UNITED STATES
SECURITIES AND EXCHANGE COMMISSION
Washington, D.C. 20549
Form 6-K/A
REPORT OF FOREIGN PRIVATE ISSUER PURSUANT TO RULE 13a-16 OR 15d-16 UNDER THE
SECURITIES EXCHANGE ACT OF 1934
For the month
August 2004
Commission File Number
0-24096
QUEENSTAKE RESOURCES LTD.
999 18th Street, Suite 2940, Denver, CO 80202
(Address of principal executive office)
(indicate by check mark whether the registrant files or will file annual reports under cover of Form 20-F or Form 40 F.
Form 20-F [X] Form 40 F [ ]
Indicate by check mark whether by furnishing the information contained in this Form the registrant is also thereby furnishing the information to the Commission pursuant to Rule 12g3-2(b) under the Securities Exchange Act of 1934.
Yes [ ] No X
(If "Yes" is marked, indicate below the file number assigned to the registrant in connection with Rule 12g3-2(b):
DOCUMENTS FILED:
SIGNATURES
Pursuant to the requirements of the Securities Exchange Act of 1934, the registrant has duly caused this report to be signed on its behalf by the undersigned, thereunto duly authorized.
QUEENSTAKE RESOURCES LTD.
(Registrant)
Date August 19, 2004
By "Jack Engele" (signed)
(Signature)
Jack Engele, Vice President Finance
Queenstake Resources Ltd.
![]()

Jerritt Canyon Mine
Elko County, Nevada
Technical Report
Prepared for
Queenstake Resources Ltd.
July 26, 2004
9234.06
Prepared by
Pincock, Allen & Holt
Raul H. Borrastero, C.P.G.
Darrel L. Buffington, P.E.
Nelson D. King
Thomas M. McNamara
Steve Milne, P.E.
Reviewed by
Pincock, Allen & Holt
Susan R. Poos, P.E.

| CONTENTS | Page | |||
| 1.0 | SUMMARY | 1.1 | ||
| 1.1 | Project Description | 1.1 | ||
| 1.2 | Regional Geology | 1.1 | ||
| 1.3 | Deposit Geology | 1.2 | ||
| 1.4 | Mineralization | 1.2 | ||
| 1.5 | Production History | 1.2 | ||
| 1.6 | Resource Estimation | 1.3 | ||
| 1.7 | Mine Plans | 1.3 | ||
| 1.8 | Metallurgy | 1.5 | ||
| 1.9 | Operating Costs | 1.5 | ||
| 1.10 | Capital Costs | 1.6 | ||
| 1.11 | Environmental Issues | 1.6 | ||
| 1.12 | Cash Flow | 1.6 | ||
| 1.13 | Sensitivities | 1.7 | ||
| 1.14 | Conclusions and Recommendations | 1.8 | ||
| 2.0 | INTRODUCTION AND TERMS OF REFERENCE | 2.1 | ||
| 2.1 | Qualified Person and Participating Personnel | 2.1 | ||
| 2.2 | Terms and Definitions | 2.2 | ||
| 2.3 | Units | 2.2 | ||
| 2.4 | Source Documents | 2.2 | ||
| 3.0 | DISCLAIMER | 3.1 | ||
| 4.0 | PROPERTY DESCRIPTION AND LOCATION | 4.1 | ||
| 4.1 | Location | 4.1 | ||
| 4.2 | Tenure | 4.1 | ||
| 4.3 | Environmental Liabilities | 4.4 | ||
| 4.4 | Status of Required Permits | 4.4 | ||
| 5.0 | ACCESIBILITY, CLIMATE, LOCAL RESOURCES AND | |||
| INFRASTRUCTURE | 5.1 | |||
| 5.1 | Access | 5.1 | ||
| 5.2 | Climate | 5.1 | ||
| 5.3 | Local Resources and Infrastructure | 5.1 | ||
AMENDED 2
Page i
| CONTENTS (CONTINUED) | PAGE | |||
| 6.0 | HISTORY | 6.1 | ||
| 7.0 | GEOLOGICAL SETTING | 7.1 | ||
| 7.1 Regional Geological Setting | 7.1 | |||
| 7.2 Property Geology | 7.1 | |||
| 8.0 | DEPOSIT TYPES | 8.1 | ||
| 9.0 | MINERALIZATION | 9.1 | ||
| 9.1 Murray Mine | 9.1 | |||
| 9.2 SSX Mine | 9.1 | |||
| 9.3 Smith Mine | 9.1 | |||
| 9.4 MCE Mine | 9.7 | |||
| 9.5 New Reserve/Resource Areas | 9.7 | |||
| 9.6 Other Mineralized Zones | 9.9 | |||
| 10.0 | PROJECT EXPLORATION | 10.1 | ||
| 11.0 | PROJECT DRILLING | 11.1 | ||
| 12.0 | SAMPLING METHODOLOGY | 12.1 | ||
| 13.0 | SAMPLE PREPARATION, ANALYSES AND SECURITY | 13.1 | ||
| 13.1 Density Analysis | 13.3 | |||
| 14.0 | DATA VERIFICATION | 14.1 | ||
| 15.0 | ADJACENT PROPERTIES | 15.1 | ||
| 16.0 | METALLURGY AND MINERAL PROCESSING | 16.1 | ||
| 17.0 | MINERAL RESOURCE AND MINERAL RESERVE ESTIMATES | 17.1 | ||
| 17.1 | Definition of Resource Categories | 17.1 | ||
| 17.2 Resource Statement | 17.1 | |||
| 17.2.1 Other Resource Constrains | 17.3 | |||
| 17.3 Model Description | 17.3 | |||
AMENDED 2
Page ii
| CONTENTS (CONTINUED) | PAGE | |||
| 17.4 | Classification Categories | 17.13 | ||
| 17.5 | PAH Resource Checks | 17.13 | ||
| 17.6 | Mineral Reserve Estimation | 17.13 | ||
| 18.0 | OTHER RELEVANT DATA AND INFORMATION | 18.1 | ||
| 19.0 | INTERPRETATION AND CONCLUSIONS | 19.1 | ||
| 20.0 | RECOMMENDATIONS | 20.1 | ||
| 21.0 | REFERENCES | 21.1 | ||
| 22.0 | ADDITIONAL REQUIREMENTS FOR PRODUCING PROPERTIES | 22.1 | ||
| 22.1 | Mining Production Schedule | 22.3 | ||
| 22.2 | Recoverability | 22.4 | ||
| 22.3 | Markets | 22.4 | ||
| 22.4 | Contracts | 22.4 | ||
| 22.5 | Environmental Considerations | 22.5 | ||
| 22.6 | Taxes and Royalties | 22.6 | ||
| 22.7 | Capital Costs | 22.6 | ||
| 22.7.1 Mining | 22.6 | |||
| 22.7.2 Ore Processing | 22.9 | |||
| 22.7.3 Surface Services | 22.9 | |||
| 22.7.4 General and Administrative | 22.9 | |||
| 22.8 | Operating Costs | 22.9 | ||
| 22.8.1 Mine Operating Costs | 22.9 | |||
| 22.8.2 Ore Processing | 22.10 | |||
| 22.8.3 Surface Services | 22.10 | |||
| 22.8.4 General and Administrative | 22.11 | |||
| 22.9 | Economic Analysis | 22.11 | ||
| 22.10 | Payback Period | 22.13 | ||
| 22.11 | Mine Life | 22.13 | ||
| 23.0 | ILLUSTRATIONS | 23.1 | ||
| 24.0 | CERTIFICATE OF QUALIFICATION | 24.1 | ||
AMENDED 2
Page iii
| CONTENTS (CONTINUED) | PAGE | ||
| TABLES | |||
| 1-1 | Mineral Resource Estimate - December 31, 2003 | 1.3 | |
| 1-2 | Mineral Reserves - December 2003 | 1.4 | |
| 4-1 | Total Land Available for Exploration and Exploitation at the Jerritt Canyon Area | 4.4 | |
| 11-1 | Project Drilling | 11.1 | |
| 16-1 | Ore Processing, Principal Parameters | 16.4 | |
| 16-2 | Ore Processing, Production and Costs, Historic and Projected | 16.4 | |
| 17-1 | Mineral Resource Estimate - December 2003 | 17.2 | |
| 17-2 | Breakeven Cutoff Grades by Mine | 17.15 | |
| 17-3 | Unplanned Dilution | 17.16 | |
| 17-4 | Mineral Reserves Estimate - December 2003 | 17.17 | |
| 22-1 | State and Local Taxes | 22.7 | |
| 22-2 | Mine Capital Expenditure Summary | 22.8 | |
| 22-3 | 2002 Capital Expenditure Detail by Mine | 22.8 | |
| 22-4 | Sustaining Capital Expenditure for 2003 to 2006 by Mine | 22.9 | |
| 22-5 | 2003 Operating Cost Summary | 22.10 | |
| 22-6 | Cash Flow Model - Cost Comparison | 22.12 | |
| 22-7 | Sensitivity to Gold Price, Ore Grade and Operating Cost | 22.14 | |
| 22-8 | Annual Cash Flow | 22.15 | |
| FIGURES | |||
| 1-1 | NPV Sensitivity | 1.7 | |
| 4-1 | General Location Map, Jerritt Canyon Mine | 4.2 | |
| 4-2 | General Land Package Status | 4.3 | |
| 7-1 | Geologic Map of the Jerritt Canyon Mining District | 7.2 | |
| 7-2 | Generalized Stratigraphic Section, Jerritt Canyon District | 7.3 | |
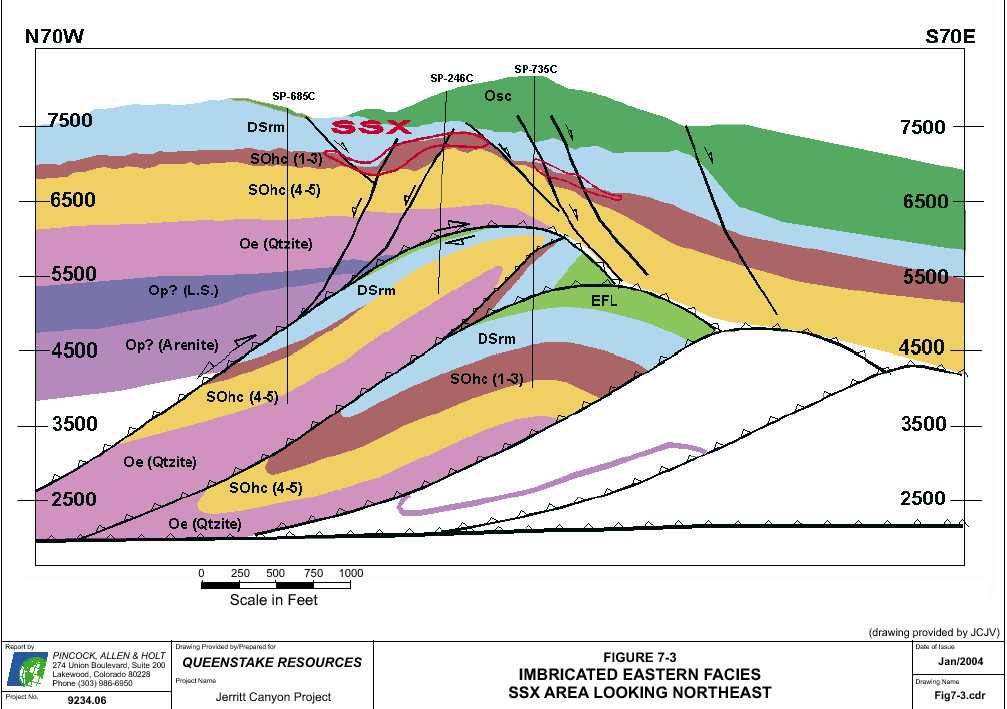
| 7-3 | Imbricated Eastern Facies SSX Area Looking Northeast | 7.4 | |
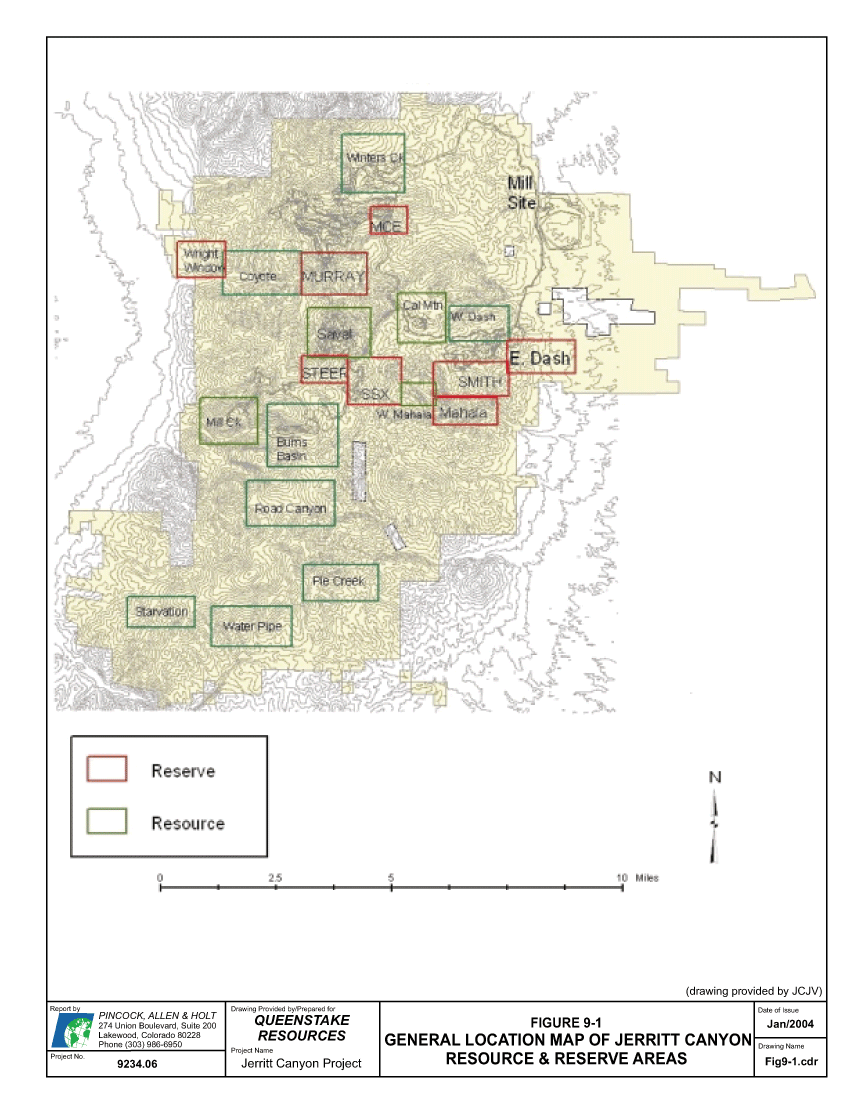
| 9-1 | Location Map of JCJV Resources and Deposits | 9.2 | |
| 9-2 | Schematic Block Diagram, Murray Mine | 9.3 | |
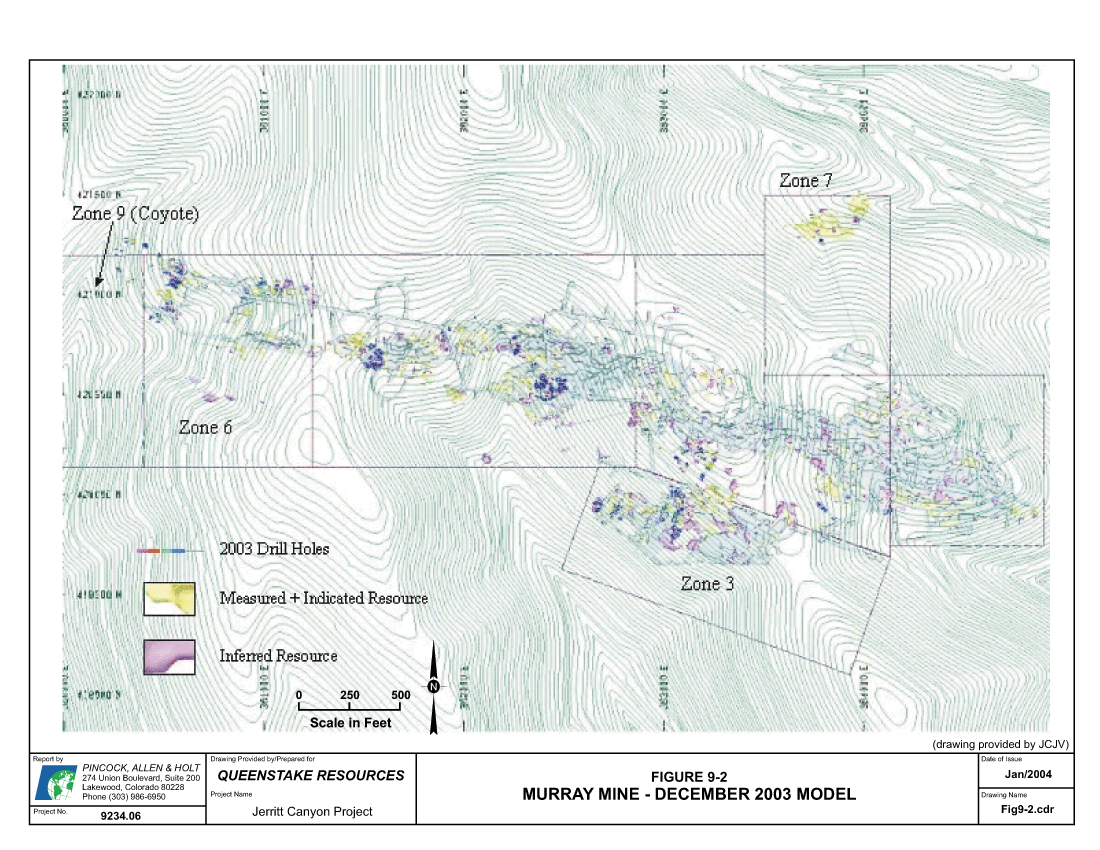
| 9-3 | Plan View - SSX Mine | 9.4 | |
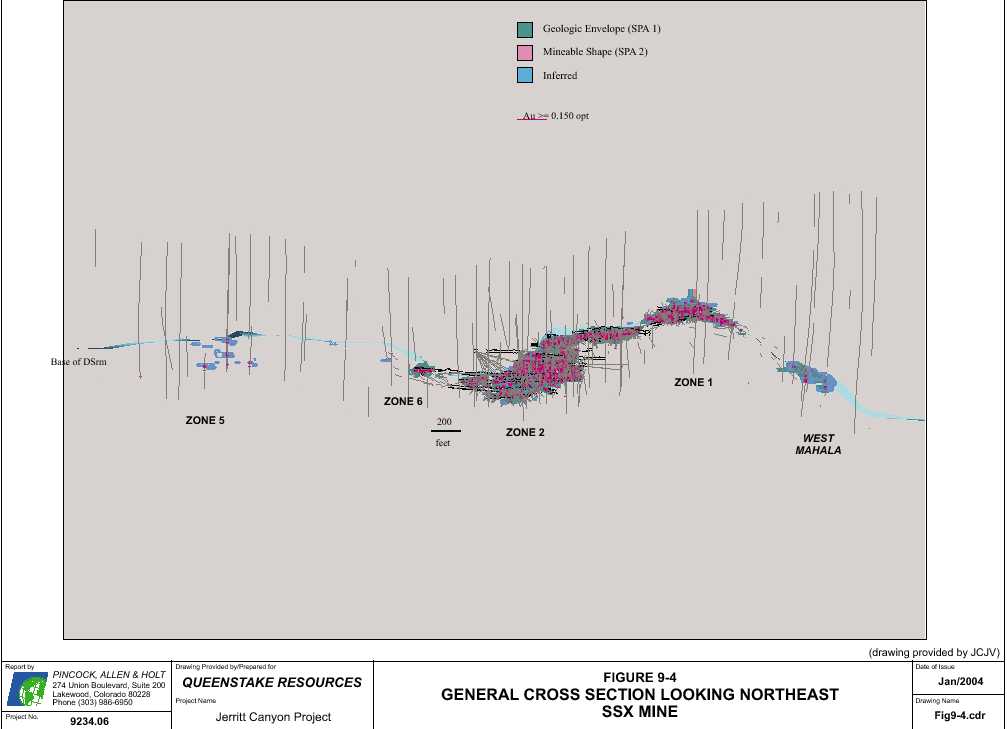
| 9-4 | Cross Section A-A', Looking Northeast, SSX Mine | 9.5 | |
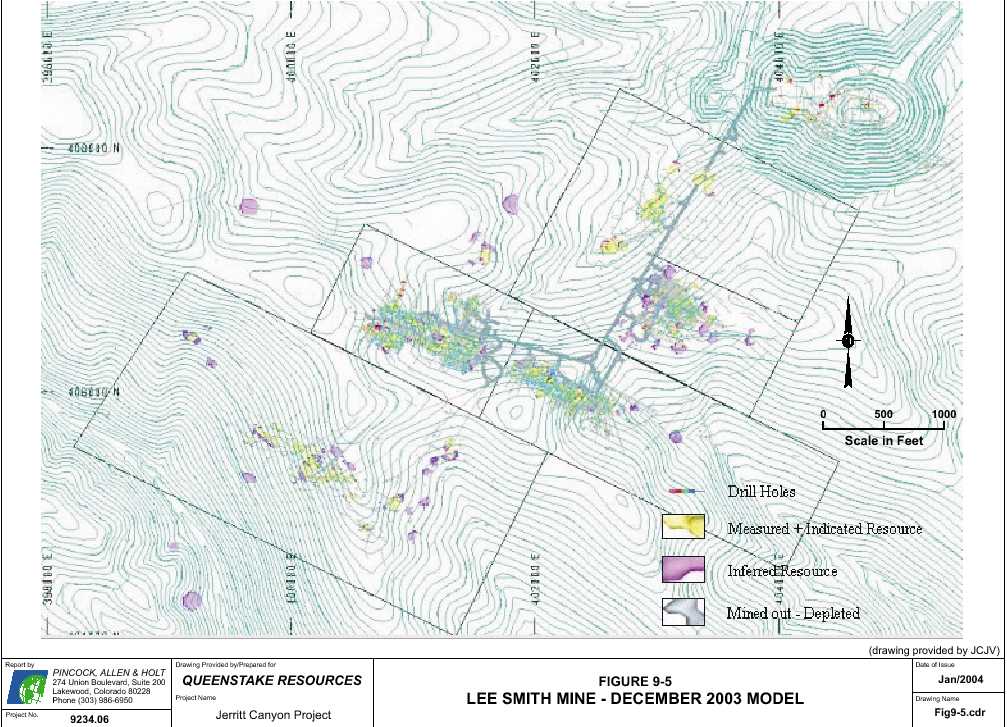
| 9-5 | Resource Areas - Smith Mine | 9.6 | |
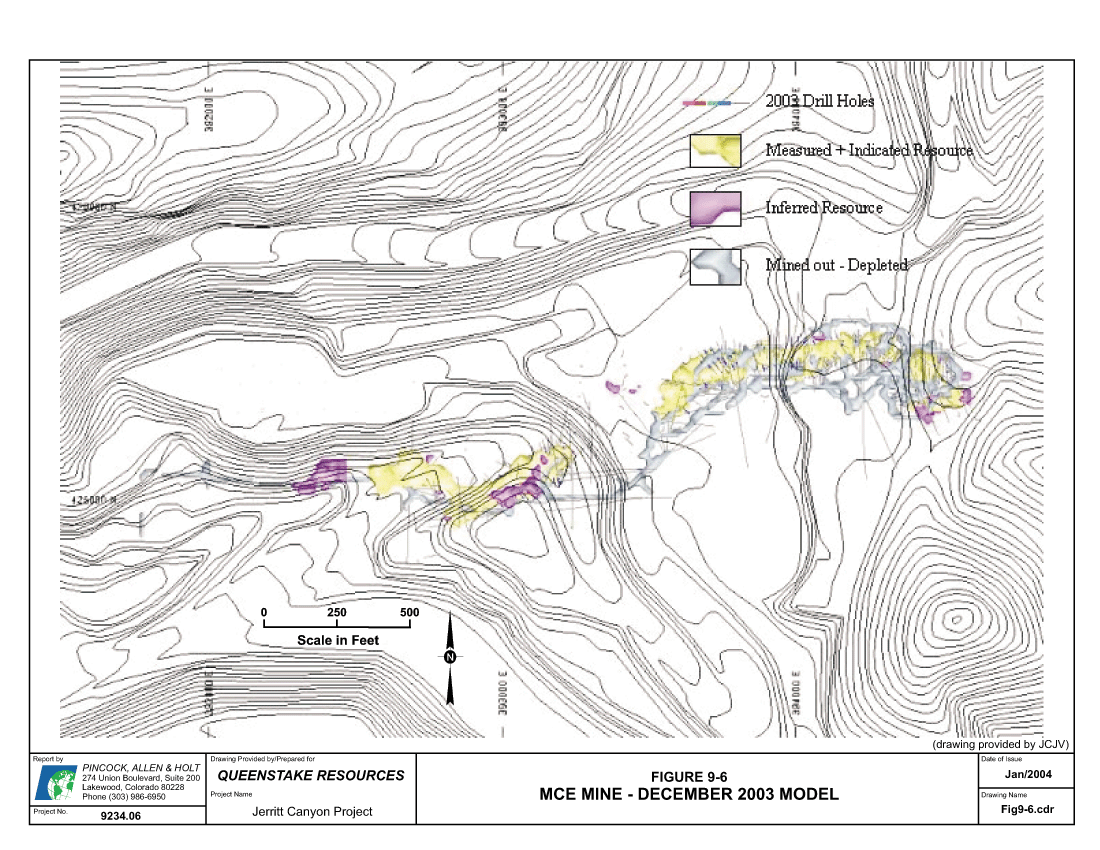
| 9-6 | Plan View - MCE Mine | 9.8 | |
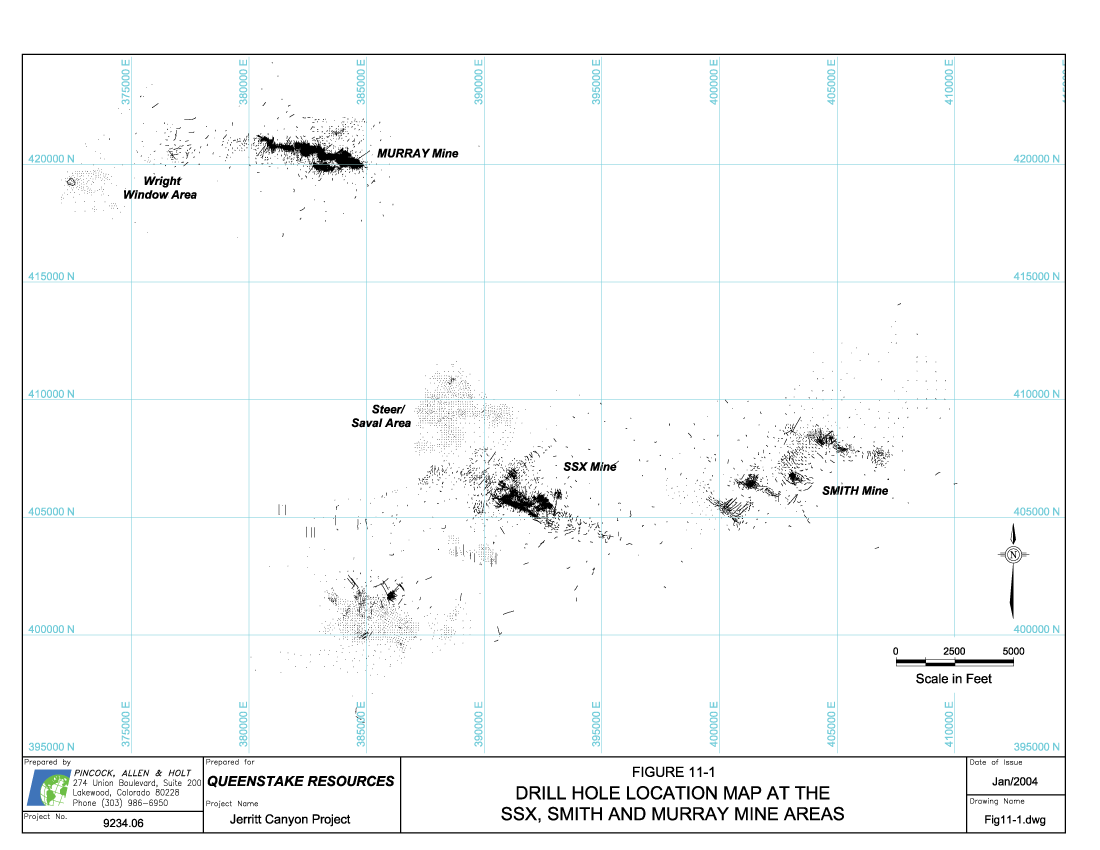
| 11-1 | Drill Hole Locations | 11.2 | |
AMENDED 2
Page iv
| CONTENTS (CONTINUED) | PAGE | ||
| 13-1 | Assay Lab Data 2002 | 13.2 | |
| 16-1 | Jerritt Canyon - Ore Processing Flow Sheet | 16.2 | |
| 16-2 | Process Facilities of the Jerritt Canyon Project | 16.3 | |
| 17-1 | Composite Statistics - SSX Mine Zone 1 | 17.6 | |
| 17-2 | Low Indicator Probability - SSX Mine | 17.7 | |
| 17-3 | High Indicator Probability - SSX Mine | 17.8 | |
| 17-4 | High Indicator Variogram - Smith Mine Zone 1 | 17.9 | |
| 17-5 | High Grade Gold Variogram - Smith Mine Zone 1 | 17.10 | |
| 17-6 | High Grade Gold Variogram - Smith Mine Zone 1 | 17.11 | |
| 17-7 | Low Grade Gold Variogram - Steer/Saval Area | 17.12 | |
| 22-1 | Location Map of the Mines with a Relationship to the Processing Plant and | ||
| Administration Offices | 22.2 | ||
AMENDED 2
Page v
1.0 SUMMARY
Queenstake Resources Ltd. (Queenstake) engaged Pincock, Allen & Holt (PAH) to prepare a Technical Report covering the Jerritt Canyon (JC) Mine near Elko, Nevada, to meet the requirements of Canadian National Instrument 43-101.
The following PAH individuals contributed to the preparation of the report:
Raul H. Borrastero, C.P.G., Senior Geologist, Resources, Reserves, Regional Geology, Drilling, Sampling
Darrel Buffington, P.E., Principal Geotechnical Engineer, Geotechnical and Environmental Review
Nelson King, Chief Process Engineer, Metallurgy and Administration Costs
Steve Milne, P.E., Principal Mine Engineer, Mine Planning and Mine Operating Costs
Tom McNamara, Manager of Mining and Geology, Economics, Cash Flow and Sensitivity
1.1 Project Description
The Jerritt Canyon project is an operating gold property with four underground mines currently in production feeding ore to a process plant. It is located in Elko County, Nevada approximately 50 miles north of Elko, Nevada. The property is wholly owned by Queenstake since June 30, 2003, when it purchased the operation from the previous joint venture partners: Anglo Gold and Meridian.
Gold mineralization was originally discovered in 1972 by FMC. Mining at JC commenced in 1981 and has continued uninterrupted until the present. Open pit mining occurred from 1981 through 1999. Underground mining started in 1993 and is the current source of mill feed. The land position covers approximately 100 square miles.
The property has been subjected to numerous drill campaigns since the 1970s. Tens of thousands of drill holes exist on the property. Several resource areas both adjacent to the existing mines and elsewhere in the district show potential for resource expansion and reserve development.
1.2 Regional Geology
The JC district deposits are hosted by a Paleozoic sedimentary sequence that underlie the Independence Mountains range and consists of four distinct assemblages: 1) the western facies
Pincock, Allen & Holt 9234.06 July 26, 2004
AMENDED 2
Page 1.1
(upper plate of the Roberts Mountains thrust fault). 2) the eastern facies (lower plate of the Roberts Mountains thrust fault). 3) the Schoonover sequence and 4) the Antler overlap sequence.
The western facies consists of chert, argillite, siltstone, shale, quartzite, and limestone-greenstone complex and is considered to be a deep-water sequence. The eastern sequence is a Cambrian to Silurian continental shelf carbonate sequence that includes the Hanson Creek Formation, and the Roberts Mountains Formation, which are the main hosts to the gold mineralization in the district.
1.3 Deposit Geology
Within the Jerritt Canyon area, gold can locally occur within all sedimentary formations, but is preferentially hosted by the Roberts Mountains and Hanson Creek Formations of the eastern facies. The Roberts Mountains Formation consists of calcareous to dolomitic siltstones and silty limestones. The Hanson Creek Formation is divided into five members and consists of medium-grained limestone, dolomitic limestone, carbonaceous micrites, and chert beds.
1.4 Mineralization
Gold mineralization at Jerritt Canyon is preferentially found within the base of the Roberts Mountains Formation and the Upper Hanson Creek Formation. Gold mineralization is structurally controlled by high angle northwest and northeast trending structures that acted as conduits for mineralizing fluids. Much of the higher grade, more continuous gold mineralization occurs where two sets of high angle structures intersect and cut the favorable stratigraphic intervals that contain high proportions of clay-sized materials. The deposits are considered to be Carlin-type, sediment-hosted, replacement fine-grained gold in carbonaceous sediments. Gold occurs as very fine-grained micron size particles deposited in carbonates and fine-grained, calcareous, clastic sedimentary rocks. The average size of gold particles is in the order of two microns.
1.5 Production History
While open pit mining was conducted at the site from startup in 1981 until 1999, the Jerritt Canyon Mine currently consists of four underground mining operations (MCE, Murray, Smith and SSX), feeding ore to a process plant that consists of a roaster followed by carbon-in-leach processing. As of early December 2003, the MCE mine was temporarily shut down until the spring or summer of 2004, in order to conduct an exploration and development drilling program during the winter months.
The mines are mechanized operations using backfilling for ground control and to increase ore recovery. From the time of start-up, the less refractory ores mined at the operation were processed through a "wet" mill. This wet mill continued to operate until 1997 and is still located on site. With ores becoming more carbonaceous and refractory as well as with the introduction of higher-grade ore from underground operations, a dry mill with an ore roasting circuit was added in 1989 and is currently in operation.
AMENDED 2
Page 1.2
Since its inception, the JC mine has produced about six million ounces of gold. Annual production has historically averaged between 300,000 and 350,000 ounces of gold, at historical cash costs ranging from $245 to $270 per ounce. Queenstake, the current mine owner, reports mill production from Jerritt Canyon at 1,496,441 tons in 2003 with 302,095 ounces of gold attributed to the operation.
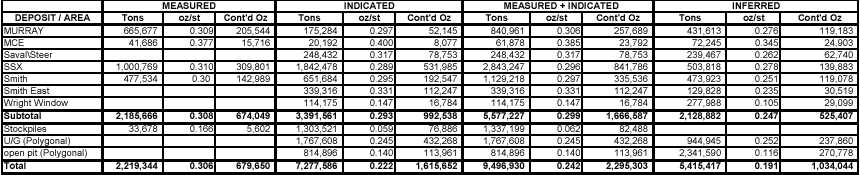
1.6 Resource Estimation
Estimates of resources at JC have been developed from the extensive drilling data, using geology-constrained standard kriging and polygonal methods using MineSight modeling and planning package. Mineral resources are contained in about twenty mineral deposits in the JC area. The operation employs block modeling techniques supported by relatively small block sizes. PAH has reviewed the estimation parameters and finds them to be in compliance with accepted engineering practices. PAH also notes that the current resource models have been supported by the production from the mines which show good reconciliations. Current measured and indicated resources as of December 2003 are presented in Table 1-1. An additional 5.4 million tons at a gold grade of 0.191 opt for about 1.0 million ounces of contained gold exist in the inferred resource category.
TABLE 1-1
Quenstake Resources Ltd.
Jerritt Canyon Project
Mineral Resource Estimate - December 2003
(including mineral reserves)
| MEASURED | INDICATED | MEASURED + INDICATED | ||||||||||||||||
| DEPOSIT / AREA | Tons | oz/st | Cont'd Oz | Tons | oz/st | Cont'd Oz | Tons | oz/st | Cont'd Oz | |||||||||
| MURRAY | 665,677 | 0.309 | 205,544 | 175,284 | 0.297 | 52,145 | 840,961 | 0.306 | 257,689 | |||||||||
| MCE | 41,686 | 0.377 | 15,716 | 20,192 | 0.400 | 8,077 | 61,878 | 0.385 | 23,792 | |||||||||
| Saval\Steer | 248,432 | 0.317 | 78,753 | 248,432 | 0.317 | 78,753 | ||||||||||||
| SSX | 1,000,769 | 0.310 | 309,801 | 1,842,478 | 0.289 | 531,985 | 2,843,247 | 0.296 | 841,786 | |||||||||
| Smith | 477,534 | 0.30 | 142,989 | 651,684 | 0.295 | 192,547 | 1,129,218 | 0.297 | 335,536 | |||||||||
| Smith East | 339,316 | 0.331 | 112,247 | 339,316 | 0.331 | 112,247 | ||||||||||||
| Wright Window | 114,175 | 0.147 | 16,784 | 114,175 | 0.147 | 16,784 | ||||||||||||
| Subtotal | 2,185,666 | 0.308 | 674,049 | 3,391,561 | 0.293 | 992,538 | 5,577,227 | 0.299 | 1,666,587 | |||||||||
| Stockpiles | 33,678 | 0.166 | 5,602 | 1,303,521 | 0.059 | 76,886 | 1,337,199 | 0.062 | 82,488 | |||||||||
| U/G (Polygonal) | 1,767,608 | 0.245 | 432,268 | 1,767,608 | 0.245 | 432,268 | ||||||||||||
| open pit (Polygonal) | 814,896 | 0.140 | 113,961 | 814,896 | 0.140 | 113,961 | ||||||||||||
| Total | 2,219,344 | 0.306 | 679,650 | 7,277,586 | 0.222 | 1,615,652 | 9,496,930 | 0.242 | 2,295,303 | |||||||||
Note: Cutoff Grade for open-pit material is 0.070 opt gold.
Cutoff grade for underground material is 0.15 opt gold.
1.7 Mine Plans
The mine production schedule for the year 2004 maintains current levels of ore production of slightly above 1.0 million tons from all mines. In 2004, 1.5 million tons (1.129 million tons from the mines and 0.371 million tons from low grade stockpiles), at 0.251 opt gold are scheduled for milling.
In 2005 the schedule calls for 1.494 million tons of ore and low-grade material (1.36 million tons from the mines and 0.13 million tons from stockpiles) at an average grade of 0.274 opt, to be sent
AMENDED 2
Page 1.3
to the mill. The 2005 schedule increases the tonnage produced by the mines by more than 200,000 tons above the levels that the underground mines have been producing in the last few years. PAH has reviewed the 2005 project schedule and believes it is optimistic based on the recent past performance of the operation, yet potentially achievable if some of the new areas considered in the mine plan (e.g. Steer/Saval, Smith East, etc.) prove to be highly productive.
In 2006, the current mineable reserves will allow only about 72,000 tons (i.e. less than one month of milling) to be processed from the mines.
Beyond that time, possible extensions to the schedule would be based on the conversion of resources to reserves. Based on the exploration and development drilling data currently available, PAH finds that there is a reasonable expectation of converting some of Jerritt Canyon's currently defined geologic resources to mineable reserves to extend the production forecast beyond the year 2006.
JC reports the mineable reserve for all areas as of December 2003 at the following gold cutoff grades: SSX (including Steer) =0.200 opt, Murray=0.260 opt, Smith (including Mahala) =0.190 opt, MCE=0.300 opt, Wright Window=0.100 opt, Stockpiles=0.090 opt, as follows:
TABLE 1-2
Quenstake Resources Ltd.
Jerritt Canyon Project
Mineral Reserves Estimate - December 2003
| PROVEN | PROBABLE | TOTAL | |||||||||||||||||
MINE | Tons | oz/st | Cont'd Oz | Tons | oz/st | Cont'd Oz | Tons | oz/st | Cont'd Oz | ||||||||||
MURRAY | 197,225 | 0.336 | 66,213 | 52,636 | 0.347 | 18,258 | 249,861 | 0.338 | 84,472 | ||||||||||
MCE | 6,101 | 0.452 | 2,755 | 8,416 | 0.504 | 4,242 | 14,516 | 0.482 | 6,997 | ||||||||||
SSX | 458,561 | 0.302 | 138,424 | 1,023,144 | 0.285 | 291,793 | 1,481,705 | 0.290 | 430,216 | ||||||||||
SOUTH STEER | 137,649 | 0.307 | 42,263 | 137,649 | 0.307 | 42,263 | |||||||||||||
SMITH EAST | 200,799 | 0.301 | 60,426 | 200,799 | 0.301 | 60,426 | |||||||||||||
SMITH WEST & MAHALA | 237,281 | 0.278 | 66,048 | 211,220 | 0.360 | 76,075 | 448,501 | 0.317 | 142,123 | ||||||||||
WRIGHT WINDOW | 32,605 | 0.226 | 7,369 | 32,605 | 0.226 | 7,369 | |||||||||||||
STOCKPILES | 33,678 | 0.166 | 5,602 | 465,960 | 0.087 | 40,637 | 499,638 | 0.093 | 46,239 | ||||||||||
TOTAL | 932,846 | 0.299 | 279,042 | 2,132,429 | 0.254 | 541,062 | 3,065,275 | 0.268 | 820,104 | ||||||||||
The gold price assumed by Queenstake in its reserve calculation was $350/ounce. PAH believes the gold price employed by Queenstake is in line with recent and current price levels.
PAH has reviewed Jerritt Canyon's production records and operating costs for each of the four mines for the production year 2003, and has calculated the breakeven cutoff grades for the January 2004 mineable ore reserve statement shown above. The cutoff grades calculated by PAH agree very closely with those calculated by the Jerritt Canyon engineers. PAH also reviewed the application of mining shapes to the resource, and the unplanned mining dilution and recovery factors used by Jerritt Canyon's engineers to calculate mineable reserves at each of the four mines and found them to be in accordance with accepted engineering practice.
AMENDED 2
Page 1.4
1.8 Metallurgy
The ore processing facility at Jerritt Canyon is unusual in that it is one of only few gold ore processing plants in Nevada that process refractory gold ore by roasting. However, as a producing mine, metallurgical risks at JC are considered low due to the project's history of successful operation. The JC Life of Mine (LOM) Plan forecasts gold recovery at 87.7 percent. This recovery value is slightly lower than historic values realized by JC, therefore PAH believes that the forecasted gold recovery is achievable.
1.9 Operating Costs
In general, mine operating costs are somewhat high when compared to other mines producing at the same production rate and using the same mining method(s). This is primarily due to the expensive backfill that is required at the JC mines. Typically, the backfill costs are about $14 per ton placed, but the excellent quality of the backfill allows complete extraction of the ore.
Total operating costs for the years 2004, 2005, and 2006 should be about the same as 2003 in constant dollars, assuming the production rate from the mines remains about the same. The majority of future production would probably come from the Smith, SSX, Steer-Saval, and Dash East deposits.
Ore processing costs have remained reasonably steady over the last two years, averaging about $25 million per year or about $16.75 per ton. Of this amount about $19 million is for operation and $6 million for maintenance. PAH would expect that future costs will remain close to the existing level were the plant to continue to operate at 1.5 million tons per year. JC has projected ore processing costs to be about $16.50 per ton in their LOM plan. PAH believes that this estimate is reasonable and is similar to the cost that was experienced during the second half of 2003.
Costs for surface services were about $4.7 million in 2003, or about $3.10 per ton milled. Most of these costs are for heavy mobile equipment operation and maintenance, since the principal service provided is transportation of mined and stockpiled ore to the ore processing plant. The costs for operation of the aggregate plant and the cost for screening of low-grade stockpiles to provide part of the ore processing plant feed are also included. The LOM plan for surface services are estimated to be $3.04 per ton milled which PAH considers acceptable.
The G & A costs were relatively consistent and at about $9.5 million per year under the previous AngloGold management structure. Queenstake has reduced G & A costs by about 20 percent with the total for the second half of 2003 being $3.8 million or about $4.80 per ton milled. Queenstake's LOM plan uses a G & A cost of $4.72 per ton milled which is similar to their current costs. PAH believes this cost estimate is reasonable for LOM plan use.
AMENDED 2
Page 1.5
1.10 Capital Costs
In general, the Jerritt Canyon planned capital expenditures for 2004 and 2005 show a significant increase over the last few years of operations when the previous owners were planning to shutdown by the end of 2004. Queenstake's budget for capital expenditures in mine development and mine exploration are in line with the company's aggressive plans to continue to convert resources to reserves and at least maintain the current reserve base.
Sustaining capital costs for ore processing have averaged $220,000 in the last two years. Queenstake has included about $700,000 in 2004 for mill facilities.
The surface services sustaining capital cost has varied significantly but has not exceeded $400,000 per year in any of the last four years. Capital costs in this account are primarily for heavy mobile equipment rebuilds.
G&A capital costs have averaged about $150,000 for the last four years. PAH expects it to remain at the current level for the life of the property and remain essentially independent of production rate.
1.11 Environmental Issues
Major operating permits for the project are in place or are being diligently pursued as is typical for similar mines. Environmental management systems are in place and there is a qualified environmental staff onsite. Various mitigation programs are in place as required under the various plans of operations that have been filed and approved for the project. No unusual costs associated with any of these programs have been identified so far. Approved reclamation and closure plans are in place and JC is progressing with concurrent reclamation in an orderly manner.
Queenstake has already funded 100 percent of the current estimated reclamation and closure costs by placing $25.8 million in a commutation account with American Insurance Group (AIG). In addition, AIG has provided insurance which will pay for reclamation and closure costs, if any, that exceed $25.8 million.
1.12 Cash Flow
Queenstake uses a gold price of $350/ounce in the cash flow projection. In PAH's opinion this metal price is in line with gold price projections currently being used by the industry. Jerritt Canyon revenue is based on gold recovered from projected mined and stockpiled ore.
The underlying production, operating costs and capital costs included in the cash flow model for JC appear reasonable and based on future plans evaluated by PAH. However, PAH did not perform a detailed independent economic analysis of the Queenstake plan and is unable to opine upon their accuracy or completeness.
AMENDED 2
Page 1.6
1.13 Sensitivities
Jerritt Canyon economics are most sensitive to gold price assumptions and projected ore grade as shown in the following graphs (Figure 1-1). The Net Present Value (NPV) is based on only 25 months cash flow as indicated by the proven and probable reserves. Queenstake intends to increase reserves, mine life, and cash flow years.
FIGURE 1-1
Queenstake Resources Ltd.
Jerritt Canyon Project
Sensitivity to Gold Price,
Ore Grade and Operating Cost ($US X 1,000,000)
Net Present Value as of January 1, 2004
![]()
AMENDED 2
Page 1.7
1.14 Conclusions and Recommendations
PAH considers the JC mine to be a relatively low-risk project at least for the short term within the next two years and one month during which the current reserves will be exhausted. For 2006 and beyond, the operation will largely depend, like many underground mines with short mine life, on its ability to replace mined-out reserves by timely conversion of resources to reserves. The success of the reserve development program that Queenstake has implemented will be the critical item in prolonging the mine life of JC.
The current reserves are largely substantiated by the production history of the mine. The operating staff of JC is competent and has successfully executed operating plans for the years reviewed. The JC operation has increased the reserve base since PAH's last review from about 1.5 years at the end of 2002 to about 2.1 years at the end of 2003, a remarkable accomplishment taking into account that over a million tons of ore were mined and 1.5 million tons processed during 2003.
Queenstake has recently acquired the JC operation and is implementing an aggressive resource and reserve development program. It is critical for the sustainability of the operation beyond 2006 that mineable reserves are maintained at least at current levels of about two years of mine life. Drilling and mine development into highly prospective resource areas should be given a high priority for the conversion of resources to reserves. In fact, some of the development costs considered to be incurred to mine the current reserve are also applicable to conversion of resources. Primary targets for resource conversion should be areas immediately adjacent to current operations primarily at the SSX and Smith mines such as Zone 5, Steer/Saval and Main Mahala.
PAH has the following recommendations:
- Maximize the mill tonnage capacity by using the low-grade stockpiles available to complement the mines' production especially during times of high gold prices.
- Considering that winter normally proves to be a difficult season for ore haulage, the operation should try to maximize stockpile haulage to or near the mill during the summer time.
- The operation production summaries need to more clearly show and identify the ore material precedence and source(s) to the mill and they should closely match the mill throughput.
AMENDED 2
Page 1.8
2.0 INTRODUCTION AND TERMS OF REFERENCE
Queenstake Resources Ltd. (Queenstake) has engaged Pincock, Allen & Holt (PAH) to prepare a Technical Report covering the Jerritt Canyon (JC) Mine near Elko, Nevada, to meet the requirements of Canadian National Instrument 43-101. This report reflects the most recent resources and reserves, which are based on models developed in December 2003.
The objective of this report is to provide Queenstake an independent reserve review and technical report that follows existing regulations in Canada. The present report meets the requirements for Canadian National Instrument 43-101 and conforms to Form 43-101F1 for technical reports.
2.1 Qualified Person and Participating Personnel
The JC operation has been previously reviewed by PAH on behalf of Standard Bank London (SBL) as part of a due-diligence review for debt and equity issues in January-February 2003. PAH has also previously prepared a technical report on the property on behalf of Queenstake in June 2003.
Raul Borrastero, a Certified Professional Geologist, was project manager for this report. Mr. Borrastero has been involved with the project since December 2002 and visited the site in January 2003, December 2003, and January 2004. The bulk of the analysis of geology, drilling, assaying, and resource and reserve estimates of the project have been reviewed directly by Mr. Borrastero. He has also assembled the location, tenure, access, infrastructure, and history of the property.
The following individuals participated in this study and have conducted a site visit:
- Raul H. Borrastero, C.P.G., Senior Geologist, Resources, Reserves, Regional Geology, Sampling; January 2003, December 2003, and January 2004.
- Darrel Buffington, P.E., Principal Geotechnical Engineer, Environmental and Geotechnical Review; January 2003.
- Steve Milne, P.E., Principal Mine Engineer, Mine Planning and Mine Operating Costs; January 2003, December 2003, and January 2004.
During the site visits, PAH reviewed existing mine and processing facilities, infrastructure, resource estimates, mine plans, budgets, operating costs, and other salient areas for a mine in operation.
Mr. Raul Borrastero was mainly responsible for the preparation and compilation of this report. Mr. Tom McNamara, Manager of Mining and Geology, and Mr. Nelson King, Principal Metallurgist, who did not visit the property, reviewed the Markets, Cash Flow, and Sensitivity for the project, and the metallurgy and processing respectively.
AMENDED 2
Page 2.1
2.2 Terms and Definitions
Queenstake refers to Queenstake Resources Ltd. PAH refers to Pincock Allen and Holt and its representatives. The Jerritt Canyon project is abbreviated to JC, and refers to the existing mine as well as exploration and other activities conducted in the vicinity of the mine and mill.
Resource and Reserve definitions are as set forth in the Appendix to Companion Policy 43-101CP, "Canadian Institute of Mining, Metallurgy and Petroleum - Definitions Adopted by CIM Council, August 20, 2000."
2.3 Units
PAH has reviewed all operating costs and commodity prices in terms of 4th quarter 2003 United States of America dollars ($), unless otherwise noted. All units are carried in imperial units, also unless otherwise noted. Grades are described in terms of troy ounces per short ton, with tonnages stated in short tons (2,000 pounds).
Salable precious metals are described in terms of troy ounces, with base metals described in terms of pounds.
2.4 Source Documents
The source documents for this report are summarized in Section 21.
AMENDED 2
Page 2.2
3.0 DISCLAIMER
This report was prepared for Queenstake Resources Ltd. ("Company") by the independent consulting firm of Pincock, Allen & Holt ("Consultant") and is based in part on information not within the control of either the Company or Consultant. While it is believed that the information contained herein will be reliable under the conditions and subject to the limitations set forth herein, neither Company nor Consultant guarantees the accuracy thereof.
PAH has not conducted a legal review of ownership, property boundaries, lease agreements, or claim notices, and presents this information for general reference only.
AMENDED 2
Page 3.1
4.0 PROPERTY DESCRIPTION AND LOCATION
The Jerritt Canyon Mine property, located in Elko County, Nevada, currently comprises four underground mining operations feeding ore to a process plant consisting of a roaster followed by carbon-in-leach processing. These mines are mechanized operations using backfilling for ground control and to increase ore recovery.
4.1 Location
The Jerritt Canyon Mine is located in Elko County, Nevada approximately 50 miles north of Elko, Nevada, at Latitude 41o< 23' North, Longitude 116o< West. The property encompasses ten (10) townships bounded by T39N to T41N and R52E to R54E relative to the Mount Diablo Base Line and Meridian (MDB&M), covering approximately 100 square miles. Operations are located in approximately the geographic center of the Independence Range within the Humboldt-Toiyabe National Forest. Access to the property is by means of State Road 225 to the main entrance road to the mine. A general location map is presented in Figure 4-1.
4.2 Tenure
Currently the property is 100 percent owned and operated by Queenstake Resources. Queenstake acquired the mine from the previous joint venture partners: Anglo Gold (70%) and Meridian Gold (30%), in June of 2003.
The operations are conducted on a combination of public and private lands, with the mines and mining related surface facilities being primarily located on public lands and the process plant administrative facilities and tailings impoundment located on private lands obtained in part through a land swap with the Bureau of Land Management.
At the present time, JC has 2,577 owned and leased claims, 12,433 acres of fee land, 1,011 acres of patented claims, and 10,351 acres of leased fee land with mineral rights (Table 4-1). The entire land package is approximately 100 square miles. The titles to these properties, lease agreements, claim notices, and affidavits were not reviewed by PAH, but are presented here for general reference. A map depicting the 2003 general land package status of the JC property is shown in Figure 4-2.
AMENDED 2
Page 4.1
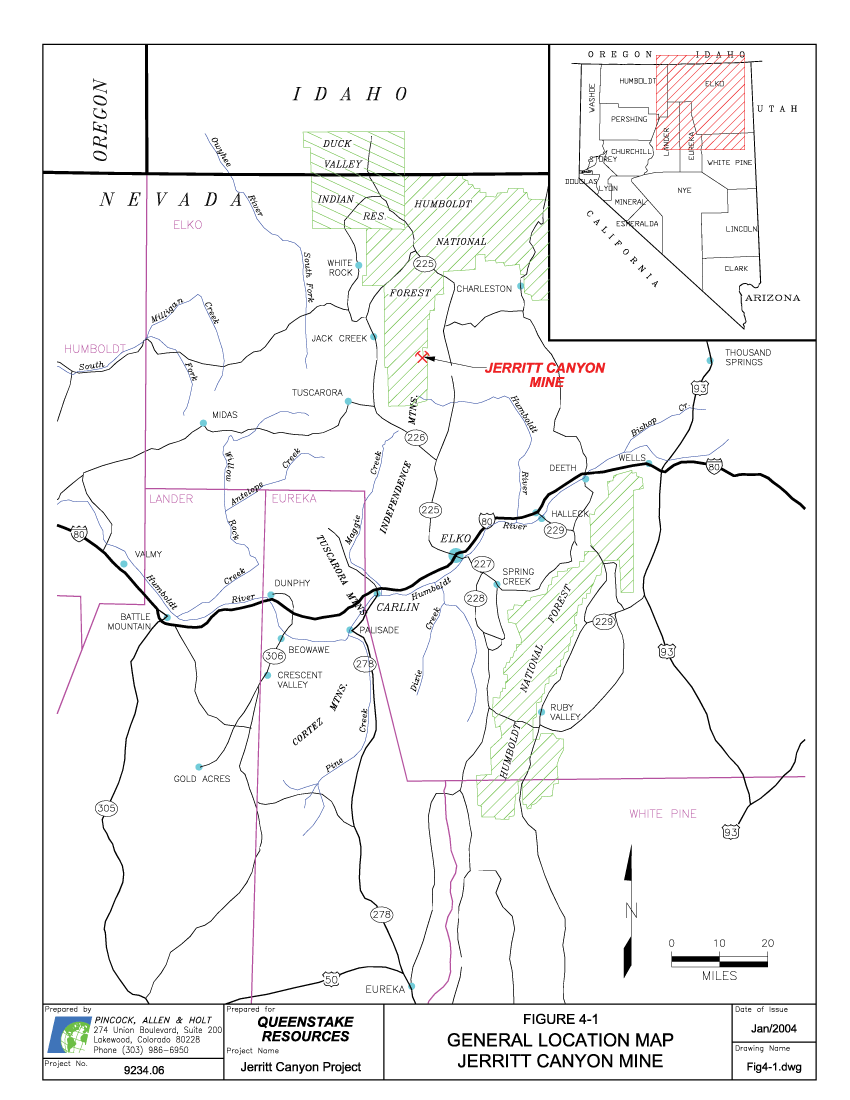
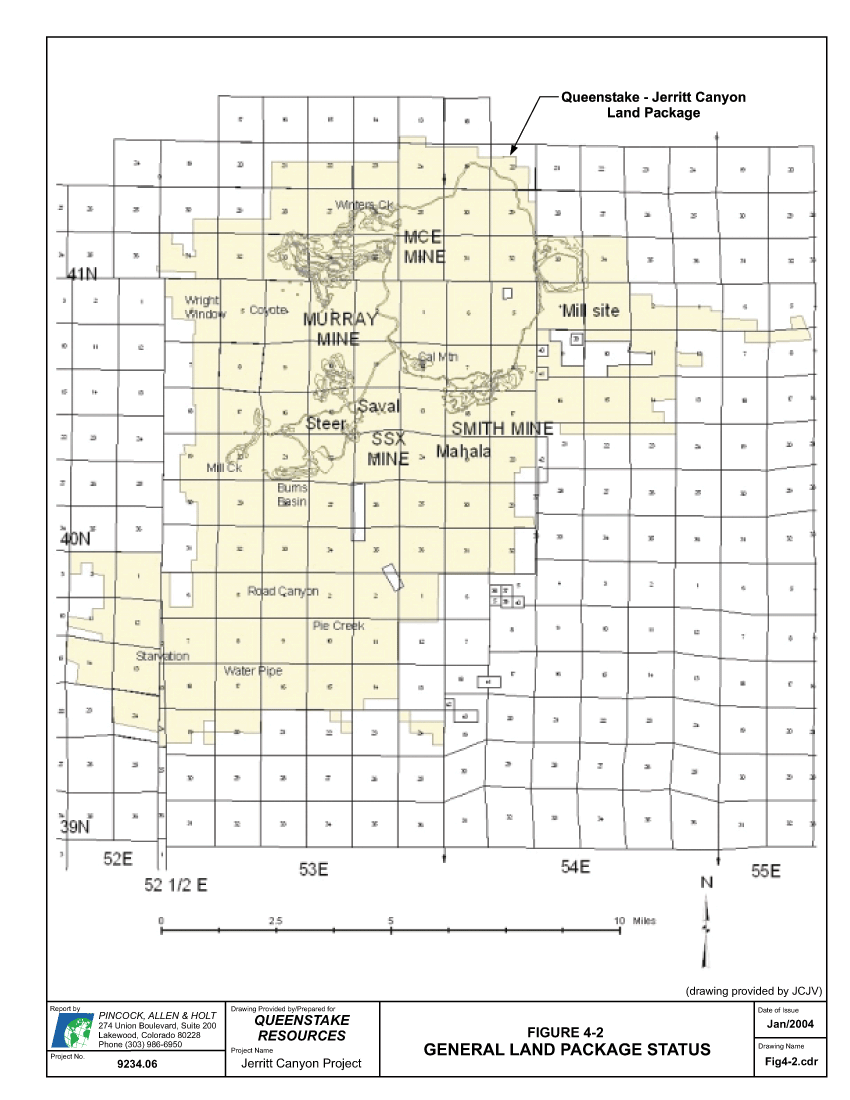
TABLE 4-1
Queenstake Resources Ltd.
Jerritt Canyon Project
Total Land Available for Exploration and
Exploitation in the Jerritt Canyon Area *
| Land Status | No. Claims | Acres | ||
| Owned Claims | 2,299 | |||
| Leased Claims | 278 | |||
| Total Claims | 2,577 | |||
| Fee Land Owned | 12,433 | |||
| Patented Claims Owned | 1,011 | |||
| Fee land Leased | 10,351 | |||
Total Acres | 23,796 | |||
*Note: 1 claim contains 20.67 acres. However, because of overlapping claims and fractional claims, the total acres covered by the claims would be less than simply multiplying the number of claims by 20.67.
4.3 Environmental Liabilities
As is common for a mining operation like Jerritt Canyon, there are several environmental liabilities associated with the project that are primarily related to closure and reclamation. Final reclamation issues for the project include closure of the tailings impoundment and waste rock dumps, reclamation of pits by partially backfilling the pits with mine waste from underground operations, sealing of underground portals and dismantling of buildings and structures. It should be noted that current geochemical characterization of the waste rock produced from mining operations has been demonstrated to be generally non-acid generating.
Queenstake has already funded 100 percent of the current estimated reclamation and closure costs by placing $25.8 million in a commutation account with American Insurance Group (AIG). In addition, AIG has provided insurance which will pay for reclamation and closure costs, if any, that exceed $25.8 million.
4.4 Status of Required Permits
The primary regulatory oversight of the Jerritt Canyon Mine is by the U.S. Forest Service (USFS), due to the mining activity being located on a combination of public and private lands, and by the Nevada Division of Environmental Protection (NDEP).
Since the initial Plan of Operations was approved in 1980, there have been at least 45 submittals to the USFS, including three Plans of Operation and Amendments or Modifications to approved Plans
AMENDED 2
Page 4.4
of Operation. From our review of the provided information and discussions with site personnel, PAH believes the operation is currently in compliance with the requirements of the USFS. We would note that development of identified ore bodies from the existing underground mine surface facilities will likely require only administrative approval. However, opening an open-pit mine at the Wright Window deposit will require permitting through the USFS. The Jerritt Canyon staff has had initial discussions with the USFS and initial indications are that the project can be permitted under an Environmental Analysis and would not need a more time-consuming Environmental Impact Statement.
The NDEP regulates the approval of the Water Pollution Control Permit, Air Quality Permit, Stormwater Discharge Permit, Underground Injection Control Permit, Dams Safety Permit and Reclamation Permit. All permits are current except that two of them, the Air Permit for the Process Plant and the Water Pollution Control Permit, have expired and renewal is being negotiated with the agencies. The Air Quality Permit has been negotiated with NDEP, presented for public comment and has been forwarded to the U.S. Environmental Protection Agency for approval. The Jerritt Canyon environmental staff considers the Water Pollution Control permit to be in the final stage of negotiation and will be issued for public comment and approved by NDEP shortly. PAH considers it highly likely that the permits will be renewed, and there are no indications that the operation is in jeopardy of regulatory action that would constrain future operations.
AMENDED 2
Page 4.5
5.0 ACCESIBILITY, CLIMATE, LOCAL RESOURCES, AND INFRASTRUCTURE
5.1 Access
The Jerritt Canyon Mine operation is located in Elko County, Nevada within the Independence Mountain Range, approximately 50 miles northwest of the City of Elko, Nevada. Access to the property is by means of State Road 225 to the main entrance road to the mine. The roads are in excellent condition and are paved all the way to the mine gate where the administrative offices are located. The active mining areas are located at elevations that range from approximately 6,400 feet at the administration offices, process plant, and tailings impoundment site to 8,000 feet at the mine sites. Sagebrush vegetation dominates the lower elevations in the southern part of the range. The northern part of the range is mostly dominated by scrublands. Small forest stands of sub alpine fir grow in canyons and north slopes.
5.2 Climate
The climate is characterized by winters with temperatures between 0 and 40 degrees Fahrenheit and summer temperatures between 35 and 85 degrees Fahrenheit. Average annual precipitation at the tailings impoundment area is estimated at 14 inches per year with an estimated annual average evaporation of 43 inches. A significant amount of the total precipitation falls as snow and increases with elevation to the mining areas. Only rarely are conditions severe enough to halt mine operations although sporadic severe winter conditions typically tend to slow down ore haulage from the mines and affect mill throughput. Mill operations are located at lower elevations and are not exposed to the weather.
5.3 Local Resources and Infrastructure
The nearest city, Elko, has a population of 34,000 and is serviced by regular scheduled air service from Reno, Nevada and Salt Lake City, Utah. All services required by the operation are readily available.
AMENDED 2
Page 5.1
6.0 HISTORY
Prospectors explored for antimony in the 1910s. Reportedly, 30 to 40 tons of stibnite as antimony ore were mined and shipped from the Burns Basin mine in the Independence Mountain range between 1918 and 1945. In the early 1970s there was a short burst in antimony exploration when its price reached historic highs of $40 a pound. Around 1971, FMC began exploring for antimony in the range. In 1972, FMC, later known as Meridian, discovered a disseminated gold deposit in the Jerritt Canyon (JC) area. In 1976, a joint venture was formed with Freeport Minerals Company, subsequently Freeport McMoran Inc., to explore and develop the area, and mining at JC commenced in 1981. In 1990, Freeport sold its interest in JC to Minorco and their wholly owned subsidiary, Independence Mining Company, became the new joint venture partner and operator of the mine. In 1998, Minorco's North America gold assets, including their 70 percent in JC, were sold to AngloGold. On June 30, 2003, Queenstake became the sole owner and operator of the project. Queenstake acquired JC from AngloGold and Meridian.
While open pit mining was done at the site from startup in 1981 until 1999, the Jerritt Canyon Mine currently consists of four underground mining operations feeding ore to a process plant consisting of a roaster followed by carbon-in-leach processing. The mines are mechanized operations using backfilling for ground control and to increase ore recovery. From the time of start-up, the less refractory ores mined at the operation were processed through a "wet" mill. This wet mill continued to operate until 1997 and is still located on site. With ores becoming more carbonaceous and refractory as well as with the introduction of higher-grade ore from underground operations, a dry mill with ore roasting circuit was added in 1989 and is currently in operation.
Since its inception, the JC mine has produced about six million ounces of gold. Annual production has historically averaged between 300,000 and 350,000 ounces of gold, at historical cash costs ranging from $245 to $270 per ounce. Queenstake reports mill production from Jerritt Canyon at 1,496,441 tons in 2003 with 302,095 ounces of gold attributed to the operation.
In the year 2000, about 445,000 feet of exploration and development drilling were completed. About 165,000 feet consisted of surface Reverse Circulation (RC) drilling, 76,000 feet were underground (UG) diamond drilling, and 204,000 were UG production drilling both RC and rotary percussion drill. In 2001, 65,450 feet of surface RC drilling, 86,000 feet UG core, 112,000 feet UG RC, and 237,000 feet of production drilling were performed. In 2002, a total of 454,000 feet were drilled. Most of the drilling was performed from UG stations: 54,000 feet UG core, 245,000 feet UG RC and 136,000 feet UG production drilling. A noticeable reduction on RC surface and underground core drilling as well as an increase in RC underground drilling occurred in 2002 relative to 2001 as apparently the operation, then operated by AngloGold, shifted focus from exploration to reserve development. However during the second half of 2003, after the acquisition of the project by Queenstake, an increased interest in mine exploration and development resurged.
AMENDED 2
Page 6.1
In December 2002, the measured and indicated resources (including reserves) at JC totaled 7.0 million tons grading 0.263 ounces per ton (opt) gold at a cutoff grade of 0.150 opt and 0.075 opt for underground and open pit areas respectively. The proven and probable reserves totaled 2.5 million tons at a gold grade of 0.236 opt at a cutoff grade of 0.200 opt for the Murray mine, 0.250 opt for the MCE mine and 0.225 opt for the SSX and Smith mines.
The current measured and indicated resources (including reserves) as of December 2003 are 9.5 million tons at 0.242 opt gold at a cutoff grade of 0.150 opt and 0.075 opt for underground and open pit areas respectively. The proven and probable reserves as of December 2003 totaled 3.0 million tons at 0.268 opt gold at a cutoff grade of 0.260 opt for the Murray mine, 0.300 opt for the MCE mine, 0.200 opt for the SSX mine, 0.190 opt for the Smith mine, 0.100 opt for the Wright Window pit area, and 0.090 opt for upgraded stockpiles. These represent an increase of 35 percent and 20 percent in resource and reserve tons, and a net increase of 25 and 41 percent in resource and reserve ounces, respectively
AMENDED 2
Page 6.2
7.0 GEOLOGICAL SETTING
7.1 Regional Geological Setting
The Jerritt Canyon mining district is located in the Independence Mountain range. This range is primarily underlain by a Paleozoic sedimentary sequence that consists of four distinct assemblages: 1) the western facies (upper plate of the Roberts Mountains thrust fault). 2) the eastern facies (lower plate of the Roberts Mountains thrust fault). 3) the Schoonover sequence and 4) the Antler overlap sequence.
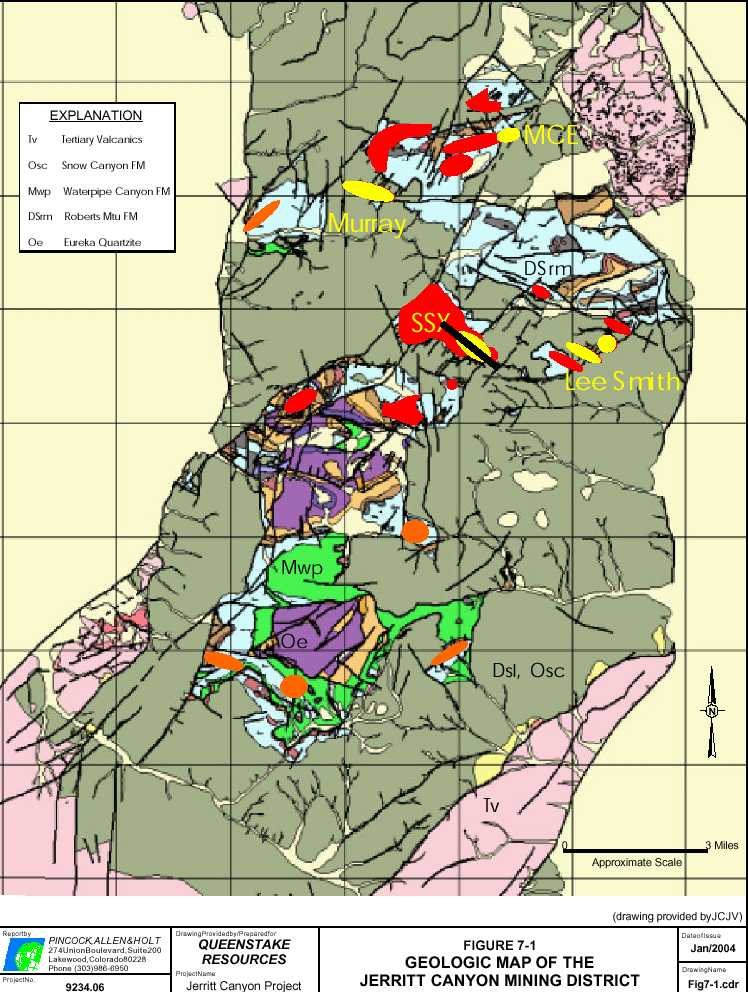
The western facies consists of the Ordovician Valmy Group, locally known as the Snow Canyon Formation, which is comprised of chert, argillite, siltstone, shale, quartzite and limestone-greenstone complex. The majority of this assemblage is considered to be a deep-water sequence. The eastern sequence is a Cambrian to Silurian continental shelf carbonate sequence. This assemblage comprises the Ordovician Pogonic Group, the Ordovician Eureka Quartzite, the Ordovician-Silurian Hanson Creek Formation, and the Silurian Roberts Mountains Formation. The Schoonover sequence occurs north of the mining district and consists of basaltic and andesitic greenstone, chert, tuff, volcaniclastic rocks and siliciclastic and limestone turbidities of Devonian to Permian age. The Antler overlap sequence is restricted to the north end of the range and consists of conglomerates, argillite, siltstone and limestone. A district geologic map is shown in Figure 7-1.
7.2 Property Geology
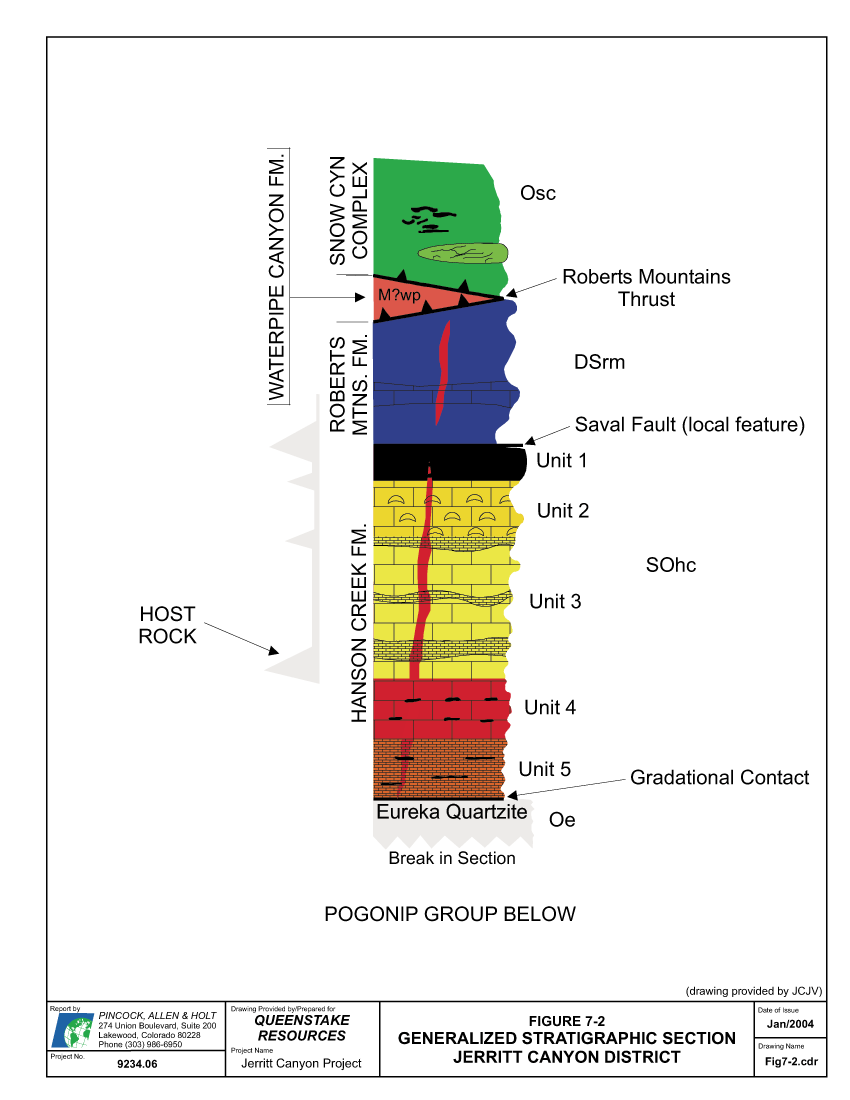
Within the Jerritt Canyon area, gold can locally occur within all sedimentary formations, but is preferentially hosted by the Roberts Mountains and Hanson Creek Formations of the eastern facies (lower plate of the Roberts Mountains thrust; Stratigraphic Section Figure 7-2). The Roberts Mountains Formation consists of calcareous to dolomitic siltstones and silty limestones. The Hanson Creek Formation is divided into five members, numbered I through V from the top of the formation. Hanson Creek I is a thinly bedded sequence of gray, medium-grained limestones and continuous block chert beds. It is typically brecciated. Hanson Creek II is a dark to light gray, irregularly bedded to massive, vuggy, dolomitic limestone. Hanson Creek III is a section of intercalated carbonaceous micrites and laminated argillaceous limestones. Hanson Creek IV is a thickly bedded, medium to coarse-grained, carbonaceous limestone with discontinuous black chert nodules. Hanson Creek V consists of laminated, carbonaceous siltstone with chert lenses.
The contact between the Snow Canyon Formation and the underling Roberts Mountains Formation is a regional thrust fault that transported the Snow Canyon eastward over the Roberts Mountains. The contact between the Roberts Mountains Formation and the underlying Hanson Creek Formation is a discontinuity locally known as the Saval discontinuity. The discontinuity may be an angular unconformity of local extent or a thrust fault. The base of the Hanson Creek is gradational into the Eureka Quartzite. Locally, the stratigraphic section has been repeated by thrust faulting as seen in the cross-section shown in Figure 7-3.
AMENDED 2
Page 7.1
Alteration within the Jerritt Canyon area includes silicification, dolomitization, remobilization, and reconstitution of organic carbon, decalcification, intermediate to advanced argillization, hypogene and supergene oxidation and bleaching. The most important alteration effects relative to gold deposition are silicification, remobilization and reconstitution of organic carbon and decalcification.
AMENDED 2
Page 7.5
8.0 DEPOSIT TYPES
Mineralization at Jerritt Canyon is preferentially found within the base of the Roberts Mountains Formation and the Upper Hanson Creek Formation. Major initial discoveries were made by following structures within the erosional windows through the upper plate created in the mountain range by the regional uplifting along the Roberts Mountains Thrusting event that placed siliceous rocks over the favorable eastern facies sequence.
Gold mineralization is structurally controlled by high angle northwest and northeast trending structures that acted as conduits for mineralizing fluids. The mineralizing fluids appear to have deposited gold as stratiform bodies where conduits intersected favorable stratigraphic intervals, particularly where the northeast and northwest structures intersect (e.g. SSX; refer to Figure 7-3), and/or where anticlinal flexures occur (e.g. SSX, Murray). The favorable host rocks in the district, Roberts Mountains and Hanson Creek Formations, typically contain large proportions of argillaceous material. Much of the higher grade, more continuous gold mineralization occurs where two sets of high angle structures intersect and cut the appropriate stratigraphy. The deposits are considered to be Carlin-type, sediment-hosted, replacement fine-grained gold deposits in carbonaceous sediments. Locally, intrusive dikes that follow the northwest structures
(Pennsylvanian dikes), or the northeast structures (Eocene dikes), may be important gold host rocks (e.g. Smith mine).
Gold occurs as very fine-grained micron size particles deposited in carbonates and fine-grained, calcareous, clastic sedimentary rocks. The average size of gold particles is in the order of two microns.
AMENDED 2
Page 8.1
9.0 MINERALIZATION
For a general location map of resource areas and deposits, please refer to Figure 9-1.
9.1 Murray Mine
The Murray mine is located in an area overlain by the Snow Canyon Formation with no surface outcrop of the favorable geologic units. It was originally discovered by condemnation drilling for a waste dump. It is primarily controlled by the N70W trending, north dipping New Deep fault (Figure 9-2). Mineralization occurs predominantly within the Roberts Mountains Formation and Hanson Creek III unit. Most of the mineralization is localized in the footwall of the New Deep fault except for Zones 1 and 2 where a significant portion of the ore occurs in the hanging wall of the fault and Zone 7, which is located completely in the hanging wall. A new orientation of Pennsylvanian dikes (330-350 degrees) has recently been recognized. The correlation of these dikes with gold mineralization is still unclear. Rock conditions at Murray are difficult and, as a result, most of the mining is carried out using underhand cut and fill and drift and fill methods.
9.2 SSX Mine
The deposit was discovered in the early 1990s following the structural trends between the Burns Basin and California Mountain deposits. The mine was open in 1997. The deposit occurs 450 to 1,000 feet below the surface. No geochemical signature on gold or pathfinders are present in the area. It is currently, and has been in the last few years, the main producer in the district. The SSX deposit is strongly structurally controlled by a network of northwest (e.g. South Boundary Fault, South Saval Trend), and northeast (e.g. Purple Fault, Saval Fault), structures. Most of the ore mineralization is hosted by the Hanson Creek III unit with lesser amounts in the Roberts Mountains Formation. Intrusive dikes are also mineralized but generally of lower grade than the surrounding mineralized rocks. The deposit is at least 4,000 feet in strike length and as much as 1,500 feet wide (Figures 9-3 and 9-4). Thickness varies from 10 feet to as much as 200 feet. Surface drilling indicates strong geologic and grade continuity to the northwest into the Steer and Saval areas and to the southeast into the West Mahala area. Rock conditions at SSX are generally good and bulk-mining methods such as sublevel and back stoping are successfully employed.
9.3 Smith Mine
The mine started in 1999 as the Dash pit was being mined out. The mineralization is associated with the northeast-southwest trending and west dipping Coulee fault, a normal fault that downthrows the west flank of the mine (Zone 2). Gold mineralization is mainly controlled by northwest trending structures (Figure 9-5) and occurs in all units of the Hanson Creek Formation and at the base of the Roberts Mountains Formation. The dominant hosts are the Hanson Creek Units II and III, which strike N50E and dip gently (20 -30 degrees) to the southeast. Gold mineralization is also
AMENDED 2
Page 9.1
encountered in association with intrusive dikes that have lately proven to be quite productive. Dike areas tend to be thin and steeply dipping but return good gold grades particularly in Zone 2 (e.g. R4 and R6 cuts). Rock conditions are generally good although bulk-mining methods can only be applied in thicker areas of the ore zones.
9.4 MCE Mine
The mine is located at the base of the Marlboro Canyon pit to the northeast of the Murray mine. The mineralization is confined to the contact zone between the Hanson Creek III and Hanson Creek IV units, which dip 20 degrees to the south. The mineralization extends about 1500 feet along a N70E trend (Figure 9-6) with a plunge of 15 degrees to the east. The highest grades are generally encountered when northeast cutting structures intersect the main trend of the orebody as is the case in Zone 1A. No intrusive dikes have been found in the mine.
In early December 2003, mine production at MCE was temporarily halted in order to conduct an exploration program aimed at increasing the limited resources and reserves currently existing at this mine. Production is expected to resume in the spring of 2004.
9.5 New Reserve/Resource Areas
Dash East (Smith East): Dash East is located about 1,800 feet southeast of the Dash pit (Figure 9-5). It is a fairly flat lying deposit composed of several high grade pods following strata mainly along the contact between Hanson Creek Units II and III. High grade pods range in size from 100 to 200 feet wide and in thickness between 10 and 25 feet. The average gold grade is about 0.37 opt. The majority of the reserve is in the far-east block against the Range Front fault, which drops the stratigraphy down to the east. It is fairly well defined by surface drilling with spacing averaging less than 70 feet. Opportunities for resource expansion may exist in the area between the Dash pit and the far-east block.
Wright Window Pit: The Wright window is a small open pit reserve and resource area located on the west side of the Independence Mountains range to the west of the Murray mine (Figure 9-1). The deposit is hosted by the lower Roberts Mountains and Upper Hanson Creek Formations along the Saval Discontinuity. Mineralization occurs on two zones., the west and the east. The west zone mineralization outcrops at the surface and is about 50 feet thick. The high-grade area is about 200 x 300 feet wide and 45 feet thick. Queenstake drilled an additional 29 holes in 2003, reducing the drill spacing to about 50 feet. The average grade of the 32,600 ton pit is 0.226 opt.
Mahala: The Mahala deposit will be accessed from the Smith portal. Mineralization is hosted by the lower Roberts Mountains and Upper Hanson Creek Formations. Like the main Smith deposit, the northeast trending Coulee Fault and an intersecting northwesterly fault serve as controls on mineralization. Mahala has been entirely drilled from the surface with spacing averaging 50 feet. The average gold grade of the reserve is 0.386 opt. Additional resources lie along the Coulee Fault and to the west of the main Mahala deposit.
AMENDED 2
Page 9.7
9.6 Other Mineralized Zones
North Burns Underground: This area is located to the northeast of the Burns pit along the structural trend that further to the northeast leads to the SSX mine (Figure 9-1). This underground target is located about 330 feet from the bottom of the pit that was mined between 1996 and 1998. The North Burns Basin open pit produced about 150,000 tons at a grade of 0.33 opt gold. Ore outcrops at the base of the pit and, if proven to have continuity, could be extracted with minimal infrastructure by underground methods. However, no drilling has been performed through the target area yet.
AMENDED 2
Page 9.9
10.0 PROJECT EXPLORATION
In the early parts of the 20th century the Jerritt Canyon district was explored by prospectors looking for antimony contained in the mineral stibnite. It was not until the early 1970s that FMC
Corporation, also initially exploring for antimony, discovered gold occurrences similar to the ones identified by Newmont in the Carlin trend area of Nevada. New technologies had by then made very fine-grained disseminated gold deposits economic. In 1976, FMC by then Meridian Mining, formed a joint venture with Freeport Minerals to explore and develop the deposits. Mining for gold began at JC in 1981 with the North Generator open pit.
Subsequent operators until present times maintained a program for the identification and development of new mineralized areas. Several other areas within the district were explored, developed and mined such as the Marlboro Canyon pit, North Burns pit, Saval pit, and the Dash pit. Underground targets were also identified and developed. The first underground operation in the district was the West Generator starting in 1993. The Murray mine was originally discovered by condemnation drilling for a waste dump. The SSX underground deposit was discovered in the early 1990's following the structural trends between the Burns Basin and California Mountain deposits despite the fact that no geochemical signature on gold or pathfinders were present in the area. The mine was open in 1997. The deposit occurs 450 to 1,000 feet below surface. The MCE mine and the Smith mine are more recent discoveries. The Smith mine started in 1999 as the Dash pit was being mined out.
As demonstrated by its production history and the number of deposits developed and mined to date, the JC operation has had a long and fruitful history of exploration and discovery. For the past few years, most of the exploration efforts have concentrated at and around the existing underground mines. Some exploration efforts in recent years were directed to drilling several areas located in the southern part of the range such as the Water Pipe, Pie Creek, and Starvation targets (refer to Figure 9-1).
Since the acquisition of the Jerritt Canyon project by Queenstake on June 30, 2003, a fairly aggressive program of mine exploration was started. A total of 50,902 feet of surface drilling (RC) and 87,218 feet of underground drilling (RC and core) were completed for the period July - December 2003. In addition, Queenstake is conducting a re-evaluation of its landholdings at JC with the objective of focusing future exploration and drilling in the most promising areas both around and away from the existing mines.
AMENDED 2
Page 10.1
11.0 PROJECT DRILLING
The property has been subjected to numerous drill campaigns since the 1970s as discussed in previous sections.
Exploration drilling programs at Jerritt Canyon typically consists of Reverse Circulation (RC) surface drilling at approximately 200-foot centers, then reduced to about 140 feet and finally, if successful, to 100-foot centers or less. Underground drilling follows with core holes (NQ size, 1.875 inches in diameter), drilled at 50-foot centers (definition drilling) from drill stations. Underground RC drilling (Cubex) is used for resource confirmation and identification. Holes are generally less than 150 feet long but can be as long as 300 feet generally at 20- to 40-foot centers. Underground production sample drilling consists of RC (Cubex) and rotary percussion drilling (Solo and Secoma drills). Holes are generally short (60 feet or less) and are drilled as close as 10 - 20 feet centers. The vast majority of drill holes (except rotary percussion holes) are measured for downhole deviations and recorded in the databases.
Numerous databases and literally tens of thousands of drill holes exist on the property. As an example, the Smith mine database already contains 3,662 drill holes totaling about 1.61 million feet although it is a fairly recent project that started mining in 1999. The Murray mine area has more than 15,000 drill holes for a total of more than 1.6 million feet. The SSX mine area (including Steer and Saval) has 12,780 holes for about 2.91 million feet of drilling. Figure 11-1 shows a representative sample of the drill hole locations for the Murray, SSX, and Smith Mine areas.
Drilling at JC for the last four years (2000, 2001, 2002, and July-December 2003) is shown in Table 11-1.
| TABLE 11-1 | |||||||||||||||||
| Queenstake Resources Ltd. | |||||||||||||||||
| Jerritt Canyon Project | |||||||||||||||||
| Project Drilling | |||||||||||||||||
| Surface RC | U/G Core | U/G RC | Production | ||||||||||||||
| Year | No. Holes | Footage | No. Holes | Footage | No. Holes | Footage | No. Holes | Footage | |||||||||
| 2000 | 378 | 164,814 | 292 | 75,799 | See Note | See Note | 4,982 | 204,182 | |||||||||
| 2001 | 59 | 65,450 | 268 | 86,134 | 914 | 112,129 | 5,086 | 349,157 | |||||||||
| 2002 | 27 | 18,905 | 186 | 53,940 | 2,939 | 245,536 | 3,593 | 135,824 | |||||||||
| 2003 (Jul - Dec) | 113 | 50,902 | 95 | 35,852 | 1,495 | 128,607 | 2,151 | 78,974 | |||||||||
Note: 2000 underground RC drilling is included with production drilling footage
AMENDED 2
Page 11.1
12.0 SAMPLING METHODOLOGY
Exploration drilling programs at Jerritt Canyon are predominantly reverse circulation (RC) surface drilling and occasionally, surface core drilling, followed by underground drilling with core holes. Underground production sample drilling consists of RC (Cubex) and rotary percussion drilling (Solo and Secoma drills).
Surface RC drilling operations consist of drilling 5.5 inches diameter holes. Chips are collected in a sample tray to represent each five-foot interval and sent to the logging facility. Surface exploration core is split or cut with a diamond saw and half of the sample sent to the lab for analysis.
Underground core samples are logged at the drill site by the geologist, photographed, and assayed. Core size is typically of NQ size (1.875 inches in diameter). No core splitting occurs. Core recoveries are generally good, especially within the ore zones, although certain units are friable and may experience low recoveries (e.g. Hanson Creek Unit I). Samples from drill holes are collected every 5 feet on surface RC and core drills and every 6 feet on the underground RC and percussion drills.
Based on past experience, the drilling with the percussion drills is purposely limited to short holes to prevent sample contamination that occurs in holes longer than 60 feet. Twin hole tests were run in 2002 at the Murray mine with the Core, Cubex (RC) and Solo (percussion) drill equipment. The data showed good reproducibility of sampling data but showed consistently higher grades when drilling with the Cubex (11 to 30 percent higher) and the Solo percussion drill (27 to 34 percent higher), relative to the core holes. PAH notes that while this apparent bias may be due, at least partially, to the highly variable distribution of gold within the deposit, the utilization of percussion drilling may be questionable for resource estimation purposes although it can be very effective for ore zone boundary definition and short tem planning which PAH acknowledges.
At all four mines each haul truck is sampled for grade control purposes. The sample consists of chip samples taken from all over the truck by the truck driver. Samples are placed in bags with pre-attached bar code numbered tags and transported to the JC lab. Truck samples are used at Jerritt Canyon for stating mine production.
Selective rib and/or face sampling is conducted by the geologists at each mine on an as needed basis. Chip samples are taken horizontally every 5 feet or by geologic unit, not to exceed 10 feet in length. These samples are used for ore/waste determination or geologic unit definition.
AMENDED 2
Page 12.1
13.0 SAMPLE PREPARATION, ANALYSES AND SECURITY
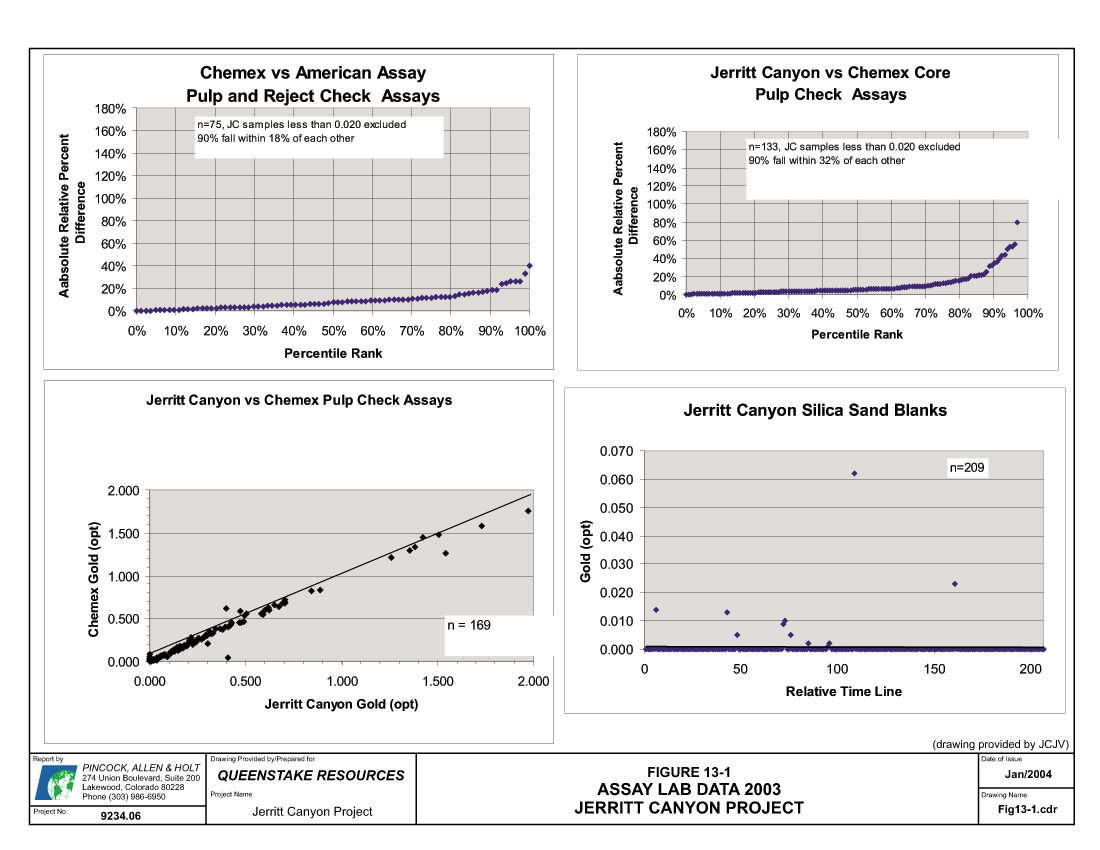
Samples from surface drilling both core and RC are sent to an outside laboratory (Chemex Labs) for assaying. Blanks or standards are routinely submitted with these samples. Underground drill samples are sent to the JC laboratory on site. The assay laboratory is located in a separate building close to the ore processing plant. The laboratory has all the normal sample preparation equipment and facilities. The laboratory operates continually with a crew of 16 and does about 500 fire assays per day with a 24-hour turn around from receipt of sample to reporting of assays. Several programs are followed to track assay quality including internal checks, check samples sent in by the mine department, weekly dispatch of samples to other laboratories, and participation in a Round Robin program with other mining laboratories in the area where random samples are sent out and others received. Blanks, standards and/or pulps are routinely submitted with the sample stream. Check samples of core holes (pulps) are sent to Chemex Labs for analysis. Pulps and coarse rejects from Chemex are routinely submitted at American Assay labs for analysis.
For the year 2003 the Quality Control/Quality Assurance (QA/QC) program at JC consisted of 970 samples broken down as follows:
- 207 local standards submitted as pulps with production samples to the Jerritt Canyon lab.
- 209 blank silica sand pulps submitted with unique sample numbers to the Jerritt Canyon lab.
- 133 pulps from the JC lab submitted to Chemex for analysis.
- 156 local standards submitted as pulps with surface RC and Core drilling samples.
- 103 pulps and coarse rejects from Chemex lab submitted to American Assay lab for analysis.
JC is currently reviewing the QA/QC program and implementing changes for 2004 and beyond where needed.
PAH reviewed the JC assay checks, blanks and standards data for the year 2003 and finds the checks adequately within industry standards (Figure 13-1). Of the pulps and coarse rejects sent from Chemex to American Assay labs, 90 percent fell within 18 relative percent of each other. The JC assay data versus the Chemex core pulp checks show that 90 percent of the checks fell within 32 percent of the original assay values and that about 72 percent of the checks fell within 10 percent of the JC assay. The data indicates that for the JC pulps submitted to Chemex labs 90 percent of the check assays fall within 16 relative percent of the original assay. The blanks data shows a few samples outside acceptable limits suggesting some degree of sample contamination.
AMENDED 2
Page 13.1
All assaying at JC follows accepted industry standards using industry practices at recognized laboratories. PAH notes that as a producing operation with sales records and recorded income, no unusual security measures are warranted.
13.1 Density Analysis
JC performed density testing in the year 2000. Sixty-seven samples from the SSX mine were sent to Chemex Labs (39) and the University of Nevada, Reno (28) for testing. The weighted average tonnage factor of all measurements was 12.616 cubic feet per ton. The tonnage factor was then changed from 13.0 cubic feet per ton to 12.6 cubic feet per ton which is currently used at all mines for all materials.
AMENDED 2
Page 13.3
14.0 DATA VERIFICATION
The operation has thousands of drill holes at each of the four active mines. In addition, there are thousands of drill holes in other mined-out areas, and at several resource areas located throughout the JC-controlled land package (please refer to Figure 9-1).
In June 2000, Mineral Resources Development Inc. (MRDI) conducted a review and audit of resources and reserves of the JC operation. MRDI reviewed the database, stored as Vulcan software files, used at the Murray and SSX mines and did not find any problems or errors. A review of the spreadsheets used for Resource and Reserve tabulation found no errors.
PAH reviewed a portion of the databases as part of its due diligence review of the JC operations in early 2003. Checks of several records of the SSX mine database performed against original logs confirmed the assays values and geological-geotechnical codes included. Data validation checks identified a few errors in the drill hole databases such as duplicate holes and missing intervals in downhole surveys (e.g. Smith mine), which were relayed to and corrected by the operation.
In early 2004 PAH conducted a review of JC resources and reserves. Checks of several drillhole records and original assay certificates against the database were performed for several areas such as Smith and SSX mines and new reserve areas such as Mahala and Smith East. Data validation checks identified no errors in the drill hole databases.
The vast majority of drill holes (except rotary percussion holes) are measured for downhole deviations and recorded in the database. Very few exploration holes do not get measured for deviation. This may occur in shallow vertical holes, when holes collapse or when logistics are such that timely measurement is not permitted.
The operation continues working on centralizing the storage of drill hole samples and assaying data into the AcQuire software package. Assay data is directly downloaded from the lab and goes through automatic validations before being recorded allowing for virtually no chance of data entry errors. The data for the Murray, Smith, and SSX mines have already been entered into AcQuire, and the MCE mine should follow. The data is normally maintained in MineSight for interpretation and modeling at each mine.
PAH believes that JC is conducting exploration and development sampling and analysis programs using standard practices, providing generally reasonable results. PAH believes that the resulting data can effectively be used in the subsequent estimation of resources and reserves.
AMENDED 2
Page 14.1
15.0 ADJACENT PROPERTIES
There are no significant resources on adjacent properties controlled by other companies.
AMENDED 2
Page 15.1
16.0 METALLURGY AND MINERAL PROCESSING
The ore processing facility at Jerritt Canyon is unusual in that it is one of only several gold ore processing plants in Nevada that process refractory gold ore by roasting. As originally built, the plant processed oxide and mildly refractory ores by conventional cyanide leaching in conjunction with chlorine-gas pre-oxidation of the mildly refractory fraction. About a decade ago the roasting section of the plant was built to process the highly refractory ores that started to be mined at that time.
The basic unit processes and facilities of the current plant are as follows:Primary and secondary crushingCrushed ore dryingTertiary crushingDry grindingRoastingOxygen plantCarbon-in-leach (cyanide leaching and carbon adsorption)Carbon stripping and reactivationZinc cementation of gold and precipitate refiningTailing containmentAssay laboratory
A flow diagram of the plant is presented in Figure 16-1 and an overview of the facilities is shown in Figure 16-2. Basic parameters of the operation are presented in Table 16-1.
Much of the ore processed has a high clay content and also has a high moisture content leading to serious handling problems, particularly the plugging of chutes. Freezing and mud in winter also contribute to handling problems.
AMENDED 2
Page 16.1
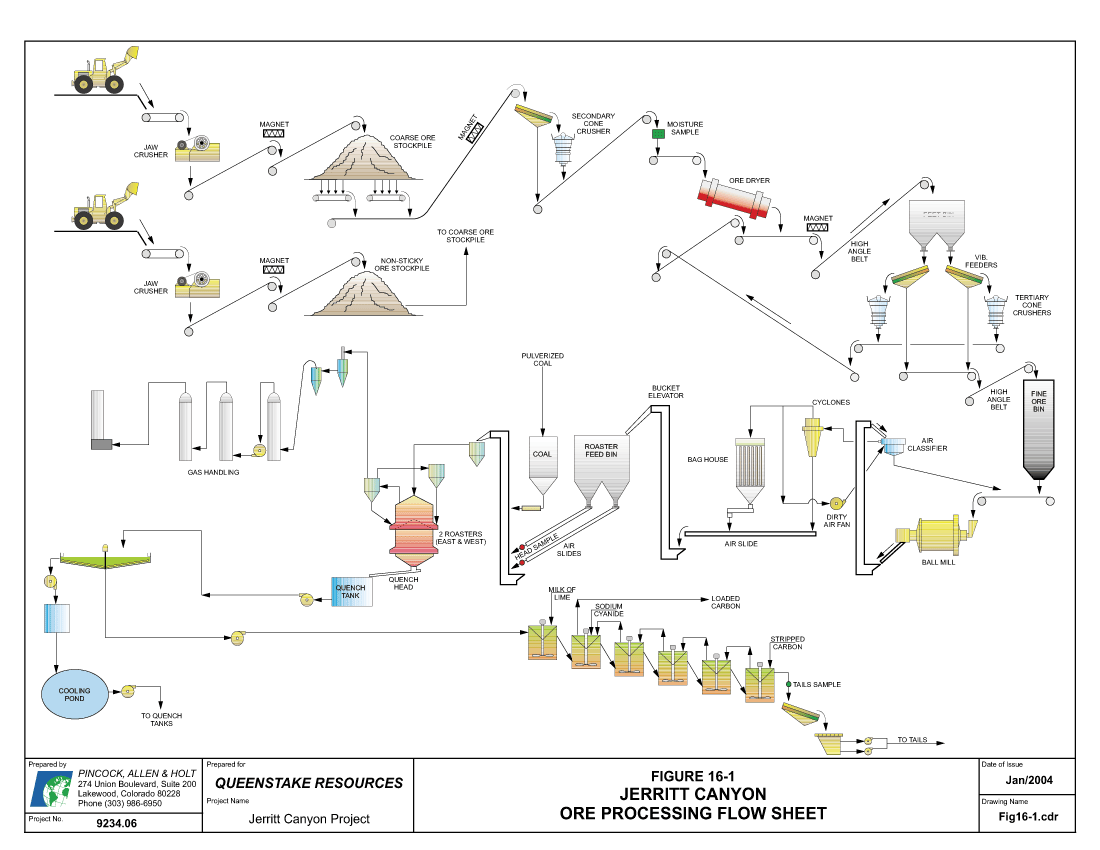
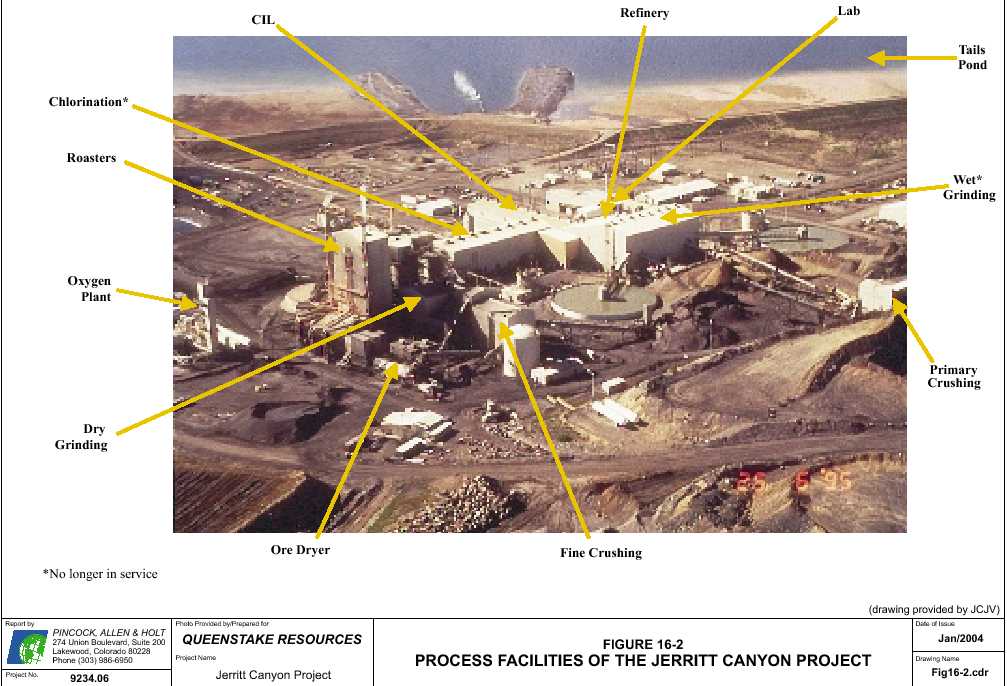
TABLE 16-1
Queenstake Resources, Ltd.
Jerritt Canyon Project
Ore Processing, PrincipalParameters
| Item | Units | Value | |
| Processing Rate | |||
| Annual | Tons/year | 1,500,000 | |
| Daily | Tons/day | 4,100 | |
| Ore Grade | Ounces gold/ton | 0.23 | |
| Recovery | Percent | 88.50 | |
| Operating Cost | $/ton milled | 16.50 | |
Gold recovery values and roaster tonnages over the last four years, as well as the projections for the 2004 Budget, are presented in Table 16-2. Queenstake has used similar production levels, recovery values (88 percent) and operating costs to those experienced during the second half of 2003 for the future budgets and PAH believes that they should be achievable.
TABLE 16-2
Queenstake Resources
Jerritt Canyon Mine
Ore Processing, Production and Costs, Historic and Projected
| Actual | Actual | Actual | Actual | Budget | |||||||||
Item | Units | 2000 | 2001 | 2002 | 2003 | 2004 | |||||||
| PRODUCTION | |||||||||||||
| Tons milled | |||||||||||||
Jerritt Canyon | tons | 1,404,980 | 1,105,856 | 1,443,333 | * 1,496,441 | 1,500,000 | |||||||
Cortez | tons | 93,781 | 363,236 | 34,136 | 0 | ||||||||
| Total | tons | 1,498,761 | 1,469,092 | 1,467,469 | 1,496,441 | 1,500,000 | |||||||
| tons/day | 4,163 | 4,014 | 4,076 | 4,100 | 4,100 | ||||||||
| Ore Grade | |||||||||||||
Jerritt Canyon | oz Au/ton | 0.256 | 0.300 | 0.263 | 0.228 | 0 | |||||||
Cortez | oz Au/ton | 0.521 | 0.325 | 0.306 | N/A | N/A | |||||||
| Combined | oz Au/ton | 0.272 | 0.306 | 0.264 | 0.228 | 0 | |||||||
| Recovery | |||||||||||||
Jerritt Canyon | percent | 88 | 87.6 | 87.8 | 88.4 | 87.7 | |||||||
Cortez | percent | 93.1 | 91.4 | 91.2 | N/A | N/A | |||||||
| Combined | percent | 90.2 | 89.2 | 87.9 | 88.4 | 87.7 | |||||||
| Gold Produced | |||||||||||||
Jerritt Canyon | ounces | 309,263 | 295,328 | 329,151 | 302,095 | 331,600 | |||||||
Cortez | ounces | 45,486 | 107,921 | 9,509 | N/A | N/A | |||||||
| Total | ounces | 354,749 | 403,249 | 338,660 | 302,095 | 331,600 | |||||||
| COSTS | |||||||||||||
| Total Costs | |||||||||||||
Operating | $ | 000 | 15,743 | 17,296 | 18,714 | 19,049 | |||||||
Maintenance | $ | 000 | 6,626 | 5,727 | 5,757 | 6,133 | |||||||
| Total | 22,369 | 23,023 | 24,471 | 25,182 | 24,735 | ||||||||
| Unit Costs | |||||||||||||
Ore milled | $ | /ton milled | 14.92 | 15.67 | 16.68 | 16.83 | 16.49 | ||||||
| Gold produced | $ | /oz Au prod. | 63.06 | 57.09 | 72.26 | 83.36 | 74.59 | ||||||
* includes processing of low-grade ore stockpile.
AMENDED 2
Page 16.4
17.0 MINERAL RESOURCE AND MINERAL RESERVE ESTIMATES
The resource and reserve estimates for JC were developed by the staff of Queenstake's Jerritt Canyon operation, with the following individuals and others contributing:
- Mark Odell, Mine Manager
- Don Colli, Mine Geology Superintendent
- Lloyd Wherry, Senior Mine Planner
- Bob Loranger, Senior Mine Geologist, Murray Mine
- Melissa Maher, Senior Mine Geologist, MCE Mine
- Bill Josey, Senior Mine Geologist, Smith Mine
- Rich Eliason, Senior Mine Geologist, SSX mine
The individuals preparing the estimates are employees of JC, and have no relationship to the reviewing qualified person.
PAH received the December 2003 updated models and reviewed the models for compliance with accepted engineering practice.
17.1Definition of Resource Categories
PAH finds that the resource and reserve models developed by JC conform to the definitions set forth in National Instrument 43-101 in Sections 1.3 and 1.4 which classify the resource into measured, indicated, and inferred categories. The standards applied by JC conform to the definitions adopted by the Canadian Institute of Mining, Metallurgy and Petroleum - - Definitions adopted by CIM Council August 20, 2000.
17.2Resource Statement
JC reports the resources as follows:
This resource estimate is current as of December 31, 2003 and reflects the advancing underground mines situation as well as areas that can reasonably be expected to be accessed by the operation at sometime in the future. The metal ounces listed in Table 17-1 are on a contained basis without adjustment for process or smelting recoveries.
AMENDED 2
Page 17.1
TABLE 17-1 Queenstake Resources Ltd. Jerritt Canyon Project Mineral Resource Estimate - December 2003 (including mineral reserves)
Cutoff Grade for open-pit material is 0.070 opt gold. Cutoff grade for underground material is 0.15 opt gold. Note:
AMENDED 2
Page 17.2
17.2.1 Other Resource Constraints
JC is a well-established operation at this time, and appears to enjoy favorable relations in the surrounding area. PAH is not aware of any possible adverse or unusual restrictions on mining resulting from legal or title issues, taxation, socio-economic, or other issues.
As noted previously, JC has in place the necessary permits to operate. However, two of them,the Air Permit for the Process Plant and the Water Pollution Control Permit, have expired and renewal is being negotiated with the agencies. The Air Quality Permit has been negotiated with NDEP, presented for public comment and has been forwarded to the U.S. Environmental Protection Agency for approval. The Jerritt Canyon environmental staff considers the Water Pollution Control permit to be in the final stage of negotiation and will be issued for public comment and approved by NDEP shortly. PAH considers it highly likely that the permits will be renewed, and there are no indications that the operation is in jeopardy of regulatory action that would constrain future operations.
We would note that development of identified ore bodies from the existing underground mine surface facilities will likely require only administrative approval. However, opening an open pit mine at the Wright Window deposit will require permitting through the USFS. The Jerritt Canyon staff has had initial discussions with the USFS and initial indications are that the project can be permitted under an Environmental Assessment and would not need a more time-consuming Environmental Impact Statement.
At this writing, no constrains are known on the marketing aspects of the property.
17.3Model Description
Mineral resources and mineral reserves at JC are contained in about twenty (20) mineral deposits in the JC area (please refer to Figure 9-1). The operation employs block modeling techniques supported by relatively small block sizes. The Murray mine models for example are built with 5 x 5 x 15 foot high blocks; the SSX Zones 123 and 456, Smith, MCE and most other areas are modeled with 15 x 15 x 15 foot blocks.
Two methods of resource estimation are applied at JC using MineSight modeling software:
- A geostatistical method known as PACK, Probability Assisted Constrained Kriging, which is applied to Murray Zones 1-8, SSX Zones 1-6, Steer/Saval area, MCE, Smith, Smith East, Mahala, B-Pit and Wright Window. Block grade is estimated using probabilistic and interpreted envelopes. Only these blocks can be used for mine planning and reserve declaration. Only blocks within interpreted "geological envelopes" can be Measured or Indicated. Inferred blocks are those outside the constraining envelopes.
AMENDED 2
Page 17.3
- A block-polygon method is utilized in all other resource areas where drill hole spacing is insufficient to conduct mine planning and reserve estimation. It employs a nearest neighbor two-dimensional search without constraining interpreted envelopes. An oriented anisotropic search is used for Winters Creek and West Dash; a horizontal search is used for the other project areas. Blocks are classified as Indicated if the nearest composite is within 75 feet of the block center and meets an opt gold cutoff grade 0.070 for open pit resources (e.g. Burns, California Mountain, Coyote, Pie Creek, Road Canyon), or a 0.15 opt gold cutoff grade for underground resources (e.g. Murray-Zone 9, Saval, SSX polygonal, West Dash, West Mahala polygonal). Inferred polygonal resources lie within 75 - - 100 feet of the nearest composite.
The PACK method consists of dividing the deposit into low-grade and high-grade probability zones and then estimating the gold distribution within each one of these zones separately. The methodology is summarized below.
1) Divide the deposits into geological zones within which the same geostatistical parameters are expected to be applicable. The remaining steps are followed within each geologic zone.
2) Using the cumulative frequency plots of the sample values (Figures 17-1 through 17-4), pick a low threshold (typically about 0.03 oz/ton) and a high threshold (typically about 0.15 oz/ton). These thresholds are chosen to help define significantly mineralized zones and high-grade zones respectively. The zone, which is significantly mineralized but not high-grade, is defined as the low-grade zone.
3) To define the significantly mineralized zone, consider the low threshold. All samples with grade below 0.03 oz/ton are given an indicator value of 0. Those exceeding 0.03 oz/ton are given an indicator value of 1. Indicator variograms are calculated from the indicator values. The deposit is divided into blocks whose indicator value is estimated by kriging. The block value can be considered as an estimate of the proportion of the block whose value exceeds 0.03 oz/ton. A value of zero indicates that the block is not likely to contain any significant mineralization while a value of one indicates that the block grade is likely to be entirely above 0.03 oz/ton.
4) A block is considered to lie within a significantly mineralized zone if its indicator value exceeds 50 percent.
5) To define the high-grade zone, consider the high threshold. All samples with grade below 0.15 oz/ton are given an indicator value of 0. Those exceeding 0.15 oz/ton are given an indicator value of 1. Variograms are calculated and high-grade block values are estimated by kriging. In theory the high-grade indicator block value should be between 0 and 1 and should exceed the low-grade indicator value.
6) A block is considered to lie within the high-grade envelope if its high-grade kriged indicator value is greater than or equal to 50 percent. A block is considered to lie within the low-grade envelope if it is in the significantly mineralized zone (its low-grade kriged indicator value is
AMENDED 2
Page 17.4
greater than or equal to 50 percent) but is not in the high-grade envelope (its high-grade kriged indicator value is less than or equal to 50 percent).
7) Samples lying within blocks constituting the low-grade envelope are tagged accordingly. The gold grades of the tagged samples are used to calculate a low-grade variogram and to estimate the gold grade of the blocks located within the low-grade envelope. The block values are estimated by kriging. Samples outside the low-grade envelope (including those in the high-grade envelope) are ignored.
8) Samples lying within blocks constituting the high-grade envelope are tagged accordingly. The gold grades of the tagged samples are used to calculate a high-grade variogram and to estimate the gold grade of the blocks located within the high-grade envelope. The block values are estimated by kriging. Samples outside the high-grade envelope (including those in the low-grade envelope) are ignored.
9) Once this process is completed, the gold grade of all the blocks located within the mineralized zone (both the low-grade and high-grade envelopes) has been estimated. A "geological envelope" is then defined, which is drawn using a nominal 0.15 oz/ton cutoff grade. In designing this envelope the emphasis is on drawing a continuous zone, which correlates well from section to section. This envelope may therefore incorporate some low grade or waste (unestimated) blocks. Conversely isolated high grade mineralized blocks may be left outside the "geological envelope." PAH notes that the so-called "geological envelope" is actually a grade envelope.
PAH visually analyzed the low-grade and high-grade indicator variograms (an example is shown in Figure 17-5). These show reasonable continuity over significant distances, often exceeding 100 feet. PAH also visually analyzed the grade variograms within the low-grade and high-grade envelopes (Figures 17-6 and 17-7). The majority of these variograms have a very short range, less than 20 feet. This was expected since the sample grades within the low-grade envelopes are mostly between 0.03 oz/ton and 0.15 oz/ton; both very low grade samples and high grade samples have been eliminated, thus destroying any structure which is present in the deposit and is reflected by the indicator variogram. Similarly the samples considered for high-grade variogram analysis only take into account high-grade samples and ignore the surrounding lower grade values.
AMENDED 2
Page 17.5
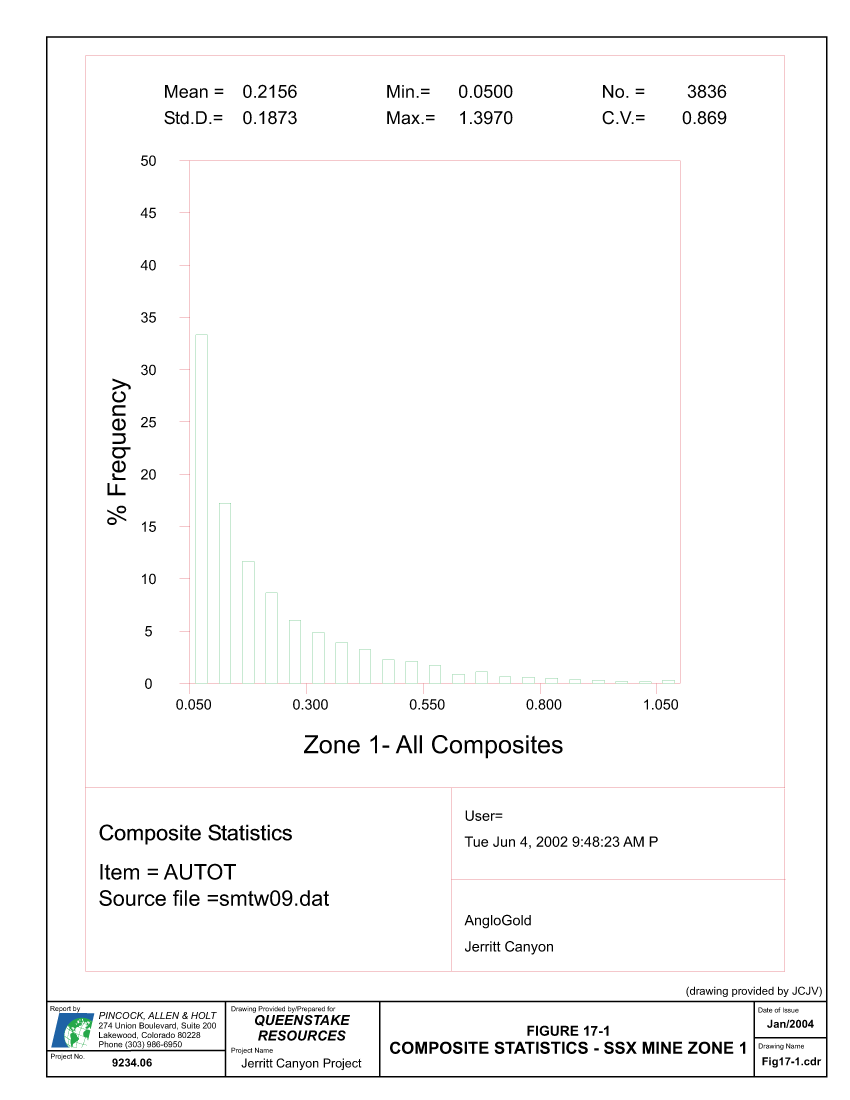
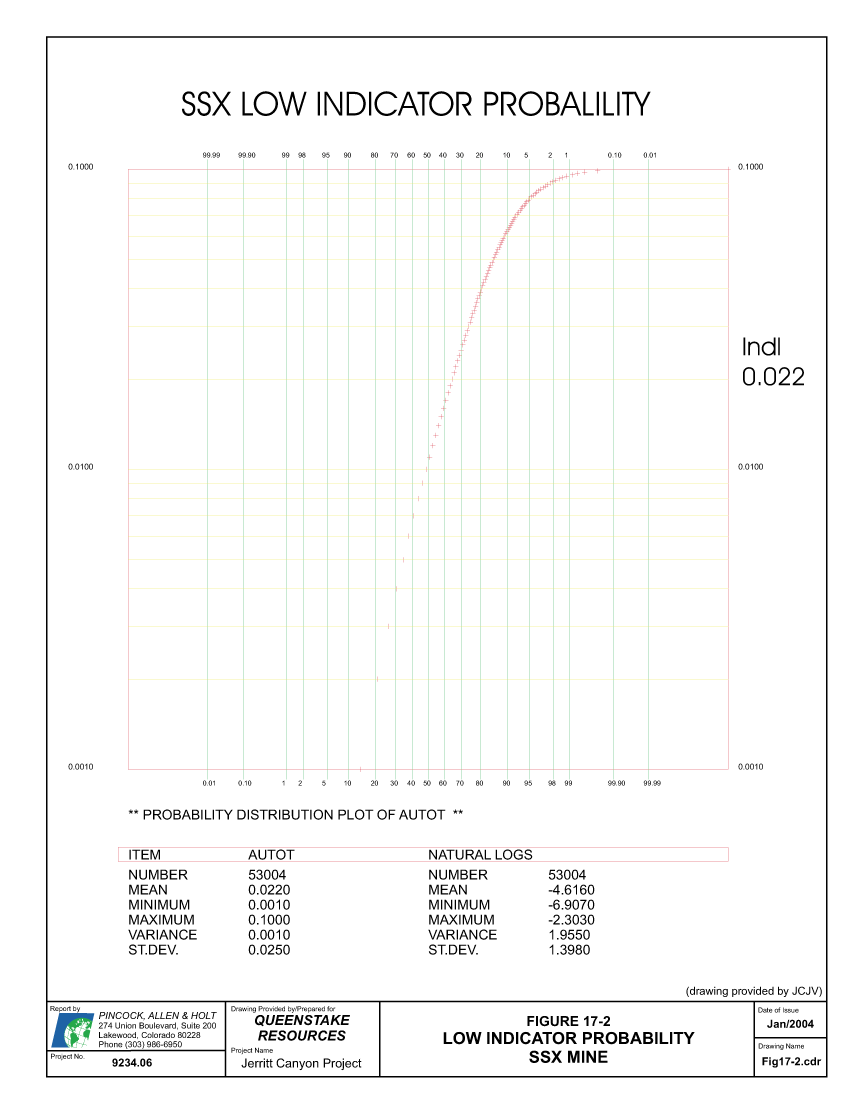
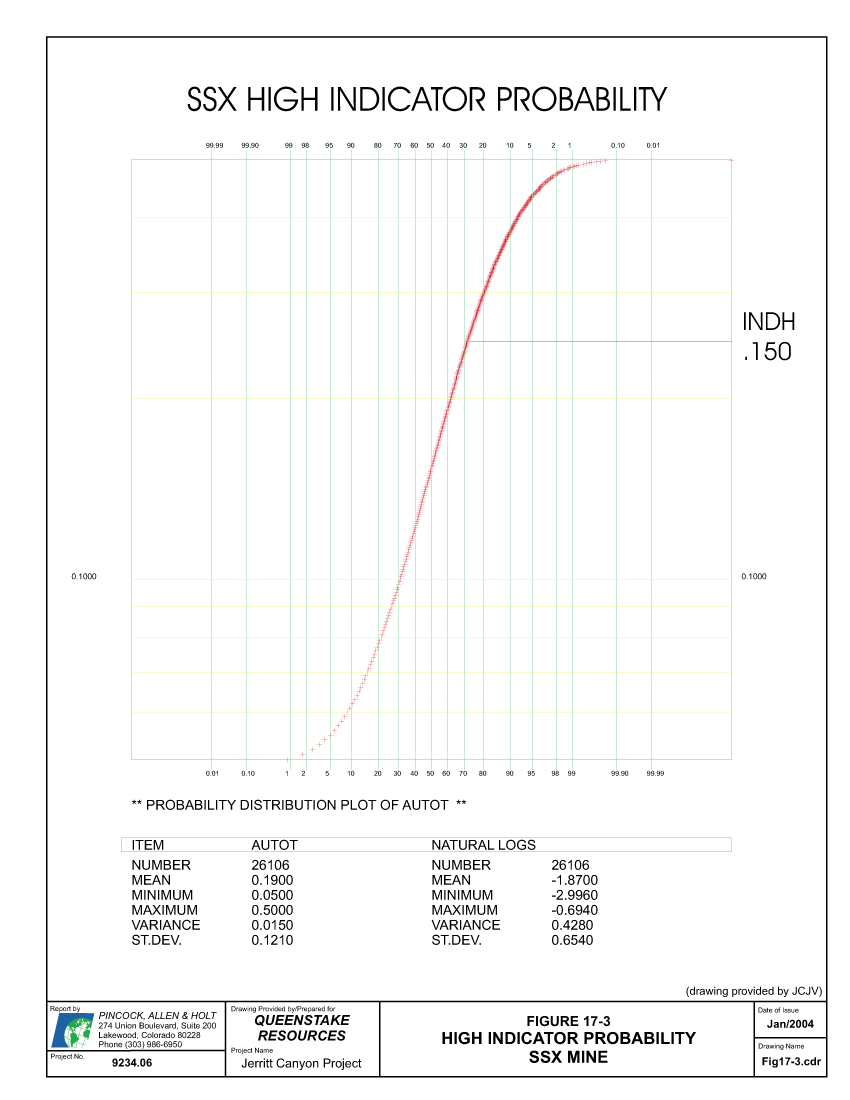
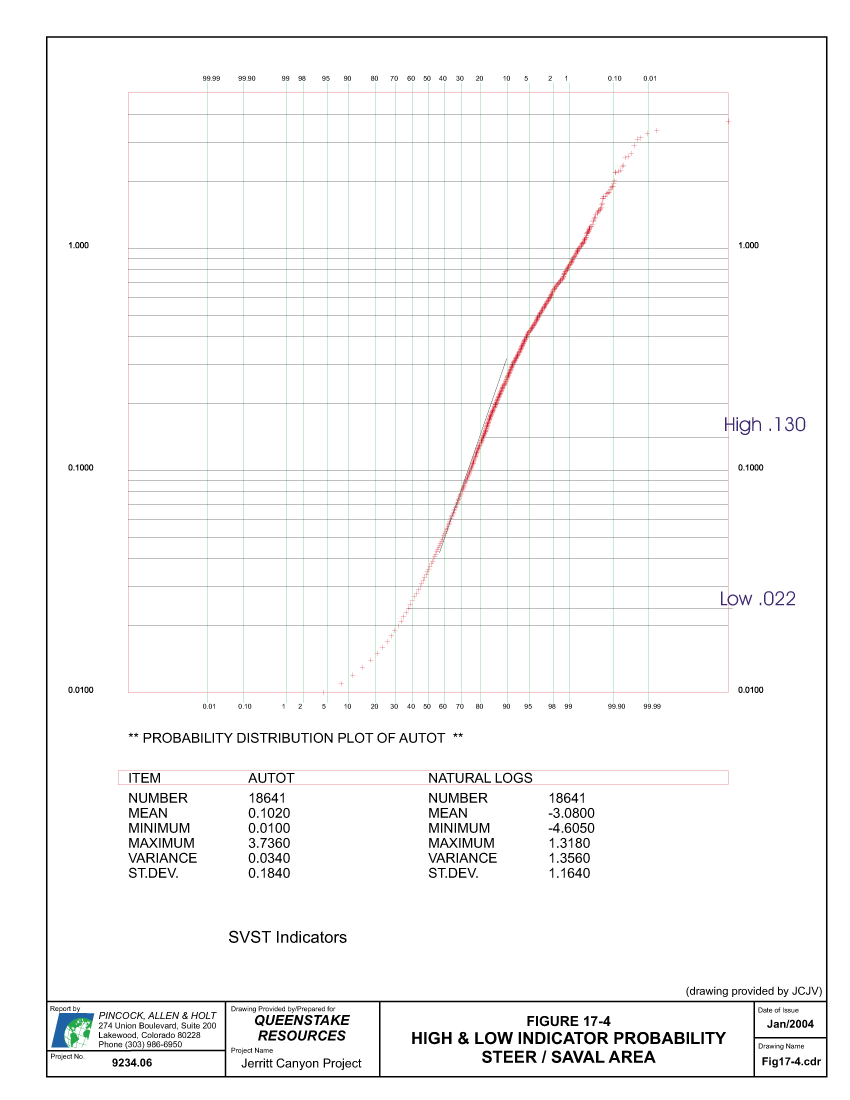
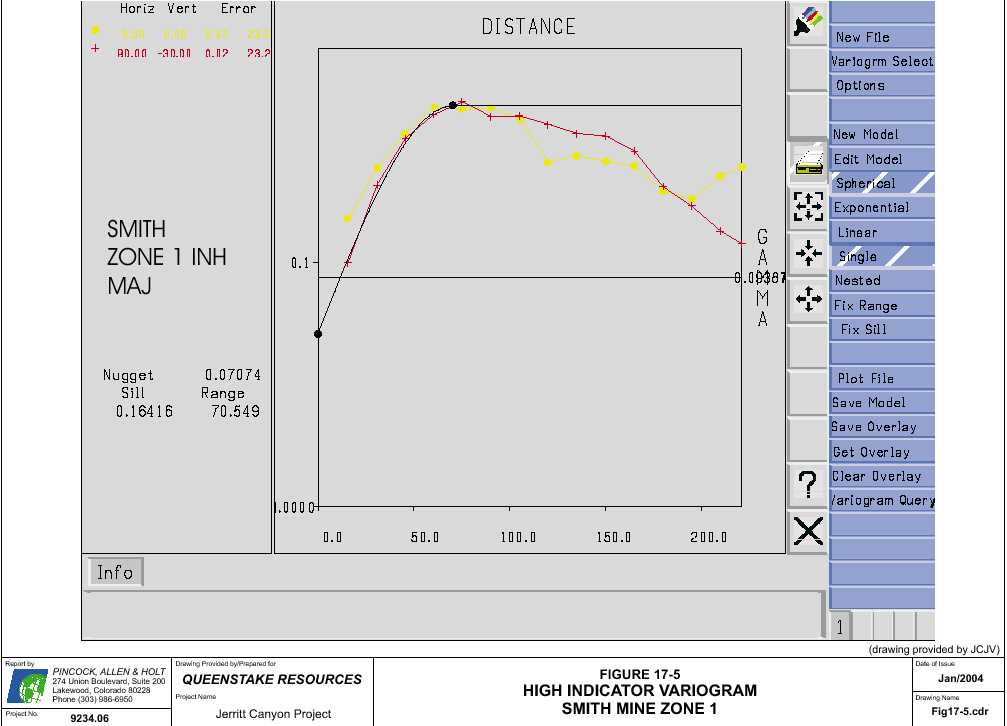
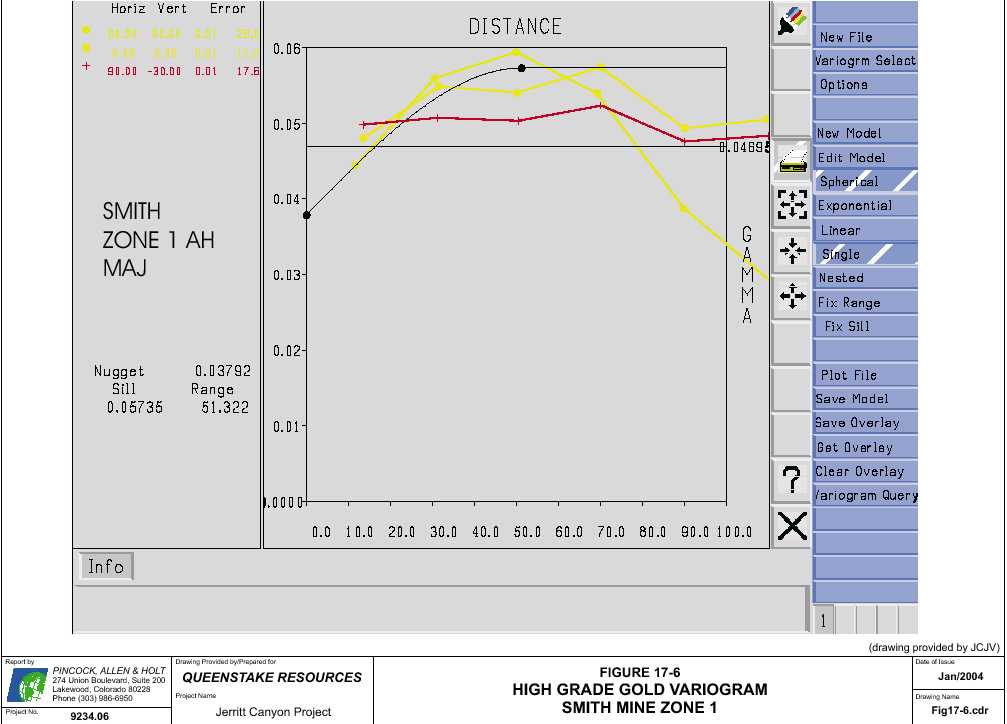
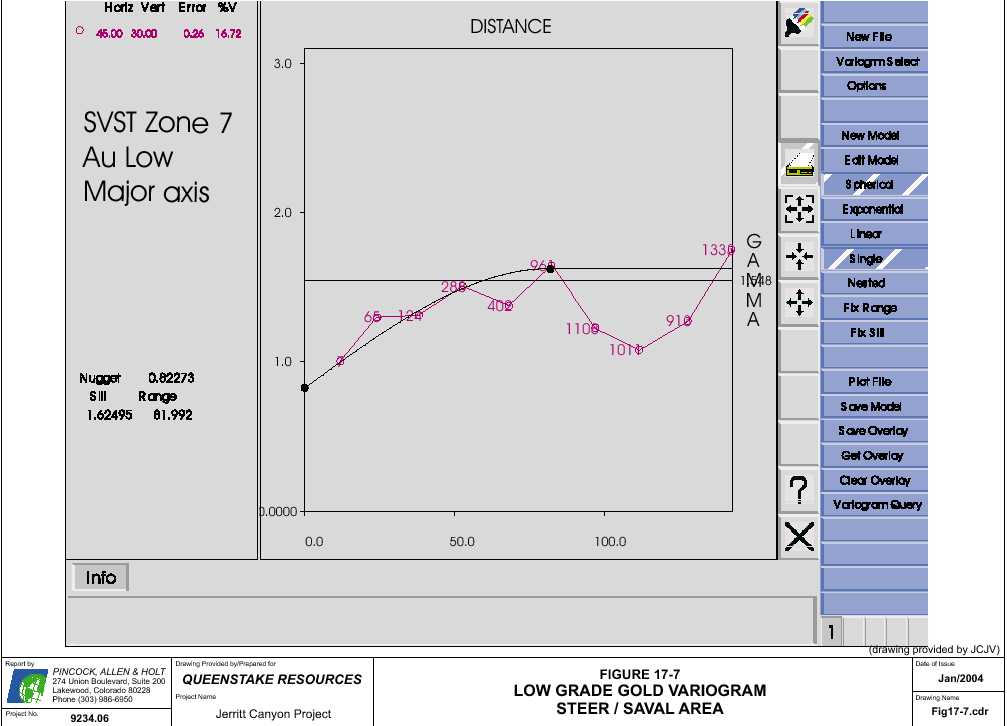
The very short range of the gold variograms should not be interpreted as an indication that gold grades are not correlated. The level of continuity in mineralization must be interpreted from the indicator variograms. Gold variograms calculated from all samples within a broadly defined mineralized zone, including both high-grade and low-grade samples, would also show continuity of mineralization over significant distances, probably exceeding 100 feet.
17.4 Classification Categories
JC bases its definition of measured, indicated, and inferred resources on probability values, distance to the nearest composite, number of composites used to estimate a block, number of drill holes used to estimate a block, and mining history. A block is considered Measured if it has a probability value greater or equal to 0.50, at least one composite within 20 feet, a minimum of eight composites within the search ellipsoid, a minimum of three drill holes within the search ellipsoid and mining history (i.e. located at or near an active mine operation). An Indicated block needs a 0.5 indicator and must lie within the interpreted envelope and has at least one composite within 75 feet. An Inferred block lies outside the geologic envelope and has at least one composite within 100 feet.
PAH has reviewed the method used to classify the blocks in the measured, indicated, and inferred resource categories and believes these methods to be reasonable and that they meet or exceed industry standards.
17.5PAH Resource Checks
PAH conducted a number of global checks on the completed resource model including transferring the JC models to Gemcom software for independent checks on data and results, reconciling resource tons and grade for several areas, reconciling geologic/grade envelopes against actual block model grades and drillhole assay data, etc.
In all cases, PAH found no material evidence of improper methods or applications. PAH considers that the JC models have been constructed in compliance with accepted engineering practice and can be considered reasonable global predictors of resources within the modeled areas.
17.6 Mineral Reserve Estimation
All current reserves at Jerritt Canyon (except stockpiles) are contained in deposits being developed and mined by underground methods except Wright Window, which is an open pit. Once the mineralized envelopes and gold grades are estimated as described in the above sections, the mine geologists draw high grade envelopes (based on cutoff grade), using the block model values, the status of the mine workings and the cutoff grades provided by operations for each mine (Table 17-2). In order to determine the portion of the measured and indicated resource that would qualify for proven and probable mineable ore reserve status, it is necessary to configure the measured and
AMENDED 2
Page 17.13
indicated resource into mineable shapes for the selected mining method, and then apply tests for economic viability and include factors for mining dilution (Table 17-3) and recovery.
The economic viability is normally accomplished by calculating a breakeven cutoff grade (oz Au/t) in an algorithm that equates total operating costs (mine, processing, and administrative) with the gold price (less refining charges and royalties) and the process plant metal recovery. This calculates the minimum gold grade that will be necessary to recoup the total operating cost. Since this is the minimum grade that will be accepted in the mining process, the average plant feed grade is always higher. The increment between the breakeven grade and the plant feed grade allows for the recovery of invested capital and provides for a profit on the investment.
Incremental cutoff grades and optimization cutoffs are useful tools for the mine management to use in the mine operation. These cutoffs are typically used to maximize the resource recovery where part of the operating cost has already been sunk, and/or to improve cash flows during certain periods of the mine operation. However, ore reserve calculations are typically based solely on the breakeven cutoff grade.
The breakeven cutoff grade (Gau), expressed in gold ounces per ton, is formulated as follows:
| Total OperatingCost | ||||||
| Gau = | ||||||
| (Gold Price - deducts) x Plant Recovery | ||||||
Using the following parameters, breakeven cutoff grades were calculated for each of the mines and compared to the cutoff grade used by JC.The cost figures and plant recovery percentage included in the parameters were derived from the December 2003 year-to-date figures, and do not includeany capitalized development or reserve development costs.
| Gold Price | $ | 350/oz | ||
| Plant Recovery | 88.3 % | |||
| Royalty (ave.) | $ | 1.86/oz | ||
| Refining | $ | 0.42/oz | ||
| Net Proceeds Tax | $ | 1.82/oz | ||
| Operating Costs | ||||
| Processing | $ | 16.49/t | ||
| G&A | 4.64/t | |||
| Subtotal | $ | 21.13/t | ||
| Mine Operating Costs | ||||
| SSX | $ | 35.02/t | ||
| Murray | $ | 48.53t | ||
| Smith | $ | 31.52/t | ||
| MCE | $ | 55.63/t | ||
| Stockpile (hauling/screening) | $ | 4.16/t | ||
| Wright Window open pit (plan) | $ | 32.97/t | ||
AMENDED 2
Page 17.14
Equating these parameters as indicated above results in the indicated breakeven cutoff grades shown in Table 17-2 that should be used to calculate the proven and probable mineable reserve portion of the resource statement. The cutoff grades used by JC to calculate their mineable reserve statement are included in Table 17-2 for comparison:
TABLE 17-2
Queenstake Resources Ltd.
Jerritt Canyon Project
Breakeven CutoffGrades by Mine
| Indicated | ||||
| Breakeven | ||||
| Mine | Cutoff | JC Cutoff | ||
| SSX | 0.19 oz/t | 0.20 oz/t | ||
| Murray | 0.24 oz/t | 0.26 oz/t | ||
| Smith | 0.18 oz/t | 0.19 oz/t | ||
| MCE | 0.26 oz/t | 0.30 oz/t | ||
| Stockpile | 0.08 oz/t | 0.09 oz/t | ||
| Wright Window | 0.11 oz/t | 0.105 oz/t | ||
The breakeven cutoff grade for the Smith mine has lowered considerably, since the water problems of last year in the deeper parts of the mine have been resolved. During the year, underground dewatering wells were operated with better efficiency; and cleaning of nuisance floor water by settling and filtering has resulted in a much higher productivity and lower operating cost for the year.
MCE is a small mine with a low production rate (currently less than 200 t/d), and is currently shut down to allow for additional exploration drilling and is planned to re-open in the spring.
Other than the Smith mine, which has improved, the cutoff grades calculated by Queenstake engineers for the other mines are very close and generally higher than those calculated by PAH.
The in-place grade of the stockpiles averages about 0.06 oz/t, which is less than the indicated cutoff grade for this material. In order to include these resources as reserves, they must be screened to be upgraded. The cutoff grade calculated by PAH includes the cost for screening.
In addition to the economic justification of the resource, factors for mining dilution and recovery need to be considered before the final mineable reserve statement is issued. At the Jerritt Canyon mines, where the ore occurs as irregular pods, and the mining methods are typically sublevel or drift and fill stoping, mining dilution occurs mostly at the fringes of the ore pods or lenses. Within the pods, slices or drifts are extracted and then filled with a cemented backfill. When the backfill has consolidated, the ore between the stopes or drifts is extracted. In the primary cuts (first pass), the interior stope boundaries are surrounded by ore, so little dilution results. In the secondary cuts, the walls and/or back are cemented backfill, which is stronger than the ore or enclosing rocks; so again, little dilution occurs. On the fringes of the individual ore bodies or pods some dilution occurs. The amount of dilution is primarily dependent on the mining method. JC has develop ed a matrix for the
AMENDED 2
Page 17.15
different dilution factors based on the mining method, and uses the appropriate dilution factor as part of their mineable reserve estimation.
PAH has reviewed the dilution amounts in the JC matrix and found them to be representative of the dilution that is occurring in the mining process. Table 17-3 includes the unplanned mining dilution percentages that have been applied to the resource to arrive at the mineable reserve statement for each of the four mines at Jerritt Canyon. All dilution is applied at zero ounces per ton, which is a conservative approach in PAH's view.
TABLE 17-3
Queenstake Resources Ltd. Jerritt Canyon Project Unplanned Dilution
Mine | Drift & Fill (rock) | Drift & Fill (fill) | Sublevel Stopes | |||
| SSX | 6.0% | 6.0% | 3.0% | |||
| Murray | 5.0% | 3.0% | 10.0% | |||
| Smith | 12.0% | 5.0% | 7.0% | |||
| MCE | 0.0% | 0.0% | 0.0% | |||
Because of the excellent quality of the cemented backfill that is being used, the mining recovery in stoping is essentially 100 percent.
No external dilution has been calculated for the stockpiles and Wright Window, which will be an open pit operation.
The mineable reserves, using JC's cutoff grades as of December 31, 2003, are listed in Table 17-4. The stockpiled ore included in the "proven" category in the mineable reserve is a combination of stockpiled ore from underground production, and that part of the open pit stockpiled material that has been screened and upgraded. The stockpiled ore included in the "probable" category is that part of the open pit stockpile that has not been screened, but has been assumed to have been screened and upgraded in order to meet the cutoff grade criteria.
AMENDED 2
Page 17.16
TABLE 17-4 Queenstake Resources Ltd. Jerritt Canyon Project Mineral Reserves Estimate - December 2003
![]()
AMENDED 2
Page 17.17
18.0 OTHER RELEVANT DATA AND INFORMATION
PAH notes that Queenstake is planning to continue operating JC at current mill throughput rates within the current Life of Mine plans which extends into the years 2004 and 2005, mining out the currently available proven and probable reserves by early 2006. Queenstake will also pursue an aggressive program of resource development with the goal of converting a good portion of the current measured and indicated resources into mineable reserves. To achieve this resource conversion Queenstake is continuing to increase expenditures in reserve development (drilling plus ore access and development), over and above the previous owner's plans for the operation.
Based on the exploration and development drilling data currently available, PAH finds that there is a reasonable expectation of converting some of Jerritt Canyon's currently defined geologic resources to mineable reserves.
PAH is not aware of any relevant data or information not already presented in this report.
AMENDED 2
Page 18.1
19.0 INTERPRETATION AND CONCLUSIONS
PAH considers the JC mine to be a relatively low-risk project at least for the short term within the next two years and one month during which the current reserves will be exhausted. For 2006 and beyond, the operation will largely depend, like many underground mines with short mine life, on its ability to replace mined-out reserves by timely conversion of resources to reserves. The success of the reserve development program that Queenstake has implemented will be the critical item in prolonging the mine life of JC.
The current reserves are largely substantiated by the production history of the mine. The operating staff of JC is competent and has successfully executed operating plans for the years reviewed. The JC operation has increased the reserve base since PAH's last review from about 1.5 years at the end of 2002 to about 2.1 years at the end of 2003, a remarkable accomplishment taking into account that over a million tons of ore were mined and 1.5 million tons processed during 2003.
AMENDED 2
Page 19.1
20.0 RECOMMENDATIONS
Queenstake has recently acquired the JC operation and is implementing an aggressive resource and reserve development program. It is critical for the sustainability of the operation beyond 2006 that mineable reserves are maintained at least at current levels of about two years. Drilling and mine development into highly prospective resource areas should be given a high priority for the conversion of resources to reserves. Primary targets for resource conversion should be areas immediately adjacent to current operations primarily at the SSX and Smith mine such as Zone 5, Steer/Saval and Main Mahala.
PAH has the following recommendations:
- Maximize the mill tonnage capacity by using the low-grade stockpiles available to complement the mines' production especially during times of high gold prices.
- Considering that winter normally proves to be a difficult season for ore haulage, the operation should try to maximize stockpile haulage to or near the mill during the summer time.
- The operation production summaries need to more clearly show and identify the ore material place of origin and source(s) (e.g., stockpile, marginal ore, etc.) to the mill and they should closely match the mill throughput.
AMENDED 2
Page 20.1
21.0 REFERENCES
| 1. | Queenstake Resources Ltd., June 2003,Jerritt Canyon Mine, Elko County, Nevada, Technical Report; Pincock, Allen & Holt. |
| 2. | Queenstake Resources Ltd., February 27, 2003,Queenstake Resources to Acquire Jerritt Canyon,Press Release 2003-04 posted on SEDAR February 27, 2003, Queenstake staff. |
| 3. | Queenstake Resources Ltd., February 2003,Proposed Acquisition of Jerritt Canyon,Queenstake staff. |
| 4. | JMR,A Review of Some Aspects of the Jerritt Canyon Project Resource and Reserve Modeling Methodology,January 2003, Jean-Michel (JM) Rendu. |
| 5. | AngloGold Corp.,2002 Mineral Resources and Mineral Reserves for the Jerritt Canyon Joint Venture, Jerritt Canyon District, Nevada,December 2002, AngloGold staff. |
| 6. | SRK Consulting,Jerritt Canyon: Life of Mine Plan Review,October 2002, SRK staff. |
| 7. | AngloGold Corp, Life of Mine Plan, Jerritt Canyon Joint Venture,September 2002, AngloGold staff. |
| 8. | AngloGold Corp,Strategic Plan 2003, Jerritt Canyon Joint Venture,March 2002, AngloGold staff. |
| 9. | AngloGold Corp., Mid-Year2002 Mineral Resources,Jerritt Canyon District, Nevada, June 2002, AngloGold staff. |
| 10. | AngloGold Corp.,2001 Mineral Resources and Mineral Reserves for the Jerritt Canyon Joint Venture, Jerritt Canyon District, Nevada,December 2001, AngloGold staff. |
| 11. | AngloGold Corp.,2000 Mineral Resources and Mineral Reserves for the Jerritt Canyon Joint Venture, Jerritt Canyon District, Nevada,December 2000, AngloGold staff. |
| 12. | Mineral Resources Development, Inc.,AngloGold North America Resources and Reserve Audit, Jerritt Canyon District,June 2000, MRDI staff. |
| 13. | AngloGold Corp,Monthly Operations Report, Jerritt Canyon Joint Venture,December 2002, AngloGold staff. |
| 14. | AngloGold Corp,Monthly Operations Report, Jerritt Canyon Joint Venture,December 2001, AngloGold staff. |
AMENDED 2
Page 21.1
| 15. | AngloGold Corp,Monthly Operations Report, Jerritt Canyon Joint Venture,December 2000, AngloGold staff. |
| 16. | Standards of Disclosure for Mineral Projects, Canadian National Instrument 43-101. |
| 17. | Standards of Disclosure for Mineral Projects, Companion Policy 43-101CP to National Instrument 43-101. |
| 18. | Standards of Disclosure for Mineral Projects, Form 43-101F1, Technical Report |
| 19. | Reference to the above documents also includes the electronic spreadsheets, maps and text included with the publications. |
AMENDED 2
Page 21.2
22.0 ADDITIONAL REQUIREMENTS FOR PRODUCING PROPERTIES
JC is an operating property with over 20 years of production experience, during which about 6.0 million ounces of gold have been produced.
The Jerritt Canyon mine consists of four operating underground mines located several miles west of the ore processing plant and administration complex that is situated about 50 miles north of Elko, Nevada (Figure 22-1).
All of the mines feed the same processing plant, with the four mines typically producing and trucking about 3,059 tons per day (t/d) to the plant. Approximately, an additional 1,000 tons per day of plant feed comes from surface stockpiles.
The individual mines, with their average, approximate, production rates for the year ending December 31, 2003, are listed as follows:
| Saval/Steer Extension (SSX) | 1,425 t/d | |
| Murray | 836 t/d | |
| Lee Smith (Smith) | 672 t/d | |
| Marlboro Canyon Extension (MCE) | 126 t/d | |
| Stockpiles | 1,000 t/d | |
| Total | 4,059 t/d |
The processing plant has the capability of treating approximately 4,200 t/d. This rate was more easily attainable when the plant was being fed with ore from several open pits, along with minor underground production. However, now that all of the open pits have been shut down, the plant feed is being derived solely from the underground mines. The four underground mines as currently developed are not capable of producing the 4,200 t/d production required by the plant. Therefore, low-grade stockpiles, left over from earlier open pit mining, and underground low-grade ore are being utilized to supplement the underground production and provide the additional tonnage required to keep the processing plant operating at full capacity.
The open pit stockpile material carries a very low grade (approximately 0.06 oz Au/t) and is "borderline" when the economics of the material is considered, even when using incremental cutoffs. On-site studies indicated that the gold values were relatively higher in the fines portion of the stockpiled material, and that screening of the material to upgrade it could be justified. This screening has been performed in a few of the various existing stockpiles, resulting in a recovery of about 70 percent, with an average grade of 0.094 oz Au/t. The screened material is part of the reserve.
Stockpiled material and low-grade feed should only be utilized if there is space in the plant, or at the end of the mine lives. Production beyond 2004 will primarily come from the SSX and Smith mines, Steer-Saval, Dash East and other newly converted resources to ore reserves.
AMENDED 2
Page 22.1
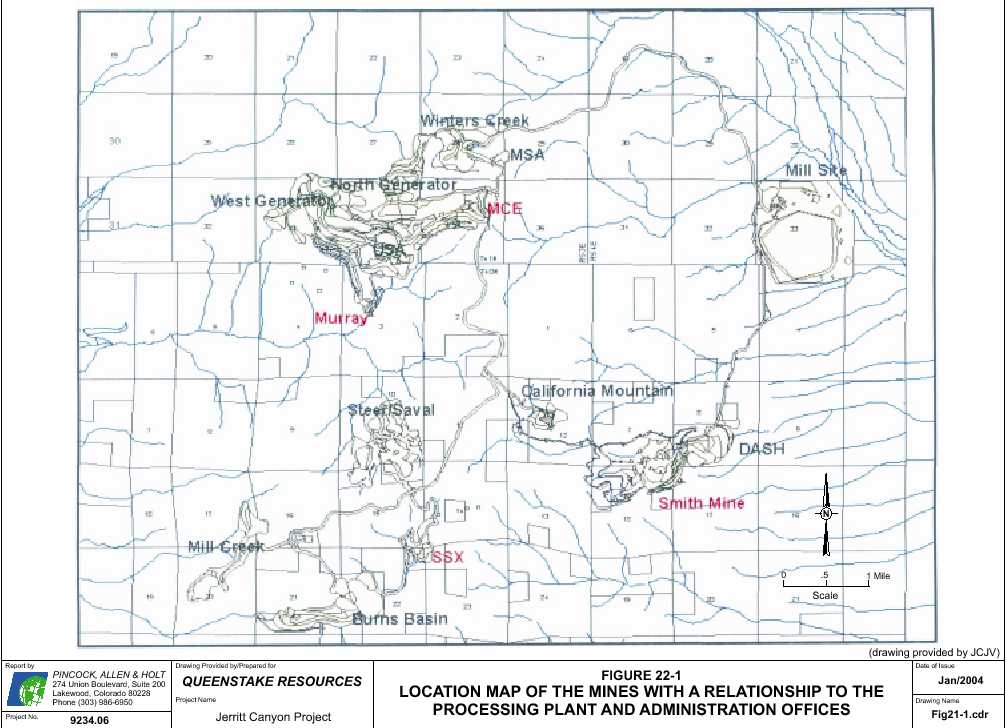
All of the mines are operated by trackless equipment and send their production from surface stockpiles located at the respective portals to the processing plant in 150-ton haul trucks.
Good, wide, haul roads connect the individual mines to the processing plants and the administration area next to the plant. In the winter months, the mine and plant areas receive a fair amount of snow that causes the roads, which have been constructed for the most part in carbonaceous sediments, to become covered with a black mud, that also covers the equipment operating on the roads.
The Jerritt Canyon gold deposits are Carlin-Type deposits, where replacement gold occurs in carbonaceous sediments, particularly along major structures. The gold is generally very fine, and the host rocks are altered, resulting in poor to fair rock conditions within the individual mines. All openings underground must be supported with rockbolts and wire mesh, and shotcrete where conditions are more severe, or where traffic is concentrated. Generally, the mines are relatively dry, except for the Smith mine which has underground water inflows of about 1,000 gallons per minute (gpm), including nuisance floor water. The dewatering system, with the capacity to handle 1,500 gpm, is handling the water; and the water table is slowly being lowered. The pumped water is sent to re-injection wells located on the surface. The Murray mine is currently pumping about 500 gpm.
Typical openings underground are 15 feet x 15 feet in cross-section, with ramps of 12 to 15 percent inclination. Ventilation and road conditions are excellent in all mines, and the ground is being well supported and maintained. The safety records at all mines are also excellent.
Mine drilling, mucking, and hauling equipment maintenance is typically performed in small surface shops located at each mine, or at the central shop located adjacent to the processing plant.
Access to all underground mines is by inclined ramp. Interior development includes haulage levels, stope access ramps, crosscutting, and drifting alongside the ore.
Ventilation boreholes (6 and 8 foot diameter, with some lined) connect the underground mine workings with the surface. Typically, the access ramps are fresh-air intakes, while the ventilation raises are used as exhaust conduits. These ventilation raises are typically equipped with variable-pitch, or belt driven, axi-vane, 125 hp to 150 hp main fans, located either underground adjacent to the ventilation raise, or on the surface. Secondary fans within the mine are typically 42" diameter, 125 hp, axi-vane units.
22.1 Mining Production Schedule
The mine production schedule for the year 2004 maintains essentially the current levels of production. For the year 2003, a total of 1.095 million tons, at a gold grade of 0.287 opt of ore and low-grade, were mined. Approximately, an additional 400,000 tons came from existing surface low grade stockpiles. In 2004, 1.5 million tons (1.129 million tons from the mines and 0.371 million tons from low grade stockpiles), at 0.251 opt gold are scheduled for milling.
AMENDED 2
Page 22.3
In 2005 the schedule calls for 1.494 million tons of ore and low-grade material (1.36 million tons from the mines and 0.13 million tons from stockpiles) at an average grade of 0.274 opt, to be sent to the mill. The 2005 schedule increases the tonnage produced by the mines by more than 200,000 tons above the levels that the underground mines have been able to produce in the last few years. Consequently, the overall mill head grade is also planned to increase by more than 10% of the recent mill head grade levels. PAH has reviewed the 2005 project schedule and believes it is optimistic based on the recent past performance of the operation, yet potentially achievable if some of the new areas considered in the mine plan (e.g. Steer/Saval, Smith East, etc.) prove to be highly productive.
In 2006, the current mineable reserves will allow only about 72,000 tons (i.e. less than one month of milling) to be processed from the mines.
It is expected that continued conversion of resources to reserves, as explained in section 18, will occur. Based on the exploration and development drilling data currently available, PAH finds that there is a reasonable expectation of converting some of Jerritt Canyon's currently defined geologic resources to mineable reserves to meet a production forecast through at least the year 2007.
22.2 Recoverability
Gold recovery values and roaster tonnages over the last four years, as well as the projections for the 2004 Budget, are presented in Table 16-2. Queenstake has used similar production levels, recovery values (88 percent) and operating costs to those experienced during the second half of 2003 for the future budgets and PAH believes that they should be achievable.
22.3Markets
Gold markets are mature, global markets with reputable smelters and refiners located throughout the world. Market prices for gold have recently been on the rise with current levels at about $400.00 per ounce.
Doré is easily marketable to refiners in North America. Jerritt Canyon has been shipping its doré to the Johnson Matthey refinery in Salt Lake City, Utah.
22.4 Contracts
Contracts for operations at JC are limited to specialized drilling and exploration or development drilling campaigns. JC conducts mining activities in-house. The current refining agreement specifies a treatment charge of $0.40 per ounce of doré processed, a transportation charge of $400 per shipment, and a payable rate of 99.9 percent of the gold. In aggregate these costs and payable rate amounts to about $1.20 per ounce of gold, the value used in Queenstake's assessment.
AMENDED 2
Page 22.4
22.5Environmental Considerations
Environmental management systems are in place and there is a qualified environmental staff onsite. The senior staff remained with the project after Queenstake's acquisition and overall the environmental management has continued as prior to the acquisition. Various mitigation programs are in place as required under the various plans of operations that have been filed and approved for the project. No unusual costs associated with any of these programs were identified. Approved reclamation and closure plans are in place and JC is progressing with concurrent reclamation in an orderly manner. A 2002 estimate of closure costs has been prepared for support of bonding. Assuming work is completed by JC, costs are estimated at $39.4 million including a $7.98 million cost for environmental management over a 16-year post-closure period that would include operation of the seepage pumpback system for the tailings impoundment. The reclamation cost for the agency bond was estimated at $33.47 m illion as calculated under the US Forest Service bonding guidelines.
It is understood Queenstake has a policy with American Insurance Group (AIG) for a closure cost cap insurance policy that has been accepted by the regulatory agencies to serve both to fund reclamation and post-closure site management by Queenstake and to meet the agency requirements for bonding. PAH has not reviewed the terms and conditions of this policy, however we would consider the current closure cost estimates developed by JC to be reflective of the post-closure reclamation costs.
Closure and reclamation will consist of the following actions:
- Open pits will be reclaimed by partially backfilling the pits with mine waste rock produced in the underground mining operations. Level areas in the pit bottom will be covered with fine-grained waste rock or growth medium and revegetated.
- Portals for the underground mines will be sealed by blasting, backfilling or bulkheading. Raises extending to the surface will be backfilled. Regional groundwater levels are below the elevation of the mine portals or raises, therefore seepage from the mines is not expected.
- Waste rock dumps are to be left in a condition meeting slope stability requirements. Portions of the older dumps will be left with angle of repose sideslopes that are covered with durable non-acid generating rock. Other dumps will have final slopes of 2.5 to 1 (horizontal to vertical). Tops of the dumps will be graded to route surface water runoff away from dump slopes. Level surfaces of the dumps and the 2.5 to 1 sideslopes will be covered with growth media and revegetated.
- Haul roads and access roads not included in the final site access requirements will be regarded to conform to the original ground contours and revegetated. It is understood discussion are currently in progress with the US Forest Service to identify roads that will remain. Haul roads that may be left open will likely require some level of reclamation to reduce overall road width.
AMENDED 2
Page 22.5
- Sediment control structures will be reclaimed by breaching ponds and basins after sediment and erosion control issues are controlled through reclamation of the areas draining to the structures.
- The tailings impoundment will be reclaimed by first removing free water from the pond through evaporation. The tailings surface will be allowed to dry to a consistency to allow operation of earth moving equipment and covered with 2 to 2.5 feet of material to grade the surface to drain and an additional 1.5 to 2 feet of growth medium placed for revegetation. Operation of the seepage recovery and pumpback system will need to continue for a period of time after the tailings impoundment is closed and seepage from the tailings ceases. It is assumed the recovered water will be managed by land application over the tailings impoundment area to assist in revegetation efforts and by evaporation.
- Spent heap leach materials from a leach pad adjacent to the tailings impoundment will be excavated and placed as fill for grading the tailings impoundment.
- Solution ponds associated with the heap leach pad and the processing plant will be reclaimed by removing solution from the pond, and disposal of all contained sludge in the tailings impoundment. Pond liners will be folded into the ponds and backfilled. Growth medium will be placed over the backfilled ponds and revegetated.
- Buildings and structures will be dismantled to the level of foundations and either salvaged or disposed of in an approved landfill. Process piping will be rinsed and neutralized Disposition of underground piping is not specifically addressed, however PAH would assume it will be necessary to remove all piping.
As the mine progresses closer to closure, the overall detail of the closure plan may require refinement. The overall closure plan is considered by PAH to follow proven and accepted industry practices.
22.6 Taxes and Royalties
Table 22-1 details the state and local taxes that Queenstake may be subjected to at its head office in Colorado and the state and local taxes levied in the state of Nevada to the Jerritt Canyon operation.
22.7Capital Costs
22.7.1 Mining
Mine capital expenditures at the JC mines are grouped into three main cost centers; exploration, capitalized underground, and capitalized mining.
Capitalized underground includes; both mine equipment and facilities, and reserve development.
AMENDED 2
Page 22.6
| TABLE 22-1 | ||||
| Queenstake Resources Ltd. | ||||
| Jerritt Canyon Project | ||||
| State and Local Taxes | ||||
| Tax base | Tax rate | Tax deductable | ||
| Colorado | ||||
| Severance tax | Gross profit | 2.25% | YES | |
| less 50% of | ||||
| property taxes | ||||
| Ad valorem taxes: | ||||
| Producing Mine Value | Higher of 25% | 4% | YES | |
| of gross profit | ||||
| or 100% of net profit | ||||
| at the mine level | ||||
| (all factors averaged) | ||||
| Equipment and | ||||
| Improvements Value | 29% (Assessed Value) of | 4% | YES | |
| Depreciated Replacement | ||||
| Cost | ||||
| Sales and Use Tax | One time transaction tax | 3% | YES | |
| based on cost of personal | ||||
| property additions, excluding | ||||
| items qualifying for | ||||
| "Manufacturer's Exemption" | ||||
| Corporate Income Tax | Federal Taxable Income | 4.63% | YES | |
| less adjustments and net | ||||
| operating loss carryforwards | ||||
| (offering complete shelter | ||||
| for a period of years) | ||||
| Nevada | ||||
| Ad valorem taxes: | ||||
| Producing Mine Value | Net income at the mine level | 5% if net | YES | |
| adjusted to deduct 100% of | proceeds over | |||
| development cost and some | $ | 4MM, sliding | ||
| exploration costs | scale below that | |||
| Equipment and | ||||
| Improvements Value | 35% (assessed value) of | 2.476% | YES | |
| depreciated replacement | ||||
| cost | ||||
| Sales and Use Tax | One time transaction tax | 6.5% | YES | |
| based on cost of personal | ||||
| property additions. | ||||
AMENDED 2
Page 22.7
Capitalized mining includes underground development work that will serve the mine for several years (major haulage levels, ramps, etc.), or includes permanent installations such as bored ventilation raises, etc.
A summary of the actual mine capital expenditures for the years 2000, 2001, 2002, and 2003, and that budgeted by the JC for 2004 are shown in Table 22-2.
| TABLE 22-2 | |||||||||||||||||||
| Queenstake Resources Ltd. | |||||||||||||||||||
| Jerritt Canyon Project | |||||||||||||||||||
| Mine Capital Expenditure Summary ($x1000) | |||||||||||||||||||
| Cost Center | 2000 | 2001 | 2002 | 2003 | 2004 | ||||||||||||||
| Exploration | $ | 3,546 | $ | 783 | $ | 0 | $ | 205 | $ | 0 | |||||||||
| Cap. UG Equip/Facil. | 10,058 | 5,378 | 5,256 | 4,694 | 4,860 | ||||||||||||||
| Capital. Mine Dev. | 10,972 | 9,209 | 4,883 | 5,103 | 9,614 | ||||||||||||||
| Total | $ | 24,576 | $ | 15,370 | $ | 10,139 | $ | 10,002 | $ | 14,474 | |||||||||
A breakdown of the mine capital underground and capitalized mining expenditures by mine for the year 2004 (Table 22-2) is shown in Table 22-3.
TABLE 22-3
Queenstake Resources Ltd. Jerritt Canyon Project
2004 Capital Expenditure Detail byMine ($x1000)
| Cost Center | SSX | Murray | Smith | Steer | Total | |||||||||||
| Capital. Mining | $ | 2,896 | $ | 195 | $ | 5,223 | $ | 1,300 | $ | 9,614 | ||||||
| Equip./Facilities | 2,088 | 700 | 1,760 | 312 | 4,860 | |||||||||||
| Reserve Develop. | 0 | 0 | 0 | 0 | 0 | |||||||||||
| Total | $ | 4,984 | 895 | 6,983 | 1,612 | $ | 14,474 | |||||||||
The on-going capital for diamond drilling and equipment rebuilds, water handling, vent raises, load centers, etc. during the years 2003 to 2006 is shown in Table 22-4. This assumes that production will continue during those years, and is estimated at $7,025,000.
AMENDED 2
Page 22.8
TABLE 22-4
Queenstake Resources Ltd.
Jerritt Canyon Project
Sustaining Capital Expenditurefor 2003 to 2006 by Mine($x1000)
Mine | 2003 | 2004 | 2005 | 2006 | Total | ||||||||||
| SSX | $ | 1,071 | $ | 1,000 | $ | 1,000 | $ | 500 | $ | 3,571 | |||||
| Murray | 677 | 677 | 0 | 0 | 1,354 | ||||||||||
| Smith | 600 | 600 | 600 | 300 | 2,100 | ||||||||||
| MCE | 0 | 0 | 0 | 0 | 0 | ||||||||||
| Total | $ | 2,348 | $ | 2,277 | $ | 1,600 | $ | 800 | $ | 7,025 | |||||
22.7.2 Ore Processing
Sustaining capital costs for ore processing have averaged $220,000 in the last two years. Queenstake has included $700,000 in 2004.
22.7.3 Surface Services
The surface services sustaining capital cost has varied significantly but has not exceeded $400,000 per year in any of the last three years. Capital costs in this account are primarily for heavy mobile equipment rebuilds.
22.7.4 General and Administrative
G&A capital costs have averaged about $150,000 for the last four years. PAH expects it to remain at the current level for the life of the property and remain essentially independent of production rate.
22.8 Operating Costs
22.8.1 Mine Operating Costs
Mine operating costs for the four mines during the year 2003, and those budgeted for 2004 and 2005, were reviewed and evaluated by PAH.
In general, mine operating costs are somewhat high when compared to other mines producing at the same production rate and using the same mining method(s). This is primarily due to the expensive backfill that is required at the JC mines. Typically, the backfill costs are about $14 per ton placed, but the excellent quality of the backfill allows complete extraction of the ore.
Total operating costs for the year 2003 (years 2004, 2005, and 2006 should be about the same in constant dollars, assuming the production rate from the mines remains about the same), are presented in the following Table 22-5. The costs in this table are based on the last six months of the year 2003, as that is the period that reflects operation by Queenstake.
AMENDED 2
Page 22.9
The majority of future production would probably come from the Smith, SSX, Steer-Saval, and Dash East deposits.
Table 22-5 details the mine operating costs incurred during the last six months of the year 2003 ($x1000)
TABLE 22-5
Queenstake Resources Ltd.
Jerritt Canyon Project
2003 (July - December) Operating Cost Summary($x1000)
| Cost Center | SSX | Murray | Smith | MCE | Total | ||||||||||||
| Mine Oper. Cost | $ | 7,481 | $ | 5,170 | $ | 3,688 | $ | 879 | $ | 17,218 | |||||||
| Maint. Oper. Cost | 3,183 | 2,053 | 1,180 | 369 | 6,783 | ||||||||||||
| Total Oper. Cost | $ | 10,664 | $ | 7,223 | $ | 4,868 | $ | 1,248 | $ | 24,001 | |||||||
| Total $/ton | $ | 42.05 | $ | 48.53 | $ | 40.73 | $ | 55.63 | $ | 44.09 | |||||||
| Less Capital Dev. | $ | 1,783 | $ | 0 | $ | 1,100 | $ | 0 | $ | 2,884 | |||||||
| Net Oper. Cost | $ | 8,879 | $ | 7,223 | $ | 3,768 | $ | 1,248 | $ | 21,118 | |||||||
| Net $/ton | $ | 35.02 | $ | 48.53 | $ | 31.52 | $ | 55.63 | $ | 38.79 | |||||||
| . | |||||||||||||||||
| 22.8.2 Ore Processing | |||||||||||||||||
Ore processing costs have remained reasonably steady over the last two years, averaging about $25 million per year or about $16.75 per ton. Of this amount about $19 million is for operation and $6 million for maintenance. PAH would expect that future costs will remain close to the existing level were the plant to continue to operate at 1.5 million tons per year. Should one of the roasters be shut down, unit costs would rise significantly since the oxygen plant cannot be turned down to operate at half rate. JC has projected ore processing costs to be about $16.50 per ton in their LOM plan. PAH believes that this estimate is reasonable and is similar to the cost that was experienced during the second half of 2003.
22.8.3 Surface Services
Costs in this category were about $4.7 million in 2003, or about $3.10 per ton milled. Most of these costs are for heavy mobile equipment operation and maintenance, since the principal service provided is transportation of mined and stockpiled ore to the ore processing plant. The costs for operation of the aggregate plant and the cost for screening of low-grade stockpiles to provide part of the ore processing plant feed are also included.
The LOM plan for surface services are estimated to be $3.04 per ton milled which PAH considers acceptable. Cost reductions may be possible by, at least partially, eliminating the stockpile ore screening as long as the gold price remains at current levels or higher.
AMENDED 2
Page 22.10
22.8.4 General and Administrative
The G&A costs are essentially independent of the production rate. Costs were relatively consistent and at about $9.5 million per year under the previous AngloGold management structure.
Queenstake has reduced G & A costs by about 20 percent with the total for the second half of 2003 being $3.8 million or about $4.80 per ton milled. Queenstake's LOM plan uses a G & A cost of $4.72 per ton milled which is similar to their current costs. PAH believes this cost estimate is reasonable for LOM plan use.
22.9 Economic Analysis
The production, operating costs and capital cost included in the Queenstake proven and probable reserves (P&P) cash flow model appear reasonable based on a comparison to Jerritt Canyon actual and the presented P&P LOM plan. A summary comparison is presented in Table 22-6.
The presented P&P plan indicates that mineable reserves are mined out by January of 2006. The average gold grade mined is slightly lower in future years than that mined during 2000 through 2002 (about 0.32 gold opt), but similar to the 2003 mine production (0.29 opt). A 0.5-million ton low-grade ore stockpile (at about 0.09 gold opt) is blended into the mill feed over the next two years. Mill recovery is projected to be about 87.7 percent through 2006 versus 88 to 90 percent during the past four years. Total recovered gold production drops from an actual peak of over 400,000 ounces (including custom milling from Cortez) in 2001 to about 332,000 ounces in 2004.
Mining and milling unit-operating costs (per ton) are similar in the P&P plan to actuals. The administration cost drops from actual to plan by about $100,000 per month due to reduced corporate overhead allocations. The P&P plan operating cost per gold ounce produced is similar to Jerritt Canyon's actual costs of the last few years at about $250 to $270 per ounce.
Planned total capital expenditures for the next two years are higher than the past two years reflecting Queenstake's increased focus on mine development and exploration. Capital is significantly higher during the next two years (over $9 million per year) to develop ore reserves beyond the two years of current declared reserves. The conversion of ore resources to planned mineable ore is critical to the viability of Jerritt Canyon beyond 2006.
The working capital is assumed to include about $3 million in warehouse inventory.
The underlying production, operating costs and capital costs included in the P&P cash flow model for JC appear reasonable and based on plans evaluated by PAH. However, PAH did not perform a detailed independent economic analysis of the Queenstake Resources P&P plan and is unable to opine upon their accuracy or completeness. PAH notes that although the presented cash flow model is based only on P&P reserves, when we consider the observations, interpretations and conclusions included in Sections 1.7, 1.14, 10.0, 17.2, 18.0,19.0 and 20.0, it is reasonable to expect
AMENDED 2
Page 22.11
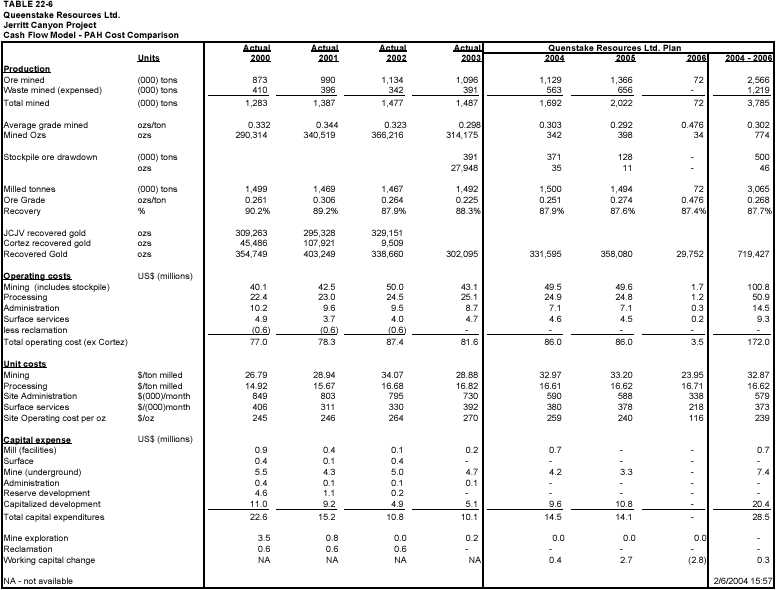
AMENDED 2
Page 22.12
that the Company may prepare life-of-mine plans that anticipate a longer mine life, and somewhat different production profiles and cost structures.
The gold price assumed by Queenstake in the cashflow projection is $350/ounce. In PAH's opinion this metal price is in line with gold price projections currently in use by the industry.
Annual projected cash flows are discounted at a rate of interest to account for the time value of money. The resulting discounted net cashflows are summed up over the mine life to yield a Net Present Value or NPV. Table 22-7 summarizes the sensitivity of NPV at various discount rates of various operating costs, ore grades, and metal prices using adjustments of 10 percent up and down. Table 22-8 shows the JC annual cash flow model for Queenstake's Base Case.
Jerritt Canyon economics are most sensitive to gold price assumptions and projected ore grade. The Net Present Value (NPV) is based on slightly over two years cash flow as indicated by the proven and probable reserves. Queenstake intends to increase reserves, mine life, and cash flow years.
22.10Payback Period
Payback period is the length of time, usually expressed in years, from the start of commercial production of a new project for the initial project capital costs to be fully repaid out of after tax operating cashflows excluding debt service. The payback period is more relevant for new mine developments or mine expansions. PAH is not aware of any outstanding capital being incurred by the JC operation regarding the recent change of ownership. On going capital investment requirements are covered by the operation's cash flow.
22.11Mine Life
The mine life of the JC mine, based on current projected milling rates and reported proven and probable reserves as of December 2003, is approximately 2.1 years, with an excellent possibility of extending it if Queenstake's resource conversion to reserves development program is successful. PAH believes that there is a reasonable likelihood of converting the higher quality resources to mineable reserves available for extraction within the next several years.
AMENDED 2
Page 22.13
TABLE 22-7
Queenstake Resources Ltd.
Jerritt Canyon Project
Sensitity to Gold Price, Ore Grade and Operating Cost ($US X 1,000,000)
Net PresentValue as of January 1, 2004
| Discount | 43-101 Base | Gold price (unhedged) | Ore Grade | Operating Cost | |||||||||||||||
| rate | Case | $ | 300 | $350 | $ | 400 | +10% | -10% | +10% | -10% | |||||||||
| 0% | 44.4 | 10.3 | 44.4 | 78.6 | 68.2 | 20.7 | 26.4 | 62.5 | |||||||||||
| 5% | 40.4 | 8.7 | 40.4 | 72.0 | 62.4 | 18.4 | 23.6 | 57.1 | |||||||||||
| 10% | 36.9 | 7.4 | 36.9 | 66.3 | 57.3 | 16.4 | 21.3 | 52.5 | |||||||||||
| 15% | 33.9 | 6.4 | 33.9 | 61.4 | 53.0 | 14.8 | 19.3 | 48.5 | |||||||||||
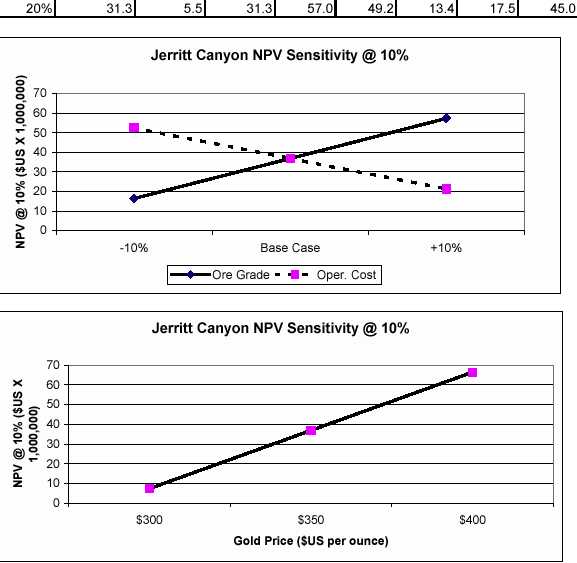
AMENDED 2
Page 22.14
| TABLE 22-8 | |||||||||||||||||||||||
| Queenstake Resources Ltd. | |||||||||||||||||||||||
| Jerritt Canyon Project | 2004 | 2005 | 2006 | 2007 | |||||||||||||||||||
| Projected Production and Annual Cash Flow | 0 | 1 | 2 | 3 | Total | ||||||||||||||||||
| 366 | 365 | 23 | - | 754 | |||||||||||||||||||
| Production | |||||||||||||||||||||||
| Reserves Mined & Processed | |||||||||||||||||||||||
| Ore Mined (000's) | 1,500.0 | 1,493.8 | 71.5 | - | 3,065.3 | ||||||||||||||||||
| Grade O.P.T. | 0.251 | 0.274 | 0.476 | - | 0.268 | ||||||||||||||||||
| Contained Gold Ounces (000's) | 377.1 | 408.9 | 34.0 | - | 820.1 | ||||||||||||||||||
| Total Ore Processed | |||||||||||||||||||||||
| Ore Mined (000's) | 1,500.0 | 1,493.8 | 71.5 | - | 3,065.3 | ||||||||||||||||||
| Grade O.P.T. | 0.251 | 0.274 | 0.476 | - | 0.268 | ||||||||||||||||||
| Contained Gold Ounces (000's) | 377.1 | 408.9 | 34.0 | - | 820.1 | ||||||||||||||||||
| Process Rate (tpd) | 4,098 | 4,093 | 3,133 | - | 4,066 | ||||||||||||||||||
| Gold Recovered (000's) | 87.7% | 331.6 | 358.1 | 29.8 | - | 719.4 | |||||||||||||||||
| Gold Price | $ | 350. | $ | 350. | $ | 350. | |||||||||||||||||
| Cash flow ($ 000's) | |||||||||||||||||||||||
| Revenue | |||||||||||||||||||||||
| Gold Sales | $ | 116,058.4 | $ | 125,327.9 | $ | 10,413.3 | - | $ | 251,799.6 | ||||||||||||||
| Operating Costs | |||||||||||||||||||||||
| Mining | (49,457.7) | (49,594.4) | (1,713.3) | ||||||||||||||||||||
| Surface Services | (4,559.9) | (4,541.1) | (217.5) | - | |||||||||||||||||||
| Processing | (24,913.3) | (24,825.6) | (1,195.9) | - | |||||||||||||||||||
| Site Administration, Royalties and production taxes | (9,198.1) | (9,649.1) | (672.2) | - | |||||||||||||||||||
| Total operating costs | (88,129.0) | (88,610.2) | (3,799.0) | - | (180,538.17) | ||||||||||||||||||
| Capital costs, salvage recoveries | (14,474.0) | (14,099.1) | 927.5 | 832.5 | (26,813.09) | ||||||||||||||||||
| Working Capital | (350.2) | (2,668.8) | 2,757.4 | 261.7 | (0.00) | ||||||||||||||||||
| Net cash flow | $ | 13,105.2 | $ | 19,949.7 | $ | 10,299.2 | $ | 1,094.2 | |||||||||||||||
| Cumulative cash flow | $ | 13,105.2 | $ | 33,054.9 | $ | 43,354.1 | $ | 44,448.3 | |||||||||||||||
| Project Return -- NPV @10% | $ | 36,886.5 | |||||||||||||||||||||
Note: Income taxes are assumed to be nil; reclamation costs are not included as Jerritt Canyon has already funded and insured all reclamation and mine closure costs.
AMENDED 2
Page 22.15
23.0 ILLUSTRATIONS
The illustrations supporting the various sections of the report are located within the relevant sections immediately following the references to the illustrations, for ease of reference. An index of tables and illustrations is provided in the Table of Contents.
AMENDED 2
Page 23.1
24.0 CERTIFICATE OF QUALIFICATION
Raul H. Borrastero
274 Union Blvd., Suite 200
Lakewood, CO 80228
303-986-6950
I, Raul H. Borrastero, am a professional geologist with Pincock, Allen and Holt of 274 Union Blvd, Suite 200 in the City of Lakewood, Colorado, in the USA.
I am:
| 1. | A Registered Professional Geologist with the American Institute of Professional Geologists (CPG-10884). |
| 2. | A graduate of the National University of Cordoba, Argentina a degree of Geologist, in 1981, and the University of Montana, with a Master of Science degree in Geology in 1990. I have practiced my profession continually for 21 years. |
| 3. | I hold membership in the following mineral industry technical societies:
|
| 4. | Since 1982 I have been involved in mine management, geologic exploration, resource and reserve estimation in both open pit and underground operations, involving copper, gold, silver, phosphates, limestone, coal and base metals located in the United States, Canada, Mexico, Peru, Argentina, Chile, Venezuela, and Spain. |
| 5. | As a result of my education and experience, I am a "Qualified Person" as defined in National Policy 43-101. |
| 6. | I am presently senior geologist with the international consulting firm of Pincock, Allen and Holt, and have been so since December 2002. |
| 7. | I have visited the Jerritt Canyon project on several occasions: in January 2003, I reviewed the operations at three of the four operating mines, and reviewed resource and reserve information; in December 2003, I discussed current operations with mine personnel; and in January 2004, I visited the SSX and Smith mines, ore stockpile areas, reviewed geologic and operational information, and reviewed the drill hole databases and assay data. |
AMENDED 2
Page 24.1
| 8. | This report was prepared under my supervision in consultation with technical specialists. I am responsible for the preparation of part of the summary (Section1), Sections 2 through 16, part of Section 17, Sections 18 through 21 and part of Section 22. |
| 9. | The sources of all information are noted and referenced in the report. The information provided by the various parties is to the best of knowledge and experience correct. |
| 10. | I am not aware of any material fact or material change with respect to the subject matter of this technical report that is not reflected in this report, the omission to disclose which would make this report misleading. |
| 11. | I am independent of Queenstake Resources, in accordance with the application of Section 1.5 of National Instrument 43-101. |
| 12. | I have not received, nor do I expect to receive, any interest, directly or indirectly, from Queenstake Resources, any affiliate, or associate company. |
| 13. | I have read National Instrument 43-101, Forms 43-101F1. This report has been prepared in compliance with NI 43-101 and Form 43-101F1. |
| 14. | I consent to the filing of the Technical Report with any stock exchange and other regulatory authority and any publication by them, including electronic publication in the public company files on their websites accessible by the public. |
| 15. | This report, as well as its conclusions and recommendations, are based on the examination of available data and discussions with involved geologists. The Author last visited the Jerritt Canyon property on January 5-8, 2004, and examined the data supplied by Queenstake before, during and after that time. |
AMENDED 2
Page 24.2
CERTIFICATE OF QUALIFIED PERSON
As an author of the report entitled "Jerritt Canyon Mine, Elko County, Nevada, Technical Report", dated July 26, 2004 (the "Technical Report") and prepared on behalf of Queenstake Resources Ltd. (the "Issuer"), I, Darrel L. Buffington, P.E., do hereby certify that:
| 1. | I am currently employed as a Principal Mining Engineer by: |
|
|
| |
Pincock, Allen & Holt |
| |
274 Union Blvd., Suite 200 |
| |
Lakewood, CO 80228 |
| |
USA |
| |
|
| |
| 2. | My residential address is: 6170 Arapahoe Drive, Evergreen, Colorado 80439 | |
|
| |
| 3. | I graduated from the University of Missouri-Rolla with a B.S. in Geological Engineering in1978 and obtained a M.S. degree in Civil Engineering from the same university in 1980. Ihave practiced my profession continuously since 1980. | |
|
| |
| 4. | I am a Registered Professional Engineer in the states of Colorado (#23705),Nevada(#07739) and Arizona (#34415) and a member of the Society of Mining, MetallurgyandExploration (SME), the Canadian Institute of Mining, Metallurgy and Petroleum andtheAmerican Society of Civil Engineers. | |
|
| |
| 5. | Since 1980, I have been involved in broad-scale civil and geotechnical engineering practice,including substantial experience in environmental review and permitting issues ofminingproperties and operations. This includes reviewing environmental management systems aspart of due diligence evaluation of operating mines, providing technical analysis ofminewaste containment facilities, review of regulatory compliance issues, anddevelopingstrategies for addressing environmental impacts in the mine planning process. | |
|
| |
| 6. | As a result of my education and experience, I am a "Qualified Person" as definedinNational Policy 43-101. | |
|
| |
| 7. | I am presently Manager of Environmental Services and Process Engineering withtheninternational consulting firm of Pincock, Allen and Holt, and have been so since March of1995.
| |
| 8. | I am responsible for the preparation of part of the Summary (Section 1), Section4.4,Environmental Liabilities, and Section 22.6, Environmental Considerations, of the TechnicalReport. | |
AMENDED 2
Page 24.3
| 9. | I have personally visited the Jerritt Canyon site in Elko, Nevada on January 2003 as part ofthe due diligence review of the operation and served as the Qualified Person for theprevious NI43-101 Technical Report on the property dated June 9, 2003. |
| |
| 10. | I am not aware of any material fact or material change with respect to the subject matter ofthe Technical Report that is not reflected in the Technical Report, the omission to disclosewhich makes the Technical Report misleading. |
| |
| 11. | I am independent of the Issuer in accordance with Section 1.5 of NI 43-101. |
| |
| 12. | I have read NI 43-101 and Form 43-101F1, and the Technical Report has been prepared incompliance with that instrument and form. |
| |
| 13. | I consent to the filing of the Technical Report with any securities regulatory authority, stockexchange or other regulatory authority and any publication by them, including electronicpublication in the public company files on their websites accessible by the public, of theTechnical Report. |
Dated in Lakewood, Colorado, this 26th day of July, 2004.
AMENDED 2
Page 24.4
CERTIFICATE OF QUALIFIED PERSON
As an author of the report entitled "Jerritt Canyon Mine, Elko County, Nevada, Technical Report", dated July 26, 2004 (the "Technical Report") and prepared on behalf of Queenstake Resources Ltd. (the "Issuer"), I, Steve L. Milne, P.E., do hereby certify that:
1. I am currently employed as a Principal Mining Engineer by:
Pincock, Allen & Holt 274 Union Blvd., Suite 200 Lakewood, CO 80228 USA
2. My residential address is 1651 East Calle el Cid, Tucson, Arizona 85718.
3. I graduated from Colorado School of Mines with a Bachelor of Science degree in Mining Engineering in 1959, and I have practiced my profession continuously since 1959.
4.I am a Registered Professional Engineer in the states of Arizona, Colorado, and Utah, USA, a Registered Professional Land Surveyor in the state of Arizona, USA, and a member of the American Institute Of Mining, Metallurgical, and Petroleum Engineers, Inc. (SME).
5. I have worked as a mining engineer for a total of 45 years since my graduation from university and have been involved in the management, design, evaluation and operation of small and large scale mining properties for gold, silver, copper, lead, and zinc in the United States, Canada, Mexico, Central and South America, the Philippines, Indonesia, Australia, Fiji, Africa, Scandinavia, the USR and Europe.
6. I have read the definition of "qualified person" set out in National Instrument 43-101 ("NI 43-101") and certify that by reason of my education, affiliation with a professional association (as defined in NI 43-101) and past relevant work experience, I fulfill the requirements to be a "qualified person" for the purposes of NI 43-101.
7. I am responsible for the preparation of part of the Summary (Section 1), reserve (part of Section 17), and Additional Information (part of Sections 18 through 22) sections of the Technical Report.
8. I have personally visited the Jerritt Canyon site in Elko, Nevada on several occasions: January 2003, December 2003, and January 2004.
9. I am not aware of any material fact or material change with respect to the subject matter of the Technical Report that is not reflected in the Technical Report, the omission to disclose which makes the Technical Report misleading.
10.I am independent of the Issuer in accordance with Section 1.5 of NI 43-101.
AMENDED 2
Page 24.5
11. I have read NI 43-101 and Form 43-101F1, and the Technical Report has been prepared in compliance with that instrument and form.
12. I consent to the filing of the Technical Report with any securities regulatory authority, stock exchange or other regulatory authority and any publication by them, including electronic publication in the public company files on their websites accessible by the public, of the Technical Report.
Dated in Lakewood, Colorado, this 26th day of July, 2004.

AMENDED 2
Page 24.6