UNITED STATES
SECURITIES AND EXCHANGE COMMISSION
Washington, D.C. 20549
FORM N-CSR
CERTIFIED SHAREHOLDER REPORT
OF
REGISTERED MANAGEMENT INVESTMENT COMPANIES
Investment Company Act file number: 811-7704
Schwab Capital Trust
(Exact name of registrant as specified in charter)
101 Montgomery Street, San Francisco, California 94104
(Address of principal executive offices) (Zip code)
Evelyn Dilsaver
Schwab Capital Trust
101 Montgomery Street, San Francisco, California 94104
(Name and address of agent for service)
Registrant’s telephone number, including area code: (415) 627-7000
Date of fiscal year end: October 31
Date of reporting period: October 31, 2006
TABLE OF CONTENTS
Item 1: Report(s) to Shareholders.
Schwab Equity Index Funds
Annual Report
October 31, 2006
Schwab S&P 500 Index Fund
Schwab Institutional Select®
S&P 500 Fund
Schwab 1000 Index® Fund
Schwab Small-Cap
Index Fund®
Schwab Total Stock Market
Index Fund®
Schwab International
Index Fund® 
Six cost-efficient ways to tap into the power of
the stock market for long-term growth potential.
In this report
| |
| Performance at a Glance | | | | | 1 | |
| From the Chairman | | | | | 2 | |
| From the President | | | | | 3 | |
| Investment Environment | | | | | 4 | |
| Schwab S&P 500 Index Fund | | | | | 6 | |
| Schwab Institutional Select® S&P 500 Fund | | | | | 8 | |
| Schwab 1000 Index® Fund | | | | | 10 | |
| Schwab Small-Cap Index Fund® | | | | | 12 | |
| Schwab Total Stock Market Index Fund® | | | | | 14 | |
| Schwab International Index Fund® | | | | | 16 | |
| Fund Expenses | | | | | 18 | |
| Financial Statements | | | | | 20 | |
| Financial Notes | | | | | 63 | |
| Investment Advisory Agreement Approval | | | | | 72 | |
| Trustees and Officers | | | | | 74 | |
| Glossary | | | | | 78 | |
Select Shares® are available on many Schwab Funds®Schwab Funds offers Select Shares, a shares class that carries lower expenses than Investor Shares™ in exchange for higher investment minimums on many of its funds. Select Shares are available for initial purchases of $50,000 or more of a single fund in a single account and for shareholders who add to their existing Investor Share position, bringing the value to or above $50,000. We encourage shareholders of Investor Shares to review their portfolio to see if they are eligible to exchange into Select Shares. If you believe you are eligible, you should contact Schwab or your financial intermediary to request a tax-free interclass exchange into Select Shares. Instructions for performing a tax-free interclass exchange can also be referenced on the Schwab Funds website at www.schwab.com/schwabfunds under Schwab Funds Investor Information. Select Shares may not be available through financial intermediaries other than Charles Schwab & Co., Inc.
Fund investment adviser: Charles Schwab Investment Management, Inc. (CSIM).
Distributor and transfer agent: Charles Schwab & Co., Inc. (Schwab).
The industry/sector classification of the funds’ portfolio holdings uses the Global Industry Classification Standard (GICS) which was developed by and is the exclusive property of Morgan Stanley Capital International Inc. and Standard & Poor’s. GICS is a service mark of MSCI and S&P and has been licensed for use by Charles Schwab & Co., Inc.
Performance at a Glance
The performance data quoted represents past performance. Past performance does not guarantee future results. Investment returns and principal value will fluctuate so that an investor’s shares may be worth more or less than their original cost. Current performance may be lower or higher than performance data quoted. To obtain performance information current to the most recent month end, please visit www.schwab.com/schwabfunds.
|
| Total Return for the Report Period
|
|---|
Schwab S&P 500 Index Fund | | | | |
| Investor Shares (Ticker Symbol: SWPIX) | | | 16.03 | % |
| Select Shares (Ticker Symbol: SWPPX) | | | 16.18 | % |
e.Shares (Ticker Symbol: SWPEX)1 | | | 16.20 | % |
| Benchmark: S&P 500® Index | | | 16.34 | % |
Performance Details | | | pages 6–7 | |
| | | | | |
Schwab Institutional Select® S&P 500 Fund (Ticker Symbol: ISLCX) | | | 16.39 | % |
| Benchmark: S&P 500® Index | | | 16.34 | % |
Performance Details | | | pages 8–9 | |
| | | | | |
Schwab 1000 Index® Fund | | | | |
| Investor Shares (Ticker Symbol: SNXFX) | | | 15.84 | % |
| Select Shares (Ticker Symbol: SNXSX) | | | 16.01 | % |
| Benchmark: Schwab1000 Index® | | | 16.26 | % |
Performance Details | | | pages 10–11 | |
| | | | | |
Schwab Small-Cap Index Fund® | | | | |
| Investor Shares (Ticker Symbol: SWSMX) | | | 17.62 | % |
| Select Shares (Ticker Symbol: SWSSX) | | | 17.78 | % |
| Benchmark: Schwab Small-Cap Index® | | | 17.94 | % |
Performance Details | | | pages 12–13 | |
| | | | | |
Schwab Total Stock Market Index Fund® | | | | |
| Investor Shares (Ticker Symbol: SWTIX) | | | 16.05 | % |
| Select Shares (Ticker Symbol: SWTSX) | | | 16.23 | % |
Benchmark: Dow Jones Wilshire 5000 Composite IndexSM | | | 16.61 | % |
Performance Details | | | pages 14–15 | |
| | | | | |
Schwab International Index Fund® | | | | |
| Investor Shares (Ticker Symbol: SWINX) | | | 26.15 | % |
| Select Shares (Ticker Symbol: SWISX) | | | 26.35 | % |
| Benchmark: Schwab International Index® | | | 26.76 | % |
Performance Details | | | pages 16–17 | |
| | | | | |
Minimum Initial Investment2 | | | | |
| Investor Shares ($1,000 for retirement, education and custodial accounts) | | | $ 2,500 | |
| Select Shares® | | | $50,000 | |
| e.Shares ($500 for retirement, education and custodial accounts) | | | $ 1,000 | |
| Institutional Select S&P 500 Fund | | | $75,000 | |
All fund and index figures on this page assume dividends and distributions were reinvested. Index figures do not include trading and management costs, which would lower performance. Indices are unmanaged, and you cannot invest in them directly. Performance results less than one year are not annualized.
Expenses may be partially absorbed by CSIM and Schwab. Without these reductions, the funds’ total returns would have been lower. Performance does not reflect the deduction of taxes that a shareholder would pay on fund distributions or on the redemption of fund shares.
1One year return presented in the table differs from the return in the Financial Highlights. This is a result of the calculation of the Financial Highlights return adhering to GAAP presentation.
2Please see prospectus for further detail and eligibility requirements.
Schwab Equity Index Funds 1
| | | From the Chairman
|
 | | Dear Shareholder, I founded Schwab over thirty years ago to be a home for serious investors. That mission continues to guide us today as we constantly strive to improve and innovate. By doing this, and providing some of the highest quality products and services — at a competitive price — we remain true to our heritage. I take particular pride in the Schwab Funds. Founded over 15 years ago, Schwab Funds now includes more than 50 funds with over $170 billion in assets. With a variety of investment strategies, Schwab Funds provides a range of innovative investment choices that can serve as a foundation for your asset allocation plan, including the Schwab Equity Index Funds, contained within this book. Schwab Funds are managed by Charles Schwab Investment Management, Inc., one of the largest mutual fund managers in the U.S. Our portfolio managers share a passion for market analysis and use some of the most sophisticated financial models in the country. I am proud of their depth of experience, which reflects an average of 14 years in the investment industry. Furthermore, I am impressed by the commitment that our managers bring to the stewardship of their funds, for you, their shareholders. In closing, I want to thank you for investing with us. We work every day to warrant the trust you have placed in us; that will never change. Sincerely, |
2 Schwab Equity Index Funds
| | | From the President |

Evelyn Dilsaver is President and
CEO of Charles Schwab Investment
Management, Inc. and of each of
the funds covered in this report.
She joined the firm in 1992 and
has held a variety of executive
positions at Schwab. | | Dear Shareholder, I am pleased to present the annual report for the Schwab Equity Index Funds for the period ended October 31, 2006. Thanks to the support of investors like you, Schwab Equity Index Funds assets were over $21 billion as of this report date. Schwab Equity Index Funds let you tap into the power of the stock market for long-term growth potential. Indexing can be a highly effective approach to stock investing. In fact, for the one-year report period, I’m pleased to note that all but one of our equity index funds beat their respective fund category averages. What’s more, since an indexing strategy generally results in lower turnover, this can mean fewer taxable capital gain distributions to shareholders. With this report, you will see that we have recently started an initiative to enhance the presentation of our shareholder reports to make it easier for you to find information about your fund. This book represents the first step in this process, with additional changes anticipated for future report cycles. You will notice, for example, that we have added a new lead page, Performance at a Glance, which includes the funds’ ticker symbols and report period returns for the funds and their benchmarks. For ease of reference, we have relocated the fund manager’s discussion to be in close proximity to the fund performance and portfolio statistics sections. At this time, I would like to highlight another valuable information resource for fund shareholders, namely, our website at www.schwabfunds.com. This website contains regular updates about the Schwab Funds. I encourage you to visit the website to stay informed about your fund. I’d like to emphasize that your trust is very important to us and I will do all I can to maintain that trust. Thank you for investing in Schwab Funds. Sincerely, Past performance is no guarantee of future results. |
Schwab Equity Index Funds 3
The Investment Environment

Jeffrey Mortimer, CFA, senior vice
president and chief investment
officer, equities, is responsible for the
overall management of the fund. | | As the U.S. economy transitioned to slower growth, equities markets rebounded, aided by higher corporate profitability, falling energy/commodity prices, and lower interest rates. The S&P 500 Index returned 16.34% and the Russell 2000 Index returned 19.98%, respectively, for the one-year report period ended October 31, 2006. Improving fundamentals and attractive valuations strengthened investor interest in emerging markets and the MSCI EAFE (Morgan Stanley Capital International, Inc. Europe, Australasia, and Far East) Index returned 27.52%. Performance in the bond markets has been mixed over the year, although the Lehman Brothers U.S. Aggregate Bond Index gained 5.19%. Several key issues continued to resonate with investors, including slowing economic growth, Federal Reserve (the Fed) policy, a sluggish real estate market, inflation concerns, and fluctuating energy prices. Economic growth has been anything but predictable over the past year. The last quarter of 2005 saw Gross Domestic Product (GDP) slow considerably as the economy adjusted to changes in inventories and higher energy prices. Although Hurricane Katrina remained a focal point in the news late in 2005, its economic impact was determined to be minimal as damage remained contained within the hurricane’s path. In the first quarter of 2006, GDP then rebounded, only to slow later in the year. Though falling existing home sales and lower motor vehicle production have done much to curtail growth in the eyes of the Fed, favorable labor market conditions, sustained increases in labor income, and lower energy prices continued to promote stable growth. The unemployment rate fell to a cyclical low of 4.4% in the third quarter of 2006 while consumer spending and business investment remained key contributors to GDP growth. |
| | | |
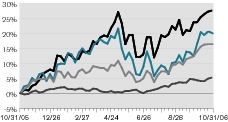
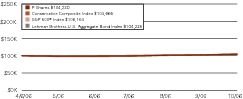
Asset Class Performance Comparison % returns during the report period |
| |
This graph compares the performance of various asset classes during the report period. Final performance figures for the period are in the key below.
| | |
| n 16.34% | S&P 500® Index: measures U.S. large-cap stocks |
| n 19.98% | Russell 2000® Index: measures U.S. small-cap stocks |
| n 27.52% | MSCI EAFE® Index: measures (in U.S. dollars) large-cap stocks in Europe, Australasia and the Far East |
| n 5.19% | Lehman Brothers U.S. Aggregate Bond Index: measures the U.S. bond market |
These figures assume dividends and distributions were reinvested. Index figures do not include trading and management costs, which would lower performance. Indices are unmanaged and you cannot invest in them directly. Remember that past performance is not an indication of future results.
Data source: Charles Schwab & Co., Inc.
4 Schwab Equity Index Funds
The Investment Environment continued
In efforts to curb inflationary pressures, the Fed raised short-term interest rates six times during the period. August marked a key point in the year as Committee members decided to hold the Fed’s target rate at 5.25%, where it remained as of the end of the report period. In its statement, the Fed noted that the economy appeared to be growing at a more moderate rate as a result of prior rate increases, lagged effects of energy prices, and a cooling of the housing market. The Fed indicated they generally expected the economy to grow at a pace below its potential, which proved to be an accurate prediction. Consistent with the Fed’s report, GDP continued to decline, growing only 2.2% in the third quarter of 2006.
Energy prices have been a key issue in the markets over the past year. Following Hurricane Katrina, oil prices peaked around $71 per barrel, with domestic gasoline prices passing $3.00 a gallon. Prices subsequently fell, but rebounded nearly 21% early in 2006, partly due to concerns that Iran might cut back exports in response to a dispute over their nuclear program. Prices declined throughout the report period due to a lack of hurricanes in the Gulf of Mexico, as well as an increase in U.S. fuel inventories. More recently, abundant inventories, warmer weather, and skepticism regarding OPEC’s proposed production cuts contributed to a slip in oil prices. Crude oil has declined nearly 26% since July 2006’s record $78.40 per barrel, yet still remained around the $60–61 per barrel range at the end of the report period, as diminishing U.S. crude inventories and concern about global surplus lingered in investors’ minds.
The events of 2006 have also had a significant impact on the housing market. Housing starts fell considerably, down nearly 34% since the beginning of 2006. Existing home sales continued to decline as well, falling nearly 15% from their peak reached in 2005. Although sales have dropped, they remained strong by historical standards. Concerns remained as to whether the Fed’s actions, and the immediate effects on the housing market, would spill over into the rest of the economy. With regards to GDP, housing took off about one percent in the third quarter of 2006, although rebounds in income, consumer spending, and investments helped to offset the impact.
Despite a moderation in economic growth during the report period, economic fundamentals remained healthy as of the end of the period. The Fed’s task of balancing inflation pressures without significantly hindering economic growth will be thoroughly scrutinized in the coming months. The challenge is to bring this economy to a state of stable growth and achieve a soft landing.
Nothing in this report represents a recommendation of a security by the investment adviser.
Manager views and portfolio holdings may have changed since the report date.
Schwab Equity Index Funds 5
Schwab S&P 500 Index Fund

Larry Mano, (right) vice president and senior portfolio manager, is responsible for the co-management of the fund.
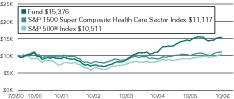
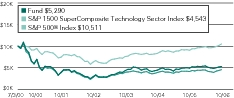
Tom Brown, (left) associate portfolio manager, is responsible for the dayto-day co-management of the fund. | | The Schwab S&P 500 Index Fund Investor Shares ended the one-year period with a positive return of 16.03%, tracking the benchmark, the S&P 500 Index, which was up 16.34%. Bear in mind that indices are unmanaged and unlike the fund, do not include operational and transaction costs. The S&P 500 Index includes the stocks of 500 leading U.S. publicly traded companies from a broad range of industries and is market-capitalization weighted. Therefore, its returns are most heavily influenced by the largest names in the index. Sectors with the best performance during the report period were Telecommunication Services, Materials, and Consumer Discretionary. On the downside, Information Technology (IT) and Health Care sectors trailed, with such IT industry heavyweights as Dell Inc., and Intel Corp. struggling. Top performing industry groups included Diversified Telecommunication Services, Metals and Mining, and Road and Rail. Conversely, Diversified Consumer Services, Internet Software and Services, and Wireless Telecommunication industry groups generated negative returns. Stocks that performed well during the period included Allegheny Technologies Inc., NVIDIA Corp. and Exxon Mobil Corp. |
| | | |
| As of 10/31/06: | | |
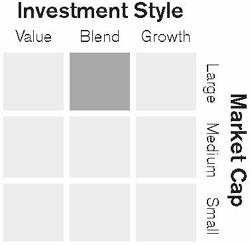
| Style Assessment1 | | |
 | | |
Statistics |
| Number of Holdings | | 502 |
| Weighted Average Market Cap ($ x 1,000,000) | | 96,440 |
| Price/Earnings Ratio (P/E) | | 17.4 |
| Price/Book Ratio (P/B) | | 2.8 |
Sector Weightings % of Investments |
| Financials | | 22.1 | % |
| Information Technology | | 15.4 | % |
| Health Care | | 12.4 | % |
| Industrials | | 10.9 | % |
| Consumer Discretionary | | 10.3 | % |
| Consumer Staples | | 9.5 | % |
| Energy | | 9.4 | % |
| Telecommunication Services | | 3.5 | % |
| Utilities | | 3.4 | % |
| Materials | | 3.0 | % |
| Others | | 0.1 | % |
Total | | 100.0 | % |
Top Holdings % of Net Assets2 |
| Exxon Mobil Corp. | | 3.4 | % |
| General Electric Co. | | 2.9 | % |
| Citigroup, Inc. | | 2.0 | % |
| Microsoft Corp. | | 2.0 | % |
| Bank of America Corp. | | 2.0 | % |
| Procter & Gamble Co. | | 1.6 | % |
| Johnson & Johnson | | 1.6 | % |
| Pfizer, Inc. | | 1.6 | % |
| American International Group, Inc. | | 1.4 | % |
| Altria Group, Inc. | | 1.4 | % |
Total | | 19.9 | % |
Manager views and portfolio holdings may have changed since the report date.
Source of Sector Classification: S&P and MSCI.
Standard & Poor’s®, S&P®, S&P 500®, Standard & Poor’s 500® and 500® are trademarks of The McGraw-Hill Companies, Inc. and have been licensed for use by the fund. The fund is not sponsored, endorsed, sold or promoted by Standard & Poor’s, and Standard & Poor’s makes no representation regarding the advisability of investing in the fund.
1Source: Morningstar, Inc. This style assessment is the result of evaluating the fund based on a ten-factor model for value and growth characteristics. The fund’s market capitalization placement is determined by the geometric mean of its holdings’ market capitalizations. The assessment reflects the fund’s portfolio as of 10/31/06, which may have changed since then, and is not a precise indication of risk or performance — past, present, or future.
2This list is not a recommendation of any security by the investment adviser.
6 Schwab Equity Index Funds
Schwab S&P 500 Index Fund
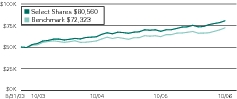
Performance Summary as of 10/31/06The performance data quoted represents past performance. Past performance does not guarantee future results. Investment returns and principal value will fluctuate so that an investor’s shares may be worth more or less than their original cost. Current performance may be lower or higher than performance data quoted. To obtain performance information current to the most recent month end, please visit www.schwab.com/schwabfunds.
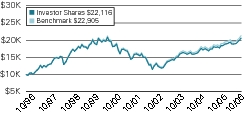
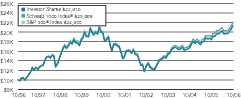
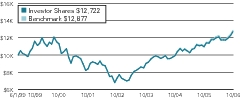
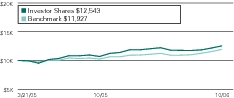
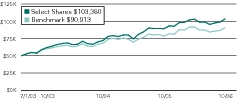
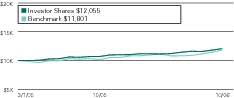
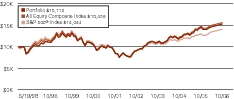
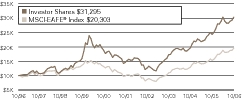
Performance of a Hypothetical
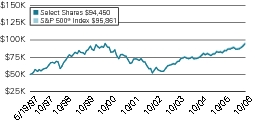
$10,000 Investment in Investor Shares1 | | Performance of a Hypothetical
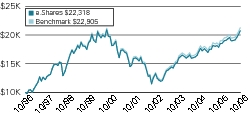
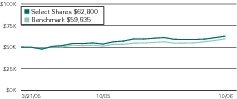
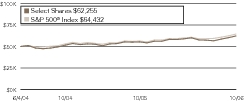
$50,000 Investment in Select Shares1 | | Performance of a Hypothetical
$10,000 Investment in e.Shares1 |
| | | | |
Pre-Tax Average Annual Total Returns1,2 |
Fund Class and Inception Date | | 1 Year | | 5 Years | | 10 Years | | Since Inception |
| Investor Shares (5/1/96) | | | 16.03 | % | | | 6.94 | % | | | 8.26 | % | | n/a |
| Select Shares® (5/19/97) | | | 16.18 | % | | | 7.12 | % | | | n/a | | | 6.96% |
| e.Shares® (5/1/96) | | | 16.20 | % | | | 7.04 | % | | | 8.36 | % | | n/a |
| |
| Benchmark: S&P 500® Index | | | 16.34 | % | | | 7.25 | % | | | 8.63 | % | | (5/19/97) 7.13% |
| |
| Fund Category: Morningstar Large-Cap Blend | | | 14.74 | % | | | 6.82 | % | | | 7.76 | % | | (5/19/97) 6.63% |
| | | | | | | | | | | | | | | |
Average Annual Total Returns After Tax1,2 |
Fund Class and Inception Date | | 1 Year | | 5 Years | | 10 Years | | Since Inception |
Investor Shares (5/1/96) | | | | | | | | | | | | | | | | |
| Pre-Liquidation (still own shares) | | | 15.41 | % | | | 6.41 | % | | | 7.80 | % | | | n/a | |
| Post-Liquidation (shares were sold) | | | 10.39 | % | | | 5.65 | % | | | 7.01 | % | | | n/a | |
Select Shares® (5/19/97) | | | | | | | | | | | | | | | | |
| Pre-Liquidation (still own shares) | | | 15.89 | % | | | 6.60 | % | | | n/a | | | | 6.50 | % |
| Post-Liquidation (shares were sold) | | | 10.86 | % | | | 5.84 | % | | | n/a | | | | 5.83 | % |
e.Shares® (5/1/96) | | | | | | | | | | | | | | | | |
| Pre-Liquidation (still own shares) | | | 15.90 | % | | | 6.54 | % | | | 7.90 | % | | | n/a | |
| Post-Liquidation (shares were sold) | | | 10.86 | % | | | 5.79 | % | | | 7.11 | % | | | n/a | |
Fund Category: Morningstar Large-Cap Blend | | | | | | | | | | | | | | | | |
| Pre-Liquidation (still own shares) | | | 6.56 | % | | | 5.96 | % | | | 6.25 | % | | | n/a | |
| Post-Liquidation (shares were sold) | | | 5.04 | % | | | 5.31 | % | | | 5.97 | % | | | n/a | |
All figures on this page assume dividends and distributions were reinvested. Index figures do not include trading and management costs, which would lower performance. Indices are unmanaged, and you cannot invest in them directly. Performance results less than one year are not annualized.
1Fund expenses may have been partially absorbed by CSIM and Schwab. Without these reductions, the fund’s returns would have been lower.
2The pre-tax total return and the graph do not reflect the deduction of taxes that a shareholder would pay on fund distributions or the redemption of fund shares. After-tax returns are calculated using the highest historical individual federal marginal income tax rates in effect as of 10/31/06 and do not reflect the impact of state and local taxes or the alternative minimum tax. Actual returns depend on an investor’s situation and may differ from those shown. After-tax returns may not be relevant to investors who hold their fund shares through tax-deferred arrangements. Pre-liquidation after-tax returns reflect the tax effects of purchases and sales of securities within the fund portfolios and assume investors continue to hold fund shares at the end of the measurement periods. Post-liquidation figures assume investors sold fund shares at the end of the measurement periods and reflect both the effects of taxable distributions and any taxable gains or losses realized upon the sale of shares. Source for category information: Morningstar, Inc. Some funds in this category may not use tax-efficient strategies, including this fund.
Schwab Equity Index Funds 7
Schwab Institutional Select® S&P 500 Fund
Larry Mano, (right) vice president and senior portfolio manager, is responsible for the co-management of the fund.
Tom Brown, (left) associate portfolio manager, is responsible for the dayto-day co-management of the fund. | | Schwab Institutional Select S&P 500 Fund ended the one-year period with a positive return of 16.39%, tracking the benchmark, the S&P 500 Index, which was up 16.34%. Bear in mind that indices are unmanaged and unlike the fund, do not include operational and transaction costs. The S&P 500 Index includes the stocks of 500 leading U.S. publicly traded companies from a broad range of industries and is market-capitalization weighted. Therefore, its returns are most heavily influenced by the largest names in the index. Sectors with the best performance during the report period were Telecommunication Services, Materials, and Consumer Discretionary. On the downside, Information Technology (IT) and Health Care sectors trailed, with such IT industry heavyweights as Dell Inc., and Intel Corp. struggling. Top performing industry groups included Diversified Telecommunication Services, Metals and Mining, and Road and Rail. Conversely, Diversified Consumer Services, Internet Software and Services, and Wireless Telecommunication industry groups generated negative returns. Stocks that performed well during the period included Allegheny Technologies Inc., NVIDIA Corp. and Exxon Mobil Corp. |
| | | |
| As of 10/31/06: | | |
| Style Assessment1 | | |
| | |
Statistics |
| Number of Holdings | | 506 |
| Weighted Average Market Cap ($ x 1,000,000) | | 96,160 |
| Price/Earnings Ratio (P/E) | | 17.4 |
| Price/Book Ratio (P/B) | | 2.8 |
Sector Weightings % of Investments |
| Financials | | 22.0 | % |
| Information Technology | | 15.3 | % |
| Health Care | | 12.3 | % |
| Industrials | | 10.8 | % |
| Consumer Discretionary | | 10.3 | % |
| Energy | | 9.4 | % |
| Consumer Staples | | 9.4 | % |
| Telecommunication Services | | 3.5 | % |
| Utilities | | 3.4 | % |
| Materials | | 2.9 | % |
| Others | | 0.7 | % |
Total | | 100.0 | % |
Top Holdings % of Net Assets2 |
| Exxon Mobil Corp. | | 3.4 | % |
| General Electric Co. | | 2.9 | % |
| Citigroup, Inc. | | 2.0 | % |
| Microsoft Corp. | | 2.0 | % |
| Bank of America Corp. | | 1.9 | % |
| Procter & Gamble Co. | | 1.6 | % |
| Johnson & Johnson | | 1.6 | % |
| Pfizer, Inc. | | 1.6 | % |
| American International Group, Inc. | | 1.4 | % |
| Altria Group, Inc. | | 1.4 | % |
Total | | 19.8 | % |
Manager views and portfolio holdings may have changed since the report date.
Source of Sector Classification: S&P and MSCI.
Standard & Poor’s®, S&P®, S&P 500®, Standard & Poor’s 500® and 500® are trademarks of The McGraw-Hill Companies, Inc. and have been licensed for use by the fund. The fund is not sponsored, endorsed, sold or promoted by Standard & Poor’s, and Standard & Poor’s makes no representation regarding the advisability of investing in the fund.
1Source: Morningstar, Inc. This style assessment is the result of evaluating the fund based on a ten-factor model for value and growth characteristics. The fund’s market capitalization placement is determined by the geometric mean of its holdings’ market capitalizations. The assessment reflects the fund’s portfolio as of 10/31/06, which may have changed since then, and is not a precise indication of risk or performance — past, present, or future.
2This list is not a recommendation of any security by the investment adviser.
8 Schwab Equity Index Funds
Schwab Institutional Select S&P 500 Fund
Performance Summary as of 10/31/06The performance data quoted represents past performance. Past performance does not guarantee future results. Investment returns and principal value will fluctuate so that an investor’s shares may be worth more or less than their original cost. Current performance may be lower or higher than performance data quoted. To obtain performance information current to the most recent month end, please visit www.schwab.com/schwabfunds.
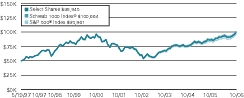
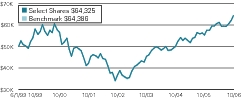
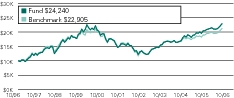
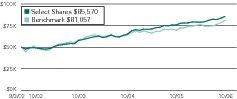
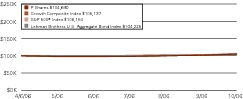
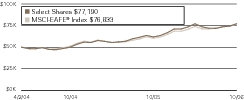
Performance of a Hypothetical
$75,000 Investment1 |
|
| |
Pre-Tax Average Annual Total Returns1,2 |
| | | 1 year | | 5 years | | Since Inception |
| Fund: Institutional Select® S&P 500 Fund (2/1/99) | | | 16.39 | % | | | 7.19 | % | | | 2.46 | % |
| |
| Benchmark: S&P 500® Index | | | 16.34 | % | | | 7.25 | % | | | 2.55 | % |
| |
| Fund Category: Morningstar Large-Cap Blend | | | 14.74 | % | | | 6.82 | % | | | 3.08 | % |
| | | | | | | | | | | | | |
Average Annual Total Returns After Tax1,2 |
| | | 1 year | | 5 years | | Since Inception |
Fund: Institutional Select S&P 500 Fund (2/1/99) | | | | | | | | | | | | |
| Pre-Liquidation (still own shares) | | | 16.14 | % | | | 6.67 | % | | | 2.03 | % |
| Post-Liquidation (shares were sold) | | | 10.90 | % | | | 5.89 | % | | | 1.84 | % |
| |
Fund Category: Morningstar Large-Cap Blend | | | | | | | | | | | | |
| Pre-Liquidation (still own shares) | | | 6.56 | % | | | 5.96 | % | | | n/a | |
| Post-Liquidation (shares were sold) | | | 5.04 | % | | | 5.31 | % | | | n/a | |
All figures on this page assume dividends and distributions were reinvested. Index figures do not include trading and management costs, which would lower performance. Indices are unmanaged, and you cannot invest in them directly. Performance results less than one year are not annualized.
1Fund expenses may have been partially absorbed by CSIM and Schwab. Without these reductions, the fund’s returns would have been lower.
2The pre-tax total return and the graph do not reflect the deduction of taxes that a shareholder would pay on fund distributions or the redemption of fund shares. After-tax returns are calculated using the highest historical individual federal marginal income tax rates in effect as of 10/31/06 and do not reflect the impact of state and local taxes or the alternative minimum tax. Actual returns depend on an investor’s situation and may differ from those shown. After-tax returns may not be relevant to investors who hold their fund shares through tax-deferred arrangements. Pre-liquidation after-tax returns reflect the tax effects of purchases and sales of securities within the fund portfolios and assume investors continue to hold fund shares at the end of the measurement periods. Post-liquidation figures assume investors sold fund shares at the end of the measurement periods and reflect both the effects of taxable distributions and any taxable gains or losses realized upon the sale of shares. Source for category information: Morningstar, Inc. Some funds in this category may not use tax-efficient strategies, including this Fund.
Schwab Equity Index Funds 9
Schwab 1000 Index® Fund
Larry Mano, (right) vice president and senior portfolio manager, is responsible for the co-management of the fund.
Tom Brown, (left) associate portfolio manager, is responsible for the dayto-day co-management of the fund. | | The Schwab 1000 Index Fund Investor Shares returned 15.84% for the period, slightly underperforming its benchmark, the Schwab 1000 Index, which gained 16.26%. Bear in mind that indices are unmanaged and unlike the fund, do not include operational and transaction costs. The Schwab 1000 Index is comprised of the stocks of the largest 1000 publicly traded companies in the United States. The Index is market-capitalization weighted, and therefore, its returns are most heavily influenced by the largest names in the index. Sectors that performed well for the period included Telecommunication Services and Materials, while Health Care and Information Technology appreciated the least. From an industry group perspective, Diversified Telecommunication Services and Metals and Mining were among the top performers, while Diversified Consumer Services produced negative returns. Top performing stocks included such names as Exxon Mobil Corp. and Bank of America Corp. Exxon Mobil’s stock continued to climb throughout the year as net income continued to rise, propelled by increased production and discovery of new wells. On the downside, holdings in Yahoo!, Inc. and Dell, Inc. detracted from returns. |
| | | |
| As of 10/31/06: | | |
| Style Assessment1 | | |
| | |
Statistics |
| Number of Holdings | | 976 |
| Weighted Average Market Cap ($ x 1,000,000) | | 85,243 |
| Price/Earnings Ratio (P/E) | | 18.1 |
| Price/Book Ratio (P/B) | | 2.8 |
Sector Weightings % of Investments |
| Financials | | 23.0 | % |
| Information Technology | | 15.2 | % |
| Health Care | | 12.0 | % |
| Consumer Discretionary | | 11.5 | % |
| Consumer Staples | | 9.3 | % |
| Energy | | 8.8 | % |
| Utilities | | 3.3 | % |
| Telecommunication Services | | 3.2 | % |
| Materials | | 3.1 | % |
| Industrials | | 10.6 | % |
Total | | 100.0 | % |
Top Holdings % of Net Assets2 |
| Exxon Mobil Corp. | | 2.9 | % |
| General Electric Co. | | 2.4 | % |
| Microsoft Corp. | | 2.0 | % |
| Bank of America Corp. | | 1.7 | % |
| Citigroup, Inc. | | 1.7 | % |
| Procter & Gamble Co. | | 1.4 | % |
| Wal-Mart Stores, Inc. | | 1.3 | % |
| Johnson & Johnson | | 1.3 | % |
| Pfizer, Inc. | | 1.3 | % |
| American International Group, Inc. | | 1.2 | % |
Total | | 17.2 | % |
Manager views and portfolio holdings may have changed since the report date.
Source of Sector Classification: S&P and MSCI.
1Source: Morningstar, Inc. This style assessment is the result of evaluating the fund based on a ten-factor model for value and growth characteristics. The fund’s market capitalization placement is determined by the geometric mean of its holdings’ market capitalizations. The assessment reflects the fund’s portfolio as of 10/31/06, which may have changed since then, and is not a precise indication of risk or performance — past, present, or future.
2This list is not a recommendation of any security by the investment adviser.
10 Schwab Equity Index Funds
Schwab 1000 Index Fund
Performance Summary as of 10/31/06
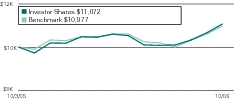
The performance data quoted represents past performance. Past performance does not guarantee future results. Investment returns and principal value will fluctuate so that an investor’s shares may be worth more or less than their original cost. Current performance may be lower or higher than performance data quoted. To obtain performance information current to the most recent month end, please visit www.schwab.com/schwabfunds.
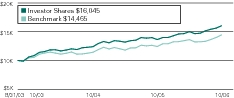
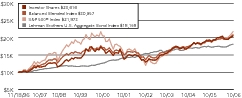
Performance of a Hypothetical
$10,000 Investment in Investor Shares1 | | Performance of a Hypothetical
$50,000 Investment in Select Shares1 |
| | |
Pre-Tax Average Annual Total Returns1,2 |
Fund Class and Inception Date | | 1 Year | | 5 Years | | 10 Years | | Since Inception |
| Investor Shares (4/2/91) | | | 15.84 | % | | | 7.70 | % | | | 8.64 | % | | n/a |
| Select Shares® (5/19/97) | | | 16.01 | % | | | 7.85 | % | | | n/a | | | 7.48% |
| |
| Benchmark: Schwab 1000® Index | | | 16.26 | % | | | 8.06 | % | | | 8.99 | % | | (5/19/97) 7.69% |
| |
| Fund Category: Morningstar Large-Cap Blend | | | 14.74 | % | | | 6.82 | % | | | 7.76 | % | | (5/19/97) 6.63% |
| | | | | | | | | | | | | | | |
Average Annual Total Returns After Tax1,2 |
Fund Class and Inception Date | | 1 Year | | 5 Years | | 10 Years | | Since Inception |
Investor Shares (4/2/91) | | | | | | | | | | | | | | | | |
| Pre-Liquidation (still own shares) | | | 15.63 | % | | | 7.30 | % | | | 8.25 | % | | n/a |
| Post-Liquidation (shares were sold) | | | 10.54 | % | | | 6.42 | % | | | 7.41 | % | | n/a |
| |
Select Shares® (5/19/97) | | | | | | | | | | | | | | | | |
| Pre-Liquidation (still own shares) | | | 15.77 | % | | | 7.40 | % | | | n/a | | | 7.08% |
| Post-Liquidation (shares were sold) | | | 10.68 | % | | | 6.52 | % | | | n/a | | | 6.33% |
| |
Fund Category: Morningstar Large-Cap Blend | | | | | | | | | | | | | | | | |
| Pre-Liquidation (still own shares) | | | 6.56 | % | | | 5.96 | % | | | 6.25 | % | | n/a |
| Post-Liquidation (shares were sold) | | | 5.04 | % | | | 5.31 | % | | | 5.97 | % | | n/a |
All figures on this page assume dividends and distributions were reinvested. Index figures do not include trading and management costs, which would lower performance. Indices are unmanaged, and you cannot invest in them directly. Performance results less than one year are not annualized.
1Fund expenses may have been partially absorbed by CSIM and Schwab. Without these reductions, the fund’s returns would have been lower.
2The pre-tax total return and the graph do not reflect the deduction of taxes that a shareholder would pay on fund distributions or the redemption of fund shares. After-tax returns are calculated using the highest historical individual federal marginal income tax rates in effect as of 10/31/06 and do not reflect the impact of state and local taxes or the alternative minimum tax. Actual returns depend on an investor’s situation and may differ from those shown. After-tax returns may not be relevant to investors who hold their fund shares through tax-deferred arrangements. Pre-liquidation after-tax returns reflect the tax effects of purchases and sales of securities within the fund portfolios and assume investors continue to hold fund shares at the end of the measurement periods. Post-liquidation figures assume investors sold fund shares at the end of the measurement periods and reflect both the effects of taxable distributions and any taxable gains or losses realized upon the sale of shares. Source for category information: Morningstar, Inc. Some funds in this category may not use tax-efficient strategies.
Schwab Equity Index Funds 11
Schwab Small-Cap Index Fund®
Larry Mano, (right) vice president and senior portfolio manager, is responsible for the co-management of the fund.
Tom Brown, (left) associate portfolio manager, is responsible for the dayto-day co-management of the fund. | | The Schwab Small-Cap Index Fund Investor Shares returned 17.62% for the report period, trailing its benchmark, the Schwab Small-Cap Index, which posted 17.94%. The Schwab Small-Cap Index is comprised of the stocks of the second- largest 1,000 publicly traded companies in the United States. The Index is market-capitalization weighted, and therefore, its returns are most heavily influenced by the largest names in the index. Bear in mind that indices are unmanaged and unlike the fund, do not include operational and transaction costs. Sectors such as Materials and Industrials lead performance, while Consumer Staples lagged in returns. Within the fund, Industrial Conglomerates and Marine industry groups contributed positively, while Distributors and Household Products produced negative returns for the period. Stocks such as Continental Airlines, Inc. and Veritas DGC, Inc. were among the top performers. One of the fund’s largest holdings, Veritas received a cash and stock offer to be purchased, which helped boost the company’s stock price. Conversely, positions in Chet Networks, Inc. and Openwave Systems, Inc. detracted from performance. |
| | | |
| As of 10/31/06: | | |
| Style Assessment1 | | |
| | |
Statistics |
| Number of Holdings | | 983 |
| Weighted Average Market Cap ($ x 1,000,000) | | 1,509 |
| Price/Earnings Ratio (P/E) | | 25.8 |
| Price/Book Ratio (P/B) | | 2.4 |
Sector Weightings % of Investments |
| Financials | | 21.6 | % |
| Consumer Discretionary | | 17.0 | % |
| Information Technology | | 16.0 | % |
| Industrials | | 14.5 | % |
| Health Care | | 9.4 | % |
| Energy | | 8.0 | % |
| Materials | | 5.0 | % |
| Utilities | | 3.6 | % |
| Consumer Staples | | 3.4 | % |
| Telecommunication Services | | 1.2 | % |
| Others | | 0.3 | % |
Total | | 100.0 | % |
Top Holdings % of Net Assets2 |
| Continental Airlines, Inc., Class B | | 0.3 | % |
| OfficeMax, Inc. | | 0.3 | % |
| Albermarie Corp. | | 0.2 | % |
| Steel Dynamics, Inc. | | 0.2 | % |
| Boardwalk Pipeline Partners L.P. | | 0.2 | % |
| Carpenter Technology Corp. | | 0.2 | % |
| Veritas DGC, Inc. | | 0.2 | % |
| Polycom, Inc. | | 0.2 | % |
| Holly Corp. | | 0.2 | % |
| Brookdale Senior Living, Inc. | | 0.2 | % |
Total | | 2.2 | % |
Manager views and portfolio holdings may have changed since the report date.
Source of Sector Classification: S&P and MSCI.
Small-company stocks are subject to greater volatility than other asset classes.
1Source: Morningstar, Inc. This style assessment is the result of evaluating the fund based on a ten-factor model for value and growth characteristics. The fund’s market capitalization placement is determined by the geometric mean of its holdings’ market capitalizations. The assessment reflects the fund’s portfolio as of 10/31/06, which may have changed since then, and is not a precise indication of risk or performance — past, present, or future.
2This list is not a recommendation of any security by the investment adviser.
12 Schwab Equity Index Funds
Schwab Small-Cap Index Fund
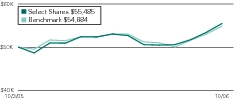
Performance Summary as of 10/31/06
The performance data quoted represents past performance. Past performance does not guarantee future results. Investment returns and principal value will fluctuate so that an investor’s shares may be worth more or less than their original cost. Current performance may be lower or higher than performance data quoted. To obtain performance information current to the most recent month end, please visit www.schwab.com/schwabfunds.
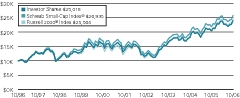
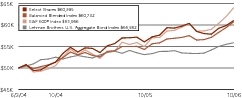
Performance of a Hypothetical
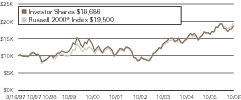
$10,000 Investment in Investor Shares1 | | Performance of a Hypothetical
$50,000 Investment in Select Shares1 |
| | |
| | |
Pre-Tax Average Annual Total Returns1,2 |
Fund Class and Inception Date | | 1 Year | | 5 Years | | 10 Years | | Since Inception |
| Investor Shares (12/3/93) | | | 17.62 | % | | | 11.79 | % | | | 9.60 | % | | n/a |
| Select Shares® (5/19/97) | | | 17.78 | % | | | 11.95 | % | | | n/a | | | 9.53% |
| |
| Benchmark: Schwab Small-Cap Index® | | | 17.94 | % | | | 11.98 | % | | | 10.37 | % | | (5/19/97) 10.06% |
| |
| Fund Category: Morningstar Small-Cap Blend | | | 16.35 | % | | | 13.54 | % | | | 11.03 | % | | (5/19/97) 10.57% |
| | | | | | | | | | | | | | | |
Average Annual Total Returns After Tax1,2 |
Fund Class and Inception Date | | 1 Year | | 5 Years | | 10 Years | | Since Inception |
Investor Shares (12/3/93) | | | | | | | | | | | | | | | | |
| Pre-Liquidation (still own shares) | | | 17.40 | % | | | 11.37 | % | | | 8.83 | % | | | n/a | |
| Post-Liquidation (shares were sold) | | | 11.69 | % | | | 10.07 | % | | | 8.07 | % | | | n/a | |
| |
Select Shares® (5/19/97) | | | | | | | | | | | | | | | | |
| Pre-Liquidation (still own shares) | | | 17.53 | % | | | 11.49 | % | | | n/a | | | | 8.69 | % |
| Post-Liquidation (shares were sold) | | | 11.83 | % | | | 10.19 | % | | | n/a | | | | 7.94 | % |
| |
Fund Category: Morningstar Large-Cap Blend | | | | | | | | | | | | | | | | |
| Pre-Liquidation (still own shares) | | | 4.38 | % | | | 12.39 | % | | | 8.66 | % | | | n/a | |
| Post-Liquidation (shares were sold) | | | 4.97 | % | | | 11.35 | % | | | 8.44 | % | | | n/a | |
All figures on this page assume dividends and distributions were reinvested. Index figures do not include trading and management costs, which would lower performance. Indices are unmanaged, and you cannot invest in them directly. Performance results less than one year are not annualized.
1Fund expenses may have been partially absorbed by CSIM and Schwab. Without these reductions, the fund’s returns would have been lower.
2The pre-tax total return and the graph do not reflect the deduction of taxes that a shareholder would pay on fund distributions or the redemption of fund shares. After-tax returns are calculated using the highest historical individual federal marginal income tax rates in effect as of 10/31/06 and do not reflect the impact of state and local taxes or the alternative minimum tax. Actual returns depend on an investor’s situation and may differ from those shown. After-tax returns may not be relevant to investors who hold their fund shares through tax-deferred arrangements. Pre-liquidation after-tax returns reflect the tax effects of purchases and sales of securities within the fund portfolios and assume investors continue to hold fund shares at the end of the measurement periods. Post-liquidation figures assume investors sold fund shares at the end of the measurement periods and reflect both the effects of taxable distributions and any taxable gains or losses realized upon the sale of shares. Source for category information: Morningstar, Inc. Some funds in this category may not use tax-efficient strategies, including this fund.
Schwab Equity Index Funds 13
Schwab Total Stock Market Index Fund®

Larry Mano, vice president and senior portfolio manager, is responsible for the co-management of the fund. | | The Schwab Total Stock Market Index Fund Investor Shares returned 16.05% during the one-year period, tracking its benchmark, the Dow Jones Wilshire 5000 Composite Index, which was up 16.61%. The Dow Jones Wilshire 5000 Composite Index includes all publicly traded stocks of companies headquartered in the United States for which pricing information is readily available, currently more than 7,000 stocks. Bear in mind that indices are unmanaged and unlike the fund, do not include operational and transaction costs. Sectors that provided positive returns included Telecommunication Services and Materials, while on the downside, Health Care and Consumer Staples trailed. Within the Fund, industry groups that performed well were Diversified Telecommunication Services and Metals and Mining. Conversely, underperformers included Distributors and Diversified Consumer Services. From a stock perspective, Exxon Mobil Corp. and Bank of America Corp. weighed in as top contributors in the fund. Although many banks are experiencing narrower profit margins as a result of the inverted yield curve, Bank of America Corp. stock continued to rise throughout the year. Conversely, stocks like Yahoo!, Inc. and Dell, Inc. detracted from returns. |
| | | |
| As of 10/31/06: | | |
| Style Assessment1 | | |
| | |
Statistics |
| Number of Holdings | | 2,581 |
| Weighted Average Market Cap ($ x 1,000,000) | | 76,998 |
| Price/Earnings Ratio (P/E) | | 18.6 |
| Price/Book Ratio (P/B) | | 2.8 |
Sector Weightings % of Investments |
| Financials | | 22.8 | % |
| Information Technology | | 15.3 | % |
| Consumer Discretionary | | 12.3 | % |
| Health Care | | 11.8 | % |
| Industrials | | 11.0 | % |
| Consumer Staples | | 8.6 | % |
| Energy | | 8.6 | % |
| Utilities | | 3.4 | % |
| Materials Telecommunication | | 3.2 | % |
| Services | | 3.0 | % |
Total | | 100.0 | % |
Top Holdings % of Net Assets2 |
| Exxon Mobil Corp. | | 2.6 | % |
| General Electric Co. | | 2.1 | % |
| Microsoft Corp. | | 1.7 | % |
| Citigroup, Inc. | | 1.5 | % |
| Bank of America Corp. | | 1.5 | % |
| Procter & Gamble Co. | | 1.3 | % |
| Johnson & Johnson | | 1.2 | % |
| Pfizer, Inc. | | 1.2 | % |
| Wal-Mart Stores, Inc. | | 1.1 | % |
| American International Group, Inc. | | 1.1 | % |
Total | | 15.3 | % |
Manager views and portfolio holdings may have changed since the report date.
Source of Sector Classification: S&P and MSCI.
“Dow Jones”, “Wilshire”, “The DJW 5000SM”, “The Dow Jones Wilshire 5000SM” and “The Dow Jones Wilshire 5000 Composite IndexSM” are service marks of Dow Jones & Company, Inc. and Wilshire Associates Incorporated. The Schwab Total Stock Market Index Fund, based on The Dow Jones Wilshire 5000 Composite IndexSM, is not sponsored, endorsed, sold or promoted by Dow Jones or Wilshire; and, neither Dow Jones nor Wilshire makes any representation regarding the advisability of investing in such a product.
1Source: Morningstar, Inc. This style assessment is the result of evaluating the fund based on a ten-factor model for value and growth characteristics. The fund’s market capitalization placement is determined by the geometric mean of its holdings’ market capitalizations. The assessment reflects the fund’s portfolio as of 10/31/06, which may have changed since then, and is not a precise indication of risk or performance — past, present, or future.
2This list is not a recommendation of any security by the investment adviser.
14 Schwab Equity Index Funds
Schwab Total Stock Market Index Fund
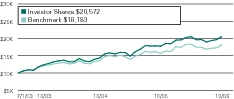
Performance Summary as of 10/31/06
The performance data quoted represents past performance. Past performance does not guarantee future results. Investment returns and principal value will fluctuate so that an investor’s shares may be worth more or less than their original cost. Current performance may be lower or higher than performance data quoted. To obtain performance information current to the most recent month end, please visit www.schwab.com/schwabfunds.
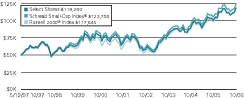
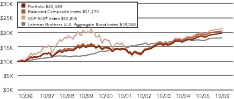
Performance of a Hypothetical
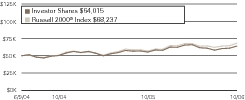
$10,000 Investment in Investor Shares1 | | Performance of a Hypothetical
$50,000 Investment in Select Shares1 |
| | |
| | | |
Pre-Tax Average Annual Total Returns1,2 |
Fund Class and Inception Date | | 1 Year | | 5 Years | | Since Inception |
| Investor Shares (6/1/99) | | | 16.05 | % | | | 8.64 | % | | | 3.29 | % |
| Select Shares® (6/1/99) | | | 16.23 | % | | | 8.80 | % | | | 3.45 | % |
| |
| Benchmark: Dow Jones Wilshire 5000 Composite® Index | | | 16.61 | % | | | 8.89 | % | | | 3.46 | % |
| |
| Fund Category: Morningstar Large-Cap Blend | | | 14.74 | % | | | 6.82 | % | | | 2.84 | % |
| | | | | | | | | | | | | |
Average Annual Total Returns After Tax1,2 |
Fund Class and Inception Date | | 1 Year | | 5 Years | | Since Inception |
Investor Shares (6/1/99) | | | | | | | | | | | | |
| Pre-Liquidation (still own shares) | | | 15.85 | % | | | 8.26 | % | | | 2.99 | % |
| Post-Liquidation (shares were sold) | | | 10.66 | % | | | 7.27 | % | | | 2.65 | % |
| |
Select Shares® (6/1/99) | | | | | | | | | | | | |
| Pre-Liquidation (still own shares) | | | 15.71 | % | | | 8.33 | % | | | 3.07 | % |
| Post-Liquidation (shares were sold) | | | 10.52 | % | | | 7.33 | % | | | 2.72 | % |
| |
Fund Category: Morningstar Large-Cap Blend | | | | | | | | | | | | |
| Pre-Liquidation (still own shares) | | | 6.56 | % | | | 5.96 | % | | | n/a | |
| Post-Liquidation (shares were sold) | | | 5.04 | % | | | 5.31 | % | | | n/a | |
All figures on this page assume dividends and distributions were reinvested. Index figures do not include trading and management costs, which would lower performance. Indices are unmanaged, and you cannot invest in them directly. Performance results less than one year are not annualized.
1Fund expenses may have been partially absorbed by CSIM and Schwab. Without these reductions, the fund’s returns would have been lower.
2The pre-tax total return and the graph do not reflect the deduction of taxes that a shareholder would pay on fund distributions or the redemption of fund shares. After-tax returns are calculated using the highest historical individual federal marginal income tax rates in effect as of 10/31/06 and do not reflect the impact of state and local taxes or the alternative minimum tax. Actual returns depend on an investor’s situation and may differ from those shown. After-tax returns may not be relevant to investors who hold their fund shares through tax-deferred arrangements. Pre-liquidation after-tax returns reflect the tax effects of purchases and sales of securities within the fund portfolios and assume investors continue to hold fund shares at the end of the measurement periods. Post-liquidation figures assume investors sold fund shares at the end of the measurement periods and reflect both the effects of taxable distributions and any taxable gains or losses realized upon the sale of shares. Source for category information: Morningstar, Inc. Some funds in this category may not use tax-efficient strategies.
Schwab Equity Index Funds 15
Schwab International Index Fund®
Larry Mano, (right) vice president and senior portfolio manager, is responsible for the co-management of the fund.
Tom Brown, (left) associate portfolio manager, is responsible for the dayto-day co-management of the fund. | | The Schwab International Index Fund Investor Shares returned an 26.15% for the one-year period, closely tracking its benchmark, the Schwab International Index, which returned 26.76%. The Index is market-capitalization weighted and therefore, its returns are most heavily influenced by the largest names in the Index. Bear in mind that indices are unmanaged and unlike the fund, do not include operational and transaction costs. The Schwab International Index is comprised of stocks of 350 of the largest publicly traded companies stocks within 21 developed countries. Within the Fund, United Kingdom and Japan were the top contributors to total return, while Austria and Portugal were on the bottom end of the return scale. Sectors that performed well during the period included Financials and Materials. On the downside, Information Technology and Telecommunications Services appreciated the least. From an individual stock standpoint, HSBC Holdings plc and UBS AG were among the top contributors to returns. Conversely, stocks such as NTT DoCoMo, Inc. and Vodafone Group PLC, both wireless telecommunication services, detracted from overall returns. |
| | | |
| As of 10/31/06: | | |
| Style Assessment1 | | |
| | |
Country Weightings % of Investments |
| United Kingdom | | 24.4 | % | | Spain | | | 4.7 | % |
| Japan | | 18.9 | % | | Australia | | | 4.3 | % |
| France | | 10.3 | % | | Netherlands | | | 4.1 | % |
| Germany | | 7.6 | % | | Italy | | | 3.3 | % |
| Switzerland | | 7.6 | % | | Other | | | 8.1 | % |
| Canada | | 6.7 | % | | Total | | | 100.0 | % |
Statistics |
| Number of Holdings | | 347 |
| Weighted Average Market Cap ($ x 1,000,000) | | 69,079 |
| Price/Earnings Ratio (P/E) | | 15.8 |
| Price/Book Ratio (P/B) | | 2.4 |
Sector Weightings % of Investments |
| Financials | | 34.5 | % |
| Energy | | 10.3 | % |
| Consumer Discretionary | | 9.0 | % |
| Consumer Staples | | 7.6 | % |
| Materials | | 7.4 | % |
| Health Care | | 7.4 | % |
| Telecommunication Services | | 6.3 | % |
| Industrials | | 6.3 | % |
| Utilities | | 5.8 | % |
| Information Technology | | 4.8 | % |
| Other | | 0.6 | % |
Total | | 100.0 | % |
Top Holdings % of Net Assets2 |
| BP plc | | 2.2 | % |
| HSBC Holdings plc | | 2.1 | % |
| Total SA | | 1.6 | % |
| Novartis AG — Reg’d. | | 1.6 | % |
| Royal Dutch Shell plc, Class A | | 1.6 | % |
| Toyota Motor Corp. | | 1.6 | % |
| GlaxoSmithKline plc | | 1.5 | % |
| Nestle S.A. | | 1.4 | % |
| Vodafone Group plc | | 1.3 | % |
| UBS AG | | 1.3 | % |
Total | | 16.2 | % |
Manager views and portfolio holdings may have changed since the report date.
Source of Sector Classification: S&P and MSCI.
Foreign securities can involve risks such as political and economic instability and currency risk.
1Source: Morningstar, Inc. This style assessment is the result of evaluating the fund based on a ten-factor model for value and growth characteristics. The fund’s market capitalization placement is determined by the geometric mean of its holdings’ market capitalizations. The assessment reflects the fund’s portfolio as of 10/31/06, which may have changed since then, and is not a precise indication of risk or performance — past, present, or future.
2This list is not a recommendation of any security by the investment adviser.
16 Schwab Equity Index Funds
Schwab International Index Fund
Performance Summary as of 10/31/06
The performance data quoted represents past performance. Past performance does not guarantee future results. Investment returns and principal value will fluctuate so that an investor’s shares may be worth more or less than their original cost. Current performance may be lower or higher than performance data quoted. To obtain performance information current to the most recent month end, please visit www.schwab.com/schwabfunds.
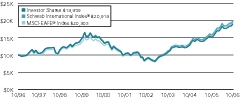
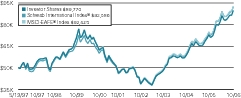
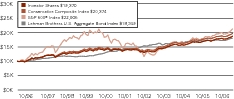
Performance of a Hypothetical
$10,000 Investment in Investor Shares1 | | Performance of a Hypothetical
$50,000 Investment in Select Shares1 |
| | |
| | | |
Pre-Tax Average Annual Total Returns1,2 |
Fund Class and Inception Date | | 1 Year | | 5 Years | | 10 Years | | Since Inception |
| Investor Shares (9/9/93) | | | 26.15 | % | | | 13.53 | % | | | 7.16 | % | | n/a |
| Select Shares® (5/19/97) | | | 26.35 | % | | | 13.70 | % | | | n/a | | | 6.39% |
| |
| Benchmark: Schwab International® Index | | | 26.76 | % | | | 14.21 | % | | | 7.66 | % | | (5/19/97) 6.74% |
| |
| Fund Category: Morningstar Foreign Large-Cap Blend | | | 26.31 | % | | | 12.90 | % | | | 7.29 | % | | (5/19/97) 6.05% |
| | | | | | | | | | | | | | | |
Average Annual Total Returns After Tax1,2 |
Fund Class and Inception Date | | 1 Year | | 5 Years | | 10 Years | | Since Inception |
Investor Shares (9/9/93) | | | | | | | | | | | | | | | | |
| Pre-Liquidation (still own shares) | | | 25.73 | % | | | 12.89 | % | | | 6.61 | % | | | n/a | |
| Post-Liquidation (shares were sold) | | | 17.31 | % | | | 11.43 | % | | | 5.93 | % | | | n/a | |
| |
Select Shares® (5/19/97) | | | | | | | | | | | | | | | | |
| Pre-Liquidation (still own shares) | | | 25.88 | % | | | 13.01 | % | | | n/a | | | | 5.83 | % |
| Post-Liquidation (shares were sold) | | | 17.47 | % | | | 11.55 | % | | | n/a | | | | 5.21 | % |
| |
Fund Category: Morningstar Foreign Large-Cap Blend | | | | | | | | | | | | | | | | |
| Pre-Liquidation (still own shares) | | | 15.10 | % | | | 11.98 | % | | | 5.48 | % | | | n/a | |
| Post-Liquidation (shares were sold) | | | 10.70 | % | | | 10.61 | % | | | 5.17 | % | | | n/a | |
All figures on this page assume dividends and distributions were reinvested. Index figures do not include trading and management costs, which would lower performance. Indices are unmanaged, and you cannot invest in them directly. Performance results less than one year are not annualized.
1Fund expenses may have been partially absorbed by CSIM and Schwab. Without these reductions, the fund’s returns would have been lower.
2The pre-tax total return and the graph do not reflect the deduction of taxes that a shareholder would pay on fund distributions or the redemption of fund shares. After-tax returns are calculated using the highest historical individual federal marginal income tax rates in effect as of 10/31/06 and do not reflect the impact of state and local taxes or the alternative minimum tax. Actual returns depend on an investor’s situation and may differ from those shown. After-tax returns may not be relevant to investors who hold their fund shares through tax-deferred arrangements. Pre-liquidation after-tax returns reflect the tax effects of purchases and sales of securities within the fund portfolios and assume investors continue to hold fund shares at the end of the measurement periods. Post-liquidation figures assume investors sold fund shares at the end of the measurement periods and reflect both the effects of taxable distributions and any taxable gains or losses realized upon the sale of shares. Source for category information: Morningstar, Inc. Some funds in this category may not use tax-efficient strategies, including this fund.
Schwab Equity Index Funds 17
Fund Expenses (unaudited)
Examples for a $1,000 Investment |
As a fund shareholder, you incur two types of costs: transaction costs, such as redemption fees; and, ongoing costs, such as management fees, transfer agent and shareholder services fees, and other fund expenses.
The expense examples below are intended to help you understand your ongoing cost (in dollars) of investing in a fund and to compare this cost with the ongoing cost of investing in other mutual funds. These examples are based on an investment of $1,000 invested for six-months beginning May 1, 2006 and held through October 31, 2006.
Actual Return lines in the table below provide information about actual account values and actual expenses. You may use this information, together with the amount you invested, to estimate the expenses that you paid over the period. To do so, simply divide your account value by $1,000 (for example, an $8,600 account value ÷ $1,000 = 8.6), then multiply the result by the number given for your fund or share class under the heading entitled “Expenses Paid During Period.”
Hypothetical Return lines in the table below provide information about hypothetical account values and hypothetical expenses based on a fund’s or share class’ actual expense ratio and an assumed return of 5% per year before expenses. Because the return used is not an actual return, it may not be used to estimate the actual ending account value or expenses you paid for the period.
You may use this information to compare the ongoing costs of investing in the fund and other funds. To do so, compare this 5% hypothetical example with the 5% hypothetical examples that appear in the shareholder reports of the other funds.
Please note that the expenses shown in the table are meant to highlight your ongoing costs only, and do not reflect any transactional costs, such as redemption fees. If these transactional costs were included, your costs would have been higher.
|
| Expense Ratio1
(Annualized)
|
| Beginning
Account Value
at 5/1/06
|
|
Ending
Account Value
(Net of Expenses)
at 10/31/06
|
| Expenses Paid
During Period2
5/1/06–10/31/06
|
|---|
Schwab S&P 500 index Fund | | | | | | | | | | | | | | | | |
Investor Shares | | | | | | | | | | | | | | | | |
| Actual Return | | | 0.37 | % | | $ | 1,000 | | | $ | 1,059.70 | | | $ | 1.92 | |
| Hypothetical 5% Return | | | 0.37 | % | | $ | 1,000 | | | $ | 1,023.34 | | | $ | 1.89 | |
Select Shares® | | | | | | | | | | | | | | | | |
| Actual Return | | | 0.19 | % | | $ | 1,000 | | | $ | 1,060.50 | | | $ | 0.99 | |
| Hypothetical 5% Return | | | 0.19 | % | | $ | 1,000 | | | $ | 1,024.25 | | | $ | 0.97 | |
e.Shares® | | | | | | | | | | | | | | | | |
| Actual Return | | | 0.22 | % | | $ | 1,000 | | | $ | 1,060.20 | | | $ | 1.14 | |
| Hypothetical 5% Return | | | 0.22 | % | | $ | 1,000 | | | $ | 1,024.10 | | | $ | 1.12 | |
Schwab Institutional Select® | | | | | | | | | | | | | | | | |
S&P 500 Fund | | | | | | | | | | | | | | | | |
| Actual Return | | | 0.10 | % | | $ | 1,000 | | | $ | 1,061.80 | | | $ | 0.52 | |
| Hypothetical 5% Return | | | 0.10 | % | | $ | 1,000 | | | $ | 1,024.70 | | | $ | 0.51 | |
Schwab 1000 Index® Fund | | | | | | | | | | | | | | | | |
Investor Shares | | | | | | | | | | | | | | | | |
| Actual Return | | | 0.49 | % | | $ | 1,000 | | | $ | 1,055.10 | | | $ | 2.54 | |
| Hypothetical 5% Return | | | 0.49 | % | | $ | 1,000 | | | $ | 1,022.74 | | | $ | 2.50 | |
Select Shares | | | | | | | | | | | | | | | | |
| Actual Return | | | 0.34 | % | | $ | 1,000 | | | $ | 1,055.90 | | | $ | 1.76 | |
| Hypothetical 5% Return | | | 0.34 | % | | $ | 1,000 | | | $ | 1,023.49 | | | $ | 1.73 | |
Schwab Small-Cap Index Fund® | | | | | | | | | | | | | | | | |
Investor Shares | | | | | | | | | | | | | | | | |
| Actual Return | | | 0.58 | % | | $ | 1,000 | | | $ | 1,007.00 | | | $ | 2.93 | |
| Hypothetical 5% Return | | | 0.58 | % | | $ | 1,000 | | | $ | 1,022.30 | | | $ | 2.96 | |
Select Shares | | | | | | | | | | | | | | | | |
| Actual Return | | | 0.42 | % | | $ | 1,000 | | | $ | 1,007.80 | | | $ | 2.13 | |
| Hypothetical 5% Return | | | 0.42 | % | | $ | 1,000 | | | $ | 1,023.14 | | | $ | 2.14 | |
1 | | Based on the most recent six-month expense ratio; may differ from the expense ratio provided in Financial Highlights. |
2 | | Expenses for each fund or share class are equal to its annualized expense ratio, multiplied by the average account value over the period, multiplied by 184 days of the period, and divided by 365 days of the fiscal year. |
18 Schwab Equity Index Funds
Fund Expenses continued (unaudited)
|
| Expense Ratio1
(Annualized)
|
| Beginning
Account Value
at 5/1/06
|
|
Ending
Account Value
(Net of Expenses)
at 10/31/06
|
| Expenses Paid
During Period2
5/1/06–10/31/06
|
|---|
Schwab Total Stock Market Index Fund® | | | | | | | | | | | | | | | | |
Investor Shares | | | | | | | | | | | | | | | | |
| Actual Return | | | 0.54 | % | | $ | 1,000 | | | $ | 1,050.70 | | | $ | 2.79 | |
| Hypothetical 5% Return | | | 0.54 | % | | $ | 1,000 | | | $ | 1,022.48 | | | $ | 2.75 | |
Select Shares | | | | | | | | | | | | | | | | |
| Actual Return | | | 0.39 | % | | $ | 1,000 | | | $ | 1,051.50 | | | $ | 2.02 | |
| Hypothetical 5% Return | | | 0.39 | % | | $ | 1,000 | | | $ | 1,023.24 | | | $ | 1.99 | |
Schwab International Index Fund® | | | | | | | | | | | | | | | | |
Investor Shares | | | | | | | | | | | | | | | | |
| Actual Return | | | 0.69 | % | | $ | 1,000 | | | $ | 1,040.90 | | | $ | 3.55 | |
| Hypothetical 5% Return | | | 0.69 | % | | $ | 1,000 | | | $ | 1,021.73 | | | $ | 3.52 | |
Select Shares | | | | | | | | | | | | | | | | |
| Actual Return | | | 0.50 | % | | $ | 1,000 | | | $ | 1,041.90 | | | $ | 2.57 | |
| Hypothetical 5% Return | | | 0.50 | % | | $ | 1,000 | | | $ | 1,022.68 | | | $ | 2.55 | |
1 | | Based on the most recent six-month expense ratio; may differ from the expense ratio provided in Financial Highlights. |
2 | | Expenses for each fund or share class are equal to its annualized expense ratio, multiplied by the average account value over the period, multiplied by 184 days of the period, and divided by 365 days of the fiscal year. |
Schwab Equity Index Funds 19
Schwab S&P 500 Index Fund
Financial Statements
Financial Highlights
Investor Shares
| | | | 11/1/05—
10/31/06
| | 11/1/04—
10/31/05
| | 11/1/03—
10/31/04
| | 11/1/02—
10/31/03
| | 11/1/01—
10/31/02
|
|---|
Per-Share Data ($) | | | | | | | | | | | | | | | | | | | | | | |
| Net asset value at beginning of period | | | | | 18.79 | | | | 17.61 | | | | 16.36 | | | | 13.79 | | | | 16.45 | |
Income or loss from investment operations:
| | | | | | | | | | | | | | | | | | | | | | |
| Net investment income | | | | | 0.34 | | | | 0.34 | | | | 0.23 | | | | 0.20 | | | | 0.20 | |
| Net realized and unrealized gains or losses | | | | | 2.64 | | | | 1.14 | | | | 1.23 | | | | 2.57 | | | | (2.68 | ) |
| Total income or loss from investment operations | | | | | 2.98 | | | | 1.48 | | | | 1.46 | | | | 2.77 | | | | (2.48 | ) |
Less distributions:
| | | | | | | | | | | | | | | | | | | | | | |
| Dividends from net investment income | | | | | (0.30 | ) | | | (0.30 | ) | | | (0.21 | ) | | | (0.20 | ) | | | (0.18 | ) |
| Net asset value at end of period | | | | | 21.47 | | | | 18.79 | | | | 17.61 | | | | 16.36 | | | | 13.79 | |
| Total return (%) | | | | | 16.03 | | | | 8.44 | | | | 9.03 | | | | 20.39 | | | | (15.32 | ) |
| |
Ratios/Supplemental Data (%) | | | | | | | | | | | | | | | | | | | | | | |
Ratios to average net assets:
| | | | | | | | | | | | | | | | | | | | | | |
| Net operating expenses | | | | | 0.36 | | | | 0.37 | | | | 0.37 | | | | 0.36 | | | | 0.35 | |
| Gross operating expenses | | | | | 0.36 | | | | 0.40 | | | | 0.45 | | | | 0.46 | | | | 0.46 | |
| Net investment income | | | | | 1.57 | | | | 1.74 | | | | 1.35 | | | | 1.45 | | | | 1.21 | |
| Portfolio turnover rate | | | | | 3 | | | | 4 | | | | 3 | | | | 3 | | | | 8 | |
| Net assets, end of period ($ x 1,000,000) | | | | | 3,685 | | | | 3,666 | | | | 3,849 | | | | 3,510 | | | | 2,760 | |
20 See financial notes.
Schwab S&P 500 Index Fund
Financial Highlights continued
Select Shares
| | | | 11/1/05—
10/31/06
| | 11/1/04—
10/31/05
| | 11/1/03—
10/31/04
| | 11/1/02—
10/31/03
| | 11/1/01—
10/31/02
|
|---|
Per-Share Data ($) | | | | | | | | | | | | | | | | | | | | | | |
| Net asset value at beginning of period | | | | | 18.88 | | | | 17.68 | | | | 16.41 | | | | 13.83 | | | | 16.50 | |
Income or loss from investment operations:
| | | | | | | | | | | | | | | | | | | | | | |
| Net investment income | | | | | 0.37 | | | | 0.36 | | | | 0.26 | | | | 0.24 | | | | 0.22 | |
| Net realized and unrealized gains or losses | | | | | 2.65 | | | | 1.16 | | | | 1.24 | | | | 2.57 | | | | (2.69 | ) |
| Total income or loss from investment operations | | | | | 3.02 | | | | 1.52 | | | | 1.50 | | | | 2.81 | | | | (2.47 | ) |
Less distributions:
| | | | | | | | | | | | | | | | | | | | | | |
| Dividends from net investment income | | | | | (0.34 | ) | | | (0.32 | ) | | | (0.23 | ) | | | (0.23 | ) | | | (0.20 | ) |
| Net asset value at end of period | | | | | 21.56 | | | | 18.88 | | | | 17.68 | | | | 16.41 | | | | 13.83 | |
| Total return (%) | | | | | 16.18 | | | | 8.66 | | | | 9.25 | | | | 20.62 | | | | (15.20 | ) |
| |
Ratios/Supplemental Data (%) | | | | | | | | | | | | | | | | | | | | | | |
Ratios to average net assets:
| | | | | | | | | | | | | | | | | | | | | | |
| Net operating expenses | | | | | 0.19 | | | | 0.19 | | | | 0.19 | | | | 0.19 | | | | 0.19 | |
| Gross operating expenses | | | | | 0.21 | | | | 0.25 | | | | 0.30 | | | | 0.31 | | | | 0.31 | |
| Net investment income | | | | | 1.74 | | | | 1.92 | | | | 1.53 | | | | 1.63 | | | | 1.37 | |
| Portfolio turnover rate | | | | | 3 | | | | 4 | | | | 3 | | | | 3 | | | | 8 | |
| Net assets, end of period ($ x 1,000,000) | | | | | 4,038 | | | | 3,938 | | | | 4,119 | | | | 3,692 | | | | 3,029 | |
See financial notes. 21
Schwab S&P 500 Index Fund
Financial Highlights continued
e.Shares
| | | | 11/1/05—
10/31/06
| | 11/1/04—
10/31/05
| | 11/1/03—
10/31/04
| | 11/1/02—
10/31/03
| | 11/1/01—
10/31/02
|
|---|
Per-Share Data ($) | | | | | | | | | | | | | | | | | | | | | | |
| Net asset value at beginning of period | | | | | 18.81 | | | | 17.62 | | | | 16.37 | | | | 13.79 | | | | 16.46 | |
Income or loss from investment operations:
| | | | | | | | | | | | | | | | | | | | | | |
| Net investment income | | | | | 0.35 | | | | 0.39 | | | | 0.26 | | | | 0.23 | | | | 0.23 | |
| Net realized and unrealized gains or losses | | | | | 2.67 | | | | 1.11 | | | | 1.21 | | | | 2.56 | | | | (2.71 | ) |
| Total income or loss from investment operations | | | | | 3.02 | | | | 1.50 | | | | 1.47 | | | | 2.79 | | | | (2.48 | ) |
Less distributions:
| | | | | | | | | | | | | | | | | | | | | | |
| Dividends from net investment income | | | | | (0.33 | ) | | | (0.31 | ) | | | (0.22 | ) | | | (0.21 | ) | | | (0.19 | ) |
| Net asset value at end of period | | | | | 21.50 | | | | 18.81 | | | | 17.62 | | | | 16.37 | | | | 13.79 | |
| Total return (%) | | | | | 16.25 | | | | 8.58 | | | | 9.10 | | | | 20.55 | | | | (15.32 | ) |
| |
Ratios/Supplemental Data (%) | | | | | | | | | | | | | | | | | | | | | | |
Ratios to average net assets:
| | | | | | | | | | | | | | | | | | | | | | |
| Net operating expenses | | | | | 0.21 | | | | 0.24 | | | | 0.28 | | | | 0.28 | | | | 0.28 | |
| Gross operating expenses | | | | | 0.21 | | | | 0.25 | | | | 0.30 | | | | 0.31 | | | | 0.31 | |
| Net investment income | | | | | 1.72 | | | | 1.88 | | | | 1.44 | | | | 1.54 | | | | 1.28 | |
| Portfolio turnover rate | | | | | 3 | | | | 4 | | | | 3 | | | | 3 | | | | 8 | |
| Net assets, end of period ($ x 1,000,000) | | | | | 241 | | | | 220 | | | | 249 | | | | 246 | | | | 220 | |
22 See financial notes.
Schwab S&P 500 Index Fund
Portfolio Holdings as of October 31, 2006
This section shows the fund’s 50 largest portfolio holdings in unaffiliated issuers and any holdings exceeding 1% of the fund’s total net assets as of the report date. The remaining securities held by the fund are grouped as “Other Securities” in each category. You can request a complete schedule of portfolio holdings as of the report date, free of charge, by calling Schwab Funds® at 1-800-435-4000. This complete schedule, filed on the fund’s Form N-CSR, is also available on the SEC’s website at http://www.sec.gov.
In addition, the fund files its complete schedule of portfolio holdings with the SEC for the first and third quarters of each fiscal year on Form N-Q. The fund’s Form N-Q is available on the SEC’s website and may be viewed and copied at the SEC’s Public Reference Room in Washington, D.C. Call 1-800-SEC-0330 for information on the operation of the Public Reference Room. A copy of the fund’s most recently filed quarterly schedule of portfolio holdings, included on the fund’s Form N-CSR (with respect to the fund’s second and fourth fiscal quarters) or Form N-Q (with respect to the fund’s first and third fiscal quarters), is available by visiting Schwab’s website at www.schwab.com/schwabfunds.
Holdings by Category
|
| Cost
($ x 1,000)
|
| Value
($ x 1,000)
|
|---|
| 99.9% | | | | Common Stock | | | 5,588,418 | | | | 7,950,692 | |
| 0.1% | | | | Short-Term Investment | | | 8,212 | | | | 8,212 | |
| —% | | | | U.S. Treasury Obligation | | | 2,983 | | | | 2,983 | |
| 100.0% | | | | Total Investments | | | 5,599,613 | | | | 7,961,887 | |
| 1.6% | | | | Collateral Invested for Securities on Loan | | | 128,448 | | | | 128,448 | |
| (1.6)% | | | | Other Assets and Liabilities, Net | | | | | | | (125,539 | ) |
| 100.0% | | | | Net Assets | | | | | | | 7,964,796 | |
Security and Number of Shares
| | % of Net
Assets
| | Value
($ x 1,000)
|
|---|
Common Stock 99.9% of net assets |
Automobiles & Components 0.6% |
| Other Securities | | | | | 1,970,427 | | | | 0.6 | | | | 46,304 | |
Banks 5.7% |
| U.S. Bancorp | | | | | 1,139,832 | | | | 0.5 | | | | 38,572 | |
| Wachovia Corp. | | | | | 1,202,870 | | | | 0.8 | | | | 66,759 | |
| Wells Fargo & Co. | | | | | 2,151,676 | | | | 1.0 | | | | 78,084 | |
| Other Securities | | | | | 5,930,244 | | | | 3.4 | | | | 274,265 | |
| | | | | | | | | | 5.7 | | | | 457,680 | |
Capital Goods 8.5% |
| 3M Co. | | | | | 482,761 | | | | 0.5 | | | | 38,061 | |
General Electric Co. (b) | | | | | 6,641,667 | | | | 2.9 | | | | 233,189 | |
| The Boeing Co. | | | | | 512,990 | | | | 0.5 | | | | 40,967 | |
| Tyco International Ltd. | | | | | 1,304,215 | | | | 0.5 | | | | 38,383 | |
| United Technologies Corp. | | | | | 647,334 | | | | 0.5 | | | | 42,543 | |
| Other Securities | | | | | 4,837,222 | | | | 3.6 | | | | 285,365 | |
| | | | | | | | | | 8.5 | | | | 678,508 | |
Commercial Services & Supplies 0.6% |
| Other Securities | | | | | 1,175,319 | | | | 0.6 | | | | 44,497 | |
Consumer Durables & Apparel 1.2% |
| Other Securities | | | | | 2,253,790 | | | | 1.2 | | | | 93,606 | |
Consumer Services 1.8% |
| Other Securities | | | | | 3,661,042 | | | | 1.8 | | | | 143,622 | |
Diversified Financials 10.4% |
| American Express Co. | | | | | 795,834 | | | | 0.6 | | | | 46,007 | |
| Bank of America Corp. | | | | | 2,926,732 | | | | 2.0 | | | | 157,663 | |
| Citigroup, Inc. | | | | | 3,183,543 | | | | 2.0 | | | | 159,686 | |
| JPMorgan Chase & Co. | | | | | 2,236,116 | | | | 1.3 | | | | 106,081 | |
| Merrill Lynch & Co., Inc. | | | | | 570,290 | | | | 0.6 | | | | 49,855 | |
| Morgan Stanley | | | | | 685,848 | | | | 0.7 | | | | 52,419 | |
The Charles Schwab
Corp. (c) | | | | | 660,696 | | | | 0.2 | | | | 12,038 | |
The Goldman Sachs Group, Inc. (a) | | | | | 276,667 | | | | 0.7 | | | | 52,509 | |
| Other Securities | | | | | 3,291,125 | | | | 2.3 | | | | 191,456 | |
| | | | | | | | | | 10.4 | | | | 827,714 | |
Energy 9.4% |
| ChevronTexaco Corp. | | | | | 1,409,919 | | | | 1.2 | | | | 94,747 | |
| ConocoPhillips | | | | | 1,057,004 | | | | 0.8 | | | | 63,674 | |
Exxon Mobil Corp. (b) | | | | | 3,823,631 | | | | 3.4 | | | | 273,084 | |
| Schlumberger Ltd. | | | | | 755,559 | | | | 0.6 | | | | 47,661 | |
| Other Securities | | | | | 5,874,484 | | | | 3.4 | | | | 272,006 | |
| | | | | | | | | | 9.4 | | | | 751,172 | |
Food & Staples Retailing 2.3% |
| Wal-Mart Stores, Inc. | | | | | 1,582,493 | | | | 1.0 | | | | 77,985 | |
| Other Securities | | | | | 2,846,731 | | | | 1.3 | | | | 103,612 | |
| | | | | | | | | | 2.3 | | | | 181,597 | |
Food, Beverage & Tobacco 4.8% |
| Altria Group, Inc. | | | | | 1,343,189 | | | | 1.4 | | | | 109,242 | |
| PepsiCo, Inc. | | | | | 1,058,158 | | | | 0.8 | | | | 67,129 | |
| The Coca-Cola Co. | | | | | 1,312,447 | | | | 0.8 | | | | 61,317 | |
| Other Securities | | | | | 3,753,356 | | | | 1.8 | | | | 142,956 | |
| | | | | | | | | | 4.8 | | | | 380,644 | |
Health Care Equipment & Services 4.2% |
| UnitedHealth Group, Inc. | | | | | 872,408 | | | | 0.5 | | | | 42,556 | |
| Other Securities | | | | | 6,337,354 | | | | 3.7 | | | | 291,773 | |
| | | | | | | | | | 4.2 | | | | 334,329 | |
Household & Personal Products 2.4% |
Procter & Gamble Co. (b) | | | | | 2,042,670 | | | | 1.6 | | | | 129,485 | |
| Other Securities | | | | | 1,117,440 | | | | 0.8 | | | | 60,526 | |
| | | | | | | | | | 2.4 | | | | 190,011 | |
See financial notes. 23
Schwab S&P 500 Index Fund
Portfolio Holdings continued
Security and Number of Shares
| | % of Net
Assets
| | Value
($ x 1,000)
|
|---|
Insurance 4.8% |
| American International Group, Inc. | | | | | 1,663,332 | | | | 1.4 | | | | 111,726 | |
| Other Securities | | | | | 5,441,524 | | | | 3.4 | | | | 270,533 | |
| | | | | | | | | | 4.8 | | | | 382,259 | |
Materials 3.0% |
| Other Securities | | | | | 5,003,096 | | | | 3.0 | | | | 235,791 | |
Media 3.5% |
| Comcast Corp., Class A * | | | | | 1,353,032 | | | | 0.7 | | | | 55,028 | |
| The Walt Disney Co. | | | | | 1,370,176 | | | | 0.5 | | | | 43,106 | |
| Time Warner, Inc. | | | | | 2,604,429 | | | | 0.7 | | | | 52,115 | |
| Other Securities | | | | | 3,981,604 | | | | 1.6 | | | | 128,308 | |
| | | | | | | | | | 3.5 | | | | 278,557 | |
Pharmaceuticals & Biotechnology 8.2% |
| Abbott Laboratories | | | | | 977,375 | | | | 0.6 | | | | 46,435 | |
| Amgen, Inc. * | | | | | 755,118 | | | | 0.7 | | | | 57,321 | |
| Johnson & Johnson | | | | | 1,896,195 | | | | 1.6 | | | | 127,804 | |
| Merck & Co., Inc. | | | | | 1,417,127 | | | | 0.8 | | | | 64,366 | |
| Pfizer, Inc. | | | | | 4,721,357 | | | | 1.6 | | | | 125,824 | |
| Wyeth | | | | | 861,882 | | | | 0.6 | | | | 43,982 | |
| Other Securities | | | | | 4,914,572 | | | | 2.3 | | | | 189,734 | |
| | | | | | | | | | 8.2 | | | | 655,466 | |
Real Estate 1.1% |
| Other Securities | | | | | 1,518,077 | | | | 1.1 | | | | 90,503 | |
Retailing 3.7% |
| Home Depot, Inc. | | | | | 1,311,913 | | | | 0.6 | | | | 48,974 | |
| Other Securities | | | | | 6,274,142 | | | | 3.1 | | | | 246,417 | |
| | | | | | | | | | 3.7 | | | | 295,391 | |
Semiconductors & Semiconductor Equipment 2.7% |
| Intel Corp. | | | | | 3,704,566 | | | | 1.0 | | | | 79,055 | |
| Other Securities | | | | | 5,471,207 | | | | 1.7 | | | | 134,679 | |
| | | | | | | | | | 2.7 | | | | 213,734 | |
Software & Services 5.5% |
| Google, Inc., Class A * | | | | | 135,170 | | | | 0.8 | | | | 64,394 | |
Microsoft Corp. (b) | | | | | 5,556,763 | | | | 2.0 | | | | 159,535 | |
| Oracle Corp. * | | | | | 2,550,731 | | | | 0.6 | | | | 47,112 | |
| Other Securities | | | | | 5,667,006 | | | | 2.1 | | | | 162,823 | |
| | | | | | | | | | 5.5 | | | | 433,864 | |
Technology Hardware & Equipment 6.8% |
| Apple Computer, Inc. * | | | | | 544,625 | | | | 0.6 | | | | 44,158 | |
| Cisco Systems, Inc. * | | | | | 3,909,298 | | | | 1.2 | | | | 94,331 | |
| Hewlett-Packard Co. | | | | | 1,764,558 | | | | 0.9 | | | | 68,359 | |
| International Business Machines Corp. | | | | | 978,747 | | | | 1.1 | | | | 90,368 | |
| Motorola, Inc. | | | | | 1,602,800 | | | | 0.5 | | | | 36,961 | |
| QUALCOMM, Inc. | | | | | 1,062,758 | | | | 0.5 | | | | 38,674 | |
| Other Securities | | | | | 12,961,227 | | | | 2.0 | | | | 169,334 | |
| | | | | | | | | | 6.8 | | | | 542,185 | |
Telecommunication Services 3.5% |
| AT&T Corp. | | | | | 2,489,859 | | | | 1.1 | | | | 85,278 | |
| BellSouth Corp. | | | | | 1,158,380 | | | | 0.7 | | | | 52,243 | |
| Verizon Communications, Inc. | | | | | 1,868,151 | | | | 0.9 | | | | 69,122 | |
| Other Securities | | | | | 3,940,624 | | | | 0.8 | | | | 73,680 | |
| | | | | | | | | | 3.5 | | | | 280,323 | |
Transportation 1.8% |
| United Parcel Service, Inc., Class B | | | | | 688,790 | | | | 0.7 | | | | 51,900 | |
| Other Securities | | | | | 1,655,405 | | | | 1.1 | | | | 89,065 | |
| | | | | | | | | | 1.8 | | | | 140,965 | |
Utilities 3.4% |
| Other Securities | | | | | 6,516,810 | | | | 3.4 | | | | 271,970 | �� |
Security
Rate, Maturity Date
| | | | Face
Amount
($ x 1,000)
| | % of Net
Assets
| Value
($ x 1,000)
| |
|---|
Short-Term Investment 0.1% of net assets |
| Other Securities | | | | | 8,212 | | | | — | | 8,212 | |
| | | | | | | | | | | |
U.S. Treasury Obligation 0.0% of net assets |
| Other Securities | | | | | 3,000 | | | | — | | 2,983 | |
24 See financial notes.
Schwab S&P 500 Index Fund
Portfolio Holdings continued
Security
| | | | Number of
Shares
| | Value
($ x 1,000)
|
|---|
Collateral Invested for Securities on Loan 1.6% of net assets
|
Securities Lending Investment Fund, a series of the
Brown Brothers
Investment Trust | | | | | 128,448,347 | | | | 128,448 | |
End of collateral invested for securities on loan.At 10/31/06 the tax basis cost of the fund’s investments was $5,647,753, and the unrealized appreciation and depreciation were $2,828,797 and ($514,663), respectively, with a net unrealized appreciation of $2,314,134.
In addition to the above, the fund held the following at 10/31/06. All numbers are x1,000 except number of futures contracts.
| | | | Number of
Contracts
| | Contract
Value
| | Unrealized
Gains
|
|---|
|
| S&P 500 Index, e-mini, Long, expires 12/15/06 | | | | | 105 | | | | 7,262 | | | | 389 | |
| * | | Non-income producing security. |
(a) | | All or a portion of this security is on loan. |
(b) | | All or a portion of this security is held as collateral for open futures contracts. |
(c) | | Issuer is affiliated with the fund’s adviser. |
See financial notes. 25
Schwab S&P 500 Index Fund
Statement of
Assets and Liabilities
As of October 31, 2006. All numbers x 1,000 except NAV.
Assets | | | | | | |
| Investments, at value including securities on loan of $125,069 (cost $5,599,613) | | | | $ | 7,961,887 | |
| Collateral invested for securities on loan | | | | | 128,448 | |
Receivables:
| | | | | | |
| Dividends | | | | | 6,842 | |
| Fund shares sold | | | | | 5,969 | |
| Income from securities on loan | | | | | 12 | |
| Interest | | | | | 1 | |
| Prepaid expenses | | | | + | 47 | |
Total assets | | | | | 8,103,206 | |
| |
Liabilities | | | | | | |
| Collateral for securities on loan | | | | | 128,448 | |
Payables:
| | | | | | |
| Investment adviser and administrator fees | | | | | 60 | |
| Transfer agent and shareholder services fees | | | | | 110 | |
| Fund shares redeemed | | | | | 9,395 | |
| Trustee fees | | | | | 8 | |
| Due to brokers for futures | | | | | 4 | |
| Accrued expenses | | | | + | 385 | |
Total liabilities | | | | | 138,410 | |
| |
Net Assets | | | | | | |
Total assets | | | | | 8,103,206 | |
Total liabilities | | | | – | 138,410 | |
Net assets | | | | $ | 7,964,796 | |
| |
Net Assets by Source | | | | | | |
| Capital received from investors | | | | | 6,413,638 | |
| Net investment income not yet distributed | | | | | 100,766 | |
| Net realized capital losses | | | | | (912,271 | ) |
| Net unrealized capital gains | | | | | 2,362,663 | |
| |
Net Asset Value (NAV) by Shares Class | | | | | | |
Share Class
| |
| | Net Assets
| | ÷
| | Shares
Outstanding
| | =
| NAV
| |
|---|
| Investor Shares | | | | | | | | $ | 3,685,095 | | | | | | | | 171,631 | | | | | | $21.47 | |
| Select Shares | | | | | | | | $ | 4,038,410 | | | | | | | | 187,284 | | | | | | $21.56 | |
| e.Shares | | | | | | | | $ | 241,291 | | | | | | | | 11,225 | | | | | | $21.50 | |
26 See financial notes.
Schwab S&P 500 Index Fund
Statement of
Operations
For November 1, 2005 through October 31, 2006. All numbers x 1,000.
Investment Income | | | | | | |
| Dividends (including $71 from affiliated issuer) | | | | $ | 150,397 | |
| Interest | | | | | 749 | |
| Lending of securities | | | | + | 223 | |
Total Investment Income | | | | | 151,369 | |
| |
Net Realized Gains and Losses | | | | | | |
| Net realized losses on investments | | | | | (97,747 | ) |
| Net realized gains on futures contracts | | | | + | 3,990 | |
Net realized losses | | | | | (93,757 | ) |
| |
Net Unrealized Gains and Losses | | | | | | |
| Net unrealized gains on investments | | | | | 1,135,806 | |
| Net unrealized gains on futures contracts | | | | + | 347 | |
Net unrealized gains | | | | | 1,136,153 | |
| |
Expenses | | | | | | |
| Investment adviser and administrator fees | | | | | 7,070 | |
Transfer agent and shareholder service fees:
| | | | | | |
| Investor Shares | | | | | 9,211 | |
| Select Shares | | | | | 3,947 | |
| e.Shares | | | | | 224 | |
| Shareholder reports | | | | | 407 | |
| Portfolio accounting fees | | | | | 269 | |
| Custodian fees | | | | | 220 | |
| Registration fees | | | | | 174 | |
| Professional fees | | | | | 80 | |
| Trustees’ fees | | | | | 57 | |
| Overdraft expense | | | | | 63 | |
| Other expenses | | | | + | 141 | |
| Total expenses | | | | | 21,863 | |
| Expense reduction by adviser and Schwab | | | | | –670 | |
Net expenses | | | | | 21,193 | |
| |
Increase in Net Assets from Operations | | | | | | |
Total investment income | | | | | 151,369 | |
Net expenses | | | | | –21,193 | |
Net investment income | | | | | 130,176 | |
Net realized losses | | | | | (93,757 | ) |
Net unrealized gains | | | | + | 1,136,153 | |
Increase in net assets from operations | | | | $ | 1,172,572 | |
See financial notes. 27
Schwab S&P 500 Index Fund
Statements of
Changes in Net Assets
For the current and prior report periods. All numbers x 1,000.
| | | | 11/1/05–10/31/06
| | 11/1/04–10/31/05
|
|---|
| Net investment income | | | | $ | 130,176 | | | $ | 150,655 | |
| Net realized gains or losses | | | | | (93,757 | ) | | | 77,682 | |
| Net unrealized gains | | | | + | 1,136,153 | | | | 464,991 | |
Increase in net assets from operations | | | | | 1,172,572 | | | | 693,328 | |
| |
Distributions Paid | | | | | | | | | | |
Dividends from net investment income | | | | | | | | | | |
| Investor Shares | | | | | 57,584 | | | | 64,372 | |
| Select Shares | | | | | 67,949 | | | | 75,732 | |
| e.Shares | | | | + | 3,805 | | | | 4,246 | |
Total dividends from net investment income | | | | $ | 129,338 | | | $ | 144,350 | |
Transactions in Fund Shares | | | | | | | | | | | | | | | | | | |
| | | | 11/1/05–10/31/06
| | 11/1/04–10/31/05
| |
|---|
| | | | SHARES
| | VALUE
| | SHARES
| | VALUE
|
|---|
Shares Sold | | | | | | | | | | | | | | | | | | |
| Investor Shares | | | | | 17,732 | | | $ | 353,074 | | | | 24,608 | | | $ | 453,452 | |
| Select Shares | | | | | 30,407 | | | | 606,896 | | | | 44,426 | | | | 826,293 | |
| e.Shares | | | | + | 2,578 | | | | 51,641 | | | | 2,521 | | | | 46,535 | |
Total shares sold | | | | | 50,717 | | | $ | 1,011,611 | | | | 71,555 | | | $ | 1,326,280 | |
| |
Shares Reinvested | | | | | | | | | | | | | | | | | | |
| Investor Shares | | | | | 2,823 | | | $ | 55,000 | | | | 3,370 | | | $ | 61,509 | |
| Select Shares | | | | | 3,056 | | | | 59,681 | | | | 3,694 | | | | 67,604 | |
| e.Shares | | | | + | 177 | | | | 3,443 | | | | 210 | | | | 3,838 | |
Total shares reinvested | | | | | 6,056 | | | $ | 118,124 | | | | 7,274 | | | $ | 132,951 | |
| |
Shares Redeemed | | | | | | | | | | | | | | | | | | |
| Investor Shares | | | | | (44,003 | ) | | $ | (874,140 | ) | | | (51,474 | ) | | $ | (955,673 | ) |
| Select Shares | | | | | (54,785 | ) | | | (1,094,191 | ) | | | (72,497 | ) | | | (1,349,747 | )* |
| e.Shares | | | | + | (3,222 | ) | | | (63,959 | ) | | | (5,182 | ) | | | (96,047 | ) |
Total shares redeemed | | | | | (102,010 | ) | | $ | (2,032,290 | ) | | | (129,153 | ) | | $ | (2,401,467 | ) |
| |
Net transactions in fund shares | | | | | (45,237 | ) | | $ | (902,555 | ) | | | (50,324 | ) | | $ | (942,236 | ) |
Shares Outstanding and Net Assets | | | | | | | | | | | | | | | | | | |
| | | | 11/1/05–10/31/06
| | 11/1/04–10/31/05
| |
|---|
| | | | SHARES
| | NET ASSETS
| | SHARES
| | NET ASSETS
|
|---|
| Beginning of period | | | | | 415,377 | | | $ | 7,824,117 | | | | 465,701 | | | $ | 8,217,375 | |
| Total increase or decrease | | | | + | (45,237 | ) | | | 140,679 | | | | (50,324 | ) | | | (393,258 | ) |
End of period | | | | | 370,140 | | | $ | 7,964,796 | | | | 415,377 | | | $ | 7,824,117 | |
Net investment income not yet distributed | | | | | | | | $ | 100,766 | | | | | | | $ | 100,796 | |
| * | | Includes $430,561 redemption in-kind by Schwab MarketTrack All Equity, Growth and Balanced Portfolios. |
28 See financial notes.
Schwab Institutional Select® S&P 500 Fund
Financial Statements
Financial Highlights
| | | | 11/1/05—
10/31/06
| | 11/1/04—
10/31/05
| | 11/1/03—
10/31/04
| | 11/1/02—
10/31/03
| | 11/1/01—
10/31/02
|
|---|
Per-Share Data ($) | | | | | | | | | | | | | | | | | | | | | | |
| Net asset value at beginning of period | | | | | 9.57 | | | | 8.95 | | | | 8.30 | | | | 7.00 | | | | 8.36 | |
Income or loss from investment operations:
| | | | | | | | | | | | | | | | | | | | | | |
| Net investment income | | | | | 0.16 | | | | 0.15 | | | | 0.13 | | | | 0.12 | | | | 0.12 | |
| Net realized and unrealized gains or losses | | | | | 1.39 | | | | 0.62 | | | | 0.64 | | | | 1.30 | | | | (1.37 | ) |
| Total income or loss from investment operations | | | | | 1.55 | | | | 0.77 | | | | 0.77 | | | | 1.42 | | | | (1.25 | ) |
Less distributions:
| | | | | | | | | | | | | | | | | | | | | | |
| Dividends from net investment income | | | | | (0.13 | ) | | | (0.15 | ) | | | (0.12 | ) | | | (0.12 | ) | | | (0.11 | ) |
| Net asset value at end of period | | | | | 10.99 | | | | 9.57 | | | | 8.95 | | | | 8.30 | | | | 7.00 | |
| Total return (%) | | | | | 16.39 | | | | 8.64 | | | | 9.36 | | | | 20.65 | | | | (15.18 | ) |
| |
Ratios/Supplemental Data (%) | | | | | | | | | | | | | | | | | | | | | | |
Ratios to average net assets:
| | | | | | | | | | | | | | | | | | | | | | |
| Net operating expenses | | | | | 0.10 | | | | 0.10 | | | | 0.15 | | | | 0.15 | | | | 0.15 | |
| Gross operating expenses | | | | | 0.28 | | | | 0.33 | | | | 0.35 | | | | 0.36 | | | | 0.37 | |
| Net investment income | | | | | 1.84 | | | | 1.82 | | | | 1.56 | | | | 1.65 | | | | 1.38 | |
| Portfolio turnover rate | | | | | 2 | | | | 3 | | | | 3 | | | | 4 | | | | 12 | |
| Net assets, end of period ($ x 1,000,000) | | | | | 2,080 | | | | 1,246 | | | | 348 | | | | 272 | | | | 203 | |
See financial notes. 29
Schwab Institutional Select S&P 500 Fund
Portfolio Holdings as of October 31, 2006
This section shows the fund’s 50 largest portfolio holdings in unaffiliated issuers and any holdings exceeding 1% of the fund’s total net assets as of the report date. The remaining securities held by the fund are grouped as “Other Securities” in each category. You can request a complete schedule of portfolio holdings as of the report date, free of charge, by calling Schwab Funds® at 1-800-435-4000. This complete schedule, filed on the fund’s Form N-CSR, is also available on the SEC’s website at http://www.sec.gov.
In addition, the fund files its complete schedule of portfolio holdings with the SEC for the first and third quarters of each fiscal year on Form N-Q. The fund’s Form N-Q is available on the SEC’s website and may be viewed and copied at the SEC’s Public Reference Room in Washington, D.C. Call 1-800-SEC-0330 for information on the operation of the Public Reference Room. A copy of the fund’s most recently filed quarterly schedule of portfolio holdings, included on the fund’s Form N-CSR (with respect to the fund’s second and fourth fiscal quarters) or Form N-Q (with respect to the fund’s first and third fiscal quarters), is available by visiting Schwab’s website at www.schwab.com/schwabfunds.
Holdings by Category
|
| Cost
($ x 1,000)
|
| Value
($ x 1,000)
|
|---|
| 98.9% | | | | Common Stock | | | 1,812,825 | | | | 2,057,718 | |
| 0.6% | | | | Short-Term Investment | | | 11,977 | | | | 11,977 | |
| 0.2% | | | | U.S. Treasury Obligation | | | 3,282 | | | | 3,282 | |
| —% | | | | Warrant | | | — | | | | 2 | |
| 99.7% | | | | Total Investments | | | 1,828,084 | | | | 2,072,979 | |
| 7.8% | | | | Collateral Invested for Securities on Loan | | | 162,875 | | | | 162,875 | |
| (7.5)% | | | | Other Assets and Liabilities, Net | | | | | | | (155,474 | ) |
| 100.0% | | | | Net Assets | | | | | | | 2,080,380 | |
Security and Number of Shares
| | % of Net
Assets
| | Value
($ x 1,000)
|
|---|
Common Stock 98.9% of net assets |
Automobiles & Components 0.6% |
| Other Securities | | | | | 511,467 | | | | 0.6 | | 11,907 | |
Banks 5.7% |
| U.S. Bancorp | | | | | 294,951 | | | | 0.5 | | 9,981 | |
| Wachovia Corp. | | | | | 317,754 | | | | 0.8 | | 17,635 | |
| Wells Fargo & Co. | | | | | 558,874 | | | | 1.0 | | 20,282 | |
| Other Securities | | | | | 1,537,705 | | | | 3.4 | | 71,159 | |
| | | | | | | | | | 5.7 | | 119,057 | |
Capital Goods 8.4% |
| 3M Co. | | | | | 125,029 | | | | 0.5 | | 9,857 | |
General Electric Co. (b) | | | | | 1,713,315 | | | | 2.9 | | 60,155 | |
| The Boeing Co. | | | | | 132,934 | | | | 0.5 | | 10,616 | |
| Tyco International Ltd. | | | | | 334,344 | | | | 0.5 | | 9,840 | |
| United Technologies Corp. | | | | | 167,820 | | | | 0.5 | | 11,029 | |
| Other Securities | | | | | 1,239,207 | | | | 3.5 | | 73,327 | |
| | | | | | | | | | 8.4 | | 174,824 | |
Commercial Services & Supplies 0.6% |
| Other Securities | | | | | 317,444 | | | | 0.6 | | 11,659 | |
Consumer Durables & Apparel 1.2% |
| Other Securities | | | | | 588,960 | | | | 1.2 | | 24,479 | |
Consumer Services 1.8% |
| Other Securities | | | | | 961,616 | | | | 1.8 | | 37,693 | |
Diversified Financials 10.3% |
| American Express Co. | | | | | 203,021 | | | | 0.6 | | 11,737 | |
Bank of America Corp. (b) | | | | | 752,276 | | | | 1.9 | | 40,525 | |
Citigroup, Inc. (b) | | | | | 820,551 | | | | 2.0 | | 41,159 | |
| JPMorgan Chase & Co. | | | | | 577,849 | | | | 1.3 | | 27,413 | |
| Merrill Lynch & Co., Inc. | | | | | 147,141 | | | | 0.6 | | 12,863 | |
| Morgan Stanley | | | | | 177,941 | | | | 0.7 | | 13,600 | |
The Charles Schwab Corp. (c) | | | | | 171,623 | | | | 0.2 | | 3,127 | |
The Goldman Sachs Group, Inc. (a) | | | | | 71,694 | | | | 0.7 | | 13,607 | |
| Other Securities | | | | | 847,484 | | | | 2.3 | | 49,403 | |
| | | | | | | | | | 10.3 | | 213,434 | |
Energy 9.3% |
| ChevronTexaco Corp. | | | | | 363,287 | | | | 1.2 | | 24,413 | |
| ConocoPhillips | | | | | 271,861 | | | | 0.8 | | 16,377 | |
Exxon Mobil Corp. (b) | | | | | 986,722 | | | | 3.4 | | 70,472 | |
Schlumberger Ltd. (a) | | | | | 196,488 | | | | 0.6 | | 12,394 | |
| Other Securities | | | | | 1,539,837 | | | | 3.3 | | 70,920 | |
| | | | | | | | | | 9.3 | | 194,576 | |
Food & Staples Retailing 2.2% |
Wal-Mart Stores, Inc. (b) | | | | | 405,276 | | | | 0.9 | | 19,972 | |
| Other Securities | | | | | 732,121 | | | | 1.3 | | 26,665 | |
| | | | | | | | | | 2.2 | | 46,637 | |
Food, Beverage & Tobacco 4.7% |
Altria Group, Inc. (b) | | | | | 347,476 | | | | 1.4 | | 28,260 | |
| PepsiCo, Inc. | | | | | 273,595 | | | | 0.8 | | 17,357 | |
| The Coca-Cola Co. | | | | | 338,214 | | | | 0.8 | | 15,801 | |
| Other Securities | | | | | 972,639 | | | | 1.7 | | 37,004 | |
| | | | | | | | | | 4.7 | | 98,422 | |
Health Care Equipment & Services 4.1% |
| UnitedHealth Group, Inc. | | | | | 223,590 | | | | 0.5 | | 10,907 | |
| Other Securities | | | | | 1,627,970 | | | | 3.6 | | 74,648 | |
| | | | | | | | | | 4.1 | | 85,555 | |
Household & Personal Products 2.4% |
| Procter & Gamble Co. | | | | | 526,953 | | | | 1.6 | | 33,403 | |
| Other Securities | | | | | 294,273 | | | | 0.8 | | 15,889 | |
| | | | | | | | | | 2.4 | | 49,292 | |
30 See financial notes.
Schwab Institutional Select S&P 500 Fund
Portfolio Holdings continued
Security and Number of Shares
| | % of Net
Assets
| | Value
($ x 1,000)
|
|---|
Insurance 4.7% |
American International
Group, Inc. | | | | | 431,354 | | | | 1.4 | | 28,974 | |
| Other Securities | | | | | 1,410,985 | | | | 3.3 | | 69,802 | |
| | | | | | | | | | 4.7 | | 98,776 | |
Materials 3.0% |
| Other Securities | | | | | 1,310,227 | | | | 3.0 | | 61,632 | |
Media 3.4% |
Comcast Corp.,
Class A (a)(b)* | | | | | 347,379 | | | | 0.7 | | 14,128 | |
| The Walt Disney Co. | | | | | 348,799 | | | | 0.5 | | 10,973 | |
Time Warner, Inc. (a) | | | | | 675,004 | | | | 0.7 | | 13,507 | |
| Other Securities | | | | | 1,033,032 | | | | 1.5 | | 33,320 | |
| | | | | | | | | | 3.4 | | 71,928 | |
Pharmaceuticals & Biotechnology 8.1% |
Abbott Laboratories (b) | | | | | 253,614 | | | | 0.6 | | 12,049 | |
Amgen, Inc. (b)* | | | | | 194,310 | | | | 0.7 | | 14,750 | |
| Johnson & Johnson | | | | | 486,334 | | | | 1.6 | | 32,779 | |
| Merck & Co., Inc. | | | | | 362,967 | | | | 0.8 | | 16,486 | |
Pfizer, Inc. (b) | | | | | 1,212,987 | | | | 1.6 | | 32,326 | |
| Wyeth | | | | | 223,309 | | | | 0.6 | | 11,395 | |
| Other Securities | | | | | 1,270,471 | | | | 2.2 | | 49,173 | |
| | | | | | | | | | 8.1 | | 168,958 | |
Real Estate 1.2% |
| Other Securities | | | | | 397,606 | | | | 1.2 | | 24,156 | |
Retailing 3.7% |
| Home Depot, Inc. | | | | | 337,022 | | | | 0.6 | | 12,581 | |
| Other Securities | | | | | 1,618,260 | | | | 3.1 | | 63,585 | |
| | | | | | | | | | 3.7 | | 76,166 | |
Semiconductors & Semiconductor Equipment 2.6% |
Intel Corp. (b) | | | | | 957,272 | | | | 0.9 | | 20,428 | |
| Other Securities | | | | | 1,417,797 | | | | 1.7 | | 34,779 | |
| | | | | | | | | | 2.6 | | 55,207 | |
Software & Services 5.4% |
Google, Inc., Class A (a)* | | | | | 35,263 | | | | 0.8 | | 16,799 | |
Microsoft Corp. (b) | | | | | 1,433,501 | | | | 2.0 | | 41,156 | |
| Oracle Corp.* | | | | | 669,403 | | | | 0.6 | | 12,364 | |
| Other Securities | | | | | 1,469,060 | | | | 2.0 | | 41,827 | |
| | | | | | | | | | 5.4 | | 112,146 | |
Technology Hardware & Equipment 6.8% |
Apple Computer, Inc. (a)* | | | | | 141,159 | | | | 0.6 | | 11,445 | |
Cisco Systems, Inc. (b)* | | | | | 1,013,155 | | | | 1.2 | | 24,447 | |
| Hewlett-Packard Co. | | | | | 456,585 | | | | 0.9 | | 17,688 | |
| International Business Machines Corp. | | | | | 253,427 | | | | 1.1 | | 23,399 | |
| QUALCOMM, Inc. | | | | | 274,179 | | | | 0.5 | | 9,977 | |
| Other Securities | | | | | 3,833,997 | | | | 2.5 | | 54,338 | |
| | | | | | | | | | 6.8 | | 141,294 | |
Telecommunication Services 3.5% |
AT&T Corp. (a) | | | | | 644,616 | | | | 1.1 | | 22,078 | |
| BellSouth Corp. | | | | | 301,323 | | | | 0.6 | | 13,590 | |
| Verizon Communications, Inc. | | | | | 481,086 | | | | 0.9 | | 17,800 | |
| Other Securities | | | | | 1,030,088 | | | | 0.9 | | 19,276 | |
| | | | | | | | | | 3.5 | | 72,744 | |
Transportation 1.8% |
United Parcel Service, Inc., Class B (a) | | | | | 179,457 | | | | 0.7 | | 13,522 | |
| Other Securities | | | | | 445,794 | | | | 1.1 | | 23,353 | |
| | | | | | | | | | 1.8 | | 36,875 | |
Utilities 3.4% |
| Other Securities | | | | | 1,691,328 | | | | 3.4 | | 70,301 | |
Security
Rate, Maturity Date
| | | | Face
Amount
($ x 1,000)
| | % of Net
Assets
| Value
($ x 1,000)
| |
|---|
Short-Term Investment 0.6% of net assets |
JP Morgan, Grand Cayman Time Deposit
4.71%, 11/01/06 | | | | | 11,977 | | | | 0.6 | | 11,977 | |
U.S. Treasury Obligation 0.2% of net assets |
| Other Securities | | | | | 3,300 | | | | 0.2 | | 3,282 | |
Security and Number of Shares
| | % of Net
Assets
| | Value
($ x 1,000)
|
|---|
Warrants 0.0% of net assets |
| Other Securities | | | | | 11,390 | | | | | — | | | 2 | |
See financial notes. 31
Schwab Institutional Select S&P 500 Fund
Portfolio Holdings continued
Security
Rate, Maturity Date
| | | | Face Amount
($ x 1,000)
| | Value
($ x 1,000)
|
|---|
Collateral Invested for Securities on Loan 7.8% of net assets
|
| Securities Lending Investment Fund, a series of the Brown Brothers Investment Trust | | | | | 162,875,434 | | | | 162,875 | |
End of collateral invested for securities on loan.At 10/31/06 the tax basis cost of the fund’s investments was $1,840,898, and the unrealized appreciation and depreciation were $272,607 and ($40,526), respectively, with a net unrealized appreciation of $232,081.
In addition to the above, the fund held the following at 10/31/06. All numbers are x1,000 except number of futures contracts.
| | Number of
Contracts
| | Contract
Value
| | Unrealized
Gains
|
|---|
|
| S&P 500 Index, e-mini, Long, expires 12/15/06 | | | 177 | | | | 12,241 | | | | 276 | |
| S&P 500 Index, Long, expires 12/14/06 | | | 20 | | | | 6,916 | | | | 31 | |
| | | | | | | | | | | | 307 | |
| * | | Non-income producing security. |
(a) | | All or a portion of security is on loan. |
(b) | | All or a portion of this security is held as collateral for open futures contracts. |
(c) | | Issuer is affiliated with the fund’s adviser. |
32 See financial notes.
Schwab Institutional Select S&P 500 Fund
Statement of
Assets and Liabilities
As of October 31, 2006. All numbers x 1,000 except NAV.
Assets | | | | | | |
| Investments, at value including securities on loan of $159,574 (cost $1,828,084) | | | | $ | 2,072,979 | |
| Collateral invested for securities on loan | | | | | 162,875 | |
Receivables:
| | | | | | |
| Fund shares sold | | | | | 7,132 | |
| Dividends | | | | | 1,712 | |
| Income from securities on loan | | | | | 9 | |
| Interest | | | | | 1 | |
| Prepaid expenses | | | | + | 12 | |
Total assets | | | | | 2,244,720 | |
| |
Liabilities | | | | | | |
| Collateral for securities on loan | | | | | 162,875 | |
Payables:
| | | | | | |
| Investments bought | | | | | 906 | |
| Transfer agent and shareholder service fees | | | | | 17 | |
| Fund shares redeemed | | | | | 410 | |
| Trustee fees | | | | | 2 | |
| Accrued expenses | | | | + | 130 | |
Total liabilities | | | | | 164,340 | |
| |
Net Assets | | | | | | |
Total assets | | | | | 2,244,720 | |
Total liabilities | | | | – | 164,340 | |
Net assets | | | | $ | 2,080,380 | |
| |
Net Assets by Source | | | | | | |
| Capital received from investors | | | | | 1,872,353 | |
| Net investment income not yet distributed | | | | | 24,468 | |
| Net realized capital losses | | | | | (61,643 | ) |
| Net unrealized capital gains | | | | | 245,202 | |
| | | | | | | |
Net Asset Value (NAV) | | | | | | |
| Net Assets | | | | ÷
| | Shares
Outstanding
| | =
| | NAV
|
|---|
| $2,080,380 | | | | | | | | | 189,370 | | | | | | | $ | 10.99 | |
See financial notes. 33
Schwab Institutional Select S&P 500 Fund
Statement of
Operations
For November 1, 2005 through October 31, 2006. All numbers x 1,000.
Investment Income | | | | | | |
| Dividends (including $3 from affiliated issuer) | | | | $ | 29,778 | |
| Interest | | | | | 1,339 | |
| Securities on loan | | | | + | 79 | |
Total Investment Income | | | | | 31,196 | |
| |
Net Realized Gains and Losses | | | | | | |
| Net realized losses on investments | | | | | (9,622 | ) |
| Net realized losses on futures contracts | | | | + | (15 | ) |
Net realized losses | | | | | (9,637 | ) |
| |
Net Unrealized Gains and Losses | | | | | | |
| Net unrealized gains on investments | | | | | 226,651 | |
| Net unrealized gains on futures contracts | | | | + | 403 | |
Net unrealized gains | | | | | 227,054 | |
| |
Expenses | | | | | | |
| Investment adviser and administrator fees | | | | | 2,577 | |
| Transfer agent and shareholder service fees | | | | | 1,491 | |
| Registration fees | | | | | 106 | |
| Portfolio accounting fees | | | | | 83 | |
| Custodian fees | | | | | 72 | |
| Shareholder reports | | | | | 63 | |
| Professional fees | | | | | 35 | |
| Trustees’ fees | | | | | 15 | |
| Overdraft expense | | | | | 5 | |
| Other expenses | | | | + | 29 | |
| Total expenses | | | | | 4,476 | |
| Expense reduction by adviser and Schwab | | | | – | 2,863 | |
Net expenses | | | | | 1,613 | |
| |
Increase in Net Assets from Operations | | | | | | |
Total investment income | | | | | 31,196 | |
Net expenses | | | | – | 1,613 | |
Net investment income | | | | | 29,583 | |
Net realized losses | | | | | (9,637 | ) |
Net unrealized gains | | | | + | 227,054 | |
Increase in net assets from operations | | | | $ | 247,000 | |
34 See financial notes.
Schwab Institutional Select S&P 500 Fund
Statements of
Changes in Net Assets
For the current and prior report periods. All numbers x 1,000.
| | | | 11/1/05–10/31/06
| | 11/1/04–10/31/05
|
|---|
| Net investment income | | | | $ | 29,583 | | | $ | 15,535 | |
| Net realized losses | | | | | (9,637 | ) | | | (626 | ) |
| Net unrealized gains | | | | + | 227,054 | | | | 24,327 | |
Increase in net assets from operations | | | | | 247,000 | | | | 39,236 | |
| |
Distributions Paid | | | | | | | | | | |
| Dividends from net investment income | | | | $ | 18,248 | | | $ | 6,241 | |
Transactions in Fund Shares | | | | | | | | | | | | | | | | | | |
| | | | 11/1/05–10/31/06
| | 11/1/04–10/31/05
| |
|---|
| | | | SHARES
| | VALUE
| | SHARES
| | VALUE
|
|---|
| Shares Sold | | | | | 85,032 | | | $ | 868,441 | | | | 102,956 | | | $ | 975,330 | * |
| Shares Reinvested | | | | | 1,660 | | | | 16,500 | | | | 537 | | | | 4,985 | |
| Shares Redeemed | | | | + | (27,532 | ) | | | (279,438 | ) | | | (12,169 | ) | | | (115,050 | ) |
Net transactions in fund shares | | | | | 59,160 | | | $ | 605,503 | | | | 91,324 | | | $ | 865,265 | |
Shares Outstanding and Net Assets | | | | | | | | | | | | | | | | | | |
| | | | 11/1/05–10/31/06
| | 11/1/04–10/31/05
| |
|---|
| | | | SHARES
| | NET ASSETS
| | SHARES
| | NET ASSETS
|
|---|
| Beginning of period | | | | | 130,210 | | | $ | 1,246,125 | | | | 38,886 | | | $ | 347,865 | |
| Total increase | | | | + | 59,160 | | | | 834,255 | | | | 91,324 | | | | 898,260 | |
End of period | | | | | 189,370 | | | $ | 2,080,380 | | | | 130,210 | | | $ | 1,246,125 | |
Net investment income not yet distributed | | | | | | | | $ | 24,468 | | | | | | | $ | 13,237 | |
| * | | Includes $430,561 subscription by Schwab MarketTrack All Equity, Growth and Balanced Portfolios. |
See financial notes. 35
Schwab 1000 Index® Fund
Financial Statements
Financial Highlights
Investor Shares
| | | | 11/1/05—
10/31/06
| | 11/1/04—
10/31/05
| | 11/1/03—
10/31/04
| | 11/1/02—
10/31/03
| | 11/1/01—
10/31/02
|
|---|
Per-Share Data ($) | | | | | | | | | | | | | | | | | | | | | | |
| Net asset value at beginning of period | | | | | 35.31 | | | | 32.54 | | | | 30.25 | | | | 25.25 | | | | 29.57 | |
Income or loss from investment operations:
| | | | | | | | | | | | | | | | | | | | | | |
| Net investment income | | | | | 0.50 | 1 | | | 0.55 | | | | 0.37 | | | | 0.33 | | | | 0.31 | |
| Net realized and unrealized gains or losses | | | | | 5.05 | 1 | | | 2.70 | | | | 2.26 | | | | 4.99 | | | | (4.36 | ) |
| Total income or loss from investment operations | | | | | 5.55 | | | | 3.25 | | | | 2.63 | | | | 5.32 | | | | (4.05 | ) |
Less distributions:
| | | | | | | | | | | | | | | | | | | | | | |
| Dividends from net investment income | | | | | (0.46 | ) | | | (0.48 | ) | | | (0.34 | ) | | | (0.32 | ) | | | (0.27 | ) |
| Net asset value at end of period | | | | | 40.40 | | | | 35.31 | | | | 32.54 | | | | 30.25 | | | | 25.25 | |
| Total return (%) | | | | | 15.84 | | | | 10.04 | | | | 8.78 | | | | 21.34 | | | | (13.87 | ) |
| |
Ratios/Supplemental Data (%) | | | | | | | | | | | | | | | | | | | | | | |
Ratios to average net assets:
| | | | | | | | | | | | | | | | | | | | | | |
| Net operating expenses | | | | | 0.49 | | | | 0.50 | | | | 0.50 | | | | 0.49 | | | | 0.46 | |
| Gross operating expenses | | | | | 0.49 | | | | 0.50 | | | | 0.50 | | | | 0.51 | | | | 0.52 | |
| Net investment income | | | | | 1.34 | | | | 1.49 | | | | 1.15 | | | | 1.27 | | | | 1.04 | |
| Portfolio turnover rate | | | | | 5 | | | | 6 | | | | 5 | | | | 5 | | | | 9 | |
| Net assets, end of period ($ x 1,000,000) | | | | | 3,918 | | | | 4,166 | | | | 4,258 | | | | 3,974 | | | | 3,223 | |
Select Shares
| | | | 11/1/05—
10/31/06
| | 11/1/04—
10/31/05
| | 11/1/03—
10/31/04
| | 11/2/02—
10/31/03
| | 11/1/01—
10/31/02
|
|---|
Per-Share Data ($) | | | | | | | | | | | | | | | | | | | | | | |
| Net asset value at beginning of period | | | | | 35.34 | | | | 32.56 | | | | 30.27 | | | | 25.26 | | | | 29.58 | |
Income or loss from investment operations:
| | | | | | | | | | | | | | | | | | | | | | |
| Net investment income | | | | | 0.56 | 1 | | | 0.56 | | | | 0.42 | | | | 0.37 | | | | 0.35 | |
| Net realized and unrealized gains or losses | | | | | 5.04 | 1 | | | 2.74 | | | | 2.25 | | | | 4.99 | | | | (4.36 | ) |
| Total income or loss from investment operations | | | | | 5.60 | | | | 3.30 | | | | 2.67 | | | | 5.36 | | | | (4.01 | ) |
Less distributions:
| | | | | | | | | | | | | | | | | | | | | | |
| Dividends from net investment income | | | | | (0.51 | ) | | | (0.52 | ) | | | (0.38 | ) | | | (0.35 | ) | | | (0.31 | ) |
| Net asset value at end of period | | | | | 40.43 | | | | 35.34 | | | | 32.56 | | | | 30.27 | | | | 25.26 | |
| Total return (%) | | | | | 16.01 | | | | 10.21 | | | | 8.90 | | | | 21.52 | | | | (13.77 | ) |
| |
Ratios/Supplemental Data (%) | | | | | | | | | | | | | | | | | | | | | | |
Ratios to average net assets:
| | | | | | | | | | | | | | | | | | | | | | |
| Net operating expenses | | | | | 0.34 | | | | 0.35 | | | | 0.35 | | | | 0.35 | | | | 0.35 | |
| Gross operating expenses | | | | | 0.34 | | | | 0.35 | | | | 0.35 | | | | 0.36 | | | | 0.37 | |
| Net investment income | | | | | 1.48 | | | | 1.63 | | | | 1.30 | | | | 1.41 | | | | 1.15 | |
| Portfolio turnover rate | | | | | 5 | | | | 6 | | | | 5 | | | | 5 | | | | 9 | |
| Net assets, end of period ($ x 1,000,000) | | | | | 2,924 | | | | 2,328 | | | | 2,138 | | | | 1,996 | | | | 1,588 | |
1 | | Calculated based on the average shares outstanding during the period. |
36 See financial notes.
Schwab 1000 Index Fund
Portfolio Holdings as of October 31, 2006
This section shows the fund’s 50 largest portfolio holdings in unaffiliated issuers and any holdings exceeding 1% of the fund’s total net assets as of the report date. The remaining securities held by the fund are grouped as “Other Securities” in each category. You can request a complete schedule of portfolio holdings as of the report date, free of charge, by calling Schwab Funds® at 1-800-435-4000. This complete schedule, filed on the fund’s Form N-CSR, is also available on the SEC’s website at http://www.sec.gov.
In addition, the fund files its complete schedule of portfolio holdings with the SEC for the first and third quarters of each fiscal year on Form N-Q. The fund’s Form N-Q is available on the SEC’s website and may be viewed and copied at the SEC’s Public Reference Room in Washington, D.C. Call 1-800-SEC-0330 for information on the operation of the Public Reference Room. A copy of the fund’s most recently filed quarterly schedule of portfolio holdings, included on the fund’s Form N-CSR (with respect to the fund’s second and fourth fiscal quarters) or Form N-Q (with respect to the fund’s first and third fiscal quarters), is available by visiting Schwab’s website at www.schwab.com/schwabfunds.
Holdings by Category
|
| Cost
($ x 1,000)
|
| Value
($ x 1,000)
|
|---|
| 99.7% | | | | Common Stock | | | 3,188,068 | | | | 6,819,942 | |
| 0.1% | | | | Foreign Common Stock | | | 4,103 | | | | 6,923 | |
| —% | | | | U.S. Treasury Obligation | | | 795 | | | | 795 | |
| —% | | | | Warrant | | | — | | | | 197 | |
| 99.8% | | | | Total Investments | | | 3,192,966 | | | | 6,827,857 | |
| 3.2% | | | | Collateral Invested for Securities on Loan | | | 220,793 | | | | 220,793 | |
| (3.0)% | | | | Other Assets and Liabilities, Net | | | | | | | (207,045 | ) |
| 100.0% | | | | Net Assets | | | | | | | 6,841,605 | |
Security and Number of Shares
| | % of Net
Assets
| | Value
($ x 1,000)
|
|---|
Common Stock 99.7% of net assets |
Automobiles & Components 0.5% |
| Other Securities | | | | | 1,535,296 | | | | 0.5 | | 36,204 | |
Banks 5.4% |
| U.S. Bancorp | | | | | 821,655 | | | | 0.4 | | 27,805 | |
| Wachovia Corp. | | | | | 881,989 | | | | 0.7 | | 48,950 | |
| Wells Fargo & Co. | | | | | 1,491,396 | | | | 0.8 | | 54,123 | |
| Other Securities | | | | | 5,588,273 | | | | 3.5 | | 238,029 | |
| | | | | | | | | | 5.4 | | 368,907 | |
Capital Goods 8.0% |
General Electric Co. (b) | | | | | 4,723,322 | | | | 2.4 | | 165,836 | |
| The Boeing Co. | | | | | 369,989 | | | | 0.4 | | 29,547 | |
| United Technologies Corp. | | | | | 464,763 | | | | 0.5 | | 30,544 | |
| Other Securities | | | | | 5,935,472 | | | | 4.7 | | 319,810 | |
| | | | | | | | | | 8.0 | | 545,737 | |
Commercial Services & Supplies 0.8% |
| Other Securities | | | | | 1,431,572 | | | | 0.8 | | 54,633 | |
Consumer Durables & Apparel 1.3% |
| Other Securities | | | | | 2,014,165 | | | | 1.3 | | 88,983 | |
Consumer Services 2.1% |
| Other Securities | | | | | 3,437,944 | | | | 2.1 | | 142,169 | |
Diversified Financials 9.3% |
American Express Co. (b) | | | | | 564,077 | | | | 0.5 | | 32,609 | |
Bank of America Corp. (b) | | | | | 2,111,568 | | | | 1.7 | | 113,750 | |
| Citigroup, Inc. | | | | | 2,255,962 | | | | 1.7 | | 113,159 | |
| JPMorgan Chase & Co. | | | | | 1,584,338 | | | | 1.1 | | 75,161 | |
| Merrill Lynch & Co., Inc. | | | | | 414,062 | | | | 0.5 | | 36,197 | |
| Morgan Stanley | | | | | 488,648 | | | | 0.6 | | 37,347 | |
The Charles Schwab
Corp. (b)(c) | | | | | 579,415 | | | | 0.2 | | 10,557 | |
The Goldman Sachs
Group, Inc. | | | | | 195,032 | | | | 0.5 | | 37,015 | |
| Other Securities | | | | | 3,365,841 | | | | 2.5 | | 182,942 | |
| | | | | | | | | | 9.3 | | 638,737 | |
Energy 8.8% |
| ChevronTexaco Corp. | | | | | 1,001,377 | | | | 1.0 | | 67,293 | |
| ConocoPhillips | | | | | 739,016 | | | | 0.7 | | 44,518 | |
| Exxon Mobil Corp. | | | | | 2,732,622 | | | | 2.9 | | 195,164 | |
| Schlumberger Ltd. | | | | | 539,906 | | | | 0.5 | | 34,057 | |
| Other Securities | | | | | 5,854,566 | | | | 3.7 | | 258,509 | |
| | | | | | | | | | 8.8 | | 599,541 | |
Food & Staples Retailing 2.3% |
Wal-Mart Stores, Inc. (b) | | | | | 1,856,777 | | | | 1.3 | | 91,502 | |
| Other Securities | | | | | 1,915,384 | | | | 1.0 | | 69,625 | |
| | | | | | | | | | 2.3 | | 161,127 | |
Food, Beverage & Tobacco 4.9% |
Altria Group, Inc. (b) | | | | | 929,615 | | | | 1.1 | | 75,606 | |
| PepsiCo, Inc. | | | | | 739,687 | | | | 0.7 | | 46,926 | |
| The Coca-Cola Co. | | | | | 1,077,204 | | | | 0.7 | | 50,327 | |
| Other Securities | | | | | 4,341,835 | | | | 2.4 | | 161,124 | |
| | | | | | | | | | 4.9 | | 333,983 | |
Health Care Equipment & Services 4.2% |
| UnitedHealth Group, Inc. | | | | | 628,712 | | | | 0.5 | | 30,669 | |
| Other Securities | | | | | 5,725,014 | | | | 3.7 | | 255,884 | |
| | | | | | | | | | 4.2 | | 286,553 | |
Household & Personal Products 2.1% |
Procter & Gamble Co. (b) | | | | | 1,476,519 | | | | 1.4 | | 93,597 | |
| Other Securities | | | | | 908,332 | | | | 0.7 | | 48,698 | |
| | | | | | | | | | 2.1 | | 142,295 | |
See financial notes. 37
Schwab 1000 Index Fund
Portfolio Holdings continued
Security and Number of Shares
| | % of Net
Assets
| | Value
($ x 1,000)
|
|---|
Insurance 6.1% |
American International
Group, Inc. (b) | | | | | 1,164,836 | | | | 1.2 | | 78,242 | |
| Berkshire Hathaway, Inc., Class A * | | | | | 697 | | | | 1.1 | | 73,516 | |
| Other Securities | | | | | 5,488,671 | | | | 3.8 | | 262,874 | |
| | | | | | | | | | 6.1 | | 414,632 | |
Materials 3.0% |
| Other Securities | | | | | 4,990,980 | | | | 3.0 | | 209,335 | |
Media 4.0% |
| Comcast Corp., Class A * | | | | | 989,202 | | | | 0.6 | | 40,231 | |
| News Corp., Class A | | | | | 1,461,928 | | | | 0.5 | | 30,481 | |
| The Walt Disney Co. | | | | | 880,202 | | | | 0.4 | | 27,691 | |
| Time Warner, Inc. | | | | | 2,104,701 | | | | 0.6 | | 42,115 | |
| Other Securities | | | | | 4,273,721 | | | | 1.9 | | 132,843 | |
| | | | | | | | | | 4.0 | | 273,361 | |
Pharmaceuticals & Biotechnology 7.7% |
Abbott Laboratories (b) | | | | | 686,146 | | | | 0.5 | | 32,599 | |
Amgen, Inc. (b)* | | | | | 549,660 | | | | 0.6 | | 41,725 | |
| Eli Lilly & Co. | | | | | 511,171 | | | | 0.4 | | 28,631 | |
| Genentech, Inc. * | | | | | 466,519 | | | | 0.6 | | 38,861 | |
| Johnson & Johnson | | | | | 1,341,617 | | | | 1.3 | | 90,425 | |
| Merck & Co., Inc. | | | | | 1,002,785 | | | | 0.7 | | 45,546 | |
| Pfizer, Inc. | | | | | 3,337,510 | | | | 1.3 | | 88,945 | |
| Wyeth | | | | | 598,983 | | | | 0.5 | | 30,566 | |
| Other Securities | | | | | 3,697,687 | | | | 1.8 | | 133,345 | |
| | | | | | | | | | 7.7 | | 530,643 | |
Real Estate 2.2% |
| Other Securities | | | | | 2,969,531 | | | | 2.2 | | 148,505 | |
Retailing 3.5% |
| Home Depot, Inc. | | | | | 936,295 | | | | 0.5 | | 34,952 | |
| Other Securities | | | | | 5,287,653 | | | | 3.0 | | 206,820 | |
| | | | | | | | | | 3.5 | | 241,772 | |
Semiconductors & Semiconductor Equipment 2.6% |
| Intel Corp. | | | | | 2,613,230 | | | | 0.8 | | 55,766 | |
| Other Securities | | | | | 5,234,006 | | | | 1.8 | | 123,074 | |
| | | | | | | | | | 2.6 | | 178,840 | |
Software & Services 6.5% |
| Google, Inc., Class A * | | | | | 131,796 | | | | 0.9 | | 62,786 | |
Microsoft Corp. (b) | | | | | 4,638,788 | | | | 2.0 | | 133,180 | |
| Oracle Corp. * | | | | | 2,388,510 | | | | 0.7 | | 44,116 | |
| Other Securities | | | | | 7,048,761 | | | | 2.9 | | 203,191 | |
| | | | | | | | | | 6.5 | | 443,273 | |
Technology Hardware & Equipment 6.1% |
Apple Computer, Inc. (b)* | | | | | 377,914 | | | | 0.5 | | 30,641 | |
| Cisco Systems, Inc. * | | | | | 2,792,515 | | | | 1.0 | | 67,383 | |
| Hewlett-Packard Co. | | | | | 1,269,818 | | | | 0.7 | | 49,193 | |
| International Business Machines Corp. | | | | | 710,390 | | | | 1.0 | | 65,590 | |
| Other Securities | | | | | 12,316,093 | | | | 2.9 | | 204,141 | |
| | | | | | | | | | 6.1 | | 416,948 | |
Telecommunication Services 3.2% |
AT&T Corp. (b) | | | | | 1,751,248 | | | | 0.9 | | 59,980 | |
| BellSouth Corp. | | | | | 816,966 | | | | 0.6 | | 36,845 | |
| Verizon Communications, Inc. | | | | | 1,318,737 | | | | 0.7 | | 48,793 | |
| Other Securities | | | | | 3,606,275 | | | | 1.0 | | 71,297 | |
| | | | | | | | | | 3.2 | | 216,915 | |
Transportation 1.8% |
| United Parcel Service, Inc., Class B | | | | | 491,025 | | | | 0.6 | | 36,999 | |
| Other Securities | | | | | 1,854,278 | | | | 1.2 | | 85,702 | |
| | | | | | | | | | 1.8 | | 122,701 | |
Utilities 3.3% |
| Other Securities | | | | | 5,489,950 | | | | 3.3 | | 224,148 | |
| | | | | | | | | | | |
Foreign Common Stock 0.1% of net assets |
Canada 0.0% |
Consumer Services 0.0% |
| Other Securities | | | | | 65,374 | | | | — | | 1,889 | |
Cayman Islands 0.1% |
Energy 0.1% |
| Other Securities | | | | | 96,995 | | | | 0.1 | | 5,034 | |
Security
Rate, Maturity Date
| | | | Face
Amount
($ x 1,000)
| | % of Net
Assets
| Value
($ x 1,000)
|
|---|
U.S. Treasury Obligation 0.0% of net assets |
| Other Securities | | | | | 800 | | | | — | | 795 |
| | | | | | | | | | | | |
Security and Number of Shares
| % of Net
Assets
| Value
($ x 1,000)
|
|---|
Warrant 0.0% of net assets |
| Other Securities | | | | | 12,506 | | | | — | | 197 |
38 See financial notes.
Schwab 1000 Index Fund
Portfolio Holdings continued
Security
| | Number of
Shares
| | Value
($ x 1,000)
|
|---|
Collateral Invested for Securities on Loan 3.2% of net assets |
State Street Navigator Security Lending
Prime Portfolio | | | 220,792,750 | | | | 220,793 | |
End of collateral invested for securities on loan.At 10/31/06 the tax basis cost of the fund’s investments was $3,195,255, and the unrealized appreciation and depreciation were $3,776,628 and ($144,026), respectively, with a net unrealized appreciation of $3,632,602.
In addition to the above, the fund held the following at 10/31/06. All numbers are x1,000 except number of futures contracts.
| | Number of
Contracts
| | Contract
Value
| | Unrealized
Gains
|
|---|
|
| S&P 500 Index, e-mini, Long, expires 12/15/06 | | | 70 | | | | 4,841 | | | | 189 | |
| * | | Non-income producing security. |
(a) | | All or a portion of this security is on loan. |
(b) | | All or a portion of this security is held as collateral for open futures contracts. |
(c) | | Issuer is affiliated with the fund’s adviser. |
See financial notes. 39
Schwab 1000 Index Fund
Statement of
Assets and Liabilities
As of October 31, 2006. All numbers x 1,000 except NAV.
Assets | | | | | | |
| Investments, at value including securities on loan of $215,554 (cost $3,192,966) | | | | $ | 6,827,857 | |
| Collateral invested for securities on loan | | | | | 220,793 | |
| Cash | | | | | 1,227 | |
Receivables:
| | | | | | |
| Investments sold | | | | | 6,322 | |
| Dividends | | | | | 5,388 | |
| Fund shares sold | | | | | 4,785 | |
| Income from securities on loan | | | | | 51 | |
| Prepaid expenses | | | | + | 40 | |
Total assets | | | | | 7,066,463 | |
| |
Liabilities | | | | | | |
| Collateral invested for securities on loan | | | | | 220,793 | |
Payables:
| | | | | | |
| Investments bought | | | | | 185 | |
| Investment adviser and administrator fees | | | | | 126 | |
| Transfer agent and shareholder services fees | | | | | 106 | |
| Fund shares redeemed | | | | | 3,362 | |
| Trustee fees | | | | | 4 | |
| Due to brokers for futures | | | | | 2 | |
| Accrued expenses | | | | + | 280 | |
Total liabilities | | | | | 224,858 | |
| |
Net Assets | | | | | | |
Total assets | | | | | 7,066,463 | |
Total liabilities | | | | – | 224,858 | |
Net assets | | | | $ | 6,841,605 | |
| |
Net Assets by Source | | | | | | |
| Capital received from investors | | | | | 3,446,994 | |
| Net investment income not yet distributed | | | | | 71,145 | |
| Net realized capital losses | | | | | (311,614 | ) |
| Net unrealized capital gains | | | | | 3,635,080 | |
| | | | | | | |
Net Asset Value (NAV) by Shares Class | | | | | | |
Share Class
| | | |
| | Net Assets
| | ÷
| | Shares
Outstanding
| | =
| NAV
| |
|---|
| Investor Shares | | | | | | | | $ | 3,917,627 | | | | | | | | 96,978 | | | | | | $40.40 | |
| Select Shares | | | | | | | | $ | 2,923,978 | | | | | | | | 72,324 | | | | | | $40.43 | |
40 See financial notes.
Schwab 1000 Index Fund
Statement of
Operations
For November 1, 2005 through October 31, 2006. All numbers x 1,000.
Investment Income | | | | | | |
| Dividends (including $75 from affiliated issuer and net of $6 foreign withholding tax) | | | | $ | 120,115 | |
| Interest | | | | | 451 | |
| Lending of securities | | | | + | 592 | |
Total Investment Income | | | | | 121,158 | |
| |
Net Realized Gains and Losses | | | | | | |
| Net realized gains on investments | | | | | 200,034 | |
| Net realized gains on futures contracts | | | | + | 561 | |
Net realized gains | | | | | 200,595 | |
| |
Net Unrealized Gains and Losses | | | | | | |
| Net unrealized gains on investments | | | | | 688,765 | |
| Net unrealized gains on futures contracts | | | | + | 197 | |
Net unrealized gains | | | | | 688,962 | |
| |
Expenses | | | | | | |
| Investment adviser and administrator fees | | | | | 14,671 | |
Transfer agent and shareholder service fees:
| | | | | | |
| Investor Shares | | | | | 10,247 | |
| Select Shares | | | | | 2,537 | |
| Shareholder reports | | | | | 380 | |
| Portfolio accounting fees | | | | | 271 | |
| Registration fees | | | | | 193 | |
| Custodian fees | | | | | 159 | |
| Professional fees | | | | | 65 | |
| Overdraft expense | | | | | 62 | |
| Trustees’ fees | | | | | 49 | |
| Other expenses | | | | + | 80 | |
| Total expenses | | | | | 28,714 | |
| Custody credit | | | | | –6 | |
Net expenses | | | | | 28,708 | |
| |
Increase in Net Assets from Operations | | | | | | |
Total investment income | | | | | 121,158 | |
Net expenses | | | | – | 28,708 | |
Net investment income | | | | | 92,450 | |
Net realized gains | | | | | 200,595 | |
Net unrealized gains | | | | + | 688,962 | |
Increase in net assets from operations | | | | $ | 982,007 | |
See financial notes. 41
Schwab 1000 Index Fund
Statements of
Changes in Net Assets
For the current and prior report periods. All numbers x 1,000.
| | | | 11/1/05–10/31/06
| | 11/1/04–10/31/05
|
|---|
| Net investment income | | | | $ | 92,450 | | | $ | 101,492 | |
| Net realized gains | | | | | 200,595 | | | | 45,444 | |
| Net unrealized gains | | | | + | 688,962 | | | | 485,599 | |
Increase in net assets from operations | | | | | 982,007 | | | | 632,535 | |
| |
Distributions Paid | | | | | | | | | | |
Dividends from net investment income | | | | | | | | | | |
| Investor Shares | | | | | 53,026 | | | | 61,678 | |
| Select Shares | | | | + | 33,855 | | | | 33,954 | |
Total dividends from net investment income | | | | $ | 86,881 | | | $ | 95,632 | |
Transactions in Fund Shares | | | | | | | | | | | | | | | | | | |
| | | | 11/1/05–10/31/06
| | 11/1/04–10/31/05
| |
|---|
| | | | SHARES
| | VALUE
| | SHARES
| | VALUE
|
|---|
Shares Sold | | | | | | | | | | | | | | | | | | |
| Investor Shares | | | | | 7,114 | | | $ | 266,698 | | | | 10,950 | | | $ | 375,768 | |
| Select Shares | | | | + | 17,151 | | | | 640,701 | | | | 11,316 | | | | 393,335 | |
Total shares sold | | | | | 24,265 | | | $ | 907,399 | | | | 22,266 | | | $ | 769,103 | |
| |
Shares Reinvested | | | | | | | | | | | | | | | | | | |
| Investor Shares | | | | | 1,329 | | | $ | 48,830 | | | | 1,674 | | | $ | 56,670 | |
| Select Shares | | | | + | 769 | | | | 28,221 | | | | 840 | | | | 28,419 | |
Total shares reinvested | | | | | 2,098 | | | $ | 77,051 | | | | 2,514 | | | $ | 85,089 | |
| |
Shares Redeemed | | | | | | | | | | | | | | | | | | |
| Investor Shares | | | | | (29,454 | ) | | $ | (1,101,605 | ) | | | (25,490 | ) | | $ | (881,852 | ) |
| Select Shares | | | | + | (11,469 | ) | | | (429,917 | ) | | | (11,930 | ) | | | (410,943 | ) |
Total shares redeemed | | | | | (40,923 | ) | | $ | (1,531,522 | ) | | | (37,420 | ) | | $ | (1,292,795 | ) |
| |
Net transactions in fund shares | | | | | (14,560 | ) | | $ | (547,072 | ) | | | (12,640 | ) | | $ | (438,603 | ) |
Shares Outstanding and Net Assets | | | | | | | | | | | | | | | | | | |
| | | | 11/1/05–10/31/06
| | 11/1/04–10/31/05
| |
|---|
| | | | SHARES
| | NET ASSETS
| | SHARES
| | NET ASSETS
|
|---|
| Beginning of period | | | | | 183,862 | | | $ | 6,493,551 | | | | 196,502 | | | $ | 6,395,251 | |
| Total increase or decrease | | | | + | (14,560 | ) | | | 348,054 | | | | (12,640 | ) | | | 98,300 | |
End of period | | | | | 169,302 | | | $ | 6,841,605 | | | | 183,862 | | | $ | 6,493,551 | |
Net investment income not yet distributed | | | | | | | | $ | 71,145 | | | | | | | $ | 67,176 | |
42 See financial notes.
Schwab Small-Cap Index Fund®
Financial Statements
Financial Highlights
Investor Shares
| | | | 11/1/05—
10/31/06
| | 11/1/04—
10/31/05
| | 11/1/03—
10/31/04
| | 11/1/02—
10/31/03
| | 11/1/01—
10/31/02
|
|---|
Per-Share Data ($) | | | | | | | | | | | | | | | | | | | | | | |
| Net asset value at beginning of period | | | | | 22.31 | | | | 19.92 | | | | 18.22 | | | | 13.27 | | | | 15.98 | |
| Income or loss from investment operations: | | | | | | | | | | | | | | | | | | | | | | |
| Net investment income | | | | | 0.23 | 1 | | | 0.14 | | | | 0.13 | | | | 0.11 | | | | 0.13 | |
| Net realized and unrealized gains or losses | | | | | 3.67 | 1 | | | 2.38 | | | | 1.68 | | | | 4.98 | | | | (2.17 | ) |
| Total income or loss from investment operations | | | | | 3.90 | | | | 2.52 | | | | 1.81 | | | | 5.09 | | | | (2.04 | ) |
| Less distributions: | | | | | | | | | | | | | | | | | | | | | | |
| Dividends from net investment income | | | | | (0.14 | ) | | | (0.13 | ) | | | (0.11 | ) | | | (0.14 | ) | | | (0.09 | ) |
| Distributions from net realized gains | | | | | (0.15 | ) | | | — | | | | — | | | | — | | | | (0.58 | ) |
| Total distributions | | | | | (0.29 | ) | | | (0.13 | ) | | | (0.11 | ) | | | (0.14 | ) | | | (0.67 | ) |
| Net asset value at end of period | | | | | 25.92 | | | | 22.31 | | | | 19.92 | | | | 18.22 | | | | 13.27 | |
| Total return (%) | | | | | 17.62 | | | | 12.66 | | | | 9.98 | | | | 38.72 | | | | (13.66 | ) |
| |
Ratios/Supplemental Data (%) | | | | | | | | | | | | | | | | | | | | | | |
| Ratios to average net assets: | | | | | | | | | | | | | | | | | | | | | | |
| Net operating expenses | | | | | 0.57 | | | | 0.58 | | | | 0.59 | | | | 0.56 | | | | 0.49 | |
| Gross operating expenses | | | | | 0.57 | | | | 0.58 | | | | 0.59 | | | | 0.60 | | | | 0.60 | |
| Net investment income | | | | | 0.94 | | | | 0.57 | | | | 0.66 | | | | 0.74 | | | | 0.77 | |
| Portfolio turnover rate | | | | | 29 | | | | 40 | | | | 39 | | | | 34 | | | | 44 | |
| Net assets, end of period ($ x 1,000,000) | | | | | 771 | | | | 823 | | | | 869 | | | | 886 | | | | 722 | |
Select Shares
| | | | 11/1/05—
10/31/06
| | 11/1/04—
10/31/05
| | 11/1/03—
10/31/04
| | 11/2/02—
10/31/03
| | 11/1/01—
10/31/02
|
|---|
Per-Share Data ($) | | | | | | | | | | | | | | | | | | | | | | |
| Net asset value at beginning of period | | | | | 22.36 | | | | 19.96 | | | | 18.25 | | | | 13.28 | | | | 16.00 | |
Income or loss from investment operations:
| | | | | | | | | | | | | | | | | | | | | | |
| Net investment income | | | | | 0.27 | 1 | | | 0.17 | | | | 0.17 | | | | 0.14 | | | | 0.14 | |
| Net realized and unrealized gains or losses | | | | | 3.67 | 1 | | | 2.39 | | | | 1.68 | | | | 4.99 | | | | (2.18 | ) |
| Total income or loss from investment operations | | | | | 3.94 | | | | 2.56 | | | | 1.85 | | | | 5.13 | | | | (2.04 | ) |
Less distributions:
| | | | | | | | | | | | | | | | | | | | | | |
| Dividends from net investment income | | | | | (0.18 | ) | | | (0.16 | ) | | | (0.14 | ) | | | (0.16 | ) | | | (0.10 | ) |
| Distributions from net realized gains | | | | | (0.15 | ) | | | — | | | | — | | | | — | | | | (0.58 | ) |
| Total distributions | | | | | (0.33 | ) | | | (0.16 | ) | | | (0.14 | ) | | | (0.16 | ) | | | (0.68 | ) |
| Net asset value at end of period | | | | | 25.97 | | | | 22.36 | | | | 19.96 | | | | 18.25 | | | | 13.28 | |
| Total return (%) | | | | | 17.78 | | | | 12.86 | | | | 10.16 | | | | 39.02 | | | | (13.62 | ) |
| |
Ratios/Supplemental Data (%) | | | | | | | | | | | | | | | | | | | | | | |
Ratios to average net assets:
| | | | | | | | | | | | | | | | | | | | | | |
| Net operating expenses | | | | | 0.42 | | | | 0.41 | | | | 0.42 | | | | 0.41 | | | | 0.38 | |
| Gross operating expenses | | | | | 0.42 | | | | 0.43 | | | | 0.44 | | | | 0.45 | | | | 0.45 | |
| Net investment income | | | | | 1.10 | | | | 0.74 | | | | 0.82 | | | | 0.89 | | | | 0.88 | |
| Portfolio turnover rate | | | | | 29 | | | | 40 | | | | 39 | | | | 34 | | | | 44 | |
| Net assets, end of period ($ x 1,000,000) | | | | | 889 | | | | 795 | | | | 761 | | | | 759 | | | | 638 | |
1 | | Calculated based on the average shares outstanding during the period. |
See financial notes. 43
Schwab Small-Cap Index Fund
Portfolio Holdings as of October 31, 2006
This section shows the fund’s 50 largest portfolio holdings in unaffiliated issuers and any holdings exceeding 1% of the fund’s total net assets as of the report date. The remaining securities held by the fund are grouped as “Other Securities” in each category. You can request a complete schedule of portfolio holdings as of the report date, free of charge, by calling Schwab Funds® at 1-800-435-4000. This complete schedule, filed on the fund’s Form N-CSR, is also available on the SEC’s website at http://www.sec.gov.
In addition, the fund files its complete schedule of portfolio holdings with the SEC for the first and third quarters of each fiscal year on Form N-Q. The fund’s Form N-Q is available on the SEC’s website at http://www.sec.gov and may be viewed and copied at the SEC’s Public Reference Room in Washington, D.C. Call 1-800-SEC-0330 for information on the operation of the Public Reference Room. The schedule of portfolio holdings filed on a fund’s most recent Form N-Q is also available by visiting Schwab’s website at www.schwab.com/schwabfunds.
Holdings by Category
|
| Cost
($ x 1,000)
|
| Value
($ x 1,000)
|
|---|
99.7% | | | | Common Stock | | | 1,241,488 | | | | 1,654,700 | |
0.2% | | | | Short-Term Investment | | | 3,156 | | | | 3,156 | |
—% | | | | U.S. Treasury Obligation | | | 679 | | | | 681 | |
99.9% | | | | Total Investments | | | 1,245,323 | | | | 1,658,537 | |
15.2% | | | | Collateral Invested for Securities on Loan | | | 251,338 | | | | 251,338 | |
(15.1)% | | | | Other Assets and Liabilities, Net | | | | | | | (250,387 | ) |
100.0% | | | | Net Assets | | | | | | | 1,659,488 | |
Security and Number of Shares
| | % of Net
Assets
| | Value
($ x 1,000)
|
|---|
Common Stock 99.7% of net assets |
Automobiles & Components 0.9% |
| Other Securities | | | | | 714,117 | | | | 0.9 | | 15,228 | |
Banks 8.1% |
| Other Securities | | | | | 5,368,264 | | | | 8.1 | | 134,607 | |
Capital Goods 7.8% |
| Acuity Brands, Inc. | | | | | 66,532 | | | | 0.2 | | 3,296 | |
| AGCO Corp. * | | | | | 125,945 | | | | 0.2 | | 3,369 | |
| Genlyte Group, Inc. * | | | | | 41,815 | | | | 0.2 | | 3,231 | |
| Lincoln Electric Holdings, Inc. | | | | | 57,525 | | | | 0.2 | | 3,537 | |
| Quanta Services, Inc. * | | | | | 170,136 | | | | 0.2 | | 3,114 | |
| Other Securities | | | | | 3,577,814 | | | | 6.8 | | 113,473 | |
| | | | | | | | | | 7.8 | | 130,020 | |
Commercial Services & Supplies 3.8% |
| Corrections Corp. of America * | | | | | 81,973 | | | | 0.2 | | 3,745 | |
| IKON Office Solutions, Inc. | | | | | 209,821 | | | | 0.1 | | 3,128 | |
| Other Securities | | | | | 1,950,267 | | | | 3.5 | | 55,540 | |
| | | | | | | | | | 3.8 | | 62,413 | |
Consumer Durables & Apparel 3.6% |
Marvel Entertainment, Inc. (a)* | | | | | 122,630 | | | | 0.2 | | 3,109 | |
| Other Securities | | | | | 2,201,486 | | | | 3.4 | | 56,779 | |
| | | | | | | | | | 3.6 | | 59,888 | |
Consumer Services 4.9% |
American Real Estate Partners L.P. (a) | | | | | 55,192 | | | | 0.2 | | 3,455 | |
| Jack in the Box, Inc. * | | | | | 55,481 | | | | 0.2 | | 3,113 | |
| Orient-Express Hotels Ltd., Class A | | | | | 79,772 | | | | 0.2 | | 3,147 | |
| Other Securities | | | | | 2,418,392 | | | | 4.3 | | 70,847 | |
| | | | | | | | | | 4.9 | | 80,562 | |
Diversified Financials 2.3% |
| Other Securities | | | | | 1,257,839 | | | | 2.3 | | 38,105 | |
Energy 8.0% |
Boardwalk Pipeline Partners, LP (a) | | | | | 138,835 | | | | 0.2 | | 3,993 | |
| Holly Corp. | | | | | 79,906 | | | | 0.2 | | 3,800 | |
Magellan Midstream Partners (a) | | | | | 92,608 | | | | 0.2 | | 3,620 | |
| Overseas Shipholding Group, Inc. | | | | | 53,961 | | | | 0.2 | | 3,375 | |
| SEACOR Holdings, Inc. * | | | | | 34,616 | | | | 0.2 | | 3,097 | |
| Superior Energy Services, Inc. * | | | | | 104,787 | | | | 0.2 | | 3,280 | |
| Veritas DGC, Inc. * | | | | | 52,792 | | | | 0.2 | | 3,802 | |
| Other Securities | | | | | 4,219,211 | | | | 6.6 | | 107,945 | |
| | | | | | | | | | 8.0 | | 132,912 | |
Food & Staples Retailing 1.0% |
Rite Aid Corp. (a)* | | | | | 721,895 | | | | 0.2 | | 3,379 | |
| Other Securities | | | | | 426,219 | | | | 0.8 | | 14,112 | |
| | | | | | | | | | 1.0 | | 17,491 | |
Food, Beverage & Tobacco 1.7% |
| Corn Products International, Inc. | | | | | 101,390 | | | | 0.2 | | 3,669 | |
Hansen Natural Corp. (a)* | | | | | 112,460 | | | | 0.2 | | 3,571 | |
| Other Securities | | | | | 710,152 | | | | 1.3 | | 21,538 | |
| | | | | | | | | | 1.7 | | 28,778 | |
Health Care Equipment & Services 4.9% |
| Brookdale Senior Living, Inc. | | | | | 78,669 | | | | 0.2 | | 3,786 | |
| WellCare Health Plans, Inc. * | | | | | 54,593 | | | | 0.1 | | 3,207 | |
| Other Securities | | | | | 2,527,824 | | | | 4.6 | | 73,577 | |
| | | | | | | | | | 4.9 | | 80,570 | |
Household & Personal Products 0.7% |
| Other Securities | | | | | 977,477 | | | | 0.7 | | 10,973 | |
44 See financial notes.
Schwab Small-Cap Index Fund
Portfolio Holdings continued
Security and Number of Shares
| | % of Net
Assets
| | Value
($ x 1,000)
|
|---|
Insurance 4.2% |
| Arch Capital Group Ltd. * | | | | | 49,227 | | | | 0.2 | | 3,165 | |
Odyssey Re Holdings Corp. (a) | | | | | 96,583 | | | | 0.2 | | 3,424 | |
| Other Securities | | | | | 2,285,847 | | | | 3.8 | | 63,836 | |
| | | | | | | | | | 4.2 | | 70,425 | |
Materials 5.0% |
| Albemarle Corp. | | | | | 63,716 | | | | 0.2 | | 4,144 | |
| Carpenter Technology Corp. | | | | | 36,101 | | | | 0.2 | | 3,863 | |
| Greif, Inc., Class A | | | | | 35,431 | | | | 0.2 | | 3,320 | |
| Steel Dynamics, Inc. | | | | | 67,162 | | | | 0.2 | | 4,037 | |
| Other Securities | | | | | 3,119,250 | | | | 4.2 | | 67,487 | |
| | | | | | | | | | 5.0 | | 82,851 | |
Media 2.1% |
| Other Securities | | | | | 2,541,434 | | | | 2.1 | | 34,765 | |
Pharmaceuticals & Biotechnology 4.6% |
| Other Securities | | | | | 3,258,499 | | | | 4.6 | | 75,624 | |
Real Estate 7.0% |
| Alexandria Real Estate Equities, Inc. | | | | | 31,429 | | | | 0.2 | | 3,133 | |
| Taubman Centers, Inc. | | | | | 70,883 | | | | 0.2 | | 3,324 | |
| Other Securities | | | | | 3,930,525 | | | | 6.6 | | 109,485 | |
| | | | | | | | | | 7.0 | | 115,942 | |
Retailing 5.5% |
| Big Lots, Inc. * | | | | | 161,833 | | | | 0.2 | | 3,411 | |
| Coldwater Creek, Inc. * | | | | | 120,979 | | | | 0.2 | | 3,689 | |
| Dick’s Sporting Goods, Inc. * | | | | | 68,840 | | | | 0.2 | | 3,425 | |
| Guess?, Inc. * | | | | | 62,886 | | | | 0.2 | | 3,581 | |
| OfficeMax, Inc. | | | | | 96,592 | | | | 0.3 | | 4,596 | |
The Men’s Wearhouse, Inc. (b) | | | | | 82,645 | | | | 0.2 | | 3,293 | |
| Other Securities | | | | | 3,005,556 | | | | 4.2 | | 69,752 | |
| | | | | | | | | | 5.5 | | 91,747 | |
Semiconductors & Semiconductor Equipment 3.4% |
| Other Securities | | | | | 5,309,903 | | | | 3.4 | | 57,205 | |
Software & Services 7.2% |
| FactSet Research Systems, Inc. | | | | | 66,796 | | | | 0.2 | | 3,400 | |
| Hyperion Solutions Corp. * | | | | | 86,914 | | | | 0.2 | | 3,251 | |
| Sybase, Inc. * | | | | | 135,719 | | | | 0.2 | | 3,305 | |
| Other Securities | | | | | 5,990,094 | | | | 6.6 | | 110,144 | |
| | | | | | | | | | 7.2 | | 120,100 | |
Technology Hardware & Equipment 5.3% |
Anixter International, Inc. (a)* | | | | | 52,843 | | | | 0.2 | | 3,158 | |
Brocade Communications Systems, Inc. (b)* | | | | | 383,283 | | | | 0.2 | | 3,108 | |
| Polycom, Inc. * | | | | | 138,739 | | | | 0.2 | | 3,801 | |
| Trimble Navigation Ltd. * | | | | | 74,801 | | | | 0.2 | | 3,457 | |
| Other Securities | | | | | 5,027,042 | | | | 4.5 | | 74,559 | |
| | | | | | | | | | 5.3 | | 88,083 | |
Telecommunication Services 1.2% |
| SBA Communications Corp. * | | | | | 118,934 | | | | 0.2 | | 3,177 | |
Time Warner Telecom, Inc., Class A (a)* | | | | | 160,808 | | | | 0.2 | | 3,206 | |
| Other Securities | | | | | 1,174,300 | | | | 0.8 | | 13,129 | |
| | | | | | | | | | 1.2 | | 19,512 | |
Transportation 2.9% |
Continental Airlines, Inc., Class B (a)* | | | | | 125,511 | | | | 0.3 | | 4,629 | |
| Other Securities | | | | | 1,604,810 | | | | 2.6 | | 42,801 | |
| | | | | | | | | | 2.9 | | 47,430 | |
Utilities 3.6% |
| Dynegy, Inc., Class A * | | | | | 530,336 | | | | 0.2 | | 3,224 | |
| Sierra Pacific Resources * | | | | | 214,037 | | | | 0.2 | | 3,245 | |
| Other Securities | | | | | 2,079,284 | | | | 3.2 | | 53,000 | |
| | | | | | | | | | 3.6 | | 59,469 | |
Security
Rate, Maturity Date
| | | | Face
Amount
($ x 1,000)
| |
| Value
($ x 1,000)
| |
|---|
Short-Term Investment 0.2% of net assets |
| Other Securities | | | | | 3,156 | | | | 0.2 | | 3,156 | |
| | | | | | | | | | | |
U.S. Treasury Obligation 0.0% of net assets |
| Other Securities | | | | | 685 | | | | — | | 681 | |
See financial notes. 45
Schwab Small-Cap Index Fund
Portfolio Holdings continued
Security
| | | | Number of
Shares
| | Value
($ x 1,000)
|
|---|
Collateral Invested for Securities on Loan 15.2% of net assets |
| Securities Lending Investment Fund, a series of the Brown Brothers Investment Trust | | | | | 251,338,226 | | | | 251,338 | |
End of collateral invested for securities on loan.At 10/31/06 the tax basis cost of the fund’s investments was $1,245,704, and the unrealized appreciation and depreciation were $498,655 and ($85,822), respectively, with a net unrealized appreciation of $412,833.
In addition to the above, the fund held the following at 10/31/2006. All numbers are x1,000 except number of futures contracts.
| | Number of
Contracts
| | Contract
Value
| | Unrealized
Gains
|
|---|
|
Russell 2000 Index, e-mini Futures, Long
expires 12/31/06 | | | 51 | | | | 3,932 | | | | 182 | |
| * | | Non-income producing security. |
(a) | | All or a portion of this security is on loan. |
(b) | | All or a portion of this security is held as collateral for open futures contracts. |
46 See financial notes.
Schwab Small-Cap Index Fund
Statement of
Assets and Liabilities
As of October 31, 2006. All numbers x 1,000 except NAV.
Assets | | | | | | |
| Investments, at value including securities on loan of $244,675 (cost $1,245,323) | | | | $ | 1,658,537 | |
| Collateral invested for securities on loan | | | | | 251,338 | |
Receivables:
| | | | | | |
| Investments sold | | | | | 714 | |
| Dividends | | | | | 859 | |
| Fund shares sold | | | | | 450 | |
| Income from securities on loan | | | | | 191 | |
| Interest | | | | | 1 | |
| Prepaid expenses | | | | + | 10 | |
Total assets | | | | | 1,912,100 | |
| |
Liabilities | | | | | | |
| Collateral for securities on loan | | | | | 251,338 | |
Payables:
| | | | | | |
| Investment adviser and administrator fees | | | | | 42 | |
| Transfer agent and shareholder services fees | | | | | 24 | |
| Fund shares redeemed | | | | | 1,087 | |
| Due to brokers for futures | | | | | 19 | |
| Trustee fees | | | | | 2 | |
| Accrued expenses | | | | + | 100 | |
Total liabilities | | | | | 252,612 | |
| |
Net Assets | | | | | | |
Total assets | | | | | 1,912,100 | |
Total liabilities | | | | – | 252,612 | |
Net assets | | | | $ | 1,659,488 | |
| |
Net Assets by Source | | | | | | |
| Capital received from investors | | | | | 1,041,234 | |
| Net investment income not yet distributed | | | | | 12,783 | |
| Net realized capital gains | | | | | 192,075 | |
| Net unrealized capital gains | | | | | 413,396 | |
| |
Net Asset Value (NAV) by Shares Class | | | | | | |
Share Class
| | | |
| | Net Assets
| | ÷
| | Shares
Outstanding
| | =
| NAV
| |
|---|
| Investor Shares | | | | | | | | $ | 770,598 | | | | | | | | 29,729 | | | | | | $25.92 | |
| Select Shares | | | | | | | | $ | 888,890 | | | | | | | | 34,222 | | | | | | $25.97 | |
See financial notes. 47
Schwab Small-Cap Index Fund
Statement of
Operations
For November 1, 2005 through October 31, 2006. All numbers x 1,000.
Investment Income | | | | | | |
| Dividends (net of $11 foreign withholding tax) | | | | $ | 22,891 | |
| Interest | | | | | 288 | |
| Lending of securities | | | | + | 2,035 | |
Total Investment Income | | | | | 25,214 | |
| |
Net Realized Gains and Losses | | | | | | |
| Net realized gains on investments | | | | | 190,721 | |
| Net realized gains on futures contracts | | | | + | 1,683 | |
Net realized gains | | | | | 192,404 | |
| |
Net Unrealized Gains and Losses | | | | | | |
| Net unrealized gains on investments | | | | | 62,567 | |
| Net unrealized gains on futures contracts | | | | + | 116 | |
Net unrealized gains | | | | | 62,683 | |
| |
Expenses | | | | | | |
| Investment adviser and administrator fees | | | | | 4,907 | |
Transfer agent and shareholder service fees:
| | | | | | |
| Investor Shares | | | | | 2,060 | |
| Select Shares | | | | | 839 | |
| Custodian fees | | | | | 109 | |
| Shareholder reports | | | | | 107 | |
| Portfolio accounting fees | | | | | 105 | |
| Registration fees | | | | | 61 | |
| Professional fees | | | | | 49 | |
| Trustees’ fees | | | | | 17 | |
| Overdraft Expense | | | | | 8 | |
| Other expenses | | | | + | 25 | |
| Total expenses | | | | | 8,287 | |
| Expense reduction by adviser and Schwab | | | | – | 43 | |
Net expenses | | | | | 8,244 | |
| |
Increase in Net Assets from Operations | | | | | | |
Total investment income | | | | | 25,214 | |
Net expenses | | | | – | 8,244 | |
Net investment income | | | | | 16,970 | |
Net realized gains | | | | | 192,404 | |
Net unrealized gains | | | | + | 62,683 | |
Increase in net assets from operations | | | | $ | 272,057 | |
48 See financial notes.
Schwab Small-Cap Index Fund
Statements of
Changes in Net Assets
For the current and prior report periods. All numbers x 1,000.
| | | | 11/1/05–10/31/06
| | 11/1/04–10/31/05
|
|---|
| Net investment income | | | | $ | 16,970 | | | $ | 10,894 | |
| Net realized gains | | | | | 192,404 | | | | 81,311 | |
| Net unrealized gains | | | | + | 62,683 | | | | 109,886 | |
Increase in net assets from operations | | | | | 272,057 | | | | 202,091 | |
| |
Distributions Paid | | | | | | | | | | |
Dividends from net investment income | | | | | | | | | | |
| Investor Shares | | | | | 4,995 | | | | 5,474 | |
| Select Shares | | | | + | 6,216 | | | | 5,977 | |
Total dividends from net investment income | | | | | 11,211 | | | | 11,451 | |
| |
Distributions from net realized gains | | | | | | | | | | |
| Investor Shares | | | | | 5,339 | | | | — | |
| Select Shares | | | | + | 5,156 | | | | — | |
Total distributions from net realized gains | | | | | 10,495 | | | | — | |
| |
Total distributions | | | | $ | 21,706 | | | $ | 11,451 | |
Transactions in Fund Shares | | | | | | | | | | | | | | | | | | |
| | | | 11/1/05–10/31/06
| | 11/1/04–10/31/05
| |
|---|
| | | | SHARES
| | VALUE
| | SHARES
| | VALUE
|
|---|
Shares Sold | | | | | | | | | | | | | | | | | | |
| Investor Shares | | | | | 2,811 | | | $ | 68,930 | | | | 4,246 | | | $ | 91,743 | |
| Select Shares | | | | + | 5,327 | | | | 128,328 | | | | 5,026 | | | | 109,688 | |
Total shares sold | | | | | 8,138 | | | $ | 197,258 | | | | 9,272 | | | $ | 201,431 | |
| |
Shares Reinvested | | | | | | | | | | | | | | | | | | |
| Investor Shares | | | | | 414 | | | $ | 9,611 | | | | 237 | | | $ | 5,085 | |
| Select Shares | | | | + | 451 | | | | 10,498 | | | | 256 | | | | 5,502 | |
Total shares reinvested | | | | | 865 | | | $ | 20,109 | | | | 493 | | | $ | 10,587 | |
| |
Shares Redeemed | | | | | | | | | | | | | | | | | | |
| Investor Shares | | | | | (10,390 | ) | | $ | (251,597 | ) | | | (11,218 | ) | | $ | (243,579 | ) |
| Select Shares | | | | + | (7,116 | ) | | | (174,607 | ) | | | (7,843 | ) | | | (170,831 | ) |
Total shares redeemed | | | | | (17,506 | ) | | $ | (426,204 | ) | | | (19,061 | ) | | $ | (414,410 | ) |
| |
Net transactions in fund shares | | | | | (8,503 | ) | | $ | (208,837 | ) | | | (9,296 | ) | | $ | (202,392 | ) |
Shares Outstanding and Net Assets | | | | | | | | | | | | | | | | | | |
| | | | 11/1/05–10/31/06
| | 11/1/04–10/31/05
| |
|---|
| | | | SHARES
| | NET ASSETS
| | SHARES
| | NET ASSETS
|
|---|
| Beginning of period | | | | | 72,454 | | | $ | 1,617,974 | | | | 81,750 | | | $ | 1,629,726 | |
| Total increase or decrease | | | | + | (8,503 | ) | | | 41,514 | | | | (9,296 | ) | | | (11,752 | ) |
End of period | | | | | 63,951 | | | $ | 1,659,488 | | | | 72,454 | | | $ | 1,617,974 | |
Net investment income not yet distributed | | | | | | | | $ | 12,783 | | | | | | | $ | 8,490 | |
See financial notes. 49
Schwab Total Stock Market Index Fund®
Financial Statements
Financial Highlights
Investor Shares
| | | | 11/1/05—
10/31/06
| | 11/1/04—
10/31/05
| | 11/1/03—
10/31/04
| | 11/1/02—
10/31/03
| | 11/1/01—
10/31/02
|
|---|
Per-Share Data ($) | | | | | | | | | | | | | | | | | | | | | | |
| Net asset value at beginning of period | | | | | 20.77 | | | | 19.04 | | | | 17.48 | | | | 14.35 | | | | 16.62 | |
Income or loss from investment operations:
| | | | | | | | | | | | | | | | | | | | | | |
| Net investment income | | | | | 0.30 | | | | 0.29 | | | | 0.19 | | | | 0.16 | | | | 0.16 | |
| Net realized and unrealized gains or losses | | | | | 3.01 | | | | 1.69 | | | | 1.53 | | | | 3.14 | | | | (2.27 | ) |
| Total income or loss from investment operations | | | | | 3.31 | | | | 1.98 | | | | 1.72 | | | | 3.30 | | | | (2.11 | ) |
Less distributions:
| | | | | | | | | | | | | | | | | | | | | | |
| Dividends from net investment income | | | | | (0.25 | ) | | | (0.25 | ) | | | (0.16 | ) | | | (0.17 | ) | | | (0.16 | ) |
| Net asset value at end of period | | | | | 23.83 | | | | 20.77 | | | | 19.04 | | | | 17.48 | | | | 14.35 | |
| Total return (%) | | | | | 16.05 | | | | 10.45 | | | | 9.93 | | | | 23.24 | | | | (12.86 | ) |
| |
Ratios/Supplemental Data (%) | | | | | | | | | | | | | | | | | | | | | | |
Ratios to average net assets:
| | | | | | | | | | | | | | | | | | | | | | |
| Net operating expenses | | | | | 0.53 | | | | 0.54 | | | | 0.56 | | | | 0.53 | | | | 0.40 | |
| Gross operating expenses | | | | | 0.53 | | | | 0.54 | | | | 0.56 | | | | 0.59 | | | | 0.62 | |
| Net investment income | | | | | 1.27 | | | | 1.37 | | | | 1.07 | | | | 1.18 | | | | 1.11 | |
| Portfolio turnover rate | | | | | 3 | | | | 2 | | | | 2 | | | | 3 | | | | 2 | |
| Net assets, end of period ($ x 1,000,000) | | | | | 607 | | | | 600 | | | | 592 | | | | 469 | | | | 263 | |
Select Shares
| | | | 11/1/05—
10/31/06
| | 11/1/04—
10/31/05
| | 11/1/03—
10/31/04
| | 11/1/02—
10/31/03
| | 11/1/01—
10/31/02
|
|---|
Per-Share Data ($) | | | | | | | | | | | | | | | | | | | | | | |
| Net asset value at beginning of period | | | | | 20.83 | | | | 19.09 | | | | 17.52 | | | | 14.37 | | | | 16.65 | |
Income or loss from investment operations:
| | | | | | | | | | | | | | | | | | | | | | |
| Net investment income | | | | | 0.31 | | | | 0.31 | | | | 0.22 | | | | 0.20 | | | | 0.19 | |
| Net realized and unrealized gains or losses | | | | | 3.04 | | | | 1.71 | | | | 1.54 | | | | 3.14 | | | | (2.29 | ) |
| Total income or loss from investment operations | | | | | 3.35 | | | | 2.02 | | | | 1.76 | | | | 3.34 | | | | (2.10 | ) |
Less distributions:
| | | | | | | | | | | | | | | | | | | | | | |
| Dividends from net investment income | | | | | (0.28 | ) | | | (0.28 | ) | | | (0.19 | ) | | | (0.19 | ) | | | (0.18 | ) |
| Net asset value at end of period | | | | | 23.90 | | | | 20.83 | | | | 19.09 | | | | 17.52 | | | | 14.37 | |
| Total return (%) | | | | | 16.23 | | | | 10.63 | | | | 10.10 | | | | 23.50 | | | | (12.81 | ) |
| |
Ratios/Supplemental Data (%) | | | | | | | | | | | | | | | | | | | | | | |
Ratios to average net assets:
| | | | | | | | | | | | | | | | | | | | | | |
| Net operating expenses | | | | | 0.38 | | | | 0.39 | | | | 0.39 | | | | 0.36 | | | | 0.27 | |
| Gross operating expenses | | | | | 0.38 | | | | 0.39 | | | | 0.41 | | | | 0.44 | | | | 0.47 | |
| Net investment income | | | | | 1.41 | | | | 1.52 | | | | 1.23 | | | | 1.35 | | | | 1.24 | |
| Portfolio turnover rate | | | | | 3 | | | | 2 | | | | 2 | | | | 3 | | | | 2 | |
| Net assets, end of period ($ x 1,000,000) | | | | | 762 | | | | 617 | | | | 548 | | | | 429 | | | | 264 | |
50 See financial notes.
Schwab Total Stock Market Index Fund
Portfolio Holdings as of October 31, 2006
This section shows the fund’s 50 largest portfolio holdings in unaffiliated issuers and any holdings exceeding 1% of the fund’s total net assets as of the report date. The remaining securities held by the fund are grouped as “Other Securities” in each category. You can request a complete schedule of portfolio holdings as of the report date, free of charge, by calling Schwab Funds® at 1-800-435-4000. This complete schedule, filed on the fund’s Form N-CSR, is also available on the SEC’s website at http://www.sec.gov.
In addition, the fund files its complete schedule of portfolio holdings with the SEC for the first and third quarters of each fiscal year on Form N-Q. The fund’s Form N-Q is available on the SEC’s website and may be viewed and copied at the SEC’s Public Reference Room in Washington, D.C. Call 1-800-SEC-0330 for information on the operation of the Public Reference Room. A copy of the fund’s most recently filed quarterly schedule of portfolio holdings, included on the fund’s Form N-CSR (with respect to the fund’s second and fourth fiscal quarters) or Form N-Q (with respect to the fund’s first and third fiscal quarters), is available by visiting Schwab’s website at www.schwab.com/schwabfunds.
Holdings by Category
|
| Cost
($ x 1,000)
|
| Value
($ x 1,000)
|
|
|---|
99.6% | | | | Common Stock | | | 1,038,021 | | | | 1,363,639 | |
0.1% | | | | Foreign Common Stock | | | 425 | | | | 994 | |
—% | | | | Preferred Stock | | | 64 | | | | 94 | |
—% | | | | U.S. Treasury Obligation | | | 308 | | | | 308 | |
—% | | | | Rights | | | — | | | | — | |
99.7% | | | | Total Investments | | | 1,038,818 | | | | 1,365,035 | |
3.9% | | | | Collateral Invested for Securities on Loan | | | 52,763 | | | | 52,763 | |
(3.6)% | | | | Other Assets and Liabilities, Net | | | | | | | (49,183 | ) |
100.0% | | | | Net Assets | | | | | | | 1,368,615 | |
Security and Number of Shares
| | % of Net
Assets
| | Value
($ x 1,000)
|
|---|
Common Stock 99.6% of net assets |
Automobiles & Components 0.6% |
| Other Securities | | | | | 328,986 | | | | 0.6 | | 7,894 | |
Banks 5.9% |
| U.S. Bancorp | | | | | 158,531 | | | | 0.4 | | 5,365 | |
| Wachovia Corp. | | | | | 163,314 | | | | 0.7 | | 9,064 | |
| Wells Fargo & Co. | | | | | 275,154 | | | | 0.8 | | 9,985 | |
| Other Securities | | | | | 1,490,956 | | | | 4.0 | | 55,630 | |
| | | | | | | | | | 5.9 | | 80,044 | |
Capital Goods 7.9% |
General Electric Co. (c) | | | | | 815,966 | | | | 2.1 | | 28,649 | |
| The Boeing Co. | | | | | 68,800 | | | | 0.4 | | 5,494 | |
| United Technologies Corp. | | | | | 84,068 | | | | 0.4 | | 5,525 | |
| Other Securities | | | | | 1,395,957 | | | | 5.0 | | 68,318 | |
| | | | | | | | | | 7.9 | | 107,986 | |
Commercial Services & Supplies 1.2% |
| Other Securities | | | | | 486,321 | | | | 1.2 | | 16,279 | |
Consumer Durables & Apparel 1.6% |
| Other Securities | | | | | 602,274 | | | | 1.6 | | 21,892 | |
Consumer Services 2.4% |
| Other Securities | | | | | 907,962 | | | | 2.4 | | 33,079 | |
Diversified Financials 8.9% |
| American Express Co. | | | | | 105,150 | | | | 0.5 | | 6,079 | |
Bank of America Corp. (c) | | | | | 381,577 | | | | 1.5 | | 20,556 | |
Citigroup, Inc. (c) | | | | | 412,286 | | | | 1.5 | | 20,680 | |
| JPMorgan Chase & Co. | | | | | 295,944 | | | | 1.0 | | 14,040 | |
| Merrill Lynch & Co., Inc. | | | | | 79,800 | | | | 0.5 | | 6,976 | |
| Morgan Stanley | | | | | 90,300 | | | | 0.5 | | 6,902 | |
The Charles Schwab Corp. (d) | | | | | 111,120 | | | | 0.2 | | 2,025 | |
The Goldman Sachs Group, Inc. (a) | | | | | 38,700 | | | | 0.5 | | 7,345 | |
| Other Securities | | | | | 710,373 | | | | 2.7 | | 37,064 | |
| | | | | | | | | | 8.9 | | 121,667 | |
Energy 8.5% |
| ChevronTexaco Corp. | | | | | 178,939 | | | | 0.9 | | 12,025 | |
| ConocoPhillips | | | | | 131,623 | | | | 0.6 | | 7,929 | |
Exxon Mobil Corp. (c) | | | | | 493,166 | | | | 2.6 | | 35,222 | |
| Schlumberger Ltd. | | | | | 100,000 | | | | 0.5 | | 6,308 | |
| Other Securities | | | | | 1,318,551 | | | | 3.9 | | 54,797 | |
| | | | | | | | | | 8.5 | | 116,281 | |
Food & Staples Retailing 2.2% |
| Wal-Mart Stores, Inc. | | | | | 309,100 | | | | 1.1 | | 15,232 | |
| Other Securities | | | | | 442,868 | | | | 1.1 | | 14,462 | |
| | | | | | | | | | 2.2 | | 29,694 | |
Food, Beverage & Tobacco 4.5% |
| Altria Group, Inc. | | | | | 168,800 | | | | 1.0 | | 13,729 | |
| PepsiCo, Inc. | | | | | 140,800 | | | | 0.7 | | 8,932 | |
| The Coca-Cola Co. | | | | | 202,200 | | | | 0.7 | | 9,447 | |
| Other Securities | | | | | 821,464 | | | | 2.1 | | 29,677 | |
| | | | | | | | | | 4.5 | | 61,785 | |
Health Care Equipment & Services 4.4% |
| UnitedHealth Group, Inc. | | | | | 118,880 | | | | 0.4 | | 5,799 | |
| Other Securities | | | | | 1,345,183 | | | | 4.0 | | 54,405 | |
| | | | | | | | | | 4.4 | | 60,204 | |
Household & Personal Products 1.9% |
Procter & Gamble Co. (c) | | | | | 269,915 | | | | 1.3 | | 17,110 | |
| Other Securities | | | | | 184,447 | | | | 0.6 | | 9,425 | |
| | | | | | | | | | 1.9 | | 26,535 | |
See financial notes. 51
Schwab Total Stock Market Index Fund
Portfolio Holdings continued
Security and Number of Shares
| | % of Net
Assets
| | Value
($ x 1,000)
|
|---|
Insurance 5.5% |
| American International Group, Inc. | | | | | 211,922 | | | | 1.1 | | 14,235 | |
| Berkshire Hathaway, Inc., Class A * | | | | | 121 | | | | 0.9 | | 12,762 | |
| Other Securities | | | | | 1,079,478 | | | | 3.5 | | 48,862 | |
| | | | | | | | | | 5.5 | | 75,859 | |
Materials 3.1% |
| Other Securities | | | | | 1,097,579 | | | | 3.1 | | 43,021 | |
Media 4.0% |
| Comcast Corp., Class A * | | | | | 151,336 | | | | 0.5 | | 6,155 | |
| News Corp., Class A | | | | | 253,950 | | | | 0.4 | | 5,295 | |
| The Walt Disney Co. | | | | | 195,410 | | | | 0.5 | | 6,148 | |
| Time Warner, Inc. | | | | | 367,052 | | | | 0.6 | | 7,345 | |
| Other Securities | | | | | 988,988 | | | | 2.0 | | 29,389 | |
| | | | | | | | | | 4.0 | | 54,332 | |
Pharmaceuticals & Biotechnology 7.4% |
| Abbott Laboratories | | | | | 125,705 | | | | 0.5 | | 5,972 | |
| Amgen, Inc. * | | | | | 103,268 | | | | 0.6 | | 7,839 | |
| Eli Lilly & Co. | | | | | 92,400 | | | | 0.4 | | 5,175 | |
| Genentech, Inc. * | | | | | 83,300 | | | | 0.5 | | 6,939 | |
| Johnson & Johnson | | | | | 246,370 | | | | 1.2 | | 16,605 | |
| Merck & Co., Inc. | | | | | 183,552 | | | | 0.6 | | 8,337 | |
| Pfizer, Inc. | | | | | 610,192 | | | | 1.2 | | 16,262 | |
| Wyeth | | | | | 109,400 | | | | 0.4 | | 5,583 | |
| Other Securities | | | | | 918,458 | | | | 2.0 | | 28,669 | |
| | | | | | | | | | 7.4 | | 101,381 | |
Real Estate 2.5% |
| Other Securities | | | | | 762,819 | | | | 2.5 | | 33,851 | |
Retailing 4.0% |
| Home Depot, Inc. | | | | | 162,300 | | | | 0.5 | | 6,059 | |
| Other Securities | | | | | 1,408,353 | | | | 3.5 | | 49,041 | |
| | | | | | | | | | 4.0 | | 55,100 | |
Semiconductors & Semiconductor Equipment 2.6% |
| Intel Corp. | | | | | 483,832 | | | | 0.8 | | 10,325 | |
| Other Securities | | | | | 1,235,866 | | | | 1.8 | | 25,309 | |
| | | | | | | | | | 2.6 | | 35,634 | |
Software & Services 6.2% |
| Google, Inc., Class A * | | | | | 22,900 | | | | 0.8 | | 10,909 | |
Microsoft Corp. (c) | | | | | 800,850 | | | | 1.7 | | 22,992 | |
| Oracle Corp. * | | | | | 434,449 | | | | 0.6 | | 8,024 | |
| Other Securities | | | | | 1,681,198 | | | | 3.1 | | 43,096 | |
| | | | | | | | | | 6.2 | | 85,021 | |
Technology Hardware & Equipment 6.1% |
| Apple Computer, Inc. * | | | | | 65,000 | | | | 0.4 | | 5,270 | |
| Cisco Systems, Inc. * | | | | | 511,909 | | | | 0.9 | | 12,352 | |
| Hewlett-Packard Co. | | | | | 239,636 | | | | 0.7 | | 9,283 | |
| International Business Machines Corp. | | | | | 131,510 | | | | 0.9 | | 12,142 | |
| Other Securities | | | | | 2,634,030 | | | | 3.2 | | 44,362 | |
| | | | | | | | | | 6.1 | | 83,409 | |
Telecommunication Services 3.0% |
| AT&T Corp. | | | | | 318,806 | | | | 0.8 | | 10,919 | |
| BellSouth Corp. | | | | | 151,887 | | | | 0.5 | | 6,850 | |
| Verizon Communications, Inc. | | | | | 247,572 | | | | 0.7 | | 9,160 | |
| Other Securities | | | | | 776,188 | | | | 1.0 | | 14,015 | |
| | | | | | | | | | 3.0 | | 40,944 | |
Transportation 1.8% |
| United Parcel Service, Inc., Class B | | | | | 91,480 | | | | 0.5 | | 6,893 | |
| Other Securities | | | | | 444,119 | | | | 1.3 | | 18,308 | |
| | | | | | | | | | 1.8 | | 25,201 | |
Utilities 3.4% |
| Other Securities | | | | | 1,229,814 | | | | 3.4 | | 46,546 | |
| | | | | | | | | | | |
Foreign Common Stock 0.1% of net assets |
Cayman Islands 0.1% |
Energy 0.1% |
| Other Securities | | | | | 19,155 | | | | 0.1 | | 994 | |
| | | | | | | | | | | |
Preferred Stock 0.0% of net assets |
Real Estate 0.0% |
| Other Securities | | | | | 1,200 | | | | — | | 94 | |
Security
Rate, Maturity Date
| | | | Face
Amount
($ x 1,000)
| | % of Net
Assets
| Value
($ x 1,000)
| |
|---|
U.S. Treasury Obligation 0.0% of net assets |
| Other Securities | | | | | 310 | | | | — | | 308 | |
52 See financial notes.
Schwab Total Stock Market Index Fund
Portfolio Holdings continued
Security and Number of Shares
| | % of Net
Assets
| | Value
($ x 1,000)
|
|---|
Rights 0.0% of net assets |
| Other Securities | | | | | 1,640 | | | | — | | — |
Security
| | | | Number of
Shares
| | Value
($ x 1,000)
|
|---|
Collateral Invested for Securities on Loan 3.9% of net assets |
| State Street Navigator Security Lending Prime Portfolio | | | | | 52,763,359 | | | | 52,763 | |
End of collateral invested for securities on loan.At 10/31/06 the tax basis cost of the fund’s investments was $1,039,468 and the unrealized appreciation and depreciation were $419,712 and ($94,145), respectively, with a net unrealized appreciation of $325,567.
In addition to the above, the fund held the following at 10/31/06. All numbers are x1,000 except number of futures contracts.
| | | | Number of
Contracts
| | Contract
Value
| | Unrealized
Gains
|
|---|
|
Russell 2000 Index, e-mini, Long
expires 12/31/06 | | | | | 10 | | | | 771 | | | | 56 | |
S&P 500 Index, e-mini, Long,
expires 12/15/06 | | | | | 10 | | | | 692 | | | | 36 | |
| | | | | | | | | | | | | | 92 | |
| * | | Non-income producing security. |
(a) | | All or a portion of this security is on loan. |
(b) | | Fair-valued by Management. Please see the complete schedule of holdings. |
(c) | | All or a portion of this security is held as collateral for open futures contracts. Please see the complete schedule of holdings. |
(d) | | Issuer is affiliated with the fund’s adviser. |
See financial notes. 53
Schwab Total Stock Market Index Fund
Statement of
Assets and Liabilities
As of October 31, 2006. All numbers x 1,000 except NAV.
Assets | | | | | | |
| Investments, at value including securities on loan of $51,285 (cost $1,038,818) | | | | $ | 1,365,035 | |
| Collateral invested for securities on loan | | | | | 52,763 | |
Receivables:
| | | | | | |
| Investments sold | | | | | 2,944 | |
| Fund shares sold | | | | | 1,349 | |
| Dividends | | | | | 1,051 | |
| Income from securities on loan | | | | | 22 | |
| Prepaid expenses | | | | + | 8 | |
Total assets | | | | | 1,423,172 | |
| |
Liabilities | | | | | | |
| Collateral invested for securities on loan | | | | | 52,763 | |
Payables:
| | | | | | |
| Investments bought | | | | | 22 | |
| Investment adviser and administrator fees | | | | | 29 | |
| Transfer agent and shareholder services fees | | | | | 19 | |
| Fund shares redeemed | | | | | 919 | |
| Payable to custodian | | | | | 715 | |
| Due to brokers for futures | | | | | 3 | |
| Trustee fees | | | | | 2 | |
| Accrued expenses | | | | + | 85 | |
Total liabilities | | | | | 54,557 | |
| |
Net Assets | | | | | | |
Total assets | | | | | 1,423,172 | |
Total liabilities | | | | – | 54,557 | |
Net assets | | | | $ | 1,368,615 | |
| |
Net Assets by Source | | | | | | |
| Capital received from investors | | | | | 1,043,168 | |
| Net investment income not yet distributed | | | | | 13,499 | |
| Net realized capital losses | | | | | (14,361 | ) |
| Net unrealized capital gains | | | | | 326,309 | |
| |
Net Asset Value (NAV) by Shares Class | | | | | | |
Share Class
| | | |
| | Net Assets
| | ÷
| | Shares
Outstanding
| | =
| NAV
| |
|---|
| Investor Shares | | | | | | | | $ | 606,548 | | | | | | | | 25,453 | | | | | | $23.83 | |
| Select Shares | | | | | | | | $ | 762,067 | | | | | | | | 31,889 | | | | | | $23.90 | |
54 See financial notes.
Schwab Total Stock Market Index Fund
Statement of
Operations
For November 1, 2005 through October 31, 2006. All numbers x 1,000.
Investment Income | | | | | | |
| Dividends (including $9 from affiliated issuer and net of $2 foreign withholding tax) | | | | $ | 22,687 | |
| Interest | | | | | 261 | |
| Lending of securities | | | | + | 193 | |
Total Investment Income | | | | | 23,141 | |
| |
Net Realized Gains and Losses | | | | | | |
| Net realized gains on investments | | | | | 3,248 | |
| Net realized gains on futures contracts | | | | + | 402 | |
Net realized gains | | | | | 3,650 | |
| |
Net Unrealized Gains and Losses | | | | | | |
| Net unrealized gains on investments | | | | | 172,007 | |
| Net unrealized gains on futures contracts | | | | + | 27 | |
Net unrealized gains | | | | | 172,034 | |
| |
Expenses | | | | | | |
| Investment adviser and administrator fees | | | | | 3,234 | |
Transfer agent and shareholder service fees:
| | | | | | |
| Investor Shares | | | | | 1,526 | |
| Select Shares | | | | | 678 | |
| Portfolio accounting fees | | | | | 127 | |
| Registration fees | | | | | 87 | |
| Shareholder reports | | | | | 69 | |
| Custodian fees | | | | | 59 | |
| Professional fees | | | | | 47 | |
| Trustees’ fees | | | | | 14 | |
| Overdraft expense | | | | | 4 | |
| Other expenses | | | | + | 24 | |
Total expenses | | | | | 5,869 | |
| |
Increase in Net Assets from Operations | | | | | | |
Total investment income | | | | | 23,141 | |
Net expenses | | | | – | 5,869 | |
Net investment income | | | | | 17,272 | |
Net realized gains | | | | | 3,650 | |
Net unrealized gains | | | | + | 172,034 | |
Increase in net assets from operations | | | | $ | 192,956 | |
See financial notes. 55
Schwab Total Stock Market Index Fund
Statements of
Changes in Net Assets
For the current and prior report periods. All numbers x 1,000.
| | | | 11/1/05–10/31/06
| | 11/1/04–10/31/05
|
|---|
| Net investment income | | | | $ | 17,272 | | | $ | 17,477 | |
| Net realized gains | | | | | 3,650 | | | | 3,994 | |
| Net unrealized gains | | | | + | 172,034 | | | | 97,829 | |
Increase in net assets from operations | | | | | 192,956 | | | | 119,300 | |
| |
Distributions Paid | | | | | | | | | | |
Dividends from net investment income | | | | | | | | | | |
| Investor Shares | | | | | 7,046 | | | | 7,770 | |
| Select Shares | | | | + | 8,255 | | | | 7,956 | |
Total dividends from net investment income | | | | $ | 15,301 | | | $ | 15,726 | |
Transactions in Fund Shares | | | | | | | | | | | |
| | | | 11/1/05–10/31/06
| | 11/1/04–10/31/05
| |
|---|
| | | | SHARES
| | VALUE
| | SHARES
| | VALUE
|
|---|
Shares Sold | | | | | | | | | | | | | | | | | | |
| Investor Shares | | | | | 3,959 | | | $ | 87,655 | | | | 5,085 | | | $ | 102,573 | |
| Select Shares | | | | + | 8,052 | | | | 178,696 | | | | 6,795 | | | | 138,664 | |
Total shares sold | | | | | 12,011 | | | $ | 266,351 | | | | 11,880 | | | $ | 241,237 | |
| |
Shares Reinvested | | | | | | | | | | | | | | | | | | |
| Investor Shares | | | | | 302 | | | $ | 6,537 | | | | 362 | | | $ | 7,203 | |
| Select Shares | | | | + | 315 | | | | 6,824 | | | | 328 | | | | 6,531 | |
Total shares reinvested | | | | | 617 | | | $ | 13,361 | | | | 690 | | | $ | 13,734 | |
| |
Shares Redeemed | | | | | | | | | | | | | | | | | | |
| Investor Shares | | | | | (7,691 | ) | | $ | (169,892 | ) | | | (7,672 | ) | | $ | (155,939 | ) |
| Select Shares | | | | + | (6,111 | ) | | | (136,146 | ) | | | (6,203 | ) | | | (126,000 | ) |
Total shares redeemed | | | | | (13,802 | ) | | $ | (306,038 | ) | | | (13,875 | ) | | $ | (281,939 | ) |
| |
Net transactions in fund shares | | | | | (1,174 | ) | | $ | (26,326 | ) | | | (1,305 | ) | | $ | (26,968 | ) |
Shares Outstanding and Net Assets | | | | | | | | | | | |
| | | | 11/1/05–10/31/06
| | 11/1/04–10/31/05
| |
|---|
| | | | SHARES
| | NET ASSETS
| | SHARES
| | NET ASSETS
|
|---|
| Beginning of period | | | | | 58,516 | | | $ | 1,217,286 | | | | 59,821 | | | $ | 1,140,680 | |
| Total increase or decrease | | | | + | (1,174 | ) | | | 151,329 | | | | (1,305 | ) | | | 76,606 | |
End of period | | | | | 57,342 | | | $ | 1,368,615 | | | | 58,516 | | | $ | 1,217,286 | |
| |
Net investment income not yet distributed | | | | | | | | $ | 13,499 | | | | | | | $ | 11,788 | |
56 See financial notes.
Schwab International Index Fund®
Financial Statements
Financial Highlights
Investor Shares
| | | | 11/1/05—
10/31/06
| | 11/1/04—
10/31/05
| | 11/1/03—
10/31/04
| | 11/1/02—
10/31/03
| | 11/1/01—
10/31/02
|
|---|
Per-Share Data ($) | | | | | | | | | | | | | | | | | | | | | | |
| Net asset value at beginning of period | | | | | 17.07 | | | | 14.82 | | | | 12.74 | | | | 10.47 | | | | 12.22 | |
Income or loss from investment operations:
| | | | | | | | | | | | | | | | | | | | | | |
| Net investment income | | | | | 0.48 | | | | 0.35 | | | | 0.26 | | | | 0.23 | | | | 0.21 | |
| Net realized and unrealized gains or losses | | | | | 3.92 | | | | 2.18 | | | | 2.05 | | | | 2.25 | | | | (1.82 | ) |
| Total income or loss from investment operations | | | | | 4.40 | | | | 2.53 | | | | 2.31 | | | | 2.48 | | | | (1.61 | ) |
Less distributions:
| | | | | | | | | | | | | | | | | | | | | | |
| Dividends from net investment income | | | | | (0.35 | ) | | | (0.28 | ) | | | (0.23 | ) | | | (0.21 | ) | | | (0.14 | ) |
| Net asset value at end of period | | | | | 21.12 | | | | 17.07 | | | | 14.82 | | | | 12.74 | | | | 10.47 | |
| Total return (%) | | | | | 26.15 | | | | 17.30 | | | | 18.40 | | | | 24.24 | | | | (13.34 | ) |
| |
Ratios/Supplemental Data (%) | | | | | | | | | | | | | | | | | | | | | | |
Ratios to average net assets:
| | | | | | | | | | | | | | | | | | | | | | |
| Net operating expenses | | | | | 0.69 | | | | 0.68 | | | | 0.69 | | | | 0.65 | | | | 0.58 | |
| Gross operating expenses | | | | | 0.70 | | | | 0.72 | | | | 0.73 | | | | 0.74 | | | | 0.76 | |
| Net investment income | | | | | 2.41 | | | | 2.05 | | | | 1.78 | | | | 2.01 | | | | 1.70 | |
| Portfolio turnover rate | | | | | 11 | | | | 10 | | | | 1 | | | | 7 | | | | 13 | |
| Net assets, end of period ($ x 1,000,000) | | | | | 706 | | | | 595 | | | | 550 | | | | 494 | | | | 443 | |
Select Shares
| | | | 11/1/05—
10/31/06
| | 11/1/04—
10/31/05
| | 11/1/03—
10/31/04
| | 11/2/02—
10/31/03
| | 11/1/01—
10/31/02
|
|---|
Per-Share Data ($) | | | | | | | | | | | | | | | | | | | | | | |
| Net asset value at beginning of period | | | | | 17.09 | | | | 14.83 | | | | 12.75 | | | | 10.47 | | | | 12.23 | |
Income or loss from investment operations:
| | | | | | | | | | | | | | | | | | | | | | |
| Net investment income | | | | | 0.50 | | | | 0.38 | | | | 0.28 | | | | 0.25 | | | | 0.21 | |
| Net realized and unrealized gains or losses | | | | | 3.93 | | | | 2.19 | | | | 2.05 | | | | 2.26 | | | | (1.82 | ) |
| Total income or loss from investment operations | | | | | 4.43 | | | | 2.57 | | | | 2.33 | | | | 2.51 | | | | (1.61 | ) |
Less distributions:
| | | | | | | | | | | | | | | | | | | | | | |
| Dividends from net investment income | | | | | (0.38 | ) | | | (0.31 | ) | | | (0.25 | ) | | | (0.23 | ) | | | (0.15 | ) |
| Net asset value at end of period | | | | | 21.14 | | | | 17.09 | | | | 14.83 | | | | 12.75 | | | | 10.47 | |
| Total return (%) | | | | | 26.35 | | | | 17.56 | | | | 18.56 | | | | 24.50 | | | | (13.31 | ) |
| |
Ratios/Supplemental Data (%) | | | | | | | | | | | | | | | | | | | | | | |
Ratios to average net assets:
| | | | | | | | | | | | | | | | | | | | | | |
| Net operating expenses | | | | | 0.50 | | | | 0.50 | | | | 0.50 | | | | 0.49 | | | | 0.47 | |
| Gross operating expenses | | | | | 0.55 | | | | 0.57 | | | | 0.58 | | | | 0.59 | | | | 0.61 | |
| Net investment income | | | | | 2.60 | | | | 2.23 | | | | 1.97 | | | | 2.19 | | | | 1.81 | |
| Portfolio turnover rate | | | | | 11 | | | | 10 | | | | 1 | | | | 7 | | | | 13 | |
| Net assets, end of period ($ x 1,000,000) | | | | | 954 | | | | 776 | | | | 687 | | | | 629 | | | | 536 | |
See financial notes. 57
Schwab International Index Fund
Portfolio Holdings as of October 31, 2006
This section shows the fund’s 50 largest portfolio holdings in unaffiliated issuers and any holdings exceeding 1% of the fund’s total net assets as of the report date. The remaining securities held by the fund are grouped as “Other Securities” in each category. You can request a complete schedule of portfolio holdings as of the report date, free of charge, by calling Schwab Funds® at 1-800-435-4000. This complete schedule, filed on the fund’s Form N-CSR, is also available on the SEC’s website at http://www.sec.gov.
In addition, the fund files its complete schedule of portfolio holdings with the SEC for the first and third quarters of each fiscal year on Form N-Q. The fund’s Form N-Q is available on the SEC’s website and may be viewed and copied at the SEC’s Public Reference Room in Washington, D.C. Call 1-800-SEC-0330 for information on the operation of the Public Reference Room. A copy of the fund’s most recently filed quarterly schedule of portfolio holdings, included on the fund’s Form N-CSR (with respect to the fund’s second and fourth fiscal quarters) or Form N-Q (with respect to the fund’s first and third fiscal quarters), is available by visiting Schwab’s website at www.schwab.com/schwabfunds.
Holdings by Category
|
| Cost
($ x 1,000)
|
| Value
($ x 1,000)
|
|---|
99.4% | | | | Foreign Common Stock | | | 967,386 | | | | 1,649,642 | |
0.3% | | | | Short-Term Investment | | | 4,182 | | | | 4,182 | |
99.7% | | | | Total Investments | | | 971,568 | | | | 1,653,824 | |
5.8% | | | | Collateral Invested for Securities on Loan | | | 96,480 | | | | 96,480 | |
(5.5)% | | | | Other Assets and Liabilities, Net | | | | | | | (91,025 | ) |
100.0% | | | | Net Assets | | | | | | | 1,659,279 | |
Security and Number of Shares
| | % of Net
Assets
| | Value
($ x 1,000)
|
|---|
Foreign Common Stock 99.4% of net assets |
Australia 4.3% |
| BHP Billiton Ltd. | | | | | 582,860 | | | | 0.8 | | 12,406 | |
| Other Securities | | | | | 3,873,498 | | | | 3.5 | | 58,530 | |
| | | | | | | | | | 4.3 | | 70,936 | |
Austria 0.2% |
| Other Securities | | | | | 58,241 | | | | 0.2 | | 3,621 | |
Belgium 1.3% |
| Fortis | | | | | 205,652 | | | | 0.5 | | 8,624 | |
| Other Securities | | | | | 197,580 | | | | 0.8 | | 12,292 | |
| | | | | | | | | | 1.3 | | 20,916 | |
Canada 6.7% |
Royal Bank of Canada (a) | | | | | 201,446 | | | | 0.5 | | 8,934 | |
| Other Securities | | | | | 2,960,648 | | | | 6.2 | | 101,941 | |
| | | | | | | | | | 6.7 | | 110,875 | |
Denmark 0.5% |
| Other Securities | | | | | 105,407 | | | | 0.5 | | 8,004 | |
Finland 1.1% |
| Nokia Oyj | | | | | 653,383 | | | | 0.8 | | 12,987 | |
| Other Securities | | | | | 255,790 | | | | 0.3 | | 5,692 | |
| | | | | | | | | | 1.1 | | 18,679 | |
France 10.3% |
| Axa | | | | | 292,677 | | | | 0.7 | | 11,134 | |
| BNP Paribas | | | | | 131,357 | | | | 0.9 | | 14,426 | |
| Sanofi-Aventis | | | | | 154,055 | | | | 0.8 | | 13,118 | |
| Societe Generale | | | | | 58,802 | | | | 0.6 | | 9,762 | |
| Suez SA | | | | | 202,911 | | | | 0.5 | | 9,089 | |
| Total SA | | | | | 393,890 | | | | 1.6 | | 26,645 | |
| Other Securities | | | | | 1,462,887 | | | | 5.2 | | 86,468 | |
| | | | | | | | | | 10.3 | | 170,642 | |
Germany 7.6% |
| Allianz AG | | | | | 63,388 | | | | 0.7 | | 11,779 | |
| DaimlerChrysler AG | | | | | 162,404 | | | | 0.6 | | 9,285 | |
| Deutsche Bank AG | | | | | 82,735 | | | | 0.6 | | 10,464 | |
| Deutsche Telekom AG | | | | | 485,962 | | | | 0.5 | | 8,425 | |
| E.ON AG | | | | | 112,817 | | | | 0.8 | | 13,584 | |
| Siemens AG * | | | | | 142,378 | | | | 0.8 | | 12,844 | |
| Other Securities | | | | | 875,463 | | | | 3.6 | | 59,780 | |
| | | | | | | | | | 7.6 | | 126,161 | |
Greece 0.3% |
| Other Securities | | | | | 123,264 | | | | 0.3 | | 4,529 | |
Hong Kong 0.8% |
| Other Securities | | | | | 1,888,420 | | | | 0.8 | | 13,768 | |
Ireland 0.7% |
| Other Securities | | | �� | | 491,102 | | | | 0.7 | | 11,912 | |
Italy 3.3% |
Eni S.p.A. (a) | | | | | 419,043 | | | | 0.8 | | 12,676 | |
| Other Securities | | | | | 5,739,239 | | | | 2.5 | | 42,022 | |
| | | | | | | | | | 3.3 | | 54,698 | |
Japan 18.8% |
| Canon, Inc. | | | | | 190,995 | | | | 0.6 | | 10,200 | |
| Honda Motor Co., Ltd. | | | | | 246,039 | | | | 0.5 | | 8,684 | |
| Mitsubishi UFJ Financial Group, Inc. | | | | | 1,612 | | | | 1.2 | | 20,448 | |
| Mizuho Financial Group, Inc. | | | | | 1,666 | | | | 0.8 | | 12,950 | |
| Sumitomo Mitsui Financial Group, Inc. | | | | | 1,014 | | | | 0.7 | | 11,081 | |
| Takeda Pharmaceutical Co., Ltd. | | | | | 130,200 | | | | 0.5 | | 8,359 | |
| Toyota Motor Corp. | | | | | 438,703 | | | | 1.6 | | 25,904 | |
| Other Securities | | | | | 11,851,680 | | | | 12.9 | | 214,892 | |
| | | | | | | | | | 18.8 | | 312,518 | |
58 See financial notes.
Schwab International Index Fund
Portfolio Holdings continued
Security and Number of Shares
| | % of Net
Assets
| | Value
($ x 1,000)
|
|---|
Netherlands 4.1% |
| ABN AMRO Holding N.V. | | | | | 300,416 | | | | 0.5 | | 8,754 | |
| ING Groep N.V. | | | | | 366,162 | | | | 1.0 | | 16,217 | |
| Other Securities | | | | | 1,805,220 | | | | 2.6 | | 43,171 | |
| | | | | | | | | | 4.1 | | 68,142 | |
Norway 0.4% |
| Other Securities | | | | | 340,039 | | | | 0.4 | | 6,923 | |
Portugal 0.2% |
| Other Securities | | | | | 717,379 | | | | 0.2 | | 4,052 | |
Singapore 0.5% |
| Other Securities | | | | | 1,602,960 | | | | 0.5 | | 8,016 | |
Spain 4.6% |
| Banco Bilbao Vizcaya Argentaria S.A. | | | | | 552,339 | | | | 0.8 | | 13,331 | |
| Banco Santander Central Hispano S.A. | | | | | 1,013,916 | | | | 1.0 | | 17,547 | |
| Telefonica S.A. | | | | | 777,060 | | | | 0.9 | | 14,960 | |
| Other Securities | | | | | 836,907 | | | | 1.9 | | 31,145 | |
| | | | | | | | | | 4.6 | | 76,983 | |
Sweden 1.8% |
| Telefonaktiebolaget LM Ericsson, Class B | | | | | 2,372,504 | | | | 0.6 | | 8,968 | |
| Other Securities | | | | | 1,174,867 | | | | 1.2 | | 20,664 | |
| | | | | | | | | | 1.8 | | 29,632 | |
Switzerland 7.6% |
| Credit Suisse Group | | | | | 199,166 | | | | 0.7 | | 12,006 | |
| Nestle S.A. | | | �� | | 65,820 | | | | 1.4 | | 22,492 | |
| Novartis AG–Reg’d. | | | | | 436,697 | | | | 1.6 | | 26,508 | |
| Roche Holdings AG | | | | | 111,022 | | | | 1.2 | | 19,439 | |
| UBS AG | | | | | 348,598 | | | | 1.3 | | 20,815 | |
| Other Securities | | | | | 541,279 | | | | 1.4 | | 23,971 | |
| | | | | | | | | | 7.6 | | 125,231 | |
United Kingdom 24.3% |
| Anglo American plc | | | | | 240,109 | | | | 0.6 | | 10,867 | |
| AstraZeneca plc | | | | | 253,064 | | | | 0.9 | | 14,914 | |
| Barclays plc | | | | | 1,053,619 | | | | 0.9 | | 14,196 | |
| BP plc | | | | | 3,203,910 | | | | 2.2 | | 35,817 | |
| Diageo plc | | | | | 445,768 | | | | 0.5 | | 8,242 | |
| GlaxoSmithKline plc | | | | | 932,267 | | | | 1.5 | | 24,845 | |
| HBOS plc | | | | | 605,157 | | | | 0.8 | | 12,537 | |
| HSBC Holdings plc | | | | | 1,805,836 | | | | 2.1 | | 34,267 | |
| Lloyds TSB Group plc | | | | | 895,483 | | | | 0.6 | | 9,565 | |
| Rio Tinto plc | | | | | 167,659 | | | | 0.6 | | 9,277 | |
| Royal Bank of Scotland Group plc | | | | | 501,714 | | | | 1.1 | | 17,860 | |
| Royal Dutch Shell plc, Class A | | | | | 749,220 | | | | 1.6 | | 26,070 | |
| Royal Dutch Shell plc, Class B | | | | | 434,049 | | | | 0.9 | | 15,596 | |
| Tesco plc | | | | | 1,227,342 | | | | 0.5 | | 9,208 | |
| Vodafone Group plc | | | | | 8,348,655 | | | | 1.3 | | 21,512 | |
| Other Securities | | | | | 23,960,527 | | | | 8.2 | | 138,631 | |
| | | | | | | | | | 24.3 | | 403,404 | |
Security
Rate, Maturity Date
| | | | Face
Amount
($ x 1,000)
| | % of Net
Assets
| Value
($ x 1,000)
| |
|---|
Short-Term Investment 0.3% of net assets |
| Other Securities | | | | | 4,182 | | | | 0.3 | | 4,182 | |
Security and Number of Shares
| |
| | Value
($ x 1,000)
|
|---|
Collateral Invested for Securities on Loan 5.8% of net assets |
| Securities Lending Investment Fund, a series of the Brown Brothers Investment Trust. | | | | | 96,479,879 | | | | 5.8 | | | | 96,480 |
End of collateral invested for securities on loan.At 10/31/06 the tax basis cost of the fund’s investments was $986,474, and the unrealized appreciation and depreciation were $699,603 and ($32,253), respectively, with a net unrealized appreciation of $667,350.
At 10/31/06, the prices of certain foreign securities held by the fund aggregating $1,515,837 were adjusted from their closing market prices following the guidelines adopted by the fund’s Board of Trustees.
| * | | Non-income producing security. |
(a) | | All or a portion of this security is on loan. |
See financial notes. 59
Schwab International Index Fund
Statement of
Assets and Liabilities
As of October 31, 2006. All numbers x 1,000 except NAV.
Assets | | | | | | |
| Investments, at value including securities on loan of $92,211 (cost $971,568) | | | | $ | 1,653,824 | |
| Collateral invested for securities on loan | | | | | 96,480 | |
| Cash | | | | | 123 | |
| Foreign currency, at value (cost $379) | | | | | 384 | |
Receivables:
| | | | | | |
| Fund shares sold | | | | | 4,309 | |
| Dividends | | | | | 1,823 | |
| Reclaims | | | | | 202 | |
| Income from securities on loan | | | | | 35 | |
| Prepaid expenses | | | | + | 9 | |
Total assets | | | | | 1,757,189 | |
| |
Liabilities | | | | | | |
| Collateral invested for securities on loan | | | | | 96,480 | |
Payables:
| | | | | | |
| Investments bought | | | | | 21 | |
| Investment advisors and administrator fees | | | | | 52 | |
| Transfer agent and shareholder services fees | | | | | 20 | |
| Fund shares redeemed | | | | | 875 | |
| Trustee fees | | | | | 2 | |
| Accrued expenses | | | | + | 460 | |
Total liabilities | | | | | 97,910 | |
| |
Net Assets | | | | | | |
Total assets | | | | | 1,757,189 | |
Total liabilities | | | | – | 97,910 | |
Net assets | | | | $ | 1,659,279 | |
| |
Net Assets by Source | | | | | | |
| Capital received from investors | | | | | 1,202,536 | |
| Net investment income not yet distributed | | | | | 34,946 | |
| Net realized capital losses | | | | | (260,470 | ) |
| Net unrealized capital gains | | | | | 682,267 | |
| |
Net Asset Value (NAV) by Shares Class | | | | | | |
Share Class
| | | |
| | Net Assets
| | ÷
| | Shares
Outstanding
| | =
| NAV
| |
|---|
| Investor Shares | | | | | | | | $ | 705,737 | | | | | | | | 33,410 | | | | | | $21.12 | |
| Select Shares | | | | | | | | $ | 953,542 | | | | | | | | 45,100 | | | | | | $21.14 | |
60 See financial notes.
Schwab International Index Fund
Statement of
Operations
For November 1, 2005 through October 31, 2006. All numbers x 1,000.
Investment Income | | | | | | |
| Dividends (net of $3,993 foreign withholding tax) | | | | $ | 45,893 | |
| Interest | | | | | 275 | |
| Lending of securities | | | | + | 1,345 | |
Total Investment Income | | | | | 47,513 | |
| |
Net Realized Gains and Losses | | | | | | |
| Net realized gains on investments | | | | | 36,532 | |
| Net realized gains on foreign currency transactions | | | | | 29 | |
| Net realized gains on futures contracts | | | | + | 34 | |
Net realized gains | | | | | 36,595 | |
| |
Net Unrealized Gains and Losses | | | | | | |
| Net unrealized gains on investments | | | | | 278,152 | |
| Net unrealized gains on foreign currency transactions | | | | + | 55 | |
Net unrealized gains | | | | | 278,207 | |
| |
Expenses | | | | | | |
| Investment adviser and administrator fees | | | | | 6,041 | |
Transfer agent and shareholder service fees:
| | | | | | |
| Investor shares | | | | | 1,641 | |
| Select shares | | | | | 876 | |
| Custodian fees | | | | | 630 | |
| Portfolio accounting fees | | | | | 94 | |
| Shareholder reports | | | | | 91 | |
| Professional fees | | | | | 49 | |
| Trustees’ fees | | | | | 15 | |
| Registration fees | | | | | 8 | |
| Overdraft expense | | | | | 4 | |
| Other expenses | | | | + | 11 | |
| Total expenses | | | | | 9,460 | |
| Expense reduction by adviser and Schwab | | | | – | 557 | |
Net expenses | | | | | 8,903 | |
| |
Increase in Net Assets from Operations | | | | | | |
Total investment income | | | | | 47,513 | |
Net expenses | | | | – | 8,903 | |
Net investment income | | | | | 38,610 | |
Net realized gains | | | | | 36,595 | |
Net unrealized gains | | | | + | 278,207 | |
Increase in net assets from operations | | | | $ | 353,412 | |
See financial notes. 61
Schwab International Index Fund
Statements of
Changes in Net Assets
For the current and prior report periods. All numbers x 1,000.
| | | | 11/1/05–10/31/06
| | 11/1/04–10/31/05
|
|---|
| Net investment income | | | | $ | 38,610 | | | $ | 29,254 | |
| Net realized gains | | | | | 36,595 | | | | 15,815 | |
| Net unrealized gains | | | | + | 278,207 | | | | 169,670 | |
Increase in net assets from operations | | | | | 353,412 | | | | 214,739 | |
| |
Distributions Paid | | | | | | | | | | |
Dividends from net investment income | | | | | | | | | | |
| Investor Shares | | | | | 12,022 | | | | 10,423 | |
| Select Shares | | | | + | 17,265 | | | | 14,231 | |
Total dividends from net investment income | | | | $ | 29,287 | | | $ | 24,654 | |
Transactions in Fund Shares | | | | | | | | | | | | | | | | | | |
| | | | 11/1/05–10/31/06
| | 11/1/04–10/31/05
| |
|---|
| | | | SHARES
| | VALUE
| | SHARES
| | VALUE
|
|---|
Shares Sold | | | | | | | | | | | | | | | | | | |
| Investor Shares | | | | | 5,781 | | | $ | 111,778 | | | | 5,337 | | | $ | 85,930 | |
| Select Shares | | | | + | 7,746 | | | | 148,437 | | | | 7,993 | | | | 128,120 | |
Total shares sold | | | | | 13,527 | | | $ | 260,215 | | | | 13,330 | | | $ | 214,050 | |
| |
Shares Reinvested | | | | | | | | | | | | | | | | | | |
| Investor Shares | | | | | 619 | | | $ | 11,010 | | | | 617 | | | $ | 9,445 | |
| Select Shares | | | | + | 882 | | | | 15,675 | | | | 864 | | | | 13,224 | |
Total shares reinvested | | | | | 1,501 | | | $ | 26,685 | | | | 1,481 | | | $ | 22,669 | |
| |
Shares Redeemed | | | | | | | | | | | | | | | | | | |
| Investor Shares | | | | | (7,861 | ) | | $ | (150,978 | ) | | | (8,209 | ) | | $ | (132,435 | ) |
| Select Shares | | | | + | (8,930 | ) | | | (171,954 | ) | | | (9,795 | ) | | | (160,690 | ) |
Total shares redeemed | | | | | (16,791 | ) | | $ | (322,932 | ) | | | (18,004 | ) | | $ | (293,125 | ) |
| |
Net transactions in fund shares | | | | | (1,763 | ) | | $ | (36,032 | ) | | | (3,193 | ) | | $ | (56,406 | ) |
Shares Outstanding and Net Assets | | | | | | | | | | | | | | | | | | |
| | | | 11/1/05–10/31/06
| | 11/1/04–10/31/05
| |
|---|
| | | | SHARES
| | NET ASSETS
| | SHARES
| | NET ASSETS
|
|---|
| Beginning of period | | | | | 80,273 | | | $ | 1,371,186 | | | | 83,466 | | | $ | 1,237,507 | |
| Total increase or decrease | | | | + | (1,763 | ) | | | 288,093 | | | | (3,193 | ) | | | 133,679 | |
End of period | | | | | 78,510 | | | $ | 1,659,279 | | | | 80,273 | | | $ | 1,371,186 | |
Net investment income not yet distributed | | | | | | | | $ | 34,946 | | | | | | | $ | 25,265 | |
62 See financial notes.
Schwab Equity Index Funds
Financial Notes
| 1. | | Business Structure of the Funds |
Each of the funds discussed in this report is a series of Schwab Capital Trust, except Schwab 1000 Index Fund, which is a series of Schwab Investments. Both Schwab Capital Trust and Schwab Investments (trust) are no-load, open-end management investment companies. Each company is organized as a Massachusetts business trust and is registered under the Investment Company Act of 1940, as amended. The list below shows all the funds in each trust including the funds discussed in this report, which are highlighted:
Schwab Capital Trust (organized May 7, 1993)
Schwab S&P 500 Index Fund
Schwab Institutional Select® S&P 500 Fund
Schwab Small-Cap Index Fund®
Schwab Total Stock Market Index Fund®
Schwab International Index Fund®
Schwab MartketTrack All Equity PortfolioTM
Schwab MarketTrack Growth PortfolioTM
Schwab MarketTrack Balanced PortfolioTM
Schwab MarketTrack Conservative PortfolioTM
Laudus U.S. MarketMasters FundTM
Laudus Small-Cap MarketMasters FundTM
Laudus International MarketMasters FundTM
Schwab Viewpoints FundTM
Schwab Premier Equity Fund®
Schwab Core Equity FundTM
Schwab Dividend Equity FundTM
Schwab Large-Cap Growth FundTM
Schwab Small-Cap Equity FundTM
Schwab Hedged Equity FundTM
Schwab Financial Services FundTM
Schwab Health Care FundTM
Schwab Technology FundTM
Schwab Target 2010 Fund
Schwab Target 2020 Fund
Schwab Target 2030 Fund
Schwab Target 2040 Fund
Schwab Retirement Income Fund | | Schwab Investments (organized October 26, 1990)
Schwab 1000 Index® Fund
Schwab YieldPlus Fund®
Schwab Short-Term Bond Market FundTM
Schwab Total Bond Market FundTM
Schwab Inflation Protected FundTM
Schwab GNMA FundTM
Schwab Tax-Free YieldPlus FundTM
Schwab Short/Intermediate Tax-Free Bond FundTM
Schwab Long-Term Tax-Free Bond FundTM
Schwab California Tax-Free YieldPlus FundTM
Schwab California Short/Intermediate
Tax-Free Bond FundTM
Schwab California Long-Term Tax-Free Bond Fund FundTM |
The Schwab Equity Index Funds, with the exception of Schwab Institutional Select S&P 500 Fund, offer multiple share classes. Shares of each class represent interest in the same portfolio, but each class has different expenses and investment minimums. In addition, one share class, e.Shares®, is available only to clients of Schwab Institutional®, Charles Schwab Trust Company and certain tax-advantaged retirement plans, and can only be traded electronically. Schwab S&P 500 Index Fund offers three classes of shares: Investor Shares, Select Shares® and e.Shares®. Schwab 1000 Index Fund, Schwab Small-Cap Index Fund, Schwab Total Market Index Fund and Schwab International Index Fund each offer two classes of shares: Investor Shares and Select Shares®. Schwab Institutional Select S&P 500 Fund offers one share class.
Shares are bought and sold at net asset value, or NAV, which is the price for all outstanding shares. Each share has a par value of 1/1,000 of a cent, and the trustees may issue as many shares as necessary.
| 2. | | Significant Accounting Policies: |
The following is a summary of the significant accounting policies in the preparation of financial statements. The accounting policies are in conformity with accounting principles generally accepted in the United States of America.
63
Schwab Equity Index Funds
Financial Notes (continued)
2. Significant Accounting Policies (continued):
The funds value the securities in their portfolios every business day. The funds use the following policies to value various types of securities:
| | Securities traded on an exchange or over-the-counter: valued at the closing value for the day, or, on days when no closing value has been reported, halfway between the most recent bid and asked quotes. Securities that are primarily traded on foreign exchanges are valued at the closing values of such securities on their respective exchanges with these values then translated into U.S. dollars at the current exchange rate. |
Securities for which no quoted value is available or when a significant event has occurred between the time of the security’s last close and the time the fund calculates net asset value: valued at fair value, as determined in good faith by the fund’s investment adviser using guidelines adopted by the fund’s Board of Trustees and the Pricing Committee. Some of the more common reasons that may necessitate that a security be valued at fair value include: the security’s trading has been halted or suspended; the security has been de-listed from a national exchange; the security’s primary trading market is temporarily closed at a time when under normal conditions it would be open; or the security’s primary pricing source is not able or willing to provide a price, or certain foreign securities’ closing market prices adjusted for changes in value that may occur between the close of foreign exchange and the time at which Fund shares are priced. The Board of Trustees regularly reviews fair value determinations made by the funds pursuant to the procedures.
Futures and forwards: open contracts are valued at their settlement prices as of the close of their exchanges (for futures) or at a market value based on that day’s exchange rates (for forwards). When a fund closes out a futures or forwards position, it calculates the difference between the value of the position at the beginning and at the end, and records a realized gain or loss accordingly.
Short-term securities (60 days or less to maturity): valued at amortized cost.
Mutual funds: valued at their respective net asset values as determined by those funds in accordance with the 1940 Act for a given day.
(b) | | Portfolio Investments: |
Futures Contract: The funds may invest in futures contracts. Futures contracts involve certain risks because they can be very sensitive to market movements.
One risk is that the price of a futures contract may not move in perfect correlation with the price of the underlying securities. Another risk is that, at certain times, it may be impossible for a fund to close out a position in a futures contract, due to a difference in trading hours or to market conditions that may reduce the liquidity for a futures contract or its underlying securities. The potential for losses associated with futures contracts may exceed amounts recorded in the Statement of Assets and Liabilities.
Because futures contracts carry inherent risks, a fund must give the broker a deposit of cash and/or securities (the “initial margin”) whenever it enters into the futures contract. The amount of the deposit may vary from one contract to another, but it is generally a percentage of the contract amount.
Futures are traded publicly on exchanges, and their market value changes daily. A fund records the change in market value of futures, and also the change in the amount of margin deposit required (“due to/from broker”).
Forward Currency Contract: The Schwab International Index Fund may invest in forward currency contracts in connection with the purchase and sale of portfolio securities to minimize the uncertainty of changes in future exchange rates. “Forwards” as they are known, are contracts to buy and sell a currency at a set price on a future date. Forwards are similar to futures except that they are not publicly traded, but are agreements directly between two parties.
As with futures, forwards involve certain risks that are not fully reflected in the fund’s financials. If counter-parties to the contracts or if the value of the foreign currency changes unfavorably, the fund could sustain a loss.
Securities Lending: The funds may loan securities to certain brokers, dealers and other financial institutions that pay the funds negotiated fees. The funds receive cash, letters of credit or U.S. Government securities as collateral on these loans. All of the cash collateral received is reinvested in high quality, short-term investments. The value of the collateral must be at least
64
Schwab Equity Index Funds
Financial Notes (continued)
2. Significant Accounting Policies (continued):
102% of the market value of the loaned securities as of the first day of the loan, and at least 100% each day thereafter. If the value of the collateral falls below 100%, it will be adjusted the following day.
(c) | | Security Transactions: |
Security transactions are recorded as of the date the order to buy or sell the security is executed. Realized gains and losses from security transactions are based on the identified costs of the securities involved.
Interest income is recorded as it accrues. Dividends and distributions from portfolio securities and underlying funds are recorded on the date they are effective (the ex-dividend date), although the funds record certain foreign security dividends on the day they learn of the ex-dividend date.
Expenses that are specific to a fund or a class are charged directly to that fund or class. Expenses that are common to all funds within the trust generally are allocated among the funds in proportion to their net assets.
For funds offering multiple share classes, the net investment income, other than class specific expenses, and the realized and unrealized gains or losses, are allocated daily to each class in proportion to its average daily net assets.
(f) | | Foreign Currency Translation: |
Assets and liabilities denominated in foreign currencies are reported in U.S. dollars. For assets and liabilities held on a given date, the dollar value is based on market exchange rates in effect on that date. Transactions involving foreign currencies, including purchases, sales, income receipts and expense payments, are calculated using exchange rates in effect on the transaction date.
(g) | | Distributions to Shareholders: |
The funds pay dividends from net investment income and make distributions from net realized capital gains once a year.
Each fund maintains its own account for purposes of holding assets and accounting, and is considered a separate entity for tax purposes. Within its account, each fund also keeps certain assets in segregated accounts, as may be required by securities law.
Each fund has an arrangement with its custodian bank under which the fund receives a credit for its uninvested cash balance to offset its custody fees and accounting fees. The credit amounts (if any) are disclosed in the statement of operations as a reduction to the fund’s operating expenses.
(i) | | Accounting Estimates: |
The accounting policies described in this report conform with accounting principles generally accepted in the United States of America. Notwithstanding this, shareholders should understand that in order to follow these principles, fund management has to make estimates and assumptions that affect the information reported in the financial statements. It’s possible that once the results are known, they may turn out to be different from these estimates.
(j) | | Federal Income Taxes: |
The funds intend to meet federal income and excise tax requirements for regulated investment companies. Accordingly, the funds distribute substantially all of their net investment income and realized net capital gains (if any) to their respective shareholders each year. As long as a fund meets the tax requirements, it is not required to pay federal income tax.
65
Schwab Equity Index Funds
Financial Notes (continued)
2. Significant Accounting Policies (continued):
Under the funds’ organizational documents, the officers and trustees are indemnified against certain liabilities arising out of the performance of their duties to the funds. In addition, in the normal course of business the funds enter into contracts with their vendors and others that provide general indemnifications. The funds’ maximum exposure under these arrangements is unknown as this would involve future claims that may be made against the funds. However, based on experience, the funds expect the risk of loss to be remote.
(l) | | New Accounting Standards: |
Financial Accounting Standards Board Interpretation (FIN) No. 48 — Accounting for Uncertainty in Tax Positions — An Interpretation of SFAS No. 109, was issued in July 2006 and is effective for fiscal years beginning after December 15, 2006. This Interpretation provides new requirements for the recognition, measurement, and disclosure in the financial statements of a tax position taken or expected to be taken in a tax return when there is uncertainty about whether that tax position will ultimately be sustained. We have not yet completed our evaluation of the impact, if any, of adopting FIN 48 on the Fund’s financial statements.
In September 2006, the Financial Accounting Standards Board (FASB) issued Statement of Financial Accounting Standards No. 157, “Fair Value Measurements” (SFAS No. 157). SFAS No. 157 defines fair value, establishes a framework for measuring fair value in accordance with generally accepted accounting principles and expands disclosure about fair value measurements. SFAS No. 157 is effective for fiscal years beginning after November 15, 2007. Management is currently evaluating the impact the adoption of SFAS No. 157 will have on the Fund’s financial statement disclosures.
| 3. | | Affiliates and Affiliated Transactions:
(All dollar amounts are × 1,000) |
Charles Schwab Investment Management, Inc. (CSIM or the investment adviser), a wholly owned subsidiary of The Charles Schwab Corporation, serves as each fund’s investment adviser and administrator pursuant to an Investment Advisory and Administration Agreement (Advisory Agreement) between it and the trust. Charles Schwab & Co., Inc. (“Schwab”), is an affiliate of the investment adviser and is the trust’s shareholder services agent and transfer agent.
For its advisory and administrative services to each fund, the investment adviser is entitled to receive an annual fee payable monthly based on each fund’s average daily net assets described as follows:
Average daily net assets
| | | | S&P 500
Index Fund
|
| Institutional Select
S&P 500 Fund
|
| 1000
Index Fund
|
| Small-Cap
Index Fund
|
| Total Stock
Market Index
Fund
|
| International
Index Fund
|
|---|
| First $500 million | | | | | 0.15 | % | | | 0.18% | | | | 0.30 | % | | | 0.33 | % | | | 0.30 | % | | | 0.43 | % |
| Over $500 million | | | | | 0.09 | % | | | 0.18% | | | | 0.22 | % | | | 0.28 | % | | | 0.22 | % | | | 0.38 | % |
| Over $1 billion | | | | | 0.09 | % | | | 0.15% | | | | 0.22 | % | | | n/a | | | | n/a | | | | n/a | |
| Over $5 billion | | | | | 0.08 | % | | | n/a | | | | 0.20 | % | | | n/a | | | | n/a | | | | n/a | |
| Over $10 billion | | | | | 0.07 | % | | | n/a | | | | 0.18 | % | | | n/a | | | | n/a | | | | n/a | |
For its transfer agent and shareholder services, Schwab is entitled to receive an annual fee payable monthly based on each fund’s average daily net assets described as follows:
| | | | Transfer Agent Fees
|
| Shareholder Service Fees
|
|---|
| Investor Shares | | | | | 0.05 | % | | | 0.20 | % |
| Select Shares | | | | | 0.05 | % | | | 0.05 | %* |
| e.Shares* | | | | | 0.05 | % | | | 0.05 | % |
| Institutional Select Fund Shares | | | | | 0.05 | % | | | 0.05 | % |
| * | | e.Shares is only offered by S&P 500 Index Fund |
66
Schwab Equity Index Funds
Financial Notes (continued)
3. Affiliates and Affiliated Transactions (continued):
Although these agreements specify certain fees for these services, CSIM and Schwab have made additional agreements with the funds to limit the total expenses charged, excluding interest, taxes and certain non-routine expenses, through February 27, 2007, as follows:
| | | | S&P 500
Index Fund
|
| Institutional Select
S&P 500 Fund
|
| 1000
Index Fund
|
| Small-Cap
Index Fund
|
| Total Stock
Market Index
Fund
|
| International
Index Fund
|
|---|
| Investor Shares | | | | | 0.37 | % | | | n/a | | | | 0.51 | % | | | 0.60 | % | | | 0.58 | % | | | 0.69 | % |
| Select Shares | | | | | 0.19 | % | | | n/a | | | | 0.36 | % | | | 0.42 | % | | | 0.39 | % | | | 0.50 | % |
| e.Shares* | | | | | 0.28 | % | | | n/a | | | | n/a | | | | n/a | | | | n/a | | | | n/a | |
| Institutional Select Shares | | | | | n/a | | | | 0.10% | | | | n/a | | | | n/a | | | | n/a | | | | n/a | |
| * | | e.Shares is only offered by S&P 500 Index Fund |
The funds may engage in certain transactions involving related parties. For instance, a fund may own shares of The Charles Schwab Corporation if that company is included in its index. The funds also may let other Schwab Funds buy and sell fund shares, particularly Schwab MarketTrack Portfolios, which seek to provide investors with allocated portfolios of Schwab Index funds. As of October 31, 2006, the percentages of fund shares owned by other Schwab Funds are:
| | | | S&P 500
Index Fund
|
| Institutional
Select S&P 500
Fund
|
| 1000
Index Fund
|
| Small-Cap
Index Fund
|
| Total Stock
Market Index
Fund
|
| International
Index Fund
|
|---|
Schwab MarketTrack Portfolios: | | | | | | | | | | | | | | | | | | | |
| All Equity Portfolio | | | | | — | | | | 11.3 | % | | | — | | | | 7.9 | % | | | — | | | | 9.5 | % |
| Growth Portfolio | | | | | — | | | | 8.2 | % | | | — | | | | 8.5 | % | | | — | | | | 8.6 | % |
| Balanced Portfolio | | | | | — | | | | 4.1 | % | | | — | | | | 4.8 | % | | | — | | | | 4.8 | % |
| Conservative Portfolio | | | | | — | | | | 0.1 | % | | | — | | | | 1.9 | % | | | — | | | | 1.9 | % |
| |
Schwab Annuity Portfolios: | | | | | | | | | | | | | | | | | | | | | | | | | | |
| Growth Portfolio II | | | | | — | | | | 0.6 | % | | | — | | | | 0.5 | % | | | — | | | | 0.5 | % |
The funds may make direct transactions with certain other Schwab Funds when practical. When one fund is seeking to sell a security that another is seeking to buy, an interfund transaction can allow both funds to benefit by reducing transaction costs. This practice is limited to funds that share the same investment adviser, trustees and officers. As of October 31, 2006, each fund’s total security transactions with other Schwab Funds were as follows:
| Schwab S&P 500 Index Fund | | | | | — | |
| Institutional Select S&P 500 Fund | | | | $ | 38,351 | |
| 1000 Index Fund | | | | | 919 | |
| Small-Cap Index Fund | | | | | 151,724 | |
| Total Stock Market Index Fund | | | | | — | |
| International Index Fund | | | | | — | |
Pursuant to an exemptive order issued by the SEC, the funds may enter into interfund borrowing and lending transactions within the Schwab Funds. All loans are for temporary or emergency purposes only. The interest rate charged on the loan is the average of the overnight repurchase agreement rate and the short-term bank loan rate. The interfund lending facility is subject to the oversight and periodic review of the Board of Trustees of the Schwab Funds. There was no interfund borrowing or lending activity for any fund during the period.
Trustees may include people who are officers and/ or directors of the investment adviser or Schwab. Federal securities law limit the percentage of such “interested persons” who may serve on a trust’s board, and the trust was in compliance with these limitations throughout the report period. The trust did not pay any of these persons for their service as trustees, but it did pay non-interested persons (independent trustees), as noted in each fund’s Statement of Operations.
67
Schwab Equity Index Funds
Financial Notes (continued)
4. Purchases and Sales of Investment Securities:
(All dollar amounts are × 1,000)
For the fiscal year ended October 31, 2006, purchases and sales of securities (excluding short-term obligations) were as follows:
| | | | Purchases of Securities
| | Sales/Maturities
of Securities
|
|---|
| S&P 500 Index Fund | | | | $ | 211,595 | | | $1,067,493 | |
| Institutional Select S&P 500 Fund | | | | | 648,618 | | | 24,017 | |
| 1000 Index Fund | | | | | 354,445 | | | 886,836 | |
| Small-Cap Index Fund | | | | | 476,516 | | | 587,563 | |
| Total Stock Market Index Fund | | | | | 36,722 | | | 47,112 | |
| International Index Fund | | | | | 175,256 | | | 193,979 | |
| 5. | | Redemption Fee:
(All dollar amounts are × 1,000) |
The funds impose a short-term redemption fee on any fund shares that are redeemed or exchanged by a shareholder within a specified number of days of the purchase date. For shares purchased on or before 4/29/05 and held less than 180 days, the S&P 500 Index Fund, the 1000 Index Fund, the Small-Cap Index Fund, the Total Market Index Fund and the Institutional Select S&P 500 Fund each charged a redemption fee of 0.75% and the International Index Fund charged a redemption fee of 1.50%. For shares purchased after 4/29/05, the funds charge a redemption fees of 2.00% on shares held 30 days or less. The redemption amounts are net of the redemption fee proceeds on the Statement of Changes in Net Assets. The redemption fees charged during the current and prior fiscal years were:
| | | | Current Period
| | Prior Period
|
|---|
S&P 500 Index Fund | | | | | | | | | |
| Investor Shares | | | | $ | 57 | | | $192 | |
| Select Shares | | | | | 60 | | | 200 | |
| e.Shares | | | | | 2 | | | 15 | |
Institutional Select S&P 500 Fund | | | | | 31 | | | 40 | |
1000 Index Fund | | | | | | |
| Investor Shares | | | | | 87 | | | 151 | |
| Select Shares | | | | | 22 | | | 65 | |
Small-Cap Index Fund | | | | | | |
| Investor Shares | | | | | 19 | | | 44 | |
| Select Shares | | | | | 5 | | | 50 | |
Total Stock Market Index Fund | | | | | | |
| Investor Shares | | | | | 15 | | | 38 | |
| Select Shares | | | | | 28 | | | 32 | |
International Index Fund | | | | | | |
| Investor Shares | | | | | 18 | | | 52 | |
| Select Shares | | | | | 63 | | | 106 | |
68
Schwab Equity Index Funds
Financial Notes (continued)
6. Borrowing:
(All dollar amounts are × 1,000)
The funds may borrow money from banks and custodians. The funds may obtain temporary bank loans through the trusts to which they belong, to use for meeting shareholder redemptions or for extraordinary or emergency purposes. The Schwab Funds have custodian overdraft facilities and line of credit arrangements of $150 million and $100 million with State Street Corporation, and Bank of America, N.A., respectively. The funds pay interest on the amounts they borrow at rates that are negotiated periodically.
Fund
| | Amount
Outstanding
at 10/31/06
|
| Average
Borrowing*
|
| Weighted
Average
Interest
Rate*(%)
|
|---|
| Schwab S&P 500 Index Fund | | $ | — | | | $ | 6,094 | | | | 4.94 | |
| Schwab Institutional Select S&P 500 Fund | | | — | | | | 1,970 | | | | 4.78 | |
| Schwab 1000 Index Fund | | | — | | | | — | | | | — | |
| Schwab Small-Cap Index Fund | | | — | | | | 2,451 | | | | 5.00 | |
| Schwab Total Stock Market Index Fund | | | 715 | | | | 1,874 | | | | 4.74 | |
| Schwab International Index Fund | | | — | | | | 600 | | | | 5.15 | |
| * | | Based on the number of days for which the borrowing is outstanding. |
| 7. | | Federal Income Taxes:
(All dollar amounts are × 1,000) |
As of October 31, 2006, the components of undistributable earnings on a tax-basis were as follows:
| | S&P 500
Index Fund
|
| Institutional Select
S&P 500 Fund
|
| 1000
Index Fund
|
| Small-Cap
Index Fund
|
| Total Stock
Market Index
Fund
|
| International
Index Fund
|
|---|
| Undistributed ordinary income | | $ | 100,766 | | | $ | 24,467 | | | $ | 70,645 | | | $ | 59,382 | | | $ | 13,299 | | | $ | 47,026 | |
Undistributed long-term
capital gains | | | — | | | | — | | | | — | | | | 145,855 | | | | — | | | | — | |
| Unrealized appreciation on investments | | | 2,828,797 | | | | 272,607 | | | | 3,776,628 | | | | 498,655 | | | | 419,712 | | | | 699,603 | |
| Unrealized depreciation on investments | | | (514,663 | ) | | | (40,526 | ) | | | (144,026 | ) | | | (85,822 | ) | | | (94,145 | ) | | | (32,253 | ) |
| Other unrealized appreciation/depreciation | | | — | | | | — | | | | — | | | | 182 | | | | — | | | | 11 | |
| Net unrealized appreciation/ (depreciation) | | | 2,314,134 | | | | 232,081 | | | | 3,632,602 | | | | 413,015 | | | | 325,567 | | | | 667,361 | |
The primary difference between book-basis and tax-basis unrealized appreciation or unrealized depreciation of investments is the tax deferral of losses on wash sales.
Capital loss carry forwards may be used to offset future realized capital gains for federal income tax purposes. As of October 31, 2006, the following funds had capital loss carry forwards expiring in:
Expire
| | S&P 500
Index Fund
|
| Institutional Select
S&P 500 Fund
|
| 1000
Index Fund
|
| Small-Cap
Index Fund
|
| Total Stock
Market Index
Fund
|
| International
Index Fund
|
|---|
| 2008 | | $ | 26,504 | | | $ | — | | | $ | — | | | $ | — | | | $ | — | | | $ | — | |
| 2009 | | | 50,224 | | | $ | 16,907 | | | | — | | | | — | | | | — | | | | 97,628 | |
| 2010 | | | 400,268 | | | | 27,646 | | | | 132,657 | | | | — | | | | 8,568 | | | | 112,722 | |
| 2011 | | | 72,381 | | | | 1,609 | | | | 164,037 | | | | — | | | | 3,976 | | | | 39,016 | |
| 2012 | | | 29,212 | | | | | | | | 11,942 | | | | — | | | | 874 | | | | 8,278 | |
| 2013 | | | 175,896 | | | | | | | | — | | | | — | | | | — | | | | — | |
| 2014 | | | 109,257 | | | | 2,359 | | | | — | | | | — | | | | — | | | | — | |
| Total | | $ | 863,742 | | | $ | 48,521 | | | $ | 308,636 | | | | — | | | $ | 13,418 | | | $ | 257,644 | |
69
Schwab Equity Index Funds
Financial Notes (continued)
7. Federal Income Taxes (continued):
For tax purposes, realized capital losses, occurring after October 31, may be deferred and treated as occurring on the first day of the following fiscal year. As of October 31, 2006, the funds had aggregate deferred realized capital losses as follows:
| | | | S&P 500
Index Fund
|
| Institutional Select
S&P 500 Fund
|
| 1000
Index Fund
|
| Small-Cap
Index Fund
|
| Total Stock
Market Index
Fund
|
| International
Index Fund
|
|---|
| Deferred capital losses | | | | $ | — | | | $ | — | | | $ | — | | | $ | — | | | $ | — | | | $ | — | |
| Capital losses utilized | | | | $ | — | | | $ | — | | | $ | 200,195 | | | $ | — | | | $ | 3,960 | | | $ | — | |
The tax-basis components of distributions paid during the current and prior fiscal years were:
| | | | S&P 500
Index Fund
|
| Institutional Select
S&P 500 Fund
|
| 1000
Index Fund
|
| Small-Cap
Index Fund
|
| Total Stock
Market Index
Fund
|
| International
Index Fund
|
|---|
Current period distributions | | | | | | | | | | | | | | | | | | | | | | | | | | |
| Ordinary income | | | | $ | 129,338 | | | $ | 18,249 | | | $ | 86,881 | | | $ | 11,211 | | | $ | 15,301 | | | $ | 29,287 | |
| Long-term capital gains | | | | | — | | | | — | | | | — | | | | 10,495 | | | | — | | | | — | |
| Return of capital | | | | | | | | | | | | | | | | | | | | | | | | | | |
| |
Prior period distributions | | | | | | | | | | | | | | | | | | | | | | | | | | |
| Ordinary income | | | | | 144,350 | | | | 6,241 | | | | 95,632 | | | | 11,451 | | | | 15,726 | | | | 24,654 | |
| Long-term capital gains | | | | | — | | | | — | | | | — | | | | — | | | | — | | | | — | |
| Return of capital | | | | | | | | | | | | | | | | | | | | | | | | | | |
The permanent book and tax basis differences may result in reclassifications between capital account and other accounts as required. The adjustments will have no impact on net assets or the results of operations. As of October 31, 2006, the funds made the following reclassifications:
| | S&P 500
Index Fund
|
| Institutional Select
S&P 500 Fund
|
| 1000
Index Fund
|
| Small-Cap
Index Fund
|
| Total Stock
Market Index
Fund
|
| International
Index Fund
|
|---|
| Capital shares | | $ | (74 | ) | | $ | (8 | ) | | $ | 235 | | | $ | 560 | | | $ | (28 | ) | | $ | — | |
| Undistributed net investment income | | | (868 | ) | | | (104 | ) | | | (1,600 | ) | | | (1,466 | ) | | | (260 | ) | | | 358 | |
| Net realized capital gains and losses | | | 942 | | | | 112 | | | | 1,365 | | | | 906 | | | | 288 | | | | (358 | ) |
Other Federal Tax Information (unaudited)
(All dollar amounts are × 1,000)
For corporate shareholders, the following percentage of the funds dividend distributions paid during the fiscal year ended October 31, 2006, qualify for the corporate dividends received deduction:
| | | | Percentage
|
|---|
| S&P 500 Index Fund | | | | | 100.00 | % |
| Institutional Select S&P 500 Fund | | | | | 97.68 | |
| 1000 Index Fund | | | | | 100.00 | |
| Small-Cap Index Fund | | | | | 81.82 | |
| Total Stock Market Index Fund | | | | | 100.00 | |
| International Index Fund | | | | | — | |
For the fiscal year ended October 31, 2006, the fund’s designate the following amounts of the dividend distributions as qualified dividends for the purpose of the maximum rate under section 1(h)(ii) of the Internal Revenue Code. Shareholders will be notified in January 2007 via IRS form 1099 of the amounts for use in preparing their 2006 income tax return.
| S&P 500 Index Fund | | | | $ | 129,338 | |
| Institutional Select S&P Fund | | | | | 18,249 | |
| 1000 Index Fund | | | | | 86,881 | |
| Small-Cap Index Fund | | | | | 11,137 | |
| Total Stock Market Index Fund | | | | | 15,301 | |
| International Index Fund | | | | | 29,287 | |
70
Report of Independent Registered Public Accounting Firm
To the Board of Trustees and Shareholders of:
Schwab S&P 500 Index Fund
Schwab Institutional Select S&P 500 Fund
Schwab 1000 Index Fund
Schwab Small-Cap Index Fund
Schwab Total Stock Market Index Fund
Schwab International Index Fund
In our opinion, the accompanying statements of assets and liabilities, including the portfolio holdings, and the related statements of operations and of changes in net assets and the financial highlights present fairly, in all material respects, the financial position of Schwab 1000 Index Fund (one of the portfolios constituting Schwab Investments), Schwab S&P 500 Index Fund, Schwab Institutional Select S&P 500 Fund, Schwab Small-Cap Index Fund, Schwab Total Stock Market Index Fund and Schwab International Index Fund (five of the portfolios constituting Schwab Capital Trust, hereafter referred to as the “Funds”) at October 31, 2006, the results of each of their operations for the year then ended, the changes in each of their net assets for each of the two years in the period then ended and the financial highlights for each of the five years in the period then ended, in conformity with accounting principles generally accepted in the United States of America. These financial statements and financial highlights (hereafter referred to as “financial statements”) are the responsibility of the Funds’ management; our responsibility is to express an opinion on these financial statements based on our audits. We conducted our audits of these financial statements in accordance with the standards of the Public Company Accounting Oversight Board (United States). Those standards require that we plan and perform the audits to obtain reasonable assurance about whether the financial statements are free of material misstatement. An audit includes examining, on a test basis, evidence supporting the amounts and disclosures in the financial statements, assessing the accounting principles used and significant estimates made by management, and evaluating the overall financial statement presentation. We believe that our audits, which included confirmation of securities at October 31, 2006 by correspondence with the custodian and brokers, provide a reasonable basis for our opinion.
PricewaterhouseCoopers LLP
San Francisco, California
December 14, 2006
71
Investment Advisory Agreement Approval
The Investment Company Act of 1940 (the “1940 Act”) requires that initial approval of, as well as the continuation of, a fund’s investment advisory agreement must be specifically approved (1) by the vote of the trustees or by a vote of the shareholders of the fund, and (2) by the vote of a majority of the trustees who are not parties to the investment advisory agreement or “interested persons” of any party (the “Independent Trustees”), cast in person at a meeting called for the purpose of voting on such approval. In connection with such approvals, the fund’s trustees must request and evaluate, and the investment adviser is required to furnish, such information as may be reasonably necessary to evaluate the terms of the advisory agreement. In addition, the Securities and Exchange Commission (the “SEC”) takes the position that, as part of their fiduciary duties with respect to fund fees, fund boards are required to evaluate the material factors applicable to a decision to approve an investment advisory agreement.
Consistent with these responsibilities, the Board of Trustees (the “Board”) calls and holds one or more meetings each year that are dedicated, in whole or in part, to considering whether to renew the investment advisory agreement between Schwab Capital Trust and Schwab Investments (collectively, the “Trust”) and CSIM (the “Agreement”) with respect to existing funds in the Trust, including the funds covered in this annual report, and to review certain other agreements pursuant to which CSIM provides investment advisory services to certain other registered investment companies. In preparation for the meeting(s), the Board requests and reviews a wide variety of materials provided by CSIM, including information about CSIM’s affiliates, personnel and operations. The Board also receives extensive data provided by third parties. This information is in addition to the detailed information about the funds that the Board reviews during the course of each year, including information that relates to fund operations and fund performance. The trustees also receive a memorandum from fund counsel regarding the responsibilities of trustees for the approval of investment advisory contracts. In addition, the Independent Trustees receive advice from independent counsel to the Independent Trustees, meet in executive session outside the presence of fund management and participate in question and answer sessions with representatives of CSIM.
The Board, including a majority of the Independent Trustees, considered information specifically relating to the continuance of the Agreement at meetings held on May 2, 2006, May 24, 2006 and June 12, 2006, and approved the renewal of the Agreement for an additional one year term at the meeting held on June 12, 2006. The Board’s approval of the Agreement was based on consideration and evaluation of a variety of specific factors discussed at these meetings and at prior meetings, including:
| 1. | | the nature, extent and quality of the services provided to the funds under the Agreement, including the resources of CSIM and its affiliates dedicated to the funds; |
| 2. | | each fund’s investment performance and how it compared to that of certain other comparable mutual funds; |
| 3. | | each fund’s expenses and how those expenses compared to those of certain other comparable mutual funds; |
| 4. | | the profitability of CSIM and its affiliates, including Charles Schwab & Co., Inc. (“Schwab”), with respect to each fund, including both direct and indirect benefits accruing to CSIM and its affiliates; and |
| 5. | | the extent to which economies of scale would be realized as the funds grow and whether fee levels in the Agreement reflect those economies of scale for the benefit of fund investors. |
Nature, Extent and Quality of Services. The Board considered the nature, extent and quality of the services provided by CSIM to the funds and the resources of CSIM and its affiliates dedicated to the funds. In this regard, the trustees evaluated, among other things, CSIM’s personnel, experience, track record and compliance program. The information considered by the trustees included specific information concerning changes in the nature, extent and quality of services provided by CSIM since the trustees had last considered approval of the Agreement. The trustees also considered the fact that Schwab’s extensive branch network, Internet access, investment and research tools, telephone services, and array of account features benefit the funds and their shareholders. The trustees also considered Schwab’s excellent reputation as a full service brokerage firm and its overall financial condition. Finally, the trustees considered that the vast majority of the funds’ shareholders are also brokerage clients of Schwab, and that CSIM and its affiliates are uniquely positioned to provide services and support to the funds and such shareholders. Following such evaluation, the Board concluded, within the context of its full deliberations, that the nature, extent and quality of services provided by CSIM to the funds and the resources of CSIM and its affiliates dedicated to the funds supported renewal of the Agreement.
Fund Performance. The Board considered fund performance in determining whether to renew the Agreement. Specifically, the trustees considered each fund’s
72
performance relative to a peer group of other mutual funds and appropriate indices/benchmarks, in light of total return and market trends. As part of this review, the trustees considered the composition of the peer group, selection criteria and the reputation of the third party who prepared the peer group analysis. In evaluating the performance of each fund, the trustees considered both market risk and shareholder risk expectations for such fund and the appropriateness of the benchmark used to compare the performance of each fund. The trustees further considered the level of fund performance in the context of its review of fund expenses and adviser profitability discussed below. Following such evaluation the Board concluded, within the context of its full deliberations, that the performance of the funds supported renewal of the Agreement.
Fund Expenses. With respect to the funds’ expenses, the trustees considered the rate of compensation called for by the Agreement, and each fund’s net operating expense ratio, in each case, in comparison to those of other comparable mutual funds, such peer groups and comparisons having been selected and calculated by an independent third party. The trustees considered the effects of CSIM’s and Schwab’s historical practice of voluntarily waiving management and other fees to prevent total fund expenses from exceeding a specified cap. The trustees also considered fees charged by CSIM to other mutual funds and to other types of accounts, such as wrap accounts, but, with respect to such other types of accounts, accorded less weight to such comparisons due to the different legal, regulatory, compliance and operating features of mutual funds as compared to these other types of accounts. Following such evaluation, the Board concluded, within the context of its full deliberations, that the expenses of the funds are reasonable and supported renewal of the Agreement.
Profitability. With regard to profitability, the trustees considered the compensation flowing to CSIM and its affiliates, directly or indirectly. In this connection, the trustees reviewed management’s profitability analyses, together with certain commentary thereon from an independent accounting firm. The trustees also considered any other benefits derived by CSIM from its relationship with the funds, such as whether, by virtue of its management of the funds, CSIM obtains investment information or other research resources that aid it in providing advisory services to other clients. The trustees considered whether the varied levels of compensation and profitability under the Agreement and other service agreements were reasonable and justified in light of the quality of all services rendered to each fund by CSIM and its affiliates. The Board also considered information relating to changes to CSIM’s cost structure, including cost savings, technology investments and increased operating efficiencies and how these changes affected CSIM’s profitability under the Agreement. Based on this evaluation, the Board concluded, within the context of its full deliberations, that the profitability of CSIM is reasonable and supported renewal of the Agreement.
Economies of Scale. The trustees considered the existence of any economies of scale and whether those are passed along to a fund’s shareholders through a graduated investment advisory fee schedule or other means, including any fee waivers by CSIM and its affiliates. In this regard, and consistent with their consideration of fund expenses, the trustees considered that CSIM and Schwab have previously committed resources to minimize the effects on shareholders of diseconomies of scale during periods when fund assets were relatively small through their contractual expense waivers. For example, such diseconomies of scale may particularly affect newer funds or funds with investment strategies that are from time to time out of favor, but shareholders may benefit from the continued availability of such funds at subsidized expense levels. The trustees also considered CSIM’s agreement to contractual investment advisory fee schedules that include lower fees at higher graduated asset levels. The Board also considered certain commitments by CSIM and Schwab that are designed to pass along potential economies of scale to fund shareholders. Specifically, the Board considered CSIM and Schwab’s commitments, which may be changed only with Board approval: (i) to reduce contractual advisory fees or add breakpoints for certain funds, and (ii) to implement, by means of expense limitation agreement, reductions in net overall expenses for certain funds. Based on this evaluation, and in consideration of the commitments made by CSIM and Schwab as discussed above, the Board concluded, within the context of its full deliberations, that the funds obtain reasonable benefit from economies of scale.
In the course of their deliberations, the trustees did not identify any particular information or factor that was all-important or controlling. Based on the trustees’ deliberation and their evaluation of the information described above, the Board, including all of the Independent Trustees, unanimously approved the continuation of the Agreement and concluded that the compensation under the Agreement is fair and reasonable in light of such services and expenses and such other matters as the trustees have considered to be relevant in the exercise of their reasonable judgment.
73
Trustees and Officers
The tables below gives information about the trustees and officers for The Schwab Capital Trust and Schwab Investments, which includes the funds covered in this report. The “Fund Complex” includes The Charles Schwab Family of Funds, Schwab Capital Trust, Schwab Investments, Schwab Annuity Portfolios, Laudus Trust, Laudus Variable Insurance Trust, Excelsior Funds, Inc., Excelsior Tax-Exempt Funds, Inc., and Excelsior Funds Trust. As of October 31, 2006, the Fund Complex included 96 funds.
The address for all trustees and officers is 101 Montgomery Street, San Francisco, CA 94104. You can find more information about the trustees and officers in the Statement of Additional Information, which is available free by calling 1-800-435-4000.
Independent Trustees |
Name, Year of Birth,
and Position(s) with
the Trust; (Term of
Office, and Length of
Time Served1) | | | | Principal Occupations
During the Past Five Years | | Number of
Portfolios in
Fund Complex
Overseen by
the Trustee | | Other Directorships |
Mariann Byerwalter
1960
Trustee
(Trustee of Schwab Capital Trust and Schwab Investments since 2000.) | | | | Chairman of JDN Corporate Advisory LLC. From 1996 to 2001, Vice President for Business Affairs and Chief Financial Officer of Stanford University, and in 2001, Special Advisor to the President of Stanford University. | | 96 | | Board 1—Director, Redwood Trust, Inc.
Board 2—Director, PMI Group, Inc. |
Donald F. Dorward
1931
Trustee
(Trustee of Schwab Capital Trust and Schwab Investments since 1989.) | | | | Chief Executive Officer, Dorward & Associates (corporate management, marketing and communications consulting firm). From 1996–1999, Executive Vice President and Managing Director, Grey Advertising. Prior to 1996, President and Chief Executive Officer, Allen & Dorward Advertising. | | 57 | | None. |
William A. Hasler
1941
Trustee
(Trustee of Schwab Capital Trust and Schwab Investments since 2000.) | | | | Retired. Dean Emeritus, Haas School of Business, University of California, Berkeley. Until February 2004, Co-Chief Executive Officer, Aphton Corp. (bio-pharmaceuticals). Prior to August 1998, Dean of the Haas School of Business, University of California, Berkeley (higher education). | | 96 | | Board 1—Director, Aphton Corp.
Board 2—Director, Mission West Properties
Board 3—Director, TOUSA
Board 4—Director, Stratex Networks
Board 5—Director, Genitope Corp.
Board 6—Director & Non-Executive
Chairman, Solectron Corp.
Board 7—Director, Ditech
Communications Corp. |
Robert G. Holmes
1931
Trustee
(Trustee of Schwab Capital Trust and Schwab Investments since 1989.) | | | | Chairman, Chief Executive Officer and Director, Semloh Financial, Inc. (international financial services and investment
advisory firm). | | 57 | | None. |
Gerald B. Smith
1950
Trustee
(Trustee of Schwab Capital Trust and Schwab Investments since 2000.) | | | | Chairman and Chief Executive Officer and founder of Smith Graham & Co.
(investment advisors). | | 57 | | Board 1—Board of Cooper Industries
Board 2—Chairman of the Audit Committee
of Northern Border Partners, M.L.P. |
74
Independent Trustees continued |
Name, Year of Birth,
and Position(s) with
the Trust; (Term of
Office, and Length of
Time Served1) | | | | Principal Occupations
During the Past Five Years | | Number of
Portfolios in
Fund Complex
Overseen by
the Trustee | | Other Directorships |
Donald R. Stephens
1938
Trustee
(Trustee of Schwab Capital Trust and Schwab Investments since 1989.) | | | | Managing Partner, D.R. Stephens & Company (investments). Prior to 1996, Chairman and Chief Executive Officer of North American Trust (real estate
investment trust). | | 57 | | None. |
Michael W. Wilsey
1943
Trustee
(Trustee of Schwab Capital Trust and Schwab Investments since 1989.) | | | | Chairman and Chief Executive Officer, Wilsey Bennett, Inc. (real estate investment and management, and other investments). | | 57 | | None. |
Interested Trustees |
Name, Year of Birth,
and Position(s) with
the Trust; (Term of
Office, and Length of
Time Served1) | | | | Principal Occupations
During the Past Five Years | | Number of
Portfolios in
Fund Complex
Overseen by
the Trustee | | Other Directorships |
Charles R. Schwab2
1937
Chairman and Trustee
(Chairman and Trustee
of Schwab Capital Trust
and Schwab Investments since 1989.) | | | | Chairman, Chief Executive Officer and Director, The Charles Schwab Corporation, Charles Schwab & Co., Inc.; Chairman and Director, Charles Schwab Investment Management, Inc., Charles Schwab Bank, N. A.; Chairman and Chief Executive Officer, Schwab (SIS) Holdings Inc. I, Schwab International Holdings, Inc.; Chief Executive Officer and Director, Schwab Holdings, Inc.; Director, U.S. Trust Company, N. A., U.S. Trust Corporation, United States Trust Company of New York. Until May 2003, Co-Chief Executive Officer, The Charles Schwab Corporation. | | 57 | | None. |
Randall W. Merk2
1954
Trustee
(Trustee of Schwab Capital Trust and Schwab Investments since 2005.) | | | | Executive Vice President and President, Schwab Financial Products, Charles Schwab & Co., Inc.; Director, Charles Schwab Asset Management (Ireland) Limited and Charles Schwab Worldwide Funds PLC. From September 2002 to July 2004, Chief Executive Officer and President, Charles Schwab Investment Management, Inc. and Executive Vice President, Charles Schwab & Co., Inc. Prior to September 2002, President and Chief Investment Officer, American Century Investment Management, and Director, American Century Companies, Inc. | | 96 | | None. |
75
Officers of the Trust |
Name, Year of Birth, and Position(s)
with the Trust; (Term of Office, and
Length of Time Served3) | | | | Principal Occupations During the Past Five Years |
Evelyn Dilsaver
1955
President and Chief Executive Officer
(Officer of Schwab Capital Trust and Schwab Investments since 2004.) | | | | President, Chief Executive Officer, and Director, Charles Schwab Investment Management, Inc.; Executive Vice President, Charles Schwab & Co., Inc; President and Chief Executive Officer, Laudus Trust and Laudus Variable Insurance Trust; President, Excelsior Funds Inc., Excelsior Tax-Exempt Funds, Inc., and Excelsior Funds Trust; President, Mutual Fund Division, UST Advisers, Inc. From June 2003 to July 2004, Senior Vice President, Asset Management Products and Services, Charles Schwab & Co., Inc. Prior to June 2003, Executive Vice President, Chief Financial Officer, and Chief Administrative Officer, U.S. Trust, a subsidiary of The Charles Schwab Corporation. |
George Pereira
1964
Treasurer and Principal Financial Officer
(Officer of Schwab Capital Trust and Schwab Investments since 2004.) | | | | Senior Vice President and Chief Financial Officer, Charles Schwab Investment Management, Inc.; Chief Financial Officer, Laudus Trust and Laudus Variable Insurance Trust; Treasurer, Chief Financial Officer and Chief Accounting Officer, Excelsior Funds Inc., Excelsior Tax-Exempt Funds, Inc., and Excelsior Funds Trust; Chief Financial Officer, Mutual Fund Division, UST Advisors, Inc. Director, Charles Schwab Worldwide Fund, PLC and Charles Schwab Asset Management (Ireland) Limited. From December 1999 to November 2004, Sr. Vice President, Financial Reporting, Charles Schwab & Co., Inc. |
Kimon Daifotis
1959
Senior Vice President and Chief
Investment Officer — Fixed Income
(Officer of Schwab Capital Trust and Schwab Investments since 2004.) | | | | Senior Vice President and Chief Investment Officer — Fixed Income, Charles Schwab Investment Management, Inc. Prior to 2004, Vice President and Sr. Portfolio Manager, Charles Schwab Investment Management, Inc. |
Jeffrey Mortimer
1963
Senior Vice President and Chief
Investment Officer — Equities
(Officer of Schwab Capital Trust and Schwab Investments since 2004.) | | | | Senior Vice President and Chief Investment Officer—Equities, Charles Schwab Investment Management, Inc.; Vice President and Chief Investment Officer, Laudus Trust and Laudus Variable Insurance Trust. Prior to 2004, Vice President and Sr. Portfolio Manager, Charles Schwab Investment Management, Inc. |
Randall Fillmore
1960
Chief Compliance Officer and AML Officer
(Officer of Schwab Capital Trust and Schwab Investments since 2002.) | | | | Senior Vice President and Chief Compliance Officer, Charles Schwab Investment Management, Inc.; Senior Vice President Charles Schwab & Co., Inc.; Chief Compliance Officer, Laudus Trust and Laudus Variable Insurance Trust; Chief Compliance Officer, Excelsior Funds Inc., Excelsior Tax-Exempt Funds, Inc., and Excelsior Funds Trust. From 2002 to 2003, Vice President, Charles Schwab & Co., Inc., and Charles Schwab Investment Management, Inc. From 2000 to 2002, Vice President, Internal Audit, Charles Schwab & Co., Inc. |
Koji E. Felton
1961
Secretary and Chief Legal Officer
(Officer of Schwab Capital Trust and Schwab Investments since 1998.) | | | | Senior Vice President, Chief Counsel and Corporate Secretary, Charles Schwab Investment Management, Inc.; Senior Vice President and Deputy General Counsel, Charles Schwab & Co., Inc.; Chief Legal Officer, Laudus Trust and Laudus Variable Insurance Trust; Chief Legal Officer, Excelsior Funds Inc., Excelsior Tax-Exempt Funds, Inc., and Excelsior Funds Trust. Prior to June 1998, Branch Chief in Enforcement at U.S. Securities and Exchange Commission in San Francisco.
|
Catherine MacGregor
1964
Vice President
(Officer of Schwab Capital Trust since 2005) | | | | Vice President, Charles Schwab & Co., Inc., Charles Schwab Investment Management, Inc., Laudus Trust and Laudus Variable Insurance Trust; since 2006, Chief Counsel, Laudus Trust and Laudus Variable Insurance Trust. Until July 2005, Senior Associate, Paul Hastings Janofsky & Walker LLP. |
76
Officers of the Trust continued |
Name, Year of Birth, and Position(s)
with the Trust; (Term of Office, and
Length of Time Served3) | | | | Principal Occupations During the Past Five Years |
Cathy Sabo
1964
Vice President
(Officer of Schwab Capital Trust since 2005) | | | | Vice President, Compliance, Charles Schwab Investment Management, Inc., Laudus Trust and Laudus Variable Insurance Trust. Until 2004, Vice President, Client, Sales & Services Controls, Charles Schwab & Co., Inc. |
Michael Haydel
1972
Vice President
(Officer of Schwab Capital Trust since 2006) | | | | Vice President, Asset Management Client Services, Charles Schwab & Co., Inc.; Vice President and AML Officer, Laudus Trust and Laudus Variable Insurance Trust. Until March 2004, Director Charles Schwab & Co., Inc. |
1 | | Trustees remain in office until they resign, retire or are removed by shareholder vote. The Schwab Funds retirement policy requires that independent trustees elected after January 1, 2000 retire at age 72 or after twenty years of service as a trustee, whichever comes first. Independent trustees elected prior to January 1, 2000 will retire on the following schedule: Messrs. Holmes and Dorward will retire on December 31, 2007, and Messrs. Stephens and Wilsey will retire on December 31, 2010. |
2 | | In addition to their employment with the investment adviser and the distributor, Messrs. Schwab and Merk also own stock of The Charles Schwab Corporation. Mr. Schwab and Mr. Merk are Interested Trustees because they are employees of Schwab and/or the adviser. |
3 | | The President, Treasurer and Secretary hold office until their respective successors are chosen and qualified or until he or she sooner dies, resigns, is removed or becomes disqualified. Each other officer serves at the pleasure of the Board. |
77
Glossary
asset allocation The practice of dividing a portfolio among different asset classes, with each asset class assigned a particular percentage.
asset class A group of securities with similar structure and basic characteristics. Stocks, bonds and cash are the three main examples of asset classes.
beta A historical measure of an investment’s volatility relative to a market index (usually the S&P 500®). The index is defined as having a beta of 1.00. Investments with a beta higher than 1.00 have been more volatile than the index; those with a beta of less than 1.00 have been less volatile.
bond A security representing a loan from the investor to the issuer. A bond typically pays interest at a fixed rate (the “coupon rate”) until a specified date (the “maturity date”), at which time the issuer returns the money borrowed (“principal” or “face value”) to the bondholder. Because of their structure, bonds are sometimes called “fixed income securities” or “debt securities.”
An individual bond is subject to the credit risk of the issuer. Changes in interest rates can affect a bond’s market value prior to call or maturity. There is no guarantee that a bond’s yield to call or maturity will provide a positive return over the rate of inflation.
bond fund A bond fund is subject to the same credit, interest rate, and inflation risks as bonds. In addition, a bond fund incurs ongoing fees and expenses. A bond fund’s net asset value will fluctuate with the price of the underlying bonds and the portfolio turnover activity; return of principal is not guaranteed.
cap, capitalization See “market cap.”
capital gain, capital loss The difference between the amount paid for an investment and its value at a later time. If the investment has been sold, the capital gain or loss is considered a realized gain or loss. If the investment is still held, the gain or loss is still “on paper” and is considered unrealized.
earnings growth rate For a mutual fund, the average yearly rate at which the earnings of the companies in the fund’s portfolio have grown, measured over the past five years.
earnings per share (EPS) A company’s earnings, or net income, for the past 12 months, divided by the number of shares outstanding.
expense ratio The amount that is taken from a mutual fund’s assets each year to cover the fund’s operating expenses. An expense ratio of 0.50% means that a fund’s expenses amount to half of one percent of its average net assets a year.
market cap, market capitalization The value of a company as determined by the total value of all shares of its stock outstanding.
median market cap The midpoint of the range of market caps of the stocks held by a fund. There are different ways of calculating median market cap. With a simple median, half of the stocks in the fund’s portfolio would be larger than the median, and half would be smaller. With a weighted median (the type that is calculated for these funds), half of the fund’s assets are invested in stocks that are larger than the median market cap, and half in stocks that are smaller.
net asset value (NAV) The value of one share of a mutual fund. NAV is calculated by taking the fund’s total assets, subtracting liabilities, and dividing by the number of shares outstanding.
outstanding shares, shares outstanding When speaking of a company or mutual fund, indicates all shares currently held by investors.
price-to-book ratio (P/B) The market price of a company’s stock compared with its “book value.” A mutual fund’s P/B is the weighted average of the P/B of all stocks in the fund’s portfolio.
price-to-earnings ratio (P/E) The market price of a company’s stock compared with earnings over the past year. A mutual fund’s P/E is the weighted average of the P/E of all stocks in the fund’s portfolio.
return on equity (ROE) The average yearly rate of return for each dollar of investors’ money, measured over the past five years.
stock A share of ownership, or equity, in the issuing company.
total return The percentage that an investor would have earned or lost on an investment in the fund assuming dividends and distributions were reinvested.
weighted average For mutual funds, an average that gives the same weight to each security as the security represents in the fund’s portfolio.
yield The income paid out by an investment, expressed as a percentage of the investment’s market value.
78
Notes
Notes
Schwab Funds® offers you an extensive family of mutual funds, each one based on a clearly defined investment approach and using disciplined management strategies. The list at right shows all currently available Schwab Funds.
Whether you’re an experienced investor or just starting out, Schwab Funds can help you achieve your financial goals. An investor should consider a fund’s investment objectives, risks, and charges and expenses carefully before investing or sending money. This and other important information can be found in the fund’s prospectus. Please call 1-800-435-4000 for a prospectus and brochure for any Schwab Fund. Please read the prospectus carefully before you invest. This report must be preceded or accompanied by a current prospectus.
Proxy Voting Policies, Procedures and Results
A description of the proxy voting policies and procedures used to determine how to vote proxies on behalf of the funds is available without charge, upon request, by visiting Schwab’s website at www.schwab.com/schwabfunds, the SEC’s website at www.sec.gov, or by contacting Schwab Funds at 1-800-435-4000.
Information regarding how a fund voted proxies relating to portfolio securities during the most recent twelve-month period ended June 30 is available, without charge, by visiting Schwab’s website at www.schwab.com/schwabfunds or the SEC’s website at www.sec.gov.
The Schwab Funds Family®
Stock Funds
Schwab Premier Equity Fund®
Schwab Core Equity Fund™
Schwab Dividend Equity Fund™
Schwab Large-Cap Growth Fund™
Schwab Small-Cap Equity Fund™
Schwab Hedged Equity Fund™
Schwab Financial Services Fund™
Schwab Health Care Fund™
Schwab Technology Fund™
Schwab Institutional Select® S&P 500 Fund
Schwab S&P 500 Index Fund
Schwab 1000 Index® Fund
Schwab Small-Cap Index Fund®
Schwab Total Stock Market Index Fund®
Schwab International Index Fund®
Asset Allocation Funds
Schwab Viewpoints Fund™
Schwab MarketTrack All Equity Portfolio™
Schwab MarketTrack Growth Portfolio™
Schwab MarketTrack Balanced Portfolio™
Schwab MarketTrack Conservative Portfolio™
Schwab Target 2010 Fund
Schwab Target 2020 Fund
Schwab Target 2030 Fund
Schwab Target 2040 Fund
Schwab Retirement Income Fund
Bond Funds
Schwab YieldPlus Fund®
Schwab Short-Term Bond Market Fund™
Schwab Total Bond Market Fund™
Schwab GNMA Fund™
Schwab Inflation Protected Fund™
Schwab Tax-Free YieldPlus Fund™
Schwab Short/Intermediate Tax-Free Bond Fund™
Schwab Long-Term Tax-Free Bond Fund™
Schwab California Tax-Free YieldPlus Fund™
Schwab California Short/Intermediate
Tax-Free Bond Fund™
Schwab California Long-Term Tax-Free Bond Fund™
Schwab Money Funds
Schwab offers an array of money market funds that seek high current income consistent with safety and liquidity.1 Choose from taxable or tax-advantaged alternatives. Many can be linked to your eligible Schwab account to “sweep” cash balances automatically, subject to availability, when you’re between investments. Or, for your larger cash reserves, choose one of our Value Advantage Investments®.
1 | | Investments in money market funds are neither insured nor guaranteed by the Federal Deposit Insurance Corporation (FDIC) or any other government agency and, although they seek to preserve the value of your investment at $1 per share, it is possible to lose money. |
Investment Adviser
Charles Schwab Investment Management, Inc.
101 Montgomery Street, San Francisco, CA 94104
Funds
Schwab Funds®
P.O. Box 3812, Englewood, CO 80155—3812
This report is not authorized for distribution to prospective investors unless preceded or accompanied by a current prospectus.
© 2006 Charles Schwab & Co., Inc. All rights reserved.
Member SIPC
Printed on recycled paper.
MFR13810-09
Schwab Active Equity Funds
Annual Report
October 31, 2006
Schwab Premier Equity Fund®
Schwab Core Equity Fund™
Schwab Dividend Equity Fund™
Schwab Large-Cap Growth Fund™
Schwab Small-Cap Equity Fund™
Schwab Hedged Equity Fund™
Schwab Financial Services Fund™
Schwab Health Care Fund™
Schwab Technology Fund™
The power of Schwab Equity Ratings®. The convenience and diversification of mutual funds.
In this report
| Performance at a Glance | | | | | 1 | |
| From the Chairman | | | | | 2 | |
| From the President | | | | | 3 | |
| Investment Environment | | | | | 4 | |
| Schwab Premier Equity Fund® | | | | | 6 | |
| Schwab Core Equity Fund™ | | | | | 8 | |
| Schwab Dividend Equity Fund™ | | | | | 10 | |
| Schwab Large-Cap Growth Fund™ | | | | | 12 | |
| Schwab Small-Cap Equity Fund™ | | | | | 14 | |
| Schwab Hedged Equity Fund™ | | | | | 16 | |
| Schwab Financial Services Fund™ | | | | | 18 | |
| Schwab Health Care Fund™ | | | | | 20 | |
| Schwab Technology Fund™ | | | | | 22 | |
| Fund Expenses | | | | | 24 | |
| Financial Statements | | | | | 26 | |
| Financial Notes | | | | | 87 | |
| Investment Advisory Agreement Approval | | | | | 98 | |
| Trustees and Officers | | | | | 100 | |
| Glossary | | | | | 104 | |
Select Shares® are available on many Schwab Funds®Schwab Funds offers Select Shares, a shares class that carries lower expenses than Investor Shares™ in exchange for higher investment minimums on many of its funds. Select Shares are available for initial purchases of $50,000 or more of a single fund in a single account and for shareholders who add to their existing Investor Share position, bringing the value to or above $50,000. We encourage shareholders of Investor Shares to review their portfolio to see if they are eligible to exchange into Select Shares. If you believe you are eligible, you should contact Schwab or your financial intermediary to request a tax-free interclass exchange into Select Shares. Instructions for performing a tax-free interclass exchange can also be referenced on the Schwab Funds website at www.schwab.com/schwabfunds under Schwab Funds Investor Information. Select Shares may not be available through financial intermediaries other than Charles Schwab & Co., Inc.
The industry/sector classification of the funds’ portfolio holdings uses the Global Industry Classification Standard (GICS) which was developed by and is the exclusive property of Morgan Stanley Capital International Inc. and Standard & Poor’s. GICS is a service mark of MSCI and S&P and has been licensed for use by Charles Schwab & Co., Inc.
Fund investment adviser: Charles Schwab Investment Management, Inc. (CSIM).
Distributor and transfer agent: Charles Schwab & Co., Inc. (Schwab).
Schwab Equity Ratings® are produced by the Schwab Center for Investment Research®.
Performance at a Glance
The performance data quoted represents past performance. Past performance does not guarantee future results. Investment returns and principal value will fluctuate so that an investor’s shares may be worth more or less than their original cost. Current performance may be lower or higher than performance data quoted. To obtain performance information current to the most recent month end, please visit www.schwab.com/schwabfunds.
Total Return for the Report Period
|
|---|
Schwab Premier Equity Fund® | | | | | | |
| Investor Shares (Ticker Symbol: SWPNX) | | | | | 17.22% |
| Select Shares (Ticker Symbol: SWPSX) | | | | | 17.28% |
| Benchmark: S&P 500® Index | | | | | 16.34% |
| Fund Category: Morningstar Large-Cap Blend | | | | | 14.74% |
Performance Details | | | | | pages 6–7 |
| | | | | | | |
Schwab Core Equity Fund™
|
| (Ticker Symbol: SWANX) | | | | | 17.02% |
| Benchmark: S&P 500® Index | | | | | 16.34% |
| Fund Category: Morningstar Large-Cap Blend | | | | | 14.74% |
Performance Details | | | | | pages 8–9 |
| | | | | | | |
Schwab Dividend Equity Fund™ | | | | | | |
| Investor Shares (Ticker Symbol: SWDIX) | | | | | 17.63% |
| Select Shares (Ticker Symbol: SWDSX) | | | | | 17.86% |
| Benchmark: S&P 500® Index | | | | | 16.34% |
| Fund Category: Morningstar Large-Cap Value | | | | | 17.90% |
Performance Details | | | | | pages 10–11 |
| | | | | | | |
Schwab Large-Cap Growth Fund™ | | | | | | |
| Investor Shares (Ticker Symbol: SWLNX) | | | | | 13.80% |
| Select Shares (Ticker Symbol: SWLSX) | | | | | 14.04% |
| Benchmark: Russell 1000 Growth Index | | | | | 10.84% |
| Fund Category: Morningstar Large-Cap Growth | | | | | 9.03% |
Performance Details | | | | | pages 12–13 |
| | | | | | | |
Schwab Small-Cap Equity Fund™ | | | | | | |
| Investor Shares (Ticker Symbol: SWSIX) | | | | | 15.71% |
| Select Shares (Ticker Symbol: SWSCX) | | | | | 15.89% |
| Benchmark: S&P Small-Cap 600 Index | | | | | 16.10% |
| Fund Category: Morningstar Small-Cap Blend | | | | | 16.35% |
Performance Details | | | | | pages 14–15 |
Schwab Hedged Equity Fund™ | | | | | | |
| Investor Shares (Ticker Symbol: SWHIX) | | | | | 12.71% |
Select Shares (Ticker Symbol: SWHEX)1 | | | | | 12.89% |
| Benchmark: S&P 500® Index | | | | | 16.34% |
| Fund Category: Morningstar Long-Short | | | | | 7.46% |
Performance Details | | | | | pages 16–17 |
| | | | | | | |
Schwab Financial Services Fund™
| (Ticker Symbol: SWFFX) | | | | | 14.85% | | Benchmark: S&P 1500 Super Composite | | | | | 19.40% | | Financials Sector Index | | | | | | | | Fund Category: Morningstar Financial Services | | | | | 18.51% | Performance Details | | | | | pages 18–19 | | | | | | | | | Schwab Health Care Fund™
| (Ticker Symbol: SWHFX) | | | | | 7.27% | | Benchmark: S&P 1500 Super Composite | | | | | 10.72% | | Health Care Sector Index | | | | | | | | Fund Category: Morningstar Health Care | | | | | 8.44% | Performance Details | | | | | pages 20–21 | | | | | | | | | Schwab Technology Fund™
| (Ticker Symbol: SWTFX) | | | | | 8.40% | | Benchmark: S&P 1500 Super Composite | | | | | 10.97% | | Technology Sector Index | | | | | | | | Fund Category: Morningstar Technology | | | | | 10.16% | Performance Details | | | | | pages 22–23 | | | | | | | | | | | Minimum Initial Investment2 | | | | | | | | Investor Shares ($1,000 for retirement, education and custodial accounts) | | | | $2,500 | | Select Shares | | | | $50,000 | | | |
All fund and index figures on this page assume dividends and distributions were reinvested. Index figures do not include trading and management costs, which would lower performance. Indices are unmanaged, and you cannot invest in them directly. Performance results less than one year are not annualized.
Expenses may be partially absorbed by CSIM and Schwab. Without these reductions, the funds’ total returns would have been lower. Performance does not reflect the deduction of taxes that a shareholder would pay on fund distributions or on the redemption of fund shares.
Source for category information: Morningstar, Inc.
1One year return presented in the table differs from the return in the Financial Highlights. This is a result of the calculation of the Financial Highlights return adhering to GAAP presentation.
2Please see prospectus for further detail and eligibility requirements.
Schwab Active Equity Funds 1
Charles Schwab
Chairman | | From the Chairman Dear Shareholder, I founded Schwab over thirty years ago to be a home for serious investors. That mission continues to guide us today as we constantly strive to improve and innovate. By doing this, and providing some of the highest quality products and services — at a competitive price — we remain true to our heritage. I take particular pride in the Schwab Funds. Founded over 15 years ago, Schwab Funds now includes more than 50 funds with over $170 billion in assets. With a variety of investment strategies, Schwab Funds provides a range of innovative investment choices that can serve as a foundation for your asset allocation plan. The Schwab Active Equity Funds, included in this report, are powered by Schwab Equity Ratings and use the same stock-ranking expertise that has helped Schwab’s model equity portfolio achieve industry recognition in Barron’s annual stock-selection competitions. Schwab Equity Ratings are based upon a disciplined, systematic approach that evaluates approximately 3,000 U.S. stocks on the basis of a wide variety of investment criteria. Schwab Funds are managed by Charles Schwab Investment Management, Inc., one of the largest mutual fund managers in the U.S. Our portfolio managers share a passion for market analysis and use some of the most sophisticated financial models in the country. I am proud of their depth of experience, which reflects an average of 14 years in the investment industry. Furthermore, I am impressed by the commitment that our managers bring to the stewardship of their funds, for you, their shareholders. In closing, I want to thank you for investing with us. We work every day to warrant the trust you have placed in us; that will never change. Sincerely, 
Barron’s awarded Schwab the first-place rank for the five-year period from June 30, 2001 to June 30, 2006, and for the three year period from June 30, 2003 to June 30, 2006, for “best of” stock recommendation lists submitted by certain brokerage firms to Zacks Investment Research, Inc., an independent firm that analyzes broker research. Barron’s also awarded Schwab the first-place rank for the five-year periods from December 31, 2000 to December 31, 2005, and for the three year periods from December 31, 2001 to December 31, 2004, and the 2001 to 2003 for “best of” stock recommendation lists. Schwab’s model performance results are simulated model portfolio performance results, which do not represent actual investment performance or trading. The results of Schwab’s model performance are not an indicator of the returns a Schwab client would have realized or will realize in relying on Schwab Equity Ratings® or for mutual funds that use Schwab Equity Ratings as part of their methodology. For further information about Schwab Equity Ratings, see schwab.com. |
2 Schwab Active Equity Funds
Evelyn Dilsaver is President and
CEO of Charles Schwab Investment
Management, Inc. and of each of
the funds covered in this report.
She joined the firm in 1992 and
has held a variety of executive
positions at Schwab.
| | From the President Dear Shareholder, I am pleased to present the annual report for the Schwab Active Equity Funds for the period ended October 31, 2006. The funds in this report leverage Schwab Equity Ratings, Schwab’s industry-recognized, disciplined stock-rating approach. With the support of investors like you, Schwab Active Equity Funds assets were over $6 billion as of this report date. While we are pleased with the growth of assets, we are also mindful of the need to ensure the funds’ size does not hamper the portfolio manager’s ability to execute its investment strategy and continue to deliver strong performance to shareholders. For this reason, we closed the Schwab Premier Equity Fund to new investors earlier this year, and have notified shareholders of our intention to close the Schwab Small-Cap Equity Fund on January 31, 2007. Existing shareholders of the fund and certain eligible investors, as defined in the prospectus, will still be able to purchase shares of the fund. With this report, you will see that we have recently started an initiative to enhance the presentation of our shareholder reports to make it easier for you to find information about your fund. This book represents the first step in this process, with additional changes anticipated for future report cycles. You will notice, for example, that we have added a new lead page, Performance at a Glance, which includes the funds’ ticker symbols and report period returns for the funds, their benchmarks and category averages. For ease of reference, we have relocated the fund manager’s discussion to be in close proximity to the fund performance and portfolio statistics sections. At this time, I would like to highlight another valuable information resource for fund shareholders, namely, our website at www.schwabfunds.com. This website contains regular updates about the Schwab Funds. I encourage you to visit the website to stay informed about your fund. I’d like to emphasize that your trust is very important to us and I will do all I can to maintain that trust. Thank you for investing in Schwab Funds. Sincerely, |
Schwab Active Equity Funds 3
The Investment Environment
Jeffrey Mortimer, CFA, senior vice
president and chief investment
officer, equities, is responsible for
the overall management of the fund. |
| As the U.S. economy transitioned to slower growth, equities markets rebounded, aided by higher corporate profitability, falling energy/commodity prices, and lower interest rates. The S&P 500 Index returned 16.34% and the Russell 2000 Index returned 19.98%, respectively, for the one-year report period ended October 31, 2006. Improving fundamentals and attractive valuations strengthened investor interest in emerging markets and the MSCI EAFE (Morgan Stanley Capital International, Inc. Europe, Australasia, and Far East) Index returned 27.52%. Performance in the bond markets has been mixed over the year, although the Lehman Brothers U.S. Aggregate Bond Index gained 5.19%. Several key issues continued to resonate with investors, including slowing economic growth, Federal Reserve (the Fed) policy, a sluggish real estate market, inflation concerns, and fluctuating energy prices. Economic growth has been anything but predictable over the past year. The last quarter of 2005 saw Gross Domestic Price (GDP) slow considerably as the economy adjusted to changes in inventories and higher energy prices. Although Hurricane Katrina remained a focal point in the news late in 2005, its economic impact was determined to be minimal as damage remained contained within the hurricane’s path. In the first quarter of 2006, GDP then rebounded, only to slow later in the year. Though falling existing home sales and lower motor vehicle production have done much to curtail growth in the eyes of the Fed, favorable labor market conditions, sustained increases in labor income, and lower energy prices continued to promote stable growth. The unemployment rate fell to a cyclical low of 4.4% in the third quarter of 2006 while consumer spending and business investment remained key contributors to GDP growth. In efforts to curb inflationary pressures, the Fed raised short-term interest rates six times during the period. August marked a key point in the year as Committee members decided to hold the Fed’s target rate at 5.25%, where it remained as of |
Asset Class Performance Comparison % returns during the report period |
| This graph compares the performance of various asset classes during the report period. Final performance figures for the period are in the key below. | | |
| n 16.34% | | S&P 500® Index: measures U.S. large-cap stocks | |
| n 19.98% | | Russell 2000® Index: measures U.S. small-cap stocks | |
| n 27.52% | | MSCI EAFE® Index: measures (in U.S. dollars) large-cap stocks in Europe, Australasia and the Far East | |
| n 5.19% | | Lehman Brothers U.S. Aggregate Bond Index: measures the U.S. bond market
| |
These figures assume dividends and distributions were reinvested. Index figures do not include trading and management costs, which would lower performance. Indices are unmanaged and you cannot invest in them directly. Remember that past performance is not an indication of future results.
Data source: Charles Schwab & Co., Inc.
4 Schwab Active Equity Funds
The Investment Environment continued
the end of the report period. In its statement, the Fed noted that the economy appeared to be growing at a more moderate rate as a result of prior rate increases, lagged effects of energy prices, and a cooling of the housing market. The Fed indicated they generally expected the economy to grow at a pace below its potential, which proved to be an accurate prediction. Consistent with the Fed’s report, GDP continued to decline, growing only 2.2% in the third quarter of 2006.
Energy prices have been a key issue in the markets over the past year. Following Hurricane Katrina, oil prices peaked around $71 per barrel, with domestic gasoline prices passing $3.00 a gallon. Prices subsequently fell, but rebounded nearly 21% early in 2006, partly due to concerns that Iran might cut back exports in response to a dispute over their nuclear program. Prices declined throughout the report period due to a lack of hurricanes in the Gulf of Mexico, as well as an increase in U.S. fuel inventories. More recently, abundant inventories, warmer weather, and skepticism regarding OPEC’s proposed production cuts contributed to a slip in oil prices. Crude oil has declined nearly 26% since July 2006’s record $78.40 per barrel, yet still remained around the $60–61 per barrel range at the end of the report period, as diminishing U.S. crude inventories and concern about global surplus lingered in investors’ minds.
The events of 2006 have also had a significant impact on the housing market. Housing starts fell considerably, down nearly 34% since the beginning of 2006. Existing home sales continued to decline as well, falling nearly 15% from their peak reached in 2005. Although sales have dropped, they remained strong by historical standards. Concerns remained as to whether the Fed’s actions, and the immediate effects on the housing market, would spill over into the rest of the economy. With regards to GDP, housing took off about one percent in the third quarter of 2006, although rebounds in income, consumer spending, and investments helped to offset the impact.
Despite a moderation in economic growth during the report period, economic fundamentals remained healthy as of the end of the period. The Fed’s task of balancing inflation pressures without significantly hindering economic growth will be thoroughly scrutinized in the coming months. The challenge is to bring this economy to a state of stable growth and achieve a soft landing.
Nothing in this report represents a recommendation of a security by the investment adviser.
Manager views and portfolio holdings may have changed since the report date.
Schwab Active Equity Funds 5
Schwab Premier Equity Fund®

Jeffrey Mortimer, (lower left) CFA,
senior vice president and chief invest
ment officer, equities, is responsible
for the overall management of
the fund. Vivienne Hsu, (upper right) CFA, vice
president and senior equities portfolio
manager, is responsible for the day-today
co-management of the fund. Larry Mano, (upper left) vice president
and senior portfolio manager,
is responsible for the day-to-day
co-management of the fund. Paul Alan Davis, (lower right) CFA,
director and portfolio manager, is
responsible for the day-to-day
co-management of the fund. | | The Schwab Premier Equity Fund Investor Shares returned 17.22% for the one-year period ended October 31, 2006, outperforming its benchmark, the S&P 500 Index, which was up 16.34% for the same period. The fund’s emphasis on stock holdings with smaller market capitalization than the benchmark contributed positively to the fund’s performance as they outperformed their larger counterparts. A significant amount of the fund’s performance can be attributed to Schwab Equity Rating’s rigorous stock evaluation and its ability to identify stocks likely to outperform the market. From an industry group perspective, an overweight to the Materials industry group positively contributed to performance, as well as an underweight to Capital Goods. Top performers from a stock selection standpoint include such names as Veritas DGC, Inc., AMR Corporation, and BEA Systems. One of the fund’s largest holdings, Veritas received a cash and stock offer to be purchased, which helped boost the company’s stock price. On the downside, an overweight to the Insurance, Health Care Equipment and Services, and Software and Services industry groups detracted from returns. Stocks that underperformed during the period included Autodesk, Inc. and Red Hat, Inc., whose stock price dipped in October 2006 as a competitor announced its plans to offer similar support services at lower prices. |
As of 10/31/06:
Statistics |
| Number of Holdings | | | | 101 |
Weighted Average
Market Cap
($ x 1,000,000) | | | | 30,113 |
| Price/Earnings Ratio (P/E) | | | | 19.9 |
| Price/Book Ratio (P/B) | | | | 2.8 |
Sector Weightings % of Investments |
| Financials | | | | | 22.8 | % |
| Information Technology | | | | | 15.0 | % |
| Health Care | | | | | 12.5 | % |
| Industrials | | | | | 10.8 | % |
| Consumer Discretionary | | | | | 9.5 | % |
| Energy | | | | | 9.0 | % |
| Consumer Staples | | | | | 8.7 | % |
| Materials | | | | | 4.8 | % |
| Utilities Telecommunication | | | | | 3.5 | % |
| Services | | | | | 2.8 | % |
| Others | | | | | 0.6 | % |
Total | | | | | 100.0 | % |
Top Holdings % of Net Assets1 |
| Veritas DGC, Inc. | | | | | 1.5 | % |
| Franklin Resources, Inc. | | | | | 1.3 | % |
| Pactiv Corp. | | | | | 1.3 | % |
| Exxon Mobil Corp. | | | | | 1.3 | % |
| Hewlett-Packard Co. | | | | | 1.3 | % |
| Nationwide Financial Services, Inc., Class A | | | | | 1.3 | % |
| General Mills, Inc. | | | | | 1.2 | % |
| Greif, Inc., Class A | | | | | 1.2 | % |
| Cameron International Corp. | | | | | 1.2 | % |
| J.C.Penny Co., Inc. | | | | | 1.2 | % |
Total | | | | | 12.8 | % |
Portfolio holdings may have changed since the report date.
Source of Sector Classification: S&P and MSCI.
1 | | This list is not a recommendation of any security by the investment adviser. |
6 Schwab Active Equity Funds
Schwab Premier Equity Fund
Performance Summary as of 10/31/06
The performance data quoted represents past performance. Past performance does not guarantee future results.
Investment returns and principal value will fluctuate so that an investor’s shares may be worth more or less than their original cost. Current performance may be lower or higher than performance data quoted. To obtain performance information current to the most recent month end, please visit www.schwab.com/schwabfunds.
Performance of a Hypothetical
$10,000 Investment in Investor Shares1 | | | | Performance of a Hypothetical
$50,000 Investment in Select Shares1 |
| | | | |
Average Annual Total Returns1,2 |
Fund Class and Inception Date | | | | 1 year | | Since Inception |
| Investor Shares (3/21/05) | | | | | 17.22 | % | | | 15.05 | % |
| Select Shares (3/21/05) | | | | | 17.28 | % | | | 15.15 | % |
| Benchmark: S&P 500® Index | | | | | 16.34 | % | | | 11.52 | % |
| Fund Category: Morningstar Large-Cap Blend | | | | | 14.74 | % | | | 11.05 | % |
Style Assessment3 |
| |
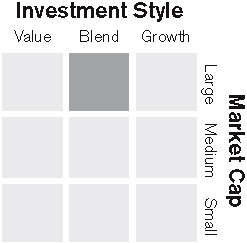 |
All figures on this page assume dividends and distributions were reinvested. Index figures do not include trading and management costs, which would lower performance. Indices are unmanaged, and you cannot invest in them directly. Performance results less than one year are not annualized.
1Fund expenses may have been partially absorbed by CSIM and Schwab. Without these reductions, the fund’s returns would have been lower. These returns do not reflect the deduction of taxes that a shareholder would pay on fund distributions or the redemption of fund shares.
2Source for category information: Morningstar, Inc.
3Source: Morningstar, Inc. This style assessment is the result of evaluating the fund based on a ten-factor model for value and growth characteristics. The fund’s market capitalization placement is determined by the geometric mean of its holdings’ market capitalizations. The assessment reflects the fund’s portfolio as of 10/31/06, which may have changed since then, and is not a precise indication of risk or performance — past, present, or future.
Schwab Active Equity Funds 7
Schwab Core Equity Fund™
Jeffrey Mortimer, (lower left) CFA,
senior vice president and chief invest
ment officer, equities, is responsible
for the overall management of
the fund. Vivienne Hsu, (upper right) CFA, vice
president and senior equities portfolio
manager, is responsible for the day-today
co-management of the fund. Larry Mano, (upper left) vice president
and senior portfolio manager,
is responsible for the day-to-day
co-management of the fund. Paul Alan Davis, (lower right) CFA,
director and portfolio manager, is
responsible for the day-to-day
co-management of the fund. | | The Schwab Core Equity Fund posted a return of 17.02%, outperforming its benchmark, the S&P 500 Index, which returned 16.34% for the one-year report period. A leading contributor to the fund’s performance was its emphasis on smaller market capitalization holdings relative to the benchmark, as they outperformed large-capitalization stocks for the report period. A significant amount of the fund’s performance can be attributed to Schwab Equity Rating’s rigorous stock evaluation and its ability to identify stocks likely to outperform the market. From an industry group standpoint, an overweight to Diversified Financials and Transportation contributed to returns. In addition, an underweight to Energy proved beneficial as energy stocks declined during the report period. Stocks that performed well during the period included such names as Lockheed Martin Corporation, CSX Corporation, and Hewlett-Packard Company. On the downside, an overweight to the Insurance and Health Care Equipment and Services industry groups contained returns. From a stock perspective, positions in Aetna, Inc., Radian Group, Inc., and Computer Sciences Corporation detracted from the fund’s performance. |
As of 10/31/06:
Statistics |
| Number of Holdings | | | | 90 |
Weighted Average
Market Cap
($ x 1,000,000) | | | | 62,672 |
| Price/Earnings Ratio (P/E) | | | | 17.7 |
| Price/Book Ratio (P/B) | | | | 2.9 |
Sector Weightings % of Investments |
| Financials | | | | | 22.9 | % |
| Health Care | | | | | 16.9 | % |
| Information Technology | | | | | 16.0 | % |
| Industrials | | | | | 12.9 | % |
| Consumer Discretionary | | | | | 8.8 | % |
| Materials | | | | | 5.8 | % |
| Energy | | | | | 5.1 | % |
| Consumer Staples | | | | | 5.0 | % |
| Telecommunication Services | | | | | 2.7 | % |
| Utilities | | | | | 2.1 | % |
| Others | | | | | 1.8 | % |
Total | | | | | 100.0 | % |
Top Holdings % of Net Assets1 |
| The Boeing Co. | | | | | 4.7 | % |
| Exxon Mobil Corp. | | | | | 4.5 | % |
| Franklin Resources, Inc. | | | | | 4.0 | % |
| MetLife, Inc. | | | | | 4.0 | % |
| Hewlett-Packard Co. | | | | | 3.9 | % |
| Pfizer, Inc. | | | | | 3.9 | % |
| Lockheed Martin Corp. | | | | | 3.8 | % |
| International Business Machines Corp. | | | | | 3.4 | % |
| Merck & Co., Inc. | | | | | 3.2 | % |
| American Express Co. | | | | | 2.8 | % |
Total | | | | | 38.2 | % |
Portfolio holdings may have changed since the report date.
Source of Sector Classification: S&P and MSCI.
1This list is not a recommendation of any security by the investment adviser.
8 Schwab Active Equity Funds
Schwab Core Equity Fund
Performance Summary as of 10/31/06
The performance data quoted represents past performance. Past performance does not guarantee future results.
Investment returns and principal value will fluctuate so that an investor’s shares may be worth more or less than their original cost. Current performance may be lower or higher than performance data quoted. To obtain performance information current to the most recent month end, please visit www.schwab.com/schwabfunds.
Performance of a Hypothetical
$10,000 Investment in Investor Shares1 |
|
Average Annual Total Returns1,2 |
Fund Class and Inception Date | | | | 1 year | | 5 years | | 10 years |
| Fund: Schwab Core Equity Fund (7/1/96) | | | | | 17.02 | % | | | 8.80 | % | | | 9.26 | % |
| Benchmark: S&P 500® Index | | | | | 16.34 | % | | | 7.25 | % | | | 8.63 | % |
| Fund Category: Morningstar Large-Cap Blend | | | | | 14.74 | % | | | 6.82 | % | | | 7.76 | % |
Style Assessment3 |
| |
|
| |
All figures on this page assume dividends and distributions were reinvested. Index figures do not include trading and management costs, which would lower performance. Indices are unmanaged, and you cannot invest in them directly. Performance results less than one year are not annualized.
1Fund expenses may have been partially absorbed by CSIM and Schwab. Without these reductions, the fund’s returns would have been lower. These returns do not reflect the deduction of taxes that a shareholder would pay on fund distributions or the redemption of fund shares.
2Source for category information: Morningstar, Inc.
3Source: Morningstar, Inc. This style assessment is the result of evaluating the fund based on a ten-factor model for value and growth characteristics. The fund’s market capitalization placement is determined by the geometric mean of its holdings’ market capitalizations. The assessment reflects the fund’s portfolio as of 10/31/06, which may have changed since then, and is not a precise indication of risk or performance — past, present, or future.
Schwab Active Equity Funds 9
Schwab Dividend Equity Fund™
Jeffrey Mortimer, (lower left) CFA,
senior vice president and chief invest
ment officer, equities, is responsible
for the overall management of
the fund. Vivienne Hsu, (upper right) CFA, vice
president and senior equities portfolio
manager, is responsible for the day-today
co-management of the fund. Larry Mano, (upper left) vice president
and senior portfolio manager,
is responsible for the day-to-day
co-management of the fund. Paul Alan Davis, (lower right) CFA,
director and portfolio manager, is
responsible for the day-to-day
co-management of the fund. | | The Schwab Dividend Equity Fund Investor Shares returned 17.63%, outperforming its benchmark, the S&P 500 Index, which gained 16.34% for the same period. This fund is designed to seek current income and capital appreciation by primarily investing in dividend-paying stocks. Among the contributing factors to the fund’s performance was an emphasis on higher yielding stocks relative to the benchmark, as they outperformed stocks that paid no dividends for the report period. A significant amount of the fund’s performance can be attributed to Schwab Equity Rating’s rigorous stock evaluation and its ability to identify stocks likely to outperform the market. From an industry group perspective, an overweight to the Telecommunication Services group positively contributed to performance, as well as an underweight to Health Care Equipment and Services. Holdings that contributed to the fund’s performance included such names as Reynolds American, Inc., Bellsouth Corporation, and Merck & Co., Inc. On the downside, an overweight to Insurance and Utilities detracted from returns. Stocks that underperformed during the report period included such names as Intel Corporation, Sunoco, Inc., and Temple-Inland, Inc. |
As of 10/31/06:
Statistics |
| Number of Holdings | | | | 121 |
Weighted Average
Market Cap
($ x 1,000,000) | | | | 57,009 |
| Price/Earnings Ratio (P/E) | | | | 17.2 |
| Price/Book Ratio (P/B) | | | | 2.6 |
Sector Weightings % of Investments |
| Financials | | | | | 26.4 | % |
| Industrials | | | | | 11.4 | % |
| Consumer Staples | | | | | 11.2 | % |
| Health Care | | | | | 8.9 | % |
| Utilities | | | | | 8.5 | % |
| Information Technology | | | | | 7.5 | % |
| Materials | | | | | 6.7 | % |
| Telecommunication Services | | | | | 6.2 | % |
| Consumer Discretionary | | | | | 6.1 | % |
| Energy | | | | | 4.6 | % |
| Others | | | | | 2.5 | % |
Total | | | | | 100.0 | % |
Top Holdings % of Net Assets1 |
| Lockheed Martin Corp. | | | | | 2.1 | % |
| Reynolds American, Inc. | | | | | 2.0 | % |
| Raytheon Co. | | | | | 1.8 | % |
| Newell Rubermaid, Inc. | | | | | 1.7 | % |
| Exxon Mobil Corp. | | | | | 1.7 | % |
| AT&T Corp. | | | | | 1.7 | % |
| JPMorgan Chase & Co. | | | | | 1.5 | % |
| BellSouth Corp. | | | | | 1.5 | % |
| Lincoln National Corp. | | | | | 1.4 | % |
| Hewlett-Packard Co. | | | | | 1.4 | % |
Total | | | | | 16.8 | % |
Portfolio holdings may have changed since the report date.
Source of Sector Classification: S&P and MSCI.
1This list is not a recommendation of any security by the investment adviser.
10 Schwab Active Equity Funds
Schwab Dividend Equity Fund
Performance Summary as of 10/31/06
The performance data quoted represents past performance. Past performance does not guarantee future results.
Investment returns and principal value will fluctuate so that an investor’s shares may be worth more or less than their original cost. Current performance may be lower or higher than performance data quoted. To obtain performance information current to the most recent month end, please visit www.schwab.com/schwabfunds.
Performance of a Hypothetical
$10,000 Investment in Investor Shares1 | | | | Performance of a Hypothetical
$50,000 Investment in Select Shares1 |
| | | | |
Average Annual Total Returns1,2 |
Fund Class and Inception Date | | | | 1 year | | 3 years | | Since Inception |
| Investor Shares (9/2/03) | | | | | 17.63 | % | | | 14.82 | % | | | 16.07 | % |
| Select Shares (9/2/03) | | | | | 17.86 | % | | | 14.98 | % | | | 16.22 | % |
| Benchmark: S&P 500® Index | | | | | 16.34 | % | | | 11.43 | % | | | 12.34 | % |
| Fund Category: Morningstar Large-Cap Value | | | | | 17.90 | % | | | 13.45 | % | | | 13.82 | % |
Style Assessment3 |
| |
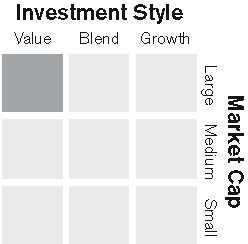 |
Yields1 | | | | |
SEC Yield | | | | | | |
Investor Shares | | | | 1.57% |
Select Shares | | | | 1.72% |
All figures on this page assume dividends and distributions were reinvested. Index figures do not include trading and management costs, which would lower performance. Indices are unmanaged, and you cannot invest in them directly. Performance results less than one year are not annualized.
1Fund expenses may have been partially absorbed by CSIM and Schwab. Without these reductions, the fund’s returns and yields would have been lower. These returns and yields do not reflect the deduction of taxes that a shareholder would pay on fund distributions or the redemption of fund shares.
2Source for category information: Morningstar, Inc.
3Source: Morningstar, Inc. This style assessment is the result of evaluating the fund based on a ten-factor model for value and growth characteristics. The fund’s market capitalization placement is determined by the geometric mean of its holdings’ market capitalizations. The assessment reflects the fund’s portfolio as of 10/31/06, which may have changed since then, and is not a precise indication of risk or performance — past, present, or future.
Schwab Active Equity Funds 11
Schwab Large-Cap Growth Fund™
Jeffrey Mortimer, (lower left) CFA,
senior vice president and chief invest
ment officer, equities, is responsible
for the overall management of
the fund. Vivienne Hsu, (upper right) CFA, vice
president and senior equities portfolio
manager, is responsible for the day-today
co-management of the fund. Larry Mano, (upper left) vice president
and senior portfolio manager,
is responsible for the day-to-day
co-management of the fund. Paul Alan Davis, (lower right) CFA,
director and portfolio manager, is
responsible for the day-to-day
co-management of the fund. | | The Schwab Large-Cap Growth Fund Investor Shares returned 13.80% for the one-year report period, well above its benchmark, the Russell 1000 Growth Index, which gained 10.84% for the same period. One factor contributing to the fund’s outperformance was that the fund’s holdings were slightly lower in market capitalization relative to the benchmark. A significant amount of the fund’s performance can be attributed to Schwab Equity Rating’s rigorous stock evaluation and its ability to identify stocks likely to outperform the market. An overweight to Diversified Financials relative to the fund’s benchmark positively contributed to returns, as did an underweight to Software and Services and Energy industry groups. Among the stocks that performed well during the period were Hewlett-Packard Company, Applied Biosystems Group, and Lockheed Martin Corporation. Lockheed Martin, the world’s largest defense contractor, raised its profit forecast as the company continued to pursue and win lucrative contracts, which had a positive impact on the portfolio. Detracting from the fund’s performance were an overweight to Consumer Durables & Apparel, Capital Goods, and Health Care Equipment and Services industry groups. From a stock selection standpoint, positions in such companies as Harman International Industries, Inc., Express Scripts, and Federated Investors, Inc. detracted from returns. |
As of 10/31/06:
Statistics |
| Number of Holdings | | | | 90 |
Weighted Average
Market Cap
($ x 1,000,000) | | | | 47,966 |
| Price/Earnings Ratio (P/E) | | | | 19.6 |
| Price/Book Ratio (P/B) | | | | 4.1 |
Sector Weightings % of Investments |
| Information Technology | | | | | 24.3 | % |
| Health Care | | | | | 20.9 | % |
| Financials | | | | | 13.2 | % |
| Industrials | | | | | 12.0 | % |
| Consumer Discretionary | | | | | 11.5 | % |
| Materials | | | | | 4.5 | % |
| Consumer Staples | | | | | 3.7 | % |
| Energy | | | | | 1.8 | % |
| Telecommunication Services | | | | | 1.5 | % |
| Utilities | | | | | 1.4 | % |
| Others | | | | | 5.2 | % |
Total | | | | | 100.0 | % |
Top Holdings % of Net Assets1 |
| International Business Machines Corp. | | | | | 4.9 | % |
| Franklin Resources, Inc. | | | | | 4.8 | % |
| Hewlett-Packard Co. | | | | | 4.8 | % |
| The McGraw-Hill Cos., Inc. | | | | | 4.7 | % |
| The Boeing Co. | | | | | 4.5 | % |
| Pfizer, Inc. | | | | | 3.1 | % |
| Lockheed Martin Corp. | | | | | 3.0 | % |
| Baxter International, Inc. | | | | | 3.0 | % |
| BMC Software, Inc. | | | | | 2.5 | % |
| Freeport-McMoRan Copper & Gold, Inc., Class B | | | | | 2.4 | % |
Total | | | | | 37.7 | % |
Portfolio holdings may have changed since the report date.
Source of Sector Classification: S&P and MSCI.
1This list is not a recommendation of any security by the investment adviser.
12 Schwab Active Equity Funds
Schwab Large-Cap Growth Fund
Performance Summary as of 10/31/06
The performance data quoted represents past performance. Past performance does not guarantee future results.
Investment returns and principal value will fluctuate so that an investor’s shares may be worth more or less than their original cost. Current performance may be lower or higher than performance data quoted. To obtain performance information current to the most recent month end, please visit www.schwab.com/schwabfunds.
Performance of a Hypothetical
$10,000 Investment in Investor Shares1 | | | | Performance of a Hypothetical
$50,000 Investment in Select Shares1 |
| | | | |
Average Annual Total Returns1,2 |
Fund Class and Inception Date | | | | 1 year | | Since Inception |
| Investor Shares (10/3/05) | | | | | 13.80 | % | | | 9.82 | % |
| Select Shares (10/3/05) | | | | | 14.04 | % | | | 10.04 | % |
| Benchmark: Russell 1000 Growth Index | | | | | 10.84 | % | | | 8.95 | % |
| Fund Category: Morningstar Large-Cap Growth | | | | | 9.03 | % | | | 7.16 | % |
Style Assessment3 |
| |
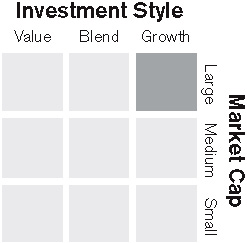 |
All figures on this page assume dividends and distributions were reinvested. Index figures do not include trading and management costs, which would lower performance. Indices are unmanaged, and you cannot invest in them directly. Performance results less than one year are not annualized.
1Fund expenses may have been partially absorbed by CSIM and Schwab. Without these reductions, the fund’s returns would have been lower. These returns do not reflect the deduction of taxes that a shareholder would pay on fund distributions or the redemption of fund shares.
2Source for category information: Morningstar, Inc.
3Source: Morningstar, Inc. This style assessment is the result of evaluating the fund based on a ten-factor model for value and growth characteristics. The fund’s market capitalization placement is determined by the geometric mean of its holdings’ market capitalizations. The assessment reflects the fund’s portfolio as of 10/31/06, which may have changed since then, and is not a precise indication of risk or performance — past, present, or future.
Schwab Active Equity Funds 13
Schwab Small-Cap Equity Fund™
Jeffrey Mortimer, (lower left) CFA,
senior vice president and chief invest
ment officer, equities, is responsible
for the overall management of
the fund. Vivienne Hsu, (upper right) CFA, vice
president and senior equities portfolio
manager, is responsible for the day-today
co-management of the fund. Larry Mano, (upper left) vice president
and senior portfolio manager,
is responsible for the day-to-day
co-management of the fund. Paul Alan Davis, (lower right) CFA,
director and portfolio manager, is
responsible for the day-to-day
co-management of the fund. | | The Schwab Small-Cap Equity Fund Investor Shares posted positive returns of 15.71% for the one-year period, slightly underperforming its benchmark, the S&P Small-Cap 600 Index, which returned 16.10% for the same period. From a market cap perspective, the fund was positioned such that its net holdings were slightly higher in market capitalization relative to the benchmark, which positively contributed to the fund’s performance. Although the fund slightly underperformed its benchmark, stock selection remained a key contributing factor in the fund’s performance. With respect to industry group selections, the fund benefited from an underweight to the Utilities, Health Care Equipment and Services, and Consumer Durables and Apparel industry groups relative to its benchmark’s weightings in those respective areas. As mentioned above, stock selection remained a key contributor to the fund’s performance, with such holdings in Veritas DGC, Inc., EMCOR Group, Inc., and Greif, Inc. benefiting the fund. Detracting from performance, however, was an overweight in the Automobiles and Components, Capital Goods, and Insurance industry groups. In addition, the fund’s weighting in Real Estate was lower than the S&P 600, which detracted from returns as a result of this industry group’s strong performance for the one-year period. Underperformers included such names as EarthLink, Inc., Spherion Corporation, and American Greetings Corporation. |
As of 10/31/06:
Statistics |
| Number of Holdings | | | | 147 |
Weighted Average
Market Cap
($ x 1,000,000) | | | | 1,586 |
| Price/Earnings Ratio (P/E) | | | | 25.7 |
| Price/Book Ratio (P/B) | | | | 2.5 |
Sector Weightings % of Investments |
| Industrials | | | | | 21.0 | % |
| Information Technology | | | | | 20.2 | % |
| Consumer Discretionary | | | | | 14.3 | % |
| Health Care | | | | | 12.2 | % |
| Financials | | | | | 12.0 | % |
| Materials | | | | | 9.4 | % |
| Energy | | | | | 4.5 | % |
| Telecommunication Services | | | | | 1.2 | % |
| Consumer Staples | | | | | 1.0 | % |
| Utilities | | | | | 0.7 | % |
| Others | | | | | 3.5 | % |
Total | | | | | 100.0 | % |
Top Holdings % of Net Assets1 |
| Veritas DGC, Inc. | | | | | 3.7 | % |
| Magellan Health Services, Inc. | | | | | 3.0 | % |
| Teleflex, Inc. | | | | | 2.9 | % |
| Kellwood Co. | | | | | 2.9 | % |
| Greif, Inc., Class A | | | | | 2.9 | % |
| EMCOR Group, Inc. | | | | | 2.9 | % |
| CSG Systems International, Inc. | | | | | 2.6 | % |
| Mentor Corp. | | | | | 2.6 | % |
| Sierra Health Services, Inc. | | | | | 2.6 | % |
| The Men’s Wearhouse, Inc. | | | | | 2.6 | % |
Total | | | | | 28.7 | % |
Portfolio holdings may have changed since the report date.
Source of Sector Classification: S&P and MSCI.
1This list is not a recommendation of any security by the investment adviser.
14 Schwab Active Equity Funds
Schwab Small-Cap Equity Fund
Performance Summary as of 10/31/06
The performance data quoted represents past performance. Past performance does not guarantee future results.
Investment returns and principal value will fluctuate so that an investor’s shares may be worth more or less than their original cost. Current performance may be lower or higher than performance data quoted. To obtain performance information current to the most recent month end, please visit www.schwab.com/schwabfunds.
Performance of a Hypothetical
$10,000 Investment in Investor Shares1 | | | | Performance of a Hypothetical
$50,000 Investment in Select Shares1 |
| | | | |
Average Annual Total Returns1,2 |
Fund Class and Inception Date | | | | 1 year | | 3 years | | Since Inception |
| Investor Shares (7/1/03) | | | | | 15.71 | % | | | 20.32 | % | | | 24.11 | % |
| Select Shares (7/1/03) | | | | | 15.89 | % | | | 20.52 | % | | | 24.30 | % |
| Benchmark: S&P Small-Cap 600 Index | | | | | 16.10 | % | | | 16.03 | % | | | 19.61 | % |
| Fund Category: Morningstar Small-Cap Blend | | | | | 16.35 | % | | | 14.38 | % | | | 18.30 | % |
Style Assessment3 |
| |
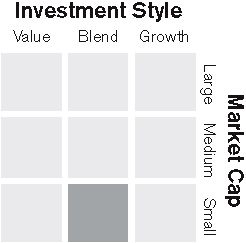 |
Small company stocks are subject to greater volatility than other asset classes.
All figures on this page assume dividends and distributions were reinvested. Index figures do not include trading and management costs, which would lower performance. Indices are unmanaged, and you cannot invest in them directly. Performance results less than one year are not annualized.
1Fund expenses may have been partially absorbed by CSIM and Schwab. Without these reductions, the fund’s returns would have been lower. These returns do not reflect the deduction of taxes that a shareholder would pay on fund distributions or the redemption of fund shares.
2Source for category information: Morningstar, Inc.
3Source: Morningstar, Inc. This style assessment is the result of evaluating the fund based on a ten-factor model for value and growth characteristics. The fund’s market capitalization placement is determined by the geometric mean of its holdings’ market capitalizations. The assessment reflects the fund’s portfolio as of 10/31/06, which may have changed since then, and is not a precise indication of risk or performance — past, present, or future.
Schwab Active Equity Funds 15
Schwab Hedged Equity Fund™
Jeffrey Mortimer, (lower left) CFA,
senior vice president and chief invest
ment officer, equities, is responsible
for the overall management of
the fund. Vivienne Hsu, (upper right) CFA, vice
president and senior equities portfolio
manager, is responsible for the day-today
co-management of the fund. Larry Mano, (upper left) vice president
and senior portfolio manager,
is responsible for the day-to-day
co-management of the fund. Paul Alan Davis, (lower right) CFA,
director and portfolio manager, is
responsible for the day-to-day
co-management of the fund. | | The Schwab Hedged Equity Fund Investor Shares returned 12.71% for the one-year report period, beating the Morningstar Long-Short Fund category average yet underperforming the benchmark, the S&P 500 Index, which returned 16.34%. The fund seeks long-term capital appreciation with lower volatility than that of broad market indices, such as the S&P 500 Index. To pursue this investment objective, the fund establishes long and short positions in equity securities. While short positions are generally used to hedge against volatility, they cannot completely eliminate that risk. An increase in the value of the shorted stocks, such as occurred during this report period, had a negative impact on fund performance. The fund’s long positions favored holdings that were smaller in market cap than those of the benchmark, which positively contributed to returns, as small-cap stocks outperformed their larger counterparts. Industry group selection, on the other hand, was negative for the report period and slightly detracted from overall return. In terms of individual stocks, long positions that contributed to overall returns included Nucor Corporation and Archer Daniels Midland Company. Conversely, short positions of several materials stocks detracted from performance when their values increased. |
As of 10/31/06:Statistics |
| Number of Holdings | | | | | | |
Long Holdings | | | | 140 |
Short Positions | | | | 86 |
Weighted Average
Market Cap
($ x 1,000,000) | | | | | | |
Long Holdings | | | | 29,114 |
Short Positions | | | | 3,338 |
| Price/Earnings Ratio (P/E) | | | | |
Long Holdings | | | | 25.8 |
Short Positions | | | | 27.2 |
| Price/Book Ratio (P/B) | | | | | | |
Long Holdings | | | | 2.9 |
Short Positions | | | | 2.9 |
Top Long Holdings % of Net Assets1 |
| Principal Financial Group, Inc. | | | | | 2.6 | % |
| Exxon Mobil Corp. | | | | | 2.5 | % |
| Applied Biosystems Group-Applera Corp. | | | | | 2.5 | % |
| ConAgra Foods, Inc. | | | | | 2.5 | % |
| Lexmark International, Inc., Class A | | | | | 2.4 | % |
Total | | | | | 12.5 | % |
Top Short Holdings % of Net Assets1 |
| Equinix, Inc. | | | | | 1.7 | % |
| Affymetrix, Inc. | | | | | 1.4 | % |
| Pacific Sunwear of California, Inc. | | | | | 1.3 | % |
| NII Holdings, Inc. | | | | | 1.3 | % |
| Conor Medsystems, Inc. | | | | | 1.3 | % |
Total | | | | | 7.0 | % |
Portfolio holdings may have changed since the report date.
Source of Sector Classification: S&P and MSCI.
1This list is not a recommendation of any security by the investment adviser.
16 Schwab Active Equity Funds
Schwab Hedged Equity Fund
Performance Summary as of 10/31/06
The performance data quoted represents past performance. Past performance does not guarantee future results.
Investment returns and principal value will fluctuate so that an investor’s shares may be worth more or less than their original cost. Current performance may be lower or higher than performance data quoted. To obtain performance information current to the most recent month end, please visit www.schwab.com/schwabfunds.
Performance of a Hypothetical
$10,000 Investment in Investor Shares1 | | | | Performance of a Hypothetical
$50,000 Investment in Select Shares1 |
| | | | |
Average Annual Total Returns1,2 |
Fund Class and Inception Date | | | | 1 year | | 3 years | | Since Inception |
| Investor Shares (3/1/05) | | | | | 12.71 | % | | | n/a | | | | 11.83% |
| Select Shares (9/3/02) | | | | | 12.89 | % | | | 14.07 | % | | | 13.76% |
| Benchmark: S&P 500® Index | | | | | 16.34 | % | | | 11.43 | % | | | (3/1/05) 10.41% |
| | | | | | | | | | | | | | (9/3/02) 12.29% |
| Fund Category: Morningstar Long-Short | | | | | 7.46 | % | | | 5.54 | % | | | (3/1/05) 5.62% |
| | | | | | | | | | | | | | (9/3/02) 9.76% |
The Hedged Equity Fund’s long positions can decline in value at the same time the value of its shorted stocks increases, thereby increasing the potential for loss. The potential loss associated with short positions is much greater than the original value of the securities sold. The use of borrowing and short sales may cause the fund to have higher expenses than those of equity funds that do not use such techniques.
All figures on this page assume dividends and distributions were reinvested. Index figures do not include trading and management costs, which would lower performance. Indices are unmanaged, and you cannot invest in them directly. Performance results less than one year are not annualized.
1Fund expenses may have been partially absorbed by CSIM and Schwab. Without these reductions, the fund’s returns would have been lower. These returns do not reflect the deduction of taxes that a shareholder would pay on fund distributions or the redemption of fund shares.
2Source for category information: Morningstar, Inc.
Schwab Active Equity Funds 17
Schwab Financial Services Fund™
Jeffrey Mortimer, (lower left) CFA,
senior vice president and chief invest
ment officer, equities, is responsible
for the overall management of
the fund. Vivienne Hsu, (upper right) CFA, vice
president and senior equities portfolio
manager, is responsible for the day-today
co-management of the fund. Larry Mano, (upper left) vice president
and senior portfolio manager,
is responsible for the day-to-day
co-management of the fund. Paul Alan Davis, (lower right) CFA,
director and portfolio manager, is
responsible for the day-to-day
co-management of the fund. | | The Schwab Financial Services Fund returned 14.85%, underperforming its benchmark, the S&P 1500 SuperComposite Financials Sector Index, which was up 19.40% for the one-year period. The fund was positioned such that its holdings were smaller in market capitalization relative to its benchmark, which contributed to performance, as small-cap stocks outperformed large-cap stocks for the period. However, overall stock selection detracted from returns. The fund favored holdings with higher growth characteristics than the benchmark (i.e., higher price-to-earnings and price-to-book ratios), which detracted from performance. From an industry group perspective, the fund benefited from an overweight to Diversified Financials. Top performers for the period included such names as Investment Technology Group, Inc. and Franklin Resources, Inc. On the downside, the fund’s underweight to Real Estate Investment Trusts (REITs), owners of commercial real estate properties, hurt returns, as this group performed well for the one-year period. In addition, an overweight to the Insurance industry group also detracted from performance. Among stocks that underperformed during the period were St. Paul Travelers Companies, Inc. and Radian Group. |
Statistics |
| Number of Holdings | | | | 45 |
Weighted Average
Market Cap
($ x 1,000,000) | | | | 37,277 |
| Price/Earnings Ratio (P/E) | | | | 14.0 |
| Price/Book Ratio (P/B) | | | | 2.0 |
Industry Weightings % of Investments |
| Diversified Financials | | | | | 44.7 | % |
| Insurance | | | | | 28.4 | % |
| Banks | | | | | 24.1 | % |
| Real Estate | | | | | 1.8 | % |
| Others | | | | | 1.0 | % |
Total | | | | | 100.0 | % |
Top Holdings % of Net Assets1 |
| Franklin Resources, Inc. | | | | | 5.1 | % |
| American Express Co. | | | | | 4.9 | % |
| Bank of America Corp. | | | | | 4.9 | % |
| JP Morgan Chase & Co. | | | | | 4.9 | % |
| Mellon Financial Corp. | | | | | 4.8 | % |
| Comerica, Inc. | | | | | 4.7 | % |
| Northern Trust Corp. | | | | | 4.5 | % |
| MetLife, Inc. | | | | | 4.5 | % |
| Genworth Financial, Inc., Class A | | | | | 4.1 | % |
| Radian Group, Inc. | | | | | 4.0 | % |
Total | | | | | 46.4 | % |
Portfolio holdings may have changed since the report date.
Source of Sector Classification: S&P and MSCI.
1This list is not a recommendation of any security by the investment adviser.
18 Schwab Active Equity Funds
Schwab Financial Services Fund
Performance Summary as of 10/31/06
The performance data quoted represents past performance. Past performance does not guarantee future results.
Investment returns and principal value will fluctuate so that an investor’s shares may be worth more or less than their original cost. Current performance may be lower or higher than performance data quoted. To obtain performance information current to the most recent month end, please visit www.schwab.com/schwabfunds.
Performance of a Hypothetical
$10,000 Investment1 |
|
Average Annual Total Returns1,2 |
| | | | | 1 year | | 5 years | | Since Inception |
| Fund: Schwab Financial Services Fund™ (7/3/00) | | | | | 14.85 | % | | | 13.76 | % | | | 10.95 | % |
| Benchmark: S&P 1500 Super Composite Financials Sector Index | | | | | 19.40 | % | | | 11.09 | % | | | 9.81 | % |
| Fund Category: Morningstar Financial Services | | | | | 18.51 | % | | | 11.88 | % | | | 11.88 | % |
Since the Financial Services fund focuses its investments on companies involved in specific sectors, this fund may involve a greater degree of risk than an investment in mutual funds that do not concentrate their investments.
All figures on this page assume dividends and distributions were reinvested. Index figures do not include trading and management costs, which would lower performance. Indices are unmanaged, and you cannot invest in them directly. Performance results less than one year are not annualized.
1Fund expenses may have been partially absorbed by CSIM and Schwab. Without these reductions, the fund’s returns would have been lower. These returns do not reflect the deduction of taxes that a shareholder would pay on fund distributions or the redemption of fund shares.
2Source for category information: Morningstar, Inc.
Schwab Active Equity Funds 19
Schwab Health Care Fund™
Jeffrey Mortimer, (lower left) CFA,
senior vice president and chief invest
ment officer, equities, is responsible
for the overall management of
the fund. Vivienne Hsu, (upper right) CFA, vice
president and senior equities portfolio
manager, is responsible for the day-today
co-management of the fund. Larry Mano, (upper left) vice president
and senior portfolio manager,
is responsible for the day-to-day
co-management of the fund. Paul Alan Davis, (lower right) CFA,
director and portfolio manager, is
responsible for the day-to-day
co-management of the fund. | | The Schwab Health Care Fund returned 7.27% for the one-year reporting period, trailing its benchmark, the S&P 1500 SuperComposite Health Care Sector Index, which gained 10.72% for the same period. One positive contributor to the fund’s performance was the fund’s emphasis toward stock holdings with smaller market capitalization than the benchmark. Industry group selection dampened the fund’s performance, as an overweight to the Health Care Equipment and Services industry group detracted from returns. An underweight to the Pharmaceuticals and Biotechnology industry group detracted from returns as well. From a style perspective, the fund gained from its higher volatility holdings. However, with respect to stock selection, gains by top contributors such as Applied Biosystems Group-Applera Corporation and Merck and Co., Inc. were offset by losses in companies such as Barr Pharmaceuticals, Inc. and HMO providers Sierra Health Services, Inc. and Aetna, Inc. |
As of 10/31/06:
Statistics |
| Number of Holdings | | | | 53 |
Weighted Average
Market Cap
($ x 1,000,000) | | | | 38,627 |
| Price/Earnings Ratio (P/E) | | | | 23.0 |
| Price/Book Ratio (P/B) | | | | 3.2 |
Industry Weightings % of Investments |
| Pharmaceutical & Biotechnology | | | | | 55.6 | % |
| Health Care Equipment & Services | | | | | 42.7 | % |
| Others | | | | | 1.7 | % |
Total | | | | | 100.0 | % |
Top Holdings % of Net Assets1 |
| Applied Biosystems Group-Applera Corp. | | | | | 5.8 | % |
| Merck & Co., Inc. | | | | | 5.5 | % |
| Pfizer, Inc. | | | | | 4.9 | % |
| Johnson & Johnson | | | | | 4.9 | % |
| Becton Dickinson & Co. | | | | | 4.8 | % |
| AmerisourceBergen Corp. | | | | | 4.3 | % |
| McKesson Corp. | | | | | 4.1 | % |
| Schering-Plough Corp. | | | | | 4.0 | % |
| King Pharmaceuticals, Inc. | | | | | 3.8 | % |
| Sierra Health Services, Inc. | | | | | 3.5 | % |
Total | | | | | 45.6 | % |
Portfolio holdings may have changed since the report date.
Source of Sector Classification: S&P and MSCI.
1This list is not a recommendation of any security by the investment adviser.
20 Schwab Active Equity Funds
Schwab Health Care Fund
Performance Summary as of 10/31/06
The performance data quoted represents past performance. Past performance does not guarantee future results.
Investment returns and principal value will fluctuate so that an investor’s shares may be worth more or less than their original cost. Current performance may be lower or higher than performance data quoted. To obtain performance information current to the most recent month end, please visit www.schwab.com/schwabfunds.
Performance of a Hypothetical
$10,000 Investment1 |
|
Average Annual Total Returns1,2 |
| | | | | 1 year | | 5 years | | Since Inception |
| Fund: Schwab Health Care Fund™ (7/3/00) | | | | | 7.27 | % | | | 10.95 | % | | | 7.03 | % |
| Benchmark: S&P 1500 Super Composite Health Care Sector Index | | | | | 10.72 | % | | | 2.75 | % | | | 1.69 | % |
| Fund Category: Morningstar Health Care | | | | | 8.44 | % | | | 4.36 | % | | | 2.04 | % |
Since the Health Care fund focuses its investments on companies involved in specific sectors, this fund may involve a greater degree of risk than an investment in mutual funds that do not concentrate their investments.
All figures on this page assume dividends and distributions were reinvested. Index figures do not include trading and management costs, which would lower performance. Indices are unmanaged, and you cannot invest in them directly. Performance results less than one year are not annualized.
1Fund expenses may have been partially absorbed by CSIM and Schwab. Without these reductions, the fund’s returns would have been lower. These returns do not reflect the deduction of taxes that a shareholder would pay on fund distributions or the redemption of fund shares.
2Source for category information: Morningstar, Inc.
Schwab Active Equity Funds 21
Schwab Technology Fund™
Jeffrey Mortimer, (lower left) CFA,
senior vice president and chief invest
ment officer, equities, is responsible
for the overall management of
the fund. Vivienne Hsu, (upper right) CFA, vice
president and senior equities portfolio
manager, is responsible for the day-today
co-management of the fund. Larry Mano, (upper left) vice president
and senior portfolio manager,
is responsible for the day-to-day
co-management of the fund. Paul Alan Davis, (lower right) CFA,
director and portfolio manager, is
responsible for the day-to-day
co-management of the fund. | | The Schwab Technology Fund retuned 8.40%, yet trailed its benchmark, the S&P 1500 SuperComposite Technology Sector Index, which gained 10.97% for the one-year report period. Among the contributing factors to the fund’s performance was an emphasis on smaller market capitalization stocks relative to the benchmark, as smaller-capitalization stocks outperformed large-capitalization stocks for the report period. Industry group selection was negative during the one-year period; an overweight to the Semiconductor and Software and Services industry groups relative to the fund’s benchmark slightly detracted from returns. From a stock selection perspective, top performers included such names as Hewlett-Packard Company and Apple Computer, Inc. On the downside, holdings in EarthLink, Inc. and Computer Sciences Company detracted from overall returns. Of noteworthy mention, the fund did not have any holdings in Microsoft Corporation, which accounts for a considerable portion of the benchmark. During the report period, Microsoft Corporation experienced a decline in stock price, followed by a major rebound later in the period that contributed to the benchmark’s return. |
As of 10/31/06:
Statistics |
| Number of Holdings | | | | 51 |
Weighted Average
Market Cap
($ x 1,000,000) | | | | 32,094 |
| Price/Earnings Ratio (P/E) | | | | 28.3 |
| Price/Book Ratio (P/B) | | | | 2.8 |
Industry Weightings % of Investments |
| Technology Hardware & Equipment | | | | | 43.8 | % |
| Software & Services | | | | | 41.5 | % |
| Semiconductors & Semiconductor Equipment | | | | | 13.6 | % |
| Other | | | | | 1.1 | % |
Total | | | | | 100.0 | % |
Top Holdings % of Net Assets1 |
| Hewlett-Packard Co. | | | | | 7.5 | % |
| International Business Machines Corp. | | | | | 5.5 | % |
| BMC Software, Inc. | | | | | 4.9 | % |
| Electronic Data Systems Corp. | | | | | 4.3 | % |
| Texas Instruments, Inc. | | | | | 4.2 | % |
| Xerox Corp. | | | | | 4.0 | % |
| Motorola, Inc. | | | | | 3.9 | % |
| Global Payments, Inc. | | | | | 3.7 | % |
| Lexmark International, Inc., Class A | | | | | 3.5 | % |
| Cisco Systems, Inc. | | | | | 3.2 | % |
Total | | | | | 44.7 | % |
Portfolio holdings may have changed since the report date.
Source of Sector Classification: S&P and MSCI.
1This list is not a recommendation of any security by the investment adviser.
22 Schwab Active Equity Funds
Schwab Technology Fund
Performance Summary as of 10/31/06
The performance data quoted represents past performance. Past performance does not guarantee future results.
Investment returns and principal value will fluctuate so that an investor’s shares may be worth more or less than their original cost. Current performance may be lower or higher than performance data quoted. To obtain performance information current to the most recent month end, please visit www.schwab.com/schwabfunds.
Performance of a Hypothetical
$10,000 Investment1 |
|
Average Annual Total Returns1,2 |
| | | | | 1 year | | 5 years | | Since Inception |
| Fund: Schwab Technology Fund™ (7/3/00) | | | | | 8.40 | % | | | 6.51 | % | | | (9.56 | )% |
| Benchmark: S&P 1500 Super Composite Technology Sector Index | | | | | 10.97 | % | | | 3.34 | % | | | (11.71 | )% |
| Fund Category: Morningstar Technology | | | | | 10.16 | % | | | 3.41 | % | | | (13.34 | )% |
Since the Technology fund focuses its investments on companies involved in specific sectors, this fund may involve a greater degree of risk than an investment in mutual funds that do not concentrate their investments.
All figures on this page assume dividends and distributions were reinvested. Index figures do not include trading and management costs, which would lower performance. Indices are unmanaged, and you cannot invest in them directly. Performance results less than one year are not annualized.
1Fund expenses may have been partially absorbed by CSIM and Schwab. Without these reductions, the fund’s returns would have been lower. These returns do not reflect the deduction of taxes that a shareholder would pay on fund distributions or the redemption of fund shares.
2Source for category information: Morningstar, Inc.
Schwab Active Equity Funds 23
Fund Expenses (Unaudited)
Examples for a $1,000 Investment |
As a fund shareholder, you incur two types of costs: transaction costs, such as redemption fees; and, ongoing costs, such as management fees, transfer agent and shareholder services fees, and other fund expenses.
The expense examples below are intended to help you understand your ongoing cost (in dollars) of investing in a fund and to compare this cost with the ongoing cost of investing in other mutual funds. These examples are based on an investment of $1,000 invested for six-months beginning May 1, 2006 and held through October 31, 2006.
Actual Return lines in the table below provide information about actual account values and actual expenses. You may use this information, together with the amount you invested, to estimate the expenses that you paid over the period. To do so, simply divide your account value by $1,000 (for example, an $8,600 account value ÷ $1,000 = 8.6), then multiply the result by the number given for your fund or share class under the heading entitled “Expenses Paid During Period.”
Hypothetical Return lines in the table below provide information about hypothetical account values and hypothetical expenses based on a fund’s or share class’ actual expense ratio and an assumed return of 5% per year before expenses. Because the return used is not an actual return, it may not be used to estimate the actual ending account value or expenses you paid for the period.
You may use this information to compare the ongoing costs of investing in the fund and other funds. To do so, compare this 5% hypothetical example with the 5% hypothetical examples that appear in the shareholder reports of the other funds.
Please note that the expenses shown in the table are meant to highlight your ongoing costs only, and do not reflect any transactional costs, such as redemption fees. If these transactional costs were included, your costs would have been higher.
|
|
|
| Expense Ratio1
(Annualized)
|
| Beginning
Account Value
at 5/1/06
|
| Ending
Account Value
(Net of Expenses)
at 10/31/06
|
| Expenses Paid
During Period2
5/1/06–10/31/06
|
|---|
Schwab Premier Equity Fund® | | | | | | | | | | | | | | | | | | |
Investor Shares | | | | | | | | | | | | | | | | | | |
| Actual Return | | | | | 1.16 | % | | $ | 1,000 | | | $ | 1,026.30 | | | $ | 5.92 | |
| Hypothetical 5% Return | | | | | 1.16 | % | | $ | 1,000 | | | $ | 1,019.36 | | | $ | 5.90 | |
Select Shares® | | | | | | | | | | | | | | | | | | |
| Actual Return | | | | | 1.01 | % | | $ | 1,000 | | | $ | 1,027.10 | | | $ | 5.16 | |
| Hypothetical 5% Return | | | | | 1.01 | % | | $ | 1,000 | | | $ | 1,020.11 | | | $ | 5.14 | |
Schwab Core Equity Fund™ | | | | | | | | | | | | | | | | | | |
| Actual Return | | | | | 0.75 | % | | $ | 1,000 | | | $ | 1,066.70 | | | $ | 3.91 | |
| Hypothetical 5% Return | | | | | 0.75 | % | | $ | 1,000 | | | $ | 1,021.42 | | | $ | 3.82 | |
Schwab Dividend Equity Fund™ | | | | | | | | | | | | | | | | | | |
Investor Shares | | | | | | | | | | | | | | | | | | |
| Actual Return | | | | | 1.04 | % | | $ | 1,000 | | | $ | 1,068.30 | | | $ | 5.42 | |
| Hypothetical 5% Return | | | | | 1.04 | % | | $ | 1,000 | | | $ | 1,019.96 | | | $ | 5.30 | |
Select Shares | | | | | | | | | | | | | | | | | | |
| Actual Return | | | | | 0.89 | % | | $ | 1,000 | | | $ | 1,069.30 | | | $ | 4.64 | |
| Hypothetical 5% Return | | | | | 0.89 | % | | $ | 1,000 | | | $ | 1,020.72 | | | $ | 4.53 | |
Schwab Large-Cap Growth Fund™ | | | | | | | | | | | | | | | | | | |
Investor Shares | | | | | | | | | | | | | | | | | | |
| Actual Return | | | | | 1.20 | % | | $ | 1,000 | | | $ | 1,051.30 | | | $ | 6.20 | |
| Hypothetical 5% Return | | | | | 1.20 | % | | $ | 1,000 | | | $ | 1,019.16 | | | $ | 6.11 | |
Select Shares | | | | | | | | | | | | | | | | | | |
| Actual Return | | | | | 0.99 | % | | $ | 1,000 | | | $ | 1,053.20 | | | $ | 5.12 | |
| Hypothetical 5% Return | | | | | 0.99 | % | | $ | 1,000 | | | $ | 1,020.21 | | | $ | 5.04 | |
Schwab Small-Cap Equity Fund™ | | | | | | | | | | | | | | | | | | |
Investor Shares | | | | | | | | | | | | | | | | | | |
| Actual Return | | | | | 1.30 | % | | $ | 1,000 | | | $ | 1,002.80 | | | $ | 6.56 | |
| Hypothetical 5% Return | | | | | 1.30 | % | | $ | 1,000 | | | $ | 1,018.65 | | | $ | 6.61 | |
Select Shares | | | | | | | | | | | | | | | | | | |
| Actual Return | | | | | 1.12 | % | | $ | 1,000 | | | $ | 1,003.40 | | | $ | 5.66 | |
| Hypothetical 5% Return | | | | | 1.12 | % | | $ | 1,000 | | | $ | 1,019.56 | | | $ | 5.70 | |
1Based on the most recent six-month expense ratio; may differ from the expense ratio provided in Financial Highlights.
2Expenses for each fund or share Class are equal to its annualized expense ratio, multiplied by the average account value over the period, multiplied by 184 days of the period, and divided by 365 days of the fiscal year.
24 Schwab Active Equity Funds
Fund Expenses continued (unaudited)
|
|
|
| Expense Ratio1
(Annualized)
|
| Beginning
Account Value
at 5/1/06
|
| Ending
Account Value
(Net of Expenses)
at 10/31/06
|
| Expenses Paid
During Period2
5/1/06–10/31/06
|
|---|
Schwab Hedged Equity Fund™ | | | | | | | | | | | | | | | | | | |
Investor Shares | | | | | | | | | | | | | | | | | | |
| Actual Return | | | | | 2.11 | % | | $ | 1,000 | | | $ | 1,082.77 | | | $ | 11.08 | |
| Hypothetical 5% Return | | | | | 2.11 | % | | $ | 1,000 | | | $ | 1,014.57 | | | $ | 10.71 | |
Select Shares | | | | | | | | | | | | | | | | | | |
| Actual Return | | | | | 1.90 | % | | $ | 1,000 | | | $ | 1,084.07 | | | $ | 9.98 | |
| Hypothetical 5% Return | | | | | 1.90 | % | | $ | 1,000 | | | $ | 1,015.63 | | | $ | 9.65 | |
Schwab Financial Services Focus Fund | | | | | | | | | | | | | | | | | | |
| Actual Return | | | | | 0.99 | % | | $ | 1,000 | | | $ | 1,016.10 | | | $ | 5.03 | |
| Hypothetical 5% Return | | | | | 0.99 | % | | $ | 1,000 | | | $ | 1,020.21 | | | $ | 5.04 | |
Schwab Health Care Focus Fund | | | | | | | | | | | | | | | | | | |
| Actual Return | | | | | 0.83 | % | | $ | 1,000 | | | $ | 1,045.90 | | | $ | 4.28 | |
| Hypothetical 5% Return | | | | | 0.83 | % | | $ | 1,000 | | | $ | 1,021.02 | | | $ | 4.23 | |
Schwab Technology Focus Fund | | | | | | | | | | | | | | | | | | |
| Actual Return | | | | | 0.97 | % | | $ | 1,000 | | | $ | 981.40 | | | $ | 4.84 | |
| Hypothetical 5% Return | | | | | 0.97 | % | | $ | 1,000 | | | $ | 1,020.32 | | | $ | 4.94 | |
1Based on the most recent six-month expense ratio; may differ from the expense ratio provided in Financial Highlights.
2Expenses for each fund or share Class are equal to its annualized expense ratio, multiplied by the average account value over the period, multiplied by 184 days of the period, and divided by 365 days of the fiscal year.
Schwab Active Equity Funds 25
Schwab Premier Equity Fund®
Financial Statements
Financial Highlights
| Investor Shares | | | | 11/1/05—
10/31/06 | | 3/21/051—
10/31/05 |
|---|
Per-Share Data ($) |
| Net asset value at beginning of period | | | | | 10.70 | | | | 10.00 | |
Income from investment operations:
| | | | | | | | | | |
| Net investment income | | | | | 0.01 | | | | 0.02 | |
| Net realized and unrealized gains | | | | | 1.83 | | | | 0.68 | |
| Total income from investment operations | | | | | 1.84 | | | | 0.70 | |
Less distributions:
| | | | | | | | | | |
| Dividends from net investment income | | | | | (0.04 | ) | | | — | |
| Net asset value at end of period | | | | | 12.50 | | | | 10.70 | |
| Total return (%) | | | | | 17.22 | | | | 7.00 | 2 |
| |
Ratios/Supplemental Data (%) |
Ratios to average net assets:
| | | | | | | | | | |
| Net operating expenses | | | | | 1.17 | | | | 0.78 | 3 |
| Gross operating expenses | | | | | 1.18 | | | | 1.23 | 3 |
| Net investment income | | | | | 0.01 | | | | 0.52 | 3 |
| Portfolio turnover rate | | | | | 73 | | | | 33 | 2 |
| Net assets, end of period ($ x 1,000,000) | | | | | 690 | | | | 364 | |
| Select Shares | | | | 11/1/05—
10/31/06 | | 3/21/051—
10/31/05 |
|---|
Per-Share Data ($) |
| Net asset value at beginning of period | | | | | 10.71 | | | | 10.00 | |
Income from investment operations:
| | | | | | | | | | |
| Net investment income | | | | | 0.02 | | | | 0.03 | |
| Net realized and unrealized gains | | | | | 1.83 | | | | 0.68 | |
| Total income from investment operations | | | | | 1.85 | | | | 0.71 | |
Less distributions:
| | | | | | | | | | |
| Dividends from net investment income | | | | | (0.05 | ) | | | — | |
| Net asset value at end of period | | | | | 12.51 | | | | 10.71 | |
| Total return (%) | | | | | 17.28 | | | | 7.10 | 2 |
| |
Ratios/Supplemental Data (%) |
Ratios to average net assets:
| | | | | | | | | | |
| Net operating expenses | | | | | 1.02 | | | | 0.68 | 3 |
| Gross operating expenses | | | | | 1.03 | | | | 1.08 | 3 |
| Net investment income | | | | | 0.17 | | | | 0.63 | 3 |
| Portfolio turnover rate | | | | | 73 | | | | 33 | 2 |
| Net assets, end of period ($ x 1,000,000) | | | | | 857 | | | | 481 | |
1 | | Commencement of operations |
26 See financial notes.
Schwab Premier Equity Fund
Portfolio Holdings as of October 31, 2006
This section shows all the securities in the fund’s portfolio and their value as of the report date.
The fund files its complete schedule of portfolio holdings with the SEC for the first and third quarters of each fiscal year on Form N-Q. The fund’s Form N-Q is available on the SEC’s website at http://www.sec.gov and may be viewed and copied at the SEC’s Public Reference Room in Washington, D.C. Call 1-800-SEC-0330 for information on the operation of the Public Reference Room. The schedule of portfolio holdings filed on a fund’s most recent Form N-Q is also available by visiting Schwab’s website at www.schwab.com/schwabfunds.
Holdings by Category
|
| Cost
($ x 1,000)
|
| Value
($ x 1,000)
|
|---|
99.8% | | | | Common Stock | | | 1,330,671 | | | | 1,542,720 | |
0.6% | | | | Short-Term Investment | | | 9,270 | | | | 9,270 | |
—% | | | | U.S. Treasury Obligation | | | 119 | | | | 119 | |
100.4% | | | | Total Investments | | | 1,340,060 | | | | 1,552,109 | |
3.5% | | | | Collateral Invested for Securities on Loan | | | 54,624 | | | | 54,624 | |
(3.9)% | | | | Other Assets and Liabilities, Net | | | | | | | (60,106 | ) |
100% | | | | Total Net Assets | | | | | | | 1,546,627 | |
| Security | | | | Number
of Shares | | Value
($ x 1,000) |
|---|
Common Stock 99.8% of net assets |
Banks 4.5% |
| Bank of Hawaii Corp. | | | | | 225,800 | | | | 11,780 | |
| Comerica, Inc. | | | | | 228,500 | | | | 13,297 | |
| KeyCorp | | | | | 435,200 | | | | 16,163 | |
| PNC Financial Services Group, Inc. | | | | | 190,000 | | | | 13,306 | |
| Radian Group, Inc. | | | | | 275,200 | | | | 14,668 | |
| | | | | | | | | | 69,214 | |
Capital Goods 6.7% |
| General Dynamics Corp. | | | | | 233,800 | | | | 16,623 | |
| Lockheed Martin Corp. | | | | | 205,000 | | | | 17,821 | |
| Precision Castparts Corp. | | | | | 250,000 | | | | 17,015 | |
| Raytheon Co. | | | | | 370,000 | | | | 18,481 | |
| The Boeing Co. | | | | | 210,100 | | | | 16,779 | |
| Thomas & Betts Corp. * | | | | | 322,400 | | | | 16,613 | |
| | | | | | | | | | 103,332 | |
Commercial Services & Supplies 2.2% |
| Equifax, Inc. | | | | | 300,000 | | | | 11,409 | |
| Republic Services, Inc. | | | | | 300,000 | | | | 12,303 | |
| Waste Management, Inc. | | | | | 291,600 | | | | 10,929 | |
| | | | | | | | | | 34,641 | |
Consumer Durables & Apparel 1.1% |
| Newell Rubbermaid, Inc. | | | | | 600,000 | | | | 17,268 | |
Consumer Services 1.1% |
| International Game Technology | | | | | 410,000 | | | | 17,429 | |
Diversified Financials 9.1% |
| American Express Co. | | | | | 271,200 | | | | 15,678 | |
| AmeriCredit Corp. * | | | | | 544,900 | | | | 13,933 | |
| Ameriprise Financial, Inc. | | | | | 200,000 | | | | 10,300 | |
| Bank of America Corp. | | | | | 260,000 | | | | 14,006 | |
| Franklin Resources, Inc. | | | | | 180,000 | | | | 20,513 | |
| Investment Technology Group, Inc. * | | | | | 328,700 | | | | 15,350 | |
| Mellon Financial Corp. | | | | | 450,600 | | | | 17,483 | |
| Northern Trust Corp. | | | | | 287,000 | | | | 16,853 | |
| State Street Corp. | | | | | 250,000 | | | | 16,058 | |
| | | | | | | | | | 140,174 | |
Energy 9.0% |
| Cameron International Corp. * | | | | | 383,200 | | | | 19,198 | |
| Exxon Mobil Corp. | | | | | 280,100 | | | | 20,005 | |
| Overseas Shipholding Group, Inc. | | | | | 254,500 | | | | 15,919 | |
| Pride International, Inc. * | | | | | 591,500 | | | | 16,331 | |
| Schlumberger Ltd. | | | | | 283,400 | | | | 17,877 | |
| SEACOR Holdings, Inc. * | | | | | 135,000 | | | | 12,080 | |
| Sunoco, Inc. | | | | | 225,000 | | | | 14,879 | |
| Veritas DGC, Inc. * | | | | | 314,000 | | | | 22,611 | |
| | | | | | | | | | 138,900 | |
Food & Staples Retailing 0.6% |
| The Kroger Co. | | | | | 425,000 | | | | 9,558 | |
Food, Beverage & Tobacco 8.1% |
| Anheuser-Busch Cos., Inc. | | | | | 350,000 | | | | 16,597 | |
| Archer-Daniels-Midland Co. | | | | | 422,500 | | | | 16,266 | |
| ConAgra Foods, Inc. | | | | | 600,000 | | | | 15,690 | |
| General Mills, Inc. | | | | | 340,000 | | | | 19,319 | |
| H.J. Heinz Co. | | | | | 250,000 | | | | 10,540 | |
Reynolds American, Inc. (a) | | | | | 260,000 | | | | 16,422 | |
| Sara Lee Corp. | | | | | 830,200 | | | | 14,196 | |
| The Coca-Cola Co. | | | | | 363,800 | | | | 16,997 | |
| | | | | | | | | | 126,027 | |
Health Care Equipment & Services 5.9% |
| Aetna, Inc. | | | | | 330,720 | | | | 13,632 | |
| AmerisourceBergen Corp. | | | | | 367,900 | | | | 17,365 | |
| Becton Dickinson & Co. | | | | | 259,900 | | | | 18,201 | |
| CIGNA Corp. | | | | | 130,000 | | | | 15,207 | |
| McKesson Corp. | | | | | 344,500 | | | | 17,256 | |
| WellPoint, Inc. * | | | | | 120,500 | | | | 9,197 | |
| | | | | | | | | | 90,858 | |
See financial notes. 27
Schwab Premier Equity Fund
Portfolio Holdings continued
| Security | | | | Number
of Shares | | Value
($ x 1,000) |
|---|
Insurance 9.4% |
| Hanover Insurance Group, Inc. | | | | | 260,000 | | | | 11,791 | |
| Loews Corp. | | | | | 448,000 | | | | 17,436 | |
| MetLife, Inc. | | | | | 300,000 | | | | 17,139 | |
| Nationwide Financial Services, Inc., Class A | | | | | 385,000 | | | | 19,604 | |
| Principal Financial Group, Inc. | | | | | 305,000 | | | | 17,229 | |
| Prudential Financial, Inc. | | | | | 188,300 | | | | 14,486 | |
| The Chubb Corp. | | | | | 310,000 | | | | 16,477 | |
| The Hartford Financial Services Group, Inc. | | | | | 174,000 | | | | 15,168 | |
| W. R. Berkley Corp. | | | | | 420,000 | | | | 15,481 | |
| | | | | | | | | | 144,811 | |
Materials 4.8% |
| Greif, Inc., Class A | | | | | 205,000 | | | | 19,211 | |
| Nucor Corp. | | | | | 311,000 | | | | 18,165 | |
| Pactiv Corp. * | | | | | 660,000 | | | | 20,354 | |
| Rohm & Haas Co. | | | | | 322,500 | | | | 16,712 | |
| | | | | | | | | | 74,442 | |
Media 2.6% |
| CBS Corp., Class B | | | | | 482,500 | | | | 13,964 | |
| The McGraw-Hill Cos., Inc. | | | | | 250,000 | | | | 16,042 | |
| The Walt Disney Co. | | | | | 322,000 | | | | 10,130 | |
| | | | | | | | | | 40,136 | |
Pharmaceuticals & Biotechnology 6.7% |
| Applied Biosystems Group — Applera Corp. | | | | | 480,000 | | | | 17,904 | |
| Biogen Idec, Inc. * | | | | | 289,000 | | | | 13,756 | |
| Johnson & Johnson | | | | | 147,000 | | | | 9,908 | |
| King Pharmaceuticals, Inc. * | | | | | 900,000 | | | | 15,057 | |
| Merck & Co., Inc. | | | | | 351,800 | | | | 15,979 | |
| Pfizer, Inc. | | | | | 620,000 | | | | 16,523 | |
| Schering-Plough Corp. | | | | | 650,000 | | | | 14,391 | |
| | | | | | | | | | 103,518 | |
Retailing 4.7% |
| Expedia, Inc. * | | | | | 500,000 | | | | 8,125 | |
| J.C. Penney Co., Inc. | | | | | 250,000 | | | | 18,808 | |
| Nordstrom, Inc. | | | | | 370,900 | | | | 17,562 | |
| Office Depot, Inc. * | | | | | 321,500 | | | | 13,500 | |
| Payless Shoesource, Inc. * | | | | | 537,800 | | | | 14,386 | |
| | | | | | | | | | 72,381 | |
Semiconductors & Semiconductor Equipment 2.4% |
| Applied Materials, Inc. | | | | | 770,000 | | | | 13,390 | |
| Micron Technology, Inc. * | | | | | 575,000 | | | | 8,309 | |
| Texas Instruments, Inc. | | | | | 508,100 | | | | 15,335 | |
| | | | | | | | | | 37,034 | |
Software & Services 7.1% |
| BEA Systems, Inc. * | | | | | 1,100,000 | | | | 17,897 | |
| BMC Software, Inc. * | | | | | 620,000 | | | | 18,792 | |
| Global Payments, Inc. | | | | | 380,000 | | | | 16,610 | |
| Intuit, Inc. * | | | | | 333,200 | | | | 11,762 | |
Red Hat, Inc. (a)* | | | | | 690,000 | | | | 11,302 | |
| Sybase, Inc. * | | | | | 649,700 | | | | 15,820 | |
| Synopsys, Inc. * | | | | | 797,100 | | | | 17,943 | |
| | | | | | | | | | 110,126 | |
Technology Hardware & Equipment 5.5% |
| Harris Corp. | | | | | 270,000 | | | | 11,502 | |
| Hewlett-Packard Co. | | | | | 510,000 | | | | 19,757 | |
Intermec, Inc. (a)* | | | | | 550,000 | | | | 12,430 | |
| Lexmark International, Inc., Class A * | | | | | 240,000 | | | | 15,262 | |
| Motorola, Inc. | | | | | 650,000 | | | | 14,989 | |
| NCR Corp. * | | | | | 281,300 | | | | 11,680 | |
| | | | | | | | | | 85,620 | |
Telecommunication Services 2.8% |
| ALLTEL Corp. | | | | | 175,000 | | | | 9,329 | |
| CenturyTel, Inc. | | | | | 440,000 | | | | 17,706 | |
| Qwest Communications International, Inc. * | | | | | 1,800,000 | | | | 15,534 | |
| | | | | | | | | | 42,569 | |
Transportation 2.0% |
AMR Corp. (a)* | | | | | 600,000 | | | | 17,004 | |
| FedEx Corp. | | | | | 115,000 | | | | 13,172 | |
| | | | | | | | | | 30,176 | |
Utilities 3.5% |
| Allegheny Energy, Inc. * | | | | | 433,700 | | | | 18,662 | |
| Alliant Energy Corp. | | | | | 185,000 | | | | 7,095 | |
| FirstEnergy Corp. | | | | | 225,700 | | | | 13,282 | |
| TXU Corp. | | | | | 245,000 | | | | 15,467 | |
| | | | | | | | | | 54,506 | |
28 See financial notes.
Schwab Premier Equity Fund
Portfolio Holdings continued
Security
Rate, Maturity Date
| | | | Face
Amount
($ x 1,000) | | Value
($ x 1,000) |
|---|
Short-Term Investment 0.6% of net assets |
Repurchase Agreement 0.6% |
Fixed Income Clearing Corp.
dated 10/31/06, due
11/01/06 at 4.8%, with a
maturity value of $9,271 (fully
collateralized by Federal
National Mortgage Association
with a value of $9,511) | | | | | 9,270 | | | | 9,270 | |
Security
Rate, Maturity Date
| | | |
|---|
U.S. Treasury Obligation 0.0% of net assets |
| |
U.S. Treasury Bill
4.90%, 12/14/06 | | | | | 120 | | | 119 |
Security
| | | | Number of
Shares | | Value
($ x 1,000) |
|---|
| |
Collateral Invested for Securities on Loan 3.5% of net assets |
| |
| State Street Navigator Security Lending Prime Portfolio | | | | | 54,623,850 | | | | 54,624 | |
End of collateral invested for securities on loan.At 10-31-06 the tax basis cost of the fund’s investments was $1,340,060 and the unrealized appreciation and depreciation were $229,132 and ($17,083), respectively, with a net appreciation of $212,049.
| * | | Non-income producing security. |
(a) | | All or a portion of this security is on loan. |
See financial notes. 29
Schwab Premier Equity Fund
Statement of
Assets and Liabilities
As of October 31, 2006. All numbers x 1,000 except NAV.
Assets |
| Investments, at value including securities on loan of $53,356 (cost $1,340,060) | | | | $ | 1,552,109 | |
| Collateral invested for securities on loan | | | | | 54,624 | |
| Cash | | | | | 11 | |
Receivables:
| | | | | | |
| Investments sold | | | | | 2,624 | |
| Fund shares sold | | | | | 2,159 | |
| Interest | | | | | 1 | |
| Dividends | | | | | 814 | |
| Income from securities on loan | | | | | 3 | |
| Prepaid expenses | | | | + | 6 | |
Total assets | | | | | 1,612,351 | |
| |
Liabilities |
| Collateral for securities on loan | | | | | 54,624 | |
Payables:
| | | | | | |
| Investments bought | | | | | 10,160 | |
| Investment adviser and administrator fees | | | | | 114 | |
| Transfer agent and shareholder services fees | | | | | 22 | |
| Fund shares redeemed | | | | | 748 | |
| Trustee fees | | | | | 1 | |
| Accrued expenses | | | | + | 55 | |
Total liabilities | | | | | 65,724 | |
| |
Net Assets |
Total assets | | | | | 1,612,351 | |
Total liabilities | | | | | –65,724 | |
Net assets | | | | $ | 1,546,627 | |
| |
Net Assets by Source | | | | | | |
| Capital received from investors | | | | | 1,335,150 | |
| Net realized capital losses | | | | | (572 | ) |
| Net unrealized capital gains | | | | | 212,049 | |
| |
Net Asset Value (NAV) by Shares Class | | | | | | |
| Share Class | | | | Net Assets | | ÷ | | Shares
Outstanding | | = | | NAV |
|---|
| Investor Shares | | | | $ | 689,925 | | | | | | | | 55,213 | | | | | | | $ | 12.50 | |
| Select Shares | | | | $ | 856,702 | | | | | | | | 68,465 | | | | | | | $ | 12.51 | |
30 See financial notes.
Schwab Premier Equity Fund
Statement of
Operations
For November 1, 2005 through October 31, 2006. All numbers x 1,000.
Investment Income |
| Dividends | | | | $ | 15,362 | |
| Interest | | | | | 399 | |
| Securities on loan | | | | + | 54 | |
Total Investment Income | | | | | 15,815 | |
| |
Net Realized Gains and Losses |
| Net realized losses on investments | | | | | (133 | ) |
| Net realized gains on futures contracts | | | | + | 107 | |
Net realized losses | | | | | (26 | ) |
| |
Net Unrealized Gains and Losses |
| Net unrealized gains on investments | | | | | 172,611 | |
| |
Expenses |
| Investment adviser and administrator fees | | | | | 11,827 | |
Transfer agent and shareholder service fees:
| | | | | | |
| Investor Shares | | | | | 1,479 | |
| Select Shares | | | | | 740 | |
| Registration fees | | | | | 289 | |
| Portfolio accounting fees | | | | | 69 | |
| Professional fees | | | | | 40 | |
| Shareholder reports | | | | | 34 | |
| Custodian fees | | | | | 30 | |
| Trustees’ fees | | | | | 13 | |
| Overdraft expense | | | | | 7 | |
| Other expenses | | | | + | 24 | |
| Total expenses | | | | | 14,552 | |
| Custody Credits | | | | | –14 | |
Net expenses | | | | | 14,538 | |
| |
Increase in Net Assets from Operations |
Total investment income | | | | | 15,815 | |
Net expenses | | | | | –14,538 | |
Net investment income | | | | | 1,277 | |
Net realized losses | | | | | (26 | ) |
Net unrealized gains | | | | + | 172,611 | |
Increase in net assets from operations | | | | $ | 173,862 | |
See financial notes. 31
Schwab Premier Equity Fund
Statement of
Changes in Net Assets
For the current and prior report periods. All numbers x 1,000.
| | | | 11/1/05–10/31/06 | | 3/21/05*–10/31/05 |
|---|
| Net investment income | | | | $ | 1,277 | | | $ | 2,233 | |
| Net realized losses | | | | | (26 | ) | | | (546 | ) |
| Net unrealized gains | | | | + | 172,611 | | | | 39,438 | |
Increase in net assets from operations | | | | | 173,862 | | | | 41,125 | |
| |
Distributions Paid |
Dividends from net investment income | | | | | | | | | | |
| Investor Shares | | | | | 1,487 | | | | — | |
| Select Shares | | | | + | 2,289 | | | | — | |
Total Dividends from net investment income | | | | $ | 3,776 | | | $ | — | |
Transactions in Fund Shares | | | | | | | | | | | | | | | | | | |
| | | | 11/1/05–10/31/06 | | 3/21/05*–10/31/05 | |
|---|
| | | | SHARES | | VALUE | | SHARES | | VALUE |
|---|
Shares Sold | | | | | | | | | | | | | | | | | | |
| Investor Shares | | | | | 33,411 | | | $ | 393,500 | | | | 37,370 | | | $ | 381,553 | |
| Select Shares | | | | + | 41,099 | | | | 485,841 | | | | 48,755 | | | | 497,896 | |
Total shares sold | | | | | 74,510 | | | $ | 879,341 | | | | 86,125 | | | $ | 879,449 | |
| | | | | | | | | | | | | | | | | | | |
Shares Reinvested | | | | | | | | | | | | | | | | | | |
| Investor Shares | | | | | 118 | | | $ | 1,352 | | | | — | | | $ | — | |
| Select Shares | | | | + | 172 | | | | 1,981 | | | | — | | | | — | |
Total shares reinvested | | | | | 290 | | | $ | 3,333 | | | | — | | | $ | — | |
| | | | | | | | | | | | | | | | | | | |
Shares Redeemed | | | | | | | | | | | | | | | | | | |
| Investor Shares | | | | | (12,348 | ) | | $ | (145,311 | ) | | | (3,338 | ) | | $ | (35,148 | ) |
| Select Shares | | | | + | (17,727 | ) | | | (205,961 | ) | | | (3,834 | ) | | | (40,287 | ) |
Total shares redeemed | | | | | (30,075 | ) | | $ | (351,272 | ) | | | (7,172 | ) | | $ | (75,435 | ) |
| | | | | | | | | | | | | | | | | | | |
Net transactions in fund shares | | | | | 44,725 | | | $ | 531,402 | | | | 78,953 | | | $ | 804,014 | |
| |
Shares Outstanding and Net Assets |
| | | | 11/1/05–10/31/06 | | 3/21/05*–10/31/05 | |
|---|
| | | | SHARES | | NET ASSETS | | SHARES | | NET ASSETS |
|---|
| Beginning of period | | | | | 78,953 | | | $ | 845,139 | | | | — | | | $ | — | |
| Total increase or decrease | | | | + | 44,725 | | | | 701,488 | | | | 78,953 | | | | 845,139 | |
End of period | | | | | 123,678 | | | $ | 1,546,627 | | | | 78,953 | | | $ | 845,139 | |
Net investment income not yet distributed | | | | | | | | $ | — | | | | | | | $ | 2,233 | |
* Commencement of Operations
32 See financial notes.
Schwab Core Equity Fund™
Financial Statements
Financial Highlights
| | | | 11/1/05—
10/31/06 | | 11/1/04—
10/31/05 | | 11/1/03—
10/31/04 | | 11/1/02—
10/31/03 | | 11/1/01—
10/31/02 |
|---|
Per-Share Data ($)1 |
| Net asset value at beginning of period | | | | | 15.81 | | | | 13.81 | | | | 12.71 | | | | 10.89 | | | | 12.53 | |
Income or loss from investment operations:
| | | | | | | | | | | | | | | | | | | | | | |
| Net investment income | | | | | 0.10 | | | | 0.13 | | | | 0.12 | | | | 0.10 | | | | 0.08 | |
| Net realized and unrealized gains or losses | | | | | 2.58 | | | | 2.03 | | | | 1.09 | | | | 1.79 | | | | (1.64 | ) |
| Total income or loss from investment operations | | | | | 2.68 | | | | 2.16 | | | | 1.21 | | | | 1.89 | | | | (1.56 | ) |
Less distributions:
| | | | | | | | | | | | | | | | | | | | | | |
| Dividends from net investment income | | | | | (0.09 | ) | | | (0.16 | ) | | | (0.11 | ) | | | (0.07 | ) | | | (0.08 | ) |
| Net asset value at end of period | | | | | 18.40 | | | | 15.81 | | | | 13.81 | | | | 12.71 | | | | 10.89 | |
| Total return (%) | | | | | 17.02 | | | | 15.74 | | | | 9.57 | | | | 17.54 | | | | (12.58 | ) |
| |
Ratios/Supplemental Data (%)1 |
Ratios to average net assets:
| | | | | | | | | | | | | | | | | | | | | | |
| Net operating expenses | | | | | 0.75 | | | | 0.75 | | | | 0.75 | | | | 0.75 | | | | 0.75 | |
| Gross operating expenses | | | | | 0.81 | | | | 0.85 | | | | 0.88 | | | | 0.88 | | | | 0.91 | |
| Net investment income | | | | | 0.63 | | | | 0.93 | | | | 0.89 | | | | 0.94 | | | | 0.63 | |
| Portfolio turnover rate | | | | | 42 | | | | 48 | | | | 86 | | | | 73 | | | | 114 | |
| Net assets, end of period ($ x 1,000,000) | | | | | 1,125 | | | | 547 | | | | 263 | | | | 237 | | | | 179 | |
1 | | Prior to June 1, 2002, the fund’s day-to-day investment management was handled by a subadviser, Symphony Asset Management LLC |
See financial notes. 33
Schwab Core Equity Fund
Portfolio Holdings as of October 31, 2006
This section shows all the securities in the fund’s portfolio and their value as of the report date.
The fund files its complete schedule of portfolio holdings with the SEC for the first and third quarters of each fiscal year on Form N-Q. The fund’s Form N-Q is available on the SEC’s website at http://www.sec.gov and may be viewed and copied at the SEC’s Public Reference Room in Washington, D.C. Call 1-800-SEC-0330 for information on the operation of the Public Reference Room. The schedule of portfolio holdings filed on a fund’s most recent Form N-Q is also available by visiting Schwab’s website at www.schwab.com/schwabfunds.
Holdings by Category
|
| Cost
($ x 1,000)
|
| Value
($ x 1,000)
|
|
|---|
98.9% | | | | Common Stock | | | 958,596 | | | | 1,112,759 | |
1.8% | | | | Short-Term Investment | | | 19,762 | | | | 19,762 | |
—% | | | | U.S. Treasury Obligation | | | 273 | | | | 273 | |
100.7% | | | | Total Investments | | | 978,631 | | | | 1,132,794 | |
0.9% | | | | Collateral Invested for Securities on Loan | | | 10,748 | | | | 10,748 | |
(1.6)% | | | | Other Assets and Liabilities, Net | | | | | | | (18,235 | ) |
100.0% | | | | Total Net Assets | | | | | | | 1,125,307 | |
Security
| | | | Number
of Shares | | Value
($ x 1,000) |
|---|
Common Stock 98.9% of net assets |
Banks 4.2% |
| Comerica, Inc. | | | | | 172,500 | | | | 10,038 | |
| KeyCorp | | | | | 235,200 | | | | 8,735 | |
| Radian Group, Inc. | | | | | 534,000 | | | | 28,462 | |
| | | | | | | | | | 47,235 | |
Capital Goods 12.1% |
| Emerson Electric Co. (a) | | | | | 88,800 | | | | 7,495 | |
| General Dynamics Corp. | | | | | 58,400 | | | | 4,152 | |
Lockheed Martin Corp. (a) | | | | | 492,800 | | | | 42,839 | |
| Northrop Grumman Corp. | | | | | 36,400 | | | | 2,416 | |
Raytheon Co. (a) | | | | | 542,500 | | | | 27,098 | |
The Boeing Co. (a) | | | | | 659,100 | | | | 52,636 | |
| | | | | | | | | | 136,636 | |
Commercial Services & Supplies 0.2% |
| Equifax, Inc. | | | | | 70,000 | | | | 2,662 | |
Consumer Durables & Apparel 2.1% |
| Hasbro, Inc. | | | | | 243,800 | | | | 6,319 | |
| Newell Rubbermaid, Inc. | | | | | 493,900 | | | | 14,214 | |
| Nike, Inc., Class B | | | | | 27,900 | | | | 2,564 | |
| | | | | | | | | | 23,097 | |
Diversified Financials 9.3% |
American Express Co. (a) | | | | | 552,000 | | | | 31,911 | |
| AmeriCredit Corp. (b)* | | | | | 87,000 | | | | 2,225 | |
| Franklin Resources, Inc. | | | | | 393,100 | | | | 44,798 | |
| JPMorgan Chase & Co. | | | | | 360,000 | | | | 17,078 | |
| Mellon Financial Corp. | | | | | 115,000 | | | | 4,462 | |
Moody’s Corp. (a) | | | | | 44,800 | | | | 2,970 | |
Northern Trust Corp. (a) | | | | | 17,500 | | | | 1,028 | |
| | | | | | | | | | 104,472 | |
Energy 5.1% |
Exxon Mobil Corp. (a) | | | | | 708,600 | | | | 50,608 | |
| Pride International, Inc. * | | | | | 245,400 | | | | 6,776 | |
| | | | | | | | | | 57,384 | |
Food, Beverage & Tobacco 5.0% |
| ConAgra Foods, Inc. | | | | | 793,100 | | | | 20,740 | |
| General Mills, Inc. | | | | | 34,500 | | | | 1,960 | |
Reynolds American, Inc. (b) | | | | | 140,000 | | | | 8,842 | |
The Coca-Cola Co. (a) | | | | | 540,500 | | | | 25,252 | |
| | | | | | | | | | 56,794 | |
Health Care Equipment & Services 7.1% |
Aetna, Inc. (a) | | | | | 422,800 | | | | 17,428 | |
| AmerisourceBergen Corp. | | | | | 300,600 | | | | 14,188 | |
| Becton Dickinson & Co. | | | | | 122,300 | | | | 8,565 | |
| CIGNA Corp. | | | | | 108,200 | | | | 12,657 | |
| Humana, Inc. * | | | | | 69,200 | | | | 4,152 | |
| McKesson Corp. | | | | | 348,300 | | | | 17,446 | |
| WellPoint, Inc. * | | | | | 68,000 | | | | 5,190 | |
| | | | | | | | | | 79,626 | |
Insurance 9.6% |
| American Financial Group, Inc. | | | | | 36,000 | | | | 1,723 | |
AON Corp. (a) | | | | | 24,000 | | | | 835 | |
| Genworth Financial, Inc., Class A | | | | | 105,600 | | | | 3,531 | |
| Loews Corp. | | | | | 266,700 | | | | 10,380 | |
MetLife, Inc. (a) | | | | | 779,900 | | | | 44,556 | |
Nationwide Financial Services, Inc., Class A (a) | | | | | 50,000 | | | | 2,546 | |
| Principal Financial Group, Inc. | | | | | 460,600 | | | | 26,019 | |
| Prudential Financial, Inc. | | | | | 64,000 | | | | 4,923 | |
| The Chubb Corp. | | | | | 151,800 | | | | 8,068 | |
| W. R. Berkley Corp. | | | | | 138,000 | | | | 5,087 | |
| | | | | | | | | | 107,668 | |
Materials 5.9% |
| Crown Holdings, Inc. * | | | | | 164,200 | | | | 3,192 | |
| International Paper Co. | | | | | 325,000 | | | | 10,839 | |
| Monsanto Co. | | | | | 34,400 | | | | 1,521 | |
| Nucor Corp. | | | | | 200,000 | | | | 11,682 | |
| Pactiv Corp. * | | | | | 251,000 | | | | 7,741 | |
| Phelps Dodge Corp. | | | | | 44,000 | | | | 4,417 | |
| Rohm & Haas Co. | | | | | 362,500 | | | | 18,785 | |
| Temple-Inland, Inc. | | | | | 63,700 | | | | 2,512 | |
| The Lubrizol Corp. | | | | | 115,400 | | | | 5,193 | |
| | | | | | | | | | 65,882 | |
34 See financial notes.
Schwab Core Equity Fund
Portfolio Holdings continued
Security
| | | | Number
of Shares | | Value
($ x 1,000) |
|---|
Media 3.9% |
| CBS Corp., Class B | | | | | 27,000 | | | | 781 | |
| Omnicom Group, Inc. | | | | | 230,000 | | | | 23,334 | |
| The McGraw-Hill Cos., Inc. | | | | | 275,000 | | | | 17,647 | |
Time Warner, Inc. (a) | | | | | 125,500 | | | | 2,511 | |
| | | | | | | | | | 44,273 | |
Pharmaceuticals & Biotechnology 9.9% |
Applera Corp. — Applied Biosystems Group (a) | | | | | 525,000 | | | | 19,582 | |
| Biogen Idec, Inc. * | | | | | 40,000 | | | | 1,904 | |
King Pharmaceuticals, Inc. (a)* | | | | | 630,000 | | | | 10,540 | |
| Merck & Co., Inc. | | | | | 792,600 | | | | 36,000 | |
| Pfizer, Inc. | | | | | 1,648,000 | | | | 43,919 | |
| | | | | | | | | | 111,945 | |
Retailing 2.8% |
| American Eagle Outfitters, Inc. | | | | | 165,000 | | | | 7,557 | |
| J.C. Penney Co., Inc. | | | | | 202,500 | | | | 15,234 | |
| Office Depot, Inc. * | | | | | 221,400 | | | | 9,297 | |
| | | | | | | | | | 32,088 | |
Semiconductors & Semiconductor Equipment 2.3% |
| Applied Materials, Inc. | | | | | 758,900 | | | | 13,197 | |
| Micron Technology, Inc. * | | | | | 195,000 | | | | 2,818 | |
| Texas Instruments, Inc. | | | | | 317,100 | | | | 9,570 | |
| | | | | | | | | | 25,585 | |
Software & Services 4.2% |
Autodesk, Inc. (a)* | | | | | 169,000 | | | | 6,211 | |
BMC Software, Inc. (a)* | | | | | 267,000 | | | | 8,093 | |
Electronic Data Systems Corp. (a) | | | | | 509,200 | | | | 12,898 | |
| Global Payments, Inc. | | | | | 93,500 | | | | 4,087 | |
| Intuit, Inc. * | | | | | 193,000 | | | | 6,813 | |
| McAfee, Inc. * | | | | | 150,500 | | | | 4,354 | |
Sybase, Inc. (a)* | | | | | 62,200 | | | | 1,514 | |
Synopsys, Inc. (a)* | | | | | 152,500 | | | | 3,433 | |
| | | | | | | | | | 47,403 | |
Technology Hardware & Equipment 9.7% |
Hewlett-Packard Co. (a) | | | | | 1,134,200 | | | | 43,939 | |
International Business Machines Corp. (a) | | | | | 416,000 | | | | 38,409 | |
| Lexmark International, Inc., Class A * | | | | | 62,500 | | | | 3,974 | |
| Motorola, Inc. | | | | | 338,900 | | | | 7,815 | |
| NCR Corp. * | | | | | 126,000 | | | | 5,232 | |
Xerox Corp. (a)* | | | | | 546,700 | | | | 9,294 | |
| | | | | | | | | | 108,663 | |
Telecommunication Services 2.8% |
| AT&T Corp. | | | | | 157,421 | | | | 5,392 | |
| Citizens Communications Co. | | | | | 1,274,100 | | | | 18,678 | |
| Qwest Communications International, Inc. * | | | | | 591,600 | | | | 5,106 | |
| Verizon Communications, Inc. | | | | | 56,300 | | | | 2,083 | |
| | | | | | | | | | 31,259 | |
Transportation 0.6% |
CSX Corp. (a) | | | | | 179,300 | | | | 6,396 | |
Utilities 2.1% |
Edison International (a) | | | | | 195,600 | | | | 8,693 | |
| FirstEnergy Corp. | | | | | 100,000 | | | | 5,885 | |
| The AES Corp. * | | | | | 170,400 | | | | 3,747 | |
| TXU Corp. | | | | | 85,000 | | | | 5,366 | |
| | | | | | | | | | 23,691 | |
Security
Rate, Maturity Date
| | | | Face
Amount
($ x 1,000) | |
|---|
Short-Term Investment 1.8% of net assets |
Repurchase Agreement 1.8% |
Fixed Income Clearing Corp.
dated 10/31/06, due
11/01/06 at 4.8%, with a
maturity value of $19,765 (fully
collateralized by Federal Home
Loan Bank with a value of
$20,491.) | | | | | 19,762 | | | | 19,762 | |
U.S. Treasury Obligation 0.0% of net assets |
| |
U.S. Treasury Bill
4.94%, 12/14/06 | | | | | 275 | | | | 273 | |
Security
| | | | Number of
Shares | |
|---|
Collateral Invested for Securities on Loan 0.9% of net assets |
| |
State Street Navigator Security
Lending Prime Portfolio | | | | | 10,748,063 | | | | 10,748 | |
End of collateral invested for securities on loan.See financial notes. 35
Schwab Core Equity Fund
Portfolio Holdings continued
At 10-31-06 the tax basis cost of the fund’s investments was $978,631, and the unrealized appreciation and depreciation were $163,064 and ($8,901), respectively, with a net unrealized appreciation of $154,163.
In addition to the above, the fund held the following at 10-31-06. All numbers are x1,000 except number of futures contracts.
| | | | Number of
Contracts | | Contract
Value | | Unrealized
Gains |
|---|
|
| |
| S&P 500 Index, e-mini, Long, expires 12/15/06 | | | | | 80 | | | | 5,533 | | | | 150 | |
| * | | Non-income producing security. |
(a) | | All or a portion of this security is held as collateral for open futures contracts. |
(b) | | All or a portion of this security is on loan. |
36 See financial notes.
Schwab Core Equity Fund
Statement of
Assets and Liabilities
As of October 31, 2006. All numbers x 1,000 except NAV.
Assets |
| Investments, at value including securities on loan of $10,514 (cost $978,631) | | | | $ | 1,132,794 | |
| Collateral invested for securities on loan | | | | | 10,748 | |
| Cash | | | | | 6 | |
Receivables:
| | | | | | |
| Investments sold | | | | | 18,670 | |
| Fund shares sold | | | | | 7,495 | |
| Dividends | | | | | 625 | |
| Interest | | | | | 3 | |
| Income from securities on loan | | | | | 1 | |
| Prepaid expenses | | | | + | 5 | |
Total assets | | | | | 1,170,347 | |
| |
Liabilities |
| Collateral for securities on loan | | | | | 10,748 | |
Payables:
| | | | | | |
| Investments bought | | | | | 33,686 | |
| Investment adviser and administrator fees | | | | | 41 | |
| Transfer agent and shareholder services fees | | | | | 24 | |
| Fund shares redeemed | | | | | 483 | |
| Trustee fees | | | | | 1 | |
| Accrued expenses | | | | + | 57 | |
Total liabilities | | | | | 45,040 | |
| |
Net Assets |
Total assets | | | | | 1,170,347 | |
Total liabilities | | | | | –45,040 | |
Net assets | | | | $ | 1,125,307 | |
| | | | | | | |
Net Assets by Source | | | | | | |
| Capital received from investors | | | | | 945,801 | |
| Net investment income not yet distributed | | | | | 3,880 | |
| Net realized capital gains | | | | | 21,313 | |
| Net unrealized capital gains | | | | | 154,313 | |
| |
Net Asset Value (NAV) | | | | | | |
Net Assets
| | | | ÷ | | Shares
Outstanding | | = | | NAV |
|---|
| $1,125,307 | | | | | | | | | 61,157 | | | | | | | $ | 18.40 | |
See financial notes. 37
Schwab Core Equity Fund
Statement of
Operations
For November 1, 2005 through October 31, 2006. All numbers x 1,000.
Investment Income |
| Dividends | | | | $ | 10,789 | |
| Interest | | | | | 434 | |
| Securities on loan | | | | + | 15 | |
Total Investment Income | | | | | 11,238 | |
| |
Net Realized Gains and Losses |
| Net realized gains on investments | | | | | 24,962 | |
| Net realized gains on futures contracts | | | | + | 224 | |
Net realized gains | | | | | 25,186 | |
| |
Net Unrealized Gains and Losses |
| Net unrealized gains on investments | | | | | 96,124 | |
| Net unrealized gains on futures contracts | | | | + | 182 | |
Net unrealized gains | | | | | 96,306 | |
| |
Expenses |
| Investment adviser and administrator fees | | | | | 4,232 | |
| Transfer agent and shareholder service fees | | | | | 2,032 | |
| Registration fees | | | | | 144 | |
| Shareholder reports | | | | | 57 | |
| Portfolio accounting fees | | | | | 47 | |
| Professional fees | | | | | 33 | |
| Custodian fees | | | | | 26 | |
| Trustees’ fees | | | | | 11 | |
| Overdraft expense | | | | | 1 | |
| Other expenses | | | | + | 15 | |
| Total expenses | | | | | 6,598 | |
| Custody Credits | | | | | –13 | |
| Expense reduction by adviser and Schwab | | | | | –492 | |
Net expenses | | | | | 6,093 | |
| |
Increase in Net Assets from Operations |
Total investment income | | | | | 11,238 | |
Net expenses | | | | | –6,093 | |
Net investment income | | | | | 5,145 | |
Net realized gains | | | | | 25,186 | |
Net unrealized gains | | | | + | 96,306 | |
Increase in net assets from operations | | | | $ | 126,637 | |
38 See financial notes.
Schwab Core Equity Fund
Statement of
Changes in Net Assets
For the current and prior report periods. All numbers x 1,000.
| | | | 11/1/05–10/31/06 | | 11/1/04–10/31/05 |
|---|
| Net investment income | | | | $ | 5,145 | | | $ | 3,489 | |
| Net realized gains | | | | | 25,186 | | | | 14,710 | |
| Net unrealized gains | | | | + | 96,306 | | | | 28,266 | |
Increase in net assets from operations | | | | | 126,637 | | | | 46,465 | |
| |
Distributions Paid |
Dividends from net investment income | | | | $ | 3,509 | | | $ | 3,112 | |
Transactions in Fund Shares | | | | | | | | | | | | | | | | | | |
| | | | 11/1/05–10/31/06 | | 11/1/04–10/31/05 | |
|---|
| | | | SHARES | | VALUE | | SHARES | | VALUE |
|---|
| Shares Sold | | | | | 34,999 | | | $ | 599,052 | | | | 19,737 | | | $ | 304,359 | |
| Shares Reinvested | | | | | 182 | | | | 3,034 | | | | 184 | | | | 2,745 | |
| Shares Redeemed | | | | + | (8,614 | ) | | | (146,741 | ) | | | (4,354 | ) | | | (66,406 | ) |
Net transactions in fund shares | | | | | 26,567 | | | $ | 455,345 | | | | 15,567 | | | $ | 240,698 | |
| |
Shares Outstanding and Net Assets |
| | | | 11/1/05–10/31/06 | | 11/1/04–10/31/05 | |
|---|
| | | | SHARES | | NET ASSETS | | SHARES | | NET ASSETS |
|---|
| Beginning of period | | | | | 34,590 | | | $ | 546,834 | | | | 19,023 | | | $ | 262,783 | |
| Total increase | | | | + | 26,567 | | | | 578,473 | | | | 15,567 | | | | 284,051 | |
End of period | | | | | 61,157 | | | $ | 1,125,307 | | | | 34,590 | | | $ | 546,834 | |
Net investment income not yet distributed | | | | | | | | $ | 3,880 | | | | | | | $ | 2,244 | |
See financial notes. 39
Schwab Dividend Equity Fund™
Financial Statements
Financial Highlights
Investor Shares
| | | | 11/1/05—
10/31/06 | | 11/1/04—
10/31/05 | | 11/1/03—
10/31/04 | | 9/2/031—
10/31/03 | |
|---|
Per-Share Data ($) |
| Net asset value at beginning of period | | | | | 12.80 | | | | 12.06 | | | | 10.60 | | | | 10.00 | | | | | |
Income from investment operations:
| | | | | | | | | | | | | | | | | | | | | | |
| Net investment income | | | | | 0.24 | | | | 0.26 | | | | 0.29 | | | | 0.05 | | | | | |
| Net realized and unrealized gains | | | | | 1.97 | | | | 0.93 | | | | 1.49 | | | | 0.55 | | | | | |
| Total income from investment operations | | | | | 2.21 | | | | 1.19 | | | | 1.78 | | | | 0.60 | | | | | |
Less distributions:
| | | | | | | | | | | | | | | | | | | | | | |
| Dividends from net investment income | | | | | (0.24 | ) | | | (0.26 | ) | | | (0.32 | ) | | | — | | | | | |
| Distributions from net realized gains | | | | | (0.16 | ) | | | (0.19 | ) | | | — | | | | — | | | | | |
| Total distributions | | | | | (0.40 | ) | | | (0.45 | ) | | | (0.32 | ) | | | — | | | | | |
| Net asset value at end of period | | | | | 14.61 | | | | 12.80 | | | | 12.06 | | | | 10.60 | | | | | |
| Total return (%) | | | | | 17.63 | | | | 9.98 | | | | 17.00 | | | | 6.00 | 2 | | | | |
| |
Ratios/Supplemental Data (%) |
Ratios to average net assets:
| | | | | | | | | | | | | | | | | | | | | | |
| Net operating expenses | | | | | 1.05 | | | | 1.07 | | | | 0.65 | | | | — | | | | | |
| Gross operating expenses | | | | | 1.05 | | | | 1.09 | | | | 1.19 | | | | 1.34 | 3 | | | | |
| Net investment income | | | | | 1.78 | | | | 2.17 | | | �� | 2.71 | | | | 3.41 | 3 | | | | |
| Portfolio turnover rate | | | | | 36 | | | | 26 | | | | 39 | | | | 2 | 2 | | | | |
| Net assets, end of period ($ x 1,000,000) | | | | | 624 | | | | 528 | | | | 267 | | | | 94 | | | | | |
| | | | | | | | | | | | |
|---|
Select Shares
| | | | 11/1/05—
10/31/06 | | 11/1/04—
10/31/05 | | 11/1/03—
10/31/04 | | 9/2/031—
10/31/03 | |
|---|
Per-Share Data ($) |
| Net asset value at beginning of period | | | | | 12.80 | | | | 12.06 | | | | 10.60 | | | | 10.00 | | | | | |
Income from investment operations:
| | | | | | | | | | | | | | | | | | | | | | |
| Net investment income | | | | | 0.26 | | | | 0.28 | | | | 0.31 | | | | 0.05 | | | | | |
| Net realized and unrealized gains | | | | | 1.98 | | | | 0.93 | | | | 1.48 | | | | 0.55 | | | | | |
| Total income from investment operations | | | | | 2.24 | | | | 1.21 | | | | 1.79 | | | | 0.60 | | | | | |
Less distributions:
| | | | | | | | | | | | | | | | | | | | | | |
| Dividends from net investment income | | | | | (0.28 | ) | | | (0.28 | ) | | | (0.33 | ) | | | — | | | | | |
| Distributions from net realized gains | | | | | (0.16 | ) | | | (0.19 | ) | | | — | | | | — | | | | | |
| Total distributions | | | | | (0.44 | ) | | | (0.47 | ) | | | (0.33 | ) | | | — | | | | | |
| Net asset value at end of period | | | | | 14.60 | | | | 12.80 | | | | 12.06 | | | | 10.60 | | | | | |
| Total return (%) | | | | | 17.86 | | | | 10.17 | | | | 17.07 | | | | 6.00 | 2 | | | | |
| |
Ratios/Supplemental Data (%) |
Ratios to average net assets:
| | | | | | | | | | | | | | | | | | | | | | |
| Net operating expenses | | | | | 0.90 | | | | 0.92 | | | | 0.54 | | | | — | | | | | |
| Gross operating expenses | | | | | 0.90 | | | | 0.94 | | | | 1.04 | | | | 1.19 | 3 | | | | |
| Net investment income | | | | | 1.92 | | | | 2.32 | | | | 2.83 | | | | 3.41 | 3 | | | | |
| Portfolio turnover rate | | | | | 36 | | | | 26 | | | | 39 | | | | 2 | 2 | | | | |
| Net assets, end of period ($ x 1,000,000) | | | | | 729 | | | | 509 | | | | 252 | | | | 111 | | | | | |
1 | | Commencement of operations. |
40 See financial notes.
Schwab Dividend Equity Fund™
Portfolio Holdings as of October 31, 2006
This section shows all the securities in the fund’s portfolio and their value as of the report date.
The fund files its complete schedule of portfolio holdings with the SEC for the first and third quarters of each fiscal year on Form N-Q. The fund’s Form N-Q is available on the SEC’s website at http://www.sec.gov and may be viewed and copied at the SEC’s Public Reference Room in Washington, D.C. Call 1-800-SEC-0330 for information on the operation of the Public Reference Room. The schedule of portfolio holdings filed on a fund’s most recent Form N-Q is also available by visiting Schwab’s website at www.schwab.com/schwabfunds.
Holdings by Category
|
| Cost
($ x 1,000)
|
| Value
($ x 1,000)
|
|
|---|
97.8% | | | | Common Stock | | | 1,116,547 | | | | 1,322,353 | |
2.4% | | | | Short-Term Investment | | | 32,670 | | | | 32,670 | |
—% | | | | U.S. Treasury Obligation | | | 537 | | | | 537 | |
100.2% | | | | Total Investments | | | 1,149,754 | | | | 1,355,560 | |
(0.2)% | | | | Other Assets and Liabilities, Net | | | | | | | (2,845 | ) |
100.0% | | | | Total Net Assets | | | | | | | 1,352,715 | |
Security
| | | | Number
of Shares | | Value
($ x 1,000) |
|---|
Common Stock 97.8% of net assets |
Automobiles & Components 0.2% |
| Ford Motor Co. | | | | | 300,000 | | | | 2,484 | |
Banks 10.0% |
| AmSouth Bancorp | | | | | 165,000 | | | | 4,986 | |
| Comerica, Inc. | | | | | 266,700 | | | | 15,519 | |
| First Horizon National Corp. | | | | | 85,000 | | | | 3,342 | |
| Huntington Bancshares, Inc. | | | | | 259,000 | | | | 6,322 | |
| KeyCorp | | | | | 392,500 | | | | 14,578 | |
| National City Corp. | | | | | 354,800 | | | | 13,216 | |
PNC Financial Services Group, Inc. (a) | | | | | 233,400 | | | | 16,345 | |
| Regions Financial Corp. | | | | | 400,000 | | | | 15,180 | |
| SunTrust Banks, Inc. | | | | | 150,887 | | | | 11,919 | |
U.S. Bancorp (a) | | | | | 449,300 | | | | 15,204 | |
| Wachovia Corp. | | | | | 255,700 | | | | 14,192 | |
| Washington Mutual, Inc. | | | | | 107,500 | | | | 4,547 | |
| | | | | | | | | | 135,350 | |
Capital Goods 8.5% |
| Cooper Industries Ltd., Class A | | | | | 85,000 | | | | 7,603 | |
| Eaton Corp. | | | | | 30,000 | | | | 2,173 | |
| Emerson Electric Co. | | | | | 194,300 | | | | 16,399 | |
| Harsco Corp. | | | | | 87,200 | | | | 7,118 | |
| Lockheed Martin Corp. | | | | | 324,000 | | | | 28,165 | |
| Northrop Grumman Corp. | | | | | 215,400 | | | | 14,301 | |
| Raytheon Co. | | | | | 487,100 | | | | 24,331 | |
The Boeing Co. (a) | | | | | 190,000 | | | | 15,173 | |
| | | | | | | | | | 115,263 | |
Commercial Services & Supplies 2.4% |
| Avery Dennison Corp. | | | | | 170,000 | | | | 10,734 | |
| Republic Services, Inc. | | | | | 135,000 | | | | 5,536 | |
| Waste Management, Inc. | | | | | 430,000 | | | | 16,117 | |
| | | | | | | | | | 32,387 | |
Consumer Durables & Apparel 3.2% |
| Hasbro, Inc. | | | | | 175,000 | | | | 4,536 | |
| Mattel, Inc. | | | | | 325,000 | | | | 7,355 | |
| Newell Rubbermaid, Inc. | | | | | 812,600 | | | | 23,386 | |
| VF Corp. | | | | | 100,000 | | | | 7,601 | |
| | | | | | | | | | 42,878 | |
Diversified Financials 7.8% |
| American Express Co. | | | | | 275,000 | | | | 15,898 | |
Bank of America Corp. (a) | | | | | 340,400 | | | | 18,337 | |
| Citigroup, Inc. | | | | | 360,000 | | | | 18,058 | |
JPMorgan Chase & Co. (a) | | | | | 430,584 | | | | 20,427 | |
| Mellon Financial Corp. | | | | | 453,900 | | | | 17,611 | |
| The Bank of New York Co., Inc. | | | | | 425,000 | | | | 14,607 | |
| | | | | | | | | | 104,938 | |
Energy 4.6% |
| ChevronTexaco Corp. | | | | | 100,000 | | | | 6,720 | |
| Exxon Mobil Corp. | | | | | 320,800 | | | | 22,912 | |
| Marathon Oil Corp. | | | | | 176,400 | | | | 15,241 | |
| Occidental Petroleum Corp. | | | | | 60,000 | | | | 2,816 | |
| Schlumberger Ltd. | | | | | 78,400 | | | | 4,945 | |
| Sunoco, Inc. | | | | | 150,000 | | | | 9,920 | |
| | | | | | | | | | 62,554 | |
Food & Staples Retailing 0.5% |
| The Kroger Co. | | | | | 300,000 | | | | 6,747 | |
Food, Beverage & Tobacco 9.2% |
| Altria Group, Inc. | | | | | 160,000 | | | | 13,013 | |
| Anheuser-Busch Cos., Inc. | | | | | 225,000 | | | | 10,669 | |
| ConAgra Foods, Inc. | | | | | 120,000 | | | | 3,138 | |
| General Mills, Inc. | | | | | 245,000 | | | | 13,921 | |
Kellogg Co. (a) | | | | | 290,000 | | | | 14,590 | |
| Loews Corp. — Carolina Group | | | | | 180,000 | | | | 10,408 | |
| PepsiCo, Inc. | | | | | 100,000 | | | | 6,344 | |
Reynolds American, Inc. (a) | | | | | 426,400 | | | | 26,931 | |
| The Coca-Cola Co. | | | | | 311,000 | | | | 14,530 | |
UST, Inc. (a) | | | | | 200,500 | | | | 10,739 | |
| | | | | | | | | | 124,283 | |
Health Care Equipment & Services 3.0% |
| AmerisourceBergen Corp. | | | | | 75,000 | | | | 3,540 | |
| Baxter International, Inc. | | | | | 255,000 | | | | 11,722 | |
| Becton Dickinson & Co. | | | | | 179,000 | | | | 12,536 | |
| Dentsply International, Inc. | | | | | 145,000 | | | | 4,536 | |
| McKesson Corp. | | | | | 170,000 | | | | 8,515 | |
| | | | | | | | | | 40,849 | |
See financial notes. 41
Schwab Dividend Equity Fund™
Portfolio Holdings continued
Security
| | | | Number
of Shares | | Value
($ x 1,000) |
|---|
Household & Personal Products 1.5% |
| Colgate-Palmolive Co. | | | | | 150,000 | | | | 9,595 | |
| Procter & Gamble Co. | | | | | 168,950 | | | | 10,710 | |
| | | | | | | | | | 20,305 | |
Insurance 8.7% |
AON Corp. (a) | | | | | 496,250 | | | | 17,265 | |
| Fidelity National Financial, Inc. | | | | | 155,000 | | | | 3,457 | |
| Fidelity National Title Group, Inc., Class A | | | | | 162,398 | | | | 3,574 | |
| First American Corp. | | | | | 82,500 | | | | 3,368 | |
| HCC Insurance Holdings, Inc. | | | | | 150,000 | | | | 5,049 | |
| Lincoln National Corp. | | | | | 300,000 | | | | 18,993 | |
| Principal Financial Group, Inc. | | | | | 140,000 | | | | 7,909 | |
| SAFECO Corp. | | | | | 201,400 | | | | 11,719 | |
| The Allstate Corp. | | | | | 218,200 | | | | 13,389 | |
| The Chubb Corp. | | | | | 276,000 | | | | 14,669 | |
The St. Paul Travelers Cos., Inc. (a) | | | | | 308,000 | | | | 15,748 | |
| W. R. Berkley Corp. | | | | | 82,500 | | | | 3,041 | |
| | | | | | | | | | 118,181 | |
Materials 6.7% |
| Freeport-McMoRan Copper & Gold, Inc., Class B | | | | | 194,000 | | | | 11,733 | |
| International Paper Co. | | | | | 375,000 | | | | 12,506 | |
| MeadWestvaco Corp. | | | | | 254,000 | | | | 6,990 | |
| Nucor Corp. | | | | | 100,000 | | | | 5,841 | |
| PPG Industries, Inc. | | | | | 145,500 | | | | 9,952 | |
| Rohm & Haas Co. | | | | | 259,000 | | | | 13,421 | |
| Sonoco Products Co. | | | | | 280,000 | | | | 9,935 | |
| Temple-Inland, Inc. | | | | | 338,300 | | | | 13,343 | |
| The Lubrizol Corp. | | | | | 150,000 | | | | 6,750 | |
| | | | | | | | | | 90,471 | |
Media 2.4% |
| CBS Corp., Class B | | | | | 425,000 | | | | 12,299 | |
| Regal Entertainment Group, Class A | | | | | 150,000 | | | | 3,110 | |
| The McGraw-Hill Cos., Inc. | | | | | 200,000 | | | | 12,834 | |
| Warner Music Group Corp. | | | | | 150,000 | | | | 3,889 | |
| | | | | | | | | | 32,132 | |
Pharmaceuticals & Biotechnology 5.9% |
| Abbott Laboratories | | | | | 180,000 | | | | 8,552 | |
| Bristol-Myers Squibb Co. | | | | | 400,000 | | | | 9,900 | |
| Johnson & Johnson | | | | | 237,000 | | | | 15,974 | |
| Merck & Co., Inc. | | | | | 380,000 | | | | 17,259 | |
| PerkinElmer, Inc. | | | | | 270,500 | | | | 5,778 | |
| Pfizer, Inc. | | | | | 573,000 | | | | 15,270 | |
| Schering-Plough Corp. | | | | | 85,000 | | | | 1,882 | |
| Wyeth | | | | | 95,000 | | | | 4,848 | |
| | | | | | | | | | 79,463 | |
Retailing 0.4% |
| Genuine Parts Co. | | | | | 121,000 | | | | 5,508 | |
Semiconductors & Semiconductor Equipment 0.9% |
| Applied Materials, Inc. | | | | | 465,000 | | | | 8,086 | |
| Microchip Technology, Inc. | | | | | 135,000 | | | | 4,446 | |
| | | | | | | | | | 12,532 | |
Software & Services 2.2% |
| Electronic Data Systems Corp. | | | | | 558,000 | | | | 14,134 | |
| Global Payments, Inc. | | | | | 25,000 | | | | 1,093 | |
| Microsoft Corp. | | | | | 500,000 | | | | 14,355 | |
| | | | | | | | | | 29,582 | |
Technology Hardware & Equipment 4.4% |
| Harris Corp. | | | | | 155,000 | | | | 6,603 | |
| Hewlett-Packard Co. | | | | | 490,000 | | | | 18,983 | |
| International Business Machines Corp. | | | | | 180,000 | | | | 16,619 | |
| Molex, Inc. | | | | | 100,000 | | | | 3,490 | |
| Motorola, Inc. | | | | | 615,000 | | | | 14,182 | |
| | | | | | | | | | 59,877 | |
Telecommunication Services 6.3% |
ALLTEL Corp. (a) | | | | | 184,800 | | | | 9,852 | |
| AT&T Corp. | | | | | 655,037 | | | | 22,435 | |
| BellSouth Corp. | | | | | 451,600 | | | | 20,367 | |
| Citizens Communications Co. | | | | | 980,000 | | | | 14,367 | |
| Verizon Communications, Inc. | | | | | 402,300 | | | | 14,885 | |
| Windstream Corp. | | | | | 191,069 | | | | 2,621 | |
| | | | | | | | | | 84,527 | |
Transportation 0.5% |
| FedEx Corp. | | | | | 60,000 | | | | 6,872 | |
Utilities 8.5% |
| Alliant Energy Corp. | | | | | 305,000 | | | | 11,697 | |
| American Electric Power Co., Inc. | | | | | 401,000 | | | | 16,614 | |
| Edison International | | | | | 391,000 | | | | 17,376 | |
| Exelon Corp. | | | | | 171,400 | | | | 10,623 | |
| FirstEnergy Corp. | | | | | 284,100 | | | | 16,719 | |
| Pepco Holdings, Inc. | | | | | 280,000 | | | | 7,118 | |
| PG&E Corp. | | | | | 360,000 | | | | 15,530 | |
| TECO Energy, Inc. | | | | | 225,000 | | | | 3,710 | |
| TXU Corp. | | | | | 250,000 | | | | 15,783 | |
| | | | | | | | | | 115,170 | |
42 See financial notes.
Schwab Dividend Equity Fund™
Portfolio Holdings continued
Security
Rate, Maturity Date
| | | | Face
Amount
($ x 1,000) | | Value
($ x 1,000) |
|---|
Short-Term Investment 2.4% of net assets |
| |
JP Morgan, Grand Cayman Time Deposit
4.71%, 11/01/06 | | | | | 32,670 | | | | 32,670 | |
U.S. Treasury Obligation 0.0% of net assets |
| |
U.S. Treasury Bill
5.00%, 12/14/06 | | | | | 540 | | | | 537 | |
At 10-31-06 the tax basis cost of the fund’s investments was $1,150,626, and the unrealized appreciation and depreciation were $214,769 and ($9,835), respectively, with a net unrealized appreciation of $204,934.
In addition to the above, the fund held the following at 10-31-06. All numbers are x1,000 except number of futures contracts.
Security
Rate, Maturity Date
| | | | Number of
Contracts | | Contract
Value | Unrealized
Gains | |
|---|
|
| |
| S&P 500 Index, e-mini, Long, expires 12/15/06 | | | | | 160 | | | | 11,066 | | 249 | |
(a) | | All or a portion of this security is held as collateral for open futures contracts. |
See financial notes. 43
Schwab Dividend Equity Fund
Statement of
Assets and Liabilities
As of October 31, 2006. All numbers x 1,000 except NAV.
Assets |
| Investments, at value (cost $1,149,754) | | | | $ | 1,355,560 | |
Receivables:
| | | | | | |
| Investments sold | | | | | 6,335 | |
| Fund shares sold | | | | | 6,616 | |
| Interest | | | | | 4 | |
| Dividends | | | | | 1,969 | |
| Prepaid expenses | | | | + | 8 | |
Total assets | | | | | 1,370,492 | |
| |
Liabilities |
| Payables: | | | | | | |
| Investments bought | | | | | 16,845 | |
| Investment adviser and administrator fees | | | | | 87 | |
| Transfer agent and shareholder services fees | | | | | 19 | |
| Fund shares redeemed | | | | | 792 | |
| Trustee fees | | | | | 2 | |
| Accrued expenses | | | | + | 32 | |
Total liabilities | | | | | 17,777 | |
| |
Net Assets |
Total assets | | | | | 1,370,492 | |
Total liabilities | | | | | –17,777 | |
Net assets | | | | $ | 1,352,715 | |
| |
Net Assets by Source | | | | | | |
| Capital received from investors | | | | | 1,116,361 | |
| Net investment income not yet distributed | | | | | 1,243 | |
| Net realized capital gains | | | | | 29,056 | |
| Net unrealized capital gains | | | | | 206,055 | |
| |
Net Asset Value (NAV) by Shares Class | | | | | | |
Share Class
| | | | Net Assets | | ÷ | | Shares
Outstanding | | = | | NAV |
|---|
| Investor Shares | | | | $ | 624,057 | | | | | | | | 42,705 | | | | | | | $ | 14.61 | |
| Select Shares | | | | $ | 728,658 | | | | | | | | 49,917 | | | | | | | $ | 14.60 | |
44 See financial notes.
Schwab Dividend Equity Fund
Statement of
Operations
For November 1, 2005 through October 31, 2006. All numbers x 1,000.
Investment Income |
| Dividends | | | | $ | 31,163 | |
| Interest | | | | | 358 | |
| Securities on loan | | | | + | 1 | |
Total Investment Income | | | | | 31,522 | |
| |
Net Realized Gains and Losses |
| Net realized gains on investments | | | | | 28,776 | |
| Net realized gains on futures contracts | | | | + | 222 | |
Net realized gains | | | | | 28,998 | |
| |
Net Unrealized Gains and Losses |
| Net unrealized gains on investments | | | | | 134,621 | |
| Net unrealized gains on futures contracts | | | | + | 307 | |
Net unrealized gains | | | | | 134,928 | |
| |
Expenses |
| Investment adviser and administrator fees | | | | | 8,596 | |
Transfer agent and shareholder service fees:
| | | | | | |
| Investor Shares | | | | | 1,384 | |
| Select Shares | | | | | 561 | |
| Registration fees | | | | | 95 | |
| Portfolio accounting fees | | | | | 67 | |
| Shareholder reports | | | | | 63 | |
| Custodian fees | | | | | 40 | |
| Professional fees | | | | | 36 | |
| Trustees’ fees | | | | | 13 | |
| Overdraft expense | | | | | 3 | |
| Other expenses | | | | + | 22 | |
Total expenses | | | | | 10,880 | |
| |
Increase in Net Assets from Operations |
Total investment income | | | | | 31,522 | |
Net expenses | | | | | –10,880 | |
Net investment income | | | | | 20,642 | |
Net realized gains | | | | | 28,998 | |
Net unrealized gains | | | | + | 134,928 | |
Increase in net assets from operations | | | | $ | 184,568 | |
See financial notes. 45
Schwab Dividend Equity Fund
Statement of
Changes in Net Assets
For the current and prior report periods. All numbers x 1,000.
| | | | 11/1/05–10/31/06 | | 11/1/04–10/31/05 |
|---|
| Net investment income | | | | $ | 20,642 | | | $ | 18,557 | |
| Net realized gains | | | | | 28,998 | | | | 13,364 | |
| Net unrealized gains | | | | + | 134,928 | | | | 29,600 | |
Increase in net assets from operations | | | | | 184,568 | | | | 61,521 | |
| |
Distributions Paid |
Dividends from net investment income | | | | | | | | | | |
| Investor Shares | | | | | 9,859 | | | | 8,840 | |
| Select Shares | | | | + | 11,451 | | | | 8,874 | |
Total dividends from net investment income | | | | | 21,310 | | | | 17,714 | |
| |
Distributions from net realized gains | | | | | | | | | | |
| Investor Shares | | | | | 6,743 | | | | 4,838 | |
| Select Shares | | | | + | 6,563 | | | | 4,386 | |
Total distributions from net realized gains | | | | | 13,306 | | | | 9,224 | |
| | | | | | | | | | | |
Total distributions | | | | $ | 34,616 | | | $ | 26,938 | |
Transactions in Fund Shares | | | | | | | | | | | | | | | | | | |
| | | | 11/1/05–10/31/06 | | 11/1/04–10/31/05 | |
|---|
| | | | SHARES | | VALUE | | SHARES | | VALUE |
|---|
Shares Sold | | | | | | | | | | | | | | | | | | |
| Investor Shares | | | | | 14,325 | | | $ | 196,579 | | | | 27,892 | | | $ | 355,147 | |
| Select Shares | | | | + | 19,222 | | | | 265,952 | | | | 24,348 | | | | 310,884 | |
Total shares sold | | | | | 33,547 | | | $ | 462,531 | | | | 52,240 | | | $ | 666,031 | |
| | | | | | | | | | | | | | | | | | | |
Shares Reinvested | | | | | | | | | | | | | | | | | | |
| Investor Shares | | | | | 1,006 | | | $ | 13,421 | | | | 854 | | | $ | 10,806 | |
| Select Shares | | | | + | 972 | | | | 12,969 | | | | 731 | | | | 9,263 | |
Total shares reinvested | | | | | 1,978 | | | $ | 26,390 | | | | 1,585 | | | $ | 20,069 | |
| | | | | | | | | | | | | | | | | | | |
Shares Redeemed | | | | | | | | | | | | | | | | | | |
| Investor Shares | | | | | (13,861 | ) | | $ | (187,504 | ) | | | (9,697 | ) | | $ | (124,160 | ) |
| Select Shares | | | | + | (10,090 | ) | | | (135,743 | ) | | | (6,148 | ) | | | (78,680 | ) |
Total shares redeemed | | | | | (23,951 | ) | | $ | (323,247 | ) | | | (15,845 | ) | | $ | (202,840 | ) |
| | | | | | | | | | | | | | | | | | | |
Net transactions in fund shares | | | | | 11,574 | | | $ | 165,674 | | | | 37,980 | | | $ | 483,260 | |
| |
Shares Outstanding and Net Assets |
| | | | 11/1/05–10/31/06 | | 11/1/04–10/31/05 | |
|---|
| | | | SHARES | | NET ASSETS | | SHARES | | NET ASSETS |
|---|
| Beginning of period | | | | | 81,048 | | | $ | 1,037,089 | | | | 43,068 | | | $ | 519,246 | |
| Total increase | | | | + | 11,574 | | | | 315,626 | | | | 37,980 | | | | 517,843 | |
End of period | | | | | 92,622 | | | $ | 1,352,715 | | | | 81,048 | | | $ | 1,037,089 | |
Net investment income not yet distributed | | | | | | | | $ | 1,243 | | | | | | | $ | 1,911 | |
46 See financial notes.
Schwab Large-Cap Growth Fund™
Financial Statements
Financial Highlights
Investor Shares
| | | | 11/1/05—
10/31/06 | | 10/3/051—
10/31/05 | |
|---|
Per-Share Data ($) |
| Net asset value at beginning of period | | | | | 9.73 | | | | 10.00 | | | | | | | | | | | | | |
Income or loss from investment operations:
| | | | | | | | | | | | | | | | | | | | | | |
| Net investment income or loss | | | | | 0.01 | | | | (0.00 | )2 | | | | | | | | | | | | |
| Net realized and unrealized gains or losses | | | | | 1.33 | | | | (0.27 | ) | | | | | | | | | | | | |
| Total income or loss from investment operations | | | | | 1.34 | | | | (0.27 | ) | | | | | | | | | | | | |
Less distributions:
| | | | | | | | | | | | | | | | | | | | | | |
| Dividends from net investment income | | | | | (0.00 | )2 | | | — | | | | | | | | | | | | | |
| Net asset value at end of period | | | | | 11.07 | | | | 9.73 | | | | | | | | | | | | | |
| Total return (%) | | | | | 13.80 | | | | (2.70 | )3 | | | | | | | | | | | | |
| |
Ratios/Supplemental Data (%) |
Ratios to average net assets:
| | | | | | | | | | | | | | | | | | | | | | |
| Net operating expenses | | | | | 1.20 | | | | 1.20 | 4 | | | | | | | | | | | | |
| Gross operating expenses | | | | | 1.26 | | | | 1.71 | 4 | | | | | | | | | | | | |
| Net investment income or loss | | | | | 0.09 | | | | (0.61 | )4 | | | | | | | | | | | | |
| Portfolio turnover rate | | | | | 53 | | | | 4 | 3 | | | | | | | | | | | | |
| Net assets, end of period ($ x 1,000,000) | | | | | 70 | | | | 25 | | | | | | | | | | | | | |
Select Shares
| | | | 11/1/05—
10/31/06 | | 10/3/051—
10/31/05 | |
|---|
Per-Share Data ($) |
| Net asset value at beginning of period | | | | | 9.73 | | | | 10.00 | | | | | | | | | | | | | |
Income or loss from investment operations:
| | | | | | | | | | | | | | | | | | | | | | |
| Net investment income or loss | | | | | 0.02 | | | | (0.00 | )2 | | | | | | | | | | | | |
| Net realized and unrealized gains or losses | | | | | 1.35 | | | | (0.27 | ) | | | | | | | | | | | | |
| Total income or loss from investment operations | | | | | 1.37 | | | | (0.27 | ) | | | | | | | | | | | | |
Less distributions:
| | | | | | | | | | | | | | | | | | | | | | |
| Dividends from net investment income | | | | | (0.01 | ) | | | — | | | | | | | | | | | | | |
| Net asset value at end of period | | | | | 11.09 | | | | 9.73 | | | | | | | | | | | | | |
| Total return (%) | | | | | 14.04 | | | | (2.70 | )3 | | | | | | | | | | | | |
| |
Ratios/Supplemental Data (%) |
Ratios to average net assets:
| | | | | | | | | | | | | | | | | | | | | | |
| Net operating expenses | | | | | 0.99 | | | | 0.99 | 4 | | | | | | | | | | | | |
| Gross operating expenses | | | | | 1.12 | | | | 1.56 | 4 | | | | | | | | | | | | |
| Net investment income or loss | | | | | 0.26 | | | | (0.40 | )4 | | | | | | | | | | | | |
| Portfolio turnover rate | | | | | 53 | | | | 4 | 3 | | | | | | | | | | | | |
| Net assets, end of period ($ x 1,000,000) | | | | | 107 | | | | 33 | | | | | | | | | | | | | |
1 | | Commencement of operations. |
2 | | Per share amount was less then $0.01. |
See financial notes. 47
Schwab Large-Cap Growth Fund
Portfolio Holdings as of October 31, 2006
This section shows all the securities in the fund’s portfolio and their value as of the report date.
The fund files its complete schedule of portfolio holdings with the SEC for the first and third quarters of each fiscal year on Form N-Q. The fund’s Form N-Q is available on the SEC’s website at http://www.sec.gov and may be viewed and copied at the SEC’s Public Reference Room in Washington, D.C. Call 1-800-SEC-0330 for information on the operation of the Public Reference Room. The schedule of portfolio holdings filed on a fund’s most recent Form N-Q is also available by visiting Schwab’s website at www.schwab.com/schwabfunds.
Holdings by Category
|
| Cost
($ x 1,000)
|
| Value
($ x 1,000)
|
|---|
97.4% | | | | Common Stock | | | 157,393 | | | | 172,230 | |
5.2% | | | | Short-Term Investment | | | 9,266 | | | | 9,266 | |
0.1% | | | | U.S. Treasury Obligations | | | 124 | | | | 124 | |
102.7% | | | | Total Investments | | | 166,783 | | | | 181,620 | |
2.5% | | | | Collateral Invested for Securities on Loan | | | 4,371 | | | | 4,371 | |
(5.2)% | | | | Other Assets and Liabilities, Net | | | | | | | (9,127 | ) |
100.0% | | | | Total Net Assets | | | | | | | 176,864 | |
Security
| | | | Number
of Shares | | Value
($ x 1,000) |
|---|
Common Stock 97.4% of net assets |
Banks 1.1% |
| Comerica, Inc. | | | | | 3,700 | | | | 215 | |
| Radian Group, Inc. | | | | | 15,500 | | | | 826 | |
| U.S. Bancorp | | | | | 25,600 | | | | 867 | |
| | | | | | | | | | 1,908 | |
Capital Goods 11.4% |
| Cooper Industries Ltd., Class A | | | | | 1,800 | | | | 161 | |
| Emerson Electric Co. | | | | | 7,300 | | | | 616 | |
| General Dynamics Corp. | | | | | 41,400 | | | | 2,943 | |
| ITT Corp. | | | | | 29,500 | | | | 1,604 | |
| Lockheed Martin Corp. | | | | | 60,700 | | | | 5,277 | |
| Precision Castparts Corp. | | | | | 14,000 | | | | 953 | |
| Raytheon Co. | | | | | 7,500 | | | | 375 | |
| The Boeing Co. | | | | | 99,800 | | | | 7,970 | |
| Thomas & Betts Corp. * | | | | | 4,300 | | | | 222 | |
| | | | | | | | | | 20,121 | |
Commercial Services & Supplies 0.5% |
| Equifax, Inc. | | | | | 21,500 | | | | 818 | |
Consumer Durables & Apparel 1.7% |
| Hasbro, Inc. | | | | | 29,000 | | | | 752 | |
| Newell Rubbermaid, Inc. | | | | | 79,300 | | | | 2,282 | |
| | | | | | | | | | 3,034 | |
Consumer Services 0.8% |
International Game Technology (a) | | | | | 31,500 | | | | 1,339 | |
Diversified Financials 7.9% |
| American Express Co. | | | | | 45,000 | | | | 2,601 | |
| Franklin Resources, Inc. | | | | | 74,500 | | | | 8,490 | |
| Mellon Financial Corp. | | | | | 15,000 | | | | 582 | |
| Moody’s Corp. | | | | | 22,500 | | | | 1,492 | |
| Northern Trust Corp. | | | | | 15,000 | | | | 881 | |
| | | | | | | | | | 14,046 | |
Energy 1.8% |
| Exxon Mobil Corp. | | | | | 45,300 | | | | 3,235 | |
Food, Beverage & Tobacco 3.8% |
| Anheuser-Busch Cos., Inc. | | | | | 4,100 | | | | 194 | |
| ConAgra Foods, Inc. | | | | | 29,500 | | | | 771 | |
| General Mills, Inc. | | | | | 22,100 | | | | 1,256 | |
| Loews Corp. — Carolina Group | | | | | 49,500 | | | | 2,862 | |
| The Coca-Cola Co. | | | | | 35,800 | | | | 1,673 | |
| | | | | | | | | | 6,756 | |
Health Care Equipment & Services 11.5% |
| Aetna, Inc. | | | | | 19,900 | | | | 820 | |
| AmerisourceBergen Corp. | | | | | 45,300 | | | | 2,138 | |
| Baxter International, Inc. | | | | | 114,200 | | | | 5,250 | |
| Becton Dickinson & Co. | | | | | 60,800 | | | | 4,258 | |
| Express Scripts, Inc. * | | | | | 9,000 | | | | 573 | |
Humana, Inc. (a)* | | | | | 23,600 | | | | 1,416 | |
| IMS Health, Inc. | | | | | 52,800 | | | | 1,471 | |
| Laboratory Corp. of America Holdings * | | | | | 6,300 | | | | 432 | |
| McKesson Corp. | | | | | 56,700 | | | | 2,840 | |
| WellPoint, Inc. * | | | | | 15,700 | | | | 1,198 | |
| | | | | | | | | | 20,396 | |
Insurance 4.6% |
| AFLAC, Inc. | | | | | 18,500 | | | | 831 | |
| First American Corp. | | | | | 10,000 | | | | 408 | |
| Genworth Financial, Inc., Class A | | | | | 15,500 | | | | 518 | |
| HCC Insurance Holdings, Inc. | | | | | 20,200 | | | | 680 | |
| MetLife, Inc. | | | | | 37,500 | | | | 2,142 | |
| Principal Financial Group, Inc. | | | | | 23,500 | | | | 1,328 | |
| Protective Life Corp. | | | | | 8,000 | | | | 354 | |
| SAFECO Corp. | | | | | 2,000 | | | | 116 | |
| W. R. Berkley Corp. | | | | | 45,300 | | | | 1,670 | |
| | | | | | | | | | 8,047 | |
48 See financial notes.
Schwab Large-Cap Growth Fund
Portfolio Holdings continued
Security
| | | | Number
of Shares | | Value
($ x 1,000) |
|---|
Materials 4.6% |
| Freeport-McMoRan Copper & Gold, Inc., Class B | | | | | 71,400 | | | | 4,318 | |
| Nucor Corp. | | | | | 37,900 | | | | 2,214 | |
| Rohm & Haas Co. | | | | | 25,000 | | | | 1,296 | |
| Temple-Inland, Inc. | | | | | 4,500 | | | | 177 | |
| United States Steel Corp. | | | | | 3,000 | | | | 203 | |
| | | | �� | | | | | | 8,208 | |
Media 5.6% |
| Omnicom Group, Inc. | | | | | 15,000 | | | | 1,522 | |
The McGraw-Hill Cos., Inc. (b) | | | | | 129,500 | | | | 8,310 | |
| | | | | | | | | | 9,832 | |
Pharmaceuticals & Biotechnology 9.9% |
Applied Biosystems Group — Applera Corp. (b) | | | | | 115,500 | | | | 4,308 | |
| Biogen Idec, Inc. * | | | | | 36,900 | | | | 1,756 | |
| Gilead Sciences, Inc. * | | | | | 17,100 | | | | 1,178 | |
| Johnson & Johnson | | | | | 10,000 | | | | 674 | |
| King Pharmaceuticals, Inc. * | | | | | 35,600 | | | | 596 | |
| Merck & Co., Inc. | | | | | 78,000 | | | | 3,543 | |
| Pfizer, Inc. | | | | | 206,600 | | | | 5,506 | |
| | | | | | | | | | 17,561 | |
Retailing 3.8% |
| American Eagle Outfitters, Inc. | | | | | 57,000 | | | | 2,611 | |
| J.C. Penney Co., Inc. | | | | | 18,900 | | | | 1,422 | |
| Nordstrom, Inc. | | | | | 45,500 | | | | 2,154 | |
| Office Depot, Inc. * | | | | | 10,500 | | | | 441 | |
| | | | | | | | | | 6,628 | |
Semiconductors & Semiconductor Equipment 2.6% |
| Applied Materials, Inc. | | | | | 112,700 | | | | 1,960 | |
| MEMC Electronic Materials, Inc. * | | | | | 12,500 | | | | 444 | |
| Micron Technology, Inc. * | | | | | 9,300 | | | | 134 | |
| Texas Instruments, Inc. | | | | | 68,500 | | | | 2,067 | |
| | | | | | | | | | 4,605 | |
Software & Services 9.4% |
| Amdocs Ltd. * | | | | | 35,100 | | | | 1,360 | |
| Autodesk, Inc. * | | | | | 22,000 | | | | 809 | |
| BEA Systems, Inc. * | | | | | 25,500 | | | | 415 | |
BMC Software, Inc. (a)* | | | | | 146,500 | | | | 4,440 | |
| Cadence Design Systems, Inc. * | | | | | 41,000 | | | | 732 | |
| Electronic Data Systems Corp. | | | | | 29,000 | | | | 735 | |
| Global Payments, Inc. | | | | | 57,200 | | | | 2,500 | |
| Google, Inc., Class A * | | | | | 1,100 | | | | 524 | |
| Intuit, Inc. * | | | | | 115,000 | | | | 4,060 | |
| McAfee, Inc. * | | | | | 26,000 | | | | 752 | |
| Red Hat, Inc. * | | | | | 20,000 | | | | 328 | |
| | | | | | | | | | 16,655 | |
Technology Hardware & Equipment 12.9% |
| Avaya, Inc. * | | | | | 46,500 | | | | 596 | |
| Cisco Systems, Inc. * | | | | | 8,500 | | | | 205 | |
| Hewlett-Packard Co. | | | | | 217,800 | | | | 8,438 | |
| International Business Machines Corp. | | | | | 94,600 | | | | 8,734 | |
| Lexmark International, Inc., Class A * | | | | | 58,000 | | | | 3,688 | |
| Motorola, Inc. | | | | | 52,500 | | | | 1,211 | |
| | | | | | | | | | 22,872 | |
Telecommunication Services 1.6% |
| Citizens Communications Co. | | | | | 177,300 | | | | 2,599 | |
| Qwest Communications International, Inc. * | | | | | 15,900 | | | | 137 | |
| | | | | | | | | | 2,736 | |
Transportation 0.5% |
AMR Corp. (a)* | | | | | 31,000 | | | | 878 | |
Utilities 1.4% |
| Edison International | | | | | 5,500 | | | | 244 | |
| TXU Corp. | | | | | 36,600 | | | | 2,311 | |
| | | | | | | | | | 2,555 | |
Security
Rate, Maturity Date
| | | | Face
Amount
($ x 1,000) | | Value
($ x 1,000) |
|---|
Short-Term Investment 5.2% of net assets |
| |
Bank of America, London Time Deposit
4.71%, 11/01/06 | | | | | 3,390 | | | | 3,390 | |
BBH, Grand Cayman Time Deposit
4.71%, 11/01/06 | | | | | 2,486 | | | | 2,486 | |
Citibank, Nassau Time Deposit
4.71%, 11/01/06 | | | | | 3,390 | | | | 3,390 | |
| | | | | | | | | | 9,266 | |
U.S. Treasury Obligations 0.1% of net assets |
| |
| U.S. Treasury Bill | | | | | | | | | | |
| 4.94%, 12/14/06 | | | | | 69 | | | | 69 | |
| 5.01%, 12/14/06 | | | | | 55 | | | | 55 | |
| | | | | | | | | | 124 | |
See financial notes. 49
Schwab Large-Cap Growth Fund
Portfolio Holdings continued
Security
| | | | Number of
Shares | | Value
($ x 1,000) |
|---|
Collateral Invested for Securities on Loan 2.5% of net assets |
| |
Securities Lending
Investment Fund, a
series of the Brown
Brothers Investment
Trust | | | | | 4,371,465 | | | | 4,371 | |
End of collateral invested for securities on loan.At 10-31-06 the tax basis cost of the fund’s investments was $166,824, and the unrealized appreciation and depreciation were $16,580 and ($1,784), respectively, with a net unrealized appreciation of $14,796.
In addition to the above, the fund held the following at 10-31-06. All numbers are x1,000 except number of futures contracts.
| | | | Number of
Contracts | | Contract
Value | | Unrealized
Gains |
|---|
|
| |
S&P 500 Index, e-mini, Long,
expires 12/15/06 | | | | | 35 | | | | 2,421 | | | | 5 | |
| * | | Non-income producing security. |
(a) | | All or portion of security is on loan. |
(b) | | All or a portion of this security is held as collateral for futures contracts. |
50 See financial notes.
Schwab Large-Cap Growth Fund
Statement of
Assets and Liabilities
As of October 31, 2006. All numbers x 1,000 except NAV.
Assets |
| Investments, at value including securities on loan of $4,216 (cost $166,783) | | | | $ | 181,620 | |
| Collateral invested for securities on loan | | | | | 4,371 | |
Receivables:
| | | | | | |
| Investments sold | | | | | 1,832 | |
| Fund shares sold | | | | | 2,591 | |
| Dividends | | | | | 57 | |
| Due from brokers for futures | | | | | 13 | |
| Interest | | | | | 1 | |
| Prepaid expenses | | | | + | 1 | |
Total assets | | | | | 190,486 | |
| |
Liabilities |
| Collateral held for securities on loan | | | | | 4,371 | |
Payables:
| | | | | | |
| Investments bought | | | | | 8,988 | |
| Investment adviser and administrator fees | | | | | 11 | |
| Transfer agent and shareholder services fees | | | | | 2 | |
| Fund shares redeemed | | | | | 216 | |
| Accrued expenses | | | | + | 34 | |
Total liabilities | | | | | 13,622 | |
| |
Net Assets |
Total assets | | | | | 190,486 | |
Total liabilities | | | | | –13,622 | |
Net assets | | | | $ | 176,864 | |
| |
Net Assets by Source | | | | | | |
| Capital received from investors | | | | | 164,762 | |
| Net investment income not yet distributed | | | | | 138 | |
| Net realized capital losses | | | | | (2,878 | ) |
| Net unrealized capital gains | | | | | 14,842 | |
| |
Net Asset Value (NAV) by Shares Class |
Share Class
| | | | Net Assets | | ÷ | | Shares
Outstanding | | = | | NAV |
|---|
| Investor Shares | | | | $ | 69,981 | | | | | | | | 6,323 | | | | | | | $ | 11.07 | |
| Select Shares | | | | $ | 106,883 | | | | | | | | 9,639 | | | | | | | $ | 11.09 | |
See financial notes. 51
Schwab Large-Cap Growth Fund
Statement of
Operations
For November 1, 2005 through October 31, 2006. All numbers x 1,000.
Investment Income |
| Dividends | | | | $ | 1,136 | |
| Interest | | | | | 77 | |
| Securities on loan | | | | + | 1 | |
Total Investment Income | | | | | 1,214 | |
| |
Net Realized Gains and Losses |
| Net realized losses on investments | | | | | (2,707 | ) |
| |
Net Unrealized Gains and Losses |
| Net unrealized gains on investments | | | | | 16,025 | |
| Net unrealized gains on futures contracts | | | | + | 5 | |
Net unrealized gains | | | | | 16,030 | |
| |
Expenses |
| Investment adviser and administrator fees | | | | | 829 | |
Transfer agent and shareholder service fees:
| | | | | | |
| Investor Shares | | | | | 119 | |
| Select Shares | | | | | 47 | |
| Registration fees | | | | | 62 | |
| Professional fees | | | | | 34 | |
| Portfolio accounting fees | | | | | 24 | |
| Custodian fees | | | | | 8 | |
| Trustees’ fees | | | | | 5 | |
| Shareholder reports | | | | | 4 | |
| Other expenses | | | | + | 7 | |
| Total expenses | | | | | 1,139 | |
| Expense reduction by adviser and Schwab | | | | | –93 | |
Net expenses | | | | | 1,046 | |
| |
Increase in Net Assets from Operations |
Total investment income | | | | | 1,214 | |
Net expenses | | | | | –1,046 | |
Net investment income | | | | | 168 | |
Net realized losses | | | | | (2,707 | ) |
Net unrealized gains | | | | + | 16,030 | |
Increase in net assets from operations | | | | $ | 13,491 | |
52 See financial notes.
Schwab Large-Cap Growth Fund
Statement of
Changes in Net Assets
For the current and prior report periods. All numbers x 1,000.
| | | | 11/1/05—10/31/06 | | 10/3/05*—10/31/05 |
|---|
| Net investment income or loss | | | | $ | 168 | | | $ | (21 | ) |
| Net realized losses | | | | | (2,707 | ) | | | (171 | ) |
| Net unrealized gains or losses | | | | + | 16,030 | | | | (1,188 | ) |
Increase or decrease in net assets from operations | | | | | 13,491 | | | | (1,380 | ) |
| |
Distributions Paid
|
Dividends from net investment income | | | | | | | | | | |
| Investor Shares | | | | | 7 | | | | — | |
| Select Shares | | | | + | 23 | | | | — | |
Total dividends from net investment income | | | | $ | 30 | | | $ | — | |
Transactions in Fund Shares | | | | | | | | | | | | | | | | | | |
| | | | 11/1/05—10/31/06 | | 10/3/05*—10/31/05 | |
|---|
| | | | SHARES | | VALUE | | SHARES | | VALUE |
|---|
Shares Sold | | | | | | | | | | | | | | | | | | |
| Investor Shares | | | | | 5,260 | | | $ | 54,737 | | | | 2,636 | | | $ | 26,231 | |
| Select Shares | | | | + | 7,872 | | | | 83,122 | | | | 3,385 | | | | 33,718 | |
Total shares sold | | | | | 13,132 | | | $ | 137,859 | | | | 6,021 | | | $ | 59,949 | |
| | | | | | | | | | | | | | | | | | | |
Shares Reinvested | | | | | | | | | | | | | | | | | | |
| Investor Shares | | | | | 1 | | | $ | 7 | | | | — | | | $ | — | |
| Select Shares | | | | + | 2 | | | | 18 | | | | — | | | | — | |
Total shares reinvested | | | | | 3 | | | $ | 25 | | | | — | | | $ | — | |
| | | | | | | | | | | | | | | | | | | |
Shares Redeemed | | | | | | | | | | | | | | | | | | |
| Investor Shares | | | | | (1,554 | ) | | $ | (16,061 | ) | | | (20 | ) | | $ | (188 | ) |
| Select Shares | | | | + | (1,620 | ) | | | (16,801 | ) | | | — | | | | — | |
Total shares redeemed | | | | | (3,174 | ) | | $ | (32,862 | ) | | | (20 | ) | | $ | (188 | ) |
| | | | | | | | | | | | | | | | | | | |
Net transactions in fund shares | | | | | 9,961 | | | $ | 105,022 | | | | 6,001 | | | $ | 59,761 | |
| | | | | | | | | | | | | | | | | | | |
Shares Outstanding and Net Assets |
| | | | 11/1/05—10/31/06 | | 10/3/05*—10/31/05 | |
|---|
| | | | SHARES | | NET ASSETS | | SHARES | | NET ASSETS |
|---|
| Beginning of period | | | | | 6,001 | | | $ | 58,381 | | | | — | | | $ | — | |
| Total increase | | | | + | 9,961 | | | | 118,483 | | | | 6,001 | | | | 58,381 | |
End of period | | | | | 15,962 | | | $ | 176,864 | | | | 6,001 | | | $ | 58,381 | |
Net investment income not yet distributed | | | | | | | | $ | 138 | | | | | | | $ | — | |
* Commencement of operations.
See financial notes. 53
Schwab Small Cap Equity Fund™
Financial Statements
Financial Highlights
Investor Shares
| | | | 11/1/05—
10/31/06 | | 11/1/04—
10/31/05 | | 11/1/03—
10/31/04 | | 7/1/031—
10/31/03 | |
|---|
Per-Share Data ($) |
| Net asset value at beginning of period | | | | | 15.72 | | | | 14.13 | | | | 11.81 | | | | 10.00 | | | | | |
Income or loss from investment operations:
| | | | | | | | | | | | | | | | | | | | | | |
| Net investment income or loss | | | | | (0.05 | ) | | | 0.01 | | | | (0.04 | ) | | | (0.02 | ) | | | | |
| Net realized and unrealized gains | | | | | 2.48 | | | | 3.12 | | | | 2.58 | | | | 1.83 | | | | | |
| Total income from investment operations | | | | | 2.43 | | | | 3.13 | | | | 2.54 | | | | 1.81 | | | | | |
Less distributions:
| | | | | | | | | | | | | | | | | | | | | | |
| Dividends from net investment income | | | | | (0.00 | )4 | | | — | | | | — | | | | — | | | | | |
| Distributions from net realized gains | | | | | (0.43 | ) | | | (1.54 | ) | | | (0.22 | ) | | | — | | | | | |
| Total distributions | | | | | (0.43 | ) | | | (1.54 | ) | | | (0.22 | ) | | | — | | | | | |
| Net asset value at end of period | | | | | 17.72 | | | | 15.72 | | | | 14.13 | | | | 11.81 | | | | | |
| Total return (%) | | | | | 15.71 | | | | 23.65 | | | | 21.74 | | | | 18.10 | 2 | | | | |
| |
Ratios/Supplemental Data (%) |
Ratios to average net assets:
| | | | | | | | | | | | | | | | | | | | | | |
| Net operating expenses | | | | | 1.29 | | | | 1.28 | | | | 1.30 | | | | 1.30 | 3 | | | | |
| Gross operating expenses | | | | | 1.29 | | | | 1.38 | | | | 1.61 | | | | 1.73 | 3 | | | | |
| Net investment income or loss | | | | | (0.39 | ) | | | 0.11 | | | | (0.35 | ) | | | (0.54 | )3 | | | | |
| Portfolio turnover rate | | | | | 82 | | | | 90 | | | | 118 | | | | 39 | 2 | | | | |
| Net assets, end of period ($ x 1,000,000) | | | | | 431 | | | | 170 | | | | 37 | | | | 26 | | | | | |
Select Shares
| | | | 11/1/05—
10/31/06 | | 11/1/04—
10/31/05 | | 11/1/03—
10/31/04 | | 7/1/031—
10/31/03 | |
|---|
Per-Share Data ($) |
| Net asset value at beginning of period | | | | | 15.78 | | | | 14.16 | | | | 11.81 | | | | 10.00 | | | | | |
Income or loss from investment operations:
| | | | | | | | | | | | | | | | | | | | | | |
| Net investment income or loss | | | | | (0.02 | ) | | | 0.00 | 4 | | | (0.02 | ) | | | (0.01 | ) | | | | |
| Net realized and unrealized gains | | | | | 2.49 | | | | 3.16 | | | | 2.59 | | | | 1.82 | | | | | |
| Total income from investment operations | | | | | 2.47 | | | | 3.16 | | | | 2.57 | | | | 1.81 | | | | | |
Less distributions:
| | | | | | | | | | | | | | | | | | | | | | |
| Dividends from net investment income | | | | | (0.02 | ) | | | — | | | | — | | | | — | | | | | |
| Distributions from net realized gains | | | | | (0.43 | ) | | | (1.54 | ) | | | (0.22 | ) | | | — | | | | | |
| Total distributions | | | | | (0.45 | ) | | | (1.54 | ) | | | (0.22 | ) | | | — | | | | | |
| Net asset value at end of period | | | | | 17.80 | | | | 15.78 | | | | 14.16 | | | | 11.81 | | | | | |
| Total return (%) | | | | | 15.89 | | | | 23.83 | | | | 22.00 | | | | 18.10 | 2 | | | | |
| |
Ratios/Supplemental Data (%) |
Ratios to average net assets:
| | | | | | | | | | | | | | | | | | | | | | |
| Net operating expenses | | | | | 1.12 | | | | 1.11 | | | | 1.12 | | | | 1.12 | 3 | | | | |
| Gross operating expenses | | | | | 1.14 | | | | 1.23 | | | | 1.46 | | | | 1.58 | 3 | | | | |
| Net investment income or loss | | | | | (0.21 | ) | | | 0.09 | | | | (0.16 | ) | | | (0.36 | )3 | | | | |
| Portfolio turnover rate | | | | | 82 | | | | 90 | | | | 118 | | | | 39 | 2 | | | | |
| Net assets, end of period ($ x 1,000,000) | | | | | 276 | | | | 80 | | | | 18 | | | | 14 | | | | | |
1 | | Commencement of operations. |
4 | | Per share amount was less than $0.01. |
54 See financial notes.
Schwab Small-Cap Equity Fund
Portfolio Holdings as of October 31, 2006
This section shows all the securities in the fund’s portfolio and their value as of the report date.
The fund files its complete schedule of portfolio holdings with the SEC for the first and third quarters of each fiscal year on Form N-Q. The fund’s Form N-Q is available on the SEC’s website at http://www.sec.gov and may be viewed and copied at the SEC’s Public Reference Room in Washington, D.C. Call 1-800-SEC-0330 for information on the operation of the Public Reference Room. The schedule of portfolio holdings filed on a fund’s most recent Form N-Q is also available by visiting Schwab’s website at www.schwab.com/schwabfunds.
Holdings by Category
|
| Cost
($ x 1,000)
|
| Value
($ x 1,000)
|
|
|---|
97.7% | | | | Common Stock | | | 612,475 | | | | 690,020 | |
3.5% | | | | Short-Term Investments | | | 24,562 | | | | 24,562 | |
—% | | | | U.S. Treasury Obligation | | | 353 | | | | 353 | |
101.2% | | | | Total Investments | | | 637,390 | | | | 714,935 | |
10.9% | | | | Collateral Invested for Securities on Loan | | | 77,196 | | | | 77,196 | |
(12.1)% | | | | Other Assets and Liabilities, Net | | | | | | | (85,589 | ) |
100.0% | | | | Total Net Assets | | | | | | | 706,542 | |
Security
| | | | Number
of Shares | | Value
($ x 1,000) |
|---|
Common Stock 97.7% of net assets |
Automobiles & Components 1.8% |
ArvinMeritor, Inc. (a) | | | | | 15,200 | | | | 228 | |
| TRW Automotive Holdings Corp. * | | | | | 232,600 | | | | 5,966 | |
| Winnebago Industries, Inc. | | | | | 204,200 | | | | 6,798 | |
| | | | | | | | | | 12,992 | |
Banks 2.9% |
| Bancfirst Corp. | | | | | 51,700 | | | | 2,572 | |
| BancorpSouth, Inc. | | | | | 183,200 | | | | 4,681 | |
Bank of Hawaii Corp. (b) | | | | | 145,900 | | | | 7,612 | |
| First Financial Holdings, Inc. | | | | | 21,900 | | | | 791 | |
| Hancock Holding Co. | | | | | 18,600 | | | | 954 | |
| Whitney Holding Corp. | | | | | 117,000 | | | | 3,821 | |
| | | | | | | | | | 20,431 | |
Capital Goods 13.9% |
| Acuity Brands, Inc. | | | | | 229,800 | | | | 11,384 | |
American Woodmark Corp. (a) | | | | | 221,100 | | | | 8,179 | |
| Belden CDT, Inc. | | | | | 64,300 | | | | 2,328 | |
| Crane Co. | | | | | 338,800 | | | | 13,193 | |
| EMCOR Group, Inc. * | | | | | 341,600 | | | | 20,206 | |
| Orbital Sciences Corp. * | | | | | 250,100 | | | | 4,542 | |
| Robbins & Myers, Inc. | | | | | 50,100 | | | | 1,928 | |
| Teleflex, Inc. | | | | | 334,800 | | | | 20,825 | |
Thomas & Betts Corp. (b)* | | | | | 197,000 | | | | 10,151 | |
| Valmont Industries, Inc. | | | | | 100,600 | | | | 5,613 | |
| | | | | | | | | | 98,349 | |
Commercial Services & Supplies 5.8% |
| Administaff, Inc. | | | | | 101,350 | | | | 3,492 | |
AMREP Corp. (a)* | | | | | 38,600 | | | | 2,764 | |
CBIZ, Inc. (a)* | | | | | 622,100 | | | | 4,380 | |
| Consolidated Graphics, Inc. * | | | | | 194,950 | | | | 12,120 | |
| Ennis, Inc. | | | | | 61,100 | | | | 1,403 | |
| Heidrick & Struggles International, Inc. * | | | | | 211,200 | | | | 8,632 | |
| IKON Office Solutions, Inc. | | | | | 101,100 | | | | 1,507 | |
| Labor Ready, Inc. * | | | | | 127,900 | | | | 2,240 | |
| Spherion Corp. * | | | | | 362,600 | | | | 2,629 | |
| Steelcase, Inc., Class A | | | | | 45,100 | | | | 747 | |
| The Standard Register Co. | | | | | 101,800 | | | | 1,377 | |
| | | | | | | | | | 41,291 | |
Consumer Durables & Apparel 4.6% |
| Blyth, Inc. | | | | | 509,000 | | | | 12,175 | |
Kellwood Co. (a) | | | | | 675,100 | | | | 20,658 | |
| | | | | | | | | | 32,833 | |
Consumer Services 2.9% |
| Career Education Corp. * | | | | | 150,000 | | | | 3,342 | |
CPI Corp. (a) | | | | | 112,000 | | | | 5,287 | |
| DeVry, Inc. * | | | | | 73,700 | | | | 1,795 | |
| IHOP Corp. | | | | | 28,200 | | | | 1,471 | |
| Jack in the Box, Inc. * | | | | | 48,000 | | | | 2,693 | |
| Papa John’s International, Inc. * | | | | | 165,500 | | | | 6,074 | |
| | | | | | | | | | 20,662 | |
Diversified Financials 1.5% |
Investment Technology Group, Inc. (b)* | | | | | 219,600 | | | | 10,255 | |
Energy 4.6% |
Matrix Service Co. (a)* | | | | | 51,800 | | | | 744 | |
| Parker Drilling Co. * | | | | | 679,300 | | | | 5,564 | |
| Veritas DGC, Inc. * | | | | | 363,700 | | | | 26,190 | |
| | | | | | | | | | 32,498 | |
Health Care Equipment & Services 11.9% |
| Alliance Imaging, Inc. * | | | | | 108,500 | | | | 918 | |
| AMERIGROUP Corp. * | | | | | 187,000 | | | | 5,603 | |
| CorVel Corp. * | | | | | 109,900 | | | | 4,753 | |
| Magellan Health Services, Inc. * | | | | | 486,300 | | | | 21,222 | |
| MedCath Corp. * | | | | | 302,400 | | | | 8,011 | |
Mentor Corp. (a) | | | | | 392,400 | | | | 18,364 | |
| Molina Healthcare, Inc. * | | | | | 108,500 | | | | 4,257 | |
Sierra Health Services, Inc. (b)* | | | | | 535,700 | | | | 18,342 | |
| Zoll Medical Corp. * | | | | | 61,200 | | | | 2,368 | |
| | | | | | | | | | 83,838 | |
Household & Personal Products 1.1% |
| NBTY, Inc. * | | | | | 270,400 | | | | 7,523 | |
See financial notes. 55
Schwab Small-Cap Equity Fund
Portfolio Holdings continued
Security
| | | | Number
of Shares | | Value
($ x 1,000) |
|---|
Insurance 7.7% |
| Alleghany Corp. * | | | | | 12,954 | | | | 3,961 | |
| American Financial Group, Inc. | | | | | 132,200 | | | | 6,327 | |
| American Physicians Capital, Inc. * | | | | | 51,900 | | | | 2,839 | |
| Argonaut Group, Inc. * | | | | | 51,300 | | | | 1,745 | |
| CNA Surety Corp. * | | | | | 16,600 | | | | 338 | |
| Crawford & Co., Class B | | | | | 44,000 | | | | 334 | |
Delphi Financial Group, Inc., Class A (b) | | | | | 127,225 | | | | 4,993 | |
| FBL Financial Group, Inc., Class A | | | | | 25,800 | | | | 912 | |
| FPIC Insurance Group, Inc. * | | | | | 40,200 | | | | 1,437 | |
| Great American Financial Resources, Inc. | | | | | 53,000 | | | | 1,225 | |
| Harleysville Group, Inc. | | | | | 130,600 | | | | 4,712 | |
| LandAmerica Financial Group, Inc. | | | | | 19,000 | | | | 1,199 | |
| National Interstate Corp. | | | | | 25,100 | | | | 707 | |
| Nationwide Financial Services, Inc., Class A | | | | | 74,200 | | | | 3,778 | |
| Philadelphia Consolidated Holding Corp. * | | | | | 102,600 | | | | 4,014 | |
| ProAssurance Corp. * | | | | | 11,000 | | | | 536 | |
| Protective Life Corp. | | | | | 28,700 | | | | 1,270 | |
| Safety Insurance Group, Inc. | | | | | 177,000 | | | | 8,852 | |
| Selective Insurance Group, Inc. | | | | | 36,500 | | | | 2,016 | |
| StanCorp Financial Group, Inc. | | | | | 21,800 | | | | 996 | |
| State Auto Financial Corp. | | | | | 42,100 | | | | 1,353 | |
| Universal American Financial Corp. * | | | | | 58,000 | | | | 1,078 | |
| | | | | | | | | | 54,622 | |
Materials 9.5% |
| AK Steel Holding Corp. * | | | | | 332,500 | | | | 4,964 | |
| Albemarle Corp. | | | | | 4,000 | | | | 260 | |
| Carpenter Technology Corp. | | | | | 32,100 | | | | 3,434 | |
| FMC Corp. | | | | | 25,000 | | | | 1,714 | |
| Greif, Inc., Class A | | | | | 217,000 | | | | 20,335 | |
| H.B. Fuller Co. | | | | | 438,000 | | | | 10,858 | |
| Hercules, Inc. * | | | | | 252,300 | | | | 4,592 | |
| OM Group, Inc. * | | | | | 90,000 | | | | 5,130 | |
| Packaging Corp. of America | | | | | 64,500 | | | | 1,482 | |
| Silgan Holdings, Inc. | | | | | 185,200 | | | | 7,662 | |
| Spartech Corp. | | | | | 239,800 | | | | 6,570 | |
| | | | | | | | | | 67,001 | |
Media 0.2% |
| LodgeNet Entertainment Corp. * | | | | | 40,600 | | | | 934 | |
| Sinclair Broadcast Group, Inc., Class A | | | | | 48,700 | | | | 439 | |
| | | | | | | | | | 1,373 | |
Pharmaceuticals & Biotechnology 0.5% |
| Bruker BioSciences Corp. * | | | | | 274,300 | | | | 2,184 | |
| Maxygen, Inc. * | | | | | 124,100 | | | | 1,057 | |
| | | | | | | | | | 3,241 | |
Real Estate 0.1% |
| Essex Property Trust, Inc. | | | | | 1,500 | | | | 200 | |
| Kilroy Realty Corp. | | | | | 2,000 | | | | 151 | |
New Century Financial Corp. (a) | | | | | 3,000 | | | | 118 | |
| | | | | | | | | | 469 | |
Retailing 4.8% |
| Audiovox Corp., Class A * | | | | | 12,500 | | | | 164 | |
Blockbuster, Inc., Class A (a)* | | | | | 205,900 | | | | 807 | |
Payless Shoesource, Inc. (b)* | | | | | 338,100 | | | | 9,044 | |
| The Cato Corp., Class A | | | | | 14,450 | | | | 331 | |
| The Gymboree Corp. * | | | | | 65,200 | | | | 3,029 | |
The Men’s Wearhouse, Inc. (a) | | | | | 455,600 | | | | 18,156 | |
Wetseal, Inc., Class A (a)* | | | | | 421,800 | | | | 2,632 | |
| | | | | | | | | | 34,163 | |
Semiconductors & Semiconductor Equipment 1.5% |
| Agere Systems, Inc. * | | | | | 22,340 | | | | 379 | |
| Asyst Technologies, Inc. * | | | | | 246,300 | | | | 1,830 | |
| Atmel Corp. * | | | | | 67,000 | | | | 385 | |
| Cirrus Logic, Inc. * | | | | | 205,100 | | | | 1,448 | |
| Fairchild Semiconductor International, Inc. * | | | | | 202,200 | | | | 3,258 | |
| MKS Instruments, Inc. * | | | | | 134,500 | | | | 2,912 | |
| ON Semiconductor Corp. * | | | | | 5,800 | | | | 36 | |
| Zoran Corp. * | | | | | 19,900 | | | | 277 | |
| | | | | | | | | | 10,525 | |
Software & Services 11.5% |
| Advent Software, Inc. * | | | | | 19,000 | | | | 703 | |
| Ariba, Inc. * | | | | | 104,000 | | | | 785 | |
| Aspen Technology Inc * | | | | | 53,800 | | | | 539 | |
| Covansys Corp. * | | | | | 192,100 | | | | 4,495 | |
| CSG Systems International, Inc. * | | | | | 692,700 | | | | 18,689 | |
| Forrester Research, Inc. * | | | | | 228,200 | | | | 7,172 | |
| Global Payments, Inc. | | | | | 192,400 | | | | 8,410 | |
| Hyperion Solutions Corp. * | | | | | 28,900 | | | | 1,081 | |
i2 Technologies, Inc. (a)* | | | | | 45,700 | | | | 924 | |
| Informatica Corp. * | | | | | 1,500 | | | | 19 | |
| Interwoven, Inc. * | | | | | 208,000 | | | | 2,646 | |
Lightbridge, Inc. (b)* | | | | | 323,100 | | | | 3,735 | |
| SonicWALL, Inc. * | | | | | 312,700 | | | | 3,283 | |
| SPSS, Inc. * | | | | | 47,000 | | | | 1,301 | |
| Sybase, Inc. * | | | | | 444,400 | | | | 10,821 | |
| Sykes Enterprises, Inc. * | | | | | 579,200 | | | | 11,752 | |
| Synopsys, Inc. * | | | | | 185,500 | | | | 4,176 | |
| Tyler Technologies, Inc. * | | | | | 32,300 | | | | 458 | |
| | | | | | | | | | 80,989 | |
56 See financial notes.
Schwab Small-Cap Equity Fund
Portfolio Holdings continued
Security
| | | | Number
of Shares | | Value
($ x 1,000) |
|---|
Technology Hardware & Equipment 7.6% |
| AVX Corp. | | | | | 150,100 | | | | 2,366 | |
Brocade Communications Systems, Inc. (b)* | | | | | 484,300 | | | | 3,928 | |
| Carrier Access Corp. * | | | | | 116,900 | | | | 732 | |
| Coherent, Inc. * | | | | | 338,100 | | | | 10,897 | |
| Emulex Corp. * | | | | | 51,000 | | | | 959 | |
| Imation Corp. | | | | | 149,200 | | | | 6,829 | |
| Littelfuse, Inc. * | | | | | 259,600 | | | | 8,790 | |
| Photon Dynamics, Inc. * | | | | | 25,200 | | | | 299 | |
| Planar Systems, Inc. * | | | | | 249,500 | | | | 3,006 | |
| Rofin-Sinar Technologies, Inc. * | | | | | 19,100 | | | | 1,176 | |
Staktek Holdings, Inc. (a)* | | | | | 475,700 | | | | 2,902 | |
| Tektronix, Inc. | | | | | 41,000 | | | | 1,245 | |
UTStarcom, Inc. (a)* | | | | | 950,000 | | | | 10,231 | |
| | | | | | | | | | 53,360 | |
Telecommunication Services 1.2% |
| Broadwing Corp. * | | | | | 361,900 | | | | 5,421 | |
| CT Communications, Inc. | | | | | 136,700 | | | | 3,187 | |
| | | | | | | | | | 8,608 | |
Transportation 1.4% |
AMR Corp. (a)* | | | | | 111,700 | | | | 3,166 | |
Continental Airlines, Inc., Class B (a)* | | | | | 126,800 | | | | 4,676 | |
| Hub Group, Inc., Class A * | | | | | 88,600 | | | | 2,406 | |
| | | | | | | | | | 10,248 | |
Utilities 0.7% |
| Allete, Inc. | | | | | 105,300 | | | | 4,749 | |
Security
Rate, Maturity Date
| | | | Face
Amount
($ x 1,000) | | Value
($ x 1,000) |
|---|
Short-Term Investments 3.5% of net assets |
| |
JP Morgan, Grand Cayman Time Deposit
4.71%, 11/01/06 | | | | | 8,332 | | | | 8,332 | |
Wells Fargo, Grand Cayman
Time Deposit
4.71%, 11/01/06 | | | | | 16,230 | | | | 16,230 | |
| | | | | | | | | | 24,562 | |
U.S. Treasury Obligation 0.0% of net assets |
| |
| U.S. Treasury Bill | | | | | | | | | | |
| 4.81%, 12/14/06 | | | | | 85 | | | | 85 | |
| 4.90%, 12/14/06 | | | | | 119 | | | | 119 | |
| 4.91%, 12/14/06 | | | | | 149 | | | | 149 | |
| | | | | | | | | | 353 | |
Security
| | | | Number of
Shares | | Value
($ x 1,000) |
|---|
Collateral Invested for Securities on Loan 10.9% of net assets |
| |
Securities Lending Investment
Fund, a series of the Brown
Brothers Investment Trust | | | | | 77,195,782 | | | | 77,196 | |
End of collateral invested for securities on loan.At 10-31-06 the tax basis cost of the fund’s investments was $637,576 and the unrealized appreciation and depreciation were $90,497 and ($13,138), respectively, with a net unrealized appreciation of $77,359.
In addition to the above, the fund held the following at 10-31-06. All numbers are x1,000 except number of future contract.
| | | | Number of
Contracts | | Contract
Value | | Unrealized
Gains |
|---|
|
| |
Russell 2000 Index, Long
expires 12/31/06 | | | | | 120 | | | | 9,252 | | | | 499 | |
| * | | Non-income producing security. |
(a) | | All or a portion of this security is on loan. |
(b) | | All or a portion of this security is held as collateral for open futures contracts. |
See financial notes. 57
Schwab Small-Cap Equity Fund
Statement of
Assets and Liabilities
As of October 31, 2006. All numbers x 1,000 except NAV.
Assets |
| Investments, at value including securities on loan of $73,950 (cost $637,390) | | | | $ | 714,935 | |
| Collateral invested for securities on loan | | | | | 77,196 | |
Receivables:
| | | | | | |
| Investments sold | | | | | 6,476 | |
| Fund shares sold | | | | | 6,601 | |
| Dividends | | | | | 326 | |
| Income from securities on loan | | | | | 19 | |
| Interest | | | | | 3 | |
| Prepaid expenses | | | | + | 2 | |
Total assets | | | | | 805,558 | |
| |
Liabilities |
| Collateral for securities on loan | | | | | 77,196 | |
Payables:
| | | | | | |
| Investments bought | | | | | 21,100 | |
| Investment adviser and administrator fees | | | | | 75 | |
| Transfer agent and shareholder service fees | | | | | 11 | |
| Fund shares redeemed | | | | | 530 | |
| Due to brokers for futures | | | | | 31 | |
| Trustee fees | | | | | 1 | |
| Accrued expenses | | | | + | 72 | |
Total liabilities | | | | | 99,016 | |
| |
Net Assets |
Total assets | | | | | 805,558 | |
Total liabilities | | | | | –99,016 | |
Net assets | | | | $ | 706,542 | |
| |
Net Assets by Source | | | | | | |
| Capital received from investors | | | | | 625,075 | |
| Net realized capital gains | | | | | 3,423 | |
| Net unrealized capital gains | | | | | 78,044 | |
| |
Net Asset Value (NAV) by Shares Class | | | | | | |
Share Class
| | | | Net Assets | | ÷ | | Shares
Outstanding | | = | | NAV |
|---|
| Investor Shares | | | | $ | 431,020 | | | | | | | | 24,331 | | | | | | | $ | 17.72 | * |
| Select Shares | | | | $ | 275,522 | | | | | | | | 15,475 | | | | | | | $ | 17.80 | |
| * | | Due to rounding, net assets divided by shares outstanding does not equal the net asset value per share. |
58 See financial notes.
Schwab Small-Cap Equity Fund
Statement of
Operations
For November 1, 2005 through October 31, 2006. All numbers x 1,000.
Investment Income |
| Dividends | | | | $ | 3,844 | |
| Interest | | | | | 277 | |
| Securities on loan | | | | + | 104 | |
Total investment income | | | | | 4,225 | |
| |
Net Realized Gains and Losses |
| Net realized gains on investments | | | | | 3,229 | |
| Net realized gains on futures contracts | | | | + | 77 | |
Net realized gains | | | | | 3,306 | |
| |
Net Unrealized Gains and Losses |
| Net unrealized gains on investments | | | | | 56,893 | |
| Net unrealized gains on futures contracts | | | | + | 610 | |
Net unrealized gains | | | | | 57,503 | |
| |
Expenses |
| Investment adviser and administrator fees | | | | | 4,509 | |
Transfer agent and shareholder service fees:
| | | | | | |
| Investor Shares | | | | | 783 | |
| Select Shares | | | | | 151 | |
| Registration fees | | | | | 166 | |
| Portfolio accounting fees | | | | | 49 | |
| Custodian fees | | | | | 36 | |
| Professional fees | | | | | 34 | |
| Shareholder reports | | | | | 32 | |
| Trustees’ fees | | | | | 9 | |
| Overdraft expense | | | | | 6 | |
| Other expenses | | | | + | 11 | |
| Total expenses | | | | | 5,786 | |
| Expense reduction by adviser and Schwab | | | | | –38 | |
Net expenses | | | | | 5,748 | |
| |
Increase in Net Assets from Operations |
Total investment income | | | | | 4,225 | |
Net expenses | | | | | –5,748 | |
Net investment loss | | | | | (1,523 | ) |
Net realized gains | | | | | 3,306 | |
Net unrealized gains | | | | + | 57,503 | |
Increase in net assets from operations | | | | $ | 59,286 | |
See financial notes. 59
Schwab Small-Cap Equity Fund
Statement of
Changes in Net Assets
For the current and prior report periods. All numbers x 1,000.
| | | | 11/1/05–10/31/06 | | 11/1/04–10/31/05 |
|---|
| Net investment income or loss | | | | $ | (1,523 | ) | | $ | 135 | |
| Net realized gains | | | | | 3,306 | | | | 8,242 | |
| Net unrealized gains | | | | + | 57,503 | | | | 13,859 | |
Increase in net assets from operations | | | | | 59,286 | | | | 22,236 | |
| |
Distributions Paid |
Dividends from net investment income | | | | | | | | | | |
| Investor Shares | | | | | 27 | | | | — | |
| Select Shares | | | | + | 109 | | | | — | |
Total dividends from net investment income | | | | | 136 | | | | — | |
| | | | | | | | | | | |
Distribution from net realized gains | | | | | | | | | | |
| Investor Shares | | | | | 5,522 | | | | 4,802 | |
| Select Shares | | | | + | 2,565 | | | | 2,252 | |
Total distribution from net realized gains | | | | | 8,087 | | | | 7,054 | |
| | | | | | | | | | | |
Total Distributions | | | | $ | 8,223 | | | $ | 7,054 | |
| |
Transactions in Fund Shares |
| | | | 11/1/05–10/31/06 | | 11/1/04–10/31/05 | |
|---|
| | | | SHARES | | VALUE | | SHARES | | VALUE |
|---|
Shares Sold | | | | | | | | | | | | | | | | | | |
| Investor Shares | | | | | 18,715 | | | $ | 315,251 | | | | 9,837 | | | $ | 146,160 | |
| Select Shares | | | | + | 13,258 | | | | 225,539 | | | | 4,714 | | | | 71,745 | |
Total shares sold | | | | | 31,973 | | | $ | 540,790 | | | | 14,551 | | | $ | 217,905 | |
| | | | | | | | | | | | | | | | | | | |
Shares Reinvested | | | | | | | | | | | | | | | | | | |
| Investor Shares | | | | | 308 | | | $ | 4,978 | | | | 313 | | | $ | 4,324 | |
| Select Shares | | | | + | 142 | | | | 2,297 | | | | 118 | | | | 1,635 | |
Total shares reinvested | | | | | 450 | | | $ | 7,275 | | | | 431 | | | $ | 5,959 | |
| | | | | | | | | | | | | | | | | | | |
Shares Redeemed | | | | | | | | | | | | | | | | | | |
| Investor Shares | | | | | (5,534 | ) | | $ | (92,761 | ) | | | (1,902 | ) | | $ | (27,944 | ) |
| Select Shares | | | | + | (3,006 | ) | | | (50,423 | ) | | | (1,055 | ) | | | (15,623 | ) |
Total shares redeemed | | | | | (8,540 | ) | | $ | (143,184 | ) | | | (2,957 | ) | | $ | (43,567 | ) |
| | | | | | | | | | | | | | | | | | | |
Net transactions in fund shares | | | | | 23,883 | | | $ | 404,881 | | | | 12,025 | | | $ | 180,297 | |
| | | | | | | | | | | | | | | | | | | |
Shares Outstanding and Net Assets |
| | | | 11/1/05–10/31/06 | | 11/1/04–10/31/05 | |
|---|
| | | | SHARES | | NET ASSETS | | SHARES | | NET ASSETS |
|---|
| Beginning of period | | | | | 15,923 | | | $ | 250,598 | | | | 3,898 | | | $ | 55,119 | |
| Total increase | | | | + | 23,883 | | | | 455,944 | | | | 12,025 | | | | 195,479 | |
End of period | | | | | 39,806 | | | $ | 706,542 | | | | 15,923 | | | $ | 250,598 | |
Net investment income not yet distributed | | | | | | | | $ | — | | | | | | | $ | 135 | |
60 See financial notes.
Schwab Hedged Equity Fund™
Financial Statements
Financial Highlights
Investor Shares
| | | | 11/1/05—
10/31/06 | | 3/1/051—
10/31/05 | | | | | | |
|---|
Per-Share Data ($) |
| Net asset value at beginning of period | | | | | 14.45 | | | | 13.51 | | | | | | | | | | | | | |
Income from investment operations:
| | | | | | | | | | | | | | | | | | | | | | |
| Net investment income | | | | | 0.06 | | | | 0.03 | | | | | | | | | | | | | |
| Net realized and unrealized gains | | | | | 1.74 | | | | 0.91 | | | | | | | | | | | | | |
| Total income from investment operations | | | | | 1.80 | | | | 0.94 | | | | | | | | | | | | | |
Less distributions:
| | | | | | | | | | | | | | | | | | | | | | |
| Dividends from net investment income | | | | | (0.04 | ) | | | — | | | | | | | | | | | | | |
| Distributions from net realized gains | | | | | (0.26 | ) | | | — | | | | | | | | | | | | | |
| Total distributions | | | | | (0.30 | ) | | | — | | | | | | | | | | | | | |
| Net asset value at end of period | | | | | 15.95 | | | | 14.45 | | | | | | | | | | | | | |
| Total return (%) | | | | | 12.71 | | | | 6.96 | 2 | | | | | | | | | | | | |
Ratios/Supplemental Data (%) |
Ratios to average net assets:
| | | | | | | | | | | | | | | | | | | | | | |
| Net operating expenses (including dividend expense on short sales) | | | | | 2.11 | | | | 2.32 | 3 | | | | | | | | | | | | |
| Net operating expenses (excluding dividend expense on short sales) | | | | | 1.99 | 4 | | | 2.05 | 3,4 | | | | | | | | | | | | |
| Gross operating expenses | | | | | 2.12 | | | | 2.35 | 3 | | | | | | | | | | | | |
| Net investment income | | | | | 0.58 | | | | 0.56 | 3 | | | | | | | | | | | | |
| Portfolio turnover rate | | | | | 100 | | | | 87 | 2 | | | | | | | | | | | | |
| Net assets, end of period ($ x 1,000,000) | | | | | 207 | | | | 33 | | | | | | | | | | | | | |
| | | | | | | | | | | | | |
|---|
Select Shares
| | | | 11/1/05—
10/31/06 | | 11/1/04—
10/31/05 | | 11/1/03—
10/31/04 | | 11/1/02—
10/31/03 | | 9/30/021—
10/31/02 |
|---|
Per-Share Data ($) |
| Net asset value at beginning of period | | | | | 14.46 | | | | 13.01 | | | | 11.53 | | | | 9.84 | | | | 10.00 | |
Income or loss from investment operations:
| | | | | | | | | | | | | | | | | | | | | | |
| Net investment income or losses | | | | | 0.07 | | | | 0.04 | | | | (0.09 | ) | | | (0.09 | ) | | | (0.01 | ) |
| Net realized and unrealized gains or losses | | | | | 1.76 | | | | 2.05 | | | | 1.57 | | | | 1.78 | | | | (0.15 | ) |
| Total income or loss from investment operations | | | | | 1.83 | | | | 2.09 | | | | 1.48 | | | | 1.69 | | | | (0.16 | ) |
Less distributions:
| | | | | | | | | | | | | | | | | | | | | | |
| Dividends from net investment income | | | | | (0.05 | ) | | | — | | | | — | | | | — | | | | — | |
| Distributions from net realized gains | | | | | (0.26 | ) | | | (0.64 | ) | | | — | | | | — | | | | — | |
| Total distributions | | | | | (0.31 | ) | | | (0.64 | ) | | | — | | | | — | | | | — | |
| Net asset value at end of period | | | | | 15.98 | | | | 14.46 | | | | 13.01 | | | | 11.53 | | | | 9.84 | |
| Total return (%) | | | | | 12.82 | | | | 16.52 | | | | 12.84 | | | | 17.17 | | | | (1.60 | )2 |
Ratios/Supplemental Data (%) |
Ratios to average net assets:
| | | | | | | | | | | | | | | | | | | | | | |
| Net operating expenses (including dividend expenses on short sales) | | | | | 1.90 | | | | 2.26 | | | | 2.43 | | | | 2.37 | | | | 2.39 | 3 |
| Net operating expenses (excluding dividend expense on short sales) | | | | | 1.77 | 5 | | | 1.92 | 5 | | | 2.10 | 5 | | | 2.00 | | | | 2.00 | 3 |
| Gross operating expenses | | | | | 1.97 | | | | 2.39 | | | | 2.71 | | | | 2.77 | | | | 3.33 | 3 |
| Net investment income or loss | | | | | 0.77 | | | | 0.55 | | | | (0.86 | ) | | | (0.90 | ) | | | (0.79 | )3 |
| Portfolio turnover rate | | | | | 100 | | | | 87 | | | | 99 | | | | 114 | | | | 68 | 2 |
| Net assets, end of period ($ x 1,000,000) | | | | | 931 | | | | 229 | | | | 68 | | | | 44 | | | | 32 | |
1 | | Commencement of operations. |
4 | | The ratio of net operating expenses would have been 2.00% and 1.98% for the periods ended 10/31/05 and 10/31/06, respectively, if interest expense had not been included. |
5 | | The ratio of net operating expenses would have been 2.00%, 1.82% and 1.76% for the periods ended 10/31/04, 10/31/05 and 10/31/06, respectively, if interest expense had not been included. |
See financial notes. 61
Schwab Hedged Equity Fund
Portfolio Holdings as of October 31, 2006
This section shows all the securities in the fund’s portfolio and their value as of the report date.
The fund files its complete schedule of portfolio holdings with the SEC for the first and third quarters of each fiscal year on Form N-Q. The fund’s Form N-Q is available on the SEC’s website at http://www.sec.gov and may be viewed and copied at the SEC’s Public Reference Room in Washington, D.C. Call 1-800-SEC-0330 for information on the operation of the Public Reference Room. The schedule of portfolio holdings filed on a fund’s most recent Form N-Q is also available by visiting Schwab’s website at www.schwab.com/schwabfunds.
Holdings by Category
|
| Cost
($ x 1,000)
|
| Value
($ x 1,000)
|
|
|---|
99.2 % | | | | Common Stock | | | 996,939 | | | | 1,128,584 | |
2.8% | | | | Short-Term Investment | | | 32,139 | | | | 32,139 | |
102.0% | | | | Total Investments | | | 1,029,078 | | | | 1,160,723 | |
(41.0)% | | | | Short Sales | | | (455,082 | ) | | | (466,145 | ) |
39.0% | | | | Other Assets and Liabilities, Net | | | | | | | 443,305 | |
100.0% | | | | Total Net Assets | | | | | | | 1,137,883 | |
Security
| | | | Number
of Shares | | Value
($ x 1,000) |
|---|
Common Stock 99.2% of net assets |
Automobiles & Components 1.0% |
TRW Automotive Holdings Corp. (a)* | | | | | 460,100 | | | | 11,802 | |
Banks 1.8% |
BancorpSouth, Inc. (a) | | | | | 9,300 | | | | 238 | |
Comerica, Inc. (a) | | | | | 45,800 | | | | 2,665 | |
KeyCorp (a) | | | | | 381,500 | | | | 14,169 | |
Radian Group, Inc. (a) | | | | | 64,300 | | | | 3,427 | |
| | | | | | | | | | 20,499 | |
Capital Goods 11.4% |
Acuity Brands, Inc. (a) | | | | | 86,700 | | | | 4,295 | |
Cooper Industries Ltd.,
Class A (a) | | | | | 7,000 | | | | 626 | |
EMCOR Group, Inc. (a)* | | | | | 419,400 | | | | 24,808 | |
Emerson Electric Co. (a) | | | | | 45,700 | | | | 3,857 | |
Genlyte Group, Inc. (a)* | | | | | 17,000 | | | | 1,313 | |
ITT Corp. (a) | | | | | 141,500 | | | | 7,696 | |
Lockheed Martin Corp. (a) | | | | | 235,600 | | | | 20,481 | |
Raytheon Co. (a) | | | | | 446,600 | | | | 22,308 | |
Teleflex, Inc. (a) | | | | | 96,500 | | | | 6,002 | |
The Boeing Co. (a) | | | | | 300,400 | | | | 23,990 | |
Thomas & Betts Corp. (a)* | | | | | 281,300 | | | | 14,495 | |
| | | | | | | | | | 129,871 | |
Commercial Services & Supplies 0.9% |
Consolidated Graphics, Inc. (a)* | | | | | 58,400 | | | | 3,631 | |
Waste Management, Inc. (a) | | | | | 173,600 | | | | 6,506 | |
| | | | | | | | | | 10,137 | |
Consumer Durables & Apparel 5.3% |
| Blyth, Inc. | | | | | 141,800 | | | | 3,392 | |
| Hasbro, Inc. | | | | | 468,700 | | | | 12,149 | |
Kellwood Co. (a) | | | | | 124,500 | | | | 3,810 | |
Mattel, Inc. (a) | | | | | 209,600 | | | | 4,743 | |
Newell Rubbermaid, Inc. (a) | | | | | 862,400 | | | | 24,820 | |
Polo Ralph Lauren Corp. (a) | | | | | 128,000 | | | | 9,088 | |
| Snap-On, Inc. | | | | | 43,600 | | | | 2,050 | |
| | | | | | | | | | 60,052 | |
Consumer Services 1.8% |
International Game Technology (a) | | | | | 222,600 | | | | 9,463 | |
Jack in the Box, Inc. (a)* | | | | �� | 20,700 | | | | 1,161 | |
Papa John’s International, Inc. (a)* | | | | | 280,000 | | | | 10,276 | |
| | | | | | | | | | 20,900 | |
Diversified Financials 4.6% |
American Express Co. (a) | | | | | 58,600 | | | | 3,388 | |
Ameriprise Financial, Inc. (a) | | | | | 10,000 | | | | 515 | |
Bank of America Corp. (a) | | | | | 247,000 | | | | 13,306 | |
Franklin Resources, Inc. (a) | | | | | 147,200 | | | | 16,775 | |
Investment Technology Group, Inc. (a)* | | | | | 142,900 | | | | 6,673 | |
JPMorgan Chase & Co. (a) | | | | | 39,700 | | | | 1,883 | |
Mellon Financial Corp. (a) | | | | | 151,300 | | | | 5,870 | |
Northern Trust Corp. (a) | | | | | 64,300 | | | | 3,776 | |
| | | | | | | | | | 52,186 | |
Energy 5.7% |
Exxon Mobil Corp. (a) | | | | | 405,800 | | | | 28,982 | |
Grant Prideco, Inc. (a)* | | | | | 82,300 | | | | 3,109 | |
Pride International, Inc. (a)* | | | | | 156,400 | | | | 4,318 | |
SEACOR Holdings, Inc. (a)* | | | | | 43,700 | | | | 3,910 | |
Veritas DGC, Inc. (a)* | | | | | 344,800 | | | | 24,829 | |
| | | | | | | | | | 65,148 | |
Food, Beverage & Tobacco 5.4% |
Anheuser-Busch Cos., Inc. (a) | | | | | 94,800 | | | | 4,495 | |
| ConAgra Foods, Inc. | | | | | 1,079,400 | | | | 28,226 | |
General Mills, Inc. (a) | | | | | 250,900 | | | | 14,256 | |
H.J. Heinz Co. (a) | | | | | 79,500 | | | | 3,352 | |
| Reynolds American, Inc. | | | | | 16,300 | | | | 1,030 | |
The Coca-Cola Co. (a) | | | | | 124,100 | | | | 5,798 | |
The J.M. Smucker Co. (a) | | | | | 76,200 | | | | 3,734 | |
| | | | | | | | | | 60,891 | |
62 See financial notes.
Schwab Hedged Equity Fund
Portfolio Holdings continued
Security
| | | | Number
of Shares | | Value
($ x 1,000) |
|---|
Health Care Equipment & Services 10.0% |
Aetna, Inc. (a) | | | | | 51,500 | | | | 2,123 | |
AMERIGROUP Corp. (a)* | | | | | 14,100 | | | | 422 | |
AmerisourceBergen Corp. (a) | | | | | 465,100 | | | | 21,953 | |
Baxter International, Inc. (a) | | | | | 98,600 | | | | 4,533 | |
Becton Dickinson & Co. (a) | | | | | 294,700 | | | | 20,638 | |
CIGNA Corp. (a) | | | | | 19,900 | | | | 2,328 | |
Humana, Inc. (a)* | | | | | 146,200 | | | | 8,772 | |
IMS Health, Inc. (a) | | | | | 46,900 | | | | 1,306 | |
Magellan Health Services, Inc. (a)* | | | | | 413,300 | | | | 18,036 | |
McKesson Corp. (a) | | | | | 474,200 | | | | 23,753 | |
Mentor Corp. (a) | | | | | 65,500 | | | | 3,065 | |
Sierra Health Services, Inc. (a)* | | | | | 75,100 | | | | 2,571 | |
WellPoint, Inc. (a)* | | | | | 52,445 | | | | 4,003 | |
| | | | | | | | | | 113,503 | |
Insurance 8.7% |
American Financial Group, Inc. (a) | | | | | 52,500 | | | | 2,513 | |
AON Corp. (a) | | | | | 537,900 | | | | 18,713 | |
Genworth Financial, Inc.,
Class A (a) | | | | | 27,600 | | | | 923 | |
Harleysville Group, Inc. (a) | | | | | 15,200 | | | | 548 | |
HCC Insurance Holdings, Inc. (a) | | | | | 62,800 | | | | 2,114 | |
| Hilb, Rogal & Hobbs Co. | | | | | 15,000 | | | | 599 | |
Loews Corp. (a) | | | | | 630,000 | | | | 24,520 | |
MetLife, Inc. (a) | | | | | 74,700 | | | | 4,268 | |
Nationwide Financial Services, Inc., Class A (a) | | | | | 105,800 | | | | 5,387 | |
Philadelphia Consolidated Holding Corp. (a)* | | | | | 5,100 | | | | 199 | |
Principal Financial Group, Inc. (a) | | | | | 515,100 | | | | 29,098 | |
Protective Life Corp. (a) | | | | | 22,300 | | | | 987 | |
SAFECO Corp. (a) | | | | | 1,700 | | | | 99 | |
The Chubb Corp. (a) | | | | | 14,200 | | | | 755 | |
W. R. Berkley Corp. (a) | | | | | 221,512 | | | | 8,165 | |
| | | | | | | | | | 98,888 | |
Materials 6.2% |
Greif, Inc., Class A (a) | | | | | 109,500 | | | | 10,261 | |
H.B. Fuller Co. (a) | | | | | 198,300 | | | | 4,916 | |
International Paper Co. (a) | | | | | 251,800 | | | | 8,398 | |
Nucor Corp. (a) | | | | | 285,200 | | | | 16,659 | |
Pactiv Corp. (a)* | | | | | 324,000 | | | | 9,992 | |
PPG Industries, Inc. (a) | | | | | 53,100 | | | | 3,632 | |
Rohm & Haas Co. (a) | | | | | 238,500 | | | | 12,359 | |
| Sonoco Products Co. | | | | | 39,300 | | | | 1,394 | |
| The Lubrizol Corp. | | | | | 61,700 | | | | 2,776 | |
| | | | | | | | | | 70,387 | |
Media 3.6% |
| CBS Corp., Class B | | | | | 152,600 | | | | 4,416 | |
The DIRECTV Group, Inc. (a)* | | | | | 501,300 | | | | 11,169 | |
The McGraw-Hill Cos., Inc. (a) | | | | | 348,400 | | | | 22,357 | |
The Walt Disney Co. (a) | | | | | 29,300 | | | | 922 | |
Warner Music Group Corp. (a) | | | | | 101,400 | | | | 2,629 | |
| | | | | | | | | | 41,493 | |
Pharmaceuticals & Biotechnology 5.1% |
Applied Biosystems Group —Applera Corp. (a) | | | | | 767,500 | | | | 28,628 | |
Biogen Idec, Inc. (a)* | | | | | 32,900 | | | | 1,566 | |
Forest Laboratories, Inc. (a)* | | | | | 30,200 | | | | 1,478 | |
King Pharmaceuticals, Inc. (a)* | | | | | 798,500 | | | | 13,359 | |
Merck & Co., Inc. (a) | | | | | 163,400 | | | | 7,422 | |
Pfizer, Inc. (a) | | | | | 145,900 | | | | 3,888 | |
Watson Pharmaceuticals, Inc. (a)* | | | | | 50,700 | | | | 1,364 | |
| | | | | | | | | | 57,705 | |
Retailing 7.4% |
American Eagle Outfitters, Inc. (a) | | | | | 360,100 | | | | 16,492 | |
| AnnTaylor Stores Corp. * | | | | | 190,500 | | | | 8,386 | |
| Big Lots, Inc. * | | | | | 100,900 | | | | 2,127 | |
| Blockbuster, Inc., Class A * | | | | | 190,300 | | | | 746 | |
J.C. Penney Co., Inc. (a) | | | | | 72,400 | | | | 5,447 | |
Office Depot, Inc. (a)* | | | | | 362,900 | | | | 15,238 | |
| OfficeMax, Inc. | | | | | 14,600 | | | | 695 | |
Payless Shoesource, Inc. (a)* | | | | | 804,400 | | | | 21,518 | |
Sears Holdings Corp. (a)* | | | | | 79,700 | | | | 13,905 | |
| | | | | | | | | | 84,554 | |
Semiconductors & Semiconductor Equipment 0.2% |
Agere Systems, Inc. (a)* | | | | | 16,570 | | | | 281 | |
| Integrated Device Technology, Inc. * | | | | | 128,800 | | | | 2,042 | |
Texas Instruments, Inc. (a) | | | | | 9,900 | | | | 299 | |
| | | | | | | | | | 2,622 | |
Software & Services 5.6% |
BEA Systems, Inc. (a)* | | | | | 24,000 | | | | 390 | |
BMC Software, Inc. (a)* | | | | | 298,100 | | | | 9,035 | |
Cadence Design Systems, Inc. (a)* | | | | | 335,700 | | | | 5,996 | |
Ceridian Corp. (a)* | | | | | 35,300 | | | | 832 | |
Electronic Data Systems Corp. (a) | | | | | 85,700 | | | | 2,171 | |
Global Payments, Inc. (a) | | | | | 383,800 | | | | 16,776 | |
| Intuit, Inc. * | | | | | 21,200 | | | | 748 | |
McAfee, Inc. (a)* | | | | | 322,600 | | | | 9,333 | |
Sybase, Inc. (a)* | | | | | 127,300 | | | | 3,100 | |
Synopsys, Inc. (a)* | | | | | 668,800 | | | | 15,055 | |
| | | | | | | | | | 63,436 | |
Technology Hardware & Equipment 6.8% |
Agilent Technologies, Inc. (a)* | | | | | 33,100 | | | | 1,178 | |
AVX Corp. (a) | | | | | 97,800 | | | | 1,541 | |
Coherent, Inc. (a)* | | | | | 43,600 | | | | 1,405 | |
Hewlett-Packard Co. (a) | | | | | 333,100 | | | | 12,904 | |
Imation Corp. (a) | | | | | 111,000 | | | | 5,081 | |
Lexmark International, Inc., Class A (a)* | | | | | 422,900 | | | | 26,892 | |
| Littelfuse, Inc. * | | | | | 10,300 | | | | 349 | |
Motorola, Inc. (a) | | | | | 320,200 | | | | 7,384 | |
UTStarcom, Inc. (a)* | | | | | 1,878,800 | | | | 20,235 | |
| | | | | | | | | | 76,969 | |
See financial notes. 63
Schwab Hedged Equity Fund
Portfolio Holdings continued
Security
| | | | Number
of Shares | | Value
($ x 1,000) |
|---|
Telecommunication Services 1.5% |
| ALLTEL Corp. | | | | | 12,000 | | | | 640 | |
CenturyTel, Inc. (a) | | | | | 35,800 | | | | 1,441 | |
Citizens Communications
Co. (a) | | | | | 841,300 | | | | 12,333 | |
Qwest Communications International, Inc. (a)* | | | | | 298,900 | | | | 2,579 | |
| | | | | | | | | | 16,993 | |
Transportation 2.4% |
Continental Airlines, Inc.,
Class B (a)* | | | | | 288,200 | | | | 10,629 | |
US Airways Group, Inc. (a)* | | | | | 341,800 | | | | 17,042 | |
| | | | | | | | | | 27,671 | |
Utilities 3.8% |
Allegheny Energy, Inc. (a)* | | | | | 54,600 | | | | 2,350 | |
Alliant Energy Corp. (a) | | | | | 93,800 | | | | 3,597 | |
Dynegy, Inc., Class A (a)* | | | | | 659,400 | | | | 4,009 | |
FirstEnergy Corp. (a) | | | | | 203,900 | | | | 12,000 | |
TXU Corp. (a) | | | | | 331,400 | | | | 20,921 | |
| | | | | | | | | | 42,877 | |
Security
Rate, Maturity Date
| | | | Face Amount
($ x 1,000) | | |
|---|
Short-Term Investment 2.8% of net assets |
Repurchase Agreement 2.8% |
Fixed Income Clearing
Corp. dated 10/31/06,
due 11/01/06 at 4.8%,
with a maturity value
of $32,143 (fully
collateralized by Federal
National Mortgage
Association with a
value of $33,182.)
4.80%, 11/01/06 | | | | | 32,139 | | | | 32,139 | |
At 10-31-06 the tax basis cost of the fund’s investments was $1,029,082 and the unrealized appreciation and depreciation were $136,548 and ($4,907), respectively, with a net unrealized appreciation of $131,641.
| * | | Non-income producing security. |
(a) | | All or a portion of this security is held as collateral for short sales. |
64 See financial notes.
Schwab Hedged Equity Fund
Portfolio Holdings continued
Security
| | | | Number of
Shares | | Value
($ x 1,000) |
|---|
Short Sales 41.0% of net assets |
Automobiles & Components 0.1% |
| American Axle & Manufacturing Holdings, Inc. | | | | | 48,300 | | | | 906 | |
Capital Goods 2.9% |
| Briggs & Stratton Corp. | | | | | 87,000 | | | | 2,218 | |
| DRS Technologies, Inc. | | | | | 16,300 | | | | 721 | |
| Energy Conversion Devices, Inc. * | | | | | 372,600 | | | | 13,708 | |
| Hexcel Corp. * | | | | | 922,700 | | | | 14,938 | |
| Watsco, Inc. | | | | | 19,100 | | | | 951 | |
| | | | | | | | | | 32,536 | |
Commercial Services & Supplies 0.5% |
| Acco Brands Corp. * | | | | | 241,400 | | | | 5,866 | |
Consumer Durables & Apparel 4.1% |
| Hovnanian Enterprises, Inc., Class A * | | | | | 421,200 | | | | 12,994 | |
| M.D.C. Holdings, Inc. | | | | | 41,500 | | | | 2,069 | |
| Meritage Homes Corp. * | | | | | 60,200 | | | | 2,756 | |
| Polaris Industries, Inc. | | | | | 113,200 | | | | 4,847 | |
| Pulte Homes, Inc. | | | | | 114,200 | | | | 3,539 | |
| Quiksilver, Inc. * | | | | | 944,600 | | | | 13,177 | |
| Standard Pacific Corp. | | | | | 272,300 | | | | 6,598 | |
| | | | | | | | | | 45,980 | |
Consumer Services 3.0% |
| OSI Restaurant Partners, Inc. | | | | | 299,400 | | | | 9,961 | |
| Red Robin Gourmet Burgers, Inc. * | | | | | 4,700 | | | | 227 | |
| Scientific Games Corp., Class A * | | | | | 100,100 | | | | 2,806 | |
| Station Casinos, Inc. | | | | | 104,600 | | | | 6,307 | |
| Texas Roadhouse, Inc., Class A * | | | | | 238,900 | | | | 3,452 | |
| Wynn Resorts Ltd. * | | | | | 147,000 | | | | 10,810 | |
| | | | | | | | | | 33,563 | |
Energy 2.9% |
| Alpha Natural Resources, Inc. * | | | | | 494,600 | | | | 7,869 | |
| ATP Oil & Gas Corp. * | | | | | 77,900 | | | | 3,349 | |
| CARBO Ceramics, Inc. | | | | | 21,300 | | | | 718 | |
| Crosstex Energy, Inc. | | | | | 57,400 | | | | 5,509 | |
| Delta Petroleum Corp. * | | | | | 343,100 | | | | 8,818 | |
| Evergreen Energy, Inc. * | | | | | 61,500 | | | | 790 | |
| Petrohawk Energy Corp. * | | | | | 127,900 | | | | 1,449 | |
| Quicksilver Resources, Inc. * | | | | | 48,300 | | | | 1,656 | |
| Rowan Cos., Inc. | | | | | 18,200 | | | | 607 | |
| Syntroleum Corp. * | | | | | 91,400 | | | | 360 | |
| TETRA Technologies, Inc. * | | | | | 83,500 | | | | 2,163 | |
| | | | | | | | | | 33,288 | |
Food & Staples Retailing 0.3% |
| United Natural Foods, Inc. * | | | | | 108,622 | | | | 3,791 | |
Food, Beverage & Tobacco 1.8% |
| Hansen Natural Corp. * | | | | | 309,000 | | | | 9,811 | |
| Sanderson Farms, Inc. | | | | | 15,900 | | | | 422 | |
| Wm. Wrigley Jr. Co. | | | | | 196,600 | | | | 10,213 | |
| | | | | | | | | | 20,446 | |
Health Care Equipment & Services 3.7% |
| Brookdale Senior Living, Inc. | | | | | 65,700 | | | | 3,162 | |
| Conor Medsystems, Inc. * | | | | | 612,700 | | | | 15,048 | |
| Omnicare, Inc. | | | | | 257,100 | | | | 9,739 | |
| St. Jude Medical, Inc. * | | | | | 28,600 | | | | 982 | |
| The Cooper Cos., Inc. | | | | | 230,600 | | | | 13,289 | |
| | | | | | | | | | 42,220 | |
Household & Personal Products 0.2% |
| Central Garden & Pet Co. * | | | | | 51,900 | | | | 2,593 | |
Insurance 0.3% |
| American Equity Investment Life Holding Co. | | | | | 135,700 | | | | 1,732 | |
| National Financial Partners Corp. | | | | | 47,700 | | | | 1,879 | |
| | | | | | | | | | 3,611 | |
Materials 1.9% |
| Century Aluminum Co. * | | | | | 161,900 | | | | 6,301 | |
| Coeur d’Alene Mines Corp. * | | | | | 1,757,800 | | | | 8,613 | |
| RTI International Metals, Inc. * | | | | | 112,700 | | | | 6,911 | |
| | | | | | | | | | 21,825 | |
Media 0.8% |
| Viacom, Inc., Class B * | | | | | 244,600 | | | | 9,520 | |
Pharmaceuticals & Biotechnology 2.8% |
| Adams Respiratory Therapeutics, Inc. * | | | | | 127,800 | | | | 5,508 | |
| Affymetrix, Inc. * | | | | | 615,900 | | | | 15,706 | |
| Alexion Pharmaceuticals, Inc. * | | | | | 53,000 | | | | 1,980 | |
| Amylin Pharmaceuticals, Inc. * | | | | | 79,100 | | | | 3,477 | |
| MannKind Corp. * | | | | | 3,900 | | | | 79 | |
| Par Pharmaceutical Cos., Inc. * | | | | | 270,700 | | | | 5,276 | |
| | | | | | | | | | 32,026 | |
See financial notes. 65
Schwab Hedged Equity Fund
Portfolio Holdings continued
Security
| | | | Number of
Shares | | Value
($ x 1,000) |
|---|
Real Estate 0.8% |
| The St. Joe Co. | | | | | 66,200 | | | | 3,560 | |
| Trammell Crow Co. * | | | | | 110,500 | | | | 5,387 | |
| | | | | | | | | | 8,947 | |
Retailing 5.7% |
| Borders Group, Inc. | | | | | 171,600 | | | | 3,533 | |
| Chico’s FAS, Inc. * | | | | | 20,000 | | | | 479 | |
| GameStop Corp., Class A * | | | | | 270,400 | | | | 13,807 | |
| GSI Commerce, Inc. * | | | | | 421,800 | | | | 7,605 | |
| Guitar Center, Inc. * | | | | | 64,400 | | | | 2,793 | |
| O’Reilly Automotive, Inc. * | | | | | 57,900 | | | | 1,869 | |
| Pacific Sunwear of California, Inc. * | | | | | 862,600 | | | | 15,199 | |
| Pier 1 Imports, Inc. | | | | | 197,700 | | | | 1,293 | |
| Tuesday Morning Corp. | | | | | 7,800 | | | | 129 | |
| Urban Outfitters, Inc. * | | | | | 825,100 | | | | 14,439 | |
| Zumiez, Inc. * | | | | | 97,500 | | | | 3,204 | |
| | | | | | | | | | 64,350 | |
Semiconductors & Semiconductor Equipment 0.1% |
| Tessera Technologies, Inc. * | | | | | 38,400 | | | | 1,341 | |
Software & Services 3.4% |
| eFunds Corp. * | | | | | 33,700 | | | | 836 | |
| Equinix, Inc. * | | | | | 290,600 | | | | 19,877 | |
| Heartland Payment Systems, Inc. | | | | | 12,700 | | | | 339 | |
| Kanbay International, Inc. * | | | | | 55,300 | | | | 1,571 | |
| Opsware, Inc. * | | | | | 1,003,600 | | | | 9,123 | |
| Take-Two Interactive Software, Inc. * | | | | | 331,100 | | | | 4,632 | |
| Wright Express Corp. * | | | | | 90,700 | | | | 2,482 | |
| | | | | | | | | | 38,860 | |
Technology Hardware & Equipment 0.9% |
| Daktronics, Inc. | | | | | 64,100 | | | | 1,520 | |
| Multi-Fineline Electronix, Inc. * | | | | | 57,900 | | | | 1,398 | |
| Plantronics, Inc. | | | | | 97,300 | | | | 2,054 | |
| Powerwave Technologies, Inc. * | | | �� | | 865,400 | | | | 5,634 | |
| | | | | | | | | | 10,606 | |
Telecommunication Services 1.3% |
| NII Holdings, Inc. * | | | | | 232,900 | | | | 15,146 | |
Transportation 1.2% |
| AirTran Holdings, Inc. * | | | | | 316,000 | | | | 3,150 | |
| Genesee & Wyoming, Inc. * | | | | | 9,900 | | | | 278 | |
| Werner Enterprises, Inc. | | | | | 519,500 | | | | 9,533 | |
| | | | | | | | | | 12,961 | |
Utilities 2.3% |
| Consolidated Edison, Inc. | | | | | 237,200 | | | | 11,469 | |
| Equitable Resources, Inc. | | | | | 325,700 | | | | 13,197 | |
| Piedmont Natural Gas Co., Inc. | | | | | 34,200 | | | | 924 | |
| South Jersey Industries, Inc. | | | | | 5,600 | | | | 173 | |
| | | | | | | | | | 25,763 | |
End of Short Sale Positions.| * | | Non-income producing security. |
66 See financial notes.
Schwab Hedged Equity Fund
Statement of
Assets and Liabilities
As of October 31, 2006. All numbers x 1,000 except NAV.
Assets |
| Investments, at value (cost $1,029,078) | | | | $ | 1,160,723 | |
| Deposits with broker for short sales | | | | | 428,404 | |
Receivables:
| | | | | | |
| Investments sold | | | | | 49,278 | |
| Fund shares sold | | | | | 7,891 | |
| Dividends | | | | | 818 | |
| Interest | | | | | 59 | |
| Prepaid expenses | | | | + | 4 | |
Total assets | | | | | 1,647,177 | |
| |
Liabilities |
| Securities sold short, at value (proceeds $455,082) | | | | | 466,145 | |
Payables:
| | | | | | |
| Investments bought | | | | | 42,424 | |
| Investment adviser and administrator fees | | | | | 142 | |
| Transfer agent and shareholder services fees | | | | | 9 | |
| Fund shares redeemed | | | | | 431 | |
| Dividends on short sales | | | | | 84 | |
| Trustee fees | | | | | 1 | |
| Accrued expenses | | | | + | 58 | |
Total liabilities | | | | | 509,294 | |
| |
Net Assets |
Total assets | | | | | 1,647,177 | |
Total liabilities | | | | | –509,294 | |
Net assets | | | | $ | 1,137,883 | |
| |
Net Assets by Source | | | | | | |
| Capital received from investors | | | | | 1,035,573 | |
| Net investment income not yet distributed | | | | | 4,267 | |
| Net realized capital losses | | | | | (22,539 | ) |
| Net unrealized capital gains | | | | | 120,582 | |
| |
Net Asset Value (NAV) by Shares Class | | | | | | |
Share Class
| | | | Net Assets | | ÷ | | Shares
Outstanding | | = | | NAV |
|---|
| Investor Shares | | | | $ | 207,174 | | | | | | | | 12,985 | | | | | | | $ | 15.95 | |
| Select Shares | | | | $ | 930,709 | | | | | | | | 58,228 | | | | | | | $ | 15.98 | |
See financial notes. 67
Schwab Hedged Equity Fund
Statement of
Operations
For November 1, 2005 through October 31, 2006. All numbers x 1,000.
Investment Income |
| Dividends | | | | $ | 7,889 | |
| Interest | | | | + | 10,315 | |
Total investment income | | | | | 18,204 | |
| |
Net Realized Gains and Losses |
| Net realized losses on investments | | | | | (22,810 | ) |
| Net realized gains on futures contracts | | | | + | 336 | |
Net realized losses | | | | | (22,474 | ) |
| |
Net Unrealized Gains and Losses |
| Net unrealized gains on investments | | | | | 116,907 | |
| Net unrealized losses on short sales | | | | + | (14,684 | ) |
Net unrealized gains | | | | | 102,223 | |
| |
Expenses |
| Investment adviser and administrator fees | | | | | 11,335 | |
Transfer agent and shareholder service fees:
| | | | | | |
| Investor Shares | | | | | 269 | |
| Select Shares | | | | | 585 | |
| Registration fees | | | | | 247 | |
| Custodian fees | | | | | 89 | |
| Interest expense | | | | | 60 | |
| Portfolio accounting fees | | | | | 47 | |
| Professional fees | | | | | 45 | |
| Overdraft expense | | | | | 35 | |
| Shareholder reports | | | | | 29 | |
| Trustees’ fees | | | | | 10 | |
| Dividends on short sales | | | | + | 832 | |
| Other expenses | | | | + | 10 | |
| Total expenses | | | | | 13,593 | |
| Expense reduction by adviser and Schwab | | | | | –355 | |
| Custody credit | | | | | –69 | |
Net expenses | | | | | 13,169 | |
| |
Increase in Net Assets from Operations |
Total investment income | | | | | 18,204 | |
Net expenses | | | | | –13,169 | |
Net investment income | | | | | 5,035 | |
Net realized losses | | | | | (22,474 | ) |
Net unrealized gains | | | | + | 102,223 | |
Increase in net assets from operations | | | | $ | 84,784 | |
68 See financial notes.
Schwab Hedged Equity Fund
Statement of
Changes in Net Assets
For the current and prior report periods. All numbers x 1,000.
| | | | 11/1/05–10/31/06 | | 11/1/04–10/31/05 |
|---|
| Net investment income | | | | $ | 5,035 | | | $ | 743 | |
| Net realized gains or losses | | | | | (22,474 | ) | | | 7,920 | |
| Net unrealized gains | | | | + | 102,223 | | | | 9,230 | |
Increase in net assets from operations | | | | | 84,784 | | | | 17,893 | |
| |
Distributions Paid |
Dividends from net investment income | | | | | | | | | | |
| Investor Shares | | | | | 185 | | | | — | |
| Select Shares | | | | + | 1,326 | | | | — | |
Total dividends from net investment income | | | | | 1,511 | | | | — | |
| | | | | | | | | | | |
Distributions from net realized gains | | | | | | | | | | |
| Investor Shares | | | | | 1,058 | | | | — | |
| Select Shares | | | | + | 6,701 | | | | 3,789 | |
Total distributions from net realized gains | | | | | 7,759 | | | | 3,789 | |
| | | | | | | | | | | |
Total distributions | | | | $ | 9,270 | | | $ | 3,789 | |
| | | | | | | | | | | |
Transactions in Fund Shares |
| | | | 11/1/05–10/31/06 | | 11/1/04–10/31/05 | |
|---|
| | | | SHARES | | VALUE | | SHARES | | VALUE |
|---|
Shares Sold | | | | | | | | | | | | | | | | | | |
| Investor Shares | | | | | 14,290 | | | $ | 215,250 | | | | 2,530 | | | $ | 35,429 | |
| Select Shares | | | | + | 54,075 | | | | 813,417 | | | | 11,743 | | | | 163,791 | |
Total shares sold | | | | | 68,365 | | | $ | 1,028,667 | | | | 14,273 | | | $ | 199,220 | |
| | | | | | | | | | | | | | | | | | | |
Shares Reinvested | | | | | | | | | | | | | | | | | | |
| Investor Shares | | | | | 75 | | | $ | 1,100 | | | | — | | | $ | — | |
| Select Shares | | | | + | 475 | | | | 6,957 | | | | 255 | | | | 3,389 | |
Total shares reinvested | | | | | 550 | | | $ | 8,057 | | | | 255 | | | $ | 3,389 | |
| | | | | | | | | | | | | | | | | | | |
Shares Redeemed | | | | | | | | | | | | | | | | | | |
| Investor Shares | | | | | (3,696 | ) | | $ | (55,379 | ) | | | (214 | ) | | $ | (3,027 | ) |
| Select Shares | | | | + | (12,150 | ) | | | (181,325 | ) | | | (1,421 | ) | | | (19,628 | ) |
Total shares redeemed | | | | | (15,846 | ) | | $ | (236,704 | ) | | | (1,635 | ) | | $ | (22,655 | ) |
| | | | | | | | | | | | | | | | | | | |
Net transactions in fund shares | | | | | 53,069 | | | $ | 800,020 | | | | 12,893 | | | $ | 179,954 | |
| | | | | | | | | | | | | | | | | | | |
Shares Outstanding and Net Assets |
| | | | 11/1/05–10/31/06 | | 11/1/04–10/31/05 | |
|---|
| | | | SHARES | | NET ASSETS | | SHARES | | NET ASSETS |
|---|
| Beginning of period | | | | | 18,144 | | | $ | 262,349 | | | | 5,251 | | | $ | 68,291 | |
| Total increase | | | | + | 53,069 | | | | 875,534 | | | | 12,893 | | | | 194,058 | |
End of period | | | | | 71,213 | | | $ | 1,137,883 | | | | 18,144 | | | $ | 262,349 | |
Net investment income not yet distributed | | | | | | | | $ | 4,267 | | | | | | | $ | 743 | |
See financial notes. 69
Schwab Financial Services Fund™
Financial Statements
Financial Highlights
| | | | 11/1/05—
10/31/06 | | 11/1/04—
10/31/05 | | 11/1/03—
10/31/04 | | 11/1/02—
10/31/03 | | 11/1/01—
10/31/02 |
|---|
Per-Share Data ($) |
| Net asset value at beginning of period | | | | | 14.42 | | | | 13.12 | | | | 11.77 | | | | 9.44 | | | | 9.75 | |
Income or loss from investment operations:
| | | | | | | | | | | | | | | | | | | | | | |
| Net investment income | | | | | 0.10 | | | | 0.12 | | | | 0.08 | | | | 0.11 | | | | 0.12 | |
| Net realized and unrealized gains or losses | | | | | 1.98 | | | | 2.21 | | | | 1.37 | | | | 2.37 | | | | (0.28 | ) |
| Total income or loss from investment operations | | | | | 2.08 | | | | 2.33 | | | | 1.45 | | | | 2.48 | | | | (0.16 | ) |
Less distributions:
| | | | | | | | | | | | | | | | | | | | | | |
| Dividends from net investment income | | | | | (0.11 | ) | | | (0.09 | ) | | | (0.10 | ) | | | (0.15 | ) | | | (0.09 | ) |
| Distributions from net reallized gains | | | | | (0.64 | ) | | | (0.94 | ) | | | — | | | | — | | | | (0.06 | ) |
| Total distributions | | | | | (0.75 | ) | | | (1.03 | ) | | | (0.10 | ) | | | (0.15 | ) | | | (0.15 | ) |
| Net asset value at end of period | | | | | 15.75 | | | | 14.42 | | | | 13.12 | | | | 11.77 | | | | 9.44 | |
| Total return (%) | | | | | 14.85 | | | | 18.62 | | | | 12.39 | | | | 26.68 | | | | (1.78 | ) |
| |
Ratios/Supplemental Data (%) |
Ratios to average net assets:
| | | | | | | | | | | | | | | | | | | | | | |
| Net operating expenses | | | | | 0.98 | | | | 1.07 | | | | 1.05 | | | | 1.04 | 1 | | | 0.89 | |
| Gross operating expenses | | | | | 0.98 | | | | 1.15 | | | | 1.25 | | | | 1.49 | | | | 1.32 | |
| Net investment income | | | | | 0.87 | | | | 1.01 | | | | 0.62 | | | | 1.05 | | | | 1.20 | |
| Portfolio turnover rate | | | | | 57 | | | | 74 | | | | 85 | | | | 181 | | | | 131 | |
| Net assets, end of period ($ x 1,000,000) | | | | | 95 | | | | 29 | | | | 20 | | | | 18 | | | | 17 | |
1 The ratio of net operating expenses would have been 1.03% if interest expense had not been included.
70 See financial notes.
Schwab Financial Services Fund
Portfolio Holdings as of October 31, 2006
This section shows all the securities in the fund’s portfolio and their value as of the report date.
The fund files its complete schedule of portfolio holdings with the SEC for the first and third quarters of each fiscal year on Form N-Q. The fund’s Form N-Q is available on the SEC’s website at http://www.sec.gov and may be viewed and copied at the SEC’s Public Reference Room in Washington, D.C. Call 1-800-SEC-0330 for information on the operation of the Public Reference Room. The schedule of portfolio holdings filed on a fund’s most recent Form N-Q is also available by visiting Schwab’s website at www.schwab.com/schwabfunds.
Holdings by Category
|
| Cost
($ x 1,000)
|
| Value
($ x 1,000)
|
|
|---|
99.4% | | | | Common Stock | | | 84,964 | | | | 94,722 | |
0.9% | | | | Short-Term Investment | | | 835 | | | | 835 | |
0.1% | | | | U.S. Government Security | | | 90 | | | | 90 | |
100.4% | | | | Total Investments | | | 85,889 | | | | 95,647 | |
1.4% | | | | Collateral Invested for Securities on Loan | | | 1,323 | | | | 1,323 | |
(1.8)% | | | | Other Assets and Liabilities, Net | | | | | | | (1,713 | ) |
100.0% | | | | Total Net Assets | | | | | | | 95,257 | |
Security
| | | | Number
of Shares | | Value
($ x 1,000) |
|---|
Common Stock 99.4% of net assets |
Banks 24.2% |
| 1st Source Corp. | | | | | 11,000 | | | | 347 | |
| BancFirst Corp. | | | | | 4,000 | | | | 199 | |
| BancorpSouth, Inc. | | | | | 9,400 | | | | 240 | |
| Bank of Hawaii Corp. | | | | | 52,300 | | | | 2,729 | |
| Comerica, Inc. | | | | | 77,100 | | | | 4,487 | |
| Commerce Bancshares, Inc. | | | | | 46,360 | | | | 2,295 | |
| KeyCorp | | | | | 93,900 | | | | 3,487 | |
| PNC Financial Services Group, Inc. | | | | | 48,700 | | | | 3,411 | |
| Radian Group, Inc. | | | | | 72,200 | | | | 3,848 | |
Regions Financial Corp. (a) | | | | | 22,500 | | | | 854 | |
| Whitney Holding Corp. | | | | | 34,700 | | | | 1,133 | |
| | | | | | | | | | 23,030 | |
Diversified Financials 44.9% |
| A.G. Edwards, Inc. | | | | | 32,100 | | | | 1,831 | |
| American Express Co. | | | | | 81,500 | | | | 4,711 | |
| AmeriCredit Corp. * | | | | | 84,700 | | | | 2,166 | |
| Ameriprise Financial, Inc. | | | | | 55,400 | | | | 2,853 | |
| Bank of America Corp. | | | | | 86,200 | | | | 4,644 | |
| CIT Group, Inc. | | | | | 23,800 | | | | 1,239 | |
| Franklin Resources, Inc. | | | | | 42,900 | | | | 4,889 | |
| Investment Technology Group, Inc. * | | | | | 48,500 | | | | 2,265 | |
| JPMorgan Chase & Co. | | | | | 97,600 | | | | 4,630 | |
| Mellon Financial Corp. | | | | | 117,500 | | | | 4,559 | |
| Merrill Lynch & Co., Inc. | | | | | 21,500 | | | | 1,879 | |
| Morgan Stanley | | | | | 2,500 | | | | 191 | |
| Northern Trust Corp. | | | | | 72,900 | | | | 4,281 | |
| State Street Corp. | | | | | 40,900 | | | | 2,627 | |
| | | | | | | | | | 42,765 | |
Insurance 28.5% |
| AFLAC, Inc. | | | | | 13,600 | | | | 611 | |
| American Financial Group, Inc. | | | | | 14,500 | | | | 694 | |
| American Physicians Capital, Inc. * | | | | | 5,500 | | | | 301 | |
AON Corp. (a) | | | | | 14,400 | | | | 501 | |
| Assurant, Inc. | | | | | 17,100 | | | | 900 | |
| Genworth Financial, Inc., Class A | | | | | 117,700 | | | | 3,936 | |
| HCC Insurance Holdings, Inc. | | | | | 9,100 | | | | 306 | |
| Lincoln National Corp. | | | | | 10,200 | | | | 646 | |
| Loews Corp. | | | | | 97,100 | | | | 3,779 | |
| MetLife, Inc. | | | | | 74,900 | | | | 4,279 | |
| Nationwide Financial Services, Inc., Class A | | | | | 41,000 | | | | 2,088 | |
| Principal Financial Group, Inc. | | | | | 67,000 | | | | 3,785 | |
| Prudential Financial, Inc. | | | | | 6,100 | | | | 469 | |
| SAFECO Corp. | | | | | 10,600 | | | | 617 | |
| StanCorp Financial Group, Inc. | | | | | 3,800 | | | | 174 | |
| The Allstate Corp. | | | | | 2,100 | | | | 129 | |
| The Chubb Corp. | | | | | 47,400 | | | | 2,519 | |
| The Hartford Financial Services Group, Inc. | | | | | 8,700 | | | | 758 | |
| W. R. Berkley Corp. | | | | | 19,125 | | | | 705 | |
| | | | | | | | | | 27,197 | |
Real Estate 1.8% |
| CB Richard Ellis Group, Inc., Class A * | | | | | 57,600 | | | | 1,730 | |
Security
Rate, Maturity Date
| | | | Face
Amount
($ x 1,000) | | Value
($ x 1,000) |
|---|
Short-Term Investment 0.9% of net assets |
| |
JP Morgan, Grand Cayman Time
Deposit 4.71%, 11/01/06 | | | | | 835 | | | | 835 | |
U.S. Government Security 0.1% of net assets |
| |
U.S. Treasury Bill
4.90%, 12/14/06 | | | | | 90 | | | | 90 | |
Security
| | | | Number
of Shares | | Value
($ x 1,000) |
|---|
Collateral Invested for Securities on Loan 1.4% of net assets |
| |
Securities Lending Investments
Fund, a series of the Brown
Brothers Investment Trust | | | | | 1,323,369 | | | | 1,323 | |
End of collateral invested for securities on loan.At 10-31-06 the tax basis cost of the fund’s investments was $85,934 and the unrealized appreciation and depreciation were $10,683 and ($970), respectively, with a net unrealized appreciation of $9,713.
| * | | Non-income producing security. |
| (a) | | All or a portion of this security is on loan. |
See financial notes. 71
Schwab Financial Services Fund
Statement of
Assets and Liabilities
As of October 31, 2006. All numbers x 1,000 except NAV.
Assets |
| Investments, at value including securities on loan of $1,287 (cost $85,889) | | | | $ | 95,647 | |
| Collateral invested for securities on loan | | | | | 1,323 | |
Receivables:
| | | | | | |
| Investments sold | | | | | 1,827 | |
| Fund shares sold | | | | | 678 | |
| Dividends | | | | | 48 | |
| Prepaid expenses | | | | + | 1 | |
Total assets | | | | | 99,524 | |
| |
Liabilities |
| Collateral for securities on loan | | | | | 1,323 | |
Payables:
| | | | | | |
| Investments bought | | | | | 2,886 | |
| Investment adviser and administrator fees | | | | | 5 | |
| Transfer agent and shareholder services fees | | | | | 2 | |
| Fund shares redeemed | | | | | 22 | |
| Trustee fees | | | | | 1 | |
| Accrued expenses | | | | + | 28 | |
Total liabilities | | | | | 4,267 | |
| |
Net Assets |
Total assets | | | | | 99,524 | |
Total liabilities | | | | | –4,267 | |
Net assets | | | | $ | 95,257 | |
| |
Net Assets by Source | | | | | | |
| Capital received from investors | | | | | 83,851 | |
| Net investment income not yet distributed | | | | | 465 | |
| Net realized capital gains | | | | | 1,183 | |
| Net unrealized capital gains | | | | | 9,758 | |
| |
Net Asset Value (NAV) | | | | | | |
Net Assets
| | | | ÷ | | Shares
Outstanding | | = | | NAV |
|---|
| $95,257 | | | | | | | | | 6,047 | | | | | | | $ | 15.75 | |
72 See financial notes.
Schwab Financial Services Fund
Statement of
Operations
For November 1, 2005 through October 31, 2006. All numbers x 1,000.
Investment Income |
| Dividends | | | | $ | 1,131 | |
| Interest | | | | + | 56 | |
Total Investment Income | | | | | 1,187 | |
| |
Net Realized Gains and Losses |
| Net realized gains on investments | | | | | 1,065 | |
| Net realized gains on futures contracts | | | | + | 123 | |
Net realized gains | | | | | 1,188 | |
| |
Net Unrealized Gains and Losses |
Net unrealized gains on investments | | | | | 5,742 | |
| |
Expenses |
| Investment adviser and administrator fees | | | | | 346 | |
| Transfer agent and shareholder service fees | | | | | 160 | |
| Registration fees | | | | | 44 | |
| Portfolio accounting fees | | | | | 29 | |
| Professional fees | | | | | 27 | |
| Trustees’ fees | | | | | 7 | |
| Custodian fees | | | | | 6 | |
| Shareholder reports | | | | | 4 | |
| Other expenses | | | | + | 7 | |
Total expenses | | | | | 630 | |
| |
Increase in Net Assets from Operations |
Total investment income | | | | | 1,187 | |
Net expenses | | | | | –630 | |
Net investment income | | | | | 557 | |
Net realized gains | | | | | 1,188 | |
Net unrealized gains | | | | + | 5,742 | |
Increase in net assets from operations | | | | $ | 7,487 | |
See financial notes. 73
Schwab Financial Services Fund
Statement of
Changes in Net Assets
For the current and prior report periods. All numbers x 1,000.
| | | | 11/1/05—10/31/06 | | 11/1/04—10/31/05 |
|---|
| Net investment income | | | | $ | 557 | | | $ | 224 | |
| Net realized gains | | | | | 1,188 | | | | 1,583 | |
| Net unrealized gains | | | | + | 5,742 | | | | 1,980 | |
Increase in net assets from operations | | | | | 7,487 | | | | 3,787 | |
| | | | | | | | | | | |
Distributions Paid |
| Dividends from net investment income | | | | | 264 | | | | 139 | |
| Distribution from net realized gains | | | | + | 1,580 | | | | 1,403 | |
Total dividends and distributions paid | | | | $ | 1,844 | | | $ | 1,542 | |
| | | | | | | | | | | |
Transactions in Fund Shares |
| | | | 11/1/05–10/31/06 | | 11/1/04–10/31/05 | |
|---|
| | | | SHARES | | VALUE | | SHARES | | VALUE |
|---|
| Shares Sold | | | | | 5,038 | | | $ | 75,696 | | | | 885 | | | $ | 11,993 | |
| Shares Reinvested | | | | | 114 | | | | 1,645 | | | | 103 | | | | 1,356 | |
| Shares Redeemed | | | | + | (1,089 | ) | | | (16,334 | ) | | | (495 | ) | | | (6,547 | ) |
Net transactions in fund shares | | | | $ | 4,063 | | | $ | 61,007 | | | | 493 | | | $ | 6,802 | |
| | | | | | | | | | | | | | | | | | | |
Shares Outstanding and Net Assets |
| | | | 11/1/05–10/31/06 | | 11/1/04–10/31/05 | |
|---|
| | | | SHARES | | NET ASSETS | | SHARES | | NET ASSETS |
|---|
| Beginning of period | | | | | 1,984 | | | $ | 28,607 | | | | 1,491 | | | $ | 19,560 | |
| Total increase | | | | + | 4,063 | | | | 66,650 | | | | 493 | | | | 9,047 | |
End of period | | | | | 6,047 | | | $ | 95,257 | | | | 1,984 | | | $ | 28,607 | |
Net investment income not yet distributed | | | | | | | | $ | 465 | | | | | | | $ | 172 | |
74 See financial notes.
Schwab Health Care Fund™
Financial Statements
Financial Highlights
| | | | 11/1/05—
10/31/06 | | 11/1/04—
10/31/05 | | 11/1/03—
10/31/04 | | 11/1/02—
10/31/03 | | 11/1/01—
10/31/02 |
|---|
Per-Share Data ($) |
| Net asset value at beginning of period | | | | | 14.03 | | | | 10.78 | | | | 8.43 | | | | 7.12 | | | | 9.00 | |
Income or loss from investment operations:
| | | | | | | | | | | | | | | | | | | | | | |
| Net investment income or loss | | | | | (0.01 | ) | | | (0.02 | ) | | | (0.06 | ) | | | 0.01 | | | | 0.03 | |
| Net realized and unrealized gains or losses | | | | | 1.03 | | | | 3.27 | | | | 2.41 | | | | 1.33 | | | | (1.90 | ) |
| Total income or loss from investment operations | | | | | 1.02 | | | | 3.25 | | | | 2.35 | | | | 1.34 | | | | (1.87 | ) |
Less distributions:
| | | | | | | | | | | | | | | | | | | | | | |
| Dividends from net investment income | | | | | — | | | | — | | | | — | | | | (0.03 | ) | | | (0.01 | ) |
| Net asset value at end of period | | | | | 15.05 | | | | 14.03 | | | | 10.78 | | | | 8.43 | | | | 7.12 | |
| Total return (%) | | | | | 7.27 | | | | 30.15 | | | | 27.88 | | | | 18.96 | | | | (20.84 | ) |
| |
Ratios/Supplemental Data (%) |
Ratios to average net assets:
| | | | | | | | | | | | | | | | | | | | | | |
| Net operating expenses | | | | | 0.84 | | | | 0.89 | | | | 1.04 | | | | 1.04 | | | | 0.89 | |
| Gross operating expenses | | | | | 0.84 | | | | 0.89 | | | | 1.07 | | | | 1.34 | | | | 1.18 | |
| Net investment income or loss | | | | | (0.07 | ) | | | (0.28 | ) | | | (0.73 | ) | | | 0.13 | | | | 0.25 | |
| Portfolio turnover rate | | | | | 76 | | | | 42 | | | | 105 | | | | 200 | | | | 99 | |
| Net assets, end of period ($ x 1,000,000) | | | | | 611 | | | | 397 | | | | 54 | | | | 25 | | | | 21 | |
See financial notes. 75
Schwab Health Care Fund
Portfolio Holdings as of October 31, 2006
This section shows all the securities in the fund’s portfolio and their value as of the report date.
The fund files its complete schedule of portfolio holdings with the SEC for the first and third quarters of each fiscal year on Form N-Q. The fund’s Form N-Q is available on the SEC’s website at http://www.sec.gov and may be viewed and copied at the SEC’s Public Reference Room in Washington, D.C. Call 1-800-SEC-0330 for information on the operation of the Public Reference Room. The schedule of portfolio holdings filed on a fund’s most recent Form N-Q is also available by visiting Schwab’s website at www.schwab.com/schwabfunds.
Holdings by Category
|
| Cost
($ x 1,000)
|
| Value
($ x 1,000)
|
|
|---|
98.2% | | | | Common Stock | | | 541,165 | | | | 600,068 | |
—% | | | | Rights | | | — | | | | — | |
1.5% | | | | Short-Term Investment | | | 9,533 | | | | 9,533 | |
0.1% | | | | U.S. Treasury Obligation | | | 308 | | | | 308 | |
99.8% | | | | Total Investments | | | 551,006 | | | | 609,909 | |
2.7% | | | | Collateral Invested for Securities on Loan | | | 16,729 | | | | 16,729 | |
(2.5)% | | | | Other Assets and Liabilities, Net | | | | | | | (15,387 | ) |
100.0% | | | | Total Net Assets | | | | | | | 611,251 | |
Security
| | | | Number
of Shares | | Value
($ x 1,000) |
|---|
Common Stock 98.2% of net assets |
Health Care Equipment & Services 42.6% |
| Aetna, Inc. | | | | | 400,000 | | | | 16,488 | |
| Alliance Imaging, Inc. * | | | | | 5,800 | | | | 49 | |
AmerisourceBergen Corp. (b) | | | | | 553,800 | | | | 26,139 | |
| Baxter International, Inc. | | | | | 446,300 | | | | 20,516 | |
Becton Dickinson & Co. (b) | | | | | 416,600 | | | | 29,175 | |
| Caremark Rx, Inc. | | | | | 100,000 | | | | 4,923 | |
Cerner Corp. (a)* | | | | | 208,000 | | | | 10,048 | |
CIGNA Corp. (b) | | | | | 180,000 | | | | 21,056 | |
| CorVel Corp. * | | | | | 8,800 | | | | 381 | |
| Dade Behring Holdings, Inc. | | | | | 240,000 | | | | 8,743 | |
| Dentsply International, Inc. | | | | | 302,400 | | | | 9,459 | |
| Edwards Lifesciences Corp. * | | | | | 50,000 | | | | 2,147 | |
| Express Scripts, Inc. * | | | | | 157,000 | | | | 10,004 | |
Humana, Inc. (a)* | | | | | 124,300 | | | | 7,458 | |
| IMS Health, Inc. | | | | | 531,000 | | | | 14,788 | |
| Laboratory Corp. of America Holdings * | | | | | 43,200 | | | | 2,959 | |
| Magellan Health Services, Inc. * | | | | | 161,800 | | | | 7,061 | |
| McKesson Corp. | | | | | 498,200 | | | | 24,955 | |
| MedCath Corp. * | | | | | 42,300 | | | | 1,121 | |
Mentor Corp. (a) | | | | | 100,000 | | | | 4,680 | |
| PDI, Inc. * | | | | | 15,000 | | | | 155 | |
| Sierra Health Services, Inc. * | | | | | 630,500 | | | | 21,588 | |
| WellPoint, Inc. * | | | | | 200,100 | | | | 15,272 | |
| Zoll Medical Corp. * | | | | | 35,000 | | | | 1,355 | |
| | | | | | | | | | 260,520 | |
Pharmaceuticals & Biotechnology 55.6% |
| Accelrys, Inc. * | | | | | 140,000 | | | | 882 | |
| Allergan, Inc. | | | | | 89,000 | | | | 10,279 | |
| Alpharma, Inc., Class A | | | | | 719,300 | | | | 15,875 | |
| Amgen, Inc. * | | | | | 125,000 | | | | 9,489 | |
| Applied Biosystems Group — Applera Corp. | | | | | 953,800 | | | | 35,577 | |
| Barr Pharmaceuticals, Inc. * | | | | | 269,600 | | | | 14,119 | |
Biogen Idec, Inc. (b)* | | | | | 450,800 | | | | 21,458 | |
| Bristol-Myers Squibb Co. | | | | | 225,000 | | | | 5,569 | |
| Bruker BioSciences Corp. * | | | | | 150,000 | | | | 1,194 | |
Enzon Pharmaceuticals, Inc. (a)* | | | | | 80,000 | | | | 685 | |
| Forest Laboratories, Inc. * | | | | | 303,900 | | | | 14,873 | |
| Gilead Sciences, Inc. * | | | | | 220,000 | | | | 15,158 | |
Johnson & Johnson (b) | | | | | 442,200 | | | | 29,804 | |
| King Pharmaceuticals, Inc. * | | | | | 1,400,000 | | | | 23,422 | |
| Maxygen, Inc. * | | | | | 2,500 | | | | 21 | |
Merck & Co., Inc. (b) | | | | | 741,100 | | | | 33,661 | |
| Millennium Pharmaceuticals, Inc. * | | | | | 525,000 | | | | 6,143 | |
| PerkinElmer, Inc. | | | | | 575,000 | | | | 12,282 | |
| Pfizer, Inc. | | | | | 1,120,000 | | | | 29,848 | |
| Regeneron Pharmaceuticals, Inc. * | | | | | 20,000 | | | | 401 | |
| Schering-Plough Corp. | | | | | 1,100,000 | | | | 24,354 | |
| Waters Corp. * | | | | | 78,000 | | | | 3,884 | |
| Watson Pharmaceuticals, Inc. * | | | | | 690,000 | | | | 18,568 | |
| Wyeth | | | | | 235,200 | | | | 12,002 | |
| | | | | | | | | | 339,548 | |
Rights 0.0% of net assets |
Pharmaceuticals & Biotechnology 0.0% |
| OSI Pharmaceuticals, Inc. * | | | | | 458 | | | | — | |
Security
Rate, Maturity Date
| | | | Face
Amount
($ x 1,000) | | Value
($ x 1,000) |
|---|
Short-Term Investment 1.5% of net assets |
| |
Wells Fargo, Grand Cayman
Time Deposit
4.71%, 11/01/06 | | | | | 9,533 | | | | 9,533 | |
U.S. Treasury Obligation 0.1% of net assets |
| |
U.S. Treasury Bill
4.90%, 12/14/06 | | | | | 308 | | | | 308 | |
76 See financial notes.
Schwab Health Care Fund
Portfolio Holdings continued
Security
| | | | Number
of Shares | | Value
($ x 1,000) |
|---|
Collateral Invested for Securities on Loan 2.7% of net assets |
| |
Securities Lending Investment
Fund, a series of the Brown
Brothers Investment Trust | | | | | 16,729,401 | | | | 16,729 | |
End of collateral invested for securities on loan.At 10-31-06 the tax basis cost of the fund’s investments was $551,398, and the unrealized appreciation and depreciation were $67,712 and ($9,201), respectively, with a net unrealized appreciation of $58,511.
In addition to the above, the fund held the following at 10-31-06. All numbers are x 1,000 except number of futures contracts.
| | | | Number of
Contracts | | Contract
Value | | Unrealized
Gains |
|---|
|
S&P 500 Index, e-mini, Long,
expires 12/15/06 | | | | | 90 | | | | 6,224 | | | | 321 | |
| * | | Non-income producing security. |
(a) | | All or a portion of this security is on loan. |
(b) | | All or a portion of this security is held as collateral for open futures contracts. |
See financial notes. 77
Schwab Health Care Fund
Statement of
Assets and Liabilities
As of October 31, 2006. All numbers x 1,000 except NAV.
Assets |
| Investments, at value including securities on loan of $16,264 (cost $551,006) | | | | $ | 609,909 | |
| Collateral invested for securities on loan | | | | | 16,729 | |
Receivables:
| | | | | | |
| Fund shares sold | | | | | 1,909 | |
| Dividends | | | | | 119 | |
| Interest | | | | | 1 | |
| Income from securities on loan | | | | | 1 | |
| Prepaid expenses | | | | + | 4 | |
Total assets | | | | | 628,672 | |
| |
Liabilities |
| Collateral for securities on loan | | | | | 16,729 | |
Payables:
| | | | | | |
| Investment adviser and administrator fees | | | | | 27 | |
| Transfer agent and shareholder services fees | | | | | 13 | |
| Fund shares redeemed | | | | | 581 | |
| Trustee fees | | | | | 1 | |
| Accrued expenses | | | | + | 70 | |
Total liabilities | | | | | 17,421 | |
| |
Net Assets |
Total assets | | | | | 628,672 | |
Total liabilities | | | | | –17,421 | |
Net assets | | | | $ | 611,251 | |
| |
Net Assets by Source | | | | | | |
| Capital received from investors | | | | | 547,464 | |
| Net realized capital gains | | | | | 4,563 | |
| Net unrealized capital gains | | | | | 59,224 | |
| |
Net Asset Value (NAV) | | | | | | |
Net Assets
| | | | ÷ | | Shares
Outstanding | | = | | NAV |
|---|
| $611,251 | | | | | | | | | 40,625 | | | | | | | $ | 15.05 | |
78 See financial notes.
Schwab Health Care Fund
Statement of
Operations
For November 1, 2005 through October 31, 2006. All numbers x 1,000.
Investment Income |
| Dividends | | | | $ | 3,933 | |
| Interest | | | | | 348 | |
| Securities on loan | | | | + | 35 | |
Total Investment Income | | | | | 4,316 | |
| |
Net Realized Gains and Losses |
| Net realized gains on investments | | | | | 8,791 | |
| Net realized gains on futures contracts | | | | + | 166 | |
Net realized gains | | | | | 8,957 | |
| |
Net Unrealized Gains and Losses |
| Net unrealized gains on investments | | | | | 18,727 | |
| Net unrealized gains on futures contracts | | | | + | 321 | |
Net unrealized gains | | | | | 19,048 | |
| |
Expenses |
| Investment adviser and administrator fees | | | | | 3,020 | |
| Transfer agent and shareholder service fees | | | | | 1,406 | |
| Registration fees | | | | | 122 | |
| Portfolio accounting fees | | | | | 45 | |
| Shareholder reports | | | | | 42 | |
| Custodian fees | | | | | 32 | |
| Professional fees | | | | | 27 | |
| Trustees’ fees | | | | | 10 | |
| Overdraft expense | | | | | 5 | |
| Other expenses | | | | + | 11 | |
Total expenses | | | | | 4,720 | |
| |
Increase in Net Assets from Operations |
Total investment income | | | | | 4,316 | |
Net expenses | | | | | –4,720 | |
Net investment loss | | | | | (404 | ) |
Net realized gains | | | | | 8,957 | |
Net unrealized gains | | | | + | 19,048 | |
Increase in net assets from operations | | | | $ | 27,601 | |
See financial notes. 79
Schwab Health Care Fund
Statement of
Changes in Net Assets
For the current and prior report periods. All numbers x 1,000.
| | | | 11/1/05–10/31/06 | | 11/1/04–10/31/05 |
|---|
| Net investment loss | | | | $ | (404 | ) | | $ | (536 | ) |
| Net realized gains | | | | | 8,957 | | | | 317 | |
| Net unrealized gains | | | | + | 19,048 | | | | 33,870 | |
Increase in net assets from operations | | | | $ | 27,601 | | | $ | 33,651 | |
| | | | | | | | | | | |
Transactions in Fund Shares |
| | | | 11/1/05–10/31/06 | | 11/1/04–10/31/05 | |
|---|
| | | | SHARES | | VALUE | | SHARES | | VALUE |
|---|
| Shares Sold | | | | | 26,841 | | | $ | 397,961 | | | | 25,580 | | | $ | 339,672 | |
| Shares Redeemed | | | | + | (14,502 | ) | | | (211,167 | ) | | | (2,299 | ) | | | (30,399 | ) |
Net transactions in fund shares | | | | | 12,339 | | | $ | 186,794 | | | | 23,281 | | | $ | 309,273 | |
| | | | | | | | | | | | | | | | | | | |
Shares Outstanding and Net Assets |
| | | | 11/1/05–10/31/06 | | 11/1/04–10/31/05 | |
|---|
| | | | SHARES | | NET ASSETS | | SHARES | | NET ASSETS |
|---|
| Beginning of period | | | | | 28,286 | | | $ | 396,856 | | | | 5,005 | | | $ | 53,932 | |
| Total increase | | | | + | 12,339 | | | | 214,395 | | | | 23,281 | | | | 342,924 | |
End of period | | | | | 40,625 | | | $ | 611,251 | | | | 28,286 | | | $ | 396,856 | |
80 See financial notes.
Schwab Technology Fund™
Financial Statements
Financial Highlights
| | | | 11/1/05—
10/31/06 | | 11/1/04—
10/31/05 | | 11/1/03—
10/31/04 | | 11/1/02—
10/31/03 | | 11/1/01—
10/31/02 |
|---|
Per-Share Data ($) |
| Net asset value at beginning of period | | | | | 4.88 | | | | 4.42 | | | | 4.32 | | | | 2.90 | | | | 3.86 | |
Income or loss from investment operations:
| | | | | | | | | | | | | | | | | | | | | | |
| Net investment loss | | | | | (0.03 | ) | | | (0.01 | ) | | | (0.04 | ) | | | (0.02 | ) | | | (0.02 | ) |
| Net realized and unrealized gains or losses | | | | | 0.44 | | | | 0.47 | | | | 0.14 | | | | 1.44 | | | | (0.94 | ) |
| Total income or loss from investment operations | | | | | 0.41 | | | | 0.46 | | | | 0.10 | | | | 1.42 | | | | (0.96 | ) |
| Net asset value at end of period | | | | | 5.29 | | | | 4.88 | | | | 4.42 | | | | 4.32 | | | | 2.90 | |
| Total return (%) | | | | | 8.40 | | | | 10.41 | | | | 2.31 | | | | 48.97 | | | | (24.87 | ) |
| |
Ratios/Supplemental Data (%) |
Ratios to average net assets:
| | | | | | | | | | | | | | | | | | | | | | |
| Net operating expenses | | | | | 0.95 | | | | 0.97 | | | | 1.02 | 1 | | | 1.04 | | | | 0.89 | |
| Gross operating expenses | | | | | 0.95 | | | | 0.97 | | | | 1.02 | | | | 1.25 | | | | 1.15 | |
| Net investment income | | | | | (0.48 | ) | | | (0.23 | ) | | | (0.78 | ) | | | (0.65 | ) | | | (0.57 | ) |
| Portfolio turnover rate | | | | | 86 | | | | 89 | | | | 109 | | | | 165 | | | | 117 | |
| Net assets, end of period ($ x 1,000,000) | | | | | 71 | | | | 53 | | | | 49 | | | | 43 | | | | 26 | |
1 | | The ratio of net operating expenses would have been 1.01% if interest expense had not been included. |
See financial notes. 81
Schwab Technology Fund
Portfolio Holdings as of October 31, 2006
This section shows all the securities in the fund’s portfolio and their value as of the report date.
The fund files its complete schedule of portfolio holdings with the SEC for the first and third quarters of each fiscal year on Form N-Q. The fund’s Form N-Q is available on the SEC’s website at http://www.sec.gov and may be viewed and copied at the SEC’s Public Reference Room in Washington, D.C. Call 1-800-SEC-0330 for information on the operation of the Public Reference Room. The schedule of portfolio holdings filed on a fund’s most recent Form N-Q is also available by visiting Schwab’s website at www.schwab.com/schwabfunds.
Holdings by Category
|
| Cost
($ x 1,000)
|
| Value
($ x 1,000)
|
|
|---|
98.2% | | | | Common Stock | | | 61,318 | | | | 69,819 | |
1.0 % | | | | Short-Term Investment | | | 693 | | | | 693 | |
0.1% | | | | U.S. Treasury Obligation | | | 40 | | | | 40 | |
99.3% | | | | Total Investments | | | 62,051 | | | | 70,552 | |
6.0 % | | | | Collateral Invested for Securities on Loan | | | 4,233 | | | | 4,233 | |
(5.3)% | | | | Other Assets and Liabilities, Net | | | | | | | (3,735 | ) |
100.0% | | | | Total Net Assets | | | | | | | 71,050 | |
Security
| | | | Number
of Shares | | Value
($ x 1,000) |
|---|
Common Stock 98.2% of net assets |
Semiconductors & Semiconductor Equipment 13.5% |
| Applied Materials, Inc. | | | | | 98,800 | | | | 1,718 | |
| Atmel Corp. * | | | | | 80,100 | | | | 461 | |
| Fairchild Semiconductor International, Inc. * | | | | | 39,100 | | | | 630 | |
| Integrated Device Technology, Inc. * | | | | | 29,400 | | | | 466 | |
| Micron Technology, Inc. * | | | | | 119,500 | | | | 1,727 | |
| Novellus Systems, Inc. * | | | | | 56,500 | | | | 1,562 | |
| Texas Instruments, Inc. | | | | | 100,000 | | | | 3,018 | |
| | | | | | | | | | 9,582 | |
Software & Services 41.2% |
| Amdocs Ltd. * | | | | | 32,300 | | | | 1,252 | |
| Autodesk, Inc. * | | | | | 31,600 | | | | 1,161 | |
| BEA Systems, Inc. * | | | | | 53,300 | | | | 867 | |
BMC Software, Inc. (a)* | | | | | 114,500 | | | | 3,470 | |
| Cadence Design Systems, Inc. * | | | | | 110,400 | | | | 1,972 | |
| Convergys Corp. * | | | | | 14,000 | | | | 297 | |
| Covansys Corp. * | | | | | 21,900 | | | | 512 | |
| CSG Systems International, Inc. * | | | | | 72,100 | | | | 1,945 | |
| Electronic Data Systems Corp. | | | | | 121,900 | | | | 3,088 | |
| FactSet Research Systems, Inc. | | | | | 15,000 | | | | 763 | |
| Forrester Research, Inc. * | | | | | 29,300 | | | | 921 | |
| Global Payments, Inc. | | | | | 60,700 | | | | 2,653 | |
| Hyperion Solutions Corp. * | | | | | 27,900 | | | | 1,043 | |
| Intuit, Inc. * | | | | | 10,000 | | | | 353 | |
| Lightbridge, Inc. * | | | | | 80,300 | | | | 928 | |
| MoneyGram International, Inc. | | | | | 21,300 | | | | 729 | |
| Oracle Corp. * | | | | | 115,300 | | | | 2,130 | |
| Red Hat, Inc. * | | | | | 9,500 | | | | 156 | |
| SonicWALL, Inc. * | | | | | 61,200 | | | | 643 | |
| Sybase, Inc. * | | | | | 59,700 | | | | 1,454 | |
| Sykes Enterprises, Inc. * | | | | | 23,900 | | | | 485 | |
| Synopsys, Inc. * | | | | | 71,600 | | | | 1,612 | |
| TIBCO Software, Inc. * | | | | | 17,900 | | | | 165 | |
| Total System Services, Inc. | | | | | 30,300 | | | | 730 | |
| | | | | | | | | | 29,329 | |
Technology Hardware & Equipment 43.5% |
| Agilent Technologies, Inc. * | | | | | 28,400 | | | | 1,011 | |
| Avaya, Inc. * | | | | | 68,700 | | | | 880 | |
| AVX Corp. | | | | | 130,300 | | | | 2,054 | |
| Cisco Systems, Inc. * | | | | | 94,000 | | | | 2,268 | |
| Coherent, Inc. * | | | | | 31,500 | | | | 1,015 | |
| Ditech Networks, Inc. * | | | | | 5,500 | | | | 44 | |
| Emulex Corp. * | | | | | 5,700 | | | | 107 | |
| Harris Corp. | | | | | 18,600 | | | | 792 | |
| Hewlett-Packard Co. | | | | | 137,900 | | | | 5,342 | |
| Imation Corp. | | | | | 49,500 | | | | 2,266 | |
| International Business Machines Corp. | | | | | 42,000 | | | | 3,878 | |
| Lexmark International, Inc., Class A * | | | | | 39,100 | | | | 2,486 | |
| Littelfuse, Inc. * | | | | | 17,900 | | | | 606 | |
| Motorola, Inc. | | | | | 120,000 | | | | 2,767 | |
| Packeteer, Inc. * | | | | | 5,000 | | | | 56 | |
| Planar Systems, Inc. * | | | | | 40,000 | | | | 482 | |
| Rofin-Sinar Technologies, Inc. * | | | | | 14,600 | | | | 899 | |
| Staktek Holdings, Inc. * | | | | | 32,100 | | | | 196 | |
UTStarcom, Inc. (a)* | | | | | 82,400 | | | | 888 | |
| Xerox Corp. * | | | | | 168,900 | | | | 2,871 | |
| | | | | | | | | | 30,908 | |
82 See financial notes.
Schwab Technology Fund
Portfolio Holdings continued
Security
Rate, Maturity Date
| | | | Face
Amount
($ x 1,000) | | Value
($ x 1,000) |
|---|
Short-Term Investment 1.0% of net assets |
| |
Wells Fargo, Grand Cayman
Time Deposit
4.71%, 11/01/06 | | | | | 693 | | | | 693 | |
U.S. Treasury Obligation 0.1% of net assets |
| |
U.S. Treasury Bill
4.82%, 12/14/06 | | | | | 40 | | | | 40 | |
Security
| | | | Number
of Shares | | Value
($ x 1,000) |
|---|
Collateral Invested for Securities on Loan 6.0% of net assets |
| |
Securities Lending Investment
Fund, a series of the Brown
Brothers Investment Trust | | | | | 4,233,105 | | | | 4,233 | |
End of collateral invested for securities on loan.At 10-31-06 the tax basis cost of the fund’s investments was $62,051, and the unrealized appreciation and depreciation were $9,779 and ($1,278), respectively, with a net unrealized appreciation of $8,501.
| * | | Non-income producing security. |
(a) | | All or a portion of this security is on loan. |
See financial notes. 83
Schwab Technology Fund
Statement of
Assets and Liabilities
As of October 31, 2006. All numbers x 1,000 except NAV.
Assets |
| Investments, at value including securities on loan of $4,140 (cost $62,051) | | | | $ | 70,552 | |
| Collateral invested for securities on loan | | | | | 4,233 | |
Receivables:
| | | | | | |
| Investments sold | | | | | 3,130 | |
| Fund shares sold | | | | | 129 | |
| Dividends | | | | | 5 | |
| Income from securities on loan | | | | + | 1 | |
Total assets | | | | | 78,050 | |
| |
Liabilities |
| Collateral for securities on loan | | | | | 4,233 | |
Payables:
| | | | | | |
| Investments bought | | | | | 2,614 | |
| Investment adviser and administrator fees | | | | | 3 | |
| Transfer agent and shareholder services fees | | | | | 1 | |
| Fund shares redeemed | | | | | 119 | |
| Trustee fees | | | | | 1 | |
| Accrued expenses | | | | + | 29 | |
Total liabilities | | | | | 7,000 | |
| |
Net Assets |
Total assets | | | | | 78,050 | |
Total liabilities | | | | | –7,000 | |
Net assets | | | | $ | 71,050 | |
| |
Net Assets by Source | | | | | | |
| Capital received from investors | | | | | 98,923 | |
| Net realized capital losses | | | | | (36,374 | ) |
| Net unrealized capital gains | | | | | 8,501 | |
| |
Net Asset Value (NAV) | | | | | | |
Net Assets
| | | | ÷ | | Shares
Outstanding | | = | | NAV |
|---|
| $71,050 | | | | | | | | | 13,429 | | | | | | | $ | 5.29 | |
84 See financial notes.
Schwab Technology Fund
Statement of
Operations
For November 1, 2005 through October 31, 2006. All numbers x 1,000.
Investment Income |
| Dividends | �� | | | $ | 301 | |
| Interest | | | | | 27 | |
| Securities on loan | | | | + | 3 | |
Total Investment Income | | | | | 331 | |
| |
Net Realized Gains and Losses |
| Net realized gains on investments | | | | | 2,501 | |
| Net realized gains on futures contracts | | | | + | 2 | |
Net realized gains | | | | | 2,503 | |
| |
Net Unrealized Gains and Losses |
| Net unrealized gains on investments | | | | | 1,658 | |
| |
Expenses |
| Investment adviser and administrator fees | | | | | 382 | |
Transfer agent and shareholder service fees
| | | | | 177 | |
| Portfolio accounting fees | | | | | 31 | |
| Registration fees | | | | | 30 | |
| Professional fees | | | | | 25 | |
| Custodian fees | | | | | 8 | |
| Trustees’ fees | | | | | 7 | |
| Shareholder reports | | | | | 4 | |
| Other expenses | | | | + | 6 | |
| Total expenses | | | | | 670 | |
| |
Increase in Net Assets from Operations |
Total investment income | | | | | 331 | |
Net expenses | | | | | –670 | |
Net investment loss | | | | | (339 | ) |
Net realized gains | | | | | 2,503 | |
Net unrealized gains | | | | + | 1,658 | |
Increase in net assets from operations | | | | $ | 3,822 | |
See financial notes. 85
Schwab Technology Fund
Statement of
Changes in Net Assets
For the current and prior report periods. All numbers x 1,000.
| | | | 11/1/05–10/31/06 | | 11/1/04–10/31/05 |
|---|
| Net investment loss | | | | $ | (339 | ) | | $ | (111 | ) |
| Net realized gains | | | | | 2,503 | | | | 2,354 | |
| Net unrealized gains | | | | + | 1,658 | | | | 2,534 | |
Increase in net assets from operations | | | | $ | 3,822 | | | $ | 4,777 | |
| | | | | | | | | | | |
Transactions in Fund Shares |
| | | | 11/1/05–10/31/06 | | 11/1/04–10/31/05 | |
|---|
| | | | SHARES | | VALUE | | SHARES | | VALUE |
|---|
| Shares Sold | | | | | 7,995 | | | $ | 41,697 | | | | 3,726 | | | $ | 17,658 | |
| Shares Redeemed | | | | + | (5,489 | ) | | | (27,733 | ) | | | (3,904 | ) | | | (18,286 | ) |
Net transactions in fund shares | | | | | 2,506 | | | $ | 13,964 | | | | (178 | ) | | $ | (628 | ) |
| | | | | | | | | | | | | | | | | | | |
Shares Outstanding and Net Assets |
| | | | 11/1/05–10/31/06 | | 11/1/04–10/31/05 | |
|---|
| | | | SHARES | | NET ASSETS | | SHARES | | NET ASSETS |
|---|
| Beginning of period | | | | | 10,923 | | | $ | 53,264 | | | | 11,101 | | | $ | 49,115 | |
| Total increase or decrease | | | | + | 2,506 | | | | 17,786 | | | | (178 | ) | | | 4,149 | |
End of period | | | | | 13,429 | | | $ | 71,050 | | | | 10,923 | | | $ | 53,264 | |
86 See financial notes.
Schwab Active Equity Funds
Financial Notes
| 1. | | Business Structure of the Funds |
Each of the funds discussed in this report is a series of Schwab Capital Trust (trust), a no-load, open-end management investment company. The company is organized as a Massachusetts business trust and is registered under the Investment Company Act of 1940, as amended. The list below shows all the funds in the trust including the funds discussed in this report, which are highlighted:
Schwab Capital Trust (organized May 7, 1993)
Schwab Premier Equity Fund®
Schwab Core Equity Fund™
Schwab Dividend Equity Fund™
Schwab Large-Cap Growth Fund™
Schwab Small-Cap Equity Fund™
Schwab Hedged Equity Fund™
Schwab Financial Services Fund™
Schwab Health Care Fund™
Schwab Technology Fund™
Schwab S&P 500 Index Fund
Schwab Institutional Select® S&P 500 Fund
Schwab Small-Cap Index Fund®
Schwab Total Stock Market Index Fund®
Schwab International Index Fund® | | Schwab MartketTrack All Equity Portfolio™
Schwab MarketTrack Growth Portfolio™
Schwab MarketTrack Balanced Portfolio™
Schwab MarketTrack Conservative Portfolio™
Laudus U.S. MarketMasters Fund™
Laudus Small-Cap MarketMasters Fund™
Laudus International MarketMasters Fund™
Schwab Viewpoints Fund™
Schwab Target 2010 Fund
Schwab Target 2020 Fund
Schwab Target 2030 Fund
Schwab Target 2040 Fund
Schwab Retirement Income Fund |
Schwab Premier Equity Fund, Schwab Dividend Equity Fund, Schwab Large-Cap Growth Fund, Schwab Small-Cap Equity Fund and Schwab Hedged Equity Fund offer two share classes: Investor Shares and Select Shares®. Shares of each class represent interest in the same portfolio, but each class has different expenses and investment minimums. Schwab Core Equity Fund, Schwab Financial Services Fund, Schwab Health Care Fund and Schwab Technology Fund each offer one share class.
Shares are bought and sold at net asset value, or NAV, which is the price for all outstanding shares. Each share has a par value of 1/1,000 of a cent, and the trustees may issue as many shares as necessary.
The Schwab Premier Equity Fund and the Schwab Large-Cap Growth Fund commenced operations on March 21, 2005 and October 3, 2005, respectively. The Schwab Hedged Equity Fund started offering Investor Shares on March 1, 2005 and the fund shares in existence prior to March 1, 2005 were designated as Select Shares.
| 2. | | Significant Accounting Policies: |
The following is a summary of the significant accounting policies used in the preparation of financial statements. The accounting policies are in conformity with accounting principles generally accepted in the United States of America.
The funds value the securities in their portfolios every business day. The funds use the following policies to value various types of securities:
| • | | Securities traded on an exchange or over-the-counter: valued at the closing value for the day, or, on days when no closing value has been reported, halfway between the most recent bid and asked quotes. Securities that are primarily traded on foreign exchanges are valued at the closing values of such securities on their respective exchanges with these values then translated into U.S. dollars at the current exchange rate. |
| • | | Securities for which no quoted value is available or when a significant event has occurred between the time of the security’s last close and the time the fund calculates net asset value: valued at fair value, as determined in good faith by the fund’s investment adviser using guidelines adopted by the fund’s Board of Trustees and the Pricing Committee. Some of the more common reasons that may necessitate that a security be valued at fair value include: the security’s trading has been halted or suspended; the security has been de-listed from a national exchange; the security’s primary trading market is temporarily closed at a time when under normal conditions it would be open; or the security’s primary pricing source is not able or willing to provide a price. |
87
Schwab Active Equity Funds
Financial Notes (continued)
2. Significant Accounting Policies (continued):
| • | | Futures and forwards: open contracts are valued at their settlement prices as of the close of their exchanges (for futures) or at a market value based on that day’s exchange rates (for forwards). When a fund closes out a futures or forwards position, it calculates the difference between the value of the position at the beginning and at the end, and records a realized gain or loss accordingly. |
| • | | Short-term securities (60 days or less to maturity): valued at amortized cost. |
| • | | Mutual funds: valued at their respective net asset values as determined by those funds in accordance with the 1940 Act for a given day. |
(b) | | Portfolio Investments: |
Futures Contracts: The funds may invest in futures contracts. Futures contracts involve certain risks because they can be very sensitive to market movements.
One risk is that the price of a futures contract may not move in perfect correlation with the price of the underlying securities. Another risk is that, at certain times, it may be impossible for a fund to close out a position in a futures contract, due to a difference in trading hours or to market conditions that may reduce the liquidity for a futures contract or its underlying securities. The potential for losses associated with futures contracts exceeds amounts recorded in the Statement of Assets and Liabilities.
Because futures contracts carry inherent risks, a fund must give the broker a deposit of cash and/or securities (the “initial margin”) whenever it enters into the futures contract. The amount of the deposit may vary from one contract to another, but it is generally a percentage of the contract amount.
Futures are traded publicly on exchanges, and their market value changes daily. A fund records the change in market value of futures, and also the change in the amount of margin deposit required (“due to/from broker”).
Short Sale: Schwab Hedged Equity Fund may sell securities short (sell securities it does not own). When it does so, the fund also places assets worth at least 100% of the value of the short securities into a segregated account, as collateral. If the market value of the short securities subsequently falls, the fund can realize a gain by closing the position. However, if the value rises, the fund typically would have to add to its collateral or close out its short position at a loss. The potential for losses associated with short positions is much greater than the original value of the securities sold short and exceeds amounts recorded in the Statements of Assets and Liabilities.
Securities Lending: The funds may loan securities to certain brokers, dealers and other financial institutions that pay the funds negotiated fees. The funds receive cash, letters of credit or U.S. Government securities as collateral on these loans. All of the cash collateral received is reinvested in high quality, short-term investments. The value of the collateral must be at least 102% of the market value of the loaned securities as of the first day of the loan, and at least 100% each day thereafter. If the value of the collateral falls below 100%, it will be adjusted the following day.
Repurchase Agreement: The funds may enter into a repurchase agreement. In a repurchase agreement, a fund buys a security from another party (usually a financial institution) with the agreement that it be sold back in the future. The date, price and other conditions are all specified when the agreement is created.
The funds’ repurchase agreements will be fully collateralized by U.S. government securities. All collateral is held by the funds’ custodian (or, with tri-party agreements, the agent’s bank) and is monitored daily to ensure that its market value is at least equal to the repurchase price under the agreement.
(c) | | Security Transactions: |
Security transactions are recorded as of the date the order to buy or sell the security is executed. Realized gains and losses from security transactions are based on the identified costs of the securities involved.
If a fund sells securities short, it records the proceeds received as an asset and the obligation to buy back the securities as a liability. At the time a short sale is initiated, the asset and liability are of equal value and effectively cancel each other out. Subsequently, the fund values the liability side of the transaction according to the market price of the securities sold short,
88
Schwab Active Equity Funds
Financial Notes (continued)
2. Significant Accounting Policies (continued):
and values the asset side according to the value of the proceeds. When the fund closes out a short position (buys the security), it records the outcome as a realized gain or loss. Interest accrued on securities sold short is recorded as an expense on the fund’s records.
Assets and liabilities denominated in foreign currencies are reported in U.S. dollars. For assets and liabilities held on a given date, the dollar value is based on market exchange rates in effect on that date. Transactions involving foreign currencies, including purchases, sales, income receipts and expense payments, are calculated using exchange rates in effect on the transaction date.
Interest income is recorded as it accrues. Dividends and distributions from portfolio securities and underlying funds are recorded on the date they are effective (the ex-dividend date), although the funds record certain foreign security dividends on the day they learn of the ex-dividend date.
Expenses that are specific to a fund or a class are charged directly to that fund or class. Expenses that are common to all funds within the trust generally are allocated among the funds in proportion to their average daily net assets.
For funds offering multiple share classes, the net investment income, other than class specific expenses, and the realized and unrealized gains or losses, are allocated daily to each class in proportion to its net assets.
(f) | | Distributions to Shareholders: |
The funds pay dividends from net investment income and make distributions from net realized capital gains once a year.
Each fund maintains its own account for purposes of holding assets and accounting, and is considered a separate entity for tax purposes. Within its account, each fund also keeps certain assets in segregated accounts, as may be required by securities law.
Each fund has an arrangement with its custodian bank under which the fund receives a credit for its uninvested cash balance to offset its custody fees and accounting fees. The credit amounts (if any) are disclosed in the statement of operations as a reduction to the fund’s operating expenses.
(h) | | Accounting Estimates: |
The accounting policies described in this report conform with accounting principles generally accepted in the United States of America. Notwithstanding this, shareholders should understand that in order to follow these principles, fund management has to make estimates and assumptions that affect the information reported in the financial statements. It’s possible that once the results are known, they may turn out to be different from these estimates.
(i) | | Federal Income Taxes: |
The funds intend to meet federal income and excise tax requirements for regulated investment companies. Accordingly, the funds distribute substantially all of their net investment income and realized net capital gains (if any) to their respective shareholders each year. As long as a fund meets the tax requirements, it is not required to pay federal income tax.
Under the funds’ organizational documents, the officers and trustees are indemnified against certain liabilities arising out of the performance of their duties to the funds. In addition, in the normal course of business the funds enter into contracts with their vendors and others that provide general indemnifications. The funds’ maximum exposure under these arrangements is unknown as this would involve future claims that may be made against the funds. However, based on experience, the funds expect the risk of loss to be remote.
89
Schwab Active Equity Funds
Financial Notes (continued)
2. Significant Accounting Policies (continued):
(k) | | New Accounting Standards: |
Financial Accounting Standards Board Interpretation (FIN) No. 48 — Accounting for Uncertainty in Tax Positions — An Interpretation of SFAS No. 109, was issued in July 2006 and is effective for fiscal years beginning after December 15, 2006. This Interpretation provides new requirements for the recognition, measurement, and disclosure in the financial statements of a tax position taken or expected to be taken in a tax return when there is uncertainty about whether that tax position will ultimately be sustained. We have not yet completed our evaluation of the impact, if any, of adopting FIN 48 on the Fund’s financial statements.
In September 2006, the Financial Accounting Standards Board (FASB) issued Statement of Financial Accounting Standards No. 157, “Fair Value Measurements” (SFAS No. 157). SFAS No. 157 defines fair value, establishes a framework for measuring fair value in accordance with generally accepted accounting principles and expands disclosure about fair value measurements. SFAS No. 157 is effective for fiscal years beginning after November 15, 2007. Management is currently evaluating the impact the adoption of SFAS No. 157 will have on the Fund’s financial statement disclosures.
| 3. | | Affiliates and Affiliated Transactions:
(All dollar amounts are × 1,000) |
Charles Schwab Investment Management, Inc. (CSIM or the investment adviser), a wholly owned subsidiary of The Charles Schwab Corporation, serves as each fund’s investment adviser and administrator pursuant to an Investment Advisory and Administration Agreement (Advisory Agreement) between it and the trust. Charles Schwab & Co., Inc. (“Schwab”) is an affiliate of the investment adviser and is the trust’s shareholder services agent and transfer agent.
For its advisory and administrative services to each fund, the investment adviser is entitled to receive an annual fee payable monthly based on each fund’s average daily net assets described as follows:
Average daily net assets
| | | | Premier
Equity
Fund
|
| Core
Equity
Fund
|
| Dividend
Equity
Fund
|
| Large-Cap
Growth Fund
|
| Small-Cap
Equity Fund
|
| Hedged
Equity Fund
|
|---|
| First $500 million | | | | | 0.91 | % | | | 0.54 | % | | | 0.775 | % | | | 0.87 | % | | | 0.975 | % | | | 1.675 | % |
| Over $500 million | | | | | 0.885 | % | | | 0.49 | % | | | 0.77 | % | | | 0.85 | % | | | 0.93 | % | | | 1.65 | % |
| Over $1 billion | | | | | 0.86 | % | | | n/a | | | | 0.76 | % | | | 0.83 | % | | | 0.91 | % | | | 1.63 | % |
| Over $2 billion | | | | | n/a | | | | n/a | | | | n/a | | | | 0.81 | % | | | n/a | | | | n/a | |
| | | | | | | | | |
|---|
Average daily net assets
| | | | Financial
Services
Fund
|
| Health
Care
Fund
|
| Technology
Fund
|
|---|
| First $500 million | | | | | 0.54 | % | | | 0.54 | % | | | 0.54 | % |
| Over $500 million | | | | | 0.515 | % | | | 0.515 | % | | | 0.515 | % |
| Over $1 billion | | | | | 0.49 | % | | | 0.49 | % | | | 0.49 | % |
| Over $2 billion | | | | | n/a | | | | n/a | | | | n/a | |
90
Schwab Active Equity Funds
Financial Notes (continued)
3. Affiliates and Affiliated Transactions (continued):
For its transfer agent and shareholder services, Schwab is entitled to receive an annual fee payable monthly based on each fund’s average daily net assets described as follows:
| | | | Transfer Agent Fees
|
| Shareholder Service Fees
|
|---|
| Investor Shares | | | | | 0.05 | % | | | 0.20 | % |
| Select Shares* | | | | | 0.05 | % | | | 0.05 | % |
Although these agreements specify certain fees for these services, CSIM and Schwab have made additional agreements with the funds to limit the total expenses charged, excluding interest, taxes and certain non-routine expenses through February 27, 2007, as follows:
| | | | Premier
Equity
Fund
|
| Core
Equity
Fund
|
| Dividend
Equity
Fund
|
| Large-Cap
Growth Fund
|
| Small-Cap
Equity Fund
|
| Hedged
Equity
Fund
|
|---|
| Investor Shares | | | | | 1.30 | % | | | 0.75 | % | | | 1.10 | % | | | 1.20 | % | | | 1.30 | % | | | 2.00 | %** |
| Select Shares* | | | | | 1.15 | % | | | n/a | | | | 0.95 | % | | | 0.99 | % | | | 1.12 | % | | | 1.77 | %** |
| | | | | | | | | | |
|---|
| | | | Financial
Services
Fund
|
| Health
Care
Fund
|
| Technology
Fund
|
|
|---|
| Investor Shares | | | | | 1.10 | % | | | 1.10 | % | | | 1.10 | % | | | | | | | | | | | | |
| Select Shares* | | | | | n/a | | | | n/a | | | | n/a | | | | | | | | | | | | | |
| * | | Select Shares are only offered by Premier Equity Fund, Dividend Equity Fund, Large-Cap Growth Fund, Small-Cap Equity Fund, and Hedged Equity Fund. |
| ** | | Excluding dividend and interest paid on securities sold short. |
The Schwab Target Funds invest portions of their portfolios in certain Schwab Active Equity Funds. The table below reflects the percentage of each Active Equity Fund’s shares owned by the Target Funds as of October 31, 2006.
| | | | Premier
Equity
Fund
|
| Core
Equity
Fund
|
| Dividend
Equity
Fund
|
| Large-Cap
Growth Fund
|
| Small-Cap
Equity Fund
|
| Hedged
Equity Fund
|
|---|
Schwab Target Funds: | | | | | | | | | | | | | | | | | | | | | | | | | | |
| Target 2010 | | | | | — | | | | 1.2 | % | | | 0.3 | % | | | — | | | | 0.6 | % | | | — | |
| Target 2020 | | | | | — | | | | 1.8 | % | | | 0.5 | % | | | — | | | | 0.9 | % | | | — | |
| Target 2030 | | | | | — | | | | 1.3 | % | | | 0.3 | % | | | — | | | | 0.8 | % | | | — | |
| Target 2040 | | | | | — | | | | 0.8 | % | | | 0.2 | % | | | — | | | | 0.5 | % | | | — | |
| Retirement Income | | | | | — | | | | — | | | | 0.4 | % | | | — | | | | — | | | | — | |
| | | | | | | | | | |
|---|
| | | | Financial
Services
Fund
|
| Health
Care
Fund
|
| Technology
Fund
|
|
|---|
Schwab Target Funds: | | | | | | | | | | | | | | | | | | | | | | | | | | |
| Target 2010 | | | | | — | | | | — | | | | — | | | | | | | | | | | | | |
| Target 2020 | | | | | — | | | | — | | | | — | | | | | | | | | | | | | |
| Target 2030 | | | | | — | | | | — | | | | — | | | | | | | | | | | | | |
| Target 2040 | | | | | — | | | | — | | | | — | | | | | | | | | | | | | |
| Retirement Income | | | | | — | | | | — | | | | — | | | | | | | | | | | | | |
91
Schwab Active Equity Funds
Financial Notes (continued)
3. Affiliates and Affiliated Transactions (continued):
The funds may make direct transactions with certain other Schwab Funds when practical. When one fund is seeking to sell a security that another is seeking to buy, an interfund transaction can allow both funds to benefit by reducing transaction costs. This practice is limited to funds that share the same investment adviser, trustees and officers. As of October 31, 2006, each fund’s total security transactions with other Schwab Funds were as follows:
| Premier Equity Fund | | | | $ | — | |
| Core Equity Fund | | | | | — | |
| Dividend Equity Fund | | | | | — | |
| Large-Cap Growth Fund | | | | | — | |
| Small-Cap Equity Fund | | | | | 734 | |
| Hedged Equity Fund | | | | | — | |
| Financial Services Fund | | | | | — | |
| Health Care Fund | | | | | — | |
| Technology Fund | | | | | — | |
Pursuant to an exemptive order issued by the SEC, the funds may enter into interfund borrowing and lending transactions within the Schwab Funds. All loans are for temporary or emergency purposes only. The interest rate charged on the loan is the average of the overnight repurchase agreement rate and the short-term bank loan rate. The interfund lending facility is subject to the oversight and periodic review of the Board of Trustees of the Schwab Funds. There was no interfund borrowing or lending activity for any fund during the period.
Independent Trustees
Trustees may include people who are officers and/ or directors of the investment adviser or Schwab. Federal securities law limits the percentage of such “interested persons” who may serve on a trust’s board, and the trust was in compliance with these limitations throughout the report period. The trust did not pay any of these persons for their service as trustees, but it did pay non-interested persons (independent trustees), as noted in each fund’s Statement of Operations.
| 4. | | Purchases and Sales of Investment Securities:
(All dollar amounts are × 1,000) |
For the fiscal year ended October 31, 2006, purchases and sales of securities (excluding short-term obligations and securities sold short) were as follows:
| | | | Purchases of Securities
| | Sales/Maturities
of Securities
|
|---|
| Premier Equity Fund | | | | $ | 1,489,603 | | | $959,343 |
| Core Equity Fund | | | | | 763,634 | | | 334,906 |
| Dividend Equity Fund | | | | | 545,607 | | | 404,686 |
| Large-Cap Growth Fund | | | | | 151,875 | | | 51,009 |
| Small-Cap Equity Fund | | | | | 762,683 | | | 379,159 |
| Hedged Equity Fund | | | | | 1,052,146 | | | 427,062 |
| Financial Services Fund | | | | | 95,694 | | | 35,894 |
| Health Care Fund | | | | | 609,216 | | | 423,033 |
| Technology Fund | | | | | 74,187 | | | 61,459 |
92
Schwab Active Equity Funds
Financial Notes (continued)
| 5. | | Redemption Fee:
(All dollar amounts are × 1,000) |
The funds may impose a short-term redemption fee on any fund shares that are redeemed or exchanged by a shareholder within a specified number of days of the purchase date. The funds charge a 2.00% redemption fee on shares held less than 30 days. Such amounts are net of the redemption fee proceeds on the Statement of Changes in Net Assets. The redemption fees charged during the current and prior fiscal years were:
| | | | Current Period
| | Prior Period
|
|---|
Premier Equity Fund | | | | | | | | |
| Investor Shares | | | | $ | 38 | | | $25 |
| Select Shares | | | | | 42 | | | 28 |
Core Equity Fund | | | | | 66 | | | 17 |
Dividend Equity Fund | | | | | | |
| Investor Shares | | | | | 19 | | | 15 |
| Select Shares | | | | | 20 | | | 19 |
Large-Cap Growth Fund | | | | | | |
| Investor Shares | | | | | 5 | | | 3 |
| Select Shares | | | | | 2 | | | — |
Small-Cap Equity Fund | | | | | | |
| Investor Shares | | | | | 34 | | | 14 |
| Select Shares | | | | | 16 | | | 16 |
Hedged Equity Fund | | | | | | |
| Investor Shares | | | | | 32 | | | 3 |
| Select Shares | | | | | 29 | | | 40 |
Financial Services Fund | | | | | 11 | | | 7 |
Health Care Fund | | | | | 42 | | | 121 |
Technology Fund | | | | | 5 | | | 10 |
| 6. | | Borrowing:
(All dollar amounts are x 1,000) |
The funds may borrow money from banks and custodians. The funds may obtain temporary bank loans through the trusts to which they belong, to use for meeting shareholder redemptions or for extraordinary or emergency purposes. The Schwab Funds have custodian overdraft facilities and line of credit arrangements of $150 million and $100 million with State Street Corporation and Bank of America, N.A., respectively. The funds pay interest on the amounts they borrow at rates that are negotiated periodically.
Fund
| | | | Amount
Outstanding
at 10/31/06
|
| Average
Borrowing*
|
| Weighted
Average
Interest
Rate*(%)
|
|---|
| Premier Equity Fund | | | | $ | — | | | $ | 4,950 | | | | 5.08 | |
| Core Equity Fund | | | | | — | | | | 404 | | | | 5.70 | |
| Dividend Equity Fund | | | | | — | | | | 808 | | | | 4.82 | |
| Large-Cap Growth Fund | | | | | — | | | | — | | | | — | |
| Small-Cap Equity Fund | | | | | — | | | | 1,241 | | | | 5.27 | |
| Hedged Equity Fund | | | | | — | | | | 2,597 | | | | 5.44 | |
| Financial Services Fund | | | | | — | | | | — | | | | — | |
| Health Care Fund | | | | | — | | | | 1,568 | | | | 5.12 | |
| Technology Fund | | | | | — | | | | 262 | | | | 5.34 | |
| * | | Based on the number of days for which the borrowing is outstanding. |
93
Schwab Active Equity Funds
Financial Notes (continued)
| 7. | | Federal Income Taxes:
(All dollar amounts are x 1,000) |
As of October 31, 2006, the components of distributable earnings on a tax-basis were as follows:
| | | | Premier
Equity
Fund
|
| Core
Equity
Fund
|
| Dividend
Equity
Fund
|
| Large-Cap
Growth Fund
|
| Small-Cap
Equity Fund
|
| Hedged
Equity
Fund
|
|---|
| Undistributed ordinary income | | | | $ | — | | | $ | 3,881 | | | $ | 1,244 | | | $ | 138 | | | $ | — | | | $ | 4,267 | |
| Undistributed long-term capital gains | | | | | — | | | | 21,463 | | | | 30,177 | | | | — | | | | 3,609 | | | | — | |
| Unrealized appreciation on investments | | | | | 229,132 | | | | 163,064 | | | | 214,769 | | | | 16,580 | | | | 90,497 | | | | 136,548 | |
| Unrealized depreciation on investments | | | | | (17,083 | ) | | | (8,901 | ) | | | (9,835 | ) | | | (1,784 | ) | | | (13,138 | ) | | | (4,907 | ) |
| Other unrealized appreciation/depreciation | | | | | — | | | | — | | | | — | | | | — | | | | 499 | | | | (11,063 | ) |
| Net unrealized appreciation / (depreciation) | | | | $ | 212,049 | | | $ | 154,163 | | | $ | 204,934 | | | $ | 14,796 | | | $ | 77,858 | | | $ | 120,578 | |
| | | | | | | | | | |
|---|
| | | | Financial
Services
Fund
|
| Health
Care
Fund
|
| Technology
Fund
|
|
|---|
| Undistributed ordinary income | | | | $ | 560 | | | $ | — | | | $ | — | | | | | | | | | | | | | |
| Undistributed long-term capital gains | | | | | 1,133 | | | | 5,276 | | | | — | | | | | | | | | | | | | |
| Unrealized appreciation on investments | | | | | 10,683 | | | | 67,712 | | | | 9,779 | | | | | | | | | | | | | |
| Unrealized depreciation on investments | | | | | (970 | ) | | | (9,201 | ) | | | (1,278 | ) | | | | | | | | | | | | |
| Net unrealized appreciation / (depreciation) | | | | $ | 9,713 | | | $ | 58,511 | | | $ | 8,501 | | | | | | | | | | | | | |
The primary difference between book-basis and tax-basis unrealized appreciation or unrealized depreciation of investments is the tax deferral of losses on wash sales.
Capital loss carry forwards may be used to offset future realized capital gains for federal income tax purposes. As of October 31, 2006, the following funds had capital loss carry forwards expiring in:
Expire
| | | | Premier
Equity
Fund
|
| Core
Equity
Fund
|
| Dividend
Equity
Fund
|
| Large-Cap
Growth Fund
|
| Small-Cap
Equity Fund
|
| Hedged
Equity
Fund
|
|---|
| 2009 | | | | | — | | | | — | | | | — | | | | — | | | | — | | | | — | |
| 2010 | | | | | — | | | | — | | | | — | | | | — | | | | — | | | | — | |
| 2011 | | | | | — | | | | — | | | | — | | | | — | | | | — | | | | — | |
| 2012 | | | | | — | | | | — | | | | — | | | | — | | | | — | | | | — | |
| 2013 | | | | $ | 546 | | | | — | | | | — | | | $ | 158 | | | | — | | | | — | �� |
| 2014 | | | | | 25 | | | | — | | | | — | | | | 2,674 | | | | — | | | $ | 22,535 | |
| Total | | | | $ | 571 | | | | — | | | | — | | | $ | 2,832 | | | | — | | | $ | 22,535 | |
| | | | | | | | | | |
|---|
Expire
| | | | Financial
Services
Fund
|
| Health
Care
Fund
|
| Technology
Fund
|
|
|---|
| 2009 | | | | | — | | | | — | | | $ | 11,530 | | | | | | | | | | | | | |
| 2010 | | | | | — | | | | — | | | | 18,148 | | | | | | | | | | | | | |
| 2011 | | | | | — | | | | — | | | | 6,697 | | | | | | | | | | | | | |
| 2012 | | | | | — | | | | — | | | | — | | | | | | | | | | | | | |
| 2013 | | | | | — | | | | — | | | | — | | | | | | | | | | | | | |
| 2014 | | | | | — | | | | — | | | | — | | | | | | | | | | | | | |
| Total | | | | | — | | | | — | | | $ | 36,375 | | | | | | | | | | | | | |
94
Schwab Active Equity Funds
Financial Notes (continued)
7. Federal Income Taxes (continued):
For tax purposes, realized capital losses, occurring after October 31, may be deferred and treated as occurring on the first day of the following fiscal year. As of October 31, 2006, the Funds had aggregate deferred realized capital losses as follows:
| | | | Premier
Equity
Fund
|
| Core
Equity
Fund
|
| Dividend
Equity
Fund
|
| Large-Cap
Growth Fund
|
| Small-Cap
Equity Fund
|
| Hedged
Equity
Fund
|
|---|
| Deferred capital losses | | | | $ | — | | | $ | — | | | $ | — | | | $ | — | | | $ | — | | | $ | — | |
| Capital losses utilized | | | | | — | | | $ | 3,858 | | | | — | | | | — | | | | — | | | | — | |
| | | | | | | | | | |
|---|
| | | | Financial
Services
Fund
|
| Health
Care
Fund
|
| Technology
Fund
|
|
|---|
| Deferred capital losses | | | | $ | — | | | $ | — | | | $ | — | | | | | | | | | | | | | |
| Capital losses utilized | | | | | — | | | $ | 4,254 | | | | — | | | | | | | | | | | | | |
The tax-basis components of distributions paid during the current and prior fiscal years were:
| | | | Premier
Equity
Fund
|
| Core
Equity
Fund
|
| Dividend
Equity
Fund
|
| Large-Cap
Growth Fund
|
| Small-Cap
Equity Fund
|
| Hedged
Equity
Fund
|
|---|
Current period distributions | | | | | | | | | | | | | | | | | | | | | | | | | | |
| Ordinary income | | | | $ | 3,776 | | | $ | 3,509 | | | $ | 21,310 | | | $ | 30 | | | $ | 1,708 | | | $ | 2,197 | |
| Long-term capital gains | | | | | — | | | | — | | | | 13,306 | | | | — | | | | 6,515 | | | | 7,073 | |
| Return of capital | | | | | — | | | | — | | | | — | | | | — | | | | — | | | | — | |
| |
Prior period distributions | | | | | | | | | | | | | | | | | | | | | | | | | | |
| Ordinary income | | | | | — | | | | 3,112 | | | | 17,714 | | | | — | | | | 4,863 | | | | — | |
| Long-term capital gains | | | | | — | | | | — | | | | 9,224 | | | | — | | | | 2,191 | | | | 3,789 | |
| Return of capital | | | | | — | | | | — | | | | — | | | | — | | | | — | | | | — | |
| | | | | | | | | | |
|---|
| | | | Financial
Services
Fund
|
| Health
Care
Fund
|
| Technology
Fund
|
|
|---|
Current period distributions | | | | | | | | | | | | | | | | | | | | | | | | | | |
| Ordinary income | | | | $ | 616 | | | | — | | | | — | | | | | | | | | | | | | |
| Long-term capital gains | | | | | 1,228 | | | | — | | | | — | | | | | | | | | | | | | |
| Return of capital | | | | | — | | | | — | | | | — | | | | | | | | | | | | | |
| |
Prior period distributions | | | | | | | | | | | | | | | | | | | | | | | | | | |
| Ordinary income | | | | | 139 | | | | — | | | | — | | | | | | | | | | | | | |
| Long-term capital gains | | | | | 1,403 | | | | — | | | | — | | | | | | | | | | | | | |
| Return of capital | | | | | — | | | | — | | | | — | | | | | | | | | | | | | |
95
Schwab Active Equity Funds
Financial Notes (continued)
7. Federal Income Taxes (continued):
The permanent book and tax basis differences may result in reclassifications between capital account and other accounts as required. The adjustments will have no impact on net assets or the results of operations. As of October 31, 2006, the funds made the following reclassifications:
| | | | Premier
Equity
Fund
|
| Core
Equity
Fund
|
| Dividend
Equity
Fund
|
| Large-Cap
Growth Fund
|
| Small-Cap
Equity Fund
|
| Hedged
Equity
Fund
|
|---|
| Capital Shares | | | | | (266 | ) | | | 1 | | | | — | | | | — | | | $ | (1,529 | ) | | | — | |
| Undistributed net investment income | | | | | 266 | | | | — | | | | — | | | | — | | | | 1,524 | | | | — | |
| Net realized capital gains and losses | | | | | | | | | (1 | ) | | | — | | | | — | | | | 5 | | | | — | |
| | | | | | | | | | |
|---|
| | | | Financial
Services
Fund
|
| Health
Care
Fund
|
| Technology
Fund
|
|
|---|
| Capital Shares | | | | | — | | | $ | (404 | ) | | $ | (339 | ) | | | | | | | | | | | | |
| Undistributed net investment income | | | | | — | | | | 404 | | | | 339 | | | | | | | | | | | | | |
| Net realized capital gains and losses | | | | | — | | | | — | | | | — | | | | | | | | | | | | | |
Other Federal Tax Information (unaudited)
(All dollar amounts are x 1,000), unaudited:
For corporate shareholders, the following percentage of the funds dividend distributions paid during the fiscal year ended October 31, 2006, qualify for the corporate dividends received deduction:
| | | | Percentage
|
|---|
| Premier Equity Fund | | | | | 100 | % |
| Core Equity Fund | | | | | 100 | % |
| Dividend Equity Fund | | | | | 99 | % |
| Large-Cap Growth Fund | | | | | 100 | % |
| Small-Cap Equity Fund | | | | | 69 | % |
| Hedged Equity Fund | | | | | 69 | % |
| Financial Services Fund | | | | | 92 | % |
| Health Care Fund | | | | | — | |
| Technology Fund | | | | | — | |
For the fiscal year ended October 31, 2006, the fund designate the following amounts of the dividend distributions as qualified dividends for the purpose of the maximum rate under section 1(h)(ii) of the Internal Revenue Code. Shareholders will be notified in January 2007 via IRS form 1099 of the amounts for use in preparing their 2006 income tax return.
| Premier Equity Fund | | | | $ | 3,776 | |
| Core Equity Fund | | | | | 3,509 | |
| Dividend Equity Fund | | | | | 21,310 | |
| Large-Cap Growth Fund | | | | | 30 | |
| Small-Cap Equity Fund | | | | | 1,708 | |
| Hedged Equity Fund | | | | | 2,196 | |
| Financial Services Fund | | | | | 616 | |
| Health Care Fund | | | | | — | |
| Technology Fund | | | | | — | |
96
Report of Independent Registered Public Accounting Firm
To the Board of Trustees and Shareholders of
Schwab Premier Equity Fund
Schwab Core Equity Fund
Schwab Dividend Equity Fund
Schwab Large-Cap Growth Fund
Schwab Small-Cap Equity Fund
Schwab Hedged Equity Fund
Schwab Financial Services Fund
Schwab Health Care Fund
Schwab Technology Fund
In our opinion, the accompanying statements of assets and liabilities, including the portfolio holdings, and the related statements of operations and of changes in net assets and the financial highlights present fairly, in all material respects, the financial position of Schwab Premier Equity Fund, Schwab Core Equity Fund, Schwab Dividend Equity Fund, Schwab Large-Cap Growth Fund, Schwab Small-Cap Equity Fund, Schwab Hedged Equity Fund, Schwab Financial Services Fund, Schwab Health Care Fund, and Schwab Technology Fund (nine of the portfolios constituting Schwab Capital Trust, hereafter referred to as the “Funds”) at October 31, 2006, the results of each of their operations for the year then ended, and the changes in each of their net assets and the financial highlights for each of the periods presented, in conformity with accounting principles generally accepted in the United States of America. These financial statements and financial highlights (hereafter referred to as “financial statements”) are the responsibility of the Funds’ management; our responsibility is to express an opinion on these financial statements based on our audits. We conducted our audits of these financial statements in accordance with the standards of the Public Company Accounting Oversight Board (United States). Those standards require that we plan and perform the audits to obtain reasonable assurance about whether the financial statements are free of material misstatement. An audit includes examining, on a test basis, evidence supporting the amounts and disclosures in the financial statements, assessing the accounting principles used and significant estimates made by management, and evaluating the overall financial statement presentation. We believe that our audits, which included confirmation of securities at October 31, 2006 by correspondence with the custodian and brokers, provide a reasonable basis for our opinion.
PricewaterhouseCoopers LLP
San Francisco, California
December 14, 2006
97
Investment Advisory Agreement Approval
The Investment Company Act of 1940 (the “1940 Act”) requires that initial approval of, as well as the continuation of, a fund’s investment advisory agreement must be specifically approved (1) by the vote of the trustees or by a vote of the shareholders of the fund, and (2) by the vote of a majority of the trustees who are not parties to the investment advisory agreement or “interested persons” of any party (the “Independent Trustees”), cast in person at a meeting called for the purpose of voting on such approval. In connection with such approvals, the fund’s trustees must request and evaluate, and the investment adviser is required to furnish, such information as may be reasonably necessary to evaluate the terms of the advisory agreement. In addition, the Securities and Exchange Commission (the “SEC”) takes the position that, as part of their fiduciary duties with respect to fund fees, fund boards are required to evaluate the material factors applicable to a decision to approve an investment advisory agreement.
Consistent with these responsibilities, the Board of Trustees (the “Board”) calls and holds one or more meetings each year that are dedicated, in whole or in part, to considering whether to renew the investment advisory agreement between Schwab Capital Trust (the “Trust”) and CSIM (the “Agreement”) with respect to existing funds in the Trust, including the funds covered in this annual report, and to review certain other agreements pursuant to which CSIM provides investment advisory services to certain other registered investment companies. In preparation for the meeting(s), the Board requests and reviews a wide variety of materials provided by CSIM, including information about CSIM’s affiliates, personnel and operations. The Board also receives extensive data provided by third parties. This information is in addition to the detailed information about the funds that the Board reviews during the course of each year, including information that relates to fund operations and fund performance. The trustees also receive a memorandum from fund counsel regarding the responsibilities of trustees for the approval of investment advisory contracts. In addition, the Independent Trustees receive advice from independent counsel to the Independent Trustees, meet in executive session outside the presence of fund management and participate in question and answer sessions with representatives of CSIM.
The Board, including a majority of the Independent Trustees, considered information specifically relating to the continuance of the Agreement at meetings held on May 2, 2006, May 24, 2006 and June 12, 2006, and approved the renewal of the Agreement for an additional one year term at the meeting held on June 12, 2006. The Board’s approval of the Agreement was based on consideration and evaluation of a variety of specific factors discussed at these meetings and at prior meetings, including:
| 1. | | the nature, extent and quality of the services provided to the funds under the Agreement, including the resources of CSIM and its affiliates dedicated to the funds; |
| 2. | | each fund’s investment performance and how it compared to that of certain other comparable mutual funds; |
| 3. | | each fund’s expenses and how those expenses compared to those of certain other comparable mutual funds; |
| 4. | | the profitability of CSIM and its affiliates, including Charles Schwab & Co., Inc. (“Schwab”), with respect to each fund, including both direct and indirect benefits accruing to CSIM and its affiliates; and |
| 5. | | the extent to which economies of scale would be realized as the funds grow and whether fee levels in the Agreement reflect those economies of scale for the benefit of fund investors. |
Nature, Extent and Quality of Services. The Board considered the nature, extent and quality of the services provided by CSIM to the funds and the resources of CSIM and its affiliates dedicated to the funds. In this regard, the trustees evaluated, among other things, CSIM’s personnel, experience, track record and compliance program. The information considered by the trustees included specific information concerning changes in the nature, extent and quality of services provided by CSIM since the trustees had last considered approval of the Agreement. The trustees also considered the fact that Schwab’s extensive branch network, Internet access, investment and research tools, telephone services, and array of account features benefit the funds and their shareholders. The trustees also considered Schwab’s excellent reputation as a full service brokerage firm and its overall financial condition. Finally, the trustees considered that the vast majority of the funds’ shareholders are also brokerage clients of Schwab, and that CSIM and its affiliates are uniquely positioned to provide services and support to the funds and such shareholders. Following such evaluation, the Board concluded, within the context of its full deliberations, that the nature, extent and quality of services provided by CSIM to the funds and the resources of CSIM and its affiliates dedicated to the funds supported renewal of the Agreement.
Fund Performance. The Board considered fund performance in determining whether to renew the Agreement. Specifically, the trustees considered each fund’s performance relative to a peer group of other mutual funds
98
and appropriate indices/benchmarks, in light of total return and market trends. As part of this review, the trustees considered the composition of the peer group, selection criteria and the reputation of the third party who prepared the peer group analysis. In evaluating the performance of each fund, the trustees considered both market risk and shareholder risk expectations for such fund and the appropriateness of the benchmark used to compare the performance of each fund. The trustees further considered the level of fund performance in the context of its review of fund expenses and adviser profitability discussed below. Following such evaluation the Board concluded, within the context of its full deliberations, that the performance of the funds supported renewal of the Agreement.
Fund Expenses. With respect to the funds’ expenses, the trustees considered the rate of compensation called for by the Agreement, and each fund’s net operating expense ratio, in each case, in comparison to those of other comparable mutual funds, such peer groups and comparisons having been selected and calculated by an independent third party. The trustees considered the effects of CSIM’s and Schwab’s historical practice of voluntarily waiving management and other fees to prevent total fund expenses from exceeding a specified cap. The trustees also considered fees charged by CSIM to other mutual funds and to other types of accounts, such as wrap accounts, but, with respect to such other types of accounts, accorded less weight to such comparisons due to the different legal, regulatory, compliance and operating features of mutual funds as compared to these other types of accounts. Following such evaluation, the Board concluded, within the context of its full deliberations, that the expenses of the funds are reasonable and supported renewal of the Agreement.
Profitability. With regard to profitability, the trustees considered the compensation flowing to CSIM and its affiliates, directly or indirectly. In this connection, the trustees reviewed management’s profitability analyses, together with certain commentary thereon from an independent accounting firm. The trustees also considered any other benefits derived by CSIM from its relationship with the funds, such as whether, by virtue of its management of the funds, CSIM obtains investment information or other research resources that aid it in providing advisory services to other clients. The trustees considered whether the varied levels of compensation and profitability under the Agreement and other service agreements were reasonable and justified in light of the quality of all services rendered to each fund by CSIM and its affiliates. The Board also considered information relating to changes to CSIM’s cost structure, including cost savings, technology investments and increased operating efficiencies and how these changes affected CSIM’s profitability under the Agreement. Based on this evaluation, the Board concluded, within the context of its full deliberations, that the profitability of CSIM is reasonable and supported renewal of the Agreement.
Economies of Scale. The trustees considered the existence of any economies of scale and whether those are passed along to a fund’s shareholders through a graduated investment advisory fee schedule or other means, including any fee waivers by CSIM and its affiliates. In this regard, and consistent with their consideration of fund expenses, the trustees considered that CSIM and Schwab have previously committed resources to minimize the effects on shareholders of diseconomies of scale during periods when fund assets were relatively small through their contractual expense waivers. For example, such diseconomies of scale may particularly affect newer funds or funds with investment strategies that are from time to time out of favor, but shareholders may benefit from the continued availability of such funds at subsidized expense levels. The trustees also considered CSIM’s agreement to contractual investment advisory fee schedules that include lower fees at higher graduated asset levels. The Board also considered certain commitments by CSIM and Schwab that are designed to pass along potential economies of scale to fund shareholders. Specifically, the Board considered CSIM and Schwab’s commitments, which may be changed only with Board approval: (i) to reduce contractual advisory fees or add breakpoints for certain funds, and (ii) to implement, by means of expense limitation agreement, reductions in net overall expenses for certain funds. Based on this evaluation, and in consideration of the commitments made by CSIM and Schwab as discussed above, the Board concluded, within the context of its full deliberations, that the funds obtain reasonable benefit from economies of scale.
In the course of their deliberations, the trustees did not identify any particular information or factor that was all-important or controlling. Based on the trustees’ deliberation and their evaluation of the information described above, the Board, including all of the Independent Trustees, unanimously approved the continuation of the Agreement and concluded that the compensation under the Agreement is fair and reasonable in light of such services and expenses and such other matters as the trustees have considered to be relevant in the exercise of their reasonable judgment.
99
Trustees and Officers
The tables below gives information about the trustees and officers for The Schwab Capital Trust, which includes the funds covered in this report. The “Fund Complex” includes The Charles Schwab Family of Funds, Schwab Capital Trust, Schwab Investments, Schwab Annuity Portfolios, Laudus Trust, Laudus Variable Insurance Trust, Excelsior Funds, Inc., Excelsior Tax-Exempt Funds, Inc., and Excelsior Funds Trust. As of October 31, 2006, the Fund Complex included 96 funds.
The address for all trustees and officers is 101 Montgomery Street, San Francisco, CA 94104. You can find more information about the trustees and officers in the Statement of Additional Information, which is available free by calling 1-800-435-4000.
Independent Trustees |
Name, Year of Birth,
and Position(s) with
the Trust; (Term of
Office, and Length of
Time Served1) | | | | Principal Occupations
During the Past Five Years | | Number of
Portfolios in
Fund Complex
Overseen by
the Trustee | | Other Directorships |
Mariann Byerwalter
1960
Trustee
(Trustee of Schwab Capital Trust since 2000.) | | | | Chairman of JDN Corporate Advisory LLC. From 1996 to 2001, Vice President for Business Affairs and Chief Financial Officer of Stanford University, and in 2001, Special Advisor to the President of Stanford University. | | 96 | | Board 1—Director, Redwood Trust, Inc.
Board 2—Director, PMI Group, Inc. |
Donald F. Dorward
1931
Trustee
(Trustee of Schwab Capital Trust since 1989.) | | | | Chief Executive Officer, Dorward & Associates (corporate management, marketing and communications consulting firm). From 1996-1999, Executive Vice President and Managing Director, Grey Advertising. Prior to 1996, President and Chief Executive Officer, Allen & Dorward Advertising. | | 57 | | None. |
William A. Hasler
1941
Trustee
(Trustee of Schwab Capital Trust since 2000.) | | | | Retired. Dean Emeritus, Haas School of Business, University of California, Berkeley. Until February 2004, Co-Chief Executive Officer, Aphton Corp. (bio-pharmaceuticals). Prior to August 1998, Dean of the Haas School of Business, University of California, Berkeley (higher education). | | 96 | | Board 1—Director, Aphton Corp.
Board 2—Director, Mission West Properties
Board 3—Director, TOUSA
Board 4—Director, Stratex Networks
Board 5—Director, Genitope Corp.
Board 6—Director & Non-Executive
Chairman, Solectron Corp.
Board 7—Director, Ditech
Communications Corp. |
Robert G. Holmes
1931
Trustee
(Trustee of Schwab Capital Trust since 1989.) | | | | Chairman, Chief Executive Officer and Director, Semloh Financial, Inc. (international financial services and investment
advisory firm). | | 57 | | None. |
Gerald B. Smith
1950
Trustee
(Trustee of Schwab Capital Trust since 2000.) | | | | Chairman and Chief Executive Officer and founder of Smith Graham & Co.
(investment advisors). | | 57 | | Board 1—Board of Cooper Industries
Board 2—Chairman of the Audit Committee
of Northern Border Partners, M.L.P. |
100
Independent Trustees continued |
Name, Year of Birth,
and Position(s) with
the Trust; (Term of
Office, and Length of
Time Served1) | | | | Principal Occupations
During the Past Five Years | | Number of
Portfolios in
Fund Complex
Overseen by
the Trustee | | Other Directorships |
Donald R. Stephens
1938
Trustee
(Trustee of Schwab Capital Trust since 1989.) | | | | Managing Partner, D.R. Stephens & Company (investments). Prior to 1996, Chairman and Chief Executive Officer of North American Trust (real estate
investment trust). | | 57 | | None. |
Michael W. Wilsey
1943
Trustee
(Trustee of Schwab Capital Trust since 1989.) | | | | Chairman and Chief Executive Officer, Wilsey Bennett, Inc. (real estate investment and management, and other investments). | | 57 | | None. |
Interested Trustees |
Name, Year of Birth,
and Position(s) with
the Trust; (Term of
Office, and Length of
Time Served1) | | | | Principal Occupations
During the Past Five Years | | Number of
Portfolios in
Fund Complex
Overseen by
the Trustee | | Other Directorships |
Charles R. Schwab2
1937
Chairman and Trustee
(Chairman and Trustee
of Schwab Capital Trust
since 1989.) | | | | Chairman, Chief Executive Officer and Director, The Charles Schwab Corporation, Charles Schwab & Co., Inc.; Chairman and Director, Charles Schwab Investment Management, Inc., Charles Schwab Bank, N. A.; Chairman and Chief Executive Officer, Schwab (SIS) Holdings Inc. I, Schwab International Holdings, Inc.; Chief Executive Officer and Director, Schwab Holdings, Inc.; Director, U.S. Trust Company, N. A., U.S. Trust Corporation, United States Trust Company of New York. Until May 2003, Co-Chief Executive Officer, The Charles Schwab Corporation. | | 57 | | None. |
Randall W. Merk2
1954
Trustee
(Trustee of Schwab Capital Trust since 2005.) | | | | Executive Vice President and President, Schwab Financial Products, Charles Schwab & Co., Inc.; Director, Charles Schwab Asset Management (Ireland) Limited and Charles Schwab Worldwide Funds PLC. From September 2002 to July 2004, Chief Executive Officer and President, Charles Schwab Investment Management, Inc. and Executive Vice President, Charles Schwab & Co., Inc. Prior to September 2002, President and Chief Investment Officer, American Century Investment Management, and Director, American Century Companies, Inc. | | 96 | | None. |
101
Officers of the Trust |
Name, Year of Birth, and Position(s)
with the Trust; (Term of Office, and
Length of Time Served3) | | | | Principal Occupations During the Past Five Years |
Evelyn Dilsaver
1955
President and Chief Executive Officer
(Officer of Schwab Capital Trust since 2004.) | | | | President, Chief Executive Officer, and Director, Charles Schwab Investment Management, Inc.; Executive Vice President, Charles Schwab & Co., Inc; President and Chief Executive Officer, Laudus Trust and Laudus Variable Insurance Trust; President, Excelsior Funds Inc., Excelsior Tax-Exempt Funds, Inc., and Excelsior Funds Trust; President, Mutual Fund Division, UST Advisers, Inc. From June 2003 to July 2004, Senior Vice President, Asset Management Products and Services, Charles Schwab & Co., Inc. Prior to June 2003, Executive Vice President, Chief Financial Officer, and Chief Administrative Officer, U.S. Trust, a subsidiary of The Charles Schwab Corporation. |
George Pereira
1964
Treasurer and Principal Financial Officer
(Officer of Schwab Capital Trust since 2004.) | | | | Senior Vice President and Chief Financial Officer, Charles Schwab Investment Management, Inc.; Chief Financial Officer, Laudus Trust and Laudus Variable Insurance Trust; Treasurer, Chief Financial Officer and Chief Accounting Officer, Excelsior Funds Inc., Excelsior Tax-Exempt Funds, Inc., and Excelsior Funds Trust; Chief Financial Officer, Mutual Fund Division, UST Advisors, Inc. Director, Charles Schwab Worldwide Fund, PLC and Charles Schwab Asset Management (Ireland) Limited. From December 1999 to November 2004, Sr. Vice President, Financial Reporting, Charles Schwab & Co., Inc. |
Kimon Daifotis
1959
Senior Vice President and Chief
Investment Officer—Fixed Income
(Officer of Schwab Capital Trust since 2004.) | | | | Senior Vice President and Chief Investment Officer—Fixed Income, Charles Schwab Investment Management, Inc. Prior to 2004, Vice President and Sr. Portfolio Manager, Charles Schwab Investment Management, Inc. |
Jeffrey Mortimer
1963
Senior Vice President and Chief
Investment Officer—Equities
(Officer of Schwab Capital Trust since 2004.) | | | | Senior Vice President and Chief Investment Officer—Equities, Charles Schwab Investment Management, Inc.; Vice President and Chief Investment Officer, Laudus Trust and Laudus Variable Insurance Trust. Prior to 2004, Vice President and Sr. Portfolio Manager, Charles Schwab Investment Management, Inc. |
Randall Fillmore
1960
Chief Compliance Officer and AML Officer
(Officer of Schwab Capital Trust since 2002.) | | | | Senior Vice President and Chief Compliance Officer, Charles Schwab Investment Management, Inc.; Senior Vice President Charles Schwab & Co., Inc.; Chief Compliance Officer, Laudus Trust and Laudus Variable Insurance Trust; Chief Compliance Officer, Excelsior Funds Inc., Excelsior Tax-Exempt Funds, Inc., and Excelsior Funds Trust. From 2002 to 2003, Vice President, Charles Schwab & Co., Inc., and Charles Schwab Investment Management, Inc. From 2000 to 2002, Vice President, Internal Audit, Charles Schwab & Co., Inc. |
Koji E. Felton
1961
Secretary and Chief Legal Officer
(Officer of Schwab Capital Trust since 1998.) | | | | Senior Vice President, Chief Counsel and Corporate Secretary, Charles Schwab Investment Management, Inc.; Senior Vice President and Deputy General Counsel, Charles Schwab & Co., Inc.; Chief Legal Officer, Laudus Trust and Laudus Variable Insurance Trust; Chief Legal Officer, Excelsior Funds Inc., Excelsior Tax-Exempt Funds, Inc., and Excelsior Funds Trust. Prior to June 1998, Branch Chief in Enforcement at U.S. Securities and Exchange Commission in San Francisco. |
Catherine MacGregor
1964
Vice President
(Officer of Schwab Capital Trust since 2005) | | | | Vice President, Charles Schwab & Co., Inc., Charles Schwab Investment Management, Inc., Laudus Trust and Laudus Variable Insurance Trust; since 2006, Chief Counsel, Laudus Trust and Laudus Variable Insurance Trust. Until July 2005, Senior Associate, Paul Hastings Janofsky & Walker LLP. |
102
Officers of the Trust (continued) |
Name, Year of Birth, and Position(s)
with the Trust; (Term of Office, and
Length of Time Served3) | | | | Principal Occupations During the Past Five Years |
Cathy Sabo
1964
Vice President
(Officer of Schwab Capital Trust since 2005) | | | | Vice President, Compliance, Charles Schwab Investment Management, Inc., Laudus Trust and Laudus Variable Insurance Trust. Until 2004, Vice President, Client, Sales & Services Controls, Charles Schwab & Co., Inc. |
Michael Haydel
1972
Vice President
(Officer of Schwab Capital Trust since 2006) | | | | Vice President, Asset Management Client Services, Charles Schwab & Co., Inc.; Vice President and AML Officer, Laudus Trust and Laudus Variable Insurance Trust. Until March 2004, Director Charles Schwab & Co., Inc. |
1 | | Trustees remain in office until they resign, retire or are removed by shareholder vote. The Schwab Funds retirement policy requires that independent trustees elected after January 1, 2000 retire at age 72 or after twenty years of service as a trustee, whichever comes first. Independent trustees elected prior to January 1, 2000 will retire on the following schedule: Messrs. Holmes and Dorward will retire on December 31, 2007, and Messrs. Stephens and Wilsey will retire on December 31, 2010. |
2 | | In addition to their employment with the investment adviser and the distributor, Messrs. Schwab and Merk also own stock of The Charles Schwab Corporation. Mr. Schwab and Mr. Merk are Interested Trustees because they are employees of Schwab and/or the adviser. |
3 | | The President, Treasurer and Secretary hold office until their respective successors are chosen and qualified or until he or she sooner dies, resigns, is removed or becomes disqualified. Each other officer serves at the pleasure of the Board. |
103
Glossary
asset allocation The practice of dividing a portfolio among different asset classes, with each asset class assigned a particular percentage.
asset class A group of securities with similar structure and basic characteristics. Stocks, bonds and cash are the three main examples of asset classes.
beta A historical measure of an investment’s volatility relative to a market index (usually the S&P 500®). The index is defined as having a beta of 1.00. Investments with a beta higher than 1.00 have been more volatile than the index; those with a beta of less than 1.00 have been less volatile.
bond A security representing a loan from the investor to the issuer. A bond typically pays interest at a fixed rate (the “coupon rate”) until a specified date (the “maturity date”), at which time the issuer returns the money borrowed (“principal” or “face value”) to the bondholder. Because of their structure, bonds are sometimes called “fixed income securities” or “debt securities.”
An individual bond is subject to the credit risk of the issuer. Changes in interest rates can affect a bond’s market value prior to call or maturity. There is no guarantee that a bond’s yield to call or maturity will provide a positive return over the rate of inflation.
bond fund A bond fund is subject to the same credit, interest rate, and inflation risks as bonds. In addition, a bond fund incurs ongoing fees and expenses. A bond fund’s net asset value will fluctuate with the price of the underlying bonds and the portfolio turnover activity; return of principal is not guaranteed.
cap, capitalization See “market cap.”
capital gain, capital loss The difference between the amount paid for an investment and its value at a later time. If the investment has been sold, the capital gain or loss is considered a realized gain or loss. If the investment is still held, the gain or loss is still “on paper” and is considered unrealized.
earnings growth rate For a mutual fund, the average yearly rate at which the earnings of the companies in the fund’s portfolio have grown, measured over the past five years.
earnings per share (EPS) A company’s earnings, or net income, for the past 12 months, divided by the number of shares outstanding.
expense ratio The amount that is taken from a mutual fund’s assets each year to cover the fund’s operating expenses. An expense ratio of 0.50% means that a fund’s expenses amount to half of one percent of its average net assets a year.
market cap, market capitalization The value of a company as determined by the total value of all shares of its stock outstanding.
median market cap The midpoint of the range of market caps of the stocks held by a fund. There are different ways of calculating median market cap. With a simple median, half of the stocks in the fund’s portfolio would be larger than the median, and half would be smaller. With a weighted median (the type that is calculated for these funds), half of the fund’s assets are invested in stocks that are larger than the median market cap, and half in stocks that are smaller.
net asset value (NAV) The value of one share of a mutual fund. NAV is calculated by taking the fund’s total assets, subtracting liabilities, and dividing by the number of shares outstanding.
outstanding shares, shares outstanding When speaking of a company or mutual fund, indicates all shares currently held by investors.
price-to-book ratio (P/B) The market price of a company’s stock compared with its “book value.” A mutual fund’s P/B is the weighted average of the P/B of all stocks in the fund’s portfolio.
price-to-earnings ratio (P/E) The market price of a company’s stock compared with earnings over the past year. A mutual fund’s P/E is the weighted average of the P/E of all stocks in the fund’s portfolio.
return on equity (ROE) The average yearly rate of return for each dollar of investors’ money, measured over the past five years.
stock A share of ownership, or equity, in the issuing company.
total return The percentage that an investor would have earned or lost on an investment in the fund assuming dividends and distributions were reinvested.
weighted average For mutual funds, an average that gives the same weight to each security as the security represents in the fund’s portfolio.
yield The income paid out by an investment, expressed as a percentage of the investment’s market value.
The industry/sector classification of the funds’ portfolio holdings uses the Global Industry Classification Standard (GICS) which was developed by and is the exclusive property of Morgan Stanley Capital International Inc. and Standard & Poor’s. GICS is a service mark of MSCI and S&P and has been licensed for use by Charles Schwab & Co., Inc.
104
Schwab Funds® offers you an extensive family of mutual funds, each one based on a clearly defined investment approach and using disciplined management strategies. The list at right shows all currently available Schwab Funds. Whether you’re an experienced investor or just starting out, Schwab Funds can help you achieve your financial goals. An investor should consider a fund’s investment objectives, risks, and charges and expenses carefully before investing or sending money. This and other important information can be found in the fund’s prospectus. Please call 1-800-435-4000 for a prospectus and brochure for any Schwab Fund. Please read the prospectus carefully before you invest. This report must be preceded or accompanied by a current prospectus. Proxy Voting Policies, Procedures and Results A description of the proxy voting policies and procedures used to determine how to vote proxies on behalf of the funds is available without charge, upon request, by visiting Schwab’s website at www.schwab.com/schwabfunds, the SEC’s website at www.sec.gov, or by contacting Schwab Funds at 1-800-435-4000. Information regarding how a fund voted proxies relating to portfolio securities during the most recent twelve-month period ended June 30 is available, without charge, by visiting Schwab’s website at www.schwab.com/schwabfunds or the SEC’s website at www.sec.gov. | | The Schwab Funds Family® Stock Funds Schwab Premier Equity Fund®
Schwab Core Equity Fund™
Schwab Dividend Equity Fund™
Schwab Large-Cap Growth Fund™
Schwab Small-Cap Equity Fund™
Schwab Hedged Equity Fund™
Schwab Financial Services Fund™
Schwab Health Care Fund™
Schwab Technology Fund™
Schwab Institutional Select® S&P 500 Fund
Schwab S&P 500 Index Fund
Schwab 1000 Index® Fund
Schwab Small-Cap Index Fund®
Schwab Total Stock Market Index Fund®
Schwab International Index Fund®
Asset Allocation Funds Schwab Viewpoints Fund™
Schwab MarketTrack All Equity Portfolio™
Schwab MarketTrack Growth Portfolio™
Schwab MarketTrack Balanced Portfolio™
Schwab MarketTrack Conservative Portfolio™
Schwab Target 2010 Fund
Schwab Target 2020 Fund
Schwab Target 2030 Fund
Schwab Target 2040 Fund
Schwab Retirement Income Fund Bond Funds Schwab YieldPlus Fund®
Schwab Short-Term Bond Market Fund™
Schwab Total Bond Market Fund™
Schwab GNMA Fund™
Schwab Inflation Protected Fund™
Schwab Tax-Free YieldPlus Fund™
Schwab Short/Intermediate Tax-Free Bond Fund™
Schwab Long-Term Tax-Free Bond Fund™
Schwab California Tax-Free YieldPlus Fund™
Schwab California Short/Intermediate
Tax-Free Bond Fund™
Schwab California Long-Term Tax-Free Bond Fund™ Schwab Money Funds Schwab offers an array of money market funds that seek high current income consistent with safety and liquidity.1 Choose from taxable or tax-advantaged alternatives. Many can be linked to your eligible Schwab account to “sweep” cash balances automatically, subject to availability, when you’re between investments. Or, for your larger cash reserves, choose one of our Value Advantage Investments®. |
1 | | Investments in money market funds are neither insured nor guaranteed by the Federal Deposit Insurance Corporation (FDIC) or any other government agency and, although they seek to preserve the value of your investment at $1 per share, it is possible to lose money. |
Investment Adviser
Charles Schwab Investment Management, Inc.
101 Montgomery Street, San Francisco, CA 94104
Funds
Schwab Funds®
P.O. Box 3812, Englewood, CO 80155—3812
This report is not authorized for distribution to prospective investors unless preceded or accompanied by a current prospectus.
© 2006 Charles Schwab & Co., Inc. All rights reserved.
Member SIPC
Printed on recycled paper.
MFR26298-03
Schwab Target Funds
Annual Report
October 31, 2006
Schwab Target 2010 Fund
Schwab Target 2020 Fund
Schwab Target 2030 Fund
Schwab Target 2040 Fund
Schwab Retirement Income Fund
A suite of five mutual funds to help keep your retirement investments properly allocated over your lifetime.
In this report
| Performance at a Glance | | | | | 1 | |
| From the Chairman | | | | | 2 | |
| From the President | | | | | 3 | |
| Investment Environment | | | | | 4 | |
| Schwab Target 2010 Fund | | | | | 6 | |
| Schwab Target 2020 Fund | | | | | 8 | |
| Schwab Target 2030 Fund | | | | | 10 | |
| Schwab Target 2040 Fund | | | | | 12 | |
| Schwab Retirement Income Fund | | | | | 14 | |
| Fund Expenses | | | | | 16 | |
| Financial Statements | | | | | 17 | |
| Financial Notes | | | | | 42 | |
| Investment Advisory Agreement Approval | | | | | 49 | |
| Trustees and Officers | | | | | 51 | |
| Glossary | | | | | 55 | |
The industry/sector classification of the funds’ fund holdings uses the Global Industry Classification Standard (GICS) which was developed by and is the exclusive property of Morgan Stanley Capital International Inc. and Standard & Poor’s. GICS is a service mark of MSCI and S&P and has been licensed for use by Charles Schwab & Co., Inc.
Fund investment adviser: Charles Schwab Investment Management, Inc. (CSIM).
Distributor and transfer agent: Charles Schwab & Co., Inc. (Schwab).
Performance at a Glance
The performance data quoted represents past performance. Past performance does not guarantee future results. Investment returns and principal value will fluctuate so that an investor’s shares may be worth more or less than their original cost. Current performance may be lower or higher than performance data quoted. To obtain performance information current to the most recent month end, please visit www.schwab.com/schwabfunds.
|
|
|
| Total Return for the Report Period
|
|---|
Schwab Target 2010 Fund (Ticker Symbol: SWBRX) | | | | | 13.39 | % |
| Benchmark: Target 2010 Composite Index | | | | | 14.00 | % |
| Fund Category: Morningstar Target-Date 2000–2014 | | | | | 9.42 | % |
Performance Details | | | | | pages 6–7 | |
| | | | | | | |
Schwab Target 2020 Fund (Ticker Symbol: SWCRX)2 | | | | | 14.25 | % |
| Benchmark: Target 2020 Composite Index | | | | | 15.03 | % |
| Fund Category: Morningstar Target-Date 2015–2029 | | | | | 13.52 | % |
Performance Details | | | | | pages 8–9 | |
| | | | | | | |
Schwab Target 2030 Fund (Ticker Symbol: SWDRX) | | | | | 14.99 | % |
| Benchmark: Target 2030 Composite Index | | | | | 15.96 | % |
| Fund Category: Morningstar Target-Date 2030+ | | | | | 15.46 | % |
Performance Details | | | | | pages 10–11 | |
| | | | | | | |
Schwab Target 2040 Fund (Ticker Symbol: SWERX) | | | | | 16.06 | % |
| Benchmark: Target 2040 Composite Index | | | | | 17.00 | % |
| Fund Category: Morningstar Target-Date 2030+ | | | | | 15.46 | % |
Performance Details | | | | | pages 12–13 | |
| | | | | | | |
Schwab Retirement Income Fund (Ticker Symbol: SWARX) | | | | | 7.52 | % |
| Benchmark: Target Income Composite Index | | | | | 7.74 | % |
| Fund Category: Morningstar Conservative Allocation | | | | | 8.43 | % |
Performance Details | | | | | pages 14–15 | |
| | | | | | | |
Minimum Initial Investment1 | | | | | | |
| ($1,000 for custodial accounts) | | | | | $2,500 | |
All fund and index figures on this page assume dividends and distributions were reinvested. Index figures do not include trading and management costs, which would lower performance. Indices are unmanaged, and you cannot invest in them directly. Performance results less than one year are not annualized.
Expenses may be partially absorbed by CSIM and Schwab. Without these reductions, the funds’ total returns would have been lower. Performance does not reflect the deduction of taxes that a shareholder would pay on fund distributions or on the redemption of fund shares.
The Target 2010 Composite Index is derived using the following portion allocations: 48% Dow Jones Wilshire 5000 Composite Index, 16% MSCI EAFE Index, 34% Lehman Brothers U.S. Aggregate Bond Index, and 2% Lehman Brothers U.S. Treasury Bills: 1–3 Months.
The Target 2020 Composite Index is derived using the following portion allocations: 53% Dow Jones Wilshire 5000 Composite Index, 18% MSCI EAFE Index, 27% Lehman Brothers U.S. Aggregate Bond Index, and 2% Lehman Brothers U.S. Treasury Bills: 1–3 Months.
The Target 2030 Composite Index is derived using the following portion allocations: 59% Dow Jones Wilshire 5000 Composite Index, 19% MSCI EAFE Index, 20% Lehman Brothers U.S. Aggregate Bond Index, and 2% Lehman Brothers U.S. Treasury Bills: 1–3 Months.
The Target 2040 Composite Index is derived using the following portion allocations: 64% Dow Jones Wilshire 5000 Composite Index, 21% MSCI EAFE Index, 13% Lehman Brothers U.S. Aggregate Bond Index, and 2% Lehman Brothers U.S. Treasury Bills: 1–3 Months.
The Target Income Composite Index is derived using the following portion allocations: 15% Dow Jones Wilshire 5000 Composite Index, 5% MSCI EAFE Index, 50% Lehman Brothers U.S. Aggregate Bond Index, and 30% Lehman Brothers U.S. Treasury Bills: 1–3 Months.
Source for category information: Morningstar, Inc.
1Please see prospectus for further detail and eligibility requirements.
2One year return presented in the table differs from the return in the Financial Highlights. This is a result of the calculation of the Financial Highlights return adhering to GAAP presentation.
Schwab Target Funds 1
| | | From the Chairman |
Charles Schwab
Chairman | | Dear Shareholder, I founded Schwab over thirty years ago to be a home for serious investors. That mission continues to guide us today as we constantly strive to improve and innovate. By doing this, and providing some of the highest quality products and services — at a competitive price — we remain true to our heritage. I take particular pride in the Schwab Funds. Founded over 15 years ago, Schwab Funds now includes more than 50 funds with over $170 billion in assets. With a variety of investment strategies, Schwab Funds provides a range of innovative investment choices that can serve as a foundation for your asset allocation plan, including the Schwab Target Funds, contained within this book. The Schwab Target Funds are asset allocation funds that are actively managed to adjust over time as you approach retirement. Research has shown that asset allocation can be the most important factor in determining overall portfolio performance. The Schwab Target Funds offer investors a convenient way to allocate their investment across management strategies and asset classes to help balance risk while seeking to provide competitive returns. Schwab Funds are managed by Charles Schwab Investment Management, Inc., one of the largest mutual fund managers in the U.S. Our portfolio managers share a passion for market analysis and use some of the most sophisticated financial models in the country. I am proud of their depth of experience, which reflects an average of 14 years in the investment industry. Furthermore, I am impressed by the commitment that our managers bring to the stewardship of their funds, for you, their shareholders. In closing, I want to thank you for investing with us. We work every day to warrant the trust you have placed in us; that will never change. Sincerely, |
2 Schwab Target Funds
| | | From the President |
Evelyn Dilsaver is President and
CEO of Charles Schwab Investment
Management, Inc. and of each of
the funds covered in this report.
She joined the firm in 1992 and
has held a variety of executive
positions at Schwab. | | Dear Shareholder, I am pleased to present the annual report for the Schwab Target Funds for the period ended October 31, 2006. Schwab Target Funds are asset allocation funds designed for retirement investing. The four dated funds are actively managed to adjust over time as you approach retirement while one is designed to help produce income with additional growth potential for those in retirement. With this report, you will see that we have recently started an initiative to enhance the presentation of our shareholder reports to make it easier for you to find information about your fund. This book represents the first step in this process, with additional changes anticipated for future report cycles. You will notice, for example, that we have added a new lead page, Performance at a Glance, which includes the Funds’ ticker symbols and report period returns for the funds, their benchmarks and category averages. For ease of reference, we have relocated the fund manager’s discussion to be in close proximity to the fund performance and portfolio statistics sections. At this time, I would like to highlight another valuable information resource for fund shareholders, namely, our website at www.schwabfunds.com. This website contains regular updates about the Schwab Funds. I encourage you
to visit the website to stay informed about your fund. I’d like to emphasize that your trust is very important to us and I will do all I can to maintain that trust. Thank you for investing in Schwab Funds. Sincerely, |
Schwab Target Funds 3
The Investment Environment

Jeffrey Mortimer, CFA, senior vice
president and chief investment
officer, equities, is responsible for
the overall management of the funds. | | As the U.S. economy transitioned to slower growth, equities markets rebounded, aided by higher corporate profitability, falling energy/commodity prices, and lower interest rates. The S&P 500 Index returned 16.34% and the Russell 2000 Index returned 19.98%, respectively, for the one-year report period ended October 31, 2006. Improving fundamentals and attractive valuations strengthened investor interest in emerging markets and the MSCI EAFE (Morgan Stanley Capital International, Inc. Europe, Australasia, and Far East) Index returned 27.52%. Performance in the bond markets has been mixed over the year, although the Lehman Brothers U.S. Aggregate Bond Index gained 5.19%. Several key issues continued to resonate with investors, including slowing economic growth, Federal Reserve (the Fed) policy, a sluggish real estate market, inflation concerns, and fluctuating energy prices. Economic growth has been anything but predictable over the past year. The last quarter of 2005 saw Gross Domestic Product (GDP) slow considerably as the economy adjusted to changes in inventories and higher energy prices. Although Hurricane Katrina remained a focal point in the news late in 2005, its economic impact was determined to be minimal as damage remained contained within the hurricane’s path. In the first quarter of 2006, GDP then rebounded, only to slow later in the year. Though falling existing home sales and lower motor vehicle production have done much to curtail growth in the eyes of the Fed, favorable labor market conditions, sustained increases in labor income, and lower energy prices continued to promote stable growth. The unemployment rate fell to a cyclical low of 4.4% in the third quarter of 2006 while consumer spending and business investment remained key contributors to GDP growth. |
| | | |
Asset Class Performance Comparison % returns during the report period |
| |
This graph compares the performance of various asset classes during the report period. Final performance figures for the period are in the key below.
| | |
| o 16.34% | S&P 500® Index: measures U.S. large-cap stocks. |
| o 19.98% | Russell 2000® Index: measures U.S. small-cap stocks |
| o 27.52% | MSCI EAFE® Index: measures (in U.S. dollars) large-cap stocks in Europe, Australasia and the Far East |
| o 5.19% | Lehman Brothers U.S. Aggregate Bond Index: measures the U.S. bond market |
| o 4.57% | Three-Month U.S. Treasury Bills (T-bills): measures short-term U.S. Treasury obligations |
These figures assume dividends and distributions were reinvested. Index figures do not include trading and management costs, which would lower performance. Indices are unmanaged and you cannot invest in them directly. Remember that past performance is not an indication of future results.
Data source: Charles Schwab & Co., Inc.
4 Schwab Target Funds
The Investment Environment continued
In efforts to curb inflationary pressures, the Fed raised short-term interest rates six times during the period. August marked a key point in the year as Committee members decided to hold the Fed’s target rate at 5.25%, where it remained as of the end of the report period. In its statement, the Fed noted that the economy appeared to be growing at a more moderate rate as a result of prior rate increases, lagged effects of energy prices, and a cooling of the housing market. The Fed indicated they generally expected the economy to grow at a pace below its potential, which proved to be an accurate prediction. Consistent with the Fed’s report, GDP continued to decline, growing only 2.2% in the third quarter of 2006.
Energy prices have been a key issue in the markets over the past year. Following Hurricane Katrina, oil prices peaked around $71 per barrel, with domestic gasoline prices passing $3.00 a gallon. Prices subsequently fell, but rebounded nearly 21% early in 2006, partly due to concerns that Iran might cut back exports in response to a dispute over their nuclear program. Prices declined throughout the report period due to a lack of hurricanes in the Gulf of Mexico, as well as an increase in U.S. fuel inventories. More recently, abundant inventories, warmer weather, and skepticism regarding OPEC’s proposed production cuts contributed to a slip in oil prices. Crude oil has declined nearly 26% since July 2006’s record $78.40 per barrel, yet still remained around the $60–61 per barrel range at the end of the report period, as diminishing U.S. crude inventories and concern about global surplus lingered in investors’ minds.
The events of 2006 have also had a significant impact on the housing market. Housing starts fell considerably, down nearly 34% since the beginning of 2006. Existing home sales continued to decline as well, falling nearly 15% from their peak reached in 2005. Although sales have dropped, they remained strong by historical standards. Concerns remained as to whether the Fed’s actions, and the immediate effects on the housing market, would spill over into the rest of the economy. With regards to GDP, housing took off about one percent in the third quarter of 2006, although rebounds in income, consumer spending, and investments helped to offset the impact.
Despite a moderation in economic growth during the report period, economic fundamentals remained healthy as of the end of the period. The Fed’s task of balancing inflation pressures without significantly hindering economic growth
will be thoroughly scrutinized in the coming months. The challenge is to bring this economy to a state of stable growth and achieve a soft landing.
Nothing in this report represents a recommendation of a security by the investment adviser.
Manager views and portfolio holdings may have changed since the report date.
Schwab Target Funds 5
Schwab Target 2010 Fund

Jeffrey Mortimer (upper left)
CFA, senior vice president and
chief investment officer, equities,
is responsible for the overall
management of the fund.
Kimon Daifotis (upper right)
CFA, senior vice president and
chief investment officer, fixed-
income, is responsible for the
overall management of the bond
and cash portions of the fund.
Caroline Lee (lower right) direc-
tor and portfolio manager, is
responsible for the day-to-day
co-management of the fund.
Tom Brown (lower left) associate
portfolio manager, is responsible
for the day-to-day co-management
of the fund. | | The Schwab Target Funds all share the same investment approach: each seeks to achieve its objective by investing in a combination of other Schwab Funds and Laudus Funds. The underlying funds include a combination of equity, fixed income and money market mutual funds to meet their various target asset allocations and investment styles. Performance of the Schwab Target Funds (the funds) reflects a blend of the results of their underlying funds. The portfolios of the funds with an earlier target date are more heavily allocated to fixed income, ultra-short fixed income and money market funds and represent a more conservative style of investment, while portfolios of the funds with later target dates have a higher percentage of assets allocated to equity funds. Schwab Target 2010 Fund (the fund) returned 13.39% for the one-year period, slightly underperforming its benchmark, the Target 2010 Composite Index, yet beating its fund category average. The fund has the shortest time horizon of the four dated funds and as such, has the lowest percentage of its assets allocated to equities. The fund’s primary target allocations are 63% of assets in equity securities and 35% in fixed-income securities. The fund’s allocation to equity securities positively contributed to performance, as equity markets, both domestic and international, rallied during the one-year period. Within the equity allocation, outstanding funds included those with an international equity focus such as the Laudus Rosenberg International Small-Cap Fund Institutional Shares and the Laudus International MarketMasters Fund Select Shares. Within the fixed income allocation of the fund, the Schwab Total Bond Market Fund and the Schwab YieldPlus Fund Select Shares contributed to returns. During the report period, bond yields rose in line with Fed rate hikes and the yield curve became inverted. Towards the end of the period, economic news suggested inflation was receding and growth was slowing, causing bond yields to decline. With the exception of short term rates, the net change in yields throughout the period remained relatively slight. |
| | | |
| As of 10/31/06: | | |
Statistics |
| Number of Holdings | | 10 |
Weighted Average
Market Cap ($ x 1,000,000) | | 39,901 |
| Price/Earnings Ratio (P/E) | | 18.8 |
| Price/Book Ratio (P/B) | | 2.8 |
Asset Class Weightings % of Investments |
| Equity Funds — Domestic | | 45.7 | % |
| Fixed-Income Funds | | 34.1 | % |
| Equity Funds — International | | 16.6 | % |
| Short Term Investments | | 3.6 | % |
Total | | 100.0 | % |
Top Holdings % of Net Assets1 |
| Schwab Total Bond Market Fund | | 33.1 | % |
| Schwab Core Equity Fund | | 22.0 | % |
| Laudus International MarketMasters Fund, Select Shares | | 10.2 | % |
| Schwab Small-Cap Equity Fund, Select Shares | | 6.7 | % |
| Schwab Dividend Equity Fund, Select Shares | | 6.7 | % |
| Laudus Rosenberg U.S. Large Capitalization Growth Fund, Institutional Shares | | 6.4 | % |
| Laudus Rosenberg International Small Capitalization Fund, Institutional Shares | | 6.3 | % |
| Laudus Rosenberg U.S. Discovery Fund, Institutional Shares | | 3.7 | % |
| Schwab YieldPlus Fund, Select Shares | | 0.9 | % |
| Schwab Value Advantage Money Fund, Institutional Shares | | 0.9 | % |
Total | | 96.9 | % |
Portfolio holdings may have changed since the report date.
The Laudus Group of Funds includes the Laudus Rosenberg Funds, which are part of the Laudus Trust and distributed by ALPS Distributor, Inc., and the Laudus MarketMasters Funds, which are part of the Schwab Capital Trust and distributed by Charles Schwab & Co., Inc.
1This list is not a recommendation of any security by the investment adviser.
6 Schwab Target Funds
Schwab Target 2010 Fund
Performance Summary as of 10/31/06
The performance data quoted represents past performance. Past performance does not guarantee future results.
Investment returns and principal value will fluctuate so that an investor’s shares may be worth more or less than their original cost. Current performance may be lower or higher than performance data quoted. To obtain performance information current to the most recent month end, please visit www.schwab.com/schwabfunds.
Performance of a Hypothetical
$10,000 Investment1,3 | | | |
| | | |
Average Annual Total Returns1,2 |
| | | | | | | | | 1 year | | Since Inception |
| Fund: Schwab Target 2010 Fund (7/1/05) | | | | | | | | | | | | | 13.39 | % | | | 11.80 | % |
| Benchmark: Target 2010 Composite Index | | | | | | | | | | | | | 14.00 | % | | | 11.67 | % |
| Fund Category: Morningstar Target-Date 2000–2014 | | | | | | | | | | | | | 9.42 | % | | | 6.84 | % |
All figures on this page assume dividends and distributions were reinvested. Index figures do not include trading and management costs, which would lower performance. Indices are unmanaged, and you cannot invest in them directly. Performance results less than one year are not annualized.
1Fund expenses may have been partially absorbed by CSIM and Schwab. Without these reductions, the fund’s returns would have been lower. These returns do not reflect the deduction of taxes that a shareholder would pay on fund distributions or the redemption of fund shares.
2Source for category information: Morningstar, Inc.
3The Target 2010 Composite Index is derived using the following portion allocations: 48% Dow Jones Wilshire 5000 Composite Index, 16% MSCI EAFE Index, 34% Lehman Brothers U.S. Aggregate Bond Index, and 2% Lehman Brothers U.S. Treasury Bills: 1–3 Months.
Schwab Target Funds 7
Schwab Target 2020 Fund
Jeffrey Mortimer (upper left)
CFA, senior vice president and
chief investment officer, equities,
is responsible for the overall
management of the fund.
Kimon Daifotis (upper right)
CFA, senior vice president and
chief investment officer, fixed-
income, is responsible for the
overall management of the bond
and cash portions of the fund.
Caroline Lee (lower right) direc-
tor and portfolio manager, is
responsible for the day-to-day
co-management of the fund.
Tom Brown (lower left) associate
portfolio manager, is responsible
for the day-to-day co-management
of the fund. | | The Schwab Target Funds all share the same investment approach: each seeks to achieve its objective by investing in a combination of other Schwab Funds and Laudus Funds. The underlying funds include a combination of equity, fixed income and money market mutual funds to meet their various target asset allocations and investment styles. Performance of the Schwab Target Funds (the funds) reflects a blend of the results of their underlying funds. The portfolios of the funds with an earlier target date are more heavily allocated to fixed income, ultra-short fixed income and money market funds and represent a more conservative style of investment, while portfolios of the funds with later target dates have a higher percentage of assets allocated to equity funds. Schwab Target 2020 Fund (the fund) returned 14.25% for the report period, outperforming its category average yet slightly underperforming its benchmark, the Target 2020 Composite Index. The fund has the second shortest time horizon of the four dated funds and allocates its assets primarily to equity securities and fixed-income securities. The fund’s primary target allocations are 70% of assets in equity securities and 28% of its assets in fixed-income securities. The fund’s emphasis on equity securities positively contributed to performance, as equity markets, both domestic and international, rallied during the one-year period. Within the equity allocation, outstanding funds included those with an international equity focus such as the Laudus Rosenberg International Small-Cap Fund Institutional Shares and the Laudus International MarketMasters Fund Select Shares. Within the fixed income allocation of the fund, the Schwab Total Bond Market Fund and the Schwab YieldPlus Fund Select Shares contributed to returns. During the report period, bond yields rose in line with Fed rate hikes and the yield curve became inverted. Towards the end of the period, economic news suggested inflation was receding and growth was slowing, causing bond yields to decline. With the exception of short term rates, the net change in yields throughout the period remained relatively slight. |
| | | |
| As of 10/31/06: | | |
Statistics |
| Number of Holdings | | 10 |
Weighted Average
Market Cap ($ x 1,000,000) | | 39,697 |
| Price/Earnings Ratio (P/E) | | 18.8 |
| Price/Book Ratio (P/B) | | 2.8 |
Asset Class Weightings % of Investments |
| Equity Funds — Domestic | | 50.8 | % |
| Fixed-Income Funds | | 27.2 | % |
| Equity Funds — International | | 17.8 | % |
| Short-Term Investments | | 4.2 | % |
Total | | 100.0 | % |
Top Holdings % of Net Assets1 |
| Schwab Total Bond Market Fund | | 26.1 | % |
| Schwab Core Equity Fund | | 23.6 | % |
| Laudus International MarketMasters Fund, Select Shares | | 9.8 | % |
| Laudus Rosenberg International Small Capitalization Fund, Institutional Shares | | 8.0 | % |
| Schwab Dividend Equity Fund, Select Shares | | 7.9 | % |
| Schwab Small-Cap Equity Fund, Select Shares | | 7.9 | % |
| Laudus Rosenberg U.S. Large Capitalization Growth Fund, Institutional Shares | | 7.5 | % |
| Laudus Rosenberg U.S. Discovery Fund, Institutional Shares | | 3.7 | % |
| Schwab YieldPlus Fund, Select Shares | | 0.9 | % |
| Schwab Value Advantage Money Fund, Institutional Shares | | 0.9 | % |
Total | | 96.3 | % |
Portfolio holdings may have changed since the report date.
Source of Sector Classification: S&P and MSCI.
The Laudus Group of Funds includes the Laudus Rosenberg Funds, which are part of the Laudus Trust and distributed by ALPS Distributor, Inc., and the Laudus MarketMasters Funds, which are part of the Schwab Capital Trust and distributed by Charles Schwab & Co., Inc.
1This list is not a recommendation of any security by the investment adviser.
8 Schwab Target Funds
Schwab Target 2020 Fund
Performance Summary as of 10/31/06
The performance data quoted represents past performance. Past performance does not guarantee future results.
Investment returns and principal value will fluctuate so that an investor’s shares may be worth more or less than their original cost. Current performance may be lower or higher than performance data quoted. To obtain performance information current to the most recent month end, please visit www.schwab.com/schwabfunds.
Performance of a Hypothetical
$10,000 Investment1,3 | | | |
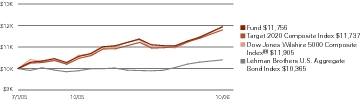
| | | |
Average Annual Total Returns1,2 |
| | | | | | | | | 1 year | | Since Inception |
| Fund: Schwab Target 2020 Fund (7/1/05) | | | | | | | | | | | | | 14.25 | % | | | 12.83 | % |
| Benchmark: Target 2020 Composite Index | | | | | | | | | | | | | 15.03 | % | | | 12.71 | % |
| Fund Category: Morningstar Target-Date 2015–2029 | | | | | | | | | | | | | 13.52 | % | | | 10.53 | % |
All figures on this page assume dividends and distributions were reinvested. Index figures do not include trading and management costs, which would lower performance. Indices are unmanaged, and you cannot invest in them directly. Performance results less than one year are not annualized.
1Fund expenses may have been partially absorbed by CSIM and Schwab. Without these reductions, the fund’s returns would have been lower. These returns do not reflect the deduction of taxes that a shareholder would pay on fund distributions or the redemption of fund shares.
2Source for category information: Morningstar, Inc.
3The Target 2020 Composite Index is derived using the following portion allocations: 53% Dow Jones Wilshire 5000 Composite Index, 18% MSCI EAFE Index, 27% Lehman Brothers U.S. Aggregate Bond Index, and 2% Lehman Brothers U.S. Treasury Bills: 1–3 Months.
Schwab Target Funds 9
Schwab Target 2030 Fund
Jeffrey Mortimer (upper left)
CFA, senior vice president and
chief investment officer, equities,
is responsible for the overall
management of the fund.
Kimon Daifotis (upper right)
CFA, senior vice president and
chief investment officer, fixed-
income, is responsible for the
overall management of the bond
and cash portions of the fund.
Caroline Lee (lower right) direc-
tor and portfolio manager, is
responsible for the day-to-day
co-management of the fund.
Tom Brown (lower left) associate
portfolio manager, is responsible
for the day-to-day co-management
of the fund. | | The Schwab Target Funds all share the same investment approach: each seeks to achieve its objective by investing in a combination of other Schwab Funds and Laudus Funds. The underlying funds include a combination of equity, fixed income and money market mutual funds to meet their various target asset allocations and investment styles. Performance of the Schwab Target Funds (the funds) reflects a blend of the results of their underlying funds. The portfolios of the funds with an earlier target date are more heavily allocated to fixed income, ultra-short fixed income and money market funds and represent a more conservative style of investment, while portfolios of the funds with later target dates have a higher percentage of assets allocated to equity funds. Schwab Target 2030 Fund (the fund) returned 14.99% for the one-year period, trailing its benchmark, Target 2030 Composite Index. The fund has the second farthest time horizon of the four dated funds and as such, has an even larger percentage of its assets allocated to equities as compared to its earlier dated counterparts. The fund’s primary asset allocation targets are 77% of its assets towards equity securities and 21% of its assets towards fixed-income securities. The fund’s emphasis on equity securities positively contributed to performance, as equity markets, both domestic and international, rallied during the one-year period. Within the equity allocation, outstanding funds included those with an international equity focus such as the Laudus Rosenberg International Small-Cap Fund Institutional Shares and the Laudus International MarketMasters Fund Select Shares. Within the fixed income allocation of the fund, the Schwab Total Bond Market Fund and Schwab YieldPlus Select Shares contributed to returns. During the report period, bond yields rose in line with Fed rate hikes and the yield curve became inverted. Towards the end of the period, economic news suggested inflation was receding and growth was slowing, causing bond yields to decline. With the exception of short term rates, the net change in yields throughout the period remained relatively slight. |
| | | |
| As of 10/31/06: | | |
Statistics |
| Number of Holdings | | 10 |
Weighted Average
Market Cap ($ x 1,000,000) | | 39,357 |
| Price/Earnings Ratio (P/E) | | 19.0 |
| Price/Book Ratio (P/B) | | 2.8 |
Asset Class Weightings % of Investments |
| Equity Funds — Domestic | | 56.4 | % |
| Fixed-Income Funds | | 20.7 | % |
| Equity Funds — International | | 18.7 | % |
| Short-Term Investments | | 4.2 | % |
Total | | 100.0 | % |
Top Holdings % of Net Assets1 |
| Schwab Core Equity Fund | | 26.5 | % |
| Schwab Total Bond Market Fund | | 19.7 | % |
| Laudus International MarketMasters Fund, Select Shares | | 11.7 | % |
| Schwab Small-Cap Equity Fund, Select Shares | | 9.6 | % |
| Schwab Dividend Equity Fund, Select Shares | | 7.9 | % |
| Laudus Rosenberg U.S. Large Capitalization Growth Fund, Institutional Shares | | 7.6 | % |
| Laudus Rosenberg International Small Capitalization Fund, Institutional Shares | | 6.9 | % |
| Laudus Rosenberg U.S. Discovery Fund, Institutional Shares | | 4.7 | % |
| Schwab YieldPlus Fund, Select Shares | | 1.0 | % |
| Schwab Value Advantage Money Fund, Institutional Shares | | 0.9 | % |
Total | | 96.5 | % |
Portfolio holdings may have changed since the report date.
Source of Sector Classification: S&P and MSCI.
The Laudus Group of Funds includes the Laudus Rosenberg Funds, which are part of the Laudus Trust and distributed by ALPS Distributor, Inc., and the Laudus MarketMasters Funds, which are part of the Schwab Capital Trust and distributed by Charles Schwab & Co., Inc.
1This list is not a recommendation of any security by the investment adviser.
10 Schwab Target Funds
Schwab Target 2030 Fund
Performance Summary as of 10/31/06
The performance data quoted represents past performance. Past performance does not guarantee future results.
Investment returns and principal value will fluctuate so that an investor’s shares may be worth more or less than their original cost. Current performance may be lower or higher than performance data quoted. To obtain performance information current to the most recent month end, please visit www.schwab.com/schwabfunds.
Performance of a Hypothetical
$10,000 Investment1,3 | | | |
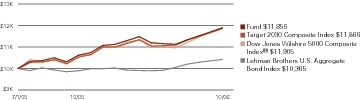
| | | |
Average Annual Total Returns1,2 |
| | | | | | | | | 1 year | | Since Inception |
| Fund: Schwab Target 2030 Fund (7/1/05) | | | | | | | | | | | | | 14.99 | % | | | 13.55 | % |
| Benchmark: Target 2030 Composite Index | | | | | | | | | | | | | 15.96 | % | | | 13.63 | % |
| Fund Category: Morningstar Target-Date 2030+ | | | | | | | | | | | | | 15.46 | % | | | 13.55 | % |
All figures on this page assume dividends and distributions were reinvested. Index figures do not include trading and management costs, which would lower performance. Indices are unmanaged, and you cannot invest in them directly. Performance results less than one year are not annualized.
1Fund expenses may have been partially absorbed by CSIM and Schwab. Without these reductions, the fund’s returns would have been lower. These returns do not reflect the deduction of taxes that a shareholder would pay on fund distributions or the redemption of fund shares.
2Source for category information: Morningstar, Inc.
3The Target 2030 Composite Index is derived using the following portion allocations: 59% Dow Jones Wilshire 5000 Composite Index, 19% MSCI EAFE Index, 20% Lehman Brothers U.S. Aggregate Bond Index, and 2% Lehman Brothers U.S. Treasury Bills: 1–3 Months.
Schwab Target Funds 11
Schwab Target 2040 Fund
Jeffrey Mortimer (upper left)
CFA, senior vice president and
chief investment officer, equities,
is responsible for the overall
management of the fund.
Kimon Daifotis (upper right)
CFA, senior vice president and
chief investment officer, fixed-
income, is responsible for the
overall management of the bond
and cash portions of the fund.
Caroline Lee (lower right) direc-
tor and portfolio manager, is
responsible for the day-to-day
co-management of the fund.
Tom Brown (lower left) associate
portfolio manager, is responsible
for the day-to-day co-management
of the fund. | | The Schwab Target Funds all share the same investment approach: each seeks to achieve its objective by investing in a combination of other Schwab Funds and Laudus Funds. The underlying funds include a combination of equity, fixed income and money market mutual funds to meet their various target asset allocations and investment styles. Performance of the Schwab Target Funds (the funds) reflects a blend of the results of their underlying funds. The portfolios of the funds with an earlier target date are more heavily allocated to fixed income, ultra-short fixed income and money market funds and represent a more conservative style of investment, while portfolios of the funds with later target dates have a higher percentage of assets allocated to equity funds. Schwab Target 2040 Fund (the fund) returned 16.06% for the one-year period, outperforming its category average yet slightly trailing its benchmark, the Target 2040 Composite Index. The fund has the longest time horizon of the four dated funds and as such, has the largest percentage of assets allocated to equity securities. The fund’s primary target allocations are 84% of its assets to equity securities and 14% of its assets to fixed-income securities. The fund’s emphasis on equity securities positively contributed to performance, as equity markets, both domestic and international, rallied during the one-year period. Within the equity allocation, outstanding funds included those with an international equity focus such as the Laudus Rosenberg International Small-Cap Fund Institutional Shares and the Laudus International MarketMasters Fund Select Shares. Within the fixed income allocation of the fund, the Schwab Total Bond Market Fund and Schwab YieldPlus Fund Select Shares contributed to returns. During the report period, bond yields rose in line with Fed rate hikes and the yield curve became inverted. Towards the end of the period, economic news suggested inflation was receding and growth was slowing, causing bond yields to decline. With the exception of short term rates, the net change in yields throughout the period remained relatively slight. |
| | | |
| As of 10/31/06: | | |
Statistics |
| Number of Holdings | | 10 |
Weighted Average
Market Cap ($ x 1,000,000) | | 39,758 |
| Price/Earnings Ratio (P/E) | | 19.0 |
| Price/Book Ratio (P/B) | | 2.8 |
Asset Class Weightings % of Investments |
| Equity Funds — Domestic | | 60.7 | % |
| Equity Funds — International | | 20.4 | % |
| Fixed-Income Funds | | 14.0 | % |
| Short-Term Investments | | 4.9 | % |
Total | | 100.0 | % |
Top Holdings % of Net Assets1 |
| Schwab Core Equity Fund | | 27.0 | % |
| Schwab Total Bond Market Fund | | 13.0 | % |
| Laudus International MarketMasters Fund, Select Shares | | 12.4 | % |
| Schwab Small-Cap Equity Fund, Select Shares | | 10.3 | % |
| Schwab Dividend Equity Fund, Select Shares | | 8.8 | % |
| Laudus Rosenberg U.S. Large Capitalization Growth Fund, Institutional Shares | | 8.4 | % |
| Laudus Rosenberg International Small Capitalization Fund, Institutional Shares | | 7.8 | % |
| Laudus Rosenberg U.S. Discovery Fund, Institutional Shares | | 5.5 | % |
| Schwab YieldPlus Fund, Select Shares | | 0.9 | % |
| Schwab Value Advantage Money Fund, Institutional Shares | | 0.9 | % |
Total | | 95.0 | % |
Portfolio holdings may have changed since the report date.
Source of Sector Classification: S&P and MSCI.
The Laudus Group of Funds includes the Laudus Rosenberg Funds, which are part of the Laudus Trust and distributed by ALPS Distributor, Inc., and the Laudus MarketMasters Funds, which are part of the Schwab Capital Trust and distributed by Charles Schwab & Co., Inc.
1This list is not a recommendation of any security by the investment adviser.
12 Schwab Target Funds
Schwab Target 2040 Fund
Performance Summary as of 10/31/06
The performance data quoted represents past performance. Past performance does not guarantee future results.
Investment returns and principal value will fluctuate so that an investor’s shares may be worth more or less than their original cost. Current performance may be lower or higher than performance data quoted. To obtain performance information current to the most recent month end, please visit www.schwab.com/schwabfunds.
Performance of a Hypothetical
$10,000 Investment1,3 | | | |
| | | |
Average Annual Total Returns1,2 |
| | | | | | | | | 1 year | | Since Inception |
| Fund: Schwab Target 2040 Fund (7/1/05) | | | | | | | | | | | | | 16.06 | % | | | 14.75 | % |
| Benchmark: Target 2040 Composite Index | | | | | | | | | | | | | 17.00 | % | | | 14.68 | % |
| Fund Category: Morningstar Target-Date 2030+ | | | | | | | | | | | | | 15.46 | % | | | 13.55 | % |
All figures on this page assume dividends and distributions were reinvested. Index figures do not include trading and management costs, which would lower performance. Indices are unmanaged, and you cannot invest in them directly. Performance results less than one year are not annualized.
1Fund expenses may have been partially absorbed by CSIM and Schwab. Without these reductions, the fund’s returns would have been lower. These returns do not reflect the deduction of taxes that a shareholder would pay on fund distributions or the redemption of fund shares.
2Source for category information: Morningstar, Inc.
3The Target 2040 Composite Index is derived using the following portion allocations: 64% Dow Jones Wilshire 5000 Composite Index, 21% MSCI EAFE Index, 13% Lehman Brothers U.S. Aggregate Bond Index, and 2% Lehman Brothers U.S. Treasury Bills: 1–3 Months.
Schwab Target Funds 13
Schwab Retirement Income Fund
Jeffrey Mortimer (upper left)
CFA, senior vice president and
chief investment officer, equities,
is responsible for the overall
management of the fund.
Kimon Daifotis (upper right)
CFA, senior vice president and
chief investment officer, fixed-
income, is responsible for the
overall management of the bond
and cash portions of the fund.
Caroline Lee (lower right) direc-
tor and portfolio manager, is
responsible for the day-to-day
co-management of the fund.
Tom Brown (lower left) associate
portfolio manager, is responsible
for the day-to-day co-management
of the fund. | | The Schwab Target Funds all share the same investment approach: each seeks to achieve its objective by investing in a combination of other Schwab Funds and Laudus Funds. The underlying funds include a combination of equity, fixed income and money market mutual funds to meet their various target asset allocations and investment styles. Performance of the Schwab Target Funds (the funds) reflects a blend of the results of their underlying funds. The portfolios of the funds with an earlier target date and the Schwab Retirement Income Fund are more heavily allocated to fixed income, ultra-short fixed income and money market funds and represent a more conservative style of investment, while portfolios of the funds with later target dates have a higher percentage of assets allocated to equity funds. Schwab Retirement Income Fund (the fund) returned 7.52% for the period, slightly underperforming its benchmark, the Target Income Composite Index. The fund is designed for investors currently in retirement, and as such, has a majority of its portfolio invested in fixed income, ultra-short fixed income and money market funds. In addition, it seeks to provide current income with equity growth potential. Since the fund invests up to 75% of its assets in fixed-income and ultra-short fixed-income securities, the performance of the bond market had a significant impact on the fund’s performance. Within the fixed income allocation of the fund, the Schwab Total Bond Market Fund and the Schwab YieldPlus Fund Select Shares contributed to returns. During the report period, bond yields rose in line with Fed rate hikes and the yield curve became inverted. Towards the end of the period, economic news suggested inflation was receding and growth was slowing, causing bond yields to decline. With the exception of short term rates, the net change in yields throughout the period remained relatively slight. The fund’s 20% target allocation to equity securities positively contributed to performance, as equity markets rallied during the one-year period. |
| | | |
| As of 10/31/06: | | |
Statistics |
| Number of Holdings | | 5 |
Weighted Average
Market Cap ($ x 1,000,000) | | 49,039 |
| Price/Earnings Ratio (P/E) | | 17.9 |
| Price/Book Ratio (P/B) | | 2.7 |
Asset Class Weightings % of Investments |
| Fixed-Income Funds | | 72.8 | % |
| Equity Funds — Domestic | | 15.7 | % |
| Short-Term Investments | | 6.6 | % |
| Equity Funds — International | | 4.9 | % |
Total | | 100.0 | % |
Top Holdings % of Net Assets1 |
| Schwab Total Bond Market Fund | | 48.2 | % |
| Schwab YieldPlus Fund, Select Shares | | 24.2 | % |
| Schwab Dividend Equity Fund, Select Shares | | 15.6 | % |
| Laudus International MarketMasters Fund, Select Shares | | 4.9 | % |
| Schwab Value Advantage Money Fund, Institutional Shares | | 4.6 | % |
Total | | 97.5 | % |
Portfolio holdings may have changed since the report date.
Source of Sector Classification: S&P and MSCI.
The Laudus Group of Funds includes the Laudus Rosenberg Funds, which are part of the Laudus Trust and distributed by ALPS Distributor, Inc., and the Laudus MarketMasters Funds, which are part of the Schwab Capital Trust and distributed by Charles Schwab & Co., Inc.
1This list is not a recommendation of any security by the investment adviser.
14 Schwab Target Funds
Schwab Retirement Income Fund
Performance Summary as of 10/31/06
The performance data quoted represents past performance. Past performance does not guarantee future results.
Investment returns and principal value will fluctuate so that an investor’s shares may be worth more or less than their original cost. Current performance may be lower or higher than performance data quoted. To obtain performance information current to the most recent month end, please visit www.schwab.com/schwabfunds.
Performance of a Hypothetical
$10,000 Investment1,3 | | | |
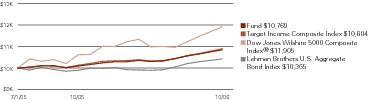
| | | |
Average Annual Total Returns1,2 |
| | | | | | | | | 1 year | | Since Inception |
| Fund: Schwab Retirement Income Fund (7/1/05) | | | | | | | | | | | | | 7.52 | % | | | 5.68 | % |
| Benchmark: Target Income Composite Index | | | | | | | | | | | | | 7.74 | % | | | 5.94 | % |
| Fund Category: Morningstar Conservative Allocation | | | | | | | | | | | | | 8.43 | % | | | 6.53 | % |
All figures on this page assume dividends and distributions were reinvested. Index figures do not include trading and management costs, which would lower performance. Indices are unmanaged, and you cannot invest in them directly. Performance results less than one year are not annualized.
1Fund expenses may have been partially absorbed by CSIM and Schwab. Without these reductions, the fund’s returns would have been lower. These returns do not reflect the deduction of taxes that a shareholder would pay on fund distributions or the redemption of fund shares.
2Source for category information: Morningstar, Inc.
3The Target Income Composite Index is derived using the following portion allocations: 15% Dow Jones Wilshire 5000 Composite Index, 5% MSCI EAFE Index, 50% Lehman Brothers U.S. Aggregate Bond Index, and 30% Lehman Brothers U.S. Treasury Bills: 1–3 Months.
Schwab Target Funds 15
Fund Expenses (unaudited)
Examples for a $1,000 Investment |
As a fund shareholder, you incur two types of costs: transaction costs, such as redemption fees; and, ongoing costs, such as management fees, transfer agent and shareholder services fees, and other fund expenses.
The expense examples below are intended to help you understand your ongoing cost (in dollars) of investing in a fund and to compare this cost with the ongoing cost of investing in other mutual funds. These examples are based on an investment of $1,000 invested for six-months beginning May 1, 2006 and held through October 31, 2006.
Actual Return lines in the table below provide information about actual account values and actual expenses. You may use this information, together with the amount you invested, to estimate the expenses that you paid over the period. To do so, simply divide your account value by $1,000 (for example, an $8,600 account value ÷ $1,000 = 8.6), then multiply the result by the number given for your fund or share class under the heading entitled “Expenses Paid During Period.”
Hypothetical Return lines in the table below provide information about hypothetical account values and hypothetical expenses based on a fund’s or share class’ actual expense ratio and an assumed return of 5% per year before expenses. Because the return used is not an actual return, it may not be used to estimate the actual ending account value or expenses you paid for the period.
You may use this information to compare the ongoing costs of investing in the fund and other funds. To do so, compare this 5% hypothetical example with the 5% hypothetical examples that appear in the shareholder reports of the other funds.
Please note that the expenses shown in the table are meant to highlight your ongoing costs only, and do not reflect any transactional costs, such as redemption fees. If these transactional costs were included, your costs would have been higher.
|
|
|
| Expense Ratio1
(Annualized)
|
| Beginning
Account Value
at 5/1/06
|
| Ending Account
Account Value
(Net of Expenses)
at 10/31/06
|
| Expenses Paid
During Period2
5/1/06–10/31/06
|
|---|
Schwab 2010 Target Fund | | | | | | | | | | | | | | | | | | |
| Actual Return | | | | | 0.06 | % | | $ | 1,000 | | | $ | 1,034.40 | | | $ | 0.31 | |
| Hypothetical 5% Return | | | | | 0.06 | % | | $ | 1,000 | | | $ | 1,024.90 | | | $ | 0.31 | |
Schwab 2020 Target Fund | | | | | | | | | | | | | | | | | | |
| Actual Return | | | | | 0.04 | % | | $ | 1,000 | | | $ | 1,034.00 | | | $ | 0.21 | |
| Hypothetical 5% Return | | | | | 0.04 | % | | $ | 1,000 | | | $ | 1,025.00 | | | $ | 0.20 | |
Schwab 2030 Target Fund | | | | | | | | | | | | | | | | | | |
| Actual Return | | | | | 0.03 | % | | $ | 1,000 | | | $ | 1,032.70 | | | $ | 0.15 | |
| Hypothetical 5% Return | | | | | 0.03 | % | | $ | 1,000 | | | $ | 1,025.05 | | | $ | 0.15 | |
Schwab 2040 Target Fund | | | | | | | | | | | | | | | | | | |
| Actual Return | | | | | 0.01 | % | | $ | 1,000 | | | $ | 1,031.40 | | | $ | 0.05 | |
| Hypothetical 5% Return | | | | | 0.01 | % | | $ | 1,000 | | | $ | 1,025.16 | | | $ | 0.05 | |
Schwab Retirement Income Fund | | | | | | | | | | | | | | | | | | |
| Actual Return | | | | | 0.10 | % | | $ | 1,000 | | | $ | 1,039.90 | | | $ | 0.51 | |
| Hypothetical 5% Return | | | | | 0.10 | % | | $ | 1,000 | | | $ | 1,024.70 | | | $ | 0.51 | |
1Based on the most recent six-month expense ratio; may differ from the expense ratio provided in Financial Highlights; does not include expenses of underlying funds in which the Target Funds invest.
2Expenses for each fund or share class are equal to its annualized expense ratio, multiplied by the average account value over the period, multiplied by 184 days of the period, and divided by 365 days of the fiscal year.
16 Schwab Target Funds
Schwab Target 2010 Fund
Financial Statements
Financial Highlights
| | | | 11/1/05—
10/31/06
| | 7/1/051—
10/31/05
| |
| |
| |
| |
|
|---|
Per-Share Data ($) | | | | | | | | | | | | | | | | | | | | | | | | | | |
| Net asset value at beginning of period | | | | | 10.24 | | | | 10.00 | | | | | | | | | | | | | | | | | |
Income from investment operations:
| | | | | | | | | | | | | | | | | | | | | | | | | | |
| Net investment income | | | | | 0.22 | | | | 0.04 | | | | | | | | | | | | | | | | | |
| Net realized and unrealized gains | | | | | 1.13 | | | | 0.20 | | | | | | | | | | | | | | | | | |
| Total income from investment operations | | | | | 1.35 | | | | 0.24 | | | | | | | | | | | | | | | | | |
Less distributions:
| | | | | | | | | | | | | | | | | | | | | | | | | | |
| Dividends from net investment income | | | | | (0.17 | ) | | | — | | | | | | | | | | | | | | | | | |
| Net asset value at end of period | | | | | 11.42 | | | | 10.24 | | | | | | | | | | | | | | | | | |
| Total return (%) | | | | | 13.39 | | | | 2.40 | 2 | | | | | | | | | | | | | | | | |
| |
Ratios/Supplemental Data (%) | | | | | | | | | | | | | | | | | | | | | | | | | | |
Ratios to average net assets:
| | | | | | | | | | | | | | | | | | | | | | | | | | |
Net operating expenses3 | | | | | 0.06 | | | | 0.06 | 4 | | | | | | | | | | | | | | | | |
Gross operating expenses3 | | | | | 0.27 | | | | 0.37 | 4 | | | | | | | | | | | | | | | | |
| Net investment income | | | | | 2.12 | | | | 1.51 | 4 | | | | | | | | | | | | | | | | |
| Portfolio turnover rate | | | | | 0 | 5 | | | — | | | | | | | | | | | | | | | | | |
| Net assets, end of period ($ x 1,000,000) | | | | | 62 | | | | 32 | | | | | | | | | | | | | | | | | |
1 | | Commencement of operations. |
3 | | The expenses incurred by underlying funds in which the fund invests are not included in this ratio.
The income received by the portfolio from underlying funds is reduced by those expenses.
|
See financial notes. 17
Schwab Target 2010 Fund
Portfolio Holdings as of October 31, 2006
This section shows all the securities in the fund’s portfolio and their value as of the report date.
The fund files its complete schedule of portfolio holdings with the SEC for the first and third quarters of each fiscal year on Form N-Q. The fund’s Form N-Q is available on the SEC’s website at http://www.sec.gov and may be viewed and copied at the SEC’s Public Reference Room in Washington, D.C. Call 1-800-SEC-0330 for information on the operation of the Public Reference Room. The schedule of portfolio holdings filed on a fund’s most recent Form N-Q is also available by visiting Schwab’s website at www.schwab.com/schwabfunds.
Holdings by Category
|
| Cost
($ x 1,000)
|
| Value
($ x 1,000)
|
|
|---|
96.9% | | | | Other Investment Companies | | | 55,435 | | | | 60,115 | |
2.7% | | | | Short-Term Investment | | | 1,699 | | | | 1,699 | |
99.6% | | | | Total Investments | | | 57,134 | | | | 61,814 | |
0.4% | | | | Other Assets and Liabilities, Net | | | | | | | 222 | |
100.0% | | | | Total Net Assets | | | | | | | 62,036 | |
Security
| | | | Number
of Shares | | Value
($ x 1,000) |
|---|
Other Investment Companies 96.9% of net assets |
Equity Funds 62.0% |
Laudus International MarketMasters Fund, Select Shares (a) | | | | | 306,147 | | | | 6,358 | |
Laudus Rosenberg International Small Capitalization Fund, Institutional Shares (a) | | | | | 178,133 | | | | 3,912 | |
Laudus Rosenberg U.S. Discovery Fund, Institutional Shares (a) | | | | | 121,214 | | | | 2,302 | |
Laudus Rosenberg U.S. Large Capitalization Growth Fund, Institutional Shares (a) | | | | | 420,814 | | | | 3,964 | |
Schwab Core Equity Fund (a) | | | | | 742,979 | | | | 13,671 | |
Schwab Dividend Equity Fund, Select Shares (a) | | | | | 283,748 | | | | 4,143 | |
Schwab Small-Cap Equity Fund, Select Shares (a) | | | | | 233,285 | | | | 4,152 | |
| | | | | | | | | | 38,502 | |
Fixed-Income Funds 34.0% |
Schwab Total Bond Market Fund (a) | | | | | 2,088,164 | | | | 20,527 | |
Schwab YieldPlus Fund, Select Shares (a) | | | | | 56,292 | | | | 545 | |
| | | | | | | | | | 21,072 | |
Money Funds 0.9% |
Schwab Value Advantage Money Fund, Institutional Shares (a) | | | | | 541,166 | | | | 541 | |
Security
Rate, Maturity Date
| | | | Face Amount
($ x 1,000) | | Value
($ x 1,000) |
|---|
Short-Term Investment 2.7% of net assets |
Brown Brothers Harriman, Grand Cayman Time Deposit
4.71%, 11/01/06 | | | | | 79 | | | | 79 | |
JP Morgan, Grand Cayman Time Deposit
4.71%, 11/01/06 | | | | | 1,620 | | | | 1,620 | |
| | | | | | | | | | 1,699 | |
At 10/31/06 the tax basis cost of the fund’s investments was $57,148 and the unrealized appreciation and depreciation were $4,848 and ($182), respectively, with a net unrealized appreciation of $4,666.
(a) | | Issuer is affiliated with the fund’s adviser. |
18 See financial notes.
Schwab Target 2010 Fund
Statement of
Assets and Liabilities
As of October 31, 2006. All numbers x 1,000 except NAV.
Assets | | | | | | |
| Investments in affiliated underlying funds, at value (cost $55,435) | | | | $ | 60,115 | |
| Investments in unaffiliated issuers, at value (cost $1,699) | | | | | 1,699 | |
| Total investments, at value (cost $57,134) | | | | | 61,814 | |
Receivables:
| | | | | | |
| Fund shares sold | | | | | 267 | |
| Dividends | | | | + | 86 | |
Total assets | | | | | 62,167 | |
| |
Liabilities | | | | | | |
Payables:
| | | | | | |
| Investments bought | | | | | 85 | |
| Due to investment adviser | | | | | 7 | |
| Fund shares redeemed | | | | | 7 | |
| Trustee fees | | | | | 1 | |
| Accrued expenses | | | | + | 31 | |
Total liabilities | | | | | 131 | |
| |
Net Assets | | | | | | |
Total assets | | | | | 62,167 | |
Total liabilities | | | | | –131 | |
Net assets | | | | $ | 62,036 | |
| |
Net Assets by Source | | | | | | |
| Capital received from investors | | | | | 56,602 | |
| Net investment income not yet distributed | | | | | 603 | |
| Net realized capital gains | | | | | 151 | |
| Net unrealized capital gains | | | | | 4,680 | |
| |
Net Asset Value (NAV) | | | | | | |
Net Assets
| | | | ÷
| | Shares
Outstanding
| | =
| | NAV
|
|---|
| $62,036 | | | | | | | | | 5,432 | | | | | | | $ | 11.42 | |
See financial notes. 19
Schwab Target 2010 Fund
Statement of
Operations
For November 1, 2005 through October 31, 2006. All numbers x 1,000.
Investment Income | | | | | | |
| Dividends received from affiliated underlying funds | | | | $ | 954 | |
| Interest | | | | + | 38 | |
Total Investment Income | | | | | 992 | |
| |
Net Realized Gains and Losses | | | | | | |
| Net realized gains received from affiliated underlying funds | | | | | 260 | |
| Net realized losses on investments | | | | + | (15 | ) |
Net realized gains | | | | | 245 | |
| |
Net Unrealized Gains and Losses | | | | | | |
| Net unrealized gains from affiliated underlying funds | | | | | 4,325 | |
| |
Expenses | | | | | | |
| Registration fees | | | | | 56 | |
| Professional fees | | | | | 33 | |
| Portfolio accounting fees | | | | | 10 | |
| Shareholder reports | | | | | 9 | |
| Trustees’ fees | | | | | 6 | |
| Custodian fees | | | | | 4 | |
| Other expenses | | | | + | 6 | |
| Total expenses | | | | | 124 | |
| Expense reduction by adviser and Schwab | | | | | –97 | |
Net expenses | | | | | 27 | |
| |
Increase in Net Assets from Operations | | | | | | |
Total investment income | | | | | 992 | |
Net expenses | | | | | –27 | |
Net investment income | | | | | 965 | |
Net realized gains | | | | | 245 | |
Net unrealized gains | | | | + | 4,325 | |
Increase in net assets from operations | | | | $ | 5,535 | |
20 See financial notes.
Schwab Target 2010 Fund
Statements of
Changes in Net Assets
For the current and prior report periods. All numbers x 1,000.
| | | | 11/1/05–10/31/06
| | 7/1/05*–10/31/05
| |
|---|
| Net investment income | | | | | | | | $ | 965 | | | | | | | $ | 136 | |
| Net realized gains | | | | | | | | | 245 | | | | | | | | — | |
| Net unrealized gains | | | | | | | | + | 4,325 | | | | | | | | 355 | |
Increase in net assets from operations | | | | | | | | | 5,535 | | | | | | | | 491 | |
| |
Distributions Paid | | | | | | | | | | | | | | | | | | |
| Dividends from net investment income | | | | | | | | $ | 592 | | | | | | | $ | — | |
Transactions in Fund Shares | | | | | | | | | | | | | | | | | | |
| | | | 11/1/05–10/31/06
| | 7/1/05*–10/31/05
| |
|---|
| | | | SHARES
| | VALUE
| | SHARES
| | VALUE
|
|---|
| Shares Sold | | | | | 3,028 | | | $ | 32,857 | | | | 3,174 | | | $ | 32,017 | |
| Shares Reinvested | | | | | 52 | | | | 546 | | | | — | | | | — | |
| Shares Redeemed | | | | + | (749 | ) | | | (8,074 | ) | | | (73 | ) | | | (744 | ) |
Net transactions in fund shares | | | | | 2,331 | | | $ | 25,329 | | | | 3,101 | | | $ | 31,273 | |
| |
Shares Outstanding and Net Assets | | | | | | | | | | | | | | | | | | |
| | | | 11/1/05–10/31/06
| | 7/1/05*–10/31/05
| |
|---|
| | | | SHARES
| | NET ASSETS
| | SHARES
| | NET ASSETS
|
|---|
| Beginning of period | | | | | 3,101 | | | $ | 31,764 | | | | — | | | $ | — | |
| Total increase | | | | + | 2,331 | | | | 30,272 | | | | 3,101 | | | | 31,764 | |
End of period | | | | | 5,432 | | | $ | 62,036 | | | | 3,101 | | | $ | 31,764 | |
| Net investment income not yet distributed | | | | | | | | $ | 603 | | | | | | | $ | 136 | |
* Commencement of operations
See financial notes. 21
Schwab Target 2020 Fund
Financial Statements
Financial Highlights
| | | | 11/1/05—
10/31/06
| | 7/1/051—
10/31/05
| |
| |
| |
| |
|
|---|
Per-Share Data ($) | | | | | | | | | | | | | | | | | | | | | | | | | | |
| Net asset value at beginning of period | | | | | 10.28 | | | | 10.00 | | | | | | | | | | | | | | | | | |
Income from investment operations:
| | | | | | | | | | | | | | | | | | | | | | | | | | |
| Net investment income | | | | | 0.21 | | | | 0.04 | | | | | | | | | | | | | | | | | |
| Net realized and unrealized gains | | | | | 1.25 | | | | 0.24 | | | | | | | | | | | | | | | | | |
| Total income from investment operations | | | | | 1.46 | | | | 0.28 | | | | | | | | | | | | | | | | | |
Less distributions:
| | | | | | | | | | | �� | | | | | | | | | | | | | | | |
| Dividends from net investment income | | | | | (0.18 | ) | | | — | | | | | | | | | | | | | | | | | |
| Net asset value at end of period | | | | | 11.56 | | | | 10.28 | | | | | | | | | | | | | | | | | |
| Total return (%) | | | | | 14.36 | | | | 2.80 | 2 | | | | | | | | | | | | | | | | |
| |
Ratios/Supplemental Data (%) | | | | | | | | | | | | | | | | | | | | | | | | | | |
| |
Ratios to average net assets:
| | | | | | | | | | | | | | | | | | | | | | | | | | |
Net operating expenses3 | | | | | 0.04 | | | | 0.04 | 4 | | | | | | | | | | | | | | | | |
Gross operating expenses3 | | | | | 0.22 | | | | 0.36 | 4 | | | | | | | | | | | | | | | | |
| Net investment income | | | | | 1.84 | | | | 1.29 | 4 | | | | | | | | | | | | | | | | |
| Portfolio turnover rate | | | | | — | | | | — | | | | | | | | | | | | | | | | | |
| Net assets, end of period ($ x 1,000,000) | | | | | 84 | | | | 35 | | | | | | | | | | | | | | | | | |
1 | | Commencement of operations. |
3 | | The expenses incurred by underlying funds in which the fund invests are not included in this ratio.
The income received by the portfolio from underlying funds is reduced by those expenses.
|
22 See financial notes.
Schwab Target 2020 Fund
Portfolio Holdings as of October 31, 2006
This section shows all the securities in the fund’s portfolio and their value as of the report date.
The fund files its complete schedule of portfolio holdings with the SEC for the first and third quarters of each fiscal year on Form N-Q. The fund’s Form N-Q is available on the SEC’s website at http://www.sec.gov and may be viewed and copied at the SEC’s Public Reference Room in Washington, D.C. Call 1-800-SEC-0330 for information on the operation of the Public Reference Room. The schedule of portfolio holdings filed on a fund’s most recent Form N-Q is also available by visiting Schwab’s website at www.schwab.com/schwabfunds.
Holdings by Category
|
| Cost
($ x 1,000)
|
| Value
($ x 1,000)
|
|
|---|
96.3% | | | | Other Investment Companies | | | 74,274 | | | | 80,582 | |
3.3% | | | | Short-Term Investment | | | 2,725 | | | | 2,725 | |
99.6% | | | | Total Investments | | | 76,999 | | | | 83,307 | |
0.4% | | | | Other Assets and Liabilities, Net | | | | | | | 335 | |
100.0% | | | | Total Net Assets | | | | | | | 83,642 | |
| Security | | | | Number
of Shares | | Value
($ x 1,000) |
|---|
Other Investment Companies 96.3% of net assets |
Equity Funds 68.3% |
Laudus Rosenberg U.S. Large Capitalization Growth Fund, Institutional Shares (a) | | | | | 666,762 | | | | 6,281 | |
Laudus Rosenberg U.S. Discovery Fund, Institutional Shares (a) | | | | | 165,020 | | | | 3,134 | |
Laudus Rosenberg International Small Capitalization Fund, Institutional Shares (a) | | | | | 303,325 | | | | 6,661 | |
Laudus International MarketMasters Fund, Select Shares (a) | | | | | 393,535 | | | | 8,173 | |
Schwab Dividend Equity Fund, Select Shares (a) | | | | | 452,744 | | | | 6,610 | |
Schwab Small-Cap Equity Fund, Select Shares (a) | | | | | 370,789 | | | | 6,600 | |
Schwab Core Equity Fund (a) | | | | | 1,070,972 | | | | 19,706 | |
| | | | | | | | | | 57,165 | |
Fixed-Income Funds 27.1% |
Schwab Total Bond Market Fund (a) | | | | | 2,225,012 | | | | 21,872 | |
Schwab YieldPlus Fund, Select Shares (a) | | | | | 80,045 | | | | 775 | |
| | | | | | | | | | 22,647 | |
Money Funds 0.9% |
Schwab Value Advantage Money Fund, Institutional Shares (a) | | | | | 769,641 | | | | 770 | |
Security
Rate, Maturity Date
| | | | Face Amount
($ x 1,000) | | Value
($ x 1,000) |
|---|
Short-Term Investment 3.3% of net assets |
JP Morgan, Grand Cayman Time Deposit
4.71%, 11/01/06 | | | | | 575 | | | | 575 | |
Wells Fargo, Grand Cayman Time Deposit
4.71%, 11/01/06 | | | | | 2,150 | | | | 2,150 | |
| | | | | | | | | | 2,725 | |
At 10/31/06 the tax basis cost of the fund’s investments was $76,999 and the unrealized appreciation and depreciation were $6,430 and ($122), respectively, with a net unrealized appreciation of $6,308.
(a) | | Issuer is affiliated with the fund’s adviser. |
See financial notes. 23
Schwab Target 2020 Fund
Statement of
Assets and Liabilities
As of October 31, 2006. All numbers x 1,000 except NAV.
Assets | | | | | | |
| Investments in affiliated underlying funds, at value (cost $74,274) | | | | $ | 80,582 | |
| Investments in unaffiliated issuers, at value (cost $2,725) | | | | | 2,725 | |
| Total investments, at value (cost $76,999) | | | | | 83,307 | |
Receivables:
| | | | | | |
| Fund shares sold | | | | | 381 | |
| Dividends | | | | + | 93 | |
Total assets | | | | | 83,781 | |
| |
Liabilities | | | | | | |
Payables:
| | | | | | |
| Investments bought | | | | | 91 | |
| Due to investment adviser | | | | | 17 | |
| Fund shares redeemed | | | | | 12 | |
| Trustee fees | | | | | 1 | |
| Accrued expenses | | | | + | 18 | |
Total liabilities | | | | | 139 | |
| |
Net Assets | | | | | | |
Total assets | | | | | 83,781 | |
Total liabilities | | | | | –139 | |
Net assets | | | | $ | 83,642 | |
| |
Net Assets by Source | | | | | | |
| Capital received from investors | | | | | 76,486 | |
| Net investment income not yet distributed | | | | | 617 | |
| Net realized capital gains | | | | | 231 | |
| Net unrealized capital gains | | | | | 6,308 | |
| |
Net Asset Value (NAV) by Shares Class | | | | | | |
Net Assets
| | | | ÷
| | Shares
Outstanding
| | =
| | NAV
|
|---|
| $83,642 | | | | | | | | | 7,236 | | | | | | | $ | 11.56 | |
24 See financial notes.
Schwab Target 2020 Fund
Statement of
Operations
For November 1, 2005 through October 31, 2006. All numbers x 1,000.
Investment Income | | | | | | |
| Dividends received from affiliated underlying funds | | | | $ | 1,025 | |
| Interest | | | | + | 58 | |
Total Investment Income | | | | | 1,083 | |
| |
Net Realized Gains and Losses | | | | | | |
| Net realized gains received from affiliated underlying funds | | | | | 353 | |
| |
Net Unrealized Gains and Losses | | | | | | |
| Net unrealized gains from affiliated underlying funds | | | | | 5,874 | |
| |
Expenses | | | | | | |
| Registration fees | | | | | 49 | |
| Professional fees | | | | | 33 | |
| Shareholder reports | | | | | 13 | |
| Portfolio accounting fees | | | | | 10 | |
| Custodian fees | | | | | 8 | |
| Trustees’ fees | | | | | 6 | |
| Other expenses | | | | + | 6 | |
| Total expenses | | | | | 125 | |
| Expense reduction by adviser and Schwab | | | | | –103 | |
Net expenses | | | | | 22 | |
| |
Increase in Net Assets from Operations | | | | | | |
Total investment income | | | | | 1,083 | |
Net expenses | | | | | –22 | |
Net investment income | | | | | 1,061 | |
Net realized gains | | | | | 353 | |
Net unrealized gains | | | | + | 5,874 | |
Increase in net assets from operations | | | | $ | 7,288 | |
See financial notes. 25
Schwab Target 2020 Fund
Statements of
Changes in Net Assets
For the current and prior report periods. All numbers x 1,000.
| | | | 11/1/05–10/31/06
| | 7/01/05*–10/31/05
| |
|---|
| Net investment income | | | | | | | | $ | 1,061 | | | | | | | $ | 121 | |
| Net realized gains or losses | | | | | | | | | 353 | | | | | | | | — | |
| Net unrealized gains | | | | | | | | + | 5,874 | | | | | | | | 434 | |
Increase in net assets from operations | | | | | | | | | 7,288 | | | | | | | | 555 | |
| |
Distributions Paid |
| Dividends from net investment income | | | | | | | | $ | 687 | | | | | | | $ | — | |
Transactions in Fund Shares | | | | | | | | | | | | | | | | | | |
| | | | 11/1/05–10/31/06
| | 7/1/05*–10/31/05
| |
|---|
| | | | SHARES
| | VALUE
| | SHARES
| | VALUE
|
|---|
| Shares Sold | | | | | 4,728 | | | $ | 51,841 | | | | 3,422 | | | $ | 34,636 | |
| Shares Reinvested | | | | | 64 | | | | 672 | | | | — | | | | — | |
| Shares Redeemed | | | | + | (933 | ) | | | (10,204 | ) | | | (45 | ) | | | (459 | ) |
Net transactions in fund shares | | | | | 3,859 | | | $ | 42,309 | | | | 3,377 | | | $ | 34,177 | |
| |
Shares Outstanding and Net Assets | | | | | | | | | | | | | | | | | | |
| | | | 11/1/05–10/31/06
| | 7/1/05*–10/31/05
| |
|---|
| | | | SHARES
| | NET ASSETS
| | SHARES
| | NET ASSETS
|
|---|
| Beginning of period | | | | | 3,377 | | | $ | 34,732 | | | | — | | | $ | — | |
| Total increase or decrease | | | | + | 3,859 | | | | 48,910 | | | | 3,377 | | | | 34,732 | |
End of period | | | | | 7,236 | | | $ | 83,642 | | | | 3,377 | | | $ | 34,732 | |
| Net investment income not yet distributed | | | | | | | | $ | 617 | | | | | | | $ | 121 | |
| * | | Commencement of operations. |
26 See financial notes.
Schwab Target 2030 Fund
Financial Statements
Financial Highlights
| | | | 11/1/05—
10/31/06
| | 7/1/051—
10/31/05
| |
| |
| |
| |
|
|---|
Per-Share Data ($) | | | | | | | | | | | | | | | | | | | | | | | | | | |
| Net asset value at beginning of period | | | | | 10.31 | | | | 10.00 | | | | | | | | | | | | | | | | | |
Income from investment operations:
| | | | | | | | | | | | | | | | | | | | | | | | | | |
| Net investment income | | | | | 0.19 | | | | 0.03 | | | | | | | | | | | | | | | | | |
| Net realized and unrealized gains | | | | | 1.34 | | | | 0.28 | | | | | | | | | | | | | | | | | |
| Total income from investment operations | | | | | 1.53 | | | | 0.31 | | | | | | | | | | | | | | | | | |
Less distributions:
| | | | | | | | | | | | | | | | | | | | | | | | | | |
| Distributions from net income | | | | | (0.17 | ) | | | — | | | | | | | | | | | | | | | | | |
| Net asset value at end of period | | | | | 11.67 | | | | 10.31 | | | | | | | | | | | | | | | | | |
| Total return (%) | | | | | 14.99 | | | | 3.10 | 2 | | | | | | | | | | | | | | | | |
| |
Ratios/Supplemental Data (%) | | | | | | | | | | | | | | | | | | | | | | | | | | |
Ratios to average net assets:
| | | | | | | | | | | | | | | | | | | | | | | | | | |
Net operating expenses3 | | | | | 0.03 | | | | 0.03 | 4 | | | | | | | | | | | | | | | | |
Gross operating expenses3 | | | | | 0.32 | | | | 0.58 | 4 | | | | | | | | | | | | | | | | |
| Net investment income | | | | | 1.54 | | | | 1.05 | 4 | | | | | | | | | | | | | | | | |
| Portfolio turnover rate | | | | | — | | | | — | | | | | | | | | | | | | | | | | |
| Net assets, end of period ($ x 1,000,000) | | | | | 56 | | | | 19 | | | | | | | | | | | | | | | | | |
1 | | Commencement of operations. |
3 | | The expenses incurred by underlying funds in which the fund invests are not included in this ratio.
The income received by the portfolio from underlying funds is reduced by those expenses.
|
See financial notes. 27
Schwab Target 2030 Fund
Portfolio Holdings as of October 31, 2006
This section shows all the securities in the fund’s portfolio and their value as of the report date.
The fund files its complete schedule of portfolio holdings with the SEC for the first and third quarters of each fiscal year on Form N-Q. The fund’s Form N-Q is available on the SEC’s website at http://www.sec.gov and may be viewed and copied at the SEC’s Public Reference Room in Washington, D.C. Call 1-800-SEC-0330 for information on the operation of the Public Reference Room. The schedule of portfolio holdings filed on a fund’s most recent Form N-Q is also available by visiting Schwab’s website at www.schwab.com/schwabfunds.
Holdings by Category
|
| Cost
($ x 1,000)
|
| Value
($ x 1,000)
|
|
|---|
96.5% | | | | Other Investment Companies | | | 49,702 | | | | 53,946 | |
3.2% | | | | Short-Term Investment | | | 1,796 | | | | 1,796 | |
99.7% | | | | Total Investments | | | 51,498 | | | | 55,742 | |
0.3% | | | | Other Assets and Liabilities, Net | | | | | | | 178 | |
100.0% | | | | Total Net Assets | | | | | | | 55,920 | |
Security
| | | | Number
of Shares | | Value
($ x 1,000) |
|---|
Other Investment Companies 96.5% of net assets |
Equity Funds 74.9% |
Laudus International MarketMasters Fund, Select Shares (a) | | | | | 315,461 | | | | 6,552 | |
Laudus Rosenberg International Small Capitalization Fund, Institutional Shares (a) | | | | | 176,415 | | | | 3,874 | |
Laudus Rosenberg U.S. Discovery Fund, Institutional Shares (a) | | | | | 138,401 | | | | 2,628 | |
Laudus Rosenberg U.S. Large Capitalization Growth Fund, Institutional Shares (a) | | | | | 448,858 | | | | 4,229 | |
Schwab Core Equity Fund (a) | | | | | 804,632 | | | | 14,805 | |
Schwab Dividend Equity Fund, Select Shares (a) | | | | | 303,714 | | | | 4,434 | |
Schwab Small-Cap Equity Fund, Select Shares (a) | | | | | 300,759 | | | | 5,354 | |
| | | | | | | | | | 41,876 | |
Fixed-Income Funds 20.7% |
Schwab Total Bond Market Fund (a) | | | | | 1,121,864 | | | | 11,028 | |
Schwab YieldPlus Fund, Select Shares (a) | | | | | 54,012 | | | | 523 | |
| | | | | | | | | | 11,551 | |
Money Funds 0.9% |
Schwab Value Advantage Money Fund, Institutional Shares (a) | | | | | 519,480 | | | | 519 | |
Security
Rate, Maturity Date
| | | | Face Amount
($ x 1,000) | | Value
($ x 1,000) |
|---|
Short-Term Investment 3.2% of net assets |
JP Morgan, Grand Cayman Time Deposit
4.71%, 11/01/06 | | | | | 371 | | | | 371 | |
Wells Fargo, Grand Cayman Time Deposit
4.71%, 11/01/06 | | | | | 1,425 | | | | 1,425 | |
| | | | | | | | | | 1,796 | |
At 10/31/06 the tax basis cost of the fund’s investments was $51,498 and the unrealized gains and losses were $4,271 and ($27), respectively, with a net unrealized appreciation of $4,244.
(a) | | Issuer is affiliated with the fund’s adviser. |
28 See financial notes.
Schwab Target 2030 Fund
Statement of
Assets and Liabilities
As of October 31, 2006. All numbers x 1,000 except NAV.
Assets | | | | | | |
| Investments in affiliated underlying funds, at value (cost $49,702) | | | | $ | 53,946 | |
| Investments in unaffiliated issuers, at value (cost $1,796) | | | | | 1,796 | |
| Total investments, at value (cost $51,498) | | | | | 55,742 | |
Receivables:
| | | | | | |
| Fund shares sold | | | | | 210 | |
| Dividends | | | | | 48 | |
| Due from investment adviser | | | | + | 3 | |
Total assets | | | | | 56,003 | |
| |
Liabilities | | | | | | |
Payables:
| | | | | | |
| Investments bought | | | | | 47 | |
| Fund shares redeemed | | | | | 4 | |
| Trustee fees | | | | | 1 | |
| Accrued expenses | | | | + | 31 | |
Total liabilities | | | | | 83 | |
| |
Net Assets | | | | | | |
Total assets | | | | | 56,003 | |
Total liabilities | | | | | –83 | |
Net assets | | | | $ | 55,920 | |
| |
Net Assets by Source | | | | | | |
| Capital received from investors | | | | | 51,246 | |
| Net investment income not yet distributed | | | | | 297 | |
| Net realized capital gains | | | | | 133 | |
| Net unrealized capital gains | | | | | 4,244 | |
Net Assets
| | | | ÷
| | Shares
Outstanding
| | =
| | NAV
|
|---|
| $55,920 | | | | | | | | | 4,791 | | | | | | | $ | 11.67 | |
See financial notes. 29
Schwab Target 2030 Fund
Statement of
Operations
For November 1, 2005 through October 31, 2006. All numbers x 1,000.
Investment Income | | | | | | |
| Dividends received from affiliated underlying funds | | | | $ | 518 | |
| Interest | | | | + | 40 | |
Total Investment Income | | | | | 558 | |
| |
Net Realized Gains and Losses | | | | | | |
| Net realized gains received from affiliated underlying funds | | | | | 192 | |
| |
Net Unrealized Gains and Losses | | | | | | |
| Net unrealized gains from affiliated underlying funds | | | | | 3,992 | |
| |
Expenses | | | | | | |
| Registration fees | | | | | 45 | |
| Professional fees | | | | | 33 | |
| Shareholder reports | | | | | 10 | |
| Portfolio accounting fees | | | | | 8 | |
| Custodian fees | | | | | 7 | |
| Trustees’ fees | | | | | 6 | |
| Other expenses | | | | + | 6 | |
| Total expenses | | | | | 115 | |
| Expense reduction by adviser and Schwab | | | | | –104 | |
Net expenses | | | | | 11 | |
| |
Increase in Net Assets from Operations | | | | | | |
Total investment income | | | | | 558 | |
Net expenses | | | | | –11 | |
Net investment income | | | | | 547 | |
Net realized gains | | | | | 192 | |
Net unrealized gains | | | | + | 3,992 | |
Increase in net assets from operations | | | | $ | 4,731 | |
30 See financial notes.
Schwab Target 2030 Fund
Statements of
Changes in Net Assets
For the current and prior report periods. All numbers x 1,000.
| | | | 11/1/05–10/31/06
| | 7/1/05*–10/31/05
| |
|---|
| Net investment income | | | | | | | | $ | 547 | | | | | | | $ | 51 | |
| Net realized gains | | | | | | | | | 192 | | | | | | | | — | |
| Net unrealized gains | | | | | | | | + | 3,992 | | | | | | | | 252 | |
Increase in net assets from operations | | | | | | | | | 4,731 | | | | | | | | 303 | |
| |
Distributions Paid |
| Dividends from net investment income | | | | | | | | $ | 360 | | | | | | | $ | — | |
Transactions in Fund Shares | | | | | | | | | | | | | | | | | | |
| | | | 11/1/05–10/31/06
| | 7/1/05*–10/31/05
| |
|---|
| | | | SHARES
| | VALUE
| | SHARES
| | VALUE
|
|---|
| Shares Sold | | | | | 3,408 | | | $ | 37,640 | | | | 1,866 | | | $ | 18,936 | |
| Shares Reinvested | | | | | 33 | | | | 346 | | | | — | | | | — | |
| Shares Redeemed | | | | + | (497 | ) | | | (5,487 | ) | | | (19 | ) | | | (189 | ) |
Net transactions in fund shares | | | | | 2,944 | | | $ | 32,499 | | | | 1,847 | | | $ | 18,747 | |
| |
Shares Outstanding and Net Assets | | | | | | | | | | | | | | | | | | |
| | | | 11/1/05–10/31/06
| | 7/1/05*–10/31/05
| |
|---|
| | | | SHARES
| | NET ASSETS
| | SHARES
| | NET ASSETS
|
|---|
| Beginning of period | | | | | 1,847 | | | $ | 19,050 | | | | — | | | $ | — | |
| Total increase | | | | + | 2,944 | | | | 36,870 | | | | 1,847 | | | | 19,050 | |
End of period | | | | | 4,791 | | | $ | 55,920 | | | | 1,847 | | | $ | 19,050 | |
| Net investment income not yet distributed | | | | | | | | $ | 297 | | | | | | | $ | 51 | |
| * | | Commencement of operations |
See financial notes. 31
Schwab Target 2040 Fund
Financial Statements
Financial Highlights
| | | | 11/1/05—
10/31/06
| | 7/1/051—
10/31/05
| |
| |
| |
| |
|
|---|
Per-Share Data ($) | | | | | | | | | | | | | | | | | | | | | | | | | | |
| Net asset value at beginning of period | | | | | 10.36 | | | | 10.00 | | | | | | | | | | | | | | | | | |
Income from investment operations:
| | | | | | | | | | | | | | | | | | | | | | | | | | |
| Net investment income | | | | | 0.19 | | | | 0.02 | | | | | | | | | | | | | | | | | |
| Net realized and unrealized gains | | | | | 1.45 | | | | 0.34 | | | | | | | | | | | | | | | | | |
| Total income from investment operations | | | | | 1.64 | | | | 0.36 | | | | | | | | | | | | | | | | | |
Less distributions:
| | | | | | | | | | | | | | | | | | | | | | | | | | |
| Dividends from net investment income | | | | | (0.17 | ) | | | — | | | | | | | | | | | | | | | | | |
| Net asset value at end of period | | | | | 11.83 | | | | 10.36 | | | | | | | | | | | | | | | | | |
| Total return (%) | | | | | 16.06 | | | | 3.60 | 2 | | | | | | | | | | | | | | | | |
| |
Ratios/Supplemental Data (%) | | | | | | | | | | | | | | | | | | | | | | | | | | |
Ratios to average net assets:
| | | | | | | | | | | | | | | | | | | | | | | | | | |
Net operating expenses3 | | | | | 0.01 | | | | 0.01 | 4 | | | | | | | | | | | | | | | | |
Gross operating expenses3 | | | | | 0.48 | | | | 1.10 | 4 | | | | | | | | | | | | | | | | |
| Net investment income | | | | | 1.26 | | | | 0.80 | 4 | | | | | | | | | | | | | | | | |
| Portfolio turnover rate | | | | | 1 | | | | — | | | | | | | | | | | | | | | | | |
| Net assets, end of period ($ x 1,000,000) | | | | | 34 | | | | 9 | | | | | | | | | | | | | | | | | |
1 | | Commencement of operations. |
3 | | The expense incurred by underlying funds in which the fund invests are not included in this ratio.
The income received by the portfolio from underlying funds is reduced by those expenses. |
32 See financial notes.
Schwab Target 2040 Fund
Portfolio Holdings as of October 31, 2006
This section shows all the securities in the fund’s portfolio and their value as of the report date.
The fund files its complete schedule of portfolio holdings with the SEC for the first and third quarters of each fiscal year on Form N-Q. The fund’s Form N-Q is available on the SEC’s website at http://www.sec.gov and may be viewed and copied at the SEC’s Public Reference Room in Washington, D.C. Call 1-800-SEC-0330 for information on the operation of the Public Reference Room. The schedule of portfolio holdings filed on a fund’s most recent Form N-Q is also available by visiting Schwab’s website at www.schwab.com/schwabfunds.
Holdings by Category
|
| Cost
($ x 1,000)
|
| Value
($ x 1,000)
|
|
|---|
95.0% | | | | Other Investment Companies | | | 29,569 | | | | 32,008 | |
3.9% | | | | Short-Term Investment | | | 1,328 | | | | 1,328 | |
98.9% | | | | Total Investments | | | 30,897 | | | | 33,336 | |
1.1% | | | | Other Assets and Liabilities, Net | | | | | | | 360 | |
100.0% | | | | Total Net Assets | | | | | | | 33,696 | |
Security
| | | | Number
of Shares | | Value
($ x 1,000) |
|---|
Other Investment Companies 95.0% of net assets |
Equity Funds 80.2% |
Laudus International MarketMasters Fund, Select Shares (a) | | | | | 201,740 | | | | 4,190 | |
Laudus Rosenberg International Small Capitalization Fund, Institutional Shares (a) | | | | | 118,789 | | | | 2,609 | |
Laudus Rosenberg U.S. Discovery Fund, Institutional Shares (a) | | | | | 98,138 | | | | 1,864 | |
Laudus Rosenberg U.S. Large Capitalization Growth Fund, Institutional Shares (a) | | | | | 299,316 | | | | 2,820 | |
Schwab Core Equity Fund (a) | | | | | 494,529 | | | | 9,099 | |
Schwab Dividend Equity Fund, Select Shares (a) | | | | | 202,303 | | | | 2,954 | |
Schwab Small-Cap Equity Fund, Select Shares (a) | | | | | 195,648 | | | | 3,482 | |
| | | | | | | | | | 27,018 | |
Fixed-Income Funds 13.9% |
Schwab Total Bond Market Fund (a) | | | | | 444,695 | | | | 4,371 | |
Schwab YieldPlus Fund, Select Shares (a) | | | | | 32,063 | | | | 311 | |
| | | | | | | | | | 4,682 | |
Money Funds 0.9% |
Schwab Value Advantage Money Fund, Institutional Shares (a) | | | | | 308,415 | | | | 308 | |
Security
Rate, Maturity Date
| | | | Face Amount
($ x 1,000) | | Value
($ x 1,000) |
|---|
Short-Term Investment 3.9% of net assets |
JP Morgan, Grand Cayman Time Deposit
4.71%, 11/01/06 | | | | | 496 | | | | 496 | |
Wells Fargo, Grand Cayman Time Deposit
4.71%, 11/01/06 | | | | | 832 | | | | 832 | |
| | | | | | | | | | 1,328 | |
At 10/31/06 the tax basis cost of the fund’s investments was $30,898, and the unrealized appreciation and depreciation were $2,438 and $0, respectively, with a net unrealized appreciation of $2,438.
(a) | | Issuer is affiliated with the fund’s adviser. |
See financial notes. 33
Schwab Target 2040 Fund
Statement of
Assets and Liabilities
As of October 31, 2006. All numbers x 1,000 except NAV.
Assets | | | | | | |
| Investments in affiliated underlying funds, at value (cost $29,569) | | | | $ | 32,008 | |
| Investments in unaffiliated issuers, at value (cost $1,328) | | | | | 1,328 | |
| Total investments, at value (cost $30,897) | | | | | 33,336 | |
Receivables:
| | | | | | |
| Fund shares sold | | | | | 396 | |
| Dividends | | | | | 19 | |
| Due from investment adviser | | | | + | 6 | |
Total assets | | | | | 33,757 | |
| |
Liabilities | | | | | | |
Payables:
| | | | | | |
| Investments bought | | | | | 19 | |
| Fund shares redeemed | | | | | 12 | |
| Trustee fees | | | | | 1 | |
| Accrued expenses | | | | + | 29 | |
Total liabilities | | | | | 61 | |
| |
Net Assets | | | | | | |
Total assets | | | | | 33,757 | |
Total liabilities | | | | | –61 | |
Net assets | | | | $ | 33,696 | |
| |
Net Assets by Source | | | | | | |
| Capital received from investors | | | | | 31,064 | |
| Net investment income not yet distributed | | | | | 117 | |
| Net realized capital gains | | | | | 76 | |
| Net unrealized capital gains | | | | | 2,439 | |
Net Assets
| | | | ÷
| | Shares
Outstanding
| | =
| | NAV
|
|---|
| $33,696 | | | | | | | | | 2,849 | | | | | | | $ | 11.83 | |
34 See financial notes.
Schwab Target 2040 Fund
Statement of
Operations
For November 1, 2005 through October 31, 2006. All numbers x 1,000.
Investment Income | | | | | | |
| Dividends received from affiliated underlying funds | | | | $ | 227 | |
| Interest | | | | + | 25 | |
Total Investment Income | | | | | 252 | |
| |
Net Realized Gains and Losses | | | | | | |
| Net realized gains received from affiliated underlying funds | | | | | 108 | |
| |
Net Unrealized Gains and Losses | | | | | | |
| Net unrealized gains from affiliated underlying funds | | | | | 2,315 | |
| |
Expenses | | | | | | |
| Professional fees | | | | | 32 | |
| Registration fees | | | | | 29 | |
| Portfolio accounting fees | | | | | 8 | |
| Shareholder reports | | | | | 7 | |
| Custodian fees | | | | | 7 | |
| Trustees’ fees | | | | | 6 | |
| Other expenses | | | | + | 6 | |
| Total expenses | | | | | 95 | |
| Expense reduction by adviser and Schwab | | | | | –93 | |
Net expenses | | | | | 2 | |
| |
Increase in Net Assets from Operations | | | | | | |
Total investment income | | | | | 252 | |
Net expenses | | | | | –2 | |
Net investment income | | | | | 250 | |
Net realized gains | | | | | 108 | |
Net unrealized gains | | | | + | 2,315 | |
Increase in net assets from operations | | | | $ | 2,673 | |
See financial notes. 35
Schwab Target 2040 Fund
Statements of
Changes in Net Assets
For the current and prior report periods. All numbers x 1,000.
| | | | 11/1/05–10/31/06
| | 7/1/05*–10/31/05
| |
|---|
| Net investment income | | | | | | | | $ | 250 | | | | | | | $ | 17 | |
| Net realized gains | | | | | | | | | 108 | | | | | | | | — | |
| Net unrealized gains | | | | | | | | + | 2,315 | | | | | | | | 124 | |
Increase in net assets from operations | | | | | | | | | 2,673 | | | | | | | | 141 | |
| |
Distributions Paid |
Dividends from net investment income | | | | | | | | $ | 182 | | | | | | | $ | — | |
Transactions in Fund Shares | | | | | | | | | | | | | | | | | | |
| | | | 11/1/05–10/31/06
| | 7/1/05*–10/31/05
| |
|---|
| | | | SHARES
| | VALUE
| | SHARES
| | VALUE
|
|---|
| Shares Sold | | | | | 2,218 | | | $ | 24,869 | | | | 894 | | | $ | 9,127 | |
| Shares Reinvested | | | | | 16 | | | | 176 | | | | — | | | | — | |
| Shares Redeemed | | | | + | (255 | ) | | | (2,853 | ) | | | (24 | ) | | | (255 | ) |
Net transactions in fund shares | | | | | 1,979 | | | $ | 22,192 | | | | 870 | | | $ | 8,872 | |
| |
Shares Outstanding and Net Assets | | | | | | | | | | | | | | | | | | |
| | | | 11/1/05–10/31/06
| | 7/1/05*–10/31/05
| |
|---|
| | | | SHARES
| | NET ASSETS
| | SHARES
| | NET ASSETS
|
|---|
| Beginning of period | | | | | 870 | | | $ | 9,013 | | | | — | | | $ | — | |
| Total increase | | | | + | 1,979 | | | | 24,683 | | | | 870 | | | | 9,013 | |
End of period | | | | | 2,849 | | | $ | 33,696 | | | | 870 | | | $ | 9,013 | |
| Net investment income not yet distributed | | | | | | | | $ | 117 | | | | | | | $ | 17 | |
| * | | Commencement of operations |
36 See financial notes.
Schwab Retirement Income Fund
Financial Statements
Financial Highlights
| | | | 11/1/05—
10/31/06
| | 7/1/051—
10/31/05
| |
| |
| |
| |
|
|---|
Per-Share Data ($) | | | | | | | | | | | | | | | | | | | | | | | | | | |
| Net asset value at beginning of period | | | | | 9.90 | | | | 10.00 | | | | | | | | | | | | | | | | | |
Income or loss from investment operations:
| | | | | | | | | | | | | | | | | | | | | | | | | | |
| Net investment income | | | | | 0.41 | | | | 0.11 | | | | | | | | | | | | | | | | | |
| Net realized and unrealized gains or losses | | | | | 0.32 | | | | (0.09 | ) | | | | | | | | | | | | | | | | |
| Total income or loss from investment operations | | | | | 0.73 | | | | 0.02 | | | | | | | | | | | | | | | | | |
Less distributions:
| | | | | | | | | | | | | | | | | | | | | | | | | | |
| Dividends from net investment income | | | | | (0.41 | ) | | | (0.12 | ) | | | | | | | | | | | | | | | | |
| Distributions from net realized gains | | | | | (0.03 | ) | | | — | | | | | | | | | | | | | | | | | |
| Total distributions | | | | | (0.44 | ) | | | (0.12 | ) | | | | | | | | | | | | | | | | |
| Net asset value at end of period | | | | | 10.19 | | | | 9.90 | | | | | | | | | | | | | | | | | |
| Total return (%) | | | | | 7.52 | | | | 0.16 | 2 | | | | | | | | | | | | | | | | |
| |
Ratios/Supplemental Data (%) | | | | | | | | | | | | | | | | | | | | | | | | | | |
Ratios to average net assets:
| | | | | | | | | | | | | | | | | | | | | | | | | | |
Net operating expenses3 | | | | | 0.10 | | | | 0.10 | 4 | | | | | | | | | | | | | | | | |
Gross operating expenses3 | | | | | 0.36 | | | | 0.64 | 4 | | | | | | | | | | | | | | | | |
| Net investment income | | | | | 4.20 | | | | 3.40 | 4 | | | | | | | | | | | | | | | | |
| Portfolio turnover rate | | | | | 1 | | | | — | | | | | | | | | | | | | | | | | |
| Net assets, end of period ($ x 1,000,000) | | | | | 36 | | | | 14 | | | | | | | | | | | | | | | | | |
1 | | Commencement of operations. |
3 | | The expenses incurred by underlying funds in which the fund invests are not included in this ratio.
The income received by the portfolio from underlying funds is reduced by those expenses.
|
See financial notes. 37
Schwab Retirement Income Fund
Portfolio Holdings as of October 31, 2006
This section shows all the securities in the fund’s portfolio and their value as of the report date.
The fund files its complete schedule of portfolio holdings with the SEC for the first and third quarters of each fiscal year on Form N-Q. The fund’s Form N-Q is available on the SEC’s website at http://www.sec.gov and may be viewed and copied at the SEC’s Public Reference Room in Washington, D.C. Call 1-800-SEC-0330 for information on the operation of the Public Reference Room. The schedule of portfolio holdings filed on a fund’s most recent Form N-Q is also available by visiting Schwab’s website at www.schwab.com/schwabfunds.
Holdings by Category
|
| Cost
($ x 1,000)
|
| Value
($ x 1,000)
|
|
|---|
97.5% | | | | Other Investment Companies | | | 34,791 | | | | 35,503 | |
1.9% | | | | Short-Term Investment | | | 703 | | | | 703 | |
99.4% | | | | Total Investments | | | 35,494 | | | | 36,206 | |
0.6% | | | | Other Assets and Liabilities, Net | | | | | | | 216 | |
100.0% | | | | Total Net Assets | | | | | | | 36,422 | |
Security
| | | | Number
of Shares | | Value
($ x 1,000) |
|---|
Other Investment Companies 97.5% of net assets |
Equity Funds 20.5% |
Laudus International MarketMasters Fund, Select Shares (a) | | | | | 85,531 | | | | 1,776 | |
Schwab Dividend Equity Fund, Select Shares (a) | | | | | 390,464 | | | | 5,701 | |
| | | | | | | | | | 7,477 | |
Fixed-Income Funds 72.4% |
Schwab Total Bond Market Fund (a) | | | | | 1,785,980 | | | | 17,556 | |
Schwab YieldPlus Fund, Select Shares (a) | | | | | 908,911 | | | | 8,798 | |
| | | | | | | | | | 26,354 | |
Money Funds 4.6% |
Schwab Value Advantage Money Fund, Institutional Shares (a) | | | | | 1,671,533 | | | | 1,672 | |
Security
Rate, Maturity Date
| | | | Face Amount
($ x 1,000) | | Value
($ x 1,000) |
|---|
Short-Term Investment 1.9% of net assets |
Wells Fargo, Grand Cayman Time Deposit
4.71%, 11/01/06 | | | | | 703 | | | | 703 | |
At 10/31/06 the tax basis cost of the fund’s investments was $35,498, and the unrealized appreciation and depreciation were $817, and $(109), respectively, with a net unrealized appreciation of $708.
(a) | | Issuer is affiliated with the fund’s adviser. |
38 See financial notes.
Schwab Retirement Income Fund
Statement of
Assets and Liabilities
As of October 31, 2006. All numbers x 1,000 except NAV.
Assets | | | | | | |
| Investments in affiliated underlying funds, at value (cost $34,791) | | | | $ | 35,503 | |
| Investments in unaffiliated issuers, at value (cost $703) | | | | | 703 | |
| Total investments, at value (cost $35,494) | | | | | 36,206 | |
Receivables:
| | | | | | |
| Fund shares sold | | | | | 305 | |
| Dividends | | | | | 114 | |
| Due from investment adviser | | | | + | 9 | |
Total assets | | | | | 36,634 | |
| |
Liabilities | | | | | | |
Payables:
| | | | | | |
| Investments bought | | | | | 110 | |
| Fund shares redeemed | | | | | 23 | |
| Accrued expenses | | | | + | 79 | |
Total liabilities | | | | | 212 | |
| |
Net Assets | | | | | | |
Total assets | | | | | 36,634 | |
Total liabilities | | | | | –212 | |
Net assets | | | | $ | 36,422 | |
| |
Net Assets by Source | | | | | | |
| Capital received from investors | | | | | 35,710 | |
| Net investment income not yet distributed | | | | | 4 | |
| Net realized capital losses | | | | | (4 | ) |
| Net unrealized capital gains | | | | | 712 | |
Net Assets
| | | | ÷
| | Shares
Outstanding
| | =
| | NAV
|
|---|
| $36,422 | | | | | | | | | 3,573 | | | | | | | $ | 10.19 | |
See financial notes. 39
Schwab Retirement Income Fund
Statement of
Operations
For November 1, 2005 through October 31, 2006. All numbers x 1,000.
Investment Income | | | | | | |
| Dividends received from affiliated underlying funds | | | | $ | 1,206 | |
| Interest | | | | + | 28 | |
Total Investment Income | | | | | 1,234 | |
| |
Net Realized Gains and Losses | | | | | | |
| Net realized gains received from affiliated underlying funds | | | | | 65 | |
| |
Net Unrealized Gains and Losses | | | | | | |
| Net unrealized gains from affiliated underlying funds | | | | | 829 | |
| |
Expenses | | | | | | |
| Registration fees | | | | | 37 | |
| Professional fees | | | | | 33 | |
| Portfolio accounting fees | | | | | 9 | |
| Trustees’ fees | | | | | 6 | |
| Shareholder reports | | | | | 6 | |
| Custodian fees | | | | | 5 | |
| Other expenses | | | | + | 6 | |
| Total expenses | | | | | 102 | |
| Expense reduction by adviser and Schwab | | | | | –73 | |
Net expenses | | | | | 29 | |
| |
Increase in Net Assets from Operations | | | | | | |
Total investment income | | | | | 1,234 | |
Net expenses | | | | | –29 | |
Net investment income | | | | | 1,205 | |
Net realized gains | | | | | 65 | |
Net unrealized gains | | | | + | 829 | |
Increase in net assets from operations | | | | $ | 2,099 | |
40 See financial notes.
Schwab Retirement Income Fund
Statements of
Changes in Net Assets
For the current and prior report periods. All numbers x 1,000.
| | | | 11/1/05–10/31/06
| | 7/1/05*–10/31/05
| |
|---|
| Net investment income | | | | | | | | $ | 1,205 | | | | | | | $ | 124 | |
| Net realized gains | | | | | | | | | 65 | | | | | | | | — | |
| Net unrealized gains or losses | | | | | | | | + | 829 | | | | | | | | (117 | ) |
Increase in net assets from operations | | | | | | | | | 2,099 | | | | | | | | 7 | |
| |
Distributions Paid |
Dividends from net investment income | | | | | | | | $ | 1,205 | | | | | | | $ | 138 | |
| Distributions from net realized gains | | | | | | | | | 65 | | | | | | | | — | |
| Total distributions | | | | | | | | $ | 1,270 | | | | | | | $ | 138 | |
Transactions in Fund Shares | | | | | | | | | | | | | | | | | | |
| | | | 11/1/05–10/31/06
| | 7/1/05*–10/31/05
| |
|---|
| | | | SHARES
| | VALUE
| | SHARES
| | VALUE
|
|---|
| Shares Sold | | | | | 3,030 | | | $ | 30,303 | | | | 1,508 | | | $ | 15,066 | |
| Shares reinvested | | | | | 86 | | | | 859 | | | | 10 | | | | 99 | |
| Shares redeemed | | | | + | (953 | ) | | | (9,526 | ) | | | (108 | ) | | | (1,077 | ) |
Net transactions in fund shares | | | | | 2,163 | | | $ | 21,636 | | | | 1,410 | | | $ | 14,088 | |
| |
Shares Outstanding and Net Assets | | | | | | | | | | | | | | | | | | |
| | | | 11/1/05–10/31/06
| | 7/1/05–10/31/05
| |
|---|
| | | | SHARES
| | NET ASSETS
| | SHARES
| | NET ASSETS
|
|---|
| Beginning of period | | | | | 1,410 | | | $ | 13,957 | | | | — | | | $ | — | |
| Total increase | | | | + | 2,163 | | | | 22,465 | | | | 1,410 | | | | 13,957 | |
End of period | | | | | 3,573 | | | $ | 36,422 | | | | 1,410 | | | $ | 13,957 | |
Net investment income not yet distributed | | | | | | | | | 4 | | | | | | | | — | |
| * | | Commencement of operations. |
See financial notes. 41
Schwab Target Funds
Financial Notes
| 1. | | Business Structure of the Funds |
Each of the funds discussed in this report is a series of Schwab Capital Trust (trust), a no-load, open-end management investment company. The company is organized as a Massachusetts business trust and is registered under the Investment Company Act of 1940, as amended. The list below shows all the funds in the trust including the funds discussed in this report, which are highlighted:
Schwab Capital Trust (organized May 7, 1993)
Schwab Target 2010 Fund
Schwab Target 2020 Fund
Schwab Target 2030 Fund
Schwab Target 2040 Fund
Schwab Retirement Income Fund
Schwab S&P 500 Index Fund
Schwab Institutional Select® S&P 500 Fund
Schwab Small-Cap Index Fund®
Schwab Total Stock Market Index Fund®
Schwab International Index Fund®
Schwab MarketTrack All Equity Portfolio™
Schwab MarketTrack Growth Portfolio™
Schwab MarketTrack Balanced Portfolio™
| Schwab MarketTrack Conservative Portfolio™
Laudus U.S. MarketMasters Fund™
Laudus Small-Cap MarketMasters Fund™
Laudus International MarketMasters Fund™
Schwab Viewpoints Fund™
Schwab Premier Equity Fund®
Schwab Core Equity Fund™
Schwab Dividend Equity Fund™
Schwab Large-Cap Growth Fund™
Schwab Small-Cap Equity Fund™
Schwab Hedged Equity Fund™
Schwab Financial Services Fund™
Schwab Health Care Fund™
Schwab Technology Fund™ |
The funds offer one share class. Shares are bought and sold at net asset value, or NAV, which is the price for all outstanding shares. Each share has a par value of 1/1,000 of a cent, and the trustees may issue as many shares as necessary.
| 2. | | Significant Accounting Policies: |
The following is a summary of the significant accounting policies used in the preparation of financial statements. The accounting policies are in conformity with accounting principles generally accepted in the United States of America. For more information about the underlying funds operations and policies, please refer to those funds’ semiannual and annual reports.
The funds value the investments in underlying funds every business day. The funds use the following policies to value these investments:
Underlying funds: valued at their respective net asset values as determined by those funds, in accordance with the Investment Company Act of 1940 for a given day.
Short-term securities (60 days or less to maturity): valued at amortized cost.
(b) Security Transactions:
Security transactions are recorded as of the date the order to buy or sell the security is executed. Realized gains and losses from security transactions are based on the identified costs of the securities involved.
(c) Investment Income:
Interest income is recorded as it accrues. Dividends and distributions from portfolio securities and underlying funds are recorded on the date they are effective (the ex-dividend date), although the funds record certain foreign security dividends on the day they learn of the ex-dividend date.
(d) Expenses:
Expenses that are specific to a fund or a class are charged directly to that fund or class. Expenses that are common to all funds within the trust generally are allocated among the funds in proportion to their average daily net assets.
(e) Distributions to Shareholders:
The funds pay dividends from net investment income and make distributions from net realized capital gains once a year, except for the Retirement Income Fund, which makes income distributions monthly.
42
Schwab Target Funds
Financial Notes (continued)
2. Significant Accounting Policies (continued):
Each fund maintains its own account for purposes of holding assets and accounting, and is considered a separate entity for tax purposes. Within its account, each fund also keeps certain assets in segregated accounts, as may be required by securities law.
(f) Accounting Estimates:
The accounting policies described in this report conform with accounting principles generally accepted in the United States of America. Notwithstanding this, shareholders should understand that in order to follow these principles, fund management has to make estimates and assumptions that affect the information reported in the financial statements. It’s possible that once the results are known, they may turn out to be different from these estimates.
(g) Federal Income Taxes:
The funds intend to meet federal income and excise tax requirements for regulated investment companies. Accordingly, the funds distribute substantially all of their net investment income and realized net capital gains (if any) to their respective shareholders each year. As long as a fund meets the tax requirements, it is not required to pay federal income tax.
(h) Indemnification:
Under the funds’ organizational documents, the officers and trustees are indemnified against certain liabilities arising out of the performance of their duties to the funds. In addition, in the normal course of business the funds enter into contracts with their vendors and others that provide general indemnifications. The funds’ maximum exposure under these arrangements is unknown as this would involve future claims that may be made against the funds. However, based on experience, the funds expect the risk of loss to be remote.
(i) New Accounting Standards:
Financial Accounting Standards Board Interpretation (FIN) No. 48 — Accounting for Uncertainty in Tax Positions — An Interpretation of SFAS No. 109, was issued in July 2006 and is effective for fiscal years beginning after December 15, 2006. This Interpretation provides new requirements for the recognition, measurement, and disclosure in the financial statements of a tax position taken or expected to be taken in a tax return when there is uncertainty about whether that tax position will ultimately be sustained. We have not yet completed our evaluation of the impact, if any, of adopting FIN 48 on the Funds’ financial statements.
In September 2006, the Financial Accounting Standards Board (FASB) issued Statement of Financial Accounting Standards No. 157, “Fair Value Measurements” (SFAS No. 157). SFAS No. 157 defines fair value, establishes a framework for measuring fair value in accordance with generally accepted accounting principles and expands disclosure about fair value measurements. SFAS No. 157 is effective for fiscal years beginning after November 15, 2007. Management is currently evaluating the impact the adoption of SFAS No. 157 will have on the Fund’s financial statement disclosures.
| 3. | | Affiliates and Affiliated Transactions:
(All dollar amounts are × 1,000) |
Charles Schwab Investment Management, Inc. (CSIM or the investment adviser), a wholly owned subsidiary of The Charles Schwab Corporation, serves as each fund’s investment adviser and administrator pursuant to an Investment Advisory and
Administration Agreement (Advisory Agreement) between it and the trust. Charles Schwab & Co., Inc. (“Schwab”) is an affiliate of the investment adviser and is the trust’s shareholder services agent and transfer agent.
The underlying funds pay fees to the investment adviser for advisory and administrative services and to Schwab for transfer agent and shareholder services. The funds are not charged such fees directly. These fees are included in the net asset value of the underlying funds.
43
Schwab Target Funds
Financial Notes (continued)
3. Affiliates and Affiliated Transactions (continued):
CSIM and Schwab have made agreements with the funds to limit the total expenses charged, excluding interest, taxes and certain non-routine expenses through February 28, 2007, as follows:
| Target 2010 Fund | | | | | 0.06 | % |
| Target 2020 Fund | | | | | 0.04 | % |
| Target 2030 Fund | | | | | 0.03 | % |
| Target 2040 Fund | | | | | 0.01 | % |
| Retirement Income Fund | | | | | 0.10 | % |
The funds may engage in certain transactions involving related parties. Pursuant to an exemptive order issued by the SEC, the funds may invest in other related funds. As of October 31, 2006, the percentages of the underlying funds’ shares of other related funds owned by each Target fund are:
| | | | Target 2010
Fund
|
| Target 2020
Fund
|
| Target 2030
Fund
|
| Target 2040
Fund
|
| Retirement
Income Fund
|
|---|
Schwab Active Equity Funds: | | | | | | | | | | | | | | | | | | | | | | |
| Core Equity Fund | | | | | 1.2 | % | | | 1.8 | % | | | 1.3 | % | | | 0.8 | % | | | — | |
| Dividend Equity Fund | | | | | 0.3 | % | | | 0.5 | % | | | 0.3 | % | | | 0.2 | % | | | 0.4 | % |
| Small-Cap Equity Fund | | | | | 0.6 | % | | | 0.9 | % | | | 0.8 | % | | | 0.5 | % | | | — | |
| |
Laudus MarketMasters Funds: | | | | | | | | | | | | | | | | | | | | | | |
| International MarketMasters Fund | | | | | 0.3 | % | | | 0.4 | % | | | 0.3 | % | | | 0.2 | % | | | 0.1 | % |
| |
Laudus Rosenberg Funds: | | | | | | | | | | | | | | | | | | | | | | |
| U.S. Large Capitalization Growth Fund | | | | | 6.4 | % | | | 10.1 | % | | | 6.8 | % | | | 4.5 | % | | | — | |
| U.S. Discovery Fund | | | | | 0.3 | % | | | 0.3 | % | | | 0.3 | % | | | 0.2 | % | | | — | |
| International Small Capitalization Fund | | | | | 0.2 | % | | | 0.4 | % | | | 0.2 | % | | | 0.2 | % | | | — | |
| |
Schwab Bond Funds: | | | | | | | | | | | | | | | | | | | | | | |
| Total Bond Market Fund | | | | | 1.6 | % | | | 1.7 | % | | | 0.9 | % | | | 0.3 | % | | | 1.4 | % |
| YieldPlus Fund | | | | | —* | | | | —* | | | | —* | | | | —* | | | | 0.1 | % |
| |
Schwab Money Funds: | | | | | | | | | | | | | | | | | | | | | | |
| Value Advantage Money Fund | | | | | —* | | | | —* | | | | —* | | | | —* | | | | —* | |
Pursuant to an exemptive order issued by the SEC, the funds may enter into interfund borrowing and lending transactions within the Schwab Funds. All loans are for temporary or emergency purposes only. The interest rate charged on the loan is the average of the overnight repurchase agreement rate and the short-term bank loan rate. The interfund lending facility is subject to the oversight and periodic review of the Board of Trustees of the Schwab Funds. There was no interfund borrowing or lending activity for any fund during the period.
Trustees may include people who are officers and/ or directors of the investment adviser or Schwab. Federal securities law limits the percentage of such “interested persons” who may serve on a trust’s board, and the trust was in compliance with these limitations throughout the report period. The trust did not pay any of these persons for their service as trustees, but it did pay non-interested persons (independent trustees), as noted in each fund’s Statement of Operations.
44
Schwab Target Funds
Financial Notes (continued)
| 4. | | Purchases and Sales of Investment Securities:
(All dollar amounts are × 1,000) |
For the fiscal year ended October 31, 2006, purchases and sales of securities (excluding short-term obligations) were as follows:
| | | | Purchases of Securities
| | Sales/Maturities
of Securities
|
|---|
| Target 2010 Fund | | | | $ | 24,807 | | | $ | 166 | |
| Target 2020 Fund | | | | | 40,820 | | | | — | |
| Target 2030 Fund | | | | | 31,835 | | | | — | |
| Target 2040 Fund | | | | | 21,155 | | | | 131 | |
| Retirement Income Fund | | | | | 21,255 | | | | 215 | |
| 5. | | Redemption Fee:
(All dollar amounts are × 1,000) |
The funds may impose a short-term redemption fee on any fund shares that are redeemed or exchanged by a shareholder within a specified number of days of the purchase date. The funds charge 2.00% of the transaction amount on shares redeemed or exchanged 30 days or less after the purchase. Such amounts are net of the redemption fee proceeds on the Statement of Changes in Net Assets. The redemption fees charged during the current and prior fiscal years were:
| | | | Current Period
| | Prior Period
|
|---|
| Target 2010 Fund | | | | $ | 1 | | | $ | 1 | |
| Target 2020 Fund | | | | | 11 | | | | 1 | |
| Target 2030 Fund | | | | | 4 | | | | 1 | |
| Target 2040 Fund | | | | | 5 | | | | — | |
| Retirement Income Fund | | | | | — | | | | — | |
| 6. | | Borrowing:
(All dollar amounts are × 1,000) |
The funds may borrow money from banks and custodians. The funds may obtain temporary bank loans through the trusts to which they belong, to use for meeting shareholder redemptions or for extraordinary or emergency purposes. The trust has custodian overdraft facilities and line of credit arrangements of $150 million and $100 million with State Street Corporation and Bank of America, N.A., respectively. The funds pay interest on the amounts they borrow at rates that are negotiated periodically.
Fund
| | | | Amount
Outstanding
at 10/31/06
| | Average
Borrowing*
| | Weighted
Average
Interest
Rate*(%)
|
|---|
| Target 2010 Fund | | | | $ | — | | | $ | 44 | | | | 5.14 | |
| Target 2020 Fund | | | | | — | | | | 140 | | | | 4.79 | |
| Target 2030 Fund | | | | | — | | | | —** | | | | 5.50 | |
| Target 2040 Fund | | | | | — | | | | 31 | | | | 4.77 | |
| Retirement Income Fund | | | | | — | | | | 135 | | | | 4.76 | |
| * | | Based on the number of days for which the borrowing is outstanding. |
| ** | | Amount is less than $1,000. |
45
Schwab Target Funds
Financial Notes (continued)
| 7. | | Federal Income Taxes:
(All dollar amounts are × 1,000)
|
As of October 31, 2006, the components of distributable earnings on a tax-basis were as follows:
| | | | Target 2010
Fund
|
| Target 2020
Fund
|
| Target 2030
Fund
|
| Target 2040
Fund
|
| Retirement
Income Fund
|
|---|
| Undistributed ordinary income | | | | $ | 603 | | | $ | 617 | | | $ | 297 | | | $ | 118 | | | $ | 4 | |
| Undistributed long-term capital gains | | | | | 166 | | | | 231 | | | | 133 | | | | 75 | | | | — | |
| Unrealized appreciation | | | | | 4,848 | | | | 6,430 | | | | 4,271 | | | | 2,438 | | | | 817 | |
| Unrealized depreciation | | | | | (182 | ) | | | (122 | ) | | | (27 | ) | | | — | | | | (109 | ) |
| Net unrealized appreciation | | | | $ | 4,666 | | | $ | 6,308 | | | $ | 4,244 | | | $ | 2,438 | | | $ | 708 | |
The primary difference between book-basis and tax-basis unrealized appreciation or unrealized depreciation of investments is the tax deferral of losses on wash sales.
The tax-basis components of distributions paid during the current and prior fiscal years were:
| | | | Target 2010
Fund
|
| Target 2020
Fund
|
| Target 2030
Fund
|
| Target 2040
Fund
|
| Retirement
Income Fund
|
|---|
Current period distributions | | | | | | | | | | | | | | | | | | | | | | |
| Ordinary income | | | | $ | 592 | | | $ | 687 | | | $ | 360 | | | $ | 182 | | | $ | 1,227 | |
| Long-term capital gains | | | | | — | | | | — | | | | — | | | | — | | | | 43 | |
| Return of capital | | | | | — | | | | — | | | | — | | | | — | | | | — | |
| |
Prior period distributions | | | | | | | | | | | | | | | | | | | | | | |
| Ordinary income | | | | | — | | | | — | | | | — | | | | — | | | | 138 | |
| Long-term capital gains | | | | | | | | | | | | | | | | | | | | | | |
| Return of capital | | | | | — | | | | — | | | | — | | | | — | | | | — | |
The permanent book and tax basis differences may result in reclassifications between capital account and other accounts as required. The adjustments will have no impact on net assets or the results of operations. As of October 31, 2006, the funds made the following reclassifications:
| | | | Target 2010
Fund
|
| Target 2020
Fund
|
| Target 2030
Fund
|
| Target 2040
Fund
|
| Retirement
Income Fund
|
|---|
| Capital shares | | | | | — | | | | — | | | | — | | | | — | | | | — | |
| Undistributed net investment income | | | | $ | 94 | | | $ | 122 | | | $ | 59 | | | $ | 32 | | | $ | 4 | |
| Net realized capital gains and losses | | | | $ | (94 | ) | | $ | (122 | ) | | $ | (59 | ) | | $ | (32 | ) | | $ | (4 | ) |
46
Schwab Target Funds
Financial Notes (continued)
Other Federal Tax Information: (unaudited)
(All dollar amounts are × 1,000)
For corporate shareholders, the following percentage of the funds dividend distributions paid during the fiscal year ended October 31, 2006, qualify for the corporate dividends received deduction:
| | | | | Percentage
| | |
|---|
| Target 2010 Fund | | | | | 34.07 | % | |
| Target 2020 Fund | | | | | 33.95 | % | |
| Target 2030 Fund | | | | | 32.21 | % | |
| Target 2040 Fund | | | | | 31.85 | % | |
| Retirement Income Fund | | | | | 15.57 | % | |
For the fiscal year ended October 31, 2006, the funds designate the following amounts of the dividend distributions as qualified dividends for the purpose of the maximum rate under section 1(h)(ii) of the Internal Revenue Code. Shareholders will be notified in January 2007 via IRS form 1099 of the amounts for use in preparing their 2006 income tax return.
| Target 2010 Fund | | | | $ | 226 | |
| Target 2020 Fund | | | | | 379 | |
| Target 2030 Fund | | | | | 177 | |
| Target 2040 Fund | | | | | 104 | |
| Retirement Income Fund | | | | | 99 | |
47
Report of Independent Registered Public Accounting Firm
To the Board of Trustees and Shareholders of
Schwab Target 2010 Fund
Schwab Target 2020 Fund
Schwab Target 2030 Fund
Schwab Target 2040 Fund
Schwab Retirement Income Fund
In our opinion, the accompanying statements of assets and liabilities, including the portfolio holdings, and the related statements of operations and of changes in net assets and the financial highlights present fairly, in all material respects, the financial position of Schwab Target 2010 Fund, Schwab Target 2020 Fund, Schwab Target 2030 Fund, Schwab Target 2040 Fund and Schwab Retirement Income Fund (five of the portfolios constituting Schwab Capital Trust, hereafter referred to as the “Funds”) at October 31, 2006, the results of each of their operations for the year then ended, and the changes in each of their net assets and the financial highlights for the year then ended and for the period July 1, 2005 (commencement of operations) through October 31, 2005, in conformity with accounting principles generally accepted in the United States of America. These financial statements and financial highlights (hereafter referred to as “financial statements”) are the responsibility of the Funds’ management; our responsibility is to express an opinion on these financial statements based on our audits. We conducted our audits of these financial statements in accordance with the standards of the Public Company Accounting Oversight Board (United States). Those standards require that we plan and perform the audits to obtain reasonable assurance about whether the financial statements are free of material misstatement. An audit includes examining, on a test basis, evidence supporting the amounts and disclosures in the financial statements, assessing the accounting principles used and significant estimates made by management, and evaluating the overall financial statement presentation. We believe that our audits, which included confirmation of securities at October 31, 2006 by correspondence with the custodian and brokers, provide a reasonable basis for our opinion.
PricewaterhouseCoopers LLP
San Francisco, California
December 14, 2006
48
Investment Advisory Agreement Approval
The Investment Company Act of 1940 (the “1940 Act”) requires that initial approval of, as well as the continuation of, a fund’s investment advisory agreement must be specifically approved (1) by the vote of the trustees or by a vote of the shareholders of the fund, and (2) by the vote of a majority of the trustees who are not parties to the investment advisory agreement or “interested persons” of any party (the “Independent Trustees”), cast in person at a meeting called for the purpose of voting on such approval. In connection with such approvals, the fund’s trustees must request and evaluate, and the investment adviser is required to furnish, such information as may be reasonably necessary to evaluate the terms of the advisory agreement. In addition, the Securities and Exchange Commission (the “SEC”) takes the position that, as part of their fiduciary duties with respect to fund fees, fund boards are required to evaluate the material factors applicable to a decision to approve an investment advisory agreement.
Consistent with these responsibilities, the Board of Trustees (the “Board”) calls and holds one or more meetings each year that are dedicated, in whole or in part, to considering whether to renew the investment advisory agreement between Schwab Capital Trust (the “Trust”) and CSIM (the “Agreement”) with respect to existing funds in the Trust, including the funds covered in this annual report, and to review certain other agreements pursuant to which CSIM provides investment advisory services to certain other registered investment companies. In preparation for the meeting(s), the Board requests and reviews a wide variety of materials provided by CSIM, including information about CSIM’s affiliates, personnel and operations. The Board also receives extensive data provided by third parties. This information is in addition to the detailed information about the funds that the Board reviews during the course of each year, including information that relates to fund operations and fund performance. The trustees also receive a memorandum from fund counsel regarding the responsibilities of trustees for the approval of investment advisory contracts. In addition, the Independent Trustees receive advice from independent counsel to the Independent Trustees, meet in executive session outside the presence of fund management and participate in question and answer sessions with representatives of CSIM.
The Board, including a majority of the Independent Trustees, considered information specifically relating to the continuance of the Agreement at meetings held on May 2, 2006, May 24, 2006 and June 12, 2006, and approved the renewal of the Agreement for an additional one year term at the meeting held on June 12, 2006. The Board’s approval of the Agreement was based on consideration and evaluation of a variety of specific factors discussed at these meetings and at prior meetings, including:
| 1. | | the nature, extent and quality of the services provided to the funds under the Agreement, including the resources of CSIM and its affiliates dedicated to the funds; |
| 2. | | each fund’s investment performance and how it compared to that of certain other comparable mutual funds; |
| 3. | | each fund’s expenses and how those expenses compared to those of certain other comparable mutual funds; |
| 4. | | the profitability of CSIM and its affiliates, including Charles Schwab & Co., Inc. (“Schwab”), with respect to each fund, including both direct and indirect benefits accruing to CSIM and its affiliates; and |
| 5. | | the extent to which economies of scale would be realized as the funds grow and whether fee levels in the Agreement reflect those economies of scale for the benefit of fund investors. |
Nature, Extent and Quality of Services. The Board considered the nature, extent and quality of the services provided by CSIM to the funds and the resources of CSIM and its affiliates dedicated to the funds. In this regard, the trustees evaluated, among other things, CSIM’s personnel, experience, track record and compliance program. The information considered by the trustees included specific information concerning changes in the nature, extent and quality of services provided by CSIM since the trustees had last considered approval of the Agreement. The trustees also considered the fact that Schwab’s extensive branch network, Internet access, investment and research tools, telephone services, and array of account features benefit the funds and their shareholders. The trustees also considered Schwab’s excellent reputation as a full service brokerage firm and its overall financial condition. Finally, the trustees considered that the vast majority of the funds’ shareholders are also brokerage clients of Schwab, and that CSIM and its affiliates are uniquely positioned to provide services and support to the funds and such shareholders. Following such evaluation, the Board concluded, within the context of its full deliberations, that the nature, extent and quality of services provided by CSIM to the funds and the resources of CSIM and its affiliates dedicated to the funds supported renewal of the Agreement.
Fund Performance. The Board considered fund performance in determining whether to renew the Agreement. Specifically, the trustees considered each fund’s performance relative to a peer group of other mutual funds
49
and appropriate indices/benchmarks, in light of total return and market trends. As part of this review, the trustees considered the composition of the peer group, selection criteria and the reputation of the third party who prepared the peer group analysis. In evaluating the performance of each fund, the trustees considered both market risk and shareholder risk expectations for such fund and the appropriateness of the benchmark used to compare the performance of each fund. The trustees further considered the level of fund performance in the context of its review of fund expenses and adviser profitability discussed below. Following such evaluation the Board concluded, within the context of its full deliberations, that the performance of the funds supported renewal of the Agreement.
Fund Expenses. With respect to the funds’ expenses, the trustees considered the rate of compensation called for by the Agreement, and each fund’s net operating expense ratio, in each case, in comparison to those of other comparable mutual funds, such peer groups and comparisons having been selected and calculated by an independent third party. The trustees considered the effects of CSIM’s and Schwab’s historical practice of voluntarily waiving management and other fees to prevent total fund expenses from exceeding a specified cap. The trustees also considered fees charged by CSIM to other mutual funds and to other types of accounts, such as wrap accounts, but, with respect to such other types of accounts, accorded less weight to such comparisons due to the different legal, regulatory, compliance and operating features of mutual funds as compared to these other types of accounts. Following such evaluation, the Board concluded, within the context of its full deliberations, that the expenses of the funds are reasonable and supported renewal of the Agreement.
Profitability. With regard to profitability, the trustees considered the compensation flowing to CSIM and its affiliates, directly or indirectly. In this connection, the trustees reviewed management’s profitability analyses, together with certain commentary thereon from an independent accounting firm. The trustees also considered any other benefits derived by CSIM from its relationship with the funds, such as whether, by virtue of its management of the funds, CSIM obtains investment information or other research resources that aid it in providing advisory services to other clients. The trustees considered whether the varied levels of compensation and profitability under the Agreement and other service agreements were reasonable and justified in light of the quality of all services rendered to each fund by CSIM and its affiliates. The Board also considered information relating to changes to CSIM’s cost structure, including cost savings, technology investments and increased operating efficiencies and how these changes affected CSIM’s profitability under the Agreement. Based on this evaluation, the Board concluded, within the context of its full deliberations, that the profitability of CSIM is reasonable and supported renewal of the Agreement.
Economies of Scale. The trustees considered the existence of any economies of scale and whether those are passed along to a fund’s shareholders through a graduated investment advisory fee schedule or other means, including any fee waivers by CSIM and its affiliates. In this regard, and consistent with their consideration of fund expenses, the trustees considered that CSIM and Schwab have previously committed resources to minimize the effects on shareholders of diseconomies of scale during periods when fund assets were relatively small through their contractual expense waivers. For example, such diseconomies of scale may particularly affect newer funds or funds with investment strategies that are from time to time out of favor, but shareholders may benefit from the continued availability of such funds at subsidized expense levels. The trustees also considered CSIM’s agreement to contractual investment advisory fee schedules that include lower fees at higher graduated asset levels. The Board also considered certain commitments by CSIM and Schwab that are designed to pass along potential economies of scale to fund shareholders. Specifically, the Board considered CSIM and Schwab’s commitments, which may be changed only with Board approval: (i) to reduce contractual advisory fees or add breakpoints for certain funds, and (ii) to implement, by means of expense limitation agreement, reductions in net overall expenses for certain funds. Based on this evaluation, and in consideration of the commitments made by CSIM and Schwab as discussed above, the Board concluded, within the context of its full deliberations, that the funds obtain reasonable benefit from economies of scale.
In the course of their deliberations, the trustees did not identify any particular information or factor that was all-important or controlling. Based on the trustees’ deliberation and their evaluation of the information described above, the Board, including all of the Independent Trustees, unanimously approved the continuation of the Agreement and concluded that the compensation under the Agreement is fair and reasonable in light of such services and expenses and such other matters as the trustees have considered to be relevant in the exercise of their reasonable judgment.
50
Trustees and Officers
The tables below gives information about the trustees and officers for The Schwab Capital Trust, which includes the funds covered in this report. The “Fund Complex” includes The Charles Schwab Family of Funds, Schwab Capital Trust, Schwab Investments, Schwab Annuity Portfolios, Laudus Trust, Laudus Variable Insurance Trust, Excelsior Funds, Inc., Excelsior Tax-Exempt Funds, Inc., and Excelsior Funds Trust. As of October 31, 2006, the Fund Complex included 96 funds.
The address for all trustees and officers is 101 Montgomery Street, San Francisco, CA 94104. You can find more information about the trustees and officers in the Statement of Additional Information, which is available free by calling 1-800-435-4000.
Independent Trustees |
Name, Year of Birth,
and Position(s) with
the Trust; (Term of
Office, and Length of
Time Served1) | | | | Principal Occupations
During the Past Five Years | | Number of
Portfolios in
Fund Complex
Overseen by
the Trustee | | Other Directorships |
Mariann Byerwalter
1960
Trustee
(Trustee of Schwab Capital Trust since 2000.) | | | | Chairman of JDN Corporate Advisory LLC. From 1996 to 2001, Vice President for Business Affairs and Chief Financial Officer of Stanford University, and in 2001, Special Advisor to the President of Stanford University. | | 96 | | Board 1—Director, Redwood Trust, Inc.
Board 2—Director, PMI Group, Inc. |
Donald F. Dorward
1931
Trustee
(Trustee of Schwab Capital Trust since 1989.) | | | | Chief Executive Officer, Dorward & Associates (corporate management, marketing and communications consulting firm). From 1996–1999, Executive Vice President and Managing Director, Grey Advertising. Prior to 1996, President and Chief Executive Officer, Allen & Dorward Advertising. | | 57 | | None. |
William A. Hasler
1941
Trustee
(Trustee of Schwab Capital Trust since 2000.) | | | | Retired. Dean Emeritus, Haas School of Business, University of California, Berkeley. Until February 2004, Co-Chief Executive Officer, Aphton Corp. (bio-pharmaceuticals). Prior to August 1998, Dean of the Haas School of Business, University of California, Berkeley (higher education). | | 96 | | Board 1—Director, Aphton Corp.
Board 2—Director, Mission West Properties
Board 3—Director, TOUSA
Board 4—Director, Stratex Networks
Board 5—Director, Genitope Corp.
Board 6���Director & Non-Executive
Chairman, Solectron Corp.
Board 7—Director, Ditech
Communications Corp. |
Robert G. Holmes
1931
Trustee
(Trustee of Schwab Capital Trust since 1989.) | | | | Chairman, Chief Executive Officer and Director, Semloh Financial, Inc. (international financial services and investment
advisory firm). | | 57 | | None. |
Gerald B. Smith
1950
Trustee
(Trustee of Schwab Capital Trust since 2000.) | | | | Chairman and Chief Executive Officer and founder of Smith Graham & Co.
(investment advisors). | | 57 | | Board 1—Board of Cooper Industries
Board 2—Chairman of the Audit Committee
of Northern Border Partners, M.L.P. |
51
Independent Trustees continued |
Name, Year of Birth,
and Position(s) with
the Trust; (Term of
Office, and Length of
Time Served1) | | | | Principal Occupations
During the Past Five Years | | Number of
Portfolios in
Fund Complex
Overseen by
the Trustee | | Other Directorships |
Donald R. Stephens
1938
Trustee
(Trustee of Schwab Capital Trust since 1989.) | | | | Managing Partner, D.R. Stephens & Company (investments). Prior to 1996, Chairman and Chief Executive Officer of North American Trust (real estate
investment trust). | | 57 | | None. |
Michael W. Wilsey
1943
Trustee
(Trustee of Schwab Capital Trust since 1989.) | | | | Chairman and Chief Executive Officer, Wilsey Bennett, Inc. (real estate investment and management, and other investments). | | 57 | | None. |
Interested Trustees |
Name, Year of Birth,
and Position(s) with
the Trust; (Term of
Office, and Length of
Time Served1) | | | | Principal Occupations
During the Past Five Years | | Number of
Portfolios in
Fund Complex
Overseen by
the Trustee | | Other Directorships |
Charles R. Schwab2
1937
Chairman and Trustee
(Chairman and Trustee
of Schwab Capital Trust
since 1989.) | | | | Chairman, Chief Executive Officer and Director, The Charles Schwab Corporation, Charles Schwab & Co., Inc.; Chairman and Director, Charles Schwab Investment Management, Inc., Charles Schwab Bank, N. A.; Chairman and Chief Executive Officer, Schwab (SIS) Holdings Inc. I, Schwab International Holdings, Inc.; Chief Executive Officer and Director, Schwab Holdings, Inc.; Director, U.S. Trust Company, N. A., U.S. Trust Corporation, United States Trust Company of New York. Until May 2003, Co-Chief Executive Officer, The Charles Schwab Corporation. | | 57 | | None. |
Randall W. Merk2
1954
Trustee
(Trustee of Schwab Capital Trust since 2005.) | | | | Executive Vice President and President, Schwab Financial Products, Charles Schwab & Co., Inc.; Director, Charles Schwab Asset Management (Ireland) Limited and Charles Schwab Worldwide Funds PLC. From September 2002 to July 2004, Chief Executive Officer and President, Charles Schwab Investment Management, Inc. and Executive Vice President, Charles Schwab & Co., Inc. Prior to September 2002, President and Chief Investment Officer, American Century Investment Management, and Director, American Century Companies, Inc. | | 96 | | None. |
52
Officers of the Trust |
Name, Year of Birth, and Position(s)
with the Trust; (Term of Office, and
Length of Time Served3) | | | | Principal Occupations During the Past Five Years |
Evelyn Dilsaver
1955
President and Chief Executive Officer
(Officer of Schwab Capital Trust since 2004.) | | | | President, Chief Executive Officer, and Director, Charles Schwab Investment Management, Inc.; Executive Vice President, Charles Schwab & Co., Inc; President and Chief Executive Officer, Laudus Trust and Laudus Variable Insurance Trust; President, Excelsior Funds Inc., Excelsior Tax-Exempt Funds, Inc., and Excelsior Funds Trust; President, Mutual Fund Division, UST Advisers, Inc. From June 2003 to July 2004, Senior Vice President, Asset Management Products and Services, Charles Schwab & Co., Inc. Prior to June 2003, Executive Vice President, Chief Financial Officer, and Chief Administrative Officer, U.S. Trust, a subsidiary of The Charles Schwab Corporation. |
George Pereira
1964
Treasurer and Principal Financial Officer
(Officer of Schwab Capital Trust since 2004.) | | | | Senior Vice President and Chief Financial Officer, Charles Schwab Investment Management, Inc.; Chief Financial Officer, Laudus Trust and Laudus Variable Insurance Trust; Treasurer, Chief Financial Officer and Chief Accounting Officer, Excelsior Funds Inc., Excelsior Tax-Exempt Funds, Inc., and Excelsior Funds Trust; Chief Financial Officer, Mutual Fund Division, UST Advisors, Inc. Director, Charles Schwab Worldwide Fund, PLC and Charles Schwab Asset Management (Ireland) Limited. From December 1999 to November 2004, Sr. Vice President, Financial Reporting, Charles Schwab & Co., Inc. |
Kimon Daifotis
1959
Senior Vice President and Chief
Investment Officer — Fixed Income
(Officer of Schwab Capital Trust since 2004.) | | | | Senior Vice President and Chief Investment Officer — Fixed Income, Charles Schwab Investment Management, Inc. Prior to 2004, Vice President and Sr. Portfolio Manager, Charles Schwab Investment Management, Inc. |
Jeffrey Mortimer
1963
Senior Vice President and Chief
Investment Officer — Equities
(Officer of Schwab Capital Trust since 2004.) | | | | Senior Vice President and Chief Investment Officer—Equities, Charles Schwab Investment Management, Inc.; Vice President and Chief Investment Officer, Laudus Trust and Laudus Variable Insurance Trust. Prior to 2004, Vice President and Sr. Portfolio Manager, Charles Schwab Investment Management, Inc. |
Randall Fillmore
1960
Chief Compliance Officer and AML Officer
(Officer of Schwab Capital Trust since 2002.) | | | | Senior Vice President and Chief Compliance Officer, Charles Schwab Investment Management, Inc.; Senior Vice President Charles Schwab & Co., Inc.; Chief Compliance Officer, Laudus Trust and Laudus Variable Insurance Trust; Chief Compliance Officer, Excelsior Funds Inc., Excelsior Tax-Exempt Funds, Inc., and Excelsior Funds Trust. From 2002 to 2003, Vice President, Charles Schwab & Co., Inc., and Charles Schwab Investment Management, Inc. From 2000 to 2002, Vice President, Internal Audit, Charles Schwab & Co., Inc. |
Koji E. Felton
1961
Secretary and Chief Legal Officer
(Officer of Schwab Capital Trust since 1998.) | | | | Senior Vice President, Chief Counsel and Corporate Secretary, Charles Schwab Investment Management, Inc.; Senior Vice President and Deputy General Counsel, Charles Schwab & Co., Inc.; Chief Legal Officer, Laudus Trust and Laudus Variable Insurance Trust; Chief Legal Officer, Excelsior Funds Inc., Excelsior Tax-Exempt Funds, Inc., and Excelsior Funds Trust. Prior to June 1998, Branch Chief in Enforcement at U.S. Securities and Exchange Commission in San Francisco. |
Catherine MacGregor
1964
Vice President
(Officer of Schwab Capital Trust since 2005) | | | | Vice President, Charles Schwab & Co., Inc., Charles Schwab Investment Management, Inc., Laudus Trust and Laudus Variable Insurance Trust; since 2006, Chief Counsel, Laudus Trust and Laudus Variable Insurance Trust. Until July 2005, Senior Associate, Paul Hastings Janofsky & Walker LLP. |
53
Officers of the Trust (continued) |
Name, Year of Birth, and Position(s)
with the Trust; (Term of Office, and
Length of Time Served3) | | | | Principal Occupations During the Past Five Years |
Cathy Sabo
1964
Vice President
(Officer of Schwab Capital Trust since 2005) | | | | Vice President, Compliance, Charles Schwab Investment Management, Inc., Laudus Trust and Laudus Variable Insurance Trust. Until 2004, Vice President, Client, Sales & Services Controls, Charles Schwab & Co., Inc. |
Michael Haydel
1972
Vice President
(Officer of Schwab Capital Trust since 2006) | | | | Vice President, Asset Management Client Services, Charles Schwab & Co., Inc.; Vice President and AML Officer, Laudus Trust and Laudus Variable Insurance Trust. Until March 2004, Director Charles Schwab & Co., Inc. |
1Trustees remain in office until they resign, retire or are removed by shareholder vote. The Schwab Funds retirement policy requires that independent trustees elected after January 1, 2000 retire at age 72 or after twenty years of service as a trustee, whichever comes first. Independent trustees elected prior to January 1, 2000 will retire on the following schedule: Messrs. Holmes and Dorward will retire on December 31, 2007, and Messrs. Stephens and Wilsey will retire on December 31, 2010.
2In addition to their employment with the investment adviser and the distributor, Messrs. Schwab and Merk also own stock of The Charles Schwab Corporation. Mr. Schwab and Mr. Merk are Interested Trustees because they are employees of Schwab and/or the adviser.
3The President, Treasurer and Secretary hold office until their respective successors are chosen and qualified or until he or she sooner dies, resigns, is removed or becomes disqualified. Each other officer serves at the pleasure of the Board.
54
Glossary
asset allocation The practice of dividing a portfolio among different asset classes, with each asset class assigned a particular percentage.
asset class A group of securities with similar structure and basic characteristics. Stocks, bonds and cash are the three main examples of asset classes.
beta A historical measure of an investment’s volatility relative to a market index (usually the S&P 500®). The index is defined as having a beta of 1.00. Investments with a beta higher than 1.00 have been more volatile than the index; those with a beta of less than 1.00 have been less volatile.
bond A security representing a loan from the investor to the issuer. A bond typically pays interest at a fixed rate (the “coupon rate”) until a specified date (the “maturity date”), at which time the issuer returns the money borrowed (“principal” or “face value”) to the bondholder. Because of their structure, bonds are sometimes called “fixed income securities” or “debt securities.”
An individual bond is subject to the credit risk of the issuer. Changes in interest rates can affect a bond’s market value prior to call or maturity. There is no guarantee that a bond’s yield to call or maturity will provide a positive return over the rate of inflation.
bond fund A bond fund is subject to the same credit, interest rate, and inflation risks as bonds. In addition, a bond fund incurs ongoing fees and expenses. A bond fund’s net asset value will fluctuate with the price of the underlying bonds and the portfolio turnover activity; return of principal is not guaranteed.
cap, capitalization See “market cap.”
capital gain, capital loss The difference between the amount paid for an investment and its value at a later time. If the investment has been sold, the capital gain or loss is considered a realized gain or loss. If the investment is still held, the gain or loss is still “on paper” and is considered unrealized.
earnings growth rate For a mutual fund, the average yearly rate at which the earnings of the companies in the fund’s portfolio have grown, measured over the past five years.
earnings per share (EPS) A company’s earnings, or net income, for the past 12 months, divided by the number of shares outstanding.
expense ratio The amount that is taken from a mutual fund’s assets each year to cover the fund’s operating expenses. An expense ratio of 0.50% means that a fund’s expenses amount to half of one percent of its average net assets a year.
market cap, market capitalization The value of a company as determined by the total value of all shares of its stock outstanding.
median market cap The midpoint of the range of market caps of the stocks held by a fund. There are different ways of calculating median market cap. With a simple median, half of the stocks in the fund’s portfolio would be larger than the median, and half would be smaller. With a weighted median (the type that is calculated for these funds), half of the fund’s assets are invested in stocks that are larger than the median market cap, and half in stocks that are smaller.
net asset value (NAV) The value of one share of a mutual fund. NAV is calculated by taking the fund’s total assets, subtracting liabilities, and dividing by the number of shares outstanding.
outstanding shares, shares outstanding When speaking of a company or mutual fund, indicates all shares currently held by investors.
price-to-book ratio (P/B) The market price of a company’s stock compared with its “book value.” A mutual fund’s P/B is the weighted average of the P/B of all stocks in the fund’s portfolio.
price-to-earnings ratio (P/E) The market price of a company’s stock compared with earnings over the past year. A mutual fund’s P/E is the weighted average of the P/E of all stocks in the fund’s portfolio.
return on equity (ROE) The average yearly rate of return for each dollar of investors’ money, measured over the past five years.
stock A share of ownership, or equity, in the issuing company.
total return The percentage that an investor would have earned or lost on an investment in the fund assuming dividends and distributions were reinvested.
weighted average For mutual funds, an average that gives the same weight to each security as the security represents in the fund’s portfolio.
yield The income paid out by an investment, expressed as a percentage of the investment’s market value.
55
Notes
Schwab Funds® offers you an extensive family of mutual funds, each one based on a clearly defined investment approach and using disciplined management strategies. The list at right shows all currently available Schwab Funds.
Whether you’re an experienced investor or just starting out, Schwab Funds can help you achieve your financial goals. An investor should consider a fund’s investment objectives, risks, and charges and expenses carefully before investing or sending money. This and other important information can be found in the fund’s prospectus. Please call 1-800-435-4000 for a prospectus and brochure for any Schwab Fund. Please read the prospectus carefully before you invest. This report must be preceded or accompanied by a current prospectus.
Proxy Voting Policies, Procedures and Results
A description of the proxy voting policies and procedures used to determine how to vote proxies on behalf of the funds is available without charge, upon request, by visiting Schwab’s website at www.schwab.com/schwabfunds, the SEC’s website at www.sec.gov, or by contacting Schwab Funds at 1-800-435-4000.
Information regarding how a fund voted proxies relating to portfolio securities during the most recent twelve-month period ended June 30 is available, without charge, by visiting Schwab’s website at www.schwab.com/schwabfunds or the SEC’s website at www.sec.gov.
The Schwab Funds Family®
Stock Funds
Schwab Premier Equity Fund®
Schwab Core Equity Fund™
Schwab Dividend Equity Fund™
Schwab Large-Cap Growth Fund™
Schwab Small-Cap Equity Fund™
Schwab Hedged Equity Fund™
Schwab Financial Services Fund™
Schwab Health Care Fund™
Schwab Technology Fund™
Schwab Institutional Select® S&P 500 Fund
Schwab S&P 500 Index Fund
Schwab 1000 Index® Fund
Schwab Small-Cap Index Fund®
Schwab Total Stock Market Index Fund®
Schwab International Index Fund®
Asset Allocation Funds
Schwab Viewpoints Fund™
Schwab MarketTrack All Equity Portfolio™
Schwab MarketTrack Growth Portfolio™
Schwab MarketTrack Balanced Portfolio™
Schwab MarketTrack Conservative Portfolio™
Schwab Target 2010 Fund
Schwab Target 2020 Fund
Schwab Target 2030 Fund
Schwab Target 2040 Fund
Schwab Retirement Income Fund
Bond Funds
Schwab YieldPlus Fund®
Schwab Short-Term Bond Market Fund™
Schwab Total Bond Market Fund™
Schwab GNMA Fund™
Schwab Inflation Protected Fund™
Schwab Tax-Free YieldPlus Fund™
Schwab Short/Intermediate Tax-Free Bond Fund™
Schwab Long-Term Tax-Free Bond Fund™
Schwab California Tax-Free YieldPlus Fund™
Schwab California Short/Intermediate
Tax-Free Bond Fund™
Schwab California Long-Term Tax-Free Bond Fund™
Schwab Money Funds
Schwab offers an array of money market funds that seek high current income consistent with safety and liquidity.1 Choose from taxable or tax-advantaged alternatives. Many can be linked to your eligible Schwab account to “sweep” cash balances automatically, subject to availability, when you’re between investments. Or, for your larger cash reserves, choose one of our Value Advantage Investments®.
1Investments in money market funds are neither insured nor guaranteed by the Federal Deposit Insurance Corporation (FDIC) or any other government agency and, although they seek to preserve the value of your investment at $1 per share, it is possible to lose money.
Investment Adviser
Charles Schwab Investment Management, Inc.
101 Montgomery Street, San Francisco, CA 94104
Funds
Schwab Funds®
P.O. Box 3812, Englewood, CO 80155—3812
This report is not authorized for distribution to prospective investors unless preceded or accompanied by a current prospectus.
© 2006 Charles Schwab & Co., Inc. All rights reserved.
Member SIPC
Printed on recycled paper.
MFR33732-01
| Schwab MarketTrack Portfolios® |
| | Annual Report
October 31, 2006
|
| | |
| | Schwab MarketTrack
All Equity Portfolio™ Schwab MarketTrack
Growth Portfolio™ Schwab MarketTrack
Balanced Portfolio™ Schwab MarketTrack
Conservative Portfolio™ |
| | |
| | |
| | |
Four portfolios that combine the power of indexing with the benefits of asset allocation
In this report
| Performance at a Glance | | 1 |
| From the Chairman | | 2 |
| From the President | | 3 |
| Investment Environment | | 4 |
| Schwab MarketTrack All Equity Portfolio™ | | 6 |
| Schwab MarketTrack Growth Portfolio™ | | 8 |
| Schwab MarketTrack Balanced Portfolio™ | | 10 |
| Schwab MarketTrack Conservative Portfolio™ | | 12 |
| Fund Expenses | | 14 |
| Financial Statements | | 15 |
| Financial Notes | | 50 |
| Investment Advisory Agreement Approval | | 58 |
| Trustees and Officers | | 60 |
| Glossary | | 64 |
The industry/sector classification of the funds’ portfolio holdings uses the Global Industry Classification Standard (GICS) which was developed by and is the exclusive property of Morgan Stanley Capital International Inc. and Standard & Poor’s. GICS is a service mark of MSCI and S&P and has been licensed for use by Charles Schwab & Co., Inc.
Fund investment adviser: Charles Schwab Investment Management, Inc. (CSIM).
Distributor and transfer agent: Charles Schwab & Co., Inc. (Schwab).
Performance at a Glance
The performance data quoted represents past performance. Past performance does not guarantee future results. Investment returns and principal value will fluctuate so that an investor’s shares may be worth more or less than their original cost. Current performance may be lower or higher than performance data quoted. To obtain performance information current to the most recent month end, please visit www.schwab.com/schwabfunds.
|
| Total Return for the Report Period
|
|---|
Schwab MarketTrack All Equity Portfolio™ (Ticker Symbol: SWEGX) | | 19.31% |
| Benchmark: All Equity Composite Index | | 19.85% |
| Fund Category: Morningstar Large-Cap Blend | | 14.74% |
Performance Details | | pages 6–7 |
| | | | | |
Schwab MarketTrack Growth Portfolio™ | | | | |
| Investor Shares (Ticker Symbol: SWHGX) | | 15.83% |
| P Shares (Ticker Symbol: SWPGX)* | | 4.69% |
| Benchmark: Growth Composite Index | | 16.37% |
| Fund Category: Morningstar Large-Cap Blend | | 14.74% |
Performance Details | | pages 8–9 |
| | | | | |
Schwab MarketTrack Balanced Portfolio™ (Ticker Symbol: SWBGX) | | 12.92% |
| Benchmark: Balanced Composite Index | | 13.50% |
| Fund Category: Morningstar Moderate Allocation | | 11.91% |
Performance Details | | pages 10–11 |
| | | | | |
Schwab MarketTrack Conservative Portfolio™ | | | | |
| Investor Shares (Ticker Symbol: SWCGX) | | 10.13% |
| P Shares (Ticker Symbol: SWCPX)* | | 4.22% |
| Benchmark: Conservative Composite Index | | 10.68% |
| Fund Category: Morningstar Conservative Allocation | | 8.43% |
Performance Details | | pages 12–13 |
| | | | | |
Minimum Initial Investment1 | | | | |
Investor Shares
| | |
| ($500 for retirement, education and custodial accounts) | | $1,000 |
| P Shares | | $100,000 |
All fund and index figures on this page assume dividends and distributions were reinvested. Index figures do not include trading and management costs, which would lower performance. Indices are unmanaged, and you cannot invest in them directly. Performance results less than one year are not annualized.
Expenses may be partially absorbed by CSIM and Schwab. Without these reductions, the portfolios’ total returns would have been lower. Performance does not reflect the deduction of taxes that a shareholder would pay on portfolio distributions or on the redemption of portfolio shares.
The All Equity Composite Index is composed of Morningstar category averages and is calculated using the following portion allocations: 45% large-cap stocks, 25% small-cap stocks and 30% foreign stocks. Source: Morningstar, Inc.
The Growth Composite Index is composed of Morningstar category averages and cash equivalents as represented by the 90-day T-bill and is calculated using the following portfolio allocations: 40% large-cap stocks, 20% small-cap stocks, 20% foreign stocks, 15% bonds and 5% cash. Source: Morningstar, Inc.
The Balanced Composite Index is composed of Morningstar category averages and cash equivalents as represented by the 90-day T-bill and is calculated using the following portfolio allocations: 30% large-cap stocks, 15% small-caps stocks, 15% foreign stocks, 35% bonds and 5% cash. Source: Morningstar, Inc.
The Conservative Composite Index is composed of Morningstar category averages and cash equivalents as represented by the 90-day T-bill and is calculated using the following portfolio allocations: 20% large-cap stocks, 10% small-cap stocks, 10% foreign stocks, 55% bonds and 5% cash. Source: Morningstar. Inc.
Source of category information: Morningstar, Inc.
1 | | Please see prospectus for further detail and eligibility requirements. |
| * | | Return is for the period since inception (4/6/06) through 10/31/06. Not annualized. |
Schwab MarketTrack Portfolios 1
Charles Schwab
Chairman | | From the Chairman Dear Shareholder, I founded Schwab over thirty years ago to be a home for serious investors. That mission continues to guide us today as we constantly strive to improve and innovate. By doing this, and providing some of the highest quality products and services — at a competitive price — we remain true to our heritage. I take particular pride in the Schwab Funds. Founded over 15 years ago, Schwab Funds now includes more than 50 funds with over $170 billion in assets. With a variety of investment strategies, Schwab Funds provides a range of innovative investment choices that can serve as a foundation for your asset allocation plan, including the Schwab MarketTrack Portfolios, contained within this book. The Schwab MarketTrack Portfolios are asset allocation funds. Research has shown that asset allocation can be the most important factor in determining overall portfolio performance. The Schwab MarketTrack Portfolios offer investors a convenient way to allocate their investment across management strategies and asset classes to help balance risk while seeking to provide competitive returns. Schwab Funds are managed by Charles Schwab Investment Management, Inc., one of the largest mutual fund managers in the U.S. Our portfolio managers share a passion for market analysis and use some of the most sophisticated financial models in the country. I am proud of their depth of experience, which reflects an average of 14 years in the investment industry. Furthermore, I am impressed by the commitment that our managers bring to the stewardship of their funds, for you, their shareholders. In closing, I want to thank you for investing with us. We work every day to warrant the trust you have placed in us; that will never change. Sincerely, |
2 Schwab MarketTrack Portfolios
Evelyn Dilsaver is President and
CEO of Charles Schwab Investment
Management, Inc. and of each of
the funds covered in this report.
She joined the firm in 1992 and
has held a variety of executive
positions at Schwab. | | From the President Dear Shareholder, I am pleased to present the annual report for the Schwab MarketTrack Portfolios for the period ended October 31, 2006. Thanks to the support of investors like you, Schwab MarketTrack Portfolios assets were over $2 billion as of this report date. Schwab MarketTrack Portfolios offer the power of indexing plus asset allocation. Indexing offers the potential to keep pace with market performance while asset allocation can help you manage risk. Indexing can be a highly effective approach to stock investing. In fact, for the one-year report period, I’m pleased to note that all four of the Schwab MarketTrack Portfolios beat their respective fund category averages. With this report, you will see that we have recently started an initiative to enhance the presentation of our shareholder reports to make it easier for you to find information about your fund. This book represents the first step in this process, with additional changes anticipated for future report cycles. You will notice, for example, that we have added a new lead page, Performance at a Glance, which includes the funds’ ticker symbols and report period returns for the funds, their benchmarks and category averages. For ease of reference, we have relocated the fund manager’s discussion to be in close proximity to the fund performance and portfolio statistics sections. At this time, I would like to highlight another valuable information resource for fund shareholders, namely, our website at www.schwabfunds.com. This website contains regular updates about the Schwab Funds. I encourage you to visit the website to stay informed about your fund. I’d like to emphasize that your trust is very important to us and I will do all I can to maintain that trust. Thank you for investing in Schwab Funds. Sincerely, Past performance is no guarantee of future results. |
Schwab MarketTrack Portfolios 3
Jeffrey Mortimer, CFA, senior vice
president and chief investment
officer, equities, is responsible for the
overall management of the fund.
| | The Investment Environment As the U.S. economy transitioned to slower growth, equities markets rebounded, aided by higher corporate profitability, falling energy/commodity prices, and lower interest rates. The S&P 500 Index returned 16.34% and the Russell 2000 Index returned 19.98%, respectively, for the one-year report period ended October 31, 2006. Improving fundamentals and attractive valuations strengthened investor interest in emerging markets and the MSCI EAFE (Morgan Stanley Capital International, Inc. Europe, Australasia, and Far East) Index returned 27.52%. Performance in the bond markets has been mixed over the year, although the Lehman Brothers U.S. Aggregate Bond Index gained 5.19%. Several key issues continued to resonate with investors, including slowing economic growth, Federal Reserve (the Fed) policy, a sluggish real estate market, inflation concerns, and fluctuating energy prices. Economic growth has been anything but predictable over the past year. The last quarter of 2005 saw Gross Domestic Product (GDP) slow considerably as the economy adjusted to changes in inventories and higher energy prices. Although Hurricane Katrina remained a focal point in the news late in 2005, its economic impact was determined to be minimal as damage remained contained within the hurricane’s path. In the first quarter of 2006, GDP then rebounded, only to slow later in the year. Though falling existing home sales and lower motor vehicle production have done much to curtail growth in the eyes of the Fed, favorable labor market conditions, sustained increases in labor income, and lower energy prices continued to promote stable growth. The unemployment rate fell to a cyclical low of 4.4% in the third quarter of 2006 while consumer spending and business investment remained key contributors to GDP growth. In efforts to curb inflationary pressures, the Fed raised short-term interest rates six times during the period. August marked a key point in the year as Committee members decided to hold the Fed’s target rate at 5.25%, where it remained as of the |
Asset Class Performance Comparison % returns during the report period |
| | | |
| This graph compares the performance of various asset classes during the report period. Final performance figures for the period are in the key below. | | |
| n 16.34% | | S&P 500® Index: measures U.S. large-cap stocks | |
| n 19.98% | | Russell 2000® Index: measures U.S. small-cap stocks | |
| o 27.52% | | MSCI EAFE® Index: measures (in U.S. dollars) large-cap stocks in Europe, Australasia and the Far East | |
| n 5.19% | | Lehman Brothers U.S. Aggregate Bond Index: measures the U.S. bond market | |
| n 4.57% | | Three-Month U.S. Treasury Bills (T-Bills): measures short-term U.S. Treasury obligations
| |
These figures assume dividends and distributions were reinvested. Index figures do not include trading and management costs, which would lower performance. Indices are unmanaged and you cannot invest in them directly. Remember that past performance is not an indication of future results.
Data source: Charles Schwab & Co., Inc.
4 Schwab MarketTrack Portfolios
The Investment Environment continued
Larry Mano, (right) vice president
and senior portfolio manager is
responsible for the day-to-day
co-management of the funds. Tom Brown, (left) associate portfolio
manager is responsible for the day-
to-day co-management of the fund. 
Matthew Hastings, CFA, vice presi
dent and senior portfolio manager,
has day-to-day co-management
responsibility for the bond and cash
portions of the funds. 
Andrew Tikofsky, PhD, director and
portfolio manager, has day-to-day
co-management responsibility for the
bond and cash portions of the funds.  Steven Hung, director and portfolio
manager, has day-to-day co-manage
ment responsibility for the bond and
cash portions of the funds.
| | end of the report period. In its statement, the Fed noted that the economy appeared to be growing at a more moderate rate as a result of prior rate increases, lagged effects of energy prices, and a cooling of the housing market. The Fed indicated they generally expected the economy to grow at a pace below its potential, which proved to be an accurate prediction. Consistent with the Fed’s report, GDP continued to decline, growing only 2.2% in the third quarter of 2006. Energy prices have been a key issue in the markets over the past year. Following Hurricane Katrina, oil prices peaked around $71 per barrel, with domestic gasoline prices passing $3.00 a gallon. Prices subsequently fell, but rebounded nearly 21% early in 2006, partly due to concerns that Iran might cut back exports in response to a dispute over their nuclear program. Prices declined throughout the report period due to a lack of hurricanes in the Gulf of Mexico, as well as an increase in U.S. fuel inventories. More recently, abundant inventories, warmer weather, and skepticism regarding OPEC’s proposed production cuts contributed to a slip in oil prices. Crude oil has declined nearly 26% since July 2006’s record $78.40 per barrel, yet still remained around the $60–61 per barrel range at the end of the report period, as diminishing U.S. crude inventories and concern about global surplus lingered in investors’ minds. The events of 2006 have also had a significant impact on the housing market. Housing starts fell considerably, down nearly 34% since the beginning of 2006. Existing home sales continued to decline as well, falling nearly 15% from their peak reached in 2005. Although sales have dropped, they remained strong by historical standards. Concerns remained as to whether the Fed’s actions, and the immediate effects on the housing market, would spill over into the rest of the economy. With regards to GDP, housing took off about one percent in the third quarter of 2006, although rebounds in income, consumer spending, and investments helped to offset the impact. Despite a moderation in economic growth during the report period, economic fundamentals remained healthy as of the end of the period. The Fed’s task of balancing inflation pressures without significantly hindering economic growth will be thoroughly scrutinized in the coming months. The challenge is to bring this economy to a state of stable growth and achieve a soft landing. |
Nothing in this report represents a recommendation of a security by the investment adviser.
Manager views and portfolio holdings may have changed since the report date.
Schwab MarketTrack Portfolios 5
Schwab MarketTrack All Equity Portfolio™
The Schwab MarketTrack Portfolios incorporate a mix of different asset classes. Accordingly, their returns over a given period will reflect a blend of returns of those asset classes, and will depend on their relative weightings within each portfolio. By spreading their exposure over various asset classes, the MarketTrack Portfolios are designed to provide more stable returns while seeking to reduce risk over various market cycles.
The Schwab MarketTrack All Equity Portfolio returned 19.31% for the one-year report period, closely tracking its benchmark, the All Equity Composite Index, which was up 19.85%. The portfolio invests in different segments of the stock market including large-cap, small-cap and international, so its performance reflects a blend of those segments’ returns. Unlike the other MarketTrack Portfolios, this fund does not have a defined allocation to fixed income. For the one-year period, the fund’s allocation to international and small-cap segments positively contributed to performance. Performance of those segments, as measured by the MSCI EAFE and Russell 2000 Index, which returned 27.52% and 19.98% respectively, outperformed that of large-cap domestic equities, as measured by the S&P 500 Index, which returned 16.34%.
As of 10/31/06:
Statistics |
| Number of Holdings | | | | 5 |
Weighted Average
Market Cap
($ x 1,000,000) | | | | 64,220 |
| Price/Earnings Ratio (P/E) | | | | 19.1 |
| Price/Book Ratio (P/B) | | | | 2.6 |
Asset Class Weightings % of Investments |
| Large-Cap Stocks | | | | | 44.6 | % |
| International Stocks | | | | | 30.1 | % |
| Small-Cap Stocks | | | | | 25.0 | % |
| Short-Term Investments | | | | | 0.3 | % |
Total | | | | | 100.0 | % |
Top Holdings % of Net Assets1 |
| Schwab Institutional Select S&P 500 Fund | | | | | 44.6 | % |
| Schwab International Index Fund, Select Shares | | | | | 30.1 | % |
| Schwab Small-Cap Index Fund, Select Shares | | | | | 25.0 | % |
Total | | | | | 99.7 | % |
Portfolio holdings may have changed since the report date.
1This list is not a recommendation of any security by the investment adviser.
6 Schwab MarketTrack Portfolios
Schwab MarketTrack All Equity Portfolio
Performance Summary as of 10/31/06
The performance data quoted represents past performance. Past performance does not guarantee future results.
Investment returns and principal value will fluctuate so that an investor’s shares may be worth more or less than their original cost. Current performance may be lower or higher than performance data quoted. To obtain performance information current to the most recent month end, please visit www.schwab.com/schwabfunds.
Performance of a Hypothetical
$10,000 Investment1 |
|
Average Annual Total Returns1,2 | | | |
| | | | | 1 year | | 5 years | | Since Inception | | | | |
| Portfolio: Schwab MarketTrack All Equity Portfolio™ (5/19/98) | | | | | 19.31 | % | | | 9.92 | % | | | 5.01 | % | | | | |
| Benchmark: All Equity Composite Index | | | | | 19.85 | % | | | 10.63 | % | | | 5.29 | % | | | | |
| Fund Category: Morningstar Large-Cap Blend | | | | | 14.74 | % | | | 6.82 | % | | | 3.98 | % | | | | |
Style Assessment3 |
| |
 |
All figures on this page assume dividends and distributions were reinvested. Index figures do not include trading and management costs, which would lower performance. Indices are unmanaged, and you cannot invest in them directly. Performance results less than one year are not annualized.
Small-company stocks are subject to greater volatility than other asset categories. Foreign securities can involve risks such as political and economic instability and currency risk.
1The All Equity Composite Index is composed of Morningstar category averages and is calculated using the following portion allocations: 45% large-cap stocks, 25% small-cap stocks and 30% foreign stocks. Source: Morningstar, Inc.
2Portfolio expenses may have been partially absorbed by CSIM and Schwab. Without these reductions, the portfolio’s returns would have been lower. These returns do not reflect the deduction of taxes that a shareholder would pay on portfolio distributions or the redemption of portfolio shares.
3Source: Morningstar, Inc. This style assessment is the result of evaluating the portfolio based on a ten-factor model for value and growth characteristics. The portfolio’s market capitalization placement is determined by the geometric mean of its holdings’ market capitalizations. The assessment reflects the portfolio’s holdings as of 10/31/06, which may have changed since then, and is not a precise indication of risk or performance — past, present, or future.
Schwab MarketTrack Portfolios 7
Schwab MarketTrack Growth Portfolio™
The Schwab MarketTrack Portfolios incorporate a mix of different asset classes. Accordingly, their returns over a given period will reflect a blend of returns of those asset classes, and will depend on their relative weightings within each portfolio. By spreading their exposure over various asset classes, the MarketTrack Portfolios are designed to provide more stable returns while seeking to reduce risk over various market cycles.
The Schwab MarketTrack Growth Portfolio Investor Shares was up 15.83%, compared to a gain of 16.37% by its benchmark, the Growth Composite Index, for the one year report period. The fund has an 80% target stock allocation that is divided among large-cap, small-cap, and international stocks. For the one-year report period, the target allocation to international stocks drove returns, as the international sector posted the strongest returns over the period. The fund is designed to allocate 20% to fixed income in order to reduce volatility and risk over the long term. Within the fixed income allocation of the fund, the Schwab Total Bond Market Fund contributed to returns. During the report period, bond yields rose in line with Fed rate hikes and the yield curve became inverted. Towards the end of the period, economic news suggested inflation was receding and growth was slowing, causing bond yields to decline. With the exception of short term rates, the net change in yields throughout the period remained relatively slight.
As of 10/31/06:
Statistics |
| Number of Holdings | | | | 508 |
Weighted Average
Market Cap
($ x 1,000,000) | | | | 58,215 |
| Price/Earnings Ratio (P/E) | | | | 19.5 |
| Price/Book Ratio (P/B) | | | | 2.6 |
Asset Class Weightings % of Investments |
| Large-Cap Stocks | | | | | 41.0 | % |
| International Stocks | | | | | 19.8 | % |
| Small-Cap Stocks | | | | | 19.7 | % |
| Bonds | | | | | 14.8 | % |
| Short Term Investments | | | | | 4.7 | % |
Total | | | | | 100.0 | % |
Top Holdings % of Net Assets1 |
| Schwab Institutional Select S&P 500 Fund | | | | | 23.8 | % |
| Schwab International Index Fund, Select Shares | | | | | 19.7 | % |
| Schwab Small-Cap Index Fund, Select Shares | | | | | 19.7 | % |
| Schwab Total Bond Market Fund | | | | | 14.8 | % |
| Schwab Value Advantage Money Fund, Institutional Shares | | | | | 4.5 | % |
| Exxon Mobil Corp. | | | | | 0.6 | % |
| General Electric Co. | | | | | 0.5 | % |
| Bank of America Corp. | | | | | 0.4 | % |
| Microsoft Corp. | | | | | 0.4 | % |
| Citigroup, Inc. | | | | | 0.4 | % |
Total | | | | | 84.8 | % |
Portfolio holdings may have changed since the report date.
1This list is not a recommendation of any security by the investment adviser.
8 Schwab MarketTrack Portfolios
Schwab MarketTrack Growth Portfolio
Performance Summary as of 10/31/06
The performance data quoted represents past performance. Past performance does not guarantee future results.
Investment returns and principal value will fluctuate so that an investor’s shares may be worth more or less than their original cost. Current performance may be lower or higher than performance data quoted. To obtain performance information current to the most recent month end, please visit www.schwab.com/schwabfunds.
Performance of a Hypothetical
$10,000 Investment in Investor Shares1 | | | | Performance of a Hypothetical
$100,000 Investment in P Shares1 |
| | | | |
| | | | | |
Average Annual Total Returns1,2 | | | | | | | | | | | |
Portfolio Class and Inception Date | | | | 1 year
| | 5 years
| | 10 years
| | Since Inception
|
| Investor Shares (11/20/95) | | | | | 15.83 | % | | | 8.55 | % | | | 7.88 | % | | n/a
|
| P Shares (4/6/06) | | | | n/a
| | n/a
| | n/a
| | 4.69%
|
| Benchmark: Growth Composite Index | | | | | 16.37 | % | | | 9.20 | % | | | 8.20 | % | | | (4/6/06 | ) 5.14% |
| Fund Category: Morningstar Large-Cap Blend | | | | | 14.74 | % | | | 6.82 | % | | | 7.76 | % | | | (4/6/06 | ) 4.10% |
Style Assessment3 |
| |
|
All figures on this page assume dividends and distributions were reinvested. Index figures do not include trading and management costs, which would lower performance. Indices are unmanaged, and you cannot invest in them directly. Performance results less than one year are not annualized.
Small-company stocks are subject to greater volatility than other asset categories. Foreign securities can involve risks such as political and economic instability and currency risk.
1The Growth Composite Index is composed of Morningstar category averages and cash equivalents as represented by the 90-day T-bill and is calculated using the following portfolio allocations: 40% large-cap stocks, 20% small-cap stocks, 20% foreign stocks, 15% bonds and 5% cash. Source: Morningstar, Inc.
2Portfolio expenses may have been partially absorbed by CSIM and Schwab. Without these reductions, the portfolio’s returns would have been lower. These returns do not reflect the deduction of taxes that a shareholder would pay on portfolio distributions or the redemption of portfolio shares.
3Source: Morningstar, Inc. This style assessment is the result of evaluating the portfolio based on a ten-factor model for value and growth characteristics. The portfolio’s market capitalization placement is determined by the geometric mean of its holdings’ market capitalizations. The assessment reflects the portfolio’s holdings as of 10/31/06, which may have changed since then, and is not a precise indication of risk or performance — past, present, or future.
Schwab MarketTrack Portfolios 9
Schwab MarketTrack Balanced Portfolio™
The Schwab MarketTrack Portfolios incorporate a mix of different asset classes. Accordingly, their returns over a given period will reflect a blend of returns of those asset classes, and will depend on their relative weightings within each portfolio. By spreading their exposure over various asset classes, the MarketTrack Portfolios are designed to provide more stable returns while seeking to reduce risk over various market cycles.
The Schwab MarketTrack Balanced Portfolio returned 12.92% for the one-year period compared to a 13.50% return for its benchmark, the Balanced Composite Index. The Balanced Portfolio’s allocation is weighted toward stock investments, with a 60% target allocation to equities. The fund also maintains a sizeable 40% allocation to fixed income investments, seeking to reduce volatility and add income. Although the equity market led in performance for the period, bonds also positively contributed to performance, as tracked by the Lehman Brothers U.S. Aggregate Bond Index, which returned 5.19% for the one-year period. Within the fixed income allocation of the fund, the Schwab Total Bond Market Fund contributed to returns. During the report period, bond yields rose in line with Fed rate hikes and the yield curve became inverted. Towards the end of the period, economic news suggested inflation was receding and growth was slowing, causing bond yields to decline. With the exception of short term rates, the net change in yields throughout the period remained relatively slight.
As of 10/31/06:
Statistics |
| Number of Holdings | | | | 507 |
Asset Class Weightings % of Investments |
| Bonds | | | | | 34.5 | % |
| Large-Cap Stocks | | | | | 31.3 | % |
| International Stocks | | | | | 14.9 | % |
| Small-Cap Stocks | | | | | 14.8 | % |
| Short-Term Investment | | | | | 4.5 | % |
Total | | | | | 100.0 | % |
Top Holdings % of Net Assets1 |
| Schwab Total Bond Market Fund | | | | | 34.4 | % |
| Schwab Institutional Select S&P 500 Fund | | | | | 15.8 | % |
| Schwab International Index Fund, Select Shares | | | | | 15.0 | % |
| Schwab Small-Cap Index Fund, Select Shares | | | | | 14.8 | % |
| Schwab Value Advantage Money Fund, Institutional Shares | | | | | 4.3 | % |
| Exxon Mobil Corp. | | | | | 0.5 | % |
| General Electric Co. | | | | | 0.5 | % |
| Citigroup, Inc. | | | | | 0.3 | % |
| Microsoft Corp. | | | | | 0.3 | % |
| Bank of America Corp. | | | | | 0.3 | % |
Total | | | | | 86.2 | % |
Portfolio holdings may have changed since the report date.
1This list is not a recommendation of any security by the investment adviser.
10 Schwab MarketTrack Portfolios
Schwab MarketTrack Balanced Portfolio
Performance Summary as of 10/31/06
The performance data quoted represents past performance. Past performance does not guarantee future results.
Investment returns and principal value will fluctuate so that an investor’s shares may be worth more or less than their original cost. Current performance may be lower or higher than performance data quoted. To obtain performance information current to the most recent month end, please visit www.schwab.com/schwabfunds.
Performance of a Hypothetical
$10,000 Investment1 |
|
Average Annual Total Returns1,2 | | | |
| | | | | | | | | 1 year
| | 5 years | | 10 years |
| Portfolio: Schwab MarketTrack Balanced Portfolio™ (11/20/95) | | | | | | | | | 12.92 | % | | | 7.47 | % | | | 7.41 | % |
| Benchmark: Balanced Composite Index | | | | | | | | | 13.50 | % | | | 8.11 | % | | | 7.84 | % |
| Fund Category: Morningstar Moderate Allocation | | | | | | | | | 11.91 | % | | | 6.62 | % | | | 7.21 | % |
All figures on this page assume dividends and distributions were reinvested. Index figures do not include trading and management costs, which would lower performance. Indices are unmanaged, and you cannot invest in them directly. Performance results less than one year are not annualized.
Small-company stocks are subject to greater volatility than other asset categories. Foreign securities can involve risks such as political and economic instability and currency risk.
1The Balanced Composite Index is composed of Morningstar category averages and cash equivalents as represented by the 90-day T-bill and is calculated using the following portfolio allocations: 30% large-cap stocks, 15% small-cap stocks, 15% foreign stocks, 35% bonds and 5% cash. Source: Morningstar, Inc.
2Portfolio expenses may have been partially absorbed by CSIM and Schwab. Without these reductions, the portfolio’s returns would have been lower. These returns do not reflect the deduction of taxes that a shareholder would pay on portfolio distributions or the redemption of portfolio shares.
Schwab MarketTrack Portfolios 11
Schwab MarketTrack Conservative Portfolio™
The Schwab MarketTrack Portfolios incorporate a mix of different asset classes. Accordingly, their returns over a given period will reflect a blend of returns of those asset classes, and will depend on their relative weightings within each portfolio. By spreading their exposure over various asset classes, the MarketTrack Portfolios are designed to provide more stable returns while seeking to reduce risk over various market cycles.
The Schwab MarketTrack Conservative Portfolio Investor shares returned 10.13% for the one-year period, compared to a 10.68% return for its benchmark, the Conservative Composite Index. This portfolio is designed to seek income with more growth potential than an all-bond portfolio. As such, the portfolio’s allocation is weighted toward bond investments, for which the target allocation is 55%. Seeking to obtain long-term growth, the portfolio has a substantial 40% target allocation to stocks. Although the equity market led in performance for the period, bonds also positively contributed to performance, as tracked by the Lehman Brothers U.S., Aggregate bond Index, which returned 5.19% for the one-year period. Within the fixed income allocation of the fund, the Schwab Total Bond Market Fund contributed to returns. During the report period, bond yields rose in line with Fed rate hikes and the yield curve became inverted. Towards the end of the period, economic news suggested inflation was receding and growth was slowing, causing bond yields to decline. With the exception of short term rates, the net change in yields throughout the period remained relatively slight.
As of 10/31/06:
Statistics |
| Number of Holdings | | | | 508 |
Asset Class Weightings % of Investments |
| Bonds | | | | | 54.7 | % |
| Large-Cap Stocks | | | | | 20.6 | % |
| International Stocks | | | | | 10.0 | % |
| Small-Cap Stocks | | | | | 10.0 | % |
| Short-Term Investments | | | | | 4.7 | % |
Total | | | | | 100.0 | % |
Top Holdings % of Net Assets1 |
| Schwab Total Bond Market Fund | | | | | 54.7 | % |
| Schwab S&P 500 Index Fund, Select Shares | | | | | 13.8 | % |
| Schwab International Index Fund, Select Shares | | | | | 10.0 | % |
| Schwab Small-Cap Index Fund, Select Shares | | | | | 10.0 | % |
| Schwab Value Advantage Money Fund, Institutional Shares | | | | | 4.3 | % |
| Schwab Institutional Select S&P 500 Fund | | | | | 0.6 | % |
| Exxon Mobil Corp. | | | | | 0.3 | % |
| General Electric Co. | | | | | 0.2 | % |
| Microsoft Corp. | | | | | 0.1 | % |
| Citigroup, Inc. | | | | | 0.1 | % |
Total | | | | | 94.1 | % |
Portfolio holdings may have changed since the report date.
1This list is not a recommendation of any security by the investment adviser.
12 Schwab MarketTrack Portfolios
Schwab MarketTrack Conservative Portfolio
Performance Summary as of 10/31/06
The performance data quoted represents past performance. Past performance does not guarantee future results.
Investment returns and principal value will fluctuate so that an investor’s shares may be worth more or less than their original cost. Current performance may be lower or higher than performance data quoted. To obtain performance information current to the most recent month end, please visit www.schwab.com/schwabfunds.
Performance of a Hypothetical
$10,000 Investment in Investor Shares1 | | | | Performance of a Hypothetical
$100,000 Investment in P Shares1 |
| | | | |
| | | | | |
Average Annual Total Returns1,2 | | | |
Portfolio Class and Inception Date | | | | 1 year
| | 5 years | | 10 years | | Since Inception |
| Investor Shares (11/20/95) | | | | | 10.13 | % | | | 6.34 | % | | | 6.83 | % | | n/a
|
| P Shares (4/6/06) | | | | n/a
| | n/a
| | n/a
| | 4.22%
|
| Benchmark: Conservative Composite Index | | | | | 10.68 | % | | | 6.95 | % | | | 7.38 | % | | | (4/6/06 | ) 4.66% |
| Fund Category: Morningstar Large-Cap Blend | | | | | 8.43 | % | | | 5.65 | % | | | 6.14 | % | | | (4/6/06 | ) 3.65% |
All figures on this page assume dividends and distributions were reinvested. Index figures do not include trading and management costs, which would lower performance. Indices are unmanaged, and you cannot invest in them directly. Performance results less than one year are not annualized.
Small-company stocks are subject to greater volatility than other asset categories. Foreign securities can involve risks such as political and economic instability and currency risk.
1The Conservative Composite Index is composed of Morningstar category averages and cash equivalents as represented by the 90-day T-bill and is calculated using the following portfolio allocations: 20% large-cap stocks, 10% small-cap stocks, 10% foreign stocks, 55% bonds and 5% cash. Source: Morningstar, Inc.
2Portfolio expenses may have been partially absorbed by CSIM and Schwab. Without these reductions, the portfolio’s returns would have been lower. These returns do not reflect the deduction of taxes that a shareholder would pay on portfolio distributions or the redemption of portfolio shares.
Schwab MarketTrack Portfolios 13
Fund Expenses (Unaudited)
Examples for a $1,000 Investment |
As a fund shareholder, you incur two types of costs: transaction costs, such as redemption fees; and, ongoing costs, such as management fees, transfer agent and shareholder services fees, and other fund expenses.
The expense examples below are intended to help you understand your ongoing cost (in dollars) of investing in a fund and to compare this cost with the ongoing cost of investing in other mutual funds. These examples are based on an investment of $1,000 invested for six-months beginning May 1, 2006 and held through October 31, 2006.
Actual Return lines in the table below provide information about actual account values and actual expenses. You may use this information, together with the amount you invested, to estimate the expenses that you paid over the period. To do so, simply divide your account value by $1,000 (for example, an $8,600 account value ÷ $1,000 = 8.6), then multiply the result by the number given for your fund or share class under the heading entitled “Expenses Paid During Period.”
Hypothetical Return lines in the table below provide information about hypothetical account values and hypothetical expenses based on a fund’s or share class’ actual expense ratio and an assumed return of 5% per year before expenses. Because the return used is not an actual return, it may not be used to estimate the actual ending account value or expenses you paid for the period.
You may use this information to compare the ongoing costs of investing in the fund and other funds. To do so, compare this 5% hypothetical example with the 5% hypothetical examples that appear in the shareholder reports of the other funds.
Please note that the expenses shown in the table are meant to highlight your ongoing costs only, and do not reflect any transactional costs, such as redemption fees. If these transactional costs were included, your costs would have been higher.
|
|
|
| Expense Ratio1
(Annualized)
|
| Beginning
Account Value
at 5/1/06
|
| Ending
Account Value
(Net of Expenses)
at 10/31/06
|
| Expenses Paid
During Period2
5/1/06–10/31/06
|
|---|
Schwab MarketTrack All Equity Portfolio™ | | | | | | | | | | | | | | | | | | |
| Actual Return | | | | | 0.50 | % | | $ | 1,000 | | | $ | 1,040.50 | | | $ | 2.57 | |
| Hypothetical 5% Return | | | | | 0.50 | % | | $ | 1,000 | | | $ | 1,022.68 | | | $ | 2.55 | |
Schwab MarketTrack Growth Portfolio™ | | | | | | | | | | | | | | | | | | |
Investor Shares | | | | | | | | | | | | | | | | | | |
| Actual Return | | | | | 0.50 | % | | $ | 1,000 | | | $ | 1,041.30 | | | $ | 2.57 | |
| Hypothetical 5% Return | | | | | 0.50 | % | | $ | 1,000 | | | $ | 1,022.68 | | | $ | 2.55 | |
P Shares | | | | | | | | | | | | | | | | | | |
| Actual Return | | | | | 0.35 | % | | $ | 1,000 | | | $ | 1,041.80 | | | $ | 1.80 | |
| Hypothetical 5% Return | | | | | 0.35 | % | | $ | 1,000 | | | $ | 1,023.44 | | | $ | 1.79 | |
Schwab MarketTrack Balanced Portfolio™ | | | | | | | | | | | | | | | | | | |
| Actual Return | | | | | 0.50 | % | | $ | 1,000 | | | $ | 1,040.90 | | | $ | 2.57 | |
| Hypothetical 5% Return | | | | | 0.50 | % | | $ | 1,000 | | | $ | 1,022.68 | | | $ | 2.55 | |
Schwab MarketTrack Conservative Portfolio™ | | | | | | | | | | | | | | | | | | |
Investor Shares | | | | | | | | | | | | | | | | | | |
| Actual Return | | | | | 0.50 | % | | $ | 1,000 | | | $ | 1,041.30 | | | $ | 2.57 | |
| Hypothetical 5% Return | | | | | 0.50 | % | | $ | 1,000 | | | $ | 1,022.68 | | | $ | 2.55 | |
P Shares | | | | | | | | | | | | | | | | | | |
| Actual Return | | | | | 0.35 | % | | $ | 1,000 | | | $ | 1,041.40 | | | $ | 1.80 | |
| Hypothetical 5% Return | | | | | 0.35 | % | | $ | 1,000 | | | $ | 1,023.44 | | | $ | 1.79 | |
1 | | Based on the most recent six-month expense ratio; may differ from the expense ratio provided in Financial Highlights; does not include expenses of underlying funds in which the portfolios invest. |
2 | | Expenses for each fund or share class are equal to its annualized expense ratio, multiplied by the average account value over the period, multiplied by 184 days of the period, and divided by 365 days of the fiscal year. |
14 Schwab MarketTrack Portfolios
Schwab MarketTrack All Equity Portfolio™
Financial Statements
Financial Highlights
| | | | 11/1/05—
10/31/06
| | 11/1/04—
10/31/05
| | 11/1/03—
10/31/04
| | 11/1/02—
10/31/03
| | 11/1/01—
10/31/02
|
|---|
Per-Share Data ($) |
| Net asset value at beginning of period | | | | | 11.55 | | | | 10.44 | | | | 9.43 | | | | 7.60 | | | | 9.06 | |
Income or loss from investment operations:
| | | | | | | | | | | | | | | | | | | | | | |
| Net investment income | | | | | 0.11 | | | | 0.12 | | | | 0.08 | | | | 0.09 | | | | 0.05 | |
| Net realized and unrealized gains or losses | | | | | 2.10 | | | | 1.11 | | | | 1.02 | | | | 1.85 | | | | (1.32 | ) |
| Total income or loss from investment operations | | | | | 2.21 | | | | 1.23 | | | | 1.10 | | | | 1.94 | | | | (1.27 | ) |
Less distributions:
| | | | | | | | | | | | | | | | | | | | | | |
| Dividends from net investment income | | | | | (0.13 | ) | | | (0.12 | ) | | | (0.09 | ) | | | (0.09 | ) | | | (0.05 | ) |
| Distributions from net realized gains | | | | | — | | | | — | | | | — | | | | (0.02 | ) | | | (0.14 | ) |
| Total distributions | | | | | (0.13 | ) | | | (0.12 | ) | | | (0.09 | ) | | | (0.11 | ) | | | (0.19 | ) |
| Net asset value at end of period | | | | | 13.63 | | | | 11.55 | | | | 10.44 | | | | 9.43 | | | | 7.60 | |
| Total return (%) | | | | | 19.31 | | | | 11.81 | | | | 11.75 | | | | 25.77 | | | | (14.40 | ) |
| |
Ratios/Supplemental Data (%) |
Ratios to average net assets:
| | | | | | | | | | | | | | | | | | | | | | |
Net operating expenses1 | | | | | 0.50 | | | | 0.50 | | | | 0.50 | | | | 0.50 | | | | 0.50 | |
Gross operating expenses1 | | | | | 0.74 | | | | 0.75 | | | | 0.76 | | | | 0.76 | | | | 0.77 | |
| Net investment income | | | | | 0.89 | | | | 1.07 | | | | 0.83 | | | | 1.10 | | | | 0.58 | |
| Portfolio turnover rate | | | | | 8 | | | | 49 | | | | 7 | | | | 10 | | | | 15 | |
| Net assets, end of period ($ x 1,000,000) | | | | | 527 | | | | 463 | | | | 450 | | | | 427 | | | | 353 | |
1 | | The expenses incurred by underlying funds in which the portfolio invests are not included in this ratio.
The income received by the portfolio from underlying funds is reduced by those expenses. |
See financial notes. 15
Schwab MarketTrack All Equity Portfolio
Portfolio Holdings as of October 31, 2006
This section shows all the securities in the fund’s portfolio and their value as of the report date.
The fund files its complete schedule of portfolio holdings with the SEC for the first and third quarters of each fiscal year on Form N-Q. The fund’s Form N-Q is available on the SEC’s website at http://www.sec.gov and may be viewed and copied at the SEC’s Public Reference Room in Washington, D.C. Call 1-800-SEC-0330 for information on the operation of the Public Reference Room. The schedule of portfolio holdings filed on a fund’s most recent Form N-Q is also available by visiting Schwab’s website at www.schwab.com/schwabfunds.
Holdings by Category
|
| Cost
($ x 1,000)
|
| Value
($ x 1,000)
|
|---|
99.6% | | | | Other Investment Companies | | | 408,213 | | | | 524,998 | |
0.4% | | | | Short-Term Investment | | | 1,712 | | | | 1,712 | |
—% | | | | U.S. Treasury Obligation | | | 199 | | | | 199 | |
100.0% | | | | Total Investments | | | 410,124 | | | | 526,909 | |
0.0% | | | | Other Assets and Liabilities, Net | | | | | | | (42 | ) |
100.0% | | | | Total Net Assets | | | | | | | 526,867 | |
Security
| | | | Number
of Shares | | Value
($ x 1,000) |
|---|
Other Investment Companies 99.6% of net assets |
Schwab Institutional Select S&P 500 Fund (a)(b) | | | | | 21,360,977 | | | | 234,757 | |
Schwab International Index Fund, Select Shares (a) | | | | | 7,492,879 | | | | 158,399 | |
Schwab Small-Cap Index Fund, Select Shares (a) | | | | | 5,076,701 | | | | 131,842 | |
| | | | | | | | | | 524,998 | |
Security
Rate, Maturity Date
| | | | Face Amount
($ x 1,000) | |
|
|---|
Short-Term Investment 0.4% of net assets |
Wells Fargo, Grand Cayman Time Deposit
4.71%, 11/01/06 | | | | | 1,712 | | | | 1,712 | |
| | | | | | | | | | | |
U.S. Treasury Obligation 0.0% of net assets |
U.S. Treasury Bill
4.90%, 12/14/06 | | | | | 200 | | | | 199 | |
At 10/31/06 the tax basis cost of the fund’s investments was $423,318 and the unrealized appreciation and depreciation were $103,591 and ($0), respectively, with net unrealized appreciation of $103,591.
In addition to the above, the fund held the following at 10/31/2006. All numbers are x 1,000 except number of futures contracts.
| | | | Number of
Contracts
| | Contract
Value
| | Unrealized
Gains
|
|---|
Futures Contract
|
|---|
| S&P 500 Index, e-mini, Long,
expires 12/15/06 | | | | | 35 | | | | 2,421 | | | | 94 | |
(a) | | Issuer is affiliated with the fund’s adviser. |
(b) | | All or a portion of this security is held as collateral for open futures contracts. |
16 See financial notes.
Schwab MarketTrack All Equity Portfolio
Statement of
Assets and Liabilities
As of October 31, 2006. All numbers x 1,000 except NAV.
Assets |
| Investments in affiliated underlying funds, at value (cost $408,213) | | | | $ | 524,998 | |
| Investments in unaffiliated issuers, at value (cost $1,911) | | | | + | 1,911 | |
| Total investments, at value (cost $410,124) | | | | | 526,909 | |
Receivables:
| | | | | | |
| Fund shares sold | | | | | 481 | |
| Prepaid expenses | | | | + | 3 | |
Total assets | | | | | 527,393 | |
| |
Liabilities |
Payables:
| | | | | | |
| Investment adviser and administrator fees | | | | | 9 | |
| Transfer agent and shareholder service fees | | | | | 11 | |
| Fund shares redeemed | | | | | 395 | |
| Accrued expenses | | | | + | 111 | |
Total liabilities | | | | | 526 | |
| |
Net Assets |
Total assets | | | | | 527,393 | |
Total liabilities | | | | | –526 | |
Net assets | | | | $ | 526,867 | |
| |
Net Assets by Source | | | | | | |
| Capital received from investors | | | | | 438,051 | |
| Distributions in excess of net investment income | | | | | (2,742 | ) |
| Net realized capital losses | | | | | (25,321 | ) |
| Net unrealized capital gains | | | | | 116,879 | |
| |
Net Asset Value (NAV) | | | | | | |
Net Assets
| | | | ÷ | | Shares
Outstanding | | = | | NAV |
|---|
| $526,867 | | | | | | | | 38,659
| | | | | | $ | 13.63 | |
See financial notes. 17
Schwab MarketTrack All Equity Portfolio
Statement of
Operations
For November 1, 2005 through October 31, 2006. All numbers x 1,000.
Investment Income |
| Dividends received from affiliated underlying funds | | | | $ | 6,841 | |
| Interest | | | | + | 83 | |
Total Investment Income | | | | | 6,924 | |
| |
Net Realized Gains and Losses |
| Net realized gains on sales of affiliated underlying funds | | | | | 11,963 | |
| Net realized gains received from affiliated underlying funds | | | | | 749 | |
| Net realized gains on futures contracts | | | | + | 114 | |
Net realized gains | | | | | 12,826 | |
| |
Net Unrealized Gains and Losses |
| Net unrealized gains on affiliated underlying funds | | | | | 69,477 | |
| Net unrealized gains on futures contracts | | | | + | 94 | |
Net unrealized gains | | | | | 69,571 | |
| |
Expenses |
| Investment adviser and administrator fees | | | | | 2,180 | |
| Transfer agent and shareholder service fees | | | | | 1,240 | |
| Shareholder reports | | | | | 116 | |
| Registration fees | | | | | 39 | |
| Professional fees | | | | | 33 | |
| Portfolio accounting fees | | | | | 25 | |
| Custodian fees | | | | | 23 | |
| Trustees’ fees | | | | | 9 | |
| Overdraft expense | | | | | 5 | |
| Other expense | | | | + | 12 | |
| Total expenses | | | | | 3,682 | |
| Expense reduction by adviser and Schwab | | | | | –1,196 | |
Net expenses | | | | | 2,486 | |
| |
Increase in Net Assets from Operations |
Total investment income | | | | | 6,924 | |
Net expenses | | | | | –2,486 | |
Net investment income | | | | | 4,438 | |
Net realized gains | | | | | 12,826 | |
Net unrealized gains | | | | + | 69,571 | |
Increase in net assets from operations | | | | $ | 86,835 | |
18 See financial notes.
Schwab MarketTrack All Equity Portfolio
Statement of
Changes in Net Assets
For the current and prior report periods. All numbers x 1,000.
| | | | 11/1/05—10/31/06
| | 11/1/04—10/31/05
|
|---|
| Net investment income | | | | $ | 4,438 | | | $ | 5,041 | |
| Net realized gains or losses | | | | | 12,826 | | | | (104 | ) |
| Net unrealized gains | | | | + | 69,571 | | | | 47,628 | |
Increase in net assets from operations | | | | | 86,835 | | | | 52,565 | |
| |
Distributions Paid | | | | | | | | | | |
| Dividends from net investment income | | | | $ | 5,267 | | | $ | 5,060 | |
Transactions in Fund Shares | | | | | | | | | | | | | | | | | | |
| | | | 11/1/05—10/31/06
| | 11/1/04—10/31/05
| |
|---|
| | | | SHARES
| | VALUE
| | SHARES
| | VALUE
|
|---|
| Shares sold | | | | | 5,531 | | | $ | 70,097 | | | | 5,741 | | | $ | 64,017 | |
| Shares reinvested | | | | | 416 | | | | 5,033 | | | | 437 | | | | 4,835 | |
| Shares redeemed | | | | + | (7,352 | ) | | | (92,711 | ) | | | (9,253 | ) | | | (103,675 | ) |
Net transactions in fund shares | | | | | (1,405 | ) | | $ | (17,581 | ) | | | (3,075 | ) | | $ | (34,823 | ) |
Shares Outstanding and Net Assets | | | | | | | | | | | | | | | | | | |
| | | | 11/1/05—10/31/06
| | 11/1/04—10/31/05
| |
|---|
| | | | SHARES
| | NET ASSETS
| | SHARES
| | NET ASSETS
|
|---|
| Beginning of period | | | | | 40,064 | | | $ | 462,880 | | | | 43,139 | | | $ | 450,198 | |
| Total increase or decrease | | | | + | (1,405 | ) | | | 63,987 | | | | (3,075 | ) | | | 12,682 | |
End of period | | | | | 38,659 | | | $ | 526,867 | | | | 40,064 | | | $ | 462,880 | |
Distribution in excess of net investment income | | | | | | | | $ | (2,742 | ) | | | | | | $ | (1,913 | ) |
See financial notes. 19
Schwab MarketTrack Growth Portfolio™
Financial Statements
Financial Highlights
Investor Shares
| | | | 11/1/05—
10/31/06 | | 11/1/04—
10/31/05 | | 11/1/03—
10/31/04 | | 11/1/02—
10/31/03 | | 11/1/01—
10/31/02 |
|---|
Per-Share Data ($) |
| Net asset value at beginning of period | | | | | 16.81 | | | | 15.57 | | | | 14.36 | | | | 12.05 | | | | 13.88 | |
Income or loss from investment operations:
| | | | | | | | | | | | | | | | | | | | | | |
| Net investment income | | | | | 0.30 | | | | 0.27 | | | | 0.21 | | | | 0.18 | | | | 0.19 | |
| Net realized and unrealized gains or losses | | | | | 2.33 | | | | 1.20 | | | | 1.21 | | | | 2.33 | | | | (1.62 | ) |
| Total income or loss from investment operations | | | | | 2.63 | | | | 1.47 | | | | 1.42 | | | | 2.51 | | | | (1.43 | ) |
Less distributions:
| | | | | | | | | | | | | | | | | | | | | | |
| Dividends from net investment income | | | | | (0.28 | ) | | | (0.23 | ) | | | (0.21 | ) | | | (0.20 | ) | | | (0.24 | ) |
| Distributions from net realized gains | | | | | — | | | | — | | | | — | | | | — | | | | (0.16 | ) |
| Total distributions | | | | | (0.28 | ) | | | (0.23 | ) | | | (0.21 | ) | | | (0.20 | ) | | | (0.40 | ) |
| Net asset value at end of period | | | | | 19.16 | | | | 16.81 | | | | 15.57 | | | | 14.36 | | | | 12.05 | |
| Total return (%) | | | | | 15.83 | | | | 9.48 | | | | 9.94 | | | | 21.18 | | | | (10.78 | ) |
| |
Ratios/Supplemental Data (%) |
Ratios to average net assets:
| | | | | | | | | | | | | | | | | | | | | | |
Net operating expenses1 | | | | | 0.50 | | | | 0.50 | | | | 0.50 | | | | 0.50 | | | | 0.50 | |
Gross operating expenses1 | | | | | 0.71 | | | | 0.72 | | | | 0.73 | | | | 0.74 | | | | 0.75 | |
| Net investment income | | | | | 1.74 | | | | 1.58 | | | | 1.35 | | | | 1.48 | | | | 1.35 | |
| Portfolio turnover rate | | | | | 7 | | | | 33 | | | | 9 | | | | 9 | | | | 21 | |
| Net assets, end of period ($ x 1,000,000) | | | | | 602 | | | | 657 | | | | 614 | | | | 578 | | | | 510 | |
| | | | | | | | | | | | | |
|---|
P Shares
| | | | 4/6/062—
10/31/06
| |
| |
| |
| |
|
|---|
Per-Share Data ($) |
| Net asset value at beginning of period | | | | | 18.32 | | | | | | | | | | | | | | | | | |
Income from investment operations:
| | | | | | | | | | | | | | | | | | | | | | |
| Net investment income | | | | | 0.10 | | | | | | | | | | | | | | | | | |
| Net realized and unrealized gains | | | | | 0.76 | | | | | | | | | | | | | | | | | |
| Total income from investment operations | | | | | 0.86 | | | | | | | | | | | | | | | | | |
| Net asset value at end of period | | | | | 19.18 | | | | | | | | | | | | | | | | | |
| Total return (%) | | | | | 4.69 | 3 | | | | | | | | | | | | | | | | |
| |
Ratios/Supplemental Data (%) |
Ratios to average net assets:
| | | | | | | | | | | | | | | | | | | | | | |
Net operating expenses1 | | | | | 0.35 | 4 | | | | | | | | | | | | | | | | |
Gross operating expenses1 | | | | | 0.56 | 4 | | | | | | | | | | | | | | | | |
| Net investment income | | | | | 0.95 | 4 | | | | | | | | | | | | | | | | |
| Portfolio turnover rate | | | | | 7 | 3 | | | | | | | | | | | | | | | | |
| Net assets, end of period ($ x 1,000,000) | | | | | 119 | | | | | | | | | | | | | | | | | |
1 | | The expenses incurred by underlying funds in which the portfolio invests are not included in this ratio.
The income received by the portfolio from underlying funds is reduced by those expenses. |
2 | | Commencement of operations. |
20 See financial notes.
Schwab MarketTrack Growth Portfolio
Portfolio Holdings as of October 31, 2006
This section shows all the securities in the fund’s portfolio and their value as of the report date.
The fund files its complete schedule of portfolio holdings with the SEC for the first and third quarters of each fiscal year on Form N-Q. The fund’s Form N-Q is available on the SEC’s website at http://www.sec.gov and may be viewed and copied at the SEC’s Public Reference Room in Washington, D.C. Call 1-800-SEC-0330 for information on the operation of the Public Reference Room. The schedule of portfolio holdings filed on a fund’s most recent Form N-Q is also available by visiting Schwab’s website at www.schwab.com/schwabfunds.
Holdings by Category
|
| Cost
($ x 1,000)
|
| Value
($ x 1,000)
|
|
|---|
17.2% | | | | Common Stock | | | 70,477 | | | | 123,699 | |
82.5% | | | | Other Investment Companies | | | 455,095 | | | | 594,832 | |
0.2% | | | | Short-Term Investment | | | 1,500 | | | | 1,500 | |
99.9% | | | | Total Investments | | | 527,072 | | | | 720,031 | |
0.1% | | | | Other Assets and Liabilities, Net | | | | | | | 570 | |
100.0% | | | | Total Net Assets | | | | | | | 720,601 | |
Security
| | | | Number
of Shares | | Value
($ x 1,000) |
|---|
Common Stock 17.2% of net assets |
Automobiles & Components 0.1% |
| Ford Motor Co. | | | | | 18,103 | | | | 150 | |
| General Motors Corp. | | | | | 5,425 | | | | 189 | |
| Harley-Davidson, Inc. | | | | | 3,000 | | | | 206 | |
| Johnson Controls, Inc. | | | | | 1,800 | | | | 147 | |
| The Goodyear Tire & Rubber Co. * | | | | | 1,600 | | | | 25 | |
| | | | | | | | | | 717 | |
Banks 1.0% |
| AmSouth Bancorp | | | | | 3,300 | | | | 100 | |
| BB&T Corp. | | | | | 5,300 | | | | 231 | |
| Comerica, Inc. | | | | | 1,700 | | | | 99 | |
| Commerce Bancorp, Inc. | | | | | 1,800 | | | | 63 | |
| Compass Bancshares, Inc. | | | | | 1,200 | | | | 67 | |
| Countrywide Financial Corp. | | | | | 5,298 | | | | 202 | |
| Fannie Mae | | | | | 9,400 | | | | 557 | |
| Fifth Third Bancorp | | | | | 5,369 | | | | 214 | |
| First Horizon National Corp. | | | | | 1,200 | | | | 47 | |
| Freddie Mac | | | | | 6,600 | | | | 455 | |
| Huntington Bancshares, Inc. | | | | | 2,262 | | | | 55 | |
| KeyCorp | | | | | 4,400 | | | | 163 | |
| M&T Bank Corp. | | | | | 998 | | | | 122 | |
| Marshall & Ilsley Corp. | | | | | 2,056 | | | | 99 | |
| MGIC Investment Corp. | | | | | 900 | | | | 53 | |
| National City Corp. | | | | | 6,100 | | | | 227 | |
| North Fork Bancorp, Inc. | | | | | 4,500 | | | | 129 | |
| PNC Financial Services Group, Inc. | | | | | 2,800 | | | | 196 | |
| Regions Financial Corp. | | | | | 4,542 | | | | 172 | |
| Sovereign Bancorp, Inc. | | | | | 3,885 | | | | 93 | |
| SunTrust Banks, Inc. | | | | | 3,500 | | | | 276 | |
| Synovus Financial Corp. | | | | | 2,750 | | | | 81 | |
| U.S. Bancorp | | | | | 17,972 | | | | 608 | |
| Wachovia Corp. | | | | | 18,552 | | | | 1,030 | |
| Washington Mutual, Inc. | | | | | 9,843 | | | | 416 | |
| Wells Fargo & Co. | | | | | 33,230 | | | | 1,206 | |
| Zions Bancorp | | | | | 900 | | | | 72 | |
| | | | | | | | | | 7,033 | |
Capital Goods 1.5% |
| 3M Co. | | | | | 7,600 | | | | 599 | |
| American Power Conversion Corp. | | | | | 1,725 | | | | 52 | |
| American Standard Cos., Inc. | | | | | 2,100 | | | | 93 | |
| Caterpillar, Inc. | | | | | 6,600 | | | | 401 | |
| Cooper Industries Ltd., Class A | | | | | 900 | | | | 81 | |
| Cummins, Inc. | | | | | 400 | | | | 51 | |
| Danaher Corp. | | | | | 2,800 | | | | 201 | |
| Deere & Co. | | | | | 2,300 | | | | 196 | |
| Dover Corp. | | | | | 2,000 | | | | 95 | |
| Eaton Corp. | | | | | 1,400 | | | | 101 | |
| Emerson Electric Co. | | | | | 4,000 | | | | 338 | |
| Fluor Corp. | | | | | 800 | | | | 63 | |
| General Dynamics Corp. | | | | | 4,000 | | | | 284 | |
| General Electric Co. | | | | | 105,200 | | | | 3,694 | |
| Goodrich Corp. | | | | | 1,100 | | | | 49 | |
| Honeywell International, Inc. | | | | | 8,437 | | | | 355 | |
| Illinois Tool Works, Inc. | | | | | 4,200 | | | | 201 | |
| Ingersoll-Rand Co., Ltd., Class A | | | | | 3,300 | | | | 121 | |
| ITT Corp. | | | | | 1,800 | | | | 98 | |
| L-3 Communications Holdings, Inc. | | | | | 1,100 | | | | 89 | |
| Lockheed Martin Corp. | | | | | 3,900 | | | | 339 | |
| Masco Corp. | | | | | 4,500 | | | | 124 | |
| Navistar International Corp. * | | | | | 700 | | | | 19 | |
| Northrop Grumman Corp. | | | | | 3,592 | | | | 238 | |
| PACCAR, Inc. | | | | | 2,362 | | | | 140 | |
| Pall Corp. | | | | | 1,000 | | | | 32 | |
| Parker Hannifin Corp. | | | | | 1,150 | | | | 96 | |
| Raytheon Co. | | | | | 4,500 | | | | 225 | |
| Rockwell Automation, Inc. | | | | | 1,900 | | | | 118 | |
| Rockwell Collins, Inc. | | | | | 1,900 | | | | 110 | |
| Textron, Inc. | | | | | 1,500 | | | | 136 | |
| The Boeing Co. | | | | | 8,078 | | | | 645 | |
| Tyco International Ltd. | | | | | 19,803 | | | | 583 | |
| United Technologies Corp. | | | | | 10,000 | | | | 657 | |
| W.W. Grainger, Inc. | | | | | 900 | | | | 66 | |
| | | | | | | | | | 10,690 | |
Commercial Services & Supplies 0.1% |
| Allied Waste Industries, Inc. * | | | | | 3,100 | | | | 38 | |
| Avery Dennison Corp. | | | | | 1,200 | | | | 76 | |
| Cintas Corp. | | | | | 1,638 | | | | 68 | |
| Equifax, Inc. | | | | | 1,200 | | | | 45 | |
| Monster Worldwide, Inc. * | | | | | 954 | | | | 39 | |
| Pitney Bowes, Inc. | | | | | 2,300 | | | | 107 | |
| R.R. Donnelley & Sons Co. | | | | | 2,100 | | | | 71 | |
| Robert Half International, Inc. | | | | | 1,700 | | | | 62 | |
| Waste Management, Inc. | | | | | 5,517 | | | | 207 | |
| | | | | | | | | | 713 | |
Consumer Durables & Apparel 0.2% |
| Brunswick Corp. | | | | | 900 | | | | 28 | |
| Centex Corp. | | | | | 1,200 | | | | 63 | |
See financial notes. 21
Schwab MarketTrack Growth Portfolio
Portfolio Holdings continued
Security
| | | | Number
of Shares | | Value
($ x 1,000) |
|---|
| Coach, Inc. * | | | | | 3,600 | | | | 143 | |
| D.R. Horton, Inc. | | | | | 2,660 | | | | 62 | |
| Eastman Kodak Co. | | | | | 3,100 | | | | 76 | |
| Fortune Brands, Inc. | | | | | 1,400 | | | | 108 | |
| Harman International Industries, Inc. | | | | | 700 | | | | 72 | |
| Hasbro, Inc. | | | | | 1,650 | | | | 43 | |
| Jones Apparel Group, Inc. | | | | | 1,200 | | | | 40 | |
| KB Home | | | | | 800 | | | | 36 | |
| Leggett & Platt, Inc. | | | | | 2,000 | | | | 47 | |
| Lennar Corp., Class A | | | | | 1,300 | | | | 62 | |
| Liz Claiborne, Inc. | | | | | 1,200 | | | | 51 | |
| Mattel, Inc. | | | | | 4,150 | | | | 94 | |
| Newell Rubbermaid, Inc. | | | | | 2,745 | | | | 79 | |
| Nike, Inc., Class B | | | | | 2,300 | | | | 211 | |
| Pulte Homes, Inc. | | | | | 2,400 | | | | 74 | |
| Snap-On, Inc. | | | | | 600 | | | | 28 | |
| The Black & Decker Corp. | | | | | 900 | | | | 75 | |
| The Stanley Works | | | | | 600 | | | | 28 | |
| VF Corp. | | | | | 1,200 | | | | 91 | |
| Whirlpool Corp. | | | | | 907 | | | | 79 | |
| | | | | | | | | | 1,590 | |
Consumer Services 0.3% |
| Apollo Group, Inc., Class A * | | | | | 1,700 | | | | 63 | |
| Carnival Corp. | | | | | 4,300 | | | | 210 | |
| Darden Restaurants, Inc. | | | | | 1,800 | | | | 75 | |
| H&R Block, Inc. | | | | | 3,400 | | | | 74 | |
| Harrah’s Entertainment, Inc. | | | | | 1,780 | | | | 132 | |
| Hilton Hotels Corp. | | | | | 3,600 | | | | 104 | |
| International Game Technology | | | | | 3,400 | | | | 145 | |
| Marriott International, Inc., Class A | | | | | 3,900 | | | | 163 | |
| McDonald’s Corp. | | | | | 12,400 | | | | 520 | |
| Starbucks Corp. * | | | | | 7,920 | | | | 299 | |
| Starwood Hotels & Resorts Worldwide, Inc. | | | | | 1,900 | | | | 113 | |
| Wendy’s International, Inc. | | | | | 1,000 | | | | 35 | |
| Western Union Co. * | | | | | 7,888 | | | | 174 | |
| Wyndham Worldwide Corp. * | | | | | 1,986 | | | | 59 | |
| YUM! Brands, Inc. | | | | | 3,120 | | | | 185 | |
| | | | | | | | | | 2,351 | |
Diversified Financials 1.8% |
| American Express Co. | | | | | 12,300 | | | | 711 | |
| Ameriprise Financial, Inc. | | | | | 2,300 | | | | 118 | |
| Bank of America Corp. | | | | | 46,110 | | | | 2,484 | |
| Capital One Financial Corp. | | | | | 2,900 | | | | 230 | |
| Chicago Mercantile Exchange Holdings, Inc. | | | | | 340 | | | | 170 | |
| CIT Group, Inc. | | | | | 2,000 | | | | 104 | |
| Citigroup, Inc. | | | | | 49,392 | | | | 2,478 | |
| E*TRADE Financial Corp. * | | | | | 3,500 | | | | 81 | |
| Federated Investors, Inc., Class B | | | | | 1,100 | | | | 38 | |
| Franklin Resources, Inc. | | | | | 1,500 | | | | 171 | |
| Janus Capital Group, Inc. | | | | | 2,200 | | | | 44 | |
| JPMorgan Chase & Co. | | | | | 34,915 | | | | 1,656 | |
| Legg Mason, Inc. | | | | | 1,200 | | | | 108 | |
| Lehman Brothers Holdings, Inc. | | | | | 5,200 | | | | 405 | |
| Mellon Financial Corp. | | | | | 4,100 | | | | 159 | |
| Merrill Lynch & Co., Inc. | | | | | 9,400 | | | | 822 | |
| Moody’s Corp. | | | | | 3,000 | | | | 199 | |
| Morgan Stanley | | | | | 10,900 | | | | 833 | |
| Northern Trust Corp. | | | | | 2,200 | | | | 129 | |
| SLM Corp. | | | | | 4,110 | | | | 200 | |
| State Street Corp. | | | | | 3,300 | | | | 212 | |
| T. Rowe Price Group, Inc. | | | | | 2,400 | | | | 114 | |
| The Bank of New York Co., Inc. | | | | | 7,300 | | | | 251 | |
| The Bear Stearns Cos., Inc. | | | | | 1,082 | | | | 164 | |
| The Charles Schwab Corp. | | | | | 11,242 | | | | 205 | |
| The Goldman Sachs Group, Inc. | | | | | 4,379 | | | | 831 | |
| | | | | | | | | | 12,917 | |
Energy 1.6% |
| Anadarko Petroleum Corp. | | | | | 4,836 | | | | 225 | |
| Apache Corp. | | | | | 3,308 | | | | 216 | |
| Baker Hughes, Inc. | | | | | 3,360 | | | | 232 | |
| BJ Services Co. | | | | | 3,000 | | | | 91 | |
| Chesapeake Energy Corp. | | | | | 3,600 | | | | 117 | |
| ChevronTexaco Corp. | | | | | 22,235 | | | | 1,494 | |
| ConocoPhillips | | | | | 16,440 | | | | 990 | |
| CONSOL Energy, Inc. | | | | | 1,800 | | | | 64 | |
| Devon Energy Corp. | | | | | 4,600 | | | | 307 | |
| El Paso Corp. | | | | | 6,306 | | | | 86 | |
| EOG Resources, Inc. | | | | | 2,256 | | | | 150 | |
| Exxon Mobil Corp. | | | | | 59,498 | | | | 4,249 | |
| Halliburton Co. | | | | | 9,916 | | | | 321 | |
| Hess Corp. | | | | | 2,520 | | | | 107 | |
| Kinder Morgan, Inc. | | | | | 1,107 | | | | 116 | |
| Marathon Oil Corp. | | | | | 3,589 | | | | 310 | |
| Murphy Oil Corp. | | | | | 1,600 | | | | 75 | |
| Nabors Industries Ltd. * | | | | | 2,800 | | | | 86 | |
| National-Oilwell Varco, Inc. * | | | | | 1,600 | | | | 97 | |
| Noble Corp. | | | | | 1,300 | | | | 91 | |
| Occidental Petroleum Corp. | | | | | 7,800 | | | | 366 | |
| Rowan Cos., Inc. | | | | | 1,100 | | | | 37 | |
| Schlumberger Ltd. | | | | | 11,400 | | | | 719 | |
| Smith International, Inc. | | | | | 1,900 | | | | 75 | |
| Sunoco, Inc. | | | | | 1,400 | | | | 93 | |
| Transocean, Inc. * | | | | | 2,945 | | | | 214 | |
| Valero Energy Corp. | | | | | 6,000 | | | | 314 | |
| Weatherford International Ltd. * | | | | | 2,720 | | | | 112 | |
| Williams Cos., Inc. | | | | | 5,000 | | | | 122 | |
| XTO Energy, Inc. | | | | | 3,333 | | | | 156 | |
| | | | | | | | | | 11,632 | |
Food & Staples Retailing 0.4% |
| Costco Wholesale Corp. | | | | | 4,400 | | | | 235 | |
| CVS Corp. | | | | | 7,800 | | | | 245 | |
| Safeway, Inc. | | | | | 4,200 | | | | 123 | |
| Supervalu, Inc. | | | | | 2,043 | | | | 68 | |
| Sysco Corp. | | | | | 6,200 | | | | 217 | |
| The Kroger Co. | | | | | 7,200 | | | | 162 | |
| Wal-Mart Stores, Inc. | | | | | 24,800 | | | | 1,222 | |
| Walgreen Co. | | | | | 9,900 | | | | 433 | |
| Whole Foods Market, Inc. | | | | | 1,000 | | | | 64 | |
| Winn-Dixie Stores, Inc. * | | | | | 1,500 | | | | — | |
| | | | | | | | | | 2,769 | |
22 See financial notes.
Schwab MarketTrack Growth Portfolio
Portfolio Holdings continued
Security
| | | | Number
of Shares | | Value
($ x 1,000) |
|---|
Food, Beverage & Tobacco 0.8% |
| Altria Group, Inc. | | | | | 20,300 | | | | 1,651 | |
| Anheuser-Busch Cos., Inc. | | | | | 7,800 | | | | 370 | |
| Archer-Daniels-Midland Co. | | | | | 6,532 | | | | 252 | |
| Brown-Forman Corp., Class B | | | | | 904 | | | | 65 | |
| Campbell Soup Co. | | | | | 1,800 | | | | 67 | |
| Coca-Cola Enterprises, Inc. | | | | | 4,000 | | | | 80 | |
| ConAgra Foods, Inc. | | | | | 4,900 | | | | 128 | |
| Constellation Brands, Inc., Class A * | | | | | 1,920 | | | | 53 | |
| Dean Foods Co. * | | | | | 1,300 | | | | 55 | |
| General Mills, Inc. | | | | | 3,576 | | | | 203 | |
| H.J. Heinz Co. | | | | | 3,400 | | | | 143 | |
| Kellogg Co. | | | | | 2,500 | | | | 126 | |
| McCormick & Co., Inc. | | | | | 1,400 | | | | 52 | |
| Molson Coors Brewing Co., Class B | | | | | 800 | | | | 57 | |
| PepsiCo, Inc. | | | | | 16,460 | | | | 1,044 | |
| Reynolds American, Inc. | | | | | 2,284 | | | | 144 | |
| Sara Lee Corp. | | | | | 7,600 | | | | 130 | |
| The Coca-Cola Co. | | | | | 20,600 | | | | 963 | |
| The Hershey Co. | | | | | 2,400 | | | | 127 | |
| The Pepsi Bottling Group, Inc. | | | | | 1,932 | | | | 61 | |
| Tyson Foods, Inc., Class A | | | | | 2,500 | | | | 36 | |
| UST, Inc. | | | | | 1,600 | | | | 86 | |
| Wm. Wrigley Jr. Co. | | | | | 2,375 | | | | 123 | |
| | | | | | | | | | 6,016 | |
Health Care Equipment & Services 0.7% |
| Aetna, Inc. | | | | | 5,696 | | | | 235 | |
| AmerisourceBergen Corp. | | | | | 2,000 | | | | 94 | |
| Bausch & Lomb, Inc. | | | | | 600 | | | | 32 | |
| Baxter International, Inc. | | | | | 6,100 | | | | 280 | |
| Becton Dickinson & Co. | | | | | 2,600 | | | | 182 | |
| Biomet, Inc. | | | | | 2,475 | | | | 94 | |
| Boston Scientific Corp. * | | | | | 10,887 | | | | 173 | |
| C.R. Bard, Inc. | | | | | 1,000 | | | | 82 | |
| Cardinal Health, Inc. | | | | | 4,100 | | | | 268 | |
| Caremark Rx, Inc. | | | | | 4,470 | | | | 220 | |
| CIGNA Corp. | | | | | 1,400 | | | | 164 | |
| Coventry Health Care, Inc. * | | | | | 1,650 | | | | 77 | |
| Express Scripts, Inc. * | | | | | 1,600 | | | | 102 | |
| HCA, Inc. | | | | | 3,200 | | | | 162 | |
| Health Management Associates, Inc., Class A | | | | | 2,400 | | | | 47 | |
| Hospira, Inc. * | | | | | 1,530 | | | | 56 | |
| Humana, Inc. * | | | | | 1,400 | | | | 84 | |
| IMS Health, Inc. | | | | | 2,300 | | | | 64 | |
| Laboratory Corp. of America Holdings * | | | | | 1,300 | | | | 89 | |
| Manor Care, Inc. | | | | | 1,100 | | | | 53 | |
| McKesson Corp. | | | | | 2,654 | | | | 133 | |
| Medco Health Solutions, Inc. * | | | | | 2,641 | | | | 141 | |
| Medtronic, Inc. | | | | | 11,800 | | | | 574 | |
| Patterson Cos., Inc. * | | | | | 1,300 | | | | 43 | |
| Quest Diagnostics, Inc. | | | | | 1,802 | | | | 90 | |
| St. Jude Medical, Inc. * | | | | | 3,500 | | | | 120 | |
| Stryker Corp. | | | | | 2,884 | | | | 151 | |
| Tenet Healthcare Corp. * | | | | | 4,650 | | | | 33 | |
| UnitedHealth Group, Inc. | | | | | 12,600 | | | | 615 | |
| WellPoint, Inc. * | | | | | 5,902 | | | | 450 | |
| Zimmer Holdings, Inc. * | | | | | 2,300 | | | | 166 | |
| | | | | | | | | | 5,074 | |
Household & Personal Products 0.4% |
| Alberto-Culver Co., Class B | | | | | 900 | | | | 46 | |
| Avon Products, Inc. | | | | | 4,800 | | | | 146 | |
| Clorox Co. | | | | | 1,500 | | | | 97 | |
| Colgate-Palmolive Co. | | | | | 5,300 | | | | 339 | |
| Kimberly-Clark Corp. | | | | | 4,960 | | | | 330 | |
| Procter & Gamble Co. | | | | | 31,717 | | | | 2,010 | |
| The Estee Lauder Cos., Inc., Class A | | | | | 1,100 | | | | 44 | |
| | | | | | | | | | 3,012 | |
Insurance 0.8% |
| ACE Ltd. | | | | | 2,500 | | | | 143 | |
| AFLAC, Inc. | | | | | 5,200 | | | | 234 | |
| Ambac Financial Group, Inc. | | | | | 1,015 | | | | 85 | |
| American International Group, Inc. | | | | | 25,551 | | | | 1,716 | |
| AON Corp. | | | | | 2,625 | | | | 91 | |
| Cincinnati Financial Corp. | | | | | 1,984 | | | | 90 | |
| Genworth Financial, Inc., Class A | | | | | 3,700 | | | | 124 | |
| Lincoln National Corp. | | | | | 3,168 | | | | 200 | |
| Loews Corp. | | | | | 4,800 | | | | 187 | |
| Marsh & McLennan Cos., Inc. | | | | | 5,200 | | | | 153 | |
| MBIA, Inc. | | | | | 1,350 | | | | 84 | |
| MetLife, Inc. | | | | | 7,310 | | | | 418 | |
| Principal Financial Group, Inc. | | | | | 3,065 | | | | 173 | |
| Prudential Financial, Inc. | | | | | 5,200 | | | | 400 | |
| SAFECO Corp. | | | | | 1,100 | | | | 64 | |
| The Allstate Corp. | | | | | 6,700 | | | | 411 | |
| The Chubb Corp. | | | | | 3,800 | | | | 202 | |
| The Hartford Financial Services Group, Inc. | | | | | 2,900 | | | | 253 | |
| The Progressive Corp. | | | | | 8,400 | | | | 203 | |
| The St. Paul Travelers Cos., Inc. | | | | | 6,453 | | | | 330 | |
| Torchmark Corp. | | | | | 1,100 | | | | 68 | |
| UnumProvident Corp. | | | | | 2,349 | | | | 46 | |
| XL Capital Ltd., Class A | | | | | 1,300 | | | | 92 | |
| | | | | | | | | | 5,767 | |
Materials 0.5% |
| Air Products & Chemicals, Inc. | | | | | 2,300 | | | | 160 | |
| Alcoa, Inc. | | | | | 8,472 | | | | 245 | |
| Allegheny Technologies, Inc. | | | | | 735 | | | | 58 | |
| Ashland, Inc. | | | | | 800 | | | | 47 | |
| Ball Corp. | | | | | 800 | | | | 33 | |
| Bemis Co. | | | | | 1,000 | | | | 34 | |
| E.I. du Pont de Nemours & Co. | | | | | 9,592 | | | | 439 | |
| Eastman Chemical Co. | | | | | 800 | | | | 49 | |
| Ecolab, Inc. | | | | | 2,200 | | | | 100 | |
| Freeport-McMoRan Copper & Gold, Inc., Class B | | | | | 1,700 | | | | 103 | |
| Hercules, Inc. * | | | | | 900 | | | | 16 | |
| International Flavors & Fragrances, Inc. | | | | | 1,100 | | | | 47 | |
| International Paper Co. | | | | | 4,846 | | | | 162 | |
| Louisiana-Pacific Corp. | | | | | 600 | | | | 12 | |
See financial notes. 23
Schwab MarketTrack Growth Portfolio
Portfolio Holdings continued
Security
| | | | Number
of Shares | | Value
($ x 1,000) |
|---|
| MeadWestvaco Corp. | | | | | 1,970 | | | | 54 | |
| Monsanto Co. | | | | | 4,986 | | | | 221 | |
| Newmont Mining Corp. | | | | | 4,201 | | | | 190 | |
| Nucor Corp. | | | | | 3,600 | | | | 210 | |
| Pactiv Corp. * | | | | | 1,500 | | | | 46 | |
| Phelps Dodge Corp. | | | | | 1,820 | | | | 183 | |
| PPG Industries, Inc. | | | | | 1,700 | | | | 116 | |
| Praxair, Inc. | | | | | 3,200 | | | | 193 | |
| Rohm & Haas Co. | | | | | 2,205 | | | | 114 | |
| Sealed Air Corp. | | | | | 882 | | | | 53 | |
| Sigma-Aldrich Corp. | | | | | 600 | | | | 45 | |
| Temple-Inland, Inc. | | | | | 1,200 | | | | 47 | |
| The Dow Chemical Co. | | | | | 9,394 | | | | 383 | |
| United States Steel Corp. | | | | | 900 | | | | 61 | |
| Vulcan Materials Co. | | | | | 800 | | | | 65 | |
| Weyerhaeuser Co. | | | | | 2,300 | | | | 146 | |
| | | | | | | | | | 3,632 | |
Media 0.6% |
| CBS Corp., Class B | | | | | 7,905 | | | | 229 | |
| Clear Channel Communications, Inc. | | | | | 5,217 | | | | 182 | |
| Comcast Corp., Class A * | | | | | 21,843 | | | | 888 | |
| Dow Jones & Co., Inc. | | | | | 800 | | | | 28 | |
| Gannett Co., Inc. | | | | | 2,500 | | | | 148 | |
| Meredith Corp. | | | | | 500 | | | | 26 | |
| News Corp., Class A | | | | | 24,300 | | | | 507 | |
| Omnicom Group, Inc. | | | | | 1,800 | | | | 183 | |
| The E.W. Scripps Co., Class A | | | | | 800 | | | | 39 | |
| The Interpublic Group of Cos., Inc. * | | | | | 3,700 | | | | 40 | |
| The McGraw-Hill Cos., Inc. | | | | | 3,800 | | | | 244 | |
| The New York Times Co., Class A | | | | | 1,400 | | | | 34 | |
| The Walt Disney Co. | | | | | 20,119 | | | | 633 | |
| Time Warner, Inc. | | | | | 40,850 | | | | 817 | |
| Tribune Co. | | | | | 3,100 | | | | 103 | |
| Univision Communications, Inc., Class A * | | | | | 3,104 | | | | 109 | |
| Viacom, Inc., Class B * | | | | | 7,905 | | | | 308 | |
| | | | | | | | | | 4,518 | |
Pharmaceuticals & Biotechnology 1.4% |
| Abbott Laboratories | | | | | 15,300 | | | | 727 | |
| Allergan, Inc. | | | | | 1,300 | | | | 150 | |
| Amgen, Inc. * | | | | | 12,138 | | | | 921 | |
| Applied Biosystems Group — Applera Corp. | | | | | 2,000 | | | | 75 | |
| Barr Pharmaceuticals, Inc. * | | | | | 1,100 | | | | 58 | |
| Biogen Idec, Inc. * | | | | | 3,125 | | | | 149 | |
| Bristol-Myers Squibb Co. | | | | | 19,000 | | | | 470 | |
| Eli Lilly & Co. | | | | | 10,900 | | | | 611 | |
| Fisher Scientific International, Inc. * | | | | | 1,115 | | | | 95 | |
| Forest Laboratories, Inc. * | | | | | 3,400 | | | | 166 | |
| Genzyme Corp. * | | | | | 2,400 | | | | 162 | |
| Gilead Sciences, Inc. * | | | | | 4,300 | | | | 296 | |
| Johnson & Johnson | | | | | 29,254 | | | | 1,972 | |
| King Pharmaceuticals, Inc. * | | | | | 2,133 | | | | 36 | |
| MedImmune, Inc. * | | | | | 2,400 | | | | 77 | |
| Merck & Co., Inc. | | | | | 21,600 | | | | 981 | |
| Millipore Corp. * | | | | | 400 | | | | 26 | |
| Mylan Laboratories, Inc. | | | | | 2,600 | | | | 53 | |
| PerkinElmer, Inc. | | | | | 1,000 | | | | 21 | |
| Pfizer, Inc. | | | | | 73,476 | | | | 1,958 | |
| Schering-Plough Corp. | | | | | 14,100 | | | | 312 | |
| Thermo Electron Corp. * | | | | | 1,300 | | | | 56 | |
| Waters Corp. * | | | | | 1,300 | | | | 65 | |
| Watson Pharmaceuticals, Inc. * | | | | | 1,000 | | | | 27 | |
| Wyeth | | | | | 13,100 | | | | 668 | |
| | | | | | | | | | 10,132 | |
Real Estate 0.2% |
| Apartment Investment & Management Co., Class A | | | | | 900 | | | | 52 | |
| Archstone-Smith Trust | | | | | 1,900 | | | | 114 | |
| Boston Properties, Inc. | | | | | 800 | | | | 85 | |
| Equity Office Properties Trust | | | | | 3,900 | | | | 166 | |
| Equity Residential | | | | | 2,600 | | | | 142 | |
| Kimco Realty Corp. | | | | | 431 | | | | 19 | |
| Plum Creek Timber Co., Inc. | | | | | 1,700 | | | | 61 | |
| ProLogis | | | | | 1,700 | | | | 108 | |
| Public Storage, Inc. | | | | | 800 | | | | 72 | |
| Realogy Corp. * | | | | | 2,483 | | | | 64 | |
| Simon Property Group, Inc. | | | | | 2,200 | | | | 214 | |
| Vornado Realty Trust | | | | | 1,200 | | | | 143 | |
| | | | | | | | | | 1,240 | |
Retailing 0.7% |
| Amazon.com, Inc. * | | | | | 3,000 | | | | 114 | |
| AutoNation, Inc. * | | | | | 2,190 | | | | 44 | |
| AutoZone, Inc. * | | | | | 800 | | | | 90 | |
| Bed, Bath & Beyond, Inc. * | | | | | 2,800 | | | | 113 | |
| Best Buy Co., Inc. | | | | | 4,505 | | | | 249 | |
| Big Lots, Inc. * | | | | | 1,100 | | | | 23 | |
| Circuit City Stores, Inc. | | | | | 2,000 | | | | 54 | |
| Dillard’s, Inc., Class A | | | | | 500 | | | | 15 | |
| Dollar General Corp. | | | | | 3,303 | | | | 46 | |
| eBay, Inc. * | | | | | 11,036 | | | | 355 | |
| Family Dollar Stores, Inc. | | | | | 1,700 | | | | 50 | |
| Federated Department Stores, Inc. | | | | | 5,144 | | | | 226 | |
| Genuine Parts Co. | | | | | 1,800 | | | | 82 | |
| Home Depot, Inc. | | | | | 21,040 | | | | 785 | |
| J.C. Penney Co., Inc. | | | | | 2,800 | | | | 211 | |
| Kohl’s Corp. * | | | | | 3,200 | | | | 226 | |
| Limited Brands, Inc. | | | | | 3,738 | | | | 110 | |
| Lowe’s Cos., Inc. | | | | | 15,200 | | | | 458 | |
| Nordstrom, Inc. | | | | | 2,600 | | | | 123 | |
| Office Depot, Inc. * | | | | | 3,300 | | | | 139 | |
| OfficeMax, Inc. | | | | | 700 | | | | 33 | |
| RadioShack Corp. | | | | | 1,900 | | | | 34 | |
| Sears Holdings Corp. * | | | | | 1,000 | | | | 174 | |
| Staples, Inc. | | | | | 7,125 | | | | 184 | |
| Target Corp. | | | | | 8,800 | | | | 521 | |
| The Gap, Inc. | | | | | 7,200 | | | | 151 | |
| The Sherwin-Williams Co. | | | | | 1,200 | | | | 71 | |
| The TJX Cos., Inc. | | | | | 5,200 | | | | 151 | |
| Tiffany & Co. | | | | | 1,400 | | | | 50 | |
| | | | | | | | | | 4,882 | |
24 See financial notes.
Schwab MarketTrack Growth Portfolio
Portfolio Holdings continued
Security
| | | | Number
of Shares | | Value
($ x 1,000) |
|---|
Semiconductors & Semiconductor Equipment 0.5% |
| Advanced Micro Devices, Inc. * | | | | | 3,840 | | | | 82 | |
| Altera Corp. * | | | | | 3,680 | | | | 68 | |
| Analog Devices, Inc. | | | | | 3,400 | | | | 108 | |
| Applied Materials, Inc. | | | | | 16,200 | | | | 282 | |
| Broadcom Corp., Class A * | | | | | 4,350 | | | | 132 | |
| Freescale Semiconductor, Inc., Class B * | | | | | 3,898 | | | | 153 | |
| Intel Corp. | | | | | 60,530 | | | | 1,292 | |
| KLA-Tencor Corp. | | | | | 1,800 | | | | 88 | |
| Linear Technology Corp. | | | | | 3,000 | | | | 93 | |
| LSI Logic Corp. * | | | | | 3,000 | | | | 30 | |
| Maxim Integrated Products, Inc. | | | | | 3,100 | | | | 93 | |
| Micron Technology, Inc. * | | | | | 5,400 | | | | 78 | |
| National Semiconductor Corp. | | | | | 3,400 | | | | 82 | |
| Novellus Systems, Inc. * | | | | | 1,325 | | | | 37 | |
| NVIDIA Corp. * | | | | | 2,800 | | | | 98 | |
| PMC - Sierra, Inc. * | | | | | 1,600 | | | | 10 | |
| Teradyne, Inc. * | | | | | 1,700 | | | | 24 | |
| Texas Instruments, Inc. | | | | | 16,800 | | | | 507 | |
| Xilinx, Inc. | | | | | 3,200 | | | | 82 | |
| | | | | | | | | | 3,339 | |
Software & Services 0.9% |
| Adobe Systems, Inc. * | | | | | 4,800 | | | | 184 | |
| Affiliated Computer Services, Inc., Class A * | | | | | 1,271 | | | | 68 | |
| Autodesk, Inc. * | | | | | 2,400 | | | | 88 | |
| Automatic Data Processing, Inc. | | | | | 5,700 | | | | 282 | |
| BMC Software, Inc. * | | | | | 2,400 | | | | 73 | |
| CA, Inc. | | | | | 5,625 | | | | 139 | |
| Citrix Systems, Inc. * | | | | | 1,800 | | | | 53 | |
| Computer Sciences Corp. * | | | | | 1,680 | | | | 89 | |
| Compuware Corp. * | | | | | 3,600 | | | | 29 | |
| Convergys Corp. * | | | | | 1,354 | | | | 29 | |
| Electronic Arts, Inc. * | | | | | 2,866 | | | | 152 | |
| Electronic Data Systems Corp. | | | | | 4,600 | | | | 116 | |
| First Data Corp. | | | | | 7,888 | | | | 191 | |
| Fiserv, Inc. * | | | | | 1,800 | | | | 89 | |
| Google, Inc., Class A * | | | | | 2,100 | | | | 1,000 | |
| Intuit, Inc. * | | | | | 3,944 | | | | 139 | |
| Microsoft Corp. | | | | | 86,420 | | | | 2,481 | |
| Novell, Inc. * | | | | | 3,200 | | | | 19 | |
| Oracle Corp. * | | | | | 38,295 | | | | 707 | |
| Parametric Technology Corp. * | | | | | 1,080 | | | | 21 | |
| Paychex, Inc. | | | | | 3,600 | | | | 142 | |
| Sabre Holdings Corp., Class A | | | | | 1,283 | | | | 33 | |
| Symantec Corp. * | | | | | 11,721 | | | | 233 | |
| Unisys Corp. * | | | | | 3,100 | | | | 20 | |
| VeriSign, Inc. * | | | | | 2,500 | | | | 52 | |
| Yahoo! Inc. * | | | | | 12,600 | | | | 332 | |
| | | | | | | | | | 6,761 | |
Technology Hardware & Equipment 1.2% |
| ADC Telecommunications, Inc. * | | | | | 857 | | | | 12 | |
| Agilent Technologies, Inc. * | | | | | 4,437 | | | | 158 | |
| Apple Computer, Inc. * | | | | | 8,000 | | | | 649 | |
| Avaya, Inc. * | | | | | 4,132 | | | | 53 | |
| Ciena Corp. * | | | | | 457 | | | | 11 | |
| Cisco Systems, Inc. * | | | | | 63,500 | | | | 1,532 | |
| Comverse Technology, Inc. * | | | | | 1,900 | | | | 41 | |
| Corning, Inc. * | | | | | 13,900 | | | | 284 | |
| Dell, Inc. * | | | | | 23,740 | | | | 578 | |
| EMC Corp. * | | | | | 23,186 | | | | 284 | |
| Hewlett-Packard Co. | | | | | 28,403 | | | | 1,100 | |
| International Business Machines Corp. | | | | | 15,820 | | | | 1,461 | |
| Jabil Circuit, Inc. | | | | | 1,998 | | | | 57 | |
| JDS Uniphase Corp. * | | | | | 1,573 | | | | 23 | |
| Juniper Networks, Inc. * | | | | | 4,200 | | | | 72 | |
| Lexmark International, Inc., Class A * | | | | | 1,300 | | | | 83 | |
| Lucent Technologies, Inc. * | | | | | 40,092 | | | | 97 | |
| Molex, Inc. | | | | | 1,875 | | | | 65 | |
| Motorola, Inc. | | | | | 24,131 | | | | 557 | |
| NCR Corp. * | | | | | 2,000 | | | | 83 | |
| Network Appliance, Inc. * | | | | | 3,400 | | | | 124 | |
| QLogic Corp. * | | | | | 1,738 | | | | 36 | |
| QUALCOMM, Inc. | | | | | 16,200 | | | | 590 | |
| SanDisk Corp. * | | | | | 1,800 | | | | 87 | |
| Sanmina — SCI Corp. * | | | | | 5,000 | | | | 20 | |
| Solectron Corp. * | | | | | 7,900 | | | | 26 | |
| Sun Microsystems, Inc. * | | | | | 30,800 | | | | 167 | |
| Symbol Technologies, Inc. | | | | | 2,031 | | | | 30 | |
| Tektronix, Inc. | | | | | 900 | | | | 27 | |
| Tellabs, Inc. * | | | | | 4,000 | | | | 42 | |
| Xerox Corp. * | | | | | 9,400 | | | | 160 | |
| | | | | | | | | | 8,509 | |
Telecommunication Services 0.6% |
| ALLTEL Corp. | | | | | 3,730 | | | | 199 | |
| AT&T Corp. | | | | | 38,070 | | | | 1,304 | |
| BellSouth Corp. | | | | | 17,800 | | | | 803 | |
| CenturyTel, Inc. | | | | | 1,350 | | | | 54 | |
| Citizens Communications Co. | | | | | 2,576 | | | | 38 | |
| Embarq Corp. | | | | | 1,428 | | | | 69 | |
| Qwest Communications International, Inc. * | | | | | 15,773 | | | | 136 | |
| Sprint Nextel Corp. | | | | | 28,569 | | | | 534 | |
| Verizon Communications, Inc. | | | | | 27,258 | | | | 1,008 | |
| Windstream Corp. | | | | | 3,856 | | | | 53 | |
| | | | | | | | | | 4,198 | |
Transportation 0.3% |
| Burlington Northern Santa Fe Corp. | | | | | 3,800 | | | | 295 | |
| CSX Corp. | | | | | 4,400 | | | | 157 | |
| Delta Air Lines, Inc. * | | | | | 1,300 | | | | 1 | |
| FedEx Corp. | | | | | 2,920 | | | | 335 | |
| Norfolk Southern Corp. | | | | | 3,600 | | | | 189 | |
| Ryder System, Inc. | | | | | 400 | | | | 21 | |
| Southwest Airlines Co. | | | | | 7,480 | | | | 112 | |
| Union Pacific Corp. | | | | | 2,500 | | | | 227 | |
| United Parcel Service, Inc., Class B | | | | | 10,818 | | | | 815 | |
| | | | | | | | | | 2,152 | |
See financial notes. 25
Schwab MarketTrack Growth Portfolio
Portfolio Holdings continued
Security
| | | | Number
of Shares | | Value
($ x 1,000) |
|---|
Utilities 0.6% |
| Allegheny Energy, Inc. * | | | | | 1,070 | | | | 46 | |
| Ameren Corp. | | | | | 1,800 | | | | 97 | |
| American Electric Power Co., Inc. | | | | | 3,860 | | | | 160 | |
| CenterPoint Energy, Inc. | | | | | 2,949 | | | | 46 | |
| CMS Energy Corp. * | | | | | 1,000 | | | | 15 | |
| Consolidated Edison, Inc. | | | | | 2,100 | | | | 101 | |
| Constellation Energy Group, Inc. | | | | | 1,700 | | | | 106 | |
| Dominion Resources, Inc. | | | | | 3,378 | | | | 274 | |
| DTE Energy Co. | | | | | 1,700 | | | | 77 | |
| Duke Energy Corp. | | | | | 11,348 | | | | 359 | |
| Dynegy, Inc., Class A * | | | | | 3,100 | | | | 19 | |
| Edison International | | | | | 3,200 | | | | 142 | |
| Entergy Corp. | | | | | 2,100 | | | | 180 | |
| Exelon Corp. | | | | | 6,524 | | | | 404 | |
| FirstEnergy Corp. | | | | | 3,195 | | | | 188 | |
| FPL Group, Inc. | | | | | 3,800 | | | | 194 | |
| KeySpan Corp. | | | | | 1,300 | | | | 53 | |
| Nicor, Inc. | �� | | | | 500 | | | | 23 | |
| NiSource, Inc. | | | | | 2,646 | | | | 62 | |
| Peoples Energy Corp. | | | | | 200 | | | | 9 | |
| PG&E Corp. | | | | | 4,000 | | | | 173 | |
| Pinnacle West Capital Corp. | | | | | 800 | | | | 38 | |
| PPL Corp. | | | | | 3,600 | | | | 124 | |
| Progress Energy, Inc. | | | | | 2,475 | | | | 114 | |
| Public Service Enterprise Group, Inc. | | | | | 2,300 | | | | 140 | |
| Sempra Energy | | | | | 2,103 | | | | 112 | |
| TECO Energy, Inc. | | | | | 1,300 | | | | 21 | |
| The AES Corp. * | | | | | 6,000 | | | | 132 | |
| The Southern Co. | | | | | 7,200 | | | | 262 | |
| TXU Corp. | | | | | 4,734 | | | | 299 | |
| Xcel Energy, Inc. | | | | | 3,850 | | | | 85 | |
| | | | | | | | | | 4,055 | |
| | | | | | | | | | | |
Other Investment Companies 82.5% of net assets |
Schwab Institutional Select S&P 500 Fund (a) | | | | | 15,600,509 | | | | 171,450 | |
Schwab International Index Fund, Select Shares (a) | | | | | 6,737,074 | | | | 142,422 | |
Schwab Small-Cap Index Fund, Select Shares (a) | | | | | 5,457,443 | | | | 141,730 | |
Schwab Total Bond Market Fund (a) | | | | | 10,824,169 | | | | 106,402 | |
Schwab Value Advantage Money Fund, Institutional Shares (a) | | | | | 32,828,008 | | | | 32,828 | |
| | | | | | | | | | 594,832 | |
Security
Rate, Maturity Date
| | | | Face Amount
($ x 1,000) | | |
|---|
Short-Term Investment 0.2% of net assets |
Wells Fargo, Grand Cayman Time Deposit
4.71%, 11/01/06 | | | | | 1,500 | | | | 1,500 | |
At 10/31/06 the tax basis cost of the fund’s investments was $532,134 and the unrealized appreciation and depreciation were $195,244 and ($7,347), respectively, with a net unrealized appreciation of $187,897.
| * | | Non-income producing security. |
(a) | | Issuer is affiliated with the fund’s adviser. |
26 See financial notes.
Schwab MarketTrack Growth Portfolio
Statement of
Assets and Liabilities
As of October 31, 2006. All numbers x 1,000 except NAV.
Assets |
| Investments in affiliated underlying funds, at value (cost $455,095) | | | | $ | 594,832 | |
| Investments in unaffiliated issuers, at value (cost $71,977) | | | | + | 125,199 | |
| Total investments, at value (cost $527,072) | | | | | 720,031 | |
| Receivables: | | | | | | |
| Fund shares sold | | | | | 916 | |
| Dividends | | | | | 604 | |
| Prepaid expenses | | | | + | 4 | |
Total assets | | | | | 721,555 | |
| |
Liabilities |
| Payables: | | | | | | |
| Investments bought | | | | | 431 | |
| Investment adviser and administrator fees | | | | | 13 | |
| Transfer agent and shareholder services fees | | | | | 13 | |
| Fund shares redeemed | | | | | 393 | |
| Trustee fees | | | | | 1 | |
| Accrued expenses | | | | + | 103 | |
Total liabilities | | | | | 954 | |
| |
Net Assets |
Total assets | | | | | 721,555 | |
Total liabilities | | | | | –954 | |
Net assets | | | | $ | 720,601 | |
| |
Net Assets by Source | | | | | | |
| Capital received from investors | | | | | 522,452 | |
| Net investment income not yet distributed | | | | | 3,726 | |
| Net realized capital gains | | | | | 1,464 | |
| Net unrealized capital gains | | | | | 192,959 | |
| |
Net Asset Value (NAV) by Shares Class | | | | | | |
Share Class
| | | | Net Assets | | ÷ | | Shares
Outstanding | | = | | NAV |
|---|
| Investor Shares | | | | $ | 601,864 | | | | | | | | 31,415 | | | | | | | $ | 19.16 | |
| P Shares | | | | $ | 118,737 | | | | | | | | 6,192 | | | | | | | $ | 19.18 | |
See financial notes. 27
Schwab MarketTrack Growth Portfolio
Statement of
Operations
For November 1, 2005 through October 31, 2006. All numbers x 1,000.
Investment Income |
| Dividends received from affiliated underlying funds | | | | $ | 13,673 | |
| Dividends, including $1 from affiliated issuer | | | | | 1,180 | |
| Interest | | | | + | 80 | |
Total Investment Income | | | | | 14,933 | |
| |
Net Realized Gains and Losses |
| Net realized gains on sales of affiliated underlying funds | | | | | 7,628 | |
| Net realized gains received from affiliated underlying funds | | | | | 1,135 | |
| Net realized gains on unaffiliated investments | | | | + | 2,915 | |
Net realized gains | | | | | 11,678 | |
| |
Net Unrealized Gains and Losses |
| Net unrealized gains on affiliated underlying funds | | | | | 63,298 | |
| Net unrealized gains on unaffiliated investments | | | | + | 15,394 | |
Net unrealized gains | | | | | 78,692 | |
| |
Expenses |
| Investment adviser and administrator fees | | | | | 2,962 | |
Transfer agent and shareholder service fees:
| | | | | | |
| Investor Shares | | | | | 1,569 | |
| P Shares | | | | | 68 | |
| Shareholder reports | | | | | 92 | |
| Portfolio accounting fees | | | | | 43 | |
| Registration fees | | | | | 41 | |
| Professional fees | | | | | 34 | |
| Custodian fees | | | | | 27 | |
| Trustees’ fees | | | | | 10 | |
| Overdraft Expense | | | | | 4 | |
| Other expenses | | | | + | 17 | |
| Total expenses | | | | | 4,867 | |
| Expense reduction by adviser and Schwab | | | | | –1,487 | |
Net expenses | | | | | 3,380 | |
| |
Increase in Net Assets from Operations |
Total investment income | | | | | 14,933 | |
Net expenses | | | | | –3,380 | |
Net investment income | | | | | 11,553 | |
Net realized gains | | | | | 11,678 | |
Net unrealized gains | | | | + | 78,692 | |
Increase in net assets from operations | | | | $ | 101,923 | |
28 See financial notes.
Schwab MarketTrack Growth Portfolio
Statement of
Changes in Net Assets
For the current and prior report periods. All numbers x 1,000.
| | | | 11/1/05—10/31/06 | | 11/1/04—10/31/05 |
|---|
| Net investment income | | | | $ | 11,553 | | | $ | 10,435 | |
| Net realized gains | | | | | 11,678 | | | | 14,721 | |
| Net unrealized gains | | | | + | 78,692 | | | | 33,101 | |
Increase in net assets from operations | | | | | 101,923 | | | | 58,257 | |
| |
Distributions Paid | | | | | | | | | | |
| Dividends from net investment income (Investor Shares) | | | | $ | 10,988 | | | $ | 9,037 | |
Transactions in Fund Shares | | | | | | | | | | | | | | | | | | |
| | | | 11/1/05—10/31/06 | | 11/1/04—10/31/05 | |
|---|
| | | | SHARES | | VALUE | | SHARES | | VALUE |
|---|
Shares Sold | | | | | | | | | | | | | | | | | | |
| Investor Shares | | | | | 4,979 | | | $ | 88,820 | | | | 6,796 | | | $ | 111,249 | |
| P. Shares | | | | + | 7,185 | | | | 131,591 | | | | — | | | | — | |
Total shares sold | | | | | 12,164 | | | $ | 220,411 | | | | 6,796 | | | $ | 111,249 | |
| | | | | | | | | | | | | | | | | | | |
Shares Reinvested | | | | | | | | | | | | | | | | | | |
| Investor Shares | | | | | 616 | | | $ | 10,669 | | | | 541 | | | $ | 8,784 | |
| P. Shares | | | | + | — | | | | — | | | | — | | | | — | |
Total shares reinvested | | | | | 616 | | | $ | 10,669 | | | | 541 | | | $ | 8,784 | |
| | | | | | | | | | | | | | | | | | | |
Shares Redeemed | | | | | | | | | | | | | | | | | | |
| Investor Shares | | | | | (13,275 | ) | | $ | (240,466 | ) | | | (7,663 | ) | | $ | (125,960 | ) |
| P. Shares | | | | + | (993 | ) | | | (18,069 | ) | | | — | | | | — | |
Total shares redeemed | | | | | (14,268 | ) | | $ | (258,535 | ) | | | (7,663 | ) | | $ | (125,960 | ) |
| | | | | | | | | | | | | | | | | | | |
Net transactions in fund shares | | | | | (1,488 | ) | | $ | (27,455 | ) | | | (326 | ) | | $ | (5,927 | ) |
Shares Outstanding and Net Assets | | | | | | | | | | | | | | | | | | |
| | | | 11/1/05—10/31/06 | | 11/1/04—10/31/05 | |
|---|
| | | | SHARES | | NET ASSETS | | SHARES | | NET ASSETS |
|---|
| Beginning of period | | | | | 39,095 | | | $ | 657,121 | | | | 39,421 | | | $ | 613,828 | |
| Total increase or decrease | | | | + | (1,488 | ) | | | 63,480 | | | | (326 | ) | | | 43,293 | |
End of period | | | | | 37,607 | | | $ | 720,601 | | | | 39,095 | | | $ | 657,121 | |
Net investment income not yet distributed | | | | | | | | $ | 3,726 | | | | | | | $ | 2,892 | |
See financial notes. 29
Schwab MarketTrack Balanced Portfolio™
Financial Statements
Financial Highlights
| | | | 11/1/05—
10/31/06 | | 11/1/04—
10/31/05 | | 11/1/03—
10/31/04 | | 11/1/02—
10/31/03 | | 11/1/01—
10/31/02 |
|---|
Per-Share Data ($) |
| Net asset value at beginning of period | | | | | 15.46 | | | | 14.66 | | | | 13.78 | | | | 12.05 | | | | 13.47 | |
Income or loss from investment operations:
| | | | | | | | | | | | | | | | | | | | | | |
| Net investment income | | | | | 0.38 | | | | 0.34 | | | | 0.29 | | | | 0.25 | | | | 0.32 | |
| Net realized and unrealized gains or losses | | | | | 1.58 | | | | 0.74 | | | | 0.88 | | | | 1.77 | | | | (1.22 | ) |
| Total income or loss from investment operations | | | | | 1.96 | | | | 1.08 | | | | 1.17 | | | | 2.02 | | | | (0.90 | ) |
Less distributions:
| | | | | | | | | | | | | | | | | | | | | | |
| Dividends from net investment income | | | | | (0.34 | ) | | | (0.28 | ) | | | (0.29 | ) | | | (0.29 | ) | | | (0.40 | ) |
| Distributions from net realized gains | | | | | (0.04 | ) | | | — | | | | — | | | | — | | | | (0.12 | ) |
| Total distributions | | | | | (0.38 | ) | | | (0.28 | ) | | | (0.29 | ) | | | (0.29 | ) | | | (0.52 | ) |
| Net asset value at end of period | | | | | 17.04 | | | | 15.46 | | | | 14.66 | | | | 13.78 | | | | 12.05 | |
| Total return (%) | | | | | 12.92 | | | | 7.41 | | | | 8.61 | | | | 17.12 | | | | (7.08 | ) |
| |
Ratios/Supplemental Data (%) |
Ratios to average net assets:
| | | | | | | | | | | | | | | | | | | | | | |
Net operating expenses1 | | | | | 0.50 | | | | 0.50 | | | | 0.50 | | | | 0.50 | | | | 0.50 | |
Gross operating expenses1 | | | | | 0.73 | | | | 0.73 | | | | 0.74 | | | | 0.74 | | | | 0.74 | |
| Net investment income | | | | | 2.35 | | | | 2.20 | | | | 2.03 | | | | 1.98 | | | | 2.35 | |
| Portfolio turnover rate | | | | | 8 | | | | 25 | | | | 11 | | | | 17 | | | | 31 | |
| Net assets, end of period ($ x 1,000,000) | | | | | 534 | | | | 519 | | | | 541 | | | | 516 | | | | 462 | |
1 | | The expenses incurred by underlying funds in which the portfolio invests are not included in this ratio.
The income received by the portfolio from underlying funds is reduced by those expenses. |
30 See financial notes.
Schwab MarketTrack Balanced Portfolio
Portfolio Holdings as of October 31, 2006
This section shows all the securities in the fund’s portfolio and their value as of the report date.
The fund files its complete schedule of portfolio holdings with the SEC for the first and third quarters of each fiscal year on Form N-Q. The fund’s Form N-Q is available on the SEC’s website at http://www.sec.gov and may be viewed and copied at the SEC’s Public Reference Room in Washington, D.C. Call 1-800-SEC-0330 for information on the operation of the Public Reference Room. The schedule of portfolio holdings filed on a fund’s most recent Form N-Q is also available by visiting Schwab’s website at www.schwab.com/schwabfunds.
Holdings by Category
|
| Cost
($ x 1,000)
|
| Value
($ x 1,000)
|
|
|---|
15.5% | | | | Common Stock | | | 47,622 | | | | 82,797 | |
84.3% | | | | Other Investment Companies | | | 368,594 | | | | 450,183 | |
0.2% | | | | Short-Term Investment | | | 960 | | | | 960 | |
100.0% | | | | Total Investments | | | 417,176 | | | | 533,940 | |
0.0% | | | | Other Assets and Liabilities, Net | | | | | | | 155 | |
100.0% | | | | Total Net Assets | | | | | | | 534,095 | |
Security
| | | | Number
of Shares | | Value
($ x 1,000) |
|---|
Common Stock 15.5% of net assets |
Automobiles & Components 0.1% |
| Ford Motor Co. | | | | | 12,185 | | | | 101 | |
| General Motors Corp. | | | | | 3,650 | | | | 128 | |
| Harley-Davidson, Inc. | | | | | 2,000 | | | | 137 | |
| Johnson Controls, Inc. | | | | | 1,200 | | | | 98 | |
The Goodyear Tire &
Rubber Co. * | | | | | 1,000 | | | | 15 | |
| | | | | | | | | | 479 | |
Banks 0.9% |
| AmSouth Bancorp | | | | | 2,600 | | | | 79 | |
| BB&T Corp. | | | | | 3,600 | | | | 157 | |
| Comerica, Inc. | | | | | 1,100 | | | | 64 | |
| Commerce Bancorp, Inc. | | | | | 1,200 | | | | 42 | |
| Compass Bancshares, Inc. | | | | | 800 | | | | 45 | |
| Countrywide Financial Corp. | | | | | 3,498 | | | | 133 | |
| Fannie Mae | | | | | 6,300 | | | | 373 | |
| Fifth Third Bancorp | | | | | 3,658 | | | | 146 | |
| First Horizon National Corp. | | | | | 800 | | | | 31 | |
| Freddie Mac | | | | | 4,500 | | | | 310 | |
| Huntington Bancshares, Inc. | | | | | 1,597 | | | | 39 | |
| KeyCorp | | | | | 2,600 | | | | 97 | |
| M&T Bank Corp. | | | | | 500 | | | | 61 | |
| Marshall & Ilsley Corp. | | | | | 1,344 | | | | 64 | |
| MGIC Investment Corp. | | | | | 700 | | | | 41 | |
| National City Corp. | | | | | 4,100 | | | | 153 | |
| North Fork Bancorp, Inc. | | | | | 3,000 | | | | 86 | |
| PNC Financial Services Group, Inc. | | | | | 1,900 | | | | 133 | |
| Regions Financial Corp. | | | | | 3,078 | | | | 117 | |
| Sovereign Bancorp, Inc. | | | | | 1,890 | | | | 45 | |
| SunTrust Banks, Inc. | | | | | 2,300 | | | | 182 | |
| Synovus Financial Corp. | | | | | 1,900 | | | | 56 | |
| U.S. Bancorp | | | | | 12,554 | | | | 425 | |
| Wachovia Corp. | | | | | 12,596 | | | | 699 | |
| Washington Mutual, Inc. | | | | | 6,634 | | | | 281 | |
| Wells Fargo & Co. | | | | | 22,470 | | | | 815 | |
| Zions Bancorp | | | | | 600 | | | | 48 | |
| | | | | | | | | | 4,722 | |
Capital Goods 1.3% |
| 3M Co. | | | | | 5,000 | | | | 394 | |
| American Power Conversion Corp. | | | | | 1,175 | | | | 36 | |
| American Standard Cos., Inc. | | | | | 1,500 | | | | 66 | |
| Caterpillar, Inc. | | | | | 4,600 | | | | 279 | |
| Cooper Industries Ltd., Class A | | | | | 600 | | | | 54 | |
| Cummins, Inc. | | | | | 300 | | | | 38 | |
| Danaher Corp. | | | | | 2,000 | | | | 144 | |
| Deere & Co. | | | | | 1,500 | | | | 128 | |
| Dover Corp. | | | | | 1,400 | | | | 66 | |
| Eaton Corp. | | | | | 1,000 | | | | 72 | |
| Emerson Electric Co. | | | | | 2,800 | | | | 236 | |
| Fluor Corp. | | | | | 500 | | | | 39 | |
| General Dynamics Corp. | | | | | 2,600 | | | | 185 | |
| General Electric Co. | | | | | 70,660 | | | | 2,481 | |
| Goodrich Corp. | | | | | 700 | | | | 31 | |
| Honeywell International, Inc. | | | | | 5,700 | | | | 240 | |
| Illinois Tool Works, Inc. | | | | | 2,800 | | | | 134 | |
| Ingersoll-Rand Co., Ltd., Class A | | | | | 2,200 | | | | 81 | |
| ITT Industries, Inc. | | | | | 1,200 | | | | 65 | |
| L-3 Communications Holdings, Inc. | | | | | 700 | | | | 56 | |
| Lockheed Martin Corp. | | | | | 2,400 | | | | 209 | |
| Masco Corp. | | | | | 3,000 | | | | 83 | |
| Navistar International Corp. * | | | | | 400 | | | | 11 | |
| Northrop Grumman Corp. | | | | | 2,256 | | | | 150 | |
| PACCAR, Inc. | | | | | 1,575 | | | | 93 | |
| Pall Corp. | | | | | 800 | | | | 25 | |
| Parker Hannifin Corp. | | | | | 700 | | | | 59 | |
| Raytheon Co. | | | | | 2,600 | | | | 130 | |
| Rockwell Automation, Inc. | | | | | 1,200 | | | | 74 | |
| Rockwell Collins, Inc. | | | | | 1,200 | | | | 70 | |
| Textron, Inc. | | | | | 1,000 | | | | 91 | |
| The Boeing Co. | | | | | 5,484 | | | | 438 | |
| Tyco International Ltd. | | | | | 12,949 | | | | 381 | |
| United Technologies Corp. | | | | | 6,600 | | | | 434 | |
| W.W. Grainger, Inc. | | | | | 600 | | | | 44 | |
| | | | | | | | | | 7,117 | |
Commercial Services & Supplies 0.1% |
| Allied Waste Industries, Inc. * | | | | | 2,100 | | | | 26 | |
| Avery Dennison Corp. | | | | | 700 | | | | 44 | |
| Cintas Corp. | | | | | 1,102 | | | | 46 | |
| Equifax, Inc. | | | | | 900 | | | | 34 | |
| Monster Worldwide, Inc. * | | | | | 666 | | | | 27 | |
| Pitney Bowes, Inc. | | | | | 1,600 | | | | 75 | |
| R.R. Donnelley & Sons Co. | | | | | 1,400 | | | | 47 | |
| Robert Half International, Inc. | | | | | 1,200 | | | | 44 | |
| Waste Management, Inc. | | | | | 3,712 | | | | 139 | |
| | | | | | | | | | 482 | |
See financial notes. 31
Schwab MarketTrack Balanced Portfolio
Portfolio Holdings continued
Security
| | | | Number
of Shares | | Value
($ x 1,000) |
|---|
Consumer Durables & Apparel 0.2% |
| Brunswick Corp. | | | | | 600 | | | | 19 | |
| Centex Corp. | | | | | 800 | | | | 42 | |
| Coach, Inc. * | | | | | 2,400 | | | | 95 | |
| D.R. Horton, Inc. | | | | | 1,790 | | | | 42 | |
| Eastman Kodak Co. | | | | | 2,000 | | | | 49 | |
| Fortune Brands, Inc. | | | | | 1,000 | | | | 77 | |
| Harman International Industries, Inc. | | | | | 300 | | | | 31 | |
| Hasbro, Inc. | | | | | 1,275 | | | | 33 | |
| Jones Apparel Group, Inc. | | | | | 800 | | | | 27 | |
| KB Home | | | | | 600 | | | | 27 | |
| Leggett & Platt, Inc. | | | | | 1,300 | | | | 30 | |
| Lennar Corp., Class A | | | | | 900 | | | | 43 | |
| Liz Claiborne, Inc. | | | | | 800 | | | | 34 | |
| Mattel, Inc. | | | | | 2,825 | | | | 64 | |
| Newell Rubbermaid, Inc. | | | | | 1,872 | | | | 54 | |
| Nike, Inc., Class B | | | | | 1,300 | | | | 119 | |
| Pulte Homes, Inc. | | | | | 1,600 | | | | 49 | |
| Snap-On, Inc. | | | | | 350 | | | | 16 | |
| The Black & Decker Corp. | | | | | 600 | | | | 50 | |
| The Stanley Works | | | | | 600 | | | | 28 | |
| VF Corp. | | | | | 800 | | | | 61 | |
| Whirlpool Corp. | | | | | 571 | | | | 50 | |
| | | | | | | | | | 1,040 | |
Consumer Services 0.3% |
| Apollo Group, Inc., Class A * | | | | | 1,100 | | | | 41 | |
| Carnival Corp. | | | | | 2,870 | | | | 140 | |
| Darden Restaurants, Inc. | | | | | 1,350 | | | | 57 | |
| H&R Block, Inc. | | | | | 2,400 | | | | 52 | |
| Harrah’s Entertainment, Inc. | | | | | 1,200 | | | | 89 | |
| Hilton Hotels Corp. | | | | | 2,500 | | | | 72 | |
| International Game Technology | | | | | 2,100 | | | | 89 | |
| Marriott International, Inc., Class A | | | | | 2,200 | | | | 92 | |
| McDonald’s Corp. | | | | | 8,100 | | | | 340 | |
| Starbucks Corp. * | | | | | 4,880 | | | | 184 | |
| Starwood Hotels & Resorts Worldwide, Inc. | | | | | 1,200 | | | | 72 | |
| Wendy’s International, Inc. | | | | | 800 | | | | 28 | |
| Wyndham Worldwide Corp. * | | | | | 1,283 | | | | 38 | |
| YUM! Brands, Inc. | | | | | 2,060 | | | | 122 | |
| | | | | | | | | | 1,416 | |
Diversified Financials 1.6% |
| American Express Co. | | | | | 8,310 | | | | 480 | |
| Ameriprise Financial, Inc. | | | | | 1,542 | | | | 79 | |
| Bank of America Corp. | | | | | 30,427 | | | | 1,639 | |
| Capital One Financial Corp. | | | | | 1,900 | | | | 151 | |
| Chicago Mercantile Exchange Holdings, Inc. | | | | | 230 | | | | 115 | |
| CIT Group, Inc. | | | | | 1,300 | | | | 68 | |
| Citigroup, Inc. | | | | | 34,266 | | | | 1,719 | |
| E*TRADE Financial Corp. * | | | | | 2,400 | | | | 56 | |
| Federated Investors, Inc., Class B | | | | | 700 | | | | 24 | |
| Franklin Resources, Inc. | | | | | 1,010 | | | | 115 | |
| Janus Capital Group, Inc. | | | | | 1,400 | | | | 28 | |
| JPMorgan Chase & Co. | | | | | 23,413 | | | | 1,111 | |
| Legg Mason, Inc. | | | | | 800 | | | | 72 | |
| Lehman Brothers Holdings, Inc. | | | | | 3,600 | | | | 280 | |
| Mellon Financial Corp. | | | | | 2,800 | | | | 109 | |
| Merrill Lynch & Co., Inc. | | | | | 6,300 | | | | 551 | |
| Moody’s Corp. | | | | | 2,000 | | | | 133 | |
| Morgan Stanley | | | | | 7,010 | | | | 536 | |
| Northern Trust Corp. | | | | | 1,400 | | | | 82 | |
| SLM Corp. | | | | | 3,000 | | | | 146 | |
| State Street Corp. | | | | | 2,200 | | | | 141 | |
| T. Rowe Price Group, Inc. | | | | | 1,600 | | | | 76 | |
| The Bank of New York Co., Inc. | | | | | 4,900 | | | | 169 | |
| The Bear Stearns Cos., Inc. | | | | | 602 | | | | 91 | |
| The Charles Schwab Corp. (a) | | | | | 6,883 | | | | 125 | |
| The Goldman Sachs Group, Inc. | | | | | 3,079 | | | | 584 | |
| | | | | | | | | | 8,680 | |
Energy 1.4% |
| Anadarko Petroleum Corp. | | | | | 3,020 | | | | 140 | |
| Apache Corp. | | | | | 2,048 | | | | 134 | |
| Baker Hughes, Inc. | | | | | 2,250 | | | | 155 | |
| BJ Services Co. | | | | | 2,000 | | | | 60 | |
| Chesapeake Energy Corp. | | | | | 2,300 | | | | 75 | |
| ChevronTexaco Corp. | | | | | 14,727 | | | | 990 | |
| ConocoPhillips | | | | | 10,985 | | | | 662 | |
| CONSOL Energy, Inc. | | | | | 1,200 | | | | 42 | |
| Devon Energy Corp. | | | | | 3,000 | | | | 201 | |
| El Paso Corp. | | | | | 3,222 | | | | 44 | |
| EOG Resources, Inc. | | | | | 1,518 | | | | 101 | |
| Exxon Mobil Corp. | | | | | 40,010 | | | | 2,858 | |
| Halliburton Co. | | | | | 6,748 | | | | 218 | |
| Hess Corp. | | | | | 1,800 | | | | 76 | |
| Kinder Morgan, Inc. | | | | | 745 | | | | 78 | |
| Marathon Oil Corp. | | | | | 2,218 | | | | 192 | |
| Murphy Oil Corp. | | | | | 1,100 | | | | 52 | |
| Nabors Industries Ltd. * | | | | | 2,000 | | | | 62 | |
| National-Oilwell Varco, Inc. * | | | | | 1,130 | | | | 68 | |
| Noble Corp. | | | | | 900 | | | | 63 | |
| Occidental Petroleum Corp. | | | | | 5,400 | | | | 253 | |
| Rowan Cos., Inc. | | | | | 600 | | | | 20 | |
| Schlumberger Ltd. | | | | | 7,800 | | | | 492 | |
| Smith International, Inc. | | | | | 1,300 | | | | 51 | |
| Sunoco, Inc. | | | | | 900 | | | | 60 | |
| Transocean, Inc. * | | | | | 2,016 | | | | 146 | |
| Valero Energy Corp. | | | | | 4,000 | | | | 209 | |
| Weatherford International Ltd. * | | | | | 1,820 | | | | 75 | |
| Williams Cos., Inc. | | | | | 3,000 | | | | 73 | |
| XTO Energy, Inc. | | | | | 2,266 | | | | 106 | |
| | | | | | | | | | 7,756 | |
Food & Staples Retailing 0.4% |
| Costco Wholesale Corp. | | | | | 3,000 | | | | 160 | |
| CVS Corp. | | | | | 5,200 | | | | 163 | |
| Safeway, Inc. | | | | | 2,800 | | | | 82 | |
| Supervalu, Inc. | | | | | 1,386 | | | | 47 | |
| Sysco Corp. | | | | | 4,400 | | | | 154 | |
| The Kroger Co. | | | | | 5,300 | | | | 119 | |
| Wal-Mart Stores, Inc. | | | | | 16,640 | | | | 820 | |
| Walgreen Co. | | | | | 6,600 | | | | 288 | |
32 See financial notes.
Schwab MarketTrack Balanced Portfolio
Portfolio Holdings continued
Security
| | | | Number
of Shares | | Value
($ x 1,000) |
|---|
| Whole Foods Market, Inc. | | | | | 800 | | | | 51 | |
| Winn-Dixie Stores, Inc. * | | | | | 1,200 | | | | — | |
| | | | | | | | | | 1,884 | |
Food, Beverage & Tobacco 0.7% |
| Altria Group, Inc. | | | | | 13,640 | | | | 1,109 | |
| Anheuser-Busch Cos., Inc. | | | | | 5,200 | | | | 247 | |
| Archer-Daniels-Midland Co. | | | | | 4,446 | | | | 171 | |
| Brown-Forman Corp., Class B | | | | | 804 | | | | 58 | |
| Campbell Soup Co. | | | | | 1,200 | | | | 45 | |
| Coca-Cola Enterprises, Inc. | | | | | 2,700 | | | | 54 | |
| ConAgra Foods, Inc. | | | | | 3,300 | | | | 86 | |
| Constellation Brands, Inc., Class A * | | | | | 1,290 | | | | 35 | |
| Dean Foods Co. * | | | | | 800 | | | | 33 | |
| General Mills, Inc. | | | | | 2,392 | | | | 136 | |
| H.J. Heinz Co. | | | | | 2,300 | | | | 97 | |
| Kellogg Co. | | | | | 1,700 | | | | 86 | |
| McCormick & Co., Inc. | | | | | 900 | | | | 34 | |
| Molson Coors Brewing Co., Class B | | | | | 200 | | | | 14 | |
| PepsiCo, Inc. | | | | | 11,070 | | | | 702 | |
| Reynolds American, Inc. | | | | | 1,228 | | | | 78 | |
| Sara Lee Corp. | | | | | 5,100 | | | | 87 | |
| The Coca-Cola Co. | | | | | 13,810 | | | | 645 | |
| The Hershey Co. | | | | | 1,600 | | | | 85 | |
| The Pepsi Bottling Group, Inc. | | | | | 926 | | | | 29 | |
| Tyson Foods, Inc., Class A | | | | | 1,700 | | | | 25 | |
| UST, Inc. | | | | | 1,100 | | | | 59 | |
| Wm. Wrigley Jr. Co. | | | | | 1,500 | | | | 78 | |
| | | | | | | | | | 3,993 | |
Health Care Equipment & Services 0.6% |
| Aetna, Inc. | | | | | 4,136 | | | | 170 | |
| AmerisourceBergen Corp. | | | | | 1,400 | | | | 66 | |
| Bausch & Lomb, Inc. | | | | | 400 | | | | 21 | |
| Baxter International, Inc. | | | | | 3,800 | | | | 175 | |
| Becton Dickinson & Co. | | | | | 1,800 | | | | 126 | |
| Biomet, Inc. | | | | | 1,575 | | | | 60 | |
| Boston Scientific Corp. * | | | | | 7,307 | | | | 116 | |
| C.R. Bard, Inc. | | | | | 600 | | | | 49 | |
| Cardinal Health, Inc. | | | | | 2,775 | | | | 182 | |
| Caremark Rx, Inc. | | | | | 2,988 | | | | 147 | |
| CIGNA Corp. | | | | | 1,000 | | | | 117 | |
| Coventry Health Care, Inc. * | | | | | 1,050 | | | | 49 | |
| Express Scripts, Inc. * | | | | | 1,000 | | | | 64 | |
| HCA, Inc. * | | | | | 2,208 | | | | 111 | |
| Health Management Associates, Inc., Class A | | | | | 1,600 | | | | 31 | |
| Hospira, Inc. * | | | | | 1,020 | | | | 37 | |
| Humana, Inc. * | | | | | 800 | | | | 48 | |
| IMS Health, Inc. | | | | | 1,500 | | | | 42 | |
| Laboratory Corp. of America Holdings * | | | | | 900 | | | | 62 | |
| Manor Care, Inc. | | | | | 500 | | | | 24 | |
| McKesson Corp. | | | | | 1,773 | | | | 89 | |
| Medco Health Solutions, Inc. * | | | | | 1,784 | | | | 95 | |
| Medtronic, Inc. | | | | | 7,800 | | | | 380 | |
| Patterson Cos., Inc. * | | | | | 900 | | | | 30 | |
| Quest Diagnostics, Inc. | | | | | 1,470 | | | | 73 | |
| St. Jude Medical, Inc. * | | | | | 2,120 | | | | 73 | |
| Stryker Corp. | | | | | 1,946 | | | | 102 | |
| Tenet Healthcare Corp. * | | | | | 3,150 | | | | 22 | |
| UnitedHealth Group, Inc. | | | | | 8,400 | | | | 410 | |
| WellPoint, Inc. * | | | | | 3,852 | | | | 294 | |
| Zimmer Holdings, Inc. * | | | | | 1,500 | | | | 108 | |
| | | | | | | | | | 3,373 | |
Household & Personal Products 0.4% |
| Alberto-Culver Co., Class B * | | | | | 600 | | | | 31 | |
| Avon Products, Inc. | | | | | 3,000 | | | | 91 | |
| Clorox Co. | | | | | 1,300 | | | | 84 | |
| Colgate-Palmolive Co. | | | | | 3,600 | | | | 230 | |
| Kimberly-Clark Corp. | | | | | 3,380 | | | | 225 | |
| Procter & Gamble Co. | | | | | 21,832 | | | | 1,384 | |
| The Estee Lauder Cos., Inc., Class A | | | | | 700 | | | | 28 | |
| | | | | | | | | | 2,073 | |
Insurance 0.7% |
| ACE Ltd. | | | | | 1,700 | | | | 97 | |
| AFLAC, Inc. | | | | | 3,300 | | | | 148 | |
| Ambac Financial Group, Inc. | | | | | 684 | | | | 57 | |
| American International Group, Inc. | | | | | 17,342 | | | | 1,165 | |
| AON Corp. | | | | | 2,025 | | | | 71 | |
| Cincinnati Financial Corp. | | | | | 1,323 | | | | 60 | |
| Genworth Financial, Inc., Class A | | | | | 2,500 | | | | 84 | |
| Lincoln National Corp. | | | | | 2,243 | | | | 142 | |
| Loews Corp. | | | | | 2,700 | | | | 105 | |
| Marsh & McLennan Cos., Inc. | | | | | 3,600 | | | | 106 | |
| MBIA, Inc. | | | | | 1,050 | | | | 65 | |
| MetLife, Inc. | | | | | 4,986 | | | | 285 | |
| Principal Financial Group, Inc. | | | | | 2,329 | | | | 132 | |
| Prudential Financial, Inc. | | | | | 3,500 | | | | 269 | |
| SAFECO Corp. | | | | | 800 | | | | 47 | |
| The Allstate Corp. | | | | | 4,700 | | | | 288 | |
| The Chubb Corp. | | | | | 2,400 | | | | 128 | |
| The Hartford Financial Services Group, Inc. | | | | | 1,800 | | | | 157 | |
| The Progressive Corp. | | | | | 6,000 | | | | 145 | |
| The St. Paul Travelers Cos., Inc. | | | | | 4,241 | | | | 217 | |
| Torchmark Corp. | | | | | 800 | | | | 49 | |
| UnumProvident Corp. | | | | | 1,657 | | | | 33 | |
| XL Capital Ltd., Class A | | | | | 800 | | | | 56 | |
| | | | | | | | | | 3,906 | |
Materials 0.5% |
| Air Products & Chemicals, Inc. | | | | | 1,500 | | | | 104 | |
| Alcoa, Inc. | | | | | 5,648 | | | | 163 | |
| Allegheny Technologies, Inc. | | | | | 492 | | | | 39 | |
| Ashland, Inc. | | | | | 500 | | | | 30 | |
| Ball Corp. | | | | | 800 | | | | 33 | |
| Bemis Co. | | | | | 600 | | | | 20 | |
| E.I. du Pont de Nemours & Co. | | | | | 6,484 | | | | 297 | |
| Eastman Chemical Co. | | | | | 600 | | | | 37 | |
| Ecolab, Inc. | | | | | 1,200 | | | | 54 | |
| Freeport-McMoRan Copper & Gold, Inc., Class B | | | | | 1,100 | | | | 66 | |
| Hercules, Inc. * | | | | | 700 | | | | 13 | |
See financial notes. 33
Schwab MarketTrack Balanced Portfolio
Portfolio Holdings continued
Security
| | | | Number
of Shares | | Value
($ x 1,000) |
|---|
| International Flavors & Fragrances, Inc. | | | | | 800 | | | | 34 | |
| International Paper Co. | | | | | 3,166 | | | | 106 | |
| Louisiana-Pacific Corp. | | | | | 700 | | | | 14 | |
| MeadWestvaco Corp. | | | | | 1,279 | | | | 35 | |
| Monsanto Co. | | | | | 3,454 | | | | 153 | |
| Newmont Mining Corp. | | | | | 2,754 | | | | 125 | |
| Nucor Corp. | | | | | 2,400 | | | | 140 | |
| Pactiv Corp. * | | | | | 1,000 | | | | 31 | |
| Phelps Dodge Corp. | | | | | 1,080 | | | | 108 | |
| PPG Industries, Inc. | | | | | 1,200 | | | | 82 | |
| Praxair, Inc. | | | | | 2,000 | | | | 120 | |
| Rohm & Haas Co. | | | | | 1,421 | | | | 74 | |
| Sealed Air Corp. | | | | | 621 | | | | 37 | |
| Sigma-Aldrich Corp. | | | | | 500 | | | | 38 | |
| Temple-Inland, Inc. | | | | | 800 | | | | 32 | |
| The Dow Chemical Co. | | | | | 6,049 | | | | 247 | |
| United States Steel Corp. | | | | | 700 | | | | 47 | |
| Vulcan Materials Co. | | | | | 700 | | | | 57 | |
| Weyerhaeuser Co. | | | | | 1,400 | | | | 89 | |
| | | | | | | | | | 2,425 | |
Media 0.6% |
| CBS Corp., Class B | | | | | 5,309 | | | | 154 | |
| Clear Channel Communications, Inc. | | | | | 4,080 | | | | 142 | |
| Comcast Corp., Class A * | | | | | 14,661 | | | | 596 | |
| Dow Jones & Co., Inc. | | | | | 600 | | | | 21 | |
| Gannett Co., Inc. | | | | | 1,700 | | | | 100 | |
| Meredith Corp. | | | | | 300 | | | | 16 | |
| News Corp., Class A | | | | | 16,300 | | | | 340 | |
| Omnicom Group, Inc. | | | | | 1,200 | | | | 122 | |
| The E.W. Scripps Co., Class A | | | | | 600 | | | | 30 | |
| The Interpublic Group of Cos., Inc. * | | | | | 2,500 | | | | 27 | |
| The McGraw-Hill Cos., Inc. | | | | | 2,400 | | | | 154 | |
| The New York Times Co., Class A | | | | | 1,100 | | | | 26 | |
| The Walt Disney Co. | | | | | 13,217 | | | | 416 | |
| Time Warner, Inc. | | | | | 27,870 | | | | 558 | |
| Tribune Co. | | | | | 2,100 | | | | 70 | |
| Univision Communications, Inc., Class A * | | | | | 2,048 | | | | 72 | |
| Viacom, Inc., Class B * | | | | | 5,309 | | | | 206 | |
| | | | | | | | | | 3,050 | |
Pharmaceuticals & Biotechnology 1.3% |
| Abbott Laboratories | | | | | 10,200 | | | | 485 | |
| Allergan, Inc. | | | | | 900 | | | | 104 | |
| Amgen, Inc. * | | | | | 8,340 | | | | 633 | |
| Applera Corp.-Applied Biosystems Group | | | | | 1,400 | | | | 52 | |
| Barr Pharmaceuticals, Inc. * | | | | | 600 | | | | 31 | |
| Biogen Idec, Inc. * | | | | | 2,150 | | | | 102 | |
| Bristol-Myers Squibb Co. | | | | | 12,800 | | | | 317 | |
| Eli Lilly & Co. | | | | | 7,400 | | | | 415 | |
| Fisher Scientific International, Inc. * | | | | | 720 | | | | 62 | |
| Forest Laboratories, Inc. * | | | | | 2,400 | | | | 117 | |
| Genzyme Corp. * | | | | | 1,700 | | | | 115 | |
| Gilead Sciences, Inc. * | | | | | 2,980 | | | | 205 | |
| Johnson & Johnson | | | | | 19,872 | | | | 1,339 | |
| King Pharmaceuticals, Inc. * | | | | | 1,388 | | | | 23 | |
| MedImmune, Inc. * | | | | | 1,400 | | | | 45 | |
| Merck & Co., Inc. | | | | | 14,500 | | | | 659 | |
| Millipore Corp. * | | | | | 200 | | | | 13 | |
| Mylan Laboratories, Inc. | | | | | 1,700 | | | | 35 | |
| PerkinElmer, Inc. | | | | | 600 | | | | 13 | |
| Pfizer, Inc. | | | | | 49,386 | | | | 1,316 | |
| Schering-Plough Corp. | | | | | 9,500 | | | | 210 | |
| Thermo Electron Corp. * | | | | | 900 | | | | 39 | |
| Waters Corp. * | | | | | 900 | | | | 45 | |
| Watson Pharmaceuticals, Inc. * | | | | | 600 | | | | 16 | |
| Wyeth | | | | | 8,800 | | | | 449 | |
| | | | | | | | | | 6,840 | |
Real Estate 0.2% |
| Apartment Investment & Management Co., Class A | | | | | 600 | | | | 34 | |
| Archstone-Smith Trust | | | | | 1,300 | | | | 78 | |
| Boston Properties, Inc. | | | | | 500 | | | | 54 | |
| Equity Office Properties Trust | | | | | 2,600 | | | | 111 | |
| Equity Residential | | | | | 1,700 | | | | 93 | |
| Kimco Realty Corp. | | | | | 301 | | | | 13 | |
| Plum Creek Timber Co., Inc. | | | | | 1,200 | | | | 43 | |
| ProLogis | | | | | 1,200 | | | | 76 | |
| Public Storage, Inc. | | | | | 600 | | | | 54 | |
| Realogy Corp. * | | | | | 1,603 | | | | 41 | |
| Simon Property Group, Inc. | | | | | 1,450 | | | | 141 | |
| Vornado Realty Trust | | | | | 800 | | | | 95 | |
| | | | | | | | | | 833 | |
Retailing 0.6% |
| Amazon.com, Inc. * | | | | | 2,000 | | | | 76 | |
| AutoNation, Inc. * | | | | | 2,000 | | | | 40 | |
| AutoZone, Inc. * | | | | | 500 | | | | 56 | |
| Bed Bath & Beyond, Inc. * | | | | | 1,800 | | | | 73 | |
| Best Buy Co., Inc. | | | | | 3,150 | | | | 174 | |
| Big Lots, Inc. * | | | | | 700 | | | | 15 | |
| Circuit City Stores, Inc. | | | | | 1,400 | | | | 38 | |
| Dillard’s, Inc., Class A | | | | | 700 | | | | 21 | |
| Dollar General Corp. | | | | | 2,202 | | | | 31 | |
| eBay, Inc. * | | | | | 7,416 | | | | 238 | |
| Family Dollar Stores, Inc. | | | | | 1,100 | | | | 32 | |
| Federated Department Stores, Inc. | | | | | 3,508 | | | | 154 | |
| Genuine Parts Co. | | | | | 1,150 | | | | 52 | |
| Home Depot, Inc. | | | | | 14,600 | | | | 545 | |
| J.C. Penney Co., Inc. | | | | | 1,700 | | | | 128 | |
| Kohl’s Corp. * | | | | | 2,200 | | | | 155 | |
| Limited Brands, Inc. | | | | | 2,991 | | | | 88 | |
| Lowe’s Cos., Inc. | | | | | 10,000 | | | | 302 | |
| Nordstrom, Inc. | | | | | 1,800 | | | | 85 | |
| Office Depot, Inc. * | | | | | 2,500 | | | | 105 | |
| OfficeMax, Inc. | | | | | 600 | | | | 29 | |
| RadioShack Corp. | | | | | 1,300 | | | | 23 | |
| Sears Holdings Corp. * | | | | | 673 | | | | 118 | |
| Staples, Inc. | | | | | 4,575 | | | | 118 | |
| Target Corp. | | | | | 5,800 | | | | 343 | |
| The Gap, Inc. | | | | | 3,862 | | | | 81 | |
| The Sherwin-Williams Co. | | | | | 1,100 | | | | 65 | |
34 See financial notes.
Schwab MarketTrack Balanced Portfolio
Portfolio Holdings continued
Security
| | | | Number
of Shares | | Value
($ x 1,000) |
|---|
| The TJX Cos., Inc. | | | | | 3,600 | | | | 104 | |
| Tiffany & Co. | | | | | 950 | | | | 34 | |
| | | | | | | | | | 3,323 | |
Semiconductors & Semiconductor Equipment 0.4% |
| Advanced Micro Devices, Inc. * | | | | | 2,040 | | | | 43 | |
| Altera Corp. * | | | | | 2,546 | | | | 47 | |
| Analog Devices, Inc. | | | | | 2,300 | | | | 73 | |
| Applied Materials, Inc. | | | | | 10,900 | | | | 190 | |
| Broadcom Corp., Class A * | | | | | 3,000 | | | | 91 | |
| Freescale Semiconductor, Inc., Class B * | | | | | 2,650 | | | | 104 | |
| Intel Corp. | | | | | 40,660 | | | | 868 | |
| KLA-Tencor Corp. | | | | | 1,200 | | | | 59 | |
| Linear Technology Corp. | | | | | 2,000 | | | | 62 | |
| LSI Logic Corp. * | | | | | 2,000 | | | | 20 | |
| Maxim Integrated Products, Inc. | | | | | 2,100 | | | | 63 | |
| Micron Technology, Inc. * | | | | | 3,600 | | | | 52 | |
| National Semiconductor Corp. | | | | | 2,200 | | | | 54 | |
| Novellus Systems, Inc. * | | | | | 900 | | | | 25 | |
| NVIDIA Corp. * | | | | | 1,800 | | | | 63 | |
| PMC — Sierra, Inc. * | | | | | 1,100 | | | | 7 | |
| Teradyne, Inc. * | | | | | 1,100 | | | | 15 | |
| Texas Instruments, Inc. | | | | | 11,300 | | | | 341 | |
| Xilinx, Inc. | | | | | 2,100 | | | | 54 | |
| | | | | | | | | | 2,231 | |
Software & Services 0.9% |
| Adobe Systems, Inc. * | | | | | 3,200 | | | | 122 | |
| Affiliated Computer Services, Inc., Class A * | | | | | 465 | | | | 25 | |
| Autodesk, Inc. * | | | | | 1,600 | | | | 59 | |
| Automatic Data Processing, Inc. | | | | | 3,900 | | | | 193 | |
| BMC Software, Inc. * | | | | | 1,600 | | | | 49 | |
| CA, Inc. | | | | | 3,825 | | | | 95 | |
| Citrix Systems, Inc. * | | | | | 1,200 | | | | 35 | |
| Computer Sciences Corp. * | | | | | 1,090 | | | | 58 | |
| Compuware Corp. * | | | | | 2,400 | | | | 19 | |
| Convergys Corp. * | | | | | 869 | | | | 18 | |
| Electronic Arts, Inc. * | | | | | 1,792 | | | | 95 | |
| Electronic Data Systems Corp. | | | | | 3,100 | | | | 79 | |
| First Data Corp. | | | | | 5,704 | | | | 138 | |
| Fiserv, Inc. * | | | | | 1,200 | | | | 59 | |
| Google, Inc., Class A * | | | | | 1,400 | | | | 667 | |
| Intuit, Inc. * | | | | | 2,654 | | | | 94 | |
| Microsoft Corp. | | | | | 58,390 | | | | 1,676 | |
| Novell, Inc. * | | | | | 2,200 | | | | 13 | |
| Oracle Corp. * | | | | | 25,721 | | | | 475 | |
| Parametric Technology Corp. * | | | | | 720 | | | | 14 | |
| Paychex, Inc. | | | | | 2,475 | | | | 98 | |
| Sabre Holdings Corp., Class A | | | | | 922 | | | | 23 | |
| Symantec Corp. * | | | | | 8,018 | | | | 159 | |
| Unisys Corp. * | | | | | 2,100 | | | | 14 | |
| VeriSign, Inc. * | | | | | 1,600 | | | | 33 | |
| Western Union Co. * | | | | | 5,704 | | | | 126 | |
| Yahoo! Inc. * | | | | | 8,400 | | | | 221 | |
| | | | | | | | | | 4,657 | |
Technology Hardware & Equipment 1.0% |
| ADC Telecommunications, Inc. * | | | | | 714 | | | | 10 | |
| Agilent Technologies, Inc. * | | | | | 2,917 | | | | 104 | |
| Apple Computer, Inc. * | | | | | 5,430 | | | | 440 | |
| Avaya, Inc. * | | | | | 2,775 | | | | 36 | |
| Ciena Corp. * | | | | | 300 | | | | 7 | |
| Cisco Systems, Inc. * | | | | | 42,100 | | | | 1,016 | |
| Comverse Technology, Inc. * | | | | | 1,000 | | | | 22 | |
| Corning, Inc. * | | | | | 9,550 | | | | 195 | |
| Dell, Inc. * | | | | | 16,500 | | | | 401 | |
| EMC Corp. * | | | | | 15,562 | | | | 191 | |
| Hewlett-Packard Co. | | | | | 18,324 | | | | 710 | |
| International Business Machines Corp. | | | | | 10,200 | | | | 942 | |
| Jabil Circuit, Inc. | | | | | 1,341 | | | | 39 | |
| JDS Uniphase Corp. * | | | | | 1,058 | | | | 15 | |
| Juniper Networks, Inc. * | | | | | 3,000 | | | | 52 | |
| Lexmark International, Inc., Class A * | | | | | 800 | | | | 51 | |
| Lucent Technologies, Inc. * | | | | | 26,905 | | | | 65 | |
| Molex, Inc. | | | | | 1,250 | | | | 44 | |
| Motorola, Inc. | | | | | 16,150 | | | | 372 | |
| NCR Corp. * | | | | | 1,200 | | | | 50 | |
| Network Appliance, Inc. * | | | | | 2,000 | | | | 73 | |
| QLogic Corp. * | | | | | 1,170 | | | | 24 | |
| QUALCOMM, Inc. | | | | | 10,760 | | | | 392 | |
| SanDisk Corp. * | | | | | 1,200 | | | | 58 | |
| Sanmina — SCI Corp. * | | | | | 3,400 | | | | 13 | |
| Solectron Corp. * | | | | | 5,300 | | | | 18 | |
| Sun Microsystems, Inc. * | | | | | 20,800 | | | | 113 | |
| Symbol Technologies, Inc. | | | | | 1,366 | | | | 20 | |
| Tektronix, Inc. | | | | | 500 | | | | 15 | |
| Tellabs, Inc. * | | | | | 2,700 | | | | 28 | |
| Xerox Corp. * | | | | | 5,200 | | | | 88 | |
| | | | | | | | | | 5,604 | |
Telecommunication Services 0.5% |
| Alltel Corp. | | | | | 2,510 | | | | 134 | |
| AT&T Corp. | | | | | 25,639 | | | | 878 | |
| BellSouth Corp. | | | | | 11,900 | | | | 537 | |
| CenturyTel, Inc. | | | | | 900 | | | | 36 | |
| Citizens Communications Co. | | | | | 1,732 | | | | 25 | |
| Embarq Corp. | | | | | 943 | | | | 45 | |
| Qwest Communications International, Inc. * | | | | | 10,622 | | | | 92 | |
| Sprint Nextel Corp. | | | | | 18,876 | | | | 353 | |
| Verizon Communications, Inc. | | | | | 17,836 | | | | 660 | |
| Windstream Corp. | | | | | 2,595 | | | | 36 | |
| | | | | | | | | | 2,796 | |
Transportation 0.3% |
| Burlington Northern Santa Fe Corp. | | | | | 2,500 | | | | 194 | |
| CSX Corp. | | | | | 3,000 | | | | 107 | |
| Delta Air Lines, Inc. * | | | | | 900 | | | | 1 | |
| FedEx Corp. | | | | | 1,960 | | | | 225 | |
| Norfolk Southern Corp. | | | | | 2,500 | | | | 131 | |
| Ryder System, Inc. | | | | | 400 | | | | 21 | |
| Southwest Airlines Co. | | | | | 5,137 | | | | 77 | |
See financial notes. 35
Schwab MarketTrack Balanced Portfolio
Portfolio Holdings continued
Security
| | | | Number
of Shares | | Value
($ x 1,000) |
|---|
| Union Pacific Corp. | | | | | 1,700 | | | | 154 | |
| United Parcel Service, Inc., Class B | | | | | 7,385 | | | | 557 | |
| | | | | | | | | | 1,467 | |
Utilities 0.5% |
| Allegheny Energy, Inc. * | | | | | 720 | | | | 31 | |
| Ameren Corp. | | | | | 1,200 | | | | 65 | |
| American Electric Power Co., Inc. | | | | | 2,580 | | | | 107 | |
| CenterPoint Energy, Inc. | | | | | 1,924 | | | | 30 | |
| CMS Energy Corp. * | | | | | 700 | | | | 10 | |
| Consolidated Edison, Inc. | | | | | 1,500 | | | | 73 | |
| Constellation Energy Group, Inc. | | | | | 1,000 | | | | 62 | |
| Dominion Resources, Inc. | | | | | 2,167 | | | | 175 | |
| DTE Energy Co. | | | | | 1,000 | | | | 45 | |
| Duke Energy Corp. | | | | | 7,512 | | | | 238 | |
| Dynegy, Inc., Class A * | | | | | 2,100 | | | | 13 | |
| Edison International | | | | | 2,200 | | | | 98 | |
| Entergy Corp. | | | | | 1,500 | | | | 129 | |
| Exelon Corp. | | | | | 4,324 | | | | 268 | |
| FirstEnergy Corp. | | | | | 2,030 | | | | 119 | |
| FPL Group, Inc. | | | | | 2,600 | | | | 133 | |
| KeySpan Corp. | | | | | 900 | | | | 36 | |
| Nicor, Inc. | | | | | 300 | | | | 14 | |
| NiSource, Inc. | | | | | 1,651 | | | | 38 | |
| Peoples Energy Corp. | | | | | 200 | | | | 9 | |
| PG&E Corp. | | | | | 2,700 | | | | 116 | |
| Pinnacle West Capital Corp. | | | | | 600 | | | | 29 | |
| PPL Corp. | | | | | 2,000 | | | | 69 | |
| Progress Energy, Inc. | | | | | 1,593 | | | | 73 | |
| Public Service Enterprise Group, Inc. | | | | | 1,500 | | | | 92 | |
| Sempra Energy | | | | | 1,360 | | | | 72 | |
| TECO Energy, Inc. | | | | | 900 | | | | 15 | |
| The AES Corp. * | | | | | 3,200 | | | | 70 | |
| The Southern Co. | | | | | 4,500 | | | | 164 | |
| TXU Corp. | | | | | 3,164 | | | | 200 | |
| Xcel Energy, Inc. | | | | | 2,585 | | | | 57 | |
| | | | | | | | | | 2,650 | |
Other Investment Companies 84.3% of net assets |
Schwab Institutional Select S&P 500 Fund (a) | | | | | 7,662,656 | | | | 84,213 | |
Schwab International Index Fund, Select Shares (a) | | | | | 3,778,134 | | | | 79,870 | |
Schwab Small-Cap Index Fund, Select Shares (a) | | | | | 3,035,569 | | | | 78,834 | |
Schwab Total Bond Market Fund (a) | | | | | 18,719,868 | | | | 184,016 | |
Schwab Value Advantage Money Fund, Institutional Shares (a) | | | | | 23,250,213 | | | | 23,250 | |
| | | | | | | | | | 450,183 | |
Security
Rate, Maturity Date
| | | | Face Amount
($ x 1,000) | | |
|---|
Short-Term Investment 0.2% of net assets |
Wells Fargo, Grand Cayman
Time Deposit
4.71%, 11/01/06 | | | | | 960 | | | | 960 | |
At 10/31/06 the tax basis cost of the fund’s investments was $420,098, and the unrealized appreciation and depreciation were $118,917 and ($5,075), respectively, with net unrealized appreciation of $113,842.
| * | | Non-income producing security. |
(a) | | Issuer is affiliated with the fund’s adviser. |
36 See financial notes.
Schwab MarketTrack Balanced Portfolio
Statement of
Assets and Liabilities
As of October 31, 2006. All numbers x 1,000 except NAV.
Assets |
| Investments in affiliated underlying funds, at value (cost $368,594) | | | | $ | 450,183 | |
| Investments, in unaffiliated issuers at value (cost $48,582) | | | | + | 83,757 | |
| Total investments, at value (cost $417,176) | | | | | 533,940 | |
Receivables:
| | | | | | |
| Fund shares sold | | | | | 556 | |
| Dividends | | | | | 863 | |
| Prepaid expenses | | | | + | 4 | |
Total assets | | | | | 535,363 | |
| |
Liabilities |
Payables:
| | | | | | |
| Investments bought | | | | | 745 | |
| Investment adviser and administrator fees | | | | | 10 | |
| Transfer agent and shareholder service fees | | | | | 11 | |
| Fund shares redeemed | | | | | 423 | |
| Trustee fees | | | | | 1 | |
| Accrued expenses | | | | + | 78 | |
Total liabilities | | | | | 1,268 | |
| |
Net Assets |
Total assets | | | | | 535,363 | |
Total liabilities | | | | | –1,268 | |
Net assets | | | | $ | 534,095 | |
| | | | | | | |
Net Assets by Source | | | | | | |
| Capital received from investors | | | | | 404,200 | |
| Net investment income not yet distributed | | | | | 7,026 | |
| Net realized capital gains | | | | | 6,105 | |
| Net unrealized capital gains | | | | | 116,764 | |
| |
Net Asset Value (NAV) | | | | | | |
Net Assets
| | | | ÷ | | Shares
Outstanding | | = | | NAV |
|---|
| $534,095 | | | | | | | | 31,346 | | | | | | $ | 17.04 | |
See financial notes. 37
Schwab MarketTrack Balanced Portfolio
Statement of
Operations
For November 1, 2005 through October 31, 2006. All numbers x 1,000.
Investment Income |
| Dividends received from unaffiliated underlying funds | | | | $ | 13,641 | |
| Dividends, including $1 from affiliated issuer | | | | | 1,143 | |
| Interest | | | | + | 86 | |
Total Investment Income | | | | | 14,870 | |
| |
Net Realized Gains and Losses |
| Net realized gains on sales of affiliated underlying funds | | | | | 8,216 | |
| Net realized gains received from affiliated underlying funds | | | | | 1,008 | |
| Net realized gains on unaffiliated investments | | | | + | 33 | |
Net realized gains | | | | | 9,257 | |
| |
Net Unrealized Gains and Losses |
| Net unrealized gains on affiliated underlying funds | | | | | 31,859 | |
| Net unrealized gains on unaffiliated investments | | | | + | 10,341 | |
Net unrealized gains | | | | | 42,200 | |
| |
Expenses |
| Investment adviser and administrator fees | | | | | 2,282 | |
| Transfer agent and shareholder service fees | | | | | 1,303 | |
| Shareholder reports | | | | | 53 | |
| Portfolio accounting fees | | | | | 37 | |
| Registration fees | | | | | 33 | |
| Professional fees | | | | | 33 | |
| Custodian fees | | | | | 19 | |
| Trustees’ fees | | | | | 9 | |
| Overdraft expense | | | | | 1 | |
| Other expenses | | | | + | 14 | |
| Total expenses | | | | | 3,784 | |
| Expense reduction by adviser and Schwab | | | | | –1,178 | |
Net expenses | | | | | 2,606 | |
| |
Increase in Net Assets from Operations |
Total investment income | | | | | 14,870 | |
Net expenses | | | | | –2,606 | |
Net investment income | | | | | 12,264 | |
Net realized gains | | | | | 9,257 | |
Net unrealized gains | | | | + | 42,200 | |
Increase in net assets from operations | | | | $ | 63,721 | |
38 See financial notes.
Schwab MarketTrack Balanced Portfolio
Statement of
Changes in Net Assets
For the current and prior report periods. All numbers x 1,000.
| | | | 11/1/05—10/31/06 | | 11/1/04—10/31/05 |
|---|
| Net investment income | | | | $ | 12,264 | | | $ | 11,810 | |
| Net realized gains | | | | | 9,257 | | | | 17,247 | |
| Net unrealized gains | | | | + | 42,200 | | | | 10,119 | |
Increase in net assets from operations | | | | | 63,721 | | | | 39,176 | |
| |
Distributions Paid |
| Dividends from net investment income | | | | | 11,244 | | | | 10,162 | |
| Distributions from net realized gains | | | | + | 1,491 | | | | — | |
Total distributions | | | | $ | 12,735 | | | $ | 10,162 | |
Transactions in Fund Shares | | | | | | | | | | | | | | |
| | | | 11/1/05—10/31/06 | | 11/1/04—10/31/05 | |
|---|
| | | | SHARES | | VALUE | | SHARES | | VALUE |
|---|
| Shares sold | | | | | 3,966 | | | $ | 64,139 | | | | 5,057 | | | $ | 76,535 | |
| Shares reinvested | | | | | 779 | | | | 12,213 | | | | 651 | | | | 9,764 | |
| Shares redeemed | | | | + | (6,981 | ) | | | (112,331 | ) | | | (9,036 | ) | | | (137,415 | ) |
Net transactions in fund shares | | | | | (2,236 | ) | | $ | (35,979 | ) | | | (3,328 | ) | | $ | (51,116 | ) |
Shares Outstanding and Net Assets | | | | | | | | | | | | | | |
| | | | 11/1/05—10/31/06 | | 11/1/04—10/31/05 | |
|---|
| | | | SHARES | | NET ASSETS | | SHARES | | NET ASSETS |
|---|
| Beginning of period | | | | | 33,582 | | | $ | 519,088 | | | | 36,910 | | | $ | 541,190 | |
| Total increase or decrease | | | | + | (2,236 | ) | | | 15,007 | | | | (3,328 | ) | | | (22,102 | ) |
End of period | | | | | 31,346 | | | $ | 534,095 | | | | 33,582 | | | $ | 519,088 | |
Net investment income not yet distributed | | | | | | | | $ | 7,026 | | | | | | | $ | 5,501 | |
See financial notes. 39
Schwab MarketTrack Conservative Portfolio™
Financial Statements
Financial Highlights
| Investor Shares | | | | 11/1/05—
10/31/06 | | 11/1/04—
10/31/05 | | 11/1/03—
10/31/04 | | 11/1/02—
10/31/03 | | 11/1/01—
10/31/02 |
|---|
Per-Share Data ($) | | | | | | | | | | | | | | | | | | | | | | |
| Net asset value at beginning of period | | | | | 13.42 | | | | 13.09 | | | | 12.53 | | | | 11.37 | | | | 12.22 | |
| Income or loss from investment operations: | | | | | | | | | | | | | | | | | | | | | | |
| Net investment income | | | | | 0.42 | | | | 0.36 | | | | 0.34 | | | | 0.29 | | | | 0.40 | |
| Net realized and unrealized gains or losses | | | | | 0.92 | | | | 0.32 | | | | 0.57 | | | | 1.16 | | | | (0.78 | ) |
| Total income or loss from investment operations | | | | | 1.34 | | | | 0.68 | | | | 0.91 | | | | 1.45 | | | | (0.38 | ) |
| Less distributions: | | | | | | | | | | | | | | | | | | | | | | |
| Dividends from net investment income | | | | | (0.42 | ) | | | (0.35 | ) | | | (0.35 | ) | | | (0.29 | ) | | | (0.41 | ) |
| Distributions from net realized gains | | | | | (0.01 | ) | | | — | | | | — | | | | — | | | | (0.06 | ) |
| Total distributions | | | | | (0.43 | ) | | | (0.35 | ) | | | (0.35 | ) | | | (0.29 | ) | | | (0.47 | ) |
| Net asset value at end of period | | | | | 14.33 | | | | 13.42 | | | | 13.09 | | | | 12.53 | | | | 11.37 | |
| Total return (%) | | | | | 10.13 | | | | 5.24 | | | | 7.38 | | | | 12.98 | | | | (3.29 | ) |
| |
Ratios/Supplemental Data (%) | | | | | | | | | | | | | | | | | | | | | | |
| Ratios to average net assets: | | | | | | | | | | | | | | | | | | | | | | |
Net operating expenses1 | | | | | 0.50 | | | | 0.50 | | | | 0.50 | | | | 0.50 | | | | 0.50 | |
Gross operating expenses1 | | | | | 0.74 | | | | 0.75 | | | | 0.75 | | | | 0.75 | | | | 0.76 | |
| Net investment income | | | | | 3.12 | | | | 2.67 | | | | 2.70 | | | | 2.44 | | | | 3.17 | |
| Portfolio turnover rate | | | | | 11 | | | | 9 | | | | 10 | | | | 17 | | | | 32 | |
| Net assets, end of period ($ x 1,000,000) | | | | | 232 | | | | 300 | | | | 290 | | | | 289 | | | | 263 | |
| | | | | | |
|---|
P Shares
| | | | 4/06/062—
10/31/06 | |
|---|
Per-Share Data ($) |
| Net asset value at beginning of period | | | | | 13.93 | | | | | | | | | | | | | | | | | |
Income from investment operations:
| | | | | | | | | | | | | | | | | | | | | | |
| Net investment income | | | | | 0.23 | | | | | | | | | | | | | | | | | |
| Net realized and unrealized gains | | | | | 0.35 | | | | | | | | | | | | | | | | | |
| Total income or loss from investment operations | | | | | 0.58 | | | | | | | | | | | | | | | | | |
Less distributions:
| | | | | | | | | | | | | | | | | | | | | | |
| Dividends from net investment income | | | | | (0.19 | ) | | | | | | | | | | | | | | | | |
| Net asset value at end of period | | | | | 14.32 | | | | | | | | | | | | | | | | | |
| Total return (%) | | | | | 4.22 | 3 | | | | | | | | | | | | | | | | |
| |
Ratios/Supplemental Data (%) |
Ratios to average net assets:
| | | | | | | | | | | | | | | | | | | | | | |
Net operating expenses1 | | | | | 0.35 | 4 | | | | | | | | | | | | | | | | |
Gross operating expenses1 | | | | | 0.60 | 4 | | | | | | | | | | | | | | | | |
| Net investment income | | | | | 2.81 | 4 | | | | | | | | | | | | | | | | |
| Portfolio turnover rate | | | | | 11 | 3 | | | | | | | | | | | | | | | | |
| Net assets, end of period ($ x 1,000,000) | | | | | 79 | | | | | | | | | | | | | | | | | |
1 | | The expenses incurred by underlying funds in which the portfolio invests are not included in this ratio.
The income received by the portfolio from underlying funds is reduced by those expenses. |
2 | | Commencement of operations. |
40 See financial notes.
Schwab MarketTrack Conservative Portfolio
Portfolio Holdings as of October 31, 2006
This section shows all the securities in the fund’s portfolio and their value as of the report date.
The fund files its complete schedule of portfolio holdings with the SEC for the first and third quarters of each fiscal year on Form N-Q. The fund’s Form N-Q is available on the SEC’s website at http://www.sec.gov and may be viewed and copied at the SEC’s Public Reference Room in Washington, D.C. Call 1-800-SEC-0330 for information on the operation of the Public Reference Room. The schedule of portfolio holdings filed on a fund’s most recent Form N-Q is also available by visiting Schwab’s website at www.schwab.com/schwabfunds.
Holdings by Category
|
| Cost
($ x 1,000)
|
| Value
($ x 1,000)
|
|
|---|
6.2% | | | | Common Stock | | | 12,294 | | | | 19,430 | |
93.4% | | | | Other Investment Companies | | | 249,898 | | | | 290,264 | |
0.4% | | | | Short-Term Investment | | | 1,153 | | | | 1,153 | |
100.0% | | | | Total Investments | | | 263,345 | | | | 310,847 | |
0.0% | | | | Other Assets and Liabilities, Net | | | | | | | (48 | ) |
100.0% | | | | Total Net Assets | | | | | | | 310,799 | |
Security
| | | | Number
of Shares | | Value
($ x 1,000) |
|---|
Common Stock 6.2% of net assets |
Automobiles & Components 0.0% |
| Ford Motor Co. | | | | | 2,921 | | | | 24 | |
| General Motors Corp. | | | | | 825 | | | | 29 | |
| Harley-Davidson, Inc. | | | | | 500 | | | | 34 | |
| Johnson Controls, Inc. | | | | | 300 | | | | 24 | |
| The Goodyear Tire & Rubber Co. * | | | | | 300 | | | | 5 | |
| | | | | | | | | | 116 | |
Banks 0.4% |
| AmSouth Bancorp | | | | | 600 | | | | 18 | |
| BB&T Corp. | | | | | 850 | | | | 37 | |
| Comerica, Inc. | | | | | 300 | | | | 18 | |
| Commerce Bancorp, Inc. | | | | | 200 | | | | 7 | |
| Compass Bancshares, Inc. | | | | | 190 | | | | 11 | |
| Countrywide Financial Corp. | | | | | 798 | | | | 30 | |
| Fannie Mae | | | | | 1,475 | | | | 87 | |
| Fifth Third Bancorp | | | | | 867 | | | | 35 | |
| First Horizon National Corp. | | | | | 200 | | | | 8 | |
| Freddie Mac | | | | | 1,000 | | | | 69 | |
| Huntington Bancshares, Inc. | | | | | 423 | | | | 10 | |
| KeyCorp | | | | | 700 | | | | 26 | |
| M&T Bank Corp. | | | | | 199 | | | | 24 | |
| Marshall & Ilsley Corp. | | | | | 322 | | | | 15 | |
| MGIC Investment Corp. | | | | | 150 | | | | 9 | |
| National City Corp. | | | | | 950 | | | | 35 | |
| North Fork Bancorp, Inc. | | | | | 750 | | | | 21 | |
| PNC Financial Services Group, Inc. | | | | | 400 | | | | 28 | |
| Regions Financial Corp. | | | | | 670 | | | | 25 | |
| Sovereign Bancorp, Inc. | | | | | 420 | | | | 10 | |
| SunTrust Banks, Inc. | | | | | 500 | | | | 40 | |
| Synovus Financial Corp. | | | | | 400 | | | | 12 | |
| U.S. Bancorp | | | | | 2,922 | | | | 99 | |
| Wachovia Corp. | | | | | 2,970 | | | | 165 | |
| Washington Mutual, Inc. | | | | | 1,491 | | | | 63 | |
| Wells Fargo & Co. | | | | | 5,120 | | | | 186 | |
| Zions Bancorp | | | | | 100 | | | | 8 | |
| | | | | | | | | | 1,096 | |
Capital Goods 0.5% |
| 3M Co. | | | | | 1,200 | | | | 95 | |
| American Power Conversion Corp. | | | | | 225 | | | | 7 | |
| American Standard Cos., Inc. | | | | | 300 | | | | 13 | |
| Caterpillar, Inc. | | | | | 1,100 | | | | 67 | |
| Cooper Industries Ltd., Class A | | | | | 150 | | | | 13 | |
| Cummins, Inc. | | | | | 100 | | | | 13 | |
| Danaher Corp. | | | | | 500 | | | | 36 | |
| Deere & Co. | | | | | 400 | | | | 34 | |
| Dover Corp. | | | | | 300 | | | | 14 | |
| Eaton Corp. | | | | | 200 | | | | 14 | |
| Emerson Electric Co. * | | | | | 650 | | | | 55 | |
| Fluor Corp. | | | | | 100 | | | | 8 | |
| General Dynamics Corp. | | | | | 600 | | | | 43 | |
| General Electric Co. | | | | | 16,490 | | | | 579 | |
| Goodrich Corp. | | | | | 200 | | | | 9 | |
| Honeywell International, Inc. | | | | | 1,275 | | | | 54 | |
| Illinois Tool Works, Inc. | | | | | 700 | | | | 34 | |
| Ingersoll-Rand Co., Ltd., Class A | | | | | 500 | | | | 18 | |
| ITT Corp. | | | | | 300 | | | | 16 | |
| L-3 Communications Holdings, Inc. | | | | | 200 | | | | 16 | |
| Lockheed Martin Corp. | | | | | 700 | | | | 61 | |
| Masco Corp. | | | | | 700 | | | | 19 | |
| Navistar International Corp. * | | | | | 100 | | | | 3 | |
| Northrop Grumman Corp. | | | | | 514 | | | | 34 | |
| PACCAR, Inc. | | | | | 450 | | | | 27 | |
| Pall Corp. | | | | | 200 | | | | 6 | |
| Parker Hannifin Corp. | | | | | 150 | | | | 13 | |
| Raytheon Co. | | | | | 600 | | | | 30 | |
| Rockwell Automation, Inc. | | | | | 300 | | | | 19 | |
| Rockwell Collins, Inc. | | | | | 300 | | | | 17 | |
| Textron, Inc. | | | | | 200 | | | | 18 | |
| The Boeing Co. | | | | | 1,246 | | | | 99 | |
| Tyco International Ltd. | | | | | 3,013 | | | | 89 | |
| United Technologies Corp. | | | | | 1,600 | | | | 105 | |
| W.W. Grainger, Inc. | | | | | 100 | | | | 7 | |
| | | | | | | | | | 1,685 | |
Commercial Services & Supplies 0.0% |
| Allied Waste Industries, Inc. * | | | | | 500 | | | | 6 | |
| Avery Dennison Corp. | | | | | 200 | | | | 13 | |
| Cintas Corp. | | | | | 260 | | | | 11 | |
| Equifax, Inc. | | | | | 200 | | | | 7 | |
| Monster Worldwide, Inc. * | | | | | 191 | | | | 8 | |
| Pitney Bowes, Inc. | | | | | 400 | | | | 19 | |
| R.R. Donnelley & Sons Co. | | | | | 300 | | | | 10 | |
| Robert Half International, Inc. | | | | | 300 | | | | 11 | |
| Waste Management, Inc. | | | | | 907 | | | | 34 | |
| | | | | | | | | | 119 | |
See financial notes. 41
Schwab MarketTrack Conservative Portfolio
Portfolio Holdings continued
Security
| | | | Number
of Shares | | Value
($ x 1,000) |
|---|
Consumer Durables & Apparel 0.1% |
| Brunswick Corp. | | | | | 100 | | | | 3 | |
| Centex Corp. | | | | | 200 | | | | 10 | |
| Coach, Inc. * | | | | | 600 | | | | 24 | |
| D.R. Horton, Inc. | | | | | 420 | | | | 10 | |
| Eastman Kodak Co. | | | | | 500 | | | | 12 | |
| Fortune Brands, Inc. | | | | | 200 | | | | 15 | |
| Harman International Industries, Inc. | | | | | 100 | | | | 10 | |
| Hasbro, Inc. | | | | | 325 | | | | 8 | |
| Jones Apparel Group, Inc. | | | | | 200 | | | | 7 | |
| KB Home | | | | | 200 | | | | 9 | |
| Leggett & Platt, Inc. | | | | | 300 | | | | 7 | |
| Lennar Corp., Class A | | | | | 200 | | | | 10 | |
| Liz Claiborne, Inc. | | | | | 200 | | | | 8 | |
| Mattel, Inc. | | | | | 650 | | | | 15 | |
| Newell Rubbermaid, Inc. | | | | | 436 | | | | 13 | |
| Nike, Inc., Class B | | | | | 300 | | | | 28 | |
| Pulte Homes, Inc. | | | | | 400 | | | | 12 | |
| Snap-On, Inc. | | | | | 100 | | | | 5 | |
| The Black & Decker Corp. | | | | | 100 | | | | 8 | |
| The Stanley Works | | | | | 100 | | | | 5 | |
| VF Corp. | | | | | 200 | | | | 15 | |
| Whirlpool Corp. | | | | | 111 | | | | 10 | |
| | | | | | | | | | 244 | |
Consumer Services 0.1% |
| Apollo Group, Inc., Class A * | | | | | 250 | | | | 9 | |
| Carnival Corp. | | | | | 820 | | | | 40 | |
| Darden Restaurants, Inc. | | | | | 300 | | | | 13 | |
| H&R Block, Inc. | | | | | 600 | | | | 13 | |
| Harrah’s Entertainment, Inc. | | | | | 200 | | | | 15 | |
| Hilton Hotels Corp. | | | | | 600 | | | | 17 | |
| International Game Technology | | | | | 556 | | | | 24 | |
| Marriott International, Inc., Class A | | | | | 600 | | | | 25 | |
| McDonald’s Corp. | | | | | 2,000 | | | | 84 | |
| Starbucks Corp. * | | | | | 1,120 | | | | 42 | |
| Starwood Hotels & Resorts Worldwide, Inc. | | | | | 300 | | | | 18 | |
| Wendy’s International, Inc. | | | | | 200 | | | | 7 | |
| Western Union Co. * | | | | | 1,392 | | | | 31 | |
| Wyndham Worldwide Corp. * | | | | | 291 | | | | 9 | |
| YUM! Brands, Inc. | | | | | 480 | | | | 28 | |
| | | | | | | | | | 375 | |
Diversified Financials 0.6% |
| American Express Co. | | | | | 1,820 | | | | 105 | |
| Ameriprise Financial, Inc. | | | | | 364 | | | | 19 | |
| Bank of America Corp. | | | | | 7,142 | | | | 385 | |
| Capital One Financial Corp. | | | | | 450 | | | | 36 | |
| Chicago Mercantile Exchange Holdings, Inc. | | | | | 54 | | | | 27 | |
| CIT Group, Inc. | | | | | 300 | | | | 16 | |
| Citigroup, Inc. | | | | | 7,782 | | | | 390 | |
| E*TRADE Financial Corp. * | | | | | 600 | | | | 14 | |
| Federated Investors, Inc., Class B | | | | | 200 | | | | 7 | |
| Franklin Resources, Inc. | | | | | 200 | | | | 23 | |
| Janus Capital Group, Inc. | | | | | 400 | | | | 8 | |
| JPMorgan Chase & Co. | | | | | 5,352 | | | | 254 | |
| Legg Mason, Inc. | | | | | 190 | | | | 17 | |
| Lehman Brothers Holdings, Inc. | | | | | 800 | | | | 62 | |
| Mellon Financial Corp. | | | | | 700 | | | | 27 | |
| Merrill Lynch & Co., Inc. | | | | | 1,500 | | | | 131 | |
| Moody’s Corp. | | | | | 400 | | | | 26 | |
| Morgan Stanley | | | | | 1,630 | | | | 124 | |
| Northern Trust Corp. | | | | | 300 | | | | 18 | |
| SLM Corp. | | | | | 650 | | | | 32 | |
| State Street Corp. | | | | | 500 | | | | 32 | |
| T. Rowe Price Group, Inc. | | | | | 400 | | | | 19 | |
| The Bank of New York Co., Inc. | | | | | 1,200 | | | | 41 | |
| The Bear Stearns Cos., Inc. | | | | | 145 | | | | 22 | |
| The Charles Schwab Corp. | | | | | 2,125 | | | | 39 | |
| The Goldman Sachs Group, Inc. * | | | | | 728 | | | | 138 | |
| | | | | | | | | | 2,012 | |
Energy 0.6% |
| Anadarko Petroleum Corp. | | | | | 734 | | | | 34 | |
| Apache Corp. | | | | | 462 | | | | 30 | |
| Baker Hughes, Inc. | | | | | 470 | | | | 33 | |
| BJ Services Co. | | | | | 400 | | | | 12 | |
| Chesapeake Energy Corp. | | | | | 500 | | | | 16 | |
| ChevronTexaco Corp. | | | | | 3,520 | | | | 237 | |
| ConocoPhillips | | | | | 2,596 | | | | 156 | |
| CONSOL Energy, Inc. | | | | | 300 | | | | 11 | |
| Devon Energy Corp. | | | | | 700 | | | | 47 | |
| El Paso Corp. | | | | | 769 | | | | 11 | |
| EOG Resources, Inc. | | | | | 360 | | | | 24 | |
| Exxon Mobil Corp. | | | | | 9,518 | | | | 680 | |
| Halliburton Co. | | | | | 1,428 | | | | 46 | |
| Hess Corp. | | | | | 300 | | | | 13 | |
| Kinder Morgan, Inc. | | | | | 176 | | | | 19 | |
| Marathon Oil Corp. | | | | | 523 | | | | 45 | |
| Murphy Oil Corp. | | | | | 300 | | | | 14 | |
| Nabors Industries Ltd. * | | | | | 400 | | | | 12 | |
| National-Oilwell Varco, Inc. * | | | | | 270 | | | | 16 | |
| Noble Corp. | | | | | 200 | | | | 14 | |
| Occidental Petroleum Corp. | | | | | 1,200 | | | | 56 | |
| Rowan Cos., Inc. | | | | | 100 | | | | 3 | |
| Schlumberger Ltd. | | | | | 1,800 | | | | 114 | |
| Smith International, Inc. | | | | | 300 | | | | 12 | |
| Sunoco, Inc. | | | | | 200 | | | | 13 | |
| Transocean, Inc. * | | | | | 474 | | | | 34 | |
| Valero Energy Corp. | | | | | 1,000 | | | | 52 | |
| Weatherford International Ltd. * | | | | | 440 | | | | 18 | |
| Williams Cos., Inc. | | | | | 700 | | | | 17 | |
| XTO Energy, Inc. | | | | | 533 | | | | 25 | |
| | | | | | | | | | 1,814 | |
Food & Staples Retailing 0.1% |
| Costco Wholesale Corp. | | | | | 700 | | | | 37 | |
| CVS Corp. | | | | | 1,200 | | | | 38 | |
| Safeway, Inc. | | | | | 650 | | | | 19 | |
| Supervalu, Inc. | | | | | 318 | | | | 11 | |
| Sysco Corp. | | | | | 1,000 | | | | 35 | |
| The Kroger Co. | | | | | 1,200 | | | | 27 | |
| Wal-Mart Stores, Inc. | | | | | 3,900 | | | | 192 | |
| Walgreen Co. | | | | | 1,600 | | | | 70 | |
42 See financial notes.
Schwab MarketTrack Conservative Portfolio
Portfolio Holdings continued
Security
| | | | Number
of Shares | | Value
($ x 1,000) |
|---|
| Whole Foods Market, Inc. | | | | | 100 | | | | 6 | |
| Winn-Dixie Stores, Inc. * | | | | | 300 | | | | — | |
| | | | | | | | | | 435 | |
Food, Beverage & Tobacco 0.3% |
| Altria Group, Inc. | | | | | 3,220 | | | | 262 | |
| Anheuser-Busch Cos., Inc. | | | | | 1,200 | | | | 57 | |
| Archer-Daniels-Midland Co. | | | | | 1,014 | | | | 39 | |
| Brown-Forman Corp., Class B | | | | | 150 | | | | 11 | |
| Campbell Soup Co. | | | | | 300 | | | | 11 | |
| Coca-Cola Enterprises, Inc. | | | | | 700 | | | | 14 | |
| ConAgra Foods, Inc. | | | | | 800 | | | | 21 | |
| Constellation Brands, Inc., Class A * | | | | | 300 | | | | 8 | |
| Dean Foods Co. * | | | | | 200 | | | | 8 | |
| General Mills, Inc. | | | | | 582 | | | | 33 | |
| H.J. Heinz Co. | | | | | 600 | �� | | | 25 | |
| Kellogg Co. | | | | | 400 | | | | 20 | |
| McCormick & Co., Inc. | | | | | 200 | | | | 8 | |
| Molson Coors Brewing Co., Class B | | | | | 50 | | | | 4 | |
| PepsiCo, Inc. | | | | | 2,560 | | | | 162 | |
| Reynolds American, Inc. | | | | | 274 | | | | 17 | |
| Sara Lee Corp. | | | | | 1,200 | | | | 21 | |
| The Coca-Cola Co. | | | | | 3,220 | | | | 150 | |
| The Hershey Co. | | | | | 400 | | | | 21 | |
| The Pepsi Bottling Group, Inc. | | | | | 350 | | | | 11 | |
| Tyson Foods, Inc., Class A | | | | | 400 | | | | 6 | |
| UST, Inc. | | | | | 300 | | | | 16 | |
| Wm. Wrigley Jr. Co. | | | | | 375 | | | | 20 | |
| | | | | | | | | | 945 | |
Health Care Equipment & Services 0.3% |
| Aetna, Inc. | | | | | 888 | | | | 37 | |
| AmerisourceBergen Corp. | | | | | 400 | | | | 19 | |
| Bausch & Lomb, Inc. | | | | | 100 | | | | 5 | |
| Baxter International, Inc. | | | | | 900 | | | | 41 | |
| Becton Dickinson & Co. | | | | | 400 | | | | 28 | |
| Biomet, Inc. | | | | | 450 | | | | 17 | |
| Boston Scientific Corp. * | | | | | 2,107 | | | | 33 | |
| C.R. Bard, Inc. | | | | | 200 | | | | 16 | |
| Cardinal Health, Inc. | | | | | 650 | | | | 42 | |
| Caremark Rx, Inc. | | | | | 581 | | | | 29 | |
| CIGNA Corp. | | | | | 200 | | | | 23 | |
| Coventry Health Care, Inc. * | | | | | 300 | | | | 14 | |
| Express Scripts, Inc. * | | | | | 200 | | | | 13 | |
| HCA, Inc. | | | | | 600 | | | | 30 | |
| Health Management Associates, Inc., Class A | | | | | 400 | | | | 8 | |
| Hospira, Inc. * | | | | | 240 | | | | 9 | |
| Humana, Inc. * | | | | | 200 | | | | 12 | |
| IMS Health, Inc. | | | | | 350 | | | | 10 | |
| Laboratory Corp. of America Holdings * | | | | | 200 | | | | 14 | |
| Manor Care, Inc. | | | | | 100 | | | | 5 | |
| McKesson Corp. | | | | | 422 | | | | 21 | |
| Medco Health Solutions, Inc. * | | | | | 422 | | | | 23 | |
| Medtronic, Inc. | | | | | 1,800 | | | | 88 | |
| Patterson Cos., Inc. * | | | | | 200 | | | | 7 | |
| Quest Diagnostics, Inc. | | | | | 278 | | | | 14 | |
| St. Jude Medical, Inc. * | | | | | 500 | | | | 17 | |
| Stryker Corp. | | | | | 602 | | | | 31 | |
| Tenet Healthcare Corp. * | | | | | 750 | | | | 5 | |
| UnitedHealth Group, Inc. | | | | | 2,000 | | | | 98 | |
| WellPoint, Inc. * | | | | | 900 | | | | 69 | |
| Zimmer Holdings, Inc. * | | | | | 350 | | | | 25 | |
| | | | | | | | | | 803 | |
Household & Personal Products 0.2% |
| Alberto-Culver Co., Class B | | | | | 150 | | | | 8 | |
| Avon Products, Inc. | | | | | 700 | | | | 21 | |
| Clorox Co. | | | | | 300 | | | | 20 | |
| Colgate-Palmolive Co. | | | | | 800 | | | | 51 | |
| Kimberly-Clark Corp. | | | | | 756 | | | | 50 | |
| Procter & Gamble Co. | | | | | 5,062 | | | | 321 | |
| The Estee Lauder Cos., Inc., Class A | | | | | 100 | | | | 4 | |
| | | | | | | | | | 475 | |
Insurance 0.3% |
| ACE Ltd. | | | | | 400 | | | | 23 | |
| AFLAC, Inc. | | | | | 800 | | | | 36 | |
| Ambac Financial Group, Inc. | | | | | 162 | | | | 14 | |
| American International Group, Inc. | | | | | 3,979 | | | | 267 | |
| AON Corp. | | | | | 475 | | | | 17 | |
| Cincinnati Financial Corp. | | | | | 330 | | | | 15 | |
| Genworth Financial, Inc., Class A | | | | | 300 | | | | 10 | |
| Lincoln National Corp. | | | | | 501 | | | | 32 | |
| Loews Corp. | | | | | 900 | | | | 35 | |
| Marsh & McLennan Cos., Inc. | | | | | 800 | | | | 24 | |
| MBIA, Inc. | | | | | 200 | | | | 12 | |
| MetLife, Inc. | | | | | 1,178 | | | | 67 | |
| Principal Financial Group, Inc. | | | | | 550 | | | | 31 | |
| Prudential Financial, Inc. | | | | | 800 | | | | 62 | |
| SAFECO Corp. | | | | | 200 | | | | 12 | |
| The Allstate Corp. | | | | | 1,100 | | | | 67 | |
| The Chubb Corp. | | | | | 600 | | | | 32 | |
| The Hartford Financial Services Group, Inc. | | | | | 425 | | | | 37 | |
| The Progressive Corp. | | | | | 1,400 | | | | 34 | |
| The St. Paul Travelers Cos., Inc. | | | | | 1,006 | | | | 51 | |
| Torchmark Corp. | | | | | 200 | | | | 12 | |
| UnumProvident Corp. | | | | | 346 | | | | 7 | |
| XL Capital Ltd., Class A | | | | | 200 | | | | 14 | |
| | | | | | | | | | 911 | |
Materials 0.2% |
| Air Products & Chemicals, Inc. | | | | | 300 | | | | 21 | |
| Alcoa, Inc. | | | | | 1,312 | | | | 38 | |
| Allegheny Technologies, Inc. | | | | | 146 | | | | 12 | |
| Ashland, Inc. | | | | | 100 | | | | 6 | |
| Ball Corp. | | | | | 200 | | | | 8 | |
| Bemis Co. | | | | | 200 | | | | 7 | |
| E.I. du Pont de Nemours & Co. | | | | | 1,525 | | | | 70 | |
| Eastman Chemical Co. | | | | | 100 | | | | 6 | |
| Ecolab, Inc. | | | | | 400 | | | | 18 | |
| Freeport-McMoRan Copper & Gold, Inc., Class B | | | | | 300 | | | | 18 | |
| Hercules, Inc. * | | | | | 200 | | | | 4 | |
See financial notes. 43
Schwab MarketTrack Conservative Portfolio
Portfolio Holdings continued
Security
| | | | Number
of Shares | | Value
($ x 1,000) |
|---|
| International Flavors & Fragrances, Inc. | | | | | 200 | | | | 9 | |
| International Paper Co. | | | | | 739 | | | | 25 | |
| Louisiana-Pacific Corp. | | | | | 100 | | | | 2 | |
| MeadWestvaco Corp. | | | | | 294 | | | | 8 | |
| Monsanto Co. | | | | | 664 | | | | 29 | |
| Newmont Mining Corp. | | | | | 643 | | | | 29 | |
| Nucor Corp. | | | | | 400 | | | | 23 | |
| Pactiv Corp. * | | | | | 300 | | | | 9 | |
| Phelps Dodge Corp. | | | | | 270 | | | | 27 | |
| PPG Industries, Inc. | | | | | 250 | | | | 17 | |
| Praxair, Inc. | | | | | 500 | | | | 30 | |
| Rohm & Haas Co. | | | | | 373 | | | | 19 | |
| Sealed Air Corp. | | | | | 153 | | | | 9 | |
| Sigma-Aldrich Corp. | | | | | 100 | | | | 8 | |
| Temple-Inland, Inc. | | | | | 200 | | | | 8 | |
| The Dow Chemical Co. | | | | | 1,372 | | | | 56 | |
| United States Steel Corp. | | | | | 100 | | | | 7 | |
| Vulcan Materials Co. | | | | | 200 | | | | 16 | |
| Weyerhaeuser Co. | | | | | 350 | | | | 22 | |
| | | | | | | | | | 561 | |
Media 0.2% |
| CBS Corp., Class B | | | | | 1,330 | | | | 38 | |
| Clear Channel Communications, Inc. | | | | | 967 | | | | 34 | |
| Comcast Corp., Class A * | | | | | 3,463 | | | | 141 | |
| Dow Jones & Co., Inc. | | | | | 100 | | | | 3 | |
| Gannett Co., Inc. | | | | | 400 | | | | 24 | |
| Meredith Corp. | | | | | 100 | | | | 5 | |
| News Corp., Class A | | | | | 3,880 | | | | 81 | |
| Omnicom Group, Inc. | | | | | 300 | | | | 30 | |
| The E.W. Scripps Co., Class A | | | | | 100 | | | | 5 | |
| The Interpublic Group of Cos., Inc. * | | | | | 600 | | | | 7 | |
| The McGraw-Hill Cos., Inc. | | | | | 600 | | | | 38 | |
| The New York Times Co., Class A | | | | | 200 | | | | 5 | |
| The Walt Disney Co. | | | | | 3,077 | | | | 97 | |
| Time Warner, Inc. | | | | | 6,380 | | | | 128 | |
| Tribune Co. | | | | | 500 | | | | 17 | |
| Univision Communications, Inc., Class A * | | | | | 519 | | | | 18 | |
| Viacom, Inc., Class B * | | | | | 1,330 | | | | 52 | |
| | | | | | | | | | 723 | |
Pharmaceuticals & Biotechnology 0.5% |
| Abbott Laboratories | | | | | 2,400 | | | | 114 | |
| Allergan, Inc. | | | | | 200 | | | | 23 | |
| Amgen, Inc. * | | | | | 1,952 | | | | 148 | |
| Applied Biosystems Group —Applera Corp. | | | | | 300 | | | | 11 | |
| Barr Pharmaceuticals, Inc. * | | | | | 200 | | | | 11 | |
| Biogen Idec, Inc. * | | | | | 480 | | | | 23 | |
| Bristol-Myers Squibb Co. | | | | | 3,000 | | | | 74 | |
| Eli Lilly & Co. | | | | | 1,725 | | | | 97 | |
| Fisher Scientific International, Inc. * | | | | | 163 | | | | 14 | |
| Forest Laboratories, Inc. * | | | | | 550 | | | | 27 | |
| Genzyme Corp. * | | | | | 325 | | | | 22 | |
| Gilead Sciences, Inc. * | | | | | 650 | | | | 45 | |
| Johnson & Johnson | | | | | 4,622 | | | | 312 | |
| King Pharmaceuticals, Inc. * | | | | | 366 | | | | 6 | |
| MedImmune, Inc. * | | | | | 400 | | | | 13 | |
| Merck & Co., Inc. | | | | | 3,400 | | | | 154 | |
| Millipore Corp. * | | | | | 100 | | | | 6 | |
| Mylan Laboratories, Inc. | | | | | 400 | | | | 8 | |
| PerkinElmer, Inc. | | | | | 200 | | | | 4 | |
| Pfizer, Inc. | | | | | 11,557 | | | | 308 | |
| Schering-Plough Corp. | | | | | 2,300 | | | | 51 | |
| Thermo Electron Corp. * | | | | | 200 | | | | 9 | |
| Waters Corp. * | | | | | 200 | | | | 10 | |
| Watson Pharmaceuticals, Inc. * | | | | | 200 | | | | 5 | |
| Wyeth | | | | | 2,000 | | | | 102 | |
| | | | | | | | | | 1,597 | |
Real Estate 0.1% |
| Apartment Investment & Management Co., Class A | | | | | 100 | | | | 6 | |
| Archstone-Smith Trust | | | | | 300 | | | | 18 | |
| Boston Properties, Inc. | | | | | 130 | | | | 14 | |
| Equity Office Properties Trust | | | | | 600 | | | | 26 | |
| Equity Residential | | | | | 400 | | | | 22 | |
| Kimco Realty Corp. | | | | | 168 | | | | 7 | |
| Plum Creek Timber Co., Inc. | | | | | 300 | | | | 11 | |
| ProLogis | | | | | 300 | | | | 19 | |
| Public Storage, Inc. | | | | | 100 | | | | 9 | |
| Realogy Corp. * | | | | | 364 | | | | 9 | |
| Simon Property Group, Inc. | | | | | 300 | | | | 29 | |
| Vornado Realty Trust | | | | | 200 | | | | 24 | |
| | | | | | | | | | 194 | |
Retailing 0.3% |
| Amazon.com, Inc. * | | | | | 300 | | | | 12 | |
| AutoNation, Inc. * | | | | | 500 | | | | 10 | |
| AutoZone, Inc. * | | | | | 150 | | | | 17 | |
| Bed, Bath & Beyond, Inc. * | | | | | 400 | | | | 16 | |
| Best Buy Co., Inc. | | | | | 675 | | | | 37 | |
| Big Lots, Inc. * | | | | | 200 | | | | 4 | |
| Circuit City Stores, Inc. | | | | | 300 | | | | 8 | |
| Dillard’s, Inc., Class A | | | | | 200 | | | | 6 | |
| Dollar General Corp. | | | | | 515 | | | | 7 | |
| eBay, Inc. * | | | | | 1,708 | | | | 55 | |
| Family Dollar Stores, Inc. | | | | | 300 | | | | 9 | |
| Federated Department Stores, Inc. | | | | | 910 | | | | 40 | |
| Genuine Parts Co. | | | | | 250 | | | | 11 | |
| Home Depot, Inc. | | | | | 3,450 | | | | 129 | |
| J.C. Penney Co., Inc. | | | | | 400 | | | | 30 | |
| Kohl’s Corp. * | | | | | 500 | | | | 35 | |
| Limited Brands, Inc. | | | | | 739 | | | | 22 | |
| Lowe’s Cos., Inc. | | | | | 2,400 | | | | 72 | |
| Nordstrom, Inc. | | | | | 400 | | | | 19 | |
| Office Depot, Inc. * | | | | | 600 | | | | 25 | |
| OfficeMax, Inc. | | | | | 100 | | | | 5 | |
| RadioShack Corp. | | | | | 300 | | | | 5 | |
| Sears Holdings Corp. * | | | | | 154 | | | | 27 | |
| Staples, Inc. | | | | | 1,125 | | | | 29 | |
| Target Corp. | | | | | 1,400 | | | | 83 | |
| The Gap, Inc. | | | | | 1,362 | | | | 29 | |
| The Sherwin-Williams Co. | | | | | 200 | | | | 12 | |
44 See financial notes.
Schwab MarketTrack Conservative Portfolio
Portfolio Holdings continued
Security
| | | | Number
of Shares | | Value
($ x 1,000) |
|---|
| The TJX Cos., Inc. | | | | | 800 | | | | 23 | |
| Tiffany & Co. | | | | | 250 | | | | 9 | |
| | | | | | | | | | 786 | |
Semiconductors & Semiconductor Equipment 0.2% |
| Advanced Micro Devices, Inc. * | | | | | 560 | | | | 12 | |
| Altera Corp. * | | | | | 510 | | | | 9 | |
| Analog Devices, Inc. | | | | | 600 | | | | 19 | |
| Applied Materials, Inc. | | | | | 2,600 | | | | 45 | |
| Broadcom Corp., Class A * | | | | | 738 | | | | 22 | |
| Freescale Semiconductor, Inc., Class B * | | | | | 404 | | | | 16 | |
| Intel Corp. | | | | | 9,800 | | | | 209 | |
| KLA-Tencor Corp. | | | | | 300 | | | | 15 | |
| Linear Technology Corp. | | | | | 500 | | | | 16 | |
| LSI Logic Corp. * | | | | | 500 | | | | 5 | |
| Maxim Integrated Products, Inc. | | | | | 500 | | | | 15 | |
| Micron Technology, Inc. * | | | | | 900 | | | | 13 | |
| National Semiconductor Corp. | | | | | 600 | | | | 15 | |
| Novellus Systems, Inc. * | | | | | 250 | | | | 7 | |
| NVIDIA Corp. * | | | | | 400 | | | | 14 | |
| PMC — Sierra, Inc. * | | | | | 300 | | | | 2 | |
| Teradyne, Inc. * | | | | | 300 | | | | 4 | |
| Texas Instruments, Inc. | | | | | 2,700 | | | | 81 | |
| Xilinx, Inc. | | | | | 500 | | | | 13 | |
| | | | | | | | | | 532 | |
Software & Services 0.3% |
| Adobe Systems, Inc. * | | | | | 800 | | | | 30 | |
| Affiliated Computer Services, Inc., Class A * | | | | | 203 | | | | 11 | |
| Autodesk, Inc. * | | | | | 400 | | | | 15 | |
| Automatic Data Processing, Inc. | | | | | 900 | | | | 44 | |
| BMC Software, Inc. * | | | | | 400 | | | | 12 | |
| CA, Inc. | | | | | 850 | | | | 21 | |
| Citrix Systems, Inc. * | | | | | 300 | | | | 9 | |
| Computer Sciences Corp. * | | | | | 258 | | | | 14 | |
| Compuware Corp. * | | | | | 600 | | | | 5 | |
| Convergys Corp. * | | | | | 174 | | | | 4 | |
| Electronic Arts, Inc. * | | | | | 424 | | | | 22 | |
| Electronic Data Systems Corp. | | | | | 700 | | | | 18 | |
| First Data Corp. | | | | | 1,392 | | | | 34 | |
| Fiserv, Inc. * | | | | | 300 | | | | 15 | |
| Google, Inc., Class A * | | | | | 300 | | | | 143 | |
| Intuit, Inc. * | | | | | 626 | | | | 22 | |
| Microsoft Corp. | | | | | 13,620 | | | | 391 | |
| Novell, Inc. * | | | | | 500 | | | | 3 | |
| Oracle Corp. * | | | | | 5,988 | | | | 110 | |
| Parametric Technology Corp. * | | | | | 200 | | | | 4 | |
| Paychex, Inc. | | | | | 525 | | | | 21 | |
| Sabre Holdings Corp., Class A | | | | | 244 | | | | 6 | |
| Symantec Corp. * | | | | | 1,678 | | | | 33 | |
| Unisys Corp. * | | | | | 500 | | | | 3 | |
| VeriSign, Inc. * | | | | | 300 | | | | 6 | |
| Yahoo! Inc. * | | | | | 2,000 | | | | 53 | |
| | | | | | | | | | 1,049 | |
Technology Hardware & Equipment 0.4% |
| ADC Telecommunications, Inc. * | | | | | 142 | | | | 2 | |
| Agilent Technologies, Inc. * | | | | | 710 | | | | 25 | |
| Apple Computer, Inc. * | | | | | 1,200 | | | | 97 | |
| Avaya, Inc. * | | | | | 618 | | | | 8 | |
| Ciena Corp. * | | | | | 71 | | | | 2 | |
| Cisco Systems, Inc. * | | | | | 9,930 | | | | 240 | |
| Comverse Technology, Inc. * | | | | | 300 | | | | 6 | |
| Corning, Inc. * | | | | | 2,250 | | | | 46 | |
| Dell, Inc. * | | | | | 3,850 | | | | 94 | |
| EMC Corp. * | | | | | 3,650 | | | | 45 | |
| Hewlett-Packard Co. | | | | | 4,703 | | | | 182 | |
| International Business Machines Corp. | | | | | 2,500 | | | | 231 | |
| Jabil Circuit, Inc. | | | | | 322 | | | | 9 | |
| JDS Uniphase Corp. * | | | | | 251 | | | | 4 | |
| Juniper Networks, Inc. * | | | | | 600 | | | | 10 | |
| Lexmark International, Inc., Class A * | | | | | 200 | | | | 13 | |
| Lucent Technologies, Inc. * | | | | | 7,019 | | | | 17 | |
| Molex, Inc. | | | | | 250 | | | | 9 | |
| Motorola, Inc. | | | | | 3,666 | | | | 85 | |
| NCR Corp. * | | | | | 400 | | | | 17 | |
| Network Appliance, Inc. * | | | | | 500 | | | | 18 | |
| QLogic Corp. * | | | | | 276 | | | | 6 | |
| QUALCOMM, Inc. | | | | | 2,400 | | | | 87 | |
| SanDisk Corp. * | | | | | 285 | | | | 14 | |
| Sanmina — SCI Corp. * | | | | | 800 | | | | 3 | |
| Solectron Corp. * | | | | | 1,000 | | | | 3 | |
| Sun Microsystems, Inc. * | | | | | 5,000 | | | | 27 | |
| Symbol Technologies, Inc. | | | | | 322 | | | | 5 | |
| Tektronix, Inc. | | | | | 200 | | | | 6 | |
| Tellabs, Inc. * | | | | | 600 | | | | 6 | |
| Xerox Corp. * | | | | | 1,200 | | | | 20 | |
| | | | | | | | | | 1,337 | |
Telecommunication Services 0.2% |
| ALLTEL Corp. | | | | | 500 | | | | 27 | |
| AT&T Corp. | | | | | 5,945 | | | | 203 | |
| BellSouth Corp. | | | | | 2,750 | | | | 124 | |
| CenturyTel, Inc. | | | | | 250 | | | | 10 | |
| Citizens Communications Co. | | | | | 410 | | | | 6 | |
| Embarq Corp. | | | | | 222 | | | | 11 | |
| Qwest Communications International, Inc. * | | | | | 2,524 | | | | 22 | |
| Sprint Nextel Corp. | | | | | 4,454 | | | | 83 | |
| Verizon Communications, Inc. | | | | | 4,188 | | | | 155 | |
| Windstream Corp. | | | | | 516 | | | | 7 | |
| | | | | | | | | | 648 | |
Transportation 0.1% |
| Burlington Northern Santa Fe Corp. | | | | | 600 | | | | 47 | |
| CSX Corp. | | | | | 600 | | | | 21 | |
| Delta Air Lines, Inc. * | | | | | 200 | | | | — | |
| FedEx Corp. | | | | | 460 | | | | 53 | |
| Norfolk Southern Corp. | | | | | 600 | | | | 32 | |
| Ryder System, Inc. | | | | | 100 | | | | 5 | |
| Southwest Airlines Co. | | | | | 1,218 | | | | 18 | |
See financial notes. 45
Schwab MarketTrack Conservative Portfolio
Portfolio Holdings continued
Security
| | | | Number
of Shares | | Value
($ x 1,000) |
|---|
| Union Pacific Corp. | | | | | 400 | | | | 36 | |
| United Parcel Service, Inc., Class B | | | | | 1,712 | | | | 129 | |
| | | | | | | | | | 341 | |
Utilities 0.2% |
| Allegheny Energy, Inc. * | | | | | 170 | | | | 7 | |
| Ameren Corp. | | | | | 300 | | | | 16 | |
| American Electric Power Co., Inc. | | | | | 580 | | | | 24 | |
| CenterPoint Energy, Inc. | | | | | 474 | | | | 7 | |
| CMS Energy Corp. * | | | | | 200 | | | | 3 | |
| Consolidated Edison, Inc. | | | | | 300 | | | | 15 | |
| Constellation Energy Group, Inc. | | | | | 200 | | | | 13 | |
| Dominion Resources, Inc. | | | | | 515 | | | | 42 | |
| DTE Energy Co. | | | | | 200 | | | | 9 | |
| Duke Energy Corp. | | | | | 1,876 | | | | 59 | |
| Dynegy, Inc., Class A * | | | | | 500 | | | | 3 | |
| Edison International | | | | | 500 | | | | 22 | |
| Entergy Corp. | | | | | 350 | | | | 30 | |
| Exelon Corp. | | | | | 1,024 | | | | 63 | |
| FirstEnergy Corp. | | | | | 533 | | | | 31 | |
| FPL Group, Inc. | | | | | 600 | | | | 31 | |
| KeySpan Corp. | | | | | 200 | | | | 8 | |
| Nicor, Inc. | | | | | 100 | | | | 5 | |
| NiSource, Inc. | | | | | 376 | | | | 9 | |
| Peoples Energy Corp. | | | | | 100 | | | | 4 | |
| PG&E Corp. | | | | | 600 | | | | 26 | |
| Pinnacle West Capital Corp. | | | | | 100 | | | | 5 | |
| PPL Corp. | | | | | 600 | | | | 21 | |
| Progress Energy, Inc. | | | | | 354 | | | | 16 | |
| Public Service Enterprise Group, Inc. | | | | | 400 | | | | 24 | |
| Sempra Energy | | | | | 297 | | | | 16 | |
| TECO Energy, Inc. | | | | | 200 | | | | 3 | |
| The AES Corp. * | | | | | 800 | | | | 18 | |
| The Southern Co. | | | | | 1,100 | | | | 40 | |
| TXU Corp. | | | | | 800 | | | | 51 | |
| Xcel Energy, Inc. | | | | | 510 | | | | 11 | |
| | | | | | | | | | 632 | |
Other Investment Companies 93.4% of net assets |
Schwab Institutional Select S&P 500 Fund (a) | | | | | 171,198 | | | | 1,881 | |
Schwab International Index Fund, Select Shares (a) | | | | | 1,474,762 | | | | 31,176 | |
Schwab S&P 500 Index Fund, Select Shares (a) | | | | | 1,980,547 | | | | 42,701 | |
Schwab Small-Cap Index Fund, Select Shares (a) | | | | | 1,197,766 | | | | 31,106 | |
Schwab Total Bond Market Fund (a) | | | | | 17,293,603 | | | | 169,996 | |
Schwab Value Advantage Money Fund, Institutional Shares (a) | | | | | 13,403,662 | | | | 13,404 | |
| | | | | | | | | | 290,264 | |
Security
Rate, Maturity Date
| | | | Face Amount
($ x 1,000) | | |
|---|
Short-Term Investment 0.4% of net assets |
Wells Fargo, Grand Cayman
Time Deposit
4.71%, 11/01/06 | | | | | 1,153 | | | | 1,153 | |
At 10/31/06 the tax basis cost of the fund’s investments was $264,842 and the unrealized appreciation and depreciation were $48,162 and ($2,157), respectively, with net unrealized appreciation of $46,005.
| * | | Non-income producing security. |
(a) | | Issuer is affiliated with the fund’s adviser. |
46 See financial notes.
Schwab MarketTrack Conservative Portfolio
Statement of
Assets and Liabilities
As of October 31, 2006. All numbers x 1,000 except NAV.
Assets | | | | | | |
| Investments in affiliated underlying funds, at value (cost $249,898) | | | | $ | 290,264 | |
| Investments, in unaffiliated issuers at value (cost $13,447) | | | | + | 20,583 | |
| Total investments, at value (cost $263,345) | | | | | 310,847 | |
Receivables:
| | | | | | |
| Fund shares sold | | | | | 215 | |
| Dividends | | | | | 733 | |
| Prepaid expenses | | | | + | 2 | |
Total assets | | | | | 311,797 | |
| |
Liabilities |
Payables:
| | | | | | |
| Investments bought | | | | | 693 | |
| Investment adviser and administrator fees | | | | | 4 | |
| Transfer agent and shareholder service fees | | | | | 5 | |
| Fund shares redeemed | | | | | 237 | |
| Trustee fees | | | | | 1 | |
| Accrued expenses | | | | + | 58 | |
Total liabilities | | | | | 998 | |
| |
Net Assets |
Total assets | | | | | 311,797 | |
Total liabilities | | | | | –998 | |
Net assets | | | | $ | 310,799 | |
| |
Net Assets by Source | | | | | | |
| Capital received from investors | | | | | 259,316 | |
| Net investment income not yet distributed | | | | | 1,190 | |
| Net realized capital gains | | | | | 2,791 | |
| Net unrealized capital gains | | | | | 47,502 | |
| |
Net Asset Value (NAV) by Shares Class | | | | | | |
Share Class
| | | | Net Assets | | ÷ | | Shares
Outstanding | | = | | NAV |
|---|
| Investor Shares | | | | $ | 231,626 | | | | | | | | 16,167 | | | | | | | $ | 14.33 | |
| P Shares | | | | $ | 79,173 | | | | | | | | 5,527 | | | | | | | $ | 14.32 | |
See financial notes. 47
Schwab MarketTrack Conservative Portfolio
Statement of
Operations
For November 1, 2005 through October 31, 2006. All numbers x 1,000.
Investment Income |
| Dividends received from affiliated underlying funds | | | | $ | 10,558 | |
| Dividends received from unaffiliated | | | | | 313 | |
| Interest | | | | + | 92 | |
Total Investment Income | | | | | 10,963 | |
| |
Net Realized Gains and Losses |
| Net realized gains on sales of affiliated underlying funds | | | | | 3,800 | |
| Net realized gains received from affiliated underlying funds | | | | | 657 | |
| Net realized losses on unaffiliated investments | | | | + | (72 | ) |
Net realized gains | | | | | 4,385 | |
| |
Net Unrealized Gains and Losses |
| Net unrealized gains on affiliated underlying funds | | | | | 26,872 | |
| Net unrealized losses on unaffiliated investments | | | | + | (11,180 | ) |
Net unrealized gains | | | | | 15,692 | |
| |
Expenses |
| Investment adviser and administrator fees | | | | | 1,360 | |
Transfer agent and shareholder service fees:
| | | | | | |
| Investor Shares | | | | | 660 | |
| Select Shares | | | | | 45 | |
| Registration fees | | | | | 55 | |
| Professional fees | | | | | 32 | |
| Portfolio accounting fees | | | | | 31 | |
| Shareholder reports | | | | | 21 | |
| Custodian fees | | | | | 12 | |
| Trustees’ fees | | | | | 8 | |
| Other expenses | | | | + | 11 | |
| Total expenses | | | | | 2,235 | |
| Expense reduction by adviser and Schwab | | | | | –757 | |
Net expenses | | | | | 1,478 | |
| |
Increase in Net Assets from Operations |
Total investment income | | | | | 10,963 | |
Net expenses | | | | | –1,478 | |
Net investment income | | | | | 9,485 | |
Net realized gains | | | | | 4,385 | |
Net unrealized gains | | | | + | 15,692 | |
Increase in net assets from operations | | | | $ | 29,562 | |
48 See financial notes.
Schwab MarketTrack Conservative Portfolio
Statement of
Changes in Net Assets
For the current and prior report periods. All numbers x 1,000.
| | | | 11/1/05—10/31/06 | | 11/1/04—10/31/05 |
|---|
| Net investment income | | | | $ | 9,485 | | | $ | 8,081 | |
| Net realized gains | | | | | 4,385 | | | | 2,298 | |
| Net unrealized gains | | | | + | 15,692 | | | | 4,872 | |
Increase in net assets from operations | | | | | 29,562 | | | | 15,251 | |
| |
Distributions Paid |
Dividends from net investment income | | | | | | | | | | |
| Investor Shares | | | | | 8,287 | | | | 7,852 | |
| P Shares | | | | + | 1,074 | | | | — | |
Total dividends from net investment income | | | | | 9,361 | | | | 7,852 | |
| | | | | | | | | | | |
Distributions from net realized gains | | | | | | | | | | |
| Investor Shares | | | | | 202 | | | | — | |
| P Shares | | | | + | — | | | | — | |
Total distributions from net realized gains | | | | | 202 | | | | — | |
| | | | | | | | | | | |
Total distributions | | | | $ | 9,563 | | | $ | 7,852 | |
Transactions in Fund Shares | | | | | | | | | | | | | | | | | | |
| | | | 11/1/05—10/31/06 | | 11/1/04—10/31/05 | |
|---|
| | | | SHARES | | VALUE | | SHARES | | VALUE |
|---|
Shares Sold | | | | | | | | | | | | | | | | | | |
| Investor Shares | | | | | 3,757 | | | $ | 51,692 | | | | 4,139 | | | $ | 55,417 | |
| P Shares | | | | + | 6,493 | | | | 90,438 | | | | — | | | | — | |
Total shares sold | | | | | 10,250 | | | $ | 142,130 | | | | 4,139 | | | $ | 55,417 | |
| | | | | | | | | | | | | | | | | | | |
Shares Reinvested | | | | | | | | | | | | | | | | | | |
| Investor Shares | | | | | 587 | | | $ | 8,073 | | | | 560 | | | $ | 7,474 | |
| P Shares | | | | + | 78 | | | | 1,074 | | | | — | | | | — | |
Total shares reinvested | | | | | 665 | | | $ | 9,147 | | | | 560 | | | $ | 7,474 | |
| | | | | | | | | | | | | | | | | | | |
Shares Redeemed | | | | | | | | | | | | | | | | | | |
| Investor Shares | | | | | (10,556 | ) | | $ | (146,482 | ) | | | (4,489 | ) | | $ | (60,077 | ) |
| P Shares | | | | + | (1,044 | ) | | | (14,366 | ) | | | — | | | | — | |
Total shares redeemed | | | | | (11,600 | ) | | $ | (160,848 | ) | | | (4,489 | ) | | $ | (60,077 | ) |
| | | | | | | | | | | | | | | | | | | |
Net transactions in fund shares | | | | | (685 | ) | | $ | (9,571 | ) | | | 210 | | | $ | 2,814 | |
Shares Outstanding and Net Assets | | | | | | | | | | | | | | | | | | |
| | | | 11/1/05—10/31/06 | | 11/1/04—10/31/05 | |
|---|
| | | | SHARES | | NET ASSETS | | SHARES | | NET ASSETS |
|---|
| Beginning of period | | | | | 22,379 | | | $ | 300,371 | | | | 22,169 | | | $ | 290,158 | |
| Total increase or decrease | | | | + | (685 | ) | | | 10,428 | | | | 210 | | | | 10,213 | |
End of period | | | | | 21,694 | | | $ | 310,799 | | | | 22,379 | | | $ | 300,371 | |
Net investment income not yet distributed | | | | | | | | $ | 1,190 | | | | | | | $ | 601 | |
See financial notes. 49
Schwab MarketTrack Portfolios
Financial Notes
| 1. | | Business Structure of the Funds |
Each of the funds discussed in this report is a series of Schwab Capital Trust (Trust), a no-load, open-end management investment company. The company is organized as a Massachusetts business trust and is registered under the Investment Company Act of 1940, as amended. The list below shows all the funds in the trust including the funds in this report, which are highlighted:
Schwab Capital Trust (organized May 7, 1993)
Schwab MartketTrack All Equity Portfolio™
Schwab MarketTrack Growth Portfolio™
Schwab MarketTrack Balanced Portfolio™
Schwab MarketTrack Conservative Portfolio™
Schwab S&P 500 Index Fund
Schwab Institutional Select® S&P 500 Fund
Schwab Small-Cap Index Fund®
Schwab Total Stock Market Index Fund®
Schwab International Index Fund®
Laudus U.S. MarketMasters Fund™
Laudus Small-Cap MarketMasters Fund™
Laudus International MarketMasters Fund™
Schwab Viewpoints Fund™ | | Schwab Premier Equity Fund®
Schwab Core Equity Fund™
Schwab Dividend Equity Fund™
Schwab Large-Cap Growth Fund™
Schwab Small-Cap Equity Fund™
Schwab Hedged Equity Fund™
Schwab Financial Services Fund™
Schwab Health Care Fund™
Schwab Technology Fund™
Schwab Target 2010 Fund
Schwab Target 2020 Fund
Schwab Target 2030 Fund
Schwab Target 2040 Fund
Schwab Retirement Income Fund |
Both Schwab MarketTrack Growth Portfolio and Schwab MarketTrack Conservative Portfolio offer two share classes: Investor Shares and P Shares. Shares of each class represent interest in the same portfolio, but each class has different expenses and investment minimums. Schwab MarketTrack All Equity Portfolio and Schwab MarketTrack Balanced Portfolio each offer one share class.
Shares are bought and sold at net asset value, or NAV, which is the price for all outstanding shares. Each share has a par value of 1/1,000 of a cent, and the trustees may issue as many shares as necessary.
| 2. | | Significant Accounting Policies: |
The following is a summary of the significant accounting policies used in the preparation of financial statements. The accounting policies are in conformity with accounting principles generally accepted in the United States of America.
The funds value the securities in their portfolios every business day. The funds use the following policies to value various types of securities:
| • | | Securities traded on an exchange or over-the-counter: valued at the closing value for the day, or, on days when no closing value has been reported, halfway between the most recent bid and asked quotes. Securities that are primarily traded on foreign exchanges are valued at the closing values of such securities on their respective exchanges with these values then translated into U.S. dollars at the current exchange rate. |
| • | | Securities for which no quoted value is available or when a significant event has occurred between the time of the security’s last close and the time the fund calculates net asset value: valued at fair value, as determined in good faith by the fund’s investment adviser using guidelines adopted by the fund’s Board of Trustees and the Pricing Committee. Some of the more common reasons that may necessitate that a security be valued at fair value include: the security’s trading has been halted or suspended; the security has been de-listed from a national exchange; the security’s primary trading market is temporarily closed at a time when under normal conditions it would be open; or the security’s primary pricing source is not able or willing to provide a price. |
| • | | Futures and forwards: open contracts are valued at their settlement prices as of the close of their exchanges (for futures) or at a market value based on that day’s exchange rates (for forwards). When a fund closes out a futures or forwards position, it calculates the difference between the value of the position at the beginning and at the end, and records a realized gain or loss accordingly. |
| • | | Underlying funds: valued at their respective net asset values as determined by those funds, in accordance with the Investment Company Act of 1940. |
| • | | Short-term securities (60 days or less to maturity): valued at amortized cost. |
50
Schwab MarketTrack Portfolios
Financial Notes (continued)
2. Significant Accounting Policies (continued):
| (b) | | Portfolio Investments: |
Futures Contracts: The funds may invest in futures contracts. Futures contracts involve certain risks because they can be very sensitive to market movements.
One risk is that the price of a futures contract may not move in perfect correlation with the price of the underlying securities. Another risk is that, at certain times, it may be impossible for a fund to close out a position in a futures contract, due to a difference in trading hours or to market conditions that may reduce the liquidity for a futures contract or its underlying securities. The potential for losses associated with futures contracts may exceed amounts recorded in the Statement of Assets and Liabilities.
Because futures contracts carry inherent risks, a fund must give the broker a deposit of cash and/or securities (the “initial margin”) whenever it enters into the futures contract. The amount of the deposit may vary from one contract to another, but it is generally a percentage of the contract amount.
Futures are traded publicly on exchanges, and their market value changes daily. A fund records the change in market value of futures, and also the change in the amount of margin deposit required (“due to/from broker”).
(c) | | Security Transactions: |
Security transactions are recorded as of the date the order to buy or sell the security is executed. Realized gains and losses from security transactions are based on the identified costs of the securities involved.
Assets and liabilities denominated in foreign currencies are reported in U.S. dollars. For assets and liabilities held on a given date, the dollar value is based on market exchange rates in effect on that date. Transactions involving foreign currencies, including purchases, sales, income receipts and expense payments, are calculated using exchange rates in effect on the transaction date.
Interest income is recorded as it accrues. Dividends and distributions from portfolio securities and underlying funds are recorded on the date they are effective (the ex-dividend date), although the funds record certain foreign security dividends on the day they learn of the ex-dividend date.
Expenses that are specific to a fund or a class are charged directly to that fund or class. Expenses that are common to all funds within the trust generally are allocated among the funds in proportion to their average daily net assets.
For funds offering multiple share classes, the net investment income, other than class specific expenses, and the realized and unrealized gains or losses, are allocated daily to each class in proportion to its net assets.
(f) | | Distributions to Shareholders: |
The funds pay dividends from net investment income and make distributions from net realized capital gains once a year.
Each fund maintains its own account for purposes of holding assets and accounting, and is considered a separate entity for tax purposes. Within its account, each fund also keeps certain assets in segregated accounts, as may be required by securities law.
Each fund has an arrangement with its custodian bank under which the fund receives a credit for its uninvested cash balance to offset its custody fees and accounting fees. The credit amounts (if any) are disclosed in the statement of operations as a reduction to the fund’s operating expenses.
51
Schwab MarketTrack Portfolios
Financial Notes (continued)
2. Significant Accounting Policies (continued):
(h) | | Accounting Estimates: |
The accounting policies described in this report conform with accounting principles generally accepted in the United States of America. Notwithstanding this, shareholders should understand that in order to follow these principles, fund management has to make estimates and assumptions that affect the information reported in the financial statements. It’s possible that once the results are known, they may turn out to be different from these estimates.
(i) | | Federal Income Taxes: |
The funds intend to meet federal income and excise tax requirements for regulated investment companies. Accordingly, the funds distribute substantially all of their net investment income and realized net capital gains (if any) to their respective shareholders each year. As long as a fund meets the tax requirements, it is not required to pay federal income tax.
Under the funds’ organizational documents, the officers and trustees are indemnified against certain liabilities arising out of the performance of their duties to the funds. In addition, in the normal course of business the funds enter into contracts with their vendors and others that provide general indemnifications. The funds’ maximum exposure under these arrangements is unknown as this would involve future claims that may be made against the funds. However, based on experience, the funds expect the risk of loss to be remote.
(k) | | New Accounting Standards: |
Financial Accounting Standards Board Interpretation (FIN) No. 48 — Accounting for Uncertainty in Tax Positions — An Interpretation of SFAS No. 109, was issued in July 2006 and is effective for fiscal years beginning after December 15, 2006. This Interpretation provides new requirements for the recognition, measurement, and disclosure in the financial statements of a tax position taken or expected to be taken in a tax return when there is uncertainty about whether that tax position will ultimately be sustained. We have not yet completed our evaluation of the impact, if any, of adopting FIN 48 on the Fund’s financial statements.
In September 2006, the Financial Accounting Standards Board (FASB) issued Statement of Financial Accounting Standards No. 157, “Fair Value Measurements” (SFAS No. 157). SFAS No. 157 defines fair value, establishes a framework for measuring fair value in accordance with generally accepted accounting principles and expands disclosure about fair value measurements. SFAS No. 157 is effective for fiscal years beginning after November 15, 2007. Management is currently evaluating the impact the adoption of SFAS No. 157 will have on the Fund’s financial statement disclosures.
| 3. | | Affiliates and Affiliated Transactions:
(All dollar amounts are × 1,000) |
Charles Schwab Investment Management, Inc. (CSIM or the investment adviser), a wholly owned subsidiary of The Charles Schwab Corporation, serves as each fund’s investment adviser and administrator pursuant to an Investment Advisory and Administration Agreement (Advisory Agreement) between it and the trust. Charles Schwab & Co., Inc. (“Schwab”) is an affiliate of the investment adviser and is the trust’s shareholder services agent and transfer agent.
For its advisory and administrative services to each fund, the investment adviser is entitled to receive an annual fee payable monthly based on each fund’s average daily net assets described as follows:
Average daily net assets
| | | | MarketTrack
All Equity
Portfolio
|
| MarketTrack
Growth
Portfolio
|
| MarketTrack
Balanced
Portfolio
|
| MarketTrack
Conservative
Portfolio
|
|---|
| First $500 million | | | | | 0.44 | % | | | 0.44 | % | | | 0.44 | % | | | 0.44 | % |
| Over $500 million | | | | | 0.39 | % | | | 0.39 | % | | | 0.39 | % | | | 0.39 | % |
52
Schwab MarketTrack Portfolios
Financial Notes (continued)
3. Affiliates and Affiliated Transactions (continued):
For its transfer agent and shareholder services, Schwab is entitled to receive an annual fee payable monthly based on each fund’s average daily net assets described as follows:
| | | | Transfer Agent Fees
|
| Shareholder Service Fees
|
|---|
| Investor Shares | | | | | 0.05 | % | | | 0.20 | % |
| P Shares* | | | | | 0.05 | % | | | 0.05 | % |
Although these agreements specify certain fees for these services, CSIM and Schwab have made additional agreements with the funds to limit the total expenses charged, excluding interest, taxes and certain non-routine expenses through February 27, 2007, as follows:
| | | | MarketTrack
All Equity
Portfolio
|
| MarketTrack
Growth
Portfolio
|
| MarketTrack
Balanced
Portfolio
|
| MarketTrack
Conservative
Portfolio
|
|---|
| Investor Shares | | | | | 0.50 | % | | | 0.50 | % | | | 0.50 | % | | | 0.50 | % |
| P Shares* | | | | | n/a | | | | 0.35 | % | | | n/a | | | | 0.35 | % |
| * | | P Shares are only offered by MarketTrack Growth Portfolio and MarketTrack Conservative Portfolio. |
Such expense reductions are disclosed in the statement of operations.
The funds may engage in certain transactions involving related parties. For instance, a fund may own shares of The Charles Schwab Corporation if that company is included in its index. Pursuant to an exemptive order issued by the SEC, the funds may invest in other related funds. As of October 31, 2006, the shares owned by each MarketTrack Portfolio as a percentage of the total shares of the underlying funds are:
Schwab Equity Index Funds: | | | | | | | | | | | | | | | | | | |
| S&P 500 Index Fund | | | | | — | | | | — | | | | — | | | | 0.5 | % |
| Small-Cap Index Fund | | | | | 7.9 | % | | | 8.5 | % | | | 4.8 | % | | | 1.9 | % |
| International Index Fund | | | | | 9.5 | % | | | 8.6 | % | | | 4.8 | % | | | 1.9 | % |
| |
Schwab Bond Funds: | | | | | | | | | | | | | | | | | | |
| Total Bond Market Fund | | | | | — | | | | 8.4 | % | | | 14.5 | % | | | 13.4 | % |
| |
Schwab Institutional Select Funds: | | | | | | | | | | | | | | | | | | |
| Institutional Select S&P 500 Index | | | | | 11.3 | % | | | 8.2 | % | | | 4.0 | % | | | 0.1 | % |
| |
Schwab Money Funds: | | | | | | | | | | | | | | | | | | |
| Value Advantage Money Fund | | | | | — | | | | 0.1 | % | | | 0.1 | % | | | —** | |
The funds may make direct transactions with certain other Schwab Funds when practical. When one fund is seeking to sell a security that another is seeking to buy, an interfund transaction can allow both funds to benefit by reducing transaction costs. This practice is limited to funds that share the same investment adviser, trustees and officers. As of October 31, 2006, each fund’s total security transactions (including in-kind redemptions) with other Schwab Funds were as follows:
| MarketTrack All Equity Portfolio | | | | | — |
| MarketTrack Growth Portfolio | | | | | — |
| MarketTrack Balanced Portfolio | | | | | — |
| MarketTrack Conservative Portfolio | | | | | — |
Pursuant to an exemptive order issued by the SEC, the funds may enter into interfund borrowing and lending transactions within the Schwab Funds. All loans are for temporary or emergency purposes only. The interest rate charged on the loan is the average of the overnight repurchase agreement rate and the short-term bank loan rate. The interfund lending facility is subject to the oversight and periodic review of the Board of Trustees of the Schwab Funds. There was no interfund borrowing or lending activity for any fund during the period.
53
Schwab MarketTrack Portfolios
Financial Notes (continued)
3. Affiliates and Affiliated Transactions (continued):
Independent Trustee
Trustees may include people who are officers and/ or directors of the investment adviser or Schwab. Federal securities law limits the percentage of such “interested persons” who may serve on a trust’s board, and the trust was in compliance with these limitations throughout the report period. The trust did not pay any of these persons for their service as trustees, but it did pay non-interested persons (independent trustees), as noted in each fund’s Statement of Operations.
| 4. | | Purchases and Sales of Investment Securities:
(All dollar amounts are × 1,000) |
For the fiscal year ended October 31, 2006, purchases and sales of securities (excluding short-term obligations) were as follows:
| | | | Purchases of Securities
|
| Sales/Maturities of Securities
|
|---|
| MarketTrack All Equity Portfolio | | | | $ | 38,590 | | | $ | 57,971 | |
| MarketTrack Growth Portfolio | | | | | 50,620 | | | | 77,224 | |
| MarketTrack Balanced Portfolio | | | | | 43,593 | | | | 77,421 | |
| MarketTrack Conservative Portfolio | | | | | 33,095 | | | | 41,302 | |
| 5. | | Redemption Fee:
(All dollar amounts are × 1,000) |
The funds may impose a short-term redemption fee on any fund shares that are redeemed or exchanged by a shareholder within a specified number of days of the purchase date. For shares purchased after 4/29/05, the funds charge 2.00% redemption fees on shares (excluding P shares) held 30 days or less. Such amounts are net of the redemption fee proceeds on the Statement of Changes in Net Assets. The redemption fees charged during the current and prior fiscal years were:
| | | | Current Period
|
| Prior Period
|
|---|
MarketTrack All Equity Portfolio | | | | $ | 13 | | | $ | 8 | |
MarketTrack Growth Portfolio | | | | | | | | | | |
| Investor Shares | | | | | 11 | | | | 10 | |
MarketTrack Balanced Portfolio | | | | | 3 | | | | 5 | |
MarketTrack Conservative Portfolio | | | | | | | | | | |
| Investor Shares | | | | | 16 | | | | 3 | |
| 6. | | Borrowing:
(All dollar amounts are × 1,000) |
The funds may borrow money from banks and custodians. The funds may obtain temporary bank loans through the trusts to which they belong, to use for meeting shareholder redemptions or for extraordinary or emergency purposes. The trust has custodian overdraft facilities and line of credit arrangements of $150 million and $100 million with State Street Corporation, and Bank of America, N.A., respectively. The funds pay interest on the amounts they borrow at rates that are negotiated periodically.
Fund
| | | | Amount
Outstanding
at 10/31/06
| Average
Borrowing*
|
| Weighted
Average
Interest
Rate*(%)
|
|
|---|
| MarketTrack All Equity Portfolio | | | | $ | — | | $1,246 | | 4.78 | |
| MarketTrack Growth Portfolio | | | | | — | | 987 | | 5.02 | |
| MarketTrack Balanced Portfolio | | | | | — | | 509 | | 5.13 | |
| MarketTrack Conservative Portfolio | | | | | — | | 471 | | 5.14 | |
| * | | Based on the number of days for which the borrowing is outstanding. |
54
Schwab MarketTrack Portfolios
Financial Notes (continued)
7. Federal Income Taxes:
(All dollar amounts are × 1,000)
As of October 31, 2006, the components of distributable earnings on a tax-basis were as follows:
| | | | MarketTrack
All Equity
Portfolio
|
| MarketTrack
Growth
Portfolio
|
| MarketTrack
Balanced
Portfolio
|
| MarketTrack
Conservative
Portfolio
|
|---|
| Undistributed ordinary income | | | | $ | 2 | * | | $ | 3,726 | | | $ | 7,085 | | | $ | 1,190 | |
| Undistributed long-term capital gains | | | | | — | | | | 6,526 | | | | 8,968 | | | | 4,289 | |
| Unrealized appreciation | | | | | 103,591 | | | | 195,244 | | | | 118,917 | | | | 48,162 | |
| Unrealized depreciation | | | | | — | | | | (7,347 | ) | | | (5,075 | ) | | | (2,157 | ) |
| Net unrealized appreciation / (depreciation) | | | | $ | 103,591 | | | $ | 187,897 | | | $ | 113,842 | | | $ | 46,005 | |
The primary difference between book-basis and tax-basis unrealized appreciation or unrealized depreciation of investments is the tax deferral of losses on wash sales.
Capital loss carry forwards may be used to offset future realized capital gains for federal income tax purposes. As of October 31, 2006, the following funds had capital loss carry forwards expiring in:
Expire
| | | | MarketTrack
All Equity
Portfolio*
|
| MarketTrack
Growth
Portfolio
|
| MarketTrack
Balanced
Portfolio
|
| MarketTrack
Conservative
Portfolio
|
|---|
| 2010 | | | | $ | 5,648 | | | $ | — | | | $ | — | | | $ | — | |
| 2011 | | | | | 13,010 | | | | — | | | | — | | | | — | |
| 2012 | | | | | 6,944 | | | | — | | | | — | | | | — | |
| Total | | | | $ | 25,602 | | | $ | — | | | $ | — | | | $ | — | |
For tax purposes, realized capital losses, occuring after October 31, may be deferred and treated as occuring on the first day of the following fiscal year. As of October 31, 2006, the funds had aggregate deferred realized capital losses as follows:
| | | | MarketTrack
All Equity
Portfolio*
|
| MarketTrack
Growth
Portfolio
|
| MarketTrack
Balanced
Portfolio
|
| MarketTrack
Conservative
Portfolio
|
|---|
| Deferred capital losses | | | | $ | 58 | | | $ | — | | | $ | — | | | $ | — | |
| Capital losses utilized | | | | | 5,410 | | | | 5,181 | | | | — | | | | — | |
The tax-basis components of distributions paid during the current and prior fiscal years were:
| | | | MarketTrack
All Equity
Portfolio*
|
| MarketTrack
Growth
Portfolio
|
| MarketTrack
Balanced
Portfolio
|
| MarketTrack
Conservative
Portfolio
|
|---|
Current period distributions | | | | | | | | | | | | | | | | | | |
| Ordinary income | | | | $ | 5,267 | | | $ | 10,988 | | | $ | 11,244 | | | $ | 9,361 | |
| Long-term capital gains | | | | | — | | | | — | | | | 1,491 | | | | 202 | |
| Return of capital | | | | | — | | | | — | | | | — | | | | — | |
| |
Prior period distributions | | | | | | | | | | | | | | | | | | |
| Ordinary income | | | | $ | 5,060 | | | $ | 9,037 | | | $ | 10,162 | | | $ | 7,852 | |
| Long-term capital gains | | | | | — | | | | — | | | | — | | | | — | |
| Return of capital | | | | | — | | | | — | | | | — | | | | — | |
| * | | Tax information for Market Track All Equity Portfolio is as of December 31, 2005. |
55
Schwab MarketTrack Portfolios
Financial Notes (continued)
7. Federal Income Taxes (continued):
The permanent book and tax basis differences may result in reclassifications between capital account and other accounts as required. The adjustments will have no impact on net assets or the results of operations. As of October 31, 2006, the funds made the following reclassifications:
| | | | MarketTrack
All Equity
Portfolio*
|
| MarketTrack
Growth
Portfolio
|
| MarketTrack
Balanced
Portfolio
|
| MarketTrack
Conservative
Portfolio
|
|---|
| Capital shares | | | | $ | — | | | $ | (1 | ) | | $ | (1 | ) | | $ | 1 | |
| Undistributed net investment income | | | | | — | | | | 269 | | | | 505 | | | | 463 | |
| Net realized capital gains and losses | | | | | — | | | | (268 | ) | | | (504 | ) | | | (464 | ) |
Other Federal Tax Information (unaudited)
(All dollar amounts are × 1,000):
For corporate shareholders, the following percentage of the funds dividend distributions paid during the fiscal year ended October 31, 2006, qualify for the corporate dividends received deduction:
| | | | Percentage
|
|---|
| MarketTrack All Equity Portfolio | | | | | 100.00 | % |
| MarketTrack Growth Portfolio | | | | | 51.01 | |
| MarketTrack Balanced Portfolio | | | | | 35.65 | |
| MarketTrack Conservative Portfolio | | | | | 20.87 | |
For the fiscal year ended October 31, 2006, the fund’s designate the following amounts of the dividend distributions as qualified dividends for the purpose of the maximum rate under section 1(h)(ii) of the Internal Revenue Code. Shareholders will be notified in January 2007 via IRS form 1099 of the amounts for use in preparing their 2006 income tax return.
| MarketTrack All Equity Portfolio | | | | $ | 5,267 | |
| MarketTrack Growth Portfolio | | | | | 7,510 | |
| MarketTrack Balanced Portfolio | | | | | 4,860 | |
| MarketTrack Conservative Portfolio | | | | | 2,546 | |
| * | | Tax information for Market Track All Equity Portfolio is as of December 31, 2005. |
56
Report of Independent Registered Public Accounting Firm
To the Board of Trustees and Shareholders of
Schwab MarketTrack All Equity Portfolio
Schwab MarketTrack Growth Portfolio
Schwab MarketTrack Balanced Portfolio
Schwab MarketTrack Conservative Portfolio
In our opinion, the accompanying statements of assets and liabilities, including the portfolio holdings, and the related statements of operations and of changes in net assets and the financial highlights present fairly, in all material respects, the financial position of Schwab MarketTrack All Equity Portfolio, Schwab MarketTrack Growth Portfolio, Schwab MarketTrack Balanced Portfolio and Schwab MarketTrack Conservative Portfolio (four of the portfolios constituting Schwab Capital Trust, hereafter referred to as the “Funds”) at October 31, 2006, the results of each of their operations for the year then ended, the changes in each of their net assets for each of the two years in the period then ended and the financial highlights for each of the five years in the period then ended, in conformity with accounting principles generally accepted in the United States of America. These financial statements and financial highlights (hereafter referred to as “financial statements”) are the responsibility of the Funds’ management; our responsibility is to express an opinion on these financial statements based on our audits. We conducted our audits of these financial statements in accordance with the standards of the Public Company Accounting Oversight Board (United States). Those standards require that we plan and perform the audits to obtain reasonable assurance about whether the financial statements are free of material misstatement. An audit includes examining, on a test basis, evidence supporting the amounts and disclosures in the financial statements, assessing the accounting principles used and significant estimates made by management, and evaluating the overall financial statement presentation. We believe that our audits, which included confirmation of securities at October 31, 2006 by correspondence with the custodian and brokers, provide a reasonable basis for our opinion.
PricewaterhouseCoopers LLP
San Francisco, California
December 14, 2006
57
Investment Advisory Agreement Approval
The Investment Company Act of 1940 (the “1940 Act”) requires that initial approval of, as well as the continuation of, a fund’s investment advisory agreement must be specifically approved (1) by the vote of the trustees or by a vote of the shareholders of the fund, and (2) by the vote of a majority of the trustees who are not parties to the investment advisory agreement or “interested persons” of any party (the “Independent Trustees”), cast in person at a meeting called for the purpose of voting on such approval. In connection with such approvals, the fund’s trustees must request and evaluate, and the investment adviser is required to furnish, such information as may be reasonably necessary to evaluate the terms of the advisory agreement. In addition, the Securities and Exchange Commission (the “SEC”) takes the position that, as part of their fiduciary duties with respect to fund fees, fund boards are required to evaluate the material factors applicable to a decision to approve an investment advisory agreement.
Consistent with these responsibilities, the Board of Trustees (the “Board”) calls and holds one or more meetings each year that are dedicated, in whole or in part, to considering whether to renew the investment advisory agreement between Schwab Capital Trust (the “Trust”) and CSIM (the “Agreement”) with respect to existing funds in the Trust, including the funds covered in this annual report, and to review certain other agreements pursuant to which CSIM provides investment advisory services to certain other registered investment companies. In preparation for the meeting(s), the Board requests and reviews a wide variety of materials provided by CSIM, including information about CSIM’s affiliates, personnel and operations. The Board also receives extensive data provided by third parties. This information is in addition to the detailed information about the funds that the Board reviews during the course of each year, including information that relates to fund operations and fund performance. The trustees also receive a memorandum from fund counsel regarding the responsibilities of trustees for the approval of investment advisory contracts. In addition, the Independent Trustees receive advice from independent counsel to the Independent Trustees, meet in executive session outside the presence of fund management and participate in question and answer sessions with representatives of CSIM.
The Board, including a majority of the Independent Trustees, considered information specifically relating to the continuance of the Agreement at meetings held on May 2, 2006, May 24, 2006 and June 12, 2006, and approved the renewal of the Agreement for an additional one year term at the meeting held on June 12, 2006. The Board’s approval of the Agreement was based on consideration and evaluation of a variety of specific factors discussed at these meetings and at prior meetings, including:
| 1. | | the nature, extent and quality of the services provided to the funds under the Agreement, including the resources of CSIM and its affiliates dedicated to the funds; |
| 2. | | each fund’s investment performance and how it compared to that of certain other comparable mutual funds; |
| 3. | | each fund’s expenses and how those expenses compared to those of certain other comparable mutual funds; |
| 4. | | the profitability of CSIM and its affiliates, including Charles Schwab & Co., Inc. (“Schwab”), with respect to each fund, including both direct and indirect benefits accruing to CSIM and its affiliates; and |
| 5. | | the extent to which economies of scale would be realized as the funds grow and whether fee levels in the Agreement reflect those economies of scale for the benefit of fund investors. |
Nature, Extent and Quality of Services. The Board considered the nature, extent and quality of the services provided by CSIM to the funds and the resources of CSIM and its affiliates dedicated to the funds. In this regard, the trustees evaluated, among other things, CSIM’s personnel, experience, track record and compliance program. The information considered by the trustees included specific information concerning changes in the nature, extent and quality of services provided by CSIM since the trustees had last considered approval of the Agreement. The trustees also considered the fact that Schwab’s extensive branch network, Internet access, investment and research tools, telephone services, and array of account features benefit the funds and their shareholders. The trustees also considered Schwab’s excellent reputation as a full service brokerage firm and its overall financial condition. Finally, the trustees considered that the vast majority of the funds’ shareholders are also brokerage clients of Schwab, and that CSIM and its affiliates are uniquely positioned to provide services and support to the funds and such shareholders. Following such evaluation, the Board concluded, within the context of its full deliberations, that the nature, extent and quality of services provided by CSIM to the funds and the resources of CSIM and its affiliates dedicated to the funds supported renewal of the Agreement.
Fund Performance. The Board considered fund performance in determining whether to renew the Agreement. Specifically, the trustees considered each fund’s performance relative to a peer group of other mutual funds
58
and appropriate indices/benchmarks, in light of total return and market trends. As part of this review, the trustees considered the composition of the peer group, selection criteria and the reputation of the third party who prepared the peer group analysis. In evaluating the performance of each fund, the trustees considered both market risk and shareholder risk expectations for such fund and the appropriateness of the benchmark used to compare the performance of each fund. The trustees further considered the level of fund performance in the context of its review of fund expenses and adviser profitability discussed below. Following such evaluation the Board concluded, within the context of its full deliberations, that the performance of the funds supported renewal of the Agreement.
Fund Expenses. With respect to the funds’ expenses, the trustees considered the rate of compensation called for by the Agreement, and each fund’s net operating expense ratio, in each case, in comparison to those of other comparable mutual funds, such peer groups and comparisons having been selected and calculated by an independent third party. The trustees considered the effects of CSIM’s and Schwab’s historical practice of voluntarily waiving management and other fees to prevent total fund expenses from exceeding a specified cap. The trustees also considered fees charged by CSIM to other mutual funds and to other types of accounts, such as wrap accounts, but, with respect to such other types of accounts, accorded less weight to such comparisons due to the different legal, regulatory, compliance and operating features of mutual funds as compared to these other types of accounts. Following such evaluation, the Board concluded, within the context of its full deliberations, that the expenses of the funds are reasonable and supported renewal of the Agreement.
Profitability. With regard to profitability, the trustees considered the compensation flowing to CSIM and its affiliates, directly or indirectly. In this connection, the trustees reviewed management’s profitability analyses, together with certain commentary thereon from an independent accounting firm. The trustees also considered any other benefits derived by CSIM from its relationship with the funds, such as whether, by virtue of its management of the funds, CSIM obtains investment information or other research resources that aid it in providing advisory services to other clients. The trustees considered whether the varied levels of compensation and profitability under the Agreement and other service agreements were reasonable and justified in light of the quality of all services rendered to each fund by CSIM and its affiliates. The Board also considered information relating to changes to CSIM’s cost structure, including cost savings, technology investments and increased operating efficiencies and how these changes affected CSIM’s profitability under the Agreement. Based on this evaluation, the Board concluded, within the context of its full deliberations, that the profitability of CSIM is reasonable and supported renewal of the Agreement.
Economies of Scale. The trustees considered the existence of any economies of scale and whether those are passed along to a fund’s shareholders through a graduated investment advisory fee schedule or other means, including any fee waivers by CSIM and its affiliates. In this regard, and consistent with their consideration of fund expenses, the trustees considered that CSIM and Schwab have previously committed resources to minimize the effects on shareholders of diseconomies of scale during periods when fund assets were relatively small through their contractual expense waivers. For example, such diseconomies of scale may particularly affect newer funds or funds with investment strategies that are from time to time out of favor, but shareholders may benefit from the continued availability of such funds at subsidized expense levels. The trustees also considered CSIM’s agreement to contractual investment advisory fee schedules that include lower fees at higher graduated asset levels. The Board also considered certain commitments by CSIM and Schwab that are designed to pass along potential economies of scale to fund shareholders. Specifically, the Board considered CSIM and Schwab’s commitments, which may be changed only with Board approval: (i) to reduce contractual advisory fees or add breakpoints for certain funds, and (ii) to implement, by means of expense limitation agreement, reductions in net overall expenses for certain funds. Based on this evaluation, and in consideration of the commitments made by CSIM and Schwab as discussed above, the Board concluded, within the context of its full deliberations, that the funds obtain reasonable benefit from economies of scale.
In the course of their deliberations, the trustees did not identify any particular information or factor that was all-important or controlling. Based on the trustees’ deliberation and their evaluation of the information described above, the Board, including all of the Independent Trustees, unanimously approved the continuation of the Agreement and concluded that the compensation under the Agreement is fair and reasonable in light of such services and expenses and such other matters as the trustees have considered to be relevant in the exercise of their reasonable judgment.
59
Trustees and Officers
The tables below gives information about the trustees and officers for The Schwab Capital Trust, which includes the funds covered in this report. The “Fund Complex” includes The Charles Schwab Family of Funds, Schwab Capital Trust, Schwab Investments, Schwab Annuity Portfolios, Laudus Trust, Laudus Variable Insurance Trust, Excelsior Funds, Inc., Excelsior Tax-Exempt Funds, Inc., and Excelsior Funds Trust. As of October 31, 2006, the Fund Complex included 96 funds.
The address for all trustees and officers is 101 Montgomery Street, San Francisco, CA 94104. You can find more information about the trustees and officers in the Statement of Additional Information, which is available free by calling 1-800-435-4000.
Independent Trustees |
Name, Year of Birth,
and Position(s) with
the Trust; (Term of
Office, and Length of
Time Served1) | | Principal Occupations
During the Past Five Years | | Number of
Portfolios in
Fund Complex
Overseen by
the Trustee | | Other Directorships |
Mariann Byerwalter
1960
Trustee
(Trustee of Schwab Capital Trust since 2000.) | | Chairman of JDN Corporate Advisory LLC. From 1996 to 2001, Vice President for Business Affairs and Chief Financial Officer of Stanford University, and in 2001, Special Advisor to the President of Stanford University. | | 96 | | Board 1—Director, Redwood Trust, Inc.
Board 2—Director, PMI Group, Inc. |
Donald F. Dorward
1931
Trustee
(Trustee of Schwab Capital Trust since 1989.) | | Chief Executive Officer, Dorward & Associates (corporate management, marketing and communications consulting firm). From 1996-1999, Executive Vice President and Managing Director, Grey Advertising. Prior to 1996, President and Chief Executive Officer, Allen & Dorward Advertising. | | 57 | | None. |
William A. Hasler
1941
Trustee
(Trustee of Schwab Capital Trust since 2000.) | | Retired. Dean Emeritus, Haas School of Business, University of California, Berkeley. Until February 2004, Co-Chief Executive Officer, Aphton Corp. (bio-pharmaceuticals). Prior to August 1998, Dean of the Haas School of Business, University of California, Berkeley (higher education). | | 96 | | Board 1—Director, Aphton Corp.
Board 2—Director, Mission West Properties
Board 3—Director, TOUSA
Board 4—Director, Stratex Networks
Board 5—Director, Genitope Corp.
Board 6—Director & Non-Executive
Chairman, Solectron Corp.
Board 7—Director, Ditech
Communications Corp. |
Robert G. Holmes
1931
Trustee
(Trustee of Schwab Capital Trust since 1989.) | | Chairman, Chief Executive Officer and Director, Semloh Financial, Inc. (international financial services and investment
advisory firm). | | 57 | | None. |
Gerald B. Smith
1950
Trustee
(Trustee of Schwab Capital Trust since 2000.) | | Chairman and Chief Executive Officer and founder of Smith Graham & Co.
(investment advisors). | | 57 | | Board 1—Board of Cooper Industries
Board 2—Chairman of the Audit Committee
of Northern Border Partners, M.L.P. |
60
Independent Trustees continued |
Name, Year of Birth,
and Position(s) with
the Trust; (Term of
Office, and Length of
Time Served1) | | Principal Occupations
During the Past Five Years | | Number of
Portfolios in
Fund Complex
Overseen by
the Trustee | | Other Directorships |
Donald R. Stephens
1938
Trustee
(Trustee of Schwab Capital Trust since 1989.) | | Managing Partner, D.R. Stephens & Company (investments). Prior to 1996, Chairman and Chief Executive Officer of North American Trust (real estate
investment trust). | | 57 | | None. |
Michael W. Wilsey
1943
Trustee
(Trustee of Schwab Capital Trust since 1989.) | | Chairman and Chief Executive Officer, Wilsey Bennett, Inc. (real estate investment and management, and other investments). | | 57 | | None. |
Interested Trustees |
Name, Year of Birth,
and Position(s) with
the Trust; (Term of
Office, and Length of
Time Served1) | | Principal Occupations
During the Past Five Years | | Number of
Portfolios in
Fund Complex
Overseen by
the Trustee | | Other Directorships |
Charles R. Schwab2
1937
Chairman and Trustee
(Chairman and Trustee
of Schwab Capital Trust
since 1989.) | | Chairman, Chief Executive Officer and Director, The Charles Schwab Corporation, Charles Schwab & Co., Inc.; Chairman and Director, Charles Schwab Investment Management, Inc., Charles Schwab Bank, N. A.; Chairman and Chief Executive Officer, Schwab (SIS) Holdings Inc. I, Schwab International Holdings, Inc.; Chief Executive Officer and Director, Schwab Holdings, Inc.; Director, U.S. Trust Company, N. A., U.S. Trust Corporation, United States Trust Company of New York. Until May 2003, Co-Chief Executive Officer, The Charles Schwab Corporation. | | 57 | | None. |
Randall W. Merk2
1954
Trustee
(Trustee of Schwab Capital Trust since 2005.) | | Executive Vice President and President, Schwab Financial Products, Charles Schwab & Co., Inc.; Director, Charles Schwab Asset Management (Ireland) Limited and Charles Schwab Worldwide Funds PLC. From September 2002 to July 2004, Chief Executive Officer and President, Charles Schwab Investment Management, Inc. and Executive Vice President, Charles Schwab & Co., Inc. Prior to September 2002, President and Chief Investment Officer, American Century Investment Management, and Director, American Century Companies, Inc. | | 96 | | None. |
61
Officers of the Trust |
Name, Year of Birth, and Position(s)
with the Trust; (Term of Office, and
Length of Time Served3) | | Principal Occupations During the Past Five Years |
Evelyn Dilsaver
1955
President and Chief Executive Officer
(Officer of Schwab Capital Trust since 2004.) | | President, Chief Executive Officer, and Director, Charles Schwab Investment Management, Inc.; Executive Vice President, Charles Schwab & Co., Inc; President and Chief Executive Officer, Laudus Trust and Laudus Variable Insurance Trust; President, Excelsior Funds Inc., Excelsior Tax-Exempt Funds, Inc., and Excelsior Funds Trust; President, Mutual Fund Division, UST Advisers, Inc. From June 2003 to July 2004, Senior Vice President, Asset Management Products and Services, Charles Schwab & Co., Inc. Prior to June 2003, Executive Vice President, Chief Financial Officer, and Chief Administrative Officer, U.S. Trust, a subsidiary of The Charles Schwab Corporation. |
George Pereira
1964
Treasurer and Principal Financial Officer
(Officer of Schwab Capital Trust since 2004.) | | Senior Vice President and Chief Financial Officer, Charles Schwab Investment Management, Inc.; Chief Financial Officer, Laudus Trust and Laudus Variable Insurance Trust; Treasurer, Chief Financial Officer and Chief Accounting Officer, Excelsior Funds Inc., Excelsior Tax-Exempt Funds, Inc., and Excelsior Funds Trust; Chief Financial Officer, Mutual Fund Division, UST Advisors, Inc. Director, Charles Schwab Worldwide Fund, PLC and Charles Schwab Asset Management (Ireland) Limited. From December 1999 to November 2004, Sr. Vice President, Financial Reporting, Charles Schwab & Co., Inc. |
Kimon Daifotis
1959
Senior Vice President and Chief
Investment Officer—Fixed Income
(Officer of Schwab Capital Trust since 2004.) | | Senior Vice President and Chief Investment Officer—Fixed Income, Charles Schwab Investment Management, Inc. Prior to 2004, Vice President and Sr. Portfolio Manager, Charles Schwab Investment Management, Inc. |
Jeffrey Mortimer
1963
Senior Vice President and Chief
Investment Officer—Equities
(Officer of Schwab Capital Trust since 2004.) | | Senior Vice President and Chief Investment Officer—Equities, Charles Schwab Investment Management, Inc.; Vice President and Chief Investment Officer, Laudus Trust and Laudus Variable Insurance Trust. Prior to 2004, Vice President and Sr. Portfolio Manager, Charles Schwab Investment Management, Inc. |
Randall Fillmore
1960
Chief Compliance Officer and AML Officer
(Officer of Schwab Capital Trust since 2002.) | | Senior Vice President and Chief Compliance Officer, Charles Schwab Investment Management, Inc.; Senior Vice President Charles Schwab & Co., Inc.; Chief Compliance Officer, Laudus Trust and Laudus Variable Insurance Trust; Chief Compliance Officer, Excelsior Funds Inc., Excelsior Tax-Exempt Funds, Inc., and Excelsior Funds Trust. From 2002 to 2003, Vice President, Charles Schwab & Co., Inc., and Charles Schwab Investment Management, Inc. From 2000 to 2002, Vice President, Internal Audit, Charles Schwab & Co., Inc. |
Koji E. Felton
1961
Secretary and Chief Legal Officer
(Officer of Schwab Capital Trust since 1998.) | | Senior Vice President, Chief Counsel and Corporate Secretary, Charles Schwab Investment Management, Inc.; Senior Vice President and Deputy General Counsel, Charles Schwab & Co., Inc.; Chief Legal Officer, Laudus Trust and Laudus Variable Insurance Trust; Chief Legal Officer, Excelsior Funds Inc., Excelsior Tax-Exempt Funds, Inc., and Excelsior Funds Trust. Prior to June 1998, Branch Chief in Enforcement at U.S. Securities and Exchange Commission in San Francisco. |
Catherine MacGregor
1964
Vice President
(Officer of Schwab Capital Trust since 2005) | | Vice President, Charles Schwab & Co., Inc., Charles Schwab
Investment Management, Inc., Laudus Trust and Laudus Variable Insurance Trust; since 2006, Chief Counsel, Laudus Trust and Laudus Variable Insurance Trust. Until July 2005, Senior Associate, Paul Hastings Janofsky & Walker LLP. |
62
Officers of the Trust continued |
Name, Year of Birth, and Position(s)
with the Trust; (Term of Office, and
Length of Time Served3) | | Principal Occupations During the Past Five Years |
Cathy Sabo
1964
Vice President
(Officer of Schwab Capital Trust since 2005) | | Vice President, Compliance, Charles Schwab Investment Management, Inc., Laudus Trust and Laudus Variable Insurance Trust. Until 2004, Vice President, Client, Sales & Services Controls, Charles Schwab & Co., Inc. |
Michael Haydel
1972
Vice President
(Officer of Schwab Capital Trust since 2006) | | Vice President, Asset Management Client Services, Charles Schwab & Co., Inc.; Vice President and AML Officer, Laudus Trust and Laudus Variable Insurance Trust. Until March 2004, Director Charles Schwab & Co., Inc. |
1 | | Trustees remain in office until they resign, retire or are removed by shareholder vote. The Schwab Funds retirement policy requires that independent trustees elected after January 1, 2000 retire at age 72 or after twenty years of service as a trustee, whichever comes first. Independent trustees elected prior to January 1, 2000 will retire on the following schedule: Messrs. Holmes and Dorward will retire on December 31, 2007, and Messrs. Stephens and Wilsey will retire on December 31, 2010. |
2 | | In addition to their employment with the investment adviser and the distributor, Messrs. Schwab and Merk also own stock of The Charles Schwab Corporation. Mr. Schwab and Mr. Merk are Interested Trustees because they are employees of Schwab and/or the adviser. |
3 | | The President, Treasurer and Secretary hold office until their respective successors are chosen and qualified or until he or she sooner dies, resigns, is removed or becomes disqualified. Each other officer serves at the pleasure of the Board. |
63
Glossary
asset allocation The practice of dividing a portfolio among different asset classes, with each asset class assigned a particular percentage.
asset class A group of securities with similar structure and basic characteristics. Stocks, bonds and cash are the three main examples of asset classes.
beta A historical measure of an investment’s volatility relative to a market index (usually the S&P 500®). The index is defined as having a beta of 1.00. Investments with a beta higher than 1.00 have been more volatile than the index; those with a beta of less than 1.00 have been less volatile.
bond A security representing a loan from the investor to the issuer. A bond typically pays interest at a fixed rate (the “coupon rate”) until a specified date (the “maturity date”), at which time the issuer returns the money borrowed (“principal” or “face value”) to the bondholder. Because of their structure, bonds are sometimes called “fixed income securities” or “debt securities.”
An individual bond is subject to the credit risk of the issuer. Changes in interest rates can affect a bond’s market value prior to call or maturity. There is no guarantee that a bond’s yield to call or maturity will provide a positive return over the rate of inflation.
bond fund A bond fund is subject to the same credit, interest rate, and inflation risks as bonds. In addition, a bond fund incurs ongoing fees and expenses. A bond fund’s net asset value will fluctuate with the price of the underlying bonds and the portfolio turnover activity; return of principal is not guaranteed.
cap, capitalization See “market cap.”
capital gain, capital loss The difference between the amount paid for an investment and its value at a later time. If the investment has been sold, the capital gain or loss is considered a realized gain or loss. If the investment is still held, the gain or loss is still “on paper” and is considered unrealized.
earnings growth rate For a mutual fund, the average yearly rate at which the earnings of the companies in the fund’s portfolio have grown, measured over the past five years.
earnings per share (EPS) A company’s earnings, or net income, for the past 12 months, divided by the number of shares outstanding.
expense ratio The amount that is taken from a mutual fund’s assets each year to cover the fund’s operating expenses. An expense ratio of 0.50% means that a fund’s expenses amount to half of one percent of its average net assets a year.
market cap, market capitalization The value of a company as determined by the total value of all shares of its stock outstanding.
median market cap The midpoint of the range of market caps of the stocks held by a fund. There are different ways of calculating median market cap. With a simple median, half of the stocks in the fund’s portfolio would be larger than the median, and half would be smaller. With a weighted median (the type that is calculated for these funds), half of the fund’s assets are invested in stocks that are larger than the median market cap, and half in stocks that are smaller.
net asset value (NAV) The value of one share of a mutual fund. NAV is calculated by taking the fund’s total assets, subtracting liabilities, and dividing by the number of shares outstanding.
outstanding shares, shares outstanding When speaking of a company or mutual fund, indicates all shares currently held by investors.
price-to-book ratio (P/B) The market price of a company’s stock compared with its “book value.” A mutual fund’s P/B is the weighted average of the P/B of all stocks in the fund’s portfolio.
price-to-earnings ratio (P/E) The market price of a company’s stock compared with earnings over the past year. A mutual fund’s P/E is the weighted average of the P/E of all stocks in the fund’s portfolio.
return on equity (ROE) The average yearly rate of return for each dollar of investors’ money, measured over the past five years.
stock A share of ownership, or equity, in the issuing company.
total return The percentage that an investor would have earned or lost on an investment in the fund assuming dividends and distributions were reinvested.
weighted average For mutual funds, an average that gives the same weight to each security as the security represents in the fund’s portfolio.
yield The income paid out by an investment, expressed as a percentage of the investment’s market value.
64
Schwab Funds® offers you an extensive family of mutual funds, each one based on a clearly defined investment approach and using disciplined management strategies. The list at right shows all currently available Schwab Funds. Whether you’re an experienced investor or just starting out, Schwab Funds can help you achieve your financial goals. An investor should consider a fund’s investment objectives, risks, and charges and expenses carefully before investing or sending money. This and other important information can be found in the fund’s prospectus. Please call 1-800-435-4000 for a prospectus and brochure for any Schwab Fund. Please read the prospectus carefully before you invest. This report must be preceded or accompanied by a current prospectus. Proxy Voting Policies, Procedures and Results A description of the proxy voting policies and procedures used to determine how to vote proxies on behalf of the funds is available without charge, upon request, by visiting Schwab’s website at www.schwab.com/schwabfunds, the SEC’s website at www.sec.gov, or by contacting Schwab Funds at 1-800-435-4000. Information regarding how a fund voted proxies relating to portfolio securities during the most recent twelve-month period ended June 30 is available, without charge, by visiting Schwab’s website at www.schwab.com/schwabfunds or the SEC’s website at www.sec.gov. | | The Schwab Funds Family® Stock Funds Schwab Premier Equity Fund®
Schwab Core Equity Fund™
Schwab Dividend Equity Fund™
Schwab Large-Cap Growth Fund™
Schwab Small-Cap Equity Fund™
Schwab Hedged Equity Fund™
Schwab Financial Services Fund™
Schwab Health Care Fund™
Schwab Technology Fund™
Schwab Institutional Select® S&P 500 Fund
Schwab S&P 500 Index Fund
Schwab 1000 Index® Fund
Schwab Small-Cap Index Fund®
Schwab Total Stock Market Index Fund®
Schwab International Index Fund®
Asset Allocation Funds Schwab Viewpoints Fund™
Schwab MarketTrack All Equity Portfolio™
Schwab MarketTrack Growth Portfolio™
Schwab MarketTrack Balanced Portfolio™
Schwab MarketTrack Conservative Portfolio™
Schwab Target 2010 Fund
Schwab Target 2020 Fund
Schwab Target 2030 Fund
Schwab Target 2040 Fund
Schwab Retirement Income Fund Bond Funds Schwab YieldPlus Fund®
Schwab Short-Term Bond Market Fund™
Schwab Total Bond Market Fund™
Schwab GNMA Fund™
Schwab Inflation Protected Fund™
Schwab Tax-Free YieldPlus Fund™
Schwab Short/Intermediate Tax-Free Bond Fund™
Schwab Long-Term Tax-Free Bond Fund™
Schwab California Tax-Free YieldPlus Fund™
Schwab California Short/Intermediate
Tax-Free Bond Fund™
Schwab California Long-Term Tax-Free Bond Fund™ Schwab Money Funds Schwab offers an array of money market funds that seek high current income consistent with safety and liquidity.1 Choose from taxable or tax-advantaged alternatives. Many can be linked to your eligible Schwab account to “sweep” cash balances automatically, subject to availability, when you’re between investments. Or, for your larger cash reserves, choose one of our Value Advantage Investments®. |
| | | |
| | | |
| | | 1 | Investments in money market funds are neither insured nor guaranteed by the Federal Deposit Insurance Corporation (FDIC) or any other government agency and, although they seek to preserve the value of your investment at $1 per share, it is possible to lose money. |
Investment Adviser
Charles Schwab Investment Management, Inc.
101 Montgomery Street, San Francisco, CA 94104
Funds
Schwab Funds®P.O. Box 3812, Englewood, CO 80155—3812
This report is not authorized for distribution to prospective investors unless preceded or accompanied by a current prospectus.
© 2006 Charles Schwab & Co., Inc. All rights reserved.
Member SIPC
Printed on recycled paper.
MFR13813-09
Annual Report
October 31, 2006 |  |
| | COMMAND PERFORMANCE™ |
Laudus MarketMasters Funds™
Laudus U.S. MarketMasters Fund™
Laudus Small-Cap MarketMasters Fund™
Laudus International MarketMasters Fund™
Three distinct Funds, each combining the expertise of leading investment managers with Schwab’s overall supervision.
In this report
| Performance at a Glance | | | | | 2 | |
| From the President | | | | | 3 | |
| Investment Environment | | | | | 4 | |
| Laudus U.S. MarketMasters Fund™ | | | | | 6 | |
| Laudus Small-Cap MarketMasters Fund™ | | | | | 8 | |
| Laudus International MarketMasters Fund™ | | | | | 10 | |
| Fund Expenses | | | | | 12 | |
| Financial Statements and Portfolio Holdings | | | | | 13 | |
| Financial Notes | | | | | 43 | |
| Investment Advisory and Sub-Advisory Agreement Approval | | | | | 51 | |
| Trustees and Officers | | | | | 54 | |
| Glossary | | | | | 58 | |
| | | | | | | |
Select Shares® are available for the MarketMasters Funds™The Laudus MarketMasters Funds offer Select Shares, a share class that carries lower expenses than Investor Shares™ in exchange for higher investment minimums. Select Shares are available for initial purchases of $50,000 or more of a single fund in a single account and for shareholders who add to their existing Investor Share position, bringing the value to or above $50,000. We encourage shareholders to review their portfolio to see if they are eligible to exchange into Select Shares. If you believe you are eligible, you should contact Schwab or your financial intermediary to request a tax-free interclass exchange into Select Shares. Select Shares may not be available through financial intermediaries other than Charles Schwab & Co., Inc.
To learn more, please see the Funds’ prospectus at www.laudus.com. Or call 1.800.435.4000 to order a prospectus or to speak with a representative.
The Laudus Group of Funds includes the Laudus Rosenberg Funds, which are part of the Laudus Trust and distributed by ALPS Distributor, Inc., and the Laudus MarketMasters Funds, which are part of the Schwab Capital Trust and distributed by Charles Schwab & Co., Inc. Charles Schwab & Co., Inc. (member SIPC) serves as dealer for the Laudus Funds.
The industry/sector classification of the funds’ portfolio holdings uses the Global Industry Classification Standard (GICS) which was developed by and is the exclusive property of Morgan Stanley Capital International Inc. and Standard & Poor’s. GICS is a service mark of MSCI and S&P and has been licensed for use by Charles Schwab & Co., Inc.
Performance at a Glance
The performance data quoted represents past performance. Past performance does not guarantee future results. Investment returns and principal value will fluctuate so that an investor’s shares may be worth more or less than their original cost. Current performance may be lower or higher than performance data quoted. To obtain performance information current to the most recent month end, please visit www.schwab.com/schwabfunds.
|
|
|
| Total Return for the Report Period
|
|---|
Laudus U.S. MarketMasters Fund™ | | | | | | |
| Investor Shares (Ticker Symbol: SWOGX) | | | | 14.71% |
| Select Shares (Ticker Symbol: SWMGX) | | | | 14.81% |
| Benchmark: S&P 500® Index | | | | 16.34% |
| Fund Category: Morningstar Large-Cap Blend | | | | 14.74% |
Performance Details | | | | pages 6–7 |
| | | | | | | |
Laudus Small-Cap MarketMasters Fund™ | | | | | | |
| Investor Shares (Ticker Symbol: SWOSX) | | | | 15.33% |
| Select Shares (Ticker Symbol: SWMSX) | | | | 15.61% |
| Benchmark: Russell 2000® Index | | | | 19.98% |
| Fund Category: Morningstar Small-Cap Blend | | | | 16.35% |
Performance Details | | | | pages 8–9 |
| | | | | | | |
Laudus International MarketMasters Fund™ | | | | | | |
| Investor Shares (Ticker Symbol: SWOIX) | | | | 24.66% |
| Select Shares (Ticker Symbol: SWMIX) | | | | 24.88% |
| Benchmark: MSCI-EAFE® Index | | | | 27.52% |
| Fund Category: Morningstar Foreign Large-Cap Growth | | | | 26.02% |
Performance Details | | | | pages 10–11 |
| | | | | | | |
Minimum Initial Investment1 | | | | | | |
| Investor Shares ($1,000 for retirement, education and custodial accounts) | | | | $ 2,500 |
| Select Shares | | | | $50,000 |
All fund and index figures on this page assume dividends and distributions were reinvested. Index figures do not include trading and management costs, which would lower performance. Indices are unmanaged, and you cannot invest in them directly. Performance results less than one year are not annualized.
Expenses may be partially absorbed by CSIM and Schwab. Without these reductions, the funds’ total returns would have been lower. Performance does not reflect the deduction of taxes that a shareholder would pay on fund distributions or on the redemption of fund shares.
Small-company stocks are subject to greater volatility than other asset categories. Foreign securities can involve risks such as political and economic instability and currency risk. These risks may be greater in emerging markets.
Source for category information: Morningstar, Inc.
1Please see prospectus for further detail and eligibility requirements.
2 Laudus MarketMasters Funds
| | | From the President |
| | | |
Evelyn Dilsaver is President and
CEO of Charles Schwab Investment
Management, Inc. and of each of
the funds covered in this report.
She joined the firm in 1992 and
has held a variety of executive
positions at Schwab.
| | Dear Shareholder, I am pleased to present the annual report for the Laudus MarketMasters Funds for the period ended October 31, 2006. At Laudus, our primary interests are to deliver strong performance and to protect the interests of our shareholders. Accordingly, as previously communicated to shareholders, we made several enhancements to the Laudus International MarketMasters Fund during this report period. We expect that these changes will expand the fund’s ability to execute its investment strategy and improve performance potential. First, we added two new sub-advisers, Mondrian Investment Partners Limited (Mondrian) and Wentworth, Hauser and Violich, Inc. Mondrian’s focus is on the international small-cap value sector, while Wentworth, Hauser and Violich, Inc. takes an opportunistic approach to the international large-cap growth sector. We also expanded current sub-adviser American Century Global Investment Management, Inc.’s small-cap mandate to include mid-cap growth. With this report, you will see that we have recently started an initiative to enhance the presentation of our shareholder reports to make it easier for you to find information about your fund. This book represents the first step in this process, with additional changes anticipated for future report cycles. You will notice, for example, that we have added a new lead page, Performance at a Glance, which includes the funds’ ticker symbols and report period returns for the funds, their benchmarks and category averages. For ease of reference, we have relocated the fund manager’s discussion to be in close proximity to the fund performance and portfolio statistics sections. At this time, I would like to highlight another valuable information resource for fund shareholders, namely, our website at www.laudus.com. This website contains regular updates about the Laudus Funds. I encourage you to visit the website to stay informed about your fund. With the support of investors like you, Laudus MarketMasters Funds assets exceed $2 billion as of this report date. I’d like to emphasize that your trust is very important to us and I will do all I can to maintain that trust. Thank you for investing in Laudus Funds. Sincerely, |
Laudus MarketMasters Fund 3
The Investment Environment
Jeffrey Mortimer, CFA, senior vice
president and chief investment
officer, equities, is responsible for the
overall management of the fund. | | As the U.S. economy transitioned to slower growth, equities markets rebounded, aided by higher corporate profitability, falling energy/commodity prices, and lower interest rates. The S&P 500 Index returned 16.34% and the Russell 2000 Index returned 19.98%, respectively, for the one-year report period ended October 31, 2006. Improving fundamentals and attractive valuations strengthened investor interest in emerging markets and the MSCI EAFE (Morgan Stanley Capital International, Inc. Europe, Australasia, and Far East) Index returned 27.52%. Performance in the bond markets has been mixed over the year, although the Lehman Brothers U.S. Aggregate Bond Index gained 5.19%. Several key issues continued to resonate with investors, including slowing economic growth, Federal Reserve (the Fed) policy, a sluggish real estate market, inflation concerns, and fluctuating energy prices. Economic growth has been anything but predictable over the past year. The last quarter of 2005 saw Gross Domestic Product (GDP) slow considerably as the economy adjusted to changes in inventories and higher energy prices. Although Hurricane Katrina remained a focal point in the news late in 2005, its economic impact was determined to be minimal as damage remained contained within the hurricane’s path. In the first quarter of 2006, GDP then rebounded, only to slow later in the year. Though falling existing home sales and lower motor vehicle production have done much to curtail growth in the eyes of the Fed, favorable labor market conditions, sustained increases in labor income, and lower energy prices continued to promote stable growth. The unemployment rate fell to a cyclical low of 4.4% in the third quarter of 2006 while consumer spending and business investment remained key contributors to GDP growth. In efforts to curb inflationary pressures, the Fed raised short-term interest rates six times during the period. August marked a key point in the year as Committee members decided to hold the Fed’s target rate at 5.25%, where it remained as of the end of the report period. In its statement, the Fed noted that the economy appeared |
Asset Class Performance Comparison % returns during the report period |
| | |
| This graph compares the performance of various asset classes during the report period. Final performance figures for the period are in the key below. | | | | |
| n 16.34% | S&P® 500 Index: measures U.S. large-cap stocks | | | |
| n 19.98% | Russell 2000® Index: measures U.S. small-cap stocks | | | |
| n 27.52% | MSCI EAFE® Index: measures (in U.S. dollars) large-cap stocks in Europe, Australasia and the Far East | | | |
| n 5.19% | Lehman Brothers U.S. Aggregate Bond Index: measures the U.S. bond market
| | | |
These figures assume dividends and distributions were reinvested. Index figures do not include trading and management costs, which would lower performance. Indices are unmanaged and you cannot invest in them directly. Remember that past performance is not an indication of future results.
Data source: Charles Schwab & Co., Inc.
4 Laudus MarketMasters Funds
The Investment Environment continued
to be growing at a more moderate rate as a result of prior rate increases, lagged effects of energy prices, and a cooling of the housing market. The Fed indicated they generally expected the economy to grow at a pace below its potential, which proved to be an accurate prediction. Consistent with the Fed’s report, GDP continued to decline, growing only 2.2% in the third quarter of 2006.
Energy prices have been a key issue in the markets over the past year. Following Hurricane Katrina, oil prices peaked around $71 per barrel, with domestic gasoline prices passing $3.00 a gallon. Prices subsequently fell, but rebounded nearly 21% early in 2006, partly due to concerns that Iran might cut back exports in response to a dispute over their nuclear program. Prices declined throughout the report period due to a lack of hurricanes in the Gulf of Mexico, as well as an increase in U.S. fuel inventories. More recently, abundant inventories, warmer weather, and skepticism regarding OPEC’s proposed production cuts contributed to a slip in oil prices. Crude oil has declined nearly 26% since July 2006’s record $78.40 per barrel, yet still remained around the $60–61 per barrel range at the end of the report period, as diminishing U.S. crude inventories and concern about global surplus lingered in investors’ minds.
The events of 2006 have also had a significant impact on the housing market. Housing starts fell considerably, down nearly 34% since the beginning of 2006. Existing home sales continued to decline as well, falling nearly 15% from their peak reached in 2005. Although sales have dropped, they remained strong by historical standards. Concerns remained as to whether the Fed’s actions, and the immediate effects on the housing market, would spill over into the rest of the economy. With regards to GDP, housing took off about one percent in the third quarter of 2006, although rebounds in income, consumer spending, and investments helped to offset the impact.
Despite a moderation in economic growth during the report period, economic fundamentals remained healthy as of the end of the period. The Fed’s task of balancing inflation pressures without significantly hindering economic growth will be thoroughly scrutinized in the coming months. The challenge is to bring this economy to a state of stable growth and achieve a soft landing.
Nothing in this report represents a recommendation of a security by the investment adviser.
Manager views and portfolio holdings may have changed since the report date.
Laudus MarketMasters Funds 5
Laudus U.S. MarketMasters Fund™

Jeffrey Mortimer, CFA, senior vice
president and chief investment
officer, equities, is responsible for the
overall management of the fund.
Caroline Lee, director and portfolio
manager, co-manages the fund. | | The Laudus MarketMasters Funds use a multi-manager strategy. CSIM, the funds’ investment adviser, uses rigorous criteria to select investment managers with proven long-term track records to manage a portion of each fund’s assets. In addition to selecting the investment managers and allocating assets among them, CSIM is responsible for monitoring and coordinating the overall management of the funds. The Laudus U.S. MarketMasters Fund Investor Shares returned 14.71% for the one-year period, trailing its benchmark, the S&P 500 Index, which gained 16.34% for the same period. Thornburg Investment Management, Inc. had a positive impact on the fund and outperformed its benchmark, the S&P 500 Index, due to strong stock selection in the Consumer Discretionary and Telecommunication Services sectors; positions in companies such as Las Vegas Sands Corporation, DirecTV Group, Comcast, NII Holdings, Inc. and American Tower Corporation positively contributed to return. TCW Investment Management Company tracked its benchmark, the Russell Mid-Cap Value Index, as gains in stock selection were offset by weak industry group selection, particularly within the Information Technology sector; holdings in ASML Holdings, Avid Technology, Inc. and Analog Devices, Inc. detracted from performance. Harris Associates L.P., the fund’s mid/large-cap value manager, fell short of outperforming the Russell 1000 Value Index as a result of poor stock selection, particularly in the Consumer Discretionary and Information Technology sectors; positions in Dell, Inc., Tiffany & Co. and Lennar Corp. detracted from returns. Gardner Lewis Asset Management L.P., whose focus is growth, also underperformed its benchmark, the Russell 1000 Growth Index, as a result of weak stock selection and sector allocation, particularly within the Health Care sector; holdings in such companies as St. Jude Medical, Inc. and Boston Scientific Corp. detracted from performance. In order to reduce exposure to large-cap growth, we reduced the fund’s allocation to Gardner Lewis over this report period and brought the fund closer to neutrality. |
As of 10/31/06:
Statistics |
| Number of Holdings | | | | 159 |
Weighted Average
Market Cap
($ x 1,000,000) | | | | 50,990 |
| Price/Earnings Ratio (P/E) | | | | 20.7 |
| Price/Book Ratio (P/B) | | | | 2.8 |
Sector Weightings % of Investments |
| Information Technology | | | | | 21.2 | % |
| Consumer Discretionary | | | | | 20.2 | % |
| Financials | | | | | 15.4 | % |
| Health Care | | | | | 14.2 | % |
| Industrials | | | | | 5.9 | % |
| Energy | | | | | 4.7 | % |
| Telecommunication Services | | | | | 3.9 | % |
| Consumer Staples | | | | | 3.6 | % |
| Materials | | | | | 3.1 | % |
| Utilities | | | | | 1.2 | % |
| Other | | | | | 6.6 | % |
Total | | | | | 100.0 | % |
Top Holdings % of Net Assets1 |
| Google, Inc., Class A | | | | | 1.8 | % |
| Comcast Corp. | | | | | 1.7 | % |
| Dell, Inc. | | | | | 1.7 | % |
| National Semiconductor Corp. | | | | | 1.3 | % |
| NII Holdings, Inc. | | | | | 1.2 | % |
| Hewlett-Packard Co. | | | | | 1.2 | % |
| Caremark Rx, Inc. | | | | | 1.2 | % |
| Exxon Mobil Corp. | | | | | 1.2 | % |
| Microsoft Corp. | | | | | 1.1 | % |
| YUM! Brands, Inc. | | | | | 1.1 | % |
Total | | | | | 13.5 | % |
Portfolio holdings may have changed since the report date.
Source of Sector Classification: S&P and MSCI.
1This list is not a recommendation of any security by the investment adviser.
6 Laudus MarketMasters Funds
Laudus U.S. MarketMasters Fund
Performance Summary as of 10/31/06
The performance data quoted represents past performance. Past performance does not guarantee future results.
Investment returns and principal value will fluctuate so that an investor’s shares may be worth more or less than their original cost. Current performance may be lower or higher than performance data quoted. To obtain performance information current to the most recent month end, please visit www.schwab.com/schwabfunds.
Performance of a Hypothetical
$10,000 Investment in Investor Shares1 | | | | Performance of a Hypothetical
$50,000 Investment in Select Shares1 |
| | | | |
Average Annual Total Returns1,2 |
Fund Class and Inception Date | | | | 1 year
| | 5 years | | Since Inception
|
| Investor Shares (11/18/96) | | | | | 14.71 | % | | | 7.23 | % | | 6.79% |
| Select Shares® (6/4/04) | | | | | 14.81 | % | | n/a
| | 9.51% |
| Benchmark: S&P 500® Index | | | | | 16.34 | % | | | 7.25 | % | | (11/18/96) 8.18% |
| | | | | | | | | | | | | (6/4/04) 11.08% |
| Fund Category: Morningstar Large-Cap Blend | | | | | 14.74 | % | | | 6.82 | % | | (11/18/96) 7.47% |
| | | | | | | | | | | | | (6/4/04) 10.46% |
Style Assessment3 |
| |
|
Investment Managers and Allocations |
Investment Manager
| | | | Investment Style
| | % of
Net Assets |
| Gardner Lewis Asset Management L.P. | | | | Large-Cap Growth | | | 23.0 | % |
| Harris Associates L.P. | | | | Mid/Large-Cap Value | | | 19.7 | % |
| TCW Investment Management Company | | | | Small/Mid-Cap Blend | | | 22.2 | % |
| Thornburg Investment Management, Inc. | | | | Large-Cap Blend | | | 32.9 | % |
All figures on this page assume dividends and distributions were reinvested. Index figures do not include trading and management costs, which would lower performance. Indices are unmanaged, and you cannot invest in them directly. Performance results less than one year are not annualized.
Because the Fund was originally an asset allocation Fund with a multi-fund strategy, its performance prior to June 3, 2002 does not reflect the current strategy and may have been different if it did.
1Fund expenses may have been partially absorbed by CSIM and Schwab. Without these reductions, the fund’s returns would have been lower. These returns do not reflect the deduction of taxes that a shareholder would pay on fund distributions or the redemption of fund shares.
2Source for category information: Morningstar, Inc.
3Source: Morningstar, Inc. This style assessment is the result of evaluating the fund based on a ten-factor model for value and growth characteristics. The fund’s market capitalization placement is determined by the geometric mean of its holdings’ market capitalizations. The assessment reflects the fund’s portfolio as of 10/31/06, which may have changed since then, and is not a precise indication of risk or performance—past, present, or future.
Laudus MarketMasters Funds 7
Laudus Small-Cap MarketMasters Fund™
Jeffrey Mortimer, CFA, senior vice
president and chief investment
officer, equities, is responsible for the
overall management of the fund.
Caroline Lee, director and portfolio
manager, co-manages the fund. | | The Laudus MarketMasters Funds use a multi-manager strategy. CSIM, the funds’ investment adviser, uses rigorous criteria to select investment managers with proven long-term track records to manage a portion of each fund’s assets. In addition to selecting the investment managers and llocating assets among them, CSIM is responsible for monitoring and coordinating the overall management of the funds. The Laudus Small-Cap MarketMasters Fund Investor Shares posted a positive return of 15.33% for the period, yet trailed its benchmark, the Russell 2000 Index, which was up 19.98%. A positive contributor to the fund’s returns was TAMRO Capital Partners, LLC, which beat its benchmark, the Russell 2000 Value Index, as a result of superior stock selection, particularly within the Financial and Industrials sectors; positions in First Marblehead Corp., Knight Capital Group, Inc., General Cable Corp. and Manitowoc Co., Inc. positively contributed to returns. Tocqueville Asset Management LP, whose focus is small-cap blend, also outperformed its benchmark, the Russell 2000 Index, primarily as a result of strong stock selection, particularly in the Energy and Information Technology sectors; holdings such as Aspen Technology, Inc., Oceaneering International, Inc. and TETRA Technologies, Inc. contributed to performance. TCW Investment Management Company tracked its benchmark, the Russell Mid-Cap Value Index, as gains in stock selection were offset by sector allocation. Veredus Asset Management LLC, whose focus is small-cap growth, underperformed its benchmark, the Russell 2000 Growth Index, mainly due to weak stock selection, particularly in Health Care and Consumer discretionary; positions in Foxhollow Technologies, Inc. and Syneron Medical, Ltd. detracted from returns. We have reduced the fund’s exposure to small-cap growth, as reflected by a reduction in Veredus’ allocation, and brought the fund closer to neutrality. |
As of 10/31/06:
Statistics |
| Number of Holdings | | | | 200 |
Weighted Average
Market Cap
($ x 1,000,000) | | | | 1,994 |
| Price/Earnings Ratio (P/E) | | | | 35.7 |
| Price/Book Ratio (P/B) | | | | 2.4 |
Sector Weightings % of Investments |
| Information Technology | | | | | 31.0 | % |
| Industrials | | | | | 16.1 | % |
| Health Care | | | | | 13.8 | % |
| Consumer Discretionary | | | | | 12.6 | % |
| Financials | | | | | 9.1 | % |
| Energy | | | | | 4.9 | % |
| Consumer Staples | | | | | 4.6 | % |
| Materials | | | | | 2.8 | % |
| Others | | | | | 5.1 | % |
Total | | | | | 100.0 | % |
Top Holdings % of Net Assets1 |
| The Hain Celestial Group, Inc. | | | | | 1.8 | % |
| ManTech International Corp., Class A | | | | | 1.4 | % |
| Baldor Electric Co. | | | | | 1.4 | % |
| Packeteer, Inc. | | | | | 1.3 | % |
| Analogic Corp. | | | | | 1.2 | % |
| The Manitowoc Co., Inc. | | | | | 1.1 | % |
| Pharmion Corp. | | | | | 1.1 | % |
| Vignette Corp. | | | | | 1.1 | % |
| Lionbridge Technologies, Inc. | | | | | 1.0 | % |
| Thoratec Corp. | | | | | 1.0 | % |
Total | | | | | 12.4 | % |
Portfolio holdings may have changed since the report date.
Source of Sector Classification: S&P and MSCI.
Small-company stocks are subject to greater volatility than other asset categories.
1This list is not a recommendation of any security by the investment adviser.
8 Laudus MarketMasters Funds
Laudus Small-Cap MarketMasters Fund
Performance Summary as of 10/31/06
The performance data quoted represents past performance. Past performance does not guarantee future results.
Investment returns and principal value will fluctuate so that an investor’s shares may be worth more or less than their original cost. Current performance may be lower or higher than performance data quoted. To obtain performance information current to the most recent month end, please visit www.schwab.com/schwabfunds.
Performance of a Hypothetical
$10,000 Investment in Investor Shares1 | | | | Performance of a Hypothetical
$50,000 Investment in Select Shares1 |
| | | | |
Average Annual Total Returns1,2 |
Fund Class and Inception Date | | | | 1 year
| | 5 years | | Since Inception
|
| Investor Shares (9/16/97) | | | | | 15.33 | % | | | 12.18 | % | | 7.09% |
| Select Shares (6/9/04) | | | | | 15.61 | % | | | n/a | | | 10.84% |
| Benchmark: Russell 2000® Index | | | | | 19.98 | % | | | 13.75 | % | | (9/16/97) 7.59% |
| | | | | | | | | | | | | (6/9/04) 13.83% |
| Fund Category: Morningstar Small-Cap Blend | | | | | 16.35 | % | | | 13.54 | % | | (9/16/97) 8.37% |
| | | | | | | | | | | | | (6/9/04) 13.90% |
Style Assessment3 |
| |
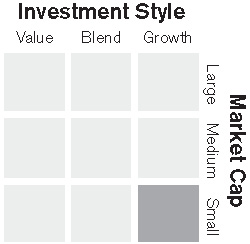 |
Investment Managers and Allocations |
Investment Manager
| | | | Investment Style
| | % of
Net Assets |
| TAMRO Capital Partners LLC | | | | Small-Cap Value/Blend | | | 34.0 | % |
| TCW Investment Management Company | | | | Small/Mid-Cap Blend | | | 19.9 | % |
| Tocqueville Asset Management L.P. | | | | Small-Cap Blend | | | 28.9 | % |
| Veredus Asset Management LLC | | | | Small-Cap Growth | | | 15.4 | % |
All figures on this page assume dividends and distributions were reinvested. Index figures do not include trading and management costs, which would lower performance. Indices are unmanaged, and you cannot invest in them directly. Performance results less than one year are not annualized.
Because the Fund was originally an asset allocation Fund with a multi-fund strategy, its performance prior to June 3, 2002 does not reflect the current strategy and may have been different if it did.
1Fund expenses may have been partially absorbed by CSIM and Schwab. Without these reductions, the fund’s returns would have been lower. These returns do not reflect the deduction of taxes that a shareholder would pay on fund distributions or the redemption of fund shares.
2Source for category information: Morningstar, Inc.
3Source: Morningstar, Inc. This style assessment is the result of evaluating the fund based on a ten-factor model for value and growth characteristics. The fund’s market capitalization placement is determined by the geometric mean of its holdings’ market capitalizations. The assessment reflects the fund’s portfolio as of 10/31/06, which may have changed since then, and is not a precise indication of risk or performance—past, present, or future.
Laudus MarketMasters Funds 9
Laudus International MarketMasters Fund™
Jeffrey Mortimer, CFA, senior vice
president and chief investment
officer, equities, is responsible for the
overall management of the fund.
Caroline Lee, director and portfolio
manager, co-manages the fund. | | The Laudus MarketMasters Funds use a multi-manager strategy. CSIM, the funds’ investment adviser, uses rigorous criteria to select investment managers with proven long-term track records to manage a portion of each fund’s assets. In addition to selecting the investment managers and allocating assets among them, CSIM is responsible for monitoring and coordinating the overall management of the funds. Laudus MarketMasters International Fund Investor Shares returned 24.66%, underperforming its benchmark, the MSCI EAFE Index, which was up 27.52% for the report period. This index is also the benchmark for each of the fund’s investment managers. Of the investment managers, Harris Associates L.P. was a positive contributor to returns, outperforming the benchmark. This was due to strong stock selection, primarily within the Financial sector, in which Willis Group Holdings Limited was a key contributor to performance. William Blair & Company, LLC, whose focus is growth, also outperformed the benchmark as a result of strong stock selection, particularly within the Financial and Industrials sectors; holdings in Bancolombia S.A. and UBS AG positively contributed to performance. Mondrian also outperformed the benchmark as a result of strong stock selection within the Industrials and Information Technology sectors; holdings in The Weir Group plc and TT Electronics plc added to performance. On the downside, American Century Global Investment Management, Inc. underperformed the benchmark, mainly due to poor sector allocation in the Financials and Information Technology; positions in Sierra Wireless, Inc. and Zoran Corp. detracted from performance. Wentworth, Hauser and Violich, Inc. underperformed the benchmark as a result of weak sector allocation. Within the Energy sector, holdings in such stocks as Nabors Industries Ltd. and Weatherford International Ltd. detracted from performance. |
As of 10/31/06:
Country Weightings % of Investments | | | | | | | |
| United Kingdom | | | | | 22.9 | % | | Italy | | | 2.8 | % |
| Japan | | | | | 10.3 | % | | Netherlands | | | 2.8 | % |
| Switzerland | | | | | 9.7 | % | | Singapore | | | 2.8 | % |
| Germany | | | | | 7.9 | % | | Canada | | | 2.6 | % |
| France | | | | | 6.7 | % | | Other Countries | | | 24.8 | % |
| Australia | | | | | 2.8 | % | | Cash & Cash Equivalents | | | 3.9 | % |
| | | | | | | | | Total | | | 100.0 | % |
Statistics |
| Number of Holdings | | | | 528 |
Weighted Average
Market Cap
($ x 1,000,000) | | | | 23,665 |
| Price/Earnings Ratio (P/E) | | | | 20.0 |
| Price/Book Ratio (P/B) | | | | 2.9 |
Sector Weightings % of Investments |
| Consumer Discretionary | | | | | 22.3 | % |
| Financials | | | | | 19.3 | % |
| Industrials | | | | | 18.7 | % |
| Information Technology | | | | | 7.6 | % |
| Health Care | | | | | 7.0 | % |
| Consumer Staples | | | | | 6.9 | % |
| Materials | | | | | 5.1 | % |
| Energy | | | | | 4.7 | % |
| Telecommunication Services | | | | | 3.5 | % |
| Utilities | | | | | 0.9 | % |
| Others | | | | | 4.0 | % |
Total | | | | | 100.0 | % |
Top Holdings % of Net Assets1 |
| UBS AG | | | | | 1.5 | % |
| GlaxoSmithKline plc | | | | | 1.4 | % |
| DaimlerChrysler AG | | | | | 1.4 | % |
British Sky Broadcasting
Group plc | | | | | 1.3 | % |
| Signet Group plc | | | | | 1.2 | % |
| Novartis AG — Reg’d. | | | | | 1.1 | % |
| SK Telecom Co., Ltd. | | | | | 1.0 | % |
| Credit Suisse Group | | | | | 1.0 | % |
| Diageo plc | | | | | 1.0 | % |
| Adecco S.A. | | | | | 1.0 | % |
Total | | | | | 11.9 | % |
Portfolio holdings may have changed since the report date.
Source of Sector Classification: S&P and MSCI.
Foreign securities can involve risks such as political and economic instability and currency risk. These risks may be greater in emerging markets.
1This list is not a recommendation of any security by the investment adviser.
10 Laudus MarketMasters Funds
Laudus International MarketMasters Fund
Performance Summary as of 10/31/06
The performance data quoted represents past performance. Past performance does not guarantee future results.
Investment returns and principal value will fluctuate so that an investor’s shares may be worth more or less than their original cost. Current performance may be lower or higher than performance data quoted. To obtain performance information current to the most recent month end, please visit www.schwab.com/schwabfunds.
Performance of a Hypothetical
$10,000 Investment in Investor Shares1 | | | | Performance of a Hypothetical
$50,000 Investment in Select Shares1 |
| | | | |
Average Annual Total Returns1,2 |
Fund Class and Inception Date | | | | | 1 year | | 5 years | | 10 years | | Since Inception |
| Investor Shares (10/16/96) | | | | | 24.66 | % | | | 15.73 | % | | | 12.08 | % | | n/a |
| Select Shares® (4/2/04) | | | | | 24.88 | % | | | n/a | | | | n/a | | | 18.30% |
| Benchmark: MSCI-EAFE® Index | | | | | 27.52 | % | | | 14.55 | % | | | 7.33 | % | | (4/2/04) 18.09% |
| Fund Category: Morningstar Foreign Large-Cap Growth | | | | | 26.02 | % | | | 12.49 | % | | | 6.74 | % | | (4/2/04) 16.03% |
Investment Managers and Allocations |
Investment Manager
| | | | Investment Style
| | % of
Net Assets |
| American Century Global Investment Management, Inc. | | | | International
Small/Mid-Cap | | | 25.8 | % |
| Wentworth, Hauser and Violich | | | | International Growth | | | 3.9 | % |
| Harris Associates LP | | | | International Value | | | 33.2 | % |
| William Blair & Company, LLC | | | | International Growth | | | 21.2 | % |
| Mondrian Investment Partners Limited | | | | International Small-Cap | | | 14.6 | % |
All figures on this page assume dividends and distributions were reinvested. Index figures do not include trading and management costs, which would lower performance. Indices are unmanaged, and you cannot invest in them directly. Performance results less than one year are not annualized.
Because the Fund was originally an asset allocation Fund with a multi-fund strategy, its performance prior to June 3, 2002 does not reflect the current strategy and may have been different if it did.
1Fund expenses may have been partially absorbed by CSIM and Schwab. Without these reductions, the fund’s returns would have been lower. These returns do not reflect the deduction of taxes that a shareholder would pay on fund distributions or the redemption of fund shares.
2Source for category information: Morningstar, Inc.
Laudus MarketMasters Funds 11
Fund Expenses (Unaudited)
Examples for a $1,000 Investment |
As a fund shareholder, you incur two types of costs: transaction costs, such as redemption fees; and, ongoing costs, such as management fees, transfer agent and shareholder services fees, and other fund expenses.
The expense examples below are intended to help you understand your ongoing cost (in dollars) of investing in a fund and to compare this cost with the ongoing cost of investing in other mutual funds. These examples are based on an investment of $1,000 invested for six-months beginning May 1, 2006 and held through October 31, 2006.
Actual Return lines in the table below provide information about actual account values and actual expenses. You may use this information, together with the amount you invested, to estimate the expenses that you paid over the period. To do so, simply divide your account value by $1,000 (for example, an $8,600 account value ÷ $1,000 = 8.6), then multiply the result by the number given for your fund or share class under the heading entitled “Expenses Paid During Period.”
Hypothetical Return lines in the table below provide information about hypothetical account values and hypothetical expenses based on a fund’s or share class’ actual expense ratio and an assumed return of 5% per year before expenses. Because the return used is not an actual return, it may not be used to estimate the actual ending account value or expenses you paid for the period.
You may use this information to compare the ongoing costs of investing in the fund and other funds. To do so, compare this 5% hypothetical example with the 5% hypothetical examples that appear in the shareholder reports of the other funds.
Please note that the expenses shown in the table are meant to highlight your ongoing costs only, and do not reflect any transactional costs, such as redemption fees. If these transactional costs were included, your costs would have been higher.
|
|
|
| Expense Ratio1
(Annualized)
|
| Beginning
Account Value
at 5/1/06
|
| Ending
Account Value
(Net of Expenses)
at 10/31/06
|
| Expenses Paid
During Period2
5/1/06–10/31/06
|
|---|
Laudus U.S. MarketMasters Fund™ | | | | | | | | | | | | | | | | | | |
Investor Shares | | | | | | | | | | | | | | | | | | |
| Actual Return | | | | | 1.15 | % | | $ | 1,000 | | | $ | 1,036.10 | | | $ | 5.90 | |
| Hypothetical 5% Return | | | | | 1.15 | % | | $ | 1,000 | | | $ | 1,019.41 | | | $ | 5.85 | |
Select Shares® | | | | | | | | | | | | | | | | | | |
| Actual Return | | | | | 0.92 | % | | $ | 1,000 | | | $ | 1,036.90 | | | $ | 4.72 | |
| Hypothetical 5% Return | | | | | 0.92 | % | | $ | 1,000 | | | $ | 1,020.57 | | | $ | 4.69 | |
Laudus Small-Cap MarketMasters Fund™ | | | | | | | | | | | | | | | | | | |
Investor Shares | | | | | | | | | | | | | | | | | | |
| Actual Return | | | | | 1.40 | % | | $ | 1,000 | | | $ | 969.30 | | | $ | 6.95 | |
| Hypothetical 5% Return | | | | | 1.40 | % | | $ | 1,000 | | | $ | 1,018.15 | | | $ | 7.12 | |
Select Shares | | | | | | | | | | | | | | | | | | |
| Actual Return | | | | | 1.11 | % | | $ | 1,000 | | | $ | 970.10 | | | $ | 5.51 | |
| Hypothetical 5% Return | | | | | 1.11 | % | | $ | 1,000 | | | $ | 1,019.61 | | | $ | 5.65 | |
Laudus International MarketMasters Fund™ | | | | | | | | | | | | | | | | | | |
Investor Shares | | | | | | | | | | | | | | | | | | |
| Actual Return | | | | | 1.52 | % | | $ | 1,000 | | | $ | 1,000.00 | | | $ | 7.67 | |
| Hypothetical 5% Return | | | | | 1.52 | % | | $ | 1,000 | | | $ | 1,017.54 | | | $ | 7.74 | |
Select Shares | | | | | | | | | | | | | | | | | | |
| Actual Return | | | | | 1.34 | % | | $ | 1,000 | | | $ | 1,001.40 | | | $ | 6.75 | |
| Hypothetical 5% Return | | | | | 1.34 | % | | $ | 1,000 | | | $ | 1,018.46 | | | $ | 6.80 | |
1 | | Based on the most recent six-month expense ratio; may differ from the expense ratio provided in Financial Highlights. |
2 | | Expenses for each fund or share class are equal to its annualized expense ratio, multiplied by the average account value over the period, multiplied by 184 days of the period, and divided by 365 days of the fiscal year. |
12 Laudus MarketMasters Funds
Laudus U.S. MarketMasters Fund™
Financial Statements
Financial Highlights
Investor Shares
| | | | 11/1/05—
10/31/06 | | 11/1/04—
10/31/05 | | 11/1/03—
10/31/04 | | 11/1/02—
10/31/03 | | 11/1/01—
10/31/02 |
|---|
Per-Share Data ($) |
| Net asset value at beginning of period | | | | | 11.26 | | | | 10.30 | | | | 9.94 | | | | 7.48 | | | | 9.20 | |
Income or loss from investment operations:
|
| Net investment income or loss | | | | | 0.03 | | | | 0.02 | | | | (0.03 | ) | | | (0.01 | ) | | | 0.06 | |
| Net realized and unrealized gains or losses | | | | | 1.63 | | | | 0.94 | | | | 0.39 | | | | 2.47 | | | | (1.68 | ) |
| Total income or loss from investment operations | | | | | 1.66 | | | | 0.96 | | | | 0.36 | | | | 2.46 | | | | (1.62 | ) |
Less distributions:
|
| Dividends from net investment income | | | | | (0.02 | ) | | | — | | | | — | | | | — | | | | (0.10 | ) |
| Net asset value at end of period | | | | | 12.90 | | | | 11.26 | | | | 10.30 | | | | 9.94 | | | | 7.48 | |
| Total return (%) | | | | | 14.71 | | | | 9.32 | | | | 3.62 | | | | 32.89 | | | | (17.92 | ) |
| |
Ratios/Supplemental Data (%) |
| |
Ratios to average net assets:
|
| Net operating expenses | | | | | 1.20 | 1 | | | 1.25 | | | | 1.25 | | | | 1.25 | | | | 0.83 | 2,3 |
| Gross operating expenses | | | | | 1.37 | | | | 1.38 | | | | 1.39 | | | | 1.42 | | | | 1.16 | 3 |
| Net investment income or loss | | | | | 0.18 | | | | 0.14 | | | | (0.25 | ) | | | (0.12 | ) | | | 0.50 | |
| Portfolio turnover rate | | | | | 65 | | | | 83 | | | | 72 | | | | 97 | | | | 390 | |
| Net assets, end of period ($ x 1,000,000) | | | | | 134 | | | | 150 | | | | 180 | | | | 169 | | | | 129 | |
Select Shares
| | | | 11/1/05—
10/31/06 | | 11/1/04—
10/31/05 | | 6/4/044—
10/31/04 | |
|---|
Per-Share Data ($) |
| Net asset value at beginning of period | | | | | 11.30 | | | | 10.32 | | | | 10.42 | | | | | | | | | |
| Income or loss from investment operations: |
| Net investment income or loss | | | | | 0.04 | | | | 0.02 | | | | (0.00 | )5 | | | | | | | | |
| Net realized and unrealized gains or losses | | | | | 1.63 | | | | 0.96 | | | | (0.10 | ) | | | | | | | | |
| Total income or loss from investment operations | | | | | 1.67 | | | | 0.98 | | | | (0.10 | ) | | | | | | | | |
| Less distributions: |
| Dividends from net investment income | | | | | (0.04 | ) | | | — | | | | — | | | | | | | | | |
| Net asset value at end of period | | | | | 12.93 | | | | 11.30 | | | | 10.32 | | | | | | | | | |
| Total return (%) | | | | | 14.81 | | | | 9.50 | | | | (0.96 | )6 | | | | | | | | |
| |
Ratios/Supplemental Data (%) |
| |
| Ratios to average net assets: |
| Net operating expenses | | | | | 0.97 | 7 | | | 1.07 | | | | 1.07 | 8 | | | | | | | | |
| Gross operating expenses | | | | | 1.33 | | | | 1.33 | | | | 1.37 | 8 | | | | | | | | |
| Net investment income or loss | | | | | 0.43 | | | | 0.25 | | | | (0.08 | )8 | | | | | | | | |
| Portfolio turnover rate | | | | | 65 | | | | 83 | | | | 72 | 6 | | | | | | | | |
| Net assets, end of period ($ x 1,000,000) | | | | | 8 | | | | 2 | | | | 1 | | | | | | | | | |
1 | | The ratio of net operating expenses would have been 1.25%, if custody credits had not been included. |
2 | | The ratio of net operating expenses would have been 0.74% if certain non-routine expenses (proxy fees) had not been included. |
3 | | Prior to the fund’s change in structure on June 3, 2002, the expenses incurred by underlying funds in which the fund invested were not included in this ratio. |
4 | | Commencement of operations. |
5 | | Per share amount was less than $0.01. |
7 | | The ratio of net operating expenses would have been 1.07%, if custody credits had not been included. |
See financial notes. 13
Laudus U.S. MarketMasters Fund
Portfolio Holdings as of October 31, 2006
This section shows all the securities in the fund’s portfolio and their value as of the report date.
The fund files its complete schedule of portfolio holdings with the SEC for the first and third quarters of each fiscal year on Form N-Q. The fund’s Form N-Q is available on the SEC’s website at http://www.sec.gov and may be viewed and copied at the SEC’s Public Reference Room in Washington, D.C. Call 1-800-SEC-0330 for information on the operation of the Public Reference Room. The schedule of portfolio holdings filed on a fund’s most recent Form N-Q is also available by visiting Schwab’s website at www.schwab.com/schwabfunds.
Holdings by Category
|
| Cost
($ x 1,000)
|
| Value
($ x 1,000)
|
|
|---|
89.7% | | | | Common Stock | | | 102,945 | | | | 126,959 | |
4.6% | | | | Foreign Common Stock | | | 6,271 | | | | 6,452 | |
6.7% | | | | Short-Term Investment | | | 9,430 | | | | 9,430 | |
101.0% | | | | Total Investments | | | 118,646 | | | | 142,841 | |
(1.0)% | | | | Other Assets and Liabilities | | | | | | | (1,400 | ) |
100.0% | | | | Net Assets | | | | | | | 141,441 | |
Security
| | | | Number
of Shares | | Value
($ x 1,000) |
|---|
Common Stock 89.7% of net assets |
Banks 3.2% |
| Commerce Bancorp, Inc. | | | | | 8,660 | | | | 302 | |
| Freddie Mac | | | | | 16,926 | | | | 1,168 | |
| Marshall & Ilsley Corp. | | | | | 13,200 | | | | 633 | |
| New York Community Bancorp, Inc. | | | | | 8,757 | | | | 143 | |
| People’s Bank | | | | | 15,765 | | | | 642 | |
| SVB Financial Group* | | | | | 11,178 | | | | 514 | |
| Washington Mutual, Inc. | | | | | 25,000 | | | | 1,058 | |
| | | | | | | | | | 4,460 | |
Capital Goods 4.3% |
| Alliant Techsystems, Inc.* | | | | | 6,600 | | | | 510 | |
| Danaher Corp. | | | | | 9,800 | | | | 703 | |
| Dover Corp. | | | | | 11,200 | | | | 532 | |
| General Electric Co. | | | | | 37,800 | | | | 1,327 | |
| Pentair, Inc. | | | | | 21,100 | | | | 695 | |
| SPX Corp. | | | | | 9,890 | | | | 569 | |
| Teleflex, Inc. | | | | | 7,000 | | | | 435 | |
| Tyco International Ltd. | | | | | 46,000 | | | | 1,354 | |
| | | | | | | | | | 6,125 | |
Commercial Services & Supplies 0.1% |
| SAIC, Inc* | | | | | 10,600 | | | | 212 | |
Consumer Durables & Apparel 2.3% |
| Coach, Inc.* | | | | | 8,400 | | | | 333 | |
| Jones Apparel Group, Inc. | | | | | 17,065 | | | | 570 | |
| Leggett & Platt, Inc. | | | | | 19,650 | | | | 459 | |
| Lennar Corp., Class A | | | | | 22,000 | | | | 1,044 | |
| Nike, Inc., Class B | | | | | 3,700 | | | | 340 | |
| The Stanley Works | | | | | 10,340 | | | | 493 | |
| | | | | | | | | | 3,239 | |
Consumer Services 5.9% |
| Carnival Corp. | | | | | 29,000 | | | | 1,416 | |
| Las Vegas Sands Corp.* | | | | | 16,900 | | | | 1,288 | |
| McDonald’s Corp. | | | | | 35,400 | | | | 1,484 | |
| Regis Corp. | | | | | 18,200 | | | | 683 | |
| Starwood Hotels & Resorts Worldwide, Inc. | | | | | 8,000 | | | | 478 | |
| The Cheesecake Factory, Inc.* | | | | | 25,400 | | | | 717 | |
| Wynn Resorts Ltd. * | | | | | 10,100 | | | | 743 | |
| YUM! Brands, Inc. | | | | | 26,600 | | | | 1,582 | |
| | | | | | | | | | 8,391 | |
Diversified Financials 8.8% |
| American Capital Strategies Ltd. | | | | | 15,700 | | | | 678 | |
| American Express Co. | | | | | 15,600 | | | | 902 | |
| Capital One Financial Corp. | | | | | 12,100 | | | | 960 | |
| Chicago Mercantile Exchange Holdings, Inc. | | | | | 1,463 | | | | 733 | |
| Citigroup, Inc. | | | | | 26,500 | | | | 1,329 | |
| Federated Investors, Inc., Class B | | | | | 19,900 | | | | 682 | |
| JPMorgan Chase & Co. | | | | | 28,000 | | | | 1,328 | |
| Mellon Financial Corp. | | | | | 32,100 | | | | 1,246 | |
| Morgan Stanley | | | | | 19,500 | | | | 1,490 | |
| Nuveen Investments, Inc., Class A | | | | | 18,000 | | | | 888 | |
| NYSE Group, Inc.* | | | | | 13,100 | | | | 969 | |
| The Goldman Sachs Group, Inc. | | | | | 6,350 | | | | 1,205 | |
| | | | | | | | | | 12,410 | |
Energy 4.8% |
| Apache Corp. | | | | | 17,800 | | | | 1,163 | |
| Cameron International Corp.* | | | | | 6,000 | | | | 301 | |
| ChevronTexaco Corp. | | | | | 22,175 | | | | 1,490 | |
| ConocoPhillips | | | | | 17,700 | | | | 1,066 | |
| Exxon Mobil Corp. | | | | | 23,800 | | | | 1,700 | |
| Murphy Oil Corp. | | | | | 6,400 | | | | 302 | |
| Valero Energy Corp. | | | | | 9,045 | | | | 473 | |
| Weatherford International Ltd.* | | | | | 6,100 | | | | 250 | |
| | | | | | | | | | 6,745 | |
Food & Staples Retailing 1.9% |
| Costco Wholesale Corp. | | | | | 8,200 | | | | 438 | |
| CVS Corp. | | | | | 27,300 | | | | 857 | |
| Rite Aid Corp.* | | | | | 196,900 | | | | 921 | |
| Sysco Corp. | | | | | 14,500 | | | | 507 | |
| | | | | | | | | | 2,723 | |
14 See financial notes.
Laudus U.S. MarketMasters Fund
Portfolio Holdings continued
Security
| | | | Number
of Shares | | Value
($ x 1,000) |
|---|
Food, Beverage & Tobacco 1.1% |
| Molson Coors Brewing Co., Class B | | | | | 5,640 | | | | 401 | |
| Pilgrim’s Pride Corp., Class B | | | | | 18,000 | | | | 450 | |
| The Hershey Co. | | | | | 13,000 | | | | 688 | |
| | | | | | | | | | 1,539 | |
Health Care Equipment & Services 9.4% |
| Alcon, Inc. | | | | | 5,510 | | | | 584 | |
| Bausch & Lomb, Inc. | | | | | 13,400 | | | | 717 | |
| Baxter International, Inc. | | | | | 25,500 | | | | 1,172 | |
| Beckman Coulter, Inc. | | | | | 6,900 | | | | 397 | |
| Boston Scientific Corp.* | | | | | 51,603 | | | | 821 | |
| Caremark Rx, Inc. | | | | | 34,850 | | | | 1,716 | |
| CIGNA Corp. | | | | | 8,200 | | | | 959 | |
| Cytyc Corp.* | | | | | 10,900 | | | | 288 | |
| Eclipsys Corp.* | | | | | 42,350 | | | | 897 | |
| Edwards Lifesciences Corp.* | | | | | 8,400 | | | | 361 | |
| HEALTHSOUTH Corp.* | | | | | 20,000 | | | | 485 | |
| Hillenbrand Industries, Inc. | | | | | 9,400 | | | | 552 | |
| Hospira, Inc.* | | | | | 16,580 | | | | 603 | |
| Humana, Inc.* | | | | | 18,500 | | | | 1,110 | |
| St. Jude Medical, Inc.* | | | | | 11,800 | | | | 405 | |
| Tenet Healthcare Corp.* | | | | | 64,400 | | | | 455 | |
| Triad Hospitals, Inc.* | | | | | 11,800 | | | | 437 | |
| WellPoint, Inc.* | | | | | 16,900 | | | | 1,290 | |
| | | | | | | | | | 13,249 | |
Household & Personal Products 0.6% |
| Procter & Gamble Co. | | | | | 14,100 | | | | 894 | |
Insurance 2.5% |
| American International Group, Inc. | | | | | 20,900 | | | | 1,404 | |
| Arthur J. Gallagher & Co. | | | | | 21,650 | | | | 603 | |
| Assurant, Inc. | | | | | 8,710 | | | | 459 | |
| MetLife, Inc. | | | | | 11,300 | | | | 645 | |
| Old Republic International Corp. | | | | | 21,375 | | | | 482 | |
| | | | | | | | | | 3,593 | |
Materials 3.1% |
| Air Products & Chemicals, Inc. | | | | | 15,600 | | | | 1,087 | |
| Cytec Industries, Inc. | | | | | 10,130 | | | | 561 | |
| International Flavors & Fragrances, Inc. | | | | | 16,000 | | | | 680 | |
| Monsanto Co. | | | | | 14,600 | | | | 645 | |
| Southern Copper Corp. | | | | | 27,000 | | | | 1,387 | |
| | | | | | | | | | 4,360 | |
Media 6.1% |
| Cablevision Systems Corp., Class A* | | | | | 30,000 | | | | 834 | |
| Comcast Corp.* | | | | | 59,450 | | | | 2,407 | |
| Liberty Global, Inc., Class A* | | | | | 6,448 | | | | 169 | |
| Liberty Global, Inc., Class C* | | | | | 46,539 | | | | 1,183 | |
| Liberty Media Holding Corp. — Capital* | | | | | 8,310 | | | | 740 | |
| The DIRECTV Group, Inc.* | | | | | 51,911 | | | | 1,157 | |
| The Walt Disney Co. | | | | | 20,200 | | | | 635 | |
| Time Warner, Inc. | | | | | 75,300 | | | | 1,507 | |
| | | | | | | | | | 8,632 | |
Pharmaceuticals & Biotechnology 3.6% |
| Fisher Scientific International, Inc.* | | | | | 15,200 | | | | 1,301 | |
| Johnson & Johnson | | | | | 14,845 | | | | 1,001 | |
| Pfizer, Inc. | | | | | 45,700 | | | | 1,218 | |
| Thermo Electron Corp.* | | | | | 18,300 | | | | 784 | |
| Valeant Pharmaceuticals International* | | | | | 11,232 | | | | 210 | |
| Varian, Inc.* | | | | | 12,120 | | | | 568 | |
| | | | | | | | | | 5,082 | |
Retailing 5.0% |
| Abercrombie & Fitch Co., Class A | | | | | 12,900 | | | | 989 | |
| Bed Bath & Beyond, Inc.* | | | | | 10,600 | | | | 427 | |
| Best Buy Co., Inc. | | | | | 16,400 | | | | 906 | |
| Federated Department Stores, Inc. | | | | | 16,896 | | | | 742 | |
| J.C. Penney Co., Inc. | | | | | 6,900 | | | | 519 | |
| Target Corp. | | | | | 22,900 | | | | 1,355 | |
| The Gap, Inc. | | | | | 38,700 | | | | 814 | |
| Tiffany & Co. | | | | | 36,000 | | | | 1,286 | |
| | | | | | | | | | 7,038 | |
Semiconductors & Semiconductor Equipment 7.8% |
| Analog Devices, Inc. | | | | | 27,900 | | | | 888 | |
| Applied Materials, Inc. | | | | | 33,700 | | | | 586 | |
| Broadcom Corp., Class A* | | | | | 22,050 | | | | 667 | |
| Cypress Semiconductor Corp.* | | | | | 21,300 | | | | 357 | |
| Intel Corp. | | | | | 71,600 | | | | 1,528 | |
| International Rectifier Corp.* | | | | | 13,200 | | | | 475 | |
| KLA-Tencor Corp. | | | | | 9,800 | | | | 482 | |
| LSI Logic Corp.* | | | | | 62,800 | | | | 631 | |
| MEMC Electronic Materials, Inc.* | | | | | 26,600 | | | | 944 | |
| Microchip Technology, Inc. | | | | | 18,000 | | | | 593 | |
| Micron Technology, Inc.* | | | | | 41,600 | | | | 601 | |
| National Semiconductor Corp. | | | | | 74,925 | | | | 1,820 | |
| Novellus Systems, Inc.* | | | | | 27,150 | | | | 751 | |
| Teradyne, Inc.* | | | | | 55,550 | | | | 779 | |
| | | | | | | | | | 11,102 | |
See financial notes. 15
Laudus U.S. MarketMasters Fund
Portfolio Holdings continued
Security
| | | | Number
of Shares | | Value
($ x 1,000) |
|---|
Software & Services 5.5% |
| Activision, Inc.* | | | | | 27,845 | | | | 429 | |
| Adobe Systems, Inc.* | | | | | 17,200 | | | | 658 | |
| BearingPoint, Inc.* | | | | | 115,420 | | | | 962 | |
| Google, Inc., Class A* | | | | | 5,326 | | | | 2,537 | |
| McAfee, Inc.* | | | | | 15,300 | | | | 443 | |
| Microsoft Corp. | | | | | 55,100 | | | | 1,582 | |
| Oracle Corp.* | | | | | 61,300 | | | | 1,132 | |
| | | | | | | | | | 7,743 | |
Technology Hardware & Equipment 7.8% |
| ADC Telecommunications, Inc.* | | | | | 40,900 | | | | 585 | |
| Apple Computer, Inc.* | | | | | 11,600 | | | | 941 | |
| Corning, Inc.* | | | | | 35,400 | | | | 723 | |
| Dell, Inc.* | | | | | 96,100 | | | | 2,338 | |
| Diebold, Inc. | | | | | 13,580 | | | | 593 | |
| Hewlett-Packard Co. | | | | | 45,000 | | | | 1,744 | |
| Motorola, Inc. | | | | | 39,200 | | | | 904 | |
| QUALCOMM, Inc. | | | | | 19,000 | | | | 692 | |
| Sun Microsystems, Inc.* | | | | | 117,300 | | | | 637 | |
| Tektronix, Inc. | | | | | 15,220 | | | | 462 | |
| Vishay Intertechnology, Inc.* | | | | | 48,200 | | | | 650 | |
| Xerox Corp.* | | | | | 44,900 | | | | 763 | |
| | | | | | | | | | 11,032 | |
Telecommunication Services 3.3% |
| American Tower Corp., Class A* | | | | | 39,400 | | | | 1,419 | |
| Leap Wireless International, Inc.* | | | | | 8,570 | | | | 475 | |
| Level 3 Communications, Inc.* | | | | | 181,000 | | | | 958 | |
| NII Holdings, Inc.* | | | | | 27,100 | | | | 1,762 | |
| | | | | | | | | | 4,614 | |
Transportation 1.4% |
| JetBlue Airways Corp.* | | | | | 90,700 | | | | 1,139 | |
| Union Pacific Corp. | | | | | 10,000 | | | | 906 | |
| | | | | | | | | | 2,045 | |
Utilities 1.2% |
| Entergy Corp. | | | | | 10,900 | | | | 936 | |
| TXU Corp. | | | | | 12,600 | | | | 795 | |
| | | | | | | | | | 1,731 | |
Foreign Common Stock 4.6% of net assets |
France 1.1% |
Automobiles & Components 0.6% |
| PSA Peugeot Citroen | | | | | 15,700 | | | | 902 | |
| |
Pharmaceuticals & Biotechnology 0.5% |
Sanofi-Aventis (a) | | | | | 15,000 | | | | 640 | |
| | | | | | | | | | 1,542 | |
Hong Kong 0.6% |
Banks 0.6% |
| HSBC Holdings plc | | | | | 49,000 | | | | 925 | |
Israel 0.5% |
Pharmaceuticals & Biotechnology 0.5% |
Teva Pharmaceutical Industries Ltd. (a) | | | | | 20,200 | | | | 666 | |
Japan 0.5% |
Automobiles & Components 0.5% |
Honda Motor Co., Ltd. (a) | | | | | 18,400 | | | | 650 | |
Netherlands 0.3% |
Semiconductors & Semiconductor Equipment 0.3% |
| ASML Holding N.V.* | | | | | 19,900 | | | | 455 | |
Taiwan 0.7% |
Telecommunication Services 0.7% |
Chunghwa Telecom Co., Ltd. (a) | | | | | 53,894 | | | | 986 | |
United Kingdom 0.9% |
Insurance 0.5% |
| Willis Group Holdings Ltd. | | | | | 16,900 | | | | 642 | |
Pharmaceuticals & Biotechnology 0.4% |
GlaxoSmithKline plc (a) | | | | | 11,000 | | | | 586 | |
| | | | | | | | | | 1,228 | |
Security
Rate, Maturity Date
| | | | Face Amount
($ x 1,000) | | Value
($ x 1,000) |
|---|
Short-Term Investment 6.7% of net assets |
Repurchase Agreements 6.7% |
Fixed Income Clearing
Corp. dated 10/31/06, due
11/01/06 at 4.8%, with
a maturity value of $9,431
(fully collateralized by Federal
National Mortgage Association
with a value of $9,764.) | | | | | 9,430 | | | | 9,430 | |
At 10/31/06 the tax basis cost of the fund’s investments was $119,527 and the unrealized appreciation and depreciation were $25,098 and ($1,784), respectively, with a net unrealized appreciation of $23,314.
| * | | Non-income producing security. |
(a) | | American Depository Receipt. |
16 See financial notes.
Laudus U.S. MarketMasters Fund
Statement of
Assets and Liabilities
As of October 31, 2006. All numbers are x 1,000 except NAV.
Assets | | | | | | |
| Investments, at value (cost $118,646) | | | | $ | 142,841 | |
| Cash | | | | | 3 | |
Receivables:
| | | | | | |
| Investments sold | | | | | 125 | |
| Fund shares sold | | | | | 26 | |
| Interest | | | | | 1 | |
| Dividends | | | | | 71 | |
| Prepaid expenses | | | | + | 1 | |
Total assets | | | | | 143,068 | |
| |
Liabilities | | | | | | |
Payables:
| | | | | | |
| Investments bought | | | | | 1,386 | |
| Investment adviser and administrator fees | | | | | 76 | |
| Transfer agent and shareholder services fees | | | | | 30 | |
| Fund shares redeemed | | | | | 34 | |
| Trustee fees | | | | | 1 | |
| Accrued expenses | | | | + | 100 | |
Total liabilities | | | | | 1,627 | |
| |
Net Assets | | | | | | |
Total assets | | | | | 143,068 | |
Total liabilities | | | | | –1,627 | |
Net assets | | | | $ | 141,441 | |
| |
Net Assets by Source | | | | | | |
| Capital received from investors | | | | | 138,855 | |
| Net investment income not yet distributed | | | | | 273 | |
| Net realized capital losses | | | | | (21,882 | ) |
| Net unrealized capital gains | | | | | 24,195 | |
| |
Net Asset Value (NAV) by Shares Class | | | | | | |
Share Class
| | | | | | Net Assets | | ÷ | | Shares
Outstanding | | = | NAV | |
|---|
| Investor Shares | | | | | | | | $ | 133,562 | | | | | | | | 10,357 | | | | | | $12.90 | |
| Select Shares | | | | | | | | $ | 7,879 | | | | | | | | 609 | | | | | | $12.93 | |
See financial notes. 17
Laudus U.S. MarketMasters Fund
Statement of
Operations
For November 1, 2005 through October 31, 2006. All numbers are x 1,000.
Investment Income | | | | | | |
| Dividends (net of $23 foreign withholding tax) | | | | $ | 1,830 | |
| Interest | | | | + | 202 | |
Total Investment Income | | | | | 2,032 | |
| |
Net Realized Gains and Losses |
| Net realized gains on investments | | | | | 11,252 | |
| Net realized losses on foreign currency transactions | | | | | (3 | ) |
| Net realized losses on futures contracts | | | | + | (38 | ) |
Net realized gains | | | | | 11,211 | |
| |
Net Unrealized Gains and Losses |
| Net unrealized gains on investments | | | | | 8,699 | |
| |
Expenses |
| Investment adviser and administrator fees | | | | | 1,357 | |
Transfer agent and shareholder service fees:
| | | | | | |
| Investor Shares | | | | | 375 | |
| Select Shares | | | | | 7 | |
| Custodian fees | | | | | 69 | |
| Registration fees | | | | | 56 | |
| Portfolio accounting fees | | | | | 51 | |
| Professional fees | | | | | 42 | |
| Shareholder reports | | | | | 40 | |
| Trustees’ fees | | | | | 6 | |
| Other expenses | | | | + | 8 | |
| Total expenses | | | | | 2,011 | |
| Custody credits | | | | | –73 | |
| Expense reduction by adviser and Schwab | | | | | –186 | |
Net expenses | | | | | 1,752 | |
| |
Increase in Net Assets from Operations |
Total investment income | | | | | 2,032 | |
Net expenses | | | | | –1,752 | |
Net investment income | | | | | 280 | |
Net realized gains | | | | | 11,211 | |
Net unrealized gains | | | | + | 8,699 | |
Increase in net assets from operations | | | | $ | 20,190 | |
18 See financial notes.
Laudus U.S. MarketMasters Fund
Statements of
Changes in Net Assets
For the current and prior report periods. All numbers are x 1,000.
| | | | 11/1/05–10/31/06 | | 11/1/04–10/31/05 |
|---|
| Net investment income | | | | $ | 280 | | | $ | 229 | |
| Net realized gains | | | | | 11,211 | | | | 20,508 | |
| Net unrealized gains or losses | | | | + | 8,699 | | | | (4,726 | ) |
Increase in net assets from operations | | | | | 20,190 | | | | 16,011 | |
| |
Distributions Paid | | | | | | | | | | |
Dividends from net investment income | | | | | | | | | | |
| Investor Shares | | | | | 196 | | | | — | |
| Select Shares | | | | + | 10 | | | | — | |
Total dividends from net investment income | | | | $ | 206 | | | $ | — | |
Transactions in Fund Shares | | | | | | | | | | | | | | | | | | |
| | | | 11/1/05–10/31/06 | | 11/1/04–10/31/05 | |
|---|
| | | | SHARES | | VALUE | | SHARES | | VALUE |
|---|
Shares Sold | | | | | | | | | | | | | | | | | | |
| Investor Shares | | | | | 233 | | | $ | 2,811 | | | | 470 | | | $ | 5,144 | |
| Select Shares | | | | + | 525 | | | | 6,214 | | | | 220 | | | | 2,449 | |
Total shares sold | | | | | 758 | | | $ | 9,025 | | | | 690 | | | $ | 7,593 | |
| |
Shares Reinvested | | | | | | | | | | | | | | | | | | |
| Investor Shares | | | | | 16 | | | $ | 188 | | | | — | | | $ | — | |
| Select Shares | | | | + | 1 | | | | 9 | | | | — | | | | — | |
Total shares reinvested | | | | | 17 | | | $ | 197 | | | | — | | | $ | — | |
| |
Shares Redeemed | | | | | | | | | | | | | | | | | | |
| Investor Shares | | | | | (3,245 | ) | | $ | (38,952 | ) | | | (4,578 | ) | | $ | (50,431 | ) |
| Select Shares | | | | + | (135 | ) | | | (1,655 | ) | | | (119 | ) | | | (1,340 | ) |
Total shares redeemed | | | | | (3,380 | ) | | $ | (40,607 | ) | | | (4,697 | ) | | $ | (51,771 | ) |
| | | | | | | | | | | | | | | | | | | |
Net transactions in fund shares | | | | | (2,605 | ) | | $ | (31,385 | ) | | | (4,007 | ) | | $ | (44,178 | ) |
Shares Outstanding and Net Assets | | | | | | | | | | | | | | | | | | |
| | | | 11/1/05–10/31/06 | | 11/1/04–10/31/05 | |
|---|
| | | | SHARES | | NET ASSETS | | SHARES | | NET ASSETS |
|---|
| Beginning of period | | | | | 13,571 | | | $ | 152,842 | | | | 17,578 | | | $ | 181,009 | |
| Total increase or decrease | | | | + | (2,605 | ) | | | (11,401 | ) | | | (4,007 | ) | | | (28,167 | ) |
End of period | | | | | 10,966 | | | $ | 141,441 | | | | 13,571 | | | $ | 152,842 | |
| Net investment income not yet distributed | | | | | | | | $ | 273 | | | | | | | $ | 206 | |
See financial notes. 19
Laudus Small-Cap MarketMasters Fund™
Financial Statements
Financial Highlights
Investor Shares
| | | | 11/1/05—
10/31/06 | | 11/1/04—
10/31/05 | | 11/1/03—
10/31/04 | | 11/1/02—
10/31/03 | | 11/1/01—
10/31/02 |
|---|
Per-Share Data ($) | | | | | | | | | | | | | | | | | | | | | | |
| Net asset value at beginning of period | | | | | 13.38 | | | | 12.18 | | | | 11.08 | | | | 7.18 | | | | 8.73 | |
| Income or loss from investment operations: | | | | | | | | | | | | | | | | | | | | | | |
| Net investment income or loss | | | | | (0.13 | ) | | | (0.14 | ) | | | (0.14 | ) | | | (0.09 | ) | | | 0.04 | |
| Net realized and unrealized gains or losses | | | | | 2.08 | | | | 1.34 | | | | 1.24 | | | | 3.99 | | | | (1.54 | ) |
| Total income or loss from investment operations | | | | | 1.95 | | | | 1.20 | | | | 1.10 | | | | 3.90 | | | | (1.50 | ) |
Less distributions:
| | | | | | | | | | | | | | | | | | | | | | |
| Dividends from net investment income | | | | | — | | | | — | | | | — | | | | (0.00 | )1 | | | (0.03 | ) |
| Distributions from net realized gains | | | | | (1.13 | ) | | | — | | | | — | | | | — | | | | (0.02 | ) |
| Total distributions | | | | | (1.13 | ) | | | — | | | | — | | | | (0.00 | )1 | | | (0.05 | ) |
| Net asset value at end of period | | | | | 14.20 | | | | 13.38 | | | | 12.18 | | | | 11.08 | | | | 7.18 | |
| Total return (%) | | | | | 15.33 | | | | 9.85 | | | | 9.93 | | | | 54.32 | | | | (17.34 | ) |
| |
Ratios/Supplemental Data (%) | | | | | | | | | | | | | | | | | | | | | | |
| Ratios to average net assets: | | | | | | | | | | | | | | | | | | | | | | |
| Net operating expenses | | | | | 1.48 | 2 | | | 1.55 | | | | 1.55 | | | | 1.55 | | | | 0.93 | 3,4 |
| Gross operating expenses | | | | | 1.63 | | | �� | 1.69 | | | | 1.77 | | | | 1.80 | | | | 1.31 | 3 |
| Net investment income | | | | | (0.82 | ) | | | (0.95 | ) | | | (1.08 | ) | | | (0.98 | ) | | | 0.06 | |
| Portfolio turnover rate | | | | | 105 | | | | 94 | | | | 140 | | | | 94 | | | | 324 | |
| Net assets, end of period ($ x 1,000,000) | | | | | 95 | | | | 108 | | | | 129 | | | | 115 | | | | 81 | |
| | | | | | | | | | |
|---|
Select Shares
| | | | 11/1/05—
10/31/06 | | 11/1/04—
10/31/05 | | 6/9/045—
10/31/04 | |
|---|
Per-Share Data ($) | | | | | | | | | | | | | | | | | | | | | | |
| Net asset value at beginning of period | | | | | 13.41 | | | | 12.19 | | | | 12.11 | | | | | | | | | |
Income or loss from investment operations:
| | | | | | | | | | | | | | | | | | | | | | |
| Net investment loss | | | | | (0.02 | ) | | | (0.11 | ) | | | (0.03 | ) | | | | | | | | |
| Net realized and unrealized gains or losses | | | | | 2.01 | | | | 1.33 | | | | 0.11 | | | | | | | | | |
| Total income from investment operations | | | | | 1.99 | | | | 1.22 | | | | 0.08 | | | | | | | | | |
Less distributions:
| | | | | | | | | | | | | | | | | | | | | | |
| Distributions from net realized gains | | | | | (1.13 | ) | | | — | | | | — | | | | | | | | | |
| Net asset value at end of period | | | | | 14.27 | | | | 13.41 | | | | 12.19 | | | | | | | | | |
| Total return (%) | | | | | 15.61 | | | | 10.01 | | | | 0.66 | 6 | | | | | | | | |
| |
Ratios/Supplemental Data (%) | | | | | | | | | | | | | | | | | | | | | | |
Ratios to average net assets:
| | | | | | | | | | | | | | | | | | | | | | |
| Net operating expenses | | | | | 1.16 | 7 | | | 1.37 | | | | 1.37 | 8 | | | | | | | | |
| Gross operating expenses | | | | | 1.55 | | | | 1.63 | | | | 1.79 | 8 | | | | | | | | |
| Net investment income | | | | | (0.43 | ) | | | (0.76 | ) | | | (0.91 | )8 | | | | | | | | |
| Portfolio turnover rate | | | | | 105 | | | | 94 | | | | 140 | 6 | | | | | | | | |
| Net assets, end of period ($ x 1,000,000) | | | | | 7 | | | | 1 | | | | 0.32 | | | | | | | | | |
1 | | Per-share amount was less than $0.01. |
2 | | The ratio of net operating expenses would have been 1.55% for the period ended 10/31/06, if custody credits had not been included. |
3 | | Prior to the fund’s change in structure on June 3, 2002, the expenses incurred by underlying funds in which the fund invested were not included in this ratio. |
4 | | The ratio of net operating expenses would have been 0.84% if certain non-routine expenses (proxy fees) had not been included. |
5 | | Commencement of operations. |
7 | | The ratio of net operating expenses would have been 1.36% for the period ended 10/31/06, if custody credits had not been included. |
20 See financial notes.
Laudus Small-Cap MarketMasters Fund
Portfolio Holdings as of October 31, 2006
This section shows all the securities in the fund’s portfolio and their value as of the report date.
The fund files its complete schedule of portfolio holdings with the SEC for the first and third quarters of each fiscal year on Form N-Q. The fund’s Form N-Q is available on the SEC’s website at http://www.sec.gov and may be viewed and copied at the SEC’s Public Reference Room in Washington, D.C. Call 1-800-SEC-0330 for information on the operation of the Public Reference Room. The schedule of portfolio holdings filed on a fund’s most recent Form N-Q is also available by visiting Schwab’s website at www.schwab.com/schwabfunds.
Holdings by Category
|
| Cost
($ x 1,000)
|
| Value
($ x 1,000)
|
|
|---|
93.5% | | | | Common Stock | | | 79,586 | | | | 95,158 | |
1.6% | | | | Foreign Common Stock | | | 1,514 | | | | 1,636 | |
5.0% | | | | Short-Term Investment | | | 5,098 | | | | 5,098 | |
100.1% | | | | Total Investments | | | 86,198 | | | | 101,892 | |
(0.1)% | | | | Other Assets and Liabilities | | | | | | | (100 | ) |
100.0% | | | | Net Assets | | | | | | | 101,792 | |
Security
| | | | Number
of Shares | | Value
($ x 1,000) |
|---|
Common Stock 93.5% of net assets |
Automobiles & Components 0.2% |
| Force Protection, Inc.* | | | | | 20,600 | | | | 154 | |
Banks 1.4% |
| Commerce Bancorp, Inc. | | | | | 6,120 | | | | 214 | |
| Marshall & Ilsley Corp. | | | | | 6,600 | | | | 316 | |
| New York Community Bancorp, Inc. | | | | | 5,719 | | | | 94 | |
| People’s Bank | | | | | 10,796 | | | | 439 | |
| SVB Financial Group* | | | | | 7,747 | | | | 357 | |
| | | | | | | | | | 1,420 | |
Capital Goods 10.9% |
| Alliant Techsystems, Inc.* | | | | | 4,600 | | | | 355 | |
| American Railcar Industries, Inc. | | | | | 6,425 | | | | 198 | |
| Applied Signal Technology, Inc. | | | | | 31,600 | | | | 469 | |
| Astec Industries, Inc.* | | | | | 11,000 | | | | 351 | |
| Baldor Electric Co. | | | | | 45,620 | | | | 1,463 | |
| BE Aerospace, Inc.* | | | | | 18,100 | | | | 458 | |
| Dover Corp. | | | | | 7,700 | | | | 366 | |
| EMCOR Group, Inc.* | | | | | 4,125 | | | | 244 | |
| Encore Wire Corp.* | | | | | 4,275 | | | | 115 | |
| General Cable Corp.* | | | | | 23,260 | | | | 875 | |
| Granite Construction, Inc. | | | | | 3,200 | | | | 167 | |
| H&E Equipment Services, Inc.* | | | | | 5,875 | | | | 158 | |
| HEICO Corp. | | | | | 3,450 | | | | 125 | |
| Infrasource Services, Inc.* | | | | | 14,100 | | | | 276 | |
| Pentair, Inc. | | | | | 14,700 | | | | 484 | |
| Perini Corp.* | | | | | 7,750 | | | | 192 | |
| Quanta Services, Inc.* | | | | | 20,225 | | | | 370 | |
| SPX Corp. | | | | | 6,960 | | | | 400 | |
| Sterling Construction Co., Inc.* | | | | | 2,475 | | | | 52 | |
| Teleflex, Inc. | | | | | 13,660 | | | | 850 | |
| The Lamson & Sessions Co.* | | | | | 9,300 | | | | 203 | |
| The Manitowoc Co., Inc. | | | | | 21,010 | | | | 1,153 | |
| Trex Co., Inc.* | | | | | 27,360 | | | | 723 | |
| Trinity Industries, Inc. | | | | | 6,300 | | | | 227 | |
| URS Corp.* | | | | | 12,925 | | | | 522 | |
| Washington Group International, Inc.* | | | | | 5,725 | | | | 324 | |
| | | | | | | | | | 11,120 | |
Commercial Services & Supplies 3.2% |
| Acco Brands Corp.* | | | | | 30,840 | | | | 749 | |
| Corrections Corp. of America* | | | | | 3,500 | | | | 160 | |
| Mobile Mini, Inc.* | | | | | 8,600 | | | | 277 | |
| SAIC, Inc.* | | | | | 6,900 | | | | 138 | |
| Steelcase, Inc., Class A | | | | | 48,040 | | | | 796 | |
| TRC Cos., Inc.* | | | �� | | 60,700 | | | | 496 | |
| Watson Wyatt & Co., Holdings | | | | | 15,100 | | | | 682 | |
| | | | | | | | | | 3,298 | |
Consumer Durables & Apparel 2.8% |
| Crocs, Inc.* | | | | | 5,775 | | | | 229 | |
| Jones Apparel Group, Inc. | | | | | 10,985 | | | | 367 | |
| La-Z-Boy, Inc. | | | | | 24,100 | | | | 295 | |
| Leggett & Platt, Inc. | | | | | 12,700 | | | | 297 | |
| Steven Madden Ltd. | | | | | 4,300 | | | | 186 | |
| The Stanley Works | | | | | 6,660 | | | | 317 | |
| The Yankee Candle Co., Inc. | | | | | 22,850 | | | | 773 | |
| Under Armour, Inc.* | | | | | 7,725 | | | | 358 | |
| | | | | | | | | | 2,822 | |
Consumer Services 4.5% |
| Bob Evans Farms, Inc. | | | | | 23,920 | | | | 811 | |
| California Pizza Kitchen, Inc.* | | | | | 22,710 | | | | 733 | |
| Chipotle Mexican Grill, Inc. Class A* | | | | | 9,475 | | | | 568 | |
| Cosi, Inc.* | | | | | 7,625 | | | | 33 | |
| DeVry, Inc.* | | | | | 39,800 | | | | 969 | |
| Regis Corp. | | | | | 12,800 | | | | 481 | |
| Ruth’s Chris Steak House, Inc.* | | | | | 10,875 | | | | 214 | |
| The Cheesecake Factory, Inc.* | | | | | 17,800 | | | | 503 | |
| Vail Resorts, Inc.* | | | | | 6,370 | | | | 246 | |
| | | | | | | | | | 4,558 | |
Diversified Financials 3.6% |
| Federated Investors, Inc., Class B | | | | | 13,900 | | | | 477 | |
| GAMCO Investors, Inc., Class A | | | | | 10,380 | | | | 411 | |
| Knight Capital Group, Inc., Class A* | | | | | 40,880 | | | | 762 | |
| Lazard Ltd. | | | | | 11,075 | | | | 470 | |
| Raymond James Financial, Inc. | | | | | 17,555 | | | | 559 | |
| The First Marblehead Corp. | | | | | 14,090 | | | | 950 | |
| | | | | | | | | | 3,629 | |
Energy 4.9% |
| Cameron International Corp.* | | | | | 4,300 | | | | 215 | |
| CARBO Ceramics, Inc. | | | | | 22,700 | | | | 765 | |
| Helmerich & Payne, Inc. | | | | | 22,900 | | | | 549 | |
| Murphy Oil Corp. | | | | | 4,050 | | | | 191 | |
| Oceaneering International, Inc.* | | | | | 25,100 | | | | 903 | |
See financial notes. 21
Laudus Small-Cap MarketMasters Fund
Portfolio Holdings continued
Security
| | | | Number
of Shares | | Value
($ x 1,000) |
|---|
| PetroQuest Energy, Inc.* | | | | | 6,000 | | | | 68 | |
| TETRA Technologies, Inc.* | | | | | 15,600 | | | | 404 | |
| Tidewater, Inc. | | | | | 10,000 | | | | 497 | |
| Weatherford International Ltd.* | | | | | 2,600 | | | | 107 | |
| Whiting Petroleum Corp.* | | | | | 16,950 | | | | 756 | |
| Willbros Group, Inc.* | | | | | 34,575 | | | | 531 | |
| | | | | | | | | | 4,986 | |
Food & Staples Retailing 0.7% |
| Performance Food Group Co.* | | | | | 25,220 | | | | 733 | |
Food, Beverage & Tobacco 2.3% |
| Molson Coors Brewing Co., Class B | | | | | 3,920 | | | | 279 | |
| Pilgrim’s Pride Corp., Class B | | | | | 11,600 | | | | 290 | |
| The Hain Celestial Group, Inc.* | | | | | 63,850 | | | | 1,802 | |
| | | | | | | | | | 2,371 | |
Health Care Equipment & Services 8.4% |
| Analogic Corp. | | | | | 22,370 | | | | 1,249 | |
| Bausch & Lomb, Inc. | | | | | 9,400 | | | | 503 | |
| Beckman Coulter, Inc. | | | | | 4,800 | | | | 276 | |
| Centene Corp.* | | | | | 16,500 | | | | 389 | |
| Dendrite International, Inc.* | | | | | 64,100 | | | | 670 | |
| Edwards Lifesciences Corp.* | | | | | 5,900 | | | | 253 | |
| HEALTHSOUTH Corp.* | | | | | 14,160 | | | | 343 | |
| Hillenbrand Industries, Inc. | | | | | 6,500 | | | | 382 | |
| Hologic, Inc.* | | | | | 8,675 | | | | 418 | |
| Hospira, Inc.* | | | | | 11,580 | | | | 421 | |
| Intuitive Surgical, Inc.* | | | | | 3,875 | | | | 384 | |
| Lifecell Corp.* | | | | | 12,225 | | | | 287 | |
| Omnicell, Inc.* | | | | | 15,650 | | | | 293 | |
| Rita Medical Systems, Inc.* | | | | | 108,700 | | | | 391 | |
| Thoratec Corp.* | | | | | 64,500 | | | | 1,016 | |
| Triad Hospitals, Inc.* | | | | | 8,300 | | | | 307 | |
| Wright Medical Group, Inc.* | | | | | 38,800 | | | | 959 | |
| | | | | | | | | | 8,541 | |
Household & Personal Products 0.8% |
| NBTY, Inc.* | | | | | 28,610 | | | | 796 | |
Insurance 1.5% |
| Arthur J. Gallagher & Co. | | | | | 15,100 | | | | 421 | |
| Assurant, Inc. | | | | | 5,610 | | | | 295 | |
| KMG America Corp.* | | | | | 67,550 | | | | 513 | |
| Old Republic International Corp. | | | | | 14,950 | | | | 337 | |
| | | | | | | | | | 1,566 | |
Materials 2.8% |
| Bowater, Inc. | | | | | 32,830 | | | | 686 | |
| Cytec Industries, Inc. | | | | | 6,550 | | | | 363 | |
| Headwaters, Inc.* | | | | | 23,740 | | | | 588 | |
| International Flavors & Fragrances, Inc. | | | | | 11,100 | | | | 472 | |
| Symyx Technologies, Inc.* | | | | | 30,040 | | | | 737 | |
| | | | | | | | | | 2,846 | |
Pharmaceuticals & Biotechnology 5.5% |
| Adams Respiratory Therapeutics, Inc.* | | | | | 12,975 | | | | 559 | |
| Connetics Corp.* | | | | | 55,600 | | | | 947 | |
| PAREXEL International Corp.* | | | | | 4,600 | | | | 136 | |
| Perrigo Co. | | | | | 39,870 | | | | 713 | |
| Pharmaceutical Product Development, Inc. (PPD) | | | | | 11,380 | | | | 360 | |
| Pharmion Corp.* | | | | | 44,500 | | | | 1,088 | |
| Salix Pharmaceuticals Ltd.* | | | | | 48,500 | | | | 647 | |
| Thermo Electron Corp.* | | | | | 12,700 | | | | 544 | |
| Valeant Pharmaceuticals International* | | | | | 7,850 | | | | 147 | |
| Varian, Inc.* | | | | | 8,520 | | | | 400 | |
| | | | | | | | | | 5,541 | |
Real Estate 2.2% |
| FelCor Lodging Trust, Inc. | | | | | 27,290 | | | | 566 | |
| Innkeepers USA Trust | | | | | 27,290 | | | | 468 | |
| Post Properties, Inc. | | | | | 6,710 | | | | 329 | |
| Trammell Crow Co.* | | | | | 7,200 | | | | 351 | |
| Washington Real Estate Investment Trust | | | | | 12,020 | | | | 507 | |
| | | | | | | | | | 2,221 | |
Retailing 5.4% |
| 1-800-FLOWERS.COM, Inc., Class A* | | | | | 113,300 | | | | 625 | |
| bebe stores, Inc. | | | | | 11,525 | | | | 286 | |
| Charlotte Russe Holding, Inc.* | | | | | 4,125 | | | | 114 | |
| Christopher & Banks Corp. | | | | | 6,850 | | | | 185 | |
| Coldwater Creek, Inc.* | | | | | 7,775 | | | | 237 | |
| Dick’s Sporting Goods, Inc.* | | | | | 2,850 | | | | 142 | |
| Federated Department Stores, Inc. | | | | | 10,144 | | | | 446 | |
| Fred’s, Inc. | | | | | 56,070 | | | | 733 | |
| Guess?, Inc.* | | | | | 3,625 | | | | 207 | |
| NetFlix, Inc.* | | | | | 31,140 | | | | 861 | |
| Sharper Image Corp.* | | | | | 51,680 | | | | 575 | |
| The Gap, Inc. | | | | | 23,800 | | | | 500 | |
| Wetseal, Inc., Class A* | | | | | 49,200 | | | | 307 | |
| Zumiez, Inc.* | | | | | 7,725 | | | | 254 | |
| | | | | | | | | | 5,472 | |
Semiconductors & Semiconductor Equipment 8.2% |
| Advanced Energy Industries, Inc.* | | | | | 15,400 | | | | 242 | |
| Amkor Technology, Inc.* | | | | | 23,700 | | | | 164 | |
| Brooks Automation, Inc.* | | | | | 66,200 | | | | 940 | |
| Cabot Microelectronics Corp.* | | | | | 23,500 | | | | 671 | |
| Cymer, Inc.* | | | | | 7,400 | | | | 343 | |
| Cypress Semiconductor Corp.* | | | | | 14,900 | | | | 250 | |
| FEI Co.* | | | | | 13,400 | | | | 306 | |
| Hittite Microwave Corp.* | | | | | 6,350 | | | | 218 | |
| International Rectifier Corp.* | | | | | 9,300 | | | | 334 | |
| Intevac, Inc.* | | | | | 7,350 | | | | 152 | |
| KLA-Tencor Corp. | | | | | 6,300 | | | | 310 | |
| Kopin Corp.* | | | | | 198,500 | | | | 709 | |
| LSI Logic Corp.* | | | | | 43,900 | | | | 441 | |
| Micron Technology, Inc.* | | | | | 14,300 | | | | 207 | |
| National Semiconductor Corp. | | | | | 13,860 | | | | 337 | |
| Netlogic Microsystems, Inc.* | | | | | 10,575 | | | | 210 | |
22 See financial notes.
Laudus Small-Cap MarketMasters Fund
Portfolio Holdings continued
Security
| | | | Number
of Shares | | Value
($ x 1,000) |
|---|
| Novellus Systems, Inc.* | | | | | 19,000 | | | | 525 | |
| Teradyne, Inc.* | | | | | 38,700 | | | | 543 | |
| Trident Microsystems, Inc.* | | | | | 28,350 | | | | 599 | |
| TriQuint Semiconductor, Inc.* | | | | | 28,025 | | | | 126 | |
| Ultratech, Inc.* | | | | | 53,200 | | | | 760 | |
| | | | | | | | | | 8,387 | |
Software & Services 13.7% |
| Activision, Inc.* | | | | | 19,370 | | | | 299 | |
| Altiris, Inc.* | | | | | 23,030 | | | | 518 | |
| Ansys, Inc.* | | | | | 8,975 | | | | 413 | |
| aQuantive, Inc.* | | | | | 16,875 | | | | 459 | |
| Aspen Technology, Inc.* | | | | | 91,578 | | | | 918 | |
| Corillian Corp.* | | | | | 45,700 | | | | 136 | |
| Epicor Software Corp.* | | | | | 71,100 | | | | 997 | |
| Gevity HR, Inc. | | | | | 36,000 | | | | 813 | |
| Indus International, Inc.* | | | | | 62,000 | | | | 231 | |
| Informatica Corp.* | | | | | 47,800 | | | | 592 | |
| Interwoven, Inc.* | | | | | 55,800 | | | | 710 | |
| Lionbridge Technologies, Inc.* | | | | | 150,100 | | | | 1,016 | |
| ManTech International Corp., Class A* | | | | | 43,130 | | | | 1,469 | |
| McAfee, Inc.* | | | | | 9,900 | | | | 286 | |
| Mentor Graphics Corp.* | | | | | 43,000 | | | | 725 | |
| MoneyGram International, Inc. | | | | | 4,825 | | | | 165 | |
| Openwave Systems, Inc.* | | | | | 76,200 | | | | 658 | |
| Radiant Systems, Inc.* | | | | | 12,700 | | | | 140 | |
| RightNow Technologies, Inc.* | | | | | 32,020 | | | | 529 | |
| TIBCO Software, Inc.* | | | | | 86,500 | | | | 800 | |
| ValueClick, Inc.* | | | | | 26,100 | | | | 491 | |
| Vignette Corp.* | | | | | 65,700 | | | | 1,071 | |
| webMethods, Inc.* | | | | | 67,900 | | | | 511 | |
| | | | | | | | | | 13,947 | |
Technology Hardware & Equipment 8.6% |
| ADC Telecommunications, Inc.* | | | | | 28,500 | | | | 408 | |
| Andrew Corp.* | | | | | 68,020 | | | | 630 | |
| Avocent Corp.* | | | | | 20,300 | | | | 745 | |
| Diebold, Inc. | | | | | 9,540 | | | | 417 | |
| Emulex Corp.* | | | | | 36,970 | | | | 695 | |
| Itron, Inc.* | | | | | 10,100 | | | | 550 | |
| L-1 Identity Solutions, Inc.* | | | | | 41,686 | | | | 597 | |
| Packeteer, Inc.* | | | | | 116,720 | | | | 1,308 | |
| Polycom, Inc.* | | | | | 26,220 | | | | 718 | |
| Powerwave Technologies, Inc.* | | | | | 120,200 | | | | 783 | |
| Seachange International, Inc.* | | | | | 54,400 | | | | 456 | |
| Tekelec* | | | | | 49,700 | | | | 733 | |
| Tektronix, Inc. | | | | | 9,785 | | | | 297 | |
| Vishay Intertechnology, Inc.* | | | | | 34,000 | | | | 459 | |
| | | | | | | | | | 8,796 | |
Transportation 1.9% |
| AirTran Holdings, Inc.* | | | | | 38,507 | | | | 384 | |
| American Commercial Lines, Inc.* | | | | | 5,575 | | | | 357 | |
| ExpressJet Holdings, Inc.* | | | | | 41,700 | | | | 331 | |
| JetBlue Airways Corp.* | | | | | 70,200 | | | | 882 | |
| | | | | | | | | | 1,954 | |
Foreign Common Stock 1.6% of net assets |
Canada 0.8% |
Food, Beverage & Tobacco 0.8% |
| SunOpta, Inc.* | | | | | 78,140 | | | | 770 | |
Netherlands 0.3% |
Semiconductors & Semiconductor Equipment 0.3% |
| ASML Holding N.V.* | | | | | 12,800 | | | | 292 | |
Singapore 0.1% |
Semiconductors & Semiconductor Equipment 0.1% |
| ASE Test Ltd.* | | | | | 14,150 | | | | 125 | |
United Kingdom 0.4% |
Insurance 0.4% |
| Willis Group Holdings Ltd. | | | | | 11,800 | | | | 449 | |
Security
| | | | Face Amount
($ x 1,000) | | Value
($ x 1,000) |
|---|
Short-Term Investment 5.0% of net assets |
Repurchase Agreement 5.0% |
Fixed Income Clearing Corp.
dated 10/31/06, due
11/01/06 at 4.8%, with
a maturity value of $5,099
(fully collateralized by
Federal National Mortgage
Association with a value
of $5,340.) | | | | | 5,098 | | | | 5,098 | |
At 10/31/06 the tax basis cost of the fund’s investments was $86,862, and the unrealized appreciation and depreciation were $17,298 and ($2,268), respectively, with a net appreciation of $15,030.
| * | | Non-income producing security. |
See financial notes. 23
Laudus Small-Cap MarketMasters Fund
Statement of
Assets and Liabilities
As of October 31, 2006. All numbers x 1,000 except NAV.
Assets | | | | | | |
| Investments, at value (cost $86,198) | | | | $ | 101,892 | |
| Cash | | | | | 2 | |
Receivables:
| | | | | | |
| Investments sold | | | | | 399 | |
| Fund shares sold | | | | | 25 | |
| Dividends | | | | | 16 | |
| Interest | | | | | 1 | |
| Prepaid expenses | | | | + | 1 | |
Total assets | | | | | 102,336 | |
| |
Liabilities | | | | | | |
Payables:
| | | | | | |
| Investments bought | | | | | 187 | |
| Investment adviser and administrator fees | | | | | 106 | |
| Transfer agent and shareholder services fees | | | | | 21 | |
| Trustee fees | | | | | 1 | |
| Fund shares redeemed | | | | | 176 | |
| Accrued expenses | | | | + | 53 | |
Total liabilities | | | | | 544 | |
| |
Net Assets | | | | | | |
Total assets | | | | | 102,336 | |
Total liabilities | | | | | –544 | |
Net assets | | | | $ | 101,792 | |
| |
Net Assets by Source | | | | | | |
| Capital received from investors | | | | | 71,410 | |
| Net investment income not yet distributed | | | | | 7 | |
| Net realized capital gains | | | | | 14,681 | |
| Net unrealized capital gains | | | | | 15,694 | |
| |
Net Asset Value (NAV) by Shares Class | | | | | | |
Share Class
| | | | Net Assets | | ÷ | | Shares
Outstanding | | = | | NAV |
|---|
| Investor Shares | | | | $ | 95,185 | | | | | | | | 6,702 | | | | | | | $ | 14.20 | |
| Select Shares | | | | $ | 6,607 | | | | | | | | 463 | | | | | | | $ | 14.27 | |
24 See financial notes.
Laudus Small-Cap MarketMasters Fund
Statement of
Operations
For November 1, 2005 through October 31, 2006. All numbers x 1,000.
Investment Income | | | | | | |
| Dividends | | | | $ | 537 | |
| Interest | | | | + | 175 | |
Total Investment Income | | | | | 712 | |
| |
Net Realized Gains and Losses | | | | | | |
| Net realized gains on investments | | | | | 16,134 | |
| Net realized gains on futures contracts | | | | + | 18 | |
Net realized gains | | | | | 16,152 | |
| |
Net Unrealized Gains and Losses | | | | | | |
| Net unrealized gains on investments | | | | | 165 | |
| |
Expenses | | | | | | |
| Investment adviser and administrator fees | | | | | 1,258 | |
Transfer agent and shareholder service fees:
| | | | | | |
| Investor Shares | | | | | 263 | |
| Select Shares | | | | | 5 | |
| Custodian fees | | | | | 73 | |
| Registration fees | | | | | 47 | |
| Professional fees | | | | | 42 | |
| Shareholder reports | | | | | 23 | |
| Portfolio accounting fees | | | | | 15 | |
| Trustees’ fees | | | | | 6 | |
| Other expenses | | | | + | 19 | |
| Total expenses | | | | | 1,751 | |
| Custody credits | | | | | –78 | |
| Expense reduction by adviser and Schwab | | | | | –92 | |
Net expenses | | | | | 1,581 | |
| |
Increase in Net Assets from Operations | | | | | | |
Total investment income | | | | | 712 | |
Net expenses | | | | | –1,581 | |
Net investment losses | | | | | (869 | ) |
Net realized gains | | | | | 16,152 | |
Net unrealized gains | | | | + | 165 | |
Increase in net assets from operations | | | | $ | 15,448 | |
See financial notes. 25
Laudus Small-Cap MarketMasters Fund
Statement of
Changes in Net Assets
For the current and prior report periods. All numbers x 1,000.
| | | | 11/1/05–10/31/06 | | 11/1/04–10/31/05 |
|---|
| Net investment loss | | | | $ | (869 | ) | | $ | (1,159 | ) |
| Net realized gains | | | | | 16,152 | | | | 9,437 | |
| Net unrealized gains | | | | + | 165 | | | | 3,833 | |
Increase in net assets from operations | | | | | 15,448 | | | | 12,111 | |
| |
Distributions Paid | | | | | | | | | | |
| Distributions from net realized gains | | | | | | | | | | |
| Investor Shares | | | | | 8,829 | | | | — | |
| Select Shares | | | | + | 89 | | | | — | |
Total distributions from net realized gains | | | | $ | 8,918 | | | $ | — | |
Transactions in Fund Shares | | | | | | | | | | | | | | | | | | |
| | | | 11/1/05–10/31/06 | | 11/1/04–10/31/05 | |
|---|
| | | | SHARES | | VALUE | | SHARES | | VALUE |
|---|
Shares Sold | | | | | | | | | | | | | | | | | | |
| Investor Shares | | | | | 190 | | | $ | 2,628 | | | | 351 | | | $ | 4,603 | |
| Select Shares | | | | + | 472 | | | | 6,249 | | | | 75 | | | | 993 | |
Total shares sold | | | | | 662 | | | $ | 8,877 | | | | 426 | | | $ | 5,596 | |
| |
Shares Reinvested | | | | | | | | | | | | | | | | | | |
| Investor Shares | | | | | 623 | | | $ | 8,135 | | | | — | | | $ | — | |
| Select Shares | | | | + | 5 | | | | 66 | | | | — | | | | — | |
Total shares reinvested | | | | | 628 | | | $ | 8,201 | | | | — | | | $ | — | |
| |
Shares Redeemed | | | | | | | | | | | | | | | | | | |
| Investor Shares | | | | | (2,205 | ) | | $ | (29,890 | ) | | | (2,867 | ) | | $ | (37,600 | ) |
| Select Shares | | | | + | (75 | ) | | | (1,031 | ) | | | (40 | ) | | | (541 | ) |
Total shares redeemed | | | | | (2,280 | ) | | $ | (30,921 | ) | | | (2,907 | ) | | $ | (38,141 | ) |
| |
Net transactions in fund shares | | | | | (990 | ) | | $ | (13,843 | ) | | | (2,481 | ) | | $ | (32,545 | ) |
Shares Outstanding and Net Assets | | | | | | | | | | | | | | | | | | |
| | | | 11/1/05–10/31/06 | | 11/1/04–10/31/05 | |
|---|
| | | | SHARES | | NET ASSETS | | SHARES | | NET ASSETS |
|---|
| Beginning of period | | | | | 8,155 | | | $ | 109,105 | | | | 10,636 | | | $ | 129,539 | |
| Total decrease | | | | + | (990 | ) | | | (7,313 | ) | | | (2,481 | ) | | | (20,434 | ) |
End of period | | | | | 7,165 | | | $ | 101,792 | | | | 8,155 | | | $ | 109,105 | |
| Net investment income not yet distributed | | | | | | | | $ | 7 | | | | | | | $ | 11 | |
26 See financial notes.
Laudus International MarketMasters Fund™
Financial Statements
Financial Highlights
Investor Shares
| | | | 11/1/05—
10/31/06 | | 11/1/04—
10/31/05 | | 11/1/03—
10/31/04 | | 11/1/02—
10/31/03 | | 11/1/01—
10/31/02 |
|---|
Per-Share Data ($) | | | | | | | | | | | | | | | | | | | | | | |
| Net asset value at beginning of period | | | | | 16.78 | | | | 13.58 | | | | 11.95 | | | | 8.74 | | | | 10.80 | |
Income or loss from investment operations:
| | | | | | | | | | | | | | | | | | | | | | |
| Net investment income | | | | | 0.13 | | | | 0.06 | | | | 0.02 | | | | 0.03 | | | | 0.10 | |
| Net realized and unrealized gains or losses | | | | | 3.98 | | | | 3.16 | | | | 1.65 | | | | 3.18 | | | | (1.43 | ) |
| Total income or loss from investment operations | | | | | 4.11 | | | | 3.22 | | | | 1.67 | | | | 3.21 | | | | (1.33 | ) |
Less distributions:
| | | | | | | | | | | | | | | | | | | | | | |
| Dividends from net investment income | | | | | (0.16 | ) | | | (0.02 | ) | | | (0.04 | ) | | | (0.00 | )1 | | | (0.07 | ) |
| Distributions from net realized gains | | | | | — | | | | — | | | | — | | | | — | | | | (0.66 | ) |
| Total distributions | | | | | (0.16 | ) | | | (0.02 | ) | | | (0.04 | ) | | | (0.00 | )1 | | | (0.73 | ) |
| Net asset value at end of period | | | | | 20.73 | | | | 16.78 | | | | 13.58 | | | | 11.95 | | | | 8.74 | |
| Total return (%) | | | | | 24.66 | | | | 23.75 | | | | 13.98 | | | | 36.74 | | | | (13.65 | ) |
| |
Ratios/Supplemental Data (%) | | | | | | | | | | | | | | | | | | | | | | |
Ratios to average net assets:
| | | | | | | | | | | | | | | | | | | | | | |
| Net operating expenses | | | | | 1.57 | 2 | | | 1.65 | | | | 1.65 | | | | 1.65 | | | | 0.99 | 3,4 |
| Gross operating expenses | | | | | 1.64 | | | | 1.74 | | | | 1.89 | | | | 1.92 | | | | 1.32 | 4 |
| Net investment income | | | | | 0.52 | | | | 0.37 | | | | 0.15 | | | | 0.33 | | | | 0.60 | |
| Portfolio turnover rate | | | | | 90 | | | | 53 | | | | 69 | | | | 99 | | | | 158 | |
| Net assets, end of period ($ x 1,000,000) | | | | | 1,320 | | | | 794 | | | | 552 | | | | 302 | | | | 206 | |
| | | | | | | | | | | | | |
|---|
Select Shares
| | | | 11/1/05—
10/31/06 | | 11/1/04—
10/31/05 | | 4/2/045—
10/31/04 | | | | |
|---|
Per-Share Data ($) | | | | | | | | | | | | | | | | | | | | | | |
| Net asset value at beginning of period | | | | | 16.81 | | | | 13.61 | | | | 13.64 | | | | | | | | | |
Income or loss from investment operations:
| | | | | | | | | | | | | | | | | | | | | | |
| Net investment income | | | | | 0.19 | | | | 0.08 | | | | 0.02 | | | | | | | | | |
| Net realized and unrealized gains or losses | | | | | 3.96 | | | | 3.17 | | | | (0.05 | ) | | | | | | | | |
| Total income or loss from investment operations | | | | | 4.15 | | | | 3.25 | | | | (0.03 | ) | | | | | | | | |
Less distributions:
| | | | | | | | | | | | | | | | | | | | | | |
| Dividends from net investment income | | | | | (0.19 | ) | | | (0.05 | ) | | | — | | | | | | | | | |
| Net asset value at end of period | | | | | 20.77 | | | | 16.81 | | | | 13.61 | | | | | | | | | |
| Total return (%) | | | | | 24.88 | | | | 23.90 | | | | (0.22 | )6 | | | | | | | | |
| |
Ratios/Supplemental Data (%) | | | | | | | | | | | | | | | | | | | | | | |
Ratios to average net assets:
| | | | | | | | | | | | | | | | | | | | | | |
| Net operating expenses | | | | | 1.39 | 7 | | | 1.47 | | | | 1.47 | 8 | | | | | | | | |
| Gross operating expenses | | | | | 1.60 | | | | 1.68 | | | | 1.86 | 8 | | | | | | | | |
| Net investment income | | | | | 0.72 | | | | 0.59 | | | | 0.37 | 8 | | | | | | | | |
| Portfolio turnover rate | | | | | 90 | | | | 53 | | | | 69 | 6 | | | | | | | | |
| Net assets, end of period ($ x 1,000,000) | | | | | 628 | | | | 274 | | | | 81 | | | | | | | | | |
1 | | Per share amount was less than $0.01. |
2 | | The ratio of net operating expenses would have been 1.64% if custody credits had not been included. |
3 | | The ratio of net operating expenses would have been 0.93% if certain non-routine expenses (proxy fees) had not been included. |
4 | | Prior to the fund’s change in structure on June 3, 2002, the expenses incurred by underlying funds in which the fund invested were not included in this ratio. |
5 | | Commencement of operations. |
7 | | The ratio of net operating expenses would have been 1.47% if custody credits had not been included. |
See financial notes. 27
Laudus International MarketMasters Fund
Portfolio Holdings as of October 31, 2006
This section shows all the securities in the fund’s portfolio and their value as of the report date.
The fund files its complete schedule of portfolio holdings with the SEC for the first and third quarters of each fiscal year on Form N-Q. The fund’s Form N-Q is available on the SEC’s website at http://www.sec.gov and may be viewed and copied at the SEC’s Public Reference Room in Washington, D.C. Call 1-800-SEC-0330 for information on the operation of the Public Reference Room. The schedule of portfolio holdings filed on a fund’s most recent Form N-Q is also available by visiting Schwab’s website at www.schwab.com/schwabfunds.
Holdings by Category
|
| Cost
($ x 1,000)
|
| Value
($ x 1,000)
|
|
|---|
0.5% | | | | Common Stock | | | 8,305 | | | | 9,658 | |
94.5% | | | | Foreign Common Stock | | | 1,538,694 | | | | 1,841,584 | |
0.4% | | | | Preferred Stock | | | 5,017 | | | | 8,258 | |
0.2% | | | | Rights | | | 1,163 | | | | 3,469 | |
3.8% | | | | Short-Term Investment | | | 73,631 | | | | 73,631 | |
—% | | | | U.S. Treasury Obligation | | | 249 | | | | 249 | |
99.4% | | | | Total Investments | | | 1,627,059 | | | | 1,936,849 | |
0.6% | | | | Other Assets and Liabilities | | | | | | | 11,165 | |
100.0% | | | | Net Assets | | | | | | | 1,948,014 | |
Security
| | | | Number
of Shares | | Value
($ x 1,000) |
|---|
Common Stock 0.5% of net assets |
Energy 0.1% |
| Schlumberger Ltd. | | | | | 55,000 | | | | 3,469 | |
Food & Staples Retailing 0.1% |
Cencosud S.A. ADR, 144A (b) | | | | | 57,500 | | | | 2,462 | |
Media 0.1% |
| CTC Media Inc* | | | | | 55,200 | | | | 1,340 | |
Technology Hardware & Equipment 0.1% |
| NovAtel, Inc.* | | | | | 26,564 | | | | 991 | |
Transportation 0.1% |
| DryShips, Inc. | | | | | 100,843 | | | | 1,396 | |
Foreign Common Stock 94.5% of net assets |
Australia 2.8% |
Banks 0.5% |
| Australia and New Zealand Banking Group Ltd. | | | | | 396,200 | | | | 8,874 | |
Capital Goods 0.2% |
| United Group Ltd. | | | | | 431,337 | | | | 4,876 | |
Commercial Services & Supplies 0.1% |
| Transfield Services Ltd. | | | | | 406,818 | | | | 2,774 | |
Diversified Financials 0.4% |
| Babcock & Brown Ltd. | | | | | 187,500 | | | | 3,160 | |
| Macquarie Bank Ltd. | | | | | 71,200 | | | | 4,104 | |
| | | | | | | | | | 7,264 | |
Energy 0.1% |
| WorleyParsons Ltd. | | | | | 107,700 | | | | 1,519 | |
Materials 0.4% |
| BHP Billiton Ltd. | | | | | 145,900 | | | | 3,105 | |
| BHP Billiton Ltd. ADR | | | | | 89,500 | | | | 3,810 | |
| Perilya Ltd. | | | | | 403,169 | | | | 1,367 | |
| | | | | | | | | | 8,282 | |
Media 0.3% |
| Austar United Communications Ltd.* | | | | | 2,379,061 | | | | 2,196 | |
| Macquarie Communications Infrastructure Group | | | | | 335,200 | | | | 1,589 | |
| Seek Ltd. | | | | | 281,000 | | | | 1,158 | |
| | | | | | | | | | 4,943 | |
Pharmaceuticals & Biotechnology 0.3% |
| CSL Ltd. | | | | | 142,800 | | | | 6,194 | |
Real Estate 0.5% |
| Commonwealth Property Office Fund | | | | | 6,282,154 | | | | 6,913 | |
| Lend Lease Corp., Ltd. | | | | | 164,400 | | | | 2,146 | |
| | | | | | | | | | 9,059 | |
Software & Services 0.0% |
| Computershare Ltd. | | | | | 73,738 | | | | 439 | |
| | | | | | | | | | 54,224 | |
Austria 0.4% |
Banks 0.2% |
| Erste Bank der Oesterreichischen Sparkassen AG | | | | | 32,344 | | | | 2,200 | |
| Raiffeisen International Bank — Holding AG | | | | | 21,800 | | | | 2,492 | |
| | | | | | | | | | 4,692 | |
Energy 0.1% |
| C.A.T. oil AG* | | | | | 37,200 | | | | 815 | |
Real Estate 0.1% |
| Meinl European Land Ltd.* | | | | | 67,200 | | | | 1,483 | |
| | | | | | | | | | 6,990 | |
Belgium 0.2% |
Materials 0.1% |
| Umicore | | | | | 17,900 | | | | 2,775 | |
Technology Hardware & Equipment 0.1% |
| EVS Broadcast Equipment SA | | | | | 37,154 | | | | 2,015 | |
| | | | | | | | | | 4,790 | |
28 See financial notes.
Laudus International MarketMasters Fund
Portfolio Holdings continued
Security
| | | | Number
of Shares | | Value
($ x 1,000) |
|---|
Bermuda 2.0% |
Capital Goods 0.5% |
| Cooper Industries Ltd., Class A | | | | | 22,500 | | | | 2,013 | |
| Fong’s Industries Co., Ltd. | | | | | 9,272,000 | | | | 6,307 | |
| Ingersoll-Rand Co., Ltd., Class A | | | | | 50,600 | | | | 1,857 | |
| | | | | | | | | | 10,177 | |
Consumer Durables & Apparel 0.3% |
| Arts Optical International Holdings Ltd. | | | | | 7,596,000 | | | | 2,197 | |
| Hongguo International Holdings Ltd.* | | | | | 6,334,000 | | | | 3,329 | |
| | | | | | | | | | 5,526 | |
Energy 0.3% |
| Nabors Industries Ltd.* | | | | | 105,700 | | | | 3,264 | |
| Weatherford International Ltd.* | | | | | 76,800 | | | | 3,155 | |
| | | | | | | | | | 6,419 | |
Insurance 0.0% |
| IPC Holdings Ltd. | | | | | 16,375 | | | | 492 | |
| PartnerRe Ltd. | | | | | 3,400 | | | | 237 | |
| | | | | | | | | | 729 | |
Materials 0.2% |
| Aquarius Platinum Ltd. | | | | | 162,644 | | | | 3,024 | |
Media 0.1% |
Central European Media Enterprises, Ltd., Class A (a)* | | | | | 12,600 | | | | 930 | |
Retailing 0.4% |
| Esprit Holdings Ltd. | | | | | 406,500 | | | | 3,933 | |
| Li & Fung Ltd. | | | | | 1,536,400 | | | | 4,011 | |
| | | | | | | | | | 7,944 | |
Technology Hardware & Equipment 0.1% |
| Vtech Holdings Ltd. | | | | | 388,000 | | | | 1,947 | |
Transportation 0.1% |
| Cosco Pacific Ltd. | | | | | 1,360,000 | | | | 2,806 | |
| | | | | | | | | | 39,502 | |
Brazil 0.6% |
Consumer Durables & Apparel 0.1% |
| Cyrela Brazil Realty S.A. | | | | | 53,100 | | | | 1,081 | |
Household & Personal Products 0.1% |
| Natura Cosmeticos S.A. | | | | | 88,400 | | | | 1,218 | |
Materials 0.1% |
| Aracruz Celulose S.A. ADR | | | | | 7,500 | | | | 412 | |
| Companhia Vale do Rio Doce ADR | | | | | 64,900 | | | | 1,651 | |
| | | | | | | | | | 2,063 | |
Retailing 0.1% |
| Lojas Renner S.A. | | | | | 80,700 | | | | 1,010 | |
| Submarino S.A.* | | | | | 45,000 | | | | 919 | |
| | | | | | | | | | 1,929 | |
Software & Services 0.0% |
| Totvs S.A.* | | | | | 40,500 | | | | 853 | |
Transportation 0.2% |
| Companhia de Concessoes Rodoviarias | | | | | 135,800 | | | | 1,450 | |
| Gol Linhas Aereas International S.A. | | | | | 44,200 | | | | 1,377 | |
| Localiza Rent a Car S.A. | | | | | 35,800 | | | | 891 | |
| | | | | | | | | | 3,718 | |
| | | | | | | | | | 10,862 | |
Canada 2.6% |
Banks 0.1% |
| Canadian Western Bank | | | | | 38,458 | | | | 1,449 | |
Capital Goods 0.1% |
| Flint Energy Services Ltd.* | | | | | 35,890 | | | | 1,838 | |
Commercial Services & Supplies 0.1% |
Ritchie Bros Auctioneers, Inc. (a) | | | | | 21,200 | | | | 1,156 | |
Consumer Durables & Apparel 0.3% |
| Gildan Activewear, Inc.* | | | | | 102,400 | | | | 5,212 | |
Energy 0.8% |
| Cameco Corp. | | | | | 91,700 | | | | 3,225 | |
| Canadian Natural Resources Ltd. | | | | | 14,000 | | | | 730 | |
| CHC Helicopter Corp., Class A | | | | | 137,700 | | | | 3,081 | |
| Ensign Energy Services, Inc. | | | | | 35,500 | | | | 576 | |
| Precision Drilling Trust | | | | | 50,700 | | | | 1,453 | |
| Suncor Energy, Inc | | | | | 46,400 | | | | 3,564 | |
| Suncor Energy, Inc. | | | | | 18,800 | | | | 1,441 | |
| Talisman Energy, Inc. | | | | | 42,800 | | | | 707 | |
| Trican Well Service Ltd. | | | | | 2,200 | | | | 39 | |
| | | | | | | | | | 14,816 | |
Food & Staples Retailing 0.1% |
| Alimentation Couche-Tard, Inc., Class B | | | | | 49,200 | | | | 1,166 | |
| Shoppers Drug Mart Corp. | | | | | 28,000 | | | | 1,140 | |
| | | | | | | | | | 2,306 | |
Insurance 0.2% |
| Manulife Financial Corp. | | | | | 124,600 | | | | 4,048 | |
Materials 0.4% |
| Alcan, Inc. | | | | | 41,000 | | | | 1,932 | |
| IPSCO, Inc. | | | | | 23,900 | | | | 2,186 | |
| Potash Corp. of Saskatchewan, Inc. | | | | | 17,800 | | | | 2,223 | |
| Teck Cominco Ltd., Class B | | | | | 26,100 | | | | 1,923 | |
| | | | | | | | | | 8,264 | |
Real Estate 0.2% |
| Brookfield Asset Management, Inc. | | | | | 17,700 | | | | 788 | |
| Northern Property Real Estate Investment Trust | | | | | 171,300 | | | | 3,707 | |
| | | | | | | | | | 4,495 | |
Retailing 0.1% |
| The Forzani Group Ltd., Class A* | | | | | 120,942 | | | | 1,888 | |
See financial notes. 29
Laudus International MarketMasters Fund
Portfolio Holdings continued
Security
| | | | Number
of Shares | | Value
($ x 1,000) |
|---|
Transportation 0.2% |
| Canadian National Railway Co. | | | | | 43,900 | | | | 2,092 | |
| Canadian Pacific Railway Ltd. | | | | | 37,500 | | | | 2,118 | |
| | | | | | | | | | 4,210 | |
| | | | | | | | | | 49,682 | |
Cayman Islands 2.0% |
Automobiles & Components 0.0% |
| Norstar Founders Group Ltd. | | | | | 1,858,000 | | | | 732 | |
Capital Goods 0.0% |
| Suntech Power Holdings Co., Ltd. ADR* | | | | | 1,600 | | | | 42 | |
Consumer Durables & Apparel 0.1% |
| Li Ning Co., Ltd. | | | | | 1,235,157 | | | | 1,459 | |
Consumer Services 0.1% |
Ctrip.com International Ltd. ADR (a) | | | | | 30,600 | | | | 1,499 | |
| FU JI Food & Catering Services | | | | | 457,000 | | | | 802 | |
| | | | | | | | | | 2,301 | |
Energy 0.6% |
| GlobalSantaFe Corp. | | | | | 71,500 | | | | 3,711 | |
| Noble Corp. | | | | | 55,100 | | | | 3,863 | |
| Transocean, Inc.* | | | | | 52,900 | | | | 3,837 | |
| | | | | | | | | | 11,411 | |
Food, Beverage & Tobacco 0.1% |
| China Mengniu Dairy Co., Ltd. | | | | | 1,021,000 | | | | 1,854 | |
Health Care Equipment & Services 0.1% |
| Mindray Medical International Ltd., ADR* | | | | | 113,652 | | | | 2,057 | |
Household & Personal Products 0.1% |
| Hengan International Group Co., Ltd. | | | | | 662,000 | | | | 1,591 | |
Materials 0.3% |
| Lee & Man Paper Manufacturing Ltd. | | | | | 388,000 | | | | 787 | |
| Vision Grande Group Holdings Ltd. | | | | | 4,506,000 | | | | 3,869 | |
| | | | | | | | | | 4,656 | |
Media 0.1% |
Focus Media Holding Ltd. ADR (a)* | | | | | 49,678 | | | | 2,627 | |
Real Estate 0.2% |
| Greentown China Holdings Ltd.* | | | | | 2,152,205 | | | | 2,955 | |
Semiconductors & Semiconductor Equipment 0.1% |
| ASM Pacific Technology Ltd. | | | | | 371,500 | | | | 1,924 | |
Himax Technologies, Inc. ADR (a)* | | | | | 96,900 | | | | 617 | |
| | | | | | | | | | 2,541 | |
Technology Hardware & Equipment 0.2% |
| AAC Acoustic Technology Holdings, Inc.* | | | | | 1,996,000 | | | | 2,313 | |
| Foxconn International Holdings Ltd.* | | | | | 686,000 | | | | 2,275 | |
| | | | | | | | | | 4,588 | |
| | | | | | | | | | 38,814 | |
Chile 0.1% |
Retailing 0.1% |
| S.A.C.I. Falabella, SA | | | | | 524,600 | | | | 1,691 | |
Columbia 0.1% |
Banks 0.1% |
BanColombia S.A. ADR (a) | | | | | 47,800 | | | | 1,461 | |
Denmark 0.9% |
Capital Goods 0.3% |
| FLSmidth & Co. A/S | | | | | 20,000 | | | | 1,052 | |
| NKT Holding A/S | | | | | 60,641 | | | | 4,750 | |
| | | | | | | | | | 5,802 | |
Consumer Durables & Apparel 0.1% |
| Bang & Olufsen A/S, Class B | | | | | 18,699 | | | | 2,167 | |
Health Care Equipment & Services 0.1% |
| Coloplast A/S | | | | | 24,300 | | | | 2,056 | |
Insurance 0.2% |
| Alm. Brand A/S* | | | | | 38,975 | | | | 2,188 | |
| Topdanmark A/S* | | | | | 12,500 | | | | 1,766 | |
| | | | | | | | | | 3,954 | |
Pharmaceuticals & Biotechnology 0.2% |
| Alk-Abello A/S* | | | | | 6,900 | | | | 1,056 | |
| Genmab A/S* | | | | | 64,477 | | | | 2,878 | |
| | | | | | | | | | 3,934 | |
| | | | | | | | | | 17,913 | |
Egypt 0.0% |
Diversified Financials 0.0% |
| Egyptian Financial Group — Hermes Holding* | | | | | 83,500 | | | | 646 | |
Finland 0.2% |
Consumer Durables & Apparel 0.1% |
| Amer Sports Oyj | | | | | 85,200 | | | | 1,887 | |
Transportation 0.1% |
| Finnlines Oyj | | | | | 132,645 | | | | 2,778 | |
| | | | | | | | | | 4,665 | |
France 6.7% |
Automobiles & Components 0.4% |
| Compagnie Generale des Etablissements Michelin, Class B | | | | | 107,600 | | | | 8,770 | |
Banks 0.5% |
| BNP Paribas | | | | | 89,290 | | | | 9,806 | |
30 See financial notes.
Laudus International MarketMasters Fund
Portfolio Holdings continued
Security
| | | | Number
of Shares | | Value
($ x 1,000) |
|---|
Capital Goods 1.3% |
| Carbone Lorraine S.A. | | | | | 100,614 | | | | 5,598 | |
| Financiere Marc de Lacharriere SA | | | | | 16,150 | | | | 1,504 | |
| Latecoere | | | | | 142,113 | | | | 4,589 | |
| Nexans S.A. | | | | | 128,175 | | | | 11,503 | |
| Vinci S. A. | | | | | 18,000 | | | | 2,028 | |
| | | | | | | | | | 25,222 | |
Consumer Durables & Apparel 0.3% |
| LVMH Moet Hennessy Louis Vuitton S.A. | | | | | 48,200 | | | | 5,020 | |
Diversified Financials 0.1% |
| Eurazeo | | | | | 16,765 | | | | 2,140 | |
Food, Beverage & Tobacco 0.2% |
| Groupe Danone | | | | | 47,600 | | | | 3,875 | |
Health Care Equipment & Services 0.2% |
| Essilor International S.A. | | | | | 32,600 | | | | 3,417 | |
| Orpea* | | | | | 13,200 | | | | 1,106 | |
| | | | | | | | | | 4,523 | |
Household & Personal Products 0.4% |
| L’Oreal S.A. | | | | | 86,000 | | | | 8,358 | |
Insurance 0.3% |
| April Group | | | | | 11,200 | | | | 478 | |
| Axa | | | | | 21,700 | | | | 827 | |
| Euler Hermes S.A. | | | | | 31,472 | | | | 4,086 | |
| | | | | | | | | | 5,391 | |
Media 1.7% |
| Ipsos | | | | | 18,437 | | | | 704 | |
| Publicis Groupe S.A. | | | | | 330,900 | | | | 12,780 | |
| Societe Television Francaise 1 | | | | | 207,000 | | | | 7,023 | |
| Vivendi Universal S.A. | | | | | 333,500 | | | | 12,635 | |
| | | | | | | | | | 33,142 | |
Pharmaceuticals & Biotechnology 0.2% |
| Boiron S.A. | | | | | 64,213 | | | | 1,455 | |
| Sanofi-Aventis | | | | | 33,400 | | | | 2,844 | |
| | | | | | | | | | 4,299 | |
Real Estate 0.1% |
| Klepierre | | | | | 9,700 | | | | 1,463 | |
Retailing 0.1% |
| Etam | | | | | 17,489 | | | | 1,563 | |
Software & Services 0.2% |
| Capgemini SA | | | | | 53,500 | | | | 3,035 | |
| Iliad S.A. | | | | | 18,950 | | | | 1,613 | |
| | | | | | | | | | 4,648 | |
Technology Hardware & Equipment 0.6% |
| Ingenico S.A.* | | | | | 134,980 | | | | 3,117 | |
| Neopost S.A. | | | | | 64,743 | | | | 7,904 | |
| | | | | | | | | | 11,021 | |
Transportation 0.1% |
| Norbert Dentressangle | | | | | 15,770 | | | | 1,308 | |
| | | | | | | | | | 130,549 | |
Germany 7.6% |
Automobiles & Components 2.5% |
| Bayerische Motoren Werke (BMW) AG | | | | | 280,200 | | | | 16,119 | |
| Continental AG | | | | | 9,200 | | | | 1,031 | |
| DaimlerChrysler AG | | | | | 476,500 | | | | 27,243 | |
| ElringKlinger AG | | | | | 85,840 | | | | 4,565 | |
| | | | | | | | | | 48,958 | |
Capital Goods 0.9% |
| Bilfinger Berger AG | | | | | 79,990 | | | | 5,000 | |
| Hochtief AG | | | | | 50,300 | | | | 3,290 | |
| MTU Aero Engines Holding AG | | | | | 121,467 | | | | 4,994 | |
| Q-Cells AG* | | | | | 34,840 | | | | 1,382 | |
| Rheinmetall AG | | | | | 24,200 | | | | 1,742 | |
| Solarworld AG | | | | | 15,480 | | | | 835 | |
| | | | | | | | | | 17,243 | |
Commercial Services & Supplies 0.1% |
| Wirecard AG* | | | | | 257,531 | | | | 2,206 | |
Consumer Durables & Apparel 0.3% |
| Bijou Brigitte Modische Accessoires AG | | | | | 4,800 | | | | 997 | |
| Rational AG | | | | | 26,783 | | | | 5,700 | |
| | | | | | | | | | 6,697 | |
Food & Staples Retailing 0.2% |
| Metro AG | | | | | 67,800 | | | | 4,035 | |
Health Care Equipment & Services 0.1% |
| Celesio AG | | | | | 43,340 | | | | 2,237 | |
Household & Personal Products 0.2% |
| Henkel KGaA | | | | | 26,100 | | | | 3,131 | |
Insurance 0.8% |
| Hannover Rueckversicherung AG* | | | | | 359,500 | | | | 15,272 | |
Materials 0.2% |
| BASF AG | | | | | 19,300 | | | | 1,698 | |
| GEA Group AG | | | | | 136,800 | | | | 2,462 | |
| | | | | | | | | | 4,160 | |
Media 0.1% |
| CTS Eventim AG | | | | | 57,955 | | | | 2,007 | |
Pharmaceuticals & Biotechnology 0.4% |
| QIAGEN N.V.* | | | | | 323,849 | | | | 5,112 | |
| Schwarz Pharma AG | | | | | 25,300 | | | | 2,959 | |
| | | | | | | | | | 8,071 | |
Real Estate 0.3% |
| Deutsche Euroshop AG | | | | | 35,335 | | | | 2,438 | |
| IVG Immobilien AG | | | | | 85,900 | | | | 3,099 | |
| | | | | | | | | | 5,537 | |
Retailing 0.1% |
| Praktiker Bau — und Heimwerkermaerkte Holding AG | | | | | 63,547 | | | | 2,022 | |
Semiconductors & Semiconductor Equipment 0.1% |
| Kontron AG | | | | | 146,112 | | | | 2,129 | |
See financial notes. 31
Laudus International MarketMasters Fund
Portfolio Holdings continued
Security
| | | | Number
of Shares | | Value
($ x 1,000) |
|---|
Software & Services 0.6% |
| SAP AG | | | | | 21,200 | | | | 4,220 | |
| Software AG | | | | | 51,654 | | | | 3,567 | |
| United Internet AG | | | | | 195,300 | | | | 3,014 | |
| | | | | | | | | | 10,801 | |
Technology Hardware & Equipment 0.5% |
| Wincor Nixdorf AG | | | | | 66,633 | | | | 9,286 | |
Utilities 0.2% |
| E.ON AG | | | | | 34,100 | | | | 4,106 | |
| RWE AG | | | | | 8,600 | | | | 850 | |
| | | | | | | | | | 4,956 | |
| | | | | | | | | | 148,748 | |
Greece 1.0% |
Banks 0.5% |
| EFG Eurobank Ergasias | | | | | 70,640 | | | | 2,348 | |
| Greek Postal Savings Bank* | | | | | 103,900 | | | | 2,372 | |
| National Bank of Greece S.A. | | | | | 56,180 | | | | 2,547 | |
| Piraeus Bank S.A. | | | | | 80,200 | | | | 2,287 | |
| | | | | | | | | | 9,554 | |
Capital Goods 0.1% |
| Frigoglass S.A. | | | | | 48,851 | | | | 1,009 | |
Diversified Financials 0.3% |
| Marfin Financial Group S.A. | | | | | 124,597 | | | | 6,275 | |
Food, Beverage & Tobacco 0.1% |
| Coca Cola Hellenic Bottling Co., S.A. | | | | | 59,500 | | | | 1,947 | |
| | | | | | | | | | 18,785 | |
Hong Kong 1.2% |
Capital Goods 0.1% |
| Melco International Development Ltd. | | | | | 1,130,000 | | | | 2,763 | |
Consumer Durables & Apparel 0.2% |
| Fountain Set (Holdings) Ltd. | | | | | 13,075,430 | | | | 3,776 | |
| Ports Design Ltd. | | | | | 474,500 | | | | 823 | |
| | | | | | | | | | 4,599 | |
Consumer Services 0.1% |
| eSun Holdings Ltd.* | | | | | 1,504,256 | | | | 1,449 | |
Food & Staples Retailing 0.0% |
| Wumart Stores, Inc. | | | | | 954,800 | | | | 890 | |
Insurance 0.2% |
| China Life Insurance Co., Ltd. | | | | | 1,444,000 | | | | 3,045 | |
Materials 0.2% |
| China National Building Material Co., Ltd. | | | | | 3,764,000 | | | | 2,089 | |
| Hung Hing Printing Group Ltd. | | | | | 2,302,000 | | | | 1,257 | |
| | | | | | | | | | 3,346 | |
Real Estate 0.1% |
| China Vanke Co., Ltd. | | | | | 928,603 | | | | 1,120 | |
| Hopson Development Holdings Ltd. | | | | | 311,500 | | | | 677 | |
| | | | | | | | | | 1,797 | |
Retailing 0.3% |
| Giordano International Ltd. | | | | | 9,080,000 | | | | 4,541 | |
| Parkson Retail Group Ltd | | | | | 235,000 | | | | 975 | |
| | | | | | | | | | 5,516 | |
Software & Services 0.0% |
| The9 Ltd. ADR* | | | | | 24,741 | | | | 584 | |
| | | | | | | | | | 23,989 | |
Hungary 0.2% |
Pharmaceuticals & Biotechnology 0.2% |
| EGIS Nyrt. | | | | | 23,924 | | | | 3,122 | |
India 1.3% |
Automobiles & Components 0.1% |
| Maruti Udyog Ltd. | | | | | 67,000 | | | | 1,442 | |
Banks 0.1% |
| HDFC Bank Ltd. | | | | | 85,300 | | | | 1,901 | |
| Housing Development Finance Corp., Ltd. | | | | | 48,500 | | | | 1,574 | |
| | | | | | | | | | 3,475 | |
Capital Goods 0.2% |
| Bharat Heavy Electricals Ltd. | | | | | 45,900 | | | | 2,456 | |
| Suzlon Energy Ltd. | | | | | 49,600 | | | | 1,439 | |
| | | | | | | | | | 3,895 | |
Diversified Financials 0.1% |
| Indiabulls Financial Services Ltd. | | | | | 110,000 | | | | 1,034 | |
Household & Personal Products 0.1% |
| Dabur India Ltd. | | | | | 512,900 | | | | 1,743 | |
| Hindustan Lever Ltd. | | | | | 194,000 | | | | 1,016 | |
| | | | | | | | | | 2,759 | |
Materials 0.2% |
| India Cements Ltd.* | | | | | 959,300 | | | | 4,568 | |
Software & Services 0.4% |
| Infosys Technologies Ltd. | | | | | 85,000 | | | | 3,947 | |
| Tech Mahindra Ltd.* | | | | | 52,300 | | | | 1,160 | |
| WNS Holdings Ltd.* | | | | | 77,204 | | | | 2,297 | |
| | | | | | | | | | 7,404 | |
Telecommunication Services 0.1% |
| Bharti Airtel Ltd.* | | | | | 126,000 | | | | 1,480 | |
| | | | | | | | | | 26,057 | |
Indonesia 0.1% |
Banks 0.1% |
| PT Bank Mandiri | | | | | 4,084,000 | | | | 1,217 | |
Pharmaceuticals & Biotechnology 0.0% |
| PT Kalbe Farma Tbk* | | | | | 6,070,200 | | | | 903 | |
| | | | | | | | | | 2,120 | |
32 See financial notes.
Laudus International MarketMasters Fund
Portfolio Holdings continued
Security
| | | | Number
of Shares | | Value
($ x 1,000) |
|---|
Ireland 2.3% |
Banks 1.2% |
| Anglo Irish Bank Corp., plc | | | | | 213,300 | | | | 3,828 | |
| Bank of Ireland | | | | | 951,600 | | | | 19,053 | |
| | | | | | | | | | 22,881 | |
Capital Goods 0.3% |
| Kingspan Group plc | | | | | 296,700 | | | | 6,289 | |
Food, Beverage & Tobacco 0.5% |
| C&C Group plc | | | | | 278,574 | | | | 4,628 | |
| Glanbia plc | | | | | 1,325,333 | | | | 5,007 | |
| | | | | | | | | | 9,635 | |
Health Care Equipment & Services 0.0% |
| United Drug plc | | | | | 185,000 | | | | 869 | |
Media 0.2% |
| Independent News & Media plc | | | | | 1,154,009 | | | | 3,890 | |
Transportation 0.1% |
| Ryanair Holdings plc ADR* | | | | | 29,200 | | | | 1,951 | |
| | | | | | | | | | 45,515 | |
Israel 0.2% |
Capital Goods 0.2% |
| Ormat Industries Ltd. | | | | | 281,947 | | | | 2,924 | |
Technology Hardware & Equipment 0.0% |
Orbotech Ltd. (a)* | | | | | 25,000 | | | | 604 | |
| | | | | | | | | | 3,528 | |
Italy 2.7% |
Automobiles & Components 0.1% |
| Brembo S.p.A | | | | | 144,225 | | | | 1,677 | |
Banks 0.1% |
| Credito Emiliano S.p.A. | | | | | 97,200 | | | | 1,391 | |
Capital Goods 0.1% |
| Astaldi S.p.A. | | | | | 317,071 | | | | 2,244 | |
Consumer Durables & Apparel 0.7% |
| Geox S.p.A. | | | | | 87,000 | | | | 1,150 | |
| Luxottica Group S.p.A. | | | | | 129,600 | | | | 4,005 | |
| Safilo Group SpA* | | | | | 375,693 | | | | 2,031 | |
| Tod’s S.p.A. | | | | | 50,994 | | | | 4,423 | |
| Valentino Fashion Group S.p.A. | | | | | 91,571 | | | | 3,281 | |
| | | | | | | | | | 14,890 | |
Diversified Financials 0.4% |
| Azimut Holding S.p.A. | | | | | 290,268 | | | | 3,282 | |
| Banca Italease | | | | | 107,200 | | | | 5,975 | |
| | | | | | | | | | 9,257 | |
Energy 0.3% |
| Saipem S.p.A. | | | | | 229,400 | | | | 5,404 | |
Food & Staples Retailing 0.1% |
| Marr SpA | | | | | 121,634 | | | | 1,017 | |
Food, Beverage & Tobacco 0.1% |
| Davide Campari — Milano S.p.A. | | | | | 115,100 | | | | 1,053 | |
Real Estate 0.1% |
| Pirelli & C. Real Estate S.p.A. | | | | | 17,585 | | | | 1,149 | |
Technology Hardware & Equipment 0.2% |
| Digital Multimedia Technologies S.p.A.* | | | | | 66,515 | | | | 4,448 | |
Transportation 0.4% |
| Autostrada Torino — Milano S.p.A. | | | | | 199,526 | | | | 4,238 | |
| Gemina S.p.A.* | | | | | 927,101 | | | | 3,432 | |
| | | | | | | | | | 7,670 | |
Utilities 0.1% |
| ASM S.p.A. | | | | | 214,300 | | | | 1,016 | |
| Hera S.p.A. | | | | | 546,300 | | | | 2,147 | |
| | | | | | | | | | 3,163 | |
| | | | | | | | | | 53,363 | |
Japan 10.3% |
Automobiles & Components 1.6% |
| Denso Corp. | | | | | 212,200 | | | | 8,090 | |
| F.C.C. Co., Ltd. | | | | | 214,600 | | | | 4,940 | |
| Honda Motor Co., Ltd. | | | | | 358,800 | | | | 12,664 | |
| Sumitomo Rubber Industries Ltd. | | | | | 182,000 | | | | 2,087 | |
| Toyoda Gosei Co., Ltd. | | | | | 100,000 | | | | 2,316 | |
| | | | | | | | | | 30,097 | |
Banks 0.4% |
| Mitsubishi UFJ Financial Group, Inc. | | | | | 311 | | | | 3,945 | |
| Suruga Bank Ltd. | | | | | 217,000 | | | | 2,699 | |
| The Nishi-Nippon City Bank Ltd. | | | | | 296,000 | | | | 1,404 | |
| The Senshu Bank Ltd. | | | | | 170,000 | | | | 465 | |
| | | | | | | | | | 8,513 | |
Capital Goods 1.2% |
| Chiyoda Corp. | | | | | 81,000 | | | | 1,466 | |
| JTEKT Corp. | | | | | 103,900 | | | | 2,161 | |
| Komatsu Ltd. | | | | | 156,000 | | | | 2,807 | |
| MISUMI Group, Inc. | | | | | 59,300 | | | | 1,036 | |
| NGK Insulators Ltd | | | | | 118,000 | | | | 1,602 | |
| Nichias Corp. | | | | | 188,000 | | | | 1,332 | |
| Ryobi Ltd. | | | | | 365,000 | | | | 2,910 | |
| Takeuchi Mfg. Co., Ltd. | | | | | 60,800 | | | | 2,578 | |
| The Japan Steel Works Ltd. | | | | | 496,000 | | | | 3,315 | |
| Ushio, Inc. | | | | | 169,400 | | | | 3,524 | |
| | | | | | | | | | 22,731 | |
Commercial Services & Supplies 0.6% |
| Asahi Pretec Corp. | | | | | 43,800 | | | | 1,059 | |
| Meitec Corp. | | | | | 120,000 | | | | 3,782 | |
| Park24 Co., Ltd. | | | | | 90,400 | | | | 1,314 | |
| Sohgo Security Services Co., Ltd. | | | | | 54,500 | | | | 968 | |
| Takara Printing Co., Ltd. | | | | | 298,980 | | | | 3,001 | |
| Tempstaff Co., Ltd. | | | | | 870 | | | | 1,359 | |
| | | | | | | | | | 11,483 | |
Consumer Durables & Apparel 0.9% |
| Asics Corp. | | | | | 167,000 | | | | 2,238 | |
| ES-Con Japan Ltd. | | | | | 1,715 | | | | 3,430 | |
| Goldcrest Co., Ltd. | | | | | 31,200 | | | | 1,707 | |
See financial notes. 33
Laudus International MarketMasters Fund
Portfolio Holdings continued
Security
| | | | Number
of Shares | | Value
($ x 1,000) |
|---|
| Hitachi Koki Co., Ltd. | | | | | 71,000 | | | | 1,011 | |
| Sanei-International Co., Ltd. | | | | | 44,400 | | | | 1,271 | |
| Sharp Corp. | | | | | 158,000 | | | | 2,813 | |
| Shimano, Inc. | | | | | 136,800 | | | | 3,812 | |
| Tamron Co., Ltd. | | | | | 102,100 | | | | 1,859 | |
| | | | | | | | | | 18,141 | |
Diversified Financials 1.1% |
| Daiwa Securities Group, Inc. | | | | | 1,163,500 | | | | 13,155 | |
| ORIX Corp. | | | | | 28,600 | | | | 8,043 | |
| Sparx Asset Management Co., Ltd. | | | | | 807 | | | | 584 | |
| | | | | | | | | | 21,782 | |
Energy 0.1% |
| Shinko Plantech Co., Ltd. | | | | | 262,000 | | | | 1,969 | |
Food, Beverage & Tobacco 0.0% |
| Ito En, Ltd. | | | | | 19,600 | | | | 621 | |
Health Care Equipment & Services 0.1% |
| Nakanishi, Inc. | | | | | 9,900 | | | | 1,206 | |
Household & Personal Products 0.4% |
| Milbon Co Ltd. | | | | | 5,900 | | | | 195 | |
| Uni-Charm Corp. | | | | | 139,200 | | | | 7,758 | |
| | | | | | | | | | 7,953 | |
Materials 0.6% |
| Air Water, Inc. | | | | | 138,000 | | | | 1,321 | |
| Kanto Denka Kogyo Co., Ltd. | | | | | 407,000 | | | | 2,791 | |
| NIFCO, Inc. | | | | | 178,100 | | | | 3,653 | |
| Showa Denko K.K. | | | | | 515,000 | | | | 2,241 | |
| Tokai Carbon Co., Ltd. | | | | | 128,000 | | | | 863 | |
| | | | | | | | | | 10,869 | |
Pharmaceuticals & Biotechnology 0.3% |
| Takeda Pharmaceutical Co., Ltd. | | | | | 98,500 | | | | 6,324 | |
Real Estate 0.7% |
| Aeon Mall Co., Ltd. | | | | | 35,600 | | | | 1,879 | |
| Joint Corp. | | | | | 145,600 | | | | 5,724 | |
| K.K. DaVinci Advisors* | | | | | 1,113 | | | | 1,216 | |
| Kenedix, Inc. | | | | | 210 | | | | 1,177 | |
| Tokyo Tatemono Co., Ltd. | | | | | 241,000 | | | | 2,874 | |
| | | | | | | | | | 12,870 | |
Retailing 0.4% |
| DeNa Co., Ltd.* | | | | | 322 | | | | 935 | |
| Honeys Co., Ltd. | | | | | 57,649 | | | | 2,690 | |
| Nitori Co., Ltd. | | | | | 28,660 | | | | 1,162 | |
| Paris Miki, Inc. | | | | | 92,800 | | | | 1,529 | |
| Yamada Denki Co., Ltd. | | | | | 22,000 | | | | 2,186 | |
| | | | | | | | | | 8,502 | |
Semiconductors & Semiconductor Equipment 0.7% |
| Rohm Co., Ltd. | | | | | 157,000 | | | | 14,416 | |
Software & Services 0.1% |
| KONAMI Corp. | | | | | 82,200 | | | | 2,263 | |
Technology Hardware & Equipment 0.4% |
| Brother Industries Ltd. | | | | | 138,000 | | | | 1,736 | |
| Hitachi Kokusai Electric, Inc. | | | | | 86,000 | | | | 1,038 | |
| Hoya Corp. | | | | | 52,500 | | | | 2,029 | |
| Keyence Corp. | | | | | 14,800 | | | | 3,272 | |
| | | | | | | | | | 8,075 | |
Telecommunication Services 0.7% |
| NTT DoCoMo, Inc. | | | | | 8,280 | | | | 12,627 | |
| | | | | | | | | | 200,442 | |
Luxembourg 0.5% |
Energy 0.2% |
| Acergy SA* | | | | | 80,836 | | | | 1,471 | |
| Tenaris S.A. | | | | | 72,500 | | | | 2,798 | |
| | | | | | | | | | 4,269 | |
Real Estate 0.0% |
| Gagfah SA* | | | | | 8,400 | | | | 244 | |
Telecommunication Services 0.3% |
| Millicom International Cellular S.A.* | | | | | 94,436 | | | | 4,710 | |
| | | | | | | | | | 9,223 | |
Malaysia 0.1% |
Banks 0.1% |
| Bumiputra-Commerce Holdings Berhad | | | | | 1,001,700 | | | | 1,891 | |
Transportation 0.0% |
| Transmile Group Berhad | | | | | 199,900 | | | | 695 | |
| | | | | | | | | | 2,586 | |
Mexico 0.9% |
Capital Goods 0.1% |
| Empresas ICA S.A. de C.V.* | | | | | 555,323 | | | | 1,903 | |
Consumer Durables & Apparel 0.3% |
| Corporacion GEO, SA de CV, Series B* | | | | | 483,300 | | | | 2,216 | |
Desarrolladora Homex SA de CV ADR (a)* | | | | | 23,600 | | | | 1,036 | |
| Urbi, Desarrollos Urbanos, SA de CV* | | | | | 594,500 | | | | 1,814 | |
| | | | | | | | | | 5,066 | |
Food & Staples Retailing 0.1% |
| Wal-Mart de Mexico Series V | | | | | 872,900 | | | | 3,035 | |
Telecommunication Services 0.2% |
| America Movil SA de CV | | | | | 1,451,500 | | | | 3,112 | |
Transportation 0.2% |
Grupo Aeroportuario del Pacifico SA de CV, ADR (a) | | | | | 93,300 | | | | 3,521 | |
| | | | | | | | | | 16,637 | |
Netherlands 2.6% |
Capital Goods 1.1% |
| Arcadis N.V. | | | | | 64,818 | | | | 3,167 | |
| Hagemeyer N.V.* | | | | | 688,200 | | | | 3,519 | |
| Imtech N.V. | | | | | 55,900 | | | | 3,107 | |
| Koninklijke BAM Groep N.V. | | | | | 386,062 | | | | 8,046 | |
34 See financial notes.
Laudus International MarketMasters Fund
Portfolio Holdings continued
Security
| | | | Number
of Shares | | Value
($ x 1,000) |
|---|
| Koninklijke Boskalis Westminster N.V. | | | | | 50,757 | | | | 3,702 | |
| | | | | | | | | | 21,541 | |
Commercial Services & Supplies 0.2% |
| USG People NV | | | | | 76,600 | | | | 3,127 | |
Consumer Durables & Apparel 0.7% |
| Koninklijke (Royal) Philips Electronics N.V. | | | | | 392,600 | | | | 13,675 | |
Diversified Financials 0.0% |
| ING Groep N.V. ADR | | | | | 18,500 | | | | 820 | |
Energy 0.2% |
| Core Laboratories N.V.* | | | | | 700 | | | | 51 | |
| Fugro N.V. | | | | | 83,393 | | | | 3,612 | |
| | | | | | | | | | 3,663 | |
Retailing 0.1% |
| Macintosh Retail Group N.V. | | | | | 48,405 | | | | 1,582 | |
Technology Hardware & Equipment 0.1% |
| TKH Group N.V. | | | | | 10,004 | | | | 705 | |
| TomTom N.V.* | | | | | 46,800 | | | | 1,970 | |
| | | | | | | | | | 2,675 | |
Transportation 0.2% |
| Koninklijke Vopak N.V. | | | | | 71,082 | | | | 2,725 | |
| Smit Internationale NV | | | | | 23,916 | | | | 1,149 | |
| | | | | | | | | | 3,874 | |
| | | | | | | | | | 50,957 | |
New Zealand 0.5% |
Consumer Services 0.1% |
| Sky City Entertainment Group Ltd. | | | | | 424,598 | | | | 1,464 | |
Health Care Equipment & Services 0.2% |
| Fisher & Paykel Healthcare Corp., Ltd. | | | | | 1,268,669 | | | | 3,549 | |
Retailing 0.1% |
| The Warehouse Group Ltd. | | | | | 356,137 | | | | 1,532 | |
Transportation 0.1% |
| Auckland International Airport Ltd. | | | | | 2,512,822 | | | | 3,432 | |
| | | | | | | | | | 9,977 | |
Norway 1.4% |
Consumer Durables & Apparel 0.2% |
| Ekornes ASA | | | | | 161,200 | | | | 3,491 | |
Diversified Financials 0.1% |
| Acta Holding ASA | | | | | 607,263 | | | | 2,813 | |
Energy 0.9% |
| Ability Group ASA (AGR)* | | | | | 82,302 | | | | 642 | |
| Deep Sea Supply ASA* | | | | | 547,413 | | | | 1,336 | |
| Farstad Shipping ASA | | | | | 202,200 | | | | 4,203 | |
| Olsen Energy ASA* | | | | | 33,292 | | | | 1,444 | |
| Petroleum Geo-Services ASA* | | | | | 35,500 | | | | 2,074 | |
| Seabird Exploration Ltd.* | | | | | 190,331 | | | | 1,168 | |
| SeaDrill Ltd.* | | | | | 167,000 | | | | 2,389 | |
| Songa Offshore ASA* | | | | | 207,816 | | | | 1,861 | |
| TGS Nopec Geophysical Co. ASA* | | | | | 83,616 | | | | 1,495 | |
| | | | | | | | | | 16,612 | |
Food, Beverage & Tobacco 0.1% |
| Cermaq ASA | | | | | 87,397 | | | | 1,077 | |
Materials 0.0% |
| Yara International ASA | | | | | 3,400 | | | | 59 | |
Software & Services 0.1% |
| Ementor ASA* | | | | | 505,584 | | | | 2,556 | |
| | | | | | | | | | 26,608 | |
Panama 0.1% |
Transportation 0.1% |
Copa Holdings S.A., Class A (a) | | | | | 51,200 | | | | 1,940 | |
Papua New Guinea 0.1% |
Materials 0.1% |
| Lihir Gold Ltd.* | | | | | 969,500 | | | | 2,086 | |
Portugal 0.1% |
Capital Goods 0.1% |
| Mota-Engil, SGPS, S.A. | | | | | 384,905 | | | | 2,388 | |
Republic of Korea 2.0% |
Banks 0.2% |
| Kookmin Bank | | | | | 54,000 | | | | 4,282 | |
Capital Goods 0.2% |
| KCC Corp. | | | | | 7,900 | | | | 2,312 | |
| Samsung Techwin Co., Ltd. | | | | | 33,300 | | | | 1,312 | |
| | | | | | | | | | 3,624 | |
Food & Staples Retailing 0.1% |
| Shinsegae Co., Ltd. | | | | | 3,100 | | | | 1,786 | |
Semiconductors & Semiconductor Equipment 0.2% |
| Samsung Electronics Co., Ltd. | | | | | 5,490 | | | | 3,555 | |
Software & Services 0.1% |
| NHN Corp.* | | | | | 22,440 | | | | 2,223 | |
Telecommunication Services 1.2% |
| LG Dacom Corp. | | | | | 67,300 | | | | 1,561 | |
| SK Telecom Co., Ltd. | | | | | 96,900 | | | | 20,986 | |
SK Telecom Co., Ltd. ADR (a) | | | | | 52,000 | | | | 1,252 | |
| | | | | | | | | | 23,799 | |
| | | | | | | | | | 39,269 | |
Russia 0.0% |
Capital Goods 0.0% |
| OAO TMK GDR | | | | | 22,328 | | | | 564 | |
Singapore 2.7% |
Banks 0.3% |
| United Overseas Bank Ltd. | | | | | 478,000 | | | | 5,429 | |
See financial notes. 35
Laudus International MarketMasters Fund
Portfolio Holdings continued
Security
| | | | Number
of Shares | | Value
($ x 1,000) |
|---|
Capital Goods 0.5% |
| Hyflux Ltd. | | | | | 3,228,000 | | | | 5,455 | |
| Jaya Holdings Ltd. | | | | | 1,264,000 | | | | 1,154 | |
| SembCorp Marine Ltd. | | | | | 1,924,000 | | | | 4,224 | |
| | | | | | | | | | 10,833 | |
Consumer Services 0.1% |
| Raffles Education Corp., Ltd. | | | | | 925,000 | | | | 1,582 | |
Diversified Financials 0.0% |
| Singapore Exchange Ltd. | | | | | 57,000 | | | | 164 | |
Health Care Equipment & Services 0.2% |
| Parkway Holdings Ltd. | | | | | 2,457,000 | | | | 4,378 | |
Household & Personal Products 0.1% |
| GP Batteries International Ltd. | | | | | 1,682,000 | | | | 1,470 | |
Real Estate 0.3% |
| Capitaland Ltd. | | | | | 1,872,300 | | | | 6,556 | |
Retailing 0.1% |
| Osim International Ltd. | | | | | 1,002,120 | | | | 1,087 | |
Telecommunication Services 0.3% |
| MobileOne Ltd. | | | | | 4,421,000 | | | | 5,624 | |
Transportation 0.8% |
| Cosco Corp.(Singapore) Ltd. | | | | | 4,176,040 | | | | 5,146 | |
| Goodpack Ltd.* | | | | | 544,000 | | | | 574 | |
| SIA Engineering Co. | | | | | 940,000 | | | | 2,261 | |
| Singapore Airport Ltd. | | | | | 1,408,000 | | | | 2,025 | |
| SMRT Corp., Ltd. | | | | | 8,763,000 | | | | 6,296 | |
| | | | | | | | | | 16,302 | |
| | | | | | | | | | 53,425 | |
South Africa 0.2% |
Diversified Financials 0.1% |
| JSE Ltd. | | | | | 193,606 | | | | 1,074 | |
Energy 0.0% |
| Sasol | | | | | 22,400 | | | | 769 | |
Media 0.1% |
| Naspers Ltd. | | | | | 53,100 | | | | 960 | |
Pharmaceuticals & Biotechnology 0.0% |
| Aspen Pharmacare Holdings Ltd.* | | | | | 111,500 | | | | 507 | |
| | | | | | | | | | 3,310 | |
Spain 2.1% |
Banks 0.1% |
| Banco Pastor SA | | | | | 86,100 | | | | 1,435 | |
Capital Goods 0.2% |
| Mecalux, S.A.* | | | | | 61,250 | | | | 2,356 | |
| Tecnicas Reunidas S.A.* | | | | | 59,862 | | | | 2,058 | |
| | | | | | | | | | 4,414 | |
Commercial Services & Supplies 0.2% |
| Prosegur, Compania de Seguridad S.A. | | | | | 116,381 | | | | 3,483 | |
Insurance 0.0% |
| Grupo Catalana Occidente, S.A. | | | | | 24,700 | | | | 813 | |
Materials 0.1% |
| Tubacex, S.A. | | | | | 263,243 | | | | 1,576 | |
Media 0.6% |
| Gestevision Telecinco S.A. | | | | | 450,000 | | | | 11,813 | |
Pharmaceuticals & Biotechnology 0.3% |
| Grifols S.A.* | | | | | 630,971 | | | | 6,608 | |
Retailing 0.3% |
| Industria de Diseno Textil SA | | | | | 98,900 | | | | 4,725 | |
Utilities 0.3% |
| Enagas | | | | | 183,800 | | | | 4,454 | |
| Red Electrica de Espana | | | | | 27,200 | | | | 1,056 | |
| | | | | | | | | | 5,510 | |
| | | | | | | | | | 40,377 | |
Sweden 0.9% |
Capital Goods 0.2% |
| Hexagon AB | | | | | 62,500 | | | | 2,324 | |
| Munters AB | | | | | 35,406 | | | | 1,370 | |
| | | | | | | | | | 3,694 | |
Materials 0.2% |
| Billerud | | | | | 263,900 | | | | 4,108 | |
Media 0.1% |
| Modern Times Group AB, Class B* | | | | | 27,450 | | | | 1,575 | |
Retailing 0.2% |
| Hemtex AB | | | | | 68,590 | | | | 1,028 | |
| Lindex AB | | | | | 108,055 | | | | 1,437 | |
| Nobia AB | | | | | 24,100 | | | | 855 | |
| | | | | | | | | | 3,320 | |
Software & Services 0.0% |
| TradeDoubler AB* | | | | | 30,500 | | | | 664 | |
Technology Hardware & Equipment 0.1% |
| Telefonaktiebolaget LM Ericsson, Class B | | | | | 798,000 | | | | 3,016 | |
Telecommunication Services 0.1% |
| Tele2 AB, Class B | | | | | 104,000 | | | | 1,092 | |
| | | | | | | | | | 17,469 | |
Switzerland 9.6% |
Capital Goods 1.0% |
| ABB Ltd. | | | | | 451,300 | | | | 6,712 | |
| Burckhardt Compression Holding AG* | | | | | 14,686 | | | | 1,594 | |
| Geberit AG | | | | | 2,500 | | | | 3,255 | |
| Georg Fischer AG — Reg’d.* | | | | | 8,001 | | | | 4,091 | |
| Kaba Holding AG* | | | | | 7,645 | | | | 2,231 | |
| Sulzer AG | | | | | 2,800 | | | | 2,460 | |
| | | | | | | | | | 20,343 | |
Commercial Services & Supplies 1.1% |
| Adecco S.A. | | | | | 318,000 | | | | 19,610 | |
| SGS SA | | | | | 1,330 | | | | 1,411 | |
| | | | | | | | | | 21,021 | |
36 See financial notes.
Laudus International MarketMasters Fund
Portfolio Holdings continued
Security
| | | | Number
of Shares | | Value
($ x 1,000) |
|---|
Consumer Durables & Apparel 0.6% |
| Advanced Digital Broadcast Holdings SA* | | | | | 22,383 | | | | 1,380 | |
| Forbo Holding AG* | | | | | 3,309 | | | | 1,158 | |
| Schulthess Group AG | | | | | 2,408 | | | | 1,403 | |
| Swatch Group AG | | | | | 36,400 | | | | 7,182 | |
| | | | | | | | | | 11,123 | |
Diversified Financials 3.1% |
| Bank Sarasin & Cie AG | | | | | 615 | | | | 1,772 | |
| Credit Suisse Group | | | | | 341,100 | | | | 20,562 | |
| EFG International* | | | | | 55,300 | | | | 1,811 | |
| Partners Group* | | | | | 41,079 | | | | 3,955 | |
| UBS AG | | | | | 487,160 | | | | 29,089 | |
| UBS AG, Reg’d | | | | | 28,800 | | | | 1,723 | |
| Verwaltungs — und Privat-Bank AG | | | | | 4,679 | | | | 1,179 | |
| | | | | | | | | | 60,091 | |
Food, Beverage & Tobacco 0.8% |
| Lindt & Spruengli AG | | | | | 700 | | | | 1,531 | |
| Nestle S.A. | | | | | 38,800 | | | | 13,259 | |
| Nestle S.A. ADR | | | | | 23,200 | | | | 1,989 | |
| | | | | | | | | | 16,779 | |
Health Care Equipment & Services 0.2% |
| Galenica Holding AG — Reg’d. | | | | | 7,749 | | | | 1,985 | |
| Nobel Biocare Holding AG | | | | | 7,750 | | | | 2,120 | |
| | | | | | | | | | 4,105 | |
Materials 0.8% |
| Givaudan S.A. — Reg’d. | | | | | 9,600 | | | | 7,952 | |
| Lonza Group AG | | | | | 13,700 | | | | 1,057 | |
| Syngenta AG* | | | | | 44,000 | | | | 7,100 | |
| | | | | | | | | | 16,109 | |
Pharmaceuticals & Biotechnology 1.7% |
| Actelion Ltd.* | | | | | 11,600 | | | | 1,948 | |
| Novartis AG — Reg’d. | | | | | 339,900 | | | | 20,632 | |
| Novartis AG ADR | | | | | 27,500 | | | | 1,670 | |
| Roche Holdings AG | | | | | 47,500 | | | | 8,317 | |
| | | | | | | | | | 32,567 | |
Software & Services 0.1% |
| Temenos Group AG* | | | | | 149,976 | | | | 1,993 | |
Transportation 0.2% |
| Kuehne & Nagel International AG | | | | | 46,200 | | | | 3,167 | |
| | | | | | | | | | 187,298 | |
Taiwan 2.3% |
Banks 1.0% |
| Chinatrust Financial Holding Co., Ltd. | | | | | 26,421,123 | | | | 19,149 | |
Consumer Durables & Apparel 0.2% |
| Inventec Appliances Corp. | | | | | 312,000 | | | | 703 | |
| Largan Precision Co., Ltd. | | | | | 58,050 | | | | 1,153 | |
| Merry Electronics Co., Ltd. | | | | | 608,000 | | | | 1,864 | |
| | | | | | | | | | 3,720 | |
Materials 0.1% |
| Chung Hwa Pulp Corp. | | | | | 5,770,000 | | | | 2,557 | |
Semiconductors & Semiconductor Equipment 0.2% |
| MediaTek, Inc. | | | | | 171,440 | | | | 1,669 | |
| Realtek Semiconductor Corp. | | | | | 1,248,000 | | | | 1,657 | |
| | | | | | | | | | 3,326 | |
Technology Hardware & Equipment 0.8% |
| Catcher Technology Co., Ltd. | | | | | 321,419 | | | | 2,770 | |
| High Tech Computer Corp. | | | | | 188,800 | | | | 4,674 | |
| Hon Hai Precision Industry Co., Ltd. | | | | | 915,689 | | | | 5,923 | |
| Inventec Co., Ltd. | | | | | 873,000 | | | | 629 | |
| Wistron Corp. | | | | | 1,879,000 | | | | 2,171 | |
| | | | | | | | | | 16,167 | |
| | | | | | | | | | 44,919 | |
Turkey 0.1% |
Media 0.1% |
| Dogan Yayin Holding A.S.* | | | | | 287,400 | | | | 1,089 | |
United Kingdom 22.8% |
Banks 1.6% |
| HBOS plc | | | | | 409,300 | | | | 8,480 | |
| Lloyds TSB Group plc | | | | | 1,330,000 | | | | 14,206 | |
| Northern Rock plc | | | | | 237,800 | | | | 5,429 | |
| Standard Chartered plc | | | | | 139,000 | | | | 3,910 | |
| | | | | | | | | | 32,025 | |
Capital Goods 2.4% |
| Alfred McAlpine plc | | | | | 140,560 | | | | 1,442 | |
| BAE Systems plc | | | | | 8,100 | | | | 263 | |
| Charter plc* | | | | | 211,393 | | | | 3,716 | |
| Chloride Group plc | | | | | 1,110,202 | | | | 2,929 | |
| Cobham plc | | | | | 1,146,435 | | | | 4,195 | |
| Morgan Crucible Co., plc | | | | | 537,568 | | | | 2,679 | |
| Punch Graphix plc | | | | | 1,901,295 | | | | 4,479 | |
| Rolls Royce Group, Class B* | | | | | 37,760,630 | | | | 72 | |
| Rolls-Royce Group plc* | | | | | 958,300 | | | | 8,578 | |
| Spirax-Sarco Engineering plc | | | | | 158,966 | | | | 2,821 | |
| The Weir Group plc | | | | | 793,138 | | | | 7,726 | |
| Ultra Electronics Holdings plc | | | | | 157,369 | | | | 3,349 | |
| Vt Group plc | | | | | 511,053 | | | | 4,679 | |
| | | | | | | | | | 46,928 | |
Commercial Services & Supplies 1.6% |
| WS Atkins plc | | | | | 183,545 | | | | 3,056 | |
| Babcock International Group plc | | | | | 499,855 | | | | 3,565 | |
| De La Rue plc | | | | | 390,545 | | | | 4,618 | |
| Homeserve plc | | | | | 126,492 | | | | 4,288 | |
| Michael Page Group plc | | | | | 677,500 | | | | 5,215 | |
| RPS Group plc | | | | | 575,645 | | | | 2,558 | |
| Serco Group plc | | | | | 1,203,004 | | | | 8,126 | |
| | | | | | | | | | 31,426 | |
Consumer Durables & Apparel 0.2% |
| Aga Foodservice Group plc | | | | | 186,489 | | | | 1,442 | |
| The Berkeley Group Holdings plc* | | | | | 77,500 | | | | 2,122 | |
| | | | | | | | | | 3,564 | |
Consumer Services 1.5% |
| Compass Group plc | | | | | 3,190,000 | | | | 17,046 | |
| Greene King plc | | | | | 270,446 | | | | 4,932 | |
| J.D. Wetherspoon plc | | | | | 347,504 | | | | 3,708 | |
See financial notes. 37
Laudus International MarketMasters Fund
Portfolio Holdings continued
Security
| | | | Number
of Shares | | Value
($ x 1,000) |
|---|
| Punch Taverns plc | | | | | 206,300 | | | | 4,042 | |
| | | | | | | | | | 29,728 | |
Diversified Financials 1.1% |
| Cattles plc | | | | | 1,006,089 | | | | 7,214 | |
| IG Group Holdings plc | | | | | 827,422 | | | | 4,008 | |
| Man Group plc | | | | | 483,400 | | | | 4,492 | |
| Schroders plc | | | | | 292,700 | | | | 5,521 | |
| | | | | | | | | | 21,235 | |
Energy 0.9% |
| BG Group plc | | | | | 429,700 | | | | 5,702 | |
| Cairn Energy plc* | | | | | 58,100 | | | | 1,945 | |
| Expro International Group plc | | | | | 355,660 | | | | 5,171 | |
| Tullow Oil plc | | | | | 617,190 | | | | 4,589 | |
| | | | | | | | | | 17,407 | |
Food & Staples Retailing 0.4% |
| Tesco plc | | | | | 1,112,500 | | | | 8,346 | |
Food, Beverage & Tobacco 2.2% |
| British American Tobacco plc | | | | | 20,900 | | | | 1,149 | |
| Cadbury Schweppes plc | | | | | 1,557,000 | | | | 15,674 | |
| Cadbury Schweppes plc ADR | | | | | 37,500 | | | | 1,522 | |
| Diageo plc | | | | | 1,085,000 | | | | 20,062 | |
| Diageo plc ADR | | | | | 26,700 | | | | 1,988 | |
| Northern Foods plc | | | | | 849,935 | | | | 1,438 | |
| | | | | | | | | | 41,833 | |
Health Care Equipment & Services 0.2% |
| Gyrus Group plc* | | | | | 202,214 | | | | 1,397 | |
| Southern Cross Healthcare Ltd.* | | | | | 321,968 | | | | 1,861 | |
| | | | | | | | | | 3,258 | |
Household & Personal Products 0.4% |
| Reckitt Benckiser plc | | | | | 167,500 | | | | 7,282 | |
Insurance 0.8% |
| Admiral Group plc | | | | | 95,700 | | | | 1,694 | |
Willis Group Holdings Ltd. (a) | | | | | 341,000 | | | | 12,968 | |
| | | | | | | | | | 14,662 | |
Materials 1.1% |
| Anglo American plc ADR | | | | | 87,700 | | | | 1,989 | |
| Croda International plc | | | | | 425,546 | | | | 4,243 | |
| Lonmin plc | | | | | 18,300 | | | | 1,010 | |
| Rexam plc | | | | | 381,826 | | | | 4,296 | |
| Rio Tinto plc | | | | | 17,600 | | | | 3,897 | |
| Victrex plc | | | | | 385,711 | | | | 5,291 | |
| | | | | | | | | | 20,726 | |
Media 2.7% |
| British Sky Broadcasting Group plc | | | | | 2,489,000 | | | | 25,807 | |
| Johnston Press plc | | | | | 1,643,800 | | | | 13,099 | |
| Trinity Mirror plc | | | | | 1,449,000 | | | | 13,500 | |
| | | | | | | | | | 52,406 | |
Pharmaceuticals & Biotechnology 1.8% |
| AstraZeneca plc | | | | | 125,400 | | | | 7,390 | |
| GlaxoSmithKline plc | | | | | 1,039,500 | | | | 27,703 | |
| | | | | | | | | | 35,093 | |
Real Estate 0.2% |
| Big Yellow Group plc | | | | | 248,631 | | | | 2,539 | |
| Unite Group plc | | | | | 171,772 | | | | 1,627 | |
| | | | | | | | | | 4,166 | |
Retailing 1.5% |
| Signet Group plc | | | | | 10,100,000 | | | | 23,149 | |
| The Carphone Warehouse plc | | | | | 1,266,848 | | | | 6,834 | |
| | | | | | | | | | 29,983 | |
Software & Services 0.0% |
| Detica Group plc | | | | | 45,200 | | | | 280 | |
Technology Hardware & Equipment 1.1% |
| CSR plc* | | | | | 54,500 | | | | 787 | |
| Laird Group plc | | | | | 383,720 | | | | 2,632 | |
| Rotork plc | | | | | 628,909 | | | | 9,405 | |
| TT electronics plc | | | | | 1,842,010 | | | | 7,813 | |
| Wolfson Microelectronics plc* | | | | | 94,178 | | | | 517 | |
| | | | | | | | | | 21,154 | |
Telecommunication Services 0.8% |
| Vodafone Group plc | | | | | 6,312,875 | | | | 16,267 | |
Transportation 0.1% |
| Air Berlin Plc* | | | | | 107,088 | | | | 2,069 | |
Utilities 0.2% |
| International Power plc | | | | | 331,400 | | | | 2,115 | |
| Pennon Group plc | | | | | 208,114 | | | | 2,051 | |
| | | | | | | | | | 4,166 | |
| | | | | | | | | | 444,004 | |
Preferred Stock 0.4% of net assets |
Brazil 0.2% |
Banks 0.1% |
| Banco Itau Holding Financeira S.A. | | | | | 57,100 | | | | 1,880 | |
Energy 0.1% |
| Petroleo Brasileiro S.A. | | | | | 91,300 | | | | 1,833 | |
| | | | | | | | | | 3,713 | |
Germany 0.2% |
Consumer Durables & Apparel 0.2% |
| Hugo Boss AG | | | | | 97,487 | | | | 4,545 | |
Rights 0.2% of net assets |
Sweden 0.2% |
| JM AB* | | | | | 176,230 | | | | 3,468 | |
Taiwan 0.0% |
| Motech Industries, Inc.* | | | | | 28,751 | | | | 1 | |
38 See financial notes.
Laudus International MarketMasters Fund
Portfolio Holdings continued
Security
Rate, Maturity Date
| | | | Face
Amount
($ x 1,000) | |
Value
($ x 1,000) |
|---|
Short-Term Investment 3.8% of net assets |
Repurchase Agreement 3.8% |
Fixed Income Clearing
Corp. dated 10/31/06,
due 11/01/06 at 4.8%,
with a maturity value
of $73,641 (fully
collateralized by Freddie
Mac with a value of
$75,441.) | | | | | 73,631 | | | | 73,631 | |
U.S. Treasury Obligation 0.0% of net assets |
U.S. Treasury Bill
4.90%, 12/14/06 | | | | | 249 | | | | 249 | |
At 10/31/06, the tax basis cost of the fund’s investments was $1,639,562, and the unrealized appreciation and depreciation were $312,946 and ($15,659), respectively, with a net unrealized appreciation of $297,287.
As of 10/31/06, the prices of certain foreign securities held by the fund aggregating $1,654,043 were adjusted from their closing market prices following the guidelines adopted by the fund’s Board of Trustees.
* | | Non-income producing security. |
(a) | | All or a portion of this security is held as collateral for open futures contracts. |
(b) | | Securities exempt from registration under Rule 144A of the Securities Act of 1933. These securities may be resold in transactions exempt from registrations, normally to qualified institutional buyers. At the period end, the value of these amounted to $2,462 or 0.1% of net assets. |
ADR — American Depositary Receipt
GDR — Global Depositary Receipt
In addition to the above, the fund held the following at 10/31/2006. All numbers are x 1,000 except number of futures contracts.
| | | |
Number of
Contracts | | Contract
Value | | Unrealized
Gains |
|---|
Futures Contracts
|
|
|---|
Russell 2000 Index, Long
expires 12/15/06 | | | | | 5 | | | | 1,928 | | | | 141 | |
S&P 500 Index, Long,
expires 12/14/06 | | | | | 2 | | | | 692 | | | | 36 | |
| | | | | | | | | | | | | | 177 | |
In addition to the above, the fund held the following at 10/31/06. All numbers x 1,000.
Expiration Date
| | | | Currency to
be Received | | Amount of
Currency to
be Received
($ x 1,000) | | Currency to
be Delivered | | Amount of
Currency to
be Delivered
($ x 1,000) | | Unrealized
Losses
($ x 1,000) |
|---|
| |
Forward Foreign Currency Contracts
|
|
|---|
| 11/6/06 | | | | USD | | 15,189 | | GBP | | | 15,035 | | | | (154 | ) |
| 1/31/07 | | | | USD | | 172 | | JPY | | | 171 | | | | (1 | ) |
| | | | | | | | | | | | | | | | (155 | ) |
See financial notes. 39
Laudus International MarketMasters Fund
Statement of
Assets and Liabilities
As of October 31, 2006. All numbers x 1,000 except NAV.
Assets | | | | | | |
| Investments, at value (cost $1,627,059) | | | | $ | 1,936,849 | |
| Cash | | | | | 506 | |
| Foreign currency, at value (cost $8,346) | | | | | 8,347 | |
Receivables:
| | | | | | |
| Investments sold | | | | | 22,432 | |
| Fund shares sold | | | | | 3,339 | |
| Dividends | | | | | 2,039 | |
| Foreign tax reclaims | | | | | 976 | |
| Interest | | | | | 10 | |
| Transfer agent | | | | | 25 | |
| Prepaid expenses | | | | + | 12 | |
Total assets | | | | | 1,974,535 | |
| |
Liabilities | | | | | | |
Payables:
| | | | | | |
| Investments bought | | | | | 22,605 | |
| Investment adviser and administrator fees | | | | | 2,110 | |
| Fund shares redeemed | | | | | 1,389 | |
| Due to brokers for futures | | | | | 6 | |
| Trustee fees | | | | | 2 | |
| Unrealized depreciation on forward foreign currency contracts | | | | | 155 | |
| Accrued expenses | | | | + | 254 | |
Total liabilities | | | | | 26,521 | |
| |
Net Assets | | |
Total assets | | | | | 1,974,535 | |
Total liabilities | | | | | –26,521 | |
Net assets | | | | $ | 1,948,014 | |
| |
Net Assets by Source | | | | | | |
| Capital received from investors | | | | | 1,482,954 | |
| Net investment income not yet distributed | | | | | 8,883 | |
| Net realized capital gains | | | | | 146,351 | |
| Net unrealized capital gains | | | | | 309,826 | |
| |
Net Asset Value (NAV) by Shares Class | | | | | | |
Share Class
| | | | Net Assets | | ÷ | | Shares
Outstanding | | = | | NAV |
|---|
| Investor Shares | | | | $ | 1,319,876 | | | | | | | | 63,677 | | | | | | | $ | 20.73 | |
| Select Shares | | | | $ | 628,138 | | | | | | | | 30,248 | | | | | | | $ | 20.77 | |
40 See financial notes.
Laudus International MarketMasters Fund
Statement of
Operations
For November 1, 2005 through October 31, 2006. All numbers x 1,000.
Investment Income | | | | | | |
| Dividends (net of foreign withholding taxes of $2,939) | | | | $ | 32,499 | |
| Interest | | | | + | 1,912 | |
Total Investment Income | | | | | 34,411 | |
| |
Net Realized Gains and Losses | | | | | | |
| Net realized gains on investments | | | | | 186,452 | |
| Net realized gains on foreign currency transactions | | | | | 4,398 | |
| Net realized losses on futures contracts | | | | + | (6,530 | ) |
Net realized gains | | | | | 184,320 | |
| |
Net Unrealized Gains and Losses | | | | | | |
| Net unrealized gains on investments | | | | | 118,523 | |
| Net unrealized losses on foreign currency transactions | | | | | (5,557 | ) |
| Net unrealized gains on futures contracts | | | | + | 70 | |
Net unrealized gains | | | | | 113,036 | |
| |
Expenses | | | | | | |
| Investment adviser and administrator fees | | | | | 20,797 | |
Transfer agent and shareholder service fees:
| | | | | | |
| Investor Shares | | | | | 2,954 | |
| Select Shares | | | | | 1,000 | |
| Custodian fees | | | | | 1,278 | |
| Registration fees | | | | | 248 | |
| Shareholder reports | | | | | 179 | |
| Portfolio accounting fees | | | | | 127 | |
| Professional fees | | | | | 73 | |
| Trustees’ fees | | | | | 16 | |
| Other expenses | | | | + | 26 | |
| Total expenses | | | | | 26,698 | |
| Custody Credit | | | | | –1,205 | |
| Expense reduction by adviser and Schwab | | | | | –634 | |
Net expenses | | | | | 24,859 | |
| |
Increase in Net Assets from Operations | | | | | | |
Total investment income | | | | | 34,411 | |
Net expenses | | | | | –24,859 | |
Net investment income | | | | | 9,552 | |
Net realized gains | | | | | 184,320 | |
Net unrealized gains | | | | + | 113,036 | |
Increase in net assets from operations | | | | $ | 306,908 | |
See financial notes. 41
Laudus International MarketMasters Fund
Statement of
Changes in Net Assets
For the current and prior report periods. All numbers x 1,000.
| | | | 11/1/05–10/31/06 | | 11/1/04–10/31/05 |
|---|
| Net investment income | | | | $ | 9,552 | | | $ | 3,570 | |
| Net realized gains | | | | | 184,320 | | | | 56,947 | |
| Net unrealized gains | | | | + | 113,036 | | | | 110,325 | |
Increase in net assets from operations | | | | | 306,908 | | | | 170,842 | |
| |
Distributions Paid | | | | | | | | | | |
| Dividends from net investment income | | | | | | | | | | |
| Investor Shares | | | | | 7,908 | | | | 907 | |
| Select Shares | | | | + | 3,448 | | | | 317 | |
Total dividends from net investment income | | | | $ | 11,356 | | | $ | 1,224 | |
Transactions in Fund Shares | | | | | | | | | | | | | | | | | | |
| | | | 11/1/05–10/31/06 | | 11/1/04–10/31/05 | |
|---|
| | | | SHARES | | VALUE | | SHARES | | VALUE |
|---|
Shares Sold | | | | | | | | | | | | | | | | | | |
| Investor Shares | | | | | 36,898 | | | $ | 713,186 | | | | 17,457 | | | $ | 271,992 | |
| Select Shares | | | | + | 20,443 | | | | 394,541 | | | | 11,835 | | | | 185,351 | |
Total shares sold | | | | | 57,341 | | | $ | 1,107,727 | | | | 29,292 | | | $ | 457,343 | |
| |
Shares Reinvested | | | | | | | | | | | | | | | | | | |
| Investor Shares | | | | | 406 | | | $ | 7,287 | | | | 58 | | | $ | 837 | |
| Select Shares | | | | + | 164 | | | | 2,946 | | | | 20 | | | | 278 | |
Total shares reinvested | | | | | 570 | | | $ | 10,233 | | | | 78 | | | $ | 1,115 | |
| |
Shares Redeemed | | | | | | | | | | | | | | | | | | |
| Investor Shares | | | | | (20,911 | ) | | $ | (404,207 | ) | | | (10,865 | ) | | $ | (169,365 | ) |
| Select Shares | | | | + | (6,679 | ) | | | (129,171 | ) | | | (1,515 | ) | | | (24,118 | ) |
Total shares redeemed | | | | | (27,590 | ) | | $ | (533,378 | ) | | | (12,380 | ) | | $ | (193,483 | ) |
| |
Net transactions in fund shares | | | | | 30,321 | | | $ | 584,582 | | | | 16,990 | | | $ | 264,975 | |
Shares Outstanding and Net Assets | | | | | | | | | | | | | | | | | | |
| | | | 11/1/05–10/31/06 | | 11/1/04–10/31/05 | |
|---|
| | | | SHARES | | NET ASSETS | | SHARES | | NET ASSETS |
|---|
| Beginning of period | | | | | 63,604 | | | $ | 1,067,880 | | | | 46,614 | | | $ | 633,287 | |
| Total increase | | | | + | 30,321 | | | | 880,134 | | | | 16,990 | | | | 434,593 | |
End of period | | | | | 93,925 | | | $ | 1,948,014 | | | | 63,604 | | | $ | 1,067,880 | |
| Net investment income not yet distributed | | | | | | | | $ | 8,883 | | | | | | | $ | 1,223 | |
42 See financial notes.
Laudus MarketMasters Fund
Financial Notes
| 1. | | Business Structure of the Funds |
Each of the funds discussed in this report is a series of Schwab Capital Trust (Trust), a no-load, open-end management investment company. The company is organized as a Massachusetts business trust and is registered under the Investment Company Act of 1940, as amended. The list below shows all the funds in the trust including the funds discussed in this report, which are highlighted:
Schwab Capital Trust (organized May 7, 1993)
Laudus U.S. MarketMasters Fund
Laudus Small-Cap MarketMasters Fund
Laudus International MarketMasters Fund
Schwab S&P 500 Index Fund
Schwab Institutional Select S&P 500 Fund
Schwab Small-Cap Index Fund
Schwab Total Stock Market Index Fund
Schwab International Index Fund
Schwab MartketTrack All Equity Portfolio
Schwab MarketTrack Growth Portfolio
Schwab MarketTrack Balanced Portfolio
Schwab MarketTrack Conservative Portfolio
Schwab Viewpoints Fund | | | | Schwab Premier Equity Fund
Schwab Core Equity Fund
Schwab Dividend Equity Fund
Schwab Large-Cap Growth Fund
Schwab Small-Cap Equity Fund
Schwab Hedged Equity Fund
Schwab Financial Services Fund
Schwab Health Care Fund
Schwab Technology Fund
Schwab Target 2010 Fund
Schwab Target 2020 Fund
Schwab Target 2030 Fund
Schwab Target 2040 Fund
Schwab Retirement Income Fund |
Laudus MarketMasters Funds offer two share classes: Investor Shares and Select Shares®. Shares of each class represent interest in the same portfolio, but each class has different expenses and investment minimums.
Shares are bought and sold at net asset value, or NAV, which is the price for all outstanding shares. Each share has a par value of 1/1,000 of a cent, and the trustees may issue as many shares as necessary.
Prior to June 3, 2002, each fund invested in a mix of actively managed mutual funds. The transition to their multi-manager strategy began on June 3, 2002. Also, effective November 1, 2004, the Schwab MarketMasters Funds were renamed the Laudus MarketMasters Funds.
| 2. | | Significant Accounting Policies: |
The following is a summary of the significant accounting policies in the preparation of financial statements. The accounting policies are in conformity with accounting principles generally accepted in the United States of America in the investment company industry.
The funds value the securities in their portfolios every business day. The funds use the following policies to value various types of securities:
| • | | Securities traded on an exchange or over-the-counter: valued at the closing value for the day, or, on days when no closing value has been reported, halfway between the most recent bid and asked quotes. Securities that are primarily traded on foreign exchanges are valued at the closing values of such securities on their respective exchanges with these values then translated into U.S. dollars at the current exchange rate. |
• | | Securities for which no quoted value is available or when a significant event has occurred between the time of the security’s last close and the time the fund calculates net asset value: valued at fair value, as determined in good faith by the fund’s investment adviser using guidelines adopted by the fund’s Board of Trustees and the Pricing Committee. Some of the more common reasons that may necessitate that a security be valued at fair value include: the security’s trading has been halted or suspended; the security has been de-listed from a national exchange; the security’s primary trading market is temporarily closed at a time when under normal conditions it would be open; the security’s primary pricing source is not able or willing to provide a price, or certain foreign securities closing market prices adjusted for changes in value that may occur between the close of foreign exchange and the time at which fund shares are priced. The Board of Trustees regularly reviews fair value determinations, made by the funds, pursuant to the procedures. |
43
Laudus MarketMasters Fund
Financial Notes (continued)
2. Significant Accounting Policies (continued):
| • | | Bonds and notes: valued at halfway between the most recent bid and asked quotes or, if such quotes are unavailable, at prices for securities of comparable maturity, credit quality and type. Valuations for bonds and notes are provided by an independent bond-pricing service. |
| • | | Futures and forwards: open contracts are valued at their settlement prices as of the close of their exchanges (for futures) or at a market value based on that day’s exchange rates (for forwards). When a fund closes out a futures or forwards position, it calculates the difference between the value of the position at the beginning and at the end, and records a realized gain or loss accordingly. |
| • | | Short-term securities (60 days or less to maturity): valued at amortized cost. |
| • | | Mutual funds: valued at their respective net asset values as determined by those funds in accordance with the 1940 Act for a given day. |
(b) | | Portfolio Investments: |
Delayed-Delivery: The funds may buy securities on a delayed-delivery basis. In these transactions, the funds agree to buy a security for a stated price, with settlement generally occurring within two weeks. If the security’s value falls before settlement occurs, the funds could end up paying more for the security than its market value at the time of settlement. The funds have set aside sufficient securities as collateral for those securities bought on a delayed-delivery basis.
Futures Contract: The funds may invest in futures contracts. Futures contracts involve certain risks because they can be very sensitive to market movements.
One risk is that the price of a futures contract may not move in perfect correlation with the price of the underlying securities. Another risk is that, at certain times, it may be impossible for a fund to close out a position in a futures contract, due to a difference in trading hours or to market conditions that may reduce the liquidity for a futures contract or its underlying securities. The potential for losses associated with futures contracts may exceed amounts recorded in the Statement of Assets and Liabilities.
Because futures contracts carry inherent risks, a fund must give the broker a deposit of cash and/or securities (the “initial margin”) whenever it enters into the futures contract. The amount of the deposit may vary from one contract to another, but it is generally a percentage of the contract amount.
Futures are traded publicly on exchanges, and their market value changes daily. A fund records the change in market value of futures, and also the change in the amount of margin deposit required (“due to/from broker”).
Forward Currency Contract: Laudus International MarketMasters Fund may invest in forward currency contracts in connection with the purchase and sale of portfolio securities to minimize the uncertainty of changes in future exchange rates. “Forwards” as they are known, are contracts to buy and sell a currency at a set price on a future date. Forwards are similar to futures except that they are not publicly traded, but are agreements directly between two parties.
As with futures, forwards involve certain risks that are not fully reflected in the fund’s financials. If counter-parties to the contracts or if the value of the foreign currency changes unfavorably, the fund could sustain a loss.
Repurchase Agreement: The funds may enter into a repurchase agreement. In a repurchase agreement, a fund buys a security from another party (usually a financial institution) with the agreement that it be sold back in the future. The date, price and other conditions are all specified when the agreement is created.
The funds’ repurchase agreements will be fully collateralized by U.S. government securities. All collateral is held by the funds’ custodian (or, with tri-party agreements, the agent’s bank) and is monitored daily to ensure that its market value is at least equal to the repurchase price under the agreement.
(c) | | Security Transactions: |
Security transactions are recorded as of the date the order to buy or sell the security is executed. Realized gains and losses from security transactions are based on the identified costs of the securities involved.
44
Laudus MarketMasters Fund
Financial Notes (continued)
2. Significant Accounting Policies (continued):
Assets and liabilities denominated in foreign currencies are reported in U.S. dollars. For assets and liabilities held on a given date, the dollar value is based on market exchange rates in effect on that date. Transactions involving foreign currencies, including purchases, sales, income receipts and expense payments, are calculated using exchange rates in effect on the transaction date.
Interest income is recorded as it accrues. Dividends and distributions from portfolio securities and underlying funds are recorded on the date they are effective (the ex-dividend date), although the funds record certain foreign security dividends on the day they learn of the ex-dividend date.
Expenses that are specific to a fund or a class are charged directly to that fund or class. Expenses that are common to all funds within the trust generally are allocated among the funds in proportion to their average daily net assets.
For funds offering multiple share classes, the net investment income, other than class specific expenses, and the realized and unrealized gains or losses, are allocated daily to each class in proportion to its net assets.
(f) | | Distributions to Shareholders: |
The funds pay dividends from net investment income and make distributions from net realized capital gains once a year.
Each fund maintains its own account for purposes of holding assets and accounting, and is considered a separate entity for tax purposes. Within its account, each fund also keeps certain assets in segregated accounts, as may be required by securities law.
Each fund has an arrangement with its custodian bank under which the fund receives a credit for its uninvested cash balance to offset its custody fees and accounting fees. The credit amounts (if any) are disclosed in the statement of operations as a reduction to the fund’s operating expenses.
(h) | | Accounting Estimates: |
The accounting policies described in this report conform with accounting principles generally accepted in the United States of America. Notwithstanding this, shareholders should understand that in order to follow these principles, fund management has to make estimates and assumptions that affect the information reported in the financial statements. It’s possible that once the results are known, they may turn out to be different from these estimates.
(i) | | Federal Income Taxes: |
The funds intend to meet federal income and excise tax requirements for regulated investment companies. Accordingly, the funds distribute substantially all of their net investment income and realized net capital gains (if any) to their respective shareholders each year. As long as a fund meets the tax requirements, it is not required to pay federal income tax.
Under the funds’ organizational documents, the officers and trustees are indemnified against certain liabilities arising out of the performance of their duties to the funds. In addition, in the normal course of business the funds enter into contracts with their vendors and others that provide general indemnifications. The funds’ maximum exposure under these arrangements is unknown as this would involve future claims that may be made against the funds. However, based on experience, the funds expect the risk of loss to be remote.
(k) New Accounting Standards:
Financial Accounting Standards Board Interpretation (FIN) No. 48 — Accounting for Uncertainty in Tax Positions — An Interpretation of SFAS No. 109, was issued in July 2006 and is effective for fiscal years beginning after December 15, 2006. This Interpretation provides new requirements for the recognition, measurement, and disclosure in the financial statements
45
Laudus MarketMasters Fund
Financial Notes (continued)
2. Significant Accounting Policies (continued):
of a tax position taken or expected to be taken in a tax return when there is uncertainty about whether that tax position will ultimately be sustained. We have not yet completed our evaluation of the impact, if any, of adopting FIN 48 on the Fund’s financial statements.
In September 2006, the Financial Accounting Standards Board (FASB) issued Statement of Financial Accounting Standards No. 157, “Fair Value Measurements” (SFAS No. 157). SFAS No. 157 defines fair value, establishes a framework for measuring fair value in accordance with generally accepted accounting principles and expands disclosure about fair value measurements. SFAS No. 157 is effective for fiscal years beginning after November 15, 2007. Management is currently evaluating the impact the adoption of SFAS No. 157 will have on the Fund’s financial statement disclosures.
| 3. | | Affiliates and Affiliated Transactions:
(All dollar amounts are × 1,000) |
Charles Schwab Investment Management, Inc. (CSIM or the investment adviser), a wholly owned subsidiary of The Charles Schwab Corporation, serves as each fund’s investment adviser and administrator pursuant to an Investment Advisory and Administration Agreement (Advisory Agreement) between it and the trust. Charles Schwab & Co., Inc. (“Schwab”) is an affiliate of the investment adviser and is the trust’s shareholder services agent and transfer agent.
For its advisory and administrative services to each fund, the investment adviser is entitled to receive an annual fee payable monthly based on each fund’s average daily net assets described as follows:
Average daily net assets
| | | | U.S.
MarketMasters
Fund
|
| Small-Cap
MarketMasters
Fund
|
| International
MarketMasters
Fund
|
|---|
| First $500 million | | | | | 0.925 | % | | | 1.17 | % | | | 1.290 | % |
| Over $500 million | | | | | 0.92 | % | | | 1.13 | % | | | 1.275 | % |
| Over $1 billion | | | | | 0.91 | % | | | 1.07 | % | | | 1.25 | % |
For its transfer agent and shareholder services, Schwab is entitled to receive an annual fee payable monthly based on each fund’s average daily net assets described as follows:
| | | | Transfer Agent Fees
|
| Shareholder Service Fees
|
|---|
| Investor Shares | | | | | 0.05 | % | | | 0.20 | % |
| Select Shares | | | | | 0.05 | % | | | 0.15 | % |
Although these agreements specify certain fees for these services, CSIM and Schwab have made additional agreements with the funds to limit the total expenses charged, excluding interest, taxes and certain non-routine expenses through February 27, 2007, as follows:
| | | | U.S.
MarketMasters
Fund
|
| Small-Cap
MarketMasters
Fund
|
| International
MarketMasters
Fund
|
|---|
| Investor Shares | | | | | 1.25 | % | | | 1.55 | % | | | 1.65 | % |
| Select Shares | | | | | 1.07 | % | | | 1.37 | % | | | 1.47 | % |
Pursuant to an exemptive order issued by the SEC, the funds may enter into interfund borrowing and lending transactions within the Schwab Funds. All loans are for temporary or emergency purposes only. The interest rate charged on the loan is the average of the overnight repurchase agreement rate and the short-term bank loan rate. The interfund lending facility is subject to the oversight and periodic review of the Board of Trustees of the Schwab Funds. There was no interfund borrowing or lending activity for any fund during the period.
Trustees may include people who are officers and/ or directors of the investment adviser or Schwab. Federal securities law limits the percentage of such “interested persons” who may serve on a trust’s board, and the trust was in compliance with these limitations throughout the report period. The trust did not pay any of these persons for their service as trustees, but it did pay non-interested persons (independent trustees), as noted in each fund’s Statement of Operations.
46
Laudus MarketMasters Fund
Financial Notes (continued)
| 4. | | Purchases and Sales of Investment Securities:
(All dollar amounts are × 1,000) |
For the fiscal year ended October 31, 2006, purchases and sales of securities (excluding short-term obligations) were as follows:
| | | | Purchases of Securities
| | Sales/Maturities of Securities
|
|---|
| U.S. MarketMasters Fund | | | | $ | 90,929 | | | $ | 123,666 | |
| Small-Cap MarketMasters Fund | | | | | 106,702 | | | | 122,595 | |
| International MarketMasters Fund | | | | | 1,922,153 | | | | 1,386,494 | |
| 5. | | Redemption Fee:
(All dollar amounts are × 1,000) |
The funds may impose a short-term redemption fee on any fund shares that are redeemed or exchanged by a shareholder within a specified number of days of the purchase date. For shares purchased on or prior to 4/29/05, the Laudus International MarketMasters Fund charged a redemption fee of 1.50% on shares held 180 days or less. For shares purchased after 4/29/05, the funds charge a redemption fee of 2.00% on shares held less than 30 days. Such amounts are net of the redemption fee proceeds on the Statement of Changes in Net Assets. The redemption fees charged during the current and prior fiscal years were:
| | | | Current Period
| | Prior Period
|
|---|
U.S. MarketMasters Fund | | | | | | | | | | |
| Investor Shares | | | | $ | 5 | | | $ | 1 | |
| Select Shares | | | | | — | | | | — | |
Small-Cap MarketMasters Fund | | | | | | | | | | |
| Investor Shares | | | | $ | 3 | | | $ | 2 | |
| Select Shares | | | | | — | | | | — | |
International MarketMasters Fund | | | | | | | | | | |
| Investor Shares | | | | $ | 89 | | | $ | 102 | |
| Select Shares | | | | $ | 47 | | | $ | 26 | |
| 6. | | Borrowing:
(All dollar amounts are × 1,000) |
The funds may borrow money from banks and custodians. The funds may obtain temporary bank loans through the trusts to which they belong, to use for meeting shareholder redemptions or for extraordinary or emergency purposes. The Schwab Funds have custodian overdraft facilities and line of credit arrangements of $150 million and $100 million with State Street Corporation and Bank of America, N.A., respectively. The funds pay interest on the amounts they borrow at rates that are negotiated periodically.
Fund
| | | | Amount
Outstanding
at 10/31/06
|
| Average
Borrowing*
|
| Weighted
Average
Interest
Rate*(%)
|
|---|
| U.S. MarketMasters Fund | | | | $ | — | | | $ | 50 | | | | 7.25 | |
| Small-Cap MarketMasters Fund | | | | | — | | | | 74 | | | | 5.18 | |
| International MarketMasters Fund | | | | | — | | | | 3,672 | | | | 5.98 | |
| * | | Based on the number of days for which the borrowing is outstanding. |
47
Laudus MarketMasters Fund
Financial Notes (continued)
| 7. | | Federal Income Taxes:
(All dollar amounts are × 1,000) |
As of October 31, 2006, the components of distributable earnings on a tax-basis were as follows:
| | | | U.S.
MarketMasters
Fund
|
| Small-Cap
MarketMasters
Fund
|
| International
MarketMasters
Fund
|
|
|---|
| Undistributed ordinary income | | | | $ | 273 | | | $2,643 | | $15,958 | |
| Undistributed long-term capital gains | | | | | — | | | 12,710 | | 151,792 | |
| Unrealized appreciation on investments | | | | | 25,098 | | | 17,298 | | 312,946 | |
| Unrealized depreciation on investments | | | | | (1,784 | ) | | (2,268) | | (15,659) | |
| Other unrealized appreciation (depreciation) | | | | | — | | | — | | 23 | |
Net unrealized appreciation/
(depreciation) | | | | $ | 23,314 | | | $15,030 | | $297,310 | |
The primary difference between book-basis and tax-basis unrealized appreciation or unrealized depreciation of investments is the tax deferral of losses on wash sales.
Capital loss carry forwards may be used to offset future realized capital gains for federal income tax purposes. As of October 31, 2006, the following funds had capital loss carry forwards expiring in:
| | | | U.S.
MarketMasters
Fund
|
| Small-Cap
MarketMasters
Fund
|
| International
MarketMasters
Fund
|
|
|---|
| 2010 | | | | $ | 20,397 | | | $— | | $— | |
| 2011 | | | | | 604 | | | — | | — | |
| Total | | | | $ | 21,001 | | | $— | | $— | |
For tax purposes, realized capital losses, occurring after October 31, may be deferred and treated as occurring on the first day of the following fiscal year. As of October 31, 2006, the funds had aggregate deferred realized capital losses as follows:
| | | | U.S.
MarketMasters
Fund
|
| Small-Cap
MarketMasters
Fund
|
| International
MarketMasters
Fund
|
|
|---|
| Capital losses utilized | | | | $ | 11,097 | | | $— | | $25,860 | |
The tax-basis components of distributions paid during the current and prior fiscal years were:
| | | | U.S.
MarketMasters
Fund
|
| Small-Cap
MarketMasters
Fund
|
|
| International
MarketMasters
Fund
|
|
|---|
Current period distributions | | | | | | |
| Ordinary income | | | | $ | 206 | | | $— | | | $11,356 | |
| Long-term capital gains | | | | | — | | | $8,918 | | | — | |
| Return of capital | | | | | — | | | — | | | — | |
| |
Prior period distributions | | | | | | |
| Ordinary income | | | | | — | | | — | | | 1,224 | |
| Long-term capital gains | | | | | — | | | — | | | — | |
| Return of capital | | | | | — | | | — | | | — | |
48
Laudus MarketMasters Fund
Financial Notes (continued)
7. Federal Income Taxes (continued):
The permanent book and tax basis differences may result in reclassifications between capital account and other accounts as required. The adjustments will have no impact on net assets or the results of operations. As of October 31, 2006, the funds made the following reclassifications:
| | | | U.S.
MarketMasters
Fund
|
| Small-Cap
MarketMasters
Fund
|
| International
MarketMasters
Fund
|
|
|---|
| Capital shares | | | | $ | 1 | | | $2 | | $— | |
| Undistributed net investment income | | | | | (7 | ) | | 865 | | 9,464 | |
| Net realized capital gains and losses | | | | | 6 | | | (867 | ) | (9,464 | ) |
Other Federal Tax Information (Unaudited)
(All dollar amounts are × 1,000)
For corporate shareholders, the following percentage of the funds dividend distributions paid during the fiscal year ended October 31, 2006, qualify for the corporate dividends received deduction:
| | | | Percentage
|
|---|
| U.S. MarketMasters Fund | | | | | 100 | % |
| Small-Cap MarketMasters Fund | | | | | 0 | % |
| International MarketMasters Fund | | | | | 0 | % |
For the fiscal year ended October 31, 2006, the fund’s designate the following amounts of the dividend distributions as qualified dividends for the purpose of the maximum rate under section 1(h)(ii) of the Internal Revenue Code. Shareholders will be notified in January 2007 via IRS form 1099 of the amounts for use in preparing their 2006 income tax return.
| U.S. MarketMasters Fund | | | | $ | 206 | |
| Small-Cap MarketMasters Fund | | | | | — | |
| International MarketMasters Fund | | | | | 11,356 | |
49
Report of Independent Registered Public Accounting Firm
To the Board of Trustees and Shareholders of
Laudus U.S. MarketMasters Fund
Laudus Small-Cap MarketMasters Fund
Laudus International MarketMasters Fund
In our opinion, the accompanying statements of assets and liabilities, including the portfolio holdings, and the related statements of operations and of changes in net assets and the financial highlights present fairly, in all material respects, the financial position of Laudus U.S. MarketMasters Fund, Laudus Small-Cap MarketMasters Fund and Laudus International MarketMasters Fund (three of the portfolios constituting Schwab Capital Trust, hereafter referred to as the “Funds”) at October 31, 2006, the results of each of their operations for the year then ended, and the changes in each of their net assets for each of the two years in the period then ended and the financial highlights for each of the periods presented, in conformity with accounting principles generally accepted in the United States of America. These financial statements and financial highlights (hereafter referred to as “financial statements”) are the responsibility of the Funds’ management; our responsibility is to express an opinion on these financial statements based on our audits. We conducted our audits of these financial statements in accordance with the standards of the Public Company Accounting Oversight Board (United States). Those standards require that we plan and perform the audits to obtain reasonable assurance about whether the financial statements are free of material misstatement. An audit includes examining, on a test basis, evidence supporting the amounts and disclosures in the financial statements, assessing the accounting principles used and significant estimates made by management, and evaluating the overall financial statement presentation. We believe that our audits, which included confirmation of securities at October 31, 2006 by correspondence with the custodian and brokers, provide a reasonable basis for our opinion.
PricewaterhouseCoopers LLP
San Francisco, California
December 14, 2006
50
Investment Advisory and Sub-Advisory Agreement Approval
The Investment Company Act of 1940 (the “1940 Act”) requires that initial approval of, as well as the continuation of, a fund’s investment advisory agreements must be specifically approved (1) by the vote of the trustees or by a vote of the shareholders of the fund, and (2) by the vote of a majority of the trustees who are not parties to the investment advisory agreements or “interested persons” of any party (the “Independent Trustees”), cast in person at a meeting called for the purpose of voting on such approval. In connection with such approvals, the fund’s trustees must request and evaluate, and the investment adviser is required to furnish, such information as may be reasonably necessary to evaluate the terms of the advisory agreements. In addition, the Securities and Exchange Commission (the “SEC”) takes the position that, as part of their fiduciary duties with respect to fund fees, fund boards are required to evaluate the material factors applicable to a decision to approve an investment advisory agreement.
Consistent with these responsibilities, the Board of Trustees (the “Board”) calls and holds one or more meetings each year that are dedicated, in whole or in part, to considering whether to renew the investment advisory agreements between Schwab Capital Trust (the “Trust”) and CSIM with respect to the funds covered in this annual report, and the individual sub-advisory agreements between CSIM and Harris Associates L.P., TCW Investment Management Company, Thornburg Investment Management, Inc. and Gardner Lewis Asset Management L.P. relating to Laudus U.S. Market Masters Fund; CSIM and TAMRO Capital Partners, LLC, TCW Investment Management Company, Tocqueville Asset Management LP and Veredus Asset Management LLC relating to Laudus Small-Cap MarektMasters Fund; and CSIM and American Century Global Investment Management, Inc., Artisan Partners Limited Partnership, Harris Associates L.P. and William Blair & Company, LLC relating to the Laudus International MarketMasters Fund (collectively, the “Sub-Advisors”). Such investment advisory and sub-advisory agreements are collectively referred to herein as the “Agreements”. The trustees also reviewed certain other agreements pursuant to which CSIM provides investment advisory services to certain other registered investment companies. In preparation for the meeting(s), the Board requests and reviews a wide variety of materials provided by CSIM and the Sub-Advisors, including information about their affiliates, personnel and operations. The Board also receives extensive data provided by third parties. This information is in addition to the detailed information about the funds that the Board reviews during the course of each year, including information that relates to fund operations and fund performance. The trustees also receive a memorandum from fund counsel regarding the responsibilities of trustees for the approval of investment advisory contracts. In addition, the Independent Trustees receive advice from independent counsel to the Independent Trustees, meet in executive session outside the presence of fund management and participate in question and answer sessions with representatives of CSIM and the Sub-Advisors, as appropriate. The trustees also discuss with CSIM the funds’ operations and CSIM’s ability, consistent with the “manager of mangers” structure of each of the funds to (i) identify and recommend to the trustees sub-advisors for each fund, (ii) monitor and oversee the performance and investment capabilities of each sub-advisor, and (iii) recommend the replacement of a sub-advisor when appropriate.
The Board, including a majority of the Independent Trustees, considered information specifically relating to the continuance of the Agreements at meetings held on May 2, 2006, May 24, 2006 and June 12, 2006, and approved the renewal of the Agreements for an additional one year term at the meeting held on June 12, 2006. The Board’s approval of the Agreements was based on consideration and evaluation of a variety of specific factors discussed at these meetings and at prior meetings, including:
| 1. | | the nature, extent and quality of the services provided to the funds under the Agreements, including the resources of CSIM and its affiliates, and the Sub-Advisors, dedicated to the funds; |
| 2. | | each fund’s investment performance and how it compared to that of certain other comparable mutual funds; |
| 3. | | each fund’s expenses and how those expenses compared to those of certain other comparable mutual funds and other types of accounts; |
| 4. | | the profitability of CSIM and its affiliates, including Charles Schwab & Co., Inc. (“Schwab”), with respect to each fund, including both direct and indirect benefits accruing to CSIM and its affiliates, as well as the profitability of the Sub-Advisors; and |
| 5. | | the extent to which economies of scale would be realized as the funds grow and whether fee levels in the Agreements reflect those economies of scale for the benefit of fund investors. |
Nature, Extent and Quality of Services. The Board considered the nature, extent and quality of the services provided by CSIM to the funds and the resources of CSIM and its affiliates dedicated to the funds. In this regard, the trustees evaluated, among other things, CSIM’s personnel, experience, track record and compliance program. The information considered by the trustees included specific information concerning changes in the nature, extent and
51
quality of services provided by CSIM since the trustees had last considered approval of the Agreements. The trustees also considered the fact that Schwab’s extensive branch network, Internet access, investment and research tools, telephone services, and array of account features benefit the funds and their shareholders. The trustees also considered Schwab’s excellent reputation as a full service brokerage firm and its overall financial condition. Finally, the trustees considered that the vast majority of the funds’ shareholders are also brokerage clients of Schwab, and that CSIM and its affiliates are uniquely positioned to provide services and support to the funds and such shareholders. The Board also considered the nature, extent and quality of the sub-advisory services provided by the Sub-Advisors to the funds and the resources each dedicates to the funds. In this regard, the trustees evaluated, among other things, each Sub-Advisor’s personnel, experience and compliance program. Following such evaluation, the Board concluded, within the context of its full deliberations, that the nature, extent and quality of services provided by CSIM and the Sub-Advisors to the funds and the resources of CSIM, and its affiliates, and the Sub-Advisors dedicated to the funds supported renewal of the Agreements.
Fund Performance. The Board considered fund performance in determining whether to renew the Agreements. Specifically, the trustees considered each fund’s performance relative to a peer group of other mutual funds and appropriate indices/benchmarks, in light of total return and market trends. As part of this review, the trustees considered the composition of the peer group, selection criteria and the reputation of the third party who prepared the peer group analysis. In evaluating the 68 performance of each fund, the trustees considered both market risk and shareholder risk expectations for such fund and the appropriateness of the benchmark used to compare the performance of each fund. In addition, the trustees considered whether irrespective of relative performance, each Sub-Advisor’s absolute performance was consistent with expectations for such Sub-Advisor’s unique investment methodology. The trustees further considered the level of fund performance in the context of its review of fund expenses and adviser profitability discussed below. Following such evaluation the Board concluded, within the context of its full deliberations, that the performance of the funds supported renewal of the Agreements.
Fund Expenses. With respect to the funds’ expenses, the trustees considered the rate of compensation called for by the Agreements, and each fund’s net operating expense ratio, in each case, in comparison to those of other comparable mutual funds, such peer groups and comparisons having been selected and calculated by an independent third party. The trustees considered the effects of CSIM’s and Schwab’s historical practice of voluntarily waiving management and other fees to prevent total fund expenses from exceeding a specified cap. The trustees also considered fees charged by CSIM and the Sub-Advisors to other similarly managed mutual funds, and other types of accounts, such as separate accounts, pooled vehicles and wrap accounts, but, with respect to such other types of accounts, accorded less weight to such comparisons due to the different legal, regulatory, compliance and operating features of mutual funds as compared to these other types of accounts. Following such evaluation, the Board concluded, within the context of its full deliberations, that the expenses of the funds are reasonable and supported renewal of the Agreements.
Profitability. With regard to profitability, the trustees considered the compensation flowing to CSIM and its affiliates, directly or indirectly and the compensation flowing to the Sub-Advisors, directly or indirectly. In this connection, the trustees reviewed management’s profitability analyses, together with certain commentary thereon from an independent accounting firm. The trustees also considered any other benefits derived by CSIM and the Sub-Advisors from their relationship with the funds, such as whether, by virtue of its management of the funds, CSIM or any Sub-Advisor obtains investment information or other research resources that aid it in providing advisory services to other clients. The trustees considered whether the varied levels of compensation and profitability under the Agreements and other service agreements were reasonable and justified in light of the quality of all services rendered to each fund by CSIM and the Sub-Advisors and their respective affiliates. The Board also considered the profitability of the Sub-Advisors with respect to the sub-advisory services they provide to the funds, although, when doing so, the Board took into account the fact that the Sub-Advisors are compensated by CSIM, and not by the funds directly, and such compensation with respect to any Sub-Advisor reflects an arms-length negotiation between the Sub-Advisor and CSIM. In addition, the Board considered information relating to changes to CSIM’s cost structure, including cost savings, technology investments and increased operating efficiencies and how these changes affected CSIM’s profitability under the Agreements. Based on this evaluation, the Board concluded, within the context of its full deliberations, that the profitability of CSIM and the Sub Advisors is reasonable and supported renewal of the Agreements.
Economies of Scale. The trustees considered the existence of any economies of scale and whether those are passed along to a fund’s shareholders through a graduated investment advisory fee schedule or other means, including any fee waivers by CSIM and its affiliates. In this regard, and consistent with their consideration of fund expenses, the trustees considered that CSIM and Schwab have
52
previously committed resources to minimize the effects on shareholders of diseconomies of scale during periods when fund assets were relatively small through their contractual expense waivers. For example, such diseconomies of scale may particularly affect newer funds or funds with investment strategies that are from time to time out of favor, but shareholders may benefit from the continued availability of such funds at subsidized expense levels. The trustees also considered CSIM’s agreement to contractual investment advisory fee schedules that include lower fees at higher graduated asset levels. The Board also considered certain commitments by CSIM and Schwab that are designed to pass along potential economies of scale to fund shareholders. Specifically, the Board considered CSIM and Schwab’s commitments, which may be changed only with Board approval: (i) to reduce contractual advisory fees or add breakpoints for certain funds, and (ii) to implement, by means of expense limitation agreement, reductions in net overall expenses for certain funds. Based on this evaluation, and in consideration of the commitments made by CSIM and Schwab as discussed above, the Board concluded, within the context of its full deliberations, that the funds obtain reasonable benefit from economies of scale.
In the course of their deliberations, the trustees did not identify any particular information or factor that was all-important or controlling. Based on the trustees’ deliberation and their evaluation of the information described above, the Board, including all of the Independent Trustees, unanimously approved the continuation of the Agreements and concluded that the compensation under the Agreements is fair and reasonable in light of such services and expenses and such other matters as the trustees have considered to be relevant in the exercise of their reasonable judgment.
Artisan Partners Limited Partnership (“Artisan”) served as investment sub-adviser to the Laudus International MarketMasters Fund™ (the “Fund”) pursuant to a sub-advisory agreement between CSIM and Artisan (the “Current Sub-Advisory Agreement”). On May 24, 2006, the Board authorized the officers of the Trust, to terminate on behalf of the Fund, the Current Sub-Advisory Agreement, dated January 23, 2002, as amended, between CSIM and Artisan, effective June 25, 2006.
At a meeting of the Board of Trustees of the Trust held on May 24, 2006, CSIM recommended, and the Board, including a majority of the Independent Trustees, approved a new investment sub-advisory agreement between CSIM and Wentworth, Hauser and Violich, Inc. (“WHV”) (the “New Sub-Advisory Agreement”), to appoint WHV as sub-adviser to the Fund. The New Sub-Advisory Agreement to be effective on May 24, 2006, although WHV did not start managing a portion of the Fund until approximately June 25, 2006.
In addition, at that same meeting, CSIM recommended, and the Board, including a majority of the Independent Trustees, approved a new investment sub-advisory agreement between CSIM and Mondrian Investment Partners Limited (“Mondrian”) (the “Mondrian New Sub-Advisory Agreement”, together with WHV’s New Sub-Advisory Agreement, the “New Sub-Advisory Agreements”), to appoint Mondrian as sub-adviser to the Fund. The Mondrian New Sub-Advisory Agreement to be effective on May 24, 2006.
On May 24, 2006, the Board held a meeting to decide, among other things, whether to approve the new Sub-Advisory Agreements. Before the meeting and in preparation for it, the Board requested and received written materials from WHV and Mondrian about their (a) quality of investment management and other services; (b) investment management personnel; (c) operations and financial condition; (d) brokerage practices (including any soft dollar arrangements) and other investment strategies; (e) the level of the sub-advisory fees the Fund is charged, (f) WHV’s and Mondrian’s compliance systems; (g) WHV’s and Mondrian’s policies on and compliance procedures for personal securities transactions; (h) WHV’s and Mondrian’s reputation, expertise and resources in international financial markets; (i) WHV’s and Mondrian’s performance compared with similar advisers; and (j) WHV’s and Mondrian’s performance with respect to similar accounts managed by WHV and Mondrian, respectively. At the meeting, representatives from CSIM presented additional oral and written information to the Board to help the trustees evaluate WHV’s and Mondrian’s fees and other aspects of their agreements, including information about the Fund’s overall fees and operating expenses. When considering the fees to be paid to WHV and Mondrian, the Board took into account the fact that WHV and Mondrian will be compensated by CSIM, and not by the Fund directly, and that such compensation reflects an arms-length negotiation between CSIM and WHV and Mondrian, respectively. The Board then discussed the written materials that they received before the meeting and CSIM’s oral presentations and other information that the trustees received at the meeting, and deliberated on the approval of the New Sub-Advisory Agreements in light of this information. In their deliberations, the Board did not identify any single piece of information that was all-important or controlling. Based on the trustees’ deliberations and its evaluation of the information described above, the Board, including all of the Independent Trustees, unanimously: (a) concluded that the terms of the New Sub-Advisory Agreements are fair and reasonable; and (b) concluded that WHV’s and Mondrian’s fees are reasonable in light of the services that they provide to the Fund. The required Notice to Shareholders was sent to existing shareholders on May 25, 2006.
53
Trustees and Officers
The tables below gives information about the trustees and officers for The Schwab Capital Trust, which includes the funds covered in this report. The “Fund Complex” includes The Charles Schwab Family of Funds, Schwab Capital Trust, Schwab Investments, Schwab Annuity Portfolios, Laudus Trust, Laudus Variable Insurance Trust, Excelsior Funds, Inc., Excelsior Tax-Exempt Funds, Inc., and Excelsior Funds Trust. As of October 31, 2006, the Fund Complex included 96 funds.
The address for all trustees and officers is 101 Montgomery Street, San Francisco, CA 94104. You can find more information about the trustees and officers in the Statement of Additional Information, which is available free by calling 1-800-435-4000.
Independent Trustees |
| |
Name, Year of Birth,
and Position(s) with
the Trust; (Term of
Office, and Length of
Time Served1) | | | | Principal Occupations
During the Past Five Years | | Number of
Portfolios in
Fund Complex
Overseen by
the Trustee | | Other Directorships |
Mariann Byerwalter
1960
Trustee
(Trustee of Schwab Capital Trust since 2000.) | | | | Chairman of JDN Corporate Advisory LLC. From 1996 to 2001, Vice President for Business Affairs and Chief Financial Officer of Stanford University, and in 2001, Special Advisor to the President of Stanford University. | | 96 | | Board 1—Director, Redwood Trust, Inc.
Board 2—Director, PMI Group, Inc. |
Donald F. Dorward
1931
Trustee
(Trustee of Schwab Capital Trust since 1989.) | | | | Chief Executive Officer, Dorward & Associates (corporate management, marketing and communications consulting firm). From 1996-1999, Executive Vice President and Managing Director, Grey Advertising. Prior to 1996, President and Chief Executive Officer, Allen & Dorward Advertising. | | 57 | | None. |
William A. Hasler
1941
Trustee
(Trustee of Schwab Capital Trust since 2000.) | | | | Retired. Dean Emeritus, Haas School of Business, University of California, Berkeley. Until February 2004, Co-Chief Executive Officer, Aphton Corp. (bio-pharmaceuticals). Prior to August 1998, Dean of the Haas School of Business, University of California, Berkeley (higher education). | | 96 | | Board 1—Director, Aphton Corp.
Board 2—Director, Mission West Properties
Board 3—Director, TOUSA
Board 4—Director, Stratex Networks
Board 5—Director, Genitope Corp.
Board 6—Director & Non-Executive
Chairman, Solectron Corp.
Board 7—Director, Ditech
Communications Corp. |
Robert G. Holmes
1931
Trustee
(Trustee of Schwab Capital Trust since 1989.) | | | | Chairman, Chief Executive Officer and Director, Semloh Financial, Inc. (international financial services and investment
advisory firm). | | 57 | | None. |
Gerald B. Smith
1950
Trustee
(Trustee of Schwab Capital Trust since 2000.) | | | | Chairman and Chief Executive Officer and founder of Smith Graham & Co.
(investment advisors). | | 57 | | Board 1—Board of Cooper Industries
Board 2—Chairman of the Audit Committee
of Northern Border Partners, M.L.P. |
54
Independent Trustees continued |
| |
Name, Year of Birth,
and Position(s) with
the Trust; (Term of
Office, and Length of
Time Served1) | | | | Principal Occupations
During the Past Five Years | | Number of
Portfolios in
Fund Complex
Overseen by
the Trustee | | Other Directorships |
Donald R. Stephens
1938
Trustee
(Trustee of Schwab Capital Trust since 1989.) | | | | Managing Partner, D.R. Stephens & Company (investments). Prior to 1996, Chairman and Chief Executive Officer of North American Trust (real estate
investment trust). | | 57 | | None. |
Michael W. Wilsey
1943
Trustee
(Trustee of Schwab Capital Trust since 1989.) | | | | Chairman and Chief Executive Officer, Wilsey Bennett, Inc. (real estate investment and management, and other investments). | | 57 | | None. |
Interested Trustees |
| |
Name, Year of Birth,
and Position(s) with
the Trust; (Term of
Office, and Length of
Time Served1) | | | | Principal Occupations
During the Past Five Years | | Number of
Portfolios in
Fund Complex
Overseen by
the Trustee | | Other Directorships |
Charles R. Schwab2
1937
Chairman and Trustee
(Chairman and Trustee
of Schwab Capital Trust
since 1989.) | | | | Chairman, Chief Executive Officer and Director, The Charles Schwab Corporation, Charles Schwab & Co., Inc.; Chairman and Director, Charles Schwab Investment Management, Inc., Charles Schwab Bank, N. A.; Chairman and Chief Executive Officer, Schwab (SIS) Holdings Inc. I, Schwab International Holdings, Inc.; Chief Executive Officer and Director, Schwab Holdings, Inc.; Director, U.S. Trust Company, N. A., U.S. Trust Corporation, United States Trust Company of New York. Until May 2003, Co-Chief Executive Officer, The Charles Schwab Corporation. | | 57 | | None. |
Randall W. Merk2
1954
Trustee
(Trustee of Schwab Capital Trust since 2005.) | | | | Executive Vice President and President, Schwab Financial Products, Charles Schwab & Co., Inc.; Director, Charles Schwab Asset Management (Ireland) Limited and Charles Schwab Worldwide Funds PLC. From September 2002 to July 2004, Chief Executive Officer and President, Charles Schwab Investment Management, Inc. and Executive Vice President, Charles Schwab & Co., Inc. Prior to September 2002, President and Chief Investment Officer, American Century Investment Management, and Director, American Century Companies, Inc. | | 96 | | None. |
55
Officers of the Trust |
| |
Name, Year of Birth, and Position(s)
with the Trust; (Term of Office, and
Length of Time Served3) | | | | Principal Occupations During the Past Five Years |
Evelyn Dilsaver
1955
President and Chief Executive Officer
(Officer of Schwab Capital Trust since 2004.) | | | | President, Chief Executive Officer, and Director, Charles Schwab Investment Management, Inc.; Executive Vice President, Charles Schwab & Co., Inc; President and Chief Executive Officer, Laudus Trust and Laudus Variable Insurance Trust; President, Excelsior Funds Inc., Excelsior Tax-Exempt Funds, Inc., and Excelsior Funds Trust; President, Mutual Fund Division, UST Advisers, Inc. From June 2003 to July 2004, Senior Vice President, Asset Management Products and Services, Charles Schwab & Co., Inc. Prior to June 2003, Executive Vice President, Chief Financial Officer, and Chief Administrative Officer, U.S. Trust, a subsidiary of The Charles Schwab Corporation. |
George Pereira
1964
Treasurer and Principal Financial Officer
(Officer of Schwab Capital Trust since 2004.) | | | | Senior Vice President and Chief Financial Officer, Charles Schwab Investment Management, Inc.; Chief Financial Officer, Laudus Trust and Laudus Variable Insurance Trust; Treasurer, Chief Financial Officer and Chief Accounting Officer, Excelsior Funds Inc., Excelsior Tax-Exempt Funds, Inc., and Excelsior Funds Trust; Chief Financial Officer, Mutual Fund Division, UST Advisors, Inc. Director, Charles Schwab Worldwide Fund, PLC and Charles Schwab Asset Management (Ireland) Limited. From December 1999 to November 2004, Sr. Vice President, Financial Reporting, Charles Schwab & Co., Inc. |
Kimon Daifotis
1959
Senior Vice President and Chief
Investment Officer—Fixed Income
(Officer of Schwab Capital Trust since 2004.) | | | | Senior Vice President and Chief Investment Officer—Fixed Income, Charles Schwab Investment Management, Inc. Prior to 2004, Vice President and Sr. Portfolio Manager, Charles Schwab Investment Management, Inc. |
Jeffrey Mortimer
1963
Senior Vice President and Chief
Investment Officer—Equities
(Officer of Schwab Capital Trust since 2004.) | | | | Senior Vice President and Chief Investment Officer—Equities, Charles Schwab Investment Management, Inc.; Vice President and Chief Investment Officer, Laudus Trust and Laudus Variable Insurance Trust. Prior to 2004, Vice President and Sr. Portfolio Manager, Charles Schwab Investment Management, Inc. |
Randall Fillmore
1960
Chief Compliance Officer and AML Officer
(Officer of Schwab Capital Trust since 2002.) | | | | Senior Vice President and Chief Compliance Officer, Charles Schwab Investment Management, Inc.; Senior Vice President Charles Schwab & Co., Inc.; Chief Compliance Officer, Laudus Trust and Laudus Variable Insurance Trust; Chief Compliance Officer, Excelsior Funds Inc., Excelsior Tax-Exempt Funds, Inc., and Excelsior Funds Trust. From 2002 to 2003, Vice President, Charles Schwab & Co., Inc., and Charles Schwab Investment Management, Inc. From 2000 to 2002, Vice President, Internal Audit, Charles Schwab & Co., Inc. |
Koji E. Felton
1961
Secretary and Chief Legal Officer
(Officer of Schwab Capital Trust since 1998.) | | | | Senior Vice President, Chief Counsel and Corporate Secretary, Charles Schwab Investment Management, Inc.; Senior Vice President and Deputy General Counsel, Charles Schwab & Co., Inc.; Chief Legal Officer, Laudus Trust and Laudus Variable Insurance Trust; Chief Legal Officer, Excelsior Funds Inc., Excelsior Tax-Exempt Funds, Inc., and Excelsior Funds Trust. Prior to June 1998, Branch Chief in Enforcement at U.S. Securities and Exchange Commission in San Francisco. |
Catherine MacGregor
1964
Vice President
(Officer of Schwab Capital Trust since 2005) | | | | Vice President, Charles Schwab & Co., Inc., Charles Schwab Investment Management, Inc., Laudus Trust and Laudus Variable Insurance Trust; since 2006, Chief Counsel, Laudus Trust and Laudus Variable Insurance Trust. Until July 2005, Senior Associate, Paul Hastings Janofsky & Walker LLP. |
56
Officers of the Trust continued |
| |
Name, Year of Birth, and Position(s)
with the Trust; (Term of Office, and
Length of Time Served3) | | | | Principal Occupations During the Past Five Years |
Cathy Sabo
1964
Vice President
(Officer of Schwab Capital Trust since 2005) | | | | Vice President, Compliance, Charles Schwab Investment Management, Inc., Laudus Trust and Laudus Variable Insurance Trust. Until 2004, Vice President, Client, Sales & Services Controls, Charles Schwab & Co., Inc. |
Michael Haydel
1972
Vice President
(Officer of Schwab Capital Trust since 2006) | | | | Vice President, Asset Management Client Services, Charles Schwab & Co., Inc.; Vice President and AML Officer, Laudus Trust and Laudus Variable Insurance Trust. Until March 2004, Director Charles Schwab & Co., Inc. |
1 | | Trustees remain in office until they resign, retire or are removed by shareholder vote. The Schwab Funds retirement policy requires that independent trustees elected after January 1, 2000 retire at age 72 or after twenty years of service as a trustee, whichever comes first. Independent trustees elected prior to January 1, 2000 will retire on the following schedule: Messrs. Holmes and Dorward will retire on December 31, 2007, and Messrs. Stephens and Wilsey will retire on December 31, 2010. |
2 | | In addition to their employment with the investment adviser and the distributor, Messrs. Schwab and Merk also own stock of The Charles Schwab Corporation. Mr. Schwab and Mr. Merk are Interested Trustees because they are employees of Schwab and/or the adviser. |
3 | | The President, Treasurer and Secretary hold office until their respective successors are chosen and qualified or until he or she sooner dies, resigns, is removed or becomes disqualified. Each other officer serves at the pleasure of the Board. |
57
Glossary
asset allocation The practice of dividing a portfolio among different asset classes, with each asset class assigned a particular percentage.
asset class A group of securities with similar structure and basic characteristics. Stocks, bonds and cash are the three main examples of asset classes.
beta A historical measure of an investment’s volatility relative to a market index (usually the S&P 500®). The index is defined as having a beta of 1.00. Investments with a beta higher than 1.00 have been more volatile than the index; those with a beta of less than 1.00 have been less volatile.
bond A security representing a loan from the investor to the issuer. A bond typically pays interest at a fixed rate (the “coupon rate”) until a specified date (the “maturity date”), at which time the issuer returns the money borrowed (“principal” or “face value”) to the bondholder. Because of their structure, bonds are sometimes called “fixed income securities” or “debt securities.”
An individual bond is subject to the credit risk of the issuer. Changes in interest rates can affect a bond’s market value prior to call or maturity. There is no guarantee that a bond’s yield to call or maturity will provide a positive return over the rate of inflation.
bond fund A bond fund is subject to the same credit, interest rate, and inflation risks as bonds. In addition, a bond fund incurs ongoing fees and expenses. A bond fund’s net asset value will fluctuate with the price of the underlying bonds and the portfolio turnover activity; return of principal is not guaranteed.
cap, capitalization See “market cap.”
capital gain, capital loss The difference between the amount paid for an investment and its value at a later time. If the investment has been sold, the capital gain or loss is considered a realized gain or loss. If the investment is still held, the gain or loss is still “on paper” and is considered unrealized.
earnings growth rate For a mutual fund, the average yearly rate at which the earnings of the companies in the fund’s portfolio have grown, measured over the past five years.
earnings per share (EPS) A company’s earnings, or net income, for the past 12 months, divided by the number of shares outstanding.
expense ratio The amount that is taken from a mutual fund’s assets each year to cover the fund’s operating expenses. An expense ratio of 0.50% means that a fund’s expenses amount to half of one percent of its average net assets a year.
market cap, market capitalization The value of a company as determined by the total value of all shares of its stock outstanding.
median market cap The midpoint of the range of market caps of the stocks held by a fund. There are different ways of calculating median market cap. With a simple median, half of the stocks in the fund’s portfolio would be larger than the median, and half would be smaller. With a weighted median (the type that is calculated for these funds), half of the fund’s assets are invested in stocks that are larger than the median market cap, and half in stocks that are smaller.
net asset value (NAV) The value of one share of a mutual fund. NAV is calculated by taking the fund’s total assets, subtracting liabilities, and dividing by the number of shares outstanding.
outstanding shares, shares outstanding When speaking of a company or mutual fund, indicates all shares currently held by investors.
price-to-book ratio (P/B) The market price of a company’s stock compared with its “book value.” A mutual fund’s P/B is the weighted average of the P/B of all stocks in the fund’s portfolio.
price-to-earnings ratio (P/E) The market price of a company’s stock compared with earnings over the past year. A mutual fund’s P/E is the weighted average of the P/E of all stocks in the fund’s portfolio.
return on equity (ROE) The average yearly rate of return for each dollar of investors’ money, measured over the past five years.
stock A share of ownership, or equity, in the issuing company.
total return The percentage that an investor would have earned or lost on an investment in the fund assuming dividends and distributions were reinvested.
weighted average For mutual funds, an average that gives the same weight to each security as the security represents in the fund’s portfolio.
yield The income paid out by an investment, expressed as a percentage of the investment’s market value.
The industry/sector classification of the funds’ portfolio holdings uses the Global Industry Classification Standard (GICS) which was developed by and is the exclusive property of Morgan Stanley Capital International Inc. and Standard & Poor’s. GICS is a service mark of MSCI and S&P and has been licensed for use by Charles Schwab & Co., Inc.
58
Notes
Notes
An investor should consider a fund’s investment objectives, risks, and charges and expenses carefully before investing or sending money. This and other important information can be found in the fund’s prospectus. Please call 1.800.435.4000 for a prospectus and brochure. Please read the prospectus carefully before you invest. This report must be preceded or accompanied by a current prospectus. Proxy Voting Policies, Procedures and Results A description of the proxy voting policies and procedures used to determine how to vote proxies on behalf of the funds is available without charge, upon request, by visiting Schwab’s website at www.schwab.com/marketmasters, the SEC’s website at http://www.sec.gov, or by contacting Schwab Funds at 1.800.435.4000. Information regarding how a fund voted proxies relating to portfolio securities during the most recent twelve-month period ended June 30 is available, without charge, by visiting Schwab’s website at www.schwab.com/schwabfunds or the SEC’s website at http://www.sec.gov. | | The Laudus FundsTM Laudus MarketMasters FundsTM Laudus U.S. MarketMasters FundTM
Laudus Small-Cap MarketMasters FundTM
Laudus International MarketMasters FundTM Laudus Rosenberg U.S. Equity Funds Laudus Rosenberg U.S. Large Capitalization Fund
Laudus Rosenberg U.S. Large Capitalization Growth Fund
Laudus Rosenberg U.S. Capitalization Value Fund
Laudus Rosenberg U.S. Discovery Fund
Laudus Rosenberg U.S. Small Capitalization Growth Fund Laudus Rosenberg Equity Funds Laudus Rosenberg International Equity Fund
Laudus Rosenberg International Discovery Fund
Laudus Rosenberg International Small Capitalization Fund
Laudus Rosenberg Long/Short Funds Laudus Rosenberg U.S. Large/Mid Capitalization
Long/Short Equity Fund
Laudus Rosenberg Global Long/Short Equity Fund
Laudus Rosenberg Value Long/Short Equity Fund The Laudus Funds includes the Laudus Rosenberg Funds, which are part of the Laudus Trust and distributed by Laudus Distributor, Inc.; and the Laudus MarketMasters Funds, which are part of the Schwab Capital Trust, and distributed by Charles Schwab & Co., Inc. |
For More Information about the Funds:
Investment Adviser
Charles Schwab Investment Management, Inc.
101 Montgomery Street, San Francisco, CA 94104
Funds
Laudus MarketMasters Funds™
P.O. Box 3812, Englewood, CO 80155-3812
This report is not authorized for distribution to prospective investors unless preceded or accompanied by a current prospectus.
© 2006 Charles Schwab & Co., Inc. All rights reserved. Member SIPC. Printed on recycled paper. | | MFR13812-09 |
Schwab Viewpoints Fund™
(formerly Laudus Balanced MarketMasters Fund™)
Annual ReportOctober 31, 2006
Schwab Viewpoints Fund™:
Leveraging Schwab’s Advice Perspective.
In this report
| Performance at a Glance | 1 |
| From the Chairman | 2 |
| From the President | 3 |
| Investment Environment | 4 |
| Schwab Viewpoints Fund™ | 6 |
| Fund Expenses | 8 |
| Financial Statements | 9 |
| Financial Notes | 25 |
| Investment Advisory and Sub-Advisory Agreement Approval | 34 |
| Trustees and Officers | 37 |
| Glossary | 41 |
Select Shares® are available on many Schwab Funds®Schwab Funds offers Select Shares, a shares class that carries lower expenses than Investor Shares™ in exchange for higher investment minimums on many of its funds. Select Shares are available for initial purchases of $50,000 or more of a single fund in a single account and for shareholders who add to their existing Investor Share position, bringing the value to or above $50,000. We encourage shareholders of Investor Shares to review their portfolio to see if they are eligible to exchange into Select Shares. If you believe you are eligible, you should contact Schwab or your financial intermediary to request a tax-free interclass exchange into Select Shares. Instructions for performing a tax-free interclass exchange can also be referenced on the Schwab Funds website at www.schwab.com/schwabfunds under Schwab Funds Investor Information. Select Shares may not be available through financial intermediaries other than Charles Schwab & Co., Inc.
Fund investment adviser: Charles Schwab Investment Management, Inc. (CSIM).
Distributor and transfer agent: Charles Schwab & Co., Inc. (Schwab).
The industry/sector classification of the funds’ portfolio holdings uses the Global Industry Classification Standard (GICS) which was developed by and is the exclusive property of Morgan Stanley Capital International Inc. and Standard & Poor’s. GICS is a service mark of MSCI and S&P and has been licensed for use by Charles Schwab & Co., Inc.
Performance at a Glance
The performance data quoted represents past performance. Past performance does not guarantee future results. Investment returns and principal value will fluctuate so that an investor’s shares may be worth more or less than their original cost. Current performance may be lower or higher than performance data quoted. To obtain performance information current to the most recent month end, please visit www.schwab.com/schwabfunds.
|
| Total Return for the Report Period
|
|---|
Schwab Viewpoints FundTM | | | | |
| Investor Shares (Ticker Symbol: SWOBX) | | | 8.59 | % |
| Select Shares (Ticker Symbol: SWMBX) | | | 8.79 | % |
| Benchmark: Balanced Blended Index | | | 11.80 | % |
| Fund Category: Morningstar Moderate Allocation | | | 11.91 | % |
| | | | | |
Minimum Initial Investment1 | | | | |
| Investor Shares ($1,000 for retirement, education and custodial accounts) | | $ | 2,500 | |
| Select Shares | | $ | 50,000 | |
All fund and index figures on this page assume dividends and distributions were reinvested. Index figures do not include trading and management costs, which would lower performance. Indices are unmanaged, and you cannot invest in them directly.
Performance results less than one year are not annualized.
Expenses may be partially absorbed by CSIM and Schwab. Without these reductions, the funds’ total returns would have been lower. Performance does not reflect the deduction of taxes that a shareholder would pay on fund distributions or on the redemption of fund shares.
Source for category information: Morningstar, Inc.
1Please see prospectus for further detail and eligibility requirements.
Schwab Viewpoints Fund 1
| | | From the Chairman |
| | | |
Charles Schwab Chairman | | Dear Shareholder, I founded Schwab over thirty years ago to be a home for serious investors. That mission continues to guide us today as we constantly strive to improve and innovate. By doing this, and providing some of the highest quality products and services — at a competitive price — we remain true to our heritage. I take particular pride in the Schwab Funds. Founded over 15 years ago, Schwab Funds now includes more than 50 funds with over $170 billion in assets. With a variety of investment strategies, Schwab Funds provides a range of innovative investment choices that can serve as a foundation for your asset allocation plan. As part of its investment strategy, some components of the Schwab Viewpoints Fund leverage Schwab Equity Ratings and use the same stock-ranking expertise that has helped Schwab’s model equity portfolio achieve industry recognition in Barron’s annual stock-selection competitions. Schwab Equity Ratings are based upon a disciplined, systematic approach that evaluates approximately 3,000 U.S. stocks on the basis of a wide variety of investment criteria. Schwab Funds are managed by Charles Schwab Investment Management, Inc., one of the largest mutual fund managers in the U.S. Our portfolio managers share a passion for market analysis and use some of the most sophisticated financial models in the country. I am proud of their depth of experience, which reflects an average of 14 years in the investment industry. Furthermore, I am impressed by the commitment that our managers bring to the stewardship of their funds, for you, their shareholders. In closing, I want to thank you for investing with us. We work every day to warrant the trust you have placed in us; that will never change. Sincerely, Charles Schwab
Chairman
Barron’s awarded Schwab the first-place rank for the five-year period from June 30, 2001 to June 30, 2006, and for the three year period from June 30, 2003 to June 30, 2006, for “best of” stock recommendation lists submitted by certain brokerage firms to Zacks Investment Research, Inc., an independent firm that analyzes broker research. Barron’s also awarded Schwab the first-place rank for the five-year periods from December 31, 2000 to December 31, 2005, and for the three year periods from December 31, 2001 to December 31, 2004, and the 2001 to 2003 for “best of” stock recommendation lists. Schwab’s model performance results are simulated model portfolio performance results, which do not represent actual investment performance or trading. The results of Schwab’s model performance are not an indicator of the returns a Schwab client would have realized or will realize in relying on Schwab Equity Ratings® or for mutual funds that use Schwab Equity Ratings as part of their methodology. For further information about Schwab Equity Ratings, see schwab.com. |
2 Schwab Viewpoints Fund
| | | From the President |
| | | |
Evelyn Dilsaver is President and CEO of Charles Schwab Investment Management, Inc. and the fund covered in this report. She joined the firm in 1992 and has held a variety of executive positions at Schwab. | | Dear Shareholder, I am pleased to present the annual report for the Schwab Viewpoints Fund for the period ended October 31, 2006. As previously communicated to shareholders, we implemented several key enhancements to the fund during the report period. We changed the fund’s name to Schwab Viewpoints Fund, to more closely align the fund’s name with its current strategies, which include leveraging the views of Schwab’s Investment Strategy Council. We have also made several changes that we believe will enhance the fund’s ability to take advantage of additional investment opportunities. First, we added an international allocation, which is managed by Harris Associates L.P., in order to harness the performance potential and diversification benefits of international investing. Further, within the fund’s domestic stock allocation, we removed the mid-cap allocation and added large- and small-cap blend allocations. Both of these new allocations are managed by Charles Schwab Investment Management, Inc. (CSIM), the fund’s investment adviser. With this report, you will see that we have recently started an initiative to enhance the presentation of our shareholder reports to make it easier for you to find information about your fund. This book represents the first step in this process, with additional changes anticipated for future report cycles. You will notice, for example, that we have added a new lead page, Performance at a Glance, which includes the fund’s ticker symbols and report period returns for the fund, its benchmark and category average. For ease of reference, we have relocated the fund manager’s discussion to be in close proximity to the fund performance and portfolio statistics sections. At this time, I would like to highlight another valuable information resource for fund shareholders, namely, our website at www.schwabfunds.com. This website contains regular updates about the Schwab Funds. I encourage you to visit the website to stay informed about your fund. I’d like to emphasize that your trust is very important to us and I will do all I can to maintain that trust. Thank you for investing in Schwab Funds. Sincerely, |
Schwab Viewpoints Fund 3
The Investment Environment
Jeffrey Mortimer, CFA, senior vice president and chief investment officer, equities, is responsible for the overall management of the fund. | | As the U.S. economy transitioned to slower growth, equities markets rebounded, aided by higher corporate profitability, falling energy/commodity prices, and lower interest rates. The S&P 500 Index returned 16.34% and the Russell 2000 Index returned 19.98%, respectively, for the one-year report period ended October 31, 2006. Improving fundamentals and attractive valuations strengthened investor interest in emerging markets and the MSCI-EAFE (Morgan Stanley Capital International, Inc. Europe, Australasia, and Far East) Index returned 27.52%. Performance in the bond markets has been mixed over the year, although the Lehman Brothers U.S. Aggregate Bond Index gained 5.19%. Several key issues continued to resonate with investors, including slowing economic growth, Federal Reserve (the Fed) policy, a sluggish real estate market, inflation concerns, and fluctuating energy prices. Economic growth has been anything but predictable over the past year. The last quarter of 2005 saw Gross Domestic Product (GDP) slow considerably as the economy adjusted to changes in inventories and higher energy prices. Although Hurricane Katrina remained a focal point in the news late in 2005, its economic impact was determined to be minimal as damage remained contained within the hurricane’s path. In the first quarter of 2006, GDP then rebounded, only to slow later in the year. Though falling existing home sales and lower motor vehicle production have done much to curtail growth in the eyes of the Fed, favorable labor market conditions, sustained increases in labor income, and lower energy prices continued to promote stable growth. The unemployment rate fell to a cyclical low of 4.4% in the third quarter of 2006 while consumer spending and business investment remained key contributors to GDP growth. In efforts to curb inflationary pressures, the Fed raised short-term interest rates six times during the period. August marked a key point in the year as Committee members decided to hold the Fed’s target rate at 5.25%, where it remained as of the end of the report period. In its statement, the Fed noted that the economy appeared |
Asset Class Performance Comparison % returns during the report period |
| |
| This graph compares the performance of various asset classes during the report period. Final performance figures for the period are in the key below. | | |
| n | | 16.34% | | S&P 500® Index: measures U.S. large-cap stocks. |
| n | | 19.98% | | Russell 2000® Index: measures U.S. small-cap stocks |
| o | | 27.52% | | MSCI EAFE® Index: measures (in U.S. dollars) large-cap stocks in Europe, Australasia and the Far East |
| n | | 5.19% | | Lehman Brothers U.S. Aggregate Bond Index: measures the U.S. bond market |
These figures assume dividends and distributions were reinvested. Index figures do not include trading and management costs, which would lower performance. Indices are unmanaged and you cannot invest in them directly. Remember that past performance is not an indication of future results.
Data Source: Charles Schwab & Co., Inc.
4 Schwab Viewpoints Fund
The Investment Environment continued
to be growing at a more moderate rate as a result of prior rate increases, lagged effects of energy prices, and a cooling of the housing market. The Fed indicated they generally expected the economy to grow at a pace below its potential, which proved to be an accurate prediction. Consistent with the Fed’s report, GDP continued to decline, growing only in the third quarter of 2006.
Energy prices have been a key issue in the markets over the past year. Following Hurricane Katrina, oil prices peaked around $71 per barrel, with domestic gasoline prices passing $3.00 a gallon. Prices subsequently fell, but rebounded nearly 21% early in 2006, partly due to concerns that Iran might cut back exports in response to a dispute over their nuclear program. Prices declined throughout the report period due to a lack of hurricanes in the Gulf of Mexico as well as an increase in U.S. fuel inventories. More recently, abundant inventories, warmer weather, and skepticism regarding OPEC’s proposed production cuts contributed to a slip in oil prices. Crude oil has declined nearly 26% since July 2006’s record $78.40 per barrel, yet still remained around the $60–61 per barrel range at the end of the report period, as diminishing U.S. crude inventories and concern about global surplus lingered in investors’ minds.
The events of 2006 have also had a significant impact on the housing market. Housing starts fell considerably, down nearly 34% since the beginning of 2006. Existing home sales continued to decline as well, falling nearly 15% from their peak reached in 2005. Although sales have dropped, they remained strong by historical standards. Concerns remained as to whether the Fed’s actions, and the immediate effects on the housing market, would spill over into the rest of the economy. With regards to GDP, housing took off about one percent in the third quarter of 2006, although rebounds in income, consumer spending, and investments helped to offset the impact.
Despite a moderation in economic growth during the report period, economic fundamentals remained healthy as of the end of the period. The Fed’s task of balancing inflation pressures without significantly hindering economic growth will be thoroughly scrutinized in the coming months. The challenge is to bring this economy to a state of stable growth and achieve a soft landing.
Nothing in this report represents a recommendation of a security by the investment adviser.
Manager views and portfolio holdings may have changed since the report date.
Schwab Viewpoints Fund 5
Schwab Viewpoints Fund™
Jeffrey Mortimer, CFA, senior vice president and chief investment officer, equities, is responsible for the overall management of the fund. | | Schwab Viewpoints Fund Investor Shares (formerly the Laudus Balanced MarketMasters Fund) returned 8.59% for the one-year report period, underperforming its benchmark, the Balanced Blended Index, which was up 11.80%. To meet its goal of providing capital growth and income, the fund invests in a mix of equity and fixed income securities. Accordingly, its performance reflects a blend of the various asset classes’ returns. As previously communicated to shareholders, we implemented several key enhancements to the fund during the report period. We added an international allocation, which is managed by Harris Associates L.P., in order to take advantage of the performance potential and diversification benefits of international investing. Further, we removed the mid-cap allocation and added large- and small-cap blend allocations, both of which are managed by CSIM, the fund’s investment adviser. These changes became effective May 1, 2006. The fund was generally overweight in stocks during the report period, as we believed stocks would have potential for higher returns. On the domestic side, TCW Investment Management Company, with a large-cap value focus, outperformed its benchmark, the Russell 1000 Value Index. Gardner Lewis Asset Management L.P., whose focus is on large-cap growth stocks, underperformed relative to its benchmark, the Russell 1000 Growth Index. The fund’s underperformance can be attributed to weak stock selection, with holdings in Boston Scientific Corp. and St. Jude Medical, Inc. detracting from return. As noted above, the period was one of transition. Since May 1, 2006, CSIM’s large- and small-cap blend allocations have outperformed their respective S&P 500 and S&P 600 benchmarks. Additionally, Harris’ allocation to the international markets has outperformed its MSCI EAFE benchmark. During the report period, bond yields rose in line with Fed rate hikes and the yield curve became inverted. Towards the end of the period, economic news suggested inflation was receding and growth was slowing, causing bond yields to decline. With the exception of short term rates, the net change in yields throughout the period remained relatively slight. The fund’s fixed income allocation, which is managed by PIMCO (Pacific Investment Management Company LLC), outperformed its benchmark, the Lehman Brothers U.S. Aggregate Bond Index, for the report period. |
As of 10/31/06.
Statistics |
| Number of Long Holdings | 429 |
| Number of Short Positions | 8 |
Weighted Average
Market Cap
($ x 1,000,000) | 42,378 |
| Price/Earnings Ratio (P/E) | 21.7 |
| Price/Book Ratio (P/B) | 2.7 |
| | |
Sector Weightings % of Investments |
| Consumer Discretionary | | 21.7 | % |
| Financials | | 18.0 | % |
| Information Technology | | 14.7 | % |
| Health Care | | 14.4 | % |
| Consumer Staples | | 10.5 | % |
| Industrials | | 7.9 | % |
| Telecommunication Services | | 4.4 | % |
| Materials | | 4.3 | % |
| Energy | | 2.7 | % |
| Utilities | | 1.4 | % |
Total | | 100.0 | % |
| |
Top Holdings % of Net Assets1 |
| Fannie Mae 5.50%, 09/01/34 | | 2.7 | % |
| Fannie Mae 5.00%, 02/01/36 | | 1.9 | % |
| U.S. Treasury Inflation Protected Security 3.38%, 01/15/07 | | 1.7 | % |
| Fannie Mae 5.50%, 11/01/34 | | 1.6 | % |
| Fannie Mae TBA 6.00%, 12/01/99 | | 1.3 | % |
| U.S. Treasury Note 4.00%, 06/15/09 | | 1.3 | % |
| Fannie Mae 5.50%, 04/01/35 | | 1.1 | % |
| Fannie Mae 5.50%, 02/01/35 | | 1.1 | % |
| American Express Co. | | 0.8 | % |
| U.S. Treasury Note 5.13%, 06/30/11 | | 0.7 | % |
Total | | 14.2 | % |
Portfolio holdings may have changed since the report date.
Source of Sector Classification: S&P and MSCI.
1This list is not a recommendation of any security by the investment adviser.
6 Schwab Viewpoints Fund
Schwab Viewpoints Fund
Performance Summary as of 10/31/06
The performance data quoted represents past performance. Past performance does not guarantee future results. Investment returns and principal value will fluctuate so that an investor’s shares may be worth more or less than their original cost. Current performance may be lower or higher than performance data quoted. To obtain performance information current to the most recent month end, please visit www.schwab.com/schwabfunds.
Performance of a Hypothetical
$10,000 Investment in Investor Shares1 | | Performance of a Hypothetical
$50,000 Investment in Select Shares1 |
| | |
| Average Annual Total Returns1,2 | | | | | | |
| Fund Class and Inception Date | | 1 Year | | 5 Years | | Since Inception |
| Investor Shares (11/18/96) | | 8.59% | | 7.84% | | 7.54% |
| Select SharesT (6/3/04) | | 8.79% | | n/a | | 8.57% |
| Benchmark: Balanced Blended Index | | 11.80% | | 6.42% | | (11/18/96) 7.72%
(6/3/04) 8.35% |
| Fund Category: Morningstar Moderate Allocation | | 11.91% | | 6.62% | | (11/18/96) 6.86%
(6/3/04) 9.34% |
Investment Managers and Allocations |
Investment Manager | | Investment Style | | % Net Assets
|
| Charles Schwab Investment Management, Inc. | | Large-Cap Blend | | | 3.0 | % |
| Gardner Lewis Asset Management L.P. | | Large-Cap Growth | | | 14.8 | % |
| TCW Investment Management Company | | Large-Cap Value | | | 18.0 | % |
| Charles Schwab Investment Management, Inc. | | Small-Cap Blend | | | 7.4 | % |
| Harris Associates L.P. | | International Value | | | 16.1 | % |
| Pacific Investment Management Company LLC | | Fixed-Income Total Return | | | 29.7 | % |
| Charles Schwab Investment Management, Inc. | | Overlay | | | 4.8 | % |
All figures on this page assume dividends and distributions were reinvested. Index figures do not include trading and management costs, which would lower performance. Indices are unmanaged, and you cannot invest in them directly. Performance results less than one year are not annualized.
Because the fund originally used a different asset allocation strategy and a multi-fund strategy, its performance prior to June 3, 2002 does not reflect the current strategy and may have been different if it did.
1Fund expenses may have been partially absorbed by CSIM and Schwab. Without these reductions, the fund’s returns would have been lower. These returns do not reflect the deduction of taxes that a shareholder would pay on fund distributions or the redemption of fund shares. The Balanced Blended Index is composed of 60% S&P 500® Index and 40% Lehman Brothers U.S. Aggregate Bond Index.
2Source for category information: Morningstar, Inc.
Schwab Viewpoints Fund 7
Fund Expenses (Unaudited)
Examples for a $1,000 Investment |
As a fund shareholder, you incur two types of costs: transaction costs, such as redemption fees; and, ongoing costs, such as management fees, transfer agent and shareholder services fees, and other fund expenses.
The expense examples below are intended to help you understand your ongoing cost (in dollars) of investing in a fund and to compare this cost with the ongoing cost of investing in other mutual funds. These examples are based on an investment of $1,000 invested for six-months beginning May 1, 2006 and held through October 31, 2006.
Actual Return lines in the table below provide information about actual account values and actual expenses. You may use this information, together with the amount you invested, to estimate the expenses that you paid over the period. To do so, simply divide your account value by $1,000 (for example, an $8,600 account value ÷ $1,000 = 8.6), then multiply the result by the number given for your fund or share class under the heading entitled “Expenses Paid During Period.”
Hypothetical Return lines in the table below provide information about hypothetical account values and hypothetical expenses based on a fund’s or share class’ actual expense ratio and an assumed return of 5% per year before expenses. Because the return used is not an actual return, it may not be used to estimate the actual ending account value or expenses you paid for the period.
You may use this information to compare the ongoing costs of investing in the fund and other funds. To do so, compare this 5% hypothetical example with the 5% hypothetical examples that appear in the shareholder reports of the other funds.
Please note that the expenses shown in the table are meant to highlight your ongoing costs only, and do not reflect any transactional costs, such as redemption fees. If these transactional costs were included, your costs would have been higher.
|
| Expense Ratio1
(Annualized)
|
| Beginning
Account Value
at 5/1/06
|
| Ending
Account Value
(Net of Expenses)
at 10/31/06
|
| Expenses Paid2
During Period
5/1/06–10/31/06
|
|---|
Schwab Viewpoints Fund™ | | | | | | | | | | | | | | | | |
Investor Shares | | | | | | | | | | | | | | | | |
| Actual Return | | | 0.96 | % | | $ | 1,000 | | | $ | 1,009.00 | | | $ | 4.86 | |
| Hypothetical 5% Return | | | 0.96 | % | | $ | 1,000 | | | $ | 1,020.37 | | | $ | 4.89 | |
Select Shares® | | | | | | | | | | | | | | | | |
| Actual Return | | | 0.74 | % | | $ | 1,000 | | | $ | 1,010.60 | | | $ | 3.75 | |
| Hypothetical 5% Return | | | 0.74 | % | | $ | 1,000 | | | $ | 1,021.48 | | | $ | 3.77 | |
1 | | Based on the most recent six-month expense ratio; may differ from the expense ratio provided in Financial Highlights. |
2 | | Expenses for the share class are equal to its annualized expense ratio, multiplied by the average account value over the period, multiplied by 184 days of the period, and divided by 365 days of the fiscal year. |
8 Schwab Viewpoints Fund
Schwab Viewpoints Fund™
Financial Statements
Financial Highlights
Investor Shares
| | 11/1/05—
10/31/06
| | 11/1/04—
10/31/05
| | 11/1/03—
10/31/04
| | 11/1/02—
10/31/03
| | 11/1/01—
10/31/02
|
|---|
Per-Share Data ($) | | | | | | | | | | | | | | | | | | | | |
| Net asset value at beginning of period | | | 12.85 | | | | 11.88 | | | | 11.07 | | | | 9.35 | | | | 10.12 | |
Income or loss from investment operations:
| | | | | | | | | | | | | | | | | | | | |
| Net investment income | | | 0.25 | 4 | | | 0.15 | | | | 0.08 | | | | 0.12 | | | | 0.20 | |
| Net realized and unrealized gains or losses | | | 0.83 | 4 | | | 0.91 | | | | 0.86 | | | | 1.75 | | | | (0.73 | ) |
| Total income or loss from investment operations | | | 1.08 | | | | 1.06 | | | | 0.94 | | | | 1.87 | | | | (0.53 | ) |
Less distributions:
| | | | | | | | | | | | | | | | | | | | |
| Dividends from net investment income | | | (0.16 | ) | | | (0.09 | ) | | | (0.13 | ) | | | (0.15 | ) | | | (0.24 | ) |
| Distributions from net realized gains | | | (0.38 | ) | | | — | | | | — | | | | — | | | | — | |
| Total distributions | | | (0.54 | ) | | | (0.09 | ) | | | (0.13 | ) | | | (0.15 | ) | | | (0.24 | ) |
| Net asset value at end of period | | | 13.39 | | | | 12.85 | | | | 11.88 | | | | 11.07 | | | | 9.35 | |
| Total return (%) | | | 8.59 | | | | 8.92 | | | | 8.59 | | | | 20.25 | | | | (5.55 | ) |
| |
Ratios/Supplemental Data (%) | | | | | | | | | | | | | | | | | | | | |
Ratios to average net assets:
| | | | | | | | | | | | | | | | | | | | |
| Net operating expenses | | | 1.03 | 3 | | | 1.10 | | | | 1.10 | | | | 1.10 | | | | 0.76 | 1,2 |
| Gross operating expenses | | | 1.26 | | | | 1.27 | | | | 1.32 | | | | 1.33 | | | | 1.10 | 2 |
| Net investment income | | | 1.90 | | | | 1.14 | | | | 0.68 | | | | 1.13 | | | | 1.89 | |
| Portfolio turnover rate | | | 244 | | | | 283 | | | | 242 | | | | 256 | | | | 380 | |
| Net assets, end of period ($ x 1,000,000) | | | 122 | | | | 130 | | | | 130 | | | | 109 | | | | 97 | |
1 | | The ratio of net operating expenses would have been 0.72% if certain non-routine expenses (proxy fees) had not been included. |
2 | | Prior to the fund’s change in structure of June 3, 2002, the expenses incurred by underlying funds in which the fund invested were not included in this ratio. |
3 | | The ratio of net operating expenses would have been 1.10% if custody credits or dividend and interest expenses on short sales had not been included. |
4 | | Calculated based on the average shares outstanding during the period. |
See financial notes. 9
Schwab Viewpoints Fund
Financial Highlights continued
Select Shares
| | 11/1/05—
10/31/06
| | 11/1/04—
10/31/05
| | 6/3/041—
10/31/04
|
|---|
Per-Share Data ($) | | | | | | | | | | | | |
| Net asset value at beginning of period | | | 12.87 | | | | 11.89 | | | | 11.57 | |
Income from investment operations:
| | | | | | | | | | | | |
| Net investment income | | | 0.29 | 5 | | | 0.15 | | | | 0.02 | |
| Net realized and unrealized gains | | | 0.82 | 5 | | | 0.93 | | | | 0.30 | |
| Total income from investment operations | | | 1.11 | | | | 1.08 | | | | 0.32 | |
Less distributions:
| | | | | | | | | | | | |
| Dividends from net investment income | | | (0.19 | ) | | | (0.10 | ) | | | — | |
| Distributions from net realized gains | | | (0.38 | ) | | | — | | | | — | |
| Total distributions | | | (0.57 | ) | | | (0.10 | ) | | | — | |
| Net asset value at end of period | | | 13.41 | | | | 12.87 | | | | 11.89 | |
| Total return (%) | | | 8.79 | | | | 9.11 | | | | 2.77 | 2 |
| |
Ratios/Supplemental Data (%) | | | | | | | | | | | | |
Ratios to average net assets:
| | | | | | | | | | | | |
| Net operating expenses | | | 0.81 | 4 | | | 0.95 | | | | 0.95 | 3 |
| Gross operating expenses | | | 1.24 | | | | 1.22 | | | | 1.29 | 3 |
| Net investment income | | | 2.21 | | | | 1.32 | | | | 0.73 | 3 |
| Portfolio turnover rate | | | 244 | | | | 283 | | | | 242 | 2 |
| Net assets, end of period ($ x 1,000,000) | | | 28 | | | | 9 | | | | 2 | |
1 | | Commencement of operations. |
4 | | The ratio of net operating expenses would have been 0.95% if custody credits or dividend and interest expenses on short sales had not been included. |
5 | | Calculated based on the average shares outstanding during the period. |
10 See financial notes.
Schwab Viewpoints Fund
Portfolio Holdings as of October 31, 2006
This section shows all the securities in the fund’s portfolio and their value as of the report date.
The fund files its complete schedule of portfolio holdings with the SEC for the first and third quarters of each fiscal year on Form N-Q. The fund’s Form N-Q is available on the SEC’s website at http://www.sec.gov and may be viewed and copied at the SEC’s Public Reference Room in Washington, D.C. Call 1-800-SEC-0330 for information on the operation of the Public Reference Room. The schedule of portfolio holdings filed on a fund’s most recent Form N-Q is also available by visiting Schwab’s website at www.schwab.com/schwabfunds.
Holdings by Category
|
| Cost
($ x 1,000)
|
| Value
($ x 1,000)
|
|---|
| 43.5% | | Common Stock | | | 56,469 | | | | 65,311 | |
| 15.5% | | Foreign Common Stock | | | 22,625 | | | | 23,310 | |
| 8.6% | | U.S. Treasury Obligations | | | 12,846 | | | | 12,862 | |
| 0.5% | | Foreign Government Securities | | | 616 | | | | 704 | |
| 1.5% | | Corporate Bonds | | | 2,146 | | | | 2,159 | |
| 0.6% | | Municipal Bonds | | | 705 | | | | 814 | |
| 0.5% | | Asset-Backed Obligations | | | 800 | | | | 800 | |
| 18.0% | | Mortgage-Backed Securities | | | 27,190 | | | | 26,985 | |
| 0.6% | | Non-Agency Mortgage-Backed Securities | | | 855 | | | | 851 | |
| 9.7% | | Short-Term Investment | | | 14,582 | | | | 14,582 | |
| 4.1% | | Other Investments | | | 6,028 | | | | 6,225 | |
| 0.1% | | Options | | | 180 | | | | 201 | |
| 103.2% | | Total Investments | | | 145,042 | | | | 154,804 | |
| (11.9)% | | Short Sales | | | (17,041 | ) | | | (17,780 | ) |
| —% | | Options Written | | | (44 | ) | | | (73 | ) |
| 8.7% | | Other Assets and Liabilities | | | | | | | 13,095 | |
| 100.0% | | Net Assets | | | | | | | 150,046 | |
Security
| | | | Number
of Shares
| | Value
($ x 1,000)
|
|---|
Common Stock 43.5% of net assets |
Automobiles & Components 0.6% |
ArvinMeritor, Inc. (a) | | | | | 230 | | | | 3 | |
General Motors Corp. (a) | | | | | 5,800 | | | | 203 | |
Honda Motor Co., Ltd. (a) | | | | | 12,600 | | | | 445 | |
TRW Automotive Holdings Corp. (a)* | | | | | 4,260 | | | | 109 | |
| Winnebago Industries, Inc. | | | | | 2,970 | | | | 99 | |
| | | | | | | | | | 859 | |
Banks 0.8% |
| BancFirst Corp. | | | | | 280 | | | | 14 | |
BancorpSouth, Inc. (a) | | | | | 480 | | | | 12 | |
Bank of Hawaii Corp. (a) | | | | | 3,270 | | | | 171 | |
Comerica, Inc. (a) | | | | | 810 | | | | 47 | |
Fannie Mae (a) | | | | | 11,600 | | | | 687 | |
KeyCorp (a) | | | | | 810 | | | | 30 | |
Radian Group, Inc. (a) | | | | | 2,170 | | | | 116 | |
Whitney Holding Corp. (a) | | | | | 1,690 | | | | 55 | |
| | | | | | | | | | 1,132 | |
Capital Goods 2.4% |
Acuity Brands, Inc. (a) | | | | | 3,310 | | | | 164 | |
American Woodmark Corp. (a) | | | | | 3,390 | | | | 125 | |
| Belden CDT, Inc. | | | | | 510 | | | | 19 | |
Crane Co. (a) | | | | | 6,280 | | | | 245 | |
Danaher Corp. (a) | | | | | 6,600 | | | | 474 | |
EMCOR Group, Inc. (a)* | | | | | 5,870 | | | | 347 | |
Emerson Electric Co. (a) | | | | | 335 | | | | 28 | |
General Dynamics Corp. (a) | | | | | 185 | | | | 13 | |
Honeywell International, Inc. (a) | | | | | 12,200 | | | | 514 | |
Lockheed Martin Corp. (a) | | | | | 2,210 | | | | 192 | |
Orbital Sciences Corp. (a)* | | | | | 2,900 | | | | 53 | |
Raytheon Co. (a) | | | | | 2,470 | | | | 123 | |
| Robbins & Myers, Inc. | | | | | 510 | | | | 20 | |
Teleflex, Inc. (a) | | | | | 5,130 | | | | 319 | |
The Boeing Co. (a) | | | | | 5,000 | | | | 399 | |
Thomas & Betts Corp. (a)* | | | | | 3,690 | | | | 190 | |
Tyco International Ltd. (a) | | | | | 7,800 | | | | 230 | |
Valmont Industries, Inc. (a) | | | | | 1,740 | | | | 97 | |
| | | | | | | | | | 3,552 | |
Commercial Services & Supplies 0.6% |
Administaff, Inc. (a) | | | | | 1,790 | | | | 62 | |
AMREP Corp. (a)* | | | | | 500 | | | | 36 | |
CBIZ, Inc. (a)* | | | | | 10,410 | | | | 73 | |
Consolidated Graphics, Inc. (a)* | | | | | 2,940 | | | | 183 | |
Equifax, Inc. (a) | | | | | 80 | | | | 3 | |
Heidrick & Struggles International, Inc. (a)* | | | | | 2,960 | | | | 121 | |
| IKON Office Solutions, Inc. | | | | | 150 | | | | 2 | |
Labor Ready, Inc. (a)* | | | | | 2,280 | | | | 40 | |
Spherion Corp. (a)* | | | | | 4,790 | | | | 35 | |
Steelcase, Inc., Class A (a) | | | | | 1,030 | | | | 17 | |
The Standard Register Co. (a) | | | | | 1,570 | | | | 21 | |
Waste Management, Inc. (a) | | | | | 8,500 | | | | 318 | |
| | | | | | | | | | 911 | |
Consumer Durables & Apparel 1.4% |
Blyth, Inc. (a) | | | | | 7,730 | | | | 185 | |
Coach, Inc.* | | | | | 5,700 | | | | 226 | |
| Hasbro, Inc. | | | | | 700 | | | | 18 | |
Kellwood Co. (a) | | | | | 10,470 | | | | 320 | |
Mattel, Inc. (a) | | | | | 22,900 | | | | 518 | |
Newell Rubbermaid, Inc. (a) | | | | | 2,280 | | | | 66 | |
Nike, Inc., Class B (a) | | | | | 2,500 | | | | 230 | |
Sony Corp. (a) | | | | | 14,000 | | | | 574 | |
| | | | | | | | | | 2,137 | |
Consumer Services 0.8% |
Career Education Corp. (a)* | | | | | 2,040 | | | | 45 | |
CPI Corp. (a) | | | | | 1,580 | | | | 75 | |
DeVry, Inc.* | | | | | 840 | | | | 20 | |
IHOP Corp. (a) | | | | | 540 | | | | 28 | |
Jack in the Box, Inc. (a)* | | | | | 940 | | | | 53 | |
Papa John’s International, Inc. (a)* | | | | | 3,120 | | | | 115 | |
Starwood Hotels & Resorts Worldwide, Inc. (a) | | | | | 5,500 | | | | 329 | |
Wynn Resorts Ltd. (a)* | | | | | 6,900 | | | | 507 | |
| | | | | | | | | | 1,172 | |
See financial notes. 11
Schwab Viewpoints Fund
Portfolio Holdings continued
Security
| | Number
of Shares
| | Value
($ x 1,000)
|
|---|
Diversified Financials 4.2% |
American Capital Strategies Ltd. (a) | | | 10,800 | | | | 466 | |
American Express Co. (a) | | | 19,630 | | | | 1,134 | |
AmeriCredit Corp. (a)* | | | 260 | | | | 7 | |
Capital One Financial Corp. (a) | | | 13,300 | | | | 1,055 | |
Chicago Mercantile Exchange Holdings, Inc. (a) | | | 1,011 | | | | 506 | |
Franklin Resources, Inc. (a) | | | 1,450 | | | | 165 | |
Investment Technology Group, Inc. (a)* | | | 3,930 | | | | 184 | |
JPMorgan Chase & Co. (a) | | | 21,230 | | | | 1,007 | |
Mellon Financial Corp. (a) | | | 200 | | | | 8 | |
Merrill Lynch & Co., Inc. (a) | | | 10,300 | | | | 900 | |
Moody’s Corp. (a) | | | 110 | | | | 7 | |
Northern Trust Corp. (a) | | | 150 | | | | 9 | |
The Goldman Sachs Group, Inc. (a) | | | 4,350 | | | | 826 | |
| | | | | | | | 6,274 | |
Energy 1.6% |
ChevronTexaco Corp. (a) | | | 10,200 | | | | 685 | |
ConocoPhillips (a) | | | 9,900 | | | | 596 | |
Exxon Mobil Corp. (a) | | | 2,920 | | | | 209 | |
Parker Drilling Co. (a)* | | | 9,560 | | | | 78 | |
Pride International, Inc.* | | | 780 | | | | 22 | |
Valero Energy Corp. (a) | | | 6,205 | | | | 325 | |
Veritas DGC, Inc. (a)* | | | 7,220 | | | | 520 | |
| | | | | | | | 2,435 | |
Food & Staples Retailing 0.8% |
| Costco Wholesale Corp. | | | 5,600 | | | | 299 | |
CVS Corp. (a) | | | 18,700 | | | | 587 | |
Sysco Corp. (a) | | | 10,000 | | | | 350 | |
| | | | | | | | 1,236 | |
Food, Beverage & Tobacco 1.6% |
Campbell Soup Co. (a) | | | 27,000 | | | | 1,009 | |
ConAgra Foods, Inc. (a) | | | 2,890 | | | | 75 | |
General Mills, Inc. (a) | | | 170 | | | | 10 | |
Kraft Foods, Inc., Class A (a) | | | 20,200 | | | | 695 | |
Reynolds American, Inc. (a) | | | 620 | | | | 39 | |
The Coca-Cola Co. (a) | | | 2,270 | | | | 106 | |
The Hershey Co. (a) | | | 8,900 | | | | 471 | |
| | | | | | | | 2,405 | |
Health Care Equipment & Services 4.6% |
Aetna, Inc. (a) | | | 13,215 | | | | 545 | |
Alcon, Inc. (a) | | | 3,800 | | | | 403 | |
Alliance Imaging, Inc. (a)* | | | 1,060 | | | | 9 | |
AMERIGROUP Corp. (a)* | | | 3,150 | | | | 94 | |
AmerisourceBergen Corp. (a) | | | 1,185 | | | | 56 | |
Baxter International, Inc. (a) | | | 7,200 | | | | 331 | |
Becton Dickinson & Co. (a) | | | 590 | | | | 41 | |
Boston Scientific Corp. (a)* | | | 51,102 | | | | 813 | |
Caremark Rx, Inc. (a) | | | 7,900 | | | | 389 | |
CIGNA Corp. (a) | | | 6,200 | | | | 725 | |
CorVel Corp. (a)* | | | 1,610 | | | | 70 | |
Humana, Inc. (a)* | | | 12,835 | | | | 770 | |
Magellan Health Services, Inc. (a)* | | | 7,500 | | | | 327 | |
McKesson Corp. (a) | | | 1,560 | | | | 78 | |
MedCath Corp. (a)* | | | 4,750 | | | | 126 | |
Medco Health Solutions, Inc. (a)* | | | 7,600 | | | | 407 | |
Mentor Corp. (a) | | | 6,270 | | | | 293 | |
Molina Healthcare, Inc. (a)* | | | 1,840 | | | | 72 | |
Sierra Health Services, Inc. (a)* | | | 8,380 | | | | 287 | |
St. Jude Medical, Inc. (a)* | | | 8,200 | | | | 282 | |
Tenet Healthcare Corp. (a)* | | | 110,630 | | | | 781 | |
WellPoint, Inc. (a)* | | | 260 | | | | 20 | |
Zoll Medical Corp. (a)* | | | 720 | | | | 28 | |
| | | | | | | | 6,947 | |
Household & Personal Products 1.8% |
Avon Products, Inc. (a) | | | 15,600 | | | | 474 | |
Kimberly-Clark Corp. (a) | | | 8,600 | | | | 572 | |
NBTY, Inc. (a)* | | | 38,130 | | | | 1,061 | |
Procter & Gamble Co. (a) | | | 9,600 | | | | 609 | |
| | | | | | | | 2,716 | |
Insurance 2.4% |
Alleghany Corp. (a)* | | | 240 | | | | 73 | |
American Financial Group, Inc. (a) | | | 3,320 | | | | 159 | |
American International Group, Inc. (a) | | | 7,300 | | | | 490 | |
American Physicians Capital, Inc. (a)* | | | 790 | | | | 43 | |
AON Corp. (a) | | | 100 | | | | 4 | |
Argonaut Group, Inc.* | | | 240 | | | | 8 | |
CNA Surety Corp. (a)* | | | 120 | | | | 2 | |
Delphi Financial Group, Inc., Class A (a) | | | 1,200 | | | | 47 | |
FBL Financial Group, Inc., Class A (a) | | | 1,020 | | | | 36 | |
FPIC Insurance Group, Inc.* | | | 100 | | | | 4 | |
Great American Financial Resources, Inc. (a) | | | 280 | | | | 6 | |
Harleysville Group, Inc. (a) | | | 1,380 | | | | 50 | |
LandAmerica Financial Group, Inc. (a) | | | 610 | | | | 39 | |
Loews Corp. (a) | | | 1,330 | | | | 52 | |
MetLife, Inc. (a) | | | 11,180 | | | | 639 | |
Nationwide Financial Services, Inc., Class A (a) | | | 1,930 | | | | 98 | |
Philadelphia Consolidated Holding Corp. (a)* | | | 1,590 | | | | 62 | |
Principal Financial Group, Inc. (a) | | | 2,080 | | | | 118 | |
Protective Life Corp. (a) | | | 330 | | | | 15 | |
Safety Insurance Group, Inc. (a) | | | 3,260 | | | | 163 | |
Selective Insurance Group, Inc. (a) | | | 840 | | | | 46 | |
StanCorp Financial Group, Inc. (a) | | | 620 | | | | 28 | |
State Auto Financial Corp. (a) | | | 900 | | | | 29 | |
The Chubb Corp. (a) | | | 11,950 | | | | 635 | |
The St. Paul Travelers Cos., Inc. (a) | | | 13,500 | | | | 690 | |
Universal American Financial Corp.* | | | 360 | | | | 7 | |
W. R. Berkley Corp. (a) | | | 710 | | | | 26 | |
| | | | | | | | 3,569 | |
12 See financial notes.
Schwab Viewpoints Fund
Portfolio Holdings continued
Security
| | Number
of Shares
| | Value
($ x 1,000)
|
|---|
Materials 1.7% |
AK Steel Holding Corp. (a)* | | | 5,350 | | | | 80 | |
Carpenter Technology Corp. (a) | | | 440 | | | | 47 | |
Crown Holdings, Inc. (a)* | | | 540 | | | | 10 | |
FMC Corp. (a) | | | 420 | | | | 29 | |
Greif, Inc., Class A (a) | | | 3,710 | | | | 348 | |
H.B. Fuller Co. (a) | | | 7,530 | | | | 187 | |
Hercules, Inc. (a)* | | | 4,550 | | | | 83 | |
International Paper Co. (a) | | | 1,225 | | | | 41 | |
MeadWestvaco Corp. (a) | | | 18,100 | | | | 498 | |
Monsanto Co. (a) | | | 10,000 | | | | 442 | |
Nucor Corp. (a) | | | 900 | | | | 53 | |
OM Group, Inc.* | | | 1,480 | | | | 84 | |
Packaging Corp. of America (a) | | | 480 | | | | 11 | |
Pactiv Corp.* | | | 1,220 | | | | 38 | |
| Phelps Dodge Corp. | | | 130 | | | | 13 | |
Rohm & Haas Co. (a) | | | 1,585 | | | | 82 | |
Silgan Holdings, Inc. (a) | | | 3,150 | | | | 130 | |
Spartech Corp. (a) | | | 3,150 | | | | 86 | |
Temple-Inland, Inc. (a) | | | 340 | | | | 13 | |
The Lubrizol Corp. (a) | | | 380 | | | | 17 | |
United States Steel Corp. (a) | | | 4,200 | | | | 284 | |
| | | | | | | | 2,576 | |
Media 2.4% |
CBS Corp., Class B (a) | | | 260 | | | | 8 | |
Clear Channel Communications, Inc. (a) | | | 16,300 | | | | 568 | |
Comcast Corp. (a)* | | | 21,300 | | | | 862 | |
Comcast Corp., Class A (a)* | | | 10,500 | | | | 427 | |
LodgeNet Entertainment Corp.* | | | 100 | | | | 2 | |
Omnicom Group, Inc. (a) | | | 885 | | | | 90 | |
Readers Digest Association, Inc., Class A (a) | | | 22,000 | | | | 316 | |
The Interpublic Group of Cos., Inc. (a)* | | | 12,800 | | | | 140 | |
The McGraw-Hill Cos., Inc. (a) | | | 1,010 | | | | 65 | |
The Walt Disney Co. (a) | | | 13,800 | | | | 434 | |
Time Warner, Inc. (a) | | | 31,990 | | | | 640 | |
| | | | | | | | 3,552 | |
Pharmaceuticals & Biotechnology 2.5% |
Applied Biosystems Group-Applera Corp. (a) | | | 2,180 | | | | 81 | |
Biogen Idec, Inc. (a)* | | | 200 | | | | 10 | |
Bruker BioSciences Corp. (a)* | | | 4,280 | | | | 34 | |
GlaxoSmithKline plc (a) | | | 7,600 | | | | 405 | |
King Pharmaceuticals, Inc. (a)* | | | 2,660 | | | | 44 | |
Maxygen, Inc. (a)* | | | 1,460 | | | | 12 | |
Merck & Co., Inc. (a) | | | 3,380 | | | | 154 | |
Millennium Pharmaceuticals, Inc. (a)* | | | 40,500 | | | | 474 | |
Pfizer, Inc. (a) | | | 25,820 | | | | 688 | |
| Sanofi-Aventis | | | 10,300 | | | | 440 | |
Teva Pharmaceutical Industries Ltd. (a) | | | 13,800 | | | | 455 | |
Watson Pharmaceuticals, Inc. (a)* | | | 14,000 | | | | 377 | |
Wyeth (a) | | | 12,215 | | | | 623 | |
| | | | | | | | 3,797 | |
Retailing 1.8% |
American Eagle Outfitters, Inc. (a) | | | 700 | | | | 32 | |
Bed, Bath & Beyond, Inc. (a)* | | | 7,300 | | | | 294 | |
Best Buy Co., Inc. (a) | | | 11,200 | | | | 619 | |
Blockbuster, Inc., Class A (a)* | | | 3,300 | | | | 13 | |
Federated Department Stores, Inc. (a) | | | 7,400 | | | | 325 | |
J.C. Penney Co., Inc. (a) | | | 5,560 | | | | 418 | |
Office Depot, Inc. (a)* | | | 10,970 | | | | 461 | |
Payless Shoesource, Inc. (a)* | | | 5,740 | | | | 153 | |
The Cato Corp., Class A (a) | | | 110 | | | | 2 | |
The Gymboree Corp. (a)* | | | 1,050 | | | | 49 | |
The Men’s Wearhouse, Inc. (a) | | | 7,500 | | | | 299 | |
Wetseal, Inc., Class A (a)* | | | 7,800 | | | | 49 | |
| | | | | | | | 2,714 | |
Semiconductors & Semiconductor Equipment 2.1% |
Agere Systems, Inc. (a)* | | | 160 | | | | 3 | |
Applied Materials, Inc. (a) | | | 26,120 | | | | 454 | |
Asyst Technologies, Inc. (a)* | | | 5,310 | | | | 39 | |
Broadcom Corp., Class A (a)* | | | 15,150 | | | | 459 | |
Cirrus Logic, Inc. (a)* | | | 3,030 | | | | 21 | |
Fairchild Semiconductor International, Inc. (a)* | | | 3,780 | | | | 61 | |
Intel Corp. (a) | | | 34,500 | | | | 736 | |
Intersil Corp., Class A (a) | | | 10,700 | | | | 251 | |
MEMC Electronic Materials, Inc. (a)* | | | 18,300 | | | | 650 | |
Microchip Technology, Inc. (a) | | | 12,300 | | | | 405 | |
Micron Technology, Inc. (a)* | | | 410 | | | | 6 | |
MKS Instruments, Inc. (a)* | | | 2,090 | | | | 45 | |
Texas Instruments, Inc. (a) | | | 1,370 | | | | 41 | |
Zoran Corp. (a)* | | | 350 | | | | 5 | |
| | | | | | | | 3,176 | |
Software & Services 2.3% |
Adobe Systems, Inc. (a)* | | | 11,800 | | | | 451 | |
Advent Software, Inc. (a)* | | | 160 | | | | 6 | |
Ariba, Inc.* | | | 740 | | | | 6 | |
Aspen Technology, Inc. (a)* | | | 1,040 | | | | 10 | |
Autodesk, Inc. (a)* | | | 680 | | | | 25 | |
BMC Software, Inc. (a)* | | | 1,260 | | | | 38 | |
Covansys Corp. (a)* | | | 2,680 | | | | 63 | |
CSG Systems International, Inc. (a)* | | | 10,210 | | | | 276 | |
Electronic Data Systems Corp. (a) | | | 20,490 | | | | 519 | |
Forrester Research, Inc. (a)* | | | 3,730 | | | | 117 | |
Global Payments, Inc. (a) | | | 4,220 | | | | 185 | |
Google, Inc., Class A (a)* | | | 2,186 | | | | 1,041 | |
Hyperion Solutions Corp. (a)* | | | 740 | | | | 28 | |
i2 Technologies, Inc. (a)* | | | 510 | | | | 10 | |
Interwoven, Inc. (a)* | | | 2,330 | | | | 30 | |
Intuit, Inc. (a)* | | | 690 | | | | 24 | |
Lightbridge, Inc. (a)* | | | 6,130 | | | | 71 | |
McAfee, Inc.* | | | 730 | | | | 21 | |
SonicWALL, Inc. (a)* | | | 5,090 | | | | 53 | |
SPSS, Inc. (a)* | | | 950 | | | | 26 | |
Sybase, Inc. (a)* | | | 6,550 | | | | 160 | |
Sykes Enterprises, Inc. (a)* | | | 9,950 | | | | 202 | |
Synopsys, Inc. (a)* | | | 4,850 | | | | 109 | |
Tyler Technologies, Inc. (a)* | | | 210 | | | | 3 | |
| | | | | | | | 3,474 | |
See financial notes. 13
Schwab Viewpoints Fund
Portfolio Holdings continued
Security
| | Number
of Shares
| | Value
($ x 1,000)
|
|---|
Technology Hardware & Equipment 3.9% |
AVX Corp. (a) | | | 3,400 | | | | 54 | |
Brocade Communications Systems, Inc. (a)* | | | 9,210 | | | | 75 | |
Carrier Access Corp. (a)* | | | 1,630 | | | | 10 | |
Coherent, Inc. (a)* | | | 5,580 | | | | 180 | |
Corning, Inc. (a)* | | | 24,200 | | | | 494 | |
Emulex Corp. (a)* | | | 1,270 | | | | 24 | |
Hewlett-Packard Co. (a) | | | 27,500 | | | | 1,065 | |
Imation Corp. (a) | | | 2,820 | | | | 129 | |
International Business Machines Corp. (a) | | | 8,830 | | | | 815 | |
Lexmark International, Inc., Class A (a)* | | | 180 | | | | 11 | |
Littelfuse, Inc. (a)* | | | 4,430 | | | | 150 | |
Lucent Technologies, Inc. (a)* | | | 191,400 | | | | 465 | |
Motorola, Inc. (a) | | | 1,320 | | | | 30 | |
NCR Corp. (a)* | | | 445 | | | | 19 | |
Photon Dynamics, Inc. (a)* | | | 420 | | | | 5 | |
Planar Systems, Inc. (a)* | | | 4,330 | | | | 52 | |
QUALCOMM, Inc. (a) | | | 13,100 | | | | 477 | |
Rofin-Sinar Technologies, Inc. (a)* | | | 430 | | | | 27 | |
Solectron Corp. (a)* | | | 101,540 | | | | 339 | |
Staktek Holdings, Inc. (a)* | | | 8,160 | | | | 50 | |
Sun Microsystems, Inc. (a)* | | | 121,100 | | | | 658 | |
UTStarcom, Inc. (a)* | | | 15,680 | | | | 169 | |
Xerox Corp. (a)* | | | 33,080 | | | | 562 | |
| | | | | | | | 5,860 | |
Telecommunication Services 1.4% |
AT&T Corp. (a) | | | 22,700 | | | | 777 | |
Broadwing Corp. (a)* | | | 5,810 | | | | 87 | |
Citizens Communications Co. (a) | | | 5,385 | | | | 79 | |
CT Communications, Inc. (a) | | | 2,260 | | | | 53 | |
Qwest Communications International, Inc. (a)* | | | 116,180 | | | | 1,003 | |
| Verizon Communications, Inc. | | | 390 | | | | 14 | |
| | | | | | | | 2,013 | |
Transportation 1.0% |
AMR Corp. (a)* | | | 1,980 | | | | 56 | |
Con-way, Inc. (a) | | | 6,300 | | | | 297 | |
Continental Airlines, Inc.,
Class B (a)* | | | 2,170 | | | | 80 | |
CSX Corp. (a) | | | 30,170 | | | | 1,076 | |
Hub Group, Inc., Class A (a)* | | | 1,740 | | | | 48 | |
| | | | | | | | 1,557 | |
Utilities 0.8% |
Allete, Inc. (a) | | | 1,990 | | | | 90 | |
American Electric Power Co., Inc. (a) | | | 12,400 | | | | 514 | |
Edison International (a) | | | 680 | | | | 30 | |
FirstEnergy Corp. (a) | | | 500 | | | | 30 | |
The AES Corp. (a)* | | | 790 | | | | 17 | |
TXU Corp. (a) | | | 8,970 | | | | 566 | |
| | | | | | | | 1,247 | |
Foreign Common Stock 15.5% of net assets |
Australia 0.2% |
Banks 0.2% |
| Australia and New Zealand Banking Group Ltd. | | | 13,900 | | | | 311 | |
France 1.4% |
Automobiles & Components 0.3% |
| Compagnie Generale des Etablissements Michelin, Class B | | | 4,800 | | | | 391 | |
Banks 0.1% |
| BNP Paribas | | | 1,900 | | | | 209 | |
Media 0.9% |
| Publicis Groupe S.A. | | | 11,000 | | | | 425 | |
| Vivendi Universal S.A. | | | 12,600 | | | | 477 | |
| Societe Television Francaise 1 | | | 13,900 | | | | 472 | |
| | | | | | | | 1,374 | |
Pharmaceuticals & Biotechnology 0.1% |
| Sanofi-Aventis | | | 2,400 | | | | 204 | |
| | | | | | | | 2,178 | |
Germany 1.9% |
Automobiles & Components 1.0% |
| DaimlerChrysler AG | | | 16,800 | | | | 961 | |
| Bayerische Motoren Werke (BMW) AG | | | 10,500 | | | | 604 | |
| | | | | | | | 1,565 | |
Food & Staples Retailing 0.2% |
| Metro AG | | | 4,500 | | | | 268 | |
Household & Personal Products 0.2% |
| Henkel KGaA | | | 2,500 | | | | 300 | |
Insurance 0.5% |
Hannover Rueckversicherung AG* | | | 18,600 | | | | 790 | |
| | | | | | | | 2,923 | |
Hong Kong 0.1% |
Retailing 0.1% |
| Giordano International Ltd. | | | 330,000 | | | | 165 | |
Ireland 0.4% |
Banks 0.4% |
| Bank of Ireland | | | 30,200 | | | | 605 | |
14 See financial notes.
Schwab Viewpoints Fund
Portfolio Holdings continued
Security
| | Number
of Shares
| | Value
($ x 1,000)
|
|---|
Japan 1.6% |
Automobiles & Components 0.2% |
| Honda Motor Co., Ltd. | | | 6,600 | | | | 233 | |
Diversified Financials 0.3% |
| Daiwa Securities Group, Inc. | | | 39,000 | | | | 441 | |
Household & Personal Products 0.3% |
| Kao Corp. | | | 8,000 | | | | 210 | |
| Uni-Charm Corp. | | | 4,900 | | | | 273 | |
| | | | | | | | 483 | |
Pharmaceuticals & Biotechnology 0.1% |
| Takeda Pharmaceutical Co., Ltd. | | | 3,400 | | | | 218 | |
Semiconductors & Semiconductor Equipment 0.4% |
| Rohm Co., Ltd. | | | 5,900 | | | | 542 | |
Telecommunication Services 0.3% |
| NTT DoCoMo, Inc. | | | 290 | | | | 442 | |
| | | | | | | | 2,359 | |
Mexico 0.1% |
Media 0.1% |
Grupo Televisa SA de CV, ADR (a) | | | 7,000 | | | | 173 | |
Netherlands 0.4% |
Consumer Durables & Apparel 0.3% |
| Koninklijke (Royal) Philips Electronics N.V. | | | 15,000 | | | | 522 | |
Materials 0.1% |
| Akzo Nobel N.V. | | | 2,900 | | | | 163 | |
| | | | | | | | 685 | |
Republic of Korea 0.6% |
Telecommunication Services 0.6% |
| SK Telecom Co., Ltd. | | | 3,900 | | | | 845 | |
Singapore 0.2% |
Banks 0.2% |
| United Overseas Bank Ltd. | | | 22,300 | | | | 253 | |
Spain 0.4% |
Media 0.4% |
| Gestevision Telecinco S.A. | | | 22,500 | | | | 591 | |
Switzerland 3.3% |
Commercial Services & Supplies 0.5% |
| Adecco S.A. | | | 11,200 | | | | 691 | |
Consumer Durables & Apparel 0.3% |
| Swatch Group AG | | | 1,900 | | | | 375 | |
Diversified Financials 1.0% |
| Credit Suisse Group | | | 11,300 | | | | 681 | |
| UBS AG | | | 13,700 | | | | 818 | |
| | | | | | | | 1,499 | |
Food, Beverage & Tobacco 0.4% |
| Nestle S.A. | | | 1,720 | | | | 588 | |
Materials 0.7% |
Syngenta AG* | | | 3,300 | | | | 532 | |
| Givaudan S.A. — Reg’d. | | | 410 | | | | 340 | |
| Lonza Group AG | | | 2,700 | | | | 208 | |
| | | | | | | | 1,080 | |
Pharmaceuticals & Biotechnology 0.4% |
| Novartis AG — Reg’d. | | | 11,000 | | | | 668 | |
| | | | | | | | 4,901 | |
United Kingdom 4.9% |
Banks 0.4% |
| Lloyds TSB Group plc | | | 50,000 | | | | 534 | |
Capital Goods 0.1% |
| Enodis plc | | | 59,000 | | | | 209 | |
Commercial Services & Supplies 0.0% |
| Michael Page Group plc | | | 7,600 | | | | 58 | |
Consumer Services 0.4% |
| Compass Group plc | | | 96,800 | | | | 517 | |
Diversified Financials 0.1% |
| Schroders plc | | | 10,100 | | | | 191 | |
Food, Beverage & Tobacco 0.9% |
| Diageo plc | | | 41,800 | | | | 773 | |
| Cadbury Schweppes plc | | | 52,200 | | | | 525 | |
| | | | | | | | 1,298 | |
Insurance 0.1% |
Willis Group Holdings Ltd. (a) | | | 3,300 | | | | 126 | |
Media 1.3% |
| British Sky Broadcasting Group plc | | | 96,000 | | | | 995 | |
| Johnston Press plc | | | 71,300 | | | | 568 | |
| Trinity Mirror plc | | | 35,800 | | | | 334 | |
| | | | | | | | 1,897 | |
Pharmaceuticals & Biotechnology 0.6% |
| GlaxoSmithKline plc | | | 34,700 | | | | 925 | |
Retailing 0.6% |
| Signet Group plc | | | 416,400 | | | | 954 | |
Telecommunication Services 0.4% |
| Vodafone Group plc | | | 237,400 | | | | 612 | |
| | | | | | | | 7,321 | |
See financial notes. 15
Schwab Viewpoints Fund
Portfolio Holdings continued
Security
Rate, Maturity Date
| | Face Amount
($ x 1,000)
| | Value
($ x 1,000)
|
|---|
U.S. Treasury Obligations 8.6% of net assets |
| U.S. Treasury Bond | | | | | | | | |
4.50%, 11/15/15 (a) | | | 100 | | | | 99 | |
6.88%, 08/15/25 (a) | | | 250 | | | | 313 | |
8.13%, 08/15/19 (a) | | | 100 | | | | 132 | |
9.13%, 05/15/18 (a) | | | 100 | | | | 139 | |
| U.S. Treasury Inflation Protected Security | | | | | | | | |
2.00%, 01/15/26 (a) | | | 308 | | | | 295 | |
2.38%, 04/15/11 (a) | | | 205 | | | | 204 | |
3.38%, 01/15/07 (a) | | | 2,561 | | | | 2,532 | |
3.63%, 01/15/08 (a) | | | 379 | | | | 379 | |
| U.S. Treasury Note | | | | | | | | |
3.25%, 01/15/09 (a) | | | 100 | | | | 97 | |
3.63%, 01/15/10 (a) | | | 100 | | | | 97 | |
3.75%, 05/15/08 (a) | | | 400 | | | | 394 | |
3.88%, 09/15/10 (a) | | | 900 | | | | 878 | |
4.00%, 06/15/09 (a) | | | 2,000 | | | | 1,970 | |
4.00%, 02/15/15 (a) | | | 500 | | | | 480 | |
4.50%, 11/15/10 (a) | | | 1,000 | | | | 998 | |
4.75%, 03/31/11 (a) | | | 600 | | | | 604 | |
4.88%, 04/30/11 (a) | | | 1,100 | | | | 1,113 | |
4.88%, 07/31/11 (a) | | | 1,000 | | | | 1,013 | |
5.13%, 06/30/11 (a) | | | 1,100 | | | | 1,125 | |
| | | | | | | | 12,862 | |
Foreign Government Securities 0.5% of net assets |
| Government of United Kingdom | | | | | | | | |
| 4.25%, 03/07/11 | | | 200 | | | | 373 | |
| Panama Government International Bond | | | | | | | | |
6.70%, 01/26/36 (a) | | | 326 | | | | 331 | |
| | | | | | | | 704 | |
Corporate Bonds 1.5% of net assets |
Fixed-Rate Obligations 0.4% |
| Caesars Entertainment, Inc. | | | | | | | | |
9.38%, 02/15/07 (a) | | | 200 | | | | 202 | |
| DaimlerChrysler NA Holding Corp | | | | | | | | |
5.75%, 09/08/11 (a) | | | 100 | | | | 100 | |
| El Paso Corp. | | | | | | | | |
7.80%, 08/01/31 (a) | | | 100 | | | | 105 | |
| Verizon Communications, Inc. | | | | | | | | |
5.55%, 02/15/16 (a) | | | 100 | | | | 100 | |
| | | | | | | | 507 | |
Variable-Rate Obligations 1.1% |
| BellSouth Corp | | | | | | | | |
5.58%, 08/15/08 (a)(b) | | | 200 | | | | 200 | |
| ConocoPhillips Australia Funding Co. | | | | | | | | |
5.47%, 04/09/09 (a)(b) | | | 600 | | | | 601 | |
| DaimlerChrysler NA Holding Corp. | | | | | | | | |
5.64%, 03/07/07 (a)(b) | | | 400 | | | | 400 | |
| HSBC Bank USA | | | | | | | | |
5.46%, 09/21/07 (a)(b) | | | 250 | | | | 251 | |
| Transocean, Inc. | | | | | | | | |
5.59%, 09/05/08 (a)(b) | | | 200 | | | | 200 | |
| | | | | | | | 1,652 | |
Municipal Bonds 0.6% of net assets |
Revenue Bonds 0.6% |
| Golden State, California Securitization Corp. Revenue Bond, Series 2003-A-1 | | | | | | | | |
6.25%, 06/01/33 (a) | | | 250 | | | | 279 | |
| Tobacco Settlement Financing Corp. of Rhode Island Revenue Bond, Series 2002A | | | | | | | | |
6.25%, 06/01/42 (a) | | | 500 | | | | 535 | |
| | | | | | | | 814 | |
Asset-Backed Obligations 0.5% of net assets |
| Honda Auto Receivables Owner Trust, Series 2006-1 Class A2 | | | | | | | | |
5.10%, 09/18/08 (a) | | | 400 | | | | 400 | |
| Nissan Auto Receivables Owner Trust, Series 2001-B Class A2 | | | | | | | | |
5.18%, 08/15/08 (a) | | | 400 | | | | 400 | |
| | | | | | | | 800 | |
Mortgage-Backed Securities 18.0% of net assets |
Collateralized Mortgage Obligations 0.4% |
Variable-Rate Obligations 0.4% |
| Freddie Mac Structured Series T-61 Class 1A1 | | | | | | | | |
5.96%, 07/25/44 (b) | | | 608 | | | | 618 | |
U.S. Government Agency Mortgages 17.6% |
| Fannie Mae | | | | | | | | |
4.00%, 07/01/18 (a) | | | 771 | | | | 733 | |
4.00%, 11/01/18 (a) | | | 821 | | | | 780 | |
4.00%, 01/01/19 (a) | | | 18 | | | | 17 | |
4.00%, 04/01/19 (a) | | | 18 | | | | 17 | |
4.00%, 06/01/19 (a) | | | 132 | | | | 126 | |
4.00%, 06/01/19 (a) | | | 136 | | | | 129 | |
4.00%, 02/01/20 (a) | | | 470 | | | | 445 | |
4.00%, 03/01/20 (a) | | | 162 | | | | 154 | |
4.50%, 08/01/33 (a) | | | 207 | | | | 195 | |
4.50%, 05/01/35 (a) | | | 453 | | | | 427 | |
4.50%, 09/01/35 (a) | | | 939 | | | | 881 | |
4.50%, 09/01/35 (a) | | | 988 | | | | 928 | |
4.50%, 10/01/35 (a) | | | 96 | | | | 90 | |
5.00%, 02/01/36 (a) | | | 3,017 | | | | 2,914 | |
5.50%, 02/01/34 (a) | | | 690 | | | | 684 | |
5.50%, 04/01/34 (a) | | | 304 | | | | 301 | |
5.50%, 09/01/34 (a) | | | 4,159 | | | | 4,118 | |
5.50%, 11/01/34 (a) | | | 2,402 | | | | 2,379 | |
5.50%, 02/01/35 (a) | | | 1,664 | | | | 1,647 | |
5.50%, 02/01/35 (a) | | | 795 | | | | 787 | |
5.50%, 02/01/35 (a) | | | 349 | | | | 346 | |
16 See financial notes.
Schwab Viewpoints Fund
Portfolio Holdings continued
Security
Rate, Maturity Date
| | Face Amount
($ x 1,000)
| | Value
($ x 1,000)
|
|---|
5.50%, 04/01/35 (a) | | | 1,742 | | | | 1,723 | |
5.50%, 05/01/35 (a) | | | 646 | | | | 639 | |
5.50%, 06/01/35 (a) | | | 92 | | | | 91 | |
5.50%, 09/01/35 (a) | | | 439 | | | | 434 | |
5.50%, 04/01/36 (a) | | | 989 | | | | 978 | |
5.50%, 07/01/36 (a) | | | 991 | | | | 980 | |
6.00%, 04/01/16 (a) | | | 26 | | | | 26 | |
6.00%, 03/01/18 (a) | | | 18 | | | | 18 | |
| 6.86%, 09/01/31 (b) | | | 18 | | | | 19 | |
| Fannie Mae TBA | | | | | | | | |
| 6.00%, 12/01/99 | | | 2,000 | | | | 2,013 | |
| Freddie Mac | | | | | | | | |
6.00%, 09/01/22 (a) | | | 171 | | | | 173 | |
| Freddie Mac ARM | | | | | | | | |
4.40%, 09/01/35 (b) | | | 163 | | | | 161 | |
| Ginnie Mae TBA | | | | | | | | |
| 6.00%, 12/01/99 | | | 1,000 | | | | 1,014 | |
| | | | | | | | 26,367 | |
Non-Agency Mortgage-Backed Securities
0.6% of net assets |
Fixed-Rate Obligations 0.1% |
| Bank of America Mortgage Securities Series 2004-2 Class 5A1 | | | | | | | | |
6.50%, 10/25/31 (a) | | | 92 | | | | 94 | |
| Residential Funding Mortgage Security I Series-S9 Class A1 | | | | | | | | |
6.50%, 03/25/32 (a) | | | 51 | | | | 52 | |
| | | | | | | | 146 | |
Variable-Rate Obligations 0.5% |
| Bear Stearns Adjustable Rate Mortgage Trust Series 2002-11 Class 1A1 | | | | | | | | |
5.62%, 02/25/33 (a)(b) | | | 65 | | | | 65 | |
| Bear Stearns Adjustable Rate Mortgage Trust Series 2005-4 Class 23A2 | | | | | | | | |
5.40%, 05/25/35 (a)(b) | | | 127 | | | | 127 | |
| Quest Trust, 144A Series 2004-X2 Class A1 | | | | | | | | |
5.88%, 06/25/34 (c)(b) | | | 22 | | | | 22 | |
| Washington Mutual Series 2003-R1 Class A1 | | | | | | | | |
5.59%, 12/25/27 (a)(b) | | | 491 | | | | 491 | |
| | | | | | | | 705 | |
Short-Term Investment 9.7% of net assets |
Commercial Paper & Other Obligations 0.2% |
| Time Warner, Inc. | | | | | | | | |
| 5.39%, 01/25/07 | | | 300 | | | | 296 | |
Repurchase Agreement 9.1% |
| Fixed Income Clearing Corp. dated 10/31/06, due 11/01/06 at 4.8%, with a maturity value of $13,726 (fully collateralized by Federal Home Loan Bank and Federal National Mortgage Association with a value of $1,279 and $13,064 respectively.) | | | 13,724 | | | | 13,724 | |
U.S. Treasury Obligations 0.4% |
| U.S. Treasury Bill | | | | | | | | |
4.73%, 12/14/06 (a) | | | 30 | | | | 30 | |
4.83%, 12/14/06 (a) | | | 110 | | | | 109 | |
4.87%, 12/14/06 (a) | | | 30 | | | | 30 | |
4.90%, 12/14/06 (a) | | | 60 | | | | 59 | |
4.89%, 12/14/06 (a) | | | 25 | | | | 25 | |
4.93%, 12/14/06 (a) | | | 80 | | | | 80 | |
4.94%, 12/14/06 (a) | | | 170 | | | | 169 | |
5.03%, 12/14/06 (a) | | | 30 | | | | 30 | |
5.04%, 12/14/06 (a) | | | 30 | | | | 30 | |
| | | | | | | | 562 | |
Security and Number of Shares
| | Value
($ x 1,000)
|
|---|
Other Investments 4.1% of net assets |
iShares Lehman Aggregate Bond Fund (a) | | 43,000 | | | | 4,318 | |
iShares Russell 1000 Value Index Fund (a) | | 24,000 | | | | 1,907 | |
| | | | | | | 6,225 | |
Security
| | Notional Amount
($ x 1,000)
| | Value
($ x 1,000)
|
|---|
Purchased Options 0.1% of net assets |
Swaptions 0.1% |
3 Month LIBOR Swap Call, Strike Price 4.50,
Expires 01/22/07 | | | 2,000 | | | | — | |
3 Month LIBOR Swap Call, Strike Price 5.00,
Expires 03/08/07 | | | 2,100 | | | | 7 | |
3 Month LIBOR Swap Call, Strike Price 5.04,
Expires 09/17/07 | | | 800 | | | | 5 | |
3 Month LIBOR Swap Call, Strike Price 5.25,
Expires 06/07/07 | | | 2,000 | | | | 16 | |
3 Month LIBOR Swap Call, Strike Price 5.37,
Expires 07/02/07 | | | 1,600 | | | | 16 | |
3 Month LIBOR Swap Call, Strike Price 5.50,
Expires 06/30/07 | | | 2,000 | | | | 24 | |
See financial notes. 17
Schwab Viewpoints Fund
Portfolio Holdings continued
Security
| | Notional Amount
($ x 1,000)
| | Value
($ x 1,000)
|
|---|
3 Month LIBOR Swap Call, Strike Price 5.31
Expires 10/19/10 | | | 2,000 | | | | 66 | |
3 Month LIBOR Swap Put, Strike Price 5.31
Expires 10/19/10 | | | 2,000 | | | | 66 | |
| | | | | | | | 200 | |
Security
| | Number of
Contracts
| | Value
($ x 1,000)
|
|---|
Put Options 0.0% |
90 Day Euro Dollar Futures, Strike Price 91.25,
Expires 12/17/07 | | | 25 | | | | — | |
90 Day Euro Dollar Futures, Strike Price 91.75,
Expires 12/18/06 | | | 50 | | | | 1 | |
90 Day Euro Dollar Futures, Strike Price 92.00,
Expires 03/19/07 | | | 50 | | | | — | |
90 Day Euro Dollar Futures, Strike Price 92.50,
Expires 12/18/06 | | | 3 | | | | — | |
90 Day Euro Dollar Futures, Strike Price 92.75,
Expires 12/18/06 | | | 4 | | | | — | |
| | | | | | | | 1 | |
At 10/31/06 the tax basis cost of the fund’s investments was $145,777, and the unrealized appreciation and depreciation were $11,484 and ($2,457), respectively, with a net appreciation of $9,027.
As of 10/31/06, the prices of certain foreign securities held by the fund aggregating $22,945 were adjusted from their closing market prices following the guidelines adopted by the fund’s Board of Trustees.
| * | | Non-income producing security. |
(a) | | All or a portion of this security is held as collateral for future contract, short sale, swap agreements, delayed-delivery security and options written |
(b) | | Variable-rate security. |
(c) | | Securities exempt from registration under Rule 144A of the Securities Act of 1933. These securities may be resold in transactions exempt from registrations, normally to qualified institutional buyers. At the period end, the value of these amounted to $22 or 0.01% of net assets. |
ADR — American Depositary Receipt
Security and Number of Shares
| | Value
($ x 1,000)
|
|---|
Short Sales (11.9)% of net assets |
Other Investment Companies (7.1)% |
| Consumer Discretionary Select Sector SPDR Fund | | | 165,000 | | | | 6,140 | |
| iShares MSCI EAFE Index Fund | | | 64,000 | | | | 4,499 | |
| | | | | | | | 10,639 | |
Security
Rate, Maturity Date
| | Face Amount
($ x 1,000)
| | Value
($ x 1,000)
|
|---|
U.S. Government Agency Mortgages (2.0)% |
| Fannie Mae | | | | | | | | |
| 5.50%, 12/01/99 | | | 2,950 | | | | 2,916 | |
U.S. Government Agency Securities (2.8)% |
| U.S. Treasury Note | | | | | | | | |
| 4.38%, 05/15/07 | | | 500 | | | | 498 | |
| U.S. Treasury Note | | | | | | | | |
| 3.63%, 05/15/13 | | | 700 | | | | 663 | |
| U.S. Treasury Note | | | | | | | | |
| 0.01%, 05/15/14 | | | 900 | | | | 909 | |
| U.S. Treasury Note | | | | | | | | |
| 4.13%, 05/15/15 | | | 1,800 | | | | 1,741 | |
| U.S. Treasury Note | | | | | | | | |
| 6.00%, 08/15/09 | | | 400 | | | | 414 | |
| | | | | | | | 4,225 | |
Security
| | Notional Amount
($ x 1,000)
| | Value
($ x 1,000)
|
|---|
Options Written 0.0% of net assets |
Swaptions 0.0% |
3 Month LIBOR Swap Call
Strike Price 4.56,
Expires 01/22/07 | | | 900 | | | | — | |
3 Month LIBOR Swap Call
Strike Price 5.04,
Expires 03/08/07 | | | 900 | | | | 7 | |
3 Month LIBOR Swap Call
Strike Price 5.34,
Expires 06/07/07 | | | 1,000 | | | | 19 | |
3 Month LIBOR Swap Call
Strike Price 5.50,
Expires 07/02/07 | | | 500 | | | | 15 | |
3 Month LIBOR Swap Call
Strike Price 5.60,
Expires 06/30/07 | | | 900 | | | | 25 | |
| | | | | | | | 66 | |
Straddle Option 0.0% |
| USD/JPY Forward Straddle Exercise Price $0.00 Expires 03/20/07 | | | 2,100 | | | | 7 | |
End of short sales and options written.In addition to the above, the fund held the following at 10/31/06. All numbers x 1000 except number of futures contracts.
18 See financial notes.
Schwab Viewpoints Fund
Portfolio Holdings continued
| | Notional
Amount
(Foreign/USD)
| | Unrealized
Gains/(Losses)
(USD)
|
|---|
Swap Agreements 0.1% of net assets |
Interest Rate Swaps 0.1% |
British Pounds 0.0% |
Receive fixed rate payments of 5.00%, Pay variable rate payments of 6 month LIBOR, expires 6/15/09,
Barclays Bank plc | | | 200 | | | | — | |
Receive fixed rate payments of 5.00%, Pay variable rate payments of 6 month
LIBOR, expires 9/15/10,
Barclays Bank plc | | | 700 | | | | (19 | ) |
| | | | | | | | (19 | ) |
Japanese Yen 0.0% |
Receive variable rate payments of 6 month LIBOR, Pay fixed rate payments of 2.00%,
expires 12/15/15,
Barclays Bank plc | | | 10,000 | | | | (2 | ) |
Receive variable rate payments of 6 month LIBOR, Pay fixed rate payments of 2.00%, expires 12/15/15,
Merrill Lynch | | | 20,000 | | | | (4 | ) |
| | | | | | | | (6 | ) |
U.S. Dollars 0.1% |
Receive fixed rate payments of 5.00%, Pay variable rate payments of 3 month LIBOR, expires 12/20/11,
Lehman Brothers | | | 1,200 | | | | 21 | |
Receive fixed rate payments of 5.00%, Pay variable rate payments of 3 month LIBOR, expires 12/20/11,
Merrill Lynch | | | 3,300 | | | | 88 | |
Receive fixed rate payments of 5.00%, Pay variable rate payments of 3 month LIBOR, expires 12/20/11,
Morgan Stanley | | | 1,000 | | | | 18 | |
| Receive fixed rate payments of 5.00%, Pay variable rate payments of 3 month LIBOR, expires 6/18/09, UBS AG | | | 4,000 | | | | 14 | |
Receive fixed rate payments of 5.00%, Pay variable rate payments of 3 month LIBOR, expires 12/20/36,
Morgan Stanley | | | 700 | | | | 45 | |
Receive fixed rate payments of 5.00%, Pay variable rate payments of 3 month LIBOR, expires 12/20/36,
Royal Bank Scotland | | | 100 | | | | 6 | |
| | Notional
Amount
(USD)
| | Unrealized
Gains/(Losses)
(USD)
|
|---|
| Receive variable rate payments of 3 month LIBOR, Pay fixed rate payments of 5.00%, expires 12/20/16, Goldman Sachs | | | 1,500 | | | | (48 | ) |
| Receive variable rate payments of 3 month LIBOR, Pay fixed rate payments of 6.00%, expires 12/15/24, UBS AG | | | 200 | | | | 4 | |
| | | | | | | | 148 | |
Net Realized Gain — Interest
Rate Swaps | | | | | | | 123 | |
Credit Default Swaps 0.0% |
U.S. Dollars 0.0% |
Allstate Corp. Rate 0.26%, expires 12/20/08,
Morgan Stanley | | | 100 | | | | — | |
Autozone, Inc. Rate 0.35%, expires 12/20/08,
UBS AG | | | 200 | | | | (1 | ) |
DaimlerChrysler NA Holding Corp. Rate 0.58%,
expires 09/20/11,
Barclays Bank plc | | | 100 | | | | — | |
Eaton Corp. Rate 0.28%,
expires 12/20/08,
Citibank N.A. | | | 100 | | | | — | |
Eli Lilly & Co. Rate 0.16%, expires 12/20/08,
Barclays Bank plc | | | 100 | | | | — | |
| Emerson Electric Co. Rate 0.21%, expires 12/20/08, Morgan Stanley | | | 100 | | | | — | |
Fedex Corp. Rate 0.29%,
expires 12/20/08,
Citibank N.A. | | | 100 | | | | (1 | ) |
GMAC Rate 2.00%,
expires 12/20/06,
UBS, AG | | | 200 | | | | — | |
Home Depot, Inc. Rate 0.12%, expires 12/20/08,
Lehman Brothers, Inc. | | | 100 | | | | — | |
Ingersoll-Rand Co. Ltd.
Rate 0.32%, expires
12/20/08, Merrill Lynch | | | 100 | | | | (1 | ) |
Johnson & Johnson, Inc.
Rate 0.11%,
expires 12/20/08,
Lehman Brothers, Inc. | | | 100 | | | | — | |
Masco Corp. Rate 0.30%,
expires 12/20/08,
Lehman Brothers, Inc. | | | 100 | | | | — | |
People of Republic of China
Rate 0.40%, expires 6/20/09, Lehman Brothers, Inc. | | | 200 | | | | (2 | ) |
Radioshack Corp. Rate 0.35%, expires 12/20/08,
Lehman Brothers, Inc. | | | 200 | | | | 1 | |
Republic of Hungary Rate 0.535%, expires 05/20/16
Morgan Stanley | | | 300 | | | | (1 | ) |
See financial notes. 19
Schwab Viewpoints Fund
Portfolio Holdings continued
| | Notional
Amount
(Foreign/USD)
| | Unrealized
Gains/(Losses)
(USD)
|
|---|
Republic of Hungary Rate 0.54%, expires 05/20/16
JPMorgan Chase & Co. | | | 100 | | | | (1 | ) |
Republic of Hungary Rate 0.545%, expires 05/20/16
Deutche Bank | | | 200 | | | | (1 | ) |
Turkey Rate 2.70%,
expires 9/20/10,
Morgan Stanley | | | 100 | | | | (4 | ) |
XL Capital Ltd. Rate 0.205%,
expires 03/20/12,
Barclays Bank plc | | | 100 | | | | — | |
Wal-Mart Stores, Inc. Rate 0.14%, expires 12/20/08,
Citibank N.A. | | | 200 | | | | (1 | ) |
Whirpool Corp. Rate 0.29%, expires 12/20/08,
Lehman Brothers, Inc. | | | 100 | | | | — | |
Net Realized Gains —
Credit Default Swaps | | | | | | | (12 | ) |
Total unrealized gain on swap agreements | | 111 | |
| Net premiums received/paid | | (176 | ) |
| Swap Agreements, at fair value | | (65 | ) |
| | Number of
Contracts
| | Contract
Value
| | Unrealized
Gains/(Losses)
|
|---|
\\nFutures Contracts
|
|---|
| 10 Years, Short, U.S. Treasury Note, expires 12/19/06 | | | (11 | ) | | | (1,190 | ) | | | 1 | |
| 5 Years, Long, U.S. Treasury Note, expires 12/29/06 | | | 31 | | | | 3,272 | | | | 21 | |
| 90 Day Eurodollar, Long expires 12/17/07 | | | 40 | | | | 9,525 | | | | 18 | |
| 90 Day Eurodollar, Long expires 06/18/07 | | | 24 | | | | 5,697 | | | | 13 | |
| 90 Day Eurodollar, Long expires 03/17/08 | | | 15 | | | | 3,573 | | | | 21 | |
| 90 Day Eurodollar, Long expires 09/17/07 | | | 90 | | | | 21,403 | | | | 40 | |
LIBOR, Long
expires 09/19/07 | | | 17 | | | | 3,837 | | | | (4 | ) |
LIBOR, Long
expires 06/20/07 | | | 7 | | | | 1,579 | | | | (2 | ) |
| U. S. Treasury Bond, Long, expires 12/19/06 | | | 6 | | | | 676 | | | | 14 | |
UK Gilt, Long
expires 12/28/06 | | | 1 | | | | 210 | | | | 1 | |
| UK Treasury Bond, Long expires 12/31/07 | | | 13 | | | | 2,935 | | | | 0 | |
| | | | | | | | | | | | 123 | |
20 See financial notes.
Schwab Viewpoints Fund
Portfolio Holdings continued
Expiration Date
| | Currency to
be Received
| | Amount of
Currency to
be Received
($ x 1,000)
| | Currency to
be Delivered
| | Amount of
Currency to
be Delivered
($ x 1,000)
| | Unrealized
Gains/Losses
($ x 1,000)
|
|---|
\\nForward Foreign Currency Contracts
|
|---|
| 12/13/06 | | BRL | | 54 | | | USD | | | 24 | | | | 1 | |
| 11/08/06 | | CLP | | 17,000 | | | USD | | | 31 | | | | 1 | |
| 12/18/06 | | CLP | | 1,900 | | | USD | | | 4 | | | | — | |
| 03/20/07 | | INR | | 1,366 | | | USD | | | 29 | | | | 1 | |
| 11/15/06 | | JPY | | 130,281 | | | USD | | | 1,145 | | | | (29 | ) |
| 11/15/06 | | USD | | 109 | | | JPY | | | 12,559 | | | | 1 | |
| 12/26/06 | | KRW | | 35,300 | | | USD | | | 37 | | | | — | |
| 02/26/07 | | KRW | | 10,559 | | | USD | | | 11 | | | | — | |
| 03/21/07 | | KRW | | 10,769 | | | USD | | | 11 | | | | — | |
| 12/04/06 | | MXN | | 180 | | | USD | | | 16 | | | | — | |
| 01/16/07 | | MXN | | 101 | | | USD | | | 9 | | | | — | |
| 11/24/06 | | PLN | | 67 | | | USD | | | 22 | | | | 1 | |
| 11/30/06 | | USD | | 481 | | | GBP | | | 257 | | | | (9 | ) |
| 01/17/07 | | RUB | | 78 | | | USD | | | 3 | | | | — | |
| 03/15/07 | | RUB | | 276 | | | USD | | | 10 | | | | — | |
| 12/13/06 | | RUB | | 179 | | | USD | | | 7 | | | | — | |
| 03/21/07 | | SGD | | 16 | | | USD | | | 10 | | | | — | |
| 11/27/06 | | SGD | | 45 | | | USD | | | 28 | | | | 1 | |
| 02/26/07 | | TWN | | 301 | | | USD | | | 9 | | | | — | |
| 11/24/06 | | TWN | | 301 | | | USD | | | 9 | | | | — | |
| 05/09/07 | | CNY | | 2,994 | | | USD | | | 390 | | | | (4 | ) |
| 08/16/07 | | CNY | | 3,721 | | | USD | | | 482 | | | | 3 | |
| | | | | | | | | | | | | | | (33 | ) |
See financial notes. 21
Schwab Viewpoints Fund
Statement of
Assets and Liabilities
As of October 31, 2006. All numbers x 1,000 except NAV.
Assets | | | | | | |
| Investments, at value (cost $145,042) | | | | $ | 154,804 | |
| Cash | | | | | 3 | |
| Deposit with broker for short sales | | | | | 9,547 | |
| Foreign currency (cost $120) | | | | | 122 | |
Receivables:
| | | | | | |
| Investments sold | | | | | 16,236 | |
| Investments sold short | | | | | 7,170 | |
| Interest | | | | | 323 | |
| Fund shares sold | | | | | 99 | |
| Dividends | | | | | 73 | |
| Due from brokers for futures | | | | | 51 | |
| Foreign tax reclaims | | | | | 9 | |
| Unrealized gains on forward foreign currency contracts | | | | | 9 | |
| Prepaid expenses | | | | + | 1 | |
Total assets | | | | | 188,447 | |
| |
Liabilities | | | | | | |
| Securities sold short, at value (proceeds $17,041) | | | | | 17,780 | |
| Options written , at value (proceeds $44) | | | | | 73 | |
| Swap agreements, at fair value (cost $176) | | | | | 65 | |
Payables:
| | | | | | |
| Investments bought | | | | | 19,680 | |
| Investment advisers and administrator fees | | | | | 15 | |
| Transfer agent and shareholder services fees | | | | | 30 | |
| Covered short sales | | | | | 562 | |
| Fund shares redeemed | | | | | 13 | |
| Due to brokers for futures | | | | | 5 | |
| Trustee fees | | | | | 1 | |
| Unrealized losses on forward foreign currency contracts | | | | | 42 | |
| Accrued expenses | | | | + | 135 | |
Total liabilities | | | | | 38,401 | |
| |
Net Assets | | | | | | |
Total assets | | | | | 188,447 | |
Total liabilities | | | | | –38,401 | |
Net assets | | | | $ | 150,046 | |
| |
Net Assets by Source | | | | | | |
| Capital received from investors | | | | | 132,865 | |
| Net investment income not yet distributed | | | | | 2,194 | |
| Net realized capital gains | | | | | 5,790 | |
| Net unrealized capital gains | | | | | 9,197 | |
| |
Net Asset Value (NAV) by Shares Class | | | | | | |
Share Class
| | | | Net Assets
| | ÷
| | Shares
Outstanding
| | =
| | NAV
|
|---|
| Investor Shares | | | | $ | 121,811 | | | | | | | | 9,100 | | | | | | | $ | 13.39 | |
| Select Shares | | | | $ | 28,235 | | | | | | | | 2,106 | | | | | | | $ | 13.41 | |
22 See financial notes.
Schwab Viewpoints Fund
Statement of
Operations
For November 1, 2005 through October 31, 2006. All numbers x 1,000.
Investment Income | | | | | | |
| Dividends (net of foreign withholding taxes of $20) | | | | $ | 1,559 | |
| Interest | | | | + | 2,649 | |
Total Investment Income | | | | | 4,208 | |
| |
Net Realized Gains and Losses | | | | | | |
| Net realized gains on investments | | | | | 6,880 | |
| Net realized losses on short sales | | | | | (939 | ) |
| Net realized gains on foreign currency transactions | | | | | 46 | |
| Net realized gains on written option contracts | | | | | 29 | |
| Net realized losses on futures contracts | | | | | (78 | ) |
| Net realized gains on swap agreements | | | | + | 26 | |
Net realized gains | | | | | 5,964 | |
| |
Net Unrealized Gains and Losses | | | | | | |
| Net unrealized gains on investments | | | | | 3,568 | |
| Net unrealized losses on short sales | | | | | (805 | ) |
| Net unrealized gains on foreign currency transactions | | | | | 9 | |
| Net unrealized losses on option contracts | | | | | (37 | ) |
| Net unrealized gains on futures contracts | | | | | 251 | |
| Net unrealized gains on swap agreements | | | | + | 199 | |
Net unrealized gains | | | | | 3,185 | |
| |
Expenses | | | | | | |
| Investment adviser and administrator fees | | | | | 1,108 | |
Transfer agent and shareholder service fees:
| | | | | | |
| Investor Shares | | | | | 325 | |
| Select Shares | | | | | 25 | |
| Custodian fees | | | | | 116 | |
| Registration fees | | | | | 64 | |
| Portfolio accounting fees | | | | | 57 | |
| Professional fees | | | | | 45 | |
| Shareholder reports | | | | | 29 | |
| Trustees’ fees | | | | | 6 | |
| Dividend and interest on short sales | | | | | 13 | |
| Other expenses | | | | + | 11 | |
| Total expenses | | | | | 1,799 | |
| Expense reduction by adviser and Schwab | | | | | –238 | |
| Custodian credits | | | | | –122 | |
Net expenses | | | | | 1,439 | |
| |
Increase in Net Assets from Operations | | | | | | |
Total investment income | | | | | 4,208 | |
Net expenses | | | | | –1,439 | |
Net investment income | | | | | 2,769 | |
Net realized gains | | | | | 5,964 | |
Net unrealized gains | | | | + | 3,185 | |
Increase in net assets from operations | | | | $ | 11,918 | |
See financial notes. 23
Schwab Viewpoints Fund
Statements of
Changes in Net Assets
For the current and prior report periods. All numbers x 1,000.
| | | | 11/1/05–10/31/06
| | 11/1/04–10/31/05
|
|---|
| Net investment income | | | | $ | 2,769 | | | $ | 1,588 | |
| Net realized gains | | | | | 5,964 | | | | 14,477 | |
| Net unrealized gains or losses | | | | + | 3,185 | | | | (4,356 | ) |
Increase in net assets from operations | | | | | 11,918 | | | | 11,709 | |
| |
Distributions Paid | | | | | | | | | | |
Dividends from net investment income | | | | | | | | | | |
| Investor Shares | | | | | 1,595 | | | | 947 | |
| Select Shares | | | | + | 137 | | | | 21 | |
Total dividends from net investment income | | | | | 1,732 | | | | 968 | |
Distributions from net realized gains | | | | | | | | | | |
| Investor Shares | | | | | 3,736 | | | | — | |
| Select Shares | | | | + | 277 | | | | — | |
Total distributions from net realized gains | | | | | 4,013 | | | | — | |
Total distributions | | | | $ | 5,745 | | | $ | 968 | |
Transactions in Fund Shares | | | | | | | | | | | | | | | | | | |
| | | | 11/1/05–10/31/06
| | 11/1/04–10/31/05
| |
|---|
| | | | SHARES
| | VALUE
| | SHARES
| | VALUE
|
|---|
Shares Sold | | | | | | | | | | | | | | | | | | |
| Investor Shares | | | | | 1,613 | | | $ | 20,830 | | | | 1,399 | | | $ | 17,588 | |
| Select Shares | | | | + | 1,710 | | | | 21,953 | | | | 679 | | | | 8,627 | |
Total shares sold | | | | | 3,323 | | | $ | 42,783 | | | | 2,078 | | | $ | 26,215 | |
| |
Shares Reinvested | | | | | | | | | | | | | | | | | | |
| Investor Shares | | | | | 395 | | | $ | 5,034 | | | | 71 | | | $ | 883 | |
| Select Shares | | | | + | 30 | | | | 387 | | | | 2 | | | | 20 | |
Total shares reinvested | | | | | 425 | | | $ | 5,421 | | | | 73 | | | $ | 903 | |
| |
Shares Redeemed | | | | | | | | | | | | | | | | | | |
| Investor Shares | | | | | (3,008 | ) | | $ | (38,807 | ) | | | (2,354 | ) | | $ | (29,691 | ) |
| Select Shares | | | | + | (349 | ) | | | (4,516 | ) | | | (105 | ) | | | (1,307 | ) |
Total shares redeemed | | | | | (3,357 | ) | | $ | (43,323 | ) | | | (2,459 | ) | | $ | (30,998 | ) |
| |
Net transactions in fund shares | | | | | 391 | | | $ | 4,881 | | | | (308 | ) | | $ | (3,880 | ) |
Shares Outstanding and Net Assets | | | | | | | | | | | | | | | | | | |
| | | | 11/1/05–10/31/06
| | 11/1/04–10/31/05
| |
|---|
| | | | SHARES
| | NET ASSETS
| | SHARES
| | NET ASSETS
|
|---|
| Beginning of period | | | | | 10,815 | | | $ | 138,992 | | | | 11,123 | | | $ | 132,131 | |
| Total increase or decrease | | | | + | 391 | | | | 11,054 | | | | (308 | ) | | | 6,861 | |
End of period | | | | | 11,206 | | | $ | 150,046 | | | | 10,815 | | | $ | 138,992 | |
Net investment income not yet distributed | | | | | | | | $ | 2,194 | | | | | | | $ | 1,187 | |
24 See financial notes.
Schwab Viewpoints Fund
Financial Notes
| 1. | | Business Structure of the Funds |
Schwab Viewpoints Fund is a series of Schwab Capital Trust (“Trust”), a no-load, open-end management investment company. The company is organized as a Massachusetts business trust and is registered under the Investment Company Act of 1940, as amended. The list below shows all the funds in the trust including the fund discussed in this report, which is highlighted:
Schwab Capital Trust (organized May 7, 1993)
Schwab Viewpoints Fund™
Schwab S&P 500 Index Fund
Schwab Institutional Select® S&P 500 Fund
Schwab Small-Cap Index Fund®
Schwab Total Stock Market Index Fund®
Schwab International Index Fund®
Schwab MartketTrack All Equity™
Schwab MarketTrack Growth Portfolio™
Schwab MarketTrack Balanced Portfolio™
Schwab MarketTrack Conservative Portfolio™
Laudus U.S. MarketMasters Fund™
Laudus Small-Cap MarketMasters Fund™
Laudus International MarketMasters Fund™ | | Schwab Premier Equity Fund®
Schwab Core Equity Fund™
Schwab Dividend Equity Fund™
Schwab Large-Cap Growth Fund™
Schwab Small-Cap Equity Fund™
Schwab Hedged Equity Fund™
Schwab Financial Services Fund™
Schwab Health Care Fund™
Schwab Technology Fund™
Schwab Target 2010 Fund
Schwab Target 2020 Fund
Schwab Target 2030 Fund
Schwab Target 2040 Fund
Schwab Retirement Income Fund |
Schwab Viewpoints Fund offers two share classes: Investor Shares and Select Shares®. Shares of each class represent interest in the same portfolio, but each class has different expenses and investment minimums.
Shares are bought and sold at net asset value, or NAV, which is the price for all outstanding shares. Each share has a par value of 1/1,000 of a cent, and the trustees may issue as many shares as necessary.
Prior to June 3, 2002, the fund invested in a mix of actively managed mutual funds. The transition to its multi-manager strategy began on June 3, 2002. Also, effective May 1, 2006, the Laudus Balanced MarketMasters Fund was renamed the Schwab Viewpoints Fund.
| 2. | | Significant Accounting Policies: |
The following is a summary of the significant accounting policies in the preparation of its financial statements. The accounting policies are in conformity with accounting principles generally accepted in the United States of America.
The fund values the securities in its portfolio every business day. The fund uses the following policies to value various types of securities:
| • | | Securities traded on an exchange or over-the-counter: valued at the closing value for the day, or, on days when no closing value has been reported, halfway between the most recent bid and asked quotes. Securities that are primarily traded on foreign exchanges are valued at the closing values of such securities on their respective exchanges with these values then translated into U.S. dollars at the current exchange rate. |
| • | | Securities for which no quoted value is available or when a significant event has occurred between the time of the security’s last close and the time the fund calculates net asset value: valued at fair value, as determined in good faith by the fund’s investment adviser using guidelines adopted by the fund’s Board of Trustees and the Pricing Committee. Some of the more common reasons that may necessitate that a security be valued at fair value include: the security’s trading has been halted or suspended; the security has been de-listed from a national exchange; the security’s primary trading market is temporarily closed at a time when under normal conditions it would be open; or the security’s primary pricing source is not able or willing to provide a price, or certain foreign securities’ closing market prices adjusted for changes in value that may occur between the close of foreign exchange and the time at which fund shares are priced. The Board of Trustees regularly reviews fair value determinations made by the Funds pursuant to the procedures. |
| • | | Bonds and notes: valued at halfway between the most recent bid and asked quotes or, if such quotes are unavailable, at prices for securities of comparable maturity, credit quality and type. Valuations for bonds and notes are provided by an independent bond-pricing service. |
25
Schwab Viewpoints Fund
Financial Notes (continued)
2. Significant Accounting Policies (continued):
| • | | Futures and forwards: open contracts are valued at their settlement prices as of the close of their exchanges (for futures) or at a market value based on that day’s exchange rates (for forwards). When a fund closes out a futures or forwards position, it calculates the difference between the value of the position at the beginning and at the end and records a realized gain or loss accordingly. |
| • | | Swap and Swaption (option on Swap) agreements: are valued based on a model that utilizes market data, including swap yield curves, to calculate prices or are based on dealer quotes. |
| • | | Options: open contracts are valued at their last quoted sale price. |
| • | | Short-term securities (60 days or less to maturity): valued at amortized cost. |
| • | | Mutual funds: valued at their respective net asset values as determined by those funds in accordance with the 1940 Act for a given day. |
(b) Portfolio Investments:
Delayed-Delivery: The fund may buy securities on a delayed-delivery basis. In these transactions, the fund agrees to buy a security for a stated price, with settlement generally occurring within two weeks. If the security’s value falls before settlement occurs, the fund could end up paying more for the security than its market value at the time of settlement. The fund has set aside sufficient securities as collateral for those securities bought on a delayed-delivery basis.
Futures Contract: The funds may invest in futures contracts. Futures contracts involve certain risks because they can be very sensitive to market movements.
One risk is that the price of a futures contract may not move in perfect correlation with the price of the underlying securities. Another risk is that, at certain times, it may be impossible for a fund to close out a position in a futures contract, due to a difference in trading hours or to market conditions that may reduce the liquidity for a futures contract or its underlying securities. The potential for losses associated with futures contracts may exceed amounts recorded in the Statement of Assets and Liabilities.
Because futures contracts carry inherent risks, a fund must give the broker a deposit of cash and/or securities (the “initial margin”) whenever it enters into the futures contract. The amount of the deposit may vary from one contract to another, but it is generally a percentage of the contract amount.
Futures are traded publicly on exchanges, and their market value changes daily. A fund records the change in market value of futures, and also the change in the amount of margin deposit required (“due to/from broker”).
Forward Currency Contract: The Schwab Viewpoints Fund may invest in forward currency contracts in connection with the purchase and sale of portfolio securities to minimize the uncertainty of changes in future exchange rates. “Forwards” as they are known, are contracts to buy and sell a currency at a set price on a future date. Forwards are similar to futures except that they are not publicly traded, but are agreements directly between two parties.
As with futures, forwards involve certain risks that are not fully reflected in the fund’s financials. If counter-parties to the contracts or if the value of the foreign currency changes unfavorably, the fund could sustain a loss.
Short Sale: The fund may sell securities short (sell securities it does not own). When it does so, the fund also places assets worth at least 100% of the value of the short securities into a segregated account as collateral. If the market value of the short securities subsequently falls, the fund can realize a gain by closing the position. However, if the value rises, the fund typically would have to add to its collateral or close out its short position at a loss. The potential for losses associated with short positions is much greater than the original value of the securities sold short and exceeds amounts recorded in the Statements of Assets and Liabilities.
Repurchase Agreements: The fund may enter into repurchase agreements. In a repurchase agreement, the fund buys a security from another party (usually a financial institution) with the agreement that it be sold back in the future. The date, price and other conditions are all specified when the agreement is created.
The fund’s repurchase agreements will be fully collateralized by U.S. government securities. All collateral is held by the fund’s custodian (or, with tri-party agreements, the agent’s bank) and is monitored daily to ensure that is market value is at least equal to the repurchase price under the agreement.
26
Schwab Viewpoints Fund
Financial Notes (continued)
2. Significant Accounting Policies (continued):
Swap Agreements: The fund may enter into swap agreements. In an interest rate swap, a fund and a counterparty agree to swap payments that are based on two different rates. The counterparty is typically a large financial institution, and the terms of the swap are specified in advance. For example, a fund may agree that for six months it will pay the counterparty the equivalent of the interest on a given amount invested in LIBOR (the London Interbank Offered Rate). In exchange, the counterparty might agree to pay a fund the equivalent of the same amount invested in a certain bond index during this same six month period.
Swap agreements carry certain risks. Because the net gains or losses stemming from a swap agreement depend on movements of one rate relative to another, a fund could experience unanticipated losses if one or both rates failed to behave as expected. A fund also could lose money if a counterparty failed to honor the terms of the swap agreement.
The Credit Swap or Credit Default Swap is a bilateral financial contract in which one counterparty (the Protection Buyer) pays a periodic fee, typically expressed in basis points on the notional amount, in return for a Contingent Payment by the Protection Seller following a Credit Event of a Reference Entity. The definitions of a Credit Event and the settlement mechanism used to determine the Contingent Payment are flexible and determined by negotiation between the counterparties at the inception of the transaction.
Options: The fund is authorized to write options and purchase put and call options. The risk in writing a call option is that the fund gives up the opportunity for profit if the market price of the security increases. The risk in writing a put option is that the fund may incur a loss if the market price of the security decreases and the option is exercised. The risk in purchasing an option is that a fund pays a premium whether or not the option is exercised. The fund also has the additional risk of being unable to enter into a closing transaction at an acceptable price if a liquid secondary market does not exist.
TBA: The fund may enter into “TBA” (to be announced) purchase commitments to purchase securities for a fixed price at a future date, typically not exceeding 45 days. TBAs may be considered securities in themselves, and involve a risk of loss if the value of the security to be purchased declines prior to settlement date. This risk is in addition to the risk of decline in the fund’s other assets.
(c) | | Security Transactions: |
Security transactions are recorded as of the date the order to buy or sell the security is executed. Realized gains and losses from security transactions are based on the identified costs of the securities involved. Gains and losses from paydowns on mortgage and asset backed securities are recorded as adjustments to interest income.
If the fund sells securities short, it records the proceeds received as an asset and the obligation to buy back the securities as a liability. At the time a short sale is initiated, the asset and liability are of equal value and effectively cancel each other out. Subsequently, the fund values the liability side of the transaction according to the market price of the securities sold short, and values the asset side according to the value of the proceeds. When the fund closes out a short position (buys the security), it records the outcome as a realized gain or loss. Interest and dividends accrued on securities sold short is recorded as an expense on the fund’s records.
Options purchased are recorded as assets and written options are recorded as liabilities to the extent of premiums paid or received. The fund will realize a gain or loss when the option transaction expires or closes. When an option is exercised, the proceeds on sales for a written call option, the purchase cost for a written put option or the cost of a security for a purchased put or call option is adjusted by the amount of the premium received or paid.
Swap premiums paid are recorded as assets and premiums received are recorded as liabilities. The fund begins recording gains and losses on swaps based on the effective date and terms of the swap agreement. Realized gains and losses are recognized on interest rate swaps at the termination or closing of the agreement. Credit Default swaps record gains or losses when a credit event occurs involving the underlying entity.
Interest Income is recorded as it accrues. If the fund buys a debt security at a discount (that is, for less than face value) or a premium (more than face value), it amortizes the discount or premium from the current date to maturity using the effective interest rate method. The fund then increases (in the case of discounts) or reduces (in the case of premiums) the income it records from the security. If the security is callable (meaning that the issuer has the option to pay it off before its maturity
27
Schwab Viewpoints Fund
Financial Notes (continued)
2. Significant Accounting Policies (continued):
date), then the fund amortizes the premium to the security’s call date and price, rather than the maturity date and price. Dividends and distributions from portfolio securities and underlying funds are recorded on the date they are effective (the ex-dividend date), although the funds record certain foreign security dividends on the day they learn of the ex-dividend date.
Expenses that are specific to a fund or a class are charged directly to that fund or class. Expenses that are common to all funds within the trust generally are allocated among the funds in proportion to their average daily net assets.
The net investment income, other than class specific expenses, and the realized and unrealized gains or losses, are allocated daily to each class in proportion to its net assets.
(f) | | Foreign Currency Translations: |
Assets and liabilities denominated in foreign currencies are reported in U.S. dollars. For assets and liabilities held on a given date, the dollar value is based on market exchange rates in effect on that date. Transactions involving foreign currencies, including purchases, sales, income receipts and expense payments, are calculated using exchange rates in effect on the transaction date.
(g) | | Distributions to Shareholders: |
The funds pay dividends from net investment income and make distributions from net realized capital gains once a year.
The fund maintains its own account for purposes of holding assets and accounting, and is considered a separate entity for tax purposes. Within its account, the fund also keeps certain assets in segregated accounts, as may be required by securities law.
Each fund has an arrangement with its custodian bank under which the fund receives a credit for its uninvested cash balance to offset its custody fees and accounting fees. The credit amounts (if any) are disclosed in the statement of operations as a reduction to the fund’s operating expenses.
(i) | | Accounting Estimates: |
The accounting policies described in this report conform with accounting principles generally accepted in the United States of America. Notwithstanding this, shareholders should understand that in order to follow these principles, fund management has to make estimates and assumptions that affect the information reported in the financial statements. It’s possible that once the results are known, they may turn out to be different from these estimates.
(j) | | Federal Income Taxes: |
The funds intend to meet federal income and excise tax requirements for regulated investment companies. Accordingly, the funds distribute substantially all of their net investment income and realized net capital gains (if any) to their respective shareholders each year. As long as a fund meets the tax requirements, it is not required to pay federal income tax.
Under the funds’ organizational documents, the officers and trustees are indemnified against certain liabilities arising out of the performance of their duties to the funds. In addition, in the normal course of business the funds enter into contracts with their vendors and others that provide general indemnifications. The funds’ maximum exposure under these arrangements is unknown as this would involve future claims that may be made against the funds. However, based on experience, the funds expect the risk of loss to be remote.
(l) | | New Accounting Standards: |
Financial Accounting Standards Board Interpretation (FIN) No. 48 — Accounting for Uncertainty in Tax Positions — An Interpretation of SFAS No. 109, was issued in July 2006 and is effective for fiscal years beginning after December 15, 2006. This Interpretation provides new requirements for the recognition, measurement, and disclosure in the financial statements
28
Schwab Viewpoints Fund
Financial Notes (continued)
2. Significant Accounting Policies (continued):
of a tax position taken or expected to be taken in a tax return when there is uncertainty about whether that tax position will ultimately be sustained. We have not yet completed our evaluation of the impact, if any, of adopting FIN 48 on the Fund’s financial statements.
In September 2006, the Financial Accounting Standards Board (FASB) issued Statement of Financial Accounting Standards No. 157, “Fair Value Measurements” (SFAS No. 157). SFAS No. 157 defines fair value, establishes a framework for measuring fair value in accordance with generally accepted accounting principles and expands disclosure about fair value measurements. SFAS No. 157 is effective for fiscal years beginning after November 15, 2007. Management is currently evaluating the impact the adoption of SFAS No. 157 will have on the Fund’s financial statement disclosures.
| 3. | | Affiliates and Affiliated Transactions: |
Charles Schwab Investment Management, Inc. (CSIM or the investment adviser), a wholly owned subsidiary of The Charles Schwab Corporation, serves as the fund’s investment adviser and administrator pursuant to an Investment Advisory and Administration Agreement (Advisory Agreement) between it and the trust. Charles Schwab & Co., Inc. (“Schwab”) is an affiliate of the investment adviser and is the trust’s shareholder services agent and transfer agent.
For its advisory and administrative services to the fund, the investment adviser is entitled to receive an annual fee payable monthly based on the fund’s average daily net assets described as follows:
Average daily net assets
| | | |
|
|---|
| First $500 million | | | | | | | 0.775% | |
| Over $500 million | | | | | | | 0.75% | |
| Over $1 billion | | | | | | | 0.725% | |
For its transfer agent and shareholder services, Schwab is entitled to receive an annual fee payable monthly based on the fund’s average daily net assets described as follows:
| | | | Transfer Agent Fees
|
| Shareholder Service Fees
|
|---|
| Investor Shares | | | | | 0.05 | % | | | 0.20 | % |
| Select Shares | | | | | 0.05 | % | | | 0.15 | % |
Although these agreements specify certain fees for these services, CSIM and Schwab have made additional agreements with the fund to limit the total expenses charged, excluding interest, taxes and certain non-routine expenses through February 27, 2007, as follows:
| Investor Shares | | | | | 1.10 | % |
| Select Shares | | | | | 0.95 | % |
Pursuant to an exemptive order issued by the SEC, the fund may enter into interfund borrowing and lending transactions within the Schwab Funds. All loans are for temporary or emergency purposes only. The interest rate charged on the loan is the average of the overnight repurchase agreement rate and the short-term bank loan rate. The interfund lending facility is subject to the oversight and periodic review of the Board of Trustees of the Schwab Funds. There was no interfund borrowing or lending activity for the fund during the period.
Independent Trustees’
Trustees may include people who are officers and/ or directors of the investment adviser or Schwab. Federal securities law limits the percentage of such “interested persons” who may serve on a trust’s board, and the trust was in compliance with these limitations throughout the report period. The trust did not pay any of these persons for their service as trustees, but it did pay non-interested persons (independent trustees), as noted in the fund’s Statement of Operations.
29
Schwab Viewpoints Fund
Financial Notes (continued)
| 4. | | Purchases and Sales of Investment Securities:
(All dollar amounts are × 1,000) |
For the fiscal year ended October 31, 2006, purchases and sales of securities (excluding short-term obligations, government securities and securities sold short) were as follows:
| | Purchases of
Securities
| | Sales/Maturities
of Securities
| |
|---|
| | | $ | 117,203 | | | $ | 121,868 | | |
For the fiscal year ended October 31, 2006, purchases and sales of long-term government security transactions were as follows:
| | Purchases of
Securities
| | Sales/Maturities
of Securities
| |
|---|
| | | $ | 192,486 | | | $ | 188,611 | | |
| 5. | | Options Written:
(All dollar amounts are × 1,000) |
For the fiscal year ended October 31, 2006, the fund’s swaptions and straddle option activity was as follows:
Options Written
| | Number of
Contracts
|
| Premiums
|
|---|
| Beginning of Period | | | 3 | | | $ | 23 | |
| Options Written | | | 11 | | | | 50 | |
| Options Closed | | | (1 | ) | | | 3 | |
| Options Expired | | | (7 | ) | | | 26 | |
| Options Exercised | | | — | | | | — | |
| End of Period | | | 6 | | | $ | 44 | |
| 6. | | Redemption Fee:
(All dollar amounts are × 1,000) |
The fund may impose a short-term redemption fee on any fund shares that are redeemed or exchanged by a shareholder within a specified number of days of the purchase date. For shares purchased after 4/29/05, the fund charges a redemption fee of 2.00% on shares held 30 days or less. Such amounts are net of the redemption fee proceeds on the Statement of Changes in Net Assets. The redemption fees charged during the current and prior fiscal years were:
| | Current Period
|
| Prior Period
|
|---|
| Investor Shares | | $ | 4 | | | $ | 1 | |
| Select Shares | | $ | — | | | $ | 0 | * |
| * | | Amount is not rounded to $1,000. |
30
Schwab Viewpoints Fund
Financial Notes (continued)
| 7. | | Borrowing:
(All dollar amounts are × 1,000) |
The funds may borrow money from banks and custodians. The funds may obtain temporary bank loans through the trusts to which they belong, to use for meeting shareholder redemptions or for extraordinary or emergency purposes. The trust has custodian overdraft facilities and line of credit arrangements of $150 million and $100 million with State Street Corporation, and Bank of America, N.A., respectively. The funds pay interest on the amounts they borrow at rates that are negotiated periodically.
Amount
Outstanding
at 10/31/06
|
|
|
| Average
Borrowing*
|
| Weighted
Average
Interest
Rate*(%)
|
|---|
| $16 | | | | $ | 464 | | | | 5.37 | % |
| * | | Based on the number of days for which the borrowing is outstanding. |
| 8. | | Federal Income Taxes:
(All dollar amounts are × 1,000) |
As of October 31, 2006, the components of distributable earnings on a tax-basis were as follows:
| Undistributed ordinary income | | | | $ | 2,142 | |
| Undistributed long-term capital gains | | | | | 6,685 | |
| Unrealized appreciation on investments | | | | | 11,484 | |
| Unrealized depreciation on investments | | | | | (2,457 | ) |
| Other net unrealized appreciation/(depreciation) | | | | | (674 | ) |
| Net unrealized appreciation/(depreciation) | | | | | 8,353 | |
The primary difference between book-basis and tax-basis unrealized appreciation or unrealized depreciation of investments is the tax deferral of losses on wash sales.
Capital loss carry forwards may be used to offset future realized capital gains for federal income tax purposes. As of October 31, 2006, the fund had no capital loss carry forwards.
The tax-basis components of distributions paid during the current and prior fiscal years were:
Current period distributions | | | | | | |
| Ordinary income | | | | $ | 1,732 | |
| Long-term capital gains | | | | | 4,013 | |
| Return of capital | | | | | — | |
| |
Prior period distributions | | | | | | |
| Ordinary income | | | | | 968 | |
| Long-term capital gains | | | | | — | |
| Return of capital | | | | | — | |
The permanent book and tax basis differences may result in reclassifications between capital account and other accounts as required. The adjustments will have no impact on net assets or the results of operations. As of October 31, 2006, the funds made the following reclassifications:
| Capital Shares | | | | $ | (1 | ) |
| Undistributed net investment income | | | | $ | (30 | ) |
| Net realized capital gains and losses | | | | $ | 31 | |
31
Schwab Viewpoints Fund
Financial Notes (continued)
Other Federal Tax Information: (Unaudited)
(All dollar amounts are × 1,000)
For corporate shareholders, 84.82% percentage of the fund’s dividend distributions paid during the fiscal year ended October 31, 2006, qualify for the corporate dividends received deduction.
For the fiscal year ended October 31, 2006, the fund designates $1,316 the dividend distributions as qualified dividends for the purpose of the maximum rate under section 1(h)(ii) of the Internal Revenue Code. Shareholders will be notified in January 2007 via IRS form 1099 of the amounts for use in preparing their 2006 income tax return.
32
Report of Independent Registered Public Accounting Firm
To the Board of Trustees and Shareholders of
Schwab Viewpoints Fund
In our opinion, the accompanying statement of assets and liabilities, including the portfolio holdings, and the related statements of operations and of changes in net assets and the financial highlights present fairly, in all material respects, the financial position of Schwab Viewpoints Fund (one of the portfolios constituting Schwab Capital Trust, hereafter referred to as the “Fund”) at October 31, 2006, the results of its operations for the year then ended, the changes in its net assets for each of the two years in the period then ended and the financial highlights for each of the periods presented, in conformity with accounting principles generally accepted in the United States of America. These financial statements and financial highlights (hereafter referred to as “financial statements”) are the responsibility of the Fund’s management; our responsibility is to express an opinion on these financial statements based on our audits. We conducted our audits of these financial statements in accordance with the standards of the Public Company Accounting Oversight Board (United States). Those standards require that we plan and perform the audit to obtain reasonable assurance about whether the financial statements are free of material misstatement. An audit includes examining, on a test basis, evidence supporting the amounts and disclosures in the financial statements, assessing the accounting principles used and significant estimates made by management, and evaluating the overall financial statement presentation. We believe that our audits, which included confirmation of securities at October 31, 2006 by correspondence with the custodian and brokers, provide a reasonable basis for our opinion.
PricewaterhouseCoopers LLP
San Francisco, California
December 14, 2006
33
Investment Advisory and Sub-Advisory Agreement Approval
The Investment Company Act of 1940 (the “1940 Act”) requires that initial approval of, as well as the continuation of, a fund’s investment advisory agreements must be specifically approved (1) by the vote of the trustees or by a vote of the shareholders of the fund, and (2) by the vote of a majority of the trustees who are not parties to the investment advisory agreements or “interested persons” of any party (the “Independent Trustees”), cast in person at a meeting called for the purpose of voting on such approval. In connection with such approvals, the fund’s trustees must request and evaluate, and the investment adviser is required to furnish, such information as may be reasonably necessary to evaluate the terms of the advisory agreements. In addition, the Securities and Exchange Commission (the “SEC”) takes the position that, as part of their fiduciary duties with respect to fund fees, fund boards are required to evaluate the material factors applicable to a decision to approve an investment advisory agreement.
Consistent with these responsibilities, the Board of Trustees (the “Board”) calls and holds one or more meetings each year that are dedicated, in whole or in part, to considering whether to renew the investment advisory agreements between Schwab Capital Trust (the “Trust”) and CSIM, with respect to the fund covered in this annual report, and the individual sub-advisory agreements between CSIM and Harris Associates L.P., TCW Investment Management Company, Gardner Lewis Asset Management L.P. and Pacific Investment Management Company LLC (collectively, the “Sub-Advisors”). Such investment advisory and sub-advisory agreements are collectively referred to herein as the “Agreements”. The trustees also reviewed certain other agreements pursuant to which CSIM provides investment advisory services to certain other registered investment companies. In preparation for the meeting(s), the Board requests and reviews a wide variety of materials provided by CSIM and the Sub-Advisors, including information about their affiliates, personnel and operations. The Board also receives extensive data provided by third parties. This information is in addition to the detailed information about the funds that the Board reviews during the course of each year, including information that relates to fund operations and fund performance. The trustees also receive a memorandum from fund counsel regarding the responsibilities of trustees for the approval of investment advisory contracts. In addition, the Independent Trustees receive advice from independent counsel to the Independent Trustees, meet in executive session outside the presence of fund management and participate in question and answer sessions with representatives of CSIM and the Sub-Advisors, as appropriate. The trustees also discuss with CSIM the funds’ operations and CSIM’s ability, consistent with the “manager of mangers” structure of each of the funds to (i) identify and recommend to the trustees sub-advisors for each fund, (ii) monitor and oversee the performance and investment capabilities of each sub-advisor, and (iii) recommend the replacement of a sub-advisor when appropriate.
The Board, including a majority of the Independent Trustees, considered information specifically relating to the continuance of the Agreements at meetings held on May 2, 2006, May 24, 2006 and June 12, 2006, and approved the renewal of the Agreements for an additional one year term at the meeting held on June 12, 2006. The Board’s approval of the Agreements was based on consideration and evaluation of a variety of specific factors discussed at these meetings and at prior meetings, including:
| 1. | | the nature, extent and quality of the services provided to the funds under the Agreements, including the resources of CSIM and its affiliates, and the Sub-Advisors, dedicated to the funds; |
| 2. | | each fund’s investment performance and how it compared to that of certain other comparable mutual funds; |
| 3. | | each fund’s expenses and how those expenses compared to those of certain other comparable mutual funds and other types of accounts; |
| 4. | | the profitability of CSIM and its affiliates, including Charles Schwab & Co., Inc. (“Schwab”), with respect to each fund, including both direct and indirect benefits accruing to CSIM and its affiliates, as well as the profitability of the Sub-Advisors; and |
| 5. | | the extent to which economies of scale would be realized as the funds grow and whether fee levels in the Agreements reflect those economies of scale for the benefit of fund investors. |
Nature, Extent and Quality of Services. The Board considered the nature, extent and quality of the services provided by CSIM to the funds and the resources of CSIM and its affiliates dedicated to the funds. In this regard, the trustees evaluated, among other things, CSIM’s personnel, experience, track record and compliance program. The information considered by the trustees included specific information concerning changes in the nature, extent and quality of services provided by CSIM since the trustees had last considered approval of the Agreements. The trustees also considered the fact that Schwab’s extensive branch network, Internet access, investment and research tools, telephone services, and array of account features benefit the funds and their shareholders. The trustees also considered Schwab’s excellent reputation as a full service brokerage firm and its overall financial condition. Finally, the trustees
34
considered that the vast majority of the funds’ shareholders are also brokerage clients of Schwab, and that CSIM and its affiliates are uniquely positioned to provide services and support to the funds and such shareholders. The Board also considered the nature, extent and quality of the sub-advisory services provided by the Sub-Advisors to the funds and the resources each dedicates to the funds. In this regard, the trustees evaluated, among other things, each Sub-Advisor’s personnel, experience and compliance program. Following such evaluation, the Board concluded, within the context of its full deliberations, that the nature, extent and quality of services provided by CSIM and the Sub-Advisors to the funds and the resources of CSIM, and its affiliates, and the Sub-Advisors dedicated to the funds supported renewal of the Agreements.
Fund Performance. The Board considered fund performance in determining whether to renew the Agreements. Specifically, the trustees considered each fund’s performance relative to a peer group of other mutual funds and appropriate indices/benchmarks, in light of total return and market trends. As part of this review, the trustees considered the composition of the peer group, selection criteria and the reputation of the third party who prepared the peer group analysis. In evaluating the 68 performance of each fund, the trustees considered both market risk and shareholder risk expectations for such fund and the appropriateness of the benchmark used to compare the performance of each fund. In addition, the trustees considered whether irrespective of relative performance, each Sub-Advisor’s absolute performance was consistent with expectations for such Sub-Advisor’s unique investment methodology. The trustees further considered the level of fund performance in the context of its review of fund expenses and adviser profitability discussed below. Following such evaluation the Board concluded, within the context of its full deliberations, that the performance of the funds supported renewal of the Agreements.
Fund Expenses. With respect to the funds’ expenses, the trustees considered the rate of compensation called for by the Agreements, and each fund’s net operating expense ratio, in each case, in comparison to those of other comparable mutual funds, such peer groups and comparisons having been selected and calculated by an independent third party. The trustees considered the effects of CSIM’s and Schwab’s historical practice of voluntarily waiving management and other fees to prevent total fund expenses from exceeding a specified cap. The trustees also considered fees charged by CSIM and the Sub-Advisors to other similarly managed mutual funds, and other types of accounts, such as separate accounts, pooled vehicles and wrap accounts, but, with respect to such other types of accounts, accorded less weight to such comparisons due to the different legal, regulatory, compliance and operating features of mutual funds as compared to these other types of accounts. Following such evaluation, the Board concluded, within the context of its full deliberations, that the expenses of the funds are reasonable and supported renewal of the Agreements.
Profitability. With regard to profitability, the trustees considered the compensation flowing to CSIM and its affiliates, directly or indirectly and the compensation flowing to the Sub-Advisors, directly or indirectly. In this connection, the trustees reviewed management’s profitability analyses, together with certain commentary thereon from an independent accounting firm. The trustees also considered any other benefits derived by CSIM and the Sub-Advisors from their relationship with the funds, such as whether, by virtue of its management of the funds, CSIM or any Sub-Advisor obtains investment information or other research resources that aid it in providing advisory services to other clients. The trustees considered whether the varied levels of compensation and profitability under the Agreements and other service agreements were reasonable and justified in light of the quality of all services rendered to each fund by CSIM and the Sub-Advisors and their respective affiliates. The Board also considered the profitability of the Sub-Advisors with respect to the sub-advisory services they provide to the funds, although, when doing so, the Board took into account the fact that the Sub-Advisors are compensated by CSIM, and not by the funds directly, and such compensation with respect to any Sub-Advisor reflects an arms-length negotiation between the Sub-Advisor and CSIM. In addition, the Board considered information relating to changes to CSIM’s cost structure, including cost savings, technology investments and increased operating efficiencies and how these changes affected CSIM’s profitability under the Agreements. Based on this evaluation, the Board concluded, within the context of its full deliberations, that the profitability of CSIM and the Sub Advisors is reasonable and supported renewal of the Agreements.
Economies of Scale. The trustees considered the existence of any economies of scale and whether those are passed along to a fund’s shareholders through a graduated investment advisory fee schedule or other means, including any fee waivers by CSIM and its affiliates. In this regard, and consistent with their consideration of fund expenses, the trustees considered that CSIM and Schwab have previously committed resources to minimize the effects on shareholders of diseconomies of scale during periods when fund assets were relatively small through their contractual expense waivers. For example, such diseconomies of scale may particularly affect newer funds or funds with investment strategies that are from time to time out of favor, but shareholders may benefit from the continued availability of such funds at subsidized expense levels. The trustees also
35
considered CSIM’s agreement to contractual investment advisory fee schedules that include lower fees at higher graduated asset levels. The Board also considered certain commitments by CSIM and Schwab that are designed to pass along potential economies of scale to fund shareholders. Specifically, the Board considered CSIM and Schwab’s commitments, which may be changed only with Board approval: (i) to reduce contractual advisory fees or add breakpoints for certain funds, and (ii) to implement, by means of expense limitation agreement, reductions in net overall expenses for certain funds. Based on this evaluation, and in consideration of the commitments made by CSIM and Schwab as discussed above, the Board concluded, within the context of its full deliberations, that the funds obtain reasonable benefit from economies of scale.
In the course of their deliberations, the trustees did not identify any particular information or factor that was all-important or controlling. Based on the trustees’ deliberation and their evaluation of the information described above, the Board, including all of the Independent Trustees, unanimously approved the continuation of the Agreements and concluded that the compensation under the Agreements is fair and reasonable in light of such services and expenses and such other matters as the trustees have considered to be relevant in the exercise of their reasonable judgment.
36
Trustees and Officers
The tables below gives information about the trustees and officers for The Schwab Capital Trust, which includes the funds covered in this report. The “Fund Complex” includes The Charles Schwab Family of Funds, Schwab Capital Trust, Schwab Investments, Schwab Annuity Portfolios, Laudus Trust, Laudus Variable Insurance Trust, Excelsior Funds, Inc., Excelsior Tax-Exempt Funds, Inc., and Excelsior Funds Trust. As of October 31, 2006, the Fund Complex included 96 funds.
The address for all trustees and officers is 101 Montgomery Street, San Francisco, CA 94104. You can find more information about the trustees and officers in the Statement of Additional Information, which is available free by calling 1-800-435-4000.
Independent Trustees |
Name, Year of Birth,
and Position(s) with
the Trust; (Term of
Office, and Length of
Time Served1) | | | | Principal Occupations
During the Past Five Years | | Number of
Portfolios in
Fund Complex
Overseen by
the Trustee | | Other Directorships |
Mariann Byerwalter
1960
Trustee
(Trustee of Schwab Capital Trust since 2000.) | | | | Chairman of JDN Corporate Advisory LLC. From 1996 to 2001, Vice President for Business Affairs and Chief Financial Officer of Stanford University, and in 2001, Special Advisor to the President of Stanford University. | | 96 | | Board 1—Director, Redwood Trust, Inc.
Board 2—Director, PMI Group, Inc. |
Donald F. Dorward
1931
Trustee
(Trustee of Schwab Capital Trust since 1989.) | | | | Chief Executive Officer, Dorward & Associates (corporate management, marketing and communications consulting firm). From 1996–1999, Executive Vice President and Managing Director, Grey Advertising. Prior to 1996, President and Chief Executive Officer, Allen & Dorward Advertising. | | 57 | | None. |
William A. Hasler
1941
Trustee
(Trustee of Schwab Capital Trust since 2000.) | | | | Retired. Dean Emeritus, Haas School of Business, University of California, Berkeley. Until February 2004, Co-Chief Executive Officer, Aphton Corp. (bio-pharmaceuticals). Prior to August 1998, Dean of the Haas School of Business, University of California, Berkeley (higher education). | | 96 | | Board 1—Director, Aphton Corp.
Board 2—Director, Mission West Properties
Board 3—Director, TOUSA
Board 4—Director, Stratex Networks
Board 5—Director, Genitope Corp.
Board 6—Director & Non-Executive
Chairman, Solectron Corp.
Board 7—Director, Ditech
Communications Corp. |
Robert G. Holmes
1931
Trustee
(Trustee of Schwab Capital Trust since 1989.) | | | | Chairman, Chief Executive Officer and Director, Semloh Financial, Inc. (international financial services and investment
advisory firm). | | 57 | | None. |
Gerald B. Smith
1950
Trustee
(Trustee of Schwab Capital Trust since 2000.) | | | | Chairman and Chief Executive Officer and founder of Smith Graham & Co.
(investment advisors). | | 57 | | Board 1—Board of Cooper Industries
Board 2—Chairman of the Audit Committee
of Northern Border Partners, M.L.P. |
37
Independent Trustees continued |
Name, Year of Birth,
and Position(s) with
the Trust; (Term of
Office, and Length of
Time Served1) | | | | Principal Occupations
During the Past Five Years | | Number of
Portfolios in
Fund Complex
Overseen by
the Trustee | | Other Directorships |
Donald R. Stephens
1938
Trustee
(Trustee of Schwab Capital Trust since 1989.) | | | | Managing Partner, D.R. Stephens & Company (investments). Prior to 1996, Chairman and Chief Executive Officer of North American Trust (real estate
investment trust). | | 57 | | None. |
Michael W. Wilsey
1943
Trustee
(Trustee of Schwab Capital Trust since 1989.) | | | | Chairman and Chief Executive Officer, Wilsey Bennett, Inc. (real estate investment and management, and other investments). | | 57 | | None. |
Interested Trustees |
Name, Year of Birth,
and Position(s) with
the Trust; (Term of
Office, and Length of
Time Served1) | | | | Principal Occupations
During the Past Five Years | | Number of
Portfolios in
Fund Complex
Overseen by
the Trustee | | Other Directorships |
Charles R. Schwab2
1937
Chairman and Trustee
(Chairman and Trustee
of Schwab Capital Trust
since 1989.) | | | | Chairman, Chief Executive Officer and Director, The Charles Schwab Corporation, Charles Schwab & Co., Inc.; Chairman and Director, Charles Schwab Investment Management, Inc., Charles Schwab Bank, N. A.; Chairman and Chief Executive Officer, Schwab (SIS) Holdings Inc. I, Schwab International Holdings, Inc.; Chief Executive Officer and Director, Schwab Holdings, Inc.; Director, U.S. Trust Company, N. A., U.S. Trust Corporation, United States Trust Company of New York. Until May 2003, Co-Chief Executive Officer, The Charles Schwab Corporation. | | 57 | | None. |
Randall W. Merk2
1954
Trustee
(Trustee of Schwab Capital Trust since 2005.) | | | | Executive Vice President and President, Schwab Financial Products, Charles Schwab & Co., Inc.; Director, Charles Schwab Asset Management (Ireland) Limited and Charles Schwab Worldwide Funds PLC. From September 2002 to July 2004, Chief Executive Officer and President, Charles Schwab Investment Management, Inc. and Executive Vice President, Charles Schwab & Co., Inc. Prior to September 2002, President and Chief Investment Officer, American Century Investment Management, and Director, American Century Companies, Inc. | | 96 | | None. |
38
| | | |
Officers of the Trust |
Name, Year of Birth, and Position(s)
with the Trust; (Term of Office, and
Length of Time Served3) | | | | Principal Occupations During the Past Five Years |
Evelyn Dilsaver
1955
President and Chief Executive Officer
(Officer of Schwab Capital Trust since 2004.) | | | | President, Chief Executive Officer, and Director, Charles Schwab Investment Management, Inc.; Executive Vice President, Charles Schwab & Co., Inc; President and Chief Executive Officer, Laudus Trust and Laudus Variable Insurance Trust; President, Excelsior Funds Inc., Excelsior Tax-Exempt Funds, Inc., and Excelsior Funds Trust; President, Mutual Fund Division, UST Advisers, Inc. From June 2003 to July 2004, Senior Vice President, Asset Management Products and Services, Charles Schwab & Co., Inc. Prior to June 2003, Executive Vice President, Chief Financial Officer, and Chief Administrative Officer, U.S. Trust, a subsidiary of The Charles Schwab Corporation. |
George Pereira
1964
Treasurer and Principal Financial Officer
(Officer of Schwab Capital Trust since 2004.) | | | | Senior Vice President and Chief Financial Officer, Charles Schwab Investment Management, Inc.; Chief Financial Officer, Laudus Trust and Laudus Variable Insurance Trust; Treasurer, Chief Financial Officer and Chief Accounting Officer, Excelsior Funds Inc., Excelsior Tax-Exempt Funds, Inc., and Excelsior Funds Trust; Chief Financial Officer, Mutual Fund Division, UST Advisors, Inc. Director, Charles Schwab Worldwide Fund, PLC and Charles Schwab Asset Management (Ireland) Limited. From December 1999 to November 2004, Sr. Vice President, Financial Reporting, Charles Schwab & Co., Inc. |
Kimon Daifotis
1959
Senior Vice President and Chief
Investment Officer — Fixed Income
(Officer of Schwab Capital Trust since 2004.) | | | | Senior Vice President and Chief Investment Officer — Fixed Income, Charles Schwab Investment Management, Inc. Prior to 2004, Vice President and Sr. Portfolio Manager, Charles Schwab Investment Management, Inc. |
Jeffrey Mortimer
1963
Senior Vice President and Chief
Investment Officer — Equities
(Officer of Schwab Capital Trust since 2004.) | | | | Senior Vice President and Chief Investment Officer — Equities, Charles Schwab Investment Management, Inc.; Vice President and Chief Investment Officer, Laudus Trust and Laudus Variable Insurance Trust. Prior to 2004, Vice President and Sr. Portfolio Manager, Charles Schwab Investment Management, Inc. |
Randall Fillmore
1960
Chief Compliance Officer and AML Officer
(Officer of Schwab Capital Trust since 2002.) | | | | Senior Vice President and Chief Compliance Officer, Charles Schwab Investment Management, Inc.; Senior Vice President Charles Schwab & Co., Inc.; Chief Compliance Officer, Laudus Trust and Laudus Variable Insurance Trust; Chief Compliance Officer, Excelsior Funds Inc., Excelsior Tax-Exempt Funds, Inc., and Excelsior Funds Trust. From 2002 to 2003, Vice President, Charles Schwab & Co., Inc., and Charles Schwab Investment Management, Inc. From 2000 to 2002, Vice President, Internal Audit, Charles Schwab & Co., Inc. |
Koji E. Felton
1961
Secretary and Chief Legal Officer
(Officer of Schwab Capital Trust since 1998.) | | | | Senior Vice President, Chief Counsel and Corporate Secretary, Charles Schwab Investment Management, Inc.; Senior Vice President and Deputy General Counsel, Charles Schwab & Co., Inc.; Chief Legal Officer, Laudus Trust and Laudus Variable Insurance Trust; Chief Legal Officer, Excelsior Funds Inc., Excelsior Tax-Exempt Funds, Inc., and Excelsior Funds Trust. Prior to June 1998, Branch Chief in Enforcement at U.S. Securities and Exchange Commission in San Francisco. |
Catherine MacGregor
1964
Vice President
(Officer of Schwab Capital Trust since 2005) | | | | Vice President, Charles Schwab & Co., Inc., Charles Schwab
Investment Management, Inc., Laudus Trust and Laudus Variable Insurance Trust; since 2006, Chief Counsel, Laudus Trust and Laudus Variable Insurance Trust. Until July 2005, Senior Associate, Paul Hastings Janofsky & Walker LLP. |
39
Officers of the Trust |
Name, Year of Birth, and Position(s)
with the Trust; (Term of Office, and
Length of Time Served3) | | | | Principal Occupations During the Past Five Years |
Cathy Sabo
1964
Vice President
(Officer of Schwab Capital Trust since 2005) | | | | Vice President, Compliance, Charles Schwab Investment Management, Inc., Laudus Trust and Laudus Variable Insurance Trust. Until 2004, Vice President, Client, Sales & Services Controls, Charles Schwab & Co., Inc. |
Michael Haydel
1972
Vice President
(Officer of Schwab Capital Trust since 2006) | | | | Vice President, Asset Management Client Services, Charles Schwab & Co., Inc.; Vice President and AML Officer, Laudus Trust and Laudus Variable Insurance Trust. Until March 2004, Director Charles Schwab & Co., Inc. |
1Trustees remain in office until they resign, retire or are removed by shareholder vote. The Schwab Funds retirement policy requires that independent trustees elected after January 1, 2000 retire at age 72 or after twenty years of service as a trustee, whichever comes first. Independent trustees elected prior to January 1, 2000 will retire on the following schedule: Messrs. Holmes and Dorward will retire on December 31, 2007, and Messrs. Stephens and Wilsey will retire on December 31, 2010.
2In addition to their employment with the investment adviser and the distributor, Messrs. Schwab and Merk also own stock of The Charles Schwab Corporation. Mr. Schwab and Mr. Merk are Interested Trustees because they are employees of Schwab and/or the adviser.
3The President, Treasurer and Secretary hold office until their respective successors are chosen and qualified or until he or she sooner dies, resigns, is removed or becomes disqualified. Each other officer serves at the pleasure of the Board.
40
Glossary
asset allocation The practice of dividing a portfolio among different asset classes, with each asset class assigned a particular percentage.
asset class A group of securities with similar structure and basic characteristics. Stocks, bonds and cash are the three main examples of asset classes.
beta A historical measure of an investment’s volatility relative to a market index (usually the S&P 500®). The index is defined as having a beta of 1.00. Investments with a beta higher than 1.00 have been more volatile than the index; those with a beta of less than 1.00 have been less volatile.
bond A security representing a loan from the investor to the issuer. A bond typically pays interest at a fixed rate (the “coupon rate”) until a specified date (the “maturity date”), at which time the issuer returns the money borrowed (“principal” or “face value”) to the bondholder. Because of their structure, bonds are sometimes called “fixed income securities” or “debt securities.”
An individual bond is subject to the credit risk of the issuer. Changes in interest rates can affect a bond’s market value prior to call or maturity. There is no guarantee that a bond’s yield to call or maturity will provide a positive return over the rate of inflation.
bond fund A bond fund is subject to the same credit, interest rate, and inflation risks as bonds. In addition, a bond fund incurs ongoing fees and expenses. A bond fund’s net asset value will fluctuate with the price of the underlying bonds and the portfolio turnover activity; return of principal is not guaranteed.
cap, capitalization See “market cap.”
capital gain, capital loss The difference between the amount paid for an investment and its value at a later time. If the investment has been sold, the capital gain or loss is considered a realized gain or loss. If the investment is still held, the gain or loss is still “on paper” and is considered unrealized.
earnings growth rate For a mutual fund, the average yearly rate at which the earnings of the companies in the fund’s portfolio have grown, measured over the past five years.
earnings per share (EPS) A company’s earnings, or net income, for the past 12 months, divided by the number of shares outstanding.
expense ratio The amount that is taken from a mutual fund’s assets each year to cover the fund’s operating expenses. An expense ratio of 0.50% means that a fund’s expenses amount to half of one percent of its average net assets a year.
market cap, market capitalization The value of a company as determined by the total value of all shares of its stock outstanding.
median market cap The midpoint of the range of market caps of the stocks held by a fund. There are different ways of calculating median market cap. With a simple median, half of the stocks in the fund’s portfolio would be larger than the median, and half would be smaller. With a weighted median (the type that is calculated for these funds), half of the fund’s assets are invested in stocks that are larger than the median market cap, and half in stocks that are smaller.
net asset value (NAV) The value of one share of a mutual fund. NAV is calculated by taking the fund’s total assets, subtracting liabilities, and dividing by the number of shares outstanding.
outstanding shares, shares outstanding When speaking of a company or mutual fund, indicates all shares currently held by investors.
price-to-book ratio (P/B) The market price of a company’s stock compared with its “book value.” A mutual fund’s P/B is the weighted average of the P/B of all stocks in the fund’s portfolio.
price-to-earnings ratio (P/E) The market price of a company’s stock compared with earnings over the past year. A mutual fund’s P/E is the weighted average of the P/E of all stocks in the fund’s portfolio.
return on equity (ROE) The average yearly rate of return for each dollar of investors’ money, measured over the past five years.
stock A share of ownership, or equity, in the issuing company.
total return The percentage that an investor would have earned or lost on an investment in the fund assuming dividends and distributions were reinvested.
weighted average For mutual funds, an average that gives the same weight to each security as the security represents in the fund’s portfolio.
yield The income paid out by an investment, expressed as a percentage of the investment’s market value.
The industry/sector classification of the funds’ portfolio holdings uses the Global Industry Classification Standard (GICS) which was developed by and is the exclusive property of Morgan Stanley Capital International Inc. and Standard & Poor’s. GICS is a service mark of MSCI and S&P and has been licensed for use by Charles Schwab & Co., Inc.
41
Notes
Notes
Notes
Schwab Funds® offers you an extensive family of mutual funds, each one based on a clearly defined investment approach and using disciplined management strategies. The list at right shows all currently available Schwab Funds.
Whether you’re an experienced investor or just starting out, Schwab Funds can help you achieve your financial goals. An investor should consider a fund’s investment objectives, risks, and charges and expenses carefully before investing or sending money. This and other important information can be found in the fund’s prospectus. Please call 1-800-435-4000 for a prospectus and brochure for any Schwab Fund. Please read the prospectus carefully before you invest. This report must be preceded or accompanied by a current prospectus.
Proxy Voting Policies, Procedures and Results
A description of the proxy voting policies and procedures used to determine how to vote proxies on behalf of the funds is available without charge, upon request, by visiting Schwab’s website at www.schwab.com/schwabfunds, the SEC’s website at www.sec.gov, or by contacting Schwab Funds at 1-800-435-4000.
Information regarding how a fund voted proxies relating to portfolio securities during the most recent twelve-month period ended June 30 is available, without charge, by visiting Schwab’s website at www.schwab.com/schwabfunds or the SEC’s website at www.sec.gov.
The Schwab Funds Family®
Stock Funds
Schwab Premier Equity Fund®
Schwab Core Equity Fund™
Schwab Dividend Equity Fund™
Schwab Large-Cap Growth Fund™
Schwab Small-Cap Equity Fund™
Schwab Hedged Equity Fund™
Schwab Financial Services Fund™
Schwab Health Care Fund™
Schwab Technology Fund™
Schwab Institutional Select® S&P 500 Fund
Schwab S&P 500 Index Fund
Schwab 1000 Index® Fund
Schwab Small-Cap Index Fund®
Schwab Total Stock Market Index Fund®
Schwab International Index Fund®
Asset Allocation Funds
Schwab Viewpoints Fund™
Schwab MarketTrack All Equity Portfolio™
Schwab MarketTrack Growth Portfolio™
Schwab MarketTrack Balanced Portfolio™
Schwab MarketTrack Conservative Portfolio™
Schwab Target 2010 Fund
Schwab Target 2020 Fund
Schwab Target 2030 Fund
Schwab Target 2040 Fund
Schwab Retirement Income Fund
Bond Funds
Schwab YieldPlus Fund®
Schwab Short-Term Bond Market Fund™
Schwab Total Bond Market Fund™
Schwab GNMA Fund™
Schwab Inflation Protected Fund™
Schwab Tax-Free YieldPlus Fund™
Schwab Short/Intermediate Tax-Free Bond Fund™
Schwab Long-Term Tax-Free Bond Fund™
Schwab California Tax-Free YieldPlus Fund™
Schwab California Short/Intermediate
Tax-Free Bond Fund™
Schwab California Long-Term Tax-Free Bond Fund™
Schwab Money Funds
Schwab offers an array of money market funds that seek high current income consistent with safety and liquidity.1 Choose from taxable or tax-advantaged alternatives. Many can be linked to your eligible Schwab account to “sweep” cash balances automatically, subject to availability, when you’re between investments. Or, for your larger cash reserves, choose one of our Value Advantage Investments®.
1Investments in money market funds are neither insured nor guaranteed by the Federal Deposit Insurance Corporation (FDIC) or any other government agency and, although they seek to preserve the value of your investment at $1 per share, it is possible to lose money.
Investment Adviser
Charles Schwab Investment Management, Inc.
101 Montgomery Street, San Francisco, CA 94104
Funds
Schwab Funds®
P.O. Box 3812, Englewood, CO 80155—3812
This report is not authorized for distribution to prospective investors unless preceded or accompanied by a current prospectus.
© 2006 Charles Schwab & Co., Inc. All rights reserved.
Member SIPC
Printed on recycled paper.
MFR36112-00
Item 2: Code of Ethics.
| (a) | | Registrant has adopted a code of ethics that applies to its principal executive officer, principal financial officer, and any other persons who perform a similar function, regardless of whether these individuals are employed by Registrant or a third party. |
| |
| (c) | | During the period covered by the report, no amendments were made to the provisions of this code of ethics. |
| |
| (d) | | During the period covered by the report, Registrant did not grant any waivers, including implicit waivers, from the provisions of this code of ethics. |
| |
| (f)(1) | | Registrant has filed this code of ethics as an exhibit pursuant to Item 12(a)(1) of Form N-CSR. |
Item 3: Audit Committee Financial Expert.
Registrant’s Board of Trustees has determined that William Hasler, Mariann Byerwalter and Donald Stephens, currently serving on its audit committee, are “audit committee financial experts,” as such term is defined in Item 3 of Form N-CSR. Each of these members of Registrant’s audit committee is “independent” under the standards set forth in Item 3 of Form N-CSR.
The designation of each of Messrs. Hasler and Stephens and Ms. Byerwalter as an “audit committee financial expert” pursuant to Item 3 of Form N-CSR does not (i) impose upon such individual any duties, obligations, or liability that are greater than the duties, obligations and liability imposed upon such individual as a member of Registrant’s audit committee or Board of Trustees in the absence of such designation; and (ii) affect the duties, obligations or liability of any other member of Registrant’s audit committee or Board of Trustees.
Item 4: Principal Accountant Fees and Services.
(a) Below are the aggregate fees billed for each of the last two fiscal years for professional services rendered by the principal accountant for the audit of Registrant’s annual financial statements or services that are normally provided by the accountant in connection with statutory and regulatory filings or engagements.
Audit Fees
2006: $816,200 2005: $691,777
(b) Below are the aggregate fees billed in each of the last two fiscal years for assurance and related services by the principal accountant that are reasonably related to the performance of the audit of Registrant’s financial statements and are not reported under paragraph (a) above.
Audit-Related Fees
For services rendered to Registrant:
2006: $51,331 2005: $52,814
Nature of these services: tax provision review and procedures performed related to Registrant’s service provider conversion.
In each of the last two fiscal years there were no “Audit-Related Fees” required to be approved pursuant to paragraph (c)(7)(ii) of Rule 2-01 of Regulation S-X.
(c) Below are the aggregate fees billed in each of the last two fiscal years for professional services rendered by the principal accountant for tax compliance, tax advice, and tax planning.
Tax Fees
For services rendered to Registrant:
2006: $66,642 2005: $79,220
Nature of these services: preparation and review of tax returns.
In each of the last two fiscal years there were no “Tax Fees” required to be approved pursuant to paragraph (c)(7)(ii) of Rule 2-01 of Regulation S-X.
(d) Below are the aggregate fees billed in each of the last two fiscal years for products and services provided by the principal accountant, other than the services reported in paragraphs (a) through (c) above.
All Other Fees
For services rendered to Registrant:
2006: $12,054 2005: $12,054
| |
| Nature of these services: | review of the methodology of allocation of Charles Schwab & Co., Inc. (“Schwab”) expenses for purposes
of Section 15(c) of the Investment Company Act of 1940. |
In each of the last two fiscal years there were no “All Other Fees” required to be approved pursuant to paragraph (c)(7)(ii) of Rule 2-01 of Regulation S-X.
(e)(1) Registrant’s audit committee does not have pre-approval policies and procedures as described in paragraph (c)(7) of Rule 2-01 of Regulation S-X.
(2) The percentage of services described in paragraph (c) of this Item that were approved by the audit committee in 2005 pursuant to paragraph (c)(7)(i)(C) of Rule 2-01 of Regulation S-X was 10.6% and the dollar amount was $10,901. This $10,901 equals 1.2% of the total fees paid by Registrant to its principal accountant in 2005. None of the services described in paragraphs (b) and (d) of this Item were approved pursuant to paragraph (c)(7)(i)(C) of Rule 2-01 of Regulation S-X.
(f) Not applicable.
(g) Below are the aggregate non-audit fees billed in each of the last two fiscal years by Registrant’s principal accountant for services rendered to Registrant, to Registrant’s investment adviser, and to any entity controlling, controlled by, or under common control with Registrant’s investment adviser that provides ongoing services to Registrant.
2006: $282,520 2005: $307,941
Although not required to be included in the amounts disclosed under this paragraph (g) or any other paragraph of this Item 4, below are the aggregate fees billed in each of the last two fiscal years by Registrant’s principal accountant for tax compliance services rendered to U.S. Trust, an entity under common control with Registrant’s investment adviser that does not provide services to Registrant.
2006: $4,176,023 2005: $4,058,364
| | (h) | | During the past fiscal year, all non-audit services provided by Registrant’s principal accountant to either Registrant’s investment adviser or to any entity controlling, controlled by, or under common control with Registrant’s investment adviser that provides ongoing services to Registrant were pre-approved. Included in the audit committee’s pre-approval was the review and consideration as to whether the provision of these non-audit services is compatible with maintaining the principal accountant’s independence. |
Item 5: Audit Committee of Listed Registrants.
Not applicable.
Item 6: Schedule of Investments.
Except as noted below, the schedules of investments are included as part of the report to shareholders filed under Item 1 of this Form. The schedules of investments for the Schwab S&P 500 Index Fund, Schwab Institutional Select ® S&P 500 Fund, Schwab Small-Cap Index Fund, Schwab Total Stock Market Index Fund and Schwab International Index Fund are filed under this Item.
Schwab S&P 500 Index Fund
Portfolio Holdings as of October 31, 2006
This section shows all the securities in the fund’s portfolio and their value as of the report date.
The fund files its complete schedule of portfolio holdings with the SEC for the first and third quarters of each fiscal year on Form N-Q. The fund’s Form N-Q is available on the SEC’s website at http://www.sec.gov and may be viewed and copied at the SEC’s Public Reference Room in Washington, D.C. Call 1-800-SEC-0330 for information on the operation of the Public Reference Room. The schedule of portfolio holdings filed on a fund’s most recent Form N-Q is also available by visiting Schwab’s website at www.schwab.com/schwabfunds.
| | | | | | | | | | | | | |
| | | | | | | Cost | | | Value | |
| Holdings by Category | | ($ x 1,000) | | | ($ x 1,000) | |
| |
| 99.9 | % | | Common Stock | | | 5,588,418 | | | | 7,950,692 | |
| 0.1 | % | | Short-Term Investment | | | 8,212 | | | | 8,212 | |
| — | % | | U.S. Treasury Obligation | | | 2,983 | | | | 2,983 | |
| |
| 100.0 | % | | Total Investments | | | 5,599,613 | | | | 7,961,887 | |
| 1.6 | % | | Collateral Invested for Securities on Loan | | | 128,448 | | | | 128,448 | |
| (1.6) | % | | Other Assets and Liabilities, Net | | | | | | | (125,539 | ) |
| |
| 100.0 | % | | Net Assets | | | | | | | 7,964,796 | |
| | | | | | | | | |
| | | Number of | | | Value | |
| Security | | Shares | | | ($ x 1,000) | |
| | | | | | | | | |
Common Stock 99.9% of net assets | | | | | | | | |
| | | | | | | | | |
Automobiles & Components 0.6% | | | | | | | | |
| |
| Ford Motor Co. | | | 1,201,277 | | | | 9,946 | |
General Motors Corp. (a) | | | 364,825 | | | | 12,740 | |
| Harley-Davidson, Inc. | | | 171,945 | | | | 11,800 | |
| Johnson Controls, Inc. | | | 124,684 | | | | 10,167 | |
The Goodyear Tire & Rubber Co. (a)* | | | 107,696 | | | | 1,651 | |
| | | | | | | | |
| | | | | | | | 46,304 | |
| | | | | | | | | |
Banks 5.7% | | | | | | | | |
| |
| AmSouth Bancorp | | | 220,977 | | | | 6,678 | |
| BB&T Corp. | | | 352,216 | | | | 15,328 | |
| Comerica, Inc. | | | 113,108 | | | | 6,582 | |
Commerce Bancorp, Inc. (a) | | | 98,200 | | | | 3,429 | |
| Compass Bancshares, Inc. | | | 83,451 | | | | 4,695 | |
| Countrywide Financial Corp. | | | 388,015 | | | | 14,791 | |
| Fannie Mae | | | 619,831 | | | | 36,731 | |
| Fifth Third Bancorp | | | 356,325 | | | | 14,200 | |
| First Horizon National Corp. | | | 73,806 | | | | 2,902 | |
| Freddie Mac | | | 442,564 | | | | 30,532 | |
Huntington Bancshares, Inc. (a) | | | 153,126 | | | | 3,738 | |
| KeyCorp | | | 268,955 | | | | 9,989 | |
| M&T Bank Corp. | | | 50,455 | | | | 6,146 | |
| Marshall & Ilsley Corp. | | | 144,183 | | | | 6,912 | |
| MGIC Investment Corp. | | | 50,120 | | | | 2,945 | |
| National City Corp. | | | 367,523 | | | | 13,690 | |
| North Fork Bancorp, Inc. | | | 294,378 | | | | 8,413 | |
| PNC Financial Services Group, Inc. | | | 196,711 | | | | 13,776 | |
| Regions Financial Corp. | | | 308,124 | | | | 11,693 | |
| Sovereign Bancorp, Inc. | | | 233,282 | | | | 5,566 | |
| SunTrust Banks, Inc. | | | 232,836 | | | | 18,392 | |
| Synovus Financial Corp. | | | 202,697 | | | | 5,955 | |
| U.S. Bancorp | | | 1,139,832 | | | | 38,572 | |
| Wachovia Corp. | | | 1,202,870 | | | | 66,759 | |
| Washington Mutual, Inc. | | | 615,199 | | | | 26,023 | |
| Wells Fargo & Co. | | | 2,151,676 | | | | 78,084 | |
| Zions Bancorp | | | 64,162 | | | | 5,159 | |
| | | | | | | | |
| | | | | | | | 457,680 | |
| | | | | | | | | |
Capital Goods 8.5% | | | | | | | | |
| |
| 3M Co. | | | 482,761 | | | | 38,061 | |
| American Power Conversion Corp. | | | 96,248 | | | | 2,910 | |
| American Standard Cos., Inc. | | | 109,817 | | | | 4,864 | |
| Caterpillar, Inc. | | | 428,787 | | | | 26,032 | |
| Cooper Industries Ltd., Class A | | | 66,011 | | | | 5,905 | |
Cummins, Inc. (a) | | | 30,977 | | | | 3,933 | |
| Danaher Corp. | | | 151,019 | | | | 10,839 | |
| Deere & Co. | | | 146,984 | | | | 12,513 | |
| Dover Corp. | | | 140,023 | | | | 6,651 | |
| Eaton Corp. | | | 96,095 | | | | 6,960 | |
| Emerson Electric Co. | | | 262,819 | | | | 22,182 | |
| Fluor Corp. | | | 52,999 | | | | 4,157 | |
| General Dynamics Corp. | | | 258,472 | | | | 18,377 | |
General Electric Co. (b) | | | 6,641,667 | | | | 233,189 | |
| Goodrich Corp. | | | 75,218 | | | | 3,316 | |
| Honeywell International, Inc. | | | 530,120 | | | | 22,329 | |
| Illinois Tool Works, Inc. | | | 282,770 | | | | 13,553 | |
| Ingersoll-Rand Co., Ltd., Class A | | | 210,710 | | | | 7,735 | |
| ITT Corp. | | | 124,260 | | | | 6,758 | |
| L-3 Communications Holdings, Inc. | | | 74,495 | | | | 5,998 | |
| Lockheed Martin Corp. | | | 236,352 | | | | 20,546 | |
Masco Corp. (a) | | | 250,581 | | | | 6,929 | |
Navistar International Corp. * | | | 32,355 | | | | 897 | |
| Northrop Grumman Corp. | | | 220,121 | | | | 14,614 | |
| PACCAR, Inc. | | | 158,847 | | | | 9,405 | |
| Pall Corp. | | | 72,422 | | | | 2,310 | |
| Parker Hannifin Corp. | | | 77,004 | | | | 6,440 | |
| Raytheon Co. | | | 302,439 | | | | 15,107 | |
| Rockwell Automation, Inc. | | | 113,641 | | | | 7,046 | |
| Rockwell Collins, Inc. | | | 109,024 | | | | 6,332 | |
| Textron, Inc. | | | 83,313 | | | | 7,576 | |
| The Boeing Co. | | | 512,990 | | | | 40,967 | |
| Tyco International Ltd. | | | 1,304,215 | | | | 38,383 | |
| United Technologies Corp. | | | 647,334 | | | | 42,543 | |
| W.W. Grainger, Inc. | | | 43,299 | | | | 3,151 | |
| | | | | | | | |
| | | | | | | | 678,508 | |
See financial notes. 1
Schwab S&P 500 Index Fund
Portfolio Holdings continued
| | | | | | | | | |
| | | Number of | | | Value | |
| Security | | Shares | | | ($ x 1,000) | |
| | | | | | | | | |
Commercial Services & Supplies 0.6% | | | | | | | | |
| |
Allied Waste Industries, Inc. * | | | 104,886 | | | | 1,274 | |
| Avery Dennison Corp. | | | 69,457 | | | | 4,385 | |
| Cintas Corp. | | | 82,791 | | | | 3,428 | |
| Equifax, Inc. | | | 82,320 | | | | 3,131 | |
Monster Worldwide, Inc. * | | | 82,126 | | | | 3,327 | |
| Pitney Bowes, Inc. | | | 139,254 | | | | 6,505 | |
| R.R. Donnelley & Sons Co. | | | 133,447 | | | | 4,518 | |
| Robert Half International, Inc. | | | 108,073 | | | | 3,950 | |
| Waste Management, Inc. | | | 372,965 | | | | 13,979 | |
| | | | | | | | |
| | | | | | | | 44,497 | |
| | | | | | | | | |
Consumer Durables & Apparel 1.2% | | | | | | | | |
| |
| Brunswick Corp. | | | 56,303 | | | | 1,774 | |
| Centex Corp. | | | 73,429 | | | | 3,840 | |
Coach, Inc. * | | | 246,216 | | | | 9,760 | |
| D.R. Horton, Inc. | | | 166,456 | | | | 3,900 | |
Eastman Kodak Co. (a) | | | 172,361 | | | | 4,206 | |
| Fortune Brands, Inc. | | | 93,149 | | | | 7,168 | |
| Harman International Industries, Inc. | | | 40,600 | | | | 4,155 | |
| Hasbro, Inc. | | | 113,895 | | | | 2,952 | |
| Jones Apparel Group, Inc. | | | 75,784 | | | | 2,531 | |
| KB Home | | | 39,275 | | | | 1,765 | |
| Leggett & Platt, Inc. | | | 113,803 | | | | 2,657 | |
| Lennar Corp., Class A | | | 80,382 | | | | 3,817 | |
| Liz Claiborne, Inc. | | | 63,619 | | | | 2,683 | |
| Mattel, Inc. | | | 246,667 | | | | 5,582 | |
| Newell Rubbermaid, Inc. | | | 198,018 | | | | 5,699 | |
| Nike, Inc., Class B | | | 120,871 | | | | 11,106 | |
| Pulte Homes, Inc. | | | 124,686 | | | | 3,864 | |
| Snap-On, Inc. | | | 36,954 | | | | 1,738 | |
| The Black & Decker Corp. | | | 48,650 | | | | 4,081 | |
| The Stanley Works | | | 37,174 | | | | 1,771 | |
| VF Corp. | | | 56,207 | | | | 4,272 | |
| Whirlpool Corp. | | | 49,291 | | | | 4,285 | |
| | | | | | | | |
| | | | | | | | 93,606 | |
| | | | | | | | | |
Consumer Services 1.8% | | | | | | | | |
| |
Apollo Group, Inc., Class A * | | | 88,210 | | | | 3,260 | |
| Carnival Corp. | | | 278,107 | | | | 13,577 | |
| Darden Restaurants, Inc. | | | 79,330 | | | | 3,324 | |
| H&R Block, Inc. | | | 204,694 | | | | 4,475 | |
| Harrah’s Entertainment, Inc. | | | 113,304 | | | | 8,422 | |
| Hilton Hotels Corp. | | | 207,414 | | | | 5,998 | |
International Game Technology (a) | | | 217,069 | | | | 9,228 | |
| Marriott International, Inc., Class A | | | 201,734 | | | | 8,426 | |
| McDonald’s Corp. | | | 797,901 | | | | 33,448 | |
Starbucks Corp. (a)* | | | 478,610 | | | | 18,068 | |
| Starwood Hotels & Resorts Worldwide, Inc. | | | 137,073 | | | | 8,189 | |
| Wendy’s International, Inc. | | | 66,758 | | | | 2,310 | |
Western Union Co. * | | | 490,262 | | | | 10,810 | |
Wyndham Worldwide Corp. * | | | 126,343 | | | | 3,727 | |
| YUM! Brands, Inc. | | | 174,233 | | | | 10,360 | |
| | | | | | | | |
| | | | | | | | 143,622 | |
| | | | | | | | | |
Diversified Financials 10.4% | | | | | | | | |
| |
| American Express Co. | | | 795,834 | | | | 46,007 | |
| Ameriprise Financial, Inc. | | | 168,361 | | | | 8,671 | |
| Bank of America Corp. | | | 2,926,732 | | | | 157,663 | |
| Capital One Financial Corp. | | | 193,989 | | | | 15,389 | |
| Chicago Mercantile Exchange Holdings, Inc. | | | 22,100 | | | | 11,072 | |
| CIT Group, Inc. | | | 126,238 | | | | 6,571 | |
| Citigroup, Inc. | | | 3,183,543 | | | | 159,686 | |
E*TRADE Financial Corp. * | | | 264,098 | | | | 6,148 | |
| Federated Investors, Inc., Class B | | | 46,211 | | | | 1,584 | |
| Franklin Resources, Inc. | | | 105,536 | | | | 12,027 | |
Goldman Sachs Group, Inc. (a) | | | 276,667 | | | | 52,509 | |
| Janus Capital Group, Inc. | | | 135,451 | | | | 2,720 | |
| JPMorgan Chase & Co. | | | 2,236,116 | | | | 106,081 | |
| Legg Mason, Inc. | | | 81,700 | | | | 7,355 | |
| Lehman Brothers Holdings, Inc. | | | 342,806 | | | | 26,684 | |
| Mellon Financial Corp. | | | 286,141 | | | | 11,102 | |
| Merrill Lynch & Co., Inc. | | | 570,290 | | | | 49,855 | |
| Moody’s Corp. | | | 156,391 | | | | 10,369 | |
| Morgan Stanley | | | 685,848 | | | | 52,419 | |
| Northern Trust Corp. | | | 131,834 | | | | 7,741 | |
| SLM Corp. | | | 263,062 | | | | 12,806 | |
| State Street Corp. | | | 225,728 | | | | 14,498 | |
| T. Rowe Price Group, Inc. | | | 170,026 | | | | 8,044 | |
| The Bank of New York Co., Inc. | | | 494,230 | | | | 16,987 | |
| The Bear Stearns Cos., Inc. | | | 77,223 | | | | 11,688 | |
The Charles Schwab Corp. (c) | | | 660,696 | | | | 12,038 | |
| | | | | | | | |
| | | | | | | | 827,714 | |
| | | | | | | | | |
Energy 9.4% | | | | | | | | |
| |
| Anadarko Petroleum Corp. | | | 298,432 | | | | 13,853 | |
| Apache Corp. | | | 211,349 | | | | 13,805 | |
| Baker Hughes, Inc. | | | 218,141 | | | | 15,063 | |
| BJ Services Co. | | | 191,575 | | | | 5,778 | |
Chesapeake Energy Corp. (a) | | | 242,500 | | | | 7,867 | |
| ChevronTexaco Corp. | | | 1,409,919 | | | | 94,747 | |
| ConocoPhillips | | | 1,057,004 | | | | 63,674 | |
| CONSOL Energy, Inc. | | | 98,100 | | | | 3,472 | |
| Devon Energy Corp. | | | 281,673 | | | | 18,827 | |
| El Paso Corp. | | | 412,734 | | | | 5,654 | |
| EOG Resources, Inc. | | | 155,607 | | | | 10,353 | |
Exxon Mobil Corp. (b) | | | 3,823,631 | | | | 273,084 | |
| Halliburton Co. | | | 670,456 | | | | 21,689 | |
| Hess Corp. | | | 142,902 | | | | 6,059 | |
| Kinder Morgan, Inc. | | | 63,146 | | | | 6,637 | |
| Marathon Oil Corp. | | | 232,061 | | | | 20,050 | |
| Murphy Oil Corp. | | | 98,027 | | | | 4,623 | |
Nabors Industries Ltd. * | | | 198,396 | | | | 6,126 | |
National-Oilwell Varco, Inc. * | | | 111,805 | | | | 6,753 | |
| Noble Corp. | | | 82,091 | | | | 5,755 | |
2 See financial notes.
Schwab S&P 500 Index Fund
Portfolio Holdings continued
| | | | | | | | | |
| | | Number of | | | Value | |
| Security | | Shares | | | ($ x 1,000) | |
| | | | | | | | | |
| Occidental Petroleum Corp. | | | 548,444 | | | | 25,744 | |
| Rowan Cos., Inc. | | | 64,341 | | | | 2,148 | |
| Schlumberger Ltd. | | | 755,559 | | | | 47,661 | |
| Smith International, Inc. | | | 60,000 | | | | 2,369 | |
| Sunoco, Inc. | | | 86,111 | | | | 5,694 | |
Transocean, Inc. (a)* | | | 201,088 | | | | 14,587 | |
| Valero Energy Corp. | | | 394,085 | | | | 20,622 | |
Weatherford International Ltd. * | | | 208,531 | | | | 8,566 | |
| Williams Cos., Inc. | | | 369,702 | | | | 9,032 | |
| XTO Energy, Inc. | | | 233,187 | | | | 10,880 | |
| | | | | | | | |
| | | | | | | | 751,172 | |
| | | | | | | | | |
Food & Staples Retailing 2.3% | | | | | | | | |
| |
| Costco Wholesale Corp. | | | 301,071 | | | | 16,071 | |
| CVS Corp. | | | 524,061 | | | | 16,445 | |
| Safeway, Inc. | | | 288,235 | | | | 8,463 | |
| Supervalu, Inc. | | | 126,724 | | | | 4,233 | |
| Sysco Corp. | | | 388,495 | | | | 13,590 | |
| The Kroger Co. | | | 481,646 | | | | 10,832 | |
| Wal-Mart Stores, Inc. | | | 1,582,493 | | | | 77,985 | |
| Walgreen Co. | | | 646,799 | | | | 28,252 | |
Whole Foods Market, Inc. (a) | | | 89,700 | | | | 5,726 | |
| | | | | | | | |
| | | | | | | | 181,597 | |
| | | | | | | | | |
Food, Beverage & Tobacco 4.8% | | | | | | | | |
| |
| Altria Group, Inc. | | | 1,343,189 | | | | 109,242 | |
| Anheuser-Busch Cos., Inc. | | | 511,708 | | | | 24,265 | |
| Archer-Daniels-Midland Co. | | | 419,069 | | | | 16,134 | |
| Brown-Forman Corp., Class B | | | 53,249 | | | | 3,844 | |
| Campbell Soup Co. | | | 122,713 | | | | 4,587 | |
| Coca-Cola Enterprises, Inc. | | | 201,467 | | | | 4,035 | |
ConAgra Foods, Inc. (a) | | | 331,155 | | | | 8,660 | |
Constellation Brands, Inc., Class A * | | | 121,205 | | | | 3,332 | |
Dean Foods Co. * | | | 76,000 | | | | 3,184 | |
| General Mills, Inc. | | | 233,863 | | | | 13,288 | |
| H.J. Heinz Co. | | | 216,951 | | | | 9,147 | |
| Kellogg Co. | | | 156,085 | | | | 7,853 | |
| McCormick & Co., Inc. | | | 88,073 | | | | 3,294 | |
| Molson Coors Brewing Co., Class B | | | 29,275 | | | | 2,084 | |
| PepsiCo, Inc. | | | 1,058,158 | | | | 67,129 | |
Reynolds American, Inc. (a) | | | 113,578 | | | | 7,174 | |
| Sara Lee Corp. | | | 486,730 | | | | 8,323 | |
| The Coca-Cola Co. | | | 1,312,447 | | | | 61,317 | |
| The Hershey Co. | | | 109,392 | | | | 5,788 | |
| The Pepsi Bottling Group, Inc. | | | 102,711 | | | | 3,248 | |
| Tyson Foods, Inc., Class A | | | 138,602 | | | | 2,003 | |
| UST, Inc. | | | 103,296 | | | | 5,532 | |
| Wm. Wrigley Jr. Co. | | | 138,234 | | | | 7,181 | |
| | | | | | | | |
| | | | | | | | 380,644 | |
| | | | | | | | | |
Health Care Equipment & Services 4.2% | | | | | | | | |
| |
| Aetna, Inc. | | | 363,072 | | | | 14,966 | |
| AmerisourceBergen Corp. | | | 148,482 | | | | 7,008 | |
| Bausch & Lomb, Inc. | | | 31,704 | | | | 1,697 | |
| Baxter International, Inc. | | | 430,311 | | | | 19,781 | |
| Becton Dickinson & Co. | | | 169,994 | | | | 11,905 | |
| Biomet, Inc. | | | 147,924 | | | | 5,597 | |
Boston Scientific Corp. * | | | 766,050 | | | | 12,188 | |
| C.R. Bard, Inc. | | | 64,512 | | | | 5,287 | |
| Cardinal Health, Inc. | | | 260,880 | | | | 17,075 | |
| Caremark Rx, Inc. | | | 288,859 | | | | 14,221 | |
| CIGNA Corp. | | | 73,970 | | | | 8,653 | |
Coventry Health Care, Inc. * | | | 102,747 | | | | 4,824 | |
Express Scripts, Inc. * | | | 88,127 | | | | 5,616 | |
| HCA, Inc. | | | 262,330 | | | | 13,253 | |
| Health Management Associates, Inc., Class A | | | 136,902 | | | | 2,697 | |
Hospira, Inc. * | | | 98,468 | | | | 3,579 | |
Humana, Inc. * | | | 108,589 | | | | 6,515 | |
| IMS Health, Inc. | | | 127,883 | | | | 3,562 | |
Laboratory Corp. of America Holdings * | | | 79,844 | | | | 5,469 | |
| Manor Care, Inc. | | | 45,374 | | | | 2,178 | |
| McKesson Corp. | | | 209,666 | | | | 10,502 | |
Medco Health Solutions, Inc. * | | | 195,438 | | | | 10,456 | |
| Medtronic, Inc. | | | 721,996 | | | | 35,147 | |
Patterson Cos., Inc. (a)* | | | 77,344 | | | | 2,541 | |
| Quest Diagnostics, Inc. | | | 104,042 | | | | 5,175 | |
St. Jude Medical, Inc. * | | | 223,259 | | | | 7,669 | |
| Stryker Corp. | | | 187,442 | | | | 9,801 | |
Tenet Healthcare Corp. * | | | 254,877 | | | | 1,799 | |
| UnitedHealth Group, Inc. | | | 872,408 | | | | 42,556 | |
WellPoint, Inc. * | | | 409,099 | | | | 31,222 | |
Zimmer Holdings, Inc. * | | | 158,169 | | | | 11,390 | |
| | | | | | | | |
| | | | | | | | 334,329 | |
| | | | | | | | | |
Household & Personal Products 2.4% | | | | | | | | |
| |
| Alberto-Culver Co., Class B | | | 45,240 | | | | 2,298 | |
| Avon Products, Inc. | | | 288,320 | | | | 8,768 | |
| Clorox Co. | | | 96,612 | | | | 6,237 | |
| Colgate-Palmolive Co. | | | 329,557 | | | | 21,082 | |
| Kimberly-Clark Corp. | | | 294,411 | | | | 19,584 | |
Procter & Gamble Co. (b) | | | 2,042,670 | | | | 129,485 | |
| The Estee Lauder Cos., Inc., Class A | | | 63,300 | | | | 2,557 | |
| | | | | | | | |
| | | | | | | | 190,011 | |
| | | | | | | | | |
Insurance 4.8% | | | | | | | | |
| |
| ACE Ltd. | | | 209,995 | | | | 12,022 | |
| AFLAC, Inc. | | | 330,768 | | | | 14,858 | |
| Ambac Financial Group, Inc. | | | 70,084 | | | | 5,851 | |
| American International Group, Inc. | | | 1,663,332 | | | | 111,726 | |
| AON Corp. | | | 226,315 | | | | 7,874 | |
| Cincinnati Financial Corp. | | | 107,986 | | | | 4,930 | |
| Genworth Financial, Inc., Class A | | | 292,738 | | | | 9,789 | |
| Lincoln National Corp. | | | 184,170 | | | | 11,660 | |
See financial notes. 3
Schwab S&P 500 Index Fund
Portfolio Holdings continued
| | | | | | | | | |
| | | Number of | | | Value | |
| Security | | Shares | | | ($ x 1,000) | |
| | | | | | | | | |
| Loews Corp. | | | 280,987 | | | | 10,936 | |
| Marsh & McLennan Cos., Inc. | | | 345,584 | | | | 10,174 | |
| MBIA, Inc. | | | 83,124 | | | | 5,155 | |
| MetLife, Inc. | | | 500,311 | | | | 28,583 | |
| Principal Financial Group, Inc. | | | 187,912 | | | | 10,615 | |
| Prudential Financial, Inc. | | | 314,981 | | | | 24,231 | |
| SAFECO Corp. | | | 90,032 | | | | 5,239 | |
| The Allstate Corp. | | | 415,282 | | | | 25,482 | |
| The Chubb Corp. | | | 279,460 | | | | 14,853 | |
| The Hartford Financial Services Group, Inc. | | | 203,517 | | | | 17,741 | |
| The Progressive Corp. | | | 501,028 | | | | 12,110 | |
| The St. Paul Travelers Cos., Inc. | | | 445,852 | | | | 22,796 | |
| Torchmark Corp. | | | 64,261 | | | | 3,964 | |
| UnumProvident Corp. | | | 196,938 | | | | 3,895 | |
| XL Capital Ltd., Class A | | | 110,199 | | | | 7,775 | |
| | | | | | | | |
| | | | | | | | 382,259 | |
| | | | | | | | | |
Materials 3.0% | | | | | | | | |
| |
| Air Products & Chemicals, Inc. | | | 142,154 | | | | 9,904 | |
| Alcoa, Inc. | | | 557,137 | | | | 16,107 | |
| Allegheny Technologies, Inc. | | | 54,355 | | | | 4,279 | |
| Ashland, Inc. | | | 42,227 | | | | 2,496 | |
| Ball Corp. | | | 60,522 | | | | 2,517 | |
| Bemis Co. | | | 60,050 | | | | 2,019 | |
| E.I. du Pont de Nemours & Co. | | | 589,978 | | | | 27,021 | |
| Eastman Chemical Co. | | | 46,991 | | | | 2,863 | |
| Ecolab, Inc. | | | 115,995 | | | | 5,260 | |
| Freeport-McMoRan Copper & Gold, Inc., Class B | | | 120,472 | | | | 7,286 | |
Hercules, Inc. * | | | 77,522 | | | | 1,411 | |
| International Flavors & Fragrances, Inc. | | | 48,667 | | | | 2,067 | |
| International Paper Co. | | | 315,603 | | | | 10,525 | |
| Louisiana-Pacific Corp. | | | 61,194 | | | | 1,211 | |
| MeadWestvaco Corp. | | | 117,577 | | | | 3,236 | |
| Monsanto Co. | | | 346,476 | | | | 15,321 | |
| Newmont Mining Corp. | | | 287,412 | | | | 13,011 | |
| Nucor Corp. | | | 214,604 | | | | 12,535 | |
Pactiv Corp. * | | | 106,495 | | | | 3,284 | |
| Phelps Dodge Corp. | | | 131,977 | | | | 13,248 | |
| PPG Industries, Inc. | | | 115,861 | | | | 7,925 | |
| Praxair, Inc. | | | 206,880 | | | | 12,465 | |
| Rohm & Haas Co. | | | 93,042 | | | | 4,822 | |
| Sealed Air Corp. | | | 54,055 | | | | 3,217 | |
| Sigma-Aldrich Corp. | | | 39,413 | | | | 2,960 | |
| Temple-Inland, Inc. | | | 80,959 | | | | 3,193 | |
| The Dow Chemical Co. | | | 615,793 | | | | 25,118 | |
| United States Steel Corp. | | | 81,248 | | | | 5,492 | |
| Vulcan Materials Co. | | | 61,904 | | | | 5,044 | |
| Weyerhaeuser Co. | | | 156,533 | | | | 9,954 | |
| | | | | | | | |
| | | | | | | | 235,791 | |
| | | | | | | | | |
Media 3.5% | | | | | | | | |
| |
| CBS Corp., Class B | | | 504,311 | | | | 14,595 | |
| Clear Channel Communications, Inc. | | | 318,500 | | | | 11,100 | |
Comcast Corp., Class A * | | | 1,353,032 | | | | 55,028 | |
Dow Jones & Co., Inc. (a) | | | 28,392 | | | | 996 | |
| Gannett Co., Inc. | | | 145,039 | | | | 8,578 | |
| Meredith Corp. | | | 17,454 | | | | 916 | |
| News Corp., Class A | | | 1,514,811 | | | | 31,584 | |
| Omnicom Group, Inc. | | | 114,691 | | | | 11,635 | |
| The E.W. Scripps Co., Class A | | | 39,225 | | | | 1,940 | |
The Interpublic Group of Cos., Inc. * | | | 260,619 | | | | 2,843 | |
| The McGraw-Hill Cos., Inc. | | | 242,211 | | | | 15,543 | |
The New York Times Co., Class A (a) | | | 82,087 | | | | 1,984 | |
| The Walt Disney Co. | | | 1,370,176 | | | | 43,106 | |
| Time Warner, Inc. | | | 2,604,429 | | | | 52,115 | |
| Tribune Co. | | | 122,626 | | | | 4,087 | |
Univision Communications, Inc., Class A * | | | 134,435 | | | | 4,713 | |
Viacom, Inc., Class B * | | | 457,203 | | | | 17,794 | |
| | | | | | | | |
| | | | | | | | 278,557 | |
| | | | | | | | | |
Pharmaceuticals & Biotechnology 8.2% | | | | | | | | |
| |
| Abbott Laboratories | | | 977,375 | | | | 46,435 | |
| Allergan, Inc. | | | 97,761 | | | | 11,291 | |
Amgen, Inc. * | | | 755,118 | | | | 57,321 | |
| Applied Biosystems Group-Applera Corp. | | | 125,342 | | | | 4,675 | |
Barr Pharmaceuticals, Inc. * | | | 66,437 | | | | 3,479 | |
Biogen Idec, Inc. * | | | 228,461 | | | | 10,875 | |
| Bristol-Myers Squibb Co. | | | 1,259,128 | | | | 31,164 | |
| Eli Lilly & Co. | | | 632,625 | | | | 35,433 | |
Fisher Scientific International, Inc. * | | | 77,676 | | | | 6,651 | |
Forest Laboratories, Inc. * | | | 209,623 | | | | 10,259 | |
Genzyme Corp. * | | | 165,507 | | | | 11,173 | |
Gilead Sciences, Inc. * | | | 291,372 | | | | 20,076 | |
| Johnson & Johnson | | | 1,896,195 | | | | 127,804 | |
King Pharmaceuticals, Inc. * | | | 172,292 | | | | 2,883 | |
MedImmune, Inc. * | | | 153,659 | | | | 4,923 | |
| Merck & Co., Inc. | | | 1,417,127 | | | | 64,366 | |
Millipore Corp. * | | | 28,708 | | | | 1,853 | |
| Mylan Laboratories, Inc. | | | 126,349 | | | | 2,590 | |
| PerkinElmer, Inc. | | | 71,880 | | | | 1,535 | |
| Pfizer, Inc. | | | 4,721,357 | | | | 125,824 | |
| Schering-Plough Corp. | | | 969,526 | | | | 21,465 | |
Thermo Electron Corp. * | | | 100,447 | | | | 4,306 | |
Waters Corp. * | | | 60,968 | | | | 3,036 | |
Watson Pharmaceuticals, Inc. * | | | 76,811 | | | | 2,067 | |
| Wyeth | | | 861,882 | | | | 43,982 | |
| | | | | | | | |
| | | | | | | | 655,466 | |
4 See financial notes.
Schwab S&P 500 Index Fund
Portfolio Holdings continued
| | | | | | | | | |
| | | Number of | | | Value | |
| Security | | Shares | | | ($ x 1,000) | |
| | | | | | | | | |
Real Estate 1.1% | | | | | | | | |
| |
| Apartment Investment & Management Co., Class A | | | 57,401 | | | | 3,290 | |
| Archstone-Smith Trust | | | 134,930 | | | | 8,124 | |
| Boston Properties, Inc. | | | 65,900 | | | | 7,040 | |
Equity Office Properties Trust (a) | | | 237,008 | | | | 10,073 | |
| Equity Residential | | | 186,292 | | | | 10,174 | |
| Kimco Realty Corp. | | | 135,000 | | | | 5,998 | |
| Plum Creek Timber Co., Inc. | | | 113,050 | | | | 4,063 | |
| ProLogis | | | 155,206 | | | | 9,820 | |
| Public Storage, Inc. | | | 68,725 | | | | 6,165 | |
Realogy Corp. * | | | 157,928 | | | | 4,071 | |
| Simon Property Group, Inc. | | | 133,510 | | | | 12,964 | |
| Vornado Realty Trust | | | 73,127 | | | | 8,721 | |
| | | | | | | | |
| | | | | | | | 90,503 | |
| | | | | | | | | |
Retailing 3.7% | | | | | | | | |
| |
Amazon.com, Inc. (a)* | | | 184,888 | | | | 7,042 | |
AutoNation, Inc. (a)* | | | 81,366 | | | | 1,631 | |
AutoZone, Inc. * | | | 29,807 | | | | 3,338 | |
Bed, Bath & Beyond, Inc. * | | | 179,765 | | | | 7,243 | |
| Best Buy Co., Inc. | | | 252,741 | | | | 13,964 | |
Big Lots, Inc. * | | | 47,209 | | | | 995 | |
| Circuit City Stores, Inc. | | | 93,008 | | | | 2,509 | |
| Dillard’s, Inc., Class A | | | 33,811 | | | | 1,020 | |
| Dollar General Corp. | | | 170,282 | | | | 2,389 | |
eBay, Inc. * | | | 740,406 | | | | 23,789 | |
| Family Dollar Stores, Inc. | | | 90,192 | | | | 2,656 | |
| Federated Department Stores, Inc. | | | 359,290 | | | | 15,777 | |
| Genuine Parts Co. | | | 109,453 | | | | 4,982 | |
| Home Depot, Inc. | | | 1,311,913 | | | | 48,974 | |
| J.C. Penney Co., Inc. | | | 155,684 | | | | 11,712 | |
Kohl’s Corp. * | | | 217,951 | | | | 15,387 | |
| Limited Brands, Inc. | | | 214,787 | | | | 6,330 | |
| Lowe’s Cos., Inc. | | | 981,720 | | | | 29,589 | |
| Nordstrom, Inc. | | | 142,282 | | | | 6,737 | |
Office Depot, Inc. * | | | 197,483 | | | | 8,292 | |
| OfficeMax, Inc. | | | 47,067 | | | | 2,240 | |
RadioShack Corp. (a) | | | 79,867 | | | | 1,425 | |
Sears Holdings Corp. * | | | 58,475 | | | | 10,202 | |
| Staples, Inc. | | | 461,497 | | | | 11,902 | |
| Target Corp. | | | 544,939 | | | | 32,250 | |
| The Gap, Inc. | | | 352,174 | | | | 7,403 | |
| The Sherwin-Williams Co. | | | 67,751 | | | | 4,013 | |
| The TJX Cos., Inc. | | | 292,939 | | | | 8,481 | |
| Tiffany & Co. | | | 87,308 | | | | 3,119 | |
| | | | | | | | |
| | | | | | | | 295,391 | |
| | | | | | | | | |
Semiconductors & Semiconductor Equipment 2.7% | | | | | | | | |
| |
Advanced Micro Devices, Inc. (a)* | | | 306,171 | | | | 6,512 | |
Altera Corp. * | | | 224,794 | | | | 4,145 | |
| Analog Devices, Inc. | | | 227,622 | | | | 7,243 | |
| Applied Materials, Inc. | | | 938,249 | | | | 16,316 | |
Broadcom Corp., Class A * | | | 290,501 | | | | 8,794 | |
Freescale Semiconductor, Inc., Class B * | | | 264,873 | | | | 10,417 | |
| Intel Corp. | | | 3,704,566 | | | | 79,055 | |
| KLA-Tencor Corp. | | | 123,967 | | | | 6,095 | |
| Linear Technology Corp. | | | 194,138 | | | | 6,042 | |
LSI Logic Corp. * | | | 254,038 | | | | 2,553 | |
| Maxim Integrated Products, Inc. | | | 203,642 | | | | 6,111 | |
Micron Technology, Inc. * | | | 479,913 | | | | 6,935 | |
| National Semiconductor Corp. | | | 191,430 | | | | 4,650 | |
Novellus Systems, Inc. * | | | 95,774 | | | | 2,648 | |
NVIDIA Corp. * | | | 220,100 | | | | 7,675 | |
PMC - Sierra, Inc. (a)* | | | 96,604 | | | | 641 | |
Teradyne, Inc. * | | | 131,483 | | | | 1,843 | |
| Texas Instruments, Inc. | | | 1,013,840 | | | | 30,598 | |
| Xilinx, Inc. | | | 214,068 | | | | 5,461 | |
| | | | | | | | |
| | | | | | | | 213,734 | |
| | | | | | | | | |
Software & Services 5.5% | | | | | | | | |
| |
Adobe Systems, Inc. * | | | 366,422 | | | | 14,016 | |
Affiliated Computer Services, Inc., Class A * | | | 63,172 | | | | 3,378 | |
Autodesk, Inc. * | | | 150,146 | | | | 5,518 | |
| Automatic Data Processing, Inc. | | | 369,060 | | | | 18,246 | |
BMC Software, Inc. * | | | 160,701 | | | | 4,871 | |
| CA, Inc. | | | 292,295 | | | | 7,237 | |
Citrix Systems, Inc. * | | | 114,845 | | | | 3,391 | |
Computer Sciences Corp. * | | | 109,953 | | | | 5,811 | |
Compuware Corp. * | | | 182,117 | | | | 1,464 | |
Convergys Corp. * | | | 92,806 | | | | 1,968 | |
Electronic Arts, Inc. * | | | 196,319 | | | | 10,383 | |
| Electronic Data Systems Corp. | | | 365,088 | | | | 9,248 | |
| First Data Corp. | | | 490,262 | | | | 11,889 | |
Fiserv, Inc. * | | | 131,097 | | | | 6,476 | |
Google, Inc., Class A * | | | 135,170 | | | | 64,394 | |
Intuit, Inc. * | | | 218,776 | | | | 7,723 | |
Microsoft Corp. (b) | | | 5,556,763 | | | | 159,535 | |
Novell, Inc. * | | | 224,287 | | | | 1,346 | |
Oracle Corp. * | | | 2,550,731 | | | | 47,112 | |
Parametric Technology Corp. * | | | 59,491 | | | | 1,162 | |
| Paychex, Inc. | | | 210,830 | | | | 8,324 | |
Sabre Holdings Corp., Class A (a) | | | 72,922 | | | | 1,854 | |
Symantec Corp. * | | | 662,834 | | | | 13,151 | |
Unisys Corp. * | | | 184,292 | | | | 1,205 | |
VeriSign, Inc. * | | | 148,800 | | | | 3,077 | |
Yahoo! Inc. * | | | 800,491 | | | | 21,085 | |
| | | | | | | | |
| | | | | | | | 433,864 | |
| | | | | | | | | |
Technology Hardware & Equipment 6.8% | | | | | | | | |
| |
ADC Telecommunications, Inc. * | | | 59,641 | | | | 853 | |
Agilent Technologies, Inc. * | | | 272,667 | | | | 9,707 | |
Apple Computer, Inc. * | | | 544,625 | | | | 44,158 | |
Avaya, Inc. * | | | 263,155 | | | | 3,371 | |
Ciena Corp. * | | | 47,966 | | | | 1,128 | |
Cisco Systems, Inc. * | | | 3,909,298 | | | | 94,331 | |
Comverse Technology, Inc. * | | | 122,392 | | | | 2,664 | |
Corning, Inc. * | | | 997,429 | | | | 20,377 | |
See financial notes. 5
Schwab S&P 500 Index Fund
Portfolio Holdings continued
| | | | | | | | | |
| | | Number of | | | Value | |
| Security | | Shares | | | ($ x 1,000) | |
| | | | | | | | | |
Dell, Inc. * | | | 1,436,194 | | | | 34,943 | |
EMC Corp. * | | | 1,503,326 | | | | 18,416 | |
| Hewlett-Packard Co. | | | 1,764,558 | | | | 68,359 | |
| International Business Machines Corp. | | | 978,747 | | | | 90,368 | |
| Jabil Circuit, Inc. | | | 110,485 | | | | 3,172 | |
JDS Uniphase Corp. * | | | 127,689 | | | | 1,855 | |
Juniper Networks, Inc. * | | | 310,000 | | | | 5,338 | |
Lexmark International, Inc., Class A * | | | 73,116 | | | | 4,649 | |
Lucent Technologies, Inc. * | | | 2,873,749 | | | | 6,983 | |
| Molex, Inc. | | | 90,848 | | | | 3,171 | |
| Motorola, Inc. | | | 1,602,800 | | | | 36,961 | |
NCR Corp. * | | | 116,524 | | | | 4,838 | |
Network Appliance, Inc. * | | | 231,263 | | | | 8,441 | |
QLogic Corp. * | | | 107,172 | | | | 2,206 | |
| QUALCOMM, Inc. | | | 1,062,758 | | | | 38,674 | |
SanDisk Corp. * | | | 111,600 | | | | 5,368 | |
Sanmina — SCI Corp. * | | | 288,702 | | | | 1,140 | |
Solectron Corp. * | | | 530,136 | | | | 1,771 | |
Sun Microsystems, Inc. * | | | 2,221,752 | | | | 12,064 | |
| Symbol Technologies, Inc. | | | 109,217 | | | | 1,631 | |
| Tektronix, Inc. | | | 55,351 | | | | 1,681 | |
Tellabs, Inc. * | | | 270,557 | | | | 2,852 | |
Xerox Corp. * | | | 630,296 | | | | 10,715 | |
| | | | | | | | |
| | | | | | | | 542,185 | |
| | | | | | | | | |
Telecommunication Services 3.5% | | | | | | | | |
| |
| ALLTEL Corp. | | | 249,106 | | | | 13,280 | |
| AT&T Corp. | | | 2,489,859 | | | | 85,278 | |
| BellSouth Corp. | | | 1,158,380 | | | | 52,243 | |
| CenturyTel, Inc. | | | 84,217 | | | | 3,389 | |
| Citizens Communications Co. | | | 239,863 | | | | 3,516 | |
| Embarq Corp. | | | 97,893 | | | | 4,733 | |
Qwest Communications International, Inc. * | | | 1,095,523 | | | | 9,454 | |
| Sprint Nextel Corp. | | | 1,907,677 | | | | 35,654 | |
| Verizon Communications, Inc. | | | 1,868,151 | | | | 69,122 | |
| Windstream Corp. | | | 266,345 | | | | 3,654 | |
| | | | | | | | |
| | | | | | | | 280,323 | |
| | | | | | | | | |
Transportation 1.8% | | | | | | | | |
| |
| Burlington Northern Santa Fe Corp. | | | 233,319 | | | | 18,089 | |
| CSX Corp. | | | 283,726 | | | | 10,120 | |
| FedEx Corp. | | | 195,349 | | | | 22,375 | |
| Norfolk Southern Corp. | | | 265,504 | | | | 13,958 | |
| Ryder System, Inc. | | | 35,093 | | | | 1,848 | |
| Southwest Airlines Co. | | | 470,201 | | | | 7,067 | |
| Union Pacific Corp. | | | 172,213 | | | | 15,608 | |
| United Parcel Service, Inc., Class B | | | 688,790 | | | | 51,900 | |
| | | | | | | | |
| | | | | | | | 140,965 | |
| | | | | | | | | |
Utilities 3.4% | | | | | | | | |
| |
Allegheny Energy, Inc. * | | | 104,525 | | | | 4,498 | |
Ameren Corp. (a) | | | 125,730 | | | | 6,802 | |
| American Electric Power Co., Inc. | | | 252,535 | | | | 10,463 | |
CenterPoint Energy, Inc. (a) | | | 174,137 | | | | 2,696 | |
CMS Energy Corp. * | | | 117,771 | | | | 1,754 | |
| Consolidated Edison, Inc. | | | 150,869 | | | | 7,294 | |
| Constellation Energy Group, Inc. | | | 114,391 | | | | 7,138 | |
| Dominion Resources, Inc. | | | 217,358 | | | | 17,604 | |
DTE Energy Co. (a) | | | 110,514 | | | | 5,021 | |
| Duke Energy Corp. | | | 790,869 | | | | 25,023 | |
Dynegy, Inc., Class A * | | | 244,620 | | | | 1,487 | |
| Edison International | | | 208,567 | | | | 9,269 | |
| Entergy Corp. | | | 132,173 | | | | 11,344 | |
| Exelon Corp. | | | 428,054 | | | | 26,531 | |
| FirstEnergy Corp. | | | 211,163 | | | | 12,427 | |
FPL Group, Inc. (a) | | | 260,750 | | | | 13,298 | |
| KeySpan Corp. | | | 110,330 | | | | 4,477 | |
| Nicor, Inc. | | | 21,182 | | | | 973 | |
| NiSource, Inc. | | | 163,456 | | | | 3,804 | |
| Peoples Energy Corp. | | | 15,854 | | | | 693 | |
| PG&E Corp. | | | 222,156 | | | | 9,584 | |
| Pinnacle West Capital Corp. | | | 51,945 | | | | 2,483 | |
| PPL Corp. | | | 236,742 | | | | 8,172 | |
Progress Energy, Inc. (a) | | | 159,892 | | | | 7,355 | |
| Public Service Enterprise Group, Inc. | | | 162,087 | | | | 9,895 | |
| Sempra Energy | | | 165,517 | | | | 8,779 | |
| TECO Energy, Inc. | | | 115,104 | | | | 1,898 | |
The AES Corp. * | | | 421,510 | | | | 9,269 | |
| The Southern Co. | | | 474,309 | | | | 17,265 | |
| TXU Corp. | | | 303,846 | | | | 19,182 | |
| Xcel Energy, Inc. | | | 248,854 | | | | 5,492 | |
| | | | | | | | |
| | | | | | | | 271,970 | |
| | | | | | | | | |
| Security | | Face Amount | | | Value | |
| Rate, Maturity Date | | ($ x 1,000) | | | ($ x 1,000) | |
| | | | | | | | | |
Short-Term Investment 0.1% of net assets | | | | | | | | |
| | | | | | | | | |
Wells Fargo, Grand Cayman Time Deposit
4.71%, 11/01/06 | | | 8,212 | | | | 8,212 | |
| | | | | | | | | |
U.S. Treasury Obligation 0.0% of net assets | | | | | | | | |
| | | | | | | | | |
U.S. Treasury Bill
4.90%, 12/14/06 | | | 3,000 | | | | 2,983 | |
| | | | | | | | | |
End of Investments. | | | | | | | | |
6 See financial notes.
Schwab S&P 500 Index Fund
| | | | | | | | | |
| | | Number of | | | Value | |
| Security | | Shares | | | ($ x 1,000) | |
| | | | | | | | | |
Collateral Invested for Securities on Loan 1.6% of net assets | | | | | | | | |
| | | | | | | | | |
| Securities Lending Investment Fund, a series of the Brown Brothers Investment Trust | | | 128,448,347 | | | | 128,448 | |
| | | | | | | | | |
End of collateral invested for securities on loan. | | | | | | | | |
At 10/31/06 the tax basis cost of the fund’s investments was $5,647,753, and the unrealized appreciation and depreciation were $2,828,797 and ($514,663), respectively, with a net unrealized appreciation of $2,314,134.
In addition to the above, the fund held the following at October 31, 2006. All numbers are x1,000 except numbers of futures contracts.
| | | | | | | | | | | | | |
| | | Number of | | | Contract | | | Unrealized | |
| | | Contracts | | | Value | | | Gains | |
| | | | | | | | | | | | | |
Futures Contract 0.1% of net assets | | | | | | | | | | | | |
| | | | | | | | | | | | | |
| S&P 500 Index, e-mini, | | | | | | | | | | | | |
| Long, expires 12/15/06 | | | 105 | | | | 7,262 | | | | 389 | |
| | |
| |
| * | | Non-income producing security. |
| |
| (a) | | All or a portion of this security is on loan. |
| |
| (b) | | All or a portion of this security is held as collateral for open futures contracts. |
| |
| (c) | | Issuer is affiliated with the fund’s adviser. |
See financial notes. 7
Schwab Institutional Select S&P 500 Fund
Portfolio Holdings as of October 31, 2006
This section shows all the securities in the fund’s portfolio and their value as of the report date.
The fund files its complete schedule of portfolio holdings with the SEC for the first and third quarters of each fiscal year on Form N-Q. The fund’s Form N-Q is available on the SEC’s website at http://www.sec.gov and may be viewed and copied at the SEC’s Public Reference Room in Washington, D.C. Call 1-800-SEC-0330 for information on the operation of the Public Reference Room. The schedule of portfolio holdings filed on a fund’s most recent Form N-Q is also available by visiting Schwab’s website at www.schwab.com/schwabfunds.
| | | | | | | | | | | | |
| | | | | | Cost | | Value |
| Holdings by Category | | ($ x 1,000) | | | ($ x 1,000) |
| |
| 98.9 | % | | Common Stock | | | 1,812,825 | | | | 2,057,718 | |
| 0.6 | % | | Short-Term Investment | | | 11,977 | | | | 11,977 | |
| 0.2 | % | | U.S. Treasury Obligations | | | 3,282 | | | | 3,282 | |
| — | % | | Warrants | | | — | | | | 2 | |
| |
| 99.7 | % | | Total Investments | | | 1,828,084 | | | | 2,072,979 | |
| 7.8 | % | | Collateral Invested for Securities on Loan | | | 162,875 | | | | 162,875 | |
| (7.5 | )% | | Other Assets and Liabilities, Net | | | | | | | (155,474 | ) |
| |
| 100.0 | % | | Total Net Assets | | | | | | | 2,080,380 | |
| | | | | | | | | |
| | | Number of | | Value |
| Security | | Shares | | ($ x 1,000) |
| | | | | | | | | |
Common Stock 98.9% of net assets | | | | | | | | |
| | | | | | | | | |
Automobiles & Components 0.6% | | | | | | | | |
| |
| Ford Motor Co. | | | 314,445 | | | | 2,603 | |
General Motors Corp. (a) | | | 93,871 | | | | 3,278 | |
Harley-Davidson, Inc. (a) | | | 43,491 | | | | 2,985 | |
| Johnson Controls, Inc. | | | 32,115 | | | | 2,619 | |
The Goodyear Tire & Rubber Co. (a)* | | | 27,545 | | | | 422 | |
| | | | | | | | | |
| | | | | | | | 11,907 | |
Banks 5.7% | | | | | | | | |
| |
| AmSouth Bancorp | | | 56,795 | | | | 1,716 | |
| BB&T Corp. | | | 89,140 | | | | 3,880 | |
| Comerica, Inc. | | | 27,799 | | | | 1,618 | |
Commerce Bancorp, Inc. (a) | | | 30,963 | | | | 1,081 | |
| Compass Bancshares, Inc. | | | 20,781 | | | | 1,169 | |
| Countrywide Financial Corp. | | | 100,736 | | | | 3,840 | |
| Fannie Mae | | | 160,637 | | | | 9,519 | |
| Fifth Third Bancorp | | | 92,641 | | | | 3,692 | |
| First Horizon National Corp. | | | 19,921 | | | | 783 | |
| Freddie Mac | | | 114,649 | | | | 7,910 | |
Huntington Bancshares, Inc. (a) | | | 38,064 | | | | 929 | |
| KeyCorp | | | 67,373 | | | | 2,502 | |
M&T Bank Corp. (a) | | | 13,417 | | | | 1,634 | |
| Marshall & Ilsley Corp. | | | 42,183 | | | | 2,022 | |
| MGIC Investment Corp. | | | 13,771 | | | | 809 | |
| National City Corp. | | | 100,413 | | | | 3,741 | |
| North Fork Bancorp, Inc. | | | 77,276 | | | | 2,209 | |
| PNC Financial Services Group, Inc. | | | 48,647 | | | | 3,407 | |
Regions Financial Corp. (a) | | | 75,732 | | | | 2,874 | |
| Sovereign Bancorp, Inc. | | | 55,442 | | | | 1,323 | |
| SunTrust Banks, Inc. | | | 60,529 | | | | 4,781 | |
| Synovus Financial Corp. | | | 53,744 | | | | 1,579 | |
| U.S. Bancorp | | | 294,951 | | | | 9,981 | |
| Wachovia Corp. | | | 317,754 | | | | 17,635 | |
| Washington Mutual, Inc. | | | 159,937 | | | | 6,765 | |
| Wells Fargo & Co. | | | 558,874 | | | | 20,282 | |
| Zions Bancorp | | | 17,115 | | | | 1,376 | |
| | | | | | | | | |
| | | | | | | | 119,057 | |
Capital Goods 8.4% | | | | | | | | |
| |
| 3M Co. | | | 125,029 | | | | 9,857 | |
| American Power Conversion Corp. | | | 22,385 | | | | 677 | |
| American Standard Cos., Inc. | | | 27,164 | | | | 1,203 | |
| Caterpillar, Inc. | | | 108,835 | | | | 6,607 | |
| Cooper Industries Ltd., Class A | | | 17,176 | | | | 1,536 | |
Cummins, Inc. (a) | | | 9,374 | | | | 1,190 | |
| Danaher Corp. | | | 38,677 | | | | 2,776 | |
| Deere & Co. | | | 37,194 | | | | 3,166 | |
| Dover Corp. | | | 34,792 | | | | 1,653 | |
| Eaton Corp. | | | 24,246 | | | | 1,756 | |
| Emerson Electric Co. | | | 67,624 | | | | 5,707 | |
| Fluor Corp. | | | 14,194 | | | | 1,113 | |
| General Dynamics Corp. | | | 66,920 | | | | 4,758 | |
General Electric Co. (b) | | | 1,713,315 | | | | 60,155 | |
| Goodrich Corp. | | | 20,038 | | | | 884 | |
| Honeywell International, Inc. | | | 135,940 | | | | 5,726 | |
| Illinois Tool Works, Inc. | | | 69,698 | | | | 3,341 | |
| Ingersoll-Rand Co., Ltd. Class A | | | 53,387 | | | | 1,960 | |
| ITT Corp. | | | 33,775 | | | | 1,837 | |
| L-3 Communications Holdings, Inc. | | | 20,457 | | | | 1,647 | |
| Lockheed Martin Corp. | | | 59,516 | | | | 5,174 | |
Masco Corp. (a) | | | 63,518 | | | | 1,756 | |
Navistar International Corp. * | | | 8,854 | | | | 246 | |
Northrop Grumman Corp. (a) | | | 56,776 | | | | 3,769 | |
| PACCAR, Inc. | | | 41,345 | | | | 2,448 | |
| Pall Corp. | | | 20,034 | | | | 639 | |
| Parker Hannifin Corp. | | | 19,631 | | | | 1,642 | |
| Raytheon Co. | | | 76,221 | | | | 3,807 | |
| Rockwell Automation, Inc. | | | 29,202 | | | | 1,811 | |
| Rockwell Collins, Inc. | | | 28,412 | | | | 1,650 | |
| Textron, Inc. | | | 21,300 | | | | 1,937 | |
| The Boeing Co. | | | 132,934 | | | | 10,616 | |
| Tyco International Ltd. | | | 334,344 | | | | 9,840 | |
| United Technologies Corp. | | | 167,820 | | | | 11,029 | |
See financial notes. 1
Schwab Institutional Select S&P 500 Fund
Portfolio Holdings continued
| | | | | | | | | |
| | | Number of | | Value |
| Security | | Shares | | ($ x 1,000) |
| | | | | | | | | |
| W.W. Grainger, Inc. | | | 12,522 | | | | 911 | |
| | | | | | | | | |
| | | | | | | | 174,824 | |
Commercial Services & Supplies 0.6% | | | | | | | | |
| |
Allied Waste Industries, Inc. * | | | 40,740 | | | | 495 | |
| Avery Dennison Corp. | | | 16,899 | | | | 1,067 | |
| Cintas Corp. | | | 22,679 | | | | 939 | |
| Equifax, Inc. | | | 22,649 | | | | 861 | |
Monster Worldwide, Inc. * | | | 23,336 | | | | 945 | |
| Pitney Bowes, Inc. | | | 36,772 | | | | 1,718 | |
R.R. Donnelley & Sons Co. (a) | | | 34,666 | | | | 1,174 | |
| Robert Half International, Inc. | | | 28,427 | | | | 1,039 | |
| Waste Management, Inc. | | | 91,276 | | | | 3,421 | |
| | | | | | | | | |
| | | | | | | | 11,659 | |
Consumer Durables & Apparel 1.2% | | | | | | | | |
| |
| Brunswick Corp. | | | 15,437 | | | | 486 | |
| Centex Corp. | | | 17,149 | | | | 897 | |
Coach, Inc. * | | | 60,719 | | | | 2,407 | |
| D.R. Horton, Inc. | | | 35,407 | | | | 830 | |
Eastman Kodak Co. (a) | | | 47,687 | | | | 1,164 | |
| Fortune Brands, Inc. | | | 23,659 | | | | 1,821 | |
| Harman International Industries, Inc. | | | 11,014 | | | | 1,127 | |
| Hasbro, Inc. | | | 35,442 | | | | 919 | |
| Jones Apparel Group, Inc. | | | 20,500 | | | | 685 | |
| KB Home | | | 10,385 | | | | 467 | |
| Leggett & Platt, Inc. | | | 31,978 | | | | 747 | |
| Lennar Corp., Class A | | | 22,340 | | | | 1,061 | |
| Liz Claiborne, Inc. | | | 16,562 | | | | 698 | |
| Mattel, Inc. | | | 64,010 | | | | 1,448 | |
| Newell Rubbermaid, Inc. | | | 51,474 | | | | 1,481 | |
| Nike, Inc., Class B | | | 31,794 | | | | 2,921 | |
| Pulte Homes, Inc. | | | 27,600 | | | | 855 | |
| Snap-On, Inc. | | | 13,922 | | | | 655 | |
| The Black & Decker Corp. | | | 11,801 | | | | 990 | |
The Stanley Works (a) | | | 12,936 | | | | 616 | |
| VF Corp. | | | 14,199 | | | | 1,079 | |
| Whirlpool Corp. | | | 12,945 | | | | 1,125 | |
| | | | | | | | | |
| | | | | | | | 24,479 | |
Consumer Services 1.8% | | | | | | | | |
| |
Apollo Group, Inc., Class A * | | | 22,493 | | | | 831 | |
Carnival Corp. (a) | | | 73,861 | | | | 3,606 | |
| Darden Restaurants, Inc. | | | 24,250 | | | | 1,016 | |
| H&R Block, Inc. | | | 48,200 | | | | 1,054 | |
| Harrah’s Entertainment, Inc. | | | 28,144 | | | | 2,092 | |
| Hilton Hotels Corp. | | | 62,971 | | | | 1,821 | |
International Game Technology (a) | | | 56,282 | | | | 2,393 | |
| Marriott International, Inc., Class A | | | 57,034 | | | | 2,382 | |
| McDonald’s Corp. | | | 202,859 | | | | 8,504 | |
Starbucks Corp. (a)* | | | 124,731 | | | | 4,709 | |
| Starwood Hotels & Resorts Worldwide, Inc. | | | 36,190 | | | | 2,162 | |
| Wendy’s International, Inc. | | | 19,491 | | | | 674 | |
Western Union Co. * | | | 126,987 | | | | 2,800 | |
Wyndham Worldwide Corp. * | | | 33,237 | | | | 980 | |
| YUM! Brands, Inc. | | | 44,886 | | | | 2,669 | |
| | | | | | | | | |
| | | | | | | | 37,693 | |
Diversified Financials 10.3% | | | | | | | | |
| |
| American Express Co. | | | 203,021 | | | | 11,737 | |
| Ameriprise Financial, Inc. | | | 41,225 | | | | 2,123 | |
Bank of America Corp. (b) | | | 752,276 | | | | 40,525 | |
| Capital One Financial Corp. | | | 50,828 | | | | 4,032 | |
| Chicago Mercantile Exchange Holdings, Inc. | | | 5,900 | | | | 2,956 | |
| CIT Group, Inc. | | | 32,984 | | | | 1,717 | |
Citigroup, Inc. (b) | | | 820,551 | | | | 41,159 | |
E*TRADE Financial Corp. * | | | 70,919 | | | | 1,651 | |
| Federated Investors, Inc., Class B | | | 14,533 | | | | 498 | |
| Franklin Resources, Inc. | | | 28,675 | | | | 3,268 | |
| Janus Capital Group, Inc. | | | 34,780 | | | | 698 | |
| JPMorgan Chase & Co. | | | 577,849 | | | | 27,413 | |
| Legg Mason, Inc. | | | 20,596 | | | | 1,854 | |
Lehman Brothers Holdings, Inc. (a) | | | 89,137 | | | | 6,939 | |
Mellon Financial Corp. (a) | | | 71,165 | | | | 2,761 | |
| Merrill Lynch & Co., Inc. | | | 147,141 | | | | 12,863 | |
| Moody’s Corp. | | | 39,101 | | | | 2,592 | |
| Morgan Stanley | | | 177,941 | | | | 13,600 | |
| Northern Trust Corp. | | | 33,541 | | | | 1,970 | |
| SLM Corp. | | | 68,033 | | | | 3,312 | |
| State Street Corp. | | | 55,941 | | | | 3,593 | |
| T. Rowe Price Group, Inc. | | | 43,478 | | | | 2,057 | |
The Bank of New York Co., Inc. (b) | | | 126,627 | | | | 4,352 | |
| The Bear Stearns Cos., Inc. | | | 20,021 | | | | 3,030 | |
The Charles Schwab Corp. (c) | | | 171,623 | | | | 3,127 | |
The Goldman Sachs Group, Inc. (a) | | | 71,694 | | | | 13,607 | |
| | | | | | | | | |
| | | | | | | | 213,434 | |
Energy 9.3% | | | | | | | | |
| |
| Anadarko Petroleum Corp. | | | 76,268 | | | | 3,540 | |
| Apache Corp. | | | 52,409 | | | | 3,423 | |
| Baker Hughes, Inc. | | | 54,571 | | | | 3,768 | |
| BJ Services Co. | | | 49,173 | | | | 1,483 | |
Chesapeake Energy Corp. (a) | | | 59,545 | | | | 1,932 | |
| ChevronTexaco Corp. | | | 363,287 | | | | 24,413 | |
| ConocoPhillips | | | 271,861 | | | | 16,377 | |
| CONSOL Energy, Inc. | | | 25,256 | | | | 894 | |
| Devon Energy Corp. | | | 73,184 | | | | 4,892 | |
| El Paso Corp. | | | 115,494 | | | | 1,582 | |
| EOG Resources, Inc. | | | 40,250 | | | | 2,678 | |
Exxon Mobil Corp. (b) | | | 986,722 | | | | 70,472 | |
| Halliburton Co. | | | 171,096 | | | | 5,535 | |
Hess Corp. (a) | | | 36,258 | | | | 1,537 | |
| Kinder Morgan, Inc. | | | 17,763 | | | | 1,867 | |
2 See financial notes.
Schwab Institutional Select S&P 500 Fund
Portfolio Holdings continued
| | | | | | | | | |
| | | Number of | | Value |
| Security | | Shares | | ($ x 1,000) |
| | | | | | | | | |
| Marathon Oil Corp. | | | 59,467 | | | | 5,138 | |
| Murphy Oil Corp. | | | 29,054 | | | | 1,370 | |
Nabors Industries Ltd. (a)* | | | 52,428 | | | | 1,619 | |
National-Oilwell Varco, Inc. * | | | 28,093 | | | | 1,697 | |
| Noble Corp. | | | 21,286 | | | | 1,492 | |
| Occidental Petroleum Corp. | | | 142,958 | | | | 6,710 | |
| Rowan Cos., Inc. | | | 14,575 | | | | 487 | |
Schlumberger Ltd. (a) | | | 196,488 | | | | 12,394 | |
Smith International, Inc. (a) | | | 32,500 | | | | 1,283 | |
| Sunoco, Inc. | | | 22,658 | | | | 1,498 | |
Transocean, Inc. (a)* | | | 51,828 | | | | 3,760 | |
| Valero Energy Corp. | | | 101,137 | | | | 5,292 | |
Weatherford International Ltd. * | | | 54,909 | | | | 2,256 | |
Williams Cos., Inc. (a) | | | 97,635 | | | | 2,385 | |
| XTO Energy, Inc. | | | 60,042 | | | | 2,802 | |
| | | | | | | | | |
| | | | | | | | 194,576 | |
Food & Staples Retailing 2.2% | | | | | | | | |
| |
| Costco Wholesale Corp. | | | 75,817 | | | | 4,047 | |
| CVS Corp. | | | 136,308 | | | | 4,277 | |
| Safeway, Inc. | | | 73,824 | | | | 2,168 | |
| Supervalu, Inc. | | | 34,258 | | | | 1,144 | |
| Sysco Corp. | | | 101,740 | | | | 3,559 | |
| The Kroger Co. | | | 119,939 | | | | 2,698 | |
Wal-Mart Stores, Inc. (b) | | | 405,276 | | | | 19,972 | |
| Walgreen Co. | | | 167,266 | | | | 7,306 | |
Whole Foods Market, Inc. (a) | | | 22,969 | | | | 1,466 | |
| | | | | | | | | |
| | | | | | | | 46,637 | |
Food, Beverage & Tobacco 4.7% | | | | | | | | |
| |
Altria Group, Inc. (b) | | | 347,476 | | | | 28,260 | |
| Anheuser-Busch Cos., Inc. | | | 127,602 | | | | 6,051 | |
| Archer-Daniels-Midland Co. | | | 108,783 | | | | 4,188 | |
| Brown-Forman Corp., Class B | | | 13,755 | | | | 993 | |
| Campbell Soup Co. | | | 38,256 | | | | 1,430 | |
| Coca-Cola Enterprises, Inc. | | | 47,834 | | | | 958 | |
ConAgra Foods, Inc. (a) | | | 86,269 | | | | 2,256 | |
Constellation Brands, Inc., Class A * | | | 31,450 | | | | 865 | |
Dean Foods Co. * | | | 21,419 | | | | 897 | |
| General Mills, Inc. | | | 59,601 | | | | 3,386 | |
| H.J. Heinz Co. | | | 57,960 | | | | 2,444 | |
| Kellogg Co. | | | 41,491 | | | | 2,087 | |
| McCormick & Co., Inc. | | | 26,561 | | | | 993 | |
| Molson Coors Brewing Co., Class B | | | 7,976 | | | | 568 | |
| PepsiCo, Inc. | | | 273,595 | | | | 17,357 | |
Reynolds American, Inc. (a) | | | 28,068 | | | | 1,773 | |
| Sara Lee Corp. | | | 128,493 | | | | 2,197 | |
| The Coca-Cola Co. | | | 338,214 | | | | 15,801 | |
| The Hershey Co. | | | 27,457 | | | | 1,453 | |
| The Pepsi Bottling Group, Inc. | | | 25,101 | | | | 794 | |
| Tyson Foods, Inc., Class A | | | 34,240 | | | | 495 | |
| UST, Inc. | | | 25,814 | | | | 1,383 | |
| Wm. Wrigley Jr. Co. | | | 34,509 | | | | 1,793 | |
| | | | | | | | | |
| | | | | | | | 98,422 | |
Health Care Equipment & Services 4.1% | | | | | | | | |
| |
| Aetna, Inc. | | | 90,887 | | | | 3,746 | |
| AmerisourceBergen Corp. | | | 34,072 | | | | 1,608 | |
| Bausch & Lomb, Inc. | | | 8,111 | | | | 434 | |
| Baxter International, Inc. | | | 109,114 | | | | 5,016 | |
| Becton Dickinson & Co. | | | 40,679 | | | | 2,849 | |
| Biomet, Inc. | | | 39,764 | | | | 1,505 | |
Boston Scientific Corp. * | | | 189,355 | | | | 3,013 | |
| C.R. Bard, Inc. | | | 17,207 | | | | 1,410 | |
| Cardinal Health, Inc. | | | 67,281 | | | | 4,404 | |
| Caremark Rx, Inc. | | | 72,089 | | | | 3,549 | |
| CIGNA Corp. | | | 19,931 | | | | 2,332 | |
Coventry Health Care, Inc. * | | | 25,531 | | | | 1,199 | |
Express Scripts, Inc. * | | | 23,540 | | | | 1,500 | |
| HCA, Inc. | | | 70,318 | | | | 3,552 | |
| Health Management Associates, Inc., Class A | | | 38,440 | | | | 757 | |
Hospira, Inc. * | | | 26,061 | | | | 947 | |
Humana, Inc. (a)* | | | 29,548 | | | | 1,773 | |
| IMS Health, Inc. | | | 36,124 | | | | 1,006 | |
Laboratory Corp. of America Holdings * | | | 20,053 | | | | 1,373 | |
Manor Care, Inc. (a) | | | 12,055 | | | | 578 | |
| McKesson Corp. | | | 51,782 | | | | 2,594 | |
Medco Health Solutions, Inc. * | | | 48,311 | | | | 2,585 | |
| Medtronic, Inc. | | | 188,732 | | | | 9,187 | |
Patterson Cos., Inc. (a)* | | | 20,090 | | | | 660 | |
| Quest Diagnostics, Inc. | | | 25,974 | | | | 1,292 | |
St. Jude Medical, Inc. * | | | 54,201 | | | | 1,862 | |
Stryker Corp. (a) | | | 49,227 | | | | 2,574 | |
Tenet Healthcare Corp. * | | | 75,592 | | | | 534 | |
| UnitedHealth Group, Inc. | | | 223,590 | | | | 10,907 | |
WellPoint, Inc. * | | | 103,611 | | | | 7,908 | |
Zimmer Holdings, Inc. * | | | 40,290 | | | | 2,901 | |
| | | | | | | | | |
| | | | | | | | 85,555 | |
Household & Personal Products 2.4% | | | | | | | | |
| |
| Alberto-Culver Co., Class B | | | 12,491 | | | | 635 | |
| Avon Products, Inc. | | | 74,254 | | | | 2,258 | |
| Clorox Co. | | | 25,064 | | | | 1,618 | |
| Colgate-Palmolive Co. | | | 85,666 | | | | 5,480 | |
| Kimberly-Clark Corp. | | | 76,078 | | | | 5,061 | |
| Procter & Gamble Co. | | | 526,953 | | | | 33,403 | |
| The Estee Lauder Cos., Inc., Class A | | | 20,720 | | | | 837 | |
| | | | | | | | | |
| | | | | | | | 49,292 | |
Insurance 4.7% | | | | | | | | |
| |
| ACE Ltd. | | | 53,926 | | | | 3,087 | |
AFLAC, Inc. (b) | | | 83,698 | | | | 3,760 | |
| Ambac Financial Group, Inc. | | | 19,390 | | | | 1,619 | |
See financial notes. 3
Schwab Institutional Select S&P 500 Fund
Portfolio Holdings continued
| | | | | | | | | |
| | | Number of | | Value |
| Security | | Shares | | ($ x 1,000) |
| | | | | | | | | |
| American International Group, Inc. | | | 431,354 | | | | 28,974 | |
AON Corp. (a) | | | 56,402 | | | | 1,962 | |
| Cincinnati Financial Corp. | | | 28,186 | | | | 1,287 | |
| Genworth Financial, Inc., Class A | | | 78,747 | | | | 2,633 | |
| Lincoln National Corp. | | | 49,296 | | | | 3,121 | |
| Loews Corp. | | | 78,613 | | | | 3,060 | |
| Marsh & McLennan Cos., Inc. | | | 87,889 | | | | 2,587 | |
| MBIA, Inc. | | | 22,374 | | | | 1,388 | |
MetLife, Inc. (b) | | | 127,375 | | | | 7,277 | |
| Principal Financial Group, Inc. | | | 46,983 | | | | 2,654 | |
| Prudential Financial, Inc. | | | 80,511 | | | | 6,194 | |
| SAFECO Corp. | | | 22,171 | | | | 1,290 | |
The Allstate Corp. (b) | | | 104,498 | | | | 6,412 | |
| The Chubb Corp. | | | 69,803 | | | | 3,710 | |
| The Hartford Financial Services Group, Inc. | | | 51,141 | | | | 4,458 | |
| The Progressive Corp. | | | 128,123 | | | | 3,097 | |
| The St. Paul Travelers Cos., Inc. | | | 115,894 | | | | 5,926 | |
| Torchmark Corp. | | | 15,882 | | | | 979 | |
| UnumProvident Corp. | | | 60,158 | | | | 1,190 | |
| XL Capital Ltd., Class A | | | 29,925 | | | | 2,111 | |
| | | | | | | | | |
| | | | | | | | 98,776 | |
Materials 3.0% | | | | | | | | |
| |
| Air Products & Chemicals, Inc. | | | 36,577 | | | | 2,548 | |
| Alcoa, Inc. | | | 140,238 | | | | 4,054 | |
| Allegheny Technologies, Inc. | | | 16,321 | | | | 1,285 | |
| Ashland, Inc. | | | 10,893 | | | | 644 | |
| Ball Corp. | | | 14,212 | | | | 591 | |
Bemis Co. (b) | | | 16,797 | | | | 565 | |
| E.I. du Pont de Nemours & Co. | | | 152,959 | | | | 7,006 | |
| Eastman Chemical Co. | | | 13,231 | | | | 806 | |
| Ecolab, Inc. | | | 29,632 | | | | 1,344 | |
| Freeport-McMoRan Copper & Gold, Inc., Class B | | | 33,654 | | | | 2,035 | |
Hercules, Inc. * | | | 31,113 | | | | 566 | |
| International Flavors & Fragrances, Inc. | | | 12,182 | | | | 517 | |
| International Paper Co. | | | 78,841 | | | | 2,629 | |
| Louisiana-Pacific Corp. | | | 17,044 | | | | 337 | |
| MeadWestvaco Corp. | | | 30,043 | | | | 827 | |
| Monsanto Co. | | | 90,070 | | | | 3,983 | |
| Newmont Mining Corp. | | | 73,909 | | | | 3,346 | |
| Nucor Corp. | | | 53,731 | | | | 3,138 | |
Pactiv Corp. * | | | 29,340 | | | | 905 | |
Phelps Dodge Corp. (a) | | | 35,145 | | | | 3,528 | |
| PPG Industries, Inc. | | | 29,563 | | | | 2,022 | |
| Praxair, Inc. | | | 53,526 | | | | 3,225 | |
| Rohm & Haas Co. | | | 26,168 | | | | 1,356 | |
| Sealed Air Corp. | | | 14,221 | | | | 846 | |
| Sigma-Aldrich Corp. | | | 10,659 | | | | 801 | |
| Temple-Inland, Inc. | | | 22,480 | | | | 887 | |
| The Dow Chemical Co. | | | 159,246 | | | | 6,496 | |
| United States Steel Corp. | | | 23,309 | | | | 1,576 | |
| Vulcan Materials Co. | | | 14,728 | | | | 1,200 | |
| Weyerhaeuser Co. | | | 40,395 | | | | 2,569 | |
| | | | | | | | | |
| | | | | | | | 61,632 | |
Media 3.4% | | | | | | | | |
| |
| CBS Corp., Class B | | | 132,327 | | | | 3,829 | |
| Clear Channel Communications, Inc. | | | 82,382 | | | | 2,871 | |
Comcast Corp., Class A (a)(b)* | | | 347,379 | | | | 14,128 | |
Dow Jones & Co., Inc. (a) | | | 7,406 | | | | 260 | |
| Gannett Co., Inc. | | | 38,727 | | | | 2,290 | |
| Meredith Corp. | | | 5,921 | | | | 311 | |
| News Corp., Class A | | | 387,773 | | | | 8,085 | |
| Omnicom Group, Inc. | | | 29,778 | | | | 3,021 | |
| The E.W. Scripps Co., Class A | | | 13,410 | | | | 663 | |
The Interpublic Group of Cos., Inc. * | | | 70,334 | | | | 767 | |
| The McGraw-Hill Cos., Inc. | | | 59,981 | | | | 3,849 | |
The New York Times Co., Class A (a) | | | 18,809 | | | | 455 | |
| The Walt Disney Co. | | | 348,799 | | | | 10,973 | |
Time Warner, Inc. (a) | | | 675,004 | | | | 13,507 | |
| Tribune Co. | | | 30,780 | | | | 1,026 | |
Univision Communications, Inc., Class A * | | | 40,296 | | | | 1,413 | |
Viacom, Inc., Class B * | | | 115,108 | | | | 4,480 | |
| | | | | | | | | |
| | | | | | | | 71,928 | |
Pharmaceuticals & Biotechnology 8.1% | | | | | | | | |
| |
Abbott Laboratories (b) | | | 253,614 | | | | 12,049 | |
| Allergan, Inc. | | | 25,069 | | | | 2,896 | |
Amgen, Inc. (b)* | | | 194,310 | | | | 14,750 | |
| Applied Biosystems Group-Applera Corp. | | | 35,411 | | | | 1,321 | |
Barr Pharmaceuticals, Inc. * | | | 17,025 | | | | 892 | |
Biogen Idec, Inc. * | | | 59,638 | | | | 2,839 | |
| Bristol-Myers Squibb Co. | | | 326,348 | | | | 8,077 | |
| Eli Lilly & Co. | | | 163,239 | | | | 9,143 | |
Fisher Scientific International, Inc. (a)* | | | 20,662 | | | | 1,769 | |
Forest Laboratories, Inc. * | | | 55,026 | | | | 2,693 | |
Genzyme Corp. * | | | 43,396 | | | | 2,930 | |
Gilead Sciences, Inc. (a)* | | | 75,859 | | | | 5,227 | |
| Johnson & Johnson | | | 486,334 | | | | 32,779 | |
King Pharmaceuticals, Inc. * | | | 42,753 | | | | 715 | |
MedImmune, Inc. * | | | 35,581 | | | | 1,140 | |
| Merck & Co., Inc. | | | 362,967 | | | | 16,486 | |
Millipore Corp. * | | | 8,013 | | | | 517 | |
| Mylan Laboratories, Inc. | | | 33,623 | | | | 689 | |
| PerkinElmer, Inc. | | | 20,053 | | | | 428 | |
Pfizer, Inc. (b) | | | 1,212,987 | | | | 32,326 | |
| Schering-Plough Corp. | | | 248,515 | | | | 5,502 | |
Thermo Electron Corp. (a)* | | | 25,269 | | | | 1,083 | |
Waters Corp. * | | | 16,190 | | | | 806 | |
Watson Pharmaceuticals, Inc. * | | | 18,801 | | | | 506 | |
4 See financial notes.
Schwab Institutional Select S&P 500 Fund
Portfolio Holdings continued
| | | | | | | | | |
| | | Number of | | Value |
| Security | | Shares | | ($ x 1,000) |
| | | | | | | | | |
| Wyeth | | | 223,309 | | | | 11,395 | |
| | | | | | | | | |
| | | | | | | | 168,958 | |
Real Estate 1.2% | | | | | | | | |
| |
| Apartment Investment & Management Co., Class A | | | 15,668 | | | | 898 | |
| Archstone-Smith Trust | | | 35,530 | | | | 2,139 | |
| Boston Properties, Inc. | | | 18,973 | | | | 2,027 | |
Equity Office Properties Trust (a) | | | 58,146 | | | | 2,471 | |
| Equity Residential | | | 48,308 | | | | 2,638 | |
| Kimco Realty Corp. | | | 35,990 | | | | 1,599 | |
| Plum Creek Timber Co., Inc. | | | 28,718 | | | | 1,032 | |
| ProLogis | | | 40,701 | | | | 2,575 | |
| Public Storage, Inc. | | | 20,173 | | | | 1,810 | |
Realogy Corp. * | | | 38,471 | | | | 992 | |
| Simon Property Group, Inc. | | | 36,729 | | | | 3,566 | |
| Vornado Realty Trust | | | 20,199 | | | | 2,409 | |
| | | | | | | | | |
| | | | | | | | 24,156 | |
Retailing 3.7% | | | | | | | | |
| |
Amazon.com, Inc. (a)* | | | 47,538 | | | | 1,811 | |
AutoNation, Inc. (a)* | | | 24,053 | | | | 482 | |
AutoZone, Inc. * | | | 7,574 | | | | 848 | |
Bed, Bath & Beyond, Inc. * | | | 44,297 | | | | 1,785 | |
| Best Buy Co., Inc. | | | 66,978 | | | | 3,701 | |
Big Lots, Inc. * | | | 17,478 | | | | 368 | |
| Circuit City Stores, Inc. | | | 22,320 | | | | 602 | |
| Dillard’s, Inc., Class A | | | 9,678 | | | | 292 | |
| Dollar General Corp. | | | 36,223 | | | | 508 | |
eBay, Inc. * | | | 194,945 | | | | 6,264 | |
| Family Dollar Stores, Inc. | | | 27,134 | | | | 799 | |
| Federated Department Stores, Inc. | | | 91,554 | | | | 4,020 | |
| Genuine Parts Co. | | | 27,744 | | | | 1,263 | |
| Home Depot, Inc. | | | 337,022 | | | | 12,581 | |
| J.C. Penney Co., Inc. | | | 38,956 | | | | 2,931 | |
Kohl’s Corp. * | | | 54,297 | | | | 3,833 | |
| Limited Brands, Inc. | | | 55,379 | | | | 1,632 | |
| Lowe’s Cos., Inc. | | | 250,377 | | | | 7,546 | |
| Nordstrom, Inc. | | | 41,414 | | | | 1,961 | |
Office Depot, Inc. * | | | 48,892 | | | | 2,053 | |
| OfficeMax, Inc. | | | 14,397 | | | | 685 | |
RadioShack Corp. (a) | | | 20,945 | | | | 374 | |
Sears Holdings Corp. (a)* | | | 14,653 | | | | 2,556 | |
| Staples, Inc. | | | 119,463 | | | | 3,081 | |
| Target Corp. | | | 142,520 | | | | 8,434 | |
| The Gap, Inc. | | | 87,628 | | | | 1,842 | |
| The Sherwin-Williams Co. | | | 18,044 | | | | 1,069 | |
| The TJX Cos., Inc. | | | 74,587 | | | | 2,159 | |
| Tiffany & Co. | | | 19,192 | | | | 686 | |
| | | | | | | | | |
| | | | | | | | 76,166 | |
Semiconductors & Semiconductor Equipment 2.6% | | | | | | | | |
| |
Advanced Micro Devices, Inc. (a)* | | | 80,599 | | | | 1,714 | |
Altera Corp. * | | | 59,626 | | | | 1,100 | |
| Analog Devices, Inc. | | | 58,510 | | | | 1,862 | |
| Applied Materials, Inc. | | | 247,962 | | | | 4,312 | |
Broadcom Corp., Class A (a)* | | | 74,246 | | | | 2,247 | |
Freescale Semiconductor, Inc., Class B * | | | 66,356 | | | | 2,610 | |
Intel Corp. (b) | | | 957,272 | | | | 20,428 | |
| KLA-Tencor Corp. | | | 32,996 | | | | 1,622 | |
| Linear Technology Corp. | | | 49,950 | | | | 1,554 | |
LSI Logic Corp. * | | | 69,172 | | | | 695 | |
| Maxim Integrated Products, Inc. | | | 49,704 | | | | 1,492 | |
Micron Technology, Inc. * | | | 128,614 | | | | 1,859 | |
| National Semiconductor Corp. | | | 47,796 | | | | 1,161 | |
Novellus Systems, Inc. * | | | 27,114 | | | | 750 | |
NVIDIA Corp. (a)* | | | 58,456 | | | | 2,038 | |
PMC — Sierra, Inc. (a)* | | | 18,535 | | | | 123 | |
Teradyne, Inc. * | | | 37,408 | | | | 525 | |
| Texas Instruments, Inc. | | | 254,314 | | | | 7,675 | |
Xilinx, Inc. (a) | | | 56,439 | | | | 1,440 | |
| | | | | | | | | |
| | | | | | | | 55,207 | |
Software & Services 5.4% | | | | | | | | |
| |
Adobe Systems, Inc. * | | | 96,169 | | | | 3,678 | |
Affiliated Computer Services, Inc., Class A * | | | 17,993 | | | | 962 | |
Autodesk, Inc. * | | | 38,471 | | | | 1,414 | |
| Automatic Data Processing, Inc. | | | 92,234 | | | | 4,560 | |
BMC Software, Inc. (a)* | | | 40,314 | | | | 1,222 | |
| CA, Inc. | | | 69,880 | | | | 1,730 | |
Citrix Systems, Inc. * | | | 30,552 | | | | 902 | |
Computer Sciences Corp. * | | | 28,536 | | | | 1,508 | |
Compuware Corp. * | | | 59,340 | | | | 477 | |
Convergys Corp. * | | | 25,295 | | | | 537 | |
Electronic Arts, Inc. * | | | 50,920 | | | | 2,693 | |
| Electronic Data Systems Corp. | | | 91,637 | | | | 2,321 | |
| First Data Corp. | | | 126,987 | | | | 3,079 | |
Fiserv, Inc. * | | | 30,347 | | | | 1,499 | |
Google, Inc., Class A (a)* | | | 35,263 | | | | 16,799 | |
Intuit, Inc. * | | | 57,495 | | | | 2,030 | |
Microsoft Corp. (b) | | | 1,433,501 | | | | 41,156 | |
Novell, Inc. * | | | 58,583 | | | | 352 | |
Oracle Corp. * | | | 669,403 | | | | 12,364 | |
Parametric Technology Corp. * | | | 17,533 | | | | 343 | |
Paychex, Inc. (a) | | | 56,181 | | | | 2,218 | |
Sabre Holdings Corp., Class A (a) | | | 21,122 | | | | 537 | |
Symantec Corp. * | | | 164,170 | | | | 3,257 | |
Unisys Corp. * | | | 52,541 | | | | 344 | |
VeriSign, Inc. * | | | 40,696 | | | | 842 | |
Yahoo! Inc. (a)* | | | 202,064 | | | | 5,322 | |
| | | | | | | | | |
| | | | | | | | 112,146 | |
Technology Hardware & Equipment 6.8% | | | | | | | | |
| |
ADC Telecommunications, Inc. * | | | 19,488 | | | | 279 | |
Agilent Technologies, Inc. * | | | 69,330 | | | | 2,468 | |
See financial notes. 5
Schwab Institutional Select S&P 500 Fund
Portfolio Holdings continued
| | | | | | | | | |
| | | Number of | | Value |
| Security | | Shares | | ($ x 1,000) |
| | | | | | | | | |
Apple Computer, Inc. (a)* | | | 141,159 | | | | 11,445 | |
Avaya, Inc. * | | | 73,345 | | | | 940 | |
Ciena Corp. * | | | 13,528 | | | | 318 | |
Cisco Systems, Inc. (b)* | | | 1,013,155 | | | | 24,447 | |
Comverse Technology, Inc. * | | | 33,494 | | | | 729 | |
Corning, Inc. (a)* | | | 258,838 | | | | 5,288 | |
Dell, Inc. (b)* | | | 372,733 | | | | 9,069 | |
EMC Corp. * | | | 381,475 | | | | 4,673 | |
| Hewlett-Packard Co. | | | 456,585 | | | | 17,688 | |
| International Business Machines Corp. | | | 253,427 | | | | 23,399 | |
| Jabil Circuit, Inc. | | | 29,647 | | | | 851 | |
JDS Uniphase Corp. * | | | 27,977 | | | | 407 | |
Juniper Networks, Inc. * | | | 92,171 | | | | 1,587 | |
Lexmark International, Inc., Class A * | | | 19,578 | | | | 1,245 | |
Lucent Technologies, Inc. * | | | 743,904 | | | | 1,808 | |
| Molex, Inc. | | | 24,651 | | | | 860 | |
| Motorola, Inc. | | | 406,651 | | | | 9,377 | |
NCR Corp. * | | | 30,258 | | | | 1,256 | |
Network Appliance, Inc. * | | | 61,767 | | | | 2,254 | |
QLogic Corp. * | | | 29,893 | | | | 615 | |
| QUALCOMM, Inc. | | | 274,179 | | | | 9,977 | |
SanDisk Corp. * | | | 31,867 | | | | 1,533 | |
Sanmina — SCI Corp. * | | | 81,576 | | | | 322 | |
Solectron Corp. * | | | 146,290 | | | | 489 | |
Sun Microsystems, Inc. * | | | 582,428 | | | | 3,163 | |
| Symbol Technologies, Inc. | | | 40,759 | | | | 609 | |
| Tektronix, Inc. | | | 16,824 | | | | 511 | |
Tellabs, Inc. * | | | 75,431 | | | | 795 | |
Xerox Corp. (a)* | | | 170,094 | | | | 2,892 | |
| | | | | | | | | |
| | | | | | | | 141,294 | |
Telecommunication Services 3.5% | | | | | | | | |
| |
| ALLTEL Corp. | | | 64,424 | | | | 3,435 | |
AT&T Corp. (a) | | | 644,616 | | | | 22,078 | |
| BellSouth Corp. | | | 301,323 | | | | 13,590 | |
| CenturyTel, Inc. | | | 23,721 | | | | 955 | |
Citizens Communications Co. (a) | | | 66,025 | | | | 968 | |
| Embarq Corp. | | | 24,786 | | | | 1,198 | |
Qwest Communications International, Inc. * | | | 279,267 | | | | 2,410 | |
| Sprint Nextel Corp. | | | 495,817 | | | | 9,267 | |
| Verizon Communications, Inc. | | | 481,086 | | | | 17,800 | |
| Windstream Corp. | | | 76,048 | | | | 1,043 | |
| | | | | | | | | |
| | | | | | | | 72,744 | |
Transportation 1.8% | | | | | | | | |
| |
| Burlington Northern Santa Fe Corp. | | | 60,029 | | | | 4,654 | |
| CSX Corp. | | | 73,630 | | | | 2,626 | |
| FedEx Corp. | | | 50,876 | | | | 5,827 | |
| Norfolk Southern Corp. | | | 68,035 | | | | 3,577 | |
| Ryder System, Inc. | | | 10,291 | | | | 542 | |
| Southwest Airlines Co. | | | 138,261 | | | | 2,078 | |
| Union Pacific Corp. | | | 44,672 | | | | 4,049 | |
United Parcel Service, Inc., Class B (a) | | | 179,457 | | | | 13,522 | |
| | | | | | | | | |
| | | | | | | | 36,875 | |
Utilities 3.4% | | | | | | | | |
| |
Allegheny Energy, Inc. * | | | 27,991 | | | | 1,204 | |
Ameren Corp. (a) | | | 32,380 | | | | 1,752 | |
| American Electric Power Co., Inc. | | | 65,340 | | | | 2,707 | |
CenterPoint Energy, Inc. (a) | | | 43,936 | | | | 680 | |
CMS Energy Corp. * | | | 36,742 | | | | 547 | |
| Consolidated Edison, Inc. | | | 36,742 | | | | 1,776 | |
| Constellation Energy Group, Inc. | | | 29,858 | | | | 1,863 | |
| Dominion Resources, Inc. | | | 57,278 | | | | 4,639 | |
DTE Energy Co. (a) | | | 25,619 | | | | 1,164 | |
| Duke Energy Corp. | | | 207,020 | | | | 6,550 | |
Dynegy, Inc., Class A * | | | 60,711 | | | | 369 | |
| Edison International | | | 54,039 | | | | 2,401 | |
| Entergy Corp. | | | 33,366 | | | | 2,864 | |
| Exelon Corp. | | | 111,144 | | | | 6,889 | |
| FirstEnergy Corp. | | | 54,727 | | | | 3,221 | |
FPL Group, Inc. (a) | | | 67,160 | | | | 3,425 | |
| KeySpan Corp. | | | 28,072 | | | | 1,139 | |
| Nicor, Inc. | | | 4,127 | | | | 190 | |
| NiSource, Inc. | | | 40,929 | | | | 952 | |
| Peoples Energy Corp. | | | 6,411 | | | | 280 | |
| PG&E Corp. | | | 58,277 | | | | 2,514 | |
| Pinnacle West Capital Corp. | | | 15,846 | | | | 758 | |
| PPL Corp. | | | 63,271 | | | | 2,184 | |
Progress Energy, Inc. (a) | | | 39,907 | | | | 1,836 | |
| Public Service Enterprise Group, Inc. | | | 40,151 | | | | 2,451 | |
| Sempra Energy | | | 41,469 | | | | 2,200 | |
| TECO Energy, Inc. | | | 33,523 | | | | 553 | |
The AES Corp. * | | | 111,078 | | | | 2,443 | |
| The Southern Co. | | | 120,388 | | | | 4,382 | |
| TXU Corp. | | | 77,783 | | | | 4,910 | |
Xcel Energy, Inc. (a) | | | 66,043 | | | | 1,458 | |
| | | | | | | | | |
| | | | | | | | 70,301 | |
| | | | | | | | | |
| Security | | Face Amount | | | | |
| Rate, Maturity Date | | ($ x 1,000) | | | | |
| | | | | | | | | |
Short-Term Investment 0.6% of net assets | | | | | | | | |
| | | | | | | | | |
| JP Morgan, Grand Cayman Time Deposit 4.71%, 11/01/06 | | | 11,977 | | | | 11,977 | |
6 See financial notes.
Schwab Institutional Select S&P 500 Fund
Portfolio Holdings continued
| | | | | | | | | |
| | | Maturity Amount | | Value |
| Security | | ($ x 1,000) | | ($ x 1,000) |
| | | | | | | | | |
U.S. Treasury Obligations 0.2% of net assets | | | | | | | | |
| | | | | | | | | |
U.S. Treasury Bill
4.90%, 12/14/06 | | | 2,500 | | | | 2,486 | |
| 4.91%, 12/14/06 | | | 150 | | | | 149 | |
| 4.93%, 12/14/06 | | | 600 | | | | 597 | |
| 5.00%, 12/14/06 | | | 50 | | | | 50 | |
| | | | | | | | | |
| | | | | | | | 3,282 | |
| | | | | | | | | |
| | | Number of | | Value |
| Security | | Shares | | ($ x 1,000) |
| | | | | | | | | |
Warrants 0.0% of net assets | | | | | | | | |
| | | | | | | | | |
Technology Hardware & Equipment 0.0% | | | | | | | | |
| |
Lucent Technologies, Inc. * expires 12/10/07 | | | 11,390 | | | | 2 | |
End of Investments.
| | | | | | | | | |
| Security | | Face Amount | | Value |
| Rate, Maturity Date | | ($ x 1,000) | | ($ x 1,000) |
| | | | | | | | | |
Collateral Invested for Securities on Loan 7.8% of net assets | | | | | | | | |
| | | | | | | | | |
| Securities Lending Investment Fund, a series of the Brown Brothers Investment Trust | | | 162,875,434 | | | | 162,875 | |
End of collateral invested for securities on loan.
At 10/31/06 the tax basis cost of the fund’s investments was $1,840,898, and the unrealized appreciation and depreciation were $272,607 and ($40,526), respectively, with a net unrealized appreciation of $232,081.
In addition to the above, the fund held the following at 10/31/2006. All numbers are x1,000 except number of futures contracts.
| | | | | | | | | | | | | |
| | | Number of | | Contract | | Unrealized |
| | | Contracts | | Value | | Gains |
| | | | | | | | | | | | | |
Futures Contracts | | | | | | | | | | | | |
| |
| S&P500 Index, e-mini, Long, expires 12/15/06 | | | 177 | | | | 12,241 | | | | 276 | |
| S&P500 Index, Long, expires 12/14/06 | | | 20 | | | | 6,916 | | | | 31 | |
| | | | | | | | | | | | | |
| | | | | | | | | | | | 307 | |
| | |
| * | | Non-income producing security. |
| |
| (a) | | All or a portion of security is on loan. |
| |
| (b) | | All or a portion of this security is held as collateral for open futures contracts. |
| |
| (c) | | Issuer is affiliated with the fund’s adviser. |
See financial notes. 7
Schwab Small-Cap Index Fund®
Portfolio Holdings as of October 31, 2006
This section shows all the securities in the fund’s portfolio and their value as of the report date.
The fund files its complete schedule of portfolio holdings with the SEC for the first and third quarters of each fiscal year on Form N-Q. The fund’s Form N-Q is available on the SEC’s website at http://www.sec.gov and may be viewed and copied at the SEC’s Public Reference Room in Washington, D.C. Call 1-800-SEC-0330 for information on the operation of the Public Reference Room. The schedule of portfolio holdings filed on a fund’s most recent Form N-Q is also available by visiting Schwab’s website at www.schwab.com/schwabfunds.
| | | | | | | | | | | | | |
| | | | | | | Cost | | | Value | |
| Holdings by Category | | ($ x 1,000) | | | ($ x 1,000) | |
| |
| 99.7 | % | | Common Stock | | | 1,241,488 | | | | 1,654,700 | |
| 0.2 | % | | Short-Term Investment | | | 3,156 | | | | 3,156 | |
| — | % | | U.S. Treasury Obligation | | | 679 | | | | 681 | |
| |
| 99.9 | % | | Total Investments | | | 1,245,323 | | | | 1,658,537 | |
| 15.2 | % | | Collateral Invested for Securities on Loan | | | 251,338 | | | | 251,338 | |
| (15.1) | % | | Other Assets and Liabilities, Net | | | | | | | (250,387 | ) |
| |
| 100.0 | % | | Total Net Assets | | | | | | | 1,659,488 | |
| | | | | | | | | |
| | | Number of | | | Value | |
| Security | | Shares | | | ($ x 1,000) | |
| | | | | | | | | |
Common Stock 99.7% of net assets | | | | | | | | |
| | | | | | | | | |
Automobiles & Components 0.9% | | | | | | | | |
| |
| American Axle & Manufacturing Holdings, Inc. | | | 62,185 | | | | 1,166 | |
ArvinMeritor, Inc. (a) | | | 94,012 | | | | 1,412 | |
Bandag, Inc. (a) | | | 23,140 | | | | 1,016 | |
Cooper Tire & Rubber Co. (a) | | | 77,323 | | | | 830 | |
Drew Industries, Inc. * | | | 20,713 | | | | 562 | |
Fleetwood Enterprises, Inc. * | | | 74,244 | | | | 530 | |
Lear Corp. (a)* | | | 82,635 | | | | 2,496 | |
LKQ Corp. * | | | 54,006 | | | | 1,250 | |
| Modine Manufacturing Co. | | | 48,491 | | | | 1,154 | |
| Sauer-Danfoss, Inc. | | | 69,820 | | | | 1,852 | |
Tenneco Automotive, Inc. * | | | 58,618 | | | | 1,331 | |
| Winnebago Industries, Inc. | | | 48,930 | | | | 1,629 | |
| | | | | | | | |
| | | | | | | | 15,228 | |
| | | | | | | | | |
Banks 8.1% | | | | | | | | |
| |
| 1st Source Corp. | | | 19,321 | | | | 610 | |
Accredited Home Lenders Holding Co. * | | | 27,071 | | | | 828 | |
| Alabama National Bancorp | | | 23,882 | | | | 1,620 | |
| Amcore Financial, Inc. | | | 34,593 | | | | 1,083 | |
| Anchor Bancorp Wisconsin, Inc. | | | 30,587 | | | | 888 | |
| BancFirst Corp. | | | 16,416 | | | | 817 | |
| BancorpSouth, Inc. | | | 114,368 | | | | 2,922 | |
| Bank Mutual Corp. | | | 73,693 | | | | 893 | |
| BankAtlantic Bancorp, Inc., Class A | | | 71,834 | | | | 941 | |
| BankUnited Financial Corp., Class A | | | 48,313 | | | | 1,303 | |
| Boston Private Financial Holdings, Inc. | | | 44,772 | | | | 1,238 | |
| Brookline Bancorp, Inc. | | | 74,496 | | | | 993 | |
Cathay General Bancorp (a) | | | 66,222 | | | | 2,281 | |
Centennial Bank Holdings, Inc. * | | | 70,865 | | | | 680 | |
| Central Pacific Financial Corp. | | | 39,332 | | | | 1,447 | |
Charter Financial Corp. (a) | | | 19,395 | | | | 921 | |
CharterMac (a) | | | 71,623 | | | | 1,458 | |
| Chemical Financial Corp. | | | 35,103 | | | | 1,050 | |
| Chittenden Corp. | | | 64,424 | | | | 1,900 | |
Citizens Banking Corp. (a) | | | 60,364 | | | | 1,568 | |
Corus Bankshares, Inc. (a) | | | 77,748 | | | | 1,596 | |
| CVB Financial Corp. | | | 98,654 | | | | 1,433 | |
Doral Financial Corp. (a) | | | 144,207 | | | | 663 | |
Downey Financial Corp. (a) | | | 39,030 | | | | 2,688 | |
| East West Bancorp, Inc. | | | 64,357 | | | | 2,350 | |
F.N.B. Corp. (a) | | | 74,937 | | | | 1,269 | |
| Fidelity Bankshares, Inc. | | | 32,583 | | | | 1,293 | |
| First Bancorp. | | | 112,777 | | | | 1,116 | |
| First Charter Corp. | | | 39,758 | | | | 990 | |
| First Citizens BancShares, Inc., Class A | | | 15,465 | | | | 2,904 | |
First Commonwealth Financial Corp. (a) | | | 83,956 | | | | 1,122 | |
| First Community Bancorp | | | 29,816 | | | | 1,594 | |
First Financial Bancorp (a) | | | 61,089 | | | | 992 | |
First Financial Bankshares, Inc. (a) | | | 31,221 | | | | 1,251 | |
| First Midwest Bancorp, Inc. Illinois | | | 59,763 | | | | 2,273 | |
| First Niagra Financial Group, Inc. | | | 155,736 | | | | 2,230 | |
| First Republic Bank | | | 32,135 | | | | 1,251 | |
FirstFed Financial Corp. (a)* | | | 21,895 | | | | 1,352 | |
| FirstMerit Corp. | | | 93,382 | | | | 2,168 | |
| Flagstar Bancorp, Inc. | | | 78,430 | | | | 1,179 | |
| Fremont General Corp. | | | 86,162 | | | | 1,252 | |
| Frontier Financial Corp. | | | 59,185 | | | | 1,717 | |
| Glacier Bancorp, Inc. | | | 37,074 | | | | 1,295 | |
| Greater Bay Bancorp | | | 71,490 | | | | 1,841 | |
| Hancock Holding Co. | | | 49,310 | | | | 2,530 | |
| Hanmi Financial Corp. | | | 68,488 | | | | 1,464 | |
| Harbor Florida Bancshares, Inc. | | | 33,205 | | | | 1,508 | |
| International Bancshares Corp. | | | 79,323 | | | | 2,434 | |
| Kearny Financial Corp. | | | 93,878 | | | | 1,502 | |
| MAF Bancorp, Inc. | | | 41,486 | | | | 1,788 | |
| MB Financial, Inc. | | | 40,024 | | | | 1,443 | |
National Penn Bancshares, Inc. (a) | | | 62,019 | | | | 1,271 | |
| NBT Bancorp., Inc. | | | 45,485 | | | | 1,130 | |
| NewAlliance Bancshares, Inc. | | | 147,911 | | | | 2,290 | |
See financial notes. 1
Schwab Small-Cap Index Fund
Portfolio Holdings continued
| | | | | | | | | |
| | | Number of | | | Value | |
| Security | | Shares | | | ($ x 1,000) | |
| | | | | | | | | |
| Northwest Bancorp, Inc. | | | 70,928 | | | | 1,897 | |
| Old National Bancorp | | | 96,483 | | | | 1,831 | |
| Pacific Capital Bancorp | | | 63,642 | | | | 1,958 | |
| Park National Corp. | | | 19,953 | | | | 2,023 | |
| PFF Bancorp, Inc. | | | 30,461 | | | | 945 | |
PrivateBancorp, Inc. (a) | | | 29,276 | | | | 1,202 | |
| Prosperity Bancshares, Inc. | | | 38,365 | | | | 1,331 | |
| Provident Bankshares Corp. | | | 44,069 | | | | 1,593 | |
| Provident Financial Services, Inc. | | | 102,351 | | | | 1,877 | |
| Republic Bancorp, Inc. | | | 101,521 | | | | 1,358 | |
| S&T Bancorp, Inc. | | | 31,881 | | | | 1,079 | |
Santander BanCorp (a) | | | 69,003 | | | | 1,290 | |
Signature Bank NY * | | | 32,909 | | | | 998 | |
| Sterling Bancshares, Inc. Texas | | | 62,608 | | | | 1,146 | |
| Sterling Financial Corp. Washington | | | 48,347 | | | | 1,608 | |
| Susquehanna Bancshares, Inc. | | | 64,808 | | | | 1,620 | |
SVB Financial Group * | | | 49,523 | | | | 2,279 | |
| Texas Regional Bancshares, Inc., Class A | | | 75,466 | | | | 2,932 | |
| The South Financial Group, Inc. | | | 83,525 | | | | 2,216 | |
Trustco Bank Corp. NY (a) | | | 103,702 | | | | 1,146 | |
| Trustmark Corp. | | | 77,877 | | | | 2,466 | |
| UCBH Holdings, Inc. | | | 112,125 | | | | 1,922 | |
| UMB Financial Corp. | | | 61,624 | | | | 2,210 | |
| Umpqua Holdings Corp. | | | 53,595 | | | | 1,514 | |
| United Bankshares, Inc. | | | 56,322 | | | | 2,151 | |
| United Community Banks, Inc. Georgia | | | 55,840 | | | | 1,756 | |
W Holding Co., Inc. (a) | | | 209,214 | | | | 1,190 | |
| Washington Federal, Inc. | | | 117,539 | | | | 2,732 | |
| WesBanco, Inc. | | | 32,298 | | | | 1,058 | |
| Westamerica Bancorp | | | 43,470 | | | | 2,167 | |
Western Alliance Bancorp (a)* | | | 31,231 | | | | 1,061 | |
| Wintrust Financial Corp. | | | 29,655 | | | | 1,431 | |
| | | | | | | | |
| | | | | | | | 134,607 | |
| | | | | | | | | |
Capital Goods 7.8% | | | | | | | | |
| |
| A.O. Smith Corp. | | | 39,130 | | | | 1,376 | |
A.S.V., Inc. (a)* | | | 30,875 | | | | 451 | |
AAR Corp. * | | | 44,997 | | | | 1,172 | |
| Actuant Corp., Class A | | | 36,574 | | | | 1,878 | |
| Acuity Brands, Inc. | | | 66,532 | | | | 3,296 | |
AGCO Corp. * | | | 125,945 | | | | 3,369 | |
| Albany International Corp., Class A | | | 42,500 | | | | 1,428 | |
| Applied Industrial Technologies, Inc. | | | 68,166 | | | | 1,959 | |
Armor Holdings, Inc. * | | | 45,516 | | | | 2,342 | |
Astec Industries, Inc. * | | | 23,395 | | | | 746 | |
| Baldor Electric Co. | | | 46,308 | | | | 1,486 | |
| Barnes Group, Inc. | | | 63,640 | | | | 1,276 | |
BE Aerospace, Inc. * | | | 79,551 | | | | 2,011 | |
Beacon Roofing Supply, Inc. (a)* | | | 47,182 | | | | 934 | |
| Belden CDT, Inc. | | | 65,393 | | | | 2,367 | |
Blount International, Inc. * | | | 56,662 | | | | 620 | |
| Briggs & Stratton Corp. | | | 63,693 | | | | 1,624 | |
| Bucyrus International, Inc., Class A | | | 37,846 | | | | 1,586 | |
Builders FirstSource, Inc. * | | | 18,760 | | | | 297 | |
Ceradyne, Inc. (a)* | | | 34,012 | | | | 1,403 | |
| Clarcor, Inc. | | | 71,898 | | | | 2,342 | |
| Curtiss-Wright Corp. | | | 54,756 | | | | 1,853 | |
DHB Industries, Inc. * | | | 19,920 | | | | 46 | |
| DRS Technologies, Inc. | | | 52,091 | | | | 2,303 | |
| ElkCorp. | | | 25,396 | | | | 638 | |
EMCOR Group, Inc. * | | | 49,802 | | | | 2,946 | |
Encore Wire Corp. (a)* | | | 29,441 | | | | 791 | |
Energy Conversion Devices, Inc. * | | | 41,063 | | | | 1,511 | |
ESCO Technologies, Inc. * | | | 35,469 | | | | 1,540 | |
Esterline Technologies Corp. * | | | 30,311 | | | | 1,143 | |
Evergreen Solar, Inc. (a)* | | | 66,889 | | | | 582 | |
| Federal Signal Corp. | | | 71,459 | | | | 1,090 | |
| Franklin Electric Co., Inc. | | | 28,318 | | | | 1,528 | |
| Freightcar America, Inc. | | | 17,490 | | | | 930 | |
Gardner Denver, Inc. * | | | 71,912 | | | | 2,444 | |
| GATX Corp. | | | 67,590 | | | | 2,945 | |
GenCorp, Inc. (a)* | | | 76,552 | | | | 1,003 | |
General Cable Corp. * | | | 74,632 | | | | 2,806 | |
Genlyte Group, Inc. * | | | 41,815 | | | | 3,231 | |
| Granite Construction, Inc. | | | 58,056 | | | | 3,025 | |
Griffon Corp. * | | | 43,450 | | | | 1,068 | |
H&E Equipment Services, Inc. * | | | 48,927 | | | | 1,313 | |
Hexcel Corp. * | | | 91,783 | | | | 1,486 | |
Infrasource Services, Inc. * | | | 32,158 | | | | 629 | |
Interline Brands, Inc. * | | | 43,134 | | | | 1,033 | |
Ionatron, Inc. (a)* | | | 75,240 | | | | 332 | |
Jacuzzi Brands, Inc. * | | | 105,290 | | | | 1,305 | |
| Kaydon Corp. | | | 44,235 | | | | 1,849 | |
| Lennox International, Inc. | | | 86,403 | | | | 2,329 | |
| Lincoln Electric Holdings, Inc. | | | 57,525 | | | | 3,537 | |
Middleby Corp. * | | | 10,826 | | | | 976 | |
Moog, Inc., Class A * | | | 53,872 | | | | 2,009 | |
| Mueller Industries, Inc. | | | 48,924 | | | | 1,794 | |
| NACCO Industries, Inc., Class A | | | 11,477 | | | | 1,728 | |
Navistar International Corp. * | | | 97,719 | | | | 2,710 | |
NCI Building Systems, Inc. * | | | 27,506 | | | | 1,646 | |
| Nordson Corp. | | | 49,343 | | | | 2,272 | |
Orbital Sciences Corp. * | | | 77,536 | | | | 1,408 | |
Perini Corp. * | | | 25,130 | | | | 621 | |
Quanta Services, Inc. * | | | 170,136 | | | | 3,114 | |
| Regal Beloit Corp. | | | 42,447 | | | | 2,099 | |
Sequa Corp., Class A * | | | 14,713 | | | | 1,561 | |
Simpson Manufacturing Co., Inc. (a)(b) | | | 60,694 | | | | 1,723 | |
| TAL International Group, Inc. | | | 44,122 | | | | 1,023 | |
Teledyne Technologies, Inc. * | | | 46,925 | | | | 1,958 | |
| Toro Co. | | | 60,335 | | | | 2,604 | |
| Triumph Group, Inc. | | | 21,101 | | | | 1,016 | |
| UAP Holding Corp. | | | 62,413 | | | | 1,562 | |
| Universal Forest Products, Inc. | | | 22,762 | | | | 1,033 | |
URS Corp. * | | | 67,253 | | | | 2,718 | |
| Valmont Industries, Inc. | | | 39,547 | | | | 2,207 | |
| Vicor Corp. | | | 55,668 | | | | 662 | |
| Wabtec Corp. | | | 63,550 | | | | 1,995 | |
Washington Group International, Inc. * | | | 36,647 | | | | 2,075 | |
| Watsco, Inc. | | | 34,982 | | | | 1,742 | |
| Watts Water Technologies, Inc., Class A | | | 43,107 | | | | 1,604 | |
2 See financial notes.
Schwab Small-Cap Index Fund
Portfolio Holdings continued
| | | | | | | | | |
| | | Number of | | | Value | |
| Security | | Shares | | | ($ x 1,000) | |
| | | | | | | | | |
Williams Scotsman International, Inc. * | | | 54,033 | | | | 1,271 | |
| Woodward Governor Co. | | | 47,317 | | | | 1,690 | |
| | | | | | | | |
| | | | | | | | 130,020 | |
| | | | | | | | | |
Commercial Services & Supplies 3.8% | | | | | | | | |
| |
| ABM Industries, Inc. | | | 68,209 | | | | 1,355 | |
Acco Brands Corp. * | | | 58,123 | | | | 1,412 | |
| Administaff, Inc. | | | 40,110 | | | | 1,382 | |
American Reprographics Co. * | | | 60,006 | | | | 2,130 | |
| Banta Corp. | | | 33,464 | | | | 1,482 | |
| Brady Corp., Class A | | | 61,729 | | | | 2,284 | |
Cenveo, Inc. * | | | 47,842 | | | | 949 | |
Consolidated Graphics, Inc. * | | | 22,600 | | | | 1,405 | |
Corrections Corp. of America * | | | 81,973 | | | | 3,745 | |
CoStar Group, Inc. * | | | 21,783 | | | | 1,031 | |
| Deluxe Corp. | | | 58,446 | | | | 1,325 | |
First Advantage Corp. (a)* | | | 52,008 | | | | 1,082 | |
FTI Consulting, Inc. * | | | 55,008 | | | | 1,563 | |
| G&K Services, Inc., Class A | | | 23,530 | | | | 897 | |
Global Cash Access, Inc. * | | | 110,039 | | | | 1,755 | |
IHS, Inc. * | | | 76,340 | | | | 2,639 | |
| IKON Office Solutions, Inc. | | | 209,821 | | | | 3,128 | |
| John H. Harland Co. | | | 42,260 | | | | 1,728 | |
| Kelly Services, Inc., Class A | | | 48,023 | | | | 1,382 | |
| Knoll, Inc. | | | 70,603 | | | | 1,398 | |
Korn/Ferry International * | | | 57,161 | | | | 1,264 | |
Labor Ready, Inc. * | | | 81,514 | | | | 1,427 | |
| McGrath Rentcorp | | | 24,932 | | | | 673 | |
Mine Safety Appliances Co. (a) | | | 47,289 | | | | 1,788 | |
Mobile Mini, Inc. * | | | 31,368 | | | | 1,009 | |
Navigant Consulting, Inc. * | | | 58,748 | | | | 1,046 | |
NCO Group, Inc. * | | | 36,449 | | | | 983 | |
PHH Corp. * | | | 73,463 | | | | 2,028 | |
Resources Connection, Inc. * | | | 58,250 | | | | 1,686 | |
| Rollins, Inc. | | | 103,950 | | | | 2,250 | |
School Specialty, Inc. * | | | 30,293 | | | | 1,186 | |
TeleTech Holdings, Inc. * | | | 103,400 | | | | 2,007 | |
Tetra Tech, Inc. * | | | 78,478 | | | | 1,427 | |
The Advisory Board Co. * | | | 26,676 | | | | 1,473 | |
United Stationers, Inc. * | | | 41,467 | | | | 1,980 | |
| Viad Corp. | | | 30,896 | | | | 1,142 | |
Waste Connections, Inc. * | | | 57,629 | | | | 2,345 | |
| Watson Wyatt & Co., Holdings | | | 58,181 | | | | 2,627 | |
| | | | | | | | |
| | | | | | | | 62,413 | |
| | | | | | | | | |
Consumer Durables & Apparel 3.6% | | | | | | | | |
| |
| American Greetings Corp., Class A | | | 91,711 | | | | 2,193 | |
| Blyth, Inc. | | | 49,309 | | | | 1,180 | |
Brookfield Homes Corp. (a) | | | 35,727 | | | | 1,159 | |
| Brown Shoe Co., Inc. | | | 36,250 | | | | 1,412 | |
| Callaway Golf Co. | | | 94,369 | | | | 1,267 | |
Carter’s, Inc. * | | | 75,514 | | | | 2,132 | |
Champion Enterprises Inc * | | | 91,233 | | | | 845 | |
Columbia Sportswear Co. (a)* | | | 52,819 | | | | 2,949 | |
Crocs, Inc. (a)* | | | 49,709 | | | | 1,969 | |
| Ethan Allen Interiors, Inc. | | | 46,579 | | | | 1,659 | |
Fossil, Inc. * | | | 81,866 | | | | 1,788 | |
Furniture Brands International, Inc. (a) | | | 68,702 | | | | 1,278 | |
JAKKS Pacific, Inc. * | | | 37,574 | | | | 815 | |
Jarden Corp. * | | | 75,508 | | | | 2,717 | |
| K-Swiss, Inc., Class A | | | 41,928 | | | | 1,481 | |
Kellwood Co. (a) | | | 40,528 | | | | 1,240 | |
| Kimball International, Inc., Class B | | | 12,351 | | | | 307 | |
La-Z-Boy, Inc. (a) | | | 69,209 | | | | 848 | |
Leapfrog Enterprises, Inc. (a)* | | | 69,425 | | | | 669 | |
Marvel Entertainment, Inc. (a)* | | | 122,630 | | | | 3,109 | |
Meritage Homes Corp. (a)* | | | 32,185 | | | | 1,473 | |
| Oakley, Inc. | | | 83,709 | | | | 1,555 | |
| Oxford Industries, Inc. | | | 20,018 | | | | 1,057 | |
| Phillips-Van Heusen Corp. | | | 60,675 | | | | 2,777 | |
Polaris Industries, Inc. (a) | | | 52,123 | | | | 2,232 | |
Quiksilver, Inc. * | | | 142,112 | | | | 1,982 | |
RC2 Corp. * | | | 25,886 | | | | 1,170 | |
Skechers U.S.A., Inc., Class A * | | | 56,178 | | | | 1,679 | |
Technical Olympic USA, Inc. (a) | | | 73,701 | | | | 818 | |
Tempur-Pedic International, Inc. * | | | 110,662 | | | | 2,184 | |
The Warnaco Group, Inc. * | | | 57,363 | | | | 1,218 | |
| The Yankee Candle Co., Inc. | | | 58,346 | | | | 1,975 | |
| Tupperware Corp. | | | 76,811 | | | | 1,631 | |
Under Armour, Inc. (a)* | | | 61,820 | | | | 2,865 | |
Volcom Inc (a)* | | | 29,290 | | | | 960 | |
WCI Communities, Inc. (a)* | | | 56,688 | | | | 914 | |
| Whirlpool Corp. | | | 172 | | | | 15 | |
| Wolverine World Wide, Inc. | | | 83,436 | | | | 2,366 | |
| | | | | | | | |
| | | | | | | | 59,888 | |
| | | | | | | | | |
Consumer Services 4.9% | | | | | | | | |
| |
American Real Estate Partners L.P. (a) | | | 55,192 | | | | 3,455 | |
| Ameristar Casinos, Inc. | | | 76,075 | | | | 1,872 | |
| Applebee’s International, Inc. | | | 100,230 | | | | 2,287 | |
Aztar Corp. * | | | 44,048 | | | | 2,360 | |
Bally Technologies, Inc. (a)* | | | 71,762 | | | | 1,424 | |
| Bob Evans Farms, Inc. | | | 47,146 | | | | 1,599 | |
Bright Horizons Family Solutions, Inc. * | | | 37,188 | | | | 1,429 | |
| CBRL Group, Inc. | | | 27,553 | | | | 1,210 | |
CEC Entertainment, Inc. * | | | 45,538 | | | | 1,570 | |
Cedar Fair L.P. * | | | 70,332 | | | | 1,930 | |
Chipotle Mexican Grill, Inc. Class A (a)* | | | 45,347 | | | | 2,716 | |
CKE Restaurants, Inc. (a) | | | 83,079 | | | | 1,623 | |
Corinthian Colleges, Inc. * | | | 120,729 | | | | 1,479 | |
DeVry, Inc. * | | | 98,080 | | | | 2,388 | |
| Domino’s Pizza, Inc. | | | 90,379 | | | | 2,457 | |
Escala Group, Inc. (a)* | | | 38,196 | | | | 193 | |
Gaylord Entertainment Co. * | | | 53,835 | | | | 2,506 | |
| IHOP Corp. | | | 33,472 | | | | 1,746 | |
Isle of Capri Casinos, Inc. (a)* | | | 36,884 | | | | 926 | |
Jack in the Box, Inc. * | | | 55,481 | | | | 3,113 | |
| Jackson Hewitt Tax Service, Inc. | | | 48,676 | | | | 1,684 | |
| Landry’s Restaurants, Inc. | | | 27,036 | | | | 792 | |
Life Time Fitness, Inc. * | | | 45,677 | | | | 2,354 | |
| Marcus Corp. | | | 29,083 | | | | 727 | |
See financial notes. 3
Schwab Small-Cap Index Fund
Portfolio Holdings continued
| | | | | | | | | |
| | | Number of | | | Value | |
| Security | | Shares | | | ($ x 1,000) | |
| | | | | | | | | |
| Matthews International Corp., Class A | | | 40,284 | | | | 1,548 | |
| Orient-Express Hotels Ltd., Class A | | | 79,772 | | | | 3,147 | |
P.F. Chang’s China Bistro, Inc. (a)* | | | 33,142 | | | | 1,386 | |
Papa John’s International, Inc. * | | | 49,255 | | | | 1,808 | |
Pinnacle Entertainment, Inc. * | | | 63,985 | | | | 1,936 | |
RARE Hospitality International, Inc. * | | | 42,882 | | | | 1,351 | |
Red Robin Gourmet Burgers, Inc. (a)* | | | 18,227 | | | | 879 | |
| Regis Corp. | | | 57,249 | | | | 2,150 | |
| Ruby Tuesday, Inc. | | | 77,514 | | | | 2,151 | |
Shuffle Master, Inc. (a)* | | | 41,612 | | | | 1,164 | |
Six Flags, Inc. (a)* | | | 101,908 | | | | 581 | |
Sonic Corp. * | | | 114,429 | | | | 2,603 | |
| Sotheby’s | | | 78,741 | | | | 2,992 | |
| Speedway Motorsports, Inc. | | | 60,484 | | | | 2,278 | |
Steiner Leisure Ltd. * | | | 28,609 | | | | 1,306 | |
| Strayer Education, Inc. | | | 19,371 | | | | 2,191 | |
Texas Roadhouse, Inc., Class A * | | | 85,396 | | | | 1,234 | |
Triarc Cos., Class B (a) | | | 101,831 | | | | 1,710 | |
Universal Technical Institute, Inc. * | | | 37,056 | | | | 740 | |
Vail Resorts, Inc. * | | | 51,871 | | | | 2,005 | |
WMS Industries, Inc. * | | | 44,201 | | | | 1,562 | |
| | | | | | | | |
| | | | | | | | 80,562 | |
| | | | | | | | | |
Diversified Financials 2.3% | | | | | | | | |
| |
| Advance America Cash Advance Centers, Inc. | | | 115,065 | | | | 1,725 | |
| Calamos Asset Management, Inc., Class A | | | 32,096 | | | | 938 | |
| Cash America International, Inc. | | | 44,470 | | | | 1,838 | |
Cohen & Steers, Inc. (a) | | | 41,928 | | | | 1,462 | |
CompuCredit Corp. (a)* | | | 68,200 | | | | 2,371 | |
Credit Acceptance Corp. (a)* | | | 32,166 | | | | 1,076 | |
| Financial Federal Corp. | | | 36,123 | | | | 994 | |
GAMCO Investors, Inc., Class A (a) | | | 42,031 | | | | 1,664 | |
GFI Group, Inc. (a)* | | | 37,342 | | | | 2,154 | |
Greenhill & Co., Inc. (a) | | | 40,182 | | | | 2,730 | |
| International Securities Exchange, Inc. | | | 56,748 | | | | 2,914 | |
Investment Technology Group, Inc. * | | | 63,465 | | | | 2,964 | |
Knight Capital Group, Inc., Class A * | | | 149,872 | | | | 2,795 | |
LaBranche & Co., Inc. (a)* | | | 82,987 | | | | 736 | |
| OptionsXpress Holdings, Inc. | | | 82,447 | | | | 2,563 | |
Piper Jaffray Cos. * | | | 30,339 | | | | 2,098 | |
Portfolio Recovery Associates, Inc. (a)* | | | 20,743 | | | | 967 | |
TradeStation Group, Inc. * | | | 58,079 | | | | 909 | |
W.P. Carey & Co. LLC (a) | | | 51,366 | | | | 1,484 | |
W.P. Stewart & Co., Ltd. (a) | | | 57,051 | | | | 787 | |
| Waddell & Reed Financial, Inc., Class A | | | 115,139 | | | | 2,936 | |
| | | | | | | | |
| | | | | | | | 38,105 | |
| | | | | | | | | |
Energy 8.0% | | | | | | | | |
| |
| Alliance Resource Partners L.P. | | | 50,610 | | | | 1,802 | |
| Alon USA Energy, Inc. | | | 64,178 | | | | 1,802 | |
Alpha Natural Resources, Inc. * | | | 72,661 | | | | 1,156 | |
Atlas America, Inc. * | | | 25,609 | | | | 1,230 | |
ATP Oil & Gas Corp. (a)* | | | 32,533 | | | | 1,399 | |
Atwood Oceanics, Inc. * | | | 40,404 | | | | 1,867 | |
Basic Energy Services, Inc. * | | | 47,102 | | | | 1,151 | |
| Berry Petroleum Co., Class A | | | 56,612 | | | | 1,690 | |
Bill Barrett Corp. (a)* | | | 55,093 | | | | 1,572 | |
Boardwalk Pipeline Partners, LP (a) | | | 138,835 | | | | 3,993 | |
Bois d’Arc Energy, Inc. * | | | 70,602 | | | | 1,135 | |
BP Prudhoe Bay Royalty Trust (a) | | | 29,865 | | | | 2,161 | |
Bristow Group, Inc. (a)* | | | 30,287 | | | | 1,006 | |
Buckeye Partners L.P. (a)* | | | 52,908 | | | | 2,423 | |
CARBO Ceramics, Inc. (a) | | | 30,420 | | | | 1,025 | |
Comstock Resources, Inc. * | | | 50,726 | | | | 1,415 | |
Crosstex Energy, Inc. (a) | | | 10,348 | | | | 993 | |
Crosstex Energy, LP (a)* | | | 31,183 | | | | 1,169 | |
Delta Petroleum Corp. * | | | 52,127 | | | | 1,340 | |
Dorchester Minerals L.P. (a) | | | 39,409 | | | | 975 | |
Dril-Quip, Inc. * | | | 51,350 | | | | 2,022 | |
Encore Acquisition Co. * | | | 63,377 | | | | 1,587 | |
Energy Partners, Ltd. * | | | 46,878 | | | | 1,145 | |
Evergreen Energy, Inc. (a)* | | | 101,457 | | | | 1,304 | |
EXCO Resources, Inc. * | | | 127,851 | | | | 1,851 | |
| Foundation Coal Holdings, Inc. | | | 59,578 | | | | 2,187 | |
| General Maritime Corp. | | | 52,796 | | | | 1,929 | |
Giant Industries, Inc. * | | | 20,130 | | | | 1,630 | |
Global Industries Ltd. * | | | 158,982 | | | | 2,639 | |
Grey Wolf, Inc. * | | | 266,348 | | | | 1,864 | |
Hanover Compressor Co. * | �� | | 133,762 | | | | 2,477 | |
Hercules Offshore, Inc. * | | | 42,204 | | | | 1,503 | |
| Holly Corp. | | | 79,906 | | | | 3,800 | |
Hornbeck Offshore Services, Inc. * | | | 37,545 | | | | 1,355 | |
Hugoton Royalty Trust (a) | | | 55,820 | | | | 1,437 | |
Hydril Co. * | | | 30,414 | | | | 1,826 | |
Inergy Holdings LP (a) | | | 18,510 | | | | 648 | |
Inergy, L.P. * | | | 54,952 | | | | 1,605 | |
International Coal Group, Inc. (a)* | | | 113,868 | | | | 591 | |
Lone Star Technologies, Inc. * | | | 40,425 | | | | 1,952 | |
| Lufkin Industries, Inc. | | | 14,195 | | | | 857 | |
Magellan Midstream Holdings LP (a) | | | 87,425 | | | | 2,010 | |
Magellan Midstream Partners (a) | | | 92,608 | | | | 3,620 | |
Natural Resource Partners L.P. (a) | | | 33,263 | | | | 1,733 | |
Newpark Resources, Inc. * | | | 81,810 | | | | 481 | |
NS Group, Inc. * | | | 31,016 | | | | 2,027 | |
Oceaneering International, Inc. * | | | 70,322 | | | | 2,531 | |
Oil States International, Inc. * | | | 63,236 | | | | 1,836 | |
OMI Corp. (a) | | | 104,787 | | | | 2,339 | |
| Overseas Shipholding Group, Inc. | | | 53,961 | | | | 3,375 | |
Pacific Energy Partners L.P. (a) | | | 47,887 | | | | 1,714 | |
Parker Drilling Co. * | | | 155,165 | | | | 1,271 | |
| Penn Virginia Corp. | | | 25,289 | | | | 1,809 | |
4 See financial notes.
Schwab Small-Cap Index Fund
Portfolio Holdings continued
| | | | | | | | | |
| | | Number of | | | Value | |
| Security | | Shares | | | ($ x 1,000) | |
| | | | | | | | | |
Penn Virginia Resource Partners, L.P. (a)* | | | 41,446 | | | | 1,084 | |
Petrohawk Energy Corp. (a)* | | | 193,850 | | | | 2,196 | |
Petroleum Development Corp. * | | | 19,903 | | | | 919 | |
Pioneer Drilling Co. * | | | 64,031 | | | | 841 | |
| Regency Energy Partners LP | | | 53,320 | | | | 1,386 | |
| RPC, Inc. | | | 83,926 | | | | 1,823 | |
SEACOR Holdings, Inc. * | | | 34,616 | | | | 3,097 | |
| Ship Finance International Ltd. | | | 95,125 | | | | 2,004 | |
Stone Energy Corp. * | | | 34,269 | | | | 1,335 | |
Sunoco Logistics Partners L.P. (a)* | | | 25,986 | | | | 1,212 | |
Superior Energy Services, Inc. * | | | 104,787 | | | | 3,280 | |
Swift Energy Co. * | | | 39,001 | | | | 1,822 | |
TETRA Technologies, Inc. (a)* | | | 85,674 | | | | 2,219 | |
The Houston Exploration Co. * | | | 36,501 | | | | 1,977 | |
Universal Compression Holdings, Inc. * | | | 39,803 | | | | 2,399 | |
USEC, Inc. * | | | 116,923 | | | | 1,305 | |
Veritas DGC, Inc. * | | | 52,792 | | | | 3,802 | |
W-H Energy Services, Inc. * | | | 34,578 | | | | 1,619 | |
Warren Resources, Inc. (a)* | | | 47,045 | | | | 555 | |
| Western Refining, Inc. | | | 92,722 | | | | 2,185 | |
Whiting Petroleum Corp. * | | | 46,811 | | | | 2,088 | |
| World Fuel Services Corp. | | | 34,978 | | | | 1,505 | |
| | | | | | | | |
| | | | | | | | 132,912 | |
| | | | | | | | | |
Food & Staples Retailing 1.0% | | | | | | | | |
| |
| Casey’s General Stores, Inc. | | | 64,726 | | | | 1,571 | |
Central European Distribution Corp. * | | | 24,517 | | | | 622 | |
| Longs Drug Stores Corp. | | | 52,605 | | | | 2,264 | |
Performance Food Group Co. * | | | 48,074 | | | | 1,398 | |
Rite Aid Corp. (a)* | | | 721,895 | | | | 3,379 | |
| Ruddick Corp. | | | 57,956 | | | | 1,634 | |
The Great Atlantic & Pacific Tea Co., Inc. * | | | 56,990 | | | | 1,577 | |
The Pantry, Inc. * | | | 30,276 | | | | 1,652 | |
United Natural Foods, Inc. * | | | 53,282 | | | | 1,860 | |
| Weis Markets, Inc. | | | 37,793 | | | | 1,534 | |
| | | | | | | | |
| | | | | | | | 17,491 | |
| | | | | | | | | |
Food, Beverage & Tobacco 1.7% | | | | | | | | |
| |
Chiquita Brands International, Inc. * | | | 57,002 | | | | 781 | |
| Corn Products International, Inc. | | | 101,390 | | | | 3,669 | |
| Delta & Pine Land Co. | | | 43,215 | | | | 1,751 | |
| Flowers Foods, Inc. | | | 81,284 | | | | 2,208 | |
Fresh Del Monte Produce, Inc. (a)* | | | 80,046 | | | | 1,248 | |
Gold Kist, Inc. * | | | 54,954 | | | | 1,089 | |
Hansen Natural Corp. (a)* | | | 112,460 | | | | 3,571 | |
| Lancaster Colony Corp. | | | 43,543 | | | | 1,766 | |
| Pilgrim’s Pride Corp., Class B | | | 88,880 | | | | 2,220 | |
Ralcorp Holdings, Inc. * | | | 36,235 | | | | 1,792 | |
Seaboard Corp. (b) | | | 1,875 | | | | 2,647 | |
The Hain Celestial Group, Inc. * | | | 47,931 | | | | 1,353 | |
| Tootsie Roll Industries, Inc. | | | 72,392 | | | | 2,301 | |
| Universal Corp. | | | 31,545 | | | | 1,161 | |
Vector Group Ltd. (a) | | | 71,250 | | | | 1,221 | |
| | | | | | | | |
| | | | | | | | 28,778 | |
| | | | | | | | | |
Health Care Equipment & Services 4.9% | | | | | | | | |
| |
Allscripts Healthcare Solutions, Inc. (a)* | | | 58,875 | | | | 1,389 | |
American Medical Systems Holdings, Inc. (a)* | | | 95,025 | | | | 1,692 | |
AMERIGROUP Corp. * | | | 69,442 | | | | 2,081 | |
| Analogic Corp. | | | 15,054 | | | | 840 | |
Apria Healthcare Group, Inc. * | | | 69,737 | | | | 1,624 | |
| Arrow International, Inc. | | | 58,720 | | | | 2,099 | |
Arthrocare Corp. (a)* | | | 32,330 | | | | 1,306 | |
Biosite, Inc. * | | | 23,575 | | | | 1,083 | |
| Brookdale Senior Living, Inc. | | | 78,669 | | | | 3,786 | |
Centene Corp. * | | | 51,692 | | | | 1,219 | |
Chemed Corp. (b) | | | 32,900 | | | | 1,168 | |
Conor Medsystems, Inc. * | | | 41,331 | | | | 1,015 | |
Cyberonics, Inc. (a)* | | | 29,385 | | | | 530 | |
Eclipsys Corp. * | | | 57,467 | | | | 1,218 | |
ev3, Inc. * | | | 46,423 | | | | 796 | |
Foxhollow Technologies, Inc. (a)* | | | 26,404 | | | | 924 | |
Genesis HealthCare Corp. * | | | 27,778 | | | | 1,345 | |
Haemonetics Corp. * | | | 33,655 | | | | 1,535 | |
HealthExtras, Inc. * | | | 47,365 | | | | 1,091 | |
Healthspring, Inc. * | | | 79,949 | | | | 1,610 | |
Healthways, Inc. * | | | 47,563 | | | | 2,014 | |
Immucor, Inc. * | | | 93,954 | | | | 2,587 | |
Integra LifeSciences Holdings * | | | 40,148 | | | | 1,483 | |
Intermagnetics General Corp. * | | | 38,914 | | | | 1,064 | |
| Invacare Corp. | | | 38,911 | | | | 849 | |
inVentiv Health, Inc. * | | | 37,301 | | | | 1,067 | |
Inverness Medical Innovations, Inc. (a)* | | | 26,856 | | | | 1,012 | |
Kindred Healthcare, Inc. * | | | 51,492 | | | | 1,390 | |
Kyphon, Inc. * | | | 55,736 | | | | 2,202 | |
| LCA-Vision, Inc. | | | 25,343 | | | | 890 | |
LifePoint Hospitals, Inc. * | | | 71,941 | | | | 2,554 | |
Magellan Health Services, Inc. * | | | 51,010 | | | | 2,226 | |
Matria Healthcare, Inc. (a)* | | | 21,841 | | | | 616 | |
Mentor Corp. (a)(b) | | | 59,996 | | | | 2,808 | |
Molina Healthcare, Inc. * | | | 44,813 | | | | 1,758 | |
Odyssey Healthcare, Inc. * | | | 48,141 | | | | 638 | |
| Owens & Minor, Inc. | | | 51,592 | | | | 1,626 | |
Per-Se Technologies, Inc. (a)* | | | 47,565 | | | | 1,164 | |
PolyMedica Corp. (a) | | | 31,147 | | | | 1,294 | |
PSS World Medical, Inc. * | | | 90,366 | | | | 1,818 | |
Psychiatric Solutions, Inc. * | | | 71,054 | | | | 2,359 | |
Sirona Dental Systems, Inc. * | | | 22,565 | | | | 835 | |
| Steris Corp. | | | 95,958 | | | | 2,339 | |
Sunrise Senior Living, Inc. * | | | 59,277 | | | | 1,850 | |
SurModics, Inc. (a)* | | | 25,819 | | | | 901 | |
Symmetry Medical, Inc. * | | | 38,991 | | | | 608 | |
Thoratec Corp. * | | | 66,726 | | | | 1,051 | |
TriZetto Group, Inc. * | | | 68,880 | | | | 1,177 | |
United Surgical Partners International, Inc. * | | | 60,344 | | | | 1,498 | |
Viasys Healthcare, Inc. * | | | 32,484 | | | | 931 | |
See financial notes. 5
Schwab Small-Cap Index Fund
Portfolio Holdings continued
| | | | | | | | | |
| | | Number of | | | Value | |
| Security | | Shares | | | ($ x 1,000) | |
| | | | | | | | | |
WebMD Health Corp., Class A (a)* | | | 69,724 | | | | 2,542 | |
WellCare Health Plans, Inc. * | | | 54,593 | | | | 3,207 | |
| West Pharmaceutical Services, Inc. | | | 44,265 | | | | 1,861 | |
| | | | | | | | |
| | | | | | | | 80,570 | |
| | | | | | | | | |
Household & Personal Products 0.7% | | | | | | | | |
| |
Central Garden & Pet Co. * | | | 22,392 | | | | 1,119 | |
Chattem, Inc. * | | | 26,313 | | | | 1,116 | |
Elizabeth Arden, Inc. * | | | 33,898 | | | | 591 | |
NBTY, Inc. * | | | 94,529 | | | | 2,630 | |
| Nu Skin Enterprises, Inc., Class A | | | 96,822 | | | | 1,851 | |
Playtex Products, Inc. * | | | 88,541 | | | | 1,234 | |
Revlon, Inc. (b)* | | | 533,983 | | | | 710 | |
Spectrum Brands, Inc. (a)* | | | 54,470 | | | | 530 | |
USANA Health Sciences, Inc. (a)* | | | 26,529 | | | | 1,192 | |
| | | | | | | | |
| | | | | | | | 10,973 | |
| | | | | | | | | |
Insurance 4.2% | | | | | | | | |
| |
| 21st Century Insurance Group | | | 114,205 | | | | 1,802 | |
| Alfa Corp. | | | 118,311 | | | | 2,185 | |
| American Equity Investment Life Holding Co. | | | 49,964 | | | | 638 | |
Arch Capital Group Ltd. * | | | 49,227 | | | | 3,165 | |
Argonaut Group, Inc. * | | | 46,100 | | | | 1,568 | |
| Aspen Insurance Holdings Ltd. | | | 105,962 | | | | 2,630 | |
| Assured Guaranty Ltd. | | | 82,537 | | | | 2,077 | |
CNA Surety Corp. * | | | 71,600 | | | | 1,456 | |
| Commerce Group, Inc. | | | 93,348 | | | | 2,763 | |
| Delphi Financial Group, Inc., Class A | | | 71,880 | | | | 2,821 | |
| FBL Financial Group, Inc., Class A | | | 47,368 | | | | 1,674 | |
| Great American Financial Resources, Inc. | | | 83,565 | | | | 1,931 | |
| Harleysville Group, Inc. | | | 50,760 | | | | 1,831 | |
| Hilb, Rogal & Hobbs Co. | | | 54,619 | | | | 2,180 | |
| Horace Mann Educators Corp. | | | 59,678 | | | | 1,202 | |
| Infinity Property & Casualty Corp. | | | 28,892 | | | | 1,243 | |
| IPC Holdings Ltd. | | | 86,677 | | | | 2,604 | |
| LandAmerica Financial Group, Inc. | | | 28,933 | | | | 1,825 | |
| Max Re Capital Ltd. | | | 79,384 | | | | 1,848 | |
| Montpelier Re Holdings Ltd. | | | 124,449 | | | | 2,209 | |
| National Financial Partners Corp. | | | 45,638 | | | | 1,798 | |
National Western Life Insurance Co., Class A * | | | 5,594 | | | | 1,342 | |
Navigators Group, Inc. * | | | 21,485 | | | | 1,011 | |
Odyssey Re Holdings Corp. (a) | | | 96,583 | | | | 3,424 | |
| Ohio Casualty Corp. | | | 85,043 | | | | 2,333 | |
| Platinum Underwriters Holdings, Ltd. | | | 73,457 | | | | 2,193 | |
ProAssurance Corp. * | | | 48,289 | | | | 2,352 | |
| RLI Corp. | | | 35,155 | | | | 1,906 | |
| Scottish Re Group Ltd. | | | 68,688 | | | | 785 | |
| Selective Insurance Group, Inc. | | | 42,857 | | | | 2,368 | |
| State Auto Financial Corp. | | | 62,256 | | | | 2,000 | |
| Stewart Information Services Corp. | | | 23,843 | | | | 884 | |
| The Phoenix Cos., Inc. | | | 143,992 | | | | 2,281 | |
| United Fire & Casualty Co. | | | 34,300 | | | | 1,214 | |
Universal American Financial Corp. * | | | 85,502 | | | | 1,590 | |
USI Holdings Corp. * | | | 61,971 | | | | 987 | |
| Zenith National Insurance Corp. | | | 49,545 | | | | 2,305 | |
| | | | | | | | |
| | | | | | | | 70,425 | |
| | | | | | | | | |
Materials 5.0% | | | | | | | | |
| |
| A. Schulman, Inc. | | | 42,709 | | | | 1,034 | |
AK Steel Holding Corp. * | | | 167,419 | | | | 2,500 | |
| Albemarle Corp. | | | 63,716 | | | | 4,144 | |
Aleris International, Inc. * | | | 35,799 | | | | 1,844 | |
AMCOL International Corp. (a) | | | 34,352 | | | | 904 | |
| Aptargroup, Inc. | | | 50,163 | | | | 2,755 | |
| Arch Chemicals, Inc. | | | 32,672 | | | | 1,093 | |
Bowater, Inc. (a) | | | 66,581 | | | | 1,392 | |
| Carpenter Technology Corp. | | | 36,101 | | | | 3,863 | |
Century Aluminum Co. (a)* | | | 40,074 | | | | 1,560 | |
| CF Industries Holdings, Inc. | | | 76,753 | | | | 1,521 | |
| Chaparral Steel Co. | | | 63,646 | | | | 2,647 | |
Cleveland-Cliffs, Inc. (a) | | | 54,698 | | | | 2,313 | |
Coeur d’Alene Mines Corp. (a)* | | | 316,606 | | | | 1,551 | |
| Compass Minerals International, Inc. | | | 43,082 | | | | 1,333 | |
| Ferro Corp. | | | 53,277 | | | | 1,051 | |
| Georgia Gulf Corp. | | | 41,655 | | | | 891 | |
| Gibraltar Industries, Inc. | | | 44,711 | | | | 944 | |
Graphic Packaging Corp. * | | | 215,915 | | | | 842 | |
| Greif, Inc., Class A | | | 35,431 | | | | 3,320 | |
| H.B. Fuller Co. | | | 88,516 | | | | 2,194 | |
Headwaters, Inc. (a)* | | | 55,014 | | | | 1,362 | |
Hercules, Inc. * | | | 169,914 | | | | 3,093 | |
| Kronos Worldwide, Inc. | | | 49,005 | | | | 1,461 | |
| MacDermid, Inc. | | | 42,282 | | | | 1,414 | |
| Metal Management, Inc. | | | 35,021 | | | | 962 | |
| Minerals Technologies, Inc. | | | 25,461 | | | | 1,404 | |
NL Industries, Inc. (a) | | | 62,046 | | | | 689 | |
| Olin Corp. | | | 93,291 | | | | 1,614 | |
Oregon Steel Mills, Inc. * | | | 48,885 | | | | 2,659 | |
PolyOne Corp. * | | | 123,875 | | | | 1,016 | |
| Quanex Corp. | | | 56,404 | | | | 1,890 | |
Rockwood Holdings, Inc. * | | | 98,688 | | | | 2,300 | |
Royal Gold, Inc. (a) | | | 32,138 | | | | 946 | |
| RPM International, Inc. | | | 134,451 | | | | 2,575 | |
RTI International Metals, Inc. (a)* | | | 25,166 | | | | 1,543 | |
Ryerson Tull, Inc. (a) | | | 33,292 | | | | 802 | |
| Schnitzer Steel Industries, Inc., Class A | | | 39,055 | | | | 1,365 | |
| Sensient Technologies Corp. | | | 65,425 | | | | 1,508 | |
| Silgan Holdings, Inc. | | | 55,912 | | | | 2,313 | |
| Spartech Corp. | | | 44,813 | | | | 1,228 | |
| Steel Dynamics, Inc. | | | 67,162 | | | | 4,037 | |
Stillwater Mining Co. * | | | 113,541 | | | | 1,221 | |
Symyx Technologies, Inc. * | | | 44,812 | | | | 1,100 | |
Texas Industries, Inc. (a) | | | 30,751 | | | | 1,910 | |
| Wausau-Mosinee Paper Corp. | | | 58,820 | | | | 798 | |
| Worthington Industries, Inc. | | | 112,560 | | | | 1,945 | |
| | | | | | | | |
| | | | | | | | 82,851 | |
6 See financial notes.
Schwab Small-Cap Index Fund
Portfolio Holdings continued
| | | | | | | | | |
| | | Number of | | | Value | |
| Security | | Shares | | | ($ x 1,000) | |
| | | | | | | | | |
Media 2.1% | | | | | | | | |
| |
| Advo, Inc. | | | 37,205 | | | | 1,092 | |
| Arbitron, Inc. | | | 41,256 | | | | 1,733 | |
| Catalina Marketing Corp. | | | 67,006 | | | | 1,699 | |
| Citadel Broadcasting Co. | | | 171,124 | | | | 1,752 | |
CKX, Inc. * | | | 87,671 | | | | 1,201 | |
Crown Media Holdings, Inc., Class A (a)* | | | 57,213 | | | | 228 | |
Cumulus Media, Inc., Class A (a)* | | | 72,889 | | | | 781 | |
| Entercom Communications Corp. | | | 58,784 | | | | 1,627 | |
Entravision Communications Corp. * | | | 58,927 | | | | 432 | |
Gemstar — TV Guide International, Inc. (b)* | | | 472,286 | | | | 1,644 | |
| Hearst-Argyle Television, Inc. | | | 71,980 | | | | 1,814 | |
| Journal Communications, Inc., Class A | | | 98,678 | | | | 1,154 | |
| Lee Enterprises, Inc. | | | 54,740 | | | | 1,562 | |
Live Nation, Inc. * | | | 90,289 | | | | 1,919 | |
Martha Stewart Living Omnimedia, Class A (a)* | | | 72,005 | | | | 1,526 | |
| Media General, Inc., Class A | | | 32,336 | | | | 1,200 | |
Mediacom Communications Corp., Class A * | | | 163,086 | | | | 1,362 | |
Morningstar, Inc. * | | | 41,951 | | | | 1,717 | |
Radio One, Inc., Class A * | | | 154,088 | | | | 1,062 | |
RCN Corp. * | | | 50,068 | | | | 1,446 | |
| Readers Digest Association, Inc., Class A | | | 128,843 | | | | 1,853 | |
Scholastic Corp. * | | | 55,269 | | | | 1,737 | |
| Sun-Times Media Group, Inc., Class A | | | 134,680 | | | | 781 | |
Valassis Communications, Inc. * | | | 65,162 | | | | 978 | |
| Westwood One, Inc. | | | 106,610 | | | | 843 | |
| World Wrestling Entertainment, Inc. | | | 97,288 | | | | 1,622 | |
| | | | | | | | |
| | | | | | | | 34,765 | |
| | | | | | | | | |
Pharmaceuticals & Biotechnology 4.6% | | | | | | | | |
| |
Adams Respiratory Therapeutics, Inc. * | | | 44,510 | | | | 1,918 | |
Adolor Corp. * | | | 54,247 | | | | 744 | |
Alexion Pharmaceuticals, Inc. (a)* | | | 39,628 | | | | 1,480 | |
| Alpharma, Inc., Class A | | | 73,230 | | | | 1,616 | |
Andrx Corp. * | | | 101,578 | | | | 2,498 | |
Applera Corp. — Celera Genomics Group * | | | 101,917 | | | | 1,582 | |
Bio-Rad Laboratories, Inc., Class A * | | | 39,731 | | | | 2,917 | |
BioMarin Pharmaceuticals, Inc. * | | | 102,214 | | | | 1,638 | |
Bruker BioSciences Corp. * | | | 32,426 | | | | 258 | |
Cubist Pharmaceuticals, Inc. * | | | 60,332 | | | | 1,344 | |
CV Therapeutics, Inc. (a)* | | | 52,063 | | | | 674 | |
Digene Corp. * | | | 31,316 | | | | 1,454 | |
Dionex Corp. * | | | 24,844 | | | | 1,352 | |
eResearch Technology, Inc. (a)* | | | 47,155 | | | | 388 | |
Exelixis, Inc. * | | | 66,572 | | | | 646 | |
Human Genome Sciences, Inc. * | | | 167,581 | | | | 2,237 | |
ICOS Corp. * | | | 88,589 | | | | 2,810 | |
Idenix Pharmaceuticals, Inc. (a)* | | | 45,058 | | | | 383 | |
Illumina, Inc. * | | | 50,994 | | | | 2,242 | |
KV Pharmaceutical Co., Class A * | | | 76,401 | | | | 1,705 | |
MannKind Corp. (a)* | | | 36,232 | | | | 734 | |
Martek Biosciences Corp. (a)* | | | 38,976 | | | | 924 | |
Medarex, Inc. * | | | 145,550 | | | | 1,880 | |
Medicis Pharmaceutical Corp., Class A (a) | | | 74,549 | | | | 2,612 | |
MGI Pharma, Inc. (b)* | | | 99,791 | | | | 1,899 | |
Momenta Pharmaceuticals, Inc. (a)* | | | 30,383 | | | | 453 | |
Myogen, Inc. * | | | 52,687 | | | | 2,756 | |
Myriad Genetics, Inc. * | | | 46,765 | | | | 1,257 | |
Nektar Therapeutics (a)* | | | 110,171 | | | | 1,590 | |
New River Pharmaceuticals, Inc. (a)* | | | 31,777 | | | | 1,616 | |
Nuvelo, Inc. * | | | 65,908 | | | | 1,215 | |
Onyx Pharmaceuticals, Inc. (a)* | | | 49,666 | | | | 933 | |
OSI Pharmaceuticals, Inc. (a)* | | | 74,491 | | | | 2,852 | |
Par Pharmaceutical Cos., Inc. * | | | 42,280 | | | | 824 | |
PAREXEL International Corp. * | | | 12,509 | | | | 370 | |
| Perrigo Co. | | | 130,651 | | | | 2,337 | |
Progenics Pharmaceuticals, Inc. * | | | 33,697 | | | | 880 | |
Regeneron Pharmaceuticals, Inc. * | | | 74,349 | | | | 1,491 | |
Salix Pharmaceuticals Ltd. * | | | 63,733 | | | | 850 | |
Sciele Pharma, Inc. * | | | 49,432 | | | | 1,078 | |
Tanox, Inc. * | | | 56,454 | | | | 758 | |
Telik, Inc. (a)* | | | 63,826 | | | | 1,209 | |
The Medicines Co. * | | | 60,508 | | | | 1,571 | |
Theravance, Inc. * | | | 80,538 | | | | 2,534 | |
United Therapeutics Corp. (a)* | | | 31,576 | | | | 1,890 | |
Valeant Pharmaceuticals International * | | | 127,586 | | | | 2,383 | |
Varian, Inc. * | | | 49,171 | | | | 2,306 | |
Ventana Medical Systems, Inc. * | | | 48,506 | | | | 1,959 | |
ViroPharma, Inc. * | | | 93,374 | | | | 1,245 | |
ZymoGenetics, Inc. * | | | 82,977 | | | | 1,332 | |
| | | | | | | | |
| | | | | | | | 75,624 | |
| | | | | | | | | |
Real Estate 7.0% | | | | | | | | |
| |
Alexander’s, Inc. * | | | 7,210 | | | | 2,630 | |
| Alexandria Real Estate Equities, Inc. | | | 31,429 | | | | 3,133 | |
| American Financial Realty Trust | | | 179,117 | | | | 2,090 | |
American Home Mortgage Investment Corp. (a) | | | 69,169 | | | | 2,364 | |
| Annaly Mortgage Management, Inc. | | | 169,245 | | | | 2,221 | |
| Biomed Property Trust, Inc. | | | 62,234 | | | | 2,006 | |
Commercial Net Lease Realty (a) | | | 75,126 | | | | 1,688 | |
Corporate Office Properties Trust SBI (a) | | | 55,249 | | | | 2,640 | |
| Cousins Properties, Inc. | | | 70,545 | | | | 2,523 | |
| Digital Realty Trust, Inc. | | | 27,304 | | | | 912 | |
| EastGroup Properties, Inc. | | | 30,590 | | | | 1,628 | |
| Entertainment Properties Trust | | | 34,955 | | | | 1,923 | |
| Equity Inns, Inc. | | | 73,687 | | | | 1,236 | |
See financial notes. 7
Schwab Small-Cap Index Fund
Portfolio Holdings continued
| | | | | | | | | |
| | | Number of | | | Value | |
| Security | | Shares | | | ($ x 1,000) | |
| | | | | | | | | |
| Equity Lifestyle Properties, Inc. | | | 31,859 | | | | 1,570 | |
| Equity One, Inc. | | | 104,337 | | | | 2,621 | |
| Extra Space Storage, Inc. | | | 51,858 | | | | 956 | |
FelCor Lodging Trust, Inc. * | | | 82,894 | | | | 1,721 | |
First Industrial Realty Trust (a) | | | 60,301 | | | | 2,772 | |
| Franklin Street Properties Corp. | | | 76,865 | | | | 1,580 | |
Friedman, Billings, Ramsey Group, Inc., Class A (a) | | | 218,817 | | | | 1,670 | |
Getty Realty Corp. (a) | | | 34,442 | | | | 1,102 | |
Glimcher Realty Trust (a) | | | 49,548 | | | | 1,276 | |
| Healthcare Realty Trust, Inc. | | | 65,681 | | | | 2,660 | |
| Highwoods Properties, Inc. | | | 74,842 | | | | 2,859 | |
Home Properties, Inc. (a) | | | 43,965 | | | | 2,777 | |
| Inland Real Estate Corp. | | | 93,136 | | | | 1,741 | |
| Innkeepers USA Trust | | | 52,723 | | | | 904 | |
| Kilroy Realty Corp. | | | 39,658 | | | | 2,987 | |
| KKR Financial Corp. | | | 112,163 | | | | 3,009 | |
| LaSalle Hotel Properties | | | 49,326 | | | | 2,084 | |
Lexington Corp. Properties Trust (a) | | | 72,291 | | | | 1,540 | |
| Longview Fibre Co. | | | 89,821 | | | | 1,892 | |
| Maguire Properties, Inc. | | | 61,635 | | | | 2,636 | |
| Mid-America Apartment Communities, Inc. | | | 30,352 | | | | 1,932 | |
Move, Inc. * | | | 181,052 | | | | 865 | |
| National Health Investors, Inc. | | | 38,368 | | | | 1,233 | |
| Nationwide Health Properties, Inc. | | | 94,280 | | | | 2,710 | |
| Newcastle Investment Corp. | | | 60,230 | | | | 1,787 | |
Novastar Financial, Inc. (a) | | | 41,026 | | | | 1,310 | |
| Omega Healthcare Investors, Inc. | | | 77,858 | | | | 1,314 | |
| Pennsylvania Real Estate Investment Trust | | | 50,312 | | | | 2,168 | |
| Post Properties, Inc. | | | 56,867 | | | | 2,785 | |
| Potlatch Corp. | | | 50,803 | | | | 2,063 | |
| PS Business Parks, Inc. | | | 30,438 | | | | 2,004 | |
| RAIT Investment Trust | | | 38,506 | | | | 1,158 | |
Realty Income Corp. (a) | | | 115,196 | | | | 3,041 | |
| Redwood Trust, Inc. | | | 34,329 | | | | 1,887 | |
| Senior Housing Properties Trust | | | 100,216 | | | | 2,298 | |
Sovran Self Storage, Inc. (a) | | | 22,026 | | | | 1,299 | |
| Spirit Finance Corp. | | | 111,121 | | | | 1,323 | |
| Strategic Hotel & Resorts, Inc. | | | 67,931 | | | | 1,445 | |
| Sunstone Hotel Investors, Inc. | | | 74,509 | | | | 2,195 | |
| Tanger Factory Outlet Centers, Inc. | | | 43,034 | | | | 1,605 | |
| Taubman Centers, Inc. | | | 70,883 | | | | 3,324 | |
Tejon Ranch Co. * | | | 19,392 | | | | 941 | |
Trammell Crow Co. * | | | 45,293 | | | | 2,208 | |
Trustreet Properties, Inc. (a) | | | 92,532 | | | | 1,570 | |
| U-store-It Trust | | | 75,979 | | | | 1,669 | |
Washington Real Estate Investment Trust (a) | | | 58,282 | | | | 2,457 | |
| | | | | | | | |
| | | | | | | | 115,942 | |
| | | | | | | | | |
Retailing 5.5% | | | | | | | | |
| |
99 Cents Only Stores * | | | 97,006 | | | | 1,163 | |
| Aaron Rents, Inc. | | | 64,371 | | | | 1,602 | |
Aeropostale, Inc. * | | | 71,988 | | | | 2,110 | |
bebe stores, Inc. (b) | | | 122,563 | | | | 3,043 | |
Big Lots, Inc. * | | | 161,833 | | | | 3,411 | |
Blockbuster, Inc., Class A (a)* | | | 265,621 | | | | 1,041 | |
| Borders Group, Inc. | | | 89,850 | | | | 1,850 | |
Building Material Holding Corp. (a) | | | 35,248 | | | | 919 | |
Cabela’s, Inc., Class A (a)* | | | 84,836 | | | | 2,002 | |
Charming Shoppes, Inc. * | | | 170,253 | | | | 2,520 | |
| Christopher & Banks Corp. | | | 48,724 | | | | 1,315 | |
Coldwater Creek, Inc. * | | | 120,979 | | | | 3,689 | |
Conn’s, Inc. (a)* | | | 26,403 | | | | 634 | |
CSK Auto Corp. * | | | 61,103 | | | | 953 | |
Dick’s Sporting Goods, Inc. * | | | 68,840 | | | | 3,425 | |
Dress Barn, Inc. * | | | 84,512 | | | | 1,836 | |
DSW, Inc. (a)* | | | 58,697 | | | | 2,031 | |
Genesco, Inc. * | | | 29,044 | | | | 1,091 | |
| Group 1 Automotive, Inc. | | | 31,664 | | | | 1,815 | |
Guess?, Inc. * | | | 62,886 | | | | 3,581 | |
Guitar Center, Inc. * | | | 32,874 | | | | 1,426 | |
Hibbett Sporting Goods, Inc. * | | | 45,775 | | | | 1,338 | |
Jos. A. Bank Clothiers, Inc. (a)* | | | 23,212 | | | | 689 | |
Keystone Automotive Industries, Inc. * | | | 20,135 | | | | 774 | |
NetFlix, Inc. (a)* | | | 82,886 | | | | 2,293 | |
New York & Co., Inc. * | | | 70,523 | | | | 917 | |
Nutri/System, Inc. (a)* | | | 42,048 | | | | 2,593 | |
| OfficeMax, Inc. | | | 96,592 | | | | 4,596 | |
Pacific Sunwear of California, Inc. * | | | 94,761 | | | | 1,670 | |
Payless Shoesource, Inc. * | | | 104,919 | | | | 2,807 | |
Pier 1 Imports, Inc. (a) | | | 114,402 | | | | 748 | |
Priceline.com, Inc. (a)* | | | 54,130 | | | | 2,181 | |
Rent-A-Center, Inc. * | | | 98,405 | | | | 2,830 | |
Select Comfort Corp. (a)* | | | 66,001 | | | | 1,411 | |
| Sonic Automotive, Inc. | | | 40,832 | | | | 1,074 | |
| Stage Stores, Inc. | | | 32,818 | | | | 1,064 | |
Stamps.com, Inc. * | | | 27,811 | | | | 446 | |
| Stein Mart, Inc. | | | 53,599 | | | | 877 | |
| Talbots, Inc. | | | 74,770 | | | | 2,097 | |
| The Buckle, Inc. | | | 24,784 | | | | 981 | |
| The Cato Corp., Class A | | | 11,504 | | | | 263 | |
The Children’s Place Retail Stores, Inc. * | | | 34,813 | | | | 2,443 | |
| The Finish Line, Class A | | | 57,517 | | | | 745 | |
The Gymboree Corp. * | | | 42,910 | | | | 1,994 | |
The Men’s Wearhouse, Inc. (b) | | | 82,645 | | | | 3,293 | |
| The Pep Boys-Manny, Moe & Jack | | | 75,504 | | | | 1,071 | |
Tuesday Morning Corp. (a) | | | 49,425 | | | | 815 | |
Tween Brands, Inc. * | | | 46,055 | | | | 1,926 | |
United Auto Group, Inc. (a) | | | 123,616 | | | | 2,841 | |
VistaPrint Ltd. * | | | 48,900 | | | | 1,530 | |
Zale Corp. (b)* | | | 68,744 | | | | 1,983 | |
| | | | | | | | |
| | | | | | | | 91,747 | |
| | | | | | | | | |
Semiconductors & Semiconductor Equipment 3.4% | | | | | | | | |
| |
AMIS Holdings, Inc. * | | | 125,998 | | | | 1,208 | |
Amkor Technology, Inc. (a)* | | | 245,218 | | | | 1,695 | |
Applied Micro Circuits Corp. (b)* | | | 461,563 | | | | 1,408 | |
Atheros Communications (a)* | | | 62,643 | | | | 1,361 | |
ATMI, Inc. * | | | 51,954 | | | | 1,647 | |
Axcelis Technologies, Inc. * | | | 135,141 | | | | 933 | |
Brooks Automation, Inc. * | | | 114,831 | | | | 1,631 | |
8 See financial notes.
Schwab Small-Cap Index Fund
Portfolio Holdings continued
| | | | | | | | | |
| | | Number of | | | Value | |
| Security | | Shares | | | ($ x 1,000) | |
| | | | | | | | | |
Cabot Microelectronics Corp. * | | | 34,600 | | | | 988 | |
Cirrus Logic, Inc. * | | | 139,004 | | | | 981 | |
Conexant Systems, Inc. (b)* | | | 617,555 | | | | 1,192 | |
Credence Systems Corp. * | | | 138,747 | | | | 447 | |
Cree, Inc. (a)* | | | 101,396 | | | | 2,230 | |
Cymer, Inc. * | | | 56,165 | | | | 2,602 | |
Diodes, Inc. (a)* | | | 35,154 | | | | 1,548 | |
DSP Group, Inc. * | | | 31,411 | | | | 682 | |
Entegris, Inc. * | | | 189,572 | | | | 2,125 | |
FormFactor, Inc. * | | | 57,373 | | | | 2,191 | |
Genesis Microchip, Inc. (a)* | | | 46,089 | | | | 472 | |
Hittite Microwave Corp. * | | | 39,909 | | | | 1,369 | |
Micrel, Inc. * | | | 116,105 | | | | 1,296 | |
Microsemi Corp. * | | | 86,019 | | | | 1,686 | |
MKS Instruments, Inc. * | | | 84,499 | | | | 1,829 | |
OmniVision Technologies, Inc. (a)* | | | 64,073 | | | | 1,052 | |
ON Semiconductor Corp. (b)* | | | 387,846 | | | | 2,412 | |
Photronics, Inc. * | | | 55,774 | | | | 780 | |
PMC — Sierra, Inc. (a)* | | | 254,323 | | | | 1,686 | |
Power Integrations, Inc. * | | | 47,962 | | | | 1,052 | |
RF Micro Devices, Inc. * | | | 252,854 | | | | 1,846 | |
Semtech Corp. * | | | 113,829 | | | | 1,483 | |
Silicon Image, Inc. * | | | 111,022 | | | | 1,313 | |
SiRF Technology Holdings, Inc. (a)* | | | 64,046 | | | | 1,801 | |
Skyworks Solutions, Inc. * | | | 205,708 | | | | 1,364 | |
Spansion, Inc. Class A (a)* | | | 171,763 | | | | 2,449 | |
Standard Microsystems Corp. * | | | 20,592 | | | | 635 | |
Tessera Technologies, Inc. * | | | 55,290 | | | | 1,930 | |
Trident Microsystems, Inc. * | | | 80,243 | | | | 1,696 | |
Varian Semiconductor Equipment Associates, Inc. * | | | 78,714 | | | | 2,872 | |
Vitesse Semiconductor Corp. (a)* | | | 306,394 | | | | 359 | |
Zoran Corp. * | | | 68,524 | | | | 954 | |
| | | | | | | | |
| | | | | | | | 57,205 | |
| | | | | | | | | |
Software & Services 7.2% | | | | | | | | |
| |
Advent Software, Inc. * | | | 51,014 | | | | 1,889 | |
Ansys, Inc. * | | | 52,024 | | | | 2,393 | |
aQuantive, Inc. (a)* | | | 97,522 | | | | 2,651 | |
BearingPoint, Inc. * | | | 274,757 | | | | 2,289 | |
| Blackbaud, Inc. | | | 59,369 | | | | 1,484 | |
Blackboard, Inc. (a)* | | | 35,961 | | | | 997 | |
CACI International, Inc., Class A * | | | 39,627 | | | | 2,280 | |
Clarent Corp. * | | | 105,200 | | | | 2 | |
CNET Networks, Inc. * | | | 198,430 | | | | 1,774 | |
CSG Systems International, Inc. * | | | 78,045 | | | | 2,106 | |
DealerTrack Holdings, Inc. * | | | 44,336 | | | | 1,130 | |
Digital Insight Corp. * | | | 44,337 | | | | 1,365 | |
Digital River, Inc. * | | | 47,870 | | | | 2,769 | |
Digitas, Inc. * | | | 121,908 | | | | 1,287 | |
EarthLink, Inc. * | | | 216,981 | | | | 1,523 | |
eFunds Corp. * | | | 55,913 | | | | 1,387 | |
Equinix, Inc. (a)* | | | 35,147 | | | | 2,404 | |
Euronet Worldwide, Inc. (a)* | | | 43,736 | | | | 1,300 | |
| FactSet Research Systems, Inc. | | | 66,796 | | | | 3,400 | |
Gartner, Inc. * | | | 149,949 | | | | 2,789 | |
| Gevity HR, Inc. | | | 37,581 | | | | 849 | |
Heartland Payment Systems, Inc. (a) | | | 45,670 | | | | 1,220 | |
Hyperion Solutions Corp. * | | | 86,914 | | | | 3,251 | |
Informatica Corp. * | | | 135,581 | | | | 1,680 | |
Infospace, Inc. * | | | 46,479 | | | | 939 | |
Intergraph Corp. * | | | 44,162 | | | | 1,929 | |
j2 Global Communications, Inc. (a)* | | | 68,328 | | | | 1,875 | |
| Jack Henry & Associates, Inc. | | | 106,620 | | | | 2,323 | |
Kronos, Inc. * | | | 44,255 | | | | 1,500 | |
Lawson Software, Inc. * | | | 171,651 | | | | 1,308 | |
Macrovision Corp. * | | | 73,451 | | | | 1,955 | |
Manhattan Associates, Inc. * | | | 6,247 | | | | 185 | |
ManTech International Corp., Class A * | | | 39,282 | | | | 1,338 | |
Marchex, Inc., Class B (a)* | | | 37,600 | | | | 533 | |
| MAXIMUS, Inc. | | | 26,774 | | | | 747 | |
Mentor Graphics Corp. * | | | 121,767 | | | | 2,054 | |
Micros Systems, Inc. * | | | 52,817 | | | | 2,624 | |
MicroStrategy, Inc., Class A * | | | 21,162 | | | | 2,526 | |
Midway Games, Inc. (a)* | | | 116,054 | | | | 993 | |
MPS Group, Inc. * | | | 154,646 | | | | 2,358 | |
Nuance Communications, Inc. (a)* | | | 193,257 | | | | 2,230 | |
Openwave Systems, Inc. * | | | 123,792 | | | | 1,068 | |
Opsware, Inc. * | | | 110,042 | | | | 1,000 | |
Parametric Technology Corp. * | | | 149,552 | | | | 2,922 | |
Perot Systems Corp., Class A * | | | 164,492 | | | | 2,426 | |
Progress Software Corp. * | | | 51,480 | | | | 1,482 | |
Quality Systems, Inc. * | | | 32,172 | | | | 1,365 | |
Quest Software, Inc. * | | | 138,488 | | | | 2,040 | |
RealNetworks, Inc. * | | | 236,530 | | | | 2,597 | |
Sapient Corp. (a)* | | | 106,663 | | | | 581 | |
Secure Computing Corp. * | | | 73,419 | | | | 527 | |
SRA International, Inc., Class A * | | | 69,595 | | | | 2,231 | |
Sybase, Inc. * | | | 135,719 | | | | 3,305 | |
Syntel, Inc. (a) | | | 49,458 | | | | 1,239 | |
Take-Two Interactive Software, Inc. (a)* | | | 89,004 | | | | 1,245 | |
| Talx Corp. | | | 34,153 | | | | 831 | |
The BISYS Group, Inc. * | | | 167,618 | | | | 1,851 | |
THQ, Inc. * | | | 79,461 | | | | 2,389 | |
TIBCO Software, Inc. * | | | 301,136 | | | | 2,786 | |
Transaction Systems Architects, Inc., Class A * | | | 50,259 | | | | 1,694 | |
| United Online, Inc. | | | 101,887 | | | | 1,378 | |
ValueClick, Inc. * | | | 133,043 | | | | 2,501 | |
VeriFone Holdings, Inc. (a)* | | | 90,343 | | | | 2,639 | |
Verint Systems, Inc. * | | | 44,222 | | | | 1,448 | |
WebEx Communications, Inc. * | | | 64,659 | | | | 2,486 | |
Websense, Inc. * | | | 70,904 | | | | 1,941 | |
Wind River Systems, Inc. * | | | 118,836 | | | | 1,305 | |
Wright Express Corp. * | | | 43,376 | | | | 1,187 | |
| | | | | | | | |
| | | | | | | | 120,100 | |
| | | | | | | | | |
Technology Hardware & Equipment 5.3% | | | | | | | | |
| |
3Com Corp. * | | | 517,119 | | | | 2,513 | |
Adaptec, Inc. * | | | 182,113 | | | | 825 | |
Aeroflex, Inc. * | | | 94,880 | | | | 1,025 | |
Anixter International, Inc. (a)* | | | 52,843 | | | | 3,158 | |
See financial notes. 9
Schwab Small-Cap Index Fund
Portfolio Holdings continued
| | | | | | | | | |
| | | Number of | | | Value | |
| Security | | Shares | | | ($ x 1,000) | |
| | | | | | | | | |
Arris Group, Inc. * | | | 144,990 | | | | 1,943 | |
Avid Technology, Inc. (a)* | | | 50,605 | | | | 1,828 | |
Avocent Corp. * | | | 65,856 | | | | 2,418 | |
Benchmark Electronics, Inc. * | | | 86,494 | | | | 2,296 | |
| Black Box Corp. | | | 19,892 | | | | 887 | |
Brightpoint, Inc. * | | | 68,295 | | | | 826 | |
Brocade Communications Systems, Inc. (b)* | | | 383,283 | | | | 3,108 | |
Checkpoint Systems, Inc. * | | | 56,844 | | | | 1,035 | |
Cogent, Inc. * | | | 105,809 | | | | 1,217 | |
| Cognex Corp. | | | 61,809 | | | | 1,423 | |
Coherent, Inc. * | | | 50,300 | | | | 1,621 | |
CommScope, Inc. * | | | 82,649 | | | | 2,637 | |
Dycom Industries, Inc. * | | | 55,932 | | | | 1,304 | |
Electro Scientific Industries, Inc. * | | | 39,085 | | | | 780 | |
Electronics for Imaging, Inc. * | | | 73,409 | | | | 1,735 | |
Emulex Corp. * | | | 129,290 | | | | 2,431 | |
FLIR Systems, Inc. (a)* | | | 83,754 | | | | 2,675 | |
Foundry Networks, Inc. * | | | 187,424 | | | | 2,373 | |
Gateway, Inc. (b)* | | | 417,106 | | | | 701 | |
Global Imaging Systems, Inc. * | | | 54,654 | | | | 1,190 | |
Hutchinson Technology, Inc. * | | | 26,486 | | | | 613 | |
| Imation Corp. | | | 52,013 | | | | 2,381 | |
Insight Enterprises, Inc. * | | | 59,600 | | | | 1,281 | |
InterDigital Communications Corp. * | | | 82,994 | | | | 2,968 | |
Intermec, Inc. * | | | 84,440 | | | | 1,908 | |
Itron, Inc. (a)* | | | 32,459 | | | | 1,767 | |
Ixia * | | | 64,940 | | | | 594 | |
Kemet Corp. * | | | 129,031 | | | | 948 | |
Komag, Inc. (a)* | | | 38,484 | | | | 1,472 | |
L-1 Identity Solutions, Inc. (a)* | | | 36,584 | | | | 524 | |
MasTec, Inc. * | | | 53,073 | | | | 581 | |
| MTS Systems Corp. | | | 32,375 | | | | 1,078 | |
Multi-Fineline Electronix, Inc. (a)* | | | 22,181 | | | | 536 | |
Newport Corp. * | | | 55,737 | | | | 1,205 | |
Palm, Inc. (a)* | | | 132,160 | | | | 2,029 | |
Paxar Corp. * | | | 52,961 | | | | 1,060 | |
Plantronics, Inc. (a) | | | 50,093 | | | | 1,058 | |
Plexus Corp. * | | | 58,862 | | | | 1,290 | |
Polycom, Inc. * | | | 138,739 | | | | 3,801 | |
Powerwave Technologies, Inc. (a)* | | | 136,674 | | | | 890 | |
Rackable Systems, Inc. * | | | 31,589 | | | | 980 | |
Redback Networks, Inc. * | | | 76,859 | | | | 1,216 | |
Rofin-Sinar Technologies, Inc. * | | | 24,268 | | | | 1,494 | |
Rogers Corp. * | | | 23,367 | | | | 1,635 | |
ScanSource, Inc. * | | | 33,778 | | | | 1,060 | |
Sonus Networks, Inc. (a)* | | | 306,958 | | | | 1,605 | |
Sycamore Networks, Inc. (b)* | | | 366,015 | | | | 1,373 | |
SYNNEX Corp. * | | | 12,600 | | | | 283 | |
| Technitrol, Inc. | | | 54,043 | | | | 1,363 | |
Tekelec * | | | 88,927 | | | | 1,312 | |
Trimble Navigation Ltd. * | | | 74,801 | | | | 3,457 | |
UTStarcom, Inc. (a)* | | | 152,163 | | | | 1,639 | |
ViaSat, Inc. * | | | 27,019 | | | | 733 | |
| | | | | | | | |
| | | | | | | | 88,083 | |
| | | | | | | | | |
Telecommunication Services 1.2% | | | | | | | | |
| |
Broadwing Corp. * | | | 104,779 | | | | 1,570 | |
Centennial Communications Corp. * | | | 139,175 | | | | 718 | |
Cincinnati Bell, Inc. * | | | 342,245 | | | | 1,605 | |
| Commonwealth Telephone Enterprises, Inc. | | | 30,467 | | | | 1,275 | |
Dobson Communications Corp., Class A * | | | 226,146 | | | | 1,755 | |
IDT Corp., Class B * | | | 125,205 | | | | 1,626 | |
NeuStar, Inc. * | | | 79,495 | | | | 2,323 | |
SBA Communications Corp. * | | | 118,934 | | | | 3,177 | |
Syniverse Holdings, Inc. * | | | 90,479 | | | | 1,335 | |
Time Warner Telecom, Inc., Class A (a)* | | | 160,808 | | | | 3,206 | |
| USA Mobility, Inc. | | | 36,309 | | | | 922 | |
| | | | | | | | |
| | | | | | | | 19,512 | |
| | | | | | | | | |
Transportation 2.9% | | | | | | | | |
| |
AirTran Holdings, Inc. (a)* | | | 108,098 | | | | 1,078 | |
Alaska Air Group, Inc. * | | | 45,809 | | | | 1,839 | |
Amerco, Inc. * | | | 27,804 | | | | 2,550 | |
American Commercial Lines, Inc. * | | | 41,001 | | | | 2,630 | |
AMR Corp. (a)* | | | 14,417 | | | | 409 | |
| Arkansas Best Corp. | | | 34,572 | | | | 1,417 | |
Continental Airlines, Inc., Class B (a)* | | | 125,511 | | | | 4,629 | |
Dollar Thrifty Automotive Group, Inc. * | | | 30,658 | | | | 1,231 | |
EGL, Inc. * | | | 54,206 | | | | 1,843 | |
| Florida East Coast Industries, Class A | | | 43,450 | | | | 2,596 | |
| Forward Air Corp. | | | 41,682 | | | | 1,353 | |
Genesee & Wyoming, Inc. * | | | 46,572 | | | | 1,308 | |
| Heartland Express, Inc. | | | 139,552 | | | | 2,279 | |
Hub Group, Inc., Class A * | | | 66,192 | | | | 1,798 | |
JetBlue Airways Corp. (a)* | | | 212,303 | | | | 2,667 | |
Kansas City Southern * | | | 95,309 | | | | 2,706 | |
Kirby Corp. * | | | 68,534 | | | | 2,401 | |
| Knight Transportation, Inc. | | | 109,888 | | | | 2,002 | |
| Macquaire Infrastructure Co. Trust | | | 36,051 | | | | 1,075 | |
Old Dominion Freight Line * | | | 49,989 | | | | 1,383 | |
| Pacer International, Inc. | | | 52,018 | | | | 1,596 | |
| SkyWest, Inc. | | | 82,212 | | | | 2,192 | |
Swift Transportation Co., Inc. * | | | 102,350 | | | | 2,574 | |
| Werner Enterprises, Inc. | | | 102,143 | | | | 1,874 | |
| | | | | | | | |
| | | | | | | | 47,430 | |
| | | | | | | | | |
Utilities 3.6% | | | | | | | | |
| |
| Allete, Inc. | | | 39,490 | | | | 1,781 | |
Aquila, Inc. (b)* | | | 521,091 | | | | 2,392 | |
| Avista Corp. | | | 58,612 | | | | 1,509 | |
| Black Hills Corp. | | | 44,198 | | | | 1,525 | |
| California Water Service Group | | | 21,487 | | | | 836 | |
| CH Energy Group, Inc. | | | 19,497 | | | | 1,014 | |
| Cleco Corp. | | | 66,715 | | | | 1,715 | |
| Duquesne Light Holdings, Inc. | | | 104,177 | | | | 2,066 | |
Dynegy, Inc., Class A * | | | 530,336 | | | | 3,224 | |
El Paso Electric Co. * | | | 66,416 | | | | 1,551 | |
Great Plains Energy, Inc. (a) | | | 80,281 | | | | 2,612 | |
| Idacorp, Inc. | | | 52,798 | | | | 2,082 | |
10 See financial notes.
Schwab Small-Cap Index Fund
Portfolio Holdings continued
| | | | | | | | | |
| | | Number of | | | Value | |
| Security | | Shares | | | ($ x 1,000) | |
| | | | | | | | | |
| ITC Holdings Corp. | | | 17,156 | | | | 609 | |
| MGE Energy, Inc. | | | 25,560 | | | | 874 | |
| New Jersey Resources Corp. | | | 35,909 | | | | 1,862 | |
| Nicor, Inc. | | | 57,694 | | | | 2,652 | |
| Northwest Natural Gas Co. | | | 36,395 | | | | 1,506 | |
| NorthWestern Corp. | | | 49,712 | | | | 1,759 | |
Ormat Technologies, Inc. (a) | | | 44,045 | | | | 1,691 | |
| Otter Tail Corp. | | | 40,409 | | | | 1,210 | |
| Peoples Energy Corp. | | | 47,712 | | | | 2,084 | |
Piedmont Natural Gas Co., Inc. (a) | | | 99,377 | | | | 2,683 | |
| PNM Resources, Inc. | | | 90,129 | | | | 2,538 | |
Sierra Pacific Resources * | | | 214,037 | | | | 3,245 | |
| South Jersey Industries, Inc. | | | 34,460 | | | | 1,066 | |
| Southwest Gas Corp. | | | 50,196 | | | | 1,801 | |
| The Laclede Group, Inc. | | | 25,977 | | | | 926 | |
| UIL Holdings Corp. | | | 33,775 | | | | 1,343 | |
| Unisource Energy Corp. | | | 47,817 | | | | 1,701 | |
| Vectren Corp. | | | 101,117 | | | | 2,938 | |
| Westar Energy, Inc. | | | 104,921 | | | | 2,657 | |
| WGL Holdings, Inc. | | | 62,161 | | | | 2,017 | |
| | | | | | | | |
| | | | | | | | 59,469 | |
| | | | | | | | | |
| Security | | Face Amount | | | Value | |
| Rate, Maturity Date | | ($ x 1,000) | | | ($ x 1,000) | |
| | | | | | | | | |
Short-Term Investment 0.2% of net assets | | | | | | | | |
| | | | | | | | | |
JP Morgan, Grand Cayman Time Deposit
4.71%, 11/01/06 | | | 3,156 | | | | 3,156 | |
| | | | | | | | | |
U.S. Treasury Obligation 0.0% of net assets | | | | | | | | |
| | | | | | | | | |
U.S. Treasury Bill
5.03%, 12/14/06 | | | 685 | | | | 681 | |
| | | | | | | | | |
End of Investments. | | | | | | | | |
| | | | | | | | | |
Collateral Invested for Securities on Loan 15.2% of net assets | | | | | | | | |
| | | | | | | | | |
| Securities Lending Investment Fund, a series of the Brown Brothers Investment Trust | | | 251,338 | | | | 251,338 | |
At 10/31/06 the tax basis cost of the fund’s investments was $1,245,704, and the unrealized appreciation and depreciation were $498,655 and ($85,822), respectively, with a net unrealized appreciation of $412,833.
In addition to the above, the fund held the following at 10/31/06. All numbers are x1,000 except number of futures contracts.
| | | | | | | | | | | | | |
| | | Number of | | | Contract | | | Unrealized | |
| | | Contracts | | | Value | | | Gains | |
| | | | | | | | | | | | | |
Futures Contract | | | | | | | | | | | | |
| | | | | | | | | | | | | |
| Russell 2000 Index, e-mini Futures, Long expires 12/31/06 | | | 51 | | | | 3,932 | | | | 182 | |
| | |
| * | | Non-income producing security. |
| |
| (a) | | All or a portion of this security is on loan. |
| |
| (b) | | All or a portion of this security is held as collateral for open futures contracts. |
See financial notes. 11
Schwab Total Stock Market Index Fund
Portfolio Holdings as of October 31, 2006
This section shows all the securities in the fund’s portfolio and their value as of the report date.
The fund files its complete schedule of portfolio holdings with the SEC for the first and third quarters of each fiscal year on Form N-Q. The fund’s Form N-Q is available on the SEC’s website at http://www.sec.gov and may be viewed and copied at the SEC’s Public Reference Room in Washington, D.C. Call 1-800-SEC-0330 for information on the operation of the Public Reference Room. The schedule of portfolio holdings filed on a fund’s most recent Form N-Q is also available by visiting Schwab’s website at www.schwab.com/schwabfunds.
| | | | | | | | | | | | | |
| | | | | | | Cost | | | Value | |
| Holdings by Category | | ($ x 1,000) | | | ($ x 1,000) | |
| |
| 99.6 | % | | Common Stock | | | 1,038,021 | | | | 1,363,639 | |
| 0.1 | % | | Foreign Common Stock | | | 425 | | | | 994 | |
| — | % | | Preferred Stock | | | 64 | | | | 94 | |
| — | % | | U.S. Treasury Obligation | | | 308 | | | | 308 | |
| — | % | | Rights | | | — | | | | — | |
| |
| 99.7 | % | | Total Investments | | | 1,038,818 | | | | 1,365,035 | |
| 3.9 | % | | Collateral Invested for Securities on Loan | | | 52,763 | | | | 52,763 | |
| (3.6) | % | | Other Assets and Liabilities, Net | | | | | | | (49,183 | ) |
| |
| 100.0 | % | | Net Assets | | | | | | | 1,368,615 | |
| | | | | | | | | |
| | | Number of | | | Value | |
| Security | | Shares | | | ($ x 1,000) | |
| | | | | | | | | |
Common Stock 99.6% of net assets | | | | | | | | |
| | | | | | | | | |
Automobiles & Components 0.6% | | | | | | | | |
| |
Aftermarket Technology Corp. * | | | 2,511 | | | | 47 | |
| American Axle & Manufacturing Holdings, Inc. | | | 5,300 | | | | 99 | |
ArvinMeritor, Inc. (a) | | | 4,900 | | | | 74 | |
Bandag, Inc. (a) | | | 700 | | | | 31 | |
| BorgWarner, Inc. | | | 5,400 | | | | 310 | |
Collins & Aikman Corp. * | | | 1,400 | | | | — | |
Cooper Tire & Rubber Co. (a) | | | 6,400 | | | | 69 | |
Drew Industries, Inc. * | | | 2,400 | | | | 65 | |
| Federal Screw Works | | | 250 | | | | 4 | |
| Ford Motor Co. | | | 148,736 | | | | 1,232 | |
General Motors Corp. (a) | | | 45,386 | | | | 1,585 | |
| Gentex Corp. | | | 4,600 | | | | 73 | |
| Harley-Davidson, Inc. | | | 25,500 | | | | 1,750 | |
Hawk Corp., Class A * | | | 1,800 | | | | 26 | |
| Johnson Controls, Inc. | | | 15,000 | | | | 1,223 | |
Lear Corp. (a) | | | 5,800 | | | | 175 | |
| Modine Manufacturing Co. | | | 3,700 | | | | 88 | |
| Monaco Coach Corp. | | | 1,200 | | | | 14 | |
Proliance International, Inc. * | | | 872 | | | | 4 | |
| Sauer-Danfoss, Inc. | | | 3,800 | | | | 101 | |
| Standard Motor Products, Inc. | | | 2,000 | | | | 22 | |
Stoneridge, Inc. * | | | 1,700 | | | | 12 | |
Strattec Security Corp. * | | | 1,500 | | | | 58 | |
| Superior Industries International, Inc. | | | 800 | | | | 14 | |
Tenneco Automotive, Inc. * | | | 4,480 | | | | 102 | |
The Goodyear Tire & Rubber Co. (a)* | | | 12,500 | | | | 192 | |
| Thor Industries, Inc. | | | 4,500 | | | | 197 | |
TRW Automotive Holdings Corp. * | | | 7,800 | | | | 200 | |
Visteon Corp. * | | | 5,451 | | | | 40 | |
| Winnebago Industries, Inc. | | | 2,600 | | | | 87 | |
| | | | | | | | |
| | | | | | | | 7,894 | |
| | | | | | | | | |
Banks 5.9% | | | | | | | | |
| |
| 1st Source Corp. | | | 1,728 | | | | 55 | |
| Abigail Adams National Bancorp | | | 550 | | | | 7 | |
Accredited Home Lenders Holding Co. * | | | 2,500 | | | | 76 | |
| Alabama National Bancorp | | | 1,600 | | | | 109 | |
| Amcore Financial, Inc. | | | 1,200 | | | | 38 | |
| Ameris Bancorp | | | 1,800 | | | | 50 | |
| AmSouth Bancorp | | | 28,403 | | | | 858 | |
| Anchor Bancorp Wisconsin, Inc. | | | 3,100 | | | | 90 | |
| Arrow Financial Corp. | | | 1,050 | | | | 27 | |
| Associated Banc-Corp. | | | 15,500 | | | | 509 | |
| Astoria Financial Corp. | | | 8,300 | | | | 241 | |
| BancFirst Corp. | | | 1,000 | | | | 50 | |
| BancorpSouth, Inc. | | | 7,612 | | | | 194 | |
| BancTrust Financial Group, Inc. | | | 1,100 | | | | 27 | |
| Bank Mutual Corp. | | | 6,168 | | | | 75 | |
| Bank of Hawaii Corp. | | | 3,500 | | | | 183 | |
Bank of the Ozarks, Inc. (a) | | | 2,800 | | | | 88 | |
| BankAtlantic Bancorp, Inc., Class A | | | 2,200 | | | | 29 | |
| BankUnited Financial Corp., Class A | | | 2,200 | | | | 59 | |
| Banner Corp. | | | 1,200 | | | | 52 | |
Bay View Capital Corp. * | | | 506 | | | | 8 | |
| BB&T Corp. | | | 47,046 | | | | 2,047 | |
| Berkshire Bancorp, Inc. | | | 3,600 | | | | 56 | |
| Berkshire Hills Bancorp, Inc. | | | 1,400 | | | | 51 | |
| BOK Financial Corp. | | | 4,540 | | | | 233 | |
| Boston Private Financial Holdings, Inc. | | | 2,129 | | | | 59 | |
| Brookline Bancorp, Inc. | | | 2,405 | | | | 32 | |
| Bryn Mawr Bank Corp. | | | 1,400 | | | | 31 | |
| Camco Financial Corp. | | | 700 | | | | 10 | |
| Camden National Corp. | | | 700 | | | | 31 | |
| Capital City Bank Group, Inc. | | | 1,875 | | | | 63 | |
Capital Crossing Bank * | | | 2,000 | | | | 58 | |
| Capitol Bancorp Ltd. | | | 1,500 | | | | 70 | |
Capitol Federal Financial (a) | | | 6,920 | | | | 262 | |
| Cascade Bancorp | | | 2,655 | | | | 97 | |
See financial notes. 1
Schwab Total Stock Market Index Fund
Portfolio Holdings continued
| | | | | | | | | |
| | | Number of | | | Value | |
| Security | | Shares | | | ($ x 1,000) | |
| | | | | | | | | |
| Cathay General Bancorp | | | 3,200 | | | | 110 | |
| Central Pacific Financial Corp. | | | 3,400 | | | | 125 | |
| Century Bancorp Inc., Class A | | | 800 | | | | 21 | |
| Charter Financial Corp. | | | 900 | | | | 43 | |
| CharterMac | | | 3,900 | | | | 79 | |
| Chemical Financial Corp. | | | 1,383 | | | | 41 | |
| Chittenden Corp. | | | 2,272 | | | | 67 | |
Citizens Banking Corp. (a) | | | 4,590 | | | | 119 | |
| Citizens First Bancorp, Inc. | | | 700 | | | | 21 | |
| Citizens South Banking Corp. | | | 1,000 | | | | 13 | |
| City Holding Co. | | | 1,800 | | | | 71 | |
| City National Corp. | | | 3,100 | | | | 206 | |
| Coastal Financial Corp. | | | 3,670 | | | | 50 | |
| Columbia Banking System, Inc. | | | 1,951 | | | | 62 | |
| Comerica, Inc. | | | 13,496 | | | | 785 | |
Commerce Bancorp, Inc. (a) | | | 11,320 | | | | 395 | |
| Commerce Bancshares, Inc. | | | 13,331 | | | | 660 | |
| Community Bank System, Inc. | | | 1,400 | | | | 35 | |
| Community Trust Bancorp, Inc. | | | 2,487 | | | | 95 | |
| Compass Bancshares, Inc. | | | 11,400 | | | | 641 | |
Corus Bankshares, Inc. (a) | | | 4,000 | | | | 82 | |
| Countrywide Financial Corp. | | | 45,000 | | | | 1,715 | |
| Cullen/Frost Bankers, Inc. | | | 3,300 | | | | 179 | |
| CVB Financial Corp. | | | 5,283 | | | | 77 | |
| Dime Community Bancshares, Inc. | | | 3,375 | | | | 47 | |
Doral Financial Corp. (a) | | | 9,900 | | | | 46 | |
| Downey Financial Corp. | | | 2,000 | | | | 138 | |
| East West Bancorp, Inc. | | | 2,600 | | | | 95 | |
| Exchange National Bancshares, Inc. | | | 750 | | | | 23 | |
F.N.B. Corp. (a) | | | 2,639 | | | | 45 | |
| Fannie Mae | | | 78,900 | | | | 4,676 | |
| Fidelity Bankshares, Inc. | | | 2,899 | | | | 115 | |
| Fifth Third Bancorp | | | 42,601 | | | | 1,698 | |
| First Bancorp. | | | 4,200 | | | | 42 | |
| First Busey Corp. | | | 1,500 | | | | 34 | |
| First Charter Corp. | | | 3,500 | | | | 87 | |
| First Citizens BancShares, Inc., Class A | | | 300 | | | | 56 | |
| First Commonwealth Financial Corp. | | | 2,504 | | | | 33 | |
| First Financial Bancorp | | | 1,839 | | | | 30 | |
| First Financial Bankshares, Inc. | | | 2,000 | | | | 80 | |
| First Financial Corp. Indiana | | | 600 | | | | 21 | |
| First Financial Holdings, Inc. | | | 1,400 | | | | 51 | |
First Horizon National Corp. (c) | | | 10,800 | | | | 425 | |
| First Indiana Corp. | | | 1,718 | | | | 44 | |
| First M&F Corp. | | | 2,000 | | | | 38 | |
| First Merchants Corp. | | | 1,041 | | | | 26 | |
| First Midwest Bancorp, Inc. Illinois | | | 3,125 | | | | 119 | |
| First Niagra Financial Group, Inc. | | | 7,670 | | | | 110 | |
| First Place Financial Corp. | | | 2,900 | | | | 68 | |
| First Republic Bank | | | 1,200 | | | | 47 | |
| First United Corp. | | | 2,200 | | | | 48 | |
FirstFed Financial Corp. * | | | 400 | | | | 25 | |
| FirstMerit Corp. | | | 7,300 | | | | 169 | |
| Flagstar Bancorp, Inc. | | | 6,200 | | | | 93 | |
| Flushing Financial Corp. | | | 3,300 | | | | 58 | |
| Freddie Mac | | | 56,100 | | | | 3,870 | |
| Fremont General Corp. | | | 6,200 | | | | 90 | |
| Frontier Financial Corp. | | | 1,575 | | | | 46 | |
| Fulton Financial Corp. | | | 14,762 | | | | 236 | |
| Glacier Bancorp, Inc. | | | 2,465 | | | | 86 | |
| Great Southern Bancorp, Inc. | | | 1,400 | | | | 44 | |
| Greater Bay Bancorp | | | 5,406 | | | | 139 | |
| Hancock Holding Co. | | | 2,100 | | | | 108 | |
| Harbor Florida Bancshares, Inc. | | | 1,100 | | | | 50 | |
| Harleysville National Corp. | | | 1,274 | | | | 27 | |
| Heritage Financial Corp/WA | | | 735 | | | | 18 | |
| Home Federal Bancorp | | | 800 | | | | 22 | |
| Horizon Financial Corp. | | | 2,695 | | | | 63 | |
| Hudson City Bancorp, Inc. | | | 48,731 | | | | 669 | |
Huntington Bancshares, Inc. (a) | | | 19,856 | | | | 485 | |
| IBERIABANK Corp. | | | 875 | | | | 51 | |
| Independent Bank Corp. Michigan | | | 1,802 | | | | 43 | |
| Independent Bank Corp/Rockland MA | | | 1,000 | | | | 33 | |
| IndyMac Bancorp, Inc. | | | 5,900 | | | | 268 | |
| Integra Bank Corp. | | | 1,225 | | | | 32 | |
| Interchange Financial Services Corp. | | | 1,575 | | | | 36 | |
| International Bancshares Corp. | | | 4,577 | | | | 140 | |
| Irwin Financial Corp. | | | 3,700 | | | | 82 | |
| ITLA Capital Corp. | | | 700 | | | | 40 | |
| KeyCorp | | | 34,300 | | | | 1,274 | |
| Lakeland Financial Corp. | | | 2,200 | | | | 57 | |
| M&T Bank Corp. | | | 8,962 | | | | 1,092 | |
| MAF Bancorp, Inc. | | | 2,028 | | | | 87 | |
| MainSource Financial Group, Inc. | | | 1,653 | | | | 30 | |
| Marshall & Ilsley Corp. | | | 19,650 | | | | 942 | |
| Massbank Corp. | | | 1,500 | | | | 50 | |
| MB Financial, Inc. | | | 2,133 | | | | 77 | |
| Mercantile Bankshares Corp. | | | 8,361 | | | | 377 | |
| Merchants Bancshares, Inc. | | | 750 | | | | 18 | |
| MGIC Investment Corp. | | | 9,300 | | | | 546 | |
| Mid-State Bancshares | | | 3,500 | | | | 105 | |
| Midwest Banc Holdings, Inc. | | | 1,300 | | | | 31 | |
| MutualFirst Financial, Inc. | | | 2,000 | | | | 42 | |
| Nara Bancorp, Inc. | | | 4,000 | | | | 76 | |
| National City Corp. | | | 56,821 | | | | 2,117 | |
National Penn Bancshares, Inc. (a) | | | 1,457 | | | | 30 | |
| NBT Bancorp., Inc. | | | 1,400 | | | | 35 | |
| NetBank, Inc. | | | 3,300 | | | | 18 | |
| New York Community Bancorp, Inc. | | | 22,697 | | | | 371 | |
| North Fork Bancorp, Inc. | | | 38,411 | | | | 1,098 | |
| North Valley Bancorp | | | 1,500 | | | | 28 | |
| Northrim BanCorp, Inc. | | | 2,625 | | | | 71 | |
2 See financial notes.
Schwab Total Stock Market Index Fund
Portfolio Holdings continued
| | | | | | | | | |
| | | Number of | | | Value | |
| Security | | Shares | | | ($ x 1,000) | |
| | | | | | | | | |
| Northway Financial, Inc. | | | 200 | | | | 7 | |
| Northwest Bancorp, Inc. | | | 5,000 | | | | 134 | |
| Oak Hill Financial, Inc. | | | 1,000 | | | | 27 | |
| OceanFirst Financial Corp. | | | 1,050 | | | | 25 | |
Ocwen Financial Corp. * | | | 5,920 | | | | 93 | |
| Old National Bancorp | | | 6,244 | | | | 118 | |
| Omega Financial Corp. | | | 1,000 | | | | 32 | |
| Oriental Financial Group, Inc. | | | 1,663 | | | | 20 | |
| PAB Bankshares, Inc. | | | 700 | | | | 15 | |
| Pacific Capital Bancorp | | | 2,844 | | | | 87 | |
| Park National Corp. | | | 845 | | | | 86 | |
| Partners Trust Financial Group, Inc. | | | 3,970 | | | | 45 | |
| Pennfed Finance Services, Inc. | | | 4,000 | | | | 73 | |
| People’s Bank | | | 12,375 | | | | 504 | |
| Peoples Financial Corp. | | | 3,000 | | | | 81 | |
| PFF Bancorp, Inc. | | | 1,680 | | | | 52 | |
Pinnacle Financial Partners, Inc. * | | | 475 | | | | 16 | |
| PNC Financial Services Group, Inc. | | | 24,500 | | | | 1,716 | |
| Popular, Inc. | | | 21,700 | | | | 395 | |
| Prosperity Bancshares, Inc. | | | 2,400 | | | | 83 | |
| Provident Bankshares Corp. | | | 1,657 | | | | 60 | |
| Provident Financial Holdings, Inc. | | | 750 | | | | 23 | |
| Provident Financial Services, Inc. | | | 917 | | | | 17 | |
| R&G Financial Corp., Class B | | | 2,550 | | | | 20 | |
| Radian Group, Inc. | | | 6,702 | | | | 357 | |
| Regions Financial Corp. | | | 39,314 | | | | 1,492 | |
| Renasant Corp. | | | 1,125 | | | | 36 | |
| Republic Bancorp, Inc. | | | 5,648 | | | | 76 | |
| Republic Bancorp, Inc., Class A | | | 1,735 | | | | 37 | |
| S&T Bancorp, Inc. | | | 1,400 | | | | 47 | |
| Sandy Spring Bancorp, Inc. | | | 2,900 | | | | 106 | |
| Santander BanCorp | | | 4,686 | | | | 88 | |
| Seacoast Banking Corp of Florida | | | 1,980 | | | | 53 | |
| Shore Bancshares, Inc. | | | 750 | | | | 22 | |
| Simmons First National Corp., Class A | | | 1,000 | | | | 31 | |
| Sky Financial Group, Inc. | | | 8,510 | | | | 213 | |
| Southwest Bancorp, Inc. | | | 3,300 | | | | 89 | |
| Sovereign Bancorp, Inc. | | | 30,389 | | | | 725 | |
| State Bancorp, Inc. | | | 1,058 | | | | 19 | |
| Sterling Bancorp | | | 1,918 | | | | 37 | |
| Sterling Bancshares, Inc. Texas | | | 2,100 | | | | 38 | |
| Sterling Financial Corp. Pennsylvania | | | 1,562 | | | | 36 | |
| Sterling Financial Corp. Washington | | | 1,827 | | | | 61 | |
| Suffolk Bancorp | | | 2,400 | | | | 84 | |
Sun Bancorp, Inc.,NJ * | | | 3,645 | | | | 76 | |
| SunTrust Banks, Inc. | | | 31,842 | | | | 2,515 | |
| Susquehanna Bancshares, Inc. | | | 3,168 | | | | 79 | |
SVB Financial Group * | | | 2,200 | | | | 101 | |
| SY Bancorp, Inc. | | | 1,470 | | | | 43 | |
| Synovus Financial Corp. | | | 24,600 | | | | 723 | |
| TCF Financial Corp. | | | 13,600 | | | | 354 | |
| TD Banknorth, Inc. | | | 11,496 | | | | 340 | |
| Texas Regional Bancshares, Inc., Class A | | | 2,558 | | | | 99 | |
| TF Financial Corp. | | | 700 | | | | 23 | |
| The Colonial BancGroup, Inc. | | | 10,100 | | | | 241 | |
| The First of Long Island Corp. | | | 2,000 | | | | 88 | |
| The PMI Group, Inc. | | | 8,100 | | | | 345 | |
| The South Financial Group, Inc. | | | 4,500 | | | | 119 | |
| Timberland Bancorp, Inc. | | | 1,000 | | | | 35 | |
| Tompkins Trustco, Inc. | | | 931 | | | | 46 | |
Triad Guaranty, Inc. * | | | 1,700 | | | | 88 | |
| TriCo Bancshares | | | 400 | | | | 10 | |
| Trustco Bank Corp. NY | | | 2,857 | | | | 32 | |
| Trustmark Corp. | | | 4,300 | | | | 136 | |
| U.S. Bancorp | | | 158,531 | | | | 5,365 | |
| UCBH Holdings, Inc. | | | 9,400 | | | | 161 | |
| UMB Financial Corp. | | | 3,574 | | | | 128 | |
| Umpqua Holdings Corp. | | | 343 | | | | 10 | |
| Union Bankshares Corp. | | | 1,050 | | | | 32 | |
| UnionBanCal Corp. | | | 20,100 | | | | 1,157 | |
| United Bankshares, Inc. | | | 3,400 | | | | 130 | |
| United Community Banks, Inc. Georgia | | | 3,750 | | | | 118 | |
| USB Holding Co., Inc. | | | 1,958 | | | | 44 | |
| Valley National Bancorp | | | 8,550 | | | | 223 | |
| W Holding Co., Inc. | | | 11,938 | | | | 68 | |
| Wachovia Corp. | | | 163,314 | | | | 9,064 | |
| Washington Federal, Inc. | | | 7,942 | | | | 185 | |
| Washington Mutual, Inc. | | | 78,449 | | | | 3,318 | |
| Washington Trust Bancorp, Inc. | | | 1,000 | | | | 27 | |
| Webster Financial Corp. | | | 4,663 | | | | 225 | |
| Wells Fargo & Co. | | | 275,154 | | | | 9,985 | |
| WesBanco, Inc. | | | 3,200 | | | | 105 | |
| West Coast Bancorp | | | 1,200 | | | | 39 | |
| Westamerica Bancorp | | | 1,700 | | | | 85 | |
| Whitney Holding Corp. | | | 6,675 | | | | 218 | |
| Willow Financial Bancorp, Inc. | | | 1,596 | | | | 25 | |
| Wilmington Trust Corp. | | | 5,700 | | | | 237 | |
| Wintrust Financial Corp. | | | 1,800 | | | | 87 | |
| WSFS Financial Corp. | | | 1,000 | | | | 64 | |
| Zions Bancorp | | | 7,725 | | | | 621 | |
| | | | | | | | |
| | | | | | | | 80,044 | |
| | | | | | | | | |
Capital Goods 7.9% | | | | | | | | |
| |
3D Systems Corp. (a)* | | | 1,400 | | | | 23 | |
| 3M Co. | | | 65,000 | | | | 5,125 | |
| A.O. Smith Corp. | | | 1,300 | | | | 46 | |
| Aaon, Inc. | | | 4,075 | | | | 95 | |
AAR Corp. * | | | 2,500 | | | | 65 | |
| Actuant Corp., Class A | | | 2,840 | | | | 146 | |
| Acuity Brands, Inc. | | | 5,200 | | | | 258 | |
Aerosonic Corp. * | | | 300 | | | | 2 | |
See financial notes. 3
Schwab Total Stock Market Index Fund
Portfolio Holdings continued
| | | | | | | | | |
| | | Number of | | | Value | |
| Security | | Shares | | | ($ x 1,000) | |
| | | | | | | | | |
AGCO Corp. * | | | 6,762 | | | | 181 | |
| Alamo Group, Inc. | | | 500 | | | | 12 | |
| Albany International Corp., Class A | | | 3,918 | | | | 132 | |
Alliant Techsystems, Inc. * | | | 2,437 | | | | 188 | |
| American Power Conversion Corp. | | | 16,600 | | | | 502 | |
American Science & Engineering, Inc. * | | | 500 | | | | 26 | |
| American Standard Cos., Inc. | | | 15,400 | | | | 682 | |
American Superconductor Corp. * | | | 700 | | | | 7 | |
American Woodmark Corp. (a) | | | 1,000 | | | | 37 | |
| Ameron International Corp. | | | 900 | | | | 66 | |
| Ametek, Inc. | | | 4,200 | | | | 196 | |
| Ampco-Pittsburgh Corp. | | | 2,800 | | | | 93 | |
| Apogee Enterprises, Inc. | | | 1,200 | | | | 19 | |
| Applied Industrial Technologies, Inc. | | | 6,525 | | | | 187 | |
Armor Holdings, Inc. * | | | 500 | | | | 26 | |
Astronics Corp. * | | | 1,250 | | | | 22 | |
| Badger Meter, Inc. | | | 4,000 | | | | 101 | |
| Baldor Electric Co. | | | 3,800 | | | | 122 | |
BE Aerospace, Inc. * | | | 1,100 | | | | 28 | |
| Belden CDT, Inc. | | | 4,400 | | | | 159 | |
Blount International, Inc. * | | | 1,200 | | | | 13 | |
Breeze-Eastern Corp. * | | | 500 | | | | 6 | |
| Briggs & Stratton Corp. | | | 3,500 | | | | 89 | |
| C&D Technologies, Inc. | | | 4,500 | | | | 22 | |
| Carlisle Cos., Inc. | | | 1,600 | | | | 134 | |
| Cascade Corp. | | | 4,400 | | | | 225 | |
| Caterpillar, Inc. | | | 53,800 | | | | 3,266 | |
Ceradyne, Inc. * | | | 2,500 | | | | 103 | |
| Chase Corp. | | | 100 | | | | 2 | |
| CIRCOR International, Inc. | | | 3,750 | | | | 124 | |
| Clarcor, Inc. | | | 3,400 | | | | 111 | |
Columbus McKinnon Corp. * | | | 2,400 | | | | 53 | |
| Cooper Industries Ltd., Class A | | | 13,700 | | | | 1,225 | |
| Crane Co. | | | 5,000 | | | | 195 | |
Cummins, Inc. (a) | | | 3,900 | | | | 495 | |
| Curtiss-Wright Corp. | | | 600 | | | | 20 | |
| Danaher Corp. | | | 24,000 | | | | 1,722 | |
| Deere & Co. | | | 19,000 | | | | 1,617 | |
Distributed Energy Systems Corp. * | | | 1,400 | | | | 5 | |
| Donaldson Co., Inc. | | | 6,500 | | | | 244 | |
| Dover Corp. | | | 16,700 | | | | 793 | |
| DRS Technologies, Inc. | | | 2,357 | | | | 104 | |
Ducommun, Inc. * | | | 3,200 | | | | 67 | |
| Eaton Corp. | | | 12,600 | | | | 913 | |
Electro Rent Corp. * | | | 5,100 | | | | 84 | |
| ElkCorp. | | | 3,450 | | | | 87 | |
EMCOR Group, Inc. * | | | 3,900 | | | | 231 | |
| Emerson Electric Co. | | | 35,000 | | | | 2,954 | |
Energy Conversion Devices, Inc. * | | | 600 | | | | 22 | |
ESCO Technologies, Inc. * | | | 2,800 | | | | 122 | |
Esterline Technologies Corp. * | | | 2,400 | | | | 90 | |
Evergreen Solar, Inc. (a)* | | | 1,000 | | | | 9 | |
| Fastenal Co. | | | 13,200 | | | | 531 | |
| Federal Signal Corp. | | | 2,800 | | | | 43 | |
Flow International Corp. * | | | 900 | | | | 11 | |
Flowserve Corp. * | | | 3,900 | | | | 207 | |
| Fluor Corp. | | | 5,600 | | | | 439 | |
Foster Wheeler Ltd. * | | | 5,200 | | | | 234 | |
| Franklin Electric Co., Inc. | | | 1,300 | | | | 70 | |
FuelCell Energy, Inc. * | | | 1,200 | | | | 8 | |
Gardner Denver, Inc. * | | | 3,400 | | | | 116 | |
| GATX Corp. | | | 4,000 | | | | 174 | |
GenCorp, Inc. (a)* | | | 2,500 | | | | 33 | |
General Cable Corp. * | | | 4,700 | | | | 177 | |
| General Dynamics Corp. | | | 31,400 | | | | 2,233 | |
General Electric Co. (c) | | | 815,966 | | | | 28,649 | |
Genlyte Group, Inc. * | | | 3,200 | | | | 247 | |
Global Power Equipment Group, Inc. * | | | 1,000 | | | | 1 | |
| Goodrich Corp. | | | 8,404 | | | | 370 | |
| Graco, Inc. | | | 7,012 | | | | 286 | |
GrafTech International, Ltd. * | | | 2,100 | | | | 13 | |
| Granite Construction, Inc. | | | 4,850 | | | | 253 | |
| Hardinge, Inc. | | | 1,800 | | | | 27 | |
| Harsco Corp. | | | 3,100 | | | | 253 | |
| Heico Corp., Class A | | | 2,286 | | | | 69 | |
Herley Industries, Inc. * | | | 4,000 | | | | 59 | |
Hexcel Corp. * | | | 2,000 | | | | 32 | |
| Honeywell International, Inc. | | | 71,062 | | | | 2,993 | |
| Hubbell, Inc., Class B | | | 3,800 | | | | 188 | |
Huttig Building Products, Inc. * | | | 811 | | | | 4 | |
| IDEX Corp. | | | 3,150 | | | | 148 | |
II-VI, Inc. * | | | 3,800 | | | | 93 | |
| Illinois Tool Works, Inc. | | | 51,700 | | | | 2,478 | |
| Ingersoll-Rand Co., Ltd., Class A | | | 27,400 | | | | 1,006 | |
Insituform Technologies, Inc., Class A * | | | 1,300 | | | | 30 | |
Integrated Electrical Services, Inc. * | | | 105 | | | | 2 | |
| ITT Corp. | | | 17,400 | | | | 946 | |
Jacobs Engineering Group, Inc. * | | | 3,800 | | | | 287 | |
Jacuzzi Brands, Inc. * | | | 4,500 | | | | 56 | |
| JLG Industries, Inc. | | | 8,600 | | | | 238 | |
| Joy Global, Inc. | | | 19,350 | | | | 757 | |
Kadant, Inc. * | | | 1 | | | | — | |
| Kaydon Corp. | | | 3,300 | | | | 138 | |
| Kennametal, Inc. | | | 4,000 | | | | 247 | |
| L-3 Communications Holdings, Inc. | | | 9,100 | | | | 733 | |
Ladish Co., Inc. * | | | 1,300 | | | | 41 | |
| Lawson Products, Inc. | | | 2,000 | | | | 97 | |
| Lennox International, Inc. | | | 4,771 | | | | 129 | |
| Lincoln Electric Holdings, Inc. | | | 3,900 | | | | 240 | |
| Lockheed Martin Corp. | | | 37,052 | | | | 3,221 | |
Magnetek, Inc. * | | | 1,500 | | | | 7 | |
Masco Corp. (a) | | | 35,800 | | | | 990 | |
McDermott International, Inc. * | | | 7,500 | | | | 335 | |
Medis Technologies Ltd. (a)* | | | 1,110 | | | | 30 | |
Merrimac Industries, Inc. * | | | 600 | | | | 6 | |
4 See financial notes.
Schwab Total Stock Market Index Fund
Portfolio Holdings continued
| | | | | | | | | |
| | | Number of | | | Value | |
| Security | | Shares | | | ($ x 1,000) | |
| | | | | | | | | |
Michael Baker Corp. * | | | 500 | | | | 11 | |
Middleby Corp. * | | | 3,500 | | | | 315 | |
Modtech Holdings, Inc. * | | | 1,000 | | | | 5 | |
Moog, Inc., Class A * | | | 2,787 | | | | 104 | |
| MSC Industrial Direct Co., Class A | | | 4,300 | | | | 176 | |
| Mueller Industries, Inc. | | | 1,700 | | | | 62 | |
| NACCO Industries, Inc., Class A | | | 1,300 | | | | 196 | |
Navistar International Corp. * | | | 6,900 | | | | 191 | |
NCI Building Systems, Inc. * | | | 2,900 | | | | 174 | |
| Nordson Corp. | | | 4,000 | | | | 184 | |
Northrop Grumman Corp. (a) | | | 30,032 | | | | 1,994 | |
Omega Flex, Inc. * | | | 700 | | | | 15 | |
Orbital Sciences Corp. * | | | 4,600 | | | | 84 | |
| Oshkosh Truck Corp. | | | 9,000 | | | | 407 | |
| PACCAR, Inc. | | | 21,150 | | | | 1,252 | |
| Pall Corp. | | | 10,900 | | | | 348 | |
| Parker Hannifin Corp. | | | 11,000 | | | | 920 | |
| Pentair, Inc. | | | 9,500 | | | | 313 | |
Plug Power, Inc. * | | | 2,248 | | | | 9 | |
Powell Industries, Inc. * | | | 1,000 | | | | 24 | |
Power-One, Inc. * | | | 6,000 | | | | 41 | |
| Precision Castparts Corp. | | | 10,302 | | | | 701 | |
Quanta Services, Inc. * | | | 8,900 | | | | 163 | |
| Quipp, Inc. | | | 900 | | | | 7 | |
| Quixote Corp. | | | 1,300 | | | | 24 | |
| Raven Industries, Inc. | | | 2,800 | | | | 90 | |
| Raytheon Co. | | | 34,900 | | | | 1,743 | |
| Regal Beloit Corp. | | | 2,500 | | | | 124 | |
| Rockwell Automation, Inc. | | | 15,700 | | | | 973 | |
| Rockwell Collins, Inc. | | | 13,100 | | | | 761 | |
| Roper Industries, Inc. | | | 6,500 | | | | 311 | |
Rush Enterprises, Inc., Class B * | | | 500 | | | | 9 | |
Sequa Corp., Class A * | | | 2,800 | | | | 297 | |
Simpson Manufacturing Co., Inc. (a) | | | 3,200 | | | | 91 | |
| SPX Corp. | | | 8,610 | | | | 495 | |
| Standex International Corp. | | | 3,000 | | | | 87 | |
Stantec, Inc. * | | | 1,690 | | | | 35 | |
Taser International, Inc. * | | | 1,700 | | | | 16 | |
Tecumseh Products Co., Class A * | | | 3,200 | | | | 54 | |
Teledyne Technologies, Inc. * | | | 12,157 | | | | 507 | |
| Teleflex, Inc. | | | 4,300 | | | | 267 | |
| Tennant Co. | | | 4,200 | | | | 116 | |
Terex Corp. * | | | 7,400 | | | | 383 | |
| Textron, Inc. | | | 11,800 | | | | 1,073 | |
The Allied Defense Group, Inc. * | | | 500 | | | | 8 | |
| The Boeing Co. | | | 68,800 | | | | 5,494 | |
| The Gorman-Rupp Co. | | | 2,875 | | | | 109 | |
| The Greenbrier Cos., Inc. | | | 1,600 | | | | 60 | |
| The Manitowoc Co., Inc. | | | 5,800 | | | | 318 | |
The Shaw Group, Inc. * | | | 2,000 | | | | 53 | |
| The Timken Co. | | | 6,600 | | | | 198 | |
Thomas & Betts Corp. * | | | 7,300 | | | | 376 | |
| Titan International, Inc. | | | 800 | | | | 15 | |
| Toro Co. | | | 4,100 | | | | 177 | |
| Tredegar Corp. | | | 2,600 | | | | 45 | |
| Trinity Industries, Inc. | | | 1,650 | | | | 59 | |
| Triumph Group, Inc. | | | 1,200 | | | | 58 | |
| Tyco International Ltd. | | | 154,100 | | | | 4,535 | |
| United Industrial Corp. | | | 1,200 | | | | 54 | |
United Rentals, Inc. * | | | 5,900 | | | | 140 | |
| United Technologies Corp. | | | 84,068 | | | | 5,525 | |
| Universal Forest Products, Inc. | | | 2,500 | | | | 113 | |
UQM Technologies, Inc. * | | | 1,500 | | | | 4 | |
URS Corp. * | | | 3,700 | | | | 149 | |
USG Corp. * | | | 3,900 | | | | 191 | |
Valence Technology, Inc. * | | | 1,400 | | | | 2 | |
| Valmont Industries, Inc. | | | 1,900 | | | | 106 | |
| Vicor Corp. | | | 4,200 | | | | 50 | |
| W.W. Grainger, Inc. | | | 7,300 | | | | 531 | |
| Wabash National Corp. | | | 2,500 | | | | 35 | |
| Wabtec Corp. | | | 2,828 | | | | 89 | |
| Walter Industries, Inc. | | | 1,900 | | | | 88 | |
| Watsco, Inc. | | | 3,400 | | | | 169 | |
| Watts Water Technologies, Inc., Class A | | | 1,000 | | | | 37 | |
WESCO International, Inc. * | | | 4,800 | | | | 313 | |
Wolverine Tube, Inc. (a)* | | | 1,000 | | | | 3 | |
| Woodward Governor Co. | | | 1,500 | | | | 54 | |
Xanser Corp. * | | | 1,400 | | | | 8 | |
| | | | | | | | |
| | | | | | | | 107,986 | |
| | | | | | | | | |
Commercial Services & Supplies 1.2% | | | | | | | | |
| |
A.T. Cross Co., Class A * | | | 2,400 | | | | 17 | |
| ABM Industries, Inc. | | | 4,900 | | | | 97 | |
| Adesa, Inc. | | | 8,200 | | | | 206 | |
| Administaff, Inc. | | | 2,800 | | | | 96 | |
Allied Waste Industries, Inc. * | | | 29,100 | | | | 354 | |
American Locker Group, Inc. * | | | 500 | | | | 2 | |
American Reprographics Co. * | | | 4,000 | | | | 142 | |
| Angelica Corp. | | | 2,500 | | | | 52 | |
| ARAMARK Corp., Class B | | | 14,800 | | | | 495 | |
| Avery Dennison Corp. | | | 9,700 | | | | 612 | |
| Banta Corp. | | | 2,700 | | | | 120 | |
| Bowne & Co., Inc. | | | 4,200 | | | | 66 | |
| Brady Corp., Class A | | | 1,400 | | | | 52 | |
Casella Waste Systems, Inc., Class A * | | | 2,500 | | | | 28 | |
| CDI Corp. | | | 3,700 | | | | 87 | |
Cenveo, Inc. * | | | 1,300 | | | | 26 | |
ChoicePoint, Inc. * | | | 6,900 | | | | 251 | |
| Cintas Corp. | | | 15,350 | | | | 636 | |
Clean Harbors, Inc. * | | | 2,500 | | | | 107 | |
| CompX International, Inc. | | | 800 | | | | 14 | |
Consolidated Graphics, Inc. * | | | 3,900 | | | | 242 | |
Copart, Inc. * | | | 6,550 | | | | 190 | |
Cornell Cos., Inc. * | | | 2,100 | | | | 38 | |
Corrections Corp. of America * | | | 5,742 | | | | 262 | |
See financial notes. 5
Schwab Total Stock Market Index Fund
Portfolio Holdings continued
| | | | | | | | | |
| | | Number of | | | Value | |
| Security | | Shares | | | ($ x 1,000) | |
| | | | | | | | | |
CoStar Group, Inc. * | | | 800 | | | | 38 | |
CRA International, Inc. * | | | 2,500 | | | | 127 | |
| Deluxe Corp. | | | 3,800 | | | | 86 | |
Diamond Management & Technology Consultants, Inc. * | | | 1,000 | | | | 11 | |
| Ennis, Inc. | | | 4,500 | | | | 103 | |
| Equifax, Inc. | | | 11,800 | | | | 449 | |
Exponent, Inc. * | | | 6,000 | | | | 109 | |
First Consulting Group, Inc. * | | | 1,800 | | | | 19 | |
FTI Consulting, Inc. * | | | 2,700 | | | | 77 | |
| G&K Services, Inc., Class A | | | 1,600 | | | | 61 | |
GP Strategies Corp. * | | | 1,500 | | | | 12 | |
| Healthcare Services Group | | | 5,625 | | | | 153 | |
Heidrick & Struggles International, Inc. * | | | 3,100 | | | | 127 | |
| Herman Miller, Inc. | | | 5,700 | | | | 195 | |
| HNI Corp. | | | 4,000 | | | | 180 | |
Hudson Highland Group, Inc. * | | | 720 | | | | 8 | |
ICT Group, Inc. * | | | 500 | | | | 16 | |
IHS, Inc. * | | | 3,600 | | | | 124 | |
| IKON Office Solutions, Inc. | | | 12,500 | | | | 186 | |
| John H. Harland Co. | | | 3,500 | | | | 143 | |
| Kelly Services, Inc., Class A | | | 3,200 | | | | 92 | |
Kforce, Inc. * | | | 405 | | | | 6 | |
Korn/Ferry International * | | | 3,600 | | | | 80 | |
Labor Ready, Inc. * | | | 3,500 | | | | 61 | |
Learning Tree International, Inc. * | | | 1,400 | | | | 12 | |
M&F Worldwide Corp. * | | | 1,200 | | | | 19 | |
| Manpower, Inc. | | | 6,991 | | | | 474 | |
| McGrath Rentcorp | | | 1,600 | | | | 43 | |
Mine Safety Appliances Co. (a) | | | 2,700 | | | | 102 | |
Mobile Mini, Inc. * | | | 1,200 | | | | 39 | |
Monster Worldwide, Inc. * | | | 9,800 | | | | 397 | |
| Multi-Color Corp. | | | 750 | | | | 24 | |
Navigant Consulting, Inc. * | | | 5,000 | | | | 89 | |
NCO Group, Inc. * | | | 2,701 | | | | 73 | |
On Assignment, Inc. * | | | 1,700 | | | | 19 | |
PHH Corp. * | | | 4,186 | | | | 116 | |
| Pitney Bowes, Inc. | | | 20,000 | | | | 934 | |
| R.R. Donnelley & Sons Co. | | | 17,000 | | | | 576 | |
| Republic Services, Inc. | | | 17,700 | | | | 726 | |
Resources Connection, Inc. * | | | 3,700 | | | | 107 | |
| Robert Half International, Inc. | | | 14,000 | | | | 512 | |
| Rollins, Inc. | | | 6,675 | | | | 144 | |
School Specialty, Inc. * | | | 1,600 | | | | 63 | |
Sitel Corp. * | | | 2,800 | | | | 12 | |
Spherion Corp. * | | | 4,330 | | | | 31 | |
| Steelcase, Inc., Class A | | | 11,500 | | | | 191 | |
Stericycle, Inc. * | | | 3,200 | | | | 226 | |
TeleTech Holdings, Inc. * | | | 5,000 | | | | 97 | |
Tetra Tech, Inc. * | | | 12,031 | | | | 219 | |
The Advisory Board Co. * | | | 1,000 | | | | 55 | |
| The Brink’s Co. | | | 5,600 | | | | 294 | |
| The Corporate Executive Board Co. | | | 2,700 | | | | 243 | |
The Dun & Bradstreet Corp. * | | | 12,140 | | | | 938 | |
The Geo Group, Inc. * | | | 5,700 | | | | 217 | |
| The Standard Register Co. | | | 4,100 | | | | 55 | |
TRC Cos., Inc. * | | | 1,350 | | | | 11 | |
United Stationers, Inc. * | | | 2,900 | | | | 138 | |
| Viad Corp. | | | 3,625 | | | | 134 | |
Volt Information Sciences, Inc. * | | | 2,100 | | | | 83 | |
Waste Connections, Inc. * | | | 3,650 | | | | 149 | |
| Waste Industries USA, Inc. | | | 1,500 | | | | 43 | |
| Waste Management, Inc. | | | 48,100 | | | | 1,803 | |
| Watson Wyatt & Co., Holdings | | | 4,600 | | | | 208 | |
Westaff, Inc. * | | | 2,000 | | | | 8 | |
| | | | | | | | |
| | | | | | | | 16,279 | |
| | | | | | | | | |
Consumer Durables & Apparel 1.6% | | | | | | | | |
| |
| American Greetings Corp., Class A | | | 8,500 | | | | 203 | |
Applica, Inc. * | | | 3,100 | | | | 18 | |
| Beazer Homes USA, Inc. | | | 2,553 | | | | 111 | |
| Blyth, Inc. | | | 4,800 | | | | 115 | |
Brookfield Homes Corp. (a) | | | 3,074 | | | | 100 | |
| Brown Shoe Co., Inc. | | | 1,950 | | | | 76 | |
| Brunswick Corp. | | | 7,400 | | | | 233 | |
| Callaway Golf Co. | | | 5,600 | | | | 75 | |
Carter’s, Inc. * | | | 5,000 | | | | 141 | |
Cavco Industries, Inc. * | | | 410 | | | | 14 | |
| Centex Corp. | | | 10,700 | | | | 560 | |
Chromcraft Revington, Inc. * | | | 1,300 | | | | 12 | |
Coach, Inc. * | | | 32,008 | | | | 1,269 | |
Columbia Sportswear Co. * | | | 4,350 | | | | 243 | |
| Craftmade International, Inc. | | | 2,800 | | | | 55 | |
| CSS Industries, Inc. | | | 900 | | | | 28 | |
| D.R. Horton, Inc. | | | 24,604 | | | | 576 | |
DGSE Cos, Inc. * | | | 700 | | | | 2 | |
Dominion Homes, Inc. (a)* | | | 500 | | | | 3 | |
| Eastman Kodak Co. | | | 22,700 | | | | 554 | |
| Ethan Allen Interiors, Inc. | | | 4,200 | | | | 150 | |
| Flexsteel Industries, Inc. | | | 600 | | | | 8 | |
Foamex International, Inc. * | | | 2,600 | | | | 14 | |
| Fortune Brands, Inc. | | | 11,500 | | | | 885 | |
Fossil, Inc. * | | | 2,962 | | | | 65 | |
Furniture Brands International, Inc. (a) | | | 4,700 | | | | 87 | |
Garmin Ltd. (a) | | | 10,000 | | | | 534 | |
Hampshire Group Ltd. * | | | 2,000 | | | | 27 | |
Hanesbrands, Inc. * | | | 8,047 | | | | 190 | |
| Harman International Industries, Inc. | | | 6,800 | | | | 696 | |
| Hasbro, Inc. | | | 14,500 | | | | 376 | |
Hovnanian Enterprises, Inc., Class A * | | | 3,700 | | | | 114 | |
Interface, Inc., Class A * | | | 3,300 | | | | 48 | |
Jarden Corp. * | | | 2,475 | | | | 89 | |
| Jones Apparel Group, Inc. | | | 12,156 | | | | 406 | |
| K-Swiss, Inc., Class A | | | 2,400 | | | | 85 | |
K2, Inc. * | | | 1,700 | | | | 23 | |
| KB Home | | | 7,800 | | | | 351 | |
6 See financial notes.
Schwab Total Stock Market Index Fund
Portfolio Holdings continued
| | | | | | | | | |
| | | Number of | | | Value | |
| Security | | Shares | | | ($ x 1,000) | |
| | | | | | | | | |
| Kellwood Co. | | | 2,900 | | | | 89 | |
| Kenneth Cole Productions, Inc., Class A | | | 3,100 | | | | 79 | |
| Kimball International, Inc., Class B | | | 3,600 | | | | 89 | |
| Leggett & Platt, Inc. | | | 16,200 | | | | 378 | |
| Lennar Corp., Class A | | | 12,190 | | | | 579 | |
Lenox Group, Inc. * | | | 3,300 | | | | 20 | |
| Levitt Corp., Class A | | | 550 | | | | 7 | |
| Liz Claiborne, Inc. | | | 8,600 | | | | 363 | |
M.D.C. Holdings, Inc. (a) | | | 1,903 | | | | 95 | |
| M/I Homes, Inc. | | | 1,800 | | | | 65 | |
| Marine Products Corp. | | | 405 | | | | 4 | |
MarineMax, Inc. * | | | 800 | | | | 23 | |
Marvel Entertainment, Inc. (a)* | | | 11,700 | | | | 297 | |
| Mattel, Inc. | | | 34,300 | | | | 776 | |
Meade Instruments Corp. * | | | 800 | | | | 2 | |
Meritage Homes Corp. (a)* | | | 1,000 | | | | 46 | |
Mity Enterprises, Inc. * | | | 600 | | | | 11 | |
Mohawk Industries, Inc. * | | | 4,819 | | | | 350 | |
| Movado Group, Inc. | | | 3,300 | | | | 85 | |
Nautilus Group, Inc. (a) | | | 4,125 | | | | 58 | |
| Newell Rubbermaid, Inc. | | | 23,900 | | | | 688 | |
| Nike, Inc., Class B | | | 20,700 | | | | 1,902 | |
NVR, Inc. * | | | 500 | | | | 281 | |
| Oakley, Inc. | | | 6,700 | | | | 124 | |
Oneida Ltd. (b)* | | | 700 | | | | — | |
Palm Harbor Homes, Inc. (a)* | | | 2,700 | | | | 38 | |
| Phillips-Van Heusen Corp. | | | 4,300 | | | | 197 | |
Polaris Industries, Inc. (a) | | | 3,200 | | | | 137 | |
| Polo Ralph Lauren Corp. | | | 7,500 | | | | 533 | |
| Pool Corp. | | | 5,662 | | | | 232 | |
| Pulte Homes, Inc. | | | 20,244 | | | | 627 | |
Quiksilver, Inc. * | | | 4,000 | | | | 56 | |
RC2 Corp. * | | | 2,200 | | | | 99 | |
Recoton Corp. * | | | 500 | | | | — | |
Russ Berrie & Co., Inc. * | | | 1,000 | | | | 15 | |
Salton, Inc. * | | | 1,100 | | | | 3 | |
Skechers U.S.A., Inc., Class A * | | | 6,500 | | | | 194 | |
| Skyline Corp. | | | 2,600 | | | | 103 | |
| Snap-On, Inc. | | | 4,000 | | | | 188 | |
SONICblue, Inc. * | | | 2,600 | | | | — | |
| Standard Pacific Corp. | | | 4,800 | | | | 116 | |
| Stanley Furniture Co., Inc. | | | 5,200 | | | | 115 | |
Steven Madden Ltd. * | | | 2,700 | | | | 116 | |
| Stride Rite Corp. | | | 2,900 | | | | 43 | |
| Superior Uniform Group, Inc. | | | 1,600 | | | | 20 | |
| Tandy Brands Accessories, Inc. | | | 1,000 | | | | 12 | |
Tarragon Corp. (a) | | | 4,422 | | | | 50 | |
Technical Olympic USA, Inc. (a) | | | 2,812 | | | | 31 | |
Tempur-Pedic International, Inc. * | | | 8,000 | | | | 158 | |
| The Black & Decker Corp. | | | 7,100 | | | | 596 | |
The Boyds Collection Ltd. (e)* | | | 34 | | | | — | |
The Fairchild Corp., Class A * | | | 3,100 | | | | 8 | |
The Ryland Group, Inc. (a) | | | 3,700 | | | | 170 | |
| The Stanley Works | | | 6,600 | | | | 314 | |
The Warnaco Group, Inc. * | | | 2,500 | | | | 53 | |
| The Yankee Candle Co., Inc. | | | 3,700 | | | | 125 | |
Timberland Co., Class A * | | | 5,300 | | | | 153 | |
Toll Brothers, Inc. * | | | 11,200 | | | | 324 | |
| Tupperware Corp. | | | 4,800 | | | | 102 | |
Unifi, Inc. * | | | 1,900 | | | | 5 | |
| Unifirst Corp. | | | 1,500 | | | | 54 | |
Uniroyal Technology Corp. * | | | 1,100 | | | | — | |
Universal Electronics, Inc. * | | | 2,200 | | | | 48 | |
| VF Corp. | | | 13,500 | | | | 1,026 | |
Virco Manufacturing Corp. * | | | 1,170 | | | | 7 | |
WCI Communities, Inc. (a)* | | | 3,800 | | | | 61 | |
| Whirlpool Corp. | | | 6,849 | | | | 595 | |
| Wolverine World Wide, Inc. | | | 7,800 | | | | 221 | |
| | | | | | | | |
| | | | | | | | 21,892 | |
| | | | | | | | | |
Consumer Services 2.4% | | | | | | | | |
| |
| Ambassadors Groups, Inc. | | | 3,400 | | | | 93 | |
| Ambassadors International, Inc. | | | 1,700 | | | | 66 | |
| American Real Estate Partners L.P. | | | 3,800 | | | | 238 | |
| Ameristar Casinos, Inc. | | | 3,400 | | | | 84 | |
Apollo Group, Inc., Class A * | | | 14,550 | | | | 538 | |
| Applebee’s International, Inc. | | | 7,912 | | | | 181 | |
Aztar Corp. * | | | 1,900 | | | | 102 | |
Bally Technologies, Inc. (a)* | | | 3,000 | | | | 60 | |
Bally Total Fitness Holding Corp. (a)* | | | 6,500 | | | | 18 | |
| Bob Evans Farms, Inc. | | | 2,200 | | | | 75 | |
| Boyd Gaming Corp. | | | 7,800 | | | | 308 | |
Bright Horizons Family Solutions, Inc. * | | | 2,600 | | | | 100 | |
| Brinker International, Inc. | | | 6,900 | | | | 320 | |
Buca, Inc. * | | | 1,100 | | | | 6 | |
Career Education Corp. * | | | 8,614 | | | | 192 | |
| Carnival Corp. | | | 50,000 | | | | 2,441 | |
| CBRL Group, Inc. | | | 946 | | | | 42 | |
CEC Entertainment, Inc. * | | | 2,025 | | | | 70 | |
Cedar Fair L.P. * | | | 5,300 | | | | 145 | |
| Choice Hotels International, Inc. | | | 6,800 | | | | 285 | |
| Churchill Downs, Inc. | | | 900 | | | | 38 | |
CKE Restaurants, Inc. (a) | | | 4,800 | | | | 94 | |
Corinthian Colleges, Inc. * | | | 9,200 | | | | 113 | |
| CPI Corp. | | | 400 | | | | 19 | |
| Darden Restaurants, Inc. | | | 13,300 | | | | 557 | |
DeVry, Inc. * | | | 4,800 | | | | 117 | |
| Domino’s Pizza, Inc. | | | 5,100 | | | | 139 | |
| Dover Downs Gaming & Entertainment, Inc. | | | 4,899 | | | | 69 | |
| Dover Motorsports, Inc. | | | 1,400 | | | | 7 | |
Empire Resorts, Inc. (a)* | | | 500 | | | | 4 | |
Gaylord Entertainment Co. * | | | 2,625 | | | | 122 | |
| H&R Block, Inc. | | | 26,300 | | | | 575 | |
| Harrah’s Entertainment, Inc. | | | 15,273 | | | | 1,135 | |
| Hilton Hotels Corp. | | | 32,926 | | | | 952 | |
See financial notes. 7
Schwab Total Stock Market Index Fund
Portfolio Holdings continued
| | | | | | | | | |
| | | Number of | | | Value | |
| Security | | Shares | | | ($ x 1,000) | |
| | | | | | | | | |
| IHOP Corp. | | | 3,000 | | | | 157 | |
International Game Technology (a) | | | 29,100 | | | | 1,237 | |
| International Speedway Corp., Class A | | | 3,245 | | | | 168 | |
Interstate Hotels & Resorts, Inc. * | | | 82 | | | | 1 | |
Isle of Capri Casinos, Inc. * | | | 4,400 | | | | 110 | |
ITT Educational Services, Inc. * | | | 6,000 | | | | 414 | |
Jack in the Box, Inc. * | | | 4,200 | | | | 236 | |
| Jackson Hewitt Tax Service, Inc. | | | 3,000 | | | | 104 | |
Krispy Kreme Doughnuts, Inc. (a)* | | | 2,100 | | | | 23 | |
| Landry’s Restaurants, Inc. | | | 1,800 | | | | 53 | |
Las Vegas Sands Corp. * | | | 17,000 | | | | 1,295 | |
Laureate Education, Inc. * | | | 4,700 | | | | 248 | |
Life Time Fitness, Inc. * | | | 2,500 | | | | 129 | |
| Lone Star Steakhouse & Saloon, Inc. | | | 1,600 | | | | 44 | |
Luby’s, Inc. * | | | 1,400 | | | | 14 | |
| Marriott International, Inc., Class A | | | 37,400 | | | | 1,562 | |
| Matthews International Corp., Class A | | | 1,900 | | | | 73 | |
| McDonald’s Corp. | | | 105,300 | | | | 4,414 | |
MGM Mirage * | | | 22,500 | | | | 968 | |
MTR Gaming Group, Inc. * | | | 2,300 | | | | 24 | |
Multimedia Games, Inc. * | | | 1,500 | | | | 14 | |
| Nobel Learning Communities, Inc. | | | 500 | | | | 5 | |
O’Charley’s, Inc. * | | | 400 | | | | 8 | |
| Orient-Express Hotels Ltd., Class A | | | 1,600 | | | | 63 | |
| OSI Restaurant Partners, Inc. | | | 7,000 | | | | 233 | |
P.F. Chang’s China Bistro, Inc. (a)* | | | 800 | | | | 33 | |
Panera Bread Co., Class A * | | | 800 | | | | 49 | |
Papa John’s International, Inc. * | | | 3,400 | | | | 125 | |
Penn National Gaming, Inc. * | | | 6,800 | | | | 249 | |
Pre-Paid Legal Services, Inc. (a) | | | 3,600 | | | | 153 | |
RARE Hospitality International, Inc. * | | | 3,325 | | | | 105 | |
| Regis Corp. | | | 3,900 | | | | 146 | |
| Royal Caribbean Cruises, Ltd. | | | 16,500 | | | | 668 | |
| Ruby Tuesday, Inc. | | | 5,600 | | | | 155 | |
Ryan’s Restaurant Group, Inc. * | | | 2,250 | | | | 37 | |
Scientific Games Corp., Class A * | | | 6,500 | | | | 182 | |
| Service Corp. International | | | 24,100 | | | | 220 | |
Shuffle Master, Inc. (a)* | | | 2,812 | | | | 79 | |
Six Flags, Inc. (a)* | | | 7,500 | | | | 43 | |
Smith & Wollensky Restaurant Group, Inc. * | | | 900 | | | | 4 | |
Sonic Corp. * | | | 7,968 | | | | 181 | |
| Sotheby’s | | | 5,438 | | | | 207 | |
| Speedway Motorsports, Inc. | | | 4,800 | | | | 181 | |
Starbucks Corp. (a)* | | | 62,600 | | | | 2,363 | |
| Starwood Hotels & Resorts Worldwide, Inc. | | | 17,730 | | | | 1,059 | |
Station Casinos, Inc. (a) | | | 4,650 | | | | 280 | |
| Stewart Enterprises, Inc., Class A | | | 7,200 | | | | 45 | |
| Strayer Education, Inc. | | | 700 | | | | 79 | |
The Cheesecake Factory, Inc. * | | | 2,887 | | | | 82 | |
| The ServiceMaster Co. | | | 22,900 | | | | 259 | |
The Steak n Shake Co. * | | | 1,580 | | | | 29 | |
| Tim Hortons, Inc. | | | 13,949 | | | | 403 | |
| Triarc Cos., Class B | | | 4,400 | | | | 74 | |
Vail Resorts, Inc. * | | | 3,800 | | | | 147 | |
Vertrue, Inc. * | | | 4,500 | | | | 202 | |
| Weight Watchers International, Inc. | | | 8,700 | | | | 379 | |
| Wendy’s International, Inc. | | | 10,300 | | | | 356 | |
Western Union Co. * | | | 62,932 | | | | 1,388 | |
Wyndham Worldwide Corp. * | | | 16,744 | | | | 494 | |
Wynn Resorts Ltd. (a)* | | | 4,000 | | | | 294 | |
| YUM! Brands, Inc. | | | 24,000 | | | | 1,427 | |
| | | | | | | | |
| | | | | | | | 33,079 | |
| | | | | | | | | |
Diversified Financials 8.9% | | | | | | | | |
| |
| A.G. Edwards, Inc. | | | 5,900 | | | | 337 | |
| Advanta Corp., Class A | | | 7,400 | | | | 266 | |
Affiliated Managers Group, Inc. (a)* | | | 1,800 | | | | 180 | |
AllianceBernstein Holding LP * | | | 7,700 | | | | 598 | |
| American Express Co. | | | 105,150 | | | | 6,079 | |
AmeriCredit Corp. * | | | 12,300 | | | | 314 | |
| Ameriprise Financial, Inc. | | | 21,030 | | | | 1,083 | |
Asset Acceptance Capital Corp. * | | | 2,500 | | | | 44 | |
| Asta Funding, Inc. | | | 2,000 | | | | 68 | |
Bank of America Corp. (c) | | | 381,577 | | | | 20,556 | |
| BlackRock, Inc., Class A | | | 3,400 | | | | 513 | |
| Capital One Financial Corp. | | | 23,710 | | | | 1,881 | |
| Cash America International, Inc. | | | 2,500 | | | | 103 | |
CBOT Holdings, Inc., Class A (a)* | | | 4,400 | | | | 653 | |
| Chicago Mercantile Exchange Holdings, Inc. | | | 2,200 | | | | 1,102 | |
| CIT Group, Inc. | | | 18,600 | | | | 968 | |
Citigroup, Inc. (c) | | | 412,286 | | | | 20,680 | |
CompuCredit Corp. * | | | 4,400 | | | | 153 | |
Credit Acceptance Corp. * | | | 2,400 | | | | 80 | |
E*TRADE Financial Corp. * | | | 34,335 | | | | 799 | |
| Eaton Vance Corp. | | | 11,600 | | | | 360 | |
| Federated Investors, Inc., Class B | | | 9,950 | | | | 341 | |
| Financial Federal Corp. | | | 1,200 | | | | 33 | |
| Franklin Resources, Inc. | | | 20,600 | | | | 2,348 | |
| GAMCO Investors, Inc., Class A | | | 700 | | | | 28 | |
Greenhill & Co., Inc. (a) | | | 2,500 | | | | 170 | |
IntercontinentalExchange, Inc. * | | | 5,100 | | | | 431 | |
| International Securities Exchange, Inc. | | | 3,000 | | | | 154 | |
Investment Technology Group, Inc. * | | | 4,750 | | | | 222 | |
| Investors Financial Services Corp. | | | 5,500 | | | | 216 | |
| Janus Capital Group, Inc. | | | 19,200 | | | | 386 | |
| Jefferies Group, Inc. | | | 8,200 | | | | 236 | |
| JPMorgan Chase & Co. | | | 295,944 | | | | 14,040 | |
Knight Capital Group, Inc., Class A * | | | 9,700 | | | | 181 | |
LaBranche & Co., Inc. (a)* | | | 2,400 | | | | 21 | |
| Legg Mason, Inc. | | | 10,050 | | | | 905 | |
| Lehman Brothers Holdings, Inc. | | | 47,744 | | | | 3,716 | |
8 See financial notes.
Schwab Total Stock Market Index Fund
Portfolio Holdings continued
| | | | | | | | | |
| | | Number of | | | Value | |
| Security | | Shares | | | ($ x 1,000) | |
| | | | | | | | | |
| Leucadia National Corp. | | | 17,908 | | | | 472 | |
| Mellon Financial Corp. | | | 35,800 | | | | 1,389 | |
| Merrill Lynch & Co., Inc. | | | 79,800 | | | | 6,976 | |
| MicroFinancial, Inc. | | | 1,900 | | | | 7 | |
| Moody’s Corp. | | | 26,600 | | | | 1,764 | |
| Morgan Stanley | | | 90,300 | | | | 6,902 | |
Nasdaq Stock Market, Inc. * | | | 8,800 | | | | 314 | |
Nelnet, Inc., Class A * | | | 4,500 | | | | 132 | |
| Northern Trust Corp. | | | 18,500 | | | | 1,086 | |
| Nuveen Investments, Inc., Class A | | | 7,300 | | | | 360 | |
NYSE Group, Inc. (a)* | | | 11,500 | | | | 851 | |
Piper Jaffray Cos. * | | | 950 | | | | 66 | |
Portfolio Recovery Associates, Inc. (a)* | | | 2,000 | | | | 93 | |
| Raymond James Financial, Inc. | | | 10,350 | | | | 330 | |
| Resource America, Inc., Class A | | | 2,000 | | | | 46 | |
| SEI Investments Co. | | | 9,700 | | | | 546 | |
Siebert Financial Corp. * | | | 2,900 | | | | 10 | |
| SLM Corp. | | | 37,300 | | | | 1,816 | |
| State Street Corp. | | | 28,000 | | | | 1,798 | |
| Student Loan Corp. | | | 1,700 | | | | 352 | |
| SWS Group, Inc. | | | 1,141 | | | | 32 | |
| T. Rowe Price Group, Inc. | | | 21,400 | | | | 1,012 | |
TD Ameritrade Holding Corp. * | | | 47,100 | | | | 776 | |
| The Bank of New York Co., Inc. | | | 63,000 | | | | 2,165 | |
| The Bear Stearns Cos., Inc. | | | 13,620 | | | | 2,061 | |
The Charles Schwab Corp. (d) | | | 111,120 | | | | 2,025 | |
| The First Marblehead Corp. | | | 5,000 | | | | 337 | |
The Goldman Sachs Group, Inc. (a) | | | 38,700 | | | | 7,345 | |
| W.P. Carey & Co. LLC | | | 4,100 | | | | 118 | |
| Waddell & Reed Financial, Inc., Class A | | | 7,250 | | | | 185 | |
| Westwood Holdings Group, Inc. | | | 285 | | | | 6 | |
World Acceptance Corp. * | | | 1,000 | | | | 50 | |
| | | | | | | | |
| | | | | | | | 121,667 | |
| | | | | | | | | |
Energy 8.5% | | | | | | | | |
| |
| Alliance Resource Partners L.P. | | | 3,400 | | | | 121 | |
| Alon USA Energy, Inc. | | | 3,700 | | | | 104 | |
| Anadarko Petroleum Corp. | | | 39,060 | | | | 1,813 | |
| Apache Corp. | | | 25,772 | | | | 1,683 | |
| APCO Argentina, Inc. | | | 200 | | | | 16 | |
| Arch Coal, Inc. | | | 7,000 | | | | 242 | |
Atlas America, Inc. * | | | 1,780 | | | | 85 | |
ATP Oil & Gas Corp. (a)* | | | 1,600 | | | | 69 | |
Atwood Oceanics, Inc. * | | | 2,400 | | | | 111 | |
| Baker Hughes, Inc. | | | 28,300 | | | | 1,954 | |
Basic Energy Services, Inc. * | | | 3,000 | | | | 73 | |
| Berry Petroleum Co., Class A | | | 4,000 | | | | 119 | |
| BJ Services Co. | | | 28,600 | | | | 863 | |
Boardwalk Pipeline Partners L.P. (a) | | | 8,000 | | | | 230 | |
BP Prudhoe Bay Royalty Trust (a) | | | 2,200 | | | | 159 | |
Bristow Group, Inc. (a)* | | | 1,800 | | | | 60 | |
Buckeye Partners L.P. (a)* | | | 3,400 | | | | 156 | |
| Cabot Oil & Gas Corp. | | | 13,600 | | | | 720 | |
Cameron International Corp. * | | | 9,100 | | | | 456 | |
CARBO Ceramics, Inc. (a) | | | 1,900 | | | | 64 | |
Chesapeake Energy Corp. (a) | | | 19,200 | | | | 623 | |
| ChevronTexaco Corp. | | | 178,939 | | | | 12,025 | |
| Cimarex Energy Co. | | | 5,508 | | | | 198 | |
CNX Gas Corp. * | | | 12,000 | | | | 314 | |
Comstock Resources, Inc. * | | | 4,500 | | | | 126 | |
| ConocoPhillips | | | 131,623 | | | | 7,929 | |
| CONSOL Energy, Inc. | | | 14,100 | | | | 499 | |
CREDO Petroleum Corp. * | | | 2,700 | | | | 35 | |
Cross Timbers Royalty Trust (a) | | | 1,500 | | | | 73 | |
Crosstex Energy L.P. (a)* | | | 2,000 | | | | 75 | |
Denbury Resources, Inc. * | | | 9,800 | | | | 282 | |
| Devon Energy Corp. | | | 37,360 | | | | 2,497 | |
Diamond Offshore Drilling, Inc. (a) | | | 9,800 | | | | 678 | |
Dresser-Rand Group, Inc. * | | | 6,000 | | | | 130 | |
| El Paso Corp. | | | 51,387 | | | | 704 | |
Enbridge Energy Management LLC * | | | 1,313 | | | | 64 | |
Encore Acquisition Co. * | | | 2,250 | | | | 56 | |
Energy Partners, Ltd. (a)* | | | 1,700 | | | | 42 | |
| Energy Transfer Partners L.P. | | | 4,000 | | | | 196 | |
ENSCO International, Inc. (a) | | | 11,200 | | | | 548 | |
Enterprise GP Holdings L.P. (a) | | | 2,100 | | | | 71 | |
Enterprise Products Partners L.P. (a) | | | 29,500 | | | | 811 | |
| EOG Resources, Inc. | | | 22,800 | | | | 1,517 | |
Exxon Mobil Corp. (c) | | | 493,166 | | | | 35,222 | |
FMC Technologies, Inc. * | | | 4,591 | | | | 278 | |
Forest Oil Corp. * | | | 4,450 | | | | 145 | |
| Frontier Oil Corp. | | | 14,400 | | | | 423 | |
| General Maritime Corp. | | | 3,000 | | | | 110 | |
Global Industries Ltd. * | | | 8,900 | | | | 148 | |
Grant Prideco, Inc. * | | | 10,100 | | | | 381 | |
Grey Wolf, Inc. * | | | 15,000 | | | | 105 | |
| Gulf Island Fabrication, Inc. | | | 2,800 | | | | 82 | |
GulfMark Offshore, Inc. * | | | 1,600 | | | | 55 | |
| Halliburton Co. | | | 78,200 | | | | 2,530 | |
Hanover Compressor Co. * | | | 5,600 | | | | 104 | |
Harvest Natural Resources, Inc. * | | | 6,000 | | | | 67 | |
Helix Energy Solutions Group, Inc. * | | | 6,064 | | | | 196 | |
| Helmerich & Payne, Inc. | | | 9,600 | | | | 230 | |
Hess Corp. (a) | | | 19,200 | | | | 814 | |
| Holly Corp. | | | 3,000 | | | | 143 | |
Hornbeck Offshore Services, Inc. * | | | 2,500 | | | | 90 | |
| Hugoton Royalty Trust | | | 4,846 | | | | 125 | |
Hydril Co. * | | | 2,500 | | | | 150 | |
Inergy, L.P. * | | | 2,000 | | | | 58 | |
Input/Output, Inc. * | | | 4,200 | | | | 47 | |
Key Energy Services, Inc. * | | | 10,300 | | | | 144 | |
Kinder Morgan Management, LLC * | | | 3,819 | | | | 166 | |
| Kinder Morgan, Inc. | | | 10,700 | | | | 1,125 | |
Lone Star Technologies, Inc. * | | | 1,200 | | | | 58 | |
| Lufkin Industries, Inc. | | | 1,000 | | | | 60 | |
Magellan Midstream Partners (a) | | | 2,400 | | | | 94 | |
See financial notes. 9
Schwab Total Stock Market Index Fund
Portfolio Holdings continued
| | | | | | | | | |
| | | Number of | | | Value | |
| Security | | Shares | | | ($ x 1,000) | |
| | | | | | | | | |
| Marathon Oil Corp. | | | 30,654 | | | | 2,649 | |
Mariner Energy, Inc. * | | | 6,601 | | | | 131 | |
| Maritrans, Inc. | | | 2,500 | | | | 93 | |
Markwest Energy Partners L.P. * | | | 500 | | | | 27 | |
| Massey Energy Co. | | | 6,800 | | | | 172 | |
Meridian Resource Corp. * | | | 3,100 | | | | 10 | |
| Murphy Oil Corp. | | | 14,500 | | | | 684 | |
Nabors Industries Ltd. * | | | 23,634 | | | | 730 | |
NATCO Group, Inc., Class A * | | | 1,200 | | | | 40 | |
National-Oilwell Varco, Inc. * | | | 11,540 | | | | 697 | |
Natural Resource Partners L.P. (a) | | | 2,000 | | | | 104 | |
Newfield Exploration Co. * | | | 7,400 | | | | 302 | |
| Noble Corp. | | | 10,100 | | | | 708 | |
| Noble Energy, Inc. | | | 14,218 | | | | 691 | |
| Occidental Petroleum Corp. | | | 75,020 | | | | 3,521 | |
Oceaneering International, Inc. * | | | 2,200 | | | | 79 | |
Oil States International, Inc. * | | | 3,600 | | | | 105 | |
OMI Corp. (a) | | | 6,500 | | | | 145 | |
| Overseas Shipholding Group, Inc. | | | 3,700 | | | | 231 | |
Pacific Energy Partners L.P. (a) | | | 3,500 | | | | 125 | |
Parker Drilling Co. * | | | 7,800 | | | | 64 | |
| Patterson-UTI Energy, Inc. | | | 13,200 | | | | 306 | |
| Peabody Energy Corp. | | | 18,500 | | | | 776 | |
| Penn Virginia Corp. | | | 2,500 | | | | 179 | |
Penn Virginia Resource Partners, L.P. (a)* | | | 5,000 | | | | 131 | |
| Pioneer Natural Resources Co. | | | 10,133 | | | | 413 | |
Plains All American Pipeline L.P. (a) | | | 4,600 | | | | 218 | |
Plains Exploration & Production Co. * | | | 6,579 | | | | 278 | |
| Pogo Producing Co. | | | 4,700 | | | | 210 | |
Pride International, Inc. * | | | 12,700 | | | | 351 | |
Quicksilver Resources, Inc. (a)* | | | 4,200 | | | | 144 | |
| Range Resources Corp. | | | 8,100 | | | | 220 | |
| Rowan Cos., Inc. | | | 8,400 | | | | 280 | |
| RPC, Inc. | | | 7,650 | | | | 166 | |
| Schlumberger Ltd. | | | 100,000 | | | | 6,308 | |
SEACOR Holdings, Inc. * | | | 1,250 | | | | 112 | |
| Smith International, Inc. | | | 17,300 | | | | 683 | |
| St. Mary Land & Exploration Co. | | | 7,400 | | | | 276 | |
Stone Energy Corp. * | | | 976 | | | | 38 | |
Sunoco Logistics Partners L.P. (a)* | | | 2,000 | | | | 93 | |
| Sunoco, Inc. | | | 11,000 | | | | 727 | |
Superior Energy Services, Inc. * | | | 7,400 | | | | 232 | |
Swift Energy Co. * | | | 2,500 | | | | 117 | |
Syntroleum Corp. * | | | 4,000 | | | | 16 | |
TC Pipelines L.P. * | | | 2,400 | | | | 77 | |
| Teekay Shipping Corp. | | | 3,000 | | | | 123 | |
| TEL Offshore Trust | | | 83 | | | | 1 | |
TEPPCO Partners L.P. (a) | | | 7,000 | | | | 276 | |
| Tesoro Corp. | | | 4,800 | | | | 307 | |
TETRA Technologies, Inc. * | | | 5,300 | | | | 137 | |
The Houston Exploration Co. * | | | 2,200 | | | | 119 | |
| Tidewater, Inc. | | | 5,200 | | | | 259 | |
Todco * | | | 5,500 | | | | 188 | |
Transocean, Inc. (a)* | | | 27,731 | | | | 2,012 | |
Ultra Petroleum Corp. * | | | 13,000 | | | | 694 | |
Unit Corp. * | | | 4,400 | | | | 204 | |
| Universal Compression Holdings, Inc. | | | 2,900 | | | | 175 | |
| USEC, Inc. | | | 6,800 | | | | 76 | |
| Valero Energy Corp. | | | 47,980 | | | | 2,511 | |
Valero L.P. * | | | 1,600 | | | | 86 | |
Veritas DGC, Inc. * | | | 3,000 | | | | 216 | |
| W&T Offshore, Inc. | | | 5,000 | | | | 169 | |
W-H Energy Services, Inc. * | | | 900 | | | | 42 | |
Weatherford International Ltd. * | | | 21,200 | | | | 871 | |
Westmoreland Coal Co. * | | | 3,500 | | | | 80 | |
| Williams Cos., Inc. | | | 42,360 | | | | 1,035 | |
| World Fuel Services Corp. | | | 2,100 | | | | 90 | |
| XTO Energy, Inc. | | | 25,942 | | | | 1,210 | |
| | | | | | | | |
| | | | | | | | 116,281 | |
| | | | | | | | | |
Food & Staples Retailing 2.2% | | | | | | | | |
| |
| Arden Group, Inc. | | | 600 | | | | 84 | |
BJ’s Wholesale Club, Inc. * | | | 6,100 | | | | 175 | |
| Casey’s General Stores, Inc. | | | 5,100 | | | | 124 | |
| Costco Wholesale Corp. | | | 38,600 | | | | 2,060 | |
| CVS Corp. | | | 63,700 | | | | 1,999 | |
| Ingles Markets, Inc., Class A | | | 300 | | | | 9 | |
| Longs Drug Stores Corp. | | | 3,300 | | | | 142 | |
| Nash Finch Co. | | | 1,700 | | | | 44 | |
Pathmark Stores, Inc. * | | | 3,900 | | | | 40 | |
Performance Food Group Co. * | | | 1,900 | | | | 55 | |
PriceSmart, Inc. * | | | 500 | | | | 8 | |
Rite Aid Corp. (a)* | | | 40,400 | | | | 189 | |
| Ruddick Corp. | | | 3,100 | | | | 87 | |
| Safeway, Inc. | | | 35,900 | | | | 1,054 | |
Smart & Final, Inc. * | | | 2,700 | | | | 49 | |
| Spartan Corp. | | | 500 | | | | 10 | |
| Supervalu, Inc. | | | 19,832 | | | | 662 | |
| Sysco Corp. | | | 48,636 | | | | 1,701 | |
| The Andersons, Inc. | | | 1,000 | | | | 36 | |
The Great Atlantic & Pacific Tea Co., Inc. * | | | 2,200 | | | | 61 | |
| The Kroger Co. | | | 60,800 | | | | 1,367 | |
The Pantry, Inc. * | | | 1,000 | | | | 55 | |
| The Topps Co., Inc. | | | 1,700 | | | | 15 | |
United Natural Foods, Inc. * | | | 2,600 | | | | 91 | |
| Wal-Mart Stores, Inc. | | | 309,100 | | | | 15,232 | |
| Walgreen Co. | | | 80,400 | | | | 3,512 | |
| Weis Markets, Inc. | | | 1,700 | | | | 69 | |
Whole Foods Market, Inc. (a) | | | 10,900 | | | | 696 | |
Wild Oats Markets, Inc. * | | | 3,800 | | | | 68 | |
| | | | | | | | |
| | | | | | | | 29,694 | |
| | | | | | | | | |
Food, Beverage & Tobacco 4.5% | | | | | | | | |
| |
Alliance One International, Inc. * | | | 3,300 | | | | 16 | |
| Altria Group, Inc. | | | 168,800 | | | | 13,729 | |
American Italian Pasta Co., Class A * | | | 1,000 | | | | 8 | |
| Anheuser-Busch Cos., Inc. | | | 61,500 | | | | 2,916 | |
| Archer-Daniels-Midland Co. | | | 53,958 | | | | 2,077 | |
10 See financial notes.
Schwab Total Stock Market Index Fund
Portfolio Holdings continued
| | | | | | | | | |
| | | Number of | | | Value | |
| Security | | Shares | | | ($ x 1,000) | |
| | | | | | | | | |
Bridgford Foods Corp. * | | | 300 | | | | 2 | |
| Brown-Forman Corp., Class B | | | 9,912 | | | | 716 | |
| Campbell Soup Co. | | | 35,400 | | | | 1,323 | |
| Chiquita Brands International, Inc. | | | 3,200 | | | | 44 | |
| Coca-Cola Bottling Co. Consolidated | | | 400 | | | | 25 | |
| Coca-Cola Enterprises, Inc. | | | 30,000 | | | | 601 | |
| ConAgra Foods, Inc. | | | 43,293 | | | | 1,132 | |
Constellation Brands, Inc., Class A * | | | 17,600 | | | | 484 | |
| Corn Products International, Inc. | | | 5,800 | | | | 210 | |
Dean Foods Co. * | | | 8,613 | | | | 361 | |
| Del Monte Foods Co. | | | 8,931 | | | | 96 | |
| Delta & Pine Land Co. | | | 2,000 | | | | 81 | |
| Flowers Foods, Inc. | | | 4,772 | | | | 130 | |
| Fresh Del Monte Produce, Inc. | | | 4,200 | | | | 66 | |
| General Mills, Inc. | | | 31,300 | | | | 1,778 | |
Green Mountain Coffee Roasters, Inc. * | | | 900 | | | | 36 | |
Griffin Land & Nurseries, Inc. * | | | 300 | | | | 8 | |
| H.J. Heinz Co. | | | 27,900 | | | | 1,176 | |
| Hormel Foods Corp. | | | 9,000 | | | | 325 | |
| J & J Snack Foods Corp. | | | 6,400 | | | | 214 | |
John B. Sanfilippo & Son * | | | 5,000 | | | | 53 | |
| Kellogg Co. | | | 34,400 | | | | 1,731 | |
Kraft Foods, Inc., Class A (a) | | | 128,700 | | | | 4,427 | |
| Lancaster Colony Corp. | | | 3,400 | | | | 138 | |
| Lance, Inc. | | | 2,900 | | | | 57 | |
| Loews Corp. — Carolina Group | | | 5,600 | | | | 324 | |
Maui Land & Pineapple Co, Inc. * | | | 800 | | | | 25 | |
| McCormick & Co., Inc. | | | 11,300 | | | | 423 | |
| MGP Ingredients, Inc. | | | 3,400 | | | | 76 | |
| Molson Coors Brewing Co., Class B | | | 6,000 | | | | 427 | |
Monterey Gourmet Foods, Inc. * | | | 700 | | | | 3 | |
Peet’s Coffee & Tea, Inc. (a)* | | | 1,800 | | | | 48 | |
| PepsiAmericas, Inc. | | | 13,200 | | | | 270 | |
| PepsiCo, Inc. | | | 140,800 | | | | 8,932 | |
| Pilgrim’s Pride Corp., Class B | | | 1,400 | | | | 35 | |
Ralcorp Holdings, Inc. * | | | 6,700 | | | | 331 | |
Reynolds American, Inc. (a) | | | 22,664 | | | | 1,431 | |
| Rocky Mountain Chocolate Factory, Inc. | | | 2,311 | | | | 30 | |
| Sanderson Farms, Inc. | | | 1,750 | | | | 46 | |
| Sara Lee Corp. | | | 64,378 | | | | 1,101 | |
| Seaboard Corp. | | | 200 | | | | 282 | |
Smithfield Foods, Inc. * | | | 6,300 | | | | 169 | |
| Tasty Baking Co. | | | 500 | | | | 5 | |
| The Coca-Cola Co. | | | 202,200 | | | | 9,447 | |
The Hain Celestial Group, Inc. * | | | 1,406 | | | | 40 | |
| The Hershey Co. | | | 19,400 | | | | 1,026 | |
| The J.M. Smucker Co. | | | 2,438 | | | | 119 | |
| The Pepsi Bottling Group, Inc. | | | 23,400 | | | | 740 | |
| Tootsie Roll Industries, Inc. | | | 2,391 | | | | 76 | |
TreeHouse Foods, Inc. * | | | 1,722 | | | | 44 | |
| Tyson Foods, Inc., Class A | | | 30,340 | | | | 438 | |
| Universal Corp. | | | 1,800 | | | | 66 | |
| UST, Inc. | | | 12,700 | | | | 680 | |
Vector Group Ltd. (a) | | | 3,735 | | | | 64 | |
| Wm. Wrigley Jr. Co. | | | 20,750 | | | | 1,078 | |
Zapata Corp. * | | | 8,000 | | | | 49 | |
| | | | | | | | |
| | | | | | | | 61,785 | |
| | | | | | | | | |
Health Care Equipment & Services 4.4% | | | | | | | | |
| |
ABIOMED, Inc. * | | | 800 | | | | 11 | |
Advanced Medical Optics, Inc. * | | | 4,111 | | | | 168 | |
| Aetna, Inc. | | | 59,200 | | | | 2,440 | |
Align Technology, Inc. * | | | 8,700 | | | | 121 | |
Alliance Imaging, Inc. * | | | 1,800 | | | | 15 | |
Allscripts Healthcare Solutions, Inc. (a)* | | | 1,900 | | | | 45 | |
Amedisys, Inc. * | | | 2,500 | | | | 101 | |
America Service Group, Inc. * | | | 3,550 | | | | 55 | |
American Medical Systems Holdings, Inc. * | | | 7,800 | | | | 139 | |
AMERIGROUP Corp. * | | | 1,800 | | | | 54 | |
| AmerisourceBergen Corp. | | | 20,648 | | | | 975 | |
AMN Healthcare Services, Inc. * | | | 4,110 | | | | 104 | |
Amsurg Corp. * | | | 2,300 | | | | 48 | |
| Analogic Corp. | | | 1,400 | | | | 78 | |
Apria Healthcare Group, Inc. * | | | 4,100 | | | | 95 | |
| Arrow International, Inc. | | | 3,500 | | | | 125 | |
Arthrocare Corp. (a)* | | | 1,400 | | | | 57 | |
Aspect Medical Systems, Inc. * | | | 3,700 | | | | 66 | |
| Bausch & Lomb, Inc. | | | 3,400 | | | | 182 | |
| Baxter International, Inc. | | | 50,118 | | | | 2,304 | |
| Beckman Coulter, Inc. | | | 5,100 | | | | 294 | |
| Becton Dickinson & Co. | | | 21,300 | | | | 1,492 | |
| Biomet, Inc. | | | 20,125 | | | | 762 | |
BioScrip, Inc. * | | | 2,172 | | | | 5 | |
Biosite, Inc. * | | | 1,400 | | | | 64 | |
Boston Scientific Corp. * | | | 109,568 | | | | 1,743 | |
| Brookdale Senior Living, Inc. | | | 300 | | | | 14 | |
| C.R. Bard, Inc. | | | 8,000 | | | | 656 | |
Cantel Medical Corp. * | | | 3,571 | | | | 51 | |
| Cardinal Health, Inc. | | | 36,160 | | | | 2,367 | |
| Caremark Rx, Inc. | | | 37,090 | | | | 1,826 | |
Centene Corp. * | | | 1,000 | | | | 24 | |
Cerner Corp. * | | | 8,400 | | | | 406 | |
Cerus Corp. * | | | 500 | | | | 4 | |
| Chemed Corp. | | | 1,400 | | | | 50 | |
Chindex International, Inc. (a)* | | | 2,200 | | | | 29 | |
Cholestech Corp. * | | | 1,700 | | | | 26 | |
| CIGNA Corp. | | | 12,800 | | | | 1,497 | |
Clinical Data, Inc. * | | | 117 | | | | 2 | |
Community Health Systems, Inc. * | | | 7,100 | | | | 230 | |
Conmed Corp. * | | | 1,700 | | | | 38 | |
CorVel Corp. * | | | 1,900 | | | | 82 | |
Coventry Health Care, Inc. * | | | 23,937 | | | | 1,124 | |
Cross Country Healthcare, Inc. * | | | 1,600 | | | | 31 | |
CryoLife, Inc. * | | | 750 | | | | 4 | |
See financial notes. 11
Schwab Total Stock Market Index Fund
Portfolio Holdings continued
| | | | | | | | | |
| | | Number of | | | Value | |
| Security | | Shares | | | ($ x 1,000) | |
| | | | | | | | | |
Cyberonics, Inc. (a)* | | | 1,200 | | | | 22 | |
Cytyc Corp. * | | | 7,800 | | | | 206 | |
| Dade Behring Holdings, Inc. | | | 5,200 | | | | 189 | |
| Datascope Corp. | | | 2,500 | | | | 90 | |
DaVita, Inc. * | | | 8,250 | | | | 459 | |
Dendrite International, Inc. * | | | 3,600 | | | | 38 | |
| Dentsply International, Inc. | | | 13,100 | | | | 410 | |
DJ Orthopedics, Inc. * | | | 3,000 | | | | 121 | |
Dynacq Healthcare, Inc. * | | | 3,616 | | | | 7 | |
Eclipsys Corp. * | | | 3,800 | | | | 81 | |
Edwards Lifesciences Corp. * | | | 3,900 | | | | 167 | |
Emdeon Corp. * | | | 21,926 | | | | 255 | |
Enpath Medical, Inc. * | | | 3,000 | | | | 29 | |
Express Scripts, Inc. * | | | 12,600 | | | | 803 | |
Five Star Quality Care, Inc. * | | | 135 | | | | 1 | |
Gen-Probe, Inc. * | | | 3,400 | | | | 163 | |
Genesis HealthCare Corp. * | | | 6,250 | | | | 303 | |
Gentiva Health Services, Inc. * | | | 3,250 | | | | 60 | |
Greatbatch, Inc. * | | | 1,100 | | | | 25 | |
Haemonetics Corp. * | | | 3,700 | | | | 169 | |
Hanger Orthopedic Group, Inc. * | | | 5,400 | | | | 42 | |
| HCA, Inc. | | | 27,200 | | | | 1,374 | |
| Health Management Associates, Inc., Class A | | | 15,900 | | | | 313 | |
Health Net, Inc. * | | | 9,100 | | | | 378 | |
HealthExtras, Inc. * | | | 1,900 | | | | 44 | |
HealthTronics, Inc. * | | | 3,500 | | | | 24 | |
Healthways, Inc. * | | | 3,100 | | | | 131 | |
Henry Schein, Inc. * | | | 4,600 | | | | 229 | |
| Hillenbrand Industries, Inc. | | | 5,800 | | | | 340 | |
Hologic, Inc. * | | | 5,200 | | | | 250 | |
| Hooper Holmes, Inc. | | | 4,600 | | | | 17 | |
Hospira, Inc. * | | | 14,070 | | | | 511 | |
Humana, Inc. * | | | 18,900 | | | | 1,134 | |
ICU Medical, Inc. * | | | 550 | | | | 23 | |
IDEXX Laboratories, Inc. * | | | 2,500 | | | | 208 | |
Immucor, Inc. * | | | 3,795 | | | | 104 | |
| IMS Health, Inc. | | | 19,300 | | | | 537 | |
Integra LifeSciences Holdings * | | | 1,100 | | | | 41 | |
Intermagnetics General Corp. * | | | 3,084 | | | | 84 | |
Intuitive Surgical, Inc. * | | | 1,050 | | | | 104 | |
| Invacare Corp. | | | 2,000 | | | | 44 | |
inVentiv Health, Inc. * | | | 2,233 | | | | 64 | |
Kindred Healthcare, Inc. * | | | 4,624 | | | | 125 | |
Kinetic Concepts, Inc. * | | | 2,500 | | | | 87 | |
Kyphon, Inc. * | | | 3,000 | | | | 118 | |
Laboratory Corp. of America Holdings * | | | 12,800 | | | | 877 | |
| Landauer, Inc. | | | 1,100 | | | | 60 | |
LifePoint Hospitals, Inc. * | | | 3,707 | | | | 132 | |
Lincare Holdings, Inc. * | | | 7,100 | | | | 238 | |
Magellan Health Services, Inc. * | | | 3,007 | | | | 131 | |
| Manor Care, Inc. | | | 8,000 | | | | 384 | |
Matria Healthcare, Inc. (a)* | | | 1,800 | | | | 51 | |
| McKesson Corp. | | | 22,900 | | | | 1,147 | |
MedCath Corp. * | | | 1,500 | | | | 40 | |
Medco Health Solutions, Inc. * | | | 25,033 | | | | 1,339 | |
Medical Action Industries, Inc. * | | | 2,500 | | | | 66 | |
Medical Staffing Network Holdings, Inc. * | | | 1,300 | | | | 7 | |
| Medtronic, Inc. | | | 95,374 | | | | 4,643 | |
| Mentor Corp. | | | 3,000 | | | | 140 | |
| Meridian Bioscience, Inc. | | | 7,500 | | | | 173 | |
Merit Medical Systems, Inc. * | | | 2,222 | | | | 35 | |
Molina Healthcare, Inc. * | | | 2,500 | | | | 98 | |
| National Healthcare Corp. | | | 600 | | | | 33 | |
National Medical Health Card Systems, Inc. * | | | 800 | | | | 11 | |
Neogen Corp. * | | | 625 | | | | 13 | |
Novoste Corp. * | | | 400 | | | | 1 | |
Nutraceutical International Corp. * | | | 5,000 | | | | 75 | |
OCA, Inc. * | | | 2,112 | | | | — | |
Odyssey Healthcare, Inc. * | | | 2,250 | | | | 30 | |
| Omnicare, Inc. | | | 7,500 | | | | 284 | |
Option Care, Inc. (a) | | | 2,250 | | | | 29 | |
OraSure Technologies, Inc. * | | | 1,500 | | | | 12 | |
| Owens & Minor, Inc. | | | 2,000 | | | | 63 | |
Patterson Cos., Inc. * | | | 10,600 | | | | 348 | |
PDI, Inc. * | | | 2,900 | | | | 30 | |
Pediatrix Medical Group, Inc. * | | | 6,000 | | | | 270 | |
Per-Se Technologies, Inc. (a)* | | | 5,428 | | | | 133 | |
PolyMedica Corp. (a) | | | 779 | | | | 32 | |
PSS World Medical, Inc. * | | | 5,800 | | | | 117 | |
Q-Med, Inc. * | | | 500 | | | | 2 | |
| Quest Diagnostics, Inc. | | | 14,820 | | | | 737 | |
Regeneration Technologies, Inc. * | | | 1,700 | | | | 11 | |
RehabCare Group, Inc. * | | | 4,000 | | | | 51 | |
Res-Care, Inc. * | | | 4,500 | | | | 87 | |
ResMed, Inc. * | | | 4,000 | | | | 176 | |
Respironics, Inc. * | | | 3,800 | | | | 134 | |
Sierra Health Services, Inc. * | | | 21,500 | | | | 736 | |
SonoSite, Inc. * | | | 1,600 | | | | 46 | |
St. Jude Medical, Inc. * | | | 29,600 | | | | 1,017 | |
| Steris Corp. | | | 6,100 | | | | 149 | |
| Stryker Corp. | | | 31,100 | | | | 1,626 | |
Sunrise Senior Living, Inc. * | | | 3,400 | | | | 106 | |
Symbion, Inc. * | | | 2,500 | | | | 41 | |
Tenet Healthcare Corp. * | | | 36,650 | | | | 259 | |
| The Cooper Cos., Inc. | | | 2,781 | | | | 160 | |
Theragenics Corp. * | | | 2,500 | | | | 8 | |
Thoratec Corp. * | | | 2,636 | | | | 42 | |
Triad Hospitals, Inc. * | | | 6,044 | | | | 224 | |
TriPath Imaging, Inc. * | | | 2,600 | | | | 24 | |
TriZetto Group, Inc. * | | | 5,900 | | | | 101 | |
United Surgical Partners International, Inc. * | | | 2,100 | | | | 52 | |
| UnitedHealth Group, Inc. | | | 118,880 | | | | 5,799 | |
| Universal Health Services, Inc., Class B | | | 4,000 | | | | 212 | |
Urologix, Inc. * | | | 1,800 | | | | 5 | |
12 See financial notes.
Schwab Total Stock Market Index Fund
Portfolio Holdings continued
| | | | | | | | | |
| | | Number of | | | Value | |
| Security | | Shares | | | ($ x 1,000) | |
| | | | | | | | | |
US Physical Therapy, Inc. * | | | 3,500 | | | | 42 | |
| Utah Medical Products, Inc. | | | 2,500 | | | | 85 | |
Varian Medical Systems, Inc. * | | | 11,900 | | | | 653 | |
VCA Antech, Inc. * | | | 5,400 | | | | 175 | |
Viasys Healthcare, Inc. * | | | 2,982 | | | | 85 | |
VistaCare, Inc., Class A * | | | 1,000 | | | | 13 | |
| Vital Signs, Inc. | | | 1,900 | | | | 107 | |
WebMD Health Corp., Class A (a)* | | | 2,600 | | | | 95 | |
WellPoint, Inc. * | | | 57,723 | | | | 4,405 | |
| West Pharmaceutical Services, Inc. | | | 4,600 | | | | 193 | |
Wright Medical Group, Inc. * | | | 1,700 | | | | 42 | |
| Young Innovations, Inc. | | | 2,000 | | | | 72 | |
Zimmer Holdings, Inc. * | | | 20,300 | | | | 1,462 | |
| | | | | | | | |
| | | | | | | | 60,204 | |
| | | | | | | | | |
Household & Personal Products 1.9% | | | | | | | | |
| |
| Alberto-Culver Co., Class B | | | 6,950 | | | | 353 | |
| Avon Products, Inc. | | | 39,000 | | | | 1,186 | |
Central Garden & Pet Co. * | | | 1,600 | | | | 80 | |
Chattem, Inc. * | | | 1,200 | | | | 51 | |
| Church & Dwight Co., Inc. | | | 4,950 | | | | 201 | |
| Clorox Co. | | | 12,200 | | | | 788 | |
| Colgate-Palmolive Co. | | | 42,500 | | | | 2,719 | |
Energizer Holdings, Inc. * | | | 6,333 | | | | 495 | |
Herbalife Ltd. * | | | 300 | | | | 11 | |
| Inter Parfums, Inc. | | | 675 | | | | 13 | |
| Kimberly-Clark Corp. | | | 40,639 | | | | 2,703 | |
NBTY, Inc. * | | | 5,400 | | | | 150 | |
| Nu Skin Enterprises, Inc., Class A | | | 6,500 | | | | 124 | |
| Oil-Dri Corp. of America | | | 500 | | | | 8 | |
Procter & Gamble Co. (c) | | | 269,915 | | | | 17,110 | |
Spectrum Brands, Inc. (a)* | | | 2,800 | | | | 27 | |
| The Estee Lauder Cos., Inc., Class A | | | 10,300 | | | | 416 | |
USANA Health Sciences, Inc. (a)* | | | 1,000 | | | | 45 | |
| WD-40 Co. | | | 1,600 | | | | 55 | |
| | | | | | | | |
| | | | | | | | 26,535 | |
| | | | | | | | | |
Insurance 5.5% | | | | | | | | |
| |
| 21st Century Holding Co. | | | 1,500 | | | | 42 | |
| 21st Century Insurance Group | | | 7,200 | | | | 114 | |
| ACE Ltd. | | | 23,100 | | | | 1,322 | |
| AFLAC, Inc. | | | 42,600 | | | | 1,914 | |
| Alfa Corp. | | | 6,800 | | | | 126 | |
Alleghany Corp. * | | | 220 | | | | 67 | |
| Ambac Financial Group, Inc. | | | 7,750 | | | | 647 | |
| American Financial Group, Inc. | | | 5,500 | | | | 263 | |
| American International Group, Inc. | | | 211,922 | | | | 14,235 | |
| American National Insurance Co. | | | 1,300 | | | | 151 | |
American Physicians Capital, Inc. * | | | 2,500 | | | | 137 | |
| AmerUs Group Co. | | | 4,400 | | | | 301 | |
AON Corp. (a) | | | 25,500 | | | | 887 | |
Arch Capital Group Ltd. * | | | 3,900 | | | | 251 | |
Argonaut Group, Inc. * | | | 2,400 | | | | 82 | |
| Arthur J. Gallagher & Co. | | | 6,800 | | | | 189 | |
| Assurant, Inc. | | | 11,500 | | | | 606 | |
| Axis Capital Holdings Ltd. | | | 7,200 | | | | 237 | |
| Baldwin & Lyons, Inc., Class B | | | 750 | | | | 19 | |
Berkshire Hathaway, Inc., Class A * | | | 121 | | | | 12,762 | |
| Brown & Brown, Inc. | | | 11,000 | | | | 322 | |
| Cincinnati Financial Corp. | | | 13,450 | | | | 614 | |
| Clark, Inc. | | | 1,700 | | | | 21 | |
CNA Financial Corp. * | | | 20,900 | | | | 783 | |
CNA Surety Corp. * | | | 2,200 | | | | 45 | |
| Commerce Group, Inc. | | | 3,200 | | | | 95 | |
Conseco, Inc. * | | | 11,500 | | | | 234 | |
| Crawford & Co., Class B | | | 1,600 | | | | 12 | |
| Delphi Financial Group, Inc., Class A | | | 6,772 | | | | 266 | |
| EMC Insurance Group, Inc. | | | 1,200 | | | | 37 | |
| Erie Indemnity Co., Class A | | | 5,500 | | | | 279 | |
| Everest Re Group Ltd. | | | 2,900 | | | | 288 | |
| FBL Financial Group, Inc., Class A | | | 2,090 | | | | 74 | |
| Fidelity National Financial, Inc. | | | 13,517 | | | | 301 | |
| Fidelity National Title Group, Inc., Class A | | | 17,327 | | | | 381 | |
| First American Corp. | | | 7,800 | | | | 318 | |
FPIC Insurance Group, Inc. * | | | 400 | | | | 14 | |
| Genworth Financial, Inc., Class A | | | 37,500 | | | | 1,254 | |
| Great American Financial Resources, Inc. | | | 2,800 | | | | 65 | |
| Hanover Insurance Group, Inc. | | | 4,900 | | | | 222 | |
| Harleysville Group, Inc. | | | 1,800 | | | | 65 | |
| HCC Insurance Holdings, Inc. | | | 7,950 | | | | 268 | |
| Hilb, Rogal & Hobbs Co. | | | 3,000 | | | | 120 | |
| Horace Mann Educators Corp. | | | 4,300 | | | | 87 | |
| Independence Holding Co. | | | 2,700 | | | | 64 | |
| Infinity Property & Casualty Corp. | | | 2,500 | | | | 108 | |
| LandAmerica Financial Group, Inc. | | | 5,300 | | | | 334 | |
| Lincoln National Corp. | | | 21,926 | | | | 1,388 | |
| Loews Corp. | | | 45,000 | | | | 1,751 | |
Markel Corp. * | | | 300 | | | | 120 | |
| Marsh & McLennan Cos., Inc. | | | 43,000 | | | | 1,266 | |
| MBIA, Inc. | | | 11,250 | | | | 698 | |
| Mercury General Corp. | | | 5,400 | | | | 280 | |
| MetLife, Inc. | | | 62,000 | | | | 3,542 | |
MIIX Group, Inc. * | | | 2,400 | | | | — | |
| National Financial Partners Corp. | | | 2,500 | | | | 98 | |
National Western Life Insurance Co., Class A * | | | 300 | | | | 72 | |
| Nationwide Financial Services, Inc., Class A | | | 11,400 | | | | 580 | |
Navigators Group, Inc. * | | | 1,500 | | | | 71 | |
| NYMAGIC, Inc. | | | 2,100 | | | | 67 | |
| Odyssey Re Holdings Corp. | | | 5,400 | | | | 191 | |
| Ohio Casualty Corp. | | | 5,500 | | | | 151 | |
| Old Republic International Corp. | | | 20,437 | | | | 460 | |
PartnerRe Ltd. (a) | | | 1,900 | | | | 133 | |
Penn Treaty American Corp. * | | | 150 | | | | 1 | |
See financial notes. 13
Schwab Total Stock Market Index Fund
Portfolio Holdings continued
| | | | | | | | | |
| | | Number of | | | Value | |
| Security | | Shares | | | ($ x 1,000) | |
| | | | | | | | | |
Philadelphia Consolidated Holding Corp. * | | | 5,500 | | | | 215 | |
PMA Capital Corp., Class A * | | | 700 | | | | 7 | |
| Presidential Life Corp. | | | 1,000 | | | | 24 | |
| Principal Financial Group, Inc. | | | 25,400 | | | | 1,435 | |
ProAssurance Corp. * | | | 1,670 | | | | 81 | |
| Protective Life Corp. | | | 5,500 | | | | 243 | |
| Prudential Financial, Inc. | | | 45,500 | | | | 3,500 | |
| Reinsurance Group of America, Inc. | | | 5,100 | | | | 288 | |
| RenaissanceRe Holdings Ltd. | | | 1,800 | | | | 98 | |
| RLI Corp. | | | 2,800 | | | | 152 | |
| SAFECO Corp. | | | 12,500 | | | | 727 | |
| Safety Insurance Group, Inc. | | | 1,000 | | | | 50 | |
SCPIE Holdings, Inc. * | | | 700 | | | | 20 | |
| Selective Insurance Group, Inc. | | | 1,200 | | | | 66 | |
SNTL Litigation Trust Certificates * | | | 1,300 | | | | — | |
| StanCorp Financial Group, Inc. | | | 5,000 | | | | 228 | |
| State Auto Financial Corp. | | | 3,800 | | | | 122 | |
| Stewart Information Services Corp. | | | 1,400 | | | | 52 | |
| The Allstate Corp. | | | 58,874 | | | | 3,613 | |
| The Chubb Corp. | | | 33,094 | | | | 1,759 | |
| The Hartford Financial Services Group, Inc. | | | 24,400 | | | | 2,127 | |
| The Midland Co. | | | 1,800 | | | | 84 | |
| The Phoenix Cos., Inc. | | | 7,000 | | | | 111 | |
| The Progressive Corp. | | | 85,200 | | | | 2,059 | |
| The St. Paul Travelers Cos., Inc. | | | 54,550 | | | | 2,789 | |
| Torchmark Corp. | | | 10,600 | | | | 654 | |
| Transatlantic Holdings, Inc. | | | 6,437 | | | | 392 | |
| United Fire & Casualty Co. | | | 1,000 | | | | 35 | |
| Unitrin, Inc. | | | 5,600 | | | | 240 | |
| UnumProvident Corp. | | | 23,914 | | | | 473 | |
USI Holdings Corp. * | | | 4,500 | | | | 72 | |
| W. R. Berkley Corp. | | | 22,950 | | | | 846 | |
| Wesco Financial Corp. | | | 200 | | | | 96 | |
| White Mountains Insurance Group Ltd. | | | 200 | | | | 114 | |
| XL Capital Ltd., Class A | | | 14,700 | | | | 1,037 | |
| Zenith National Insurance Corp. | | | 3,400 | | | | 158 | |
| | | | | | | | |
| | | | | | | | 75,859 | |
| | | | | | | | | |
Materials 3.1% | | | | | | | | |
| |
| A. Schulman, Inc. | | | 2,300 | | | | 56 | |
| A.M. Castle & Co. | | | 1,500 | | | | 50 | |
AEP Industries, Inc. * | | | 400 | | | | 21 | |
| Air Products & Chemicals, Inc. | | | 17,700 | | | | 1,233 | |
| Airgas, Inc. | | | 5,000 | | | | 189 | |
AK Steel Holding Corp. * | | | 9,527 | | | | 142 | |
| Albemarle Corp. | | | 4,500 | | | | 293 | |
| Alcoa, Inc. | | | 68,664 | | | | 1,985 | |
Aleris International, Inc. * | | | 2,459 | | | | 127 | |
| Allegheny Technologies, Inc. | | | 7,700 | | | | 606 | |
| Aptargroup, Inc. | | | 2,200 | | | | 121 | |
| Arch Chemicals, Inc. | | | 2,700 | | | | 90 | |
| Ashland, Inc. | | | 5,500 | | | | 325 | |
| Ball Corp. | | | 5,700 | | | | 237 | |
| Bemis Co. | | | 8,900 | | | | 299 | |
Bowater, Inc. (a) | | | 2,300 | | | | 48 | |
Buckeye Technologies, Inc. * | | | 1,200 | | | | 12 | |
| Cabot Corp. | | | 5,200 | | | | 206 | |
| Carpenter Technology Corp. | | | 2,500 | | | | 267 | |
| Celanese Corp. | | | 12,500 | | | | 258 | |
Century Aluminum Co. * | | | 600 | | | | 23 | |
| Chaparral Steel Co. | | | 4,500 | | | | 187 | |
| Chemtura Corp. | | | 16,927 | | | | 145 | |
| Chesapeake Corp. | | | 1,000 | | | | 16 | |
| Commercial Metals Co. | | | 9,000 | | | | 239 | |
| Compass Minerals International, Inc. | | | 2,500 | | | | 77 | |
Crown Holdings, Inc. * | | | 10,400 | | | | 202 | |
| Cytec Industries, Inc. | | | 3,600 | | | | 199 | |
| Deltic Timber Corp. | | | 700 | | | | 36 | |
| E.I. du Pont de Nemours & Co. | | | 78,195 | | | | 3,581 | |
| Eagle Materials, Inc. | | | 4,143 | | | | 152 | |
| Eastman Chemical Co. | | | 5,600 | | | | 341 | |
| Ecolab, Inc. | | | 21,500 | | | | 975 | |
| Ferro Corp. | | | 4,200 | | | | 83 | |
| Florida Rock Industries, Inc. | | | 5,987 | | | | 257 | |
| FMC Corp. | | | 3,100 | | | | 213 | |
| Freeport-McMoRan Copper & Gold, Inc., Class B | | | 16,000 | | | | 968 | |
| Georgia Gulf Corp. | | | 3,300 | | | | 71 | |
| Gibraltar Industries, Inc. | | | 2,500 | | | | 53 | |
Glamis Gold Ltd. * | | | 11,100 | | | | 490 | |
| Greif, Inc., Class A | | | 3,700 | | | | 347 | |
| H.B. Fuller Co. | | | 4,000 | | | | 99 | |
| Hawkins, Inc. | | | 1,900 | | | | 27 | |
Headwaters, Inc. (a)* | | | 2,500 | | | | 62 | |
Hercules, Inc. * | | | 8,500 | | | | 155 | |
Huntsman Corp. * | | | 17,500 | | | | 302 | |
| International Flavors & Fragrances, Inc. | | | 4,400 | | | | 187 | |
| International Paper Co. | | | 39,304 | | | | 1,311 | |
| Kronos Worldwide, Inc. | | | 2,560 | | | | 76 | |
LESCO, Inc. * | | | 500 | | | | 4 | |
| Louisiana-Pacific Corp. | | | 8,300 | | | | 164 | |
| Lyondell Chemical Co. | | | 19,930 | | | | 512 | |
| MacDermid, Inc. | | | 3,800 | | | | 127 | |
| Martin Marietta Materials, Inc. | | | 4,200 | | | | 370 | |
Material Sciences Corp. * | | | 4,000 | | | | 48 | |
| MeadWestvaco Corp. | | | 14,474 | | | | 398 | |
Meridian Gold, Inc. * | | | 6,600 | | | | 167 | |
| Minerals Technologies, Inc. | | | 600 | | | | 33 | |
Mod-Pac Corp. * | | | 500 | | | | 6 | |
| Monsanto Co. | | | 43,290 | | | | 1,914 | |
| Myers Industries, Inc. | | | 2,580 | | | | 47 | |
Nalco Holding Co. * | | | 11,100 | | | | 225 | |
| Neenah Paper, Inc. | | | 1,231 | | | | 45 | |
| NewMarket Corp. | | | 2,000 | | | | 129 | |
| Newmont Mining Corp. | | | 32,251 | | | | 1,460 | |
14 See financial notes.
Schwab Total Stock Market Index Fund
Portfolio Holdings continued
| | | | | | | | | |
| | | Number of | | | Value | |
| Security | | Shares | | | ($ x 1,000) | |
| | | | | | | | | |
NL Industries, Inc. (a) | | | 5,300 | | | | 59 | |
| NN, Inc. | | | 1,800 | | | | 20 | |
| Nucor Corp. | | | 27,000 | | | | 1,577 | |
| Olin Corp. | | | 4,820 | | | | 83 | |
OM Group, Inc. * | | | 2,400 | | | | 137 | |
Omnova Solutions, Inc. * | | | 3,400 | | | | 15 | |
Oregon Steel Mills, Inc. * | | | 2,500 | | | | 136 | |
Owens-Illinois, Inc. * | | | 13,700 | | | | 227 | |
| Packaging Corp. of America | | | 8,500 | | | | 195 | |
Pactiv Corp. * | | | 12,400 | | | | 382 | |
| Penford Corp. | | | 2,700 | | | | 44 | |
| Phelps Dodge Corp. | | | 14,660 | | | | 1,472 | |
PolyOne Corp. * | | | 3,200 | | | | 26 | |
| PPG Industries, Inc. | | | 13,900 | | | | 951 | |
| Praxair, Inc. | | | 25,700 | | | | 1,548 | |
| Quanex Corp. | | | 5,625 | | | | 189 | |
| Reliance Steel & Aluminum Co. | | | 8,500 | | | | 292 | |
| Rock-Tennessee Co., Class A | | | 1,500 | | | | 31 | |
| Rohm & Haas Co. | | | 26,753 | | | | 1,386 | |
Royal Gold, Inc. (a) | | | 2,200 | | | | 65 | |
| RPM International, Inc. | | | 9,600 | | | | 184 | |
RTI International Metals, Inc. (a)* | | | 1,500 | | | | 92 | |
| Schnitzer Steel Industries, Inc., Class A | | | 1,650 | | | | 58 | |
| Schweitzer-Mauduit International, Inc. | | | 2,300 | | | | 53 | |
| Sealed Air Corp. | | | 6,000 | | | | 357 | |
| Sensient Technologies Corp. | | | 4,800 | | | | 111 | |
| Sigma-Aldrich Corp. | | | 6,300 | | | | 473 | |
| Silgan Holdings, Inc. | | | 5,800 | | | | 240 | |
Smurfit-Stone Container Corp. * | | | 20,000 | | | | 213 | |
| Sonoco Products Co. | | | 4,100 | | | | 145 | |
Southern Copper Corp. (a) | | | 10,800 | | | | 555 | |
| Spartech Corp. | | | 4,200 | | | | 115 | |
| Steel Dynamics, Inc. | | | 3,500 | | | | 210 | |
| Stepan Co. | | | 1,200 | | | | 38 | |
Stillwater Mining Co. * | | | 7,133 | | | | 77 | |
Symyx Technologies, Inc. * | | | 3,800 | | | | 93 | |
| Temple-Inland, Inc. | | | 8,800 | | | | 347 | |
| Texas Industries, Inc. | | | 1,000 | | | | 62 | |
| The Dow Chemical Co. | | | 78,766 | | | | 3,213 | |
| The Lubrizol Corp. | | | 5,400 | | | | 243 | |
The Mosaic Co. * | | | 29,500 | | | | 552 | |
| The Scotts Miracle-Gro Co., Class A | | | 5,600 | | | | 277 | |
Titanium Metals Corp. * | | | 7,200 | | | | 212 | |
| United States Steel Corp. | | | 9,900 | | | | 669 | |
| Valhi, Inc. | | | 8,600 | | | | 212 | |
| Valspar Corp. | | | 8,400 | | | | 225 | |
| Vulcan Materials Co. | | | 6,900 | | | | 562 | |
| Wausau-Mosinee Paper Corp. | | | 4,700 | | | | 64 | |
| Westlake Chemical Corp. | | | 5,100 | | | | 161 | |
| Weyerhaeuser Co. | | | 18,250 | | | | 1,161 | |
| Worthington Industries, Inc. | | | 7,200 | | | | 124 | |
| | | | | | | | |
| | | | | | | | 43,021 | |
| | | | | | | | | |
Media 4.0% | | | | | | | | |
| |
4Kids Entertainment, Inc. * | | | 1,000 | | | | 18 | |
Acme Communications, Inc. * | | | 1,900 | | | | 10 | |
ACT Teleconferencing, Inc. * | | | 1,100 | | | | — | |
Adelphia Communications, Class A * | | | 6,301 | | | | — | |
| Advo, Inc. | | | 4,050 | | | | 119 | |
| Arbitron, Inc. | | | 2,120 | | | | 89 | |
| Belo Corp., Class A | | | 9,400 | | | | 165 | |
Cablevision Systems Corp., Class A * | | | 21,100 | | | | 586 | |
| Cadmus Communications Corp. | | | 3,900 | | | | 59 | |
| Carmike Cinemas, Inc. | | | 2,500 | | | | 50 | |
| Catalina Marketing Corp. | | | 5,900 | | | | 150 | |
| CBS Corp., Class B | | | 72,006 | | | | 2,084 | |
| Citadel Broadcasting Co. | | | 2,500 | | | | 26 | |
| Clear Channel Communications, Inc. | | | 49,721 | | | | 1,733 | |
Clear Channel Outdoor Holdings, Inc., Class A * | | | 23,700 | | | | 582 | |
Comcast Corp. * | | | 42,800 | | | | 1,733 | |
Comcast Corp., Class A * | | | 151,336 | | | | 6,155 | |
Cox Radio, Inc., Class A * | | | 4,600 | | | | 77 | |
Crown Media Holdings, Inc., Class A (a)* | | | 6,000 | | | | 24 | |
Cumulus Media, Inc., Class A * | | | 4,351 | | | | 47 | |
Daily Journal Corp. * | | | 500 | | | | 20 | |
Discovery Holding Co., Class A * | | | 22,323 | | | | 331 | |
Dow Jones & Co., Inc. (a) | | | 6,500 | | | | 228 | |
DreamWorks Animation SKG, Inc., Class A * | | | 2,800 | | | | 74 | |
EchoStar Communications Corp., Class A * | | | 37,700 | | | | 1,339 | |
Emak Worldwide, Inc. * | | | 500 | | | | 3 | |
Emmis Communications Corp., Class A * | | | 713 | | | | 9 | |
| Entercom Communications Corp. | | | 3,000 | | | | 83 | |
Entravision Communications Corp. * | | | 5,000 | | | | 37 | |
| Gannett Co., Inc. | | | 19,500 | | | | 1,153 | |
Gemstar — TV Guide International, Inc. * | | | 33,360 | | | | 116 | |
Getty Images, Inc. * | | | 4,600 | | | | 199 | |
| Gray Television, Inc. | | | 5,600 | | | | 36 | |
| Harte-Hanks, Inc. | | | 8,100 | | | | 205 | |
| Hearst-Argyle Television, Inc. | | | 3,700 | | | | 93 | |
Interactive Data Corp. * | | | 20,700 | | | | 473 | |
| John Wiley & Sons, Inc., Class A | | | 6,300 | | | | 222 | |
| Journal Communications, Inc., Class A | | | 7,500 | | | | 88 | |
| Journal Register Co. | | | 3,200 | | | | 25 | |
Lakes Entertainment, Inc. * | | | 1,800 | | | | 20 | |
Lamar Advertising Co., Class A * | | | 9,200 | | | | 531 | |
| Lee Enterprises, Inc. | | | 2,500 | | | | 71 | |
Liberty Global, Inc., Class A * | | | 12,575 | | | | 330 | |
Liberty Global, Inc., Class C * | | | 12,601 | | | | 320 | |
See financial notes. 15
Schwab Total Stock Market Index Fund
Portfolio Holdings continued
| | | | | | | | | |
| | | Number of | | | Value | |
| Security | | Shares | | | ($ x 1,000) | |
| | | | | | | | | |
Liberty Media Holding Corp. — Capital * | | | 11,161 | | | | 994 | |
Lin TV Corp., Class A * | | | 3,300 | | | | 27 | |
Live Nation, Inc. * | | | 6,215 | | | | 132 | |
Martha Stewart Living Omnimedia, Class A (a)* | | | 3,900 | | | | 83 | |
| Media General, Inc., Class A | | | 2,000 | | | | 74 | |
Mediacom Communications Corp., Class A * | | | 7,600 | | | | 63 | |
| Meredith Corp. | | | 3,800 | | | | 199 | |
Morningstar, Inc. * | | | 3,200 | | | | 131 | |
| News Corp., Class A | | | 253,950 | | | | 5,295 | |
Nexstar Broadcasting Group, Inc., Class A * | | | 4,500 | | | | 17 | |
| NTL, Inc. | | | 15,000 | | | | 405 | |
| Omnicom Group, Inc. | | | 16,800 | | | | 1,704 | |
Pegasus Communications Corp., Class A * | | | 6,320 | | | | 13 | |
Playboy Enterprises, Inc., Class B * | | | 4,500 | | | | 48 | |
ProQuest Co. * | | | 1,700 | | | | 22 | |
R.H. Donnelley Corp. * | | | 2,966 | | | | 179 | |
Radio One, Inc., Class A * | | | 9,500 | | | | 65 | |
| Readers Digest Association, Inc., Class A | | | 7,300 | | | | 105 | |
Regal Entertainment Group, Class A (a) | | | 4,200 | | | | 87 | |
Salem Communications Corp., Class A * | | | 900 | | | | 12 | |
Scholastic Corp. * | | | 2,200 | | | | 69 | |
| Sinclair Broadcast Group, Inc., Class A | | | 4,800 | | | | 43 | |
Sirius Satellite Radio, Inc. (a)* | | | 2,600 | | | | 10 | |
| Sun-Times Media Group, Inc., Class A | | | 7,300 | | | | 42 | |
The DIRECTV Group, Inc. * | | | 101,476 | | | | 2,261 | |
| The E.W. Scripps Co., Class A | | | 12,000 | | | | 594 | |
The Interpublic Group of Cos., Inc. * | | | 34,537 | | | | 377 | |
| The McClatchy Co., Class A | | | 8,416 | | | | 365 | |
| The McGraw-Hill Cos., Inc. | | | 34,600 | | | | 2,220 | |
The New York Times Co., Class A (a) | | | 13,200 | | | | 319 | |
| The Walt Disney Co. | | | 195,410 | | | | 6,148 | |
| Time Warner, Inc. | | | 367,052 | | | | 7,345 | |
Tivo, Inc. * | | | 4,500 | | | | 29 | |
| Tribune Co. | | | 26,900 | | | | 897 | |
Triple Crown Media, Inc. * | | | 560 | | | | 4 | |
Univision Communications, Inc., Class A * | | | 25,510 | | | | 894 | |
Valassis Communications, Inc. * | | | 3,700 | | | | 56 | |
| Value Line, Inc. | | | 300 | | | | 16 | |
Viacom, Inc., Class B * | | | 56,606 | | | | 2,203 | |
| Warner Music Group Corp. | | | 11,700 | | | | 303 | |
| Washington Post, Class B | | | 600 | | | | 452 | |
| Westwood One, Inc. | | | 7,200 | | | | 57 | |
| World Wrestling Entertainment, Inc. | | | 4,900 | | | | 82 | |
XM Satellite Radio Holdings, Inc., Class A * | | | 15,300 | | | | 178 | |
| | | | | | | | |
| | | | | | | | 54,332 | |
| | | | | | | | | |
Pharmaceuticals & Biotechnology 7.4% | | | | | | | | |
| |
| Abbott Laboratories | | | 125,705 | | | | 5,972 | |
Accelrys, Inc. * | | | 1,300 | | | | 8 | |
Adolor Corp. * | | | 1,700 | | | | 23 | |
Affymetrix, Inc. * | | | 4,900 | | | | 125 | |
Albany Molecular Research, Inc. * | | | 1,600 | | | | 19 | |
Alkermes, Inc. * | | | 3,100 | | | | 52 | |
| Allergan, Inc. | | | 13,234 | | | | 1,529 | |
| Alpharma, Inc., Class A | | | 3,700 | | | | 82 | |
Amgen, Inc. * | | | 103,268 | | | | 7,839 | |
Amylin Pharmaceuticals, Inc. * | | | 2,300 | | | | 101 | |
Andrx Corp. * | | | 6,400 | | | | 157 | |
Aphton Corp. * | | | 800 | | | | — | |
Applera Corp. — Celera Genomics Group * | | | 5,600 | | | | 87 | |
| Applied Biosystems Group-Applera Corp. | | | 16,500 | | | | 615 | |
Arena Pharmaceuticals, Inc. * | | | 800 | | | | 12 | |
ArQule, Inc. * | | | 8,800 | | | | 35 | |
AVANIR Pharmaceuticals, Class A (a)* | | | 475 | | | | 2 | |
Avigen, Inc. * | | | 900 | | | | 5 | |
Barr Pharmaceuticals, Inc. * | | | 8,781 | | | | 460 | |
Bio-Rad Laboratories, Inc., Class A * | | | 3,000 | | | | 220 | |
BioCryst Pharmaceuticals, Inc. * | | | 1,400 | | | | 17 | |
Biogen Idec, Inc. * | | | 28,125 | | | | 1,339 | |
BioMarin Pharmaceuticals, Inc. * | | | 1,800 | | | | 29 | |
BioVeris Corp. * | | | 3,800 | | | | 36 | |
Bradley Pharmaceuticals, Inc. * | | | 1,700 | | | | 30 | |
| Bristol-Myers Squibb Co. | | | 153,750 | | | | 3,805 | |
Bruker BioSciences Corp. * | | | 2,100 | | | | 17 | |
Caliper Life Sciences, Inc. * | | | 700 | | | | 4 | |
| Cambrex Corp. | | | 3,400 | | | | 80 | |
Celgene Corp. * | | | 27,000 | | | | 1,443 | |
Cell Genesys, Inc. * | | | 1,500 | | | | 7 | |
Cephalon, Inc. * | | | 3,500 | | | | 246 | |
Charles River Laboratories, Inc. * | | | 6,416 | | | | 275 | |
| CNS, Inc. | | | 5,000 | | | | 185 | |
CollaGenex Pharmaceuticals, Inc. * | | | 3,000 | | | | 35 | |
Connetics Corp. * | | | 3,400 | | | | 58 | |
Covance, Inc. * | | | 5,800 | | | | 339 | |
Cubist Pharmaceuticals, Inc. * | | | 1,900 | | | | 42 | |
CuraGen Corp. * | | | 2,100 | | | | 8 | |
CV Therapeutics, Inc. (a)* | | | 1,100 | | | | 14 | |
CYTOGEN Corp. * | | | 230 | | | | 1 | |
Dendreon Corp. * | | | 1,400 | | | | 7 | |
Digene Corp. * | | | 1,400 | | | | 65 | |
Dionex Corp. * | | | 1,200 | | | | 65 | |
Diversa Corp. * | | | 1,100 | | | | 10 | |
Durect Corp. * | | | 2,000 | | | | 9 | |
16 See financial notes.
Schwab Total Stock Market Index Fund
Portfolio Holdings continued
| | | | | | | | | |
| | | Number of | | | Value | |
| Security | | Shares | | | ($ x 1,000) | |
| | | | | | | | | |
Dyax Corp. * | | | 2,000 | | | | 6 | |
| Eli Lilly & Co. | | | 92,400 | | | | 5,175 | |
Embrex, Inc. * | | | 1,300 | | | | 15 | |
Emisphere Technologies, Inc. (a)* | | | 800 | | | | 5 | |
Encysive Pharmaceuticals, Inc. * | | | 2,600 | | | | 12 | |
Endo Pharmaceutical Holdings, Inc. * | | | 10,500 | | | | 300 | |
Entremed, Inc. * | | | 1,200 | | | | 3 | |
Enzo Biochem, Inc. * | | | 1,781 | | | | 25 | |
Enzon Pharmaceuticals, Inc. * | | | 4,400 | | | | 38 | |
Epicept Corp. * | | | 489 | | | | 1 | |
eResearch Technology, Inc. (a)* | | | 5,625 | | | | 46 | |
Exelixis, Inc. * | | | 1,800 | | | | 17 | |
Fisher Scientific International, Inc. * | | | 8,876 | | | | 760 | |
Forest Laboratories, Inc. * | | | 27,500 | | | | 1,346 | |
Gene Logic, Inc. * | | | 1,300 | | | | 2 | |
Genentech, Inc. * | | | 83,300 | | | | 6,939 | |
Genzyme Corp. * | | | 20,732 | | | | 1,400 | |
Geron Corp. * | | | 1,000 | | | | 8 | |
Gilead Sciences, Inc. * | | | 35,420 | | | | 2,440 | |
Harvard Bioscience, Inc. * | | | 500 | | | | 3 | |
Human Genome Sciences, Inc. * | | | 5,100 | | | | 68 | |
ICOS Corp. * | | | 2,700 | | | | 86 | |
Illumina, Inc. * | | | 1,500 | | | | 66 | |
ImClone Systems, Inc. * | | | 6,935 | | | | 217 | |
ImmunoGen, Inc. * | | | 1,500 | | | | 6 | |
Impax Laboratories, Inc. * | | | 1,600 | | | | 11 | |
Incyte Corp. * | | | 2,600 | | | | 12 | |
Indevus Pharmaceuticals, Inc. * | | | 1,800 | | | | 12 | |
Inspire Pharmaceuticals, Inc. * | | | 1,300 | | | | 7 | |
InterMune, Inc. * | | | 1,100 | | | | 24 | |
Invitrogen Corp. * | | | 3,629 | | | | 211 | |
Isis Pharmaceuticals, Inc. * | | | 1,900 | | | | 16 | |
| Johnson & Johnson | | | 246,370 | | | | 16,605 | |
Kendle International, Inc. * | | | 2,700 | | | | 93 | |
King Pharmaceuticals, Inc. * | | | 18,516 | | | | 310 | |
Kos Pharmaceuticals, Inc. * | | | 3,200 | | | | 159 | |
Kosan Biosciences, Inc. * | | | 2,500 | | | | 10 | |
KV Pharmaceutical Co., Class A * | | | 2,700 | | | | 60 | |
Lexicon Genetics, Inc. * | | | 6,900 | | | | 28 | |
Ligand Pharmaceuticals, Inc., Class B (a)* | | | 2,300 | | | | 25 | |
Luminex Corp. * | | | 800 | | | | 13 | |
Matrixx Initiatives, Inc. * | | | 1,700 | | | | 37 | |
Maxygen, Inc. * | | | 1,500 | | | | 13 | |
Medarex, Inc. * | | | 3,000 | | | | 39 | |
Medicis Pharmaceutical Corp., Class A (a) | | | 3,400 | | | | 119 | |
MedImmune, Inc. * | | | 19,875 | | | | 637 | |
| Merck & Co., Inc. | | | 183,552 | | | | 8,337 | |
MGI Pharma, Inc. * | | | 3,932 | | | | 75 | |
Millennium Pharmaceuticals, Inc. * | | | 25,856 | | | | 302 | |
Millipore Corp. * | | | 5,100 | | | | 329 | |
Molecular Devices Corp. * | | | 3,200 | | | | 64 | |
| Mylan Laboratories, Inc. | | | 16,600 | | | | 340 | |
Myogen, Inc. * | | | 2,500 | | | | 131 | |
Myriad Genetics, Inc. * | | | 1,400 | | | | 38 | |
Nabi Biopharmaceuticals * | | | 2,800 | | | | 18 | |
Nanogen, Inc. * | | | 1,500 | | | | 3 | |
Nektar Therapeutics (a)* | | | 2,200 | | | | 32 | |
Neose Technologies, Inc. * | | | 500 | | | | 1 | |
Neurocrine Biosciences, Inc. * | | | 1,400 | | | | 16 | |
Neurogen Corp. * | | | 800 | | | | 5 | |
Northfield Laboratories, Inc. (a)* | | | 1,100 | | | | 15 | |
Noven Pharmaceuticals, Inc. * | | | 1,800 | | | | 40 | |
NPS Pharmacuticals, Inc. * | | | 1,000 | | | | 5 | |
Nuvelo, Inc. * | | | 300 | | | | 6 | |
Onyx Pharmaceuticals, Inc. (a)* | | | 1,800 | | | | 34 | |
Orchid Cellmark, Inc. * | | | 280 | | | | 1 | |
OSI Pharmaceuticals, Inc. (a)* | | | 1,998 | | | | 76 | |
OXiGENE, Inc. (a)* | | | 900 | | | | 4 | |
Pain Therapeutics, Inc. * | | | 2,600 | | | | 22 | |
Par Pharmaceutical Cos., Inc. * | | | 1,900 | | | | 37 | |
PAREXEL International Corp. * | | | 2,400 | | | | 71 | |
PDL BioPharma, Inc. * | | | 4,100 | | | | 87 | |
| PerkinElmer, Inc. | | | 11,477 | | | | 245 | |
| Perrigo Co. | | | 7,300 | | | | 131 | |
| Pfizer, Inc. | | | 610,192 | | | | 16,262 | |
| Pharmaceutical Product Development, Inc. (PPD) | | | 10,000 | | | | 316 | |
Pharmacopeia Drug Discovery, Inc. * | | | 650 | | | | 3 | |
Pharmacyclics, Inc. * | | | 1,100 | | | | 6 | |
PharmaNet Development Group, Inc. * | | | 1,500 | | | | 28 | |
Pharmion Corp. * | | | 2,500 | | | | 61 | |
POZEN, Inc. * | | | 1,300 | | | | 22 | |
Regeneron Pharmaceuticals, Inc. * | | | 1,900 | | | | 38 | |
Sangamo BioSciences, Inc. * | | | 1,200 | | | | 7 | |
Savient Pharmaceuticals, Inc. * | | | 2,300 | | | | 17 | |
| Schering-Plough Corp. | | | 121,750 | | | | 2,696 | |
Sciele Pharma, Inc. * | | | 3,400 | | | | 74 | |
Sepracor, Inc. (a)* | | | 6,600 | | | | 342 | |
SuperGen, Inc. * | | | 900 | | | | 5 | |
Tanox, Inc. * | | | 4,900 | | | | 66 | |
Techne Corp. * | | | 3,800 | | | | 212 | |
The Medicines Co. * | | | 1,700 | | | | 44 | |
Thermo Electron Corp. * | | | 19,550 | | | | 838 | |
Third Wave Technologies, Inc. * | | | 1,800 | | | | 7 | |
Titan Pharmaceuticals, Inc. * | | | 800 | | | | 2 | |
Trimeris, Inc. * | | | 500 | | | | 4 | |
Tripos, Inc. * | | | 6,000 | | | | 8 | |
| Valeant Pharmaceuticals International | | | 7,900 | | | | 148 | |
Varian, Inc. * | | | 5,800 | | | | 272 | |
Ventana Medical Systems, Inc. * | | | 2,400 | | | | 97 | |
Vertex Pharmaceuticals, Inc. * | | | 3,144 | | | | 128 | |
Vical, Inc. * | | | 1,600 | | | | 10 | |
See financial notes. 17
Schwab Total Stock Market Index Fund
Portfolio Holdings continued
| | | | | | | | | |
| | | Number of | | | Value | |
| Security | | Shares | | | ($ x 1,000) | |
| | | | | | | | | |
ViroPharma, Inc. * | | | 1,000 | | | | 13 | |
Waters Corp. * | | | 8,700 | | | | 433 | |
Watson Pharmaceuticals, Inc. * | | | 7,732 | | | | 208 | |
| Wyeth | | | 109,400 | | | | 5,583 | |
ZymoGenetics, Inc. * | | | 2,000 | | | | 32 | |
| | | | | | | | |
| | | | | | | | 101,381 | |
| | | | | | | | | |
Real Estate 2.5% | | | | | | | | |
| |
Affordable Residential Communities * | | | 3,000 | | | | 33 | |
Alexander’s, Inc. * | | | 700 | | | | 255 | |
| Alexandria Real Estate Equities, Inc. | | | 2,500 | | | | 249 | |
| AMB Property Corp. | | | 7,300 | | | | 426 | |
| American Financial Realty Trust | | | 8,500 | | | | 99 | |
American Home Mortgage Investment Corp. (a) | | | 4,500 | | | | 154 | |
| American Land Lease, Inc. | | | 1,700 | | | | 44 | |
| American Mortgage Acceptance Co. | | | 1,500 | | | | 27 | |
American Realty Investors, Inc. * | | | 1,037 | | | | 9 | |
| Annaly Mortgage Management, Inc. | | | 9,400 | | | | 123 | |
| Anthracite Capital, Inc. | | | 4,900 | | | | 70 | |
| Anworth Mortgage Asset Corp. | | | 1,000 | | | | 9 | |
| Apartment Investment & Management Co., Class A | | | 7,400 | | | | 424 | |
| Archstone-Smith Trust | | | 15,285 | | | | 920 | |
| AvalonBay Communities, Inc. | | | 6,100 | | | | 799 | |
| Boston Properties, Inc. | | | 9,900 | | | | 1,058 | |
| Brandywine Realty Trust | | | 7,363 | | | | 246 | |
| BRE Properties, Class A | | | 5,000 | | | | 331 | |
| Brookfield Properties Corp. | | | 17,800 | | | | 674 | |
| Camden Property Trust | | | 2,300 | | | | 186 | |
CapitalSource, Inc. (a) | | | 6,900 | | | | 191 | |
| Capstead Mortgage Corp. | | | 2,240 | | | | 19 | |
CB Richard Ellis Group, Inc., Class A * | | | 17,500 | | | | 526 | |
| CBL & Associates Properties, Inc. | | | 4,400 | | | | 192 | |
| Colonial Properties Trust | | | 2,567 | | | | 129 | |
Commercial Net Lease Realty (a) | | | 3,320 | | | | 75 | |
| Consolidated-Tomoka Land Co. | | | 900 | | | | 58 | |
| Corporate Office Properties Trust SBI | | | 3,500 | | | | 167 | |
| Correctional Properties Trust | | | 1,600 | | | | 52 | |
| Cousins Properties, Inc. | | | 5,200 | | | | 186 | |
| Crescent Real Estate Equity Co. | | | 7,400 | | | | 161 | |
| Developers Diversified Realty Corp. | | | 7,612 | | | | 464 | |
| Duke Realty Corp. | | | 12,990 | | | | 520 | |
| EastGroup Properties, Inc. | | | 900 | | | | 48 | |
| Entertainment Properties Trust | | | 2,200 | | | | 121 | |
| Equity Inns, Inc. | | | 2,700 | | | | 45 | |
| Equity Lifestyle Properties, Inc. | | | 3,000 | | | | 148 | |
Equity Office Properties Trust (a) | | | 32,738 | | | | 1,391 | |
| Equity One, Inc. | | | 6,600 | | | | 166 | |
| Equity Residential | | | 24,700 | | | | 1,349 | |
| Essex Property Trust, Inc. | | | 2,600 | | | | 347 | |
| Federal Realty Investment Trust | | | 5,200 | | | | 417 | |
FelCor Lodging Trust, Inc. * | | | 5,700 | | | | 118 | |
First Industrial Realty Trust (a) | | | 2,600 | | | | 120 | |
| Forest City Enterprises, Inc., Class A | | | 10,400 | | | | 571 | |
| Friedman, Billings, Ramsey Group, Inc., Class A | | | 12,080 | | | | 92 | |
| General Growth Properties, Inc. | | | 20,460 | | | | 1,062 | |
Getty Realty Corp. (a) | | | 2,000 | | | | 64 | |
| Glenborough Realty Trust, Inc. | | | 2,400 | | | | 62 | |
Glimcher Realty Trust (a) | | | 3,800 | | | | 98 | |
| Global Signal, Inc. | | | 5,000 | | | | 271 | |
| Health Care Property Investors, Inc. | | | 10,648 | | | | 334 | |
| Health Care REIT, Inc. | | | 5,200 | | | | 215 | |
| Healthcare Realty Trust, Inc. | | | 4,900 | | | | 198 | |
| Highwoods Properties, Inc. | | | 5,600 | | | | 214 | |
| Home Properties, Inc. | | | 2,500 | | | | 158 | |
| Hospitality Properties Trust | | | 6,000 | | | | 291 | |
| Host Hotels & Resorts, Inc. | | | 39,254 | | | | 905 | |
| HRPT Properties Trust | | | 13,500 | | | | 161 | |
| IMPAC Mortgage Holdings, Inc. | | | 4,800 | | | | 45 | |
| Inland Real Estate Corp. | | | 5,500 | | | | 103 | |
| Innkeepers USA Trust | | | 1,500 | | | | 26 | |
| iStar Financial, Inc. | | | 9,390 | | | | 435 | |
| Jones Lang LaSalle, Inc. | | | 2,300 | | | | 212 | |
| Kilroy Realty Corp. | | | 1,800 | | | | 136 | |
| Kimco Realty Corp. | | | 19,196 | | | | 853 | |
| LaSalle Hotel Properties | | | 3,500 | | | | 148 | |
| Lexington Corp. Properties Trust | | | 3,000 | | | | 64 | |
| Liberty Media Holding Corp. — Capital | | | 8,300 | | | | 400 | |
| LTC Properties, Inc. | | | 2,800 | | | | 76 | |
| Mack-Cali Realty Corp. | | | 5,900 | | | | 312 | |
| Maguire Properties, Inc. | | | 3,000 | | | | 128 | |
| MFA Mortgage Investments, Inc. | | | 5,500 | | | | 44 | |
| Mid-America Apartment Communities, Inc. | | | 2,500 | | | | 159 | |
Move, Inc. * | | | 5,020 | | | | 24 | |
| National Health Investors, Inc. | | | 3,100 | | | | 100 | |
| National Health Realty, Inc. | | | 2,300 | | | | 47 | |
| Nationwide Health Properties, Inc. | | | 5,100 | | | | 147 | |
New Century Financial Corp. (a) | | | 3,600 | | | | 142 | |
| New Plan Excel Realty Trust | | | 8,500 | | | | 245 | |
| Newcastle Investment Corp. | | | 2,200 | | | | 65 | |
Novastar Financial, Inc. (a) | | | 2,000 | | | | 64 | |
| Omega Healthcare Investors, Inc. | | | 2,784 | | | | 47 | |
| Parkway Properties, Inc. | | | 500 | | | | 25 | |
| Pennsylvania Real Estate Investment Trust | | | 2,500 | | | | 108 | |
| Plum Creek Timber Co., Inc. | | | 15,047 | | | | 541 | |
18 See financial notes.
Schwab Total Stock Market Index Fund
Portfolio Holdings continued
| | | | | | | | | |
| | | Number of | | | Value | |
| Security | | Shares | | | ($ x 1,000) | |
| | | | | | | | | |
| PMC Commercial Trust | | | 1,500 | | | | 21 | |
| Post Properties, Inc. | | | 2,200 | | | | 108 | |
| Potlatch Corp. | | | 2,753 | | | | 112 | |
| ProLogis | | | 20,854 | | | | 1,319 | |
| PS Business Parks, Inc. | | | 3,000 | | | | 198 | |
| Public Storage, Inc. | | | 14,590 | | | | 1,309 | |
| RAIT Investment Trust | | | 3,300 | | | | 99 | |
| Ramco-Gershenson Properties | | | 1,400 | | | | 46 | |
| Rayonier, Inc. | | | 2,388 | | | | 98 | |
Realogy Corp. * | | | 20,930 | | | | 540 | |
| Realty Income Corp. | | | 4,600 | | | | 121 | |
| Reckson Associates Realty Corp. | | | 5,300 | | | | 234 | |
| Redwood Trust, Inc. | | | 2,500 | | | | 137 | |
| Regency Centers Corp. | | | 5,700 | | | | 411 | |
| Saul Centers, Inc. | | | 2,100 | | | | 102 | |
| Saxon Capital, Inc. | | | 3,500 | | | | 50 | |
| Senior Housing Properties Trust | | | 4,950 | | | | 114 | |
Shelbourne Properties I (b)* | | | 500 | | | | 5 | |
Shelbourne Properties III (b)* | | | 500 | | | | 3 | |
| Simon Property Group, Inc. | | | 18,574 | | | | 1,804 | |
SL Green Realty Corp. (a) | | | 4,200 | | | | 508 | |
| Sovran Self Storage, Inc. | | | 800 | | | | 47 | |
| Sun Communities, Inc. | | | 3,000 | | | | 105 | |
| Tanger Factory Outlet Centers, Inc. | | | 1,600 | | | | 60 | |
| Taubman Centers, Inc. | | | 4,100 | | | | 192 | |
Tejon Ranch Co. * | | | 674 | | | | 33 | |
| The Macerich Co. | | | 5,200 | | | | 418 | |
| The Mills Corp. | | | 5,400 | | | | 99 | |
The St. Joe Co. (a) | | | 5,300 | | | | 285 | |
Thornburg Mortgage, Inc. (a) | | | 7,800 | | | | 200 | |
Trammell Crow Co. * | | | 2,800 | | | | 136 | |
| Trustreet Properties, Inc. | | | 1,000 | | | | 17 | |
| UMH Properties, Inc. | | | 1,600 | | | | 26 | |
| United Dominion Realty Trust, Inc. | | | 9,400 | | | | 304 | |
| Universal Health Realty Income | | | 900 | | | | 35 | |
| Urstadt Biddle Properties, Inc. | | | 500 | | | | 9 | |
| Urstadt Biddle Properties, Inc., Class A | | | 1,000 | | | | 19 | |
| Ventas, Inc. | | | 5,800 | | | | 226 | |
| Vornado Realty Trust | | | 10,500 | | | | 1,252 | |
Washington Real Estate Investment Trust (a) | | | 3,100 | | | | 131 | |
| Weingarten Realty Investors | | | 7,975 | | | | 371 | |
Wellsford Real Properties, Inc. * | | | 1,400 | | | | 9 | |
| | | | | | | | |
| | | | | | | | 33,851 | |
| | | | | | | | | |
Retailing 4.0% | | | | | | | | |
| |
99 Cents Only Stores * | | | 3,066 | | | | 37 | |
| Aaron Rents, Inc. | | | 3,750 | | | | 93 | |
| Aaron Rents, Inc., Class A | | | 2,175 | | | | 49 | |
| Abercrombie & Fitch Co., Class A | | | 5,800 | | | | 445 | |
| Advance Auto Parts, Inc. | | | 9,540 | | | | 334 | |
Advanced Marketing Services, Inc. * | | | 2,400 | | | | 7 | |
Aeropostale, Inc. * | | | 4,400 | | | | 129 | |
Amazon.com, Inc. (a)* | | | 33,700 | | | | 1,284 | |
America’s Car-Mart, Inc. (a)* | | | 3,750 | | | | 56 | |
| American Eagle Outfitters, Inc. | | | 12,100 | | | | 554 | |
AnnTaylor Stores Corp. * | | | 9,825 | | | | 432 | |
| Asbury Automotive Group, Inc. | | | 4,100 | | | | 98 | |
Audiovox Corp., Class A * | | | 1,600 | | | | 21 | |
AutoNation, Inc. (a)* | | | 21,600 | | | | 433 | |
AutoZone, Inc. * | | | 6,100 | | | | 683 | |
| Barnes & Noble, Inc. | | | 7,400 | | | | 306 | |
Bed, Bath & Beyond, Inc. * | | | 23,700 | | | | 955 | |
| Best Buy Co., Inc. | | | 39,225 | | | | 2,167 | |
Big Lots, Inc. * | | | 11,100 | | | | 234 | |
Blockbuster, Inc., Class A * | | | 6,900 | | | | 27 | |
| Borders Group, Inc. | | | 5,700 | | | | 117 | |
Building Material Holding Corp. (a) | | | 3,000 | | | | 78 | |
Cabela’s, Inc., Class A (a)* | | | 3,500 | | | | 83 | |
CarMax, Inc. * | | | 3,923 | | | | 174 | |
Charming Shoppes, Inc. * | | | 10,200 | | | | 151 | |
Chico’s FAS, Inc. * | | | 13,300 | | | | 318 | |
| Christopher & Banks Corp. | | | 2,900 | | | | 78 | |
| Circuit City Stores, Inc. | | | 16,500 | | | | 445 | |
| Claire’s Stores, Inc. | | | 16,000 | | | | 454 | |
Coldwater Creek, Inc. * | | | 8,502 | | | | 259 | |
CSK Auto Corp. * | | | 3,500 | | | | 55 | |
| Deb Shops, Inc. | | | 1,600 | | | | 45 | |
Dick’s Sporting Goods, Inc. * | | | 3,000 | | | | 149 | |
| Dillard’s, Inc., Class A | | | 5,500 | | | | 166 | |
| Dollar General Corp. | | | 27,775 | | | | 390 | |
Dollar Tree Stores, Inc. * | | | 8,650 | | | | 269 | |
Dress Barn, Inc. * | | | 6,000 | | | | 130 | |
Duckwall-ALCO Stores, Inc. * | | | 1,800 | | | | 71 | |
eBay, Inc. * | | | 110,848 | | | | 3,562 | |
Expedia, Inc. * | | | 31,345 | | | | 509 | |
| Family Dollar Stores, Inc. | | | 12,700 | | | | 374 | |
| Federated Department Stores, Inc. | | | 42,952 | | | | 1,886 | |
Finlay Enterprises, Inc. * | | | 1,000 | | | | 7 | |
| Foot Locker, Inc. | | | 14,100 | | | | 327 | |
GameStop Corp., Class A (a)* | | | 1,524 | | | | 78 | |
Genesco, Inc. * | | | 4,300 | | | | 162 | |
| Genuine Parts Co. | | | 13,500 | | | | 614 | |
| Group 1 Automotive, Inc. | | | 1,400 | | | | 80 | |
Guess?, Inc. * | | | 2,700 | | | | 154 | |
Guitar Center, Inc. * | | | 1,700 | | | | 74 | |
| Handleman Co. | | | 6,600 | | | | 53 | |
Hibbett Sporting Goods, Inc. * | | | 3,543 | | | | 104 | |
Hollywood Media Corp. * | | | 1,100 | | | | 5 | |
| Home Depot, Inc. | | | 162,300 | | | | 6,059 | |
IAC/InterActiveCorp. * | | | 31,345 | | | | 971 | |
| J.C. Penney Co., Inc. | | | 22,400 | | | | 1,685 | |
See financial notes. 19
Schwab Total Stock Market Index Fund
Portfolio Holdings continued
| | | | | | | | | |
| | | Number of | | | Value | |
| Security | | Shares | | | ($ x 1,000) | |
| | | | | | | | | |
Keystone Automotive Industries, Inc. * | | | 1,800 | | | | 69 | |
Kohl’s Corp. * | | | 28,300 | | | | 1,998 | |
Liberty Media Holding Corp. - Interactive * | | | 55,809 | | | | 1,232 | |
| Limited Brands, Inc. | | | 31,520 | | | | 929 | |
| Lithia Motors, Inc., Class A | | | 700 | | | | 18 | |
| Lowe’s Cos., Inc. | | | 122,500 | | | | 3,692 | |
Midas, Inc. * | | | 1,300 | | | | 27 | |
| Monro Muffler Brake, Inc. | | | 1,050 | | | | 40 | |
NetFlix, Inc. (a)* | | | 6,000 | | | | 166 | |
NexCen Brands, Inc. * | | | 1,100 | | | | 7 | |
| Nordstrom, Inc. | | | 20,600 | | | | 975 | |
O’Reilly Automotive, Inc. * | | | 4,400 | | | | 142 | |
Office Depot, Inc. * | | | 26,000 | | | | 1,092 | |
| OfficeMax, Inc. | | | 6,400 | | | | 304 | |
Pacific Sunwear of California, Inc. * | | | 7,475 | | | | 132 | |
Payless Shoesource, Inc. * | | | 5,906 | | | | 158 | |
| PETsMART, Inc. | | | 11,100 | | | | 319 | |
Pomeroy IT Solutions, Inc. * | | | 2,100 | | | | 18 | |
Priceline.com, Inc. (a)* | | | 3,983 | | | | 160 | |
RadioShack Corp. (a) | | | 10,700 | | | | 191 | |
Rent-A-Center, Inc. * | | | 5,250 | | | | 151 | |
Rent-Way, Inc. (a)* | | | 3,200 | | | | 34 | |
REX Stores Corp. * | | | 1,875 | | | | 31 | |
| Ross Stores, Inc. | | | 13,400 | | | | 394 | |
Saks, Inc. * | | | 10,800 | | | | 209 | |
Sears Holdings Corp. * | | | 12,885 | | | | 2,248 | |
Select Comfort Corp. (a)* | | | 4,500 | | | | 96 | |
Shoe Carnival, Inc. * | | | 1,200 | | | | 34 | |
| Sonic Automotive, Inc. | | | 1,400 | | | | 37 | |
Source Interlink Cos., Inc. * | | | 5,000 | | | | 45 | |
| Stage Stores, Inc. | | | 1,800 | | | | 58 | |
| Staples, Inc. | | | 61,800 | | | | 1,594 | |
| Stein Mart, Inc. | | | 3,800 | | | | 62 | |
| Talbots, Inc. | | | 5,700 | | | | 160 | |
| Target Corp. | | | 69,800 | | | | 4,131 | |
| The Buckle, Inc. | | | 3,500 | | | | 139 | |
| The Cato Corp., Class A | | | 4,300 | | | | 98 | |
The Children’s Place Retail Stores, Inc. * | | | 1,800 | | | | 126 | |
| The Finish Line, Class A | | | 3,600 | | | | 47 | |
| The Gap, Inc. | | | 73,900 | | | | 1,553 | |
The Gymboree Corp. * | | | 2,500 | | | | 116 | |
| The Men’s Wearhouse, Inc. | | | 3,600 | | | | 143 | |
| The Sherwin-Williams Co. | | | 13,000 | | | | 770 | |
| The TJX Cos., Inc. | | | 40,400 | | | | 1,170 | |
| Tiffany & Co. | | | 11,500 | | | | 411 | |
Tractor Supply Co. * | | | 4,000 | | | | 194 | |
Trans World Entertainment Corp. * | | | 1,500 | | | | 10 | |
Tuesday Morning Corp. (a) | | | 2,500 | | | | 41 | |
Tween Brands, Inc. * | | | 1,742 | | | | 73 | |
Tweeter Home Entertainment Group, Inc. * | | | 1,100 | | | | 4 | |
| United Auto Group, Inc. | | | 2,000 | | | | 46 | |
Urban Outfitters, Inc. * | | | 12,800 | | | | 224 | |
ValueVision Media, Inc., Class A * | | | 1,400 | | | | 18 | |
| Williams-Sonoma, Inc. | | | 9,200 | | | | 313 | |
Winmark Corp. * | | | 1,200 | | | | 26 | |
Zale Corp. * | | | 5,020 | | | | 145 | |
| | | | | | | | |
| | | | | | | | 55,100 | |
| | | | | | | | | |
Semiconductors & Semiconductor Equipment 2.6% | | | | | | | | |
| |
Actel Corp. * | | | 1,100 | | | | 18 | |
Advanced Energy Industries, Inc. * | | | 3,900 | | | | 61 | |
Advanced Micro Devices, Inc. (a)* | | | 34,200 | | | | 727 | |
Agere Systems, Inc. * | | | 15,011 | | | | 255 | |
Alliance Semiconductor Corp. * | | | 1,200 | | | | 4 | |
Altera Corp. * | | | 30,400 | | | | 561 | |
AMIS Holdings, Inc. * | | | 2,500 | | | | 24 | |
Amkor Technology, Inc. * | | | 14,400 | | | | 99 | |
Anadigics, Inc. * | | | 1,150 | | | | 9 | |
| Analog Devices, Inc. | | | 30,200 | | | | 961 | |
| Applied Materials, Inc. | | | 139,098 | | | | 2,419 | |
Applied Micro Circuits Corp. * | | | 25,238 | | | | 77 | |
Asyst Technologies, Inc. * | | | 1,700 | | | | 13 | |
Atmel Corp. * | | | 37,900 | | | | 218 | |
ATMI, Inc. * | | | 1,400 | | | | 44 | |
Axcelis Technologies, Inc. * | | | 7,044 | | | | 49 | |
AXT, Inc. (a)* | | | 800 | | | | 4 | |
Broadcom Corp., Class A * | | | 40,700 | | | | 1,232 | |
Brooks Automation, Inc. * | | | 5,585 | | | | 79 | |
Cabot Microelectronics Corp. * | | | 660 | | | | 19 | |
CEVA, Inc. * | | | 433 | | | | 3 | |
Cirrus Logic, Inc. * | | | 3,800 | | | | 27 | |
| Cohu, Inc. | | | 1,100 | | | | 22 | |
Conexant Systems, Inc. * | | | 37,546 | | | | 72 | |
Credence Systems Corp. * | | | 1,700 | | | | 5 | |
Cree, Inc. (a)* | | | 6,000 | | | | 132 | |
Cymer, Inc. * | | | 4,200 | | | | 195 | |
Cypress Semiconductor Corp. (a)* | | | 8,500 | | | | 143 | |
Diodes, Inc. * | | | 4,275 | | | | 188 | |
DSP Group, Inc. * | | | 3,300 | | | | 72 | |
Electroglas, Inc. * | | | 900 | | | | 3 | |
EMCORE Corp. (a)* | | | 1,500 | | | | 9 | |
Entegris, Inc. * | | | 10,199 | | | | 114 | |
Exar Corp. * | | | 3,300 | | | | 43 | |
Fairchild Semiconductor International, Inc. * | | | 8,600 | | | | 139 | |
FEI Co. (a)* | | | 1,500 | | | | 34 | |
FormFactor, Inc. * | | | 2,500 | | | | 95 | |
Freescale Semiconductor, Inc., Class B * | | | 31,360 | | | | 1,233 | |
FSI International, Inc. * | | | 1,300 | | | | 8 | |
HI/FN, Inc. * | | | 800 | | | | 4 | |
Ibis Technology Corp. * | | | 800 | | | | 2 | |
Integrated Device Technology, Inc. * | | | 11,220 | | | | 178 | |
20 See financial notes.
Schwab Total Stock Market Index Fund
Portfolio Holdings continued
| | | | | | | | | |
| | | Number of | | | Value | |
| Security | | Shares | | | ($ x 1,000) | |
| | | | | | | | | |
Integrated Silicon Solutions, Inc. * | | | 3,400 | | | | 18 | |
| Intel Corp. | | | 483,832 | | | | 10,325 | |
International Rectifier Corp. * | | | 6,600 | | | | 237 | |
| Intersil Corp., Class A | | | 12,364 | | | | 290 | |
IXYS Corp. * | | | 900 | | | | 9 | |
| KLA-Tencor Corp. | | | 15,000 | | | | 738 | |
Kopin Corp. * | | | 2,500 | | | | 9 | |
Kulicke & Soffa Industries, Inc. * | | | 4,400 | | | | 40 | |
Lam Research Corp. * | | | 11,600 | | | | 574 | |
Lattice Semiconductor Corp. * | | | 4,600 | | | | 29 | |
| Linear Technology Corp. | | | 25,000 | | | | 778 | |
LSI Logic Corp. * | | | 29,964 | | | | 301 | |
LTX Corp. * | | | 1,900 | | | | 9 | |
Marvell Technology Group Ltd. * | | | 32,400 | | | | 592 | |
Mattson Technology, Inc. * | | | 4,100 | | | | 40 | |
| Maxim Integrated Products, Inc. | | | 25,453 | | | | 764 | |
MEMC Electronic Materials, Inc. * | | | 16,300 | | | | 579 | |
Micrel, Inc. * | | | 6,800 | | | | 76 | |
| Microchip Technology, Inc. | | | 16,475 | | | | 543 | |
Micron Technology, Inc. * | | | 52,699 | | | | 761 | |
Microsemi Corp. * | | | 7,652 | | | | 150 | |
MIPS Technologies, Inc. * | | | 1,100 | | | | 8 | |
MKS Instruments, Inc. * | | | 4,300 | | | | 93 | |
MoSys, Inc. * | | | 1,200 | | | | 9 | |
Nanometrics, Inc. * | | | 300 | | | | 3 | |
| National Semiconductor Corp. | | | 29,200 | | | | 709 | |
Novellus Systems, Inc. * | | | 11,171 | | | | 309 | |
NVIDIA Corp. * | | | 28,000 | | | | 976 | |
OmniVision Technologies, Inc. (a)* | | | 4,800 | | | | 79 | |
ON Semiconductor Corp. * | | | 21,000 | | | | 131 | |
Pericom Semiconductor Corp. * | | | 600 | | | | 6 | |
Photronics, Inc. * | | | 3,900 | | | | 55 | |
Pixelworks, Inc. * | | | 4,100 | | | | 9 | |
PLX Technology, Inc. * | | | 1,300 | | | | 16 | |
PMC — Sierra, Inc. (a)* | | | 8,800 | | | | 58 | |
QuickLogic Corp. * | | | 900 | | | | 3 | |
Rambus, Inc. * | | | 8,200 | | | | 136 | |
RF Micro Devices, Inc. * | | | 13,700 | | | | 100 | |
Rudolph Technologies, Inc. * | | | 1,318 | | | | 23 | |
Semitool, Inc. * | | | 4,300 | | | | 52 | |
Semtech Corp. * | | | 6,000 | | | | 78 | |
Silicon Image, Inc. * | | | 6,500 | | | | 77 | |
Silicon Laboratories, Inc. * | | | 5,000 | | | | 163 | |
Silicon Storage Technology, Inc. * | | | 7,000 | | | | 29 | |
Sipex Corp. * | | | 1,600 | | | | 6 | |
SiRF Technology Holdings, Inc. (a)* | | | 3,500 | | | | 98 | |
Skyworks Solutions, Inc. * | | | 5,689 | | | | 38 | |
Standard Microsystems Corp. * | | | 3,600 | | | | 111 | |
Supertex, Inc. * | | | 1,400 | | | | 62 | |
Teradyne, Inc. * | | | 15,559 | | | | 218 | |
Tessera Technologies, Inc. * | | | 3,000 | | | | 105 | |
| Texas Instruments, Inc. | | | 143,397 | | | | 4,328 | |
Three-Five Systems, Inc. * | | | 1,099 | | | | — | |
Transmeta Corp., Delaware * | | | 4,500 | | | | 5 | |
Transwitch Corp. * | | | 3,100 | | | | 5 | |
Trident Microsystems, Inc. * | | | 5,000 | | | | 106 | |
TriQuint Semiconductor, Inc. * | | | 5,310 | | | | 24 | |
Ultratech, Inc. * | | | 1,300 | | | | 19 | |
Varian Semiconductor Equipment Associates, Inc. * | | | 2,250 | | | | 82 | |
Veeco Instruments, Inc. * | | | 3,500 | | | | 65 | |
Virage Logic Corp. * | | | 1,400 | | | | 13 | |
Vitesse Semiconductor Corp. (a)* | | | 6,986 | | | | 8 | |
| Xilinx, Inc. | | | 27,600 | | | | 704 | |
Zoran Corp. * | | | 4,261 | | | | 59 | |
| | | | | | | | |
| | | | | | | | 35,634 | |
| | | | | | | | | |
Software & Services 6.2% | | | | | | | | |
| |
| Accenture Ltd., Class A | | | 72,000 | | | | 2,370 | |
Activision, Inc. * | | | 19,866 | | | | 306 | |
Actuate Corp. * | | | 2,300 | | | | 12 | |
| Acxiom Corp. | | | 13,300 | | | | 329 | |
Adobe Systems, Inc. * | | | 46,210 | | | | 1,768 | |
Advent Software, Inc. * | | | 4,100 | | | | 152 | |
Affiliated Computer Services, Inc., Class A * | | | 9,900 | | | | 529 | |
Agile Software Corp. * | | | 4,400 | | | | 30 | |
Akamai Technologies, Inc. * | | | 12,138 | | | | 569 | |
Alliance Data Systems Corp. * | | | 6,600 | | | | 401 | |
Altiris, Inc. * | | | 2,500 | | | | 56 | |
Ansoft Corp. * | | | 4,600 | | | | 123 | |
Answerthink, Inc. * | | | 1,700 | | | | 5 | |
Ansys, Inc. * | | | 3,400 | | | | 156 | |
aQuantive, Inc. * | | | 6,000 | | | | 163 | |
Ariba, Inc. * | | | 5,270 | | | | 40 | |
ARTISTdirect, Inc. * | | | 1,000 | | | | 3 | |
Aspen Technology, Inc. * | | | 6,000 | | | | 60 | |
Autodesk, Inc. * | | | 16,800 | | | | 617 | |
| Automatic Data Processing, Inc. | | | 48,100 | | | | 2,378 | |
BEA Systems, Inc. * | | | 30,400 | | | | 495 | |
BearingPoint, Inc. * | | | 7,100 | | | | 59 | |
| Blackbaud, Inc. | | | 3,000 | | | | 75 | |
BMC Software, Inc. * | | | 19,000 | | | | 576 | |
Borland Software Corp. * | | | 3,000 | | | | 17 | |
Bottomline Technologies, Inc. * | | | 2,000 | | | | 19 | |
BroadVision, Inc. * | | | 1,090 | | | | 1 | |
| CA, Inc. | | | 47,508 | | | | 1,176 | |
CACI International, Inc., Class A * | | | 2,100 | | | | 121 | |
Cadence Design Systems, Inc. * | | | 22,600 | | | | 404 | |
Captaris, Inc. * | | | 2,200 | | | | 13 | |
Carreker Corp. * | | | 3,700 | | | | 27 | |
Catapult Communications Corp. * | | | 1,600 | | | | 14 | |
Ceridian Corp. * | | | 19,500 | | | | 460 | |
CheckFree Corp. * | | | 7,900 | | | | 312 | |
Chordiant Software, Inc. * | | | 1,100 | | | | 3 | |
CIBER, Inc. * | | | 1,900 | | | | 13 | |
See financial notes. 21
Schwab Total Stock Market Index Fund
Portfolio Holdings continued
| | | | | | | | | |
| | | Number of | | | Value | |
| Security | | Shares | | | ($ x 1,000) | |
| | | | | | | | | |
Citrix Systems, Inc. * | | | 20,000 | | | | 591 | |
Clarent Corp. * | | | 1,545 | | | | — | |
CNET Networks, Inc. * | | | 9,983 | | | | 89 | |
Cognizant Technology Solutions Corp., Class A * | | | 10,600 | | | | 798 | |
Computer Sciences Corp. * | | | 16,238 | | | | 858 | |
Compuware Corp. * | | | 19,900 | | | | 160 | |
Convergys Corp. * | | | 10,500 | | | | 223 | |
Corillian Corp. * | | | 2,000 | | | | 6 | |
Covansys Corp. * | | | 5,000 | | | | 117 | |
CSG Systems International, Inc. * | | | 5,400 | | | | 146 | |
Digimarc Corp. * | | | 3,500 | | | | 31 | |
Digital Insight Corp. * | | | 2,300 | | | | 71 | |
Digital River, Inc. * | | | 2,100 | | | | 122 | |
Digitas, Inc. * | | | 6,800 | | | | 72 | |
Divine, Inc. * | | | 161 | | | | — | |
DST Systems, Inc. * | | | 8,100 | | | | 501 | |
Dynamics Research Corp. * | | | 1,200 | | | | 12 | |
EarthLink, Inc. * | | | 11,850 | | | | 83 | |
Edgewater Technology, Inc. * | | | 767 | | | | 5 | |
eFunds Corp. * | | | 5,002 | | | | 124 | |
Electronic Arts, Inc. * | | | 25,200 | | | | 1,333 | |
| Electronic Data Systems Corp. | | | 42,100 | | | | 1,066 | |
eLoyalty Corp. * | | | 190 | | | | 4 | |
Embarcadero Technologies, Inc. * | | | 2,900 | | | | 24 | |
Entrust, Inc. * | | | 2,800 | | | | 11 | |
Epicor Software Corp. * | | | 4,000 | | | | 56 | |
EPIQ Systems, Inc. * | | | 550 | | | | 8 | |
Equinix, Inc. (a)* | | | 2,565 | | | | 175 | |
eSPEED, Inc., Class A * | | | 3,300 | | | | 33 | |
Euronet Worldwide, Inc. (a)* | | | 2,500 | | | | 74 | |
| FactSet Research Systems, Inc. | | | 3,750 | | | | 191 | |
| Fair Isaac Corp. | | | 7,744 | | | | 284 | |
FalconStor Software, Inc. * | | | 1,200 | | | | 9 | |
| Fidelity National Information Services, Inc. | | | 9,050 | | | | 376 | |
| First Data Corp. | | | 62,932 | | | | 1,526 | |
Firstwave Technologies, Inc. * | | | 1,000 | | | | 2 | |
Fiserv, Inc. * | | | 15,300 | | | | 756 | |
Forrester Research, Inc. * | | | 4,100 | | | | 129 | |
Gartner, Inc. * | | | 10,300 | | | | 192 | |
| Global Payments, Inc. | | | 6,240 | | | | 273 | |
Google, Inc., Class A * | | | 22,900 | | | | 10,909 | |
GSE Systems, Inc. * | | | 424 | | | | 1 | |
Hewitt Associates, Inc., Class A * | | | 9,425 | | | | 236 | |
Hyperion Solutions Corp. * | | | 4,275 | | | | 160 | |
iBEAM Broadcasting Corp. * | | | 290 | | | | — | |
iGate Corp. * | | | 3,800 | | | | 21 | |
Informatica Corp. * | | | 6,700 | | | | 83 | |
Inforte Corp. * | | | 3,700 | | | | 15 | |
Infospace, Inc. * | | | 3,872 | | | | 78 | |
infoUSA, Inc. * | | | 4,800 | | | | 53 | |
Interactive Intelligence, Inc. * | | | 1,000 | | | | 18 | |
Intergraph Corp. * | | | 9,700 | | | | 424 | |
Internet Capital Group, Inc. * | | | 350 | | | | 4 | |
Intervoice, Inc. * | | | 1,678 | | | | 10 | |
Interwoven, Inc. * | | | 5,925 | | | | 75 | |
Intuit, Inc. * | | | 33,430 | | | | 1,180 | |
Iron Mountain, Inc. (a)* | | | 9,787 | | | | 424 | |
j2 Global Communications, Inc. (a)* | | | 4,000 | | | | 110 | |
| Jack Henry & Associates, Inc. | | | 6,300 | | | | 137 | |
JDA Software Group, Inc. * | | | 4,500 | | | | 66 | |
Kana Software, Inc. * | | | 528 | | | | 2 | |
Kanbay International, Inc. * | | | 3,000 | | | | 85 | |
Keane, Inc. * | | | 3,960 | | | | 46 | |
Kronos, Inc. * | | | 1,875 | | | | 64 | |
Lawson Software, Inc. * | | | 8,000 | | | | 61 | |
Lightbridge, Inc. * | | | 4,700 | | | | 54 | |
LookSmart, Ltd. * | | | 480 | | | | 2 | |
Macrovision Corp. * | | | 3,100 | | | | 83 | |
Magma Design Automation, Inc. * | | | 1,700 | | | | 16 | |
Manhattan Associates, Inc. * | | | 1,300 | | | | 38 | |
ManTech International Corp., Class A * | | | 2,500 | | | | 85 | |
MapInfo Corp. * | | | 3,125 | | | | 42 | |
| Mastercard, Inc. | | | 10,000 | | | | 741 | |
| MAXIMUS, Inc. | | | 1,700 | | | | 47 | |
McAfee, Inc. * | | | 14,445 | | | | 418 | |
Mentor Graphics Corp. * | | | 5,700 | | | | 96 | |
MetaSolv, Inc. * | | | 2,800 | | | | 11 | |
Micros Systems, Inc. * | | | 11,000 | | | | 546 | |
Microsoft Corp. (c) | | | 800,850 | | | | 22,992 | |
MicroStrategy, Inc., Class A * | | | 856 | | | | 102 | |
Midway Games, Inc. (a)* | | | 5,600 | | | | 48 | |
Moldflow Corp. * | | | 300 | | | | 4 | |
| MoneyGram International, Inc. | | | 7,500 | | | | 257 | |
MPS Group, Inc. * | | | 8,100 | | | | 124 | |
MSC.Software Corp. * | | | 1,800 | | | | 24 | |
Napster, Inc. * | | | 724 | | | | 3 | |
NAVTEQ Corp. * | | | 6,100 | | | | 203 | |
NetRatings, Inc. * | | | 3,000 | | | | 52 | |
NetScout Systems, Inc. * | | | 1,800 | | | | 15 | |
Novell, Inc. * | | | 25,600 | | | | 154 | |
Nuance Communications, Inc. * | | | 1,974 | | | | 23 | |
NYFIX, Inc. * | | | 750 | | | | 4 | |
Openwave Systems, Inc. * | | | 7,771 | | | | 67 | |
Opnet Technologies, Inc. * | | | 3,600 | | | | 53 | |
Opsware, Inc. * | | | 800 | | | | 7 | |
Oracle Corp. * | | | 434,449 | | | | 8,024 | |
Parametric Technology Corp. * | | | 8,680 | | | | 170 | |
| Paychex, Inc. | | | 32,400 | | | | 1,279 | |
Perot Systems Corp., Class A * | | | 9,100 | | | | 134 | |
Phoenix Technologies Ltd. * | | | 1,300 | | | | 6 | |
PLATO Learning, Inc. * | | | 1,433 | | | | 8 | |
Progress Software Corp. * | | | 4,200 | | | | 121 | |
Quality Systems, Inc. * | | | 2,000 | | | | 85 | |
Quest Software, Inc. * | | | 7,700 | | | | 113 | |
Quovadx, Inc. * | | | 2,600 | | | | 7 | |
Radiant Systems, Inc. * | | | 3,800 | | | | 42 | |
22 See financial notes.
Schwab Total Stock Market Index Fund
Portfolio Holdings continued
| | | | | | | | | |
| | | Number of | | | Value | |
| Security | | Shares | | | ($ x 1,000) | |
| | | | | | | | | |
RealNetworks, Inc. * | | | 13,300 | | | | 146 | |
Red Hat, Inc. * | | | 14,600 | | | | 239 | |
Renaissance Learning, Inc. (a) | | | 2,100 | | | | 31 | |
S1 Corp. * | | | 12,930 | | | | 64 | |
Saba Software, Inc. * | | | 1,349 | | | | 8 | |
Sabre Holdings Corp., Class A (a) | | | 12,401 | | | | 315 | |
Sagent Technology, Inc. * | | | 1,500 | | | | — | |
Salesforce.com, Inc. (a)* | | | 8,500 | | | | 332 | |
Sapient Corp. (a)* | | | 9,100 | | | | 50 | |
SAVVIS, Inc. * | | | 4,000 | | | | 124 | |
Secure Computing Corp. * | | | 3,200 | | | | 23 | |
Selectica, Inc. * | | | 1,900 | | | | 4 | |
Sonic Foundry, Inc. * | | | 600 | | | | 2 | |
SonicWALL, Inc. * | | | 7,400 | | | | 78 | |
SPSS, Inc. * | | | 3,200 | | | | 89 | |
SRA International, Inc., Class A * | | | 5,000 | | | | 160 | |
| Startek, Inc. | | | 3,900 | | | | 53 | |
| Stellent, Inc. | | | 3,600 | | | | 40 | |
SumTotal Systems, Inc. * | | | 463 | | | | 3 | |
SupportSoft, Inc. * | | | 4,800 | | | | 25 | |
Sybase, Inc. * | | | 19,036 | | | | 464 | |
Symantec Corp. * | | | 93,673 | | | | 1,858 | |
Synopsys, Inc. * | | | 13,684 | | | | 308 | |
Synplicity, Inc. * | | | 1,200 | | | | 8 | |
| Syntel, Inc. | | | 2,500 | | | | 63 | |
Take-Two Interactive Software, Inc. * | | | 6,000 | | | | 84 | |
| Talx Corp. | | | 3,825 | | | | 93 | |
TeleCommunication Systems, Inc., Class A * | | | 1,300 | | | | 4 | |
The BISYS Group, Inc. * | | | 9,000 | | | | 99 | |
THQ, Inc. * | | | 2,925 | | | | 88 | |
TIBCO Software, Inc. * | | | 16,000 | | | | 148 | |
Tier Technologies, Inc., Class B * | | | 500 | | | | 3 | |
| Total System Services, Inc. | | | 16,300 | | | | 393 | |
Transaction Systems Architects, Inc., Class A * | | | 5,200 | | | | 175 | |
Troy Group, Inc. * | | | 2,000 | | | | 8 | |
Tumbleweed Communications Corp. * | | | 2,000 | | | | 5 | |
Ulticom, Inc. * | | | 4,800 | | | | 48 | |
Unisys Corp. * | | | 27,600 | | | | 181 | |
| United Online, Inc. | | | 6,150 | | | | 83 | |
USinternetworking, Inc. * | | | 1,100 | | | | — | |
VA Software Corp. * | | | 4,527 | | | | 18 | |
ValueClick, Inc. * | | | 8,500 | | | | 160 | |
VeriFone Holdings, Inc. * | | | 1,500 | | | | 44 | |
Verint Systems, Inc. * | | | 2,500 | | | | 82 | |
VeriSign, Inc. * | | | 20,875 | | | | 432 | |
Vignette Corp. * | | | 3,394 | | | | 55 | |
Vitria Technology, Inc. * | | | 925 | | | | 2 | |
Web.com, Inc. * | | | 510 | | | | 2 | |
WebEx Communications, Inc. * | | | 4,500 | | | | 173 | |
webMethods, Inc. * | | | 4,421 | | | | 33 | |
Websense, Inc. * | | | 5,000 | | | | 137 | |
Wind River Systems, Inc. * | | | 6,760 | | | | 74 | |
Witness Systems, Inc. * | | | 2,100 | | | | 37 | |
Yahoo! Inc. * | | | 111,144 | | | | 2,928 | |
| | | | | | | | |
| | | | | | | | 85,021 | |
| | | | | | | | | |
Technology Hardware & Equipment 6.1% | | | | | | | | |
| |
3Com Corp. * | | | 17,900 | | | | 87 | |
Adaptec, Inc. * | | | 5,700 | | | | 26 | |
ADC Telecommunications, Inc. * | | | 4,031 | | | | 58 | |
| ADTRAN, Inc. | | | 7,000 | | | | 162 | |
Aeroflex, Inc. * | | | 5,400 | | | | 58 | |
Agilent Technologies, Inc. * | | | 39,317 | | | | 1,400 | |
| Agilysys, Inc. | | | 1,600 | | | | 24 | |
American Technical Ceramics Corp. * | | | 500 | | | | 7 | |
| Amphenol Corp., Class A | | | 8,800 | | | | 598 | |
Anaren, Inc. * | | | 3,300 | | | | 66 | |
Andrew Corp. * | | | 13,425 | | | | 124 | |
Anixter International, Inc. * | | | 3,300 | | | | 197 | |
Apple Computer, Inc. * | | | 65,000 | | | | 5,270 | |
Arris Group, Inc. * | | | 2,600 | | | | 35 | |
Arrow Electronics, Inc. * | | | 12,000 | | | | 358 | |
Avanex Corp. * | | | 2,100 | | | | 3 | |
Avaya, Inc. * | | | 37,885 | | | | 485 | |
Avici Systems, Inc. * | | | 375 | | | | 3 | |
Avid Technology, Inc. * | | | 3,756 | | | | 136 | |
Avnet, Inc. * | | | 11,288 | | | | 267 | |
Avocent Corp. * | | | 3,963 | | | | 145 | |
| AVX Corp. | | | 14,000 | | | | 221 | |
Aware, Inc. * | | | 1,100 | | | | 5 | |
| Bel Fuse, Inc. | | | 1,200 | | | | 37 | |
Bell Microproducts, Inc. * | | | 1,000 | | | | 7 | |
Benchmark Electronics, Inc. * | | | 4,575 | | | | 121 | |
| Black Box Corp. | | | 1,700 | | | | 76 | |
Blue Coat Systems, Inc. * | | | 340 | | | | 8 | |
Brightpoint, Inc. * | | | 4,454 | | | | 54 | |
Brocade Communications Systems, Inc. * | | | 21,000 | | | | 170 | |
C-COR, Inc. * | | | 3,100 | | | | 31 | |
CalAmp Corp. * | | | 1,000 | | | | 7 | |
| CDW Corp. | | | 6,800 | | | | 447 | |
Checkpoint Systems, Inc. * | | | 4,600 | | | | 84 | |
Ciena Corp. * | | | 2,470 | | | | 58 | |
Cisco Systems, Inc. * | | | 511,909 | | | | 12,352 | |
Cogent, Inc. * | | | 5,000 | | | | 57 | |
| Cognex Corp. | | | 2,900 | | | | 67 | |
Cognitronics Corp. * | | | 2,600 | | | | 5 | |
Coherent, Inc. * | | | 1,300 | | | | 42 | |
Com21, Inc. * | | | 1,400 | | | | — | |
Comarco, Inc. * | | | 500 | | | | 5 | |
CommScope, Inc. * | | | 4,900 | | | | 156 | |
Comtech Telecommunications Corp. * | | | 2,175 | | | | 78 | |
Comverse Technology, Inc. * | | | 13,400 | | | | 292 | |
See financial notes. 23
Schwab Total Stock Market Index Fund
Portfolio Holdings continued
| | | | | | | | | |
| | | Number of | | | Value | |
| Security | | Shares | | | ($ x 1,000) | |
| | | | | | | | | |
Corning, Inc. * | | | 121,807 | | | | 2,489 | |
CoSine Communications, Inc. * | | | 730 | | | | 2 | |
| CTS Corp. | | | 5,800 | | | | 82 | |
| Daktronics, Inc. | | | 5,200 | | | | 123 | |
DDi Corp. * | | | 1 | | | | — | |
Dell, Inc. * | | | 178,900 | | | | 4,353 | |
| Diebold, Inc. | | | 5,300 | | | | 232 | |
Ditech Networks, Inc. * | | | 4,100 | | | | 32 | |
Echelon Corp. (a)* | | | 3,700 | | | | 31 | |
Electro Scientific Industries, Inc. * | | | 1,300 | | | | 26 | |
Electronics for Imaging, Inc. * | | | 3,400 | | | | 80 | |
EMC Corp. * | | | 199,686 | | | | 2,446 | |
EMS Technologies, Inc. * | | | 1,000 | | | | 18 | |
Emulex Corp. * | | | 5,900 | | | | 111 | |
Excel Technology, Inc. * | | | 600 | | | | 15 | |
Extreme Networks, Inc. * | | | 4,500 | | | | 17 | |
F5 Networks, Inc. * | | | 3,300 | | | | 218 | |
Finisar Corp. (a)* | | | 7,900 | | | | 27 | |
FLIR Systems, Inc. * | | | 4,800 | | | | 153 | |
Foundry Networks, Inc. * | | | 9,300 | | | | 118 | |
| Frequency Electronics, Inc. | | | 500 | | | | 7 | |
Gateway, Inc. * | | | 11,800 | | | | 20 | |
Gerber Scientific, Inc. * | | | 1,900 | | | | 28 | |
Glenayre Technologies, Inc. * | | | 2,300 | | | | 6 | |
Global Imaging Systems, Inc. * | | | 4,200 | | | | 91 | |
Harmonic, Inc. * | | | 6,342 | | | | 51 | |
| Harris Corp. | | | 14,000 | | | | 596 | |
| Hewlett-Packard Co. | | | 239,636 | | | | 9,283 | |
Hutchinson Technology, Inc. * | | | 2,500 | | | | 58 | |
I.D. Systems, Inc. * | | | 3,000 | | | | 63 | |
| Imation Corp. | | | 2,000 | | | | 92 | |
Immersion Corp. * | | | 800 | | | | 5 | |
InFocus Corp. * | | | 1,600 | | | | 5 | |
Ingram Micro, Inc., Class A * | | | 13,400 | | | | 276 | |
Insight Enterprises, Inc. * | | | 4,650 | | | | 100 | |
Intelli-Check, Inc. * | | | 500 | | | | 3 | |
| Inter-Tel, Inc. | | | 6,000 | | | | 124 | |
InterDigital Communications Corp. * | | | 4,500 | | | | 161 | |
Intermec, Inc. * | | | 5,600 | | | | 127 | |
| International Business Machines Corp. | | | 131,510 | | | | 12,142 | |
Iomega Corp. * | | | 12,400 | | | | 51 | |
Itron, Inc. * | | | 2,500 | | | | 136 | |
Ixia * | | | 5,200 | | | | 48 | |
| Jabil Circuit, Inc. | | | 15,400 | | | | 442 | |
JDS Uniphase Corp. * | | | 14,053 | | | | 204 | |
Juniper Networks, Inc. * | | | 40,565 | | | | 699 | |
| Keithley Instruments, Inc. | | | 3,200 | | | | 44 | |
Kemet Corp. * | | | 6,700 | | | | 49 | |
L-1 Identity Solutions, Inc. * | | | 756 | | | | 11 | |
LaserCard Corp. * | | | 1,000 | | | | 11 | |
LeCroy Corp. * | | | 900 | | | | 11 | |
Lexmark International, Inc., Class A * | | | 10,900 | | | | 693 | |
Lightpath Technologies, Inc. * | | | 75 | | | | — | |
Littelfuse, Inc. * | | | 2,000 | | | | 68 | |
Lucent Technologies, Inc. * | | | 301,923 | | | | 734 | |
MasTec, Inc. * | | | 5,350 | | | | 59 | |
Maxwell Technologies, Inc. * | | | 1,000 | | | | 18 | |
McData Corp., Class A * | | | 4,047 | | | | 23 | |
Measurement Specialties, Inc. * | | | 700 | | | | 15 | |
Mechanical Technology, Inc. * | | | 1,800 | | | | 3 | |
Mercury Computer Systems, Inc. * | | | 3,600 | | | | 44 | |
Merix Corp. * | | | 3,700 | | | | 33 | |
| Methode Electronics, Inc. | | | 3,600 | | | | 40 | |
| MOCON, Inc. | | | 600 | | | | 6 | |
| Molex, Inc. | | | 16,125 | | | | 563 | |
| Motorola, Inc. | | | 195,955 | | | | 4,519 | |
MRV Communications, Inc. (a)* | | | 4,307 | | | | 15 | |
| MTS Systems Corp. | | | 4,500 | | | | 150 | |
Multi-Fineline Electronix, Inc. (a)* | | | 2,500 | | | | 60 | |
| National Instruments Corp. | | | 5,675 | | | | 177 | |
NCR Corp. * | | | 23,800 | | | | 988 | |
Network Appliance, Inc. * | | | 27,500 | | | | 1,004 | |
Network Equipment Technologies, Inc. * | | | 5,000 | | | | 28 | |
Newport Corp. * | | | 4,200 | | | | 91 | |
NMS Communications Corp. * | | | 1,500 | | | | 3 | |
Oplink Communications, Inc. * | | | 657 | | | | 13 | |
OSI Systems, Inc. * | | | 3,700 | | | | 77 | |
OYO Geospace Corp. * | | | 300 | | | | 17 | |
Packeteer, Inc. * | | | 3,600 | | | | 40 | |
Palm, Inc. (a)* | | | 3,138 | | | | 48 | |
| Park Electrochemical Corp. | | | 3,600 | | | | 111 | |
Parkervision, Inc. * | | | 400 | | | | 4 | |
Paxar Corp. * | | | 2,300 | | | | 46 | |
PC Connection, Inc. * | | | 3,000 | | | | 33 | |
PC-Tel, Inc. * | | | 1,400 | | | | 15 | |
Pemstar, Inc. (a)* | | | 1,600 | | | | 7 | |
Performance Technologies, Inc. * | | | 1,600 | | | | 9 | |
Photon Dynamics, Inc. * | | | 3,400 | | | | 40 | |
Planar Systems, Inc. * | | | 3,700 | | | | 45 | |
Plantronics, Inc. (a) | | | 4,000 | | | | 84 | |
Plexus Corp. * | | | 3,700 | | | | 81 | |
Polycom, Inc. * | | | 9,200 | | | | 252 | |
Powerwave Technologies, Inc. (a)* | | | 3,583 | | | | 23 | |
Presstek, Inc. * | | | 1,100 | | | | 7 | |
| Printronix, Inc. | | | 2,400 | | | | 29 | |
QLogic Corp. * | | | 17,044 | | | | 351 | |
| QUALCOMM, Inc. | | | 135,100 | | | | 4,916 | |
Quantum Corp. * | | | 5,500 | | | | 12 | |
Radisys Corp. * | | | 3,700 | | | | 68 | |
Redback Networks, Inc. * | | | 8,076 | | | | 128 | |
Research Frontiers, Inc. * | | | 800 | | | | 5 | |
| Richardson Electronics, Ltd. | | | 1,300 | | | | 12 | |
Rofin-Sinar Technologies, Inc. * | | | 1,900 | | | | 117 | |
Rogers Corp. * | | | 2,500 | | | | 175 | |
SafeNet, Inc. * | | | 2,770 | | | | 59 | |
SanDisk Corp. * | | | 11,000 | | | | 529 | |
Sanmina — SCI Corp. * | | | 41,316 | | | | 163 | |
ScanSource, Inc. * | | | 1,200 | | | | 38 | |
SCM Microsystems, Inc. * | | | 1,200 | | | | 4 | |
24 See financial notes.
Schwab Total Stock Market Index Fund
Portfolio Holdings continued
| | | | | | | | | |
| | | Number of | | | Value | |
| Security | | Shares | | | ($ x 1,000) | |
| | | | | | | | | |
Seachange International, Inc. * | | | 3,350 | | | | 28 | |
| Seagate Technology | | | 37,066 | | | | 837 | |
Sirenza Microdevices, Inc. * | | | 1,300 | | | | 10 | |
Solectron Corp. * | | | 81,520 | | | | 272 | |
Sonus Networks, Inc. (a)* | | | 19,400 | | | | 101 | |
| Spectralink Corp. | | | 1,000 | | | | 9 | |
Stratasys, Inc. (a)* | | | 1,350 | | | | 38 | |
Stratex Networks, Inc. * | | | 2,800 | | | | 13 | |
Sun Microsystems, Inc. * | | | 248,230 | | | | 1,348 | |
SunPower Corp., Class A (a)* | | | 1,300 | | | | 44 | |
Sycamore Networks, Inc. * | | | 18,200 | | | | 68 | |
| Symbol Technologies, Inc. | | | 19,690 | | | | 294 | |
Symmetricom, Inc. * | | | 8,450 | | | | 72 | |
Synaptics, Inc. * | | | 3,500 | | | | 99 | |
Tech Data Corp. * | | | 5,300 | | | | 209 | |
| Technitrol, Inc. | | | 4,000 | | | | 101 | |
Tekelec * | | | 8,700 | | | | 128 | |
| Tektronix, Inc. | | | 9,202 | | | | 279 | |
Tellabs, Inc. * | | | 34,564 | | | | 364 | |
TESSCO Technologies, Inc. * | | | 900 | | | | 29 | |
Tollgrade Communications, Inc. * | | | 3,600 | | | | 30 | |
Trimble Navigation Ltd. * | | | 5,700 | | | | 263 | |
TTM Technologies, Inc. * | | | 4,400 | | | | 53 | |
UTStarcom, Inc. (a)* | | | 9,500 | | | | 102 | |
Vertel Corp. * | | | 900 | | | | — | |
ViaSat, Inc. * | | | 3,500 | | | | 95 | |
Vishay Intertechnology, Inc. * | | | 36,688 | | | | 495 | |
Westell Technologies, Inc., Class A * | | | 2,560 | | | | 6 | |
Western Digital Corp. * | | | 15,700 | | | | 287 | |
WJ Communications, Inc. * | | | 2,300 | | | | 5 | |
Xerox Corp. * | | | 69,700 | | | | 1,185 | |
Xybernaut Corp. * | | | 1,400 | | | | — | |
Zebra Technologies Corp., Class A * | | | 6,375 | | | | 238 | |
Zygo Corp. * | | | 500 | | | | 9 | |
| | | | | | | | |
| | | | | | | | 83,409 | |
| | | | | | | | | |
Telecommunication Services 3.0% | | | | | | | | |
| |
@Road, Inc. * | | | 4,400 | | | | 28 | |
| ALLTEL Corp. | | | 30,587 | | | | 1,631 | |
American Tower Corp., Class A * | | | 33,800 | | | | 1,218 | |
| AT&T Corp. | | | 318,806 | | | | 10,919 | |
AT&T Latin America Corp., Class A * | | | 2,100 | | | | — | |
| Atlantic Tele-Network, Inc. | | | 3,250 | | | | 63 | |
| BellSouth Corp. | | | 151,887 | | | | 6,850 | |
Centennial Communications Corp. * | | | 8,000 | | | | 41 | |
| CenturyTel, Inc. | | | 10,500 | | | | 423 | |
Cincinnati Bell, Inc. * | | | 18,568 | | | | 87 | |
| Citizens Communications Co. | | | 24,900 | | | | 365 | |
ClearOne Communications, Inc. * | | | 107 | | | | — | |
| Commonwealth Telephone Enterprises, Inc. | | | 9,400 | | | | 394 | |
Covad Communications Group, Inc. * | | | 7,000 | | | | 9 | |
Crown Castle International Corp. * | | | 20,900 | | | | 703 | |
| CT Communications, Inc. | | | 4,500 | | | | 105 | |
| D&E Communications, Inc. | | | 3,500 | | | | 49 | |
Dobson Communications Corp., Class A * | | | 13,300 | | | | 103 | |
| Embarq Corp. | | | 11,576 | | | | 560 | |
| HickoryTech Corp. | | | 4,600 | | | | 33 | |
IDT Corp., Class B * | | | 7,600 | | | | 99 | |
Leap Wireless International, Inc. * | | | 1,800 | | | | 100 | |
Level 3 Communications, Inc. (a)* | | | 93,000 | | | | 492 | |
Lynch Interactive Corp. * | | | 9 | | | | 26 | |
Moscow CableCom Corp. * | | | 1,400 | | | | 14 | |
NII Holdings, Inc. * | | | 1,900 | | | | 124 | |
| North Pittsburgh Systems, Inc. | | | 3,500 | | | | 92 | |
Qwest Communications International, Inc. * | | | 151,337 | | | | 1,306 | |
Rural Cellular Corp. * | | | 1,200 | | | | 13 | |
SBA Communications Corp. * | | | 9,300 | | | | 248 | |
| Sprint Nextel Corp. | | | 234,030 | | | | 4,374 | |
TALK America Holdings, Inc. (a)* | | | 5,000 | | | | 40 | |
| Telephone & Data Systems, Inc. | | | 5,100 | | | | 249 | |
Time Warner Telecom, Inc., Class A * | | | 9,000 | | | | 179 | |
U.S. Cellular Corp. * | | | 6,100 | | | | 387 | |
U.S. Wireless Corp. * | | | 400 | | | | — | |
| Verizon Communications, Inc. | | | 247,572 | | | | 9,160 | |
| Warwick Valley Telephone Co. | | | 1,100 | | | | 22 | |
| Windstream Corp. | | | 31,624 | | | | 434 | |
Wireless Facilities, Inc. * | | | 1,800 | | | | 4 | |
| | | | | | | | |
| | | | | | | | 40,944 | |
| | | | | | | | | |
Transportation 1.8% | | | | | | | | |
| |
AirTran Holdings, Inc. * | | | 5,800 | | | | 58 | |
Alaska Air Group, Inc. * | | | 1,900 | | | | 76 | |
| Alexander & Baldwin, Inc. | | | 3,400 | | | | 157 | |
Amerco, Inc. * | | | 900 | | | | 83 | |
AMR Corp. (a)* | | | 17,000 | | | | 482 | |
| Arkansas Best Corp. | | | 1,100 | | | | 45 | |
| Avis Budget Group, Inc. | | | 8,372 | | | | 166 | |
| Burlington Northern Santa Fe Corp. | | | 30,300 | | | | 2,349 | |
| C.H. Robinson Worldwide, Inc. | | | 15,000 | | | | 626 | |
| Con-way, Inc. | | | 4,500 | | | | 212 | |
Continental Airlines, Inc., Class B (a)* | | | 7,500 | | | | 277 | |
| CSX Corp. | | | 34,200 | | | | 1,220 | |
Dollar Thrifty Automotive Group, Inc. * | | | 3,500 | | | | 141 | |
EGL, Inc. * | | | 3,500 | | | | 119 | |
| Expeditors International of Washington, Inc. | | | 16,200 | | | | 768 | |
ExpressJet Holdings, Inc. * | | | 3,000 | | | | 24 | |
| FedEx Corp. | | | 24,063 | | | | 2,756 | |
| Florida East Coast Industries, Class A | | | 3,600 | | | | 215 | |
| Forward Air Corp. | | | 2,600 | | | | 84 | |
| Heartland Express, Inc. | | | 8,941 | | | | 146 | |
Hub Group, Inc., Class A * | | | 1,400 | | | | 38 | |
See financial notes. 25
Schwab Total Stock Market Index Fund
Portfolio Holdings continued
| | | | | | | | | |
| | | Number of | | | Value | |
| Security | | Shares | | | ($ x 1,000) | |
| | | | | | | | | |
| Interpool, Inc. | | | 1,200 | | | | 29 | |
| J.B. Hunt Transport Services, Inc. | | | 13,000 | | | | 281 | |
JetBlue Airways Corp. (a)* | | | 11,962 | | | | 150 | |
Kansas City Southern * | | | 5,050 | | | | 143 | |
Kirby Corp. * | | | 5,600 | | | | 196 | |
| Knight Transportation, Inc. | | | 4,050 | | | | 74 | |
| Laidlaw International, Inc. | | | 8,200 | | | | 238 | |
| Landstar Systems, Inc. | | | 15,200 | | | | 706 | |
MAIR Holdings, Inc. * | | | 1,100 | | | | 6 | |
Mesa Air Group, Inc. * | | | 3,800 | | | | 34 | |
| Norfolk Southern Corp. | | | 32,000 | | | | 1,682 | |
Northwest Airlines Corp. * | | | 6,500 | | | | 5 | |
Old Dominion Freight Line * | | | 4,050 | | | | 112 | |
| Pacer International, Inc. | | | 2,800 | | | | 86 | |
Park-Ohio Holdings Corp. * | | | 2,600 | | | | 36 | |
| Ryder System, Inc. | | | 6,400 | | | | 337 | |
Saia, Inc. * | | | 1,100 | | | | 29 | |
| SkyWest, Inc. | | | 4,000 | | | | 107 | |
| Southwest Airlines Co. | | | 64,125 | | | | 964 | |
Swift Transportation Co., Inc. * | | | 5,970 | | | | 150 | |
UAL Corp. * | | | 5,600 | | | | 201 | |
| Union Pacific Corp. | | | 22,000 | | | | 1,994 | |
| United Parcel Service, Inc., Class B | | | 91,480 | | | | 6,893 | |
US Airways Group, Inc. * | | | 5,900 | | | | 294 | |
| UTI Worldwide, Inc. | | | 4,300 | | | | 111 | |
| Werner Enterprises, Inc. | | | 5,832 | | | | 107 | |
YRC Worldwide, Inc. * | | | 5,004 | | | | 194 | |
| | | | | | | | |
| | | | | | | | 25,201 | |
| | | | | | | | | |
Utilities 3.4% | | | | | | | | |
| |
| AGL Resources, Inc. | | | 4,300 | | | | 161 | |
Allegheny Energy, Inc. * | | | 11,900 | | | | 512 | |
| Allete, Inc. | | | 2,733 | | | | 123 | |
| Alliant Energy Corp. | | | 9,300 | | | | 357 | |
Ameren Corp. (a) | | | 15,100 | | | | 817 | |
| American Electric Power Co., Inc. | | | 33,820 | | | | 1,401 | |
Aqua America, Inc. (a) | | | 4,894 | | | | 119 | |
Aquila, Inc. * | | | 29,400 | | | | 135 | |
| Atmos Energy Corp. | | | 6,700 | | | | 206 | |
| Avista Corp. | | | 3,800 | | | | 98 | |
| Black Hills Corp. | | | 1,400 | | | | 48 | |
CenterPoint Energy, Inc. (a) | | | 26,100 | | | | 404 | |
| Central Vermont Public Service Corp. | | | 2,700 | | | | 61 | |
| CH Energy Group, Inc. | | | 1,900 | | | | 99 | |
| Cleco Corp. | | | 3,400 | | | | 87 | |
CMS Energy Corp. * | | | 17,400 | | | | 259 | |
| Consolidated Edison, Inc. | | | 17,000 | | | | 822 | |
| Constellation Energy Group, Inc. | | | 15,500 | | | | 967 | |
| Dominion Resources, Inc. | | | 26,610 | | | | 2,155 | |
| DPL, Inc. | | | 11,452 | | | | 329 | |
DTE Energy Co. (a) | | | 13,801 | | | | 627 | |
| Duke Energy Corp. | | | 100,356 | | | | 3,175 | |
| Duquesne Light Holdings, Inc. | | | 6,100 | | | | 121 | |
Dynegy, Inc., Class A * | | | 38,700 | | | | 235 | |
| Edison International | | | 37,710 | | | | 1,676 | |
El Paso Electric Co. * | | | 2,800 | | | | 65 | |
| Energen Corp. | | | 5,200 | | | | 223 | |
| Energy East Corp. | | | 12,214 | | | | 297 | |
| Entergy Corp. | | | 15,700 | | | | 1,347 | |
| Equitable Resources, Inc. | | | 8,800 | | | | 357 | |
| Exelon Corp. | | | 54,474 | | | | 3,376 | |
| FirstEnergy Corp. | | | 28,217 | | | | 1,661 | |
| Florida Public Utilites Co. | | | 1,599 | | | | 22 | |
FPL Group, Inc. (a) | | | 29,400 | | | | 1,499 | |
| Great Plains Energy, Inc. | | | 6,500 | | | | 211 | |
| Green Mountain Power Corp. | | | 3,800 | | | | 128 | |
| Hawaiian Electric Industries, Inc. | | | 7,700 | | | | 216 | |
| Idacorp, Inc. | | | 4,200 | | | | 166 | |
| KeySpan Corp. | | | 13,400 | | | | 544 | |
| MDU Resources Group, Inc. | | | 16,425 | | | | 422 | |
Mirant Corp. * | | | 17,700 | | | | 523 | |
| National Fuel Gas Co. | | | 5,800 | | | | 217 | |
| New Jersey Resources Corp. | | | 1,650 | | | | 85 | |
| Nicor, Inc. | | | 3,000 | | | | 138 | |
| NiSource, Inc. | | | 22,864 | | | | 532 | |
| Northeast Utilities | | | 10,124 | | | | 253 | |
| Northwest Natural Gas Co. | | | 2,700 | | | | 112 | |
NRG Energy, Inc. (a)* | | | 7,000 | | | | 337 | |
| NSTAR | | | 7,734 | | | | 269 | |
| OGE Energy Corp. | | | 6,500 | | | | 251 | |
| Oneok, Inc. | | | 9,900 | | | | 412 | |
| Ormat Technologies, Inc. | | | 2,800 | | | | 107 | |
| Otter Tail Corp. | | | 1,100 | | | | 33 | |
| Peoples Energy Corp. | | | 3,200 | | | | 140 | |
| Pepco Holdings, Inc. | | | 14,000 | | | | 356 | |
| PG&E Corp. | | | 29,900 | | | | 1,290 | |
Piedmont Natural Gas Co., Inc. (a) | | | 3,200 | | | | 86 | |
| Pinnacle West Capital Corp. | | | 6,800 | | | | 325 | |
| PNM Resources, Inc. | | | 5,500 | | | | 155 | |
| PPL Corp. | | | 30,000 | | | | 1,036 | |
Progress Energy, Inc. (a) | | | 21,159 | | | | 973 | |
| Public Service Enterprise Group, Inc. | | | 19,000 | | | | 1,160 | |
| Puget Energy, Inc. | | | 7,500 | | | | 179 | |
| Questar Corp. | | | 8,100 | | | | 660 | |
Reliant Energy, Inc. (a)* | | | 25,125 | | | | 319 | |
| SCANA Corp. | | | 7,905 | | | | 316 | |
| Sempra Energy | | | 19,175 | | | | 1,017 | |
Sierra Pacific Resources * | | | 4,476 | | | | 68 | |
| Southern Union Co. | | | 6,074 | | | | 168 | |
| Southwest Gas Corp. | | | 3,600 | | | | 129 | |
| TECO Energy, Inc. | | | 15,700 | | | | 259 | |
The AES Corp. * | | | 52,596 | | | | 1,157 | |
| The Laclede Group, Inc. | | | 3,300 | | | | 118 | |
| The Southern Co. | | | 58,600 | | | | 2,133 | |
| TXU Corp. | | | 52,800 | | | | 3,333 | |
| UGI Corp. | | | 8,200 | | | | 217 | |
| UIL Holdings Corp. | | | 3,166 | | | | 126 | |
| Unisource Energy Corp. | | | 3,800 | | | | 135 | |
26 See financial notes.
Schwab Total Stock Market Index Fund
Portfolio Holdings continued
| | | | | | | | | |
| | | Number of | | | Value | |
| Security | | Shares | | | ($ x 1,000) | |
| | | | | | | | | |
| Unitil Corp. | | | 600 | | | | 15 | |
| Vectren Corp. | | | 5,766 | | | | 167 | |
| Westar Energy, Inc. | | | 8,200 | | | | 208 | |
| WGL Holdings, Inc. | | | 3,000 | | | | 97 | |
| Wisconsin Energy Corp. | | | 11,400 | | | | 524 | |
| WPS Resources Corp. | | | 2,400 | | | | 128 | |
| Xcel Energy, Inc. | | | 34,195 | | | | 755 | |
| | | | | | | | |
| | | | | | | | 46,546 | |
| | | | | | | | | |
Foreign Common Stock 0.1% of net assets | | | | | | | | |
| | | | | | | | | |
Cayman Islands 0.1% | | | | | | | | |
| |
Energy 0.1% | | | | | | | | |
| GlobalSantaFe Corp. | | | 19,155 | | | | 994 | |
| | | | | | | | | |
Preferred Stock 0.0% of net assets | | | | | | | | |
| | | | | | | | | |
Real Estate 0.0% | | | | | | | | |
| |
| Simon Property Group, Inc. | | | 1,200 | | | | 94 | |
| | | | | | | | | |
| Security | | Face Amount | | | Value | |
| Rate, Maturity Date | | ($ x 1,000) | | | ($ x 1,000) | |
| | | | | | | | | |
U.S. Treasury Obligation 0.0% of net assets | | | | | | | | |
| | | | | | | | | |
U.S. Treasury Bill
4.90%, 12/14/06 | | | 310 | | | | 308 | |
| | | | | | | | | |
| | | Number of | | | Value | |
| Security | | Shares | | | ($ x 1,000) | |
| | | | | | | | | |
Rights 0.0% of net assets | | | | | | | | |
| | | | | | | | | |
OSI Pharmaceuticals, Inc. * | | | 1,640 | | | | -- | |
| | | | | | | | | |
End of Investments. | | | | | | | | |
| | | | | | | | | |
Collateral Invested for Securities on Loan 3.9% of net assets | | | | | | | | |
| | | | | | | | | |
| State Street Navigator Security Lending Prime Portfolio | | | 52,763,359 | | | | 52,763 | |
| | | | | | | | | |
| End of collateral invested for securities on loan. |
At October 31, 2006 the tax basis cost of the fund’s investments was $1,038,818 and the unrealized appreciation and depreciation were $420,363 and ($94,146), respectively, with a net unrealized appreciation of $326,217.
In addition to the above, the fund held the following at October 31, 2006. All numbers are x 1,000 except number of futures contracts.
| | | | | | | | | | | | | |
| | | Number of | | | Contract | | | Unrealized | |
| | | Contracts | | | Value | | | Gains | |
| | | | | | | | | | | | | |
Futures Contracts | | | | | | | | | | | | |
| | | | | | | | | | | | | |
| Russell 2000 Index, e-mini, Long expires 12/31/06 | | | 10 | | | | 771 | | | | 56 | |
| S&P 500 Index, e-mini, Long, expires 12/15/06 | | | 10 | | | | 692 | | | | 36 | |
| | | | | | | | | | | | |
| | | | | | | | | | | | 92 | |
| | |
| * | | Non-income producing security. |
| |
| (a) | | All or a portion of this security is on loan. |
| |
| (b) | | Fair-valued by Management. |
| |
| (c) | | All or a portion of this security is held as collateral for open futures contracts. |
| |
| (d) | | Issuer is affiliated with the fund’s adviser. |
| |
| (e) | | Bankrupt security/delisted. |
See financial notes. 27
Schwab International Index Fund
Portfolio Holdings as of October 31, 2006
This section shows all the securities in the fund’s portfolio and their value as of the report date.
The fund files its complete schedule of portfolio holdings with the SEC for the first and third quarters of each fiscal year on Form N-Q. The fund’s Form N-Q is available on the SEC’s website at http://www.sec.gov and may be viewed and copied at the SEC’s Public Reference Room in Washington, D.C. Call 1-800-SEC-0330 for information on the operation of the Public Reference Room. The schedule of portfolio holdings filed on a fund’s most recent Form N-Q is also available by visiting Schwab’s website at www.schwab.com/schwabfunds.
| | | | | | | | | | | | | |
| | | | | | | Cost | | | Value | |
| Holdings by Category | | ($ x 1,000) | | | ($ x 1,000) | |
| |
| | 99.4 | % | | Foreign Common Stock | | | 967,386 | | | | 1,649,642 | |
| | 0.3 | % | | Short-Term Investment | | | 4,182 | | | | 4,182 | |
| |
| | 99.7 | % | | Total Investments | | | 971,568 | | | | 1,653,824 | |
| | 5.8 | % | | Collateral Invested for Securities on Loan | | | 96,480 | | | | 96,480 | |
| | (5.5) | % | | Other Assets and Liabilities, Net | | | | | | | (91,025 | ) |
| |
| | 100.0 | % | | Total Net Assets | | | | | | | 1,659,279 | |
| | | | | | | | | |
| | | Number of | | | Value | |
| Security | | Shares | | | ($ x 1,000) | |
| | | | | | | | | |
Foreign Common Stock 99.4% of net assets | | | | | | | | |
| | | | | | | | | |
Australia 4.3% | | | | | | | | |
| |
| | | | | | | | | |
Banks 1.7% | | | | | | | | |
| |
| Australia and New Zealand Banking Group Ltd. | | | 275,227 | | | | 6,164 | |
| Commonwealth Bank of Australia | | | 208,546 | | | | 7,695 | |
| National Australia Bank Ltd. | | | 251,679 | | | | 7,420 | |
St. George Bank Ltd. (a) | | | 79,285 | | | | 1,986 | |
| Westpac Banking Corp. | | | 298,794 | | | | 5,539 | |
| | | | | | | | |
| | | | | | | | 28,804 | |
| | | | | | | | | |
Capital Goods 0.1% | | | | | | | | |
| |
| Wesfarmers Ltd. | | | 59,508 | | | | 1,590 | |
| | | | | | | | | |
Diversified Financials 0.2% | | | | | | �� | | |
| |
| Macquarie Bank Ltd. | | | 36,389 | | | | 2,098 | |
Suncorp.-Metway Ltd. (a) | | | 94,261 | | | | 1,517 | |
| | | | | | | | |
| | | | | | | | 3,615 | |
| | | | | | | | | |
Energy 0.1% | | | | | | | | |
| |
| Woodside Petroleum Ltd. | | | 70,492 | | | | 2,071 | |
| | | | | | | | | |
Food & Staples Retailing 0.3% | | | | | | | | |
| |
| Coles Myer Ltd. | | | 185,781 | | | | 1,953 | |
| Woolworths Ltd. | | | 186,347 | | | | 2,984 | |
| | | | | | | | |
| | | | | | | | 4,937 | |
| | | | | | | | | |
Food, Beverage & Tobacco 0.1% | | | | | | | | |
| |
| Foster’s Group Ltd. | | | 310,703 | | | | 1,552 | |
| | | | | | | | | |
Insurance 0.3% | | | | | | | | |
| |
| AMP Ltd. | | | 283,951 | | | | 2,085 | |
| QBE Insurance Group Ltd. | | | 128,017 | | | | 2,446 | |
| | | | | | | | |
| | | | | | | | 4,531 | |
| | | | | | | | | |
Materials 1.1% | | | | | | | | |
| |
| BHP Billiton Ltd. | | | 582,860 | | | | 12,406 | |
| Rinker Group Ltd. | | | 152,818 | | | | 2,187 | |
Rio Tinto Ltd. (a) | | | 44,243 | | | | 2,690 | |
| | | | | | | | |
| | | | | | | | 17,283 | |
| | | | | | | | | |
Real Estate 0.2% | | | | | | | | |
| |
| Westfield Group | | | 250,650 | | | | 3,615 | |
| | | | | | | | | |
Telecommunication Services 0.2% | | | | | | | | |
| |
Telstra Corp., Ltd. (a) | | | 956,807 | | | | 2,938 | |
| | | | | | | | |
| | | | | | | | 70,936 | |
| | | | | | | | | |
Austria 0.2% | | | | | | | | |
| |
| | | | | | | | | |
Banks 0.1% | | | | | | | | |
| |
| Erste Bank der Oesterreichischen Sparkassen AG | | | 33,336 | | | | 2,268 | |
| | | | | | | | | |
Energy 0.1% | | | | | | | | |
| |
| OMV AG | | | 24,905 | | | | 1,353 | |
| | | | | | | | |
| | | | | | | | 3,621 | |
| | | | | | | | | |
Belgium 1.3% | | | | | | | | |
| |
| | | | | | | | | |
Banks 0.4% | | | | | | | | |
| |
| Dexia | | | 116,326 | | | | 3,138 | |
| KBC GROEP NV | | | 32,914 | | | | 3,594 | |
| | | | | | | | |
| | | | | | | | 6,732 | |
| | | | | | | | | |
Diversified Financials 0.5% | | | | | | | | |
| |
| Fortis | | | 205,652 | | | | 8,624 | |
| | | | | | | | | |
Food, Beverage & Tobacco 0.1% | | | | | | | | |
| |
InBev NV * | | | 33,347 | | | | 1,877 | |
| | | | | | | | | |
Materials 0.1% | | | | | | | | |
| |
| Solvay SA | | | 11,315 | | | | 1,466 | |
| | | | | | | | | |
Utilities 0.2% | | | | | | | | |
| |
| Electrabel SA | | | 3,678 | | | | 2,217 | |
| | | | | | | | |
| | | | | | | | 20,916 | |
See financial notes. 1
Schwab International Index Fund
Portfolio Holdings continued
| | | | | | | | | |
| | | Number of | | | Value | |
| Security | | Shares | | | ($ x 1,000) | |
| | | | | | | | | |
Canada 6.7% | | | | | | | | |
| |
| | | | | | | | | |
Automobiles & Components 0.1% | | | | | | | | |
| |
Magna International, Inc., Class A (a) | | | 16,790 | | | | 1,257 | |
| | | | | | | | | |
Banks 2.0% | | | | | | | | |
| |
Bank of Montreal (a) | | | 82,275 | | | | 5,088 | |
Bank of Nova Scotia (a) | | | 151,680 | | | | 6,659 | |
Canadian Imperial Bank of Commerce (a) | | | 56,793 | | | | 4,430 | |
National Bank of Canada (a) | | | 26,520 | | | | 1,447 | |
Royal Bank of Canada (a) | | | 201,446 | | | | 8,934 | |
Toronto-Dominion Bank (a) | | | 113,303 | | | | 6,568 | |
| | | | | | | | |
| | | | | | | | 33,126 | |
| | | | | | | | | |
Energy 1.9% | | | | | | | | |
| |
| Canadian Natural Resources Ltd. | | | 88,025 | | | | 4,582 | |
Enbridge, Inc. (a) | | | 59,980 | | | | 2,017 | |
| EnCana Corp. | | | 132,106 | | | | 6,274 | |
Imperial Oil Ltd. (a) | | | 52,047 | | | | 1,774 | |
| Nexen, Inc. | | | 42,457 | | | | 2,265 | |
| Petro-Canada | | | 79,554 | | | | 3,392 | |
| Suncor Energy, Inc | | | 72,088 | | | | 5,537 | |
| Talisman Energy, Inc. | | | 162,888 | | | | 2,676 | |
TransCanada Corp. (a) | | | 75,940 | | | | 2,457 | |
| | | | | | | | |
| | | | | | | | 30,974 | |
| | | | | | | | | |
Food & Staples Retailing 0.1% | | | | | | | | |
| |
| Shoppers Drug Mart Corp. | | | 34,748 | | | | 1,415 | |
| | | | | | | | | |
Insurance 0.8% | | | | | | | | |
| |
Manulife Financial Corp. (a) | | | 245,296 | | | | 7,973 | |
Power Corp. of Canada (a) | | | 48,677 | | | | 1,475 | |
Sun Life Financial, Inc. (a) | | | 97,223 | | | | 4,088 | |
| | | | | | | | |
| | | | | | | | 13,536 | |
| | | | | | | | | |
Materials 0.7% | | | | | | | | |
| |
| Alcan, Inc. | | | 56,826 | | | | 2,665 | |
| Barrick Gold Corp. | | | 137,399 | | | | 4,252 | |
| Novelis, Inc. | | | 1 | | | | — | |
| Potash Corp of Saskatchewan | | | 16,545 | | | | 2,073 | |
| Teck Cominco Ltd., Class B | | | 33,931 | | | | 2,500 | |
| | | | | | | | |
| | | | | | | | 11,490 | |
| | | | | | | | | |
Media 0.1% | | | | | | | | |
| |
The Thomson Corp. (a) | | | 32,575 | | | | 1,348 | |
| | | | | | | | | |
Real Estate 0.1% | | | | | | | | |
| |
Brookfield Asset Management, Inc., Class A (a) | | | 50,757 | | | | 2,312 | |
| | | | | | | | | |
Technology Hardware & Equipment 0.3% | | | | | | | | |
| |
Nortel Networks Corp. * | | | 703,685 | | | | 1,573 | |
Research In Motion Ltd. * | | | 31,116 | | | | 3,655 | |
| | | | | | | | |
| | | | | | | | 5,228 | |
| | | | | | | | | |
Telecommunication Services 0.4% | | | | | | | | |
| |
BCE, Inc. (a) | | | 135,368 | | | | 3,821 | |
| Rogers Communications, Inc. | | | 37,589 | | | | 2,249 | |
| | | | | | | | |
| | | | | | | | 6,070 | |
| | | | | | | | | |
Transportation 0.2% | | | | | | | | |
| |
| Canadian National Railway Co. | | | 86,466 | | | | 4,119 | |
| | | | | | | | |
| | | | | | | | 110,875 | |
| | | | | | | | | |
Denmark 0.5% | | | | | | | | |
| |
| | | | | | | | | |
Banks 0.2% | | | | | | | | |
| |
| Danske Bank A/S | | | 71,510 | | | | 2,995 | |
| | | | | | | | | |
Pharmaceuticals & Biotechnology 0.2% | | | | | | | | |
| |
| Novo-Nordisk A/S, Class B | | | 33,620 | | | | 2,532 | |
| | | | | | | | | |
Transportation 0.1% | | | | | | | | |
| |
| AP Moller - Maersk A/S | | | 128 | | | | 1,156 | |
| AP Moller - Maersk A/S | | | 149 | | | | 1,321 | |
| | | | | | | | |
| | | | | | | | 2,477 | |
| | | | | | | | |
| | | | | | | | 8,004 | |
| | | | | | | | | |
Finland 1.1% | | | | | | | | |
| |
| | | | | | | | | |
Materials 0.2% | | | | | | | | |
| |
| Stora Enso Oyj | | | 103,510 | | | | 1,673 | |
| UPM-Kymmene Oyj | | | 83,482 | | | | 2,119 | |
| | | | | | | | |
| | | | | | | | 3,792 | |
| | | | | | | | | |
Technology Hardware & Equipment 0.8% | | | | | | | | |
| |
| Nokia Oyj | | | 653,383 | | | | 12,987 | |
| | | | | | | | | |
Utilities 0.1% | | | | | | | | |
| |
| Fortum Oyj | | | 68,798 | | | | 1,900 | |
| | | | | | | | |
| | | | | | | | 18,679 | |
| | | | | | | | | |
France 10.3% | | | | | | | | |
| |
| | | | | | | | | |
Automobiles & Components 0.4% | | | | | | | | |
| |
| Compagnie Generale des Etablissements Michelin, Class B | | | 20,614 | | | | 1,680 | |
| PSA Peugeot Citroen | | | 28,624 | | | | 1,642 | |
| Renault S.A. | | | 30,704 | | | | 3,588 | |
| | | | | | | | |
| | | | | | | | 6,910 | |
| | | | | | | | | |
Banks 1.7% | | | | | | | | |
| |
| BNP Paribas | | | 131,357 | | | | 14,426 | |
| Credit Agricole S.A. | | | 113,868 | | | | 4,838 | |
| Societe Generale | | | 58,802 | | | | 9,762 | |
| | | | | | | | |
| | | | | | | | 29,026 | |
2 See financial notes.
Schwab International Index Fund
Portfolio Holdings continued
| | | | | | | | | |
| | | Number of | | | Value | |
| Security | | Shares | | | ($ x 1,000) | |
| | | | | | | | | |
Capital Goods 0.7% | | | | | | | | |
| |
| Compagnie de Saint-Gobain | | | 53,044 | | | | 3,909 | |
| Schneider Electric SA | | | 34,576 | | | | 3,591 | |
| Vinci S. A. | | | 37,948 | | | | 4,275 | |
| | | | | | | | |
| | | | | | | | 11,775 | |
| | | | | | | | | |
Consumer Durables & Apparel 0.3% | | | | | | | | |
| |
| LVMH Moet Hennessy Louis Vuitton S.A. | | | 40,824 | | | | 4,252 | |
| | | | | | | | | |
Consumer Services 0.2% | | | | | | | | |
| |
| Accor SA | | | 37,106 | | | | 2,574 | |
| | | | | | | | | |
Energy 1.6% | | | | | | | | |
| |
| Total SA | | | 393,890 | | | | 26,645 | |
| | | | | | | | | |
Food & Staples Retailing 0.3% | | | | | | | | |
| |
Carrefour S.A. * | | | 96,720 | | | | 5,891 | |
| | | | | | | | | |
Food, Beverage & Tobacco 0.5% | | | | | | | | |
| |
| Groupe Danone | | | 41,720 | | | | 6,108 | |
| Pernod Ricard SA | | | 13,699 | | | | 2,742 | |
| | | | | | | | |
| | | | | | | | 8,850 | |
| | | | | | | | | |
Health Care Equipment & Services 0.1% | | | | | | | | |
| |
| Essilor International S.A. | | | 16,331 | | | | 1,712 | |
| | | | | | | | | |
Household & Personal Products 0.2% | | | | | | | | |
| |
| L’Oreal S.A. | | | 40,437 | | | | 3,930 | |
| | | | | | | | | |
Insurance 0.8% | | | | | | | | |
| |
| Assurances Generales de France (AGF) | | | 12,978 | | | | 1,823 | |
| Axa | | | 292,677 | | | | 11,134 | |
| | | | | | | | |
| | | | | | | | 12,957 | |
| | | | | | | | | |
Materials 0.5% | | | | | | | | |
| |
| Air Liquide S.A. | | | 18,948 | | | | 4,027 | |
| Lafarge S.A. | | | 27,323 | | | | 3,663 | |
| | | | | | | | |
| | | | | | | | 7,690 | |
| | | | | | | | | |
Media 0.5% | | | | | | | | |
| |
| Lagardere S.C.A. | | | 22,134 | | | | 1,592 | |
| Vivendi Universal S.A. | | | 181,776 | | | | 6,887 | |
| | | | | | | | |
| | | | | | | | 8,479 | |
| | | | | | | | | |
Pharmaceuticals & Biotechnology 0.8% | | | | | | | | |
| |
| Sanofi-Aventis | | | 154,055 | | | | 13,118 | |
| | | | | | | | | |
Retailing 0.1% | | | | | | | | |
| |
| Pinault-Printemps-Redoute S.A. | | | 12,173 | | | | 1,815 | |
| | | | | | | | | |
Technology Hardware & Equipment 0.2% | | | | | | | | |
| |
| Alcatel SA, Class A | | | 206,671 | | | | 2,623 | |
| | | | | | | | | |
Telecommunication Services 0.6% | | | | | | | | |
| |
| Bouygues SA | | | 39,073 | | | | 2,278 | |
| France Telecom SA | | | 270,491 | | | | 7,044 | |
| | | | | | | | |
| | | | | | | | 9,322 | |
| | | | | | | | | |
Utilities 0.8% | | | | | | | | |
| |
| Suez SA | | | 202,911 | | | | 9,089 | |
| Veolia Environnement | | | 65,105 | | | | 3,984 | |
| | | | | | | | |
| | | | | | | | 13,073 | |
| | | | | | | | |
| | | | | | | | 170,642 | |
| | | | | | | | | |
Germany 7.6% | | | | | | | | |
| |
| | | | | | | | | |
Automobiles & Components 1.0% | | | | | | | | |
| |
| Bayerische Motoren Werke (BMW) AG | | | 47,949 | | | | 2,758 | |
| Continental AG | | | 22,867 | | | | 2,562 | |
| DaimlerChrysler AG | | | 162,404 | | | | 9,285 | |
| Volkswagen AG | | | 30,793 | | | | 3,042 | |
| | | | | | | | |
| | | | | | | | 17,647 | |
| | | | | | | | | |
Banks 0.5% | | | | | | | | |
| |
Bayerische Hypo-und Vereinsbank AG (a) | | | 101,300 | | | | 4,594 | |
| Commerzbank AG | | | 105,004 | | | | 3,734 | |
| | | | | | | | |
| | | | | | | | 8,328 | |
| | | | | | | | | |
Capital Goods 0.8% | | | | | | | | |
| |
Siemens AG * | | | 142,378 | | | | 12,844 | |
| | | | | | | | | |
Consumer Durables & Apparel 0.1% | | | | | | | | |
| |
| Adidas-Salomon AG | | | 25,972 | | | | 1,303 | |
| | | | | | | | | |
Diversified Financials 0.8% | | | | | | | | |
| |
| Deutsche Bank AG | | | 82,735 | | | | 10,464 | |
| Deutsche Boerse AG | | | 16,600 | | | | 2,682 | |
| | | | | | | | |
| | | | | | | | 13,146 | |
| | | | | | | | | |
Insurance 1.1% | | | | | | | | |
| |
| Allianz AG | | | 63,388 | | | | 11,779 | |
| Muenchener Rueckversicherungs AG | | | 36,694 | | | | 5,967 | |
| | | | | | | | |
| | | | | | | | 17,746 | |
| | | | | | | | | |
Materials 0.9% | | | | | | | | |
| |
| BASF AG | | | 83,012 | | | | 7,330 | |
Bayer AG (a) | | | 122,106 | | | | 6,142 | |
See financial notes. 3
Schwab International Index Fund
Portfolio Holdings continued
| | | | | | | | | |
| | | Number of | | | Value | |
| Security | | Shares | | | ($ x 1,000) | |
| | | | | | | | | |
| ThyssenKrupp AG | | | 60,228 | | | | 2,242 | |
| | | | | | | | |
| | | | | | | | 15,714 | |
| | | | | | | | | |
Software & Services 0.4% | | | | | | | | |
| |
| SAP AG | | | 34,535 | | | | 6,875 | |
| | | | | | | | | |
Telecommunication Services 0.5% | | | | | | | | |
| |
| Deutsche Telekom AG | | | 485,962 | | | | 8,425 | |
| | | | | | | | | |
Transportation 0.2% | | | | | | | | |
| |
| Deutsche Post AG | | | 113,727 | | | | 3,152 | |
| | | | | | | | | |
Utilities 1.3% | | | | | | | | |
| |
| E.ON AG | | | 112,817 | | | | 13,585 | |
| RWE AG | | | 74,676 | | | | 7,396 | |
| | | | | | | | |
| | | | | | | | 20,981 | |
| | | | | | | | |
| | | | | | | | 126,161 | |
| | | | | | | | | |
Greece 0.3% | | | | | | | | |
| |
| | | | | | | | | |
Banks 0.3% | | | | | | | | |
| |
| Alpha Bank A.E. | | | 65,044 | | | | 1,890 | |
| National Bank of Greece S.A. | | | 58,220 | | | | 2,639 | |
| | | | | | | | |
| | | | | | | | 4,529 | |
| | | | | | | | | |
Hong Kong 0.8% | | | | | | | | |
| |
| | | | | | | | | |
Banks 0.1% | | | | | | | | |
| |
| Hang Seng Bank Ltd. | | | 121,836 | | | | 1,551 | |
| | | | | | | | | |
Capital Goods 0.2% | | | | | | | | |
| |
| Hutchison Whampoa Ltd. | | | 336,370 | | | | 2,982 | |
| | | | | | | | | |
Real Estate 0.4% | | | | | | | | |
| |
| Cheung Kong (Holdings) Ltd. | | | 204,240 | | | | 2,219 | |
| Sun Hung Kai Properties Ltd. | | | 210,604 | | | | 2,300 | |
| Swire Pacific Ltd. | | | 167,890 | | | | 1,772 | |
| | | | | | | | |
| | | | | | | | 6,291 | |
| | | | | | | | | |
Utilities 0.1% | | | | | | | | |
| |
| CLP Holdings Ltd. | | | 247,080 | | | | 1,569 | |
| Hong Kong & China Gas Co. | | | 600,400 | | | | 1,375 | |
| | | | | | | | |
| | | | | | | | 2,944 | |
| | | | | | | | |
| | | | | | | | 13,768 | |
| | | | | | | | | |
Ireland 0.7% | | | | | | | | |
| |
| | | | | | | | | |
Banks 0.5% | | | | | | | | |
| |
| Allied Irish Banks plc | | | 138,658 | | | | 3,751 | |
| Anglo Irish Bank Corp., plc | | | 110,337 | | | | 1,980 | |
| Bank of Ireland | | | 155,007 | | | | 3,104 | |
| | | | | | | | |
| | | | | | | | 8,835 | |
| | | | | | | | | |
Materials 0.2% | | | | | | | | |
| |
| CRH plc | | | 87,100 | | | | 3,077 | |
| | | | | | | | |
| | | | | | | | 11,912 | |
| | | | | | | | | |
Italy 3.3% | | | | | | | | |
| |
| | | | | | | | | |
Banks 1.2% | | | | | | | | |
| |
| Banca Intesa S.p.A. | | | 608,806 | | | | 4,159 | |
| Banche Popolari Unite Scpa | | | 56,071 | | | | 1,539 | |
| SanPaolo IMI S.p.A. | | | 164,991 | | | | 3,520 | |
| UniCredito Italiano S.p.A. | | | 541,340 | | | | 4,508 | |
| UniCredito Italiano S.p.A. | | | 777,937 | | | | 6,447 | |
| | | | | | | | |
| | | | | | | | 20,173 | |
| | | | | | | | | |
Energy 0.8% | | | | | | | | |
| |
Eni S.p.A. (a) | | | 419,043 | | | | 12,676 | |
| | | | | | | | | |
Insurance 0.4% | | | | | | | | |
| |
Assicurazioni Generali S.p.A. * | | | 173,745 | | | | 6,890 | |
| | | | | | | | | |
Media 0.1% | | | | | | | | |
| |
| Mediaset S.p.A. | | | 110,368 | | | | 1,237 | |
| | | | | | | | | |
Telecommunication Services 0.4% | | | | | | | | |
| |
| Telecom Italia RNC S.p.A. | | | 963,731 | | | | 2,435 | |
| Telecom Italia S.p.A. | | | 1,701,963 | | | | 5,155 | |
| | | | | | | | |
| | | | | | | | 7,590 | |
| | | | | | | | | |
Utilities 0.4% | | | | | | | | |
| |
| Enel S.p.A. | | | 640,287 | | | | 6,132 | |
| | | | | | | | |
| | | | | | | | 54,698 | |
| | | | | | | | | |
Japan 18.8% | | | | | | | | |
| |
| | | | | | | | | |
Automobiles & Components 2.6% | | | | | | | | |
| |
| Bridgestone Corp. | | | 91,657 | | | | 1,909 | |
| Denso Corp. | | | 68,000 | | | | 2,592 | |
| Honda Motor Co., Ltd. | | | 246,039 | | | | 8,684 | |
| Nissan Motors Co., Ltd. | | | 337,196 | | | | 4,031 | |
| Toyota Motor Corp. | | | 438,703 | | | | 25,904 | |
| | | | | | | | |
| | | | | | | | 43,120 | |
| | | | | | | | | |
Banks 3.4% | | | | | | | | |
| |
| Mitsubishi UFJ Financial Group, Inc. | | | 1,612 | | | | 20,448 | |
| Mitsui Trust Holdings, Inc. | | | 129,000 | | | | 1,514 | |
| Mizuho Financial Group, Inc. | | | 1,666 | | | | 12,950 | |
| Resona Holdings, Inc. | | | 1,748 | | | | 5,305 | |
| Shinsei Bank Ltd. | | | 222,000 | | | | 1,280 | |
| Sumitomo Mitsui Financial Group, Inc. | | | 1,014 | | | | 11,081 | |
| The Bank of Yokohama Ltd. | | | 214,000 | | | | 1,649 | |
| The Sumitomo Trust & Banking Co., Ltd. | | | 253,950 | | | | 2,724 | |
| | | | | | | | |
| | | | | | | | 56,951 | |
| | | | | | | | | |
Capital Goods 1.6% | | | | | | | | |
| |
| Asahi Glass Co., Ltd. | | | 143,000 | | | | 1,644 | |
| Fanuc Ltd. | | | 32,300 | | | | 2,802 | |
4 See financial notes.
Schwab International Index Fund
Portfolio Holdings continued
| | | | | | | | | |
| | | Number of | | | Value | |
| Security | | Shares | | | ($ x 1,000) | |
| | | | | | | | | |
| Itochu Corp. | | | 237,000 | | | | 1,886 | |
| Komatsu Ltd. | | | 135,609 | | | | 2,440 | |
| Mitsubishi Corp. | | | 227,000 | | | | 4,383 | |
| Mitsubishi Electric Corp. | | | 303,000 | | | | 2,638 | |
| Mitsubishi Heavy Industries Ltd. | | | 565,000 | | | | 2,518 | |
| Mitsui & Co., Ltd. | | | 231,000 | | | | 3,150 | |
| SMC Corp. | | | 7,000 | | | | 955 | |
| Sumitomo Corp. | | | 188,000 | | | | 2,470 | |
| Sumitomo Electric Industries Ltd. | | | 97,000 | | | | 1,371 | |
| | | | | | | | |
| | | | | | | | 26,257 | |
| | | | | | | | | |
Commercial Services & Supplies 0.2% | | | | | | | | |
| |
| Dai Nippon Printing Co., Ltd. | | | 87,000 | | | | 1,294 | |
| Secom Co., Ltd. | | | 38,500 | | | | 1,925 | |
| | | | | | | | |
| | | | | | | | 3,219 | |
| | | | | | | | | |
Consumer Durables & Apparel 1.1% | | | | | | | | |
| |
| Fuji Photo Film Co., Ltd. | | | 70,811 | | | | 2,631 | |
| Matsushita Electric Industrial Co., Ltd. | | | 328,912 | | | | 6,857 | |
| Sharp Corp. | | | 123,785 | | | | 2,203 | |
| Sony Corp. | | | 159,500 | | | | 6,519 | |
| | | | | | | | |
| | | | | | | | 18,210 | |
| | | | | | | | | |
Diversified Financials 0.9% | | | | | | | | |
| |
| Credit Saison Co., Ltd. | | | 26,000 | | | | 940 | |
| Daiwa Securities Group, Inc. | | | 177,045 | | | | 2,002 | |
| Nikko Cordial Corp. | | | 120,000 | | | | 1,433 | |
| Nomura Holdings, Inc. | | | 311,000 | | | | 5,468 | |
| ORIX Corp. | | | 14,000 | | | | 3,937 | |
| Takefuji Corp. | | | 18,000 | | | | 652 | |
| | | | | | | | |
| | | | | | | | 14,432 | |
| | | | | | | | | |
Energy 0.1% | | | | | | | | |
| |
| Nippon Oil Corp. | | | 182,000 | | | | 1,360 | |
| | | | | | | | | |
Food & Staples Retailing 0.4% | | | | | | | | |
| |
| Aeon Co., Ltd. | | | 97,000 | | | | 2,281 | |
| Seven & I Holdings Co., Ltd. | | | 133,203 | | | | 4,273 | |
| | | | | | | | |
| | | | | | | | 6,554 | |
| | | | | | | | | |
Food, Beverage & Tobacco 0.3% | | | | | | | | |
| |
| Japan Tobacco, Inc. | | | 750 | | | | 3,264 | |
| Kirin Brewery Co., Ltd. | | | 136,000 | | | | 1,809 | |
| | | | | | | | |
| | | | | | | | 5,073 | |
| | | | | | | | | |
Household & Personal Products 0.1% | | | | | | | | |
| |
| Kao Corp. | | | 78,619 | | | | 2,065 | |
| | | | | | | | | |
Insurance 0.7% | | | | | | | | |
| |
| Millea Holdings, Inc. | | | 129,500 | | | | 4,876 | |
| Mitsui Sumitomo Insurance Co., Ltd. | | | 211,875 | | | | 2,626 | |
| Sompo Japan Insurance, Inc. | | | 140,920 | | | | 1,870 | |
| T&D Holdings, Inc. | | | 37,000 | | | | 2,700 | |
| | | | | | | | |
| | | | | | | | 12,072 | |
| | | | | | | | | |
Materials 1.0% | | | | | | | | |
| |
| JFE Holdings, Inc. | | | 85,000 | | | | 3,413 | |
| Nippon Steel Corp. | | | 1,020,000 | | | | 4,145 | |
| Nitto Denko Corp. | | | 28,000 | | | | 1,593 | |
| Shin-Etsu Chemical Co., Ltd. | | | 58,280 | | | | 3,821 | |
| Sumitomo Chemical Co., Ltd. | | | 229,000 | | | | 1,630 | |
| Sumitomo Metal Industries, Ltd. | | | 658,000 | | | | 2,473 | |
| | | | | | | | |
| | | | | | | | 17,075 | |
| | | | | | | | | |
Pharmaceuticals & Biotechnology 1.0% | | | | | | | | |
| |
| Astellas Pharma, Inc. | | | 79,370 | | | | 3,574 | |
| Daiichi Sankyo Co., Ltd. | | | 105,500 | | | | 3,135 | |
| Eisai Co., Ltd. | | | 45,000 | | | | 2,302 | |
| Takeda Pharmaceutical Co., Ltd. | | | 130,200 | | | | 8,359 | |
| | | | | | | | |
| | | | | | | | 17,370 | |
| | | | | | | | | |
Real Estate 0.4% | | | | | | | | |
| |
| Mitsubishi Estate Co., Ltd. | | | 181,502 | | | | 4,341 | |
| Mitsui Fudosan Co., Ltd. | | | 125,777 | | | | 3,094 | |
| | | | | | | | |
| | | | | | | | 7,435 | |
| | | | | | | | | |
Semiconductors & Semiconductor Equipment 0.2% | | | | | | | | |
| |
| Rohm Co., Ltd. | | | 14,112 | | | | 1,296 | |
| Tokyo Electron Ltd. | | | 28,000 | | | | 2,088 | |
| | | | | | | | |
| | | | | | | | 3,384 | |
| | | | | | | | | |
Software & Services 0.3% | | | | | | | | |
| |
| Nintendo Co., Ltd. | | | 18,239 | | | | 3,727 | |
| Yahoo! Japan Corp. | | | 1,840 | | | | 715 | |
| | | | | | | | |
| | | | | | | | 4,442 | |
| | | | | | | | | |
Technology Hardware & Equipment 2.0% | | | | | | | | |
| |
| Canon, Inc. | | | 190,995 | | | | 10,200 | |
| Fujitsu Ltd. | | | 326,000 | | | | 2,656 | |
| Hitachi Ltd. | | | 487,079 | | | | 2,785 | |
| Hoya Corp. | | | 69,607 | | | | 2,690 | |
| Keyence Corp. | | | 6,400 | | | | 1,415 | |
| Kyocera Corp. | | | 24,500 | | | | 2,196 | |
| Murata Manufacturing Co., Ltd. | | | 32,574 | | | | 2,274 | |
| NEC Corp. | | | 327,000 | | | | 1,684 | |
| Ricoh Co., Ltd. | | | 89,000 | | | | 1,756 | |
| TDK Corp. | | | 22,000 | | | | 1,716 | |
Toshiba Corp. (a) | | | 471,178 | | | | 2,974 | |
| | | | | | | | |
| | | | | | | | 32,346 | |
See financial notes. 5
Schwab International Index Fund
Portfolio Holdings continued
| | | | | | | | | |
| | | Number of | | | Value | |
| Security | | Shares | | | ($ x 1,000) | |
| | | | | | | | | |
Telecommunication Services 1.0% | | | | | | | | |
| |
| KDDI Corp. | | | 444 | | | | 2,769 | |
| Nippon Telegraph & Telephone Corp. (NTT) | | | 1,565 | | | | 7,862 | |
| NTT DoCoMo, Inc. | | | 2,615 | | | | 3,988 | |
Softbank Corp. (a) | | | 109,000 | | | | 2,380 | |
| | | | | | | | |
| | | | | | | | 16,999 | |
| | | | | | | | | |
Transportation 0.5% | | | | | | | | |
| |
| Central Japan Railway Co. | | | 272 | | | | 2,930 | |
| East Japan Railway Co. | | | 562 | | | | 3,928 | |
| Mitsui O.S.K. Lines Ltd. | | | 175,000 | | | | 1,457 | |
| | | | | | | | |
| | | | | | | | 8,315 | |
| | | | | | | | | |
Utilities 1.0% | | | | | | | | |
| |
Chubu Electric Power Co., Inc. (a) | | | 102,100 | | | | 2,827 | |
| Kyushu Electric Power Co., Inc. | | | 58,493 | | | | 1,368 | |
| The Kansai Electric Power Co., Inc. | | | 130,000 | | | | 3,067 | |
| The Tokyo Electric Power Co., Inc. | | | 181,890 | | | | 5,287 | |
| Tohoku Electric Power Co., Inc. | | | 57,700 | | | | 1,278 | |
| Tokyo Gas Co., Ltd. | | | 394,201 | | | | 2,012 | |
| | | | | | | | |
| | | | | | | | 15,839 | |
| | | | | | | | |
| | | | | | | | 312,518 | |
| | | | | | | | | |
Netherlands 4.1% | | | | | | | | |
| |
| | | | | | | | | |
Banks 0.5% | | | | | | | | |
| |
| ABN AMRO Holding N.V. | | | 300,416 | | | | 8,754 | |
| | | | | | | | | |
Capital Goods 0.1% | | | | | | | | |
| |
| European Aeronautic Defense & Space Co. | | | 46,558 | | | | 1,261 | |
| | | | | | | | | |
Consumer Durables & Apparel 0.4% | | | | | | | | |
| |
| Koninklijke (Royal) Philips Electronics N.V. | | | 209,766 | | | | 7,307 | |
| | | | | | | | | |
Diversified Financials 1.0% | | | | | | | | |
| |
| ING Groep N.V. | | | 366,162 | | | | 16,217 | |
| | | | | | | | | |
Food & Staples Retailing 0.2% | | | | | | | | |
| |
Koninklijke Ahold NV * | | | 248,229 | | | | 2,615 | |
| | | | | | | | | |
Food, Beverage & Tobacco 0.6% | | | | | | | | |
| |
| Heineken NV | | | 34,407 | | | | 1,558 | |
| Royal Numico N.V. | | | 28,252 | | | | 1,262 | |
| Unilever NV | | | 272,295 | | | | 6,715 | |
| | | | | | | | |
| | | | | | | | 9,535 | |
| | | | | | | | | |
Insurance 0.2% | | | | | | | | |
| |
| Aegon N.V. | | | 184,183 | | | | 3,384 | |
| | | | | | | | | |
Materials 0.5% | | | | | | | | |
| |
| Akzo Nobel N.V. | | | 39,704 | | | | 2,226 | |
| Koninklijke DSM N.V. | | | 32,938 | | | | 1,502 | |
| Mittal Steel Co NV | | | 98,640 | | | | 4,236 | |
| | | | | | | | |
| | | | | | | | 7,964 | |
| | | | | | | | | |
Media 0.1% | | | | | | | | |
| |
| Reed Elsevier N.V. | | | 105,903 | | | | 1,808 | |
| | | | | | | | | |
Semiconductors & Semiconductor Equipment 0.2% | | | | | | | | |
| |
ASML Holding NV * | | | 63,189 | | | | 1,442 | |
| STMicroelectronics NV | | | 70,117 | | | | 1,213 | |
| | | | | | | | |
| | | | | | | | 2,655 | |
| | | | | | | | | |
Telecommunication Services 0.2% | | | | | | | | |
| |
| Koninklijke (Royal) KPN NV | | | 303,896 | | | | 4,063 | |
| | | | | | | | | |
Transportation 0.1% | | | | | | | | |
| |
| TNT N.V. | | | 67,143 | | | | 2,579 | |
| | | | | | | | |
| | | | | | | | 68,142 | |
| | | | | | | | | |
Norway 0.4% | | | | | | | | |
| |
| | | | | | | | | |
Banks 0.1% | | | | | | | | |
| |
| DNB NOR ASA | | | 117,439 | | | | 1,538 | |
| | | | | | | | | |
Energy 0.3% | | | | | | | | |
| |
Norsk Hydro ASA (a) | | | 118,680 | | | | 2,746 | |
| Statoil ASA | | | 103,920 | | | | 2,639 | |
| | | | | | | | |
| | | | | | | | 5,385 | |
| | | | | | | | |
| | | | | | | | 6,923 | |
| | | | | | | | | |
Portugal 0.2% | | | | | | | | |
| |
| | | | | | | | | |
Banks 0.1% | | | | | | | | |
| |
| Banco Comercial Portugues S.A. | | | 531,272 | | | | 1,730 | |
| | | | | | | | | |
Telecommunication Services 0.1% | | | | | | | | |
| |
| Portugal Telecom, SGPS, S.A. | | | 186,107 | | | | 2,322 | |
| | | | | | | | |
| | | | | | | | 4,052 | |
| | | | | | | | | |
Singapore 0.5% | | | | | | | | |
| |
| | | | | | | | | |
Banks 0.4% | | | | | | | | |
| |
| DBS Group Holdings Ltd. | | | 175,246 | | | | 2,291 | |
| Overseas-Chinese Banking Corp., Ltd. | | | 437,552 | | | | 1,965 | |
| United Overseas Bank Ltd. | | | 214,682 | | | | 2,439 | |
| | | | | | | | |
| | | | | | | | 6,695 | |
| | | | | | | | | |
Telecommunication Services 0.1% | | | | | | | | |
| |
| Singapore Telecommunications Ltd. | | | 775,480 | | | | 1,321 | |
| | | | | | | | |
| | | | | | | | 8,016 | |
6 See financial notes.
Schwab International Index Fund
Portfolio Holdings continued
| | | | | | | | | |
| | | Number of | | | Value | |
| Security | | Shares | | | ($ x 1,000) | |
| | | | | | | | | |
Spain 4.6% | | | | | | | | |
| |
| | | | | | | | | |
Banks 2.0% | | | | | | | | |
| |
| Banco Bilbao Vizcaya Argentaria S.A. | | | 552,339 | | | | 13,331 | |
| Banco Popular Espanol SA | | | 155,820 | | | | 2,700 | |
| Banco Santander Central Hispano S.A. | | | 1,013,916 | | | | 17,547 | |
| | | | | | | | |
| | | | | | | | 33,578 | |
| | | | | | | | | |
Capital Goods 0.1% | | | | | | | | |
| |
| ACS Actividades de Construction Y Servicios, SA | | | 35,072 | | | | 1,760 | |
| | | | | | | | | |
Energy 0.3% | | | | | | | | |
| |
| Repsol YPF S.A. | | | 154,504 | | | | 5,136 | |
| | | | | | | | | |
Food, Beverage & Tobacco 0.1% | | | | | | | | |
| |
| Altadis S.A. | | | 42,027 | | | | 2,010 | |
| | | | | | | | | |
Retailing 0.1% | | | | | | | | |
| |
| Industria de Diseno Textil SA | | | 41,211 | | | | 1,969 | |
| | | | | | | | | |
Telecommunication Services 0.9% | | | | | | | | |
| |
| Telefonica S.A. | | | 777,060 | | | | 14,960 | |
| | | | | | | | | |
Transportation 0.1% | | | | | | | | |
| |
| Abertis Infraestructuras SA | | | 52,740 | | | | 1,428 | |
| | | | | | | | | |
Utilities 1.0% | | | | | | | | |
| |
| Endesa S.A. | | | 173,536 | | | | 7,614 | |
| Iberdrola S.A. | | | 143,905 | | | | 6,595 | |
| Union Fenosa SA | | | 38,092 | | | | 1,933 | |
| | | | | | | | |
| | | | | | | | 16,142 | |
| | | | | | | | |
| | | | | | | | 76,983 | |
| | | | | | | | | |
Sweden 1.8% | | | | | | | | |
| |
| | | | | | | | | |
Banks 0.7% | | | | | | | | |
| |
| ForeningsSparbanken AB | | | 64,379 | | | | 2,106 | |
| Nordea Bank AB | | | 346,815 | | | | 4,770 | |
| Skandinaviska Enskilda Banken AB, (SEB) Series A | | | 70,925 | | | | 1,979 | |
| Svenska Handelsbanken AB, Class A | | | 82,642 | | | | 2,138 | |
| | | | | | | | |
| | | | | | | | 10,993 | |
| | | | | | | | | |
Capital Goods 0.2% | | | | | | | | |
| |
| Sandvik AB | | | 160,500 | | | | 1,958 | |
| Volvo AB | | | 34,020 | | | | 2,120 | |
| | | | | | | | |
| | | | | | | | 4,078 | |
| | | | | | | | | |
Retailing 0.2% | | | | | | | | |
| |
| Hennes & Mauritz AB, Series B | | | 71,752 | | | | 3,090 | |
| | | | | | | | | |
Technology Hardware & Equipment 0.5% | | | | | | | | |
| |
| Telefonaktiebolaget LM Ericsson, Class B | | | 2,372,504 | | | | 8,968 | |
| | | | | | | | | |
Telecommunication Services 0.2% | | | | | | | | |
| |
| TeliaSonera AB | | | 343,834 | | | | 2,503 | |
| | | | | | | | |
| | | | | | | | 29,632 | |
| | | | | | | | | |
Switzerland 7.6% | | | | | | | | |
| |
| | | | | | | | | |
Capital Goods 0.3% | | | | | | | | |
| |
| ABB Ltd. | | | 339,807 | | | | 5,054 | |
| | | | | | | | | |
Consumer Durables & Apparel 0.2% | | | | | | | | |
| |
| Compagnie Financiere Richemont AG, Series A | | | 83,283 | | | | 4,119 | |
| | | | | | | | | |
Diversified Financials 2.0% | | | | | | | | |
| |
| Credit Suisse Group | | | 199,166 | | | | 12,006 | |
| UBS AG | | | 348,598 | | | | 20,815 | |
| | | | | | | | |
| | | | | | | | 32,821 | |
| | | | | | | | | |
Food, Beverage & Tobacco 1.4% | | | | | | | | |
| |
| Nestle S.A. | | | 65,820 | | | | 22,492 | |
| | | | | | | | | |
Insurance 0.6% | | | | | | | | |
| |
| Swiss Re | | | 53,201 | | | | 4,364 | |
| Zurich Financial Services AG | | | 22,760 | | | | 5,623 | |
| | | | | | | | |
| | | | | | | | 9,987 | |
| | | | | | | | | |
Materials 0.3% | | | | | | | | |
| |
| Holcim Ltd. | | | 26,619 | | | | 2,292 | |
Syngenta AG * | | | 15,609 | | | | 2,519 | |
| | | | | | | | |
| | | | | | | | 4,811 | |
| | | | | | | | | |
Pharmaceuticals & Biotechnology 2.8% | | | | | | | | |
| |
| Novartis AG — Reg’d. | | | 436,697 | | | | 26,508 | |
| Roche Holdings AG | | | 111,022 | | | | 19,439 | |
| | | | | | | | |
| | | | | | | | 45,947 | |
| | | | | | | | |
| | | | | | | | 125,231 | |
| | | | | | | | | |
United Kingdom 24.3% | | | | | | | | |
| |
| | | | | | | | | |
Automobiles & Components 0.0% | | | | | | | | |
| |
Rolls Royce Group, Class B * | | | 11,223,007 | | | | 21 | |
| | | | | | | | | |
Banks 5.6% | | | | | | | | |
| |
| Barclays plc | | | 1,053,619 | | | | 14,196 | |
| HBOS plc | | | 605,157 | | | | 12,537 | |
See financial notes. 7
Schwab International Index Fund
Portfolio Holdings continued
| | | | | | | | | |
| | | Number of | | | Value | |
| Security | | Shares | | | ($ x 1,000) | |
| | | | | | | | | |
| HSBC Holdings plc | | | 1,805,836 | | | | 34,266 | |
| Lloyds TSB Group plc | | | 895,483 | | | | 9,565 | |
| Royal Bank of Scotland Group plc | | | 501,714 | | | | 17,860 | |
| Standard Chartered plc | | | 183,129 | | | | 5,152 | |
| | | | | | | | |
| | | | | | | | 93,576 | |
| | | | | | | | | |
Capital Goods 0.6% | | | | | | | | |
| |
| BAE Systems plc | | | 490,319 | | | | 3,920 | |
Rolls-Royce Group plc * | | | 305,804 | | | | 2,737 | |
| Smiths Group plc | | | 77,351 | | | | 1,395 | |
| Wolseley plc | | | 100,048 | | | | 2,359 | |
| | | | | | | | |
| | | | | | | | 10,411 | |
| | | | | | | | | |
Commercial Services & Supplies 0.1% | | | | | | | | |
| |
Experian Group Ltd. * | | | 147,144 | | | | 1,618 | |
| | | | | | | | | |
Consumer Services 0.3% | | | | | | | | |
| |
| Carnival plc | | | 30,775 | | | | 1,498 | |
| Compass Group plc | | | 328,860 | | | | 1,757 | |
| Ladbrokes plc | | | 101,485 | | | | 791 | |
| | | | | | | | |
| | | | | | | | 4,046 | |
| | | | | | | | | |
Diversified Financials 0.3% | | | | | | | | |
| |
| 3i Group plc | | | 79,355 | | | | 1,453 | |
| Man Group plc | | | 305,124 | | | | 2,835 | |
| | | | | | | | |
| | | | | | | | 4,288 | |
| | | | | | | | | |
Energy 5.1% | | | | | | | | |
| |
| BG Group plc | | | 541,434 | | | | 7,186 | |
| BP plc | | | 3,203,910 | | | | 35,817 | |
| Royal Dutch Shell plc, Class A | | | 749,220 | | | | 26,070 | |
| Royal Dutch Shell plc, Class B | | | 434,049 | | | | 15,596 | |
| | | | | | | | |
| | | | | | | | 84,669 | |
| | | | | | | | | |
Food & Staples Retailing 0.6% | | | | | | | | |
| |
| Boots Group plc | | | 85,666 | | | | 1,323 | |
| Tesco plc | | | 1,227,342 | | | | 9,208 | |
| | | | | | | | |
| | | | | | | | 10,531 | |
| | | | | | | | | |
Food, Beverage & Tobacco 1.9% | | | | | | | | |
| |
| British American Tobacco plc | | | 232,940 | | | | 6,344 | |
| Cadbury Schweppes plc | | | 343,491 | | | | 3,458 | |
| Diageo plc | | | 445,768 | | | | 8,242 | |
| Gallaher Group plc | | | 117,546 | | | | 1,995 | |
| Imperial Tobacco Group plc | | | 106,921 | | | | 3,787 | |
| SABMiller plc | | | 124,102 | | | | 2,400 | |
| Unilever plc | | | 214,819 | | | | 5,335 | |
| | | | | | | | |
| | | | | | | | 31,561 | |
| | | | | | | | | |
Health Care Equipment & Services 0.1% | | | | | | | | |
| |
| Smith & Nephew plc | | | 175,479 | | | | 1,714 | |
| | | | | | | | | |
Household & Personal Products 0.3% | | | | | | | | |
| |
| Reckitt Benckiser plc | | | 94,602 | | | | 4,113 | |
| | | | | | | | | |
Insurance 1.0% | | | | | | | | |
| |
| Aviva plc | | | 375,087 | | | | 5,540 | |
| Legal & General Group plc | | | 992,966 | | | | 2,738 | |
| Old Mutual plc | | | 874,614 | | | | 2,831 | |
| Prudential plc | | | 394,603 | | | | 4,834 | |
| | | | | | | | |
| | | | | | | | 15,943 | |
| | | | | | | | | |
Materials 1.9% | | | | | | | | |
| |
| Anglo American plc | | | 240,109 | | | | 10,867 | |
| BHP Billiton plc | | | 385,794 | | | | 7,429 | |
| Hanson plc | | | 128,676 | | | | 1,786 | |
| Rio Tinto plc | | | 167,659 | | | | 9,277 | |
| Xstrata plc | | | 61,410 | | | | 2,614 | |
| | | | | | | | |
| | | | | | | | 31,973 | |
| | | | | | | | | |
Media 0.7% | | | | | | | | |
| |
| British Sky Broadcasting Group plc | | | 195,898 | | | | 2,031 | |
| ITV plc | | | 738,032 | | | | 1,485 | |
| Pearson plc | | | 143,637 | | | | 2,120 | |
| Reed Elsevier plc | | | 180,755 | | | | 2,055 | |
| Reuters Group plc | | | 196,728 | | | | 1,677 | |
| WPP Group plc | | | 214,518 | | | | 2,748 | |
| | | | | | | | |
| | | | | | | | 12,116 | |
| | | | | | | | | |
Pharmaceuticals & Biotechnology 2.4% | | | | | | | | |
| |
| AstraZeneca plc | | | 253,064 | | | | 14,914 | |
| GlaxoSmithKline plc | | | 932,267 | | | | 24,845 | |
| | | | | | | | |
| | | | | | | | 39,759 | |
| | | | | | | | | |
Real Estate 0.3% | | | | | | | | |
| |
| British Land Co., plc | | | 90,252 | | | | 2,574 | |
| Land Securities Group plc | | | 75,040 | | | | 3,001 | |
| | | | | | | | |
| | | | | | | | 5,575 | |
| | | | | | | | | |
Retailing 0.4% | | | | | | | | |
| |
Home Retail Group * | | | 147,144 | | | | 1,126 | |
| Kingfisher plc | | | 310,070 | | | | 1,555 | |
| Marks & Spencer Group plc | | | 275,748 | | | | 3,449 | |
| | | | | | | | |
| | | | | | | | 6,130 | |
| | | | | | | | | |
Telecommunication Services 1.7% | | | | | | | | |
| |
| BT Group plc | | | 1,305,157 | | | | 6,938 | |
| Vodafone Group plc | | | 8,348,655 | | | | 21,512 | |
| | | | | | | | |
| | | | | | | | 28,450 | |
| | | | | | | | | |
Utilities 1.0% | | | | | | | | |
| |
| Centrica plc | | | 538,641 | | | | 3,406 | |
| National Grid plc | | | 405,043 | | | | 5,165 | |
| Scottish Power plc | | | 248,688 | | | | 3,100 | |
| Scottish Southern Energy plc | | | 133,187 | | | | 3,341 | |
8 See financial notes.
Schwab International Index Fund
Portfolio Holdings continued
| | | | | | | | | |
| Security | | Face Amount | | | Value | |
| Rate, Maturity Date | | ($ x 1,000) | | | ($ x 1,000) | |
| United Utilities plc | | | 139,438 | | | | 1,898 | |
| | | | | | | | |
| | | | | | | | 16,910 | |
| | | | | | | | |
| | | | | | | | 403,404 | |
| | | | | | | | | |
Short-Term Investment 0.3% of net assets | | | | | | | | |
| | | | | | | | | |
| Wells Fargo, Grand Cayman Time Deposit 4.71%, 11/01/06 | | | 4,182 | | | | 4,182 | |
End of Investments.
| | | | | | | | | |
| | | Number of | | | | | |
| Security | | Shares | | | | | |
| | | | | | | | | |
| Collateral Invested for Securities on Loan 5.8% of net assets |
| | | | | | | | | |
| Securities Lending Investment Fund, a series of the Brown Brothers Investment Trust. | | | 96,479,879 | | | | 96,480 | |
End of collateral invested for securities on loan.
At 10/31/06 the tax basis cost of the fund’s investments was $986,474, and the unrealized appreciation and depreciation were $699,603 and ($32,253), respectively, with a net unrealized appreciation of $667,350.
As of 10/31/06, the prices of certain foreign securities held by the fund aggregating $1,515,837 were adjusted from their closing market prices following the guidelines adopted by the fund’s Board of Trustees.
| | |
| * | | Non-income producing security. |
| |
| (a) | | All or a portion of this security is on loan. |
See financial notes. 9
Item 7: Disclosure of Proxy Voting Policies and Procedures for Closed-End Management Investment Companies.
Not applicable.
Item 8: Portfolio Managers of Closed-End Management Investment Companies.
Not applicable.
Item 9: Purchases of Equity Securities by Closed-End Management Investment Company and Affiliated Purchasers.
Not applicable.
Item 10: Submission of Matters to a Vote of Security Holders.
Not applicable.
Item 11: Controls and Procedures.
| (a) | | Based on their evaluation of Registrant’s disclosure controls and procedures, as of a date within 90 days of the filing date, Registrant’s Chief Executive Officer, Evelyn Dilsaver and Registrant’s Principal Financial Officer, George Pereira, have concluded that Registrant’s disclosure controls and procedures are: (i) reasonably designed to ensure that information required to be disclosed in this report is appropriately communicated to Registrant’s officers to allow timely decisions regarding disclosures required in this report; (ii) reasonably designed to ensure that information required to be disclosed in this report is recorded, processed, summarized and reported in a timely manner; and (iii) are effective in achieving the goals described in (i) and (ii) above. |
| (b) | | During the second fiscal quarter of the period covered by this report, there have been no changes in Registrant’s internal control over financial reporting that the above officers believe to have materially affected, or to be reasonably likely to materially affect, Registrant’s internal control over financial reporting. |
Item 12: Exhibits.
| (a)(1) | | Registrant’s code of ethics (that is the subject of the disclosure required by Item 2(a)) is attached. |
| |
| (2) | | Separate certifications for Registrant’s principal executive officer and principal financial officer, as required by Rule 30a-2(a) under the 1940 Act, are attached. |
| |
| (3) | | Not applicable. |
| (b) | | A certification for Registrant’s principal executive officer and principal financial officer, as required by Rule 30a-2(b) under the 1940 Act, is attached. This certification is being furnished to the Securities and Exchange Commission solely pursuant to 18 U.S.C. section 1350 and is not being filed as part of the Form N-CSR with the Commission. |
Pursuant to the requirements of the Securities Exchange Act of 1934 and the Investment Company Act of 1940, the registrant has duly caused this report to be signed on its behalf by the undersigned, thereunto duly authorized.
(Registrant) Schwab Capital Trust
| | | | | |
| | | |
| By: | /s/ Evelyn Dilsaver | | |
| | Evelyn Dilsaver | | |
| | Chief Executive Officer | | |
Date: December 20, 2006
Pursuant to the requirements of the Securities Exchange Act of 1934 and the Investment Company Act of 1940, this report has been signed below by the following persons on behalf of the registrant and in the capacities and on the dates indicated.
| | | | | |
| | | |
| By: | /s/ Evelyn Dilsaver | | |
| | Evelyn Dilsaver | | |
| | Chief Executive Officer | | |
Date: December 20, 2006
| | | | | |
| | | |
| By: | /s/ George Pereira | | |
| | George Pereira | | |
| | Principal Financial Officer | | |
Date: December 20, 2006