UNITED STATES
SECURITIES AND EXCHANGE COMMISSION
Washington, D.C. 20549
FORM N-CSR
CERTIFIED SHAREHOLDER REPORT OF REGISTERED
MANAGEMENT INVESTMENT COMPANIES
Investment Company Act file number: 811-07704
Schwab Capital Trust – Target Index Funds
(Exact name of registrant as specified in charter)
211 Main Street, San Francisco, California 94105
(Address of principal executive offices) (Zip code)
Marie Chandoha
Schwab Capital Trust
211 Main Street, San Francisco, California 94105
(Name and address of agent for service)
Registrant’s telephone number, including area code: (415) 636-7000
Date of fiscal year end: March 31
Date of reporting period: March 31, 2017
Item 1: Report(s) to Shareholders.
Annual Report | March 31, 2017
Schwab Target Index Funds
Schwab Target 2010 Index Fund
Schwab Target 2015 Index Fund
Schwab Target 2020 Index Fund
Schwab Target 2025 Index Fund
Schwab Target 2030 Index Fund
Schwab Target 2035 Index Fund
Schwab Target 2040 Index Fund
Schwab Target 2045 Index Fund
Schwab Target 2050 Index Fund
Schwab Target 2055 Index Fund
Schwab Target 2060 Index Fund
This page is intentionally left blank.
Schwab Target Index Funds
Fund investment adviser: Charles Schwab Investment Management, Inc. (CSIM).
Distributor: Charles Schwab & Co., Inc. (Schwab).
Schwab Target Index Funds | Annual Report
Schwab Target Index Funds
The performance data quoted represents past performance. Past performance does not guarantee future results. Investment returns and principal value of an investment will fluctuate so that an investor’s shares may be worth more or less than their original cost. Current performance may be lower or higher than performance data quoted. To obtain performance information current to the most recent month end, please visit www.csimfunds.com.
| Total Returns From Inception (August 25, 2016) to March 31, 2017 |
| Schwab Target 2010 Index Fund | |
| Investor Shares (Ticker Symbol: SWXAX) | 2.26% |
| Institutional Shares (Ticker Symbol: SWYAX) | 2.26% |
| Target 2010 Passive Composite Index | 2.37% |
| Fund Category: Morningstar Target-Date 2000-2010 | 2.72% |
| Performance Details | pages 9-12 |
| |
| Schwab Target 2015 Index Fund | |
| Investor Shares (Ticker Symbol: SWXBX) | 2.48% |
| Institutional Shares (Ticker Symbol: SWYBX) | 2.49% |
| Target 2015 Passive Composite Index | 2.58% |
| Fund Category: Morningstar Target-Date 2015 | 3.22% |
| Performance Details | pages 13-16 |
| |
| Schwab Target 2020 Index Fund | |
| Investor Shares (Ticker Symbol: SWXCX) | 3.59% |
| Institutional Shares (Ticker Symbol: SWYLX) | 3.69% |
| Target 2020 Passive Composite Index | 3.68% |
| Fund Category: Morningstar Target-Date 2020 | 3.46% |
| Performance Details | pages 17-20 |
| |
| Schwab Target 2025 Index Fund | |
| Investor Shares (Ticker Symbol: SWXDX) | 4.81% |
| Institutional Shares (Ticker Symbol: SWYDX) | 4.82% |
| Target 2025 Passive Composite Index | 4.83% |
| Fund Category: Morningstar Target-Date 2025 | 4.56% |
| Performance Details | pages 21-24 |
| |
| Schwab Target 2030 Index Fund | |
| Investor Shares (Ticker Symbol: SWXEX) | 5.66% |
| Institutional Shares (Ticker Symbol: SWYEX) | 5.66% |
| Target 2030 Passive Composite Index | 5.70% |
| Fund Category: Morningstar Target-Date 2030 | 5.44% |
| Performance Details | pages 25-28 |
| |
| Schwab Target 2035 Index Fund | |
| Investor Shares (Ticker Symbol: SWXFX) | 6.33% |
| Institutional Shares (Ticker Symbol: SWYFX) | 6.44% |
| Target 2035 Passive Composite Index | 6.44% |
| Fund Category: Morningstar Target-Date 2035 | 6.46% |
| Performance Details | pages 29-32 |
All total returns on this page assume dividends and distributions were reinvested. Index figures do not include trading and management costs, which would lower performance. Indexes are unmanaged and cannot be invested in directly. Performance results less than one year are not annualized.
The components that make up each of the composite indexes may vary over time. For index definitions, please see the Glossary.
Fund expenses may have been partially absorbed by CSIM and its affiliates. Without these reductions, a fund’s total return would have been lower. Performance does not reflect the deduction of taxes that a shareholder would pay on fund distributions or on the redemption of fund shares.
Source for category information: Morningstar, Inc. The Morningstar Category return represents all active and index mutual funds within the category as of the report date.
Schwab Target Index Funds | Annual Report
Schwab Target Index Funds
Performance at a Glance (continued)
| Total Returns From Inception (August 25, 2016) to March 31, 2017 |
| Schwab Target 2040 Index Fund | |
| Investor Shares (Ticker Symbol: SWXGX) | 7.08% |
| Institutional Shares (Ticker Symbol: SWYGX) | 7.09% |
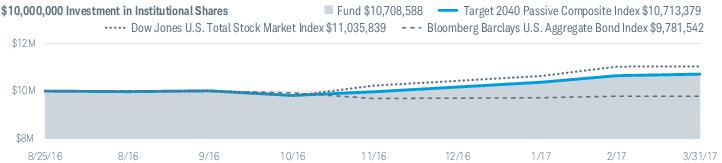
| Target 2040 Passive Composite Index | 7.13% |
| Fund Category: Morningstar Target-Date 2040 | 6.86% |
| Performance Details | pages 33-36 |
| |
| Schwab Target 2045 Index Fund | |
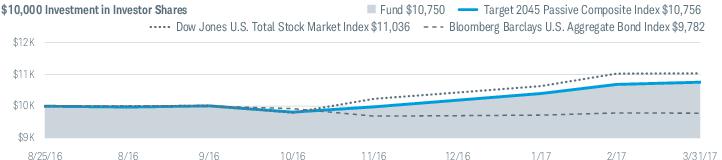
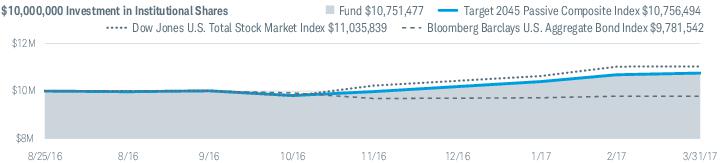
| Investor Shares (Ticker Symbol: SWXHX) | 7.50% |
| Institutional Shares (Ticker Symbol: SWYHX) | 7.51% |
| Target 2045 Passive Composite Index | 7.56% |
| Fund Category: Morningstar Target-Date 2045 | 7.36% |
| Performance Details | pages 37-40 |
| |
| Schwab Target 2050 Index Fund | |
| Investor Shares (Ticker Symbol: SWXIX) | 7.69% |
| Institutional Shares (Ticker Symbol: SWYMX) | 7.80% |
| Target 2050 Passive Composite Index | 7.83% |
| Fund Category: Morningstar Target-Date 2050 | 7.29% |
| Performance Details | pages 41-44 |
| |
| Schwab Target 2055 Index Fund | |
| Investor Shares (Ticker Symbol: SWXJX) | 8.02% |
| Institutional Shares (Ticker Symbol: SWYJX) | 8.03% |
| Target 2055 Passive Composite Index | 8.09% |
| Fund Category: Morningstar Target-Date 2055 | 7.58% |
| Performance Details | pages 45-48 |
| |
| Schwab Target 2060 Index Fund | |
| Investor Shares (Ticker Symbol: SWXKX) | 8.11% |
| Institutional Shares (Ticker Symbol: SWYNX) | 8.11% |
| Target 2060 Passive Composite Index | 8.16% |
| Fund Category: Morningstar Target-Date 2060+ | 7.78% |
| Performance Details | pages 49-52 |
| |
| Minimum Initial Investment1 | |
| Investor Shares | $ 100 |
| Institutional Shares | $10,000,000 |
All total returns on this page assume dividends and distributions were reinvested. Index figures do not include trading and management costs, which would lower performance. Indexes are unmanaged and cannot be invested in directly. Performance results less than one year are not annualized.
The components that make up each of the composite indexes may vary over time. For index definitions, please see the Glossary.
Fund expenses may have been partially absorbed by CSIM and its affiliates. Without these reductions, a fund’s total return would have been lower. Performance does not reflect the deduction of taxes that a shareholder would pay on fund distributions or on the redemption of fund shares.
Source for category information: Morningstar, Inc. The Morningstar Category return represents all active and index mutual funds within the category as of the report date.
| 1 | There is no minimum investment requirement for employer-sponsored retirement plans (including, but not limited to, profit sharing, 401(k), 403(b), 457(b) and defined benefit plans). Please see the funds' prospectus for further detail and eligibility requirements. |
Schwab Target Index Funds | Annual Report
Schwab Target Index Funds
Marie Chandoha
President and CEO of
Charles Schwab Investment
Management, Inc. and the
funds covered in this report.
Dear Shareholder,
As tax season wraps up, I’ve been reflecting on the importance of process in our financial lives. Filing taxes can be challenging for those who don’t have a sound approach for handling their returns, and investing is the same way: your goals can be easier to attain when you have a disciplined and deliberate plan that you follow. At Charles Schwab Investment Management, we believe the new Schwab Target Index Funds (the funds) can help with that process – and here’s how.
The funds can help investors stay anchored to their long-term plans and can remove impulses to buy or sell stocks or bonds during tumultuous market periods. Investors simply choose a fund based on their target retirement date, and we do the rest. The funds’ asset allocations are adjusted annually and follow a predetermined glide path, becoming more conservative as the target retirement date approaches. When developing the funds’ glide path, we use a series of factors to quantify investors’ risk tolerances, which helps us to identify appropriate market exposures at various ages. The funds all share a low-cost approach, made possible by the primary use of low-cost Schwab exchange-traded funds (ETFs) for the funds’ underlying investments. We believe the funds can help investors achieve their retirement goals by seeking to recognize and reduce risks along the way to retirement and beyond, and
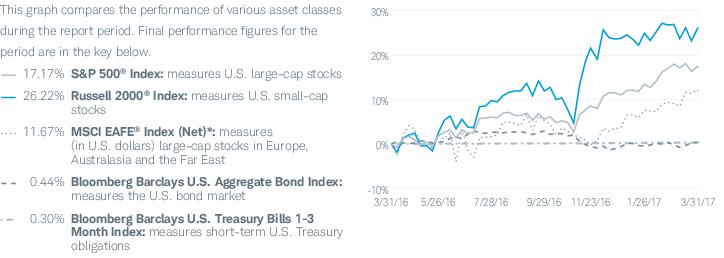
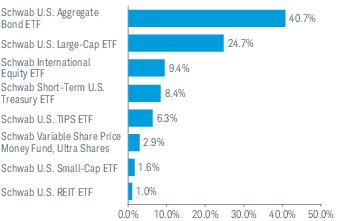
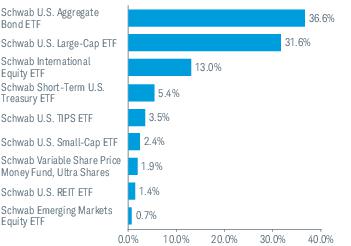
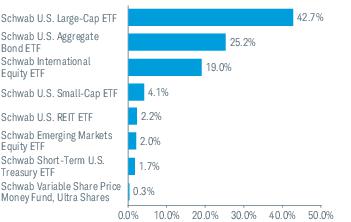
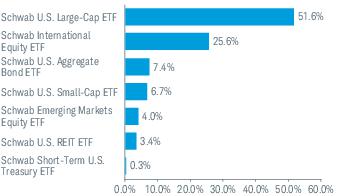
Asset Class Performance Comparison % returns during the 12 months ended 3/31/2017
Index figures assume dividends and distributions were reinvested. Index figures do not include trading and management costs, which would lower performance. Indices are unmanaged and cannot be invested in directly. Past performance is not an indication of future results.
For index definitions, please see the Glossary.
Data source: Index provider websites and CSIM.
Nothing in this report represents a recommendation of a security by the investment adviser.
Management views and portfolio holdings may have changed since the report date.
| * | The net version of the index reflects reinvested dividends net of withholding taxes, but reflects no deductions for expenses or other taxes. |
Schwab Target Index Funds | Annual Report
Schwab Target Index Funds
From the President (continued)
“ For the reporting period of the funds’ inception date of August 25, 2016 through March 31, 2017, the funds’ generated positive returns and tracked their respective indexes.”
we’re pleased that you have chosen the funds to include in your own investment portfolio in pursuit of your financial goals.
At Charles Schwab Investment Management, we also aim to deliver products with consistent performance, and the funds are just one example of our commitment to this goal. For the reporting period of the funds’ inception date of August 25, 2016 through March 31, 2017, the funds’ generated positive returns and tracked their respective indexes. The performance of the funds was marked by strong gains for equities and modest declines for U.S. bonds. Stocks rallied as investors focused on reflating economies around the globe, while bond prices fell in the face of rate hikes from the Federal Reserve and expectations for more in the coming months. In this environment, the longer-dated funds generated higher returns due to their larger allocation to equity ETFs.
Thank you for investing with Charles Schwab Investment Management, and for trusting us to help you achieve your financial goals. For more information about the funds, please continue reading this report. In addition, you can find further details about the funds by visiting our website at www.csimfunds.com. We are also happy to hear from you at 1-877-824-5615.
Sincerely,
Schwab Target Index Funds | Annual Report
Schwab Target Index Funds
The Investment Environment
Over the 12-month reporting period ended March 31, 2017, stock markets generated solid returns while U.S. bond yields rose and returns fell, ending the reporting period in slightly positive territory (bond yields and bond prices move in opposite directions). The Federal Reserve (Fed) raised short-term interest rates twice during the reporting period in December and again in March, while expectations for increased infrastructure spending, tax reform, and reduced regulation from the Trump administration helped fuel a post-election stock market rally. Internationally, concerns lessened around the state of China’s economy and the United Kingdom’s (U.K.) decision to leave the European Union (Brexit), and accommodative monetary policies contributed to improving overall global economic growth. Meanwhile, the U.S. dollar continued to strengthen against many major currencies over the reporting period, including the British pound and Mexican peso, generally reducing returns on investments from these countries in U.S. dollar terms. The S&P 500® Index, a bellwether for the overall U.S. stock market, returned 17.17%, and the MSCI EAFE Index (Net), a broad measure of developed international equity performance, returned 11.67% for the reporting period. In fixed income, the Bloomberg Barclays U.S. Aggregate Bond Index returned 0.44% over the same period.
U.S. short-term interest rates remained low over the reporting period, although the Fed took steps toward a more normalized interest rate environment. With unsteady global economic growth, low inflation, and room for improvement in the labor market, the Fed left the federal funds rate unchanged at each of its meetings through November. Then in December, with progress in several key economic measurements, the Fed raised short-term interest rates for only the second time in 10 years to a target range of 0.50% to 0.75%. As global growth continued to show signs of stability and labor market conditions strengthened, combined with an uptick in inflation, the Fed raised rates again in March by 0.25%. As both of these rate hikes were already priced into global equity markets, the response to these changes was muted. However, the Fed’s moves confirmed its confidence in the health and direction of the U.S. economy.
Outside the U.S., many central banks maintained or stepped up accommodative policy measures to spur economic growth and inflation. The European Central Bank (ECB) left its main interest rate at 0.00% and its deposit rate in negative territory. The ECB also extended its bond purchase program until at least December 2017 and announced it would loosen the restrictions on the types of bonds it can purchase. Meanwhile, facing a weakening growth outlook after Brexit, the Bank of England revived its government bond buying program and cut its main interest rate to an all-time low in August. In Asia, the Bank of Japan (BOJ) maintained its negative interest rate policy and expanded its asset-buying program. With these tools potentially reaching the limits of their effectiveness, the BOJ shifted focus in September and introduced yield curve management as a policy tool, targeting interest rates on government bonds to achieve its inflation goal. Stock markets in Europe and Japan rallied toward the end of the reporting period, suggesting that these monetary policies were beginning to achieve their intended results.
U.S. economic data was largely positive over the reporting period, especially toward the end of 2016 and in early 2017. Wage growth continued to trend upwards, and outside of a sharp drop in May, nonfarm payroll numbers came in near or above expectations. The unemployment rate fell to below 5% in May, and in November, dropped further to the lowest level since before the 2008 financial crisis. Consumer confidence, as measured by the Conference Board Consumer Confidence Index®, also grew over the reporting period, hitting a 16-year high in March amid post-election optimism for U.S. economic growth. Meanwhile, the consumer-price index, a broad measure of inflation, moved above 2% in early 2017 for the first time in over two years.
Most markets steadied over the reporting period, despite brief periods of volatility tied in part to political developments around the globe. The results of the Brexit referendum triggered a global stock selloff and sent the price of oil sharply downward, while the British pound depreciated significantly versus the U.S. dollar. Most markets stabilized in the days and weeks that followed, and concerns surrounding the future of the U.K. lessened in early 2017 as a feasible exit plan began to take shape. Meanwhile, U.S. election-related volatility picked up in the middle of the reporting period and through Election Day in early November, when U.S. equity futures dropped sharply soon after the election results were announced. Stock markets rebounded almost immediately the following day, however, and generally maintained an upward trajectory throughout the remainder of the reporting period. Expectations for new policies from the Trump administration supported a positive growth outlook, and contributed to the solid performance of both U.S. and international stock markets over the reporting period.
Schwab Target Index Funds | Annual Report
Schwab Target Index Funds
The Investment Environment (continued)
Global economic growth generally improved over the 12-month reporting period, due in part to accommodative central bank policies and rising oil and commodity prices. Economic activity in the eurozone slowed in the second quarter of 2016 and was flat in the third quarter, but surprisingly robust fourth quarter estimates indicated a turnaround for that region, driven by strong numbers from Germany, Spain, and France. At the same time, the U.K. economy specifically performed better than expected in the months following the Brexit vote with progress toward an exit plan, while the entire eurozone bloc had exited deflation by the end of January 2017. In Japan, economic growth accelerated and consumer prices fell at a slower pace, with inflation on track to hit the target of 2% in the next two years. Generally increasing oil and commodity prices supported a rebound in many oil-exporting emerging markets, including Russia and Brazil. The price of Brent crude oil (a global crude oil benchmark) rose from less than $40 per barrel in April 2016 to over $50 per barrel at the end of March 2017, providing a substantial tailwind for these countries. In China, despite slower economic growth in 2016 than in prior years, concerns lessened around this subdued pace as many economic indicators showed signs of strength toward the end of the reporting period.
Over the 12-month reporting period, U.S. bond yields generally rose but remained relatively low compared to long-term averages. Short-term yields climbed in response to both Fed interest rate increases in December and March. Meanwhile longer-term yields, which are generally influenced by economic growth and inflation expectations, rose after the U.S. presidential election in anticipation of changes in key economic policies. In this environment, the yield on the benchmark 10-year Treasury note began the reporting period at 1.79% and finished at 2.40%. Despite low bond yields in the U.S., negative interest rates and other central bank monetary policies resulted in even lower yields on many international government-backed securities, with some yielding below 0.00%.
Index figures assume dividends and distributions were reinvested. Index figures do not include trading and management costs, which would lower performance. Indices are unmanaged and cannot be invested in directly. Performance results less than one year are not annualized. Past performance is not an indication of future results.
For index definitions, please see the Glossary.
Nothing in this report represents a recommendation of a security by the investment adviser.
Management views may have changed since the report date.
Schwab Target Index Funds | Annual Report
Schwab Target Index Funds
 | Zifan Tang, Ph.D., CFA, Managing Director and Senior Portfolio Manager, leads the portfolio management team and has overall responsibility for all aspects of the management of the funds. She has served as portfolio manager of the funds since their inception. Prior to joining CSIM in 2012, Ms. Tang was a product manager at Thomson Reuters and, from 1997 to 2009, worked as a portfolio manager at Barclays Global Investors, which was subsequently acquired by BlackRock. |
Schwab Target Index Funds | Annual Report
Schwab Target 2010 Index Fund
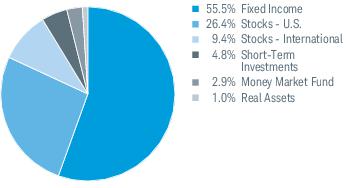
The Schwab Target 2010 Index Fund (the fund) seeks to provide capital appreciation and income consistent with its current asset allocation, and seeks to achieve its investment objective by investing primarily in affiliated Schwab exchange-traded funds (ETFs). The fund may also invest in affiliated Schwab and Laudus mutual funds and unaffiliated third party ETFs and mutual funds. The target asset allocation is adjusted annually based on the adviser’s asset allocation strategy; as of the annual adjustment at the end of January 2017, the fund’s asset allocation was approximately 37.1% equity securities, 55.9% fixed-income securities, and 7.1% cash and cash equivalents (including money market funds).1 (For portfolio allocations as of the end of this reporting period, please see the fund’s Portfolio Holdings included in this report.)
Market Highlights. Over the 12-month period, both international and U.S. equities generated solid returns, while U.S. bond yields rose and returns fell (bond yields and bond prices move in opposite directions). The Federal Reserve (Fed) raised short-term interest rates in both December and March amid steadily improving U.S. economic data and a slight uptick in inflation, and expectations for policy changes from the Trump administration contributed to a post-election stock market rally. Meanwhile, concerns lessened around global economic growth and potential fallout from the United Kingdom’s June vote to leave the European Union. Short-term bond yields rose after both Fed rate hikes, while longer-term yields rose after the U.S. presidential election as economic growth and inflation expectations grew.
Performance. For the period of fund inception (August 25, 2016) through March 31, 2017, the fund’s Investor Shares returned 2.26%. The fund’s internally calculated comparative index, the Target 2010 Passive Composite Index (the composite index), returned 2.37% for the same period.
Positioning and Strategies.2 The fund’s asset allocations were generally in line with those of the composite index over the reporting period.
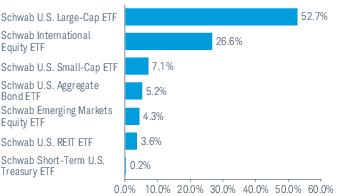
The fund’s fixed-income allocation detracted from the fund’s total return over the reporting period. The fund’s intermediate-term bond holding, the Schwab U.S. Aggregate Bond ETF™, was the largest detractor from the fund’s total return. The Schwab U.S. Aggregate Bond ETF returned approximately -2.3%, while the Bloomberg Barclays U.S. Aggregate Bond Index, the composite index’s underlying intermediate-term bond component, returned -2.2% for the same period. The fund’s U.S. TIPS exposure, the Schwab US TIPS ETF™, also detracted from the total return of the fund, returning approximately -1% over the reporting period.
The fund’s real estate allocation was a small detractor from the fund’s total return and return relative to the composite index. The Schwab U.S. REIT ETF™ returned approximately -5.0% for the reporting period, slightly underperforming its comparative index, the Dow Jones U.S. Select REIT Index, which returned -4.8%.
The fund’s equity exposures provided the greatest contribution to total return, particularly from the fund’s U.S. large cap holding. The top contributor to the total return of the fund was the Schwab U.S. Large-Cap ETF™, which returned approximately 10.2% for the reporting period. The Schwab International Equity ETF™ also contributed notably. The Schwab International Equity ETF returned approximately 7.1%, slightly outperforming the composite index’s international equity component, the FTSE Developed ex US Index (Net), which returned 6.9% for the same period. The Schwab U.S. Small-Cap ETF™ also contributed to the fund’s total return, but detracted from the fund’s relative performance, as it slightly underperformed the composite index’s U.S. small cap component, the Dow Jones U.S. Small-Cap Total Stock Market Index.
Management views may have changed since the report date.
| 1 | Percentages may not equal 100% due to rounding. |
| 2 | ETF performance can be expressed on a market price or NAV basis. The returns cited in this section are Market Price Returns. The ETF’s per share NAV is the value of one share of the ETF. NAV is calculated by taking the ETF’s total assets (including the market value of securities owned), subtracting liabilities, and dividing by the number of shares outstanding. The NAV Return is based on the NAV of the ETF, and the Market Price Return is based on the market price per share of the ETF. The price used to calculate market return (Market Price) is determined by using the midpoint between the highest bid and the lowest offer on the primary stock exchange on which the shares of the ETF are listed for trading, as of the time that the ETF’s NAV is calculated. NAV is used as a proxy for purposes of calculating Market Price Return on inception date. Market Price and NAV returns assume that dividends and capital gain distributions have been reinvested in the ETF at Market Price and NAV, respectively. |
Schwab Target Index Funds | Annual Report
Schwab Target 2010 Index Fund
Performance and Fund Facts as of 3/31/17
The performance data quoted represents past performance. Past performance does not guarantee future results. Investment returns and principal value of an investment will fluctuate so that an investor’s shares may be worth more or less than their original cost. Current performance may be lower or higher than performance data quoted. To obtain performance information current to the most recent month end, please visit www.csimfunds.com.
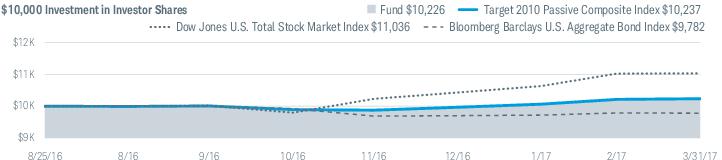
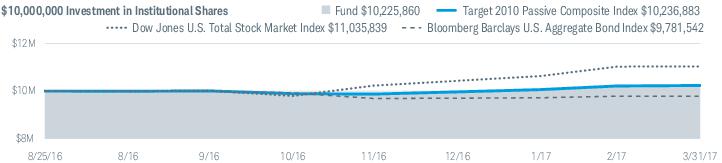
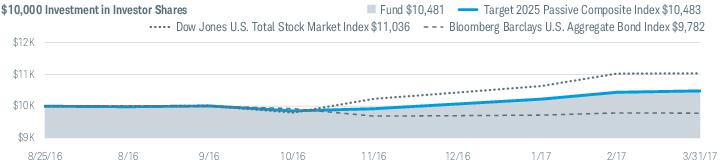
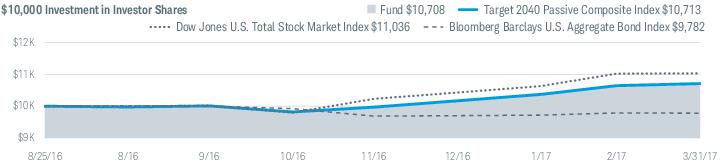
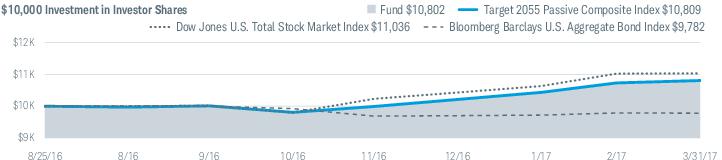
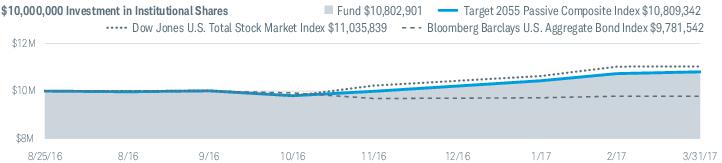
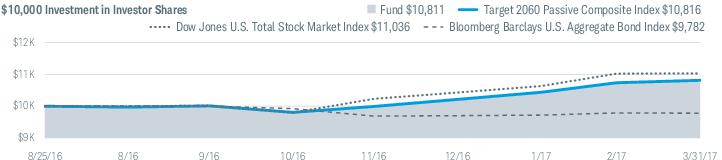
Performance of Hypothetical Investment (August 25, 2016 – March 31, 2017)1
| 1 | Fund expenses may have been partially absorbed by CSIM and its affiliates. Without these reductions, the fund's returns would have been lower. These returns do not reflect the deduction of taxes that a shareholder would pay on fund distributions or the redemption of fund shares. |
Schwab Target Index Funds | Annual Report
Schwab Target 2010 Index Fund
Performance and Fund Facts as of 3/31/17 (continued)
| Class and Inception Date | Since Inception |
| Investor Shares (8/25/16) | 2.26% |
| Institutional Shares (8/25/16) | 2.26% |
| Target 2010 Passive Composite Index | 2.37% |
| Dow Jones U.S. Total Stock Market IndexSM | 10.36% |
| Bloomberg Barclays U.S. Aggregate Bond Index | -2.18% |
| Fund Category: Morningstar Target-Date 2000-20102 | 2.72% |
| Fund Expense Ratios3: Investor Shares: Net 0.13%; Gross 0.19% / Institutional Shares: Net 0.08%; Gross 0.14% |
All total returns on this page assume dividends and distributions were reinvested. Index figures do not include trading and management costs, which would lower performance. Indexes are unmanaged and cannot be invested in directly. Performance results less than one year are not annualized.
For index definitions, please see the Glossary.
| 1 | Fund expenses may have been partially absorbed by CSIM and its affiliates. Without these reductions, the fund's returns would have been lower. These returns do not reflect the deduction of taxes that a shareholder would pay on fund distributions or the redemption of fund shares. |
| 2 | Source for category information: Morningstar, Inc. The Morningstar Category return represents all active and index mutual funds within the category as of the report date. |
| 3 | As stated in the prospectus. Includes expenses of the underlying funds in which the fund invests. The annualized weighted average expense ratio of the underlying funds was 0.06%. Net Expense: Expenses reduced by a contractual fee waiver in effect for so long as CSIM serves as the investment adviser to the fund. Gross Expense: Does not reflect the effect of contractual fee waivers. For actual ratios during the period, refer to the financial highlights section of the financial statements. |
Schwab Target Index Funds | Annual Report
Schwab Target 2010 Index Fund
Performance and Fund Facts as of 3/31/17 (continued)
| Number of Holdings | 10 |
| Portfolio Turnover Rate | 2% |
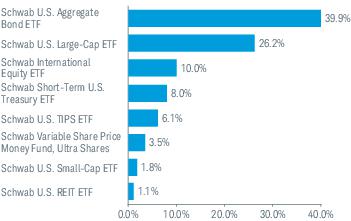
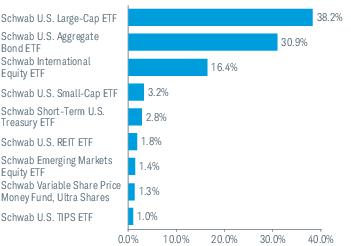
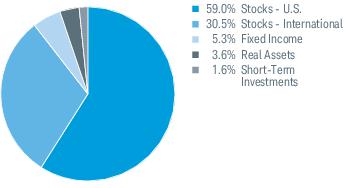
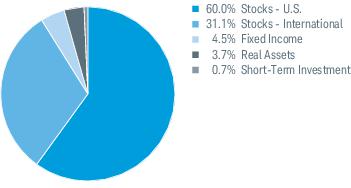
Asset Class Weightings % of Investments1
Top Holdings % of Net Assets2,3
Portfolio holdings may have changed since the report date.
| 1 | The fund intends to primarily invest in affiliated Schwab ETFs and may also invest in affiliated Schwab and Laudus mutual funds and unaffiliated third party ETFs and mutual funds (all such ETFs and mutual funds referred to as "underlying funds"). |
| 2 | This list is not a recommendation of any security by the investment adviser. |
| 3 | The holdings listed exclude any temporary liquidity investments. |
Schwab Target Index Funds | Annual Report
Schwab Target 2015 Index Fund
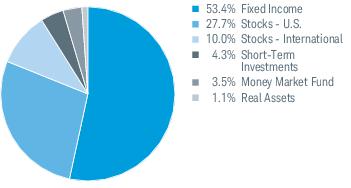
The Schwab Target 2015 Index Fund (the fund) seeks to provide capital appreciation and income consistent with its current asset allocation, and seeks to achieve its investment objective by investing primarily in affiliated Schwab exchange-traded funds (ETFs). The fund may also invest in affiliated Schwab and Laudus mutual funds and unaffiliated third party ETFs and mutual funds. The target asset allocation is adjusted annually based on the adviser’s asset allocation strategy; as of the annual adjustment at the end of January 2017, the fund’s asset allocation was approximately 39.3% equity securities, 54.0% fixed-income securities, and 6.7% cash and cash equivalents (including money market funds). (For portfolio allocations as of the end of this reporting period, please see the fund’s Portfolio Holdings included in this report.)
Market Highlights. Over the 12-month period, both international and U.S. equities generated solid returns, while U.S. bond yields rose and returns fell (bond yields and bond prices move in opposite directions). The Federal Reserve (Fed) raised short-term interest rates in both December and March amid steadily improving U.S. economic data and a slight uptick in inflation, and expectations for policy changes from the Trump administration contributed to a post-election stock market rally. Meanwhile, concerns lessened around global economic growth and potential fallout from the United Kingdom’s June vote to leave the European Union. Short-term bond yields rose after both Fed rate hikes, while longer-term yields rose after the U.S. presidential election as economic growth and inflation expectations grew.
Performance. For the period of fund inception (August 25, 2016) through March 31, 2017, the fund’s Investor Shares returned 2.48%. The fund’s internally calculated comparative index, the Target 2015 Passive Composite Index (the composite index), returned 2.58% for the same period.
Positioning and Strategies.1 The fund’s asset allocations were broadly in line with those of the composite index over the reporting period.
The fund’s fixed-income allocation detracted from the fund’s total return over the reporting period. The fund’s intermediate-term bond holding, the Schwab U.S. Aggregate Bond ETF™, was the largest detractor from the fund’s total return. The Schwab U.S. Aggregate Bond ETF returned approximately -2.3%, while the Bloomberg Barclays U.S. Aggregate Bond Index, the composite index’s underlying intermediate-term bond component, returned -2.2% for the same period. The fund’s U.S. TIPS exposure, the Schwab US TIPS ETF™, also detracted from the total return of the fund, returning approximately -1% over the reporting period.
The fund’s real estate allocation was a small detractor from the fund’s total return and return relative to the composite index. The Schwab U.S. REIT ETF™ returned approximately -5.0% for the reporting period, slightly underperforming its comparative index, the Dow Jones U.S. Select REIT Index, which returned -4.8%.
The fund’s equity exposures provided the greatest contribution to total return, particularly from the fund’s U.S. large cap holding. The top contributor to the total return of the fund was the Schwab U.S. Large-Cap ETF™, which returned approximately 10.2% for the reporting period. The Schwab International Equity ETF™ also contributed notably. The Schwab International Equity ETF returned approximately 7.1%, slightly outperforming the composite index’s international equity component, the FTSE Developed ex US Index (Net), which returned 6.9% for the same period. The Schwab U.S. Small-Cap ETF™ also contributed to the fund’s total return, but detracted from the fund’s relative performance, as it slightly underperformed the composite index’s U.S. small cap component, the Dow Jones U.S. Small-Cap Total Stock Market Index.
Management views may have changed since the report date.
| 1 | ETF performance can be expressed on a market price or NAV basis. The returns cited in this section are Market Price Returns. The ETF’s per share NAV is the value of one share of the ETF. NAV is calculated by taking the ETF’s total assets (including the market value of securities owned), subtracting liabilities, and dividing by the number of shares outstanding. The NAV Return is based on the NAV of the ETF, and the Market Price Return is based on the market price per share of the ETF. The price used to calculate market return (Market Price) is determined by using the midpoint between the highest bid and the lowest offer on the primary stock exchange on which the shares of the ETF are listed for trading, as of the time that the ETF’s NAV is calculated. NAV is used as a proxy for purposes of calculating Market Price Return on inception date. Market Price and NAV returns assume that dividends and capital gain distributions have been reinvested in the ETF at Market Price and NAV, respectively. |
Schwab Target Index Funds | Annual Report
Schwab Target 2015 Index Fund
Performance and Fund Facts as of 3/31/17
The performance data quoted represents past performance. Past performance does not guarantee future results. Investment returns and principal value of an investment will fluctuate so that an investor’s shares may be worth more or less than their original cost. Current performance may be lower or higher than performance data quoted. To obtain performance information current to the most recent month end, please visit www.csimfunds.com.
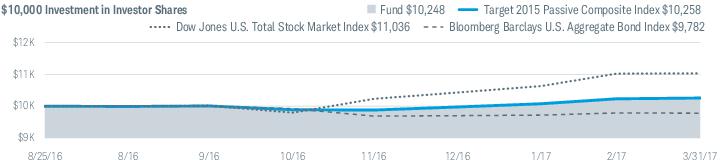
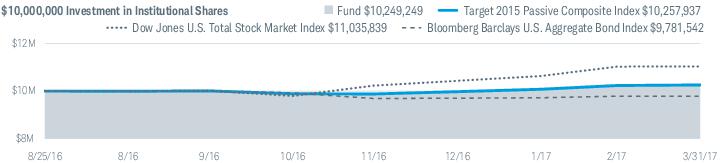
Performance of Hypothetical Investment (August 25, 2016 – March 31, 2017)1
| 1 | Fund expenses may have been partially absorbed by CSIM and its affiliates. Without these reductions, the fund's returns would have been lower. These returns do not reflect the deduction of taxes that a shareholder would pay on fund distributions or the redemption of fund shares. |
Schwab Target Index Funds | Annual Report
Schwab Target 2015 Index Fund
Performance and Fund Facts as of 3/31/17 (continued)
| Class and Inception Date | Since Inception |
| Investor Shares (8/25/16) | 2.48% 2 |
| Institutional Shares (8/25/16) | 2.49% |
| Target 2015 Passive Composite Index | 2.58% |
| Dow Jones U.S. Total Stock Market IndexSM | 10.36% |
| Bloomberg Barclays U.S. Aggregate Bond Index | -2.18% |
| Fund Category: Morningstar Target-Date 20153 | 3.22% |
| Fund Expense Ratios4: Investor Shares: Net 0.13%; Gross 0.19% / Institutional Shares: Net 0.08%; Gross 0.14% |
All total returns on this page assume dividends and distributions were reinvested. Index figures do not include trading and management costs, which would lower performance. Indexes are unmanaged and cannot be invested in directly. Performance results less than one year are not annualized.
For index definitions, please see the Glossary.
| 1 | Fund expenses may have been partially absorbed by CSIM and its affiliates. Without these reductions, the fund's returns would have been lower. These returns do not reflect the deduction of taxes that a shareholder would pay on fund distributions or the redemption of fund shares. |
| 2 | Total return for the report period presented in the table differs from the return in the Financial Highlights. The total return presented in the above table is calculated based on the net asset value (NAV) at which shareholder transactions were processed. The total return presented in the Financial Highlights section of the report is calculated in the same manner, but also takes into account certain adjustments that are necessary under generally accepted accounting principles required in the annual and semiannual reports. |
| 3 | Source for category information: Morningstar, Inc. The Morningstar Category return represents all active and index mutual funds within the category as of the report date. |
| 4 | As stated in the prospectus. Includes expenses of the underlying funds in which the fund invests. The annualized weighted average expense ratio of the underlying funds was 0.06%. Net Expense: Expenses reduced by a contractual fee waiver in effect for so long as CSIM serves as the investment adviser to the fund. Gross Expense: Does not reflect the effect of contractual fee waivers. For actual ratios during the period, refer to the financial highlights section of the financial statements. |
Schwab Target Index Funds | Annual Report
Schwab Target 2015 Index Fund
Performance and Fund Facts as of 3/31/17 (continued)
| Number of Holdings | 10 |
| Portfolio Turnover Rate | 15% |
Asset Class Weightings % of Investments1
Top Holdings % of Net Assets2,3
Portfolio holdings may have changed since the report date.
| 1 | The fund intends to primarily invest in affiliated Schwab ETFs and may also invest in affiliated Schwab and Laudus mutual funds and unaffiliated third party ETFs and mutual funds (all such ETFs and mutual funds referred to as "underlying funds"). |
| 2 | This list is not a recommendation of any security by the investment adviser. |
| 3 | The holdings listed exclude any temporary liquidity investments. |
Schwab Target Index Funds | Annual Report
Schwab Target 2020 Index Fund
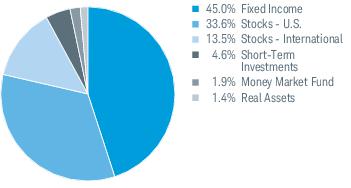
The Schwab Target 2020 Index Fund (the fund) seeks to provide capital appreciation and income consistent with its current asset allocation, and seeks to achieve its investment objective by investing primarily in affiliated Schwab exchange-traded funds (ETFs). The fund may also invest in affiliated Schwab and Laudus mutual funds and unaffiliated third party ETFs and mutual funds. The target asset allocation is adjusted annually based on the adviser’s asset allocation strategy; as of the annual adjustment at the end of January 2017, the fund’s asset allocation was approximately 49.2% equity securities, 45.4% fixed-income securities, and 5.4% cash and cash equivalents (including money market funds). (For portfolio allocations as of the end of this reporting period, please see the fund’s Portfolio Holdings included in this report.)
Market Highlights. Over the 12-month period, both international and U.S. equities generated solid returns, while U.S. bond yields rose and returns fell (bond yields and bond prices move in opposite directions). The Federal Reserve (Fed) raised short-term interest rates in both December and March amid steadily improving U.S. economic data and a slight uptick in inflation, and expectations for policy changes from the Trump administration contributed to a post-election stock market rally. Meanwhile, concerns lessened around global economic growth and potential fallout from the United Kingdom’s June vote to leave the European Union. Short-term bond yields rose after both Fed rate hikes, while longer-term yields rose after the U.S. presidential election as economic growth and inflation expectations grew.
Performance. For the period of fund inception (August 25, 2016) through March 31, 2017, the fund’s Investor Shares returned 3.59%. The fund’s internally calculated comparative index, the Target 2020 Passive Composite Index (the composite index), returned 3.68% for the same period.
Positioning and Strategies.1 The fund’s asset allocations were generally in line with those of the composite index over the reporting period.
The fund’s fixed-income allocation detracted from the fund’s total return over the reporting period. The fund’s intermediate-term bond holding, the Schwab U.S. Aggregate Bond ETF™, was the largest detractor from the fund’s total return. The Schwab U.S. Aggregate Bond ETF returned approximately -2.3%, while the Bloomberg Barclays U.S. Aggregate Bond Index, the composite index’s underlying intermediate-term bond component, returned -2.2% for the same period. The fund’s U.S. TIPS exposure, the Schwab US TIPS ETF™, also detracted from the total return of the fund, returning approximately -1% over the reporting period.
The fund’s real estate allocation was another detractor from the fund’s total return and return relative to the composite index. The Schwab U.S. REIT ETF™ returned approximately -5.0% for the reporting period, slightly underperforming its comparative index, the Dow Jones U.S. Select REIT Index, which returned -4.8%.
The fund’s equity exposures provided the greatest contribution to total return, particularly from the fund’s U.S. large cap holding. The top contributor to the total return of the fund was the Schwab U.S. Large-Cap ETF™, which returned approximately 10.2% for the reporting period. The Schwab International Equity ETF™ also contributed notably. The Schwab International Equity ETF returned approximately 7.1%, slightly outperforming the composite index’s international equity component, the FTSE Developed ex US Index (Net), which returned 6.9% for the same period. The Schwab Emerging Markets Equity ETF™ also contributed to the fund’s total return and return relative to the index, as it slightly outperformed the composite index’s emerging markets component, the FTSE Emerging Index (Net). The fund’s U.S. small cap holding, the Schwab US Small-Cap ETF™, contributed to the fund’s total return, but detracted from return relative to the composite index.
Management views may have changed since the report date.
| 1 | ETF performance can be expressed on a market price or NAV basis. The returns cited in this section are Market Price Returns. The ETF’s per share NAV is the value of one share of the ETF. NAV is calculated by taking the ETF’s total assets (including the market value of securities owned), subtracting liabilities, and dividing by the number of shares outstanding. The NAV Return is based on the NAV of the ETF, and the Market Price Return is based on the market price per share of the ETF. The price used to calculate market return (Market Price) is determined by using the midpoint between the highest bid and the lowest offer on the primary stock exchange on which the shares of the ETF are listed for trading, as of the time that the ETF’s NAV is calculated. NAV is used as a proxy for purposes of calculating Market Price Return on inception date. Market Price and NAV returns assume that dividends and capital gain distributions have been reinvested in the ETF at Market Price and NAV, respectively. |
Schwab Target Index Funds | Annual Report
Schwab Target 2020 Index Fund
Performance and Fund Facts as of 3/31/17
The performance data quoted represents past performance. Past performance does not guarantee future results. Investment returns and principal value of an investment will fluctuate so that an investor’s shares may be worth more or less than their original cost. Current performance may be lower or higher than performance data quoted. To obtain performance information current to the most recent month end, please visit www.csimfunds.com.
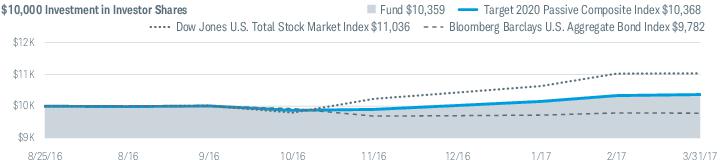
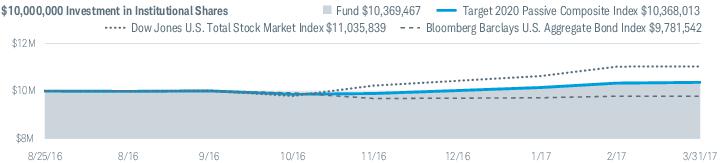
Performance of Hypothetical Investment (August 25, 2016 – March 31, 2017)1
| 1 | Fund expenses may have been partially absorbed by CSIM and its affiliates. Without these reductions, the fund's returns would have been lower. These returns do not reflect the deduction of taxes that a shareholder would pay on fund distributions or the redemption of fund shares. |
Schwab Target Index Funds | Annual Report
Schwab Target 2020 Index Fund
Performance and Fund Facts as of 3/31/17 (continued)
| Class and Inception Date | Since Inception |
| Investor Shares (8/25/16) | 3.59% |
| Institutional Shares (8/25/16) | 3.69% |
| Target 2020 Passive Composite Index | 3.68% |
| Dow Jones U.S. Total Stock Market IndexSM | 10.36% |
| Bloomberg Barclays U.S. Aggregate Bond Index | -2.18% |
| Fund Category: Morningstar Target-Date 20202 | 3.46% |
| Fund Expense Ratios3: Investor Shares: Net 0.13%; Gross 0.19% / Institutional Shares: Net 0.08%; Gross 0.14% |
All total returns on this page assume dividends and distributions were reinvested. Index figures do not include trading and management costs, which would lower performance. Indexes are unmanaged and cannot be invested in directly. Performance results less than one year are not annualized.
For index definitions, please see the Glossary.
| 1 | Fund expenses may have been partially absorbed by CSIM and its affiliates. Without these reductions, the fund's returns would have been lower. These returns do not reflect the deduction of taxes that a shareholder would pay on fund distributions or the redemption of fund shares. |
| 2 | Source for category information: Morningstar, Inc. The Morningstar Category return represents all active and index mutual funds within the category as of the report date. |
| 3 | As stated in the prospectus. Includes expenses of the underlying funds in which the fund invests. The annualized weighted average expense ratio of the underlying funds was 0.06%. Net Expense: Expenses reduced by a contractual fee waiver in effect for so long as CSIM serves as the investment adviser to the fund. Gross Expense: Does not reflect the effect of contractual fee waivers. For actual ratios during the period, refer to the financial highlights section of the financial statements. |
Schwab Target Index Funds | Annual Report
Schwab Target 2020 Index Fund
Performance and Fund Facts as of 3/31/17 (continued)
| Number of Holdings | 15 |
| Portfolio Turnover Rate | 17% |
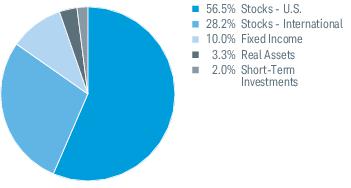
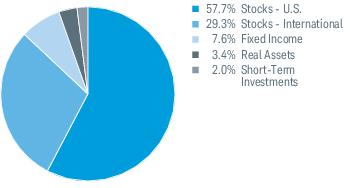
Asset Class Weightings % of Investments1
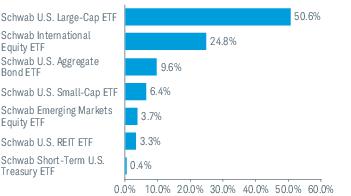
Top Holdings % of Net Assets2,3
Portfolio holdings may have changed since the report date.
| 1 | The fund intends to primarily invest in affiliated Schwab ETFs and may also invest in affiliated Schwab and Laudus mutual funds and unaffiliated third party ETFs and mutual funds (all such ETFs and mutual funds referred to as "underlying funds"). |
| 2 | This list is not a recommendation of any security by the investment adviser. |
| 3 | The holdings listed exclude any temporary liquidity investments. |
Schwab Target Index Funds | Annual Report
Schwab Target 2025 Index Fund
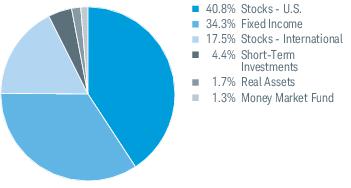
The Schwab Target 2025 Index Fund (the fund) seeks to provide capital appreciation and income consistent with its current asset allocation, and seeks to achieve its investment objective by investing primarily in affiliated Schwab exchange-traded funds (ETFs). The fund may also invest in affiliated Schwab and Laudus mutual funds and unaffiliated third party ETFs and mutual funds. The target asset allocation is adjusted annually based on the adviser’s asset allocation strategy; as of the annual adjustment at the end of January 2017, the fund’s asset allocation was approximately 61.2% equity securities, 34.9% fixed-income securities, and 3.9% cash and cash equivalents (including money market funds). (For portfolio allocations as of the end of this reporting period, please see the fund’s Portfolio Holdings included in this report.)
Market Highlights. Over the 12-month period, both international and U.S. equities generated solid returns, while U.S. bond yields rose and returns fell (bond yields and bond prices move in opposite directions). The Federal Reserve (Fed) raised short-term interest rates in both December and March amid steadily improving U.S. economic data and a slight uptick in inflation, and expectations for policy changes from the Trump administration contributed to a post-election stock market rally. Meanwhile, concerns lessened around global economic growth and potential fallout from the United Kingdom’s June vote to leave the European Union. Short-term bond yields rose after both Fed rate hikes, while longer-term yields rose after the U.S. presidential election as economic growth and inflation expectations grew.
Performance. For the period of fund inception (August 25, 2016) through March 31, 2017, the fund’s Investor Shares returned 4.81%. The fund’s internally calculated comparative index, the Target 2025 Passive Composite Index (the composite index), returned 4.83% for the same period.
Positioning and Strategies.1 The fund’s asset allocations were generally in line with those of the composite index over the reporting period.
The fund’s fixed-income allocation detracted from the fund’s total return over the reporting period. The fund’s intermediate-term bond holding, the Schwab U.S. Aggregate Bond ETF™, was the largest detractor from the fund’s total return. The Schwab U.S. Aggregate Bond ETF returned approximately -2.3%, while the Bloomberg Barclays U.S. Aggregate Bond Index, the composite index’s underlying intermediate-term bond component, returned -2.2% for the same period. The fund’s other fixed-income allocations, the Schwab Short-Term U.S. Treasury ETF™ and Schwab U.S. TIPS ETF™, slightly detracted from the fund’s relative return, as these holdings underperformed their respective comparative indexes.
The fund’s real estate allocation was another detractor from the fund’s total return and return relative to the composite index. The Schwab U.S. REIT ETF™ returned approximately -5.0% for the reporting period, slightly underperforming its comparative index, the Dow Jones U.S. Select REIT Index, which returned -4.8%.
The fund’s equity exposures provided the greatest contribution to total return, particularly from the fund’s U.S. large cap holding. The top contributor to the total return of the fund was the Schwab U.S. Large-Cap ETF™, which returned approximately 10.2% for the reporting period. The fund’s international equity component, the Schwab International Equity ETF™, also contributed notably. The Schwab International Equity ETF returned approximately 7.1%, slightly outperforming the composite index’s international equity component, the FTSE Developed ex US Index (Net), which returned 6.9% for the same period. The Schwab Emerging Markets Equity ETF™ also contributed to the fund’s total return and return relative to the index, as it slightly outperformed the composite index’s emerging markets component, the FTSE Emerging Index (Net). The fund’s U.S. small cap holding, the Schwab US Small-Cap ETF™, contributed to the fund’s total return, but detracted from return relative to the composite index.
Management views may have changed since the report date.
| 1 | ETF performance can be expressed on a market price or NAV basis. The returns cited in this section are Market Price Returns. The ETF’s per share NAV is the value of one share of the ETF. NAV is calculated by taking the ETF’s total assets (including the market value of securities owned), subtracting liabilities, and dividing by the number of shares outstanding. The NAV Return is based on the NAV of the ETF, and the Market Price Return is based on the market price per share of the ETF. The price used to calculate market return (Market Price) is determined by using the midpoint between the highest bid and the lowest offer on the primary stock exchange on which the shares of the ETF are listed for trading, as of the time that the ETF’s NAV is calculated. NAV is used as a proxy for purposes of calculating Market Price Return on inception date. Market Price and NAV returns assume that dividends and capital gain distributions have been reinvested in the ETF at Market Price and NAV, respectively. |
Schwab Target Index Funds | Annual Report
Schwab Target 2025 Index Fund
Performance and Fund Facts as of 3/31/17
The performance data quoted represents past performance. Past performance does not guarantee future results. Investment returns and principal value of an investment will fluctuate so that an investor’s shares may be worth more or less than their original cost. Current performance may be lower or higher than performance data quoted. To obtain performance information current to the most recent month end, please visit www.csimfunds.com.
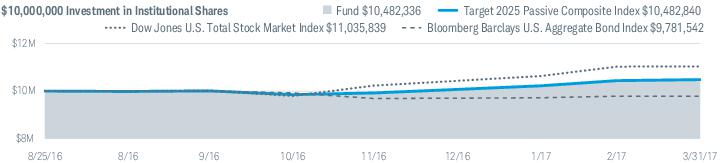
Performance of Hypothetical Investment (August 25, 2016 – March 31, 2017)1
| 1 | Fund expenses may have been partially absorbed by CSIM and its affiliates. Without these reductions, the fund's returns would have been lower. These returns do not reflect the deduction of taxes that a shareholder would pay on fund distributions or the redemption of fund shares. |
Schwab Target Index Funds | Annual Report
Schwab Target 2025 Index Fund
Performance and Fund Facts as of 3/31/17 (continued)
| Class and Inception Date | Since Inception |
| Investor Shares (8/25/16) | 4.81% |
| Institutional Shares (8/25/16) | 4.82% |
| Target 2025 Passive Composite Index | 4.83% |
| Dow Jones U.S. Total Stock Market IndexSM | 10.36% |
| Bloomberg Barclays U.S. Aggregate Bond Index | -2.18% |
| Fund Category: Morningstar Target-Date 20252 | 4.56% |
| Fund Expense Ratios3: Investor Shares: Net 0.13%; Gross 0.19% / Institutional Shares: Net 0.08%; Gross 0.14% |
All total returns on this page assume dividends and distributions were reinvested. Index figures do not include trading and management costs, which would lower performance. Indexes are unmanaged and cannot be invested in directly. Performance results less than one year are not annualized.
For index definitions, please see the Glossary.
| 1 | Fund expenses may have been partially absorbed by CSIM and its affiliates. Without these reductions, the fund's returns would have been lower. These returns do not reflect the deduction of taxes that a shareholder would pay on fund distributions or the redemption of fund shares. |
| 2 | Source for category information: Morningstar, Inc. The Morningstar Category return represents all active and index mutual funds within the category as of the report date. |
| 3 | As stated in the prospectus. Includes expenses of the underlying funds in which the fund invests. The annualized weighted average expense ratio of the underlying funds was 0.06%. Net Expense: Expenses reduced by a contractual fee waiver in effect for so long as CSIM serves as the investment adviser to the fund. Gross Expense: Does not reflect the effect of contractual fee waivers. For actual ratios during the period, refer to the financial highlights section of the financial statements. |
Schwab Target Index Funds | Annual Report
Schwab Target 2025 Index Fund
Performance and Fund Facts as of 3/31/17 (continued)
| Number of Holdings | 14 |
| Portfolio Turnover Rate | 6% |
Asset Class Weightings % of Investments1
Top Holdings % of Net Assets2,3
Portfolio holdings may have changed since the report date.
| 1 | The fund intends to primarily invest in affiliated Schwab ETFs and may also invest in affiliated Schwab and Laudus mutual funds and unaffiliated third party ETFs and mutual funds (all such ETFs and mutual funds referred to as "underlying funds"). |
| 2 | This list is not a recommendation of any security by the investment adviser. |
| 3 | The holdings listed exclude any temporary liquidity investments. |
Schwab Target Index Funds | Annual Report
Schwab Target 2030 Index Fund
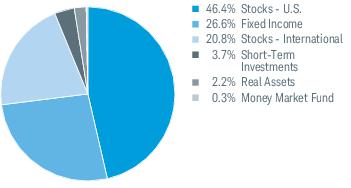
The Schwab Target 2030 Index Fund (the fund) seeks to provide capital appreciation and income consistent with its current asset allocation, and seeks to achieve its investment objective by investing primarily in affiliated Schwab exchange-traded funds (ETFs). The fund may also invest in affiliated Schwab and Laudus mutual funds and unaffiliated third party ETFs and mutual funds. The target asset allocation is adjusted annually based on the adviser’s asset allocation strategy; as of the annual adjustment at the end of January 2017, the fund’s asset allocation was approximately 70.1% equity securities, 26.9% fixed-income securities, and 3.0% cash and cash equivalents (including money market funds). (For portfolio allocations as of the end of this reporting period, please see the fund’s Portfolio Holdings included in this report.)
Market Highlights. Over the 12-month period, both international and U.S. equities generated solid returns, while U.S. bond yields rose and returns fell (bond yields and bond prices move in opposite directions). The Federal Reserve (Fed) raised short-term interest rates in both December and March amid steadily improving U.S. economic data and a slight uptick in inflation, and expectations for policy changes from the Trump administration contributed to a post-election stock market rally. Meanwhile, concerns lessened around global economic growth and potential fallout from the United Kingdom’s June vote to leave the European Union. Short-term bond yields rose after both Fed rate hikes, while longer-term yields rose after the U.S. presidential election as economic growth and inflation expectations grew.
Performance. For the period of fund inception (August 25, 2016) through March 31, 2017, the fund’s Investor Shares returned 5.66%. The fund’s internally calculated comparative index, the Target 2030 Passive Composite Index (the composite index), returned 5.70% for the same period.
Positioning and Strategies.1 The fund’s asset allocations were generally in line with those of the composite index over the reporting period.
The fund’s fixed-income allocation detracted from the fund’s total return over the reporting period, and return relative to the composite index. The fund’s intermediate-term bond holding, the Schwab U.S. Aggregate Bond ETF™, was the largest detractor from the fund’s total return. The Schwab U.S. Aggregate Bond ETF returned approximately -2.3%, while the Bloomberg Barclays U.S. Aggregate Bond Index, the composite index’s underlying intermediate-term bond component, returned -2.2% for the same period. The fund’s other fixed-income allocation, the Schwab Short-Term U.S. Treasury ETF™, detracted from the fund’s relative return, as the Schwab Short-Term U.S. Treasury ETF also underperformed its comparative index, the Bloomberg Barclays U.S. 1-3 Year Treasury Bond Index.
The fund’s real estate allocation was another detractor from the fund’s total return and return relative to the composite index. The Schwab U.S. REIT ETF™ returned approximately -5.0% for the reporting period, slightly underperforming its comparative index, the Dow Jones U.S. Select REIT Index, which returned -4.8%.
The fund’s equity exposures provided the greatest contribution to total return, particularly from the fund’s U.S. large cap holding. The top contributor to the total return of the fund was the Schwab U.S. Large-Cap ETF™, which returned approximately 10.2% for the reporting period. The fund’s international equity component, the Schwab International Equity ETF™, also contributed notably to both total return and return relative to the composite index. The Schwab International Equity ETF returned approximately 7.1%, slightly outperforming the composite index’s international equity component, the FTSE Developed ex US Index (Net), which returned 6.9% for the same period. The Schwab Emerging Markets Equity ETF™ also contributed to the fund’s total return and relative return, as it slightly outperformed the composite index’s emerging markets component, the FTSE Emerging Index (Net). The fund’s U.S. small cap holding, the Schwab US Small-Cap ETF™, contributed to the fund’s total return, but detracted from return relative to the composite index.
Management views may have changed since the report date.
| 1 | ETF performance can be expressed on a market price or NAV basis. The returns cited in this section are Market Price Returns. The ETF’s per share NAV is the value of one share of the ETF. NAV is calculated by taking the ETF’s total assets (including the market value of securities owned), subtracting liabilities, and dividing by the number of shares outstanding. The NAV Return is based on the NAV of the ETF, and the Market Price Return is based on the market price per share of the ETF. The price used to calculate market return (Market Price) is determined by using the midpoint between the highest bid and the lowest offer on the primary stock exchange on which the shares of the ETF are listed for trading, as of the time that the ETF’s NAV is calculated. NAV is used as a proxy for purposes of calculating Market Price Return on inception date. Market Price and NAV returns assume that dividends and capital gain distributions have been reinvested in the ETF at Market Price and NAV, respectively. |
Schwab Target Index Funds | Annual Report
Schwab Target 2030 Index Fund
Performance and Fund Facts as of 3/31/17
The performance data quoted represents past performance. Past performance does not guarantee future results. Investment returns and principal value of an investment will fluctuate so that an investor’s shares may be worth more or less than their original cost. Current performance may be lower or higher than performance data quoted. To obtain performance information current to the most recent month end, please visit www.csimfunds.com.
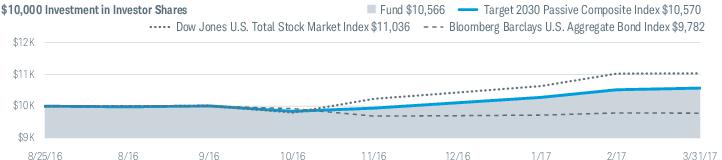
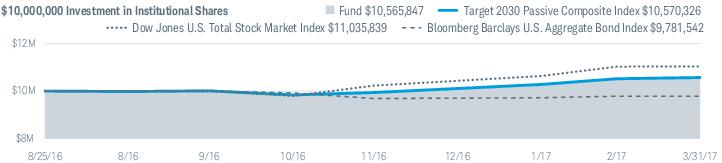
Performance of Hypothetical Investment (August 25, 2016 – March 31, 2017)1
| 1 | Fund expenses may have been partially absorbed by CSIM and its affiliates. Without these reductions, the fund's returns would have been lower. These returns do not reflect the deduction of taxes that a shareholder would pay on fund distributions or the redemption of fund shares. |
Schwab Target Index Funds | Annual Report
Schwab Target 2030 Index Fund
Performance and Fund Facts as of 3/31/17 (continued)
| Class and Inception Date | Since Inception |
| Investor Shares (8/25/16) | 5.66% |
| Institutional Shares (8/25/16) | 5.66% |
| Target 2030 Passive Composite Index | 5.70% |
| Dow Jones U.S. Total Stock Market IndexSM | 10.36% |
| Bloomberg Barclays U.S. Aggregate Bond Index | -2.18% |
| Fund Category: Morningstar Target-Date 20302 | 5.44% |
| Fund Expense Ratios3: Investor Shares: Net 0.13%; Gross 0.19% / Institutional Shares: Net 0.08%; Gross 0.14% |
All total returns on this page assume dividends and distributions were reinvested. Index figures do not include trading and management costs, which would lower performance. Indexes are unmanaged and cannot be invested in directly. Performance results less than one year are not annualized.
For index definitions, please see the Glossary.
| 1 | Fund expenses may have been partially absorbed by CSIM and its affiliates. Without these reductions, the fund's returns would have been lower. These returns do not reflect the deduction of taxes that a shareholder would pay on fund distributions or the redemption of fund shares. |
| 2 | Source for category information: Morningstar, Inc. The Morningstar Category return represents all active and index mutual funds within the category as of the report date. |
| 3 | As stated in the prospectus. Includes expenses of the underlying funds in which the fund invests. The annualized weighted average expense ratio of the underlying funds was 0.06%. Net Expense: Expenses reduced by a contractual fee waiver in effect for so long as CSIM serves as the investment adviser to the fund. Gross Expense: Does not reflect the effect of contractual fee waivers. For actual ratios during the period, refer to the financial highlights section of the financial statements. |
Schwab Target Index Funds | Annual Report
Schwab Target 2030 Index Fund
Performance and Fund Facts as of 3/31/17 (continued)
| Number of Holdings | 12 |
| Portfolio Turnover Rate | 7% |
Asset Class Weightings % of Investments1
Top Holdings % of Net Assets2,3
Portfolio holdings may have changed since the report date.
| 1 | The fund intends to primarily invest in affiliated Schwab ETFs and may also invest in affiliated Schwab and Laudus mutual funds and unaffiliated third party ETFs and mutual funds (all such ETFs and mutual funds referred to as "underlying funds"). |
| 2 | This list is not a recommendation of any security by the investment adviser. |
| 3 | The holdings listed exclude any temporary liquidity investments. |
Schwab Target Index Funds | Annual Report
Schwab Target 2035 Index Fund
The Schwab Target 2035 Index Fund (the fund) seeks to provide capital appreciation and income consistent with its current asset allocation, and seeks to achieve its investment objective by investing primarily in affiliated Schwab exchange-traded funds (ETFs). The fund may also invest in affiliated Schwab and Laudus mutual funds and unaffiliated third party ETFs and mutual funds. The target asset allocation is adjusted annually based on the adviser’s asset allocation strategy; as of the annual adjustment at the end of January 2017, the fund’s asset allocation was approximately 77.4% equity securities, 20.3% fixed income securities, and 2.3% cash and cash equivalents (including money market funds). (For portfolio allocations as of the end of this reporting period, please see the fund’s Portfolio Holdings included in this report.)
Market Highlights. Over the 12-month period, both international and U.S. equities generated solid returns, while U.S. bond yields rose and returns fell (bond yields and bond prices move in opposite directions). The Federal Reserve (Fed) raised short-term interest rates in both December and March amid steadily improving U.S. economic data and a slight uptick in inflation, and expectations for policy changes from the Trump administration contributed to a post-election stock market rally. Meanwhile, concerns lessened around global economic growth and potential fallout from the United Kingdom’s June vote to leave the European Union. Short-term bond yields rose after both Fed rate hikes, while longer-term yields rose after the U.S. presidential election as economic growth and inflation expectations grew.
Performance. For the reporting period of fund inception (August 25, 2016) through March 31, 2017, the fund’s Investor Shares returned 6.33%. The fund’s internally calculated comparative index, the Target 2035 Passive Composite Index (the composite index), returned 6.44% for the same period.
Positioning and Strategies.1 The fund’s asset allocations were generally in line with those of the composite index over the reporting period.
The fund’s fixed-income allocation detracted from the fund’s total return over the reporting period, and return relative to the composite index. The fund’s intermediate-term bond holding, the Schwab U.S. Aggregate Bond ETF™, was the largest detractor from the fund’s total return. The Schwab U.S. Aggregate Bond ETF returned approximately -2.3%, while the Bloomberg Barclays U.S. Aggregate Bond Index, the composite index’s underlying intermediate-term bond component, returned -2.2% for the same period. The fund’s other fixed-income allocation, the Schwab Short-Term U.S. Treasury ETF™, detracted from the fund’s relative return, as the Schwab Short-Term U.S. Treasury ETF also underperformed its comparative index, the Bloomberg Barclays U.S. 1-3 Year Treasury Bond Index.
The fund’s real estate allocation was another detractor from the fund’s total return and return relative to the composite index. The Schwab U.S. REIT ETF™ returned approximately -5.0% for the reporting period, slightly underperforming its comparative index, the Dow Jones U.S. Select REIT Index, which returned -4.8%.
The fund’s equity exposures provided the greatest contribution to total return, particularly from the fund’s U.S. large cap holding. The top contributor to the total return of the fund was the Schwab U.S. Large-Cap ETF™, which returned approximately 10.2% for the reporting period. The fund’s international equity component, the Schwab International Equity ETF™, also contributed notably to both total return and return relative to the composite index. The Schwab International Equity ETF returned approximately 7.1%, slightly outperforming the composite index’s international equity component, the FTSE Developed ex US Index (Net), which returned 6.9% for the same period. The Schwab Emerging Markets Equity ETF™ also contributed to the fund’s total return and relative return, as it slightly outperformed the composite index’s emerging markets component, the FTSE Emerging Index (Net). The fund’s U.S. small cap holding, the Schwab US Small-Cap ETF™, contributed to the fund’s total return, but detracted from return relative to the composite index.
Management views may have changed since the report date.
| 1 | ETF performance can be expressed on a market price or NAV basis. The returns cited in this section are Market Price Returns. The ETF’s per share NAV is the value of one share of the ETF. NAV is calculated by taking the ETF’s total assets (including the market value of securities owned), subtracting liabilities, and dividing by the number of shares outstanding. The NAV Return is based on the NAV of the ETF, and the Market Price Return is based on the market price per share of the ETF. The price used to calculate market return (Market Price) is determined by using the midpoint between the highest bid and the lowest offer on the primary stock exchange on which the shares of the ETF are listed for trading, as of the time that the ETF’s NAV is calculated. NAV is used as a proxy for purposes of calculating Market Price Return on inception date. Market Price and NAV returns assume that dividends and capital gain distributions have been reinvested in the ETF at Market Price and NAV, respectively. |
Schwab Target Index Funds | Annual Report
Schwab Target 2035 Index Fund
Performance and Fund Facts as of 3/31/17
The performance data quoted represents past performance. Past performance does not guarantee future results. Investment returns and principal value of an investment will fluctuate so that an investor’s shares may be worth more or less than their original cost. Current performance may be lower or higher than performance data quoted. To obtain performance information current to the most recent month end, please visit www.csimfunds.com.
Performance of Hypothetical Investment (August 25, 2016 – March 31, 2017)1
| 1 | Fund expenses may have been partially absorbed by CSIM and its affiliates. Without these reductions, the fund's returns would have been lower. These returns do not reflect the deduction of taxes that a shareholder would pay on fund distributions or the redemption of fund shares. |
Schwab Target Index Funds | Annual Report
Schwab Target 2035 Index Fund
Performance and Fund Facts as of 3/31/17 (continued)
| Class and Inception Date | Since Inception |
| Investor Shares (8/25/16) | 6.33% |
| Institutional Shares (8/25/16) | 6.44% |
| Target 2035 Passive Composite Index | 6.44% |
| Dow Jones U.S. Total Stock Market IndexSM | 10.36% |
| Bloomberg Barclays U.S. Aggregate Bond Index | -2.18% |
| Fund Category: Morningstar Target-Date 20352 | 6.46% |
| Fund Expense Ratios3: Investor Shares: Net 0.13%; Gross 0.18% / Institutional Shares: Net 0.08%; Gross 0.13% |
All total returns on this page assume dividends and distributions were reinvested. Index figures do not include trading and management costs, which would lower performance. Indexes are unmanaged and cannot be invested in directly. Performance results less than one year are not annualized.
For index definitions, please see the Glossary.
| 1 | Fund expenses may have been partially absorbed by CSIM and its affiliates. Without these reductions, the fund's returns would have been lower. These returns do not reflect the deduction of taxes that a shareholder would pay on fund distributions or the redemption of fund shares. |
| 2 | Source for category information: Morningstar, Inc. The Morningstar Category return represents all active and index mutual funds within the category as of the report date. |
| 3 | As stated in the prospectus. Includes expenses of the underlying funds in which the fund invests. The annualized weighted average expense ratio of the underlying funds was 0.05%. Net Expense: Expenses reduced by a contractual fee waiver in effect for so long as CSIM serves as the investment adviser to the fund. Gross Expense: Does not reflect the effect of contractual fee waivers. For actual ratios during the period, refer to the financial highlights section of the financial statements. |
Schwab Target Index Funds | Annual Report
Schwab Target 2035 Index Fund
Performance and Fund Facts as of 3/31/17 (continued)
| Number of Holdings | 13 |
| Portfolio Turnover Rate | 13% |
Asset Class Weightings % of Investments1
Top Holdings % of Net Assets2,3
Portfolio holdings may have changed since the report date.
| 1 | The fund intends to primarily invest in affiliated Schwab ETFs and may also invest in affiliated Schwab and Laudus mutual funds and unaffiliated third party ETFs and mutual funds (all such ETFs and mutual funds referred to as "underlying funds"). |
| 2 | This list is not a recommendation of any security by the investment adviser. |
| 3 | The holdings listed exclude any temporary liquidity investments. |
Schwab Target Index Funds | Annual Report
Schwab Target 2040 Index Fund
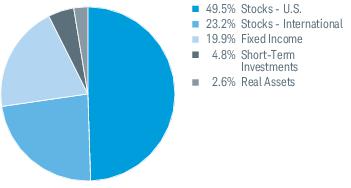
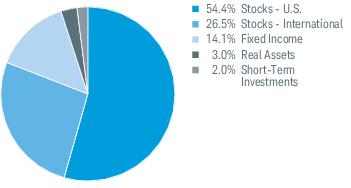
The Schwab Target 2040 Index Fund (the fund) seeks to provide capital appreciation and income consistent with its current asset allocation, and seeks to achieve its investment objective by investing primarily in affiliated Schwab exchange-traded funds (ETFs). The fund may also invest in affiliated Schwab and Laudus mutual funds and unaffiliated third party ETFs and mutual funds. The target asset allocation is adjusted annually based on the adviser’s asset allocation strategy; as of the annual adjustment at the end of January 2017, the fund’s asset allocation was approximately 84.3% equity securities, 14.1% fixed-income securities, and 1.6% cash and cash equivalents (including money market funds). (For portfolio allocations as of the end of this reporting period, please see the fund’s Portfolio Holdings included in this report.)
Market Highlights. Over the 12-month period, both international and U.S. equities generated solid returns, while U.S. bond yields rose and returns fell (bond yields and bond prices move in opposite directions). The Federal Reserve (Fed) raised short-term interest rates in both December and March amid steadily improving U.S. economic data and a slight uptick in inflation, and expectations for policy changes from the Trump administration contributed to a post-election stock market rally. Meanwhile, concerns lessened around global economic growth and potential fallout from the United Kingdom’s June vote to leave the European Union. Short-term bond yields rose after both Fed rate hikes, while longer-term yields rose after the U.S. presidential election as economic growth and inflation expectations grew.
Performance. For the reporting period of fund inception (August 25, 2016) through March 31, 2017, the fund’s Investor Shares returned 7.08%. The fund’s internally calculated comparative index, the Target 2040 Passive Composite Index (the composite index), returned 7.13% for the same period.
Positioning and Strategies.1 The fund’s asset allocations were generally in line with those of the composite index over the reporting period.
The fund’s fixed-income allocation detracted from the fund’s total return over the reporting period, and return relative to the composite index. The fund’s intermediate-term bond holding, the Schwab U.S. Aggregate Bond ETF™, was the largest detractor from the fund’s total return. The Schwab U.S. Aggregate Bond ETF returned approximately -2.3%, while the Bloomberg Barclays U.S. Aggregate Bond Index, the composite index’s underlying intermediate-term bond component, returned -2.2% for the same period. The fund’s other fixed-income allocation, the Schwab Short-Term U.S. Treasury ETF™, detracted from the fund’s relative return, as the Schwab Short-Term U.S. Treasury ETF also underperformed its comparative index, the Bloomberg Barclays U.S. 1-3 Year Treasury Bond Index.
The fund’s real estate allocation was another detractor from the fund’s total return and return relative to the composite index. The Schwab U.S. REIT ETF™ returned approximately -5.0% for the reporting period, slightly underperforming its comparative index, the Dow Jones U.S. Select REIT Index, which returned -4.8%.
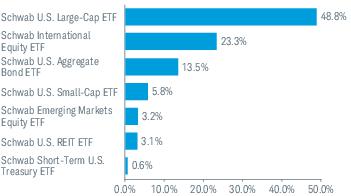
The fund’s equity exposures provided the greatest contribution to total return, particularly from the fund’s U.S. large cap holding. The top contributor to the total return of the fund was the Schwab U.S. Large-Cap ETF™, which returned approximately 10.2% for the reporting period. The fund’s international equity component, the Schwab International Equity ETF™, also contributed notably to both total return and return relative to the composite index. The Schwab International Equity ETF returned approximately 7.1%, slightly outperforming the composite index’s international equity component, the FTSE Developed ex US Index (Net), which returned 6.9% for the same period. The Schwab Emerging Markets Equity ETF™ also contributed to the fund’s total return and relative return, as it slightly outperformed the composite index’s emerging markets component, the FTSE Emerging Index (Net). The fund’s U.S. small cap holding, the Schwab US Small-Cap ETF™, contributed to the fund’s total return, but detracted from return relative to the composite index.
Management views may have changed since the report date.
| 1 | ETF performance can be expressed on a market price or NAV basis. The returns cited in this section are Market Price Returns. The ETF’s per share NAV is the value of one share of the ETF. NAV is calculated by taking the ETF’s total assets (including the market value of securities owned), subtracting liabilities, and dividing by the number of shares outstanding. The NAV Return is based on the NAV of the ETF, and the Market Price Return is based on the market price per share of the ETF. The price used to calculate market return (Market Price) is determined by using the midpoint between the highest bid and the lowest offer on the primary stock exchange on which the shares of the ETF are listed for trading, as of the time that the ETF’s NAV is calculated. NAV is used as a proxy for purposes of calculating Market Price Return on inception date. Market Price and NAV returns assume that dividends and capital gain distributions have been reinvested in the ETF at Market Price and NAV, respectively. |
Schwab Target Index Funds | Annual Report
Schwab Target 2040 Index Fund
Performance and Fund Facts as of 3/31/17
The performance data quoted represents past performance. Past performance does not guarantee future results. Investment returns and principal value of an investment will fluctuate so that an investor’s shares may be worth more or less than their original cost. Current performance may be lower or higher than performance data quoted. To obtain performance information current to the most recent month end, please visit www.csimfunds.com.
Performance of Hypothetical Investment (August 25, 2016 – March 31, 2017)1
| 1 | Fund expenses may have been partially absorbed by CSIM and its affiliates. Without these reductions, the fund's returns would have been lower. These returns do not reflect the deduction of taxes that a shareholder would pay on fund distributions or the redemption of fund shares. |
Schwab Target Index Funds | Annual Report
Schwab Target 2040 Index Fund
Performance and Fund Facts as of 3/31/17 (continued)
| Class and Inception Date | Since Inception |
| Investor Shares (8/25/16) | 7.08% |
| Institutional Shares (8/25/16) | 7.09% |
| Target 2040 Passive Composite Index | 7.13% |
| Dow Jones U.S. Total Stock Market IndexSM | 10.36% |
| Bloomberg Barclays U.S. Aggregate Bond Index | -2.18% |
| Fund Category: Morningstar Target-Date 20402 | 6.86% |
| Fund Expense Ratios3: Investor Shares: Net 0.13%; Gross 0.18% / Institutional Shares: Net 0.08%; Gross 0.13% |
All total returns on this page assume dividends and distributions were reinvested. Index figures do not include trading and management costs, which would lower performance. Indexes are unmanaged and cannot be invested in directly. Performance results less than one year are not annualized.
For index definitions, please see the Glossary.
| 1 | Fund expenses may have been partially absorbed by CSIM and its affiliates. Without these reductions, the fund's returns would have been lower. These returns do not reflect the deduction of taxes that a shareholder would pay on fund distributions or the redemption of fund shares. |
| 2 | Source for category information: Morningstar, Inc. The Morningstar Category return represents all active and index mutual funds within the category as of the report date. |
| 3 | As stated in the prospectus. Includes expenses of the underlying funds in which the fund invests. The annualized weighted average expense ratio of the underlying funds was 0.05%. Net Expense: Expenses reduced by a contractual fee waiver in effect for so long as CSIM serves as the investment adviser to the fund. Gross Expense: Does not reflect the effect of contractual fee waivers. For actual ratios during the period, refer to the financial highlights section of the financial statements. |
Schwab Target Index Funds | Annual Report
Schwab Target 2040 Index Fund
Performance and Fund Facts as of 3/31/17 (continued)
| Number of Holdings | 10 |
| Portfolio Turnover Rate | 8% |
Asset Class Weightings % of Investments1
Top Holdings % of Net Assets2,3
Portfolio holdings may have changed since the report date.
| 1 | The fund intends to primarily invest in affiliated Schwab ETFs and may also invest in affiliated Schwab and Laudus mutual funds and unaffiliated third party ETFs and mutual funds (all such ETFs and mutual funds referred to as "underlying funds"). |
| 2 | This list is not a recommendation of any security by the investment adviser. |
| 3 | The holdings listed exclude any temporary liquidity investments. |
Schwab Target Index Funds | Annual Report
Schwab Target 2045 Index Fund
The Schwab Target 2045 Index Fund (the fund) seeks to provide capital appreciation and income consistent with its current asset allocation, and seeks to achieve its investment objective by investing primarily in affiliated Schwab exchange-traded funds (ETFs). The fund may also invest in affiliated Schwab and Laudus mutual funds and unaffiliated third party ETFs and mutual funds. The target asset allocation is adjusted annually based on the adviser’s asset allocation strategy; as of the annual adjustment at the end of January 2017, the fund’s asset allocation was approximately 84.3% equity securities, 14.1% fixed-income securities, and 1.6% cash and cash equivalents (including money market funds). (For portfolio allocations as of the end of this reporting period, please see the fund’s Portfolio Holdings included in this report.)
Market Highlights. Over the 12-month period, both international and U.S. equities generated solid returns, while U.S. bond yields rose and returns fell (bond yields and bond prices move in opposite directions). The Federal Reserve (Fed) raised short-term interest rates in both December and March amid steadily improving U.S. economic data and a slight uptick in inflation, and expectations for policy changes from the Trump administration contributed to a post-election stock market rally. Meanwhile, concerns lessened around global economic growth and potential fallout from the United Kingdom’s June vote to leave the European Union. Short-term bond yields rose after both Fed rate hikes, while longer-term yields rose after the U.S. presidential election as economic growth and inflation expectations grew.
Performance. For the reporting period of fund inception (August 25, 2016) through March 31, 2017, the fund’s Investor Shares returned 7.50%. The fund’s internally calculated comparative index, the Target 2045 Passive Composite Index (the composite index), returned 7.56% for the same period.
Positioning and Strategies.1 The fund’s asset allocations were generally in line with those of the composite index over the reporting period.
The fund’s fixed-income allocation detracted from the fund’s total return over the reporting period, and return relative to the composite index. The fund’s intermediate-term bond holding, the Schwab U.S. Aggregate Bond ETF™, was the largest detractor from the fund’s total return. The Schwab U.S. Aggregate Bond ETF returned approximately -2.3%, while the Bloomberg Barclays U.S. Aggregate Bond Index, the composite index’s underlying intermediate-term bond component, returned -2.2% for the same period. The fund’s other fixed-income allocation, the Schwab Short-Term U.S. Treasury ETF™, detracted from the fund’s relative return, as the Schwab Short-Term U.S. Treasury ETF also underperformed its comparative index, the Bloomberg Barclays U.S. 1-3 Year Treasury Bond Index.
The fund’s real estate allocation was another detractor from the fund’s total return and return relative to the composite index. The Schwab U.S. REIT ETF™ returned approximately -5.0% for the reporting period, slightly underperforming its comparative index, the Dow Jones U.S. Select REIT Index, which returned -4.8%.
The fund’s equity exposures provided the greatest contribution to total return, particularly from the fund’s U.S. large cap holding. The top contributor to the total return of the fund was the Schwab U.S. Large-Cap ETF™, which returned approximately 10.2% for the reporting period. The fund’s international equity component, the Schwab International Equity ETF™, also contributed notably to both total return and return relative to the composite index. The Schwab International Equity ETF returned approximately 7.1%, slightly outperforming the composite index’s international equity component, the FTSE Developed ex US Index (Net), which returned 6.9% for the same period. The Schwab Emerging Markets Equity ETF™ also contributed to the fund’s total return and relative return, as it slightly outperformed the composite index’s emerging markets component, the FTSE Emerging Index (Net). The fund’s U.S. small cap holding, the Schwab US Small-Cap ETF™, contributed to the fund’s total return, but detracted from return relative to the composite index.
Management views may have changed since the report date.
| 1 | ETF performance can be expressed on a market price or NAV basis. The returns cited in this section are Market Price Returns. The ETF’s per share NAV is the value of one share of the ETF. NAV is calculated by taking the ETF’s total assets (including the market value of securities owned), subtracting liabilities, and dividing by the number of shares outstanding. The NAV Return is based on the NAV of the ETF, and the Market Price Return is based on the market price per share of the ETF. The price used to calculate market return (Market Price) is determined by using the midpoint between the highest bid and the lowest offer on the primary stock exchange on which the shares of the ETF are listed for trading, as of the time that the ETF’s NAV is calculated. NAV is used as a proxy for purposes of calculating Market Price Return on inception date. Market Price and NAV returns assume that dividends and capital gain distributions have been reinvested in the ETF at Market Price and NAV, respectively. |
Schwab Target Index Funds | Annual Report
Schwab Target 2045 Index Fund
Performance and Fund Facts as of 3/31/17
The performance data quoted represents past performance. Past performance does not guarantee future results. Investment returns and principal value of an investment will fluctuate so that an investor’s shares may be worth more or less than their original cost. Current performance may be lower or higher than performance data quoted. To obtain performance information current to the most recent month end, please visit www.csimfunds.com.
Performance of Hypothetical Investment (August 25, 2016 – March 31, 2017)1
| 1 | Fund expenses may have been partially absorbed by CSIM and its affiliates. Without these reductions, the fund's returns would have been lower. These returns do not reflect the deduction of taxes that a shareholder would pay on fund distributions or the redemption of fund shares. |
Schwab Target Index Funds | Annual Report
Schwab Target 2045 Index Fund
Performance and Fund Facts as of 3/31/17 (continued)
| Class and Inception Date | Since Inception |
| Investor Shares (8/25/16) | 7.50% |
| Institutional Shares (8/25/16) | 7.51% |
| Target 2045 Passive Composite Index | 7.56% |
| Dow Jones U.S. Total Stock Market IndexSM | 10.36% |
| Bloomberg Barclays U.S. Aggregate Bond Index | -2.18% |
| Fund Category: Morningstar Target-Date 20452 | 7.36% |
| Fund Expense Ratios3: Investor Shares: Net 0.13%; Gross 0.18% / Institutional Shares: Net 0.08%; Gross 0.13% |
All total returns on this page assume dividends and distributions were reinvested. Index figures do not include trading and management costs, which would lower performance. Indexes are unmanaged and cannot be invested in directly. Performance results less than one year are not annualized.
For index definitions, please see the Glossary.
| 1 | Fund expenses may have been partially absorbed by CSIM and its affiliates. Without these reductions, the fund's returns would have been lower. These returns do not reflect the deduction of taxes that a shareholder would pay on fund distributions or the redemption of fund shares. |
| 2 | Source for category information: Morningstar, Inc. The Morningstar Category return represents all active and index mutual funds within the category as of the report date. |
| 3 | As stated in the prospectus. Includes expenses of the underlying funds in which the fund invests. The annualized weighted average expense ratio of the underlying funds was 0.05%. Net Expense: Expenses reduced by a contractual fee waiver in effect for so long as CSIM serves as the investment adviser to the fund. Gross Expense: Does not reflect the effect of contractual fee waivers. For actual ratios during the period, refer to the financial highlights section of the financial statements. |
Schwab Target Index Funds | Annual Report
Schwab Target 2045 Index Fund
Performance and Fund Facts as of 3/31/17 (continued)
| Number of Holdings | 10 |
| Portfolio Turnover Rate | 8% |
Asset Class Weightings % of Investments1
Top Holdings % of Net Assets2,3
Portfolio holdings may have changed since the report date.
| 1 | The fund intends to primarily invest in affiliated Schwab ETFs and may also invest in affiliated Schwab and Laudus mutual funds and unaffiliated third party ETFs and mutual funds (all such ETFs and mutual funds referred to as "underlying funds"). |
| 2 | This list is not a recommendation of any security by the investment adviser. |
| 3 | The holdings listed exclude any temporary liquidity investments. |
Schwab Target Index Funds | Annual Report
Schwab Target 2050 Index Fund
The Schwab Target 2050 Index Fund (the fund) seeks to provide capital appreciation and income consistent with its current asset allocation, and seeks to achieve its investment objective by investing primarily in affiliated Schwab exchange-traded funds (ETFs). The fund may also invest in affiliated Schwab and Laudus mutual funds and unaffiliated third party ETFs and mutual funds. The target asset allocation is adjusted annually based on the adviser’s asset allocation strategy; as of the annual adjustment at the end of January 2017, the fund’s asset allocation was approximately 91.5% equity securities, 7.7% fixed income securities, and 0.9% cash and cash equivalents (including money market funds).1 (For portfolio allocations as of the end of this reporting period, please see the fund’s Portfolio Holdings included in this report.)
Market Highlights. Over the 12-month period, both international and U.S. equities generated solid returns, while U.S. bond yields rose and returns fell (bond yields and bond prices move in opposite directions). The Federal Reserve (Fed) raised short-term interest rates in both December and March amid steadily improving U.S. economic data and a slight uptick in inflation, and expectations for policy changes from the Trump administration contributed to a post-election stock market rally. Meanwhile, concerns lessened around global economic growth and potential fallout from the United Kingdom’s June vote to leave the European Union. Short-term bond yields rose after both Fed rate hikes, while longer-term yields rose after the U.S. presidential election as economic growth and inflation expectations grew.
Performance. For the reporting period of fund inception (August 25, 2016) through March 31, 2017, the fund’s Investor Shares returned 7.69%. The fund’s internally calculated comparative index, the Target 2050 Passive Composite Index (the composite index), returned 7.83% for the same period.
Positioning and Strategies.2 The fund’s asset allocations were generally in line with those of the composite index over the reporting period.
The fund’s real estate allocation was the largest detractor from the fund’s total return and return relative to the composite index. The Schwab U.S. REIT ETF™ returned approximately -5.0% for the reporting period, slightly underperforming its comparative index, the Dow Jones U.S. Select REIT Index, which returned -4.8%.
The fund’s fixed-income allocation also detracted from the fund’s total return over the reporting period, and return relative to the composite index. The fund’s intermediate-term bond holding, the Schwab U.S. Aggregate Bond ETF™, returned approximately -2.3%, while the Bloomberg Barclays U.S. Aggregate Bond Index, the composite index’s underlying intermediate-term bond component, returned -2.2% for the same period. The fund’s other fixed-income allocation, the Schwab Short-Term U.S. Treasury ETF™, detracted from the fund’s relative return, as the Schwab Short-Term U.S. Treasury ETF also underperformed its comparative index, the Bloomberg Barclays U.S. 1-3 Year Treasury Bond Index.
The fund’s equity exposures provided the greatest contribution to total return, particularly from the fund’s U.S. large cap holding. The top contributor to the total return of the fund was the Schwab U.S. Large-Cap ETF™, which returned approximately 10.2% for the reporting period. The fund’s international equity component, the Schwab International Equity ETF™, also contributed notably to both total return and return relative to the composite index. The Schwab International Equity ETF returned approximately 7.1%, slightly outperforming the composite index’s international equity component, the FTSE Developed ex US Index (Net), which returned 6.9% for the same period. The Schwab Emerging Markets Equity ETF™ also contributed to the fund’s total return and relative return, as it slightly outperformed the composite index’s emerging markets component, the FTSE Emerging Index (Net). The fund’s U.S. small cap holding, the Schwab US Small-Cap ETF™, contributed to the fund’s total return, but detracted from return relative to the composite index.
Management views may have changed since the report date.
| 1 | Percentages may not equal 100% due to rounding. |
| 2 | ETF performance can be expressed on a market price or NAV basis. The returns cited in this section are Market Price Returns. The ETF’s per share NAV is the value of one share of the ETF. NAV is calculated by taking the ETF’s total assets (including the market value of securities owned), subtracting liabilities, and dividing by the number of shares outstanding. The NAV Return is based on the NAV of the ETF, and the Market Price Return is based on the market price per share of the ETF. The price used to calculate market return (Market Price) is determined by using the midpoint between the highest bid and the lowest offer on the primary stock exchange on which the shares of the ETF are listed for trading, as of the time that the ETF’s NAV is calculated. NAV is used as a proxy for purposes of calculating Market Price Return on inception date. Market Price and NAV returns assume that dividends and capital gain distributions have been reinvested in the ETF at Market Price and NAV, respectively. |
Schwab Target Index Funds | Annual Report
Schwab Target 2050 Index Fund
Performance and Fund Facts as of 3/31/17
The performance data quoted represents past performance. Past performance does not guarantee future results. Investment returns and principal value of an investment will fluctuate so that an investor’s shares may be worth more or less than their original cost. Current performance may be lower or higher than performance data quoted. To obtain performance information current to the most recent month end, please visit www.csimfunds.com.
Performance of Hypothetical Investment (August 25, 2016 – March 31, 2017)1
| 1 | Fund expenses may have been partially absorbed by CSIM and its affiliates. Without these reductions, the fund's returns would have been lower. These returns do not reflect the deduction of taxes that a shareholder would pay on fund distributions or the redemption of fund shares. |
Schwab Target Index Funds | Annual Report
Schwab Target 2050 Index Fund
Performance and Fund Facts as of 3/31/17 (continued)
| Class and Inception Date | Since Inception |
| Investor Shares (8/25/16) | 7.69% |
| Institutional Shares (8/25/16) | 7.80% |
| Target 2050 Passive Composite Index | 7.83% |
| Dow Jones U.S. Total Stock Market IndexSM | 10.36% |
| Bloomberg Barclays U.S. Aggregate Bond Index | -2.18% |
| Fund Category: Morningstar Target-Date 20502 | 7.29% |
| Fund Expense Ratios3: Investor Shares: Net 0.13%; Gross 0.18% / Institutional Shares: Net 0.08%; Gross 0.13% |
All total returns on this page assume dividends and distributions were reinvested. Index figures do not include trading and management costs, which would lower performance. Indexes are unmanaged and cannot be invested in directly. Performance results less than one year are not annualized.
For index definitions, please see the Glossary.
| 1 | Fund expenses may have been partially absorbed by CSIM and its affiliates. Without these reductions, the fund's returns would have been lower. These returns do not reflect the deduction of taxes that a shareholder would pay on fund distributions or the redemption of fund shares. |
| 2 | Source for category information: Morningstar, Inc. The Morningstar Category return represents all active and index mutual funds within the category as of the report date. |
| 3 | As stated in the prospectus. Includes expenses of the underlying funds in which the fund invests. The annualized weighted average expense ratio of the underlying funds was 0.05%. Net Expense: Expenses reduced by a contractual fee waiver in effect for so long as CSIM serves as the investment adviser to the fund. Gross Expense: Does not reflect the effect of contractual fee waivers. For actual ratios during the period, refer to the financial highlights section of the financial statements. |
Schwab Target Index Funds | Annual Report
Schwab Target 2050 Index Fund
Performance and Fund Facts as of 3/31/17 (continued)
| Number of Holdings | 10 |
| Portfolio Turnover Rate | 4% |
Asset Class Weightings % of Investments1
Top Holdings % of Net Assets2,3
Portfolio holdings may have changed since the report date.
| 1 | The fund intends to primarily invest in affiliated Schwab ETFs and may also invest in affiliated Schwab and Laudus mutual funds and unaffiliated third party ETFs and mutual funds (all such ETFs and mutual funds referred to as "underlying funds"). |
| 2 | This list is not a recommendation of any security by the investment adviser. |
| 3 | The holdings listed exclude any temporary liquidity investments. |
Schwab Target Index Funds | Annual Report
Schwab Target 2055 Index Fund
The Schwab Target 2055 Index Fund (the fund) seeks to provide capital appreciation and income consistent with its current asset allocation, and seeks to achieve its investment objective by investing primarily in affiliated Schwab exchange-traded funds (ETFs). The fund may also invest in affiliated Schwab and Laudus mutual funds and unaffiliated third party ETFs and mutual funds. The target asset allocation is adjusted annually based on the adviser’s asset allocation strategy; as of the annual adjustment at the end of January 2017, the fund’s asset allocation was approximately 94.0% equity securities, 5.4% fixed-income securities, and 0.6% cash and cash equivalents (including money market funds). (For portfolio allocations as of the end of this reporting period, please see the fund’s Portfolio Holdings included in this report.)
Market Highlights. Over the 12-month period, both international and U.S. equities generated solid returns, while U.S. bond yields rose and returns fell (bond yields and bond prices move in opposite directions). The Federal Reserve (Fed) raised short-term interest rates in both December and March amid steadily improving U.S. economic data and a slight uptick in inflation, and expectations for policy changes from the Trump administration contributed to a post-election stock market rally. Meanwhile, concerns lessened around global economic growth and potential fallout from the United Kingdom’s June vote to leave the European Union. Short-term bond yields rose after both Fed rate hikes, while longer-term yields rose after the U.S. presidential election as economic growth and inflation expectations grew.
Performance. For the reporting period of fund inception (August 25, 2016) through March 31, 2017, the fund’s Investor Shares returned 8.02%. The fund’s internally calculated comparative index, the Target 2055 Passive Composite Index (the composite index), returned 8.09% for the same period.
Positioning and Strategies.1 The fund’s asset allocations were generally in line with those of the composite index over the reporting period.
The fund’s real estate allocation was the largest detractor from the fund’s total return and return relative to the composite index. The Schwab U.S. REIT ETF™ returned approximately -5.0% for the reporting period, slightly underperforming its comparative index, the Dow Jones U.S. Select REIT Index, which returned -4.8%.
The fund’s fixed-income allocation also detracted from the fund’s total return over the reporting period, and return relative to the composite index. The fund’s intermediate-term bond holding, the Schwab U.S. Aggregate Bond ETF™, returned approximately -2.3%, while the Bloomberg Barclays U.S. Aggregate Bond Index, the composite index’s underlying intermediate-term bond component, returned -2.2% for the same period. The fund’s other fixed-income allocation, the Schwab Short-Term U.S. Treasury ETF™, detracted from the fund’s relative return, as the Schwab Short-Term U.S. Treasury ETF also underperformed its comparative index, the Bloomberg Barclays U.S. 1-3 Year Treasury Bond Index.
The fund’s equity exposures provided the greatest contribution to total return, particularly from the fund’s U.S. large cap holding. The top contributor to the total return of the fund was the Schwab U.S. Large-Cap ETF™, which returned approximately 10.2% for the reporting period. The fund’s international equity component, the Schwab International Equity ETF™, also contributed notably to both total return and return relative to the composite index. The Schwab International Equity ETF returned approximately 7.1%, slightly outperforming the composite index’s international equity component, the FTSE Developed ex US Index (Net), which returned 6.9% for the same period. The Schwab Emerging Markets Equity ETF™ also contributed to the fund’s total return and relative return, as it slightly outperformed the composite index’s emerging markets component, the FTSE Emerging Index (Net). The fund’s U.S. small cap holding, the Schwab US Small-Cap ETF™, contributed to the fund’s total return, but detracted from return relative to the composite index.
Management views may have changed since the report date.
| 1 | ETF performance can be expressed on a market price or NAV basis. The returns cited in this section are Market Price Returns. The ETF’s per share NAV is the value of one share of the ETF. NAV is calculated by taking the ETF’s total assets (including the market value of securities owned), subtracting liabilities, and dividing by the number of shares outstanding. The NAV Return is based on the NAV of the ETF, and the Market Price Return is based on the market price per share of the ETF. The price used to calculate market return (Market Price) is determined by using the midpoint between the highest bid and the lowest offer on the primary stock exchange on which the shares of the ETF are listed for trading, as of the time that the ETF’s NAV is calculated. NAV is used as a proxy for purposes of calculating Market Price Return on inception date. Market Price and NAV returns assume that dividends and capital gain distributions have been reinvested in the ETF at Market Price and NAV, respectively. |
Schwab Target Index Funds | Annual Report
Schwab Target 2055 Index Fund
Performance and Fund Facts as of 3/31/17
The performance data quoted represents past performance. Past performance does not guarantee future results. Investment returns and principal value of an investment will fluctuate so that an investor’s shares may be worth more or less than their original cost. Current performance may be lower or higher than performance data quoted. To obtain performance information current to the most recent month end, please visit www.csimfunds.com.
Performance of Hypothetical Investment (August 25, 2016 – March 31, 2017)1
| 1 | Fund expenses may have been partially absorbed by CSIM and its affiliates. Without these reductions, the fund's returns would have been lower. These returns do not reflect the deduction of taxes that a shareholder would pay on fund distributions or the redemption of fund shares. |
Schwab Target Index Funds | Annual Report
Schwab Target 2055 Index Fund
Performance and Fund Facts as of 3/31/17 (continued)
| Class and Inception Date | Since Inception |
| Investor Shares (8/25/16) | 8.02% |
| Institutional Shares (8/25/16) | 8.03% |
| Target 2055 Passive Composite Index | 8.09% |
| Dow Jones U.S. Total Stock Market IndexSM | 10.36% |
| Bloomberg Barclays U.S. Aggregate Bond Index | -2.18% |
| Fund Category: Morningstar Target-Date 20552 | 7.58% |
| Fund Expense Ratios3: Investor Shares: Net 0.13%; Gross 0.18% / Institutional Shares: Net 0.08%; Gross 0.13% |
All total returns on this page assume dividends and distributions were reinvested. Index figures do not include trading and management costs, which would lower performance. Indexes are unmanaged and cannot be invested in directly. Performance results less than one year are not annualized.
For index definitions, please see the Glossary.
| 1 | Fund expenses may have been partially absorbed by CSIM and its affiliates. Without these reductions, the fund's returns would have been lower. These returns do not reflect the deduction of taxes that a shareholder would pay on fund distributions or the redemption of fund shares. |
| 2 | Source for category information: Morningstar, Inc. The Morningstar Category return represents all active and index mutual funds within the category as of the report date. |
| 3 | As stated in the prospectus. Includes expenses of the underlying funds in which the fund invests. The annualized weighted average expense ratio of the underlying funds was 0.05%. Net Expense: Expenses reduced by a contractual fee waiver in effect for so long as CSIM serves as the investment adviser to the fund. Gross Expense: Does not reflect the effect of contractual fee waivers. For actual ratios during the period, refer to the financial highlights section of the financial statements. |
Schwab Target Index Funds | Annual Report
Schwab Target 2055 Index Fund
Performance and Fund Facts as of 3/31/17 (continued)
| Number of Holdings | 9 |
| Portfolio Turnover Rate | 14% |
Asset Class Weightings % of Investments1
Top Holdings % of Net Assets2,3
Portfolio holdings may have changed since the report date.
| 1 | The fund intends to primarily invest in affiliated Schwab ETFs and may also invest in affiliated Schwab and Laudus mutual funds and unaffiliated third party ETFs and mutual funds (all such ETFs and mutual funds referred to as "underlying funds"). |
| 2 | This list is not a recommendation of any security by the investment adviser. |
| 3 | The holdings listed exclude any temporary liquidity investments. |
Schwab Target Index Funds | Annual Report
Schwab Target 2060 Index Fund
The Schwab Target 2060 Index Fund (the fund) seeks to provide capital appreciation and income consistent with its current asset allocation, and seeks to achieve its investment objective by investing primarily in affiliated Schwab exchange-traded funds (ETFs). The fund may also invest in affiliated Schwab and Laudus mutual funds and unaffiliated third party ETFs and mutual funds. The target asset allocation is adjusted annually based on the adviser’s asset allocation strategy; as of the annual adjustment at the end of January 2017, the fund’s asset allocation was approximately 95.0% equity securities, 4.5% fixed-income securities, and 0.5% cash and cash equivalents (including money market funds). (For portfolio allocations as of the end of this reporting period, please see the fund’s Portfolio Holdings included in this report.)
Market Highlights. Over the 12-month period, both international and U.S. equities generated solid returns, while U.S. bond yields rose and returns fell (bond yields and bond prices move in opposite directions). The Federal Reserve (Fed) raised short-term interest rates in both December and March amid steadily improving U.S. economic data and a slight uptick in inflation, and expectations for policy changes from the Trump administration contributed to a post-election stock market rally. Meanwhile, concerns lessened around global economic growth and potential fallout from the United Kingdom’s June vote to leave the European Union. Short-term bond yields rose after both Fed rate hikes, while longer-term yields rose after the U.S. presidential election as economic growth and inflation expectations grew.
Performance. For the reporting period of fund inception (August 25, 2016) through March 31, 2017, the fund’s Investor Shares returned 8.11%. The fund’s internally calculated comparative index, the Target 2060 Passive Composite Index (the composite index), returned 8.16% for the same period.
Positioning and Strategies.1 The fund’s asset allocations were generally in line with those of the composite index over the reporting period.
The fund’s real estate allocation was the largest detractor from the fund’s total return and return relative to the composite index. The Schwab U.S. REIT ETF™ returned approximately -5.0% for the reporting period, slightly underperforming its comparative index, the Dow Jones U.S. Select REIT Index, which returned -4.8%.
The fund’s fixed-income allocation also detracted from the fund’s total return over the reporting period, and return relative to the composite index. The fund’s intermediate-term bond holding, the Schwab U.S. Aggregate Bond ETF™, returned approximately -2.3%, while the Bloomberg Barclays U.S. Aggregate Bond Index, the composite index’s underlying intermediate-term bond component, returned -2.2% for the same period. The fund’s other fixed-income allocation, the Schwab Short-Term U.S. Treasury ETF™, detracted from the fund’s relative return, as the Schwab Short-Term U.S. Treasury ETF also underperformed its comparative index, the Bloomberg Barclays U.S. 1-3 Year Treasury Bond Index.
The fund’s equity exposures provided the greatest contribution to total return, particularly from the fund’s U.S. large cap holding. The top contributor to the total return of the fund was the Schwab U.S. Large-Cap ETF™, which returned approximately 10.2% for the reporting period. The fund’s international equity component, the Schwab International Equity ETF™, also contributed notably to both total return and return relative to the composite index. The Schwab International Equity ETF returned approximately 7.1%, slightly outperforming the composite index’s international equity component, the FTSE Developed ex US Index (Net), which returned 6.9% for the same period. The Schwab Emerging Markets Equity ETF™ also contributed to the fund’s total return and relative return, as it slightly outperformed the composite index’s emerging markets component, the FTSE Emerging Index (Net). The fund’s U.S. small cap holding, the Schwab US Small-Cap ETF™, contributed to the fund’s total return, but detracted from return relative to the composite index.
Management views may have changed since the report date.
| 1 | ETF performance can be expressed on a market price or NAV basis. The returns cited in this section are Market Price Returns. The ETF’s per share NAV is the value of one share of the ETF. NAV is calculated by taking the ETF’s total assets (including the market value of securities owned), subtracting liabilities, and dividing by the number of shares outstanding. The NAV Return is based on the NAV of the ETF, and the Market Price Return is based on the market price per share of the ETF. The price used to calculate market return (Market Price) is determined by using the midpoint between the highest bid and the lowest offer on the primary stock exchange on which the shares of the ETF are listed for trading, as of the time that the ETF’s NAV is calculated. NAV is used as a proxy for purposes of calculating Market Price Return on inception date. Market Price and NAV returns assume that dividends and capital gain distributions have been reinvested in the ETF at Market Price and NAV, respectively. |
Schwab Target Index Funds | Annual Report
Schwab Target 2060 Index Fund
Performance and Fund Facts as of 3/31/17
The performance data quoted represents past performance. Past performance does not guarantee future results. Investment returns and principal value of an investment will fluctuate so that an investor’s shares may be worth more or less than their original cost. Current performance may be lower or higher than performance data quoted. To obtain performance information current to the most recent month end, please visit www.csimfunds.com.
Performance of Hypothetical Investment (August 25, 2016 – March 31, 2017)1
| 1 | Fund expenses may have been partially absorbed by CSIM and its affiliates. Without these reductions, the fund's returns would have been lower. These returns do not reflect the deduction of taxes that a shareholder would pay on fund distributions or the redemption of fund shares. |
Schwab Target Index Funds | Annual Report
Schwab Target 2060 Index Fund
Performance and Fund Facts as of 3/31/17 (continued)
| Class and Inception Date | Since Inception |
| Investor Shares (8/25/16) | 8.11% |
| Institutional Shares (8/25/16) | 8.11% |
| Target 2060 Passive Composite Index | 8.16% |
| Dow Jones U.S. Total Stock Market IndexSM | 10.36% |
| Bloomberg Barclays U.S. Aggregate Bond Index | -2.18% |
| Fund Category: Morningstar Target-Date 2060+2 | 7.78% |
| Fund Expense Ratios3: Investor Shares: Net 0.13%; Gross 0.18% / Institutional Shares: Net 0.08%; Gross 0.13% |
All total returns on this page assume dividends and distributions were reinvested. Index figures do not include trading and management costs, which would lower performance. Indexes are unmanaged and cannot be invested in directly. Performance results less than one year are not annualized.
For index definitions, please see the Glossary.
| 1 | Fund expenses may have been partially absorbed by CSIM and its affiliates. Without these reductions, the fund's returns would have been lower. These returns do not reflect the deduction of taxes that a shareholder would pay on fund distributions or the redemption of fund shares. |
| 2 | Source for category information: Morningstar, Inc. The Morningstar Category return represents all active and index mutual funds within the category as of the report date. |
| 3 | As stated in the prospectus. Includes expenses of the underlying funds in which the fund invests. The annualized weighted average expense ratio of the underlying funds was 0.05%. Net Expense: Expenses reduced by a contractual fee waiver in effect for so long as CSIM serves as the investment adviser to the fund. Gross Expense: Does not reflect the effect of contractual fee waivers. For actual ratios during the period, refer to the financial highlights section of the financial statements. |
Schwab Target Index Funds | Annual Report
Schwab Target 2060 Index Fund
Performance and Fund Facts as of 3/31/17 (continued)
| Number of Holdings | 8 |
| Portfolio Turnover Rate | 0% |
Asset Class Weightings % of Investments1
Top Holdings % of Net Assets2,3
Portfolio holdings may have changed since the report date.
| 1 | The fund intends to primarily invest in affiliated Schwab ETFs and may also invest in affiliated Schwab and Laudus mutual funds and unaffiliated third party ETFs and mutual funds (all such ETFs and mutual funds referred to as "underlying funds"). |
| 2 | This list is not a recommendation of any security by the investment adviser. |
| 3 | The holdings listed exclude any temporary liquidity investments. |
Schwab Target Index Funds | Annual Report
Schwab Target Index Funds
Fund Expenses (Unaudited)
Examples for a $1,000 Investment
As a fund shareholder, you may incur two types of costs: (1) transaction costs; and (2) ongoing costs, including management fees and shareholder services fees.
The expense examples below are intended to help you understand your ongoing cost (in dollars) of investing in a fund and to compare this cost with the ongoing cost of investing in other mutual funds. These examples are based on an investment of $1,000 invested for six months beginning October 1, 2016 and held through March 31, 2017.
Actual Return lines in the table below provide information about actual account values and actual expenses. You may use this information, together with the amount you invested, to estimate the expenses that you paid over the period. To do so, simply divide your account value by $1,000 (for example, an $8,600 account value ÷ $1,000 = 8.6), then multiply the result by the number given for your fund under the heading entitled “Expenses Paid During Period.”
Hypothetical Return lines in the table below provide information about hypothetical account values and hypothetical expenses based on a fund’s actual expense ratio and an assumed return of 5% per year before expenses. Because the return used is not an actual return, it may not be used to estimate the actual ending account value or expenses you paid for the period.
You may use this information to compare the ongoing costs of investing in a fund and other funds. To do so, compare this 5% hypothetical example with the 5% hypothetical examples that appear in the shareholder reports of the other funds.
Please note that the expenses shown in the table are meant to highlight your ongoing costs only, and do not reflect any transactional costs. Therefore, the hypothetical return lines of the table are useful in comparing ongoing costs only, and will not help you determine the relative total costs of owning different funds. In addition, if these transactional costs or non-routine expenses were included, your costs would have been higher.
| | Expense Ratio
(Annualized)1 | Beginning
Account Value
at 10/1/16 | Ending
Account Value
(Net of Expenses)
at 3/31/17 | Expenses Paid
During Period
10/1/16-3/31/172 |
| Schwab Target 2010 Index Fund | | | | |
| Investor Shares | | | | |
| Actual Return | 0.07% | $1,000.00 | $1,021.50 | $0.35 |
| Hypothetical 5% Return | 0.07% | $1,000.00 | $1,024.55 | $0.35 |
| Institutional Shares | | | | |
| Actual Return | 0.02% | $1,000.00 | $1,021.60 | $0.10 |
| Hypothetical 5% Return | 0.02% | $1,000.00 | $1,024.80 | $0.10 |
| Schwab Target 2015 Index Fund | | | | |
| Investor Shares | | | | |
| Actual Return | 0.06% | $1,000.00 | $1,024.80 | $0.30 |
| Hypothetical 5% Return | 0.06% | $1,000.00 | $1,024.60 | $0.30 |
| Institutional Shares | | | | |
| Actual Return | 0.02% | $1,000.00 | $1,023.90 | $0.10 |
| Hypothetical 5% Return | 0.02% | $1,000.00 | $1,024.80 | $0.10 |
| Schwab Target 2020 Index Fund | | | | |
| Investor Shares | | | | |
| Actual Return | 0.08% | $1,000.00 | $1,034.80 | $0.41 |
| Hypothetical 5% Return | 0.08% | $1,000.00 | $1,024.50 | $0.40 |
| Institutional Shares | | | | |
| Actual Return | 0.03% | $1,000.00 | $1,035.90 | $0.15 |
| Hypothetical 5% Return | 0.03% | $1,000.00 | $1,024.75 | $0.15 |
| Schwab Target 2025 Index Fund | | | | |
| Investor Shares | | | | |
| Actual Return | 0.08% | $1,000.00 | $1,046.00 | $0.41 |
| Hypothetical 5% Return | 0.08% | $1,000.00 | $1,024.50 | $0.40 |
| Institutional Shares | | | | |
| Actual Return | 0.03% | $1,000.00 | $1,047.20 | $0.15 |
| Hypothetical 5% Return | 0.03% | $1,000.00 | $1,024.75 | $0.15 |
| Schwab Target 2030 Index Fund | | | | |
| Investor Shares | | | | |
| Actual Return | 0.08% | $1,000.00 | $1,055.50 | $0.41 |
| Hypothetical 5% Return | 0.08% | $1,000.00 | $1,024.50 | $0.40 |
| Institutional Shares | | | | |
| Actual Return | 0.03% | $1,000.00 | $1,054.50 | $0.15 |
| Hypothetical 5% Return | 0.03% | $1,000.00 | $1,024.75 | $0.15 |
Schwab Target Index Funds | Annual Report
Schwab Target Index Funds
Fund Expenses (Unaudited) (continued)
| | Expense Ratio
(Annualized)1 | Beginning
Account Value
at 10/1/16 | Ending
Account Value
(Net of Expenses)
at 3/31/17 | Expenses Paid
During Period
10/1/16-3/31/172 |
| Schwab Target 2035 Index Fund | | | | |
| Investor Shares | | | | |
| Actual Return | 0.08% | $1,000.00 | $1,062.20 | $0.41 |
| Hypothetical 5% Return | 0.08% | $1,000.00 | $1,024.50 | $0.40 |
| Institutional Shares | | | | |
| Actual Return | 0.03% | $1,000.00 | $1,063.30 | $0.15 |
| Hypothetical 5% Return | 0.03% | $1,000.00 | $1,024.75 | $0.15 |
| Schwab Target 2040 Index Fund | | | | |
| Investor Shares | | | | |
| Actual Return | 0.08% | $1,000.00 | $1,069.80 | $0.41 |
| Hypothetical 5% Return | 0.08% | $1,000.00 | $1,024.50 | $0.40 |
| Institutional Shares | | | | |
| Actual Return | 0.03% | $1,000.00 | $1,069.90 | $0.15 |
| Hypothetical 5% Return | 0.03% | $1,000.00 | $1,024.75 | $0.15 |
| Schwab Target 2045 Index Fund | | | | |
| Investor Shares | | | | |
| Actual Return | 0.07% | $1,000.00 | $1,073.90 | $0.36 |
| Hypothetical 5% Return | 0.07% | $1,000.00 | $1,024.55 | $0.35 |
| Institutional Shares | | | | |
| Actual Return | 0.02% | $1,000.00 | $1,074.00 | $0.10 |
| Hypothetical 5% Return | 0.02% | $1,000.00 | $1,024.80 | $0.10 |
| Schwab Target 2050 Index Fund | | | | |
| Investor Shares | | | | |
| Actual Return | 0.07% | $1,000.00 | $1,075.80 | $0.36 |
| Hypothetical 5% Return | 0.07% | $1,000.00 | $1,024.55 | $0.35 |
| Institutional Shares | | | | |
| Actual Return | 0.02% | $1,000.00 | $1,075.90 | $0.10 |
| Hypothetical 5% Return | 0.02% | $1,000.00 | $1,024.80 | $0.10 |
| Schwab Target 2055 Index Fund | | | | |
| Investor Shares | | | | |
| Actual Return | 0.07% | $1,000.00 | $1,078.00 | $0.36 |
| Hypothetical 5% Return | 0.07% | $1,000.00 | $1,024.55 | $0.35 |
| Institutional Shares | | | | |
| Actual Return | 0.02% | $1,000.00 | $1,078.10 | $0.10 |
| Hypothetical 5% Return | 0.02% | $1,000.00 | $1,024.80 | $0.10 |
| Schwab Target 2060 Index Fund | | | | |
| Investor Shares | | | | |
| Actual Return | 0.07% | $1,000.00 | $1,078.90 | $0.36 |
| Hypothetical 5% Return | 0.07% | $1,000.00 | $1,024.55 | $0.35 |
| Institutional Shares | | | | |
| Actual Return | 0.02% | $1,000.00 | $1,079.00 | $0.10 |
| Hypothetical 5% Return | 0.02% | $1,000.00 | $1,024.80 | $0.10 |
| 1 | Based on the most recent six-month expense ratio; may differ from the expense ratio provided in the Financial Highlights which covers a 12-month period. The expenses incurred by the underlying funds in which the funds invest are not included in this ratio. |
| 2 | Expenses for each fund or share class are equal to its annualized expense ratio, multiplied by the average account value over the period, multiplied by the 182 days of the period, and divided by the 365 days of the fiscal year. |
Schwab Target Index Funds | Annual Report
Schwab Target 2010 Index Fund
Financial Statements
Financial Highlights
| Investor Shares | 8/25/16 1–
3/31/17 | | | | | |
| Per-Share Data |
| Net asset value at beginning of period | $10.00 | | | | | |
| Income (loss) from investment operations: | | | | | | |
| Net investment income (loss)2 | 0.13 | | | | | |
| Net realized and unrealized gains (losses) | 0.09 | | | | | |
| Total from investment operations | 0.22 | | | | | |
| Less distributions: | | | | | | |
| Distributions from net investment income | (0.07) | | | | | |
| Net asset value at end of period | $10.15 | | | | | |
| Total return | 2.26% 3 | | | | | |
| Ratios/Supplemental Data |
| Ratios to average net assets: | | | | | | |
| Net operating expenses4 | 0.07% 5 | | | | | |
| Gross operating expenses4 | 0.13% 5 | | | | | |
| Net investment income (loss) | 2.22% 5 | | | | | |
| Portfolio turnover rate | 2% 3 | | | | | |
| Net assets, end of period (x 1,000) | $2,696 | | | | | |
| |
| Institutional Shares | 8/25/16 1–
3/31/17 | | | | | |
| Per-Share Data |
| Net asset value at beginning of period | $10.00 | | | | | |
| Income (loss) from investment operations: | | | | | | |
| Net investment income (loss)2 | 0.12 | | | | | |
| Net realized and unrealized gains (losses) | 0.10 | | | | | |
| Total from investment operations | 0.22 | | | | | |
| Less distributions: | | | | | | |
| Distributions from net investment income | (0.07) | | | | | |
| Net asset value at end of period | $10.15 | | | | | |
| Total return | 2.26% 3 | | | | | |
| Ratios/Supplemental Data |
| Ratios to average net assets: | | | | | | |
| Net operating expenses4 | 0.02% 5 | | | | | |
| Gross operating expenses4 | 0.08% 5 | | | | | |
| Net investment income (loss) | 1.99% 5 | | | | | |
| Portfolio turnover rate | 2% 3 | | | | | |
| Net assets, end of period (x 1,000) | $955 | | | | | |
1
Commencement of operations.
2
Calculated based on the average shares outstanding during the period.
3
Not annualized.
4
The expenses incurred by underlying funds in which the fund invests are not included in this ratio, if expenses incurred by the underlying funds were included in the ratio it would have increased 0.06% (see financial note 4).
5
Annualized.
Schwab Target Index Funds | Annual Report
Schwab Target 2010 Index Fund
Portfolio Holdings as of March 31, 2017
This section shows all the securities in the fund's portfolio and their values as of the report date.
The fund files its complete schedule of portfolio holdings with the SEC for the first and third quarters of each fiscal year on Form N-Q. The fund's Form N-Q is available on the SEC's website at www.sec.gov and may be viewed and copied at the SEC's Public Reference Room in Washington, D.C. Call 1-800-SEC-0330 for information on the operation of the Public Reference Room. The fund also makes available its complete schedule of portfolio holdings 15 to 20 days after calendar quarters on the fund's website at www.csimfunds.com/schwabfunds_prospectus.
| Holdings by Category | Cost ($) | Value ($) |
| 95.0% | Other Investment Companies | 3,419,533 | 3,466,716 |
| 4.8% | Short-Term Investments | 175,223 | 175,223 |
| 99.8% | Total Investments | 3,594,756 | 3,641,939 |
| 0.2% | Other Assets and Liabilities, Net | | 8,979 |
| 100.0% | Net Assets | | 3,650,918 |
| Security | Number
of Shares | Value ($) |
| Other Investment Companies 95.0% of net assets |
| |
| U.S. Stocks 26.3% |
| Large-Cap 24.7% |
| Schwab U.S. Large-Cap ETF (a) | 16,013 | 901,052 |
| Small-Cap 1.6% |
| Schwab U.S. Small-Cap ETF (a) | 936 | 58,949 |
| | | 960,001 |
| |
| International Stock 9.4% |
| Developed-Market Large-Cap 9.4% |
| Schwab International Equity ETF (a) | 11,460 | 342,310 |
| |
| Real Assets 1.0% |
| Real Estate 1.0% |
| Schwab U.S. REIT ETF (a) | 922 | 37,599 |
| |
| Fixed Income 55.4% |
| Inflation-Protected Bond 6.3% |
| Schwab U.S. TIPS ETF (a) | 4,102 | 227,784 |
| Intermediate-Term Bond 40.7% |
| Schwab U.S. Aggregate Bond ETF (a) | 28,675 | 1,485,078 |
| Treasury Bond 8.4% |
| Schwab Short-Term U.S. Treasury ETF (a) | 6,099 | 307,756 |
| | | 2,020,618 |
| |
| Security | Number
of Shares | Value ($) |
| Money Market Fund 2.9% |
| Schwab Variable Share Price Money Fund, Ultra Shares 0.87% (a)(b) | 106,157 | 106,188 |
| Total Other Investment Companies |
| (Cost $3,419,533) | | 3,466,716 |
Issuer
Rate, Maturity Date | Face
Amount ($) | Value ($) |
| Short-Term Investments 4.8% of net assets |
| |
| Time Deposits 4.8% |
| BNP Paribas |
| 0.41%, 04/03/17 (c) | 82,935 | 82,935 |
| Sumitomo Mitsui Banking Corp. |
| 0.41%, 04/03/17 (c) | 92,288 | 92,288 |
| Total Short-Term Investments |
| (Cost $175,223) | | 175,223 |
End of Investments.
At 03/31/17, the tax basis cost of the fund's investments was $3,595,145 and the unrealized appreciation and depreciation were $49,404 and ($2,610), respectively, with a net unrealized appreciation of $46,794.
| (a) | Issuer is affiliated with the fund's investment adviser. |
| (b) | The rate shown is the 7-day yield. |
| (c) | The rate shown is the current daily overnight rate. |
| | |
| ETF — | Exchange-traded fund |
| REIT — | Real Estate Investment Trust |
| TIPS — | Treasury Inflation Protected Securities |
The following is a summary of the inputs used to value the fund's investments as of March 31, 2017 (see financial note 2(a) for additional information):
| Description | Quoted Prices in
Active Markets for
Identical Assets
(Level 1) | Other Significant
Observable Inputs
(Level 2) | Significant
Unobservable Inputs
(Level 3) | Total | |
| Other Investment Companies1 | $3,466,716 | $— | $— | $3,466,716 | |
| Short-Term Investments1 | — | 175,223 | — | 175,223 | |
| Total | $3,466,716 | $175,223 | $— | $3,641,939 | |
| 1 | As categorized in Portfolio Holdings. |
The fund's policy is to recognize transfers between Level 1, Level 2 and Level 3 as of the beginning of the fiscal year. There were no transfers between Level 1, Level 2 and Level 3 for the period ended March 31, 2017.
Schwab Target Index Funds | Annual Report
Schwab Target 2010 Index Fund
Statement of Assets and Liabilities
As of March 31, 2017
| Assets |
| Investments in affiliated underlying funds, at value (cost $3,419,533) | | $3,466,716 |
| Investments in unaffiliated issuers, at value (cost $175,223) | + | 175,223 |
| Total investments, at value (cost $3,594,756) | | 3,641,939 |
| Receivables: | | |
| Fund shares sold | | 574,964 |
| Dividends | + | 44 |
| Total assets | | 4,216,947 |
| Liabilities |
| Payables: | | |
| Investments bought | | 565,846 |
| Investment adviser fees | | 75 |
| Shareholder service fees | + | 108 |
| Total liabilities | | 566,029 |
| Net Assets |
| Total assets | | 4,216,947 |
| Total liabilities | – | 566,029 |
| Net assets | | $3,650,918 |
| Net Assets by Source | | |
| Capital received from investors | | 3,597,561 |
| Net investment income not yet distributed | | 6,493 |
| Net realized capital losses | | (319) |
| Net unrealized capital appreciation | | 47,183 |
| Net Asset Value (NAV) by Shares Class | |
| Share Class | Net Assets | ÷ | Shares
Outstanding | = | NAV |
| Investor Shares | $2,695,886 | | 265,609 | | $10.15 |
| Institutional Shares | $955,032 | | 94,089 | | $10.15 |
| | | | | | |
Schwab Target Index Funds | Annual Report
Schwab Target 2010 Index Fund
Statement of Operations
For the period August 25, 2016* through March 31, 2017
| Investment Income |
| Dividends received from affiliated underlying funds | | $17,826 |
| Interest | + | 103 |
| Total investment income | | 17,929 |
| Expenses |
| Investment adviser and administrator fees | | 633 |
| Shareholder service fees: | | |
| Investor Shares | + | 362 |
| Total expenses | | 995 |
| Expense reduction by CSIM | – | 473 |
| Net expenses | – | 522 |
| Net investment income | | 17,407 |
| Realized and Unrealized Gains (Losses) |
| Net realized losses on sales of affiliated underlying funds | | (319) |
| Net change in unrealized appreciation (depreciation) on affiliated underlying funds | + | 47,183 |
| Net realized and unrealized gains | | 46,864 |
| Increase in net assets resulting from operations | | $64,271 |
| * | Commencement of operations. |
Schwab Target Index Funds | Annual Report
Schwab Target 2010 Index Fund
Statement of Changes in Net Assets
For the current period only. Because the fund commenced operations on August 25, 2016, it has no prior report period
| Operations |
| | 8/25/16*-3/31/17 |
| Net investment income | | $17,407 |
| Net realized losses | | (319) |
| Net change in unrealized appreciation (depreciation) | + | 47,183 |
| Increase in net assets from operations | | 64,271 |
| Distributions to Shareholders |
| Distributions from net investment income | | |
| Investor Shares | | (10,172) |
| Institutional Shares | + | (742) |
| Total distributions from net investment income | | (10,914) |
| Transactions in Fund Shares | |
| | | 8/25/16*-3/31/17 |
| | | SHARES | VALUE |
| Shares Sold | | | |
| Investor Shares | | 267,894 | $2,668,599 |
| Institutional Shares | + | 94,015 | 951,351 |
| Total shares sold | | 361,909 | $3,619,950 |
| Shares Reinvested | | | |
| Investor Shares | | 1,030 | $10,172 |
| Institutional Shares | + | 75 | 742 |
| Total shares reinvested | | 1,105 | $10,914 |
| Shares Redeemed | | | |
| Investor Shares | | (3,315) | ($33,293) |
| Institutional Shares | + | (1) | (10) |
| Total shares redeemed | | (3,316) | ($33,303) |
| Net transactions in fund shares | | 359,698 | $3,597,561 |
| Shares Outstanding and Net Assets | |
| | | 8/25/16*-3/31/17 |
| | | SHARES | NET ASSETS |
| Beginning of period | | — | $— |
| Total increase | + | 359,698 | 3,650,918 |
| End of period | | 359,698 | $3,650,918 |
| Net investment income not yet distributed | | | $6,493 |
| * | Commencement of operations. |
Schwab Target Index Funds | Annual Report
Schwab Target 2015 Index Fund
Financial Statements
Financial Highlights
| Investor Shares | 8/25/16 1–
3/31/17 | | | | | |
| Per-Share Data |
| Net asset value at beginning of period | $10.00 | | | | | |
| Income (loss) from investment operations: | | | | | | |
| Net investment income (loss)2 | 0.13 | | | | | |
| Net realized and unrealized gains (losses) | 0.13 | | | | | |
| Total from investment operations | 0.26 | | | | | |
| Less distributions: | | | | | | |
| Distributions from net investment income | (0.08) | | | | | |
| Net asset value at end of period | $10.18 | | | | | |
| Total return | 2.58% 3 | | | | | |
| Ratios/Supplemental Data |
| Ratios to average net assets: | | | | | | |
| Net operating expenses4 | 0.07% 5 | | | | | |
| Gross operating expenses4 | 0.13% 5 | | | | | |
| Net investment income (loss) | 2.17% 5 | | | | | |
| Portfolio turnover rate | 15% 3 | | | | | |
| Net assets, end of period (x 1,000) | $4,872 | | | | | |
| |
| Institutional Shares | 8/25/16 1–
3/31/17 | | | | | |
| Per-Share Data |
| Net asset value at beginning of period | $10.00 | | | | | |
| Income (loss) from investment operations: | | | | | | |
| Net investment income (loss)2 | 0.13 | | | | | |
| Net realized and unrealized gains (losses) | 0.12 | | | | | |
| Total from investment operations | 0.25 | | | | | |
| Less distributions: | | | | | | |
| Distributions from net investment income | (0.08) | | | | | |
| Net asset value at end of period | $10.17 | | | | | |
| Total return | 2.49% 3 | | | | | |
| Ratios/Supplemental Data |
| Ratios to average net assets: | | | | | | |
| Net operating expenses4 | 0.02% 5 | | | | | |
| Gross operating expenses4 | 0.08% 5 | | | | | |
| Net investment income (loss) | 2.15% 5 | | | | | |
| Portfolio turnover rate | 15% 3 | | | | | |
| Net assets, end of period (x 1,000) | $797 | | | | | |
1
Commencement of operations.
2
Calculated based on the average shares outstanding during the period.
3
Not annualized.
4
The expenses incurred by underlying funds in which the fund invests are not included in this ratio, if expenses incurred by the underlying funds were included in the ratio it would have increased 0.06% (see financial note 4).
5
Annualized.
Schwab Target Index Funds | Annual Report
Schwab Target 2015 Index Fund
Portfolio Holdings as of March 31, 2017
This section shows all the securities in the fund's portfolio and their values as of the report date.
The fund files its complete schedule of portfolio holdings with the SEC for the first and third quarters of each fiscal year on Form N-Q. The fund's Form N-Q is available on the SEC's website at www.sec.gov and may be viewed and copied at the SEC's Public Reference Room in Washington, D.C. Call 1-800-SEC-0330 for information on the operation of the Public Reference Room. The fund also makes available its complete schedule of portfolio holdings 15 to 20 days after calendar quarters on the fund's website at www.csimfunds.com/schwabfunds_prospectus.
| Holdings by Category | Cost ($) | Value ($) |
| 96.6% | Other Investment Companies | 5,385,243 | 5,477,736 |
| 4.4% | Short-Term Investments | 247,188 | 247,188 |
| 101.0% | Total Investments | 5,632,431 | 5,724,924 |
| (1.0%) | Other Assets and Liabilities, Net | | (56,398) |
| 100.0% | Net Assets | | 5,668,526 |
| Security | Number
of Shares | Value ($) |
| Other Investment Companies 96.6% of net assets |
| |
| U.S. Stocks 28.0% |
| Large-Cap 26.2% |
| Schwab U.S. Large-Cap ETF (a) | 26,384 | 1,484,628 |
| Small-Cap 1.8% |
| Schwab U.S. Small-Cap ETF (a) | 1,626 | 102,405 |
| | | 1,587,033 |
| |
| International Stock 10.0% |
| Developed-Market Large-Cap 10.0% |
| Schwab International Equity ETF (a) | 19,044 | 568,844 |
| |
| Real Assets 1.1% |
| Real Estate 1.1% |
| Schwab U.S. REIT ETF (a) | 1,536 | 62,638 |
| |
| Fixed Income 54.0% |
| Inflation-Protected Bond 6.1% |
| Schwab U.S. TIPS ETF (a) | 6,193 | 343,897 |
| Intermediate-Term Bond 39.9% |
| Schwab U.S. Aggregate Bond ETF (a) | 43,640 | 2,260,116 |
| Treasury Bond 8.0% |
| Schwab Short-Term U.S. Treasury ETF (a) | 9,013 | 454,796 |
| | | 3,058,809 |
| |
| Security | Number
of Shares | Value ($) |
| Money Market Fund 3.5% |
| Schwab Variable Share Price Money Fund, Ultra Shares 0.87% (a)(b) | 200,351 | 200,412 |
| Total Other Investment Companies |
| (Cost $5,385,243) | | 5,477,736 |
Issuer
Rate, Maturity Date | Face
Amount ($) | Value ($) |
| Short-Term Investments 4.4% of net assets |
| |
| Time Deposits 4.4% |
| BNP Paribas |
| 0.41%, 04/03/17 (c) | 76,527 | 76,527 |
| Sumitomo Mitsui Banking Corp. |
| 0.41%, 04/03/17 (c) | 170,661 | 170,661 |
| Total Short-Term Investments |
| (Cost $247,188) | | 247,188 |
End of Investments.
At 03/31/17, the tax basis cost of the fund's investments was $5,642,291 and the unrealized appreciation and depreciation were $95,341 and ($12,708), respectively, with a net unrealized appreciation of $82,633.
| (a) | Issuer is affiliated with the fund's investment adviser. |
| (b) | The rate shown is the 7-day yield. |
| (c) | The rate shown is the current daily overnight rate. |
| | |
| ETF — | Exchange-traded fund |
| REIT — | Real Estate Investment Trust |
| TIPS — | Treasury Inflation Protected Securities |
The following is a summary of the inputs used to value the fund's investments as of March 31, 2017 (see financial note 2(a) for additional information):
| Description | Quoted Prices in
Active Markets for
Identical Assets
(Level 1) | Other Significant
Observable Inputs
(Level 2) | Significant
Unobservable Inputs
(Level 3) | Total | |
| Other Investment Companies1 | $5,477,736 | $— | $— | $5,477,736 | |
| Short-Term Investments1 | — | 247,188 | — | 247,188 | |
| Total | $5,477,736 | $247,188 | $— | $5,724,924 | |
| 1 | As categorized in Portfolio Holdings. |
The fund's policy is to recognize transfers between Level 1, Level 2 and Level 3 as of the beginning of the fiscal year. There were no transfers between Level 1, Level 2 and Level 3 for the period ended March 31, 2017.
Schwab Target Index Funds | Annual Report
Schwab Target 2015 Index Fund
Statement of Assets and Liabilities
As of March 31, 2017
| Assets |
| Investments in affiliated underlying funds, at value (cost $5,385,243) | | $5,477,736 |
| Investments in unaffiliated issuers, at value (cost $247,188) | + | 247,188 |
| Total investments, at value (cost $5,632,431) | | 5,724,924 |
| Receivables: | | |
| Investments sold | | 43,984 |
| Fund shares sold | | 551,930 |
| Dividends | + | 80 |
| Total assets | | 6,320,918 |
| Liabilities |
| Payables: | | |
| Investments bought | | 133,232 |
| Investment adviser fees | | 139 |
| Shareholder service fees | | 207 |
| Fund shares redeemed | + | 518,814 |
| Total liabilities | | 652,392 |
| Net Assets |
| Total assets | | 6,320,918 |
| Total liabilities | – | 652,392 |
| Net assets | | $5,668,526 |
| Net Assets by Source | | |
| Capital received from investors | | 5,570,072 |
| Net investment income not yet distributed | | 13,148 |
| Net realized capital losses | | (7,187) |
| Net unrealized capital appreciation | | 92,493 |
| Net Asset Value (NAV) by Shares Class | |
| Share Class | Net Assets | ÷ | Shares
Outstanding | = | NAV |
| Investor Shares | $4,871,917 | | 478,806 | | $10.18 |
| Institutional Shares | $796,609 | | 78,325 | | $10.17 |
| | | | | | |
Schwab Target Index Funds | Annual Report
Schwab Target 2015 Index Fund
Statement of Operations
For the period August 25, 2016* through March 31, 2017
| Investment Income |
| Dividends received from affiliated underlying funds | | $38,714 |
| Interest | + | 263 |
| Total investment income | | 38,977 |
| Expenses |
| Investment adviser and administrator fees | | 1,399 |
| Shareholder service fees: | | |
| Investor Shares | + | 837 |
| Total expenses | | 2,236 |
| Expense reduction by CSIM | – | 1,137 |
| Net expenses | – | 1,099 |
| Net investment income | | 37,878 |
| Realized and Unrealized Gains (Losses) |
| Net realized losses on sales of affiliated underlying funds | | (7,187) |
| Net change in unrealized appreciation (depreciation) on affiliated underlying funds | + | 92,493 |
| Net realized and unrealized gains | | 85,306 |
| Increase in net assets resulting from operations | | $123,184 |
| * | Commencement of operations. |
Schwab Target Index Funds | Annual Report
Schwab Target 2015 Index Fund
Statement of Changes in Net Assets
For the current period only. Because the fund commenced operations on August 25, 2016, it has no prior report period
| Operations |
| | 8/25/16*-3/31/17 |
| Net investment income | | $37,878 |
| Net realized losses | | (7,187) |
| Net change in unrealized appreciation (depreciation) | + | 92,493 |
| Increase in net assets from operations | | 123,184 |
| Distributions to Shareholders |
| Distributions from net investment income | | |
| Investor Shares | | (23,959) |
| Institutional Shares | + | (771) |
| Total distributions from net investment income | | (24,730) |
| Transactions in Fund Shares | |
| | | 8/25/16*-3/31/17 |
| | | SHARES | VALUE |
| Shares Sold | | | |
| Investor Shares | | 587,984 | $5,884,658 |
| Institutional Shares | + | 78,248 | 792,672 |
| Total shares sold | | 666,232 | $6,677,330 |
| Shares Reinvested | | | |
| Investor Shares | | 2,350 | $23,249 |
| Institutional Shares | + | 78 | 771 |
| Total shares reinvested | | 2,428 | $24,020 |
| Shares Redeemed | | | |
| Investor Shares | | (111,528) | ($1,131,266) |
| Institutional Shares | + | (1) | (12) |
| Total shares redeemed | | (111,529) | ($1,131,278) |
| Net transactions in fund shares | | 557,131 | $5,570,072 |
| Shares Outstanding and Net Assets | |
| | | 8/25/16*-3/31/17 |
| | | SHARES | NET ASSETS |
| Beginning of period | | — | $— |
| Total increase | + | 557,131 | 5,668,526 |
| End of period | | 557,131 | $5,668,526 |
| Net investment income not yet distributed | | | $13,148 |
| * | Commencement of operations. |
Schwab Target Index Funds | Annual Report
Schwab Target 2020 Index Fund
Financial Statements
Financial Highlights
| Investor Shares | 8/25/16 1–
3/31/17 | | | | | |
| Per-Share Data |
| Net asset value at beginning of period | $10.00 | | | | | |
| Income (loss) from investment operations: | | | | | | |
| Net investment income (loss)2 | 0.13 | | | | | |
| Net realized and unrealized gains (losses) | 0.23 | | | | | |
| Total from investment operations | 0.36 | | | | | |
| Less distributions: | | | | | | |
| Distributions from net investment income | (0.07) | | | | | |
| Net asset value at end of period | $10.29 | | | | | |
| Total return | 3.59% 3 | | | | | |
| Ratios/Supplemental Data |
| Ratios to average net assets: | | | | | | |
| Net operating expenses4 | 0.08% 5 | | | | | |
| Gross operating expenses4 | 0.13% 5 | | | | | |
| Net investment income (loss) | 2.21% 5 | | | | | |
| Portfolio turnover rate | 17% 3 | | | | | |
| Net assets, end of period (x 1,000) | $8,046 | | | | | |
| |
| Institutional Shares | 8/25/16 1–
3/31/17 | | | | | |
| Per-Share Data |
| Net asset value at beginning of period | $10.00 | | | | | |
| Income (loss) from investment operations: | | | | | | |
| Net investment income (loss)2 | 0.16 | | | | | |
| Net realized and unrealized gains (losses) | 0.21 | | | | | |
| Total from investment operations | 0.37 | | | | | |
| Less distributions: | | | | | | |
| Distributions from net investment income | (0.07) | | | | | |
| Net asset value at end of period | $10.30 | | | | | |
| Total return | 3.69% 3 | | | | | |
| Ratios/Supplemental Data |
| Ratios to average net assets: | | | | | | |
| Net operating expenses4 | 0.03% 5 | | | | | |
| Gross operating expenses4 | 0.08% 5 | | | | | |
| Net investment income (loss) | 2.68% 5 | | | | | |
| Portfolio turnover rate | 17% 3 | | | | | |
| Net assets, end of period (x 1,000) | $5,455 | | | | | |
1
Commencement of operations.
2
Calculated based on the average shares outstanding during the period.
3
Not annualized.
4
The expenses incurred by underlying funds in which the fund invests are not included in this ratio, if expenses incurred by the underlying funds were included in the ratio it would have increased 0.05% (see financial note 4).
5
Annualized.
Schwab Target Index Funds | Annual Report
Schwab Target 2020 Index Fund
Portfolio Holdings as of March 31, 2017
This section shows all the securities in the fund's portfolio and their values as of the report date.
The fund files its complete schedule of portfolio holdings with the SEC for the first and third quarters of each fiscal year on Form N-Q. The fund's Form N-Q is available on the SEC's website at www.sec.gov and may be viewed and copied at the SEC's Public Reference Room in Washington, D.C. Call 1-800-SEC-0330 for information on the operation of the Public Reference Room. The fund also makes available its complete schedule of portfolio holdings 15 to 20 days after calendar quarters on the fund's website at www.csimfunds.com/schwabfunds_prospectus.
| Holdings by Category | Cost ($) | Value ($) |
| 96.5% | Other Investment Companies | 12,819,214 | 13,028,411 |
| 4.6% | Short-Term Investments | 627,656 | 627,656 |
| 101.1% | Total Investments | 13,446,870 | 13,656,067 |
| (1.1%) | Other Assets and Liabilities, Net | | (154,895) |
| 100.0% | Net Assets | | 13,501,172 |
| Security | Number
of Shares | Value ($) |
| Other Investment Companies 96.5% of net assets |
| |
| U.S. Stocks 34.0% |
| Large-Cap 31.6% |
| Schwab U.S. Large-Cap ETF (a) | 75,839 | 4,267,461 |
| Small-Cap 2.4% |
| Schwab U.S. Small-Cap ETF (a) | 5,041 | 317,482 |
| | | 4,584,943 |
| |
| International Stocks 13.7% |
| Developed-Market Large-Cap 13.0% |
| Schwab International Equity ETF (a) | 58,705 | 1,753,519 |
| Emerging-Market 0.7% |
| Schwab Emerging Markets Equity ETF (a) | 4,127 | 98,924 |
| | | 1,852,443 |
| |
| Real Assets 1.4% |
| Real Estate 1.4% |
| Schwab U.S. REIT ETF (a) | 4,730 | 192,889 |
| |
| Fixed Income 45.5% |
| Inflation-Protected Bond 3.5% |
| Schwab U.S. TIPS ETF (a) | 8,507 | 472,393 |
| Intermediate-Term Bond 36.6% |
| Schwab U.S. Aggregate Bond ETF (a) | 95,329 | 4,937,089 |
| Treasury Bond 5.4% |
| Schwab Short-Term U.S. Treasury ETF (a) | 14,493 | 731,317 |
| | | 6,140,799 |
| |
| Money Market Fund 1.9% |
| Schwab Variable Share Price Money Fund, Ultra Shares 0.87% (a)(b) | 257,260 | 257,337 |
| Total Other Investment Companies |
| (Cost $12,819,214) | | 13,028,411 |
Issuer
Rate, Maturity Date | Face
Amount ($) | Value ($) |
| Short-Term Investments 4.6% of net assets |
| |
| Time Deposits 4.6% |
| Australia & New Zealand Banking Group Ltd. |
| 0.41%, 04/03/17 (c) | 105,037 | 105,037 |
| BNP Paribas |
| 0.41%, 04/03/17 (c) | 105,037 | 105,037 |
| DNB |
| 0.41%, 04/03/17 (c) | 102,471 | 102,471 |
| JPMorgan Chase Bank |
| 0.41%, 04/03/17 (c) | 105,037 | 105,037 |
| Sumitomo Mitsui Banking Corp. |
| 0.41%, 04/03/17 (c) | 105,037 | 105,037 |
| Wells Fargo |
| 0.41%, 04/03/17 (c) | 105,037 | 105,037 |
| Total Short-Term Investments |
| (Cost $627,656) | | 627,656 |
End of Investments.
At 03/31/17, the tax basis cost of the fund's investments was $13,460,182 and the unrealized appreciation and depreciation were $195,900 and ($15), respectively, with a net unrealized appreciation of $195,885.
| (a) | Issuer is affiliated with the fund's investment adviser. |
| (b) | The rate shown is the 7-day yield. |
| (c) | The rate shown is the current daily overnight rate. |
| | |
| ETF — | Exchange-traded fund |
| REIT — | Real Estate Investment Trust |
| TIPS — | Treasury Inflation Protected Securities |
Schwab Target Index Funds | Annual Report
Schwab Target 2020 Index Fund
Portfolio Holdings as of March 31, 2017 (continued)
The following is a summary of the inputs used to value the fund's investments as of March 31, 2017 (see financial note 2(a) for additional information):
| Description | Quoted Prices in
Active Markets for
Identical Assets
(Level 1) | Other Significant
Observable Inputs
(Level 2) | Significant
Unobservable Inputs
(Level 3) | Total | |
| Other Investment Companies1 | $13,028,411 | $— | $— | $13,028,411 | |
| Short-Term Investments1 | — | 627,656 | — | 627,656 | |
| Total | $13,028,411 | $627,656 | $— | $13,656,067 | |
| 1 | As categorized in Portfolio Holdings. |
The fund's policy is to recognize transfers between Level 1, Level 2 and Level 3 as of the beginning of the fiscal year. There were no transfers between Level 1, Level 2 and Level 3 for the period ended March 31, 2017.
Schwab Target Index Funds | Annual Report
Schwab Target 2020 Index Fund
Statement of Assets and Liabilities
As of March 31, 2017
| Assets |
| Investments in affiliated underlying funds, at value (cost $12,819,214) | | $13,028,411 |
| Investments in unaffiliated issuers, at value (cost $627,656) | + | 627,656 |
| Total investments, at value (cost $13,446,870) | | 13,656,067 |
| Receivables: | | |
| Fund shares sold | | 3,004,319 |
| Dividends | + | 106 |
| Total assets | | 16,660,492 |
| Liabilities |
| Payables: | | |
| Investments bought | | 3,158,719 |
| Investment adviser fees | | 288 |
| Shareholder service fees | + | 313 |
| Total liabilities | | 3,159,320 |
| Net Assets |
| Total assets | | 16,660,492 |
| Total liabilities | – | 3,159,320 |
| Net assets | | $13,501,172 |
| Net Assets by Source | | |
| Capital received from investors | | 13,278,204 |
| Net investment income not yet distributed | | 26,061 |
| Net realized capital losses | | (12,290) |
| Net unrealized capital appreciation | | 209,197 |
| Net Asset Value (NAV) by Shares Class | |
| Share Class | Net Assets | ÷ | Shares
Outstanding | = | NAV |
| Investor Shares | $8,046,234 | | 781,857 | | $10.29 |
| Institutional Shares | $5,454,938 | | 529,785 | | $10.30 |
| | | | | | |
Schwab Target Index Funds | Annual Report
Schwab Target 2020 Index Fund
Statement of Operations
For the period August 25, 2016* through March 31, 2017
| Investment Income |
| Dividends received from affiliated underlying funds | | $57,496 |
| Interest | + | 412 |
| Total investment income | | 57,908 |
| Expenses |
| Investment adviser and administrator fees | | 1,956 |
| Shareholder service fees: | | |
| Investor Shares | + | 985 |
| Total expenses | | 2,941 |
| Expense reduction by CSIM and its affiliates | – | 1,240 |
| Net expenses | – | 1,701 |
| Net investment income | | 56,207 |
| Realized and Unrealized Gains (Losses) |
| Net realized losses on sales of affiliated underlying funds | | (12,290) |
| Net change in unrealized appreciation (depreciation) on affiliated underlying funds | + | 209,197 |
| Net realized and unrealized gains | | 196,907 |
| Increase in net assets resulting from operations | | $253,114 |
| * | Commencement of operations. |
Schwab Target Index Funds | Annual Report
Schwab Target 2020 Index Fund
Statement of Changes in Net Assets
For the current period only. Because the fund commenced operations on August 25, 2016, it has no prior report period
| Operations |
| | 8/25/16*-3/31/17 |
| Net investment income | | $56,207 |
| Net realized losses | | (12,290) |
| Net change in unrealized appreciation (depreciation) | + | 209,197 |
| Increase in net assets from operations | | 253,114 |
| Distributions to Shareholders |
| Distributions from net investment income | | |
| Investor Shares | | (24,391) |
| Institutional Shares | + | (5,755) |
| Total distributions from net investment income | | (30,146) |
| Transactions in Fund Shares | |
| | | 8/25/16*-3/31/17 |
| | | SHARES | VALUE |
| Shares Sold | | | |
| Investor Shares | | 917,276 | $9,234,087 |
| Institutional Shares | + | 532,580 | 5,445,182 |
| Total shares sold | | 1,449,856 | $14,679,269 |
| Shares Reinvested | | | |
| Investor Shares | | 2,358 | $23,440 |
| Institutional Shares | + | 578 | 5,755 |
| Total shares reinvested | | 2,936 | $29,195 |
| Shares Redeemed | | | |
| Investor Shares | | (137,777) | ($1,396,262) |
| Institutional Shares | + | (3,373) | (33,998) |
| Total shares redeemed | | (141,150) | ($1,430,260) |
| Net transactions in fund shares | | 1,311,642 | $13,278,204 |
| Shares Outstanding and Net Assets | |
| | | 8/25/16*-3/31/17 |
| | | SHARES | NET ASSETS |
| Beginning of period | | — | $— |
| Total increase | + | 1,311,642 | 13,501,172 |
| End of period | | 1,311,642 | $13,501,172 |
| Net investment income not yet distributed | | | $26,061 |
| * | Commencement of operations. |
Schwab Target Index Funds | Annual Report
Schwab Target 2025 Index Fund
Financial Statements
Financial Highlights
| Investor Shares | 8/25/16 1–
3/31/17 | | | | | |
| Per-Share Data |
| Net asset value at beginning of period | $10.00 | | | | | |
| Income (loss) from investment operations: | | | | | | |
| Net investment income (loss)2 | 0.15 | | | | | |
| Net realized and unrealized gains (losses) | 0.33 | | | | | |
| Total from investment operations | 0.48 | | | | | |
| Less distributions: | | | | | | |
| Distributions from net investment income | (0.08) | | | | | |
| Net asset value at end of period | $10.40 | | | | | |
| Total return | 4.81% 3 | | | | | |
| Ratios/Supplemental Data |
| Ratios to average net assets: | | | | | | |
| Net operating expenses4 | 0.08% 5 | | | | | |
| Gross operating expenses4 | 0.13% 5 | | | | | |
| Net investment income (loss) | 2.48% 5 | | | | | |
| Portfolio turnover rate | 6% 3 | | | | | |
| Net assets, end of period (x 1,000) | $17,208 | | | | | |
| |
| Institutional Shares | 8/25/16 1–
3/31/17 | | | | | |
| Per-Share Data |
| Net asset value at beginning of period | $10.00 | | | | | |
| Income (loss) from investment operations: | | | | | | |
| Net investment income (loss)2 | 0.14 | | | | | |
| Net realized and unrealized gains (losses) | 0.34 | | | | | |
| Total from investment operations | 0.48 | | | | | |
| Less distributions: | | | | | | |
| Distributions from net investment income | (0.08) | | | | | |
| Net asset value at end of period | $10.40 | | | | | |
| Total return | 4.82% 3 | | | | | |
| Ratios/Supplemental Data |
| Ratios to average net assets: | | | | | | |
| Net operating expenses4 | 0.03% 5 | | | | | |
| Gross operating expenses4 | 0.08% 5 | | | | | |
| Net investment income (loss) | 2.41% 5 | | | | | |
| Portfolio turnover rate | 6% 3 | | | | | |
| Net assets, end of period (x 1,000) | $1,649 | | | | | |
1
Commencement of operations.
2
Calculated based on the average shares outstanding during the period.
3
Not annualized.
4
The expenses incurred by underlying funds in which the fund invests are not included in this ratio, if expenses incurred by the underlying funds were included in the ratio it would have increased 0.05% (see financial note 4).
5
Annualized.
Schwab Target Index Funds | Annual Report
Schwab Target 2025 Index Fund
Portfolio Holdings as of March 31, 2017
This section shows all the securities in the fund's portfolio and their values as of the report date.
The fund files its complete schedule of portfolio holdings with the SEC for the first and third quarters of each fiscal year on Form N-Q. The fund's Form N-Q is available on the SEC's website at www.sec.gov and may be viewed and copied at the SEC's Public Reference Room in Washington, D.C. Call 1-800-SEC-0330 for information on the operation of the Public Reference Room. The fund also makes available its complete schedule of portfolio holdings 15 to 20 days after calendar quarters on the fund's website at www.csimfunds.com/schwabfunds_prospectus.
| Holdings by Category | Cost ($) | Value ($) |
| 97.0% | Other Investment Companies | 17,818,387 | 18,292,682 |
| 4.5% | Short-Term Investments | 850,809 | 850,809 |
| 101.5% | Total Investments | 18,669,196 | 19,143,491 |
| (1.5%) | Other Assets and Liabilities, Net | | (287,165) |
| 100.0% | Net Assets | | 18,856,326 |
| Security | Number
of Shares | Value ($) |
| Other Investment Companies 97.0% of net assets |
| |
| U.S. Stocks 41.4% |
| Large-Cap 38.2% |
| Schwab U.S. Large-Cap ETF (a) | 127,975 | 7,201,153 |
| Small-Cap 3.2% |
| Schwab U.S. Small-Cap ETF (a) | 9,550 | 601,459 |
| | | 7,802,612 |
| |
| International Stocks 17.8% |
| Developed-Market Large-Cap 16.4% |
| Schwab International Equity ETF (a) | 103,686 | 3,097,101 |
| Emerging-Market 1.4% |
| Schwab Emerging Markets Equity ETF (a) | 10,610 | 254,321 |
| | | 3,351,422 |
| |
| Real Assets 1.8% |
| Real Estate 1.8% |
| Schwab U.S. REIT ETF (a) | 8,164 | 332,928 |
| |
| Fixed Income 34.7% |
| Inflation-Protected Bond 1.0% |
| Schwab U.S. TIPS ETF (a) | 3,494 | 194,022 |
| Intermediate-Term Bond 30.9% |
| Schwab U.S. Aggregate Bond ETF (a) | 112,471 | 5,824,873 |
| Treasury Bond 2.8% |
| Schwab Short-Term U.S. Treasury ETF (a) | 10,631 | 536,440 |
| | | 6,555,335 |
| |
| Security | Number
of Shares | Value ($) |
| Money Market Fund 1.3% |
| Schwab Variable Share Price Money Fund, Ultra Shares 0.87% (a)(b) | 250,310 | 250,385 |
| Total Other Investment Companies |
| (Cost $17,818,387) | | 18,292,682 |
Issuer
Rate, Maturity Date | Face
Amount ($) | Value ($) |
| Short-Term Investments 4.5% of net assets |
| |
| Time Deposits 4.5% |
| BNP Paribas |
| 0.41%, 04/03/17 (c) | 178,021 | 178,021 |
| DNB |
| 0.41%, 04/03/17 (c) | 178,021 | 178,021 |
| National Australia Bank |
| 0.41%, 04/03/17 (c) | 138,725 | 138,725 |
| Sumitomo Mitsui Banking Corp. |
| 0.41%, 04/03/17 (c) | 178,021 | 178,021 |
| Wells Fargo |
| 0.41%, 04/03/17 (c) | 178,021 | 178,021 |
| Total Short-Term Investments |
| (Cost $850,809) | | 850,809 |
End of Investments.
At 03/31/17, the tax basis cost of the fund's investments was $18,673,283 and the unrealized appreciation and depreciation were $493,750 and ($23,542), respectively, with a net unrealized appreciation of $470,208.
| (a) | Issuer is affiliated with the fund's investment adviser. |
| (b) | The rate shown is the 7-day yield. |
| (c) | The rate shown is the current daily overnight rate. |
| | |
| ETF — | Exchange-traded fund |
| REIT — | Real Estate Investment Trust |
| TIPS — | Treasury Inflation Protected Securities |
The following is a summary of the inputs used to value the fund's investments as of March 31, 2017 (see financial note 2(a) for additional information):
| Description | Quoted Prices in
Active Markets for
Identical Assets
(Level 1) | Other Significant
Observable Inputs
(Level 2) | Significant
Unobservable Inputs
(Level 3) | Total | |
| Other Investment Companies1 | $18,292,682 | $— | $— | $18,292,682 | |
| Short-Term Investments1 | — | 850,809 | — | 850,809 | |
| Total | $18,292,682 | $850,809 | $— | $19,143,491 | |
| 1 | As categorized in Portfolio Holdings. |
The fund's policy is to recognize transfers between Level 1, Level 2 and Level 3 as of the beginning of the fiscal year. There were no transfers between Level 1, Level 2 and Level 3 for the period ended March 31, 2017.
Schwab Target Index Funds | Annual Report
Schwab Target 2025 Index Fund
Statement of Assets and Liabilities
As of March 31, 2017
| Assets |
| Investments in affiliated underlying funds, at value (cost $17,818,387) | | $18,292,682 |
| Investments in unaffiliated issuers, at value (cost $850,809) | + | 850,809 |
| Total investments, at value (cost $18,669,196) | | 19,143,491 |
| Receivables: | | |
| Fund shares sold | | 1,267,186 |
| Dividends | + | 106 |
| Total assets | | 20,410,783 |
| Liabilities |
| Payables: | | |
| Investments bought | | 1,361,632 |
| Investment adviser fees | | 497 |
| Shareholder service fees | | 664 |
| Fund shares redeemed | + | 191,664 |
| Total liabilities | | 1,554,457 |
| Net Assets |
| Total assets | | 20,410,783 |
| Total liabilities | – | 1,554,457 |
| Net assets | | $18,856,326 |
| Net Assets by Source | | |
| Capital received from investors | | 18,341,540 |
| Net investment income not yet distributed | | 44,393 |
| Net realized capital losses | | (3,902) |
| Net unrealized capital appreciation | | 474,295 |
| Net Asset Value (NAV) by Shares Class | |
| Share Class | Net Assets | ÷ | Shares
Outstanding | = | NAV |
| Investor Shares | $17,207,649 | | 1,654,411 | | $10.40 |
| Institutional Shares | $1,648,677 | | 158,509 | | $10.40 |
| | | | | | |
Schwab Target Index Funds | Annual Report
Schwab Target 2025 Index Fund
Statement of Operations
For the period August 25, 2016* through March 31, 2017
| Investment Income |
| Dividends received from affiliated underlying funds | | $118,793 |
| Interest | + | 632 |
| Total investment income | | 119,425 |
| Expenses |
| Investment adviser and administrator fees | | 3,734 |
| Shareholder service fees: | | |
| Investor Shares | + | 2,269 |
| Total expenses | | 6,003 |
| Expense reduction by CSIM | – | 2,344 |
| Net expenses | – | 3,659 |
| Net investment income | | 115,766 |
| Realized and Unrealized Gains (Losses) |
| Net realized losses on sales of affiliated underlying funds | | (3,902) |
| Net change in unrealized appreciation (depreciation) on affiliated underlying funds | + | 474,295 |
| Net realized and unrealized gains | | 470,393 |
| Increase in net assets resulting from operations | | $586,159 |
| * | Commencement of operations. |
Schwab Target Index Funds | Annual Report
Schwab Target 2025 Index Fund
Statement of Changes in Net Assets
For the current period only. Because the fund commenced operations on August 25, 2016, it has no prior report period
| Operations |
| | 8/25/16*-3/31/17 |
| Net investment income | | $115,766 |
| Net realized losses | | (3,902) |
| Net change in unrealized appreciation (depreciation) | + | 474,295 |
| Increase in net assets from operations | | 586,159 |
| Distributions to Shareholders |
| Distributions from net investment income | | |
| Investor Shares | | (70,338) |
| Institutional Shares | + | (1,035) |
| Total distributions from net investment income | | (71,373) |
| Transactions in Fund Shares | |
| | | 8/25/16*-3/31/17 |
| | | SHARES | VALUE |
| Shares Sold | | | |
| Investor Shares | | 1,778,012 | $17,975,764 |
| Institutional Shares | + | 158,407 | 1,636,344 |
| Total shares sold | | 1,936,419 | $19,612,108 |
| Shares Reinvested | | | |
| Investor Shares | | 6,970 | $69,634 |
| Institutional Shares | + | 104 | 1,035 |
| Total shares reinvested | | 7,074 | $70,669 |
| Shares Redeemed | | | |
| Investor Shares | | (130,571) | ($1,341,220) |
| Institutional Shares | + | (2) | (17) |
| Total shares redeemed | | (130,573) | ($1,341,237) |
| Net transactions in fund shares | | 1,812,920 | $18,341,540 |
| Shares Outstanding and Net Assets | |
| | | 8/25/16*-3/31/17 |
| | | SHARES | NET ASSETS |
| Beginning of period | | — | $— |
| Total increase | + | 1,812,920 | 18,856,326 |
| End of period | | 1,812,920 | $18,856,326 |
| Net investment income not yet distributed | | | $44,393 |
| * | Commencement of operations. |
Schwab Target Index Funds | Annual Report
Schwab Target 2030 Index Fund
Financial Statements
Financial Highlights
| Investor Shares | 8/25/16 1–
3/31/17 | | | | | |
| Per-Share Data |
| Net asset value at beginning of period | $10.00 | | | | | |
| Income (loss) from investment operations: | | | | | | |
| Net investment income (loss)2 | 0.17 | | | | | |
| Net realized and unrealized gains (losses) | 0.39 | | | | | |
| Total from investment operations | 0.56 | | | | | |
| Less distributions: | | | | | | |
| Distributions from net investment income | (0.10) | | | | | |
| Net asset value at end of period | $10.46 | | | | | |
| Total return | 5.66% 3 | | | | | |
| Ratios/Supplemental Data |
| Ratios to average net assets: | | | | | | |
| Net operating expenses4 | 0.08% 5 | | | | | |
| Gross operating expenses4 | 0.13% 5 | | | | | |
| Net investment income (loss) | 2.91% 5 | | | | | |
| Portfolio turnover rate | 7% 3 | | | | | |
| Net assets, end of period (x 1,000) | $13,085 | | | | | |
| |
| Institutional Shares | 8/25/16 1–
3/31/17 | | | | | |
| Per-Share Data |
| Net asset value at beginning of period | $10.00 | | | | | |
| Income (loss) from investment operations: | | | | | | |
| Net investment income (loss)2 | 0.15 | | | | | |
| Net realized and unrealized gains (losses) | 0.41 | | | | | |
| Total from investment operations | 0.56 | | | | | |
| Less distributions: | | | | | | |
| Distributions from net investment income | (0.10) | | | | | |
| Net asset value at end of period | $10.46 | | | | | |
| Total return | 5.66% 3 | | | | | |
| Ratios/Supplemental Data |
| Ratios to average net assets: | | | | | | |
| Net operating expenses4 | 0.03% 5 | | | | | |
| Gross operating expenses4 | 0.08% 5 | | | | | |
| Net investment income (loss) | 2.49% 5 | | | | | |
| Portfolio turnover rate | 7% 3 | | | | | |
| Net assets, end of period (x 1,000) | $3,258 | | | | | |
1
Commencement of operations.
2
Calculated based on the average shares outstanding during the period.
3
Not annualized.
4
The expenses incurred by underlying funds in which the fund invests are not included in this ratio, if expenses incurred by the underlying funds were included in the ratio it would have increased 0.05% (see financial note 4).
5
Annualized.
Schwab Target Index Funds | Annual Report
Schwab Target 2030 Index Fund
Portfolio Holdings as of March 31, 2017
This section shows all the securities in the fund's portfolio and their values as of the report date.
The fund files its complete schedule of portfolio holdings with the SEC for the first and third quarters of each fiscal year on Form N-Q. The fund's Form N-Q is available on the SEC's website at www.sec.gov and may be viewed and copied at the SEC's Public Reference Room in Washington, D.C. Call 1-800-SEC-0330 for information on the operation of the Public Reference Room. The fund also makes available its complete schedule of portfolio holdings 15 to 20 days after calendar quarters on the fund's website at www.csimfunds.com/schwabfunds_prospectus.
| Holdings by Category | Cost ($) | Value ($) |
| 97.2% | Other Investment Companies | 15,494,538 | 15,882,680 |
| 3.7% | Short-Term Investments | 611,814 | 611,814 |
| 100.9% | Total Investments | 16,106,352 | 16,494,494 |
| (0.9%) | Other Assets and Liabilities, Net | | (151,574) |
| 100.0% | Net Assets | | 16,342,920 |
| Security | Number
of Shares | Value ($) |
| Other Investment Companies 97.2% of net assets |
| |
| U.S. Stocks 46.8% |
| Large-Cap 42.7% |
| Schwab U.S. Large-Cap ETF (a) | 124,173 | 6,987,215 |
| Small-Cap 4.1% |
| Schwab U.S. Small-Cap ETF (a) | 10,529 | 663,116 |
| | | 7,650,331 |
| |
| International Stocks 21.0% |
| Developed-Market Large-Cap 19.0% |
| Schwab International Equity ETF (a) | 104,155 | 3,111,110 |
| Emerging-Market 2.0% |
| Schwab Emerging Markets Equity ETF (a) | 13,339 | 319,736 |
| | | 3,430,846 |
| |
| Real Assets 2.2% |
| Real Estate 2.2% |
| Schwab U.S. REIT ETF (a) | 8,847 | 360,781 |
| |
| Fixed Income 26.9% |
| Intermediate-Term Bond 25.2% |
| Schwab U.S. Aggregate Bond ETF (a) | 79,641 | 4,124,607 |
| Treasury Bond 1.7% |
| Schwab Short-Term U.S. Treasury ETF (a) | 5,371 | 271,021 |
| | | 4,395,628 |
| |
| Security | Number
of Shares | Value ($) |
| Money Market Fund 0.3% |
| Schwab Variable Share Price Money Fund, Ultra Shares 0.87% (a)(b) | 45,081 | 45,094 |
| Total Other Investment Companies |
| (Cost $15,494,538) | | 15,882,680 |
Issuer
Rate, Maturity Date | Face
Amount ($) | Value ($) |
| Short-Term Investments 3.7% of net assets |
| |
| Time Deposits 3.7% |
| BNP Paribas |
| 0.41%, 04/03/17 (c) | 154,783 | 154,783 |
| JPMorgan Chase Bank |
| 0.41%, 04/03/17 (c) | 154,783 | 154,783 |
| Sumitomo Mitsui Banking Corp. |
| 0.41%, 04/03/17 (c) | 154,783 | 154,783 |
| Wells Fargo |
| 0.41%, 04/03/17 (c) | 147,465 | 147,465 |
| Total Short-Term Investments |
| (Cost $611,814) | | 611,814 |
End of Investments.
At 03/31/17, the tax basis cost of the fund's investments was $16,118,536 and the unrealized appreciation and depreciation were $384,560 and ($8,602), respectively, with a net unrealized appreciation of $375,958.
| (a) | Issuer is affiliated with the fund's investment adviser. |
| (b) | The rate shown is the 7-day yield. |
| (c) | The rate shown is the current daily overnight rate. |
| | |
| ETF — | Exchange-traded fund |
| REIT — | Real Estate Investment Trust |
The following is a summary of the inputs used to value the fund's investments as of March 31, 2017 (see financial note 2(a) for additional information):
| Description | Quoted Prices in
Active Markets for
Identical Assets
(Level 1) | Other Significant
Observable Inputs
(Level 2) | Significant
Unobservable Inputs
(Level 3) | Total | |
| Other Investment Companies1 | $15,882,680 | $— | $— | $15,882,680 | |
| Short-Term Investments1 | — | 611,814 | — | 611,814 | |
| Total | $15,882,680 | $611,814 | $— | $16,494,494 | |
| 1 | As categorized in Portfolio Holdings. |
The fund's policy is to recognize transfers between Level 1, Level 2 and Level 3 as of the beginning of the fiscal year. There were no transfers between Level 1, Level 2 and Level 3 for the period ended March 31, 2017.
Schwab Target Index Funds | Annual Report
Schwab Target 2030 Index Fund
Statement of Assets and Liabilities
As of March 31, 2017
| Assets |
| Investments in affiliated underlying funds, at value (cost $15,494,538) | | $15,882,680 |
| Investments in unaffiliated issuers, at value (cost $611,814) | + | 611,814 |
| Total investments, at value (cost $16,106,352) | | 16,494,494 |
| Receivables: | | |
| Fund shares sold | | 887,328 |
| Dividends | + | 23 |
| Total assets | | 17,381,845 |
| Liabilities |
| Payables: | | |
| Investments bought | | 1,037,999 |
| Investment adviser fees | | 437 |
| Shareholder service fees | + | 489 |
| Total liabilities | | 1,038,925 |
| Net Assets |
| Total assets | | 17,381,845 |
| Total liabilities | – | 1,038,925 |
| Net assets | | $16,342,920 |
| Net Assets by Source | | |
| Capital received from investors | | 15,929,343 |
| Net investment income not yet distributed | | 37,619 |
| Net realized capital losses | | (12,184) |
| Net unrealized capital appreciation | | 388,142 |
| Net Asset Value (NAV) by Shares Class | |
| Share Class | Net Assets | ÷ | Shares
Outstanding | = | NAV |
| Investor Shares | $13,085,326 | | 1,250,985 | | $10.46 |
| Institutional Shares | $3,257,594 | | 311,518 | | $10.46 |
| | | | | | |
Schwab Target Index Funds | Annual Report
Schwab Target 2030 Index Fund
Statement of Operations
For the period August 25, 2016* through March 31, 2017
| Investment Income |
| Dividends received from affiliated underlying funds | | $109,024 |
| Interest | + | 540 |
| Total investment income | | 109,564 |
| Expenses |
| Investment adviser and administrator fees | | 2,990 |
| Shareholder service fees: | | |
| Investor Shares | + | 1,670 |
| Total expenses | | 4,660 |
| Expense reduction by CSIM | – | 2,108 |
| Net expenses | – | 2,552 |
| Net investment income | | 107,012 |
| Realized and Unrealized Gains (Losses) |
| Net realized losses on sales of affiliated underlying funds | | (12,184) |
| Net change in unrealized appreciation (depreciation) on affiliated underlying funds | + | 388,142 |
| Net realized and unrealized gains | | 375,958 |
| Increase in net assets resulting from operations | | $482,970 |
| * | Commencement of operations. |
Schwab Target Index Funds | Annual Report
Schwab Target 2030 Index Fund
Statement of Changes in Net Assets
For the current period only. Because the fund commenced operations on August 25, 2016, it has no prior report period
| Operations |
| | 8/25/16*-3/31/17 |
| Net investment income | | $107,012 |
| Net realized losses | | (12,184) |
| Net change in unrealized appreciation (depreciation) | + | 388,142 |
| Increase in net assets from operations | | 482,970 |
| Distributions to Shareholders |
| Distributions from net investment income | | |
| Investor Shares | | (61,903) |
| Institutional Shares | + | (7,490) |
| Total distributions from net investment income | | (69,393) |
| Transactions in Fund Shares | |
| | | 8/25/16*-3/31/17 |
| | | SHARES | VALUE |
| Shares Sold | | | |
| Investor Shares | | 1,383,363 | $14,060,631 |
| Institutional Shares | + | 322,973 | 3,328,447 |
| Total shares sold | | 1,706,336 | $17,389,078 |
| Shares Reinvested | | | |
| Investor Shares | | 6,106 | $61,060 |
| Institutional Shares | + | 749 | 7,490 |
| Total shares reinvested | | 6,855 | $68,550 |
| Shares Redeemed | | | |
| Investor Shares | | (138,484) | ($1,403,984) |
| Institutional Shares | + | (12,204) | (124,301) |
| Total shares redeemed | | (150,688) | ($1,528,285) |
| Net transactions in fund shares | | 1,562,503 | $15,929,343 |
| Shares Outstanding and Net Assets | |
| | | 8/25/16*-3/31/17 |
| | | SHARES | NET ASSETS |
| Beginning of period | | — | $— |
| Total increase | + | 1,562,503 | 16,342,920 |
| End of period | | 1,562,503 | $16,342,920 |
| Net investment income not yet distributed | | | $37,619 |
| * | Commencement of operations. |
Schwab Target Index Funds | Annual Report
Schwab Target 2035 Index Fund
Financial Statements
Financial Highlights
| Investor Shares | 8/25/16 1–
3/31/17 | | | | | |
| Per-Share Data |
| Net asset value at beginning of period | $10.00 | | | | | |
| Income (loss) from investment operations: | | | | | | |
| Net investment income (loss)2 | 0.17 | | | | | |
| Net realized and unrealized gains (losses) | 0.46 | | | | | |
| Total from investment operations | 0.63 | | | | | |
| Less distributions: | | | | | | |
| Distributions from net investment income | (0.10) | | | | | |
| Net asset value at end of period | $10.53 | | | | | |
| Total return | 6.33% 3 | | | | | |
| Ratios/Supplemental Data |
| Ratios to average net assets: | | | | | | |
| Net operating expenses4 | 0.08% 5 | | | | | |
| Gross operating expenses4 | 0.13% 5 | | | | | |
| Net investment income (loss) | 2.74% 5 | | | | | |
| Portfolio turnover rate | 13% 3 | | | | | |
| Net assets, end of period (x 1,000) | $11,407 | | | | | |
| |
| Institutional Shares | 8/25/16 1–
3/31/17 | | | | | |
| Per-Share Data |
| Net asset value at beginning of period | $10.00 | | | | | |
| Income (loss) from investment operations: | | | | | | |
| Net investment income (loss)2 | 0.12 | | | | | |
| Net realized and unrealized gains (losses) | 0.52 | | | | | |
| Total from investment operations | 0.64 | | | | | |
| Less distributions: | | | | | | |
| Distributions from net investment income | (0.10) | | | | | |
| Net asset value at end of period | $10.54 | | | | | |
| Total return | 6.44% 3 | | | | | |
| Ratios/Supplemental Data |
| Ratios to average net assets: | | | | | | |
| Net operating expenses4 | 0.03% 5 | | | | | |
| Gross operating expenses4 | 0.08% 5 | | | | | |
| Net investment income (loss) | 2.04% 5 | | | | | |
| Portfolio turnover rate | 13% 3 | | | | | |
| Net assets, end of period (x 1,000) | $1,904 | | | | | |
1
Commencement of operations.
2
Calculated based on the average shares outstanding during the period.
3
Not annualized.
4
The expenses incurred by underlying funds in which the fund invests are not included in this ratio, if expenses incurred by the underlying funds were included in the ratio it would have increased 0.05% (see financial note 4).
5
Annualized.
Schwab Target Index Funds | Annual Report
Schwab Target 2035 Index Fund
Portfolio Holdings as of March 31, 2017
This section shows all the securities in the fund's portfolio and their values as of the report date.
The fund files its complete schedule of portfolio holdings with the SEC for the first and third quarters of each fiscal year on Form N-Q. The fund's Form N-Q is available on the SEC's website at www.sec.gov and may be viewed and copied at the SEC's Public Reference Room in Washington, D.C. Call 1-800-SEC-0330 for information on the operation of the Public Reference Room. The fund also makes available its complete schedule of portfolio holdings 15 to 20 days after calendar quarters on the fund's website at www.csimfunds.com/schwabfunds_prospectus.
| Holdings by Category | Cost ($) | Value ($) |
| 97.7% | Other Investment Companies | 12,590,279 | 13,007,355 |
| 4.9% | Short-Term Investments | 653,377 | 653,377 |
| 102.6% | Total Investments | 13,243,656 | 13,660,732 |
| (2.6%) | Other Assets and Liabilities, Net | | (349,706) |
| 100.0% | Net Assets | | 13,311,026 |
| Security | Number
of Shares | Value ($) |
| Other Investment Companies 97.7% of net assets |
| |
| U.S. Stocks 50.8% |
| Large-Cap 45.9% |
| Schwab U.S. Large-Cap ETF (a) | 108,718 | 6,117,562 |
| Small-Cap 4.9% |
| Schwab U.S. Small-Cap ETF (a) | 10,291 | 648,127 |
| | | 6,765,689 |
| |
| International Stocks 23.9% |
| Developed-Market Large-Cap 21.3% |
| Schwab International Equity ETF (a) | 95,041 | 2,838,875 |
| Emerging-Market 2.6% |
| Schwab Emerging Markets Equity ETF (a) | 14,049 | 336,754 |
| | | 3,175,629 |
| |
| Real Assets 2.6% |
| Real Estate 2.6% |
| Schwab U.S. REIT ETF (a) | 8,573 | 349,607 |
| |
| Fixed Income 20.4% |
| Intermediate-Term Bond 19.3% |
| Schwab U.S. Aggregate Bond ETF (a) | 49,600 | 2,568,784 |
| Treasury Bond 1.1% |
| Schwab Short-Term U.S. Treasury ETF (a) | 2,926 | 147,646 |
| | | 2,716,430 |
| Total Other Investment Companies |
| (Cost $12,590,279) | | 13,007,355 |
Issuer
Rate, Maturity Date | Face
Amount ($) | Value ($) |
| Short-Term Investments 4.9% of net assets |
| |
| Time Deposits 4.9% |
| Australia & New Zealand Banking Group Ltd. |
| 0.41%, 04/03/17 (b) | 120,616 | 120,616 |
| BNP Paribas |
| 0.41%, 04/03/17 (b) | 120,616 | 120,616 |
| Citibank |
| 0.41%, 04/03/17 (b) | 120,616 | 120,616 |
| DNB |
| 0.41%, 04/03/17 (b) | 120,616 | 120,616 |
| JPMorgan Chase Bank |
| 0.41%, 04/03/17 (b) | 50,297 | 50,297 |
| National Australia Bank |
| 0.41%, 04/03/17 (b) | 120,616 | 120,616 |
| Total Short-Term Investments |
| (Cost $653,377) | | 653,377 |
End of Investments.
At 03/31/17, the tax basis cost of the fund's investments was $13,253,000 and the unrealized appreciation and depreciation were $417,150 and ($9,418), respectively, with a net unrealized appreciation of $407,732.
| (a) | Issuer is affiliated with the fund's investment adviser. |
| (b) | The rate shown is the current daily overnight rate. |
| | |
| ETF — | Exchange-traded fund |
| REIT — | Real Estate Investment Trust |
The following is a summary of the inputs used to value the fund's investments as of March 31, 2017 (see financial note 2(a) for additional information):
| Description | Quoted Prices in
Active Markets for
Identical Assets
(Level 1) | Other Significant
Observable Inputs
(Level 2) | Significant
Unobservable Inputs
(Level 3) | Total | |
| Other Investment Companies1 | $13,007,355 | $— | $— | $13,007,355 | |
| Short-Term Investments1 | — | 653,377 | — | 653,377 | |
| Total | $13,007,355 | $653,377 | $— | $13,660,732 | |
| 1 | As categorized in Portfolio Holdings. |
The fund's policy is to recognize transfers between Level 1, Level 2 and Level 3 as of the beginning of the fiscal year. There were no transfers between Level 1, Level 2 and Level 3 for the period ended March 31, 2017.
Schwab Target Index Funds | Annual Report
Schwab Target 2035 Index Fund
Statement of Assets and Liabilities
As of March 31, 2017
| Assets |
| Investments in affiliated underlying funds, at value (cost $12,590,279) | | $13,007,355 |
| Investments in unaffiliated issuers, at value (cost $653,377) | + | 653,377 |
| Total investments, at value (cost $13,243,656) | | 13,660,732 |
| Receivables: | | |
| Fund shares sold | + | 1,266,326 |
| Total assets | | 14,927,058 |
| Liabilities |
| Payables: | | |
| Investments bought | | 1,615,237 |
| Investment adviser fees | | 350 |
| Shareholder service fees | + | 445 |
| Total liabilities | | 1,616,032 |
| Net Assets |
| Total assets | | 14,927,058 |
| Total liabilities | – | 1,616,032 |
| Net assets | | $13,311,026 |
| Net Assets by Source | | |
| Capital received from investors | | 12,872,738 |
| Net investment income not yet distributed | | 29,219 |
| Net realized capital losses | | (8,007) |
| Net unrealized capital appreciation | | 417,076 |
| Net Asset Value (NAV) by Shares Class | |
| Share Class | Net Assets | ÷ | Shares
Outstanding | = | NAV |
| Investor Shares | $11,407,044 | | 1,083,304 | | $10.53 |
| Institutional Shares | $1,903,982 | | 180,704 | | $10.54 |
| | | | | | |
Schwab Target Index Funds | Annual Report
Schwab Target 2035 Index Fund
Statement of Operations
For the period August 25, 2016* through March 31, 2017
| Investment Income |
| Dividends received from affiliated underlying funds | | $93,136 |
| Interest | + | 599 |
| Total investment income | | 93,735 |
| Expenses |
| Investment adviser and administrator fees | | 2,697 |
| Shareholder service fees: | | |
| Investor Shares | + | 1,612 |
| Total expenses | | 4,309 |
| Expense reduction by CSIM and its affiliates | – | 1,790 |
| Net expenses | – | 2,519 |
| Net investment income | | 91,216 |
| Realized and Unrealized Gains (Losses) |
| Net realized losses on sales of affiliated underlying funds | | (8,007) |
| Net change in unrealized appreciation (depreciation) on affiliated underlying funds | + | 417,076 |
| Net realized and unrealized gains | | 409,069 |
| Increase in net assets resulting from operations | | $500,285 |
| * | Commencement of operations. |
Schwab Target Index Funds | Annual Report
Schwab Target 2035 Index Fund
Statement of Changes in Net Assets
For the current period only. Because the fund commenced operations on August 25, 2016, it has no prior report period
| Operations |
| | 8/25/16*-3/31/17 |
| Net investment income | | $91,216 |
| Net realized losses | | (8,007) |
| Net change in unrealized appreciation (depreciation) | + | 417,076 |
| Increase in net assets from operations | | 500,285 |
| Distributions to Shareholders |
| Distributions from net investment income | | |
| Investor Shares | | (59,014) |
| Institutional Shares | + | (2,983) |
| Total distributions from net investment income | | (61,997) |
| Transactions in Fund Shares | |
| | | 8/25/16*-3/31/17 |
| | | SHARES | VALUE |
| Shares Sold | | | |
| Investor Shares | | 1,186,207 | $12,040,095 |
| Institutional Shares | + | 180,408 | 1,883,415 |
| Total shares sold | | 1,366,615 | $13,923,510 |
| Shares Reinvested | | | |
| Investor Shares | | 5,816 | $58,332 |
| Institutional Shares | + | 297 | 2,983 |
| Total shares reinvested | | 6,113 | $61,315 |
| Shares Redeemed | | | |
| Investor Shares | | (108,719) | ($1,112,070) |
| Institutional Shares | + | (1) | (17) |
| Total shares redeemed | | (108,720) | ($1,112,087) |
| Net transactions in fund shares | | 1,264,008 | $12,872,738 |
| Shares Outstanding and Net Assets | |
| | | 8/25/16*-3/31/17 |
| | | SHARES | NET ASSETS |
| Beginning of period | | — | $— |
| Total increase | + | 1,264,008 | 13,311,026 |
| End of period | | 1,264,008 | $13,311,026 |
| Net investment income not yet distributed | | | $29,219 |
| * | Commencement of operations. |
Schwab Target Index Funds | Annual Report
Schwab Target 2040 Index Fund
Financial Statements
Financial Highlights
| Investor Shares | 8/25/16 1–
3/31/17 | | | | | |
| Per-Share Data |
| Net asset value at beginning of period | $10.00 | | | | | |
| Income (loss) from investment operations: | | | | | | |
| Net investment income (loss)2 | 0.17 | | | | | |
| Net realized and unrealized gains (losses) | 0.53 | | | | | |
| Total from investment operations | 0.70 | | | | | |
| Less distributions: | | | | | | |
| Distributions from net investment income | (0.11) | | | | | |
| Net asset value at end of period | $10.59 | | | | | |
| Total return | 7.08% 3 | | | | | |
| Ratios/Supplemental Data |
| Ratios to average net assets: | | | | | | |
| Net operating expenses4 | 0.08% 5 | | | | | |
| Gross operating expenses4 | 0.13% 5 | | | | | |
| Net investment income (loss) | 2.79% 5 | | | | | |
| Portfolio turnover rate | 8% 3 | | | | | |
| Net assets, end of period (x 1,000) | $11,738 | | | | | |
| |
| Institutional Shares | 8/25/16 1–
3/31/17 | | | | | |
| Per-Share Data |
| Net asset value at beginning of period | $10.00 | | | | | |
| Income (loss) from investment operations: | | | | | | |
| Net investment income (loss)2 | 0.15 | | | | | |
| Net realized and unrealized gains (losses) | 0.55 | | | | | |
| Total from investment operations | 0.70 | | | | | |
| Less distributions: | | | | | | |
| Distributions from net investment income | (0.11) | | | | | |
| Net asset value at end of period | $10.59 | | | | | |
| Total return | 7.09% 3 | | | | | |
| Ratios/Supplemental Data |
| Ratios to average net assets: | | | | | | |
| Net operating expenses4 | 0.03% 5 | | | | | |
| Gross operating expenses4 | 0.08% 5 | | | | | |
| Net investment income (loss) | 2.48% 5 | | | | | |
| Portfolio turnover rate | 8% 3 | | | | | |
| Net assets, end of period (x 1,000) | $1,514 | | | | | |
1
Commencement of operations.
2
Calculated based on the average shares outstanding during the period.
3
Not annualized.
4
The expenses incurred by underlying funds in which the fund invests are not included in this ratio, if expenses incurred by the underlying funds were included in the ratio it would have increased 0.05% (see financial note 4).
5
Annualized.
Schwab Target Index Funds | Annual Report
Schwab Target 2040 Index Fund
Portfolio Holdings as of March 31, 2017
This section shows all the securities in the fund's portfolio and their values as of the report date.
The fund files its complete schedule of portfolio holdings with the SEC for the first and third quarters of each fiscal year on Form N-Q. The fund's Form N-Q is available on the SEC's website at www.sec.gov and may be viewed and copied at the SEC's Public Reference Room in Washington, D.C. Call 1-800-SEC-0330 for information on the operation of the Public Reference Room. The fund also makes available its complete schedule of portfolio holdings 15 to 20 days after calendar quarters on the fund's website at www.csimfunds.com/schwabfunds_prospectus.
| Holdings by Category | Cost ($) | Value ($) |
| 98.3% | Other Investment Companies | 12,614,847 | 13,022,404 |
| 2.0% | Short-Term Investments | 268,208 | 268,208 |
| 100.3% | Total Investments | 12,883,055 | 13,290,612 |
| (0.3%) | Other Assets and Liabilities, Net | | (38,873) |
| 100.0% | Net Assets | | 13,251,739 |
| Security | Number
of Shares | Value ($) |
| Other Investment Companies 98.3% of net assets |
| |
| U.S. Stocks 54.6% |
| Large-Cap 48.8% |
| Schwab U.S. Large-Cap ETF (a) | 114,817 | 6,460,752 |
| Small-Cap 5.8% |
| Schwab U.S. Small-Cap ETF (a) | 12,263 | 772,324 |
| | | 7,233,076 |
| |
| International Stocks 26.5% |
| Developed-Market Large-Cap 23.3% |
| Schwab International Equity ETF (a) | 103,591 | 3,094,263 |
| Emerging-Market 3.2% |
| Schwab Emerging Markets Equity ETF (a) | 17,625 | 422,471 |
| | | 3,516,734 |
| |
| Real Assets 3.1% |
| Real Estate 3.1% |
| Schwab U.S. REIT ETF (a) | 9,873 | 402,621 |
| |
| Fixed Income 14.1% |
| Intermediate-Term Bond 13.5% |
| Schwab U.S. Aggregate Bond ETF (a) | 34,469 | 1,785,150 |
| Security | Number
of Shares | Value ($) |
| Treasury Bond 0.6% |
| Schwab Short-Term U.S. Treasury ETF (a) | 1,681 | 84,823 |
| | | 1,869,973 |
| Total Other Investment Companies |
| (Cost $12,614,847) | | 13,022,404 |
Issuer
Rate, Maturity Date | Face
Amount ($) | Value ($) |
| Short-Term Investments 2.0% of net assets |
| |
| Time Deposits 2.0% |
| BNP Paribas |
| 0.41%, 04/03/17 (b) | 130,436 | 130,436 |
| Brown Brothers Harriman |
| 0.41%, 04/03/17 (b) | 7,336 | 7,336 |
| Sumitomo Mitsui Banking Corp. |
| 0.41%, 04/03/17 (b) | 130,436 | 130,436 |
| Total Short-Term Investments |
| (Cost $268,208) | | 268,208 |
End of Investments.
At 03/31/17, the tax basis cost of the fund's investments was $12,887,436 and the unrealized appreciation and depreciation were $410,733 and ($7,557), respectively, with a net unrealized appreciation of $403,176.
| (a) | Issuer is affiliated with the fund's investment adviser. |
| (b) | The rate shown is the current daily overnight rate. |
| | |
| ETF — | Exchange-traded fund |
| REIT — | Real Estate Investment Trust |
The following is a summary of the inputs used to value the fund's investments as of March 31, 2017 (see financial note 2(a) for additional information):
| Description | Quoted Prices in
Active Markets for
Identical Assets
(Level 1) | Other Significant
Observable Inputs
(Level 2) | Significant
Unobservable Inputs
(Level 3) | Total | |
| Other Investment Companies1 | $13,022,404 | $— | $— | $13,022,404 | |
| Short-Term Investments1 | — | 268,208 | — | 268,208 | |
| Total | $13,022,404 | $268,208 | $— | $13,290,612 | |
| 1 | As categorized in Portfolio Holdings. |
The fund's policy is to recognize transfers between Level 1, Level 2 and Level 3 as of the beginning of the fiscal year. There were no transfers between Level 1, Level 2 and Level 3 for the period ended March 31, 2017.
Schwab Target Index Funds | Annual Report
Schwab Target 2040 Index Fund
Statement of Assets and Liabilities
As of March 31, 2017
| Assets |
| Investments in affiliated underlying funds, at value (cost $12,614,847) | | $13,022,404 |
| Investments in unaffiliated issuers, at value (cost $268,208) | + | 268,208 |
| Total investments, at value (cost $12,883,055) | | 13,290,612 |
| Receivables: | | |
| Investments sold | | 49,536 |
| Fund shares sold | + | 230,991 |
| Total assets | | 13,571,139 |
| Liabilities |
| Payables: | | |
| Investments bought | | 318,573 |
| Investment adviser fees | | 369 |
| Shareholder service fees | + | 458 |
| Total liabilities | | 319,400 |
| Net Assets |
| Total assets | | 13,571,139 |
| Total liabilities | – | 319,400 |
| Net assets | | $13,251,739 |
| Net Assets by Source | | |
| Capital received from investors | | 12,816,168 |
| Net investment income not yet distributed | | 30,828 |
| Net realized capital losses | | (2,814) |
| Net unrealized capital appreciation | | 407,557 |
| Net Asset Value (NAV) by Shares Class | |
| Share Class | Net Assets | ÷ | Shares
Outstanding | = | NAV |
| Investor Shares | $11,737,625 | | 1,108,289 | | $10.59 |
| Institutional Shares | $1,514,114 | | 142,960 | | $10.59 |
| | | | | | |
Schwab Target Index Funds | Annual Report
Schwab Target 2040 Index Fund
Statement of Operations
For the period August 25, 2016* through March 31, 2017
| Investment Income |
| Dividends received from affiliated underlying funds | | $89,094 |
| Interest | + | 345 |
| Total investment income | | 89,439 |
| Expenses |
| Investment adviser and administrator fees | | 2,519 |
| Shareholder service fees: | | |
| Investor Shares | + | 1,463 |
| Total expenses | | 3,982 |
| Expense reduction by CSIM | – | 1,708 |
| Net expenses | – | 2,274 |
| Net investment income | | 87,165 |
| Realized and Unrealized Gains (Losses) |
| Net realized losses on sales of affiliated underlying funds | | (2,814) |
| Net change in unrealized appreciation (depreciation) on affiliated underlying funds | + | 407,557 |
| Net realized and unrealized gains | | 404,743 |
| Increase in net assets resulting from operations | | $491,908 |
| * | Commencement of operations. |
Schwab Target Index Funds | Annual Report
Schwab Target 2040 Index Fund
Statement of Changes in Net Assets
For the current period only. Because the fund commenced operations on August 25, 2016, it has no prior report period
| Operations |
| | 8/25/16*-3/31/17 |
| Net investment income | | $87,165 |
| Net realized losses | | (2,814) |
| Net change in unrealized appreciation (depreciation) | + | 407,557 |
| Increase in net assets from operations | | 491,908 |
| Distributions to Shareholders |
| Distributions from net investment income | | |
| Investor Shares | | (53,782) |
| Institutional Shares | + | (2,555) |
| Total distributions from net investment income | | (56,337) |
| Transactions in Fund Shares | |
| | | 8/25/16*-3/31/17 |
| | | SHARES | VALUE |
| Shares Sold | | | |
| Investor Shares | | 1,192,700 | $12,211,411 |
| Institutional Shares | + | 157,010 | 1,632,206 |
| Total shares sold | | 1,349,710 | $13,843,617 |
| Shares Reinvested | | | |
| Investor Shares | | 5,344 | $53,698 |
| Institutional Shares | + | 254 | 2,556 |
| Total shares reinvested | | 5,598 | $56,254 |
| Shares Redeemed | | | |
| Investor Shares | | (89,755) | ($932,514) |
| Institutional Shares | + | (14,304) | (151,189) |
| Total shares redeemed | | (104,059) | ($1,083,703) |
| Net transactions in fund shares | | 1,251,249 | $12,816,168 |
| Shares Outstanding and Net Assets | |
| | | 8/25/16*-3/31/17 |
| | | SHARES | NET ASSETS |
| Beginning of period | | — | $— |
| Total increase | + | 1,251,249 | 13,251,739 |
| End of period | | 1,251,249 | $13,251,739 |
| Net investment income not yet distributed | | | $30,828 |
| * | Commencement of operations. |
Schwab Target Index Funds | Annual Report
Schwab Target 2045 Index Fund
Financial Statements
Financial Highlights
| Investor Shares | 8/25/16 1–
3/31/17 | | | | | |
| Per-Share Data |
| Net asset value at beginning of period | $10.00 | | | | | |
| Income (loss) from investment operations: | | | | | | |
| Net investment income (loss)2 | 0.18 | | | | | |
| Net realized and unrealized gains (losses) | 0.56 | | | | | |
| Total from investment operations | 0.74 | | | | | |
| Less distributions: | | | | | | |
| Distributions from net investment income | (0.10) | | | | | |
| Net asset value at end of period | $10.64 | | | | | |
| Total return | 7.50% 3 | | | | | |
| Ratios/Supplemental Data |
| Ratios to average net assets: | | | | | | |
| Net operating expenses4 | 0.07% 5 | | | | | |
| Gross operating expenses4 | 0.13% 5 | | | | | |
| Net investment income (loss) | 3.03% 5 | | | | | |
| Portfolio turnover rate | 8% 3 | | | | | |
| Net assets, end of period (x 1,000) | $7,425 | | | | | |
| |
| Institutional Shares | 8/25/16 1–
3/31/17 | | | | | |
| Per-Share Data |
| Net asset value at beginning of period | $10.00 | | | | | |
| Income (loss) from investment operations: | | | | | | |
| Net investment income (loss)2 | 0.10 | | | | | |
| Net realized and unrealized gains (losses) | 0.65 | | | | | |
| Total from investment operations | 0.75 | | | | | |
| Less distributions: | | | | | | |
| Distributions from net investment income | (0.11) | | | | | |
| Net asset value at end of period | $10.64 | | | | | |
| Total return | 7.51% 3 | | | | | |
| Ratios/Supplemental Data |
| Ratios to average net assets: | | | | | | |
| Net operating expenses4 | 0.02% 5 | | | | | |
| Gross operating expenses4 | 0.08% 5 | | | | | |
| Net investment income (loss) | 1.68% 5 | | | | | |
| Portfolio turnover rate | 8% 3 | | | | | |
| Net assets, end of period (x 1,000) | $1,261 | | | | | |
1
Commencement of operations.
2
Calculated based on the average shares outstanding during the period.
3
Not annualized.
4
The expenses incurred by underlying funds in which the fund invests are not included in this ratio, if expenses incurred by the underlying funds were included in the ratio it would have increased 0.06% (see financial note 4).
5
Annualized.
Schwab Target Index Funds | Annual Report
Schwab Target 2045 Index Fund
Portfolio Holdings as of March 31, 2017
This section shows all the securities in the fund's portfolio and their values as of the report date.
The fund files its complete schedule of portfolio holdings with the SEC for the first and third quarters of each fiscal year on Form N-Q. The fund's Form N-Q is available on the SEC's website at www.sec.gov and may be viewed and copied at the SEC's Public Reference Room in Washington, D.C. Call 1-800-SEC-0330 for information on the operation of the Public Reference Room. The fund also makes available its complete schedule of portfolio holdings 15 to 20 days after calendar quarters on the fund's website at www.csimfunds.com/schwabfunds_prospectus.
| Holdings by Category | Cost ($) | Value ($) |
| 98.8% | Other Investment Companies | 8,294,620 | 8,586,123 |
| 2.1% | Short-Term Investments | 179,179 | 179,179 |
| 100.9% | Total Investments | 8,473,799 | 8,765,302 |
| (0.9%) | Other Assets and Liabilities, Net | | (79,538) |
| 100.0% | Net Assets | | 8,685,764 |
| Security | Number
of Shares | Value ($) |
| Other Investment Companies 98.8% of net assets |
| |
| U.S. Stocks 57.0% |
| Large-Cap 50.6% |
| Schwab U.S. Large-Cap ETF (a) | 78,137 | 4,396,769 |
| Small-Cap 6.4% |
| Schwab U.S. Small-Cap ETF (a) | 8,769 | 552,272 |
| | | 4,949,041 |
| |
| International Stocks 28.5% |
| Developed-Market Large-Cap 24.8% |
| Schwab International Equity ETF (a) | 72,118 | 2,154,165 |
| Emerging-Market 3.7% |
| Schwab Emerging Markets Equity ETF (a) | 13,332 | 319,568 |
| | | 2,473,733 |
| |
| Real Assets 3.3% |
| Real Estate 3.3% |
| Schwab U.S. REIT ETF (a) | 7,077 | 288,600 |
| |
| Fixed Income 10.0% |
| Intermediate-Term Bond 9.6% |
| Schwab U.S. Aggregate Bond ETF (a) | 16,219 | 839,982 |
| Security | Number
of Shares | Value ($) |
| Treasury Bond 0.4% |
| Schwab Short-Term U.S. Treasury ETF (a) | 689 | 34,767 |
| | | 874,749 |
| Total Other Investment Companies |
| (Cost $8,294,620) | | 8,586,123 |
Issuer
Rate, Maturity Date | Face
Amount ($) | Value ($) |
| Short-Term Investments 2.1% of net assets |
| |
| Time Deposits 2.1% |
| BNP Paribas |
| 0.41%, 04/03/17 (b) | 83,869 | 83,869 |
| Brown Brothers Harriman |
| 0.41%, 04/03/17 (b) | 11,441 | 11,441 |
| Sumitomo Mitsui Banking Corp. |
| 0.41%, 04/03/17 (b) | 83,869 | 83,869 |
| Total Short-Term Investments |
| (Cost $179,179) | | 179,179 |
End of Investments.
At 03/31/17, the tax basis cost of the fund's investments was $8,478,223 and the unrealized appreciation and depreciation were $288,741 and ($1,662), respectively, with a net unrealized appreciation of $287,079.
| (a) | Issuer is affiliated with the fund's investment adviser. |
| (b) | The rate shown is the current daily overnight rate. |
| | |
| ETF — | Exchange-traded fund |
| REIT — | Real Estate Investment Trust |
The following is a summary of the inputs used to value the fund's investments as of March 31, 2017 (see financial note 2(a) for additional information):
| Description | Quoted Prices in
Active Markets for
Identical Assets
(Level 1) | Other Significant
Observable Inputs
(Level 2) | Significant
Unobservable Inputs
(Level 3) | Total | |
| Other Investment Companies1 | $8,586,123 | $— | $— | $8,586,123 | |
| Short-Term Investments1 | — | 179,179 | — | 179,179 | |
| Total | $8,586,123 | $179,179 | $— | $8,765,302 | |
| 1 | As categorized in Portfolio Holdings. |
The fund's policy is to recognize transfers between Level 1, Level 2 and Level 3 as of the beginning of the fiscal year. There were no transfers between Level 1, Level 2 and Level 3 for the period ended March 31, 2017.
Schwab Target Index Funds | Annual Report
Schwab Target 2045 Index Fund
Statement of Assets and Liabilities
As of March 31, 2017
| Assets |
| Investments in affiliated underlying funds, at value (cost $8,294,620) | | $8,586,123 |
| Investments in unaffiliated issuers, at value (cost $179,179) | + | 179,179 |
| Total investments, at value (cost $8,473,799) | | 8,765,302 |
| Receivables: | | |
| Fund shares sold | + | 317,202 |
| Total assets | | 9,082,504 |
| Liabilities |
| Payables: | | |
| Investments bought | | 391,247 |
| Investment adviser fees | | 229 |
| Shareholder service fees | | 283 |
| Fund shares redeemed | + | 4,981 |
| Total liabilities | | 396,740 |
| Net Assets |
| Total assets | | 9,082,504 |
| Total liabilities | – | 396,740 |
| Net assets | | $8,685,764 |
| Net Assets by Source | | |
| Capital received from investors | | 8,379,470 |
| Net investment income not yet distributed | | 19,172 |
| Net realized capital losses | | (4,381) |
| Net unrealized capital appreciation | | 291,503 |
| Net Asset Value (NAV) by Shares Class | |
| Share Class | Net Assets | ÷ | Shares
Outstanding | = | NAV |
| Investor Shares | $7,424,610 | | 698,095 | | $10.64 |
| Institutional Shares | $1,261,154 | | 118,521 | | $10.64 |
| | | | | | |
Schwab Target Index Funds | Annual Report
Schwab Target 2045 Index Fund
Statement of Operations
For the period August 25, 2016* through March 31, 2017
| Investment Income |
| Dividends received from affiliated underlying funds | | $60,799 |
| Interest | + | 188 |
| Total investment income | | 60,987 |
| Expenses |
| Investment adviser and administrator fees | | 1,665 |
| Shareholder service fees: | | |
| Investor Shares | + | 912 |
| Total expenses | | 2,577 |
| Expense reduction by CSIM | – | 1,193 |
| Net expenses | – | 1,384 |
| Net investment income | | 59,603 |
| Realized and Unrealized Gains (Losses) |
| Net realized losses on sales of affiliated underlying funds | | (4,381) |
| Net change in unrealized appreciation (depreciation) on affiliated underlying funds | + | 291,503 |
| Net realized and unrealized gains | | 287,122 |
| Increase in net assets resulting from operations | | $346,725 |
| * | Commencement of operations. |
Schwab Target Index Funds | Annual Report
Schwab Target 2045 Index Fund
Statement of Changes in Net Assets
For the current period only. Because the fund commenced operations on August 25, 2016, it has no prior report period
| Operations |
| | 8/25/16*-3/31/17 |
| Net investment income | | $59,603 |
| Net realized losses | | (4,381) |
| Net change in unrealized appreciation (depreciation) | + | 291,503 |
| Increase in net assets from operations | | 346,725 |
| Distributions to Shareholders |
| Distributions from net investment income | | |
| Investor Shares | | (32,949) |
| Institutional Shares | + | (7,482) |
| Total distributions from net investment income | | (40,431) |
| Transactions in Fund Shares | |
| | | 8/25/16*-3/31/17 |
| | | SHARES | VALUE |
| Shares Sold | | | |
| Investor Shares | | 718,567 | $7,368,178 |
| Institutional Shares | + | 148,641 | 1,532,883 |
| Total shares sold | | 867,208 | $8,901,061 |
| Shares Reinvested | | | |
| Investor Shares | | 3,238 | $32,606 |
| Institutional Shares | + | 742 | 7,482 |
| Total shares reinvested | | 3,980 | $40,088 |
| Shares Redeemed | | | |
| Investor Shares | | (23,710) | ($244,675) |
| Institutional Shares | + | (30,862) | (317,004) |
| Total shares redeemed | | (54,572) | ($561,679) |
| Net transactions in fund shares | | 816,616 | $8,379,470 |
| Shares Outstanding and Net Assets | |
| | | 8/25/16*-3/31/17 |
| | | SHARES | NET ASSETS |
| Beginning of period | | — | $— |
| Total increase | + | 816,616 | 8,685,764 |
| End of period | | 816,616 | $8,685,764 |
| Net investment income not yet distributed | | | $19,172 |
| * | Commencement of operations. |
Schwab Target Index Funds | Annual Report
Schwab Target 2050 Index Fund
Financial Statements
Financial Highlights
| Investor Shares | 8/25/16 1–
3/31/17 | | | | | |
| Per-Share Data |
| Net asset value at beginning of period | $10.00 | | | | | |
| Income (loss) from investment operations: | | | | | | |
| Net investment income (loss)2 | 0.18 | | | | | |
| Net realized and unrealized gains (losses) | 0.58 | | | | | |
| Total from investment operations | 0.76 | | | | | |
| Less distributions: | | | | | | |
| Distributions from net investment income | (0.12) | | | | | |
| Net asset value at end of period | $10.64 | | | | | |
| Total return | 7.69% 3 | | | | | |
| Ratios/Supplemental Data |
| Ratios to average net assets: | | | | | | |
| Net operating expenses4 | 0.07% 5 | | | | | |
| Gross operating expenses4 | 0.13% 5 | | | | | |
| Net investment income (loss) | 2.90% 5 | | | | | |
| Portfolio turnover rate | 4% 3 | | | | | |
| Net assets, end of period (x 1,000) | $5,734 | | | | | |
| |
| Institutional Shares | 8/25/16 1–
3/31/17 | | | | | |
| Per-Share Data |
| Net asset value at beginning of period | $10.00 | | | | | |
| Income (loss) from investment operations: | | | | | | |
| Net investment income (loss)2 | 0.15 | | | | | |
| Net realized and unrealized gains (losses) | 0.62 | | | | | |
| Total from investment operations | 0.77 | | | | | |
| Less distributions: | | | | | | |
| Distributions from net investment income | (0.12) | | | | | |
| Net asset value at end of period | $10.65 | | | | | |
| Total return | 7.80% 3 | | | | | |
| Ratios/Supplemental Data |
| Ratios to average net assets: | | | | | | |
| Net operating expenses4 | 0.02% 5 | | | | | |
| Gross operating expenses4 | 0.08% 5 | | | | | |
| Net investment income (loss) | 2.54% 5 | | | | | |
| Portfolio turnover rate | 4% 3 | | | | | |
| Net assets, end of period (x 1,000) | $793 | | | | | |
1
Commencement of operations.
2
Calculated based on the average shares outstanding during the period.
3
Not annualized.
4
The expenses incurred by underlying funds in which the fund invests are not included in this ratio, if expenses incurred by the underlying funds were included in the ratio it would have increased 0.06% (see financial note 4).
5
Annualized.
Schwab Target Index Funds | Annual Report
Schwab Target 2050 Index Fund
Portfolio Holdings as of March 31, 2017
This section shows all the securities in the fund's portfolio and their values as of the report date.
The fund files its complete schedule of portfolio holdings with the SEC for the first and third quarters of each fiscal year on Form N-Q. The fund's Form N-Q is available on the SEC's website at www.sec.gov and may be viewed and copied at the SEC's Public Reference Room in Washington, D.C. Call 1-800-SEC-0330 for information on the operation of the Public Reference Room. The fund also makes available its complete schedule of portfolio holdings 15 to 20 days after calendar quarters on the fund's website at www.csimfunds.com/schwabfunds_prospectus.
| Holdings by Category | Cost ($) | Value ($) |
| 99.0% | Other Investment Companies | 6,256,084 | 6,460,247 |
| 2.0% | Short-Term Investments | 134,802 | 134,802 |
| 101.0% | Total Investments | 6,390,886 | 6,595,049 |
| (1.0%) | Other Assets and Liabilities, Net | | (68,220) |
| 100.0% | Net Assets | | 6,526,829 |
| Security | Number
of Shares | Value ($) |
| Other Investment Companies 99.0% of net assets |
| |
| U.S. Stocks 58.3% |
| Large-Cap 51.6% |
| Schwab U.S. Large-Cap ETF (a) | 59,829 | 3,366,578 |
| Small-Cap 6.7% |
| Schwab U.S. Small-Cap ETF (a) | 6,939 | 437,018 |
| | | 3,803,596 |
| |
| International Stocks 29.6% |
| Developed-Market Large-Cap 25.6% |
| Schwab International Equity ETF (a) | 55,967 | 1,671,734 |
| Emerging-Market 4.0% |
| Schwab Emerging Markets Equity ETF (a) | 10,890 | 261,033 |
| | | 1,932,767 |
| |
| Real Assets 3.4% |
| Real Estate 3.4% |
| Schwab U.S. REIT ETF (a) | 5,499 | 224,249 |
| |
| Fixed Income 7.7% |
| Intermediate-Term Bond 7.4% |
| Schwab U.S. Aggregate Bond ETF (a) | 9,280 | 480,611 |
| Security | Number
of Shares | Value ($) |
| Treasury Bond 0.3% |
| Schwab Short-Term U.S. Treasury ETF (a) | 377 | 19,024 |
| | | 499,635 |
| Total Other Investment Companies |
| (Cost $6,256,084) | | 6,460,247 |
Issuer
Rate, Maturity Date | Face
Amount ($) | Value ($) |
| Short-Term Investments 2.0% of net assets |
| |
| Time Deposits 2.0% |
| Australia & New Zealand Banking Group Ltd. |
| 0.41%, 04/03/17 (b) | 61,433 | 61,433 |
| BNP Paribas |
| 0.41%, 04/03/17 (b) | 61,433 | 61,433 |
| Brown Brothers Harriman |
| 0.41%, 04/03/17 (b) | 11,936 | 11,936 |
| Total Short-Term Investments |
| (Cost $134,802) | | 134,802 |
End of Investments.
At 03/31/17, the tax basis cost of the fund's investments was $6,392,694 and the unrealized appreciation and depreciation were $204,787 and ($2,432), respectively, with a net unrealized appreciation of $202,355.
| (a) | Issuer is affiliated with the fund's investment adviser. |
| (b) | The rate shown is the current daily overnight rate. |
| | |
| ETF — | Exchange-traded fund |
| REIT — | Real Estate Investment Trust |
The following is a summary of the inputs used to value the fund's investments as of March 31, 2017 (see financial note 2(a) for additional information):
| Description | Quoted Prices in
Active Markets for
Identical Assets
(Level 1) | Other Significant
Observable Inputs
(Level 2) | Significant
Unobservable Inputs
(Level 3) | Total | |
| Other Investment Companies1 | $6,460,247 | $— | $— | $6,460,247 | |
| Short-Term Investments1 | — | 134,802 | — | 134,802 | |
| Total | $6,460,247 | $134,802 | $— | $6,595,049 | |
| 1 | As categorized in Portfolio Holdings. |
The fund's policy is to recognize transfers between Level 1, Level 2 and Level 3 as of the beginning of the fiscal year. There were no transfers between Level 1, Level 2 and Level 3 for the period ended March 31, 2017.
Schwab Target Index Funds | Annual Report
Schwab Target 2050 Index Fund
Statement of Assets and Liabilities
As of March 31, 2017
| Assets |
| Investments in affiliated underlying funds, at value (cost $6,256,084) | | $6,460,247 |
| Investments in unaffiliated issuers, at value (cost $134,802) | + | 134,802 |
| Total investments, at value (cost $6,390,886) | | 6,595,049 |
| Receivables: | | |
| Fund shares sold | + | 423,650 |
| Total assets | | 7,018,699 |
| Liabilities |
| Payables: | | |
| Investments bought | | 461,874 |
| Investment adviser fees | | 158 |
| Shareholder service fees | | 212 |
| Fund shares redeemed | + | 29,626 |
| Total liabilities | | 491,870 |
| Net Assets |
| Total assets | | 7,018,699 |
| Total liabilities | – | 491,870 |
| Net assets | | $6,526,829 |
| Net Assets by Source | | |
| Capital received from investors | | 6,311,051 |
| Net investment income not yet distributed | | 13,423 |
| Net realized capital losses | | (1,808) |
| Net unrealized capital appreciation | | 204,163 |
| Net Asset Value (NAV) by Shares Class | |
| Share Class | Net Assets | ÷ | Shares
Outstanding | = | NAV |
| Investor Shares | $5,733,942 | | 538,709 | | $10.64 |
| Institutional Shares | $792,887 | | 74,481 | | $10.65 |
| | | | | | |
Schwab Target Index Funds | Annual Report
Schwab Target 2050 Index Fund
Statement of Operations
For the period August 25, 2016* through March 31, 2017
| Investment Income |
| Dividends received from affiliated underlying funds | | $41,329 |
| Interest | + | 110 |
| Total investment income | | 41,439 |
| Expenses |
| Investment adviser and administrator fees | | 1,128 |
| Shareholder service fees: | | |
| Investor Shares | + | 656 |
| Total expenses | | 1,784 |
| Expense reduction by CSIM | – | 833 |
| Net expenses | – | 951 |
| Net investment income | | 40,488 |
| Realized and Unrealized Gains (Losses) |
| Net realized losses on sales of affiliated underlying funds | | (1,808) |
| Net change in unrealized appreciation (depreciation) on affiliated underlying funds | + | 204,163 |
| Net realized and unrealized gains | | 202,355 |
| Increase in net assets resulting from operations | | $242,843 |
| * | Commencement of operations. |
Schwab Target Index Funds | Annual Report
Schwab Target 2050 Index Fund
Statement of Changes in Net Assets
For the current period only. Because the fund commenced operations on August 25, 2016, it has no prior report period
| Operations |
| | 8/25/16*-3/31/17 |
| Net investment income | | $40,488 |
| Net realized losses | | (1,808) |
| Net change in unrealized appreciation (depreciation) | + | 204,163 |
| Increase in net assets from operations | | 242,843 |
| Distributions to Shareholders |
| Distributions from net investment income | | |
| Investor Shares | | (24,827) |
| Institutional Shares | + | (2,238) |
| Total distributions from net investment income | | (27,065) |
| Transactions in Fund Shares | |
| | | 8/25/16*-3/31/17 |
| | | SHARES | VALUE |
| Shares Sold | | | |
| Investor Shares | | 574,447 | $5,899,391 |
| Institutional Shares | + | 75,399 | 791,031 |
| Total shares sold | | 649,846 | $6,690,422 |
| Shares Reinvested | | | |
| Investor Shares | | 2,428 | $24,451 |
| Institutional Shares | + | 222 | 2,238 |
| Total shares reinvested | | 2,650 | $26,689 |
| Shares Redeemed | | | |
| Investor Shares | | (38,166) | ($394,238) |
| Institutional Shares | + | (1,140) | (11,822) |
| Total shares redeemed | | (39,306) | ($406,060) |
| Net transactions in fund shares | | 613,190 | $6,311,051 |
| Shares Outstanding and Net Assets | |
| | | 8/25/16*-3/31/17 |
| | | SHARES | NET ASSETS |
| Beginning of period | | — | $— |
| Total increase | + | 613,190 | 6,526,829 |
| End of period | | 613,190 | $6,526,829 |
| Net investment income not yet distributed | | | $13,423 |
| * | Commencement of operations. |
Schwab Target Index Funds | Annual Report
Schwab Target 2055 Index Fund
Financial Statements
Financial Highlights
| Investor Shares | 8/25/16 1–
3/31/17 | | | | | |
| Per-Share Data |
| Net asset value at beginning of period | $10.00 | | | | | |
| Income (loss) from investment operations: | | | | | | |
| Net investment income (loss)2 | 0.19 | | | | | |
| Net realized and unrealized gains (losses) | 0.60 | | | | | |
| Total from investment operations | 0.79 | | | | | |
| Less distributions: | | | | | | |
| Distributions from net investment income | (0.12) | | | | | |
| Net asset value at end of period | $10.67 | | | | | |
| Total return | 8.02% 3 | | | | | |
| Ratios/Supplemental Data |
| Ratios to average net assets: | | | | | | |
| Net operating expenses4 | 0.07% 5 | | | | | |
| Gross operating expenses4 | 0.13% 5 | | | | | |
| Net investment income (loss) | 3.13% 5 | | | | | |
| Portfolio turnover rate | 14% 3 | | | | | |
| Net assets, end of period (x 1,000) | $3,612 | | | | | |
| |
| Institutional Shares | 8/25/16 1–
3/31/17 | | | | | |
| Per-Share Data |
| Net asset value at beginning of period | $10.00 | | | | | |
| Income (loss) from investment operations: | | | | | | |
| Net investment income (loss)2 | 0.15 | | | | | |
| Net realized and unrealized gains (losses) | 0.65 | | | | | |
| Total from investment operations | 0.80 | | | | | |
| Less distributions: | | | | | | |
| Distributions from net investment income | (0.13) | | | | | |
| Net asset value at end of period | $10.67 | | | | | |
| Total return | 8.03% 3 | | | | | |
| Ratios/Supplemental Data |
| Ratios to average net assets: | | | | | | |
| Net operating expenses4 | 0.02% 5 | | | | | |
| Gross operating expenses4 | 0.08% 5 | | | | | |
| Net investment income (loss) | 2.53% 5 | | | | | |
| Portfolio turnover rate | 14% 3 | | | | | |
| Net assets, end of period (x 1,000) | $147 | | | | | |
1
Commencement of operations.
2
Calculated based on the average shares outstanding during the period.
3
Not annualized.
4
The expenses incurred by underlying funds in which the fund invests are not included in this ratio, if expenses incurred by the underlying funds were included in the ratio it would have increased 0.06% (see financial note 4).
5
Annualized.
Schwab Target Index Funds | Annual Report
Schwab Target 2055 Index Fund
Portfolio Holdings as of March 31, 2017
This section shows all the securities in the fund's portfolio and their values as of the report date.
The fund files its complete schedule of portfolio holdings with the SEC for the first and third quarters of each fiscal year on Form N-Q. The fund's Form N-Q is available on the SEC's website at www.sec.gov and may be viewed and copied at the SEC's Public Reference Room in Washington, D.C. Call 1-800-SEC-0330 for information on the operation of the Public Reference Room. The fund also makes available its complete schedule of portfolio holdings 15 to 20 days after calendar quarters on the fund's website at www.csimfunds.com/schwabfunds_prospectus.
| Holdings by Category | Cost ($) | Value ($) |
| 99.7% | Other Investment Companies | 3,558,567 | 3,746,455 |
| 1.6% | Short-Term Investments | 62,315 | 62,315 |
| 101.3% | Total Investments | 3,620,882 | 3,808,770 |
| (1.3%) | Other Assets and Liabilities, Net | | (49,590) |
| 100.0% | Net Assets | | 3,759,180 |
| Security | Number
of Shares | Value ($) |
| Other Investment Companies 99.7% of net assets |
| |
| U.S. Stocks 59.8% |
| Large-Cap 52.7% |
| Schwab U.S. Large-Cap ETF (a) | 35,193 | 1,980,310 |
| Small-Cap 7.1% |
| Schwab U.S. Small-Cap ETF (a) | 4,251 | 267,728 |
| | | 2,248,038 |
| |
| International Stocks 30.9% |
| Developed-Market Large-Cap 26.6% |
| Schwab International Equity ETF (a) | 33,433 | 998,644 |
| Emerging-Market 4.3% |
| Schwab Emerging Markets Equity ETF (a) | 6,826 | 163,619 |
| | | 1,162,263 |
| |
| Real Assets 3.6% |
| Real Estate 3.6% |
| Schwab U.S. REIT ETF (a) | 3,330 | 135,797 |
| |
| Fixed Income 5.4% |
| Intermediate-Term Bond 5.2% |
| Schwab U.S. Aggregate Bond ETF (a) | 3,741 | 193,747 |
| Security | Number
of Shares | Value ($) |
| Treasury Bond 0.2% |
| Schwab Short-Term U.S. Treasury ETF (a) | 131 | 6,610 |
| | | 200,357 |
| Total Other Investment Companies |
| (Cost $3,558,567) | | 3,746,455 |
Issuer
Rate, Maturity Date | Face
Amount ($) | Value ($) |
| Short-Term Investments 1.6% of net assets |
| |
| Time Deposits 1.6% |
| BNP Paribas |
| 0.41%, 04/03/17 (b) | 37,595 | 37,595 |
| National Australia Bank |
| 0.41%, 04/03/17 (b) | 24,720 | 24,720 |
| Total Short-Term Investments |
| (Cost $62,315) | | 62,315 |
End of Investments.
At 03/31/17, the tax basis cost of the fund's investments was $3,624,336 and the unrealized appreciation and depreciation were $185,547 and ($1,113), respectively, with a net unrealized appreciation of $184,434.
| (a) | Issuer is affiliated with the fund's investment adviser. |
| (b) | The rate shown is the current daily overnight rate. |
| | |
| ETF — | Exchange-traded fund |
| REIT — | Real Estate Investment Trust |
The following is a summary of the inputs used to value the fund's investments as of March 31, 2017 (see financial note 2(a) for additional information):
| Description | Quoted Prices in
Active Markets for
Identical Assets
(Level 1) | Other Significant
Observable Inputs
(Level 2) | Significant
Unobservable Inputs
(Level 3) | Total | |
| Other Investment Companies1 | $3,746,455 | $— | $— | $3,746,455 | |
| Short-Term Investments1 | — | 62,315 | — | 62,315 | |
| Total | $3,746,455 | $62,315 | $— | $3,808,770 | |
| 1 | As categorized in Portfolio Holdings. |
The fund's policy is to recognize transfers between Level 1, Level 2 and Level 3 as of the beginning of the fiscal year. There were no transfers between Level 1, Level 2 and Level 3 for the period ended March 31, 2017.
Schwab Target Index Funds | Annual Report
Schwab Target 2055 Index Fund
Statement of Assets and Liabilities
As of March 31, 2017
| Assets |
| Investments in affiliated underlying funds, at value (cost $3,558,567) | | $3,746,455 |
| Investments in unaffiliated issuers, at value (cost $62,315) | + | 62,315 |
| Total investments, at value (cost $3,620,882) | | 3,808,770 |
| Receivables: | | |
| Fund shares sold | + | 30,120 |
| Total assets | | 3,838,890 |
| Liabilities |
| Payables: | | |
| Investments bought | | 55,532 |
| Investment adviser fees | | 102 |
| Shareholder service fees | | 144 |
| Fund shares redeemed | + | 23,932 |
| Total liabilities | | 79,710 |
| Net Assets |
| Total assets | | 3,838,890 |
| Total liabilities | – | 79,710 |
| Net assets | | $3,759,180 |
| Net Assets by Source | | |
| Capital received from investors | | 3,566,615 |
| Net investment income not yet distributed | | 8,107 |
| Net realized capital losses | | (3,430) |
| Net unrealized capital appreciation | | 187,888 |
| Net Asset Value (NAV) by Shares Class | |
| Share Class | Net Assets | ÷ | Shares
Outstanding | = | NAV |
| Investor Shares | $3,612,074 | | 338,515 | | $10.67 |
| Institutional Shares | $147,106 | | 13,782 | | $10.67 |
| | | | | | |
Schwab Target Index Funds | Annual Report
Schwab Target 2055 Index Fund
Statement of Operations
For the period August 25, 2016* through March 31, 2017
| Investment Income |
| Dividends received from affiliated underlying funds | | $37,426 |
| Interest | + | 77 |
| Total investment income | | 37,503 |
| Expenses |
| Investment adviser and administrator fees | | 950 |
| Shareholder service fees: | | |
| Investor Shares | + | 557 |
| Total expenses | | 1,507 |
| Expense reduction by CSIM | – | 693 |
| Net expenses | – | 814 |
| Net investment income | | 36,689 |
| Realized and Unrealized Gains (Losses) |
| Net realized losses on sales of affiliated underlying funds | | (3,430) |
| Net change in unrealized appreciation (depreciation) on affiliated underlying funds | + | 187,888 |
| Net realized and unrealized gains | | 184,458 |
| Increase in net assets resulting from operations | | $221,147 |
| * | Commencement of operations. |
Schwab Target Index Funds | Annual Report
Schwab Target 2055 Index Fund
Statement of Changes in Net Assets
For the current period only. Because the fund commenced operations on August 25, 2016, it has no prior report period
| Operations |
| | 8/25/16*-3/31/17 |
| Net investment income | | $36,689 |
| Net realized losses | | (3,430) |
| Net change in unrealized appreciation (depreciation) | + | 187,888 |
| Increase in net assets from operations | | 221,147 |
| Distributions to Shareholders |
| Distributions from net investment income | | |
| Investor Shares | | (26,235) |
| Institutional Shares | + | (2,347) |
| Total distributions from net investment income | | (28,582) |
| Transactions in Fund Shares | |
| | | 8/25/16*-3/31/17 |
| | | SHARES | VALUE |
| Shares Sold | | | |
| Investor Shares | | 376,557 | $3,828,247 |
| Institutional Shares | + | 21,287 | 216,514 |
| Total shares sold | | 397,844 | $4,044,761 |
| Shares Reinvested | | | |
| Investor Shares | | 2,550 | $25,712 |
| Institutional Shares | + | 233 | 2,347 |
| Total shares reinvested | | 2,783 | $28,059 |
| Shares Redeemed | | | |
| Investor Shares | | (40,592) | ($425,647) |
| Institutional Shares | + | (7,738) | (80,558) |
| Total shares redeemed | | (48,330) | ($506,205) |
| Net transactions in fund shares | | 352,297 | $3,566,615 |
| Shares Outstanding and Net Assets | |
| | | 8/25/16*-3/31/17 |
| | | SHARES | NET ASSETS |
| Beginning of period | | — | $— |
| Total increase | + | 352,297 | 3,759,180 |
| End of period | | 352,297 | $3,759,180 |
| Net investment income not yet distributed | | | $8,107 |
| * | Commencement of operations. |
Schwab Target Index Funds | Annual Report
Schwab Target 2060 Index Fund
Financial Statements
Financial Highlights
| Investor Shares | 8/25/16 1–
3/31/17 | | | | | |
| Per-Share Data |
| Net asset value at beginning of period | $10.00 | | | | | |
| Income (loss) from investment operations: | | | | | | |
| Net investment income (loss)2 | 0.21 | | | | | |
| Net realized and unrealized gains (losses) | 0.59 | | | | | |
| Total from investment operations | 0.80 | | | | | |
| Less distributions: | | | | | | |
| Distributions from net investment income | (0.12) | | | | | |
| Net asset value at end of period | $10.68 | | | | | |
| Total return | 8.11% 3 | | | | | |
| Ratios/Supplemental Data |
| Ratios to average net assets: | | | | | | |
| Net operating expenses4 | 0.07% 5 | | | | | |
| Gross operating expenses4 | 0.13% 5 | | | | | |
| Net investment income (loss) | 3.44% 5 | | | | | |
| Portfolio turnover rate | 0% 3 | | | | | |
| Net assets, end of period (x 1,000) | $4,868 | | | | | |
| |
| Institutional Shares | 8/25/16 1–
3/31/17 | | | | | |
| Per-Share Data |
| Net asset value at beginning of period | $10.00 | | | | | |
| Income (loss) from investment operations: | | | | | | |
| Net investment income (loss)2 | 0.18 | | | | | |
| Net realized and unrealized gains (losses) | 0.62 | | | | | |
| Total from investment operations | 0.80 | | | | | |
| Less distributions: | | | | | | |
| Distributions from net investment income | (0.12) | | | | | |
| Net asset value at end of period | $10.68 | | | | | |
| Total return | 8.11% 3 | | | | | |
| Ratios/Supplemental Data |
| Ratios to average net assets: | | | | | | |
| Net operating expenses4 | 0.02% 5 | | | | | |
| Gross operating expenses4 | 0.08% 5 | | | | | |
| Net investment income (loss) | 2.94% 5 | | | | | |
| Portfolio turnover rate | 0% 3 | | | | | |
| Net assets, end of period (x 1,000) | $166 | | | | | |
1
Commencement of operations.
2
Calculated based on the average shares outstanding during the period.
3
Not annualized.
4
The expenses incurred by underlying funds in which the fund invests are not included in this ratio, if expenses incurred by the underlying funds were included in the ratio it would have increased 0.06% (see financial note 4).
5
Annualized.
Schwab Target Index Funds | Annual Report
Schwab Target 2060 Index Fund
Portfolio Holdings as of March 31, 2017
This section shows all the securities in the fund's portfolio and their values as of the report date.
The fund files its complete schedule of portfolio holdings with the SEC for the first and third quarters of each fiscal year on Form N-Q. The fund's Form N-Q is available on the SEC's website at www.sec.gov and may be viewed and copied at the SEC's Public Reference Room in Washington, D.C. Call 1-800-SEC-0330 for information on the operation of the Public Reference Room. The fund also makes available its complete schedule of portfolio holdings 15 to 20 days after calendar quarters on the fund's website at www.csimfunds.com/schwabfunds_prospectus.
| Holdings by Category | Cost ($) | Value ($) |
| 99.2% | Other Investment Companies | 4,755,858 | 4,993,430 |
| 0.7% | Short-Term Investment | 36,829 | 36,829 |
| 99.9% | Total Investments | 4,792,687 | 5,030,259 |
| 0.1% | Other Assets and Liabilities, Net | | 3,504 |
| 100.0% | Net Assets | | 5,033,763 |
| Security | Number
of Shares | Value ($) |
| Other Investment Companies 99.2% of net assets |
| |
| U.S. Stocks 59.9% |
| Large-Cap 52.7% |
| Schwab U.S. Large-Cap ETF (a) | 47,185 | 2,655,100 |
| Small-Cap 7.2% |
| Schwab U.S. Small-Cap ETF (a) | 5,758 | 362,639 |
| | | 3,017,739 |
| |
| International Stocks 31.1% |
| Developed-Market Large-Cap 26.7% |
| Schwab International Equity ETF (a) | 45,058 | 1,345,883 |
| Emerging-Market 4.4% |
| Schwab Emerging Markets Equity ETF (a) | 9,127 | 218,774 |
| | | 1,564,657 |
| |
| Real Assets 3.7% |
| Real Estate 3.7% |
| Schwab U.S. REIT ETF (a) | 4,534 | 184,897 |
| |
| Fixed Income 4.5% |
| Intermediate-Term Bond 4.4% |
| Schwab U.S. Aggregate Bond ETF (a) | 4,231 | 219,123 |
| Security | Number
of Shares | Value ($) |
| Treasury Bond 0.1% |
| Schwab Short-Term U.S. Treasury ETF (a) | 139 | 7,014 |
| | | 226,137 |
| Total Other Investment Companies |
| (Cost $4,755,858) | | 4,993,430 |
Issuer
Rate, Maturity Date | Face
Amount ($) | Value ($) |
| Short-Term Investment 0.7% of net assets |
| |
| Time Deposit 0.7% |
| Sumitomo Mitsui Banking Corp. |
| 0.41%, 04/03/17 (b) | 36,829 | 36,829 |
| Total Short-Term Investment |
| (Cost $36,829) | | 36,829 |
End of Investments.
At 03/31/17, the tax basis cost of the fund's investments was $4,792,687 and the unrealized appreciation and depreciation were $238,220 and ($648), respectively, with a net unrealized appreciation of $237,572.
| (a) | Issuer is affiliated with the fund's investment adviser. |
| (b) | The rate shown is the current daily overnight rate. |
| | |
| ETF — | Exchange-traded fund |
| REIT — | Real Estate Investment Trust |
The following is a summary of the inputs used to value the fund's investments as of March 31, 2017 (see financial note 2(a) for additional information):
| Description | Quoted Prices in
Active Markets for
Identical Assets
(Level 1) | Other Significant
Observable Inputs
(Level 2) | Significant
Unobservable Inputs
(Level 3) | Total | |
| Other Investment Companies1 | $4,993,430 | $— | $— | $4,993,430 | |
| Short-Term Investment1 | — | 36,829 | — | 36,829 | |
| Total | $4,993,430 | $36,829 | $— | $5,030,259 | |
| 1 | As categorized in Portfolio Holdings. |
The fund's policy is to recognize transfers between Level 1, Level 2 and Level 3 as of the beginning of the fiscal year. There were no transfers between Level 1, Level 2 and Level 3 for the period ended March 31, 2017.
Schwab Target Index Funds | Annual Report
Schwab Target 2060 Index Fund
Statement of Assets and Liabilities
As of March 31, 2017
| Assets |
| Investments in affiliated underlying funds, at value (cost $4,755,858) | | $4,993,430 |
| Investments in unaffiliated issuers, at value (cost $36,829) | + | 36,829 |
| Total investments, at value (cost $4,792,687) | | 5,030,259 |
| Receivables: | | |
| Fund shares sold | + | 64,262 |
| Total assets | | 5,094,521 |
| Liabilities |
| Payables: | | |
| Investments bought | | 37,455 |
| Investment adviser fees | | 140 |
| Shareholder service fees | | 198 |
| Fund shares redeemed | + | 22,965 |
| Total liabilities | | 60,758 |
| Net Assets |
| Total assets | | 5,094,521 |
| Total liabilities | – | 60,758 |
| Net assets | | $5,033,763 |
| Net Assets by Source | | |
| Capital received from investors | | 4,784,660 |
| Net investment income not yet distributed | | 11,531 |
| Net unrealized capital appreciation | | 237,572 |
| Net Asset Value (NAV) by Shares Class | |
| Share Class | Net Assets | ÷ | Shares
Outstanding | = | NAV |
| Investor Shares | $4,868,176 | | 455,853 | | $10.68 |
| Institutional Shares | $165,587 | | 15,502 | | $10.68 |
| | | | | | |
Schwab Target Index Funds | Annual Report
Schwab Target 2060 Index Fund
Statement of Operations
For the period August 25, 2016* through March 31, 2017
| Investment Income |
| Dividends received from affiliated underlying funds | | $50,477 |
| Interest | + | 86 |
| Total investment income | | 50,563 |
| Expenses |
| Investment adviser and administrator fees | | 1,161 |
| Shareholder service fees: | | |
| Investor Shares | + | 694 |
| Total expenses | | 1,855 |
| Expense reduction by CSIM | – | 842 |
| Net expenses | – | 1,013 |
| Net investment income | | 49,550 |
| Realized and Unrealized Gains (Losses) |
| Net change in unrealized appreciation (depreciation) on affiliated underlying funds | + | 237,572 |
| Net realized and unrealized gains | | 237,572 |
| Increase in net assets resulting from operations | | $287,122 |
| * | Commencement of operations. |
Schwab Target Index Funds | Annual Report
Schwab Target 2060 Index Fund
Statement of Changes in Net Assets
For the current period only. Because the fund commenced operations on August 25, 2016, it has no prior report period
| Operations |
| | 8/25/16*-3/31/17 |
| Net investment income | | $49,550 |
| Net change in unrealized appreciation (depreciation) | + | 237,572 |
| Increase in net assets from operations | | 287,122 |
| Distributions to Shareholders |
| Distributions from net investment income | | |
| Investor Shares | | (36,773) |
| Institutional Shares | + | (1,246) |
| Total distributions from net investment income | | (38,019) |
| Transactions in Fund Shares | |
| | | 8/25/16*-3/31/17 |
| | | SHARES | VALUE |
| Shares Sold | | | |
| Investor Shares | | 462,701 | $4,699,657 |
| Institutional Shares | + | 15,408 | 157,668 |
| Total shares sold | | 478,109 | $4,857,325 |
| Shares Reinvested | | | |
| Investor Shares | | 3,611 | $36,445 |
| Institutional Shares | + | 124 | 1,246 |
| Total shares reinvested | | 3,735 | $37,691 |
| Shares Redeemed | | | |
| Investor Shares | | (10,459) | ($110,053) |
| Institutional Shares | + | (30) | (303) |
| Total shares redeemed | | (10,489) | ($110,356) |
| Net transactions in fund shares | | 471,355 | $4,784,660 |
| Shares Outstanding and Net Assets | |
| | | 8/25/16*-3/31/17 |
| | | SHARES | NET ASSETS |
| Beginning of period | | — | $— |
| Total increase | + | 471,355 | 5,033,763 |
| End of period | | 471,355 | $5,033,763 |
| Net investment income not yet distributed | | | $11,531 |
| * | Commencement of operations. |
Schwab Target Index Funds | Annual Report
Schwab Target Index Funds
1. Business Structure of the Funds:
Each of the funds in this report is a series of Schwab Capital Trust (the trust), a no-load, open-end management investment company. The trust is organized as a Massachusetts business trust and is registered under the Investment Company Act of 1940, as amended (the 1940 Act). The list below shows all the funds in the trust as of the end of the period, including the funds discussed in this report, which are highlighted:
| SCHWAB CAPITAL TRUST (ORGANIZED MAY 7, 1993) |
| Schwab Target 2010 Index Fund | Schwab Small-Cap Equity Fund™ |
| Schwab Target 2015 Index Fund | Schwab Hedged Equity Fund™ |
| Schwab Target 2020 Index Fund | Schwab Health Care Fund™ |
| Schwab Target 2025 Index Fund | Schwab® International Core Equity Fund |
| Schwab Target 2030 Index Fund | Schwab Target 2010 Fund |
| Schwab Target 2035 Index Fund | Schwab Target 2015 Fund |
| Schwab Target 2040 Index Fund | Schwab Target 2020 Fund |
| Schwab Target 2045 Index Fund | Schwab Target 2025 Fund |
| Schwab Target 2050 Index Fund | Schwab Target 2030 Fund |
| Schwab Target 2055 Index Fund | Schwab Target 2035 Fund |
| Schwab Target 2060 Index Fund | Schwab Target 2040 Fund |
| Schwab ® S&P 500 Index Fund | Schwab Target 2045 Fund |
| Schwab Small-Cap Index Fund® | Schwab Target 2050 Fund |
| Schwab Total Stock Market Index Fund® | Schwab Target 2055 Fund |
| Schwab International Index Fund® | Schwab Target 2060 Fund |
| Schwab MarketTrack All Equity Portfolio™ | Schwab Fundamental US Large Company Index Fund |
| Schwab MarketTrack Growth Portfolio™ | Schwab Fundamental US Small Company Index Fund |
| Schwab MarketTrack Balanced Portfolio™ | Schwab Fundamental International Large Company Index Fund |
| Schwab MarketTrack Conservative Portfolio™ | Schwab Fundamental International Small Company Index Fund |
| Laudus Small-Cap MarketMasters Fund™ | Schwab Fundamental Emerging Markets Large Company Index Fund |
| Laudus International MarketMasters Fund™ | Schwab Fundamental Global Real Estate Index Fund |
| Schwab Balanced Fund | Schwab® Monthly Income Fund - Moderate Payout |
| Schwab Core Equity Fund™ | Schwab® Monthly Income Fund - Enhanced Payout |
| Schwab Dividend Equity Fund™ | Schwab® Monthly Income Fund - Maximum Payout |
| Schwab Large-Cap Growth Fund™ | |
The Schwab Target Index Funds are “funds of funds.” Each of the funds seeks to achieve its investment objective by investing primarily in affiliated Schwab exchange-traded funds (ETFs). The funds may also invest in affiliated Schwab and Laudus mutual funds and unaffiliated third-party ETFs and mutual funds (all such ETFs and mutual funds referred to as underlying funds), in accordance with their target portfolio allocation. Each fund may also invest directly in equity and fixed-income securities, and cash equivalents, including money market securities.
Each fund in this report offers two share classes: Investor Shares and Institutional Shares. Shares are bought and sold at closing net asset value per share (NAV), which is the price for all outstanding shares of a fund or share class, as applicable. Each share has a par value of 1/1,000 of a cent, and the funds' Board of Trustees (the Board) may authorize the issuance of as many shares as necessary.
The funds commenced operations on August 25, 2016.
Each fund maintains its own account for purposes of holding assets and accounting, and is considered a separate entity for tax purposes. Within its account, each fund may also keep certain assets in segregated accounts, as required by securities law.
2. Significant Accounting Policies:
The following is a summary of the significant accounting policies the funds use in their preparation of financial statements. The funds follow the investment company accounting and reporting guidance of the Financial Accounting Standards Board Accounting Standard Codification Topic 946 Financial Services — Investment Companies. The accounting policies are in conformity with accounting principles generally accepted in the United States of America (GAAP).
Schwab Target Index Funds | Annual Report
Schwab Target Index Funds
Financial Notes (continued)
2. Significant Accounting Policies (continued):
The financial statements of the funds should be read in conjunction with the underlying funds' financial statements. For more information about the underlying funds' operations and policies, please refer to those funds' semiannual and annual reports, which are filed and available on the U.S. Securities and Exchange Commission's (SEC) website at www.sec.gov or at the SEC's Public Reference Room in Washington D.C.
(a) Security Valuation:
Under procedures approved by the Board, the investment adviser has formed a Pricing Committee to administer the pricing and valuation of portfolio securities and other assets and to ensure that prices used for internal purposes or provided by third parties reasonably reflect fair market value. Among other things, these procedures allow the funds to utilize independent pricing services, quotations from securities and financial instrument dealers and other market sources to determine fair value.
The funds value the securities in their portfolios every business day. The funds use the following policies to value various types of securities:
• Underlying funds: Mutual funds are valued at their respective NAVs. ETFs traded on a recognized securities exchange are valued at the last reported sale price that day or the official closing price, if applicable.
• Securities for which no quoted value is available: The Board has adopted procedures to fair value each fund’s securities when market prices are not “readily available” or are unreliable. For example, a fund may fair value a security when it is de-listed or its trading is halted or suspended; when a security’s primary pricing source is unable or unwilling to provide a price; or when a security’s primary trading market is closed during regular market hours. Each fund makes fair value determinations in good faith in accordance with the fund’s valuation procedures. The Pricing Committee considers a number of factors, including unobservable market inputs when arriving at fair value. The Pricing Committee may employ techniques such as the review of related or comparable assets or liabilities, related market activities, recent transactions, market multiples, book values, transactional back-testing, disposition analysis and other relevant information. The Pricing Committee regularly reviews these inputs and assumptions to calibrate the valuations. Due to the subjective and variable nature of fair value pricing, there can be no assurance that a fund could obtain the fair value assigned to the security upon the sale of such security. The Board convenes on a regular basis to review fair value determinations made by the funds pursuant to the valuation procedures.
In accordance with the authoritative guidance on fair value measurements and disclosures under GAAP, the funds disclose the fair value of their investments in a hierarchy that prioritizes the significant inputs to valuation techniques used to measure the fair value. The hierarchy gives the highest priority to valuations based upon unadjusted quoted prices in active markets for identical assets or liabilities (Level 1 measurements) and the lowest priority to valuations based upon unobservable inputs that are significant to the valuation (Level 3 measurements). If inputs used to measure the financial instruments fall within different levels of the hierarchy, the categorization is based on the lowest level input that is significant to the valuation. If the funds determine that either the volume and/or level of activity for an asset or liability has significantly decreased (from normal conditions for that asset or liability) or price quotations or observable inputs are not associated with orderly transactions, increased analysis and management judgment will be required to estimate fair value.
The three levels of the fair value hierarchy are as follows:
• Level 1—quoted prices in active markets for identical securities—Investments whose values are based on quoted market prices in active markets, and whose values are therefore classified as Level 1 prices, include active listed equities and ETFs. Investments in mutual funds are valued daily at their NAVs, and investments in ETFs are valued daily at the last reported sale price or the official closing price, which are classified as Level 1 prices, without consideration to the classification level of the specific investments held by an underlying fund.
• Level 2—other significant observable inputs (including quoted prices for similar securities, interest rates, prepayment speeds, credit risk, etc.)—Investments that trade in markets that are not considered to be active, but whose values are based on quoted market prices, dealer quotations or valuations provided by alternative pricing sources supported by observable inputs are classified as Level 2 prices. These generally include U.S. government and sovereign obligations, most government agency securities, investment-grade corporate bonds, certain mortgage products, less liquid listed equities, and state, municipal and provincial obligations.
• Level 3—significant unobservable inputs (including the funds' own assumptions in determining the fair value of investments)—Investments whose values are classified as Level 3 prices have significant unobservable inputs, as they may trade infrequently or not at all. When observable prices are not available for these securities, the funds use one or more
Schwab Target Index Funds | Annual Report
Schwab Target Index Funds
Financial Notes (continued)
2. Significant Accounting Policies (continued):
valuation techniques for which sufficient and reliable data is available. The inputs used by the funds in estimating the value of Level 3 prices may include the original transaction price, quoted prices for similar securities or assets in active markets, completed or pending third-party transactions in the underlying investment or comparable issuers, and changes in financial ratios or cash flows. Level 3 prices may also be adjusted to reflect illiquidity and/or non-transferability, with the amount of such discount estimated by the funds in the absence of market information. Assumptions used by the funds due to the lack of observable inputs may significantly impact the resulting fair value and therefore the funds' results of operations.
The inputs or methodology used for valuing securities are not necessarily an indication of the risk associated with investing in those securities.
The levels associated with valuing the funds' investments as of March 31, 2017 are disclosed in the Portfolio Holdings.
(b) Accounting Policies for certain Portfolio Investments (if held):
Cash Management Transactions: The funds may subscribe to the Brown Brothers Harriman & Co. (BBH) Cash Management Service Sweep (CMS Sweep). The BBH CMS Sweep is an investment product that automatically sweeps the funds’ cash balances into overnight offshore time deposits with either the BBH Grand Cayman branch or a branch of a pre-approved commercial bank. This fully automated program allows the funds to earn interest on cash balances. Excess cash invested with deposit institutions domiciled outside of the U.S., as with any offshore deposit, may be subject to sovereign actions in the jurisdiction of the deposit institution including, but not limited to, freeze, seizure or diminution. The funds bear the risk associated with the repayment of principal and payment of interest on such instruments by the institution with which the deposit is ultimately placed. Balances in the CMS Sweep are accounted for on a cost basis, which approximates market value.
(c) Security Transactions:
Security transactions are recorded as of the date the order to buy or sell the security is executed. Realized gains and losses from security transactions are based on the identified costs of the securities involved.
(d) Investment Income:
Interest income is recorded as it accrues. Dividends and distributions from portfolio securities and underlying funds are recorded on the date they are effective (the ex-dividend date), although the funds record certain foreign security dividends on the day they learn of the ex-dividend date. Any distributions from underlying funds are recorded in accordance with the character of the distributions as designated by the underlying funds.
(e) Expenses:
Pursuant to the Investment Advisory Agreement (Advisory Agreement) between Charles Schwab Investment Management, Inc. (CSIM or the investment adviser) and the funds, the investment adviser will pay the operating expenses of each fund, including the cost of transfer agency, custody, fund administration, legal, audit and other services, but excluding shareholder servicing fees, acquired fund fees and expenses, interest expense, taxes, any brokerage expenses and extraordinary or non-routine expenses.
(f) Distributions to Shareholders:
The funds make distributions from net investment income and net realized capital gains, if any, once a year.
(g) Accounting Estimates:
The accounting policies described in this report conform to GAAP. Notwithstanding this, shareholders should understand that in order to follow these principles, fund management has to make estimates and assumptions that affect the information reported in the financial statements. It’s possible that once the results are known, they may turn out to be different from these estimates and these differences may be material.
(h) Federal Income Taxes:
The funds intend to meet federal income and excise tax requirements for regulated investment companies under subchapter M of the Internal Revenue Code, as amended. Accordingly, the funds distribute substantially all of their net investment income and net realized capital gains, if any, to their respective shareholders each year. As long as a fund meets the tax requirements, it is not required to pay federal income tax.
Schwab Target Index Funds | Annual Report
Schwab Target Index Funds
Financial Notes (continued)
2. Significant Accounting Policies (continued):
(i) Indemnification:
Under the funds’ organizational documents, the officers and trustees are indemnified against certain liabilities arising out of the performance of their duties to the funds. In addition, in the normal course of business the funds enter into contracts with their vendors and others that provide general indemnifications. The funds’ maximum exposure under these arrangements is unknown as this would involve future claims that may be made against the funds. However, based on experience, the funds expect the risk of loss attributable to these arrangements to be remote.
3. Risk Factors:
Investing in the funds may involve certain risks, as discussed in the funds' prospectus, including, but not limited to, those described below. Any of these risks could cause an investor to lose money.
Asset Allocation Risk. The funds are subject to asset allocation risk, which is the risk that the selection of the underlying funds and the allocation of a fund's assets among the various asset classes and market segments will cause the fund to underperform other funds with a similar investment objective.
Conflicts of Interest Risk. The investment adviser’s authority to select and substitute underlying funds from a variety of affiliated and unaffiliated ETFs and mutual funds may create a conflict of interest because the fees paid to it by some underlying funds are higher than the fees paid by other underlying funds. The investment adviser also may have an incentive to select an affiliated underlying fund for other reasons, including to increase assets under management or to support new investment strategies. In addition, other conflicts of interest may exist where the best interests of the affiliated underlying fund may not be aligned with those of the fund or vice versa. However, the investment adviser is a fiduciary to the fund and is legally obligated to act in the fund’s best interests when selecting underlying funds.
Market Risk. Stock and bond markets rise and fall daily. As with any investment whose performance is tied to these markets, the value of an investment in the funds will fluctuate, which means that you could lose money.
ETF Risk. When a fund invests in an ETF, it will bear a proportionate share of the ETF's expenses. In addition, lack of liquidity in the market for an ETF's shares can result in its value being more volatile than the underlying portfolio of securities. Although ETFs are listed on national securities exchanges, there can be no assurance that an active trading market for such ETF shares will develop or be maintained. If an active market is not maintained, the fund may experience difficulty in buying or selling ETF shares. In addition, th market price of ETF shares may deviate, sometimes significantly, from net asset value, particularly during periods of market volatility. Certain ETFs that seek to track the performance of their benchmark indices may not fully replicate their index and may hold securities not included in the index, which may not produce the intended results.
Direct Investment Risk. The funds may invest a portion of their assets directly in equity and fixed income securities, ETFs, and cash equivalents, including money market securities. A fund’s direct investment in these securities is subject to the same or similar risks as an underlying fund’s investment in the same security.
Underlying Fund Investment Risk. The value of your investment in the funds is based primarily on the prices of the underlying funds that the fund purchases. In turn, the price of each underlying fund is based on the value of its securities. The funds are subject to the performance and expenses of the underlying funds in which they invest. Before investing in the funds, investors should assess the risks associated with the underlying funds in which the funds may invest and the types of investments made by those underlying funds. These risks include any combination of the risks described below, although a fund's exposure to a particular risk will be proportionate to the fund's overall asset allocation and underlying fund allocation.
• Investment Risk. The funds may experience losses with respect to their investment in an underlying fund. Further, there is no guarantee that an underlying fund will be able to achieve its objective.
• Fixed Income Risk. Interest rates rise and fall over time, which will affect an underlying fund's yield and share price. Because interest rates in the United States and other countries are at, or near, historically low levels, a change in a central bank’s monetary policy or improving economic conditions, among other things, may result in an increase in interest rates. A rise in interest rates could cause an underlying fund’s shares price to fall. The credit quality of a portfolio investment could also cause an underlying fund's share price to fall. An underlying fund could lose money if the issuer or guarantor of a portfolio investment or the counterparty to a derivatives contract fails to make timely principal or interest payments or otherwise honor its obligations. Fixed income securities may be paid off earlier or later than expected. Either situation could cause an underlying
Schwab Target Index Funds | Annual Report
Schwab Target Index Funds
Financial Notes (continued)
3. Risk Factors (continued):
fund to hold securities paying lower-than-market rates of interest, which could hurt the fund's yield or share price. Below investment-grade bonds (junk bonds) involve greater credit risk, are more volatile, involve greater risk of price declines and may be more susceptible to economic downturns than investment-grade securities.
• Equity Risk. The prices of equity securities rise and fall daily. These price movements may result from factors affecting individual companies, industries or the securities market as a whole. In addition, the equity market tends to move in cycles, which may cause stock prices to fall over short or extended periods of time.
• Large-, Mid- and Small-Cap Risk. Stocks of different market capitalizations tend to go in and out of favor based on market and economic conditions. Historically, small- and mid-cap stocks tend to be more volatile than large-cap stocks, and small-cap stocks have been riskier than large- and mid-cap stocks. During a period when stocks of a particular market capitalization fall behind other types of investments—bonds or stocks of another capitalization range, for instance—underlying fund's large-, mid- or small-cap holdings could reduce performance.
• Money Market Fund Risk. The funds may invest in underlying money market funds that either seek to maintain a stable $1 net asset value (“stable share price money market funds”) or have a share price that fluctuates (“variable share price money market funds”). Although an underlying stable share price money market fund seeks to maintain a stable $1 net asset value, it is possible to lose money by investing in such a money market fund. Because the share price of an underlying variable share price money market fund will fluctuate, when the fund sells the shares it owns they may be worth more or less than what the fund originally paid for them. In addition, neither type of money market fund is designed to offer capital appreciation. Effective October 14, 2016, certain underlying money market funds may impose a fee upon the sale of shares or may temporarily suspend the ability to sell shares if such fund's liquidity falls below required minimum standards.
• Foreign Investment Risk. An underlying fund's investments in securities of foreign issuers may involve certain risks that are greater than those associated with investments in securities of U.S. issuers. These include risks of adverse changes in foreign economic, political, regulatory and other conditions; changes in currency exchange rates or exchange control regulations (including limitations on currency movements and exchanges); the imposition of economic sanctions or other government restrictions; differing accounting, auditing, financial reporting and legal standards and practices; differing securities market structures; and higher transaction costs. These risks may negatively impact the value or liquidity of the underlying fund's investments, and could impair the underlying fund's ability to meet its investment objective or invest in accordance with its investment strategy.
• Emerging Markets Risk. Emerging market countries may be more likely to experience political turmoil or rapid changes in market or economic conditions than more developed countries. Emerging market countries often have less uniformity in accounting and reporting requirements and greater risk associated with the custody of securities. In addition, the financial stability of issuers (including governments) in emerging market countries may be more precarious than in other countries. As a result, there will tend to be an increased risk of price volatility associated with an underlying fund's investments in emerging market countries and, at times, it may be difficult to value such investments.
• Derivatives Risk. An underlying fund may use derivatives to enhance returns or hedge against market declines. Examples of derivatives are options, futures, options on futures and swaps. An option is the right to buy or sell an instrument at a specific price before a specific date. A future is an agreement to buy or sell a financial instrument at a specific price on a specific day. A swap is an agreement whereby two parties agree to exchange payment streams calculated in relation to a rate, index, instrument or certain securities and a predetermined amount. A credit default swap is an agreement in which the seller agrees to make a payment to the buyer in the event of a specified credit event in exchange for a fixed payment or series of fixed payments.
An underlying fund’s use of derivative instruments involves risks different from or possibly greater than the risks associated with investing directly in securities and other traditional investments. Certain of these risks, such as credit risk, leverage risk, liquidity risk, market risk and management risk, are discussed elsewhere in this section. An underlying fund’s use of derivatives is also subject to lack of availability risk, valuation risk, correlation risk and tax risk. Lack of availability risk is the risk that suitable derivative transactions may not be available in all circumstances for risk management or other purposes. Valuation risk is the risk that a particular derivative may be valued incorrectly. Correlation risk is the risk that changes in the value of the derivative may not correlate perfectly with the underlying asset, rate or index. Tax risk is the risk that the use of derivatives may cause the fund to realize higher amounts of short-term capital gain. An underlying fund’s use of derivatives could reduce the underlying fund’s performance, increase its volatility, and could cause the fund to lose more than the initial amount invested. The use of derivatives that are subject to regulation by the Commodity Futures Trading Commission (CFTC) by an underlying fund could cause a fund to become a commodity pool, which would require the fund to comply with certain CFTC rules.
Schwab Target Index Funds | Annual Report
Schwab Target Index Funds
Financial Notes (continued)
3. Risk Factors (continued):
• Leverage Risk. Certain underlying fund transactions, such as derivatives, short sales, reverse repurchase agreements, and mortgage dollar rolls, may give rise to a form of leverage and may expose an underlying fund to greater risk. Leverage tends to magnify the effect of any decrease or increase in the value of an underlying fund's portfolio securities, which means even a small amount of leverage can have a disproportionately large impact on the underlying fund.
• Real Estate Investment Risk. An underlying fund in which the fund may invest may have a policy of concentrating its investments in real estate companies and companies related to the real estate industry. As such, an underlying fund is subject to risks associated with the direct ownership of real estate securities and a fund's investment in such an underlying fund is subject to risks associated with the direct ownership of real estate securities and an investment in the underlying fund will be closely linked to the performance of the real estate markets. These risks include, among others, declines in the value of real estate; risks related to general and local economic conditions; possible lack of availability of mortgage funds or other limits to accessing the credit or capital markets; defaults by borrowers or tenants, particularly during an economic downturn; and changes in interest rates.
• Real Estate Investment Trust (REITs) Risk. An underlying fund may invest in REITs. An underlying fund's investments in REITs will be subject to the risks associated with the direct ownership of real estate, including fluctuations in the value of underlying properties, defaults by borrowers or tenants, changes in interest rates and risks related to general or local economic conditions. REITs are also subject to certain additional risks. For example, equity REITs may be affected by changes in the value of the underlying properties owned by the trusts, and mortgage REITs may be affected by the quality of any credit extended. Further, REITs may have their investments in relatively few properties, a small geographic area or a single property type. In addition, REITs have their own expenses, and the underlying fund will bear a proportionate share of those expenses.
• Liquidity Risk. An underlying fund may be unable to sell certain securities, such as illiquid securities, readily at a favorable time or price, or an underlying fund may have to sell them at a loss.
• Portfolio Turnover Risk. Certain of the underlying funds may buy and sell portfolio securities actively. If they do, their portfolio turnover rate and transaction costs will rise, which may lower the underlying fund's performance and may increase the likelihood of capital gain distributions.
Please refer to the funds’ prospectus for a more complete description of the principal risks of investing in the funds.
4. Affiliates and Affiliated Transactions:
Investment Advisory Fees
Charles Schwab Investment Management, Inc. (CSIM or the investment adviser), a wholly owned subsidiary of The Charles Schwab Corporation, serves as each fund's investment adviser and administrator pursuant to an Investment Advisory and Administration Agreement between CSIM and the trust.
For its advisory and administrative services to the funds, CSIM is entitled to receive an annual fee of 0.08%, payable monthly, based on a percentage of each fund's average daily net assets.
Expense Limitation
The Board has adopted a Shareholder Servicing Plan (the Plan) on behalf of the funds. The Plan enables each fund to bear expenses relating to the provision by financial intermediaries, including Charles Schwab & Co., Inc. (a broker-dealer affiliate of CSIM, Schwab) (together, “service providers”), of certain account maintenance, customer liaison and shareholder services to the current shareholders of the funds.
Pursuant to the Plan, each fund’s Investor Shares are subject to an annual shareholder servicing fee up to 0.05%. Each fund’s Institutional Shares are not subject to any fee under the Plan. The shareholder servicing fee paid to a particular service provider is made pursuant to its written agreement with Schwab, as distributor of the funds (or, in the case of payments made to Schwab acting as a service provider, pursuant to Schwab’s written agreement with the funds), and a fund will pay no more than 0.05% of the average annual daily net asset value of the fund’s Investor Shares owned by shareholders holding shares through such service provider. Payments under the Plan are made as described above without regard to whether the fee is more or less than the service provider’s actual cost of providing the services, and if more, such excess may be retained as profit by the service provider.
Schwab Target Index Funds | Annual Report
Schwab Target Index Funds
Financial Notes (continued)
4. Affiliates and Affiliated Transactions (continued):
Although these agreements specify certain fees for these services, CSIM and its affiliates have made an additional agreement with the funds, for so long as CSIM serves as the investment adviser to the funds, which may only be amended or terminated with the approval of the Board, to maintain the “net operating expenses” of each of the funds (including shareholder servicing fees and acquired fund fees and expenses, but excluding interest, taxes and certain non-routine expenses) as follows:
| Investor Shares | 0.13% |
| Institutional Shares | 0.08% |
In the above agreement, CSIM and its affiliates have contractually agreed to waive acquired fund fees and expenses of the underlying funds in which the funds invest.
Investments In Affiliated Funds
The funds may engage in certain transactions involving related parties. Pursuant to an exemptive order issued by the SEC, the funds may invest in other related funds. As of March 31, 2017, each Schwab Target Index Fund's ownership percentages of other related funds' shares are:
| Underlying Funds | Schwab
Target
2010
Index
Fund | Schwab
Target
2015
Index
Fund | Schwab
Target
2020
Index
Fund | Schwab
Target
2025
Index
Fund | Schwab
Target
2030
Index
Fund | Schwab
Target
2035
Index
Fund | Schwab
Target
2040
Index
Fund | Schwab
Target
2045
Index
Fund | Schwab
Target
2050
Index
Fund | Schwab
Target
2055
Index
Fund | Schwab
Target
2060
Index
Fund |
| Schwab Emerging Markets Equity ETF | —% | —% | 0.0%* | 0.0%* | 0.0%* | 0.0%* | 0.0%* | 0.0%* | 0.0%* | 0.0%* | 0.0%* |
| Schwab International Equity ETF | 0.0%* | 0.0%* | 0.0%* | 0.0%* | 0.0%* | 0.0%* | 0.0%* | 0.0%* | 0.0%* | 0.0%* | 0.0%* |
| Schwab Short-Term U.S. Treasury ETF | 0.0%* | 0.0%* | 0.0%* | 0.0%* | 0.0%* | 0.0%* | 0.0%* | 0.0%* | 0.0%* | 0.0%* | 0.0%* |
| Schwab U.S. Aggregate Bond ETF | 0.0%* | 0.1% | 0.1% | 0.2% | 0.1% | 0.1% | 0.1% | 0.0%* | 0.0%* | 0.0%* | 0.0%* |
| Schwab U.S. Large-Cap ETF | 0.0%* | 0.0%* | 0.1% | 0.1% | 0.1% | 0.1% | 0.1% | 0.1% | 0.0%* | 0.0%* | 0.0%* |
| Schwab U.S. REIT ETF | 0.0%* | 0.0%* | 0.0%* | 0.0%* | 0.0%* | 0.0%* | 0.0%* | 0.0%* | 0.0%* | 0.0%* | 0.0%* |
| Schwab U.S. Small-Cap ETF | 0.0%* | 0.0%* | 0.0%* | 0.0%* | 0.0%* | 0.0%* | 0.0%* | 0.0%* | 0.0%* | 0.0%* | 0.0%* |
| Schwab U.S. TIPS ETF | 0.0%* | 0.0%* | 0.0%* | 0.0%* | —% | —% | —% | —% | —% | —% | —% |
| Schwab Variable Share Price Money Fund, Ultra Shares | 0.0%* | 0.0%* | 0.0%* | 0.0%* | 0.0%* | —% | —% | —% | —% | —% | —% |
Below is a summary of the funds' transactions with their affiliated underlying funds during the period ended March 31, 2017:
Schwab Target 2010 Index Fund:
| Underlying Funds | Balance
of Shares
Held at
08/25/16(a) | Gross
Purchases | Gross
Sales | Balance
of Shares
Held at
03/31/17 | Market
Value at
03/31/17 | | Realized
Gains (Losses)
08/25/16(a)
to 03/31/17 | | Distributions
Received*
08/25/16(a)
to 03/31/17 |
| Schwab International Equity ETF | — | 11,836 | (376) | 11,460 | $342,310 | | $47 | | $3,340 |
| Schwab Short-Term U.S. Treasury ETF | — | 6,143 | (44) | 6,099 | 307,756 | | (21) | | 510 |
| Schwab U.S. Aggregate Bond ETF | — | 28,816 | (141) | 28,675 | 1,485,078 | | (349) | | 6,737 |
| Schwab U.S. Large-Cap ETF | — | 16,269 | (256) | 16,013 | 901,052 | | 4 | | 5,487 |
| Schwab U.S. REIT ETF | — | 922 | — | 922 | 37,599 | | — | | 287 |
| Schwab U.S. Small-Cap ETF | — | 936 | — | 936 | 58,949 | | — | | 270 |
| Schwab U.S. TIPS ETF | — | 4,102 | — | 4,102 | 227,784 | | — | | 960 |
| Schwab Variable Share Price Money Fund, Ultra Shares | — | 106,157 | — | 106,157 | 106,188 | | — | | 235 |
| Total | | | | | $3,466,716 | | ($319) | | $17,826 |
Schwab Target Index Funds | Annual Report
Schwab Target Index Funds
Financial Notes (continued)
4. Affiliates and Affiliated Transactions (continued):
Schwab Target 2015 Index Fund:
| Underlying Funds | Balance
of Shares
Held at
08/25/16(a) | Gross
Purchases | Gross
Sales | Balance
of Shares
Held at
03/31/17 | Market
Value at
03/31/17 | | Realized
Gains (Losses)
08/25/16(a)
to 03/31/17 | | Distributions
Received*
08/25/16(a)
to 03/31/17 |
| Schwab International Equity ETF | — | 21,009 | (1,965) | 19,044 | $568,844 | | $247 | | $7,080 |
| Schwab Short-Term U.S. Treasury ETF | — | 9,700 | (687) | 9,013 | 454,796 | | (302) | | 1,051 |
| Schwab U.S. Aggregate Bond ETF | — | 47,327 | (3,687) | 43,640 | 2,260,116 | | (8,281) | | 14,627 |
| Schwab U.S. Large-Cap ETF | — | 28,922 | (2,538) | 26,384 | 1,484,628 | | 2,189 | | 12,074 |
| Schwab U.S. REIT ETF | — | 1,617 | (81) | 1,536 | 62,638 | | (213) | | 634 |
| Schwab U.S. Small-Cap ETF | — | 1,699 | (73) | 1,626 | 102,405 | | (84) | | 596 |
| Schwab U.S. TIPS ETF | — | 6,601 | (408) | 6,193 | 343,897 | | (743) | | 2,160 |
| Schwab Variable Share Price Money Fund, Ultra Shares | — | 200,351 | — | 200,351 | 200,412 | | — | | 492 |
| Total | | | | | $5,477,736 | | ($7,187) | | $38,714 |
Schwab Target 2020 Index Fund:
| Underlying Funds | Balance
of Shares
Held at
08/25/16(a) | Gross
Purchases | Gross
Sales | Balance
of Shares
Held at
03/31/17 | Market
Value at
03/31/17 | | Realized
Gains (Losses)
08/25/16(a)
to 03/31/17 | | Distributions
Received*
08/25/16(a)
to 03/31/17 |
| Schwab Emerging Markets Equity ETF | — | 4,512 | (385) | 4,127 | $98,924 | | ($173) | | $687 |
| Schwab International Equity ETF | — | 64,195 | (5,490) | 58,705 | 1,753,519 | | (980) | | 12,221 |
| Schwab Short-Term U.S. Treasury ETF | — | 15,092 | (599) | 14,493 | 731,317 | | (250) | | 975 |
| Schwab U.S. Aggregate Bond ETF | — | 99,484 | (4,155) | 95,329 | 4,937,089 | | (9,091) | | 18,575 |
| Schwab U.S. Large-Cap ETF | — | 81,873 | (6,034) | 75,839 | 4,267,461 | | (371) | | 21,154 |
| Schwab U.S. REIT ETF | — | 4,901 | (171) | 4,730 | 192,889 | | (451) | | 1,041 |
| Schwab U.S. Small-Cap ETF | — | 5,494 | (453) | 5,041 | 317,482 | | (428) | | 1,167 |
| Schwab U.S. TIPS ETF | — | 8,841 | (334) | 8,507 | 472,393 | | (546) | | 1,223 |
| Schwab Variable Share Price Money Fund, Ultra Shares | — | 257,260 | — | 257,260 | 257,337 | | — | | 453 |
| Total | | | | | $13,028,411 | | ($12,290) | | $57,496 |
Schwab Target 2025 Index Fund:
| Underlying Funds | Balance
of Shares
Held at
08/25/16(a) | Gross
Purchases | Gross
Sales | Balance
of Shares
Held at
03/31/17 | Market
Value at
03/31/17 | | Realized
Gains (Losses)
08/25/16(a)
to 03/31/17 | | Distributions
Received*
08/25/16(a)
to 03/31/17 |
| Schwab Emerging Markets Equity ETF | — | 11,404 | (794) | 10,610 | $254,321 | | ($277) | | $2,403 |
| Schwab International Equity ETF | — | 107,817 | (4,131) | 103,686 | 3,097,101 | | (1,149) | | 31,724 |
| Schwab Short-Term U.S. Treasury ETF | — | 10,631 | — | 10,631 | 536,440 | | — | | 987 |
| Schwab U.S. Aggregate Bond ETF | — | 113,054 | (583) | 112,471 | 5,824,873 | | (12) | | 29,025 |
| Schwab U.S. Large-Cap ETF | — | 132,516 | (4,541) | 127,975 | 7,201,153 | | (957) | | 47,822 |
| Schwab U.S. REIT ETF | — | 8,513 | (349) | 8,164 | 332,928 | | (1,150) | | 2,613 |
| Schwab U.S. Small-Cap ETF | — | 9,934 | (384) | 9,550 | 601,459 | | (357) | | 3,002 |
| Schwab U.S. TIPS ETF | — | 3,494 | — | 3,494 | 194,022 | | — | | 719 |
| Schwab Variable Share Price Money Fund, Ultra Shares | — | 250,310 | — | 250,310 | 250,385 | | — | | 498 |
| Total | | | | | $18,292,682 | | ($3,902) | | $118,793 |
Schwab Target Index Funds | Annual Report
Schwab Target Index Funds
Financial Notes (continued)
4. Affiliates and Affiliated Transactions (continued):
Schwab Target 2030 Index Fund:
| Underlying Funds | Balance
of Shares
Held at
08/25/16(a) | Gross
Purchases | Gross
Sales | Balance
of Shares
Held at
03/31/17 | Market
Value at
03/31/17 | | Realized
Gains (Losses)
08/25/16(a)
to 03/31/17 | | Distributions
Received*
08/25/16(a)
to 03/31/17 |
| Schwab Emerging Markets Equity ETF | — | 13,842 | (503) | 13,339 | $319,736 | | ($733) | | $2,947 |
| Schwab International Equity ETF | — | 107,079 | (2,924) | 104,155 | 3,111,110 | | (3,208) | | 31,805 |
| Schwab Short-Term U.S. Treasury ETF | — | 5,371 | — | 5,371 | 271,021 | | — | | 467 |
| Schwab U.S. Aggregate Bond ETF | — | 82,614 | (2,973) | 79,641 | 4,124,607 | | (6,326) | | 18,868 |
| Schwab U.S. Large-Cap ETF | — | 128,186 | (4,013) | 124,173 | 6,987,215 | | (1,202) | | 48,376 |
| Schwab U.S. REIT ETF | — | 9,017 | (170) | 8,847 | 360,781 | | (579) | | 2,946 |
| Schwab U.S. Small-Cap ETF | — | 10,667 | (138) | 10,529 | 663,116 | | (136) | | 3,505 |
| Schwab Variable Share Price Money Fund, Ultra Shares | — | 45,081 | — | 45,081 | 45,094 | | — | | 110 |
| Total | | | | | $15,882,680 | | ($12,184) | | $109,024 |
Schwab Target 2035 Index Fund:
| Underlying Funds | Balance
of Shares
Held at
08/25/16(a) | Gross
Purchases | Gross
Sales | Balance
of Shares
Held at
03/31/17 | Market
Value at
03/31/17 | | Realized
Gains (Losses)
08/25/16(a)
to 03/31/17 | | Distributions
Received*
08/25/16(a)
to 03/31/17 |
| Schwab Emerging Markets Equity ETF | — | 14,949 | (900) | 14,049 | $336,754 | | ($332) | | $3,237 |
| Schwab International Equity ETF | — | 101,714 | (6,673) | 95,041 | 2,838,875 | | (1,412) | | 29,176 |
| Schwab Short-Term U.S. Treasury ETF | — | 2,945 | (19) | 2,926 | 147,646 | | (1) | | 282 |
| Schwab U.S. Aggregate Bond ETF | — | 52,510 | (2,910) | 49,600 | 2,568,784 | | (4,806) | | 13,282 |
| Schwab U.S. Large-Cap ETF | — | 115,181 | (6,463) | 108,718 | 6,117,562 | | (260) | | 40,938 |
| Schwab U.S. REIT ETF | — | 8,779 | (206) | 8,573 | 349,607 | | (570) | | 2,855 |
| Schwab U.S. Small-Cap ETF | — | 10,974 | (683) | 10,291 | 648,127 | | (626) | | 3,366 |
| Total | | | | | $13,007,355 | | ($8,007) | | $93,136 |
Schwab Target 2040 Index Fund:
| Underlying Funds | Balance
of Shares
Held at
08/25/16(a) | Gross
Purchases | Gross
Sales | Balance
of Shares
Held at
03/31/17 | Market
Value at
03/31/17 | | Realized
Gains (Losses)
08/25/16(a)
to 03/31/17 | | Distributions
Received*
08/25/16(a)
to 03/31/17 |
| Schwab Emerging Markets Equity ETF | — | 18,448 | (823) | 17,625 | $422,471 | | $287 | | $3,500 |
| Schwab International Equity ETF | — | 107,982 | (4,391) | 103,591 | 3,094,263 | | 392 | | 27,902 |
| Schwab Short-Term U.S. Treasury ETF | — | 1,681 | — | 1,681 | 84,823 | | — | | 144 |
| Schwab U.S. Aggregate Bond ETF | — | 35,148 | (679) | 34,469 | 1,785,150 | | (1,440) | | 8,239 |
| Schwab U.S. Large-Cap ETF | — | 118,862 | (4,045) | 114,817 | 6,460,752 | | (1,110) | | 42,591 |
| Schwab U.S. REIT ETF | — | 10,083 | (210) | 9,873 | 402,621 | | (727) | | 2,961 |
| Schwab U.S. Small-Cap ETF | — | 12,519 | (256) | 12,263 | 772,324 | | (216) | | 3,757 |
| Total | | | | | $13,022,404 | | ($2,814) | | $89,094 |
Schwab Target Index Funds | Annual Report
Schwab Target Index Funds
Financial Notes (continued)
4. Affiliates and Affiliated Transactions (continued):
Schwab Target 2045 Index Fund:
| Underlying Funds | Balance
of Shares
Held at
08/25/16(a) | Gross
Purchases | Gross
Sales | Balance
of Shares
Held at
03/31/17 | Market
Value at
03/31/17 | | Realized
Gains (Losses)
08/25/16(a)
to 03/31/17 | | Distributions
Received*
08/25/16(a)
to 03/31/17 |
| Schwab Emerging Markets Equity ETF | — | 13,973 | (641) | 13,332 | $319,568 | | ($258) | | $2,668 |
| Schwab International Equity ETF | — | 74,949 | (2,831) | 72,118 | 2,154,165 | | (912) | | 19,880 |
| Schwab Short-Term U.S. Treasury ETF | — | 689 | — | 689 | 34,767 | | — | | 64 |
| Schwab U.S. Aggregate Bond ETF | — | 16,823 | (604) | 16,219 | 839,982 | | (1,064) | | 4,104 |
| Schwab U.S. Large-Cap ETF | — | 81,221 | (3,084) | 78,137 | 4,396,769 | | (1,116) | | 29,150 |
| Schwab U.S. REIT ETF | — | 7,356 | (279) | 7,077 | 288,600 | | (782) | | 2,193 |
| Schwab U.S. Small-Cap ETF | — | 9,065 | (296) | 8,769 | 552,272 | | (249) | | 2,740 |
| Total | | | | | $8,586,123 | | ($4,381) | | $60,799 |
Schwab Target 2050 Index Fund:
| Underlying Funds | Balance
of Shares
Held at
08/25/16(a) | Gross
Purchases | Gross
Sales | Balance
of Shares
Held at
03/31/17 | Market
Value at
03/31/17 | | Realized
Gains (Losses)
08/25/16(a)
to 03/31/17 | | Distributions
Received*
08/25/16(a)
to 03/31/17 |
| Schwab Emerging Markets Equity ETF | — | 10,974 | (84) | 10,890 | $261,033 | | ($29) | | $1,856 |
| Schwab International Equity ETF | — | 57,242 | (1,275) | 55,967 | 1,671,734 | | (390) | | 13,299 |
| Schwab Short-Term U.S. Treasury ETF | — | 377 | — | 377 | 19,024 | | — | | 29 |
| Schwab U.S. Aggregate Bond ETF | — | 9,558 | (278) | 9,280 | 480,611 | | (414) | | 1,997 |
| Schwab U.S. Large-Cap ETF | — | 60,719 | (890) | 59,829 | 3,366,578 | | (899) | | 20,624 |
| Schwab U.S. REIT ETF | — | 5,550 | (51) | 5,499 | 224,249 | | (47) | | 1,538 |
| Schwab U.S. Small-Cap ETF | — | 7,002 | (63) | 6,939 | 437,018 | | (29) | | 1,986 |
| Total | | | | | $6,460,247 | | ($1,808) | | $41,329 |
Schwab Target 2055 Index Fund:
| Underlying Funds | Balance
of Shares
Held at
08/25/16(a) | Gross
Purchases | Gross
Sales | Balance
of Shares
Held at
03/31/17 | Market
Value at
03/31/17 | | Realized
Gains (Losses)
08/25/16(a)
to 03/31/17 | | Distributions
Received*
08/25/16(a)
to 03/31/17 |
| Schwab Emerging Markets Equity ETF | — | 7,327 | (501) | 6,826 | $163,619 | | ($362) | | $2,116 |
| Schwab International Equity ETF | — | 36,202 | (2,769) | 33,433 | 998,644 | | (636) | | 14,554 |
| Schwab Short-Term U.S. Treasury ETF | — | 143 | (12) | 131 | 6,610 | | (6) | | 16 |
| Schwab U.S. Aggregate Bond ETF | — | 4,016 | (275) | 3,741 | 193,747 | | (700) | | 1,273 |
| Schwab U.S. Large-Cap ETF | — | 38,017 | (2,824) | 35,193 | 1,980,310 | | (375) | | 16,344 |
| Schwab U.S. REIT ETF | — | 3,573 | (243) | 3,330 | 135,797 | | (845) | | 1,432 |
| Schwab U.S. Small-Cap ETF | — | 4,561 | (310) | 4,251 | 267,728 | | (506) | | 1,691 |
| Total | | | | | $3,746,455 | | ($3,430) | | $37,426 |
Schwab Target Index Funds | Annual Report
Schwab Target Index Funds
Financial Notes (continued)
4. Affiliates and Affiliated Transactions (continued):
Schwab Target 2060 Index Fund:
| Underlying Funds | Balance
of Shares
Held at
08/25/16(a) | Gross
Purchases | Gross
Sales | Balance
of Shares
Held at
03/31/17 | Market
Value at
03/31/17 | | Realized
Gains (Losses)
08/25/16(a)
to 03/31/17 | | Distributions
Received*
08/25/16(a)
to 03/31/17 |
| Schwab Emerging Markets Equity ETF | — | 9,127 | — | 9,127 | $218,774 | | $— | | $2,858 |
| Schwab International Equity ETF | — | 45,058 | — | 45,058 | 1,345,883 | | — | | 19,728 |
| Schwab Short-Term U.S. Treasury ETF | — | 139 | — | 139 | 7,014 | | — | | 18 |
| Schwab U.S. Aggregate Bond ETF | — | 4,231 | — | 4,231 | 219,123 | | — | | 1,264 |
| Schwab U.S. Large-Cap ETF | — | 47,185 | — | 47,185 | 2,655,100 | | — | | 22,345 |
| Schwab U.S. REIT ETF | — | 4,534 | — | 4,534 | 184,897 | | — | | 1,945 |
| Schwab U.S. Small-Cap ETF | — | 5,758 | — | 5,758 | 362,639 | | — | | 2,319 |
| Total | | | | | $4,993,430 | | $— | | $50,477 |
| * | Distributions received include distributions from net investment income and capital gains, if any, from the underlying funds. |
| (a) | Commencement of operations. |
Pursuant to an exemptive order issued by the SEC, the funds may enter into interfund borrowing and lending transactions with other funds in the Fund Complex (for definition refer to Trustees and Officers section). All loans are for temporary or emergency purposes and the interest rate to be charged will be the average of the overnight repurchase agreement rate and the short-term bank loan rate. All loans are subject to numerous conditions designed to ensure fair and equitable treatment of all participating funds. The interfund lending facility is subject to the oversight and periodic review by the Board. The funds had no interfund borrowing or lending activity during the period.
Shareholder Concentration
Certain accounts or CSIM affiliates may from time to time own (beneficially) or control a significant percentage of a fund's shares. As of March 31, 2017, shareholder ownership of each fund's outstanding shares was as follows:
| | CSIM Affiliated
Ownership %* | Number of Unaffiliated
Shareholder Accounts
Greater than 10% |
| Schwab Target 2010 Index Fund | 8% | 1 (owning 18%) |
| Schwab Target 2015 Index Fund | 5% | 1 (owning 16%) |
| Schwab Target 2020 Index Fund | - | - |
| Schwab Target 2025 Index Fund | - | - |
| Schwab Target 2030 Index Fund | - | - |
| Schwab Target 2035 Index Fund | - | - |
| Schwab Target 2040 Index Fund | - | - |
| Schwab Target 2045 Index Fund | - | - |
| Schwab Target 2050 Index Fund | 5% | - |
| Schwab Target 2055 Index Fund | 9% | - |
| Schwab Target 2060 Index Fund | 6% | 1 (owning 32%) |
| * | The CSIM affiliated ownership percentage is related to seed capital invested on the first day of operations to assist the funds in meeting their investment objective. This ownership percentage is expected to decrease over time. |
5. Board of Trustees:
The Board may include people who are officers and/or directors of CSIM or its affiliates. Federal securities law limits the percentage of such “interested persons” who may serve on a trust’s board, and the trust was in compliance with these limitations throughout the report period. The funds do not pay any interested or non-interested trustees (independent trustees). The independent trustees are paid by CSIM. For information regarding the trustees, please refer to the Trustees and Officers table at the end of this report.
Schwab Target Index Funds | Annual Report
Schwab Target Index Funds
Financial Notes (continued)
6. Borrowing from Banks:
Effective October 6, 2016, the funds became participants with other U.S. registered investment companies managed by CSIM in a joint, syndicated, committed $555 million line of credit (The Credit Facility), which matures on October 5, 2017. Under the terms of the Credit Facility, in addition to the interest charged on any borrowings by a fund, each fund pays a commitment fee of 0.15% per annum on its proportionate share of the unused portion of the Credit Facility. There were no borrowings from the line of credit during the period.
The funds also have access to custodian overdraft facilities. A fund may have utilized the overdraft facility and incurred an interest expense, which is disclosed on the fund’s Statement of Operations, if any. The interest expense is determined based on a negotiated rate above the current Federal Funds Rate.
7. Purchases and Sales/Maturities of Investment Securities:
For the period ended March 31, 2017, purchases and sales/maturities of securities (excluding short-term obligations) were as follows:
| | Purchases
of Securities | Sales/Maturities
of Securities |
| Schwab Target 2010 Index Fund | $3,454,252 | $34,399 |
| Schwab Target 2015 Index Fund | 5,848,011 | 455,581 |
| Schwab Target 2020 Index Fund | 13,633,967 | 802,463 |
| Schwab Target 2025 Index Fund | 18,277,771 | 455,482 |
| Schwab Target 2030 Index Fund | 15,988,017 | 481,295 |
| Schwab Target 2035 Index Fund | 13,362,610 | 764,324 |
| Schwab Target 2040 Index Fund | 13,053,799 | 436,138 |
| Schwab Target 2045 Index Fund | 8,620,305 | 321,305 |
| Schwab Target 2050 Index Fund | 6,364,210 | 106,316 |
| Schwab Target 2055 Index Fund | 3,857,169 | 295,172 |
| Schwab Target 2060 Index Fund | 4,755,858 | — |
8. Federal Income Taxes:
As of March 31, 2017, the components of distributable earnings on a tax-basis were as follows:
| | Schwab
Target
2010
Index Fund | | Schwab
Target
2015
Index Fund | | Schwab
Target
2020
Index Fund | | Schwab
Target
2025
Index Fund | | Schwab
Target
2030
Index Fund | | Schwab
Target
2035
Index Fund | | Schwab
Target
2040
Index Fund |
| Undistributed ordinary income | $6,563 | | $15,821 | | $27,083 | | $44,578 | | $37,619 | | $30,556 | | $32,395 |
| Undistributed long-term capital gains | — | | — | | — | | — | | — | | — | | — |
| Unrealized appreciation on investments | 49,404 | | 95,341 | | 195,900 | | 493,750 | | 384,560 | | 417,150 | | 410,733 |
| Unrealized depreciation on investments | (2,610) | | (12,708) | | (15) | | (23,542) | | (8,602) | | (9,418) | | (7,557) |
| Net unrealized appreciation (depreciation) | $46,794 | | $82,633 | | $195,885 | | $470,208 | | $375,958 | | $407,732 | | $403,176 |
Schwab Target Index Funds | Annual Report
Schwab Target Index Funds
Financial Notes (continued)
8. Federal Income Taxes (continued):
| | Schwab
Target
2045
Index Fund | | Schwab
Target
2050
Index Fund | | Schwab
Target
2055
Index Fund | | Schwab
Target
2060
Index Fund |
| Undistributed ordinary income | $19,215 | | $13,423 | | $8,131 | | $11,531 |
| Undistributed long-term capital gains | — | | — | | — | | — |
| Unrealized appreciation on investments | 288,741 | | 204,787 | | 185,547 | | 238,220 |
| Unrealized depreciation on investments | (1,662) | | (2,432) | | (1,113) | | (648) |
| Net unrealized appreciation (depreciation) | $287,079 | | $202,355 | | $184,434 | | $237,572 |
The primary difference between book-basis and tax-basis unrealized appreciation or unrealized depreciation of investments is the tax deferral of losses on wash sales.
Capital loss carryforwards may be used to offset future realized capital gains for federal income tax purposes. As of March 31, 2017, the funds had no capital loss carryforwards.
The tax-basis components of distributions paid during the current fiscal year were as follows:
| | Schwab
Target
2010
Index Fund | Schwab
Target
2015
Index Fund | Schwab
Target
2020
Index Fund | Schwab
Target
2025
Index Fund | Schwab
Target
2030
Index Fund | Schwab
Target
2035
Index Fund | Schwab
Target
2040
Index Fund |
| Current period distributions | | | | | | | |
| Ordinary income | $10,914 | $24,730 | $30,146 | $71,373 | $69,393 | $61,997 | $56,337 |
| Long-term capital gains | — | — | — | — | — | — | — |
| | Schwab
Target
2045
Index Fund | Schwab
Target
2050
Index Fund | Schwab
Target
2055
Index Fund | Schwab
Target
2060
Index Fund |
| Current period distributions | | | | |
| Ordinary income | $40,431 | $27,065 | $28,582 | $38,019 |
| Long-term capital gains | — | — | — | — |
Distributions paid to shareholders are based on net investment income and net realized gains determined on a tax basis, which may differ from net investment income and net realized gains for financial reporting purposes. These differences reflect the differing character of certain income items and net realized gains and losses for financial statement and tax purposes, and may result in reclassification among certain capital accounts on the financial statements.
Permanent book and tax basis differences may result in reclassifications between components of net assets as required. The adjustments will have no impact on net assets or the results of operations. As of March 31, 2017, no such reclassifications were required.
As of March 31, 2017, management has reviewed the tax positions for open periods (for federal purposes, three years from the date of filing and for state purposes, four years from the date of filing) as applicable to the funds, and has determined that no provision for income tax is required in the funds’ financial statements. The funds recognize interest and penalties, if any, related to unrecognized tax benefits as income tax expense in the Statement of Operations. During the period ended March 31, 2017, the funds did not incur any interest or penalties.
Schwab Target Index Funds | Annual Report
Schwab Target Index Funds
Financial Notes (continued)
9. Recent Regulatory Development:
In October 2016, the SEC adopted new rules and amended existing rules (together, final rules) intended to modernize the reporting and disclosure of information by registered investment companies. In part, the final rules amend Regulation S-X and require standardized, enhanced disclosure about derivatives in investment company financial statements, as well as other amendments. The compliance date for the amendments to Regulation S-X is August 1, 2017. Management is currently evaluating the impact that the adoption of the amendments to Regulation S-X will have on the funds' financial statements and related disclosures.
10. Subsequent Events:
Management has determined there are no subsequent events or transactions through the date the financial statements were issued that would have materially impacted the financial statements as presented.
Schwab Target Index Funds | Annual Report
Schwab Target Index Funds
Report of Independent Registered Public Accounting Firm
To the Board of Trustees of Schwab Capital Trust and Shareholders of Schwab Target 2010 Index Fund, Schwab Target 2015 Index Fund, Schwab Target 2020 Index Fund, Schwab Target 2025 Index Fund, Schwab Target 2030 Index Fund, Schwab Target 2035 Index Fund, Schwab Target 2040 Index Fund, Schwab Target 2045 Index Fund, Schwab Target 2050 Index Fund, Schwab Target 2055 Index Fund, and Schwab Target 2060 Index Fund
In our opinion, the accompanying statements of assets and liabilities, including the portfolio holdings, and the related statements of operations and of changes in net assets and the financial highlights present fairly, in all material respects, the financial position of the Schwab Target 2010 Index Fund, Schwab Target 2015 Index Fund, Schwab Target 2020 Index Fund, Schwab Target 2025 Index Fund, Schwab Target 2030 Index Fund, Schwab Target 2035 Index Fund, Schwab Target 2040 Index Fund, Schwab Target 2045 Index Fund, Schwab Target 2050 Index Fund, Schwab Target 2055 Index Fund, and Schwab Target 2060 Index Fund (eleven of the funds constituting the Schwab Capital Trust, hereafter referred to as the “Funds”) as of March 31, 2017, and the results of each of their operations, the changes in each of their net assets and the financial highlights for the period August 25, 2016 (commencement of operations) through March 31, 2017, in conformity with accounting principles generally accepted in the United States of America. These financial statements and financial highlights (hereafter referred to as “financial statements”) are the responsibility of the Funds’ management. Our responsibility is to express an opinion on these financial statements based on our audit. We conducted our audit of these financial statements in accordance with the standards of the Public Company Accounting Oversight Board (United States). Those standards require that we plan and perform the audit to obtain reasonable assurance about whether the financial statements are free of material misstatement. An audit includes examining, on a test basis, evidence supporting the amounts and disclosures in the financial statements, assessing the accounting principles used and significant estimates made by management, and evaluating the overall financial statement presentation. We believe that our audits, which included confirmation of securities and investments in the underlying funds as of March 31, 2017 by correspondence with the custodian and transfer agent of the underlying funds, respectively, or by other appropriate auditing procedures where replies were not received, provide a reasonable basis for our opinion.
PricewaterhouseCoopers LLP
San Francisco, California
May 17, 2017
Schwab Target Index Funds | Annual Report
Schwab Target Index Funds
Other Federal Tax Information (unaudited)
For corporate shareholders, the following percentage of the funds' dividend distributions paid during the fiscal year ended March 31, 2017, qualify for the corporate dividends received deduction:
| | Percentage |
| Schwab Target 2010 Index Fund | 29.38 |
| Schwab Target 2015 Index Fund | 27.22 |
| Schwab Target 2020 Index Fund | 34.73 |
| Schwab Target 2025 Index Fund | 38.96 |
| Schwab Target 2030 Index Fund | 41.97 |
| Schwab Target 2035 Index Fund | 42.23 |
| Schwab Target 2040 Index Fund | 45.56 |
| Schwab Target 2045 Index Fund | 45.58 |
| Schwab Target 2050 Index Fund | 48.84 |
| Schwab Target 2055 Index Fund | 43.21 |
| Schwab Target 2060 Index Fund | 41.86 |
For the fiscal year ended March 31, 2017, the funds designate the following amounts of the dividend distributions as qualified dividends for the purpose of the maximum rate under section 1(h)(11) of the Internal Revenue Code. Shareholders will be notified in January 2018 via IRS form 1099 of the amounts for use in preparing their 2017 income tax return.
| Schwab Target 2010 Index Fund | $5,259 |
| Schwab Target 2015 Index Fund | 10,984 |
| Schwab Target 2020 Index Fund | 17,041 |
| Schwab Target 2025 Index Fund | 47,806 |
| Schwab Target 2030 Index Fund | 50,436 |
| Schwab Target 2035 Index Fund | 46,263 |
| Schwab Target 2040 Index Fund | 44,402 |
| Schwab Target 2045 Index Fund | 31,860 |
| Schwab Target 2050 Index Fund | 22,718 |
| Schwab Target 2055 Index Fund | 24,253 |
| Schwab Target 2060 Index Fund | 31,763 |
Schwab Target Index Funds | Annual Report
Schwab Target Index Funds
Trustees and Officers
The tables below give information about the trustees and officers of Schwab Capital Trust, which includes the funds covered in this report. The “Fund Complex” includes The Charles Schwab Family of Funds, Schwab Capital Trust, Schwab Investments, Schwab Annuity Portfolios, Schwab Strategic Trust and Laudus Trust. The Fund Complex includes 110 funds.
The address for all trustees and officers is 211 Main Street, San Francisco, CA 94105. You can find more information about the trustees and officers in the funds’ Statement of Additional Information, which is available free by calling 1-877-824-5615.
| Independent Trustees |
Name, Year of Birth, and
Position(s) with the trust
(Terms of office, and
length of Time Served1) | Principal Occupations
During the Past Five Years | Number of
Portfolios in
Fund Complex
Overseen by
the Trustee | Other Directorships |
Robert W. Burns
1959
Trustee
(Trustee of Schwab Strategic Trust since 2009; The Charles Schwab Family of Funds, Schwab Investments, Schwab Capital Trust, Schwab Annuity Portfolios and Laudus Trust since 2016) | Retired/Private Investor (Jan. 2009 – present). Formerly, Managing Director, Pacific Investment Management Company, LLC (PIMCO) and President, PIMCO Funds. | 110 | Director, PS Business Parks, Inc. (2005 – 2012) |
John F. Cogan
1947
Trustee
(Trustee of The Charles Schwab Family of Funds, Schwab Investments, Schwab Capital Trust and Schwab Annuity Portfolios since 2008; Laudus Trust since 2010; Schwab Strategic Trust since 2016) | Senior Fellow, The Hoover Institution at Stanford University (Oct. 1979 – present); Senior Fellow, Stanford Institute for Economic Policy Research (2000 – present); Professor of Public Policy, Stanford University (1994 – 2015). | 110 | Director, Gilead Sciences, Inc. (2005 – present) |
Stephen Timothy Kochis
1946
Trustee
(Trustee of Schwab Strategic Trust since 2012; The Charles Schwab Family of Funds, Schwab Investments, Schwab Capital Trust, Schwab Annuity Portfolios and Laudus Trust since 2016) | CEO and Owner, Kochis Global (wealth management consulting) (May 2012 – present); Chairman and CEO, Aspiriant, LLC (wealth management) (Jan. 2008 – Apr. 2012). | 110 | None |
David L. Mahoney
1954
Trustee
(Trustee of The Charles Schwab Family of Funds, Schwab Investments, Schwab Capital Trust, Schwab Annuity Portfolios and Laudus Trust since 2011; Schwab Strategic Trust since 2016) | Private Investor. | 110 | Director, Symantec Corporation (2003 – present)
Director, Corcept Therapeutics Incorporated (2004 – present)
Director, Adamas Pharmaceuticals, Inc. (2009 – present) |
Schwab Target Index Funds | Annual Report
Schwab Target Index Funds
| Independent Trustees (continued) |
Name, Year of Birth, and
Position(s) with the trust
(Terms of office, and
length of Time Served1) | Principal Occupations
During the Past Five Years | Number of
Portfolios in
Fund Complex
Overseen by
the Trustee | Other Directorships |
Kiran M. Patel
1948
Trustee
(Trustee of The Charles Schwab Family of Funds, Schwab Investments, Schwab Capital Trust, Schwab Annuity Portfolios and Laudus Trust since 2011; Schwab Strategic Trust since 2016) | Retired. Executive Vice President and General Manager of Small Business Group, Intuit, Inc. (financial software and services firm for consumers and small businesses) (Dec. 2008 – Sept. 2013). | 110 | Director, KLA-Tencor Corporation (2008 – present) |
Kimberly S. Patmore
1956
Trustee
(Trustee of The Charles Schwab Family of Funds, Schwab Investments, Schwab Capital Trust, Schwab Annuity Portfolios, Schwab Strategic Trust and Laudus Trust since 2016) | Consultant, Patmore Management Consulting (management consulting) (2008 – present). | 110 | None |
Charles A. Ruffel
1956
Trustee
(Trustee of Schwab Strategic Trust since 2009; The Charles Schwab Family of Funds, Schwab Investments, Schwab Capital Trust, Schwab Annuity Portfolios and Laudus Trust since 2015) | Co-Chief Executive Officer, Kudu Investment Management, LLC (financial services) (Jan. 2015 – present); Partner, Kudu Advisors, LLC (financial services) (June 2008 – Jan. 2015); Advisor, Asset International, Inc. (publisher of financial services information) (Aug. 2008 – Jan. 2015). | 110 | None |
Gerald B. Smith
1950
Trustee
(Trustee of The Charles Schwab Family of Funds, Schwab Investments, Schwab Capital Trust and Schwab Annuity Portfolios since 2000; Laudus Trust since 2010; Schwab Strategic Trust since 2016) | Chairman, Chief Executive Officer and Founder of Smith Graham & Co. (investment advisors) (Mar. 1990 – present). | 110 | Director, Eaton (2012 – present)
Director and Chairman of the Audit Committee, Oneok Partners LP (2003 – 2013)
Director, Oneok, Inc. (2009 – 2013)
Lead Independent Director, Board of Cooper Industries (2002 – 2012) |
Joseph H. Wender
1944
Trustee
(Trustee of The Charles Schwab Family of Funds, Schwab Investments, Schwab Capital Trust and Schwab Annuity Portfolios since 2008; Laudus Trust since 2010; Schwab Strategic Trust since 2016) | Senior Consultant, Goldman Sachs & Co., Inc. (investment banking and securities firm) (Jan. 2008 – present); Partner, Colgin Partners, LLC (vineyards) (Feb. 1998 – present). | 110 | Board Member and Chairman of the Audit Committee, Ionis Pharmaceuticals (1994 – present)
Lead Independent Director and Chair of Audit Committee, OUTFRONT Media Inc. (2014 – present) |
Schwab Target Index Funds | Annual Report
Schwab Target Index Funds
| Interested Trustees |
Name, Year of Birth, and
Position(s) with the trust
(Terms of office, and
length of Time Served1) | Principal Occupations
During the Past Five Years | Number of
Portfolios in
Fund Complex
Overseen by
the Trustee | Other Directorships |
Walter W. Bettinger II2
1960
Chairman and Trustee
(Trustee of The Charles Schwab Family of Funds, Schwab Investments, Schwab Capital Trust and Schwab Annuity Portfolios since 2008; Schwab Strategic Trust since 2009; Laudus Trust since 2010) | Director, President and Chief Executive Officer, The Charles Schwab Corporation (Oct. 2008 – present); President and Chief Executive Officer (Oct. 2008 – present), Director (May 2008 – present), Charles Schwab & Co., Inc.; Director, Charles Schwab Bank (Apr. 2006 – present); Director, Schwab Holdings, Inc. (May 2008 – present); and Director, Charles Schwab Investment Management, Inc. (July 2016 – present). | 110 | Director, The Charles Schwab Corporation (2008 – present) |
Marie A. Chandoha2
1961
Trustee
(Trustee of The Charles Schwab Family of Funds, Schwab Investments, Schwab Capital Trust, Schwab Annuity Portfolios, Schwab Strategic Trust and Laudus Trust since 2016) | Director, President and Chief Executive Officer (Dec. 2010 – present), Chief Investment Officer (Sept. 2010 – Oct. 2011), Charles Schwab Investment Management, Inc.; Trustee (Jan. 2016 – present), President, Chief Executive Officer (Dec. 2010 – present), and Chief Investment Officer (Sept. 2010 – Oct. 2011), Schwab Funds, Laudus Funds and Schwab ETFs; Director, Charles Schwab Worldwide Funds plc and Charles Schwab Asset Management (Ireland) Limited (Jan. 2011 – present); Global Head of Fixed Income Business Division, BlackRock, Inc. (formerly Barclays Global Investors) (Mar. 2007 – Aug. 2010). | 110 | None |
Joseph R. Martinetto2
1962
Trustee
(Trustee of The Charles Schwab Family of Funds, Schwab Investments, Schwab Capital Trust, Schwab Annuity Portfolios, Schwab Strategic Trust and Laudus Trust since 2016) | Senior Executive Vice President and Chief Financial Officer, The Charles Schwab Corporation and Charles Schwab & Co., Inc. (July 2015 – present); Executive Vice President and Chief Financial Officer of The Charles Schwab Corporation and Charles Schwab & Co., Inc. (May 2007 – July 2015); Director, Charles Schwab & Co., Inc. (May 2007 – present); Director (Apr. 2010 – present) and Chief Executive Officer (July 2013 – Apr. 2015), Charles Schwab Bank; Director, Executive Vice President and Chief Financial Officer (May 2007 – present), Senior Executive Vice President (Feb. 2016 – present), and Executive Vice President (May 2007 – Feb. 2016), Schwab Holdings, Inc. | 110 | None |
| Officers of the Trust |
Name, Year of Birth, and Position(s) with the trust
(Terms of office, and length of Time Served3) | Principal Occupations During the Past Five Years |
Marie A. Chandoha
1961
President and Chief Executive Officer
(Officer of The Charles Schwab Family of Funds, Schwab Investments, Schwab Capital Trust, Schwab Annuity Portfolios, Schwab Strategic Trust and Laudus Trust since 2010) | Director, President and Chief Executive Officer (Dec. 2010 – present), Chief Investment Officer (Sept. 2010 – Oct. 2011), Charles Schwab Investment Management, Inc.; Trustee (Jan. 2016 – present), President, Chief Executive Officer (Dec. 2010 – present), and Chief Investment Officer (Sept. 2010 – Oct. 2011), Schwab Funds, Laudus Funds and Schwab ETFs; Director, Charles Schwab Worldwide Funds plc and Charles Schwab Asset Management (Ireland) Limited (Jan. 2011 – present); Global Head of Fixed Income Business Division, BlackRock, Inc. (formerly Barclays Global Investors) (Mar. 2007 – Aug. 2010). |
Mark Fischer
1970
Treasurer and Chief Financial Officer
(Officer of The Charles Schwab Family of Funds, Schwab Investments, Schwab Capital Trust, Schwab Annuity Portfolios, Schwab Strategic Trust and Laudus Trust since 2013) | Treasurer and Chief Financial Officer, Schwab Funds, Laudus Funds and Schwab ETFs (Jan. 2016 – present); Assistant Treasurer, Schwab Funds and Laudus Funds (Dec. 2013 – Dec. 2015), Schwab ETFs (Nov. 2013 – Dec. 2015); Vice President, Charles Schwab Investment Management, Inc. (Oct. 2013 – present); Executive Director, J.P. Morgan Investor Services (Apr. 2011 – Sept. 2013); Assistant Treasurer, Massachusetts Financial Service Investment Management (May 2005 – Mar. 2011). |
Schwab Target Index Funds | Annual Report
Schwab Target Index Funds
| Officers of the Trust (continued) |
Name, Year of Birth, and Position(s) with the trust
(Terms of office, and length of Time Served3) | Principal Occupations During the Past Five Years |
George Pereira
1964
Senior Vice President and Chief Operating Officer
(Officer of The Charles Schwab Family of Funds, Schwab Investments, Schwab Capital Trust and Schwab Annuity Portfolios since 2004; Laudus Trust since 2006; Schwab Strategic Trust since 2009) | Senior Vice President and Chief Financial Officer (Nov. 2004 – present), Chief Operating Officer (Jan. 2011 – present), Charles Schwab Investment Management, Inc.; Senior Vice President and Chief Operating Officer (Jan. 2016 – present), Treasurer and Chief Financial Officer, Laudus Funds (June 2006 – Dec. 2015); Treasurer and Principal Financial Officer, Schwab Funds (Nov. 2004 – Dec. 2015) and Schwab ETFs (Oct. 2009 – Dec. 2015); Director, Charles Schwab Worldwide Funds plc and Charles Schwab Asset Management (Ireland) Limited (Apr. 2005 – present). |
Omar Aguilar
1970
Senior Vice President and Chief Investment Officer – Equities and Multi-Asset Strategies
(Officer of The Charles Schwab Family of Funds, Schwab Investments, Schwab Capital Trust, Schwab Annuity Portfolios, Schwab Strategic Trust and Laudus Trust since 2011) | Senior Vice President and Chief Investment Officer – Equities and Multi-Asset Strategies, Charles Schwab Investment Management, Inc. (Apr. 2011 – present); Senior Vice President and Chief Investment Officer – Equities, Schwab Funds, Laudus Funds and Schwab ETFs (June 2011 – present); Head of the Portfolio Management Group and Vice President of Portfolio Management, Financial Engines, Inc. (May 2009 – Apr. 2011); Head of Quantitative Equity, ING Investment Management (July 2004 – Jan. 2009). |
Brett Wander
1961
Senior Vice President and Chief Investment Officer – Fixed Income
(Officer of The Charles Schwab Family of Funds, Schwab Investments, Schwab Capital Trust, Schwab Annuity Portfolios, Schwab Strategic Trust and Laudus Trust since 2011) | Senior Vice President and Chief Investment Officer – Fixed Income, Charles Schwab Investment Management, Inc. (Apr. 2011 – present); Senior Vice President and Chief Investment Officer – Fixed Income, Schwab Funds, Laudus Funds and Schwab ETFs (June 2011 – present); Senior Managing Director, Global Head of Active Fixed-Income Strategies, State Street Global Advisors (Jan. 2008 – Oct. 2010); Director of Alpha Strategies Loomis, Sayles & Company (Apr. 2006 – Jan. 2008). |
David Lekich
1964
Chief Legal Officer and Secretary, Schwab Funds and Schwab ETFs
Vice President and Assistant Clerk, Laudus Funds
(Officer of The Charles Schwab Family of Funds, Schwab Investments, Schwab Capital Trust, Schwab Annuity Portfolios, Schwab Strategic Trust and Laudus Trust since 2011) | Senior Vice President (Sept. 2011 – present), Vice President (Mar. 2004 – Sept. 2011), Charles Schwab & Co., Inc.; Senior Vice President and Chief Counsel (Sept. 2011 – present), Vice President (Jan. 2011 – Sept. 2011), Charles Schwab Investment Management, Inc.; Secretary (Apr. 2011 – present) and Chief Legal Officer (Dec. 2011 – present), Schwab Funds; Vice President and Assistant Clerk, Laudus Funds (Apr. 2011 – present); Secretary (May 2011 – present) and Chief Legal Officer (Nov. 2011 – present), Schwab ETFs. |
Catherine MacGregor
1964
Vice President and Assistant Secretary, Schwab Funds and Schwab ETFs
Chief Legal Officer, Vice President and Clerk, Laudus Funds
(Officer of The Charles Schwab Family of Funds, Schwab Investments, Schwab Capital Trust, Schwab Annuity Portfolios and Laudus Trust since 2005; Schwab Strategic Trust since 2009) | Vice President, Charles Schwab & Co., Inc., Charles Schwab Investment Management, Inc. (July 2005 – present); Vice President (Dec. 2005 – present), Chief Legal Officer and Clerk (Mar. 2007 – present), Laudus Funds; Vice President (Nov. 2005 – present) and Assistant Secretary (June 2007 – present), Schwab Funds; Vice President and Assistant Secretary, Schwab ETFs (Oct. 2009 – present). |
| 1 | Each Trustee shall hold office until the election and qualification of his or her successor, or until he or she dies, resigns or is removed. The retirement policy requires that each independent trustee retire by December 31 of the year in which the Trustee turns 74 or the Trustee’s twentieth year of service as an independent trustee on any trust in the Fund Complex, whichever occurs first. |
| 2 | Mr. Bettinger, Ms. Chandoha, and Mr. Martinetto are Interested Trustees because they own stock of The Charles Schwab Corporation, the parent company of the investment adviser. |
| 3 | The President, Treasurer and Secretary/Clerk hold office until their respective successors are chosen and qualified or until he or she sooner dies, resigns, is removed or becomes disqualified. Each of the other officers serves at the pleasure of the Board. |
Schwab Target Index Funds | Annual Report
Schwab Target Index Funds
asset allocation The practice of dividing a portfolio among different asset classes, with each asset class assigned a particular percentage.
asset class A group of securities with similar structure and basic characteristics. Stocks, bonds and cash are the three main examples of asset classes.
Bloomberg Barclays U.S. 1 – 3 Year Treasury Bond Index An index that includes all publicly-issued U.S. Treasury securities that have a remaining maturity of greater than or equal to one year and less than three years, are rated investment grade, and have $250 million or more of outstanding face value.
Bloomberg Barclays U.S. Aggregate Bond Index An index that represents securities that are SEC registered, taxable, and dollar denominated. The index covers the U.S. investment grade fixed rate bond market, with index components for government and corporate securities, mortgage pass-through securities, and asset-backed securities. The index excludes certain types of securities, including state and local government series bonds, structured notes embedded with swaps or other special features, private placements, floating rate securities, inflation-linked bonds and Eurobonds.
Bloomberg Barclays U.S. Treasury Bills 1 – 3 Month Index An index that includes all publicly issued zero-coupon U.S. Treasury Bills that have a remaining maturity of less than 3 months but more than 1 month, are rated investment grade and have $250 million or more of outstanding face value. It excludes zero-coupon STRIPS.
Bloomberg Barclays U.S. Treasury Inflation Protected Securities (TIPS) Index (Series-L) An index that tracks inflation-protected securities issued by the U.S. Treasury that have at least one year remaining to maturity, are rated investment grade, and have $250 million or more of outstanding face value.
bond A security representing a loan from the investor to the issuer. A bond typically pays interest at a fixed rate (the coupon rate) until a specified date (the maturity date), at which time the issuer returns the money borrowed (principal or face value) to the bondholder. Because of their structure, bonds are sometimes called “fixed income securities” or “debt securities.”
An individual bond is subject to the credit risk of the issuer. Changes in interest rates can affect a bond’s market value prior to call or maturity. There is no guarantee that a bond’s yield to call or maturity will provide a positive return over the rate of inflation.
bond fund A bond fund is subject to the same credit, interest rate, and inflation risks as bonds. In addition, a bond fund incurs ongoing fees and expenses. A bond fund’s net asset value will fluctuate with the price of the underlying bonds and the portfolio turnover activity; return of principal is not guaranteed.
cap, capitalization See “market cap.”
capital gain, capital loss the difference between the amount paid for an investment and its value at a later time. If the investment has been sold, the capital gain or loss is considered a realized gain or loss. If the investment is still held, the capital gain or loss is considered unrealized appreciation or depreciation.
Dow Jones U.S. Large-Cap Total Stock Market Index An index that is a subset of the Dow Jones U.S. Total Stock Market Index, which measures all U.S. equity securities with readily available prices. The index includes approximately the largest 750 stocks and is float-adjusted market-capitalization weighted.
Dow Jones U.S. Select REIT Index An index that is a float-adjusted market-capitalization weighted index comprised of real estate investment trusts (REITs). REITs are real estate companies that own and commonly operate income-producing commercial and/or residential real estate. The index excludes mortgage REITs, net-lease REITs, real estate finance companies, mortgage brokers and bankers, commercial and residential real estate brokers and estate agents, homebuilders, large landowners and sub dividers of unimproved land, hybrid REITs, timber REITs and companies that have more than 25% of their assets in direct mortgage investments.
Dow Jones U.S. Small-Cap Total Stock Market Index An index that is a subset of the Dow Jones U.S. Total Stock Market Index, which measures all U.S. equity securities with readily available prices. The index includes components ranked 751-2500 by full market capitalization and is float-adjusted market cap weighted.
Dow Jones U.S. Total Stock Market Index An index that measures the performance of all publicly traded stocks of companies headquartered in the U.S. for which pricing data is readily available - currently more than 3,800 stocks. The index is a float adjusted market capitalization weighted index that reflects the shares of securities actually available to investors in the marketplace.
expense ratio The amount that is taken from a mutual fund’s assets each year to cover the fund’s operating expenses. An expense ratio of 0.50% means that a fund’s expenses amount to half of one percent of its average net assets a year.
FTSE Developed ex US Index (Net) An index that is comprised of approximately 85% large-cap stocks and 15% mid-cap stocks from more than 20 developed markets, excluding the U.S. This index defines the large- and mid-cap stocks as approximately the top 90% of the eligible universe. The Net version of the index reflects reinvested dividends net of withholding taxes, but reflects no deductions for expenses or other taxes.
market cap, market capitalization The value of a company as determined by the total value of all shares of its stock outstanding.
MSCI EAFE Index (Net) A free float-adjusted market capitalization index that is designed to measure the equity market performance of developed markets in Europe, Australasia, and the Far East. The Net version of the index reflects reinvested dividends net of withholding taxes, but reflects no deductions for expenses or other taxes; returns are calculated applying dividend withholding rates applicable to non-resident persons who do not benefit from double taxation treaties.
net asset value (NAV) The value of one share of a mutual fund. NAV is calculated by taking the fund’s total assets, subtracting liabilities, and dividing by the number of shares outstanding.
outstanding shares, shares outstanding When speaking of a company or mutual fund, indicates all shares currently held by investors.
Russell 2000 Index An index that measures the performance of the 2,000 smallest companies in the Russell 3000 Index. The Russell 3000 Index measures the performance of the largest 3,000 U.S. companies representing approximately 98% of the investable U.S. equity market.
S&P 500 Index An index that is designed to measure the performance of 500 leading publicly traded companies from a broad range of industries.
stock A share of ownership, or equity, in the issuing company.
Schwab Target Index Funds | Annual Report
Schwab Target Index Funds
Target 2010 Passive Composite Index A custom blended index developed by CSIM based on the Target 2010 Index Fund’s asset allocation glide schedule and will become more conservative as time elapses. Effective February 1, 2017, the composite is derived using the following portion allocations: 24.9% Dow Jones U.S. Large Cap Total Stock Market Index, 1.6% Dow Jones U.S. Small Cap Total Stock Market Index, 9.5% FTSE Developed ex US Index (Net), 1.1% Dow Jones U.S. Select REIT Index, 8.5% Bloomberg Barclays U.S. 1-3 Year Treasury Bond Index, 41.1% Bloomberg Barclays U.S. Aggregate Bond Index, 6.3% Bloomberg Barclays U.S. Treasury Inflation Protected Securities (TIPS) Index (Series-L), 7.1% Bloomberg Barclays 1-3 Month U.S. Treasury Bill Index. The components that make up the composite index may vary over time. The composite index represents target allocations for 2017. Percentages listed may not total to 100% due to rounding.
Target 2015 Passive Composite Index A custom blended index developed by CSIM based on the Target 2015 Index Fund’s asset allocation glide schedule and will become more conservative as time elapses. Effective February 1, 2017, the composite is derived using the following portion allocations: 26.3% Dow Jones U.S. Large Cap Total Stock Market Index, 1.7% Dow Jones U.S. Small Cap Total Stock Market Index, 10.1% FTSE Developed ex US Index (Net), 1.2% Dow Jones U.S. Select REIT Index, 8.0% Bloomberg Barclays U.S. 1-3 Year Treasury Bond Index, 39.9% Bloomberg Barclays U.S. Aggregate Bond Index, 6.1% Bloomberg Barclays U.S. Treasury Inflation Protected Securities (TIPS) Index (Series-L), 6.7% Bloomberg Barclays U.S. Treasury Bills 1-3 Month Index. The components that make up the composite index may vary over time. The composite index represents target allocations for 2017. Percentages listed may not total to 100% due to rounding.
Target 2020 Passive Composite Index A custom blended index developed by CSIM based on the Target 2020 Index Fund’s asset allocation glide schedule and will become more conservative as time elapses. Effective February 1, 2017, the composite is derived using the following portion allocations: 31.7% Dow Jones U.S. Large Cap Total Stock Market Index, 2.4% Dow Jones U.S. Small Cap Total Stock Market Index, 13.0% FTSE Developed ex US Index (Net), 0.7% FTSE Emerging Index (Net), 1.4% Dow Jones U.S. Select REIT Index, 5.4% Bloomberg Barclays U.S. 1-3 Year Treasury Bond Index, 36.5% Bloomberg Barclays U.S. Aggregate Bond Index, 3.5% Bloomberg Barclays U.S. Treasury Inflation Protected Securities (TIPS) Index (Series-L), 5.4% Bloomberg Barclays U.S. Treasury Bills 1-3 Month Index. The components that make up the composite index may vary over time. The composite index represents target allocations for 2017. Percentages listed may not total to 100% due to rounding.
Target 2025 Passive Composite Index A custom blended index developed by CSIM based on the Target 2025 Index Fund’s asset allocation glide schedule and will become more conservative as time elapses. Effective February 1, 2017, the composite is derived using the following portion allocations: 38.3% Dow Jones U.S. Large Cap Total Stock Market Index, 3.2% Dow Jones U.S. Small Cap Total Stock Market Index, 16.5% FTSE Developed ex US Index (Net), 1.4% FTSE Emerging Index (Net), 1.8% Dow Jones U.S. Select REIT Index, 2.9% Bloomberg Barclays U.S. 1-3 Year Treasury Bond Index, 30.9% Bloomberg Barclays U.S. Aggregate Bond Index, 1.1% Bloomberg Barclays U.S. Treasury Inflation Protected Securities (TIPS) Index (Series-L), 3.9% Bloomberg Barclays U.S. Treasury Bills 1-3 Month Index. The components that make up the composite index may vary over time. The composite index represents target allocations for 2017. Percentages listed may not total to 100% due to rounding.
Target 2030 Passive Composite Index A custom blended index developed by CSIM based on the Target 2030 Index Fund’s asset allocation glide schedule and will become more conservative as time elapses. Effective February 1, 2017, the composite is derived using the
following portion allocations: 42.7% Dow Jones U.S. Large Cap Total Stock Market Index, 4.1% Dow Jones U.S. Small Cap Total Stock Market Index, 19.1% FTSE Developed ex US Index (Net), 2.0% FTSE Emerging Index (Net), 2.2% Dow Jones U.S. Select REIT Index, 1.7% Bloomberg Barclays U.S. 1-3 Year Treasury Bond Index, 25.2% Bloomberg Barclays U.S. Aggregate Bond Index, 3.0% Bloomberg Barclays U.S. Treasury Bills 1-3 Month Index. The components that make up the composite index may vary over time. The composite index represents target allocations for 2017. Percentages listed may not total to 100% due to rounding.
Target 2035 Passive Composite Index A custom blended index developed by CSIM based on the Target 2030 Index Fund’s asset allocation glide schedule and will become more conservative as time elapses. Effective February 1, 2017, the composite is derived using the following portion allocations: 46.0% Dow Jones U.S. Large Cap Total Stock Market Index, 4.9% Dow Jones U.S. Small Cap Total Stock Market Index, 21.3% FTSE Developed ex US Index (Net), 2.6% FTSE Emerging Index (Net), 2.6% Dow Jones U.S. Select REIT Index, 1.1% Bloomberg Barclays U.S. 1-3 Year Treasury Bond Index, 19.2% Bloomberg Barclays U.S. Aggregate Bond Index, 2.3% Bloomberg Barclays U.S. Treasury Bills 1-3 Month Index. The components that make up the composite index may vary over time. The composite index represents target allocations for 2017. Percentages listed may not total to 100% due to rounding.
Target 2040 Passive Composite Index A custom blended index developed by CSIM based on the Target 2040 Index Fund’s asset allocation glide schedule and will become more conservative as time elapses. Effective February 1, 2017, the composite is derived using the following portion allocations: 48.9% Dow Jones U.S. Large Cap Total Stock Market Index, 5.8% Dow Jones U.S. Small Cap Total Stock Market Index, 23.4% FTSE Developed ex US Index (Net), 3.2% FTSE Emerging Index (Net), 3.0% Dow Jones U.S. Select REIT Index, 0.7% Bloomberg Barclays U.S. 1-3 Year Treasury Bond Index, 13.5% Bloomberg Barclays U.S. Aggregate Bond Index, 1.6% Bloomberg Barclays U.S. Treasury Bills 1-3 Month Index. The components that make up the composite index may vary over time. The composite index represents target allocations for 2017. Percentages listed may not total to 100% due to rounding.
Target 2045 Passive Composite Index A custom blended index developed by CSIM based on the Target 2045 Index Fund’s asset allocation glide schedule and will become more conservative as time elapses. Effective February 1, 2017, the composite is derived using the following portion allocations: 50.7% Dow Jones U.S. Large Cap Total Stock Market Index, 6.4% Dow Jones U.S. Small Cap Total Stock Market Index, 24.8% FTSE Developed ex US Index (Net), 3.7% FTSE Emerging Index (Net), 3.3% Dow Jones U.S. Select REIT Index, 0.4% Bloomberg Barclays U.S. 1-3 Year Treasury Bond Index, 9.6% Bloomberg Barclays U.S. Aggregate Bond Index, 1.1% Bloomberg Barclays U.S. Treasury Bills 1-3 Month Index. The components that make up the composite index may vary over time. The composite index represents target allocations for 2017. Percentages listed may not total to 100% due to rounding.
Target 2050 Passive Composite Index A custom blended index developed by CSIM based on the Target 2050 Index Fund’s asset allocation glide schedule and will become more conservative as time elapses. Effective February 1, 2017, the composite is derived using the following portion allocations: 51.7% Dow Jones U.S. Large Cap Total Stock Market Index, 6.7% Dow Jones U.S. Small Cap Total Stock Market Index, 25.6% FTSE Developed ex US Index (Net), 4.0% FTSE Emerging Index (Net), 3.5% Dow Jones U.S. Select REIT Index, 0.3% Bloomberg Barclays U.S. 1-3 Year Treasury Bond Index, 7.3%
Schwab Target Index Funds | Annual Report
Schwab Target Index Funds
Bloomberg Barclays U.S. Aggregate Bond Index, 0.9% Bloomberg Barclays U.S. Treasury Bills 1-3 Month Index. The components that make up the composite index may vary over time. The composite index represents target allocations for 2017. Percentages listed may not total to 100% due to rounding.
Target 2055 Passive Composite Index A custom blended index developed by CSIM based on the Target 2055 Index Fund’s asset allocation glide schedule and will become more conservative as time elapses. Effective February 1, 2017, the composite is derived using the following portion allocations: 52.6% Dow Jones U.S. Large Cap Total Stock Market Index, 7.1% Dow Jones U.S. Small Cap Total Stock Market Index, 26.4% FTSE Developed ex US Index (Net), 4.3% FTSE Emerging Index (Net), 3.6% Dow Jones U.S. Select REIT Index, 0.2% Bloomberg Barclays U.S. 1-3 Year Treasury Bond Index, 5.2% Bloomberg Barclays U.S. Aggregate Bond Index, 0.6% Bloomberg Barclays U.S. Treasury Bills 1-3 Month Index. The components that make up the composite index may vary over time. The composite index represents target allocations for 2017. Percentages listed may not total to 100% due to rounding.
Target 2060 Passive Composite Index A custom blended index developed by CSIM based on the Target 2060 Index Fund’s asset allocation glide schedule and will become more conservative as time elapses. Effective February 1, 2017, the composite is derived using the
following portion allocations: 53.0% Dow Jones U.S. Large Cap Total Stock Market Index, 7.2% Dow Jones U.S. Small Cap Total Stock Market Index, 26.7% FTSE Developed ex US Index (Net), 4.4% FTSE Emerging Index (Net), 3.7% Dow Jones U.S. Select REIT Index, 0.2% Bloomberg Barclays U.S. 1-3 Year Treasury Bond Index, 4.3% Bloomberg Barclays U.S. Aggregate Bond Index, 0.5% Bloomberg Barclays U.S. Treasury Bills 1-3 Month Index. The components that make up the composite index may vary over time. The composite index represents target allocations for 2017. Percentages listed may not total to 100% due to rounding.
total return The percentage that an investor would have earned or lost on an investment in the fund assuming dividends and distributions were reinvested.
weighted average For mutual funds, an average that gives the same weight to each security as the security represents in the fund’s portfolio.
yield The income paid out by an investment, expressed as a percentage of the investment’s market value.
Schwab Target Index Funds | Annual Report
Schwab Target Index Funds
PRIVACY NOTICE
THIS IS NOT PART OF THE SHAREHOLDER REPORT
A Commitment to Your Privacy
Your Privacy Is Not for Sale
We do not and will not sell your personal information to anyone, for any reason.
We are committed to protecting the privacy of information we maintain about you. Below are details about our commitment, including the types of information we collect and how we use and share that information. This Privacy Notice applies to you only if you are an individual who invests directly in the funds by placing orders through the funds’ transfer agent. If you place orders through your brokerage account at Charles Schwab & Co., Inc. or an account with another broker-dealer, investment advisor, 401(k) plan, employee benefit plan, administrator, bank or other financial intermediary, you are covered by the privacy policies of that financial institution and should consult those policies.
How We Collect Information About You
We collect personal information about you in a number of ways.
• APPLICATION AND REGISTRATION
INFORMATION.
We collect personal information from you when you open an account or utilize one of our services. We may also collect information about you from third parties such as consumer reporting agencies to verify your identity. The information we collect may include personal information, including your Social Security number, as well as details about your interests, investments and investment experience.
• TRANSACTION AND EXPERIENCE
INFORMATION.
Once your account has been opened, we collect and maintain personal information about your account activity, including your transactions, balances, positions and history. This information allows us to administer your account and provide the services you have requested.
• WEBSITE USAGE.
When you visit our websites, we may use devices known as “cookies,” graphic interchange format files (GIFs), or other similar web tools to enhance your web experience. These tools help us to recognize you, maintain your web session, and provide a more personalized experience. To learn more, please go to www.schwab.com/privacy.
How We Share and Use Your Information
We provide access to information about you to our affiliated companies, outside companies and other third parties in certain limited circumstances, including:
• to help us process transactions for your account;
• when we use other companies to provide services for us, such as printing and mailing your account statements;
• when we believe that disclosure is required or permitted under law (for example, to cooperate with regulators or law enforcement, resolve consumer disputes, perform credit/authentication checks, or for risk control).
State Laws
We will comply with state laws that apply to the disclosure or use of information about you.
Safeguarding Your Information — Security Is a
Partnership
We take precautions to ensure the information we collect about you is protected and is accessed only by authorized individuals or organizations.
Companies we use to provide support services are not allowed to use information about our shareholders for their own purposes and are contractually obligated to maintain strict confidentiality. We limit their use of information to the performance of the specific services we have requested.
We restrict access to personal information by our employees and agents. Our employees are trained about privacy and are required to safeguard personal information.
We maintain physical, electronic and procedural safeguards that comply with federal standards to guard your nonpublic personal information.
Contact Us
To provide us with updated information, report suspected fraud or identity theft, or for any other questions, please call the number below.
Schwab Funds® direct investors: 1-800-407-0256
© 2017 Schwab Funds. All rights reserved.
Schwab Target Index Funds | Annual Report
Schwab Target Index Funds
Charles Schwab Investment Management
As one of the nation’s largest asset managers, our goal is to provide investors with a diverse selection of foundational products that aim to deliver consistent performance at a competitive cost. The list below shows all currently available Schwab Funds.
Investors should carefully consider information contained in the prospectus, or if available, the summary prospectus, including investment objectives, risks, charges and expenses before investing. Please call 1-877-824-5615 for a prospectus and brochure for any Schwab Fund. Please read the prospectus carefully before you invest. This report must be preceded or accompanied by a current prospectus.
Proxy Voting Policies, Procedures and Results
A description of the proxy voting policies and procedures used to determine how to vote proxies on behalf of the funds is available without charge, upon request, by visiting the Schwab Funds’ website at www.csimfunds.com/schwabfunds_prospectus, the SEC’s website at www.sec.gov, or by contacting Schwab Funds at 1-877-824-5615.
Information regarding how a fund voted proxies relating to portfolio securities during the most recent twelve-month period ended June 30 is available, without charge, by visiting the fund’s website at www.csimfunds.com/schwabfunds_prospectus or the SEC’s website at www.sec.gov.
The Schwab Funds Family®
Stock Funds
Schwab Core Equity Fund™
Schwab Dividend Equity Fund™
Schwab Large-Cap Growth Fund™
Schwab Small-Cap Equity Fund™
Schwab Hedged Equity Fund™
Schwab Health Care Fund™
Schwab® International Core Equity Fund
Schwab Fundamental US Large Company Index Fund
Schwab Fundamental US Small Company Index Fund
Schwab Fundamental International Large Company Index Fund
Schwab Fundamental International Small Company Index Fund
Schwab Fundamental Emerging Markets Large Company Index Fund
Schwab Fundamental Global Real Estate Index Fund
Schwab Global Real Estate Fund™
Schwab® S&P 500 Index Fund
Schwab 1000 Index® Fund
Schwab Small-Cap Index Fund®
Schwab Total Stock Market Index Fund®
Schwab International Index Fund®
Asset Allocation Funds
Schwab Balanced Fund™
Schwab MarketTrack All Equity Portfolio™
Schwab MarketTrack Growth Portfolio™
Schwab MarketTrack Balanced Portfolio™
Schwab MarketTrack Conservative Portfolio™
Schwab Target Funds
Schwab Target Index Funds
Schwab® Monthly Income Fund – Moderate Payout
Schwab® Monthly Income Fund – Enhanced Payout
Schwab® Monthly Income Fund – Maximum Payout
Bond Funds
Schwab Short-Term Bond Market Fund™
Schwab Intermediate-Term Bond Fund™
Schwab Total Bond Market Fund™
Schwab GNMA Fund™
Schwab® Treasury Inflation Protected Securities Index Fund
Schwab Tax-Free Bond Fund™
Schwab California Tax-Free Bond Fund™
Schwab® U.S. Aggregate Bond Index Fund
Schwab® Short-Term Bond Index Fund
Schwab Money Funds
Schwab offers an array of money market funds1. Choose from taxable or tax-advantaged alternatives. Some are linked to your eligible Schwab account to “sweep” cash balances automatically, subject to availability, when you’re between investments. Or, for your larger cash reserves, choose one of our Value Advantage Investments®.
Investment Adviser
Charles Schwab Investment Management, Inc.
211 Main Street, San Francisco, CA 94105
Funds
Schwab Funds®
1-877-824-5615
© 2017 Charles Schwab & Co., Inc. All rights reserved.
Member SIPC®
Printed on recycled paper.
| 1 | You could lose money by investing in a money market fund. All Schwab Money Funds with the exception of Schwab Variable Share Price Money Fund seek to preserve the value of your investment at $1.00 per share, but cannot guarantee they will do so. All Schwab Money Funds with the exception of Schwab Government Money Fund, Schwab Retirement Government Money Fund, Schwab U.S. Treasury Money Fund, Schwab Treasury Obligations Money Fund and Schwab Government Money Market Portfolio may impose a fee upon the sale of your shares or may temporarily suspend your ability to sell shares if the fund’s liquidity falls below required minimums because of market conditions or other factors. An investment in a money market fund is not insured or guaranteed by the Federal Deposit Insurance Corporation or any other government agency. The money market fund's sponsor has no legal obligation to provide financial support to the fund, and you should not expect that the sponsor will provide financial support to the fund at any time. |
This page is intentionally left blank.
Item 2: Code of Ethics.
| (a) | Registrant has adopted a code of ethics that applies to its principal executive officer, principal financial officer, and any other persons who perform a similar function, regardless of whether these individuals are employed by Registrant or a third party. |
| (c) | During the period covered by the report, no amendments were made to the provisions of this code of ethics. |
| (d) | During the period covered by the report, Registrant did not grant any waivers, including implicit waivers, from the provisions of this code of ethics. |
| (f)(1) | Registrant has filed this code of ethics as an exhibit pursuant to Item 11(a)(1) of Form N-CSR. |
Item 3: Audit Committee Financial Expert.
Registrant’s Board of Trustees has determined that Kiran M. Patel, Robert W. Burns and Kimberly S. Patmore, each currently serving on its audit, compliance and valuation committee, are each an “audit committee financial expert,” as such term is defined in Item 3 of Form N-CSR. Each member of Registrant’s audit, compliance and valuation committee is “independent” under the standards set forth in Item 3 of Form N-CSR.
The designation of each of Mr. Patel, Mr. Burns and Ms. Patmore as an “audit committee financial expert” pursuant to Item 3 of Form N-CSR does not (i) impose upon such individual any duties, obligations, or liability that are greater than the duties, obligations and liability imposed upon such individual as a member of Registrant’s audit, compliance and valuation committee or Board of Trustees in the absence of such designation; and (ii) affect the duties, obligations or liability of any other member of Registrant’s audit, compliance and valuation committee or Board of Trustees.
Item 4: Principal Accountant Fees and Services.
Registrant is composed of forty-nine series. Eleven series have a fiscal year-end of March 31, whose annual financial statements are reported in Item 1, three series have a fiscal year-end of December 31, thirty-four series have a fiscal year-end of October 31, and one series has a fiscal year-end of February 28. Principal accountant fees disclosed in Items 4(a)-(d) and 4(g) include fees billed for services rendered to each of the thirty-eight series, based on their respective 2017 and 2016 fiscal years, as applicable.
The following table presents fees billed by the principal accountant in each of the last two fiscal years for the services rendered to the Funds:
| | | | | | | | | | | | | | |
(a) Audit Fees | | (b)Audit-Related Fees1 | | (c) Tax Fees2 | | (d) All Other Fees3 |
Fiscal Year 2017 | | Fiscal Year
2016 | | Fiscal Year 2017 | | Fiscal Year 2016 | | Fiscal Year 2017 | | Fiscal Year 2016 | | Fiscal Year 2017 | | Fiscal Year 2016 |
$1,309,453 | | $1,275,248 | | $0 | | $0 | | $146,355 | | $129,645 | | $0 | | $12,838 |
| 1 | The nature of the services includes assurance and related services reasonably related to the performance of the audit of financial statements not included in Audit Fees. |
| 2 | The nature of the services includes tax compliance, tax advice and tax planning. |
| 3 | The nature of the services include agreed upon procedures relating to Charles Schwab Investment Management., Inc.’s, (“CSIM”) expenses for purposes of Section 15(c) of the Investment Company Act of 1940. |
(e)(1) Registrant’s audit committee does not have pre-approval policies and procedures as described in paragraph (c)(7) of Rule 2-01 of Regulation S-X.
(2) There were no services described in each of paragraphs (b) through (d) above (including services required to be approved by Registrant’s audit committee pursuant to paragraph (c)(7)(ii) of Rule 2-01 of Regulation S-X) that were approved by Registrant’s audit committee pursuant to paragraph (c)(7)(i)(C) of Rule 2-01 of Regulation S-X.
(g) Below are the aggregate non-audit fees billed in each of the last two fiscal years by Registrant’s principal accountant for services rendered to Registrant, to Registrant’s investment adviser, and to any entity controlling, controlled by, or under common control with Registrant’s investment adviser that provides ongoing services to Registrant.
| | |
| 2017: $146,355 | | 2016: $142,483 |
(h) During the past fiscal year, all non-audit services provided by Registrant’s principal accountant to either Registrant’s investment adviser or to any entity controlling, controlled by, or under common control with Registrant’s investment adviser that provides ongoing services to Registrant were pre-approved. Included in the audit committee’s pre-approval was the review and consideration as to whether the provision of these non-audit services is compatible with maintaining the principal accountant’s independence.
Item 5: Audit Committee of Listed Registrants.
Not applicable.
Item 6: Schedule of Investments.
The schedules of investments are included as part of the report to shareholders filed under Item 1 of this Form.
Item 7: Disclosure of Proxy Voting Policies and Procedures for Closed-End Management Investment Companies.
Not applicable.
Item 8: Portfolio Managers of Closed-End Management Investment Companies.
Not applicable.
Item 9: Purchases of Equity Securities by Closed-End Management Investment Company and Affiliated Purchasers.
Not applicable.
Item 10: Submission of Matters to a Vote of Security Holders.
Not applicable.
Item 11: Controls and Procedures.
| (a) | Based on their evaluation of Registrant’s disclosure controls and procedures, as of a date within 90 days of the filing date, Registrant’s Chief Executive Officer, Marie Chandoha and Registrant’s Chief Financial Officer, Mark Fischer, have concluded that Registrant’s disclosure controls and procedures |
| | are: (i) reasonably designed to ensure that information required to be disclosed in this report is appropriately communicated to Registrant’s officers to allow timely decisions regarding disclosures required in this report; (ii) reasonably designed to ensure that information required to be disclosed in this report is recorded, processed, summarized and reported in a timely manner; and (iii) are effective in achieving the goals described in (i) and (ii) above. |
| (b) | There have been no changes in Registrant’s internal control over financial reporting that the above officers believe to have materially affected, or to be reasonably likely to materially affect, Registrant’s internal control over financial reporting. |
Item 12: Exhibits.
| (a) | (1) Registrant’s code of ethics (that is the subject of the disclosure required by Item 2(a)) is attached. |
| | (2) | Separate certifications for Registrant’s principal executive officer and principal financial officer, as required by Rule 30a-2(a) under the 1940 Act, are attached. |
| (b) | A certification for Registrant’s principal executive officer and principal financial officer, as required by Rule 30a-2(b) under the 1940 Act, is attached. This certification is being furnished to the Securities and Exchange Commission solely pursuant to 18 U.S.C. section 1350 and is not being filed as part of the Form N-CSR with the Commission. |
Pursuant to the requirements of the Securities Exchange Act of 1934 and the Investment Company Act of 1940, the registrant has duly caused this report to be signed on its behalf by the undersigned, thereunto duly authorized.
| | |
| (Registrant) Schwab Capital Trust |
| |
| By: | | /s/ Marie Chandoha |
| | Marie Chandoha |
| | Chief Executive Officer |
| |
| Date: | | 05/15/2017 |
Pursuant to the requirements of the Securities Exchange Act of 1934 and the Investment Company Act of 1940, this report has been signed below by the following persons on behalf of the registrant and in the capacities and on the dates indicated.
| | |
| By: | | /s/ Marie Chandoha |
| | Marie Chandoha |
| | Chief Executive Officer |
| |
| Date: | | 05/15/2017 |
| | |
| By: | | /s/ Mark Fischer |
| | Mark Fischer |
| | Chief Financial Officer |
| |
| Date: | | 05/15/2017 |