UNITED STATES
SECURITIES AND EXCHANGE COMMISSION
Washington, D.C. 20549
FORM N-CSRS
CERTIFIED SHAREHOLDER REPORT OF REGISTERED
MANAGEMENT INVESTMENT COMPANIES
Investment Company Act file number: 811-07704
Schwab Capital Trust – Schwab Target Index Funds
(Exact name of registrant as specified in charter)
211 Main Street,
San Francisco, California 94105
(Address of principal executive offices) (Zip code)
Jonathan de St. Paer
Schwab Capital Trust – Target Index Funds
211 Main Street,
San Francisco, California 94105
(Name and address of agent for service)
Registrant’s telephone number, including area code: (415) 636-7000
Date of fiscal year end: March 31
Date of reporting period: September 30, 2022
Item 1: Report(s) to Shareholders.
Semiannual Report | September 30, 2022
Schwab Target Index Funds
Schwab Target 2010 Index Fund
Schwab Target 2015 Index Fund
Schwab Target 2020 Index Fund
Schwab Target 2025 Index Fund
Schwab Target 2030 Index Fund
Schwab Target 2035 Index Fund
Schwab Target 2040 Index Fund
Schwab Target 2045 Index Fund
Schwab Target 2050 Index Fund
Schwab Target 2055 Index Fund
Schwab Target 2060 Index Fund
Schwab Target 2065 Index Fund
Schwab Target Index Funds
Fund investment adviser: Charles Schwab Investment Management, Inc., dba Schwab Asset ManagementTM
Distributor: Charles Schwab & Co., Inc. (Schwab)
Schwab Target Index Funds | Semiannual Report
Schwab Target Index Funds
The performance data quoted represents past performance. Past performance does not guarantee future results. Investment returns and principal value of an investment will fluctuate so that an investor’s shares may be worth more or less than their original cost. Current performance may be lower or higher than performance data quoted. To obtain performance information current to the most recent month end, please visit www.schwabassetmanagement.com/schwabfunds_prospectus.
| Total Returns For the 6 Months Ended September 30, 2022 |
| Schwab Target 2010 Index Fund (Ticker Symbol: SWYAX) | -12.93% |
| Target 2010 Passive Composite Index | -12.95% |
| Fund Category: Morningstar Target-Date 2000-20101 | -12.56% |
| Performance Details | pages 7-8 |
| |
| Schwab Target 2015 Index Fund (Ticker Symbol: SWYBX) | -13.54% |
| Target 2015 Passive Composite Index | -13.47% |
| Fund Category: Morningstar Target-Date 20151 | -13.63% |
| Performance Details | pages 9-10 |
| |
| Schwab Target 2020 Index Fund (Ticker Symbol: SWYLX) | -13.84% |
| Target 2020 Passive Composite Index | -13.83% |
| Fund Category: Morningstar Target-Date 20201 | -14.33% |
| Performance Details | pages 11-12 |
| |
| Schwab Target 2025 Index Fund (Ticker Symbol: SWYDX) | -15.31% |
| Target 2025 Passive Composite Index | -15.25% |
| Fund Category: Morningstar Target-Date 20251 | -15.16% |
| Performance Details | pages 13-14 |
| |
| Schwab Target 2030 Index Fund (Ticker Symbol: SWYEX) | -16.90% |
| Target 2030 Passive Composite Index | -16.93% |
| Fund Category: Morningstar Target-Date 20301 | -16.44% |
| Performance Details | pages 15-16 |
| |
| Schwab Target 2035 Index Fund (Ticker Symbol: SWYFX) | -18.03% |
| Target 2035 Passive Composite Index | -18.13% |
| Fund Category: Morningstar Target-Date 20351 | -17.76% |
| Performance Details | pages 17-18 |
All total returns on this page assume dividends and distributions were reinvested. Index figures do not include trading and management costs, which would lower performance. Indices are unmanaged and cannot be invested in directly. Performance results less than one year are not annualized.
The components that make up each of the composite indices may vary over time. For index definitions, please see the Glossary.
Fund expenses may have been partially absorbed by the investment adviser and its affiliates. Without these reductions, a fund’s total return would have been lower. Performance does not reflect the deduction of taxes that a shareholder would pay on fund distributions or on the redemption of fund shares.
| 1 | Source for category information: Morningstar, Inc. The Morningstar Category return represents all active and index mutual funds and ETFs within the category as of the report date. |
| | |
Schwab Target Index Funds | Semiannual Report
Schwab Target Index Funds
Performance at a Glance (continued)
| Total Returns For the 6 Months Ended September 30, 2022 |
| Schwab Target 2040 Index Fund (Ticker Symbol: SWYGX) | -18.99% |
| Target 2040 Passive Composite Index | -19.10% |
| Fund Category: Morningstar Target-Date 20401 | -18.85% |
| Performance Details | pages 19-20 |
| |
| Schwab Target 2045 Index Fund (Ticker Symbol: SWYHX) | -19.78% |
| Target 2045 Passive Composite Index | -19.88% |
| Fund Category: Morningstar Target-Date 20451 | -19.41% |
| Performance Details | pages 21-22 |
| |
| Schwab Target 2050 Index Fund (Ticker Symbol: SWYMX) | -20.26% |
| Target 2050 Passive Composite Index | -20.35% |
| Fund Category: Morningstar Target-Date 20501 | -19.81% |
| Performance Details | pages 23-24 |
| |
| Schwab Target 2055 Index Fund (Ticker Symbol: SWYJX) | -20.46% |
| Target 2055 Passive Composite Index | -20.61% |
| Fund Category: Morningstar Target-Date 20551 | -19.92% |
| Performance Details | pages 25-26 |
| |
| Schwab Target 2060 Index Fund (Ticker Symbol: SWYNX) | -20.74% |
| Target 2060 Passive Composite Index | -20.85% |
| Fund Category: Morningstar Target-Date 20601 | -19.98% |
| Performance Details | pages 27-28 |
| |
| Schwab Target 2065 Index Fund (Ticker Symbol: SWYOX) | -20.82% |
| Target 2065 Passive Composite Index | -20.94% |
| Fund Category: Morningstar Target-Date 2065+1 | -20.29% |
| Performance Details | pages 29-30 |
All total returns on this page assume dividends and distributions were reinvested. Index figures do not include trading and management costs, which would lower performance. Indices are unmanaged and cannot be invested in directly. Performance results less than one year are not annualized.
The components that make up each of the composite indices may vary over time. For index definitions, please see the Glossary.
Fund expenses may have been partially absorbed by the investment adviser and its affiliates. Without these reductions, a fund’s total return would have been lower. Performance does not reflect the deduction of taxes that a shareholder would pay on fund distributions or on the redemption of fund shares.
| 1 | Source for category information: Morningstar, Inc. The Morningstar Category return represents all active and index mutual funds and ETFs within the category as of the report date. |
Schwab Target Index Funds | Semiannual Report
Schwab Target Index Funds
The Investment Environment
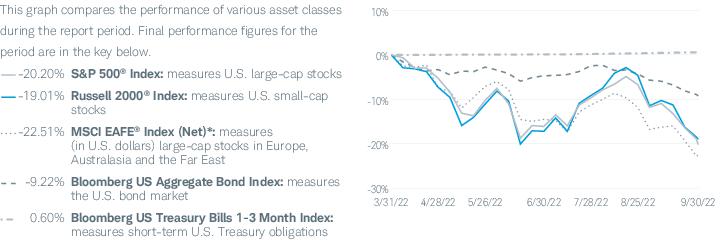
For the six-month reporting period ended September 30, 2022, U.S. and international stocks generally lost ground as a result of accelerating inflation, rising interest rates, and geopolitical tensions, including the war in Ukraine. Albeit decelerating, COVID-19 continued to weigh on economies worldwide, with highly transmissible variants and subvariants keeping infection rates high in many areas. Economic growth around the world slowed and recession fears rose. As Russia’s war against Ukraine raged on, oil prices remained elevated for much of the period, hitting a reporting-period high in early June before retreating. Over the reporting period, the U.S. dollar strengthened against a basket of international currencies, generally decreasing the returns on overseas investments in U.S. dollar terms. For the reporting period, the S&P 500® Index, a bellwether for the overall U.S. stock market, returned -20.20%. Among U.S. stocks, large-cap stocks underperformed small-cap stocks, with the Russell 1000® Index and Russell 2000® Index returning -20.51% and -19.01%, respectively. Outside the United States, the MSCI EAFE® Index (Net)*, a broad measure of developed international equity performance, returned -22.51%, while the MSCI Emerging Markets Index (Net)* returned -21.70%. As interest rates rose over the reporting period, yields climbed and bond prices fell with the Bloomberg US Aggregate Bond Index, representing the broad U.S. bond market, returned -9.22%. (Bond yields and bond prices typically move in opposite directions.)
The U.S. economy showed signs of weakening over the reporting period. Amid ongoing supply chain disruptions, persisting inflation, and a tight labor market, gross domestic product (GDP) decreased at an annualized rate of -0.6% for the second quarter of 2022, following a decrease at an annualized rate of -1.6% for the first quarter of 2022. The unemployment rate remained near pre-pandemic lows over the reporting period. Inflation remained stubbornly high due to supply chain bottlenecks and soaring energy and food prices.
Outside the United States, global economies also wrestled with the fallout of the COVID-19 pandemic, high energy costs, rising inflation, and the war in Ukraine. The eurozone, heavily impacted by the war in Ukraine and associated commodity price spikes, managed to eke out small gains in GDP for both the first and second quarters of 2022 as COVID-19 restrictions eased and tourism increased in response to pent-up demand. The United Kingdom also posted
Asset Class Performance Comparison % returns during the 6 months ended September 30, 2022
Index figures assume dividends and distributions were reinvested. Index figures do not include trading and management costs, which would lower performance. Indices are unmanaged and cannot be invested in directly. Performance results less than one year are not annualized. Past performance is not a guarantee of future results.
For index definitions, please see the Glossary.
Data source: Index provider websites and Schwab Asset Management.
Nothing in this report represents a recommendation of a security by the investment adviser.
Management views may have changed since the report date.
| * | The net version of the index reflects reinvested dividends net of withholding taxes but reflects no deductions for expenses or other taxes. |
Schwab Target Index Funds | Semiannual Report
Schwab Target Index Funds
The Investment Environment (continued)
small increases in GDP growth for the first and second quarters of 2022, in part driven by increases in COVID-19 testing and tracing and an expansion of its vaccination program. In Japan, following a slight contraction for the first quarter of 2022, GDP growth was positive for the second quarter of 2022 as COVID-19 restrictions were lifted and government spending rose. Among emerging markets, China’s GDP growth remained positive but slowed notably as it dealt with numerous headwinds including the political landscape, an emphasis on domestic consumption over globalization, lockdowns and quarantines, and a severe property downturn as a result of stalled demand, a decline in financing for property development, halted construction on in progress projects, and homeowners pausing payment of their mortgages on incomplete builds. India’s GDP growth jumped for the second quarter of 2022 on rising consumer demand and a rapid decline in COVID-19 cases.
Monetary policy around the world varied. In the United States, after raising interest rates by 0.25% in mid-March 2022—its first hike since December 2018—the U.S. Federal Reserve (Fed) increased the federal funds rate four times during the reporting period—by 0.50% in early May, 0.75% in mid-June, 0.75% in late July, and 0.75% in late September—in its ongoing efforts to achieve a return to price stability. The federal funds rate ended the reporting period in a range of 3.00% to 3.25%. The Fed reiterated that further rate hikes were likely by the end of 2022. In June, the Fed also began to reduce the $9 trillion in assets it holds on its balance sheet, vowing to be even more aggressive than during its last round of quantitative tightening in 2017 through 2019. Outside the United States, central banks were generally similarly responsive. After holding its policy rate unchanged since March 2016, at 0.00%, the European Central Bank raised its interest rate by 0.50% in July 2022, followed by a 1.25% increase in September 2022. European Central Bank policymakers also set expectations for future rate increases in an effort to dampen demand and control inflation. The Bank of England raised its key official bank rate four times during the reporting period, to 2.25%, bringing borrowing costs to a 13-year high as the Bank of England wrestles with soaring inflation. In contrast, the Bank of Japan upheld its short-term interest rate target of -0.1%, unchanged since 2016, but reiterated that it would not hesitate to take extra easing measures if needed. Central banks in India, Indonesia, Brazil, Mexico, and Pakistan all raised rates multiple times over the reporting period to counteract the impacts of inflation. In contrast, China cut its rate in August 2022, its second rate reduction in 2022. Russia, which raised its benchmark policy rate to 20% in late February 2022 amid the broadening fallout of Western sanctions in retaliation against Russia’s invasion of Ukraine, reduced it several times during the reporting period.
Nearly all U.S. bond markets posted negative returns for the reporting period, with the exception of the shortest (one- and three- month U.S. Treasury bills), which posted slightly positive returns. Even U.S. Treasury Inflation-Protected Securities lost ground for the reporting period. Yields on U.S. Treasuries climbed during the reporting period in response to the Fed’s monetary policy actions. The yield on the 10-year U.S. Treasury began the reporting period at 2.32% and ended it at 3.83%, just off the reporting-period high of 3.97% recorded three days earlier. Short-term rates also rose, with the yield on the three-month U.S. Treasury climbing from 0.52% to 3.33% over the reporting period.
Schwab Target Index Funds | Semiannual Report
Schwab Target Index Funds
 | Zifan Tang, Ph.D., CFA, Senior Portfolio Manager, is responsible for the co-management of the funds. Prior to joining Schwab in 2012, Ms. Tang was a product manager at Thomson Reuters and from 1997 to 2009 worked as a portfolio manager at Barclays Global Investors (now known as BlackRock). |
 | Drew Hayes, CFA, Portfolio Manager, is responsible for the co-management of the funds. Mr. Hayes has been with Schwab since 2006. Before becoming a portfolio manager, he spent seven years as a senior fixed income specialist for Schwab Wealth Advisory, Inc. Prior to that, he worked as a bond investment specialist for two years and as a registered representative for two years for Charles Schwab & Co., Inc. |
 | Patrick Kwok, CFA, Portfolio Manager, is responsible for the co-management of the funds. Previously, Mr. Kwok served as an associate portfolio manager from 2012 to 2016. Prior to that, he worked as a fund administration manager, where he was responsible for oversight of sub-advisers, trading, cash management, and fund administration supporting the Charles Schwab Trust Bank Collective Investment Trusts and multi-asset Schwab Funds. Prior to joining Schwab Asset Management in 2008, Mr. Kwok spent two years as an asset operations specialist at Charles Schwab Trust Company. He also worked for one year at State Street Bank & Trust as a portfolio accountant and pricing specialist. |
Schwab Target Index Funds | Semiannual Report
Schwab Target 2010 Index Fund
The performance data quoted represents past performance. Past performance does not guarantee future results. Investment returns and principal value of an investment will fluctuate so that an investor’s shares may be worth more or less than their original cost. Current performance may be lower or higher than performance data quoted. To obtain performance information current to the most recent month end, please visit www.schwabassetmanagement.com/schwabfunds_prospectus.
Average Annual Total Returns1,2
| Fund and Inception Date | 6 Months | 1 Year | 5 Years | Since Inception |
| Schwab Target 2010 Index Fund (8/25/16) | -12.93% | -14.66% | 2.38% | 3.01% |
| Dow Jones U.S. Total Stock Market IndexSM | -20.63% | -18.05% | 8.48% | 9.98% |
| Bloomberg US Aggregate Bond Index | -9.22% | -14.60% | -0.27% | -0.21% |
| Target 2010 Passive Composite Index | -12.95% | -14.71% | 2.44% | 3.08% |
| Fund Category: Morningstar Target-Date 2000-20103 | -12.56% | -14.75% | 2.15% | N/A |
| Fund Expense Ratios4: Net 0.08%; Gross 0.13% |
All total returns on this page assume dividends and distributions were reinvested. Index figures do not include trading and management costs, which would lower performance. Indices are unmanaged and cannot be invested in directly. Performance results less than one year are not annualized.
For index definitions, please see the Glossary.
| 1 | Fund expenses have been partially absorbed by the investment adviser and its affiliates. Without these reductions, the fund’s returns would have been lower. These returns do not reflect the deduction of taxes that a shareholder would pay on fund distributions or the redemption of fund shares. |
| 2 | On July 24, 2017, the Investor Shares and Institutional Shares share classes were combined into a single class of shares of the fund. Accordingly, the performance history of the fund, prior to July 24, 2017, is that of the fund’s former Institutional Shares. |
| 3 | Source for category information: Morningstar, Inc. The Morningstar Category return represents all active and index mutual funds and ETFs within the category as of the report date. |
| 4 | As stated in the prospectus. Includes 0.05% of acquired fund fees and expenses (AFFE), which are indirect expenses incurred by the fund through its investments in the underlying funds. Net Expense: Expenses reduced by a contractual fee waiver in effect for so long as the investment adviser serves as adviser to the fund. Gross Expense: Does not reflect the effect of contractual fee waivers. For actual expense ratios during the period, not including AFFE, refer to the financial highlights section of the financial statements. |
Schwab Target Index Funds | Semiannual Report
Schwab Target 2010 Index Fund
Performance and Fund Facts as of September 30, 2022
| Number of Holdings | 8 |
| Portfolio Turnover Rate | 6% |
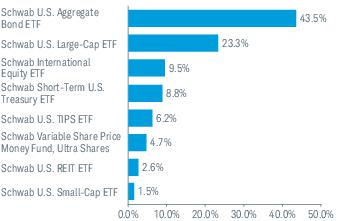
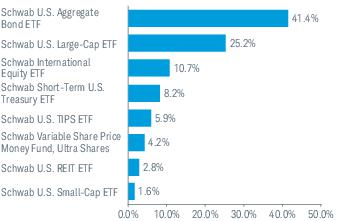
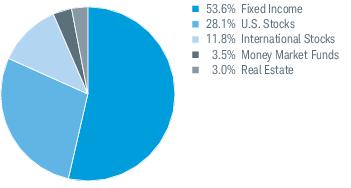
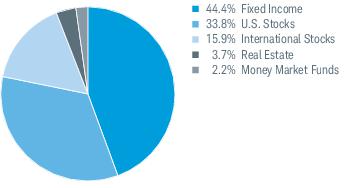
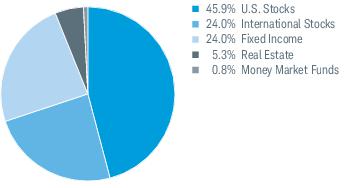
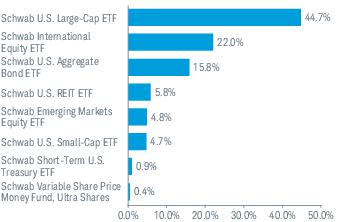
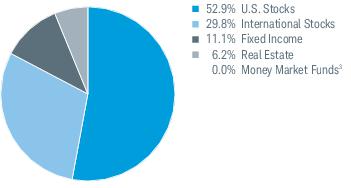
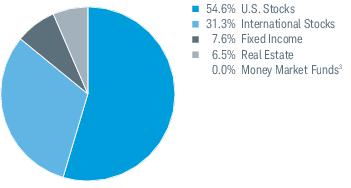
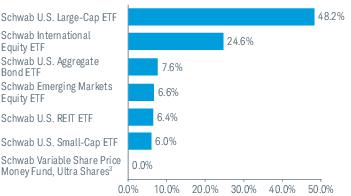
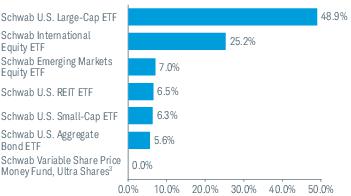
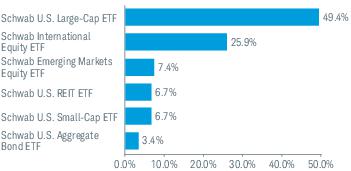
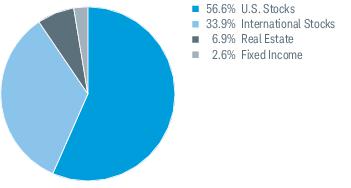
Asset Class Weightings % of Investments1,2
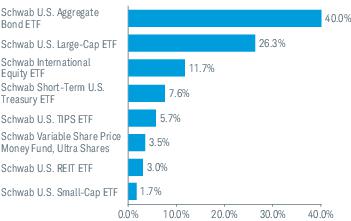
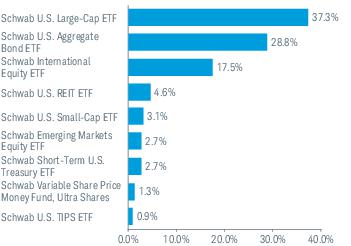
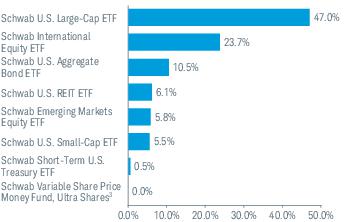
Top Holdings % of Net Assets2,3,4
Portfolio holdings may have changed since the report date.
| 1 | The percentage may differ from the Portfolio Holdings because the above calculation is based on a percentage of total investments, whereas the calculation in the Portfolio Holdings is based on a percentage of net assets. |
| 2 | The fund intends to primarily invest in affiliated Schwab ETFs and may also invest in affiliated Schwab Funds and unaffiliated third party ETFs and mutual funds (all such ETFs and mutual funds referred to as “underlying funds”). |
| 3 | This list is not a recommendation of any security by the investment adviser. |
| 4 | The holdings listed exclude any temporary liquidity investments. |
Schwab Target Index Funds | Semiannual Report
Schwab Target 2015 Index Fund
The performance data quoted represents past performance. Past performance does not guarantee future results. Investment returns and principal value of an investment will fluctuate so that an investor’s shares may be worth more or less than their original cost. Current performance may be lower or higher than performance data quoted. To obtain performance information current to the most recent month end, please visit www.schwabassetmanagement.com/schwabfunds_prospectus.
Average Annual Total Returns1,2
| Fund and Inception Date | 6 Months | 1 Year | 5 Years | Since Inception |
| Schwab Target 2015 Index Fund (8/25/16) | -13.54% | -15.12% | 2.44% | 3.12% |
| Dow Jones U.S. Total Stock Market IndexSM | -20.63% | -18.05% | 8.48% | 9.98% |
| Bloomberg US Aggregate Bond Index | -9.22% | -14.60% | -0.27% | -0.21% |
| Target 2015 Passive Composite Index | -13.47% | -15.06% | 2.56% | 3.24% |
| Fund Category: Morningstar Target-Date 20153 | -13.63% | -15.60% | 2.36% | N/A |
| Fund Expense Ratios4: Net 0.08%; Gross 0.13% |
All total returns on this page assume dividends and distributions were reinvested. Index figures do not include trading and management costs, which would lower performance. Indices are unmanaged and cannot be invested in directly. Performance results less than one year are not annualized.
For index definitions, please see the Glossary.
| 1 | Fund expenses have been partially absorbed by the investment adviser and its affiliates. Without these reductions, the fund’s returns would have been lower. These returns do not reflect the deduction of taxes that a shareholder would pay on fund distributions or the redemption of fund shares. |
| 2 | On July 24, 2017, the Investor Shares and Institutional Shares share classes were combined into a single class of shares of the fund. Accordingly, the performance history of the fund, prior to July 24, 2017, is that of the fund’s former Institutional Shares. |
| 3 | Source for category information: Morningstar, Inc. The Morningstar Category return represents all active and index mutual funds and ETFs within the category as of the report date. |
| 4 | As stated in the prospectus. Includes 0.05% of acquired fund fees and expenses (AFFE), which are indirect expenses incurred by the fund through its investments in the underlying funds. Net Expense: Expenses reduced by a contractual fee waiver in effect for so long as the investment adviser serves as adviser to the fund. Gross Expense: Does not reflect the effect of contractual fee waivers. For actual expense ratios during the period, not including AFFE, refer to the financial highlights section of the financial statements. |
Schwab Target Index Funds | Semiannual Report
Schwab Target 2015 Index Fund
Performance and Fund Facts as of September 30, 2022
| Number of Holdings | 8 |
| Portfolio Turnover Rate | 7% |
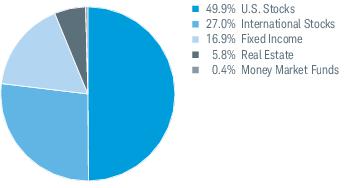
Asset Class Weightings % of Investments1,2
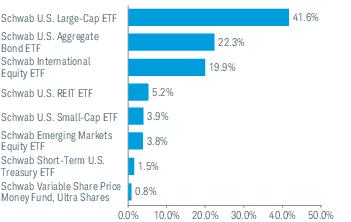
Top Holdings % of Net Assets2,3,4
Portfolio holdings may have changed since the report date.
| 1 | The percentage may differ from the Portfolio Holdings because the above calculation is based on a percentage of total investments, whereas the calculation in the Portfolio Holdings is based on a percentage of net assets. |
| 2 | The fund intends to primarily invest in affiliated Schwab ETFs and may also invest in affiliated Schwab Funds and unaffiliated third party ETFs and mutual funds (all such ETFs and mutual funds referred to as “underlying funds”). |
| 3 | This list is not a recommendation of any security by the investment adviser. |
| 4 | The holdings listed exclude any temporary liquidity investments. |
Schwab Target Index Funds | Semiannual Report
Schwab Target 2020 Index Fund
The performance data quoted represents past performance. Past performance does not guarantee future results. Investment returns and principal value of an investment will fluctuate so that an investor’s shares may be worth more or less than their original cost. Current performance may be lower or higher than performance data quoted. To obtain performance information current to the most recent month end, please visit www.schwabassetmanagement.com/schwabfunds_prospectus.
Average Annual Total Returns1,2
| Fund and Inception Date | 6 Months | 1 Year | 5 Years | Since Inception |
| Schwab Target 2020 Index Fund (8/25/16) | -13.84% | -15.31% | 2.67% | 3.64% |
| Dow Jones U.S. Total Stock Market IndexSM | -20.63% | -18.05% | 8.48% | 9.98% |
| Bloomberg US Aggregate Bond Index | -9.22% | -14.60% | -0.27% | -0.21% |
| Target 2020 Passive Composite Index | -13.83% | -15.31% | 2.76% | 3.71% |
| Fund Category: Morningstar Target-Date 20203 | -14.33% | -16.29% | 2.49% | N/A |
| Fund Expense Ratios4: Net 0.08%; Gross 0.13% |
All total returns on this page assume dividends and distributions were reinvested. Index figures do not include trading and management costs, which would lower performance. Indices are unmanaged and cannot be invested in directly. Performance results less than one year are not annualized.
For index definitions, please see the Glossary.
| 1 | Fund expenses have been partially absorbed by the investment adviser and its affiliates. Without these reductions, the fund’s returns would have been lower. These returns do not reflect the deduction of taxes that a shareholder would pay on fund distributions or the redemption of fund shares. |
| 2 | On July 24, 2017, the Investor Shares and Institutional Shares share classes were combined into a single class of shares of the fund. Accordingly, the performance history of the fund, prior to July 24, 2017, is that of the fund’s former Institutional Shares. |
| 3 | Source for category information: Morningstar, Inc. The Morningstar Category return represents all active and index mutual funds and ETFs within the category as of the report date. |
| 4 | As stated in the prospectus. Includes 0.05% of acquired fund fees and expenses (AFFE), which are indirect expenses incurred by the fund through its investments in the underlying funds. Net Expense: Expenses reduced by a contractual fee waiver in effect for so long as the investment adviser serves as adviser to the fund. Gross Expense: Does not reflect the effect of contractual fee waivers. For actual expense ratios during the period, not including AFFE, refer to the financial highlights section of the financial statements. |
Schwab Target Index Funds | Semiannual Report
Schwab Target 2020 Index Fund
Performance and Fund Facts as of September 30, 2022
| Number of Holdings | 8 |
| Portfolio Turnover Rate | 7% |
Asset Class Weightings % of Investments1,2
Top Holdings % of Net Assets2,3,4
Portfolio holdings may have changed since the report date.
| 1 | The percentage may differ from the Portfolio Holdings because the above calculation is based on a percentage of total investments, whereas the calculation in the Portfolio Holdings is based on a percentage of net assets. |
| 2 | The fund intends to primarily invest in affiliated Schwab ETFs and may also invest in affiliated Schwab Funds and unaffiliated third party ETFs and mutual funds (all such ETFs and mutual funds referred to as “underlying funds”). |
| 3 | This list is not a recommendation of any security by the investment adviser. |
| 4 | The holdings listed exclude any temporary liquidity investments. |
Schwab Target Index Funds | Semiannual Report
Schwab Target 2025 Index Fund
The performance data quoted represents past performance. Past performance does not guarantee future results. Investment returns and principal value of an investment will fluctuate so that an investor’s shares may be worth more or less than their original cost. Current performance may be lower or higher than performance data quoted. To obtain performance information current to the most recent month end, please visit www.schwabassetmanagement.com/schwabfunds_prospectus.
Average Annual Total Returns1,2
| Fund and Inception Date | 6 Months | 1 Year | 5 Years | Since Inception |
| Schwab Target 2025 Index Fund (8/25/16) | -15.31% | -16.37% | 3.27% | 4.49% |
| Dow Jones U.S. Total Stock Market IndexSM | -20.63% | -18.05% | 8.48% | 9.98% |
| Bloomberg US Aggregate Bond Index | -9.22% | -14.60% | -0.27% | -0.21% |
| Target 2025 Passive Composite Index | -15.25% | -16.29% | 3.40% | 4.59% |
| Fund Category: Morningstar Target-Date 20253 | -15.16% | -17.02% | 2.75% | N/A |
| Fund Expense Ratios4: Net 0.08%; Gross 0.12% |
All total returns on this page assume dividends and distributions were reinvested. Index figures do not include trading and management costs, which would lower performance. Indices are unmanaged and cannot be invested in directly. Performance results less than one year are not annualized.
For index definitions, please see the Glossary.
| 1 | Fund expenses have been partially absorbed by the investment adviser and its affiliates. Without these reductions, the fund’s returns would have been lower. These returns do not reflect the deduction of taxes that a shareholder would pay on fund distributions or the redemption of fund shares. |
| 2 | On July 24, 2017, the Investor Shares and Institutional Shares share classes were combined into a single class of shares of the fund. Accordingly, the performance history of the fund, prior to July 24, 2017, is that of the fund’s former Institutional Shares. |
| 3 | Source for category information: Morningstar, Inc. The Morningstar Category return represents all active and index mutual funds and ETFs within the category as of the report date. |
| 4 | As stated in the prospectus. Includes 0.04% of acquired fund fees and expenses (AFFE), which are indirect expenses incurred by the fund through its investments in the underlying funds. Net Expense: Expenses reduced by a contractual fee waiver in effect for so long as the investment adviser serves as adviser to the fund. Gross Expense: Does not reflect the effect of contractual fee waivers. For actual expense ratios during the period, not including AFFE, refer to the financial highlights section of the financial statements. |
Schwab Target Index Funds | Semiannual Report
Schwab Target 2025 Index Fund
Performance and Fund Facts as of September 30, 2022
| Number of Holdings | 9 |
| Portfolio Turnover Rate | 6% |
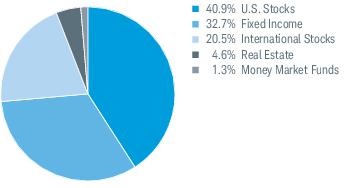
Asset Class Weightings % of Investments1,2
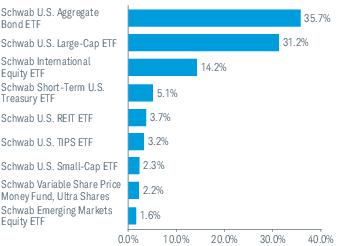
Top Holdings % of Net Assets2,3,4
Portfolio holdings may have changed since the report date.
| 1 | The percentage may differ from the Portfolio Holdings because the above calculation is based on a percentage of total investments, whereas the calculation in the Portfolio Holdings is based on a percentage of net assets. |
| 2 | The fund intends to primarily invest in affiliated Schwab ETFs and may also invest in affiliated Schwab Funds and unaffiliated third party ETFs and mutual funds (all such ETFs and mutual funds referred to as “underlying funds”). |
| 3 | This list is not a recommendation of any security by the investment adviser. |
| 4 | The holdings listed exclude any temporary liquidity investments. |
Schwab Target Index Funds | Semiannual Report
Schwab Target 2030 Index Fund
The performance data quoted represents past performance. Past performance does not guarantee future results. Investment returns and principal value of an investment will fluctuate so that an investor’s shares may be worth more or less than their original cost. Current performance may be lower or higher than performance data quoted. To obtain performance information current to the most recent month end, please visit www.schwabassetmanagement.com/schwabfunds_prospectus.
Average Annual Total Returns1,2
| Fund and Inception Date | 6 Months | 1 Year | 5 Years | Since Inception |
| Schwab Target 2030 Index Fund (8/25/16) | -16.90% | -17.45% | 3.71% | 5.07% |
| Dow Jones U.S. Total Stock Market IndexSM | -20.63% | -18.05% | 8.48% | 9.98% |
| Bloomberg US Aggregate Bond Index | -9.22% | -14.60% | -0.27% | -0.21% |
| Target 2030 Passive Composite Index | -16.93% | -17.45% | 3.78% | 5.15% |
| Fund Category: Morningstar Target-Date 20303 | -16.44% | -17.98% | 3.22% | N/A |
| Fund Expense Ratios4: Net 0.08%; Gross 0.12% |
All total returns on this page assume dividends and distributions were reinvested. Index figures do not include trading and management costs, which would lower performance. Indices are unmanaged and cannot be invested in directly. Performance results less than one year are not annualized.
For index definitions, please see the Glossary.
| 1 | Fund expenses have been partially absorbed by the investment adviser and its affiliates. Without these reductions, the fund’s returns would have been lower. These returns do not reflect the deduction of taxes that a shareholder would pay on fund distributions or the redemption of fund shares. |
| 2 | On July 24, 2017, the Investor Shares and Institutional Shares share classes were combined into a single class of shares of the fund. Accordingly, the performance history of the fund, prior to July 24, 2017, is that of the fund’s former Institutional Shares. |
| 3 | Source for category information: Morningstar, Inc. The Morningstar Category return represents all active and index mutual funds and ETFs within the category as of the report date. |
| 4 | As stated in the prospectus. Includes 0.04% of acquired fund fees and expenses (AFFE), which are indirect expenses incurred by the fund through its investments in the underlying funds. Net Expense: Expenses reduced by a contractual fee waiver in effect for so long as the investment adviser serves as adviser to the fund. Gross Expense: Does not reflect the effect of contractual fee waivers. For actual expense ratios during the period, not including AFFE, refer to the financial highlights section of the financial statements. |
Schwab Target Index Funds | Semiannual Report
Schwab Target 2030 Index Fund
Performance and Fund Facts as of September 30, 2022
| Number of Holdings | 9 |
| Portfolio Turnover Rate | 4% |
Asset Class Weightings % of Investments1,2
Top Holdings % of Net Assets2,3,4
Portfolio holdings may have changed since the report date.
| 1 | The percentage may differ from the Portfolio Holdings because the above calculation is based on a percentage of total investments, whereas the calculation in the Portfolio Holdings is based on a percentage of net assets. |
| 2 | The fund intends to primarily invest in affiliated Schwab ETFs and may also invest in affiliated Schwab Funds and unaffiliated third party ETFs and mutual funds (all such ETFs and mutual funds referred to as “underlying funds”). |
| 3 | This list is not a recommendation of any security by the investment adviser. |
| 4 | The holdings listed exclude any temporary liquidity investments. |
Schwab Target Index Funds | Semiannual Report
Schwab Target 2035 Index Fund
The performance data quoted represents past performance. Past performance does not guarantee future results. Investment returns and principal value of an investment will fluctuate so that an investor’s shares may be worth more or less than their original cost. Current performance may be lower or higher than performance data quoted. To obtain performance information current to the most recent month end, please visit www.schwabassetmanagement.com/schwabfunds_prospectus.
Average Annual Total Returns1,2
| Fund and Inception Date | 6 Months | 1 Year | 5 Years | Since Inception |
| Schwab Target 2035 Index Fund (8/25/16) | -18.03% | -18.21% | 3.96% | 5.51% |
| Dow Jones U.S. Total Stock Market IndexSM | -20.63% | -18.05% | 8.48% | 9.98% |
| Bloomberg US Aggregate Bond Index | -9.22% | -14.60% | -0.27% | -0.21% |
| Target 2035 Passive Composite Index | -18.13% | -18.27% | 4.06% | 5.58% |
| Fund Category: Morningstar Target-Date 20353 | -17.76% | -18.96% | 3.62% | N/A |
| Fund Expense Ratios4: Net 0.08%; Gross 0.12% |
All total returns on this page assume dividends and distributions were reinvested. Index figures do not include trading and management costs, which would lower performance. Indices are unmanaged and cannot be invested in directly. Performance results less than one year are not annualized.
For index definitions, please see the Glossary.
| 1 | Fund expenses have been partially absorbed by the investment adviser and its affiliates. Without these reductions, the fund’s returns would have been lower. These returns do not reflect the deduction of taxes that a shareholder would pay on fund distributions or the redemption of fund shares. |
| 2 | On July 24, 2017, the Investor Shares and Institutional Shares share classes were combined into a single class of shares of the fund. Accordingly, the performance history of the fund, prior to July 24, 2017, is that of the fund’s former Institutional Shares. |
| 3 | Source for category information: Morningstar, Inc. The Morningstar Category return represents all active and index mutual funds and ETFs within the category as of the report date. |
| 4 | As stated in the prospectus. Includes 0.04% of acquired fund fees and expenses (AFFE), which are indirect expenses incurred by the fund through its investments in the underlying funds. Net Expense: Expenses reduced by a contractual fee waiver in effect for so long as the investment adviser serves as adviser to the fund. Gross Expense: Does not reflect the effect of contractual fee waivers. For actual expense ratios during the period, not including AFFE, refer to the financial highlights section of the financial statements. |
Schwab Target Index Funds | Semiannual Report
Schwab Target 2035 Index Fund
Performance and Fund Facts as of September 30, 2022
| Number of Holdings | 8 |
| Portfolio Turnover Rate | 4% |
Asset Class Weightings % of Investments1,2
Top Holdings % of Net Assets2,3,4
Portfolio holdings may have changed since the report date.
| 1 | The percentage may differ from the Portfolio Holdings because the above calculation is based on a percentage of total investments, whereas the calculation in the Portfolio Holdings is based on a percentage of net assets. |
| 2 | The fund intends to primarily invest in affiliated Schwab ETFs and may also invest in affiliated Schwab Funds and unaffiliated third party ETFs and mutual funds (all such ETFs and mutual funds referred to as “underlying funds”). |
| 3 | This list is not a recommendation of any security by the investment adviser. |
| 4 | The holdings listed exclude any temporary liquidity investments. |
Schwab Target Index Funds | Semiannual Report
Schwab Target 2040 Index Fund
The performance data quoted represents past performance. Past performance does not guarantee future results. Investment returns and principal value of an investment will fluctuate so that an investor’s shares may be worth more or less than their original cost. Current performance may be lower or higher than performance data quoted. To obtain performance information current to the most recent month end, please visit www.schwabassetmanagement.com/schwabfunds_prospectus.
Average Annual Total Returns1,2
| Fund and Inception Date | 6 Months | 1 Year | 5 Years | Since Inception |
| Schwab Target 2040 Index Fund (8/25/16) | -18.99% | -18.87% | 4.17% | 5.88% |
| Dow Jones U.S. Total Stock Market IndexSM | -20.63% | -18.05% | 8.48% | 9.98% |
| Bloomberg US Aggregate Bond Index | -9.22% | -14.60% | -0.27% | -0.21% |
| Target 2040 Passive Composite Index | -19.10% | -18.92% | 4.29% | 5.96% |
| Fund Category: Morningstar Target-Date 20403 | -18.85% | -19.66% | 3.87% | N/A |
| Fund Expense Ratios4: Net 0.08%; Gross 0.12% |
All total returns on this page assume dividends and distributions were reinvested. Index figures do not include trading and management costs, which would lower performance. Indices are unmanaged and cannot be invested in directly. Performance results less than one year are not annualized.
For index definitions, please see the Glossary.
| 1 | Fund expenses have been partially absorbed by the investment adviser and its affiliates. Without these reductions, the fund’s returns would have been lower. These returns do not reflect the deduction of taxes that a shareholder would pay on fund distributions or the redemption of fund shares. |
| 2 | On July 24, 2017, the Investor Shares and Institutional Shares share classes were combined into a single class of shares of the fund. Accordingly, the performance history of the fund, prior to July 24, 2017, is that of the fund’s former Institutional Shares. |
| 3 | Source for category information: Morningstar, Inc. The Morningstar Category return represents all active and index mutual funds and ETFs within the category as of the report date. |
| 4 | As stated in the prospectus. Includes 0.04% of acquired fund fees and expenses (AFFE), which are indirect expenses incurred by the fund through its investments in the underlying funds. Net Expense: Expenses reduced by a contractual fee waiver in effect for so long as the investment adviser serves as adviser to the fund. Gross Expense: Does not reflect the effect of contractual fee waivers. For actual expense ratios during the period, not including AFFE, refer to the financial highlights section of the financial statements. |
Schwab Target Index Funds | Semiannual Report
Schwab Target 2040 Index Fund
Performance and Fund Facts as of September 30, 2022
| Number of Holdings | 8 |
| Portfolio Turnover Rate | 2% |
Asset Class Weightings % of Investments1,2
Top Holdings % of Net Assets2,3,4
Portfolio holdings may have changed since the report date.
| 1 | The percentage may differ from the Portfolio Holdings because the above calculation is based on a percentage of total investments, whereas the calculation in the Portfolio Holdings is based on a percentage of net assets. |
| 2 | The fund intends to primarily invest in affiliated Schwab ETFs and may also invest in affiliated Schwab Funds and unaffiliated third party ETFs and mutual funds (all such ETFs and mutual funds referred to as “underlying funds”). |
| 3 | This list is not a recommendation of any security by the investment adviser. |
| 4 | The holdings listed exclude any temporary liquidity investments. |
Schwab Target Index Funds | Semiannual Report
Schwab Target 2045 Index Fund
The performance data quoted represents past performance. Past performance does not guarantee future results. Investment returns and principal value of an investment will fluctuate so that an investor’s shares may be worth more or less than their original cost. Current performance may be lower or higher than performance data quoted. To obtain performance information current to the most recent month end, please visit www.schwabassetmanagement.com/schwabfunds_prospectus.
Average Annual Total Returns1,2
| Fund and Inception Date | 6 Months | 1 Year | 5 Years | Since Inception |
| Schwab Target 2045 Index Fund (8/25/16) | -19.78% | -19.43% | 4.38% | 6.15% |
| Dow Jones U.S. Total Stock Market IndexSM | -20.63% | -18.05% | 8.48% | 9.98% |
| Bloomberg US Aggregate Bond Index | -9.22% | -14.60% | -0.27% | -0.21% |
| Target 2045 Passive Composite Index | -19.88% | -19.43% | 4.48% | 6.25% |
| Fund Category: Morningstar Target-Date 20453 | -19.41% | -20.12% | 4.08% | N/A |
| Fund Expense Ratios4: Net 0.08%; Gross 0.13% |
All total returns on this page assume dividends and distributions were reinvested. Index figures do not include trading and management costs, which would lower performance. Indices are unmanaged and cannot be invested in directly. Performance results less than one year are not annualized.
For index definitions, please see the Glossary.
| 1 | Fund expenses have been partially absorbed by the investment adviser and its affiliates. Without these reductions, the fund’s returns would have been lower. These returns do not reflect the deduction of taxes that a shareholder would pay on fund distributions or the redemption of fund shares. |
| 2 | On July 24, 2017, the Investor Shares and Institutional Shares share classes were combined into a single class of shares of the fund. Accordingly, the performance history of the fund, prior to July 24, 2017, is that of the fund’s former Institutional Shares. |
| 3 | Source for category information: Morningstar, Inc. The Morningstar Category return represents all active and index mutual funds and ETFs within the category as of the report date. |
| 4 | As stated in the prospectus. Includes 0.05% of acquired fund fees and expenses (AFFE), which are indirect expenses incurred by the fund through its investments in the underlying funds. Net Expense: Expenses reduced by a contractual fee waiver in effect for so long as the investment adviser serves as adviser to the fund. Gross Expense: Does not reflect the effect of contractual fee waivers. For actual expense ratios during the period, not including AFFE, refer to the financial highlights section of the financial statements. |
Schwab Target Index Funds | Semiannual Report
Schwab Target 2045 Index Fund
Performance and Fund Facts as of September 30, 2022
| Number of Holdings | 8 |
| Portfolio Turnover Rate | 2% |
Asset Class Weightings % of Investments1,2
Top Holdings % of Net Assets2,4,5
Portfolio holdings may have changed since the report date.
| 1 | The percentage may differ from the Portfolio Holdings because the above calculation is based on a percentage of total investments, whereas the calculation in the Portfolio Holdings is based on a percentage of net assets. |
| 2 | The fund intends to primarily invest in affiliated Schwab ETFs and may also invest in affiliated Schwab Funds and unaffiliated third party ETFs and mutual funds (all such ETFs and mutual funds referred to as “underlying funds”). |
| 3 | Less than 0.05%. |
| 4 | This list is not a recommendation of any security by the investment adviser. |
| 5 | The holdings listed exclude any temporary liquidity investments. |
Schwab Target Index Funds | Semiannual Report
Schwab Target 2050 Index Fund
The performance data quoted represents past performance. Past performance does not guarantee future results. Investment returns and principal value of an investment will fluctuate so that an investor’s shares may be worth more or less than their original cost. Current performance may be lower or higher than performance data quoted. To obtain performance information current to the most recent month end, please visit www.schwabassetmanagement.com/schwabfunds_prospectus.
Average Annual Total Returns1,2
| Fund and Inception Date | 6 Months | 1 Year | 5 Years | Since Inception |
| Schwab Target 2050 Index Fund (8/25/16) | -20.26% | -19.81% | 4.46% | 6.29% |
| Dow Jones U.S. Total Stock Market IndexSM | -20.63% | -18.05% | 8.48% | 9.98% |
| Bloomberg US Aggregate Bond Index | -9.22% | -14.60% | -0.27% | -0.21% |
| Target 2050 Passive Composite Index | -20.35% | -19.77% | 4.58% | 6.40% |
| Fund Category: Morningstar Target-Date 20503 | -19.81% | -20.43% | 4.07% | N/A |
| Fund Expense Ratios4: Net 0.08%; Gross 0.13% |
All total returns on this page assume dividends and distributions were reinvested. Index figures do not include trading and management costs, which would lower performance. Indices are unmanaged and cannot be invested in directly. Performance results less than one year are not annualized.
For index definitions, please see the Glossary.
| 1 | Fund expenses have been partially absorbed by the investment adviser and its affiliates. Without these reductions, the fund’s returns would have been lower. These returns do not reflect the deduction of taxes that a shareholder would pay on fund distributions or the redemption of fund shares. |
| 2 | On July 24, 2017, the Investor Shares and Institutional Shares share classes were combined into a single class of shares of the fund. Accordingly, the performance history of the fund, prior to July 24, 2017, is that of the fund’s former Institutional Shares. |
| 3 | Source for category information: Morningstar, Inc. The Morningstar Category return represents all active and index mutual funds and ETFs within the category as of the report date. |
| 4 | As stated in the prospectus. Includes 0.05% of acquired fund fees and expenses (AFFE), which are indirect expenses incurred by the fund through its investments in the underlying funds. Net Expense: Expenses reduced by a contractual fee waiver in effect for so long as the investment adviser serves as adviser to the fund. Gross Expense: Does not reflect the effect of contractual fee waivers. For actual expense ratios during the period, not including AFFE, refer to the financial highlights section of the financial statements. |
Schwab Target Index Funds | Semiannual Report
Schwab Target 2050 Index Fund
Performance and Fund Facts as of September 30, 2022
| Number of Holdings | 7 |
| Portfolio Turnover Rate | 1% |
Asset Class Weightings % of Investments1,2
Top Holdings % of Net Assets2,4,5
Portfolio holdings may have changed since the report date.
| 1 | The percentage may differ from the Portfolio Holdings because the above calculation is based on a percentage of total investments, whereas the calculation in the Portfolio Holdings is based on a percentage of net assets. |
| 2 | The fund intends to primarily invest in affiliated Schwab ETFs and may also invest in affiliated Schwab Funds and unaffiliated third party ETFs and mutual funds (all such ETFs and mutual funds referred to as “underlying funds”). |
| 3 | Less than 0.05%. |
| 4 | This list is not a recommendation of any security by the investment adviser. |
| 5 | The holdings listed exclude any temporary liquidity investments. |
Schwab Target Index Funds | Semiannual Report
Schwab Target 2055 Index Fund
The performance data quoted represents past performance. Past performance does not guarantee future results. Investment returns and principal value of an investment will fluctuate so that an investor’s shares may be worth more or less than their original cost. Current performance may be lower or higher than performance data quoted. To obtain performance information current to the most recent month end, please visit www.schwabassetmanagement.com/schwabfunds_prospectus.
Average Annual Total Returns1,2
| Fund and Inception Date | 6 Months | 1 Year | 5 Years | Since Inception |
| Schwab Target 2055 Index Fund (8/25/16) | -20.46% | -19.92% | 4.55% | 6.44% |
| Dow Jones U.S. Total Stock Market IndexSM | -20.63% | -18.05% | 8.48% | 9.98% |
| Bloomberg US Aggregate Bond Index | -9.22% | -14.60% | -0.27% | -0.21% |
| Target 2055 Passive Composite Index | -20.61% | -19.95% | 4.65% | 6.54% |
| Fund Category: Morningstar Target-Date 20553 | -19.92% | -20.54% | 4.12% | N/A |
| Fund Expense Ratios4: Net 0.08%; Gross 0.13% |
All total returns on this page assume dividends and distributions were reinvested. Index figures do not include trading and management costs, which would lower performance. Indices are unmanaged and cannot be invested in directly. Performance results less than one year are not annualized.
For index definitions, please see the Glossary.
| 1 | Fund expenses have been partially absorbed by the investment adviser and its affiliates. Without these reductions, the fund’s returns would have been lower. These returns do not reflect the deduction of taxes that a shareholder would pay on fund distributions or the redemption of fund shares. |
| 2 | On July 24, 2017, the Investor Shares and Institutional Shares share classes were combined into a single class of shares of the fund. Accordingly, the performance history of the fund, prior to July 24, 2017, is that of the fund’s former Institutional Shares. |
| 3 | Source for category information: Morningstar, Inc. The Morningstar Category return represents all active and index mutual funds and ETFs within the category as of the report date. |
| 4 | As stated in the prospectus. Includes 0.05% of acquired fund fees and expenses (AFFE), which are indirect expenses incurred by the fund through its investments in the underlying funds. Net Expense: Expenses reduced by a contractual fee waiver in effect for so long as the investment adviser serves as adviser to the fund. Gross Expense: Does not reflect the effect of contractual fee waivers. For actual expense ratios during the period, not including AFFE, refer to the financial highlights section of the financial statements. |
Schwab Target Index Funds | Semiannual Report
Schwab Target 2055 Index Fund
Performance and Fund Facts as of September 30, 2022
| Number of Holdings | 7 |
| Portfolio Turnover Rate | 1% |
Asset Class Weightings % of Investments1,2
Top Holdings % of Net Assets2,4,5
Portfolio holdings may have changed since the report date.
| 1 | The percentage may differ from the Portfolio Holdings because the above calculation is based on a percentage of total investments, whereas the calculation in the Portfolio Holdings is based on a percentage of net assets. |
| 2 | The fund intends to primarily invest in affiliated Schwab ETFs and may also invest in affiliated Schwab Funds and unaffiliated third party ETFs and mutual funds (all such ETFs and mutual funds referred to as “underlying funds”). |
| 3 | Less than 0.05%. |
| 4 | This list is not a recommendation of any security by the investment adviser. |
| 5 | The holdings listed exclude any temporary liquidity investments. |
Schwab Target Index Funds | Semiannual Report
Schwab Target 2060 Index Fund
The performance data quoted represents past performance. Past performance does not guarantee future results. Investment returns and principal value of an investment will fluctuate so that an investor’s shares may be worth more or less than their original cost. Current performance may be lower or higher than performance data quoted. To obtain performance information current to the most recent month end, please visit www.schwabassetmanagement.com/schwabfunds_prospectus.
Average Annual Total Returns1,2
| Fund and Inception Date | 6 Months | 1 Year | 5 Years | Since Inception |
| Schwab Target 2060 Index Fund (8/25/16) | -20.74% | -20.11% | 4.59% | 6.50% |
| Dow Jones U.S. Total Stock Market IndexSM | -20.63% | -18.05% | 8.48% | 9.98% |
| Bloomberg US Aggregate Bond Index | -9.22% | -14.60% | -0.27% | -0.21% |
| Target 2060 Passive Composite Index | -20.85% | -20.09% | 4.72% | 6.61% |
| Fund Category: Morningstar Target-Date 20603 | -19.98% | -20.55% | 4.14% | N/A |
| Fund Expense Ratios4: Net 0.08%; Gross 0.13% |
All total returns on this page assume dividends and distributions were reinvested. Index figures do not include trading and management costs, which would lower performance. Indices are unmanaged and cannot be invested in directly. Performance results less than one year are not annualized.
For index definitions, please see the Glossary.
| 1 | Fund expenses have been partially absorbed by the investment adviser and its affiliates. Without these reductions, the fund’s returns would have been lower. These returns do not reflect the deduction of taxes that a shareholder would pay on fund distributions or the redemption of fund shares. |
| 2 | On July 24, 2017, the Investor Shares and Institutional Shares share classes were combined into a single class of shares of the fund. Accordingly, the performance history of the fund, prior to July 24, 2017, is that of the fund’s former Institutional Shares. |
| 3 | Source for category information: Morningstar, Inc. The Morningstar Category return represents all active and index mutual funds and ETFs within the category as of the report date. |
| 4 | As stated in the prospectus. Includes 0.05% of acquired fund fees and expenses (AFFE), which are indirect expenses incurred by the fund through its investments in the underlying funds. Net Expense: Expenses reduced by a contractual fee waiver in effect for so long as the investment adviser serves as adviser to the fund. Gross Expense: Does not reflect the effect of contractual fee waivers. For actual expense ratios during the period, not including AFFE, refer to the financial highlights section of the financial statements. |
Schwab Target Index Funds | Semiannual Report
Schwab Target 2060 Index Fund
Performance and Fund Facts as of September 30, 2022
| Number of Holdings | 6 |
| Portfolio Turnover Rate | 1% |
Asset Class Weightings % of Investments1,2
Top Holdings % of Net Assets2,3,4
Portfolio holdings may have changed since the report date.
| 1 | The percentage may differ from the Portfolio Holdings because the above calculation is based on a percentage of total investments, whereas the calculation in the Portfolio Holdings is based on a percentage of net assets. |
| 2 | The fund intends to primarily invest in affiliated Schwab ETFs and may also invest in affiliated Schwab Funds and unaffiliated third party ETFs and mutual funds (all such ETFs and mutual funds referred to as “underlying funds”). |
| 3 | This list is not a recommendation of any security by the investment adviser. |
| 4 | The holdings listed exclude any temporary liquidity investments. |
Schwab Target Index Funds | Semiannual Report
Schwab Target 2065 Index Fund
The performance data quoted represents past performance. Past performance does not guarantee future results. Investment returns and principal value of an investment will fluctuate so that an investor’s shares may be worth more or less than their original cost. Current performance may be lower or higher than performance data quoted. To obtain performance information current to the most recent month end, please visit www.schwabassetmanagement.com/schwabfunds_prospectus.
Average Annual Total Returns1
| Fund and Inception Date | 6 Months | 1 Year | Since Inception |
| Schwab Target 2065 Index Fund (2/25/21) | -20.82% | -20.21% | -8.86% |
| Dow Jones U.S. Total Stock Market IndexSM | -20.63% | -18.05% | -5.47% |
| Bloomberg US Aggregate Bond Index | -9.22% | -14.60% | -8.61% |
| Target 2065 Passive Composite Index | -20.94% | -20.16% | -9.02% |
| Fund Category: Morningstar Target-Date 2065+2 | -20.29% | -20.87% | N/A |
| Fund Expense Ratios3: Net 0.08%; Gross 0.13% |
All total returns on this page assume dividends and distributions were reinvested. Index figures do not include trading and management costs, which would lower performance. Indices are unmanaged and cannot be invested in directly. Performance results less than one year are not annualized.
For index definitions, please see the Glossary.
| 1 | Fund expenses have been partially absorbed by the investment adviser and its affiliates. Without these reductions, the fund’s returns would have been lower. These returns do not reflect the deduction of taxes that a shareholder would pay on fund distributions or the redemption of fund shares. |
| 2 | Source for category information: Morningstar, Inc. The Morningstar Category return represents all active and index mutual funds and ETFs within the category as of the report date. |
| 3 | As stated in the prospectus. Includes 0.05% of acquired fund fees and expenses (AFFE), which are indirect expenses incurred by the fund through its investments in the underlying funds. Net Expense: Expenses reduced by a contractual fee waiver in effect for so long as the investment adviser serves as adviser to the fund. Gross Expense: Does not reflect the effect of contractual fee waivers. For actual expense ratios during the period, not including AFFE, refer to the financial highlights section of the financial statements. |
Schwab Target Index Funds | Semiannual Report
Schwab Target 2065 Index Fund
Performance and Fund Facts as of September 30, 2022
| Number of Holdings | 6 |
| Portfolio Turnover Rate | 5% |
Asset Class Weightings % of Investments1,2
Top Holdings % of Net Assets2,3,4
Portfolio holdings may have changed since the report date.
| 1 | The percentage may differ from the Portfolio Holdings because the above calculation is based on a percentage of total investments, whereas the calculation in the Portfolio Holdings is based on a percentage of net assets. |
| 2 | The fund intends to primarily invest in affiliated Schwab ETFs and may also invest in affiliated Schwab Funds and unaffiliated third party ETFs and mutual funds (all such ETFs and mutual funds referred to as “underlying funds”). |
| 3 | This list is not a recommendation of any security by the investment adviser. |
| 4 | The holdings listed exclude any temporary liquidity investments. |
Schwab Target Index Funds | Semiannual Report
Schwab Target Index Funds
Fund Expenses (Unaudited)
Examples for a $1,000 Investment
As a fund shareholder, you may incur two types of costs: (1) transaction costs; and (2) ongoing costs, including management fees.
The expense examples below are intended to help you understand your ongoing cost (in dollars) of investing in a fund and to compare this cost with the ongoing cost of investing in other mutual funds. These examples are based on an investment of $1,000 invested for six months beginning April 1, 2022 and held through September 30, 2022.
Actual Return lines in the table below provide information about actual account values and actual expenses. You may use this information, together with the amount you invested, to estimate the expenses that you paid over the period. To do so, simply divide your account value by $1,000 (for example, an $8,600 account value ÷ $1,000 = 8.6), then multiply the result by the number given for your fund under the heading entitled “Expenses Paid During Period.”
Hypothetical Return lines in the table below provide information about hypothetical account values and hypothetical expenses based on a fund’s actual expense ratio and an assumed return of 5% per year before expenses. Because the return used is not an actual return, it may not be used to estimate the actual ending account value or expenses you paid for the period.
You may use this information to compare the ongoing costs of investing in a fund and other funds. To do so, compare this 5% hypothetical example with the 5% hypothetical examples that appear in the shareholder reports of the other funds.
Please note that the expenses shown in the table are meant to highlight your ongoing costs only and do not reflect any transactional costs. Therefore, the hypothetical return lines of the table are useful in comparing ongoing costs only and will not help you determine the relative total costs of owning different funds. In addition, if these transactional costs were included, your costs would have been higher.
| | EXPENSE RATIO
(ANNUALIZED)1,2 | EFFECTIVE
EXPENSE RATIO
(ANNUALIZED)3,4 | BEGINNING
ACCOUNT VALUE
AT 4/1/22 | ENDING
ACCOUNT VALUE
(NET OF EXPENSES)
AT 9/30/222 | EXPENSES PAID
DURING PERIOD
4/1/22-9/30/222,5 | EFFECTIVE
EXPENSES PAID
DURING PERIOD
4/1/22-9/30/224,5 |
| Schwab Target 2010 Index Fund | | | | | | |
| Actual Return | 0.04% | 0.08% | $1,000.00 | $ 870.70 | $0.19 | $0.38 |
| Hypothetical 5% Return | 0.04% | 0.08% | $1,000.00 | $1,024.87 | $0.20 | $0.41 |
| Schwab Target 2015 Index Fund | | | | | | |
| Actual Return | 0.04% | 0.08% | $1,000.00 | $ 864.60 | $0.19 | $0.37 |
| Hypothetical 5% Return | 0.04% | 0.08% | $1,000.00 | $1,024.87 | $0.20 | $0.41 |
| Schwab Target 2020 Index Fund | | | | | | |
| Actual Return | 0.04% | 0.08% | $1,000.00 | $ 861.60 | $0.19 | $0.37 |
| Hypothetical 5% Return | 0.04% | 0.08% | $1,000.00 | $1,024.87 | $0.20 | $0.41 |
| Schwab Target 2025 Index Fund | | | | | | |
| Actual Return | 0.04% | 0.08% | $1,000.00 | $ 846.90 | $0.19 | $0.37 |
| Hypothetical 5% Return | 0.04% | 0.08% | $1,000.00 | $1,024.87 | $0.20 | $0.41 |
| Schwab Target 2030 Index Fund | | | | | | |
| Actual Return | 0.04% | 0.08% | $1,000.00 | $ 831.00 | $0.18 | $0.37 |
| Hypothetical 5% Return | 0.04% | 0.08% | $1,000.00 | $1,024.87 | $0.20 | $0.41 |
| Schwab Target 2035 Index Fund | | | | | | |
| Actual Return | 0.04% | 0.08% | $1,000.00 | $ 819.70 | $0.18 | $0.36 |
| Hypothetical 5% Return | 0.04% | 0.08% | $1,000.00 | $1,024.87 | $0.20 | $0.41 |
| Schwab Target 2040 Index Fund | | | | | | |
| Actual Return | 0.04% | 0.08% | $1,000.00 | $ 810.10 | $0.18 | $0.36 |
| Hypothetical 5% Return | 0.04% | 0.08% | $1,000.00 | $1,024.87 | $0.20 | $0.41 |
| Schwab Target 2045 Index Fund | | | | | | |
| Actual Return | 0.04% | 0.08% | $1,000.00 | $ 802.20 | $0.18 | $0.36 |
| Hypothetical 5% Return | 0.04% | 0.08% | $1,000.00 | $1,024.87 | $0.20 | $0.41 |
| Schwab Target 2050 Index Fund | | | | | | |
| Actual Return | 0.04% | 0.08% | $1,000.00 | $ 797.40 | $0.18 | $0.36 |
| Hypothetical 5% Return | 0.04% | 0.08% | $1,000.00 | $1,024.87 | $0.20 | $0.41 |
| Schwab Target 2055 Index Fund | | | | | | |
| Actual Return | 0.04% | 0.08% | $1,000.00 | $ 795.40 | $0.18 | $0.36 |
| Hypothetical 5% Return | 0.04% | 0.08% | $1,000.00 | $1,024.87 | $0.20 | $0.41 |
| Schwab Target 2060 Index Fund | | | | | | |
| Actual Return | 0.04% | 0.08% | $1,000.00 | $ 792.60 | $0.18 | $0.36 |
| Hypothetical 5% Return | 0.04% | 0.08% | $1,000.00 | $1,024.87 | $0.20 | $0.41 |
Schwab Target Index Funds | Semiannual Report
Schwab Target Index Funds
Fund Expenses (Unaudited) (continued)
| | EXPENSE RATIO
(ANNUALIZED)1,2 | EFFECTIVE
EXPENSE RATIO
(ANNUALIZED)3,4 | BEGINNING
ACCOUNT VALUE
AT 4/1/22 | ENDING
ACCOUNT VALUE
(NET OF EXPENSES)
AT 9/30/222 | EXPENSES PAID
DURING PERIOD
4/1/22-9/30/222,5 | EFFECTIVE
EXPENSES PAID
DURING PERIOD
4/1/22-9/30/224,5 |
| Schwab Target 2065 Index Fund | | | | | | |
| Actual Return | 0.04% | 0.08% | $1,000.00 | $ 791.80 | $0.18 | $0.36 |
| Hypothetical 5% Return | 0.04% | 0.08% | $1,000.00 | $1,024.87 | $0.20 | $0.41 |
| 1 | Based on the most recent six-month expense ratio; may differ from the expense ratio provided in the Financial Highlights. |
| 2 | Excludes acquired fund fees and expenses, which are indirect expenses incurred by the fund through its investments in underlying funds. |
| 3 | Based on the most recent six-month acquired fund fees and expenses and the expense ratio; may differ from the acquired fund fees and expenses and the expense ratios in the prospectus. |
| 4 | Includes acquired fund fees and expenses, which are indirect expenses incurred by the fund through its investments in underlying funds. |
| 5 | Expenses for each fund are equal to its annualized expense ratio, multiplied by the average account value over the period, multiplied by the 183 days of the period, and divided by the 365 days of the fiscal year. |
Schwab Target Index Funds | Semiannual Report
Schwab Target 2010 Index Fund
Financial Statements
FINANCIAL HIGHLIGHTS
| | 4/1/22–
9/30/22* | 4/1/21–
3/31/22 | 4/1/20–
3/31/21 | 4/1/19–
3/31/20 | 4/1/18–
3/31/19 | 4/1/17–
3/31/181 |
| Per-Share Data |
| Net asset value at beginning of period | $12.37 | $12.49 | $10.70 | $10.88 | $10.59 | $10.15 |
| Income (loss) from investment operations: | | | | | | |
| Net investment income (loss)2 | 0.13 | 0.25 | 0.22 | 0.27 | 0.27 | 0.22 |
| Net realized and unrealized gains (losses) | (1.73) | (0.04) | 1.82 | (0.19) | 0.23 | 0.34 |
| Total from investment operations | (1.60) | 0.21 | 2.04 | 0.08 | 0.50 | 0.56 |
| Less distributions: | | | | | | |
| Distributions from net investment income | — | (0.25) | (0.21) | (0.25) | (0.20) | (0.12) |
| Distributions from net realized gains | — | (0.08) | (0.04) | (0.01) | (0.01) | (0.00) 3 |
| Total distributions | — | (0.33) | (0.25) | (0.26) | (0.21) | (0.12) |
| Net asset value at end of period | $10.77 | $12.37 | $12.49 | $10.70 | $10.88 | $10.59 |
| Total return | (12.93%) 4 | 1.55% | 19.04% | 0.58% | 4.81% | 5.57% |
| Ratios/Supplemental Data |
| Ratios to average net assets: | | | | | | |
| Net operating expenses5 | 0.04% 6,7 | 0.03% | 0.03% | 0.03% | 0.03% | 0.03% |
| Gross operating expenses5 | 0.08% 6,7 | 0.08% | 0.08% | 0.08% | 0.08% | 0.08% |
| Net investment income (loss) | 2.28% 6 | 1.90% | 1.83% | 2.43% | 2.53% | 2.11% |
| Portfolio turnover rate | 6% 4 | 27% | 21% | 19% | 30% | 28% |
| Net assets, end of period (x 1,000) | $43,875 | $55,048 | $55,137 | $35,614 | $25,391 | $14,185 |
| * | Unaudited. |
| 1 | Effective July 24, 2017, the Investor Shares and Institutional Shares share classes were combined into a single class of shares of the fund. The financial history as shown in the financial highlights is that of the former Institutional Shares. |
| 2 | Calculated based on the average shares outstanding during the period. |
| 3 | Per-share amount was less than $0.005. |
| 4 | Not annualized. |
| 5 | Ratio excludes acquired fund fees and expenses, which are indirect expenses incurred by the fund through its investments in underlying funds. If the expenses incurred by the underlying funds were included in these ratios they would have increased by 0.04% (annualized), 0.05%, 0.05%, 0.05%, 0.05% and 0.05%, respectively, for the periods ended September 30, 2022, March 31, 2022 March 31, 2021, March 31, 2020, March 31, 2019 and March 31, 2018 (see financial note 4). |
| 6 | Annualized (except for proxy expenses). |
| 7 | Ratio includes less than 0.005% of non-routine proxy expenses. |
Schwab Target Index Funds | Semiannual Report
Schwab Target 2010 Index Fund
Portfolio Holdings as of September 30, 2022 (Unaudited)
This section shows all the securities in the fund’s portfolio and their values as of the report date, including a summary of the fund’s transactions with its affiliated underlying funds during the period.
The fund files its complete schedule of portfolio holdings with the U.S. Securities and Exchange Commission (SEC) for the first and third quarters of each fiscal year on Form N-PORT Part F. The fund’s Form N-PORT Part F is available on the SEC’s website at www.sec.gov. You can also obtain this information at no cost on the fund’s website at www.schwabassetmanagement.com/schwabfunds_prospectus, by calling 1-866-414-6349, or by sending an email request to orders@mysummaryprospectus.com.The fund also makes available its complete schedule of portfolio holdings 15 to 20 days after the end of the month on the fund’s website.
| SECURITY | VALUE AT
3/31/22 | PURCHASES | SALES | REALIZED
GAINS (LOSSES) | NET CHANGE IN
UNREALIZED
APPRECIATION
(DEPRECIATION) | VALUE AT
9/30/22 | BALANCE
OF SHARES
HELD AT
9/30/22 | DISTRIBUTIONS
RECEIVED(a) |
| AFFILIATED UNDERLYING FUNDS 100.1% OF NET ASSETS |
| |
| U.S. Stocks 24.8% |
| Large-Cap 23.3% |
| Schwab U.S. Large-Cap ETF | $13,059,648 | $1,461,285 | ($1,538,371) | ($48,146) | ($2,676,187) | $10,258,229 | 242,225 | $91,408 |
| Small-Cap 1.5% |
| Schwab U.S. Small-Cap ETF | 810,851 | 73,759 | (73,795) | (3,493) | (157,578) | 649,744 | 17,189 | 4,805 |
| | | | | | | 10,907,973 | | |
| |
| International Stocks 9.5% |
| Developed Markets 9.5% |
| Schwab International Equity ETF | 5,261,462 | 409,609 | (285,790) | (22,830) | (1,193,247) | 4,169,204 | 148,212 | 38,033 |
| |
| Real Estate 2.6% |
| U.S. REITs 2.6% |
| Schwab U.S. REIT ETF | 1,442,898 | 106,432 | (66,303) | (2,664) | (348,534) | 1,131,829 | 60,558 | 16,477 |
| |
| Fixed Income 58.5% |
| Inflation-Protected Bond 6.2% |
| Schwab U.S. TIPS ETF | 3,438,675 | 24,012 | (237,103) | (19,985) | (466,208) | 2,739,391 | 52,884 | 131,765 |
| Intermediate-Term Bond 43.5% |
| Schwab U.S. Aggregate Bond ETF | 23,774,980 | 958,333 | (3,287,572) | (422,489) | (1,951,865) | 19,071,387 | 420,909 | 261,725 |
| Treasury Bond 8.8% |
| Schwab Short-Term U.S. Treasury ETF | 4,761,586 | 158,889 | (963,118) | (42,135) | (70,927) | 3,844,295 | 79,658 | 22,552 |
| | | | | | | 25,655,073 | | |
| |
| Money Market Funds 4.7% |
| Schwab Variable Share Price Money Fund, Ultra Shares, 3.01% (b) | 2,037,571 | 12,009 | — | — | 614 | 2,050,194 | 2,049,579 | 14,574 |
Total Affiliated Underlying Funds
(Cost $44,837,407) | $54,587,671 | $3,204,328 | ($6,452,052) | ($561,742) | ($6,863,932) | $43,914,273 | | $581,339 |
Total Investments in Securities
(Cost $44,837,407) | | | | | | $43,914,273 | | |
| (a) | Distributions received include distributions from net investment income and capital gains, if any, from the underlying funds. Amounts shown are only presented for affiliated underlying funds, which are presented in the corresponding line-item in the Statement of Operations, if applicable (See financial note 2(d) for additional information). |
| (b) | The rate shown is the 7-day yield. |
| ETF — | Exchange traded fund |
| REIT — | Real Estate Investment Trust |
| TIPS — | Treasury Inflation Protected Securities |
At September 30, 2022, all of the fund’s investment securities were classified as Level 1. Fund investments in mutual funds and ETFs are classified as Level 1, without consideration to the classification level of the underlying securities held by the mutual funds and ETFs, which could be Level 1, Level 2 or Level 3. (See financial note 2(a) for additional information).
Schwab Target Index Funds | Semiannual Report
Schwab Target 2010 Index Fund
Statement of Assets and Liabilities
As of September 30, 2022; unaudited
| Assets |
| Investments in securities, at value - affiliated (cost $44,837,407) | | $43,914,273 |
| Receivables: | | |
| Investments sold | | 459,784 |
| Fund shares sold | | 5,133 |
| Dividends | + | 2,709 |
| Total assets | | 44,381,899 |
| Liabilities |
| Payables: | | |
| Investments bought | | 271,066 |
| Fund shares redeemed | | 224,184 |
| Due to custodian | | 10,268 |
| Investment adviser fees | + | 1,549 |
| Total liabilities | | 507,067 |
| Net assets | | $43,874,832 |
| Net Assets by Source |
| Capital received from investors | | $45,226,744 |
| Total distributable loss | + | (1,351,912) |
| Net assets | | $43,874,832 |
| Net Asset Value (NAV) |
| Net Assets | ÷ | Shares
Outstanding | = | NAV |
| $43,874,832 | | 4,074,989 | | $10.77 |
| | | | | |
| | | | | |
Schwab Target Index Funds | Semiannual Report
Schwab Target 2010 Index Fund
Statement of Operations
| For the period April 1, 2022 through September 30, 2022; unaudited |
| Investment Income |
| Dividends received from securities - affiliated | | $581,339 |
| Interest received from securities - unaffiliated | + | 234 |
| Total investment income | | 581,573 |
| Expenses |
| Investment adviser fees | | 20,134 |
| Proxy fees1 | + | 2,269 |
| Total expenses | | 22,403 |
| Expense reduction | – | 11,279 |
| Net expenses | – | 11,124 |
| Net investment income | | 570,449 |
| REALIZED AND UNREALIZED GAINS (LOSSES) |
| Net realized losses on sales of securities - affiliated | | (561,742) |
| Net change in unrealized appreciation (depreciation) on securities - affiliated | + | (6,863,932) |
| Net realized and unrealized losses | | (7,425,674) |
| Decrease in net assets resulting from operations | | ($6,855,225) |
| 1 | Proxy fees are non-routine expenses (see financial note 2(e) for additional information). |
Schwab Target Index Funds | Semiannual Report
Schwab Target 2010 Index Fund
Statement of Changes in Net Assets
For the current and prior report periods
Figures for the current period are unaudited
| OPERATIONS |
| | 4/1/22-9/30/22 | 4/1/21-3/31/22 |
| Net investment income | | $570,449 | $1,111,179 |
| Net realized gains (losses) | | (561,742) | 190,119 |
| Net change in unrealized appreciation (depreciation) | + | (6,863,932) | (400,635) |
| Increase (decrease) in net assets resulting from operations | | ($6,855,225) | $900,663 |
| DISTRIBUTIONS TO SHAREHOLDERS |
| Total distributions | | $— | ($1,460,719) |
| TRANSACTIONS IN FUND SHARES |
| | 4/1/22-9/30/22 | 4/1/21-3/31/22 |
| | | SHARES | VALUE | SHARES | VALUE |
| Shares sold | | 277,386 | $3,249,822 | 1,420,137 | $18,277,254 |
| Shares reinvested | | — | — | 104,962 | 1,363,444 |
| Shares redeemed | + | (653,452) | (7,567,993) | (1,490,015) | (19,169,445) |
| Net transactions in fund shares | | (376,066) | ($4,318,171) | 35,084 | $471,253 |
| SHARES OUTSTANDING AND NET ASSETS |
| | 4/1/22-9/30/22 | 4/1/21-3/31/22 |
| | | SHARES | NET ASSETS | SHARES | NET ASSETS |
| Beginning of period | | 4,451,055 | $55,048,228 | 4,415,971 | $55,137,031 |
| Total increase (decrease) | + | (376,066) | (11,173,396) | 35,084 | (88,803) |
| End of period | | 4,074,989 | $43,874,832 | 4,451,055 | $55,048,228 |
Schwab Target Index Funds | Semiannual Report
Schwab Target 2015 Index Fund
Financial Statements
FINANCIAL HIGHLIGHTS
| | 4/1/22–
9/30/22* | 4/1/21–
3/31/22 | 4/1/20–
3/31/21 | 4/1/19–
3/31/20 | 4/1/18–
3/31/19 | 4/1/17–
3/31/181 |
| Per-Share Data |
| Net asset value at beginning of period | $12.48 | $12.58 | $10.68 | $10.92 | $10.61 | $10.17 |
| Income (loss) from investment operations: | | | | | | |
| Net investment income (loss)2 | 0.13 | 0.25 | 0.22 | 0.28 | 0.27 | 0.22 |
| Net realized and unrealized gains (losses) | (1.82) | 0.01 3 | 1.97 | (0.26) | 0.22 | 0.38 |
| Total from investment operations | (1.69) | 0.26 | 2.19 | 0.02 | 0.49 | 0.60 |
| Less distributions: | | | | | | |
| Distributions from net investment income | — | (0.25) | (0.22) | (0.25) | (0.17) | (0.15) |
| Distributions from net realized gains | — | (0.11) | (0.07) | (0.01) | (0.01) | (0.01) |
| Total distributions | — | (0.36) | (0.29) | (0.26) | (0.18) | (0.16) |
| Net asset value at end of period | $10.79 | $12.48 | $12.58 | $10.68 | $10.92 | $10.61 |
| Total return | (13.54%) 4 | 1.92% | 20.52% | (0.02%) | 4.74% | 5.83% |
| Ratios/Supplemental Data |
| Ratios to average net assets: | | | | | | |
| Net operating expenses5 | 0.04% 6,7 | 0.03% | 0.04% | 0.03% | 0.03% | 0.03% |
| Gross operating expenses5 | 0.08% 6,7 | 0.08% | 0.08% | 0.08% | 0.08% | 0.08% |
| Net investment income (loss) | 2.25% 6 | 1.91% | 1.85% | 2.45% | 2.54% | 2.06% |
| Portfolio turnover rate | 7% 4 | 23% | 30% | 24% | 29% | 47% |
| Net assets, end of period (x 1,000) | $58,919 | $75,362 | $73,384 | $57,790 | $45,688 | $20,229 |
| * | Unaudited. |
| 1 | Effective July 24, 2017, the Investor Shares and Institutional Shares share classes were combined into a single class of shares of the fund. The financial history as shown in the financial highlights is that of the former Institutional Shares. |
| 2 | Calculated based on the average shares outstanding during the period. |
| 3 | The per share amount does not accord with the change in aggregate gains and losses in securities during the period because of the timing of sales and repurchases of fund shares in relation to fluctuating market values. |
| 4 | Not annualized. |
| 5 | Ratio excludes acquired fund fees and expenses, which are indirect expenses incurred by the fund through its investments in underlying funds. If the expenses incurred by the underlying funds were included in these ratios they would have increased by 0.04% (annualized), 0.05%, 0.04%, 0.05%, 0.05% and 0.05%, respectively, for the periods ended September 30, 2022, March 31, 2022 March 31, 2021, March 31, 2020, March 31, 2019 and March 31, 2018 (see financial note 4). |
| 6 | Annualized (except for proxy expenses). |
| 7 | Ratio includes less than 0.005% of non-routine proxy expenses. |
Schwab Target Index Funds | Semiannual Report
Schwab Target 2015 Index Fund
Portfolio Holdings as of September 30, 2022 (Unaudited)
This section shows all the securities in the fund’s portfolio and their values as of the report date, including a summary of the fund’s transactions with its affiliated underlying funds during the period.
The fund files its complete schedule of portfolio holdings with the U.S. Securities and Exchange Commission (SEC) for the first and third quarters of each fiscal year on Form N-PORT Part F. The fund’s Form N-PORT Part F is available on the SEC’s website at www.sec.gov. You can also obtain this information at no cost on the fund’s website at www.schwabassetmanagement.com/schwabfunds_prospectus, by calling 1-866-414-6349, or by sending an email request to orders@mysummaryprospectus.com.The fund also makes available its complete schedule of portfolio holdings 15 to 20 days after the end of the month on the fund’s website.
| SECURITY | VALUE AT
3/31/22 | PURCHASES | SALES | REALIZED
GAINS (LOSSES) | NET CHANGE IN
UNREALIZED
APPRECIATION
(DEPRECIATION) | VALUE AT
9/30/22 | BALANCE
OF SHARES
HELD AT
9/30/22 | DISTRIBUTIONS
RECEIVED(a) |
| AFFILIATED UNDERLYING FUNDS 100.0% OF NET ASSETS |
| |
| U.S. Stocks 26.8% |
| Large-Cap 25.2% |
| Schwab U.S. Large-Cap ETF | $19,284,923 | $2,123,698 | ($2,680,230) | $13,009 | ($3,895,861) | $14,845,539 | 350,544 | $129,445 |
| Small-Cap 1.6% |
| Schwab U.S. Small-Cap ETF | 1,245,379 | 135,186 | (168,682) | (12,520) | (229,264) | 970,099 | 25,664 | 6,980 |
| | | | | | | 15,815,638 | | |
| |
| International Stocks 10.7% |
| Developed Markets 10.7% |
| Schwab International Equity ETF | 8,151,546 | 895,924 | (890,730) | (76,573) | (1,746,107) | 6,334,060 | 225,171 | 56,291 |
| |
| Real Estate 2.8% |
| U.S. REITs 2.8% |
| Schwab U.S. REIT ETF | 2,170,358 | 308,030 | (333,618) | (523) | (481,323) | 1,662,924 | 88,974 | 23,720 |
| |
| Fixed Income 55.5% |
| Inflation-Protected Bond 5.9% |
| Schwab U.S. TIPS ETF | 4,438,933 | 117,210 | (438,094) | (17,137) | (594,932) | 3,505,980 | 67,683 | 165,624 |
| Intermediate-Term Bond 41.4% |
| Schwab U.S. Aggregate Bond ETF | 30,953,897 | 1,087,356 | (4,646,106) | (606,989) | (2,414,912) | 24,373,246 | 537,922 | 331,360 |
| Treasury Bond 8.2% |
| Schwab Short-Term U.S. Treasury ETF | 6,044,425 | 177,445 | (1,280,936) | (56,754) | (81,683) | 4,802,497 | 99,513 | 27,714 |
| | | | | | | 32,681,723 | | |
| |
| Money Market Funds 4.2% |
| Schwab Variable Share Price Money Fund, Ultra Shares, 3.01% (b) | 2,436,557 | 14,361 | — | — | 734 | 2,451,652 | 2,450,917 | 17,428 |
Total Affiliated Underlying Funds
(Cost $59,015,763) | $74,726,018 | $4,859,210 | ($10,438,396) | ($757,487) | ($9,443,348) | $58,945,997 | | $758,562 |
Total Investments in Securities
(Cost $59,015,763) | | | | | | $58,945,997 | | |
| (a) | Distributions received include distributions from net investment income and capital gains, if any, from the underlying funds. Amounts shown are only presented for affiliated underlying funds, which are presented in the corresponding line-item in the Statement of Operations, if applicable (See financial note 2(d) for additional information). |
| (b) | The rate shown is the 7-day yield. |
| ETF — | Exchange traded fund |
| REIT — | Real Estate Investment Trust |
| TIPS — | Treasury Inflation Protected Securities |
At September 30, 2022, all of the fund’s investment securities were classified as Level 1. Fund investments in mutual funds and ETFs are classified as Level 1, without consideration to the classification level of the underlying securities held by the mutual funds and ETFs, which could be Level 1, Level 2 or Level 3. (See financial note 2(a) for additional information).
Schwab Target Index Funds | Semiannual Report
Schwab Target 2015 Index Fund
Statement of Assets and Liabilities
As of September 30, 2022; unaudited
| Assets |
| Investments in securities, at value - affiliated (cost $59,015,763) | | $58,945,997 |
| Cash | | 70,228 |
| Receivables: | | |
| Investments sold | | 487,542 |
| Fund shares sold | | 9,432 |
| Dividends | + | 3,240 |
| Total assets | | 59,516,439 |
| Liabilities |
| Payables: | | |
| Investments bought | | 595,627 |
| Investment adviser fees | + | 2,054 |
| Total liabilities | | 597,681 |
| Net assets | | $58,918,758 |
| Net Assets by Source |
| Capital received from investors | | $59,549,385 |
| Total distributable loss | + | (630,627) |
| Net assets | | $58,918,758 |
| Net Asset Value (NAV) |
| Net Assets | ÷ | Shares
Outstanding | = | NAV |
| $58,918,758 | | 5,458,454 | | $10.79 |
| | | | | |
| | | | | |
Schwab Target Index Funds | Semiannual Report
Schwab Target 2015 Index Fund
Statement of Operations
| For the period April 1, 2022 through September 30, 2022; unaudited |
| Investment Income |
| Dividends received from securities - affiliated | | $758,562 |
| Interest received from securities - unaffiliated | + | 314 |
| Total investment income | | 758,876 |
| Expenses |
| Investment adviser fees | | 26,688 |
| Proxy fees1 | + | 3,009 |
| Total expenses | | 29,697 |
| Expense reduction | – | 14,860 |
| Net expenses | – | 14,837 |
| Net investment income | | 744,039 |
| REALIZED AND UNREALIZED GAINS (LOSSES) |
| Net realized losses on sales of securities - affiliated | | (757,487) |
| Net change in unrealized appreciation (depreciation) on securities - affiliated | + | (9,443,348) |
| Net realized and unrealized losses | | (10,200,835) |
| Decrease in net assets resulting from operations | | ($9,456,796) |
| 1 | Proxy fees are non-routine expenses (see financial note 2(e) for additional information). |
Schwab Target Index Funds | Semiannual Report
Schwab Target 2015 Index Fund
Statement of Changes in Net Assets
For the current and prior report periods
Figures for the current period are unaudited
| OPERATIONS |
| | 4/1/22-9/30/22 | 4/1/21-3/31/22 |
| Net investment income | | $744,039 | $1,490,265 |
| Net realized gains (losses) | | (757,487) | 333,576 |
| Net change in unrealized appreciation (depreciation) | + | (9,443,348) | (412,377) |
| Increase (decrease) in net assets resulting from operations | | ($9,456,796) | $1,411,464 |
| DISTRIBUTIONS TO SHAREHOLDERS |
| Total distributions | | $— | ($2,126,395) |
| TRANSACTIONS IN FUND SHARES |
| | 4/1/22-9/30/22 | 4/1/21-3/31/22 |
| | | SHARES | VALUE | SHARES | VALUE |
| Shares sold | | 357,410 | $4,160,202 | 1,612,364 | $20,853,291 |
| Shares reinvested | | — | — | 153,206 | 2,008,520 |
| Shares redeemed | + | (939,722) | (11,147,069) | (1,559,156) | (20,168,590) |
| Net transactions in fund shares | | (582,312) | ($6,986,867) | 206,414 | $2,693,221 |
| SHARES OUTSTANDING AND NET ASSETS |
| | 4/1/22-9/30/22 | 4/1/21-3/31/22 |
| | | SHARES | NET ASSETS | SHARES | NET ASSETS |
| Beginning of period | | 6,040,766 | $75,362,421 | 5,834,352 | $73,384,131 |
| Total increase (decrease) | + | (582,312) | (16,443,663) | 206,414 | 1,978,290 |
| End of period | | 5,458,454 | $58,918,758 | 6,040,766 | $75,362,421 |
Schwab Target Index Funds | Semiannual Report
Schwab Target 2020 Index Fund
Financial Statements
FINANCIAL HIGHLIGHTS
| | 4/1/22–
9/30/22* | 4/1/21–
3/31/22 | 4/1/20–
3/31/21 | 4/1/19–
3/31/20 | 4/1/18–
3/31/19 | 4/1/17–
3/31/181 |
| Per-Share Data |
| Net asset value at beginning of period | $13.01 | $13.05 | $10.93 | $11.18 | $10.92 | $10.30 |
| Income (loss) from investment operations: | | | | | | |
| Net investment income (loss)2 | 0.14 | 0.26 | 0.23 | 0.29 | 0.27 | 0.23 |
| Net realized and unrealized gains (losses) | (1.94) | 0.03 | 2.12 | (0.29) | 0.22 | 0.52 |
| Total from investment operations | (1.80) | 0.29 | 2.35 | 0.00 3 | 0.49 | 0.75 |
| Less distributions: | | | | | | |
| Distributions from net investment income | — | (0.26) | (0.21) | (0.25) | (0.23) | (0.13) |
| Distributions from net realized gains | — | (0.07) | (0.02) | (0.00) 3 | (0.00) 3 | (0.00) 3 |
| Total distributions | — | (0.33) | (0.23) | (0.25) | (0.23) | (0.13) |
| Net asset value at end of period | $11.21 | $13.01 | $13.05 | $10.93 | $11.18 | $10.92 |
| Total return | (13.84%) 4 | 2.13% | 21.51% | (0.17%) | 4.73% | 7.30% |
| Ratios/Supplemental Data |
| Ratios to average net assets: | | | | | | |
| Net operating expenses5 | 0.04% 6,7 | 0.03% | 0.03% | 0.03% | 0.03% | 0.03% |
| Gross operating expenses5 | 0.08% 6,7 | 0.08% | 0.08% | 0.08% | 0.08% | 0.08% |
| Net investment income (loss) | 2.22% 6 | 1.92% | 1.86% | 2.46% | 2.48% | 2.15% |
| Portfolio turnover rate | 7% 4 | 18% | 13% | 22% | 13% | 21% |
| Net assets, end of period (x 1,000) | $239,005 | $286,650 | $277,678 | $172,353 | $129,760 | $70,841 |
| * | Unaudited. |
| 1 | Effective July 24, 2017, the Investor Shares and Institutional Shares share classes were combined into a single class of shares of the fund. The financial history as shown in the financial highlights is that of the former Institutional Shares. |
| 2 | Calculated based on the average shares outstanding during the period. |
| 3 | Per-share amount was less than $0.005. |
| 4 | Not annualized. |
| 5 | Ratio excludes acquired fund fees and expenses, which are indirect expenses incurred by the fund through its investments in underlying funds. If the expenses incurred by the underlying funds were included in these ratios they would have increased by 0.04% (annualized), 0.05%, 0.05%, 0.05%, 0.05% and 0.05%, respectively, for the periods ended September 30, 2022, March 31, 2022 March 31, 2021, March 31, 2020, March 31, 2019 and March 31, 2018 (see financial note 4). |
| 6 | Annualized (except for proxy expenses). |
| 7 | Ratio includes less than 0.005% of non-routine proxy expenses. |
Schwab Target Index Funds | Semiannual Report
Schwab Target 2020 Index Fund
Portfolio Holdings as of September 30, 2022 (Unaudited)
This section shows all the securities in the fund’s portfolio and their values as of the report date, including a summary of the fund’s transactions with its affiliated underlying funds during the period.
The fund files its complete schedule of portfolio holdings with the U.S. Securities and Exchange Commission (SEC) for the first and third quarters of each fiscal year on Form N-PORT Part F. The fund’s Form N-PORT Part F is available on the SEC’s website at www.sec.gov. You can also obtain this information at no cost on the fund’s website at www.schwabassetmanagement.com/schwabfunds_prospectus, by calling 1-866-414-6349, or by sending an email request to orders@mysummaryprospectus.com.The fund also makes available its complete schedule of portfolio holdings 15 to 20 days after the end of the month on the fund’s website.
| SECURITY | VALUE AT
3/31/22 | PURCHASES | SALES | REALIZED
GAINS (LOSSES) | NET CHANGE IN
UNREALIZED
APPRECIATION
(DEPRECIATION) | VALUE AT
9/30/22 | BALANCE
OF SHARES
HELD AT
9/30/22 | DISTRIBUTIONS
RECEIVED(a) |
| AFFILIATED UNDERLYING FUNDS 99.5% OF NET ASSETS |
| |
| U.S. Stocks 28.0% |
| Large-Cap 26.3% |
| Schwab U.S. Large-Cap ETF | $76,467,377 | $8,664,161 | ($5,932,400) | ($560,291) | ($15,841,208) | $62,797,639 | 1,482,825 | $548,046 |
| Small-Cap 1.7% |
| Schwab U.S. Small-Cap ETF | 5,051,749 | 242,255 | (248,445) | (21,385) | (988,986) | 4,035,188 | 106,751 | 30,563 |
| | | | | | | 66,832,827 | | |
| |
| International Stocks 11.7% |
| Developed Markets 11.7% |
| Schwab International Equity ETF | 33,920,614 | 3,536,706 | (1,437,259) | (210,898) | (7,842,430) | 27,966,733 | 994,196 | 251,855 |
| |
| Real Estate 3.0% |
| U.S. REITs 3.0% |
| Schwab U.S. REIT ETF | 8,710,604 | 945,563 | (310,864) | (11,782) | (2,161,906) | 7,171,615 | 383,714 | 102,160 |
| |
| Fixed Income 53.3% |
| Inflation-Protected Bond 5.7% |
| Schwab U.S. TIPS ETF | 16,230,636 | 339,088 | (600,865) | (31,698) | (2,322,826) | 13,614,335 | 262,825 | 633,976 |
| Intermediate-Term Bond 40.0% |
| Schwab U.S. Aggregate Bond ETF | 113,876,864 | 4,652,147 | (11,421,818) | (1,593,172) | (10,032,892) | 95,481,129 | 2,107,286 | 1,280,685 |
| Treasury Bond 7.6% |
| Schwab Short-Term U.S. Treasury ETF | 21,563,722 | 907,285 | (3,684,679) | (169,068) | (348,003) | 18,269,257 | 378,559 | 104,154 |
| | | | | | | 127,364,721 | | |
| |
| Money Market Funds 3.5% |
| Schwab Variable Share Price Money Fund, Ultra Shares, 3.01% (b) | 8,381,809 | 49,402 | — | — | 2,526 | 8,433,737 | 8,431,208 | 59,953 |
Total Affiliated Underlying Funds
(Cost $244,430,918) | $284,203,375 | $19,336,607 | ($23,636,330) | ($2,598,294) | ($39,535,725) | $237,769,633 | | $3,011,392 |
Total Investments in Securities
(Cost $244,430,918) | | | | | | $237,769,633 | | |
| (a) | Distributions received include distributions from net investment income and capital gains, if any, from the underlying funds. Amounts shown are only presented for affiliated underlying funds, which are presented in the corresponding line-item in the Statement of Operations, if applicable (See financial note 2(d) for additional information). |
| (b) | The rate shown is the 7-day yield. |
| ETF — | Exchange traded fund |
| REIT — | Real Estate Investment Trust |
| TIPS — | Treasury Inflation Protected Securities |
At September 30, 2022, all of the fund’s investment securities were classified as Level 1. Fund investments in mutual funds and ETFs are classified as Level 1, without consideration to the classification level of the underlying securities held by the mutual funds and ETFs, which could be Level 1, Level 2 or Level 3. (See financial note 2(a) for additional information).
Schwab Target Index Funds | Semiannual Report
Schwab Target 2020 Index Fund
Statement of Assets and Liabilities
As of September 30, 2022; unaudited
| Assets |
| Investments in securities, at value - affiliated (cost $244,430,918) | | $237,769,633 |
| Cash | | 802,597 |
| Receivables: | | |
| Investments sold | | 1,994,474 |
| Fund shares sold | | 538,327 |
| Dividends | + | 11,144 |
| Total assets | | 241,116,175 |
| Liabilities |
| Payables: | | |
| Investments bought | | 2,001,475 |
| Fund shares redeemed | | 100,990 |
| Investment adviser fees | + | 8,462 |
| Total liabilities | | 2,110,927 |
| Net assets | | $239,005,248 |
| Net Assets by Source |
| Capital received from investors | | $246,259,029 |
| Total distributable loss | + | (7,253,781) |
| Net assets | | $239,005,248 |
| Net Asset Value (NAV) |
| Net Assets | ÷ | Shares
Outstanding | = | NAV |
| $239,005,248 | | 21,317,155 | | $11.21 |
| | | | | |
| | | | | |
Schwab Target Index Funds | Semiannual Report
Schwab Target 2020 Index Fund
Statement of Operations
| For the period April 1, 2022 through September 30, 2022; unaudited |
| Investment Income |
| Dividends received from securities - affiliated | | $3,011,392 |
| Interest received from securities - unaffiliated | + | 4,626 |
| Total investment income | | 3,016,018 |
| Expenses |
| Investment adviser fees | | 107,138 |
| Proxy fees1 | + | 12,033 |
| Total expenses | | 119,171 |
| Expense reduction | – | 58,626 |
| Net expenses | – | 60,545 |
| Net investment income | | 2,955,473 |
| REALIZED AND UNREALIZED GAINS (LOSSES) |
| Net realized losses on sales of securities - affiliated | | (2,598,294) |
| Net change in unrealized appreciation (depreciation) on securities - affiliated | + | (39,535,725) |
| Net realized and unrealized losses | | (42,134,019) |
| Decrease in net assets resulting from operations | | ($39,178,546) |
| 1 | Proxy fees are non-routine expenses (see financial note 2(e) for additional information). |
Schwab Target Index Funds | Semiannual Report
Schwab Target 2020 Index Fund
Statement of Changes in Net Assets
For the current and prior report periods
Figures for the current period are unaudited
| OPERATIONS |
| | 4/1/22-9/30/22 | 4/1/21-3/31/22 |
| Net investment income | | $2,955,473 | $5,743,217 |
| Net realized gains (losses) | | (2,598,294) | 1,175,272 |
| Net change in unrealized appreciation (depreciation) | + | (39,535,725) | (1,060,431) |
| Increase (decrease) in net assets resulting from operations | | ($39,178,546) | $5,858,058 |
| DISTRIBUTIONS TO SHAREHOLDERS |
| Total distributions | | $— | ($7,308,160) |
| TRANSACTIONS IN FUND SHARES |
| | 4/1/22-9/30/22 | 4/1/21-3/31/22 |
| | | SHARES | VALUE | SHARES | VALUE |
| Shares sold | | 1,905,214 | $23,442,584 | 6,413,180 | $86,878,636 |
| Shares reinvested | | — | — | 504,832 | 6,906,111 |
| Shares redeemed | + | (2,619,860) | (31,909,106) | (6,165,206) | (83,362,548) |
| Net transactions in fund shares | | (714,646) | ($8,466,522) | 752,806 | $10,422,199 |
| SHARES OUTSTANDING AND NET ASSETS |
| | 4/1/22-9/30/22 | 4/1/21-3/31/22 |
| | | SHARES | NET ASSETS | SHARES | NET ASSETS |
| Beginning of period | | 22,031,801 | $286,650,316 | 21,278,995 | $277,678,219 |
| Total increase (decrease) | + | (714,646) | (47,645,068) | 752,806 | 8,972,097 |
| End of period | | 21,317,155 | $239,005,248 | 22,031,801 | $286,650,316 |
Schwab Target Index Funds | Semiannual Report
Schwab Target 2025 Index Fund
Financial Statements
FINANCIAL HIGHLIGHTS
| | 4/1/22–
9/30/22* | 4/1/21–
3/31/22 | 4/1/20–
3/31/21 | 4/1/19–
3/31/20 | 4/1/18–
3/31/19 | 4/1/17–
3/31/181 |
| Per-Share Data |
| Net asset value at beginning of period | $13.98 | $13.83 | $10.92 | $11.46 | $11.18 | $10.40 |
| Income (loss) from investment operations: | | | | | | |
| Net investment income (loss)2 | 0.13 | 0.27 | 0.25 | 0.30 | 0.28 | 0.25 |
| Net realized and unrealized gains (losses) | (2.27) | 0.16 | 2.90 | (0.61) | 0.23 | 0.68 |
| Total from investment operations | (2.14) | 0.43 | 3.15 | (0.31) | 0.51 | 0.93 |
| Less distributions: | | | | | | |
| Distributions from net investment income | — | (0.26) | (0.23) | (0.23) | (0.23) | (0.15) |
| Distributions from net realized gains | — | (0.02) | (0.01) | (0.00) 3 | (0.00) 3 | (0.00) 3 |
| Total distributions | — | (0.28) | (0.24) | (0.23) | (0.23) | (0.15) |
| Net asset value at end of period | $11.84 | $13.98 | $13.83 | $10.92 | $11.46 | $11.18 |
| Total return | (15.31%) 4 | 3.02% | 28.91% | (2.89%) | 4.79% | 8.93% |
| Ratios/Supplemental Data |
| Ratios to average net assets: | | | | | | |
| Net operating expenses5 | 0.04% 6,7 | 0.04% | 0.04% | 0.03% | 0.03% | 0.04% |
| Gross operating expenses5 | 0.08% 6,7 | 0.08% | 0.08% | 0.08% | 0.08% | 0.08% |
| Net investment income (loss) | 2.02% 6 | 1.90% | 1.90% | 2.50% | 2.46% | 2.22% |
| Portfolio turnover rate | 6% 4 | 12% | 15% | 19% | 13% | 14% |
| Net assets, end of period (x 1,000) | $437,977 | $518,480 | $443,433 | $264,880 | $154,328 | $84,235 |
| * | Unaudited. |
| 1 | Effective July 24, 2017, the Investor Shares and Institutional Shares share classes were combined into a single class of shares of the fund. The financial history as shown in the financial highlights is that of the former Institutional Shares. |
| 2 | Calculated based on the average shares outstanding during the period. |
| 3 | Per-share amount was less than $0.005. |
| 4 | Not annualized. |
| 5 | Ratio excludes acquired fund fees and expenses, which are indirect expenses incurred by the fund through its investments in underlying funds. If the expenses incurred by the underlying funds were included in these ratios they would have increased by 0.04% (annualized), 0.04%, 0.04%, 0.05%, 0.05% and 0.04%, respectively, for the periods ended September 30, 2022, March 31, 2022 March 31, 2021, March 31, 2020, March 31, 2019 and March 31, 2018 (see financial note 4). |
| 6 | Annualized (except for proxy expenses). |
| 7 | Ratio includes less than 0.005% of non-routine proxy expenses. |
Schwab Target Index Funds | Semiannual Report
Schwab Target 2025 Index Fund
Portfolio Holdings as of September 30, 2022 (Unaudited)
This section shows all the securities in the fund’s portfolio and their values as of the report date, including a summary of the fund’s transactions with its affiliated underlying funds during the period.
The fund files its complete schedule of portfolio holdings with the U.S. Securities and Exchange Commission (SEC) for the first and third quarters of each fiscal year on Form N-PORT Part F. The fund’s Form N-PORT Part F is available on the SEC’s website at www.sec.gov. You can also obtain this information at no cost on the fund’s website at www.schwabassetmanagement.com/schwabfunds_prospectus, by calling 1-866-414-6349, or by sending an email request to orders@mysummaryprospectus.com.The fund also makes available its complete schedule of portfolio holdings 15 to 20 days after the end of the month on the fund’s website.
| SECURITY | VALUE AT
3/31/22 | PURCHASES | SALES | REALIZED
GAINS (LOSSES) | NET CHANGE IN
UNREALIZED
APPRECIATION
(DEPRECIATION) | VALUE AT
9/30/22 | BALANCE
OF SHARES
HELD AT
9/30/22 | DISTRIBUTIONS
RECEIVED(a) |
| AFFILIATED UNDERLYING FUNDS 99.2% OF NET ASSETS |
| |
| U.S. Stocks 33.5% |
| Large-Cap 31.2% |
| Schwab U.S. Large-Cap ETF | $163,687,953 | $13,360,081 | ($5,011,848) | ($505,996) | ($35,004,971) | $136,525,219 | 3,223,736 | $1,186,558 |
| Small-Cap 2.3% |
| Schwab U.S. Small-Cap ETF | 11,945,328 | 857,177 | (257,579) | (42,606) | (2,390,366) | 10,111,954 | 267,512 | 73,194 |
| | | | | | | 146,637,173 | | |
| |
| International Stocks 15.8% |
| Developed Markets 14.2% |
| Schwab International Equity ETF | 73,865,915 | 7,101,247 | (1,224,350) | (283,770) | (17,455,571) | 62,003,471 | 2,204,176 | 554,085 |
| Emerging Markets 1.6% |
| Schwab Emerging Markets Equity ETF | 8,271,406 | 268,809 | — | — | (1,628,583) | 6,911,632 | 308,555 | 22,458 |
| | | | | | | 68,915,103 | | |
| |
| Real Estate 3.7% |
| U.S. REITs 3.7% |
| Schwab U.S. REIT ETF | 19,464,428 | 2,394,610 | (701,325) | (19,676) | (4,868,018) | 16,270,019 | 870,520 | 230,104 |
| |
| Fixed Income 44.0% |
| Inflation-Protected Bond 3.2% |
| Schwab U.S. TIPS ETF | 16,350,781 | 1,006,032 | (684,243) | (62,659) | (2,374,649) | 14,235,262 | 274,812 | 648,706 |
| Intermediate-Term Bond 35.7% |
| Schwab U.S. Aggregate Bond ETF | 182,965,092 | 6,435,452 | (14,371,337) | (2,024,906) | (16,804,374) | 156,199,927 | 3,447,361 | 2,062,898 |
| Treasury Bond 5.1% |
| Schwab Short-Term U.S. Treasury ETF | 25,836,299 | 918,276 | (3,893,730) | (187,309) | (448,986) | 22,224,550 | 460,517 | 126,012 |
| | | | | | | 192,659,739 | | |
| |
| Money Market Funds 2.2% |
| Schwab Variable Share Price Money Fund, Ultra Shares, 3.01% (b) | 9,721,920 | 57,301 | — | — | 2,929 | 9,782,150 | 9,779,216 | 69,538 |
Total Affiliated Underlying Funds
(Cost $450,635,607) | $512,109,122 | $32,398,985 | ($26,144,412) | ($3,126,922) | ($80,972,589) | $434,264,184 | | $4,973,553 |
Total Investments in Securities
(Cost $450,635,607) | | | | | | $434,264,184 | | |
| (a) | Distributions received include distributions from net investment income and capital gains, if any, from the underlying funds. Amounts shown are only presented for affiliated underlying funds, which are presented in the corresponding line-item in the Statement of Operations, if applicable (See financial note 2(d) for additional information). |
| (b) | The rate shown is the 7-day yield. |
| ETF — | Exchange traded fund |
| REIT — | Real Estate Investment Trust |
| TIPS — | Treasury Inflation Protected Securities |
Schwab Target Index Funds | Semiannual Report
Schwab Target 2025 Index Fund
Portfolio Holdings as of September 30, 2022 (Unaudited) (continued)
At September 30, 2022, all of the fund’s investment securities were classified as Level 1. Fund investments in mutual funds and ETFs are classified as Level 1, without consideration to the classification level of the underlying securities held by the mutual funds and ETFs, which could be Level 1, Level 2 or Level 3. (See financial note 2(a) for additional information).
Schwab Target Index Funds | Semiannual Report
Schwab Target 2025 Index Fund
Statement of Assets and Liabilities
As of September 30, 2022; unaudited
| Assets |
| Investments in securities, at value - affiliated (cost $450,635,607) | | $434,264,184 |
| Cash | | 4,426,928 |
| Receivables: | | |
| Investments sold | | 3,842,840 |
| Fund shares sold | | 562,233 |
| Dividends | + | 12,926 |
| Total assets | | 443,109,111 |
| Liabilities |
| Payables: | | |
| Investments bought | | 4,401,465 |
| Fund shares redeemed | | 715,415 |
| Investment adviser fees | + | 15,444 |
| Total liabilities | | 5,132,324 |
| Net assets | | $437,976,787 |
| Net Assets by Source |
| Capital received from investors | | $456,362,498 |
| Total distributable loss | + | (18,385,711) |
| Net assets | | $437,976,787 |
| Net Asset Value (NAV) |
| Net Assets | ÷ | Shares
Outstanding | = | NAV |
| $437,976,787 | | 36,976,429 | | $11.84 |
| | | | | |
| | | | | |
Schwab Target Index Funds | Semiannual Report
Schwab Target 2025 Index Fund
Statement of Operations
| For the period April 1, 2022 through September 30, 2022; unaudited |
| Investment Income |
| Dividends received from securities - affiliated | | $4,973,553 |
| Interest received from securities - unaffiliated | + | 18,213 |
| Total investment income | | 4,991,766 |
| Expenses |
| Investment adviser fees | | 194,435 |
| Proxy fees1 | + | 21,697 |
| Total expenses | | 216,132 |
| Expense reduction | – | 105,609 |
| Net expenses | – | 110,523 |
| Net investment income | | 4,881,243 |
| REALIZED AND UNREALIZED GAINS (LOSSES) |
| Net realized losses on sales of securities - affiliated | | (3,126,922) |
| Net change in unrealized appreciation (depreciation) on securities - affiliated | + | (80,972,589) |
| Net realized and unrealized losses | | (84,099,511) |
| Decrease in net assets resulting from operations | | ($79,218,268) |
| 1 | Proxy fees are non-routine expenses (see financial note 2(e) for additional information). |
Schwab Target Index Funds | Semiannual Report
Schwab Target 2025 Index Fund
Statement of Changes in Net Assets
For the current and prior report periods
Figures for the current period are unaudited
| OPERATIONS |
| | 4/1/22-9/30/22 | 4/1/21-3/31/22 |
| Net investment income | | $4,881,243 | $9,652,859 |
| Net realized losses | | (3,126,922) | (815,809) |
| Net change in unrealized appreciation (depreciation) | + | (80,972,589) | 3,521,986 |
| Increase (decrease) in net assets resulting from operations | | ($79,218,268) | $12,359,036 |
| DISTRIBUTIONS TO SHAREHOLDERS |
| Total distributions | | $— | ($10,216,730) |
| TRANSACTIONS IN FUND SHARES |
| | 4/1/22-9/30/22 | 4/1/21-3/31/22 |
| | | SHARES | VALUE | SHARES | VALUE |
| Shares sold | | 4,419,407 | $57,583,284 | 12,707,739 | $183,306,333 |
| Shares reinvested | | — | — | 668,095 | 9,841,042 |
| Shares redeemed | + | (4,542,849) | (58,868,683) | (8,345,429) | (120,242,319) |
| Net transactions in fund shares | | (123,442) | ($1,285,399) | 5,030,405 | $72,905,056 |
| SHARES OUTSTANDING AND NET ASSETS |
| | 4/1/22-9/30/22 | 4/1/21-3/31/22 |
| | | SHARES | NET ASSETS | SHARES | NET ASSETS |
| Beginning of period | | 37,099,871 | $518,480,454 | 32,069,466 | $443,433,092 |
| Total increase (decrease) | + | (123,442) | (80,503,667) | 5,030,405 | 75,047,362 |
| End of period | | 36,976,429 | $437,976,787 | 37,099,871 | $518,480,454 |
Schwab Target Index Funds | Semiannual Report
Schwab Target 2030 Index Fund
Financial Statements
FINANCIAL HIGHLIGHTS
| | 4/1/22–
9/30/22* | 4/1/21–
3/31/22 | 4/1/20–
3/31/21 | 4/1/19–
3/31/20 | 4/1/18–
3/31/19 | 4/1/17–
3/31/181 |
| Per-Share Data |
| Net asset value at beginning of period | $14.73 | $14.41 | $10.86 | $11.65 | $11.37 | $10.46 |
| Income (loss) from investment operations: | | | | | | |
| Net investment income (loss)2 | 0.12 | 0.29 | 0.26 | 0.31 | 0.28 | 0.26 |
| Net realized and unrealized gains (losses) | (2.60) | 0.32 | 3.53 | (0.86) | 0.24 | 0.80 |
| Total from investment operations | (2.48) | 0.61 | 3.79 | (0.55) | 0.52 | 1.06 |
| Less distributions: | | | | | | |
| Distributions from net investment income | — | (0.27) | (0.24) | (0.24) | (0.24) | (0.15) |
| Distributions from net realized gains | — | (0.02) | (0.00) 3 | (0.00) 3 | — | (0.00) 3 |
| Total distributions | — | (0.29) | (0.24) | (0.24) | (0.24) | (0.15) |
| Net asset value at end of period | $12.25 | $14.73 | $14.41 | $10.86 | $11.65 | $11.37 |
| Total return | (16.90%) 4 | 4.11% | 34.98% | (4.99%) | 4.76% | 10.12% |
| Ratios/Supplemental Data |
| Ratios to average net assets: | | | | | | |
| Net operating expenses5 | 0.04% 6,7 | 0.04% | 0.04% | 0.03% | 0.03% | 0.04% |
| Gross operating expenses5 | 0.08% 6,7 | 0.08% | 0.08% | 0.08% | 0.08% | 0.08% |
| Net investment income (loss) | 1.83% 6 | 1.88% | 1.94% | 2.53% | 2.46% | 2.30% |
| Portfolio turnover rate | 4% 4 | 9% | 13% | 13% | 8% | 8% |
| Net assets, end of period (x 1,000) | $693,958 | $802,660 | $622,076 | $352,969 | $201,250 | $109,554 |
| * | Unaudited. |
| 1 | Effective July 24, 2017, the Investor Shares and Institutional Shares share classes were combined into a single class of shares of the fund. The financial history as shown in the financial highlights is that of the former Institutional Shares. |
| 2 | Calculated based on the average shares outstanding during the period. |
| 3 | Per-share amount was less than $0.005. |
| 4 | Not annualized. |
| 5 | Ratio excludes acquired fund fees and expenses, which are indirect expenses incurred by the fund through its investments in underlying funds. If the expenses incurred by the underlying funds were included in these ratios they would have increased by 0.04% (annualized), 0.04%, 0.04%, 0.05%, 0.05% and 0.04%, respectively, for the periods ended September 30, 2022, March 31, 2022 March 31, 2021, March 31, 2020, March 31, 2019 and March 31, 2018 (see financial note 4). |
| 6 | Annualized (except for proxy expenses). |
| 7 | Ratio includes less than 0.005% of non-routine proxy expenses. |
Schwab Target Index Funds | Semiannual Report
Schwab Target 2030 Index Fund
Portfolio Holdings as of September 30, 2022 (Unaudited)
This section shows all the securities in the fund’s portfolio and their values as of the report date, including a summary of the fund’s transactions with its affiliated underlying funds during the period.
The fund files its complete schedule of portfolio holdings with the U.S. Securities and Exchange Commission (SEC) for the first and third quarters of each fiscal year on Form N-PORT Part F. The fund’s Form N-PORT Part F is available on the SEC’s website at www.sec.gov. You can also obtain this information at no cost on the fund’s website at www.schwabassetmanagement.com/schwabfunds_prospectus, by calling 1-866-414-6349, or by sending an email request to orders@mysummaryprospectus.com.The fund also makes available its complete schedule of portfolio holdings 15 to 20 days after the end of the month on the fund’s website.
| SECURITY | VALUE AT
3/31/22 | PURCHASES | SALES | REALIZED
GAINS (LOSSES) | NET CHANGE IN
UNREALIZED
APPRECIATION
(DEPRECIATION) | VALUE AT
9/30/22 | BALANCE
OF SHARES
HELD AT
9/30/22 | DISTRIBUTIONS
RECEIVED(a) |
| AFFILIATED UNDERLYING FUNDS 98.9% OF NET ASSETS |
| |
| U.S. Stocks 40.4% |
| Large-Cap 37.3% |
| Schwab U.S. Large-Cap ETF | $302,984,548 | $29,767,382 | ($7,232,189) | ($740,082) | ($65,863,871) | $258,915,788 | 6,113,714 | $2,247,058 |
| Small-Cap 3.1% |
| Schwab U.S. Small-Cap ETF | 25,427,584 | 1,797,772 | (559,811) | (124,322) | (5,034,497) | 21,506,726 | 568,961 | 155,260 |
| | | | | | | 280,422,514 | | |
| |
| International Stocks 20.2% |
| Developed Markets 17.5% |
| Schwab International Equity ETF | 140,388,014 | 15,324,337 | — | — | (34,515,821) | 121,196,530 | 4,308,444 | 1,072,442 |
| Emerging Markets 2.7% |
| Schwab Emerging Markets Equity ETF | 21,806,504 | 2,358,518 | (575,580) | (135,634) | (4,333,706) | 19,120,102 | 853,576 | 61,128 |
| | | | | | | 140,316,632 | | |
| |
| Real Estate 4.6% |
| U.S. REITs 4.6% |
| Schwab U.S. REIT ETF | 37,140,858 | 4,815,621 | (826,544) | (9,572) | (9,406,125) | 31,714,238 | 1,696,856 | 448,661 |
| |
| Fixed Income 32.4% |
| Inflation-Protected Bond 0.9% |
| Schwab U.S. TIPS ETF | 7,546,800 | 459,172 | (403,704) | (52,726) | (1,084,280) | 6,465,262 | 124,812 | 308,341 |
| Intermediate-Term Bond 28.8% |
| Schwab U.S. Aggregate Bond ETF | 227,772,539 | 14,144,377 | (18,063,497) | (2,680,226) | (21,346,804) | 199,826,389 | 4,410,205 | 2,612,150 |
| Treasury Bond 2.7% |
| Schwab Short-Term U.S. Treasury ETF | 20,673,488 | 1,049,197 | (2,836,436) | (135,602) | (387,621) | 18,363,026 | 380,502 | 102,842 |
| | | | | | | 224,654,677 | | |
| |
| Money Market Funds 1.3% |
| Schwab Variable Share Price Money Fund, Ultra Shares, 3.01% (b) | 8,989,620 | 52,985 | — | — | 2,709 | 9,045,314 | 9,042,601 | 64,300 |
Total Affiliated Underlying Funds
(Cost $724,194,437) | $792,729,955 | $69,769,361 | ($30,497,761) | ($3,878,164) | ($141,970,016) | $686,153,375 | | $7,072,182 |
Total Investments in Securities
(Cost $724,194,437) | | | | | | $686,153,375 | | |
| (a) | Distributions received include distributions from net investment income and capital gains, if any, from the underlying funds. Amounts shown are only presented for affiliated underlying funds, which are presented in the corresponding line-item in the Statement of Operations, if applicable (See financial note 2(d) for additional information). |
| (b) | The rate shown is the 7-day yield. |
| ETF — | Exchange traded fund |
| REIT — | Real Estate Investment Trust |
| TIPS — | Treasury Inflation Protected Securities |
Schwab Target Index Funds | Semiannual Report
Schwab Target 2030 Index Fund
Portfolio Holdings as of September 30, 2022 (Unaudited) (continued)
At September 30, 2022, all of the fund’s investment securities were classified as Level 1. Fund investments in mutual funds and ETFs are classified as Level 1, without consideration to the classification level of the underlying securities held by the mutual funds and ETFs, which could be Level 1, Level 2 or Level 3. (See financial note 2(a) for additional information).
Schwab Target Index Funds | Semiannual Report
Schwab Target 2030 Index Fund
Statement of Assets and Liabilities
As of September 30, 2022; unaudited
| Assets |
| Investments in securities, at value - affiliated (cost $724,194,437) | | $686,153,375 |
| Cash | | 6,779,095 |
| Receivables: | | |
| Investments sold | | 6,922,834 |
| Fund shares sold | | 566,716 |
| Dividends | + | 11,952 |
| Total assets | | 700,433,972 |
| Liabilities |
| Payables: | | |
| Investments bought | | 5,896,253 |
| Fund shares redeemed | | 554,834 |
| Investment adviser fees | + | 24,652 |
| Total liabilities | | 6,475,739 |
| Net assets | | $693,958,233 |
| Net Assets by Source |
| Capital received from investors | | $733,288,571 |
| Total distributable loss | + | (39,330,338) |
| Net assets | | $693,958,233 |
| Net Asset Value (NAV) |
| Net Assets | ÷ | Shares
Outstanding | = | NAV |
| $693,958,233 | | 56,672,513 | | $12.25 |
| | | | | |
| | | | | |
Schwab Target Index Funds | Semiannual Report
Schwab Target 2030 Index Fund
Statement of Operations
| For the period April 1, 2022 through September 30, 2022; unaudited |
| Investment Income |
| Dividends received from securities - affiliated | | $7,072,182 |
| Interest received from securities - unaffiliated | + | 32,830 |
| Total investment income | | 7,105,012 |
| Expenses |
| Investment adviser fees | | 305,937 |
| Proxy fees1 | + | 27,098 |
| Total expenses | | 333,035 |
| Expense reduction | – | 166,315 |
| Net expenses | – | 166,720 |
| Net investment income | | 6,938,292 |
| REALIZED AND UNREALIZED GAINS (LOSSES) |
| Net realized losses on sales of securities - affiliated | | (3,878,164) |
| Net change in unrealized appreciation (depreciation) on securities - affiliated | + | (141,970,016) |
| Net realized and unrealized losses | | (145,848,180) |
| Decrease in net assets resulting from operations | | ($138,909,888) |
| 1 | Proxy fees are non-routine expenses (see financial note 2(e) for additional information). |
Schwab Target Index Funds | Semiannual Report
Schwab Target 2030 Index Fund
Statement of Changes in Net Assets
For the current and prior report periods
Figures for the current period are unaudited
| OPERATIONS |
| | 4/1/22-9/30/22 | 4/1/21-3/31/22 |
| Net investment income | | $6,938,292 | $14,059,833 |
| Net realized losses | | (3,878,164) | (1,211,263) |
| Net change in unrealized appreciation (depreciation) | + | (141,970,016) | 10,805,772 |
| Increase (decrease) in net assets resulting from operations | | ($138,909,888) | $23,654,342 |
| DISTRIBUTIONS TO SHAREHOLDERS |
| Total distributions | | $— | ($14,691,831) |
| TRANSACTIONS IN FUND SHARES |
| | 4/1/22-9/30/22 | 4/1/21-3/31/22 |
| | | SHARES | VALUE | SHARES | VALUE |
| Shares sold | | 6,696,595 | $91,242,073 | 19,317,474 | $292,518,601 |
| Shares reinvested | | — | — | 916,429 | 14,250,471 |
| Shares redeemed | + | (4,519,926) | (61,034,239) | (8,912,051) | (135,147,065) |
| Net transactions in fund shares | | 2,176,669 | $30,207,834 | 11,321,852 | $171,622,007 |
| SHARES OUTSTANDING AND NET ASSETS |
| | 4/1/22-9/30/22 | 4/1/21-3/31/22 |
| | | SHARES | NET ASSETS | SHARES | NET ASSETS |
| Beginning of period | | 54,495,844 | $802,660,287 | 43,173,992 | $622,075,769 |
| Total increase (decrease) | + | 2,176,669 | (108,702,054) | 11,321,852 | 180,584,518 |
| End of period | | 56,672,513 | $693,958,233 | 54,495,844 | $802,660,287 |
Schwab Target Index Funds | Semiannual Report
Schwab Target 2035 Index Fund
Financial Statements
FINANCIAL HIGHLIGHTS
| | 4/1/22–
9/30/22* | 4/1/21–
3/31/22 | 4/1/20–
3/31/21 | 4/1/19–
3/31/20 | 4/1/18–
3/31/19 | 4/1/17–
3/31/181 |
| Per-Share Data |
| Net asset value at beginning of period | $15.31 | $14.86 | $10.81 | $11.82 | $11.53 | $10.54 |
| Income (loss) from investment operations: | | | | | | |
| Net investment income (loss)2 | 0.12 | 0.30 | 0.26 | 0.31 | 0.29 | 0.26 |
| Net realized and unrealized gains (losses) | (2.88) | 0.44 | 4.04 | (1.06) | 0.22 | 0.90 |
| Total from investment operations | (2.76) | 0.74 | 4.30 | (0.75) | 0.51 | 1.16 |
| Less distributions: | | | | | | |
| Distributions from net investment income | — | (0.28) | (0.24) | (0.26) | (0.22) | (0.17) |
| Distributions from net realized gains | — | (0.01) | (0.01) | (0.00) 3 | (0.00) 3 | (0.00) 3 |
| Total distributions | — | (0.29) | (0.25) | (0.26) | (0.22) | (0.17) |
| Net asset value at end of period | $12.55 | $15.31 | $14.86 | $10.81 | $11.82 | $11.53 |
| Total return | (18.03%) 4 | 4.88% | 39.84% | (6.72%) | 4.68% | 10.96% |
| Ratios/Supplemental Data |
| Ratios to average net assets: | | | | | | |
| Net operating expenses5 | 0.04% 6,7 | 0.04% | 0.04% | 0.03% | 0.03% | 0.04% |
| Gross operating expenses5 | 0.08% 6,7 | 0.08% | 0.08% | 0.08% | 0.08% | 0.08% |
| Net investment income (loss) | 1.72% 6 | 1.88% | 1.93% | 2.53% | 2.49% | 2.29% |
| Portfolio turnover rate | 4% 4 | 12% | 12% | 12% | 6% | 14% |
| Net assets, end of period (x 1,000) | $428,974 | $488,322 | $372,100 | $196,194 | $126,200 | $62,526 |
| * | Unaudited. |
| 1 | Effective July 24, 2017, the Investor Shares and Institutional Shares share classes were combined into a single class of shares of the fund. The financial history as shown in the financial highlights is that of the former Institutional Shares. |
| 2 | Calculated based on the average shares outstanding during the period. |
| 3 | Per-share amount was less than $0.005. |
| 4 | Not annualized. |
| 5 | Ratio excludes acquired fund fees and expenses, which are indirect expenses incurred by the fund through its investments in underlying funds. If the expenses incurred by the underlying funds were included in these ratios they would have increased by 0.04% (annualized), 0.04%, 0.04%, 0.05%, 0.05% and 0.04%, respectively, for the periods ended September 30, 2022, March 31, 2022 March 31, 2021, March 31, 2020, March 31, 2019 and March 31, 2018 (see financial note 4). |
| 6 | Annualized (except for proxy expenses). |
| 7 | Ratio includes less than 0.005% of non-routine proxy expenses. |
Schwab Target Index Funds | Semiannual Report
Schwab Target 2035 Index Fund
Portfolio Holdings as of September 30, 2022 (Unaudited)
This section shows all the securities in the fund’s portfolio and their values as of the report date, including a summary of the fund’s transactions with its affiliated underlying funds during the period.
The fund files its complete schedule of portfolio holdings with the U.S. Securities and Exchange Commission (SEC) for the first and third quarters of each fiscal year on Form N-PORT Part F. The fund’s Form N-PORT Part F is available on the SEC’s website at www.sec.gov. You can also obtain this information at no cost on the fund’s website at www.schwabassetmanagement.com/schwabfunds_prospectus, by calling 1-866-414-6349, or by sending an email request to orders@mysummaryprospectus.com.The fund also makes available its complete schedule of portfolio holdings 15 to 20 days after the end of the month on the fund’s website.
| SECURITY | VALUE AT
3/31/22 | PURCHASES | SALES | REALIZED
GAINS (LOSSES) | NET CHANGE IN
UNREALIZED
APPRECIATION
(DEPRECIATION) | VALUE AT
9/30/22 | BALANCE
OF SHARES
HELD AT
9/30/22 | DISTRIBUTIONS
RECEIVED(a) |
| AFFILIATED UNDERLYING FUNDS 99.0% OF NET ASSETS |
| |
| U.S. Stocks 45.5% |
| Large-Cap 41.6% |
| Schwab U.S. Large-Cap ETF | $204,986,380 | $22,550,067 | ($3,964,561) | ($453,656) | ($45,010,985) | $178,107,245 | 4,205,602 | $1,539,819 |
| Small-Cap 3.9% |
| Schwab U.S. Small-Cap ETF | 19,168,060 | 2,056,197 | (443,680) | (87,804) | (3,886,251) | 16,806,522 | 444,617 | 121,244 |
| | | | | | | 194,913,767 | | |
| |
| International Stocks 23.7% |
| Developed Markets 19.9% |
| Schwab International Equity ETF | 97,393,925 | 12,760,236 | (632,685) | (139,067) | (23,988,787) | 85,393,622 | 3,035,678 | 740,283 |
| Emerging Markets 3.8% |
| Schwab Emerging Markets Equity ETF | 18,265,634 | 2,240,076 | (291,153) | (72,509) | (3,714,358) | 16,427,690 | 733,379 | 51,121 |
| | | | | | | 101,821,312 | | |
| |
| Real Estate 5.2% |
| U.S. REITs 5.2% |
| Schwab U.S. REIT ETF | 25,751,916 | 4,274,325 | (981,211) | (30,912) | (6,642,805) | 22,371,313 | 1,196,967 | 318,756 |
| |
| Fixed Income 23.8% |
| Intermediate-Term Bond 22.3% |
| Schwab U.S. Aggregate Bond ETF | 107,058,763 | 9,369,988 | (9,255,063) | (1,360,091) | (10,036,911) | 95,776,686 | 2,113,809 | 1,233,500 |
| Treasury Bond 1.5% |
| Schwab Short-Term U.S. Treasury ETF | 7,082,734 | 274,159 | (730,377) | (34,065) | (145,880) | 6,446,571 | 133,580 | 35,582 |
| | | | | | | 102,223,257 | | |
| |
| Money Market Funds 0.8% |
| Schwab Variable Share Price Money Fund, Ultra Shares, 3.01% (b) | 3,483,716 | 20,533 | — | — | 1,050 | 3,505,299 | 3,504,248 | 24,918 |
Total Affiliated Underlying Funds
(Cost $447,194,948) | $483,191,128 | $53,545,581 | ($16,298,730) | ($2,178,104) | ($93,424,927) | $424,834,948 | | $4,065,223 |
Total Investments in Securities
(Cost $447,194,948) | | | | | | $424,834,948 | | |
| (a) | Distributions received include distributions from net investment income and capital gains, if any, from the underlying funds. Amounts shown are only presented for affiliated underlying funds, which are presented in the corresponding line-item in the Statement of Operations, if applicable (See financial note 2(d) for additional information). |
| (b) | The rate shown is the 7-day yield. |
| ETF — | Exchange traded fund |
| REIT — | Real Estate Investment Trust |
At September 30, 2022, all of the fund’s investment securities were classified as Level 1. Fund investments in mutual funds and ETFs are classified as Level 1, without consideration to the classification level of the underlying securities held by the mutual funds and ETFs, which could be Level 1, Level 2 or Level 3. (See financial note 2(a) for additional information).
Schwab Target Index Funds | Semiannual Report
Schwab Target 2035 Index Fund
Statement of Assets and Liabilities
As of September 30, 2022; unaudited
| Assets |
| Investments in securities, at value - affiliated (cost $447,194,948) | | $424,834,948 |
| Cash | | 4,540,962 |
| Receivables: | | |
| Investments sold | | 2,810,098 |
| Fund shares sold | | 267,697 |
| Dividends | + | 4,632 |
| Total assets | | 432,458,337 |
| Liabilities |
| Payables: | | |
| Investments bought | | 3,324,006 |
| Fund shares redeemed | | 145,360 |
| Investment adviser fees | + | 14,579 |
| Total liabilities | | 3,483,945 |
| Net assets | | $428,974,392 |
| Net Assets by Source |
| Capital received from investors | | $452,037,001 |
| Total distributable loss | + | (23,062,609) |
| Net assets | | $428,974,392 |
| Net Asset Value (NAV) |
| Net Assets | ÷ | Shares
Outstanding | = | NAV |
| $428,974,392 | | 34,190,433 | | $12.55 |
| | | | | |
| | | | | |
Schwab Target Index Funds | Semiannual Report
Schwab Target 2035 Index Fund
Statement of Operations
| For the period April 1, 2022 through September 30, 2022; unaudited |
| Investment Income |
| Dividends received from securities - affiliated | | $4,065,223 |
| Interest received from securities - unaffiliated | + | 18,836 |
| Total investment income | | 4,084,059 |
| Expenses |
| Investment adviser fees | | 186,982 |
| Proxy fees1 | + | 20,649 |
| Total expenses | | 207,631 |
| Expense reduction | – | 103,382 |
| Net expenses | – | 104,249 |
| Net investment income | | 3,979,810 |
| REALIZED AND UNREALIZED GAINS (LOSSES) |
| Net realized losses on sales of securities - affiliated | | (2,178,104) |
| Net change in unrealized appreciation (depreciation) on securities - affiliated | + | (93,424,927) |
| Net realized and unrealized losses | | (95,603,031) |
| Decrease in net assets resulting from operations | | ($91,623,221) |
| 1 | Proxy fees are non-routine expenses (see financial note 2(e) for additional information). |
Schwab Target Index Funds | Semiannual Report
Schwab Target 2035 Index Fund
Statement of Changes in Net Assets
For the current and prior report periods
Figures for the current period are unaudited
| OPERATIONS |
| | 4/1/22-9/30/22 | 4/1/21-3/31/22 |
| Net investment income | | $3,979,810 | $8,458,833 |
| Net realized losses | | (2,178,104) | (1,301,727) |
| Net change in unrealized appreciation (depreciation) | + | (93,424,927) | 9,760,137 |
| Increase (decrease) in net assets resulting from operations | | ($91,623,221) | $16,917,243 |
| DISTRIBUTIONS TO SHAREHOLDERS |
| Total distributions | | $— | ($8,650,986) |
| TRANSACTIONS IN FUND SHARES |
| | 4/1/22-9/30/22 | 4/1/21-3/31/22 |
| | | SHARES | VALUE | SHARES | VALUE |
| Shares sold | | 4,785,427 | $66,952,822 | 11,814,431 | $185,357,149 |
| Shares reinvested | | — | — | 521,864 | 8,438,542 |
| Shares redeemed | + | (2,494,531) | (34,677,391) | (5,484,090) | (85,839,910) |
| Net transactions in fund shares | | 2,290,896 | $32,275,431 | 6,852,205 | $107,955,781 |
| SHARES OUTSTANDING AND NET ASSETS |
| | 4/1/22-9/30/22 | 4/1/21-3/31/22 |
| | | SHARES | NET ASSETS | SHARES | NET ASSETS |
| Beginning of period | | 31,899,537 | $488,322,182 | 25,047,332 | $372,100,144 |
| Total increase (decrease) | + | 2,290,896 | (59,347,790) | 6,852,205 | 116,222,038 |
| End of period | | 34,190,433 | $428,974,392 | 31,899,537 | $488,322,182 |
Schwab Target Index Funds | Semiannual Report
Schwab Target 2040 Index Fund
Financial Statements
FINANCIAL HIGHLIGHTS
| | 4/1/22–
9/30/22* | 4/1/21–
3/31/22 | 4/1/20–
3/31/21 | 4/1/19–
3/31/20 | 4/1/18–
3/31/19 | 4/1/17–
3/31/181 |
| Per-Share Data |
| Net asset value at beginning of period | $15.80 | $15.24 | $10.76 | $11.95 | $11.69 | $10.59 |
| Income (loss) from investment operations: | | | | | | |
| Net investment income (loss)2 | 0.12 | 0.31 | 0.26 | 0.32 | 0.29 | 0.27 |
| Net realized and unrealized gains (losses) | (3.12) | 0.55 | 4.48 | (1.26) | 0.21 | 1.00 |
| Total from investment operations | (3.00) | 0.86 | 4.74 | (0.94) | 0.50 | 1.27 |
| Less distributions: | | | | | | |
| Distributions from net investment income | — | (0.29) | (0.25) | (0.25) | (0.24) | (0.17) |
| Distributions from net realized gains | — | (0.01) | (0.01) | (0.00) 3 | — | (0.00) 3 |
| Total distributions | — | (0.30) | (0.26) | (0.25) | (0.24) | (0.17) |
| Net asset value at end of period | $12.80 | $15.80 | $15.24 | $10.76 | $11.95 | $11.69 |
| Total return | (18.99%) 4 | 5.53% | 44.07% | (8.20%) | 4.49% | 11.97% |
| Ratios/Supplemental Data |
| Ratios to average net assets: | | | | | | |
| Net operating expenses5 | 0.04% 6,7 | 0.04% | 0.04% | 0.03% | 0.03% | 0.04% |
| Gross operating expenses5 | 0.08% 6,7 | 0.08% | 0.08% | 0.08% | 0.08% | 0.08% |
| Net investment income (loss) | 1.67% 6 | 1.90% | 1.93% | 2.54% | 2.48% | 2.33% |
| Portfolio turnover rate | 2% 4 | 9% | 9% | 7% | 2% | 15% |
| Net assets, end of period (x 1,000) | $550,940 | $631,308 | $473,638 | $249,144 | $143,404 | $72,830 |
| * | Unaudited. |
| 1 | Effective July 24, 2017, the Investor Shares and Institutional Shares share classes were combined into a single class of shares of the fund. The financial history as shown in the financial highlights is that of the former Institutional Shares. |
| 2 | Calculated based on the average shares outstanding during the period. |
| 3 | Per-share amount was less than $0.005. |
| 4 | Not annualized. |
| 5 | Ratio excludes acquired fund fees and expenses, which are indirect expenses incurred by the fund through its investments in underlying funds. If the expenses incurred by the underlying funds were included in these ratios they would have increased by 0.04% (annualized), 0.04%, 0.04%, 0.05%, 0.05% and 0.04%, respectively, for the periods ended September 30, 2022, March 31, 2022 March 31, 2021, March 31, 2020, March 31, 2019 and March 31, 2018 (see financial note 4). |
| 6 | Annualized (except for proxy expenses). |
| 7 | Ratio includes less than 0.005% of non-routine proxy expenses. |
Schwab Target Index Funds | Semiannual Report
Schwab Target 2040 Index Fund
Portfolio Holdings as of September 30, 2022 (Unaudited)
This section shows all the securities in the fund’s portfolio and their values as of the report date, including a summary of the fund’s transactions with its affiliated underlying funds during the period.
The fund files its complete schedule of portfolio holdings with the U.S. Securities and Exchange Commission (SEC) for the first and third quarters of each fiscal year on Form N-PORT Part F. The fund’s Form N-PORT Part F is available on the SEC’s website at www.sec.gov. You can also obtain this information at no cost on the fund’s website at www.schwabassetmanagement.com/schwabfunds_prospectus, by calling 1-866-414-6349, or by sending an email request to orders@mysummaryprospectus.com.The fund also makes available its complete schedule of portfolio holdings 15 to 20 days after the end of the month on the fund’s website.
| SECURITY | VALUE AT
3/31/22 | PURCHASES | SALES | REALIZED
GAINS (LOSSES) | NET CHANGE IN
UNREALIZED
APPRECIATION
(DEPRECIATION) | VALUE AT
9/30/22 | BALANCE
OF SHARES
HELD AT
9/30/22 | DISTRIBUTIONS
RECEIVED(a) |
| AFFILIATED UNDERLYING FUNDS 99.1% OF NET ASSETS |
| |
| U.S. Stocks 49.4% |
| Large-Cap 44.7% |
| Schwab U.S. Large-Cap ETF | $284,637,314 | $30,206,641 | ($5,245,379) | ($719,569) | ($62,770,198) | $246,108,809 | 5,811,306 | $2,148,271 |
| Small-Cap 4.7% |
| Schwab U.S. Small-Cap ETF | 30,345,731 | 2,516,161 | (510,982) | (125,689) | (6,140,575) | 26,084,646 | 690,070 | 189,746 |
| | | | | | | 272,193,455 | | |
| |
| International Stocks 26.8% |
| Developed Markets 22.0% |
| Schwab International Equity ETF | 138,613,924 | 17,059,698 | — | — | (34,534,281) | 121,139,341 | 4,306,411 | 1,073,164 |
| Emerging Markets 4.8% |
| Schwab Emerging Markets Equity ETF | 29,883,269 | 3,278,274 | (535,709) | (137,936) | (6,011,882) | 26,476,016 | 1,181,965 | 84,164 |
| | | | | | | 147,615,357 | | |
| |
| Real Estate 5.8% |
| U.S. REITs 5.8% |
| Schwab U.S. REIT ETF | 36,835,284 | 5,160,410 | (831,339) | (24,069) | (9,487,743) | 31,652,543 | 1,693,555 | 453,358 |
| |
| Fixed Income 16.7% |
| Intermediate-Term Bond 15.8% |
| Schwab U.S. Aggregate Bond ETF | 97,678,281 | 6,353,450 | (6,535,706) | (994,868) | (9,392,818) | 87,108,339 | 1,922,497 | 1,134,189 |
| Treasury Bond 0.9% |
| Schwab Short-Term U.S. Treasury ETF | 5,288,494 | 767,916 | (839,108) | (40,316) | (103,605) | 5,073,381 | 105,126 | 28,293 |
| | | | | | | 92,181,720 | | |
| |
| Money Market Funds 0.4% |
| Schwab Variable Share Price Money Fund, Ultra Shares, 3.01% (b) | 2,364,319 | 13,936 | — | — | 712 | 2,378,967 | 2,378,253 | 16,911 |
Total Affiliated Underlying Funds
(Cost $576,622,928) | $625,646,616 | $65,356,486 | ($14,498,223) | ($2,042,447) | ($128,440,390) | $546,022,042 | | $5,128,096 |
Total Investments in Securities
(Cost $576,622,928) | | | | | | $546,022,042 | | |
| (a) | Distributions received include distributions from net investment income and capital gains, if any, from the underlying funds. Amounts shown are only presented for affiliated underlying funds, which are presented in the corresponding line-item in the Statement of Operations, if applicable (See financial note 2(d) for additional information). |
| (b) | The rate shown is the 7-day yield. |
| ETF — | Exchange traded fund |
| REIT — | Real Estate Investment Trust |
At September 30, 2022, all of the fund’s investment securities were classified as Level 1. Fund investments in mutual funds and ETFs are classified as Level 1, without consideration to the classification level of the underlying securities held by the mutual funds and ETFs, which could be Level 1, Level 2 or Level 3. (See financial note 2(a) for additional information).
Schwab Target Index Funds | Semiannual Report
Schwab Target 2040 Index Fund
Statement of Assets and Liabilities
As of September 30, 2022; unaudited
| Assets |
| Investments in securities, at value - affiliated (cost $576,622,928) | | $546,022,042 |
| Cash | | 5,750,868 |
| Receivables: | | |
| Investments sold | | 2,434,507 |
| Fund shares sold | | 490,894 |
| Dividends | + | 3,143 |
| Total assets | | 554,701,454 |
| Liabilities |
| Payables: | | |
| Investments bought | | 3,078,835 |
| Fund shares redeemed | | 664,317 |
| Investment adviser fees | + | 18,237 |
| Total liabilities | | 3,761,389 |
| Net assets | | $550,940,065 |
| Net Assets by Source |
| Capital received from investors | | $580,946,829 |
| Total distributable loss | + | (30,006,764) |
| Net assets | | $550,940,065 |
| Net Asset Value (NAV) |
| Net Assets | ÷ | Shares
Outstanding | = | NAV |
| $550,940,065 | | 43,057,620 | | $12.80 |
| | | | | |
| | | | | |
Schwab Target Index Funds | Semiannual Report
Schwab Target 2040 Index Fund
Statement of Operations
| For the period April 1, 2022 through September 30, 2022; unaudited |
| Investment Income |
| Dividends received from securities - affiliated | | $5,128,096 |
| Interest received from securities - unaffiliated | + | 21,076 |
| Total investment income | | 5,149,172 |
| Expenses |
| Investment adviser fees | | 242,906 |
| Proxy fees1 | + | 24,196 |
| Total expenses | | 267,102 |
| Expense reduction | – | 136,436 |
| Net expenses | – | 130,666 |
| Net investment income | | 5,018,506 |
| REALIZED AND UNREALIZED GAINS (LOSSES) |
| Net realized losses on sales of securities - affiliated | | (2,042,447) |
| Net change in unrealized appreciation (depreciation) on securities - affiliated | + | (128,440,390) |
| Net realized and unrealized losses | | (130,482,837) |
| Decrease in net assets resulting from operations | | ($125,464,331) |
| 1 | Proxy fees are non-routine expenses (see financial note 2(e) for additional information). |
Schwab Target Index Funds | Semiannual Report
Schwab Target 2040 Index Fund
Statement of Changes in Net Assets
For the current and prior report periods
Figures for the current period are unaudited
| OPERATIONS |
| | 4/1/22-9/30/22 | 4/1/21-3/31/22 |
| Net investment income | | $5,018,506 | $10,918,075 |
| Net realized losses | | (2,042,447) | (1,552,332) |
| Net change in unrealized appreciation (depreciation) | + | (128,440,390) | 15,572,075 |
| Increase (decrease) in net assets resulting from operations | | ($125,464,331) | $24,937,818 |
| DISTRIBUTIONS TO SHAREHOLDERS |
| Total distributions | | $— | ($11,102,382) |
| TRANSACTIONS IN FUND SHARES |
| | 4/1/22-9/30/22 | 4/1/21-3/31/22 |
| | | SHARES | VALUE | SHARES | VALUE |
| Shares sold | | 5,850,868 | $84,544,506 | 13,419,419 | $216,624,618 |
| Shares reinvested | | — | — | 652,842 | 10,895,926 |
| Shares redeemed | + | (2,760,364) | (39,448,322) | (5,187,654) | (83,686,188) |
| Net transactions in fund shares | | 3,090,504 | $45,096,184 | 8,884,607 | $143,834,356 |
| SHARES OUTSTANDING AND NET ASSETS |
| | 4/1/22-9/30/22 | 4/1/21-3/31/22 |
| | | SHARES | NET ASSETS | SHARES | NET ASSETS |
| Beginning of period | | 39,967,116 | $631,308,212 | 31,082,509 | $473,638,420 |
| Total increase (decrease) | + | 3,090,504 | (80,368,147) | 8,884,607 | 157,669,792 |
| End of period | | 43,057,620 | $550,940,065 | 39,967,116 | $631,308,212 |
Schwab Target Index Funds | Semiannual Report
Schwab Target 2045 Index Fund
Financial Statements
FINANCIAL HIGHLIGHTS
| | 4/1/22–
9/30/22* | 4/1/21–
3/31/22 | 4/1/20–
3/31/21 | 4/1/19–
3/31/20 | 4/1/18–
3/31/19 | 4/1/17–
3/31/181 |
| Per-Share Data |
| Net asset value at beginning of period | $16.23 | $15.57 | $10.68 | $12.05 | $11.81 | $10.64 |
| Income (loss) from investment operations: | | | | | | |
| Net investment income (loss)2 | 0.12 | 0.32 | 0.27 | 0.32 | 0.29 | 0.28 |
| Net realized and unrealized gains (losses) | (3.33) | 0.65 | 4.86 | (1.43) | 0.19 | 1.06 |
| Total from investment operations | (3.21) | 0.97 | 5.13 | (1.11) | 0.48 | 1.34 |
| Less distributions: | | | | | | |
| Distributions from net investment income | — | (0.30) | (0.24) | (0.26) | (0.24) | (0.17) |
| Distributions from net realized gains | — | (0.01) | (0.00) 3 | (0.00) 3 | (0.00) 3 | (0.00) 3 |
| Total distributions | — | (0.31) | (0.24) | (0.26) | (0.24) | (0.17) |
| Net asset value at end of period | $13.02 | $16.23 | $15.57 | $10.68 | $12.05 | $11.81 |
| Total return | (19.78%) 4 | 6.11% | 48.20% | (9.63%) | 4.33% | 12.57% |
| Ratios/Supplemental Data |
| Ratios to average net assets: | | | | | | |
| Net operating expenses5 | 0.04% 6,7 | 0.03% | 0.03% | 0.03% | 0.03% | 0.03% |
| Gross operating expenses5 | 0.08% 6,7 | 0.08% | 0.08% | 0.08% | 0.08% | 0.08% |
| Net investment income (loss) | 1.63% 6 | 1.92% | 1.93% | 2.54% | 2.43% | 2.39% |
| Portfolio turnover rate | 2% 4 | 10% | 6% | 6% | 7% | 11% |
| Net assets, end of period (x 1,000) | $327,207 | $361,870 | $274,502 | $135,960 | $84,790 | $44,817 |
| * | Unaudited. |
| 1 | Effective July 24, 2017, the Investor Shares and Institutional Shares share classes were combined into a single class of shares of the fund. The financial history as shown in the financial highlights is that of the former Institutional Shares. |
| 2 | Calculated based on the average shares outstanding during the period. |
| 3 | Per-share amount was less than $0.005. |
| 4 | Not annualized. |
| 5 | Ratio excludes acquired fund fees and expenses, which are indirect expenses incurred by the fund through its investments in underlying funds. If the expenses incurred by the underlying funds were included in these ratios they would have increased by 0.04% (annualized), 0.05%, 0.05%, 0.05%, 0.05% and 0.05%, respectively, for the periods ended September 30, 2022, March 31, 2022 March 31, 2021, March 31, 2020, March 31, 2019 and March 31, 2018 (see financial note 4). |
| 6 | Annualized (except for proxy expenses). |
| 7 | Ratio includes less than 0.005% of non-routine proxy expenses. |
Schwab Target Index Funds | Semiannual Report
Schwab Target 2045 Index Fund
Portfolio Holdings as of September 30, 2022 (Unaudited)
This section shows all the securities in the fund’s portfolio and their values as of the report date, including a summary of the fund’s transactions with its affiliated underlying funds during the period.
The fund files its complete schedule of portfolio holdings with the U.S. Securities and Exchange Commission (SEC) for the first and third quarters of each fiscal year on Form N-PORT Part F. The fund’s Form N-PORT Part F is available on the SEC’s website at www.sec.gov. You can also obtain this information at no cost on the fund’s website at www.schwabassetmanagement.com/schwabfunds_prospectus, by calling 1-866-414-6349, or by sending an email request to orders@mysummaryprospectus.com.The fund also makes available its complete schedule of portfolio holdings 15 to 20 days after the end of the month on the fund’s website.
| SECURITY | VALUE AT
3/31/22 | PURCHASES | SALES | REALIZED
GAINS (LOSSES) | NET CHANGE IN
UNREALIZED
APPRECIATION
(DEPRECIATION) | VALUE AT
9/30/22 | BALANCE
OF SHARES
HELD AT
9/30/22 | DISTRIBUTIONS
RECEIVED(a) |
| AFFILIATED UNDERLYING FUNDS 99.1% OF NET ASSETS |
| |
| U.S. Stocks 52.5% |
| Large-Cap 47.0% |
| Schwab U.S. Large-Cap ETF | $171,177,411 | $23,790,513 | ($2,307,285) | ($267,540) | ($38,817,558) | $153,575,541 | 3,626,341 | $1,324,279 |
| Small-Cap 5.5% |
| Schwab U.S. Small-Cap ETF | 20,291,676 | 2,312,512 | (200,612) | (55,563) | (4,243,438) | 18,104,575 | 478,957 | 129,285 |
| | | | | | | 171,680,116 | | |
| |
| International Stocks 29.5% |
| Developed Markets 23.7% |
| Schwab International Equity ETF | 85,296,778 | 14,018,140 | (196,125) | (35,259) | (21,668,874) | 77,414,660 | 2,752,032 | 667,916 |
| Emerging Markets 5.8% |
| Schwab Emerging Markets Equity ETF | 20,696,564 | 3,476,524 | (726,797) | (173,265) | (4,187,868) | 19,085,158 | 852,016 | 59,628 |
| | | | | | | 96,499,818 | | |
| |
| Real Estate 6.1% |
| U.S. REITs 6.1% |
| Schwab U.S. REIT ETF | 22,666,278 | 3,992,802 | (541,296) | (13,712) | (6,027,143) | 20,076,929 | 1,074,207 | 286,864 |
| |
| Fixed Income 11.0% |
| Intermediate-Term Bond 10.5% |
| Schwab U.S. Aggregate Bond ETF | 36,708,763 | 4,044,905 | (2,470,789) | (369,983) | (3,619,116) | 34,293,780 | 756,870 | 432,805 |
| Treasury Bond 0.5% |
| Schwab Short-Term U.S. Treasury ETF | 1,729,590 | — | — | — | (44,689) | 1,684,901 | 34,913 | 8,962 |
| | | | | | | 35,978,681 | | |
| |
| Money Market Funds 0.0% |
| Schwab Variable Share Price Money Fund, Ultra Shares, 3.01% (b) | 45,994 | 271 | — | — | 14 | 46,279 | 46,265 | 329 |
Total Affiliated Underlying Funds
(Cost $340,633,717) | $358,613,054 | $51,635,667 | ($6,442,904) | ($915,322) | ($78,608,672) | $324,281,823 | | $2,910,068 |
Total Investments in Securities
(Cost $340,633,717) | | | | | | $324,281,823 | | |
| (a) | Distributions received include distributions from net investment income and capital gains, if any, from the underlying funds. Amounts shown are only presented for affiliated underlying funds, which are presented in the corresponding line-item in the Statement of Operations, if applicable (See financial note 2(d) for additional information). |
| (b) | The rate shown is the 7-day yield. |
| ETF — | Exchange traded fund |
| REIT — | Real Estate Investment Trust |
At September 30, 2022, all of the fund’s investment securities were classified as Level 1. Fund investments in mutual funds and ETFs are classified as Level 1, without consideration to the classification level of the underlying securities held by the mutual funds and ETFs, which could be Level 1, Level 2 or Level 3. (See financial note 2(a) for additional information).
Schwab Target Index Funds | Semiannual Report
Schwab Target 2045 Index Fund
Statement of Assets and Liabilities
As of September 30, 2022; unaudited
| Assets |
| Investments in securities, at value - affiliated (cost $340,633,717) | | $324,281,823 |
| Cash | | 3,695,280 |
| Receivables: | | |
| Investments sold | | 719,884 |
| Fund shares sold | + | 392,561 |
| Total assets | | 329,089,548 |
| Liabilities |
| Payables: | | |
| Investments bought | | 1,628,742 |
| Fund shares redeemed | | 243,182 |
| Investment adviser fees | + | 10,561 |
| Total liabilities | | 1,882,485 |
| Net assets | | $327,207,063 |
| Net Assets by Source |
| Capital received from investors | | $343,114,173 |
| Total distributable loss | + | (15,907,110) |
| Net assets | | $327,207,063 |
| Net Asset Value (NAV) |
| Net Assets | ÷ | Shares
Outstanding | = | NAV |
| $327,207,063 | | 25,130,348 | | $13.02 |
| | | | | |
| | | | | |
Schwab Target Index Funds | Semiannual Report
Schwab Target 2045 Index Fund
Statement of Operations
| For the period April 1, 2022 through September 30, 2022; unaudited |
| Investment Income |
| Dividends received from securities - affiliated | | $2,910,068 |
| Interest received from securities - unaffiliated | + | 12,853 |
| Total investment income | | 2,922,921 |
| Expenses |
| Investment adviser fees | | 141,029 |
| Proxy fees1 | + | 15,493 |
| Total expenses | | 156,522 |
| Expense reduction | – | 80,296 |
| Net expenses | – | 76,226 |
| Net investment income | | 2,846,695 |
| REALIZED AND UNREALIZED GAINS (LOSSES) |
| Net realized losses on sales of securities - affiliated | | (915,322) |
| Net change in unrealized appreciation (depreciation) on securities - affiliated | + | (78,608,672) |
| Net realized and unrealized losses | | (79,523,994) |
| Decrease in net assets resulting from operations | | ($76,677,299) |
| 1 | Proxy fees are non-routine expenses (see financial note 2(e) for additional information). |
Schwab Target Index Funds | Semiannual Report
Schwab Target 2045 Index Fund
Statement of Changes in Net Assets
For the current and prior report periods
Figures for the current period are unaudited
| OPERATIONS |
| | 4/1/22-9/30/22 | 4/1/21-3/31/22 |
| Net investment income | | $2,846,695 | $6,419,368 |
| Net realized losses | | (915,322) | (782,759) |
| Net change in unrealized appreciation (depreciation) | + | (78,608,672) | 10,856,506 |
| Increase (decrease) in net assets resulting from operations | | ($76,677,299) | $16,493,115 |
| DISTRIBUTIONS TO SHAREHOLDERS |
| Total distributions | | $— | ($6,485,385) |
| TRANSACTIONS IN FUND SHARES |
| | 4/1/22-9/30/22 | 4/1/21-3/31/22 |
| | | SHARES | VALUE | SHARES | VALUE |
| Shares sold | | 4,037,347 | $59,725,813 | 7,697,234 | $127,427,006 |
| Shares reinvested | | — | — | 369,233 | 6,336,041 |
| Shares redeemed | + | (1,201,219) | (17,711,063) | (3,397,304) | (56,403,521) |
| Net transactions in fund shares | | 2,836,128 | $42,014,750 | 4,669,163 | $77,359,526 |
| SHARES OUTSTANDING AND NET ASSETS |
| | 4/1/22-9/30/22 | 4/1/21-3/31/22 |
| | | SHARES | NET ASSETS | SHARES | NET ASSETS |
| Beginning of period | | 22,294,220 | $361,869,612 | 17,625,057 | $274,502,356 |
| Total increase (decrease) | + | 2,836,128 | (34,662,549) | 4,669,163 | 87,367,256 |
| End of period | | 25,130,348 | $327,207,063 | 22,294,220 | $361,869,612 |
Schwab Target Index Funds | Semiannual Report
Schwab Target 2050 Index Fund
Financial Statements
FINANCIAL HIGHLIGHTS
| | 4/1/22–
9/30/22* | 4/1/21–
3/31/22 | 4/1/20–
3/31/21 | 4/1/19–
3/31/20 | 4/1/18–
3/31/19 | 4/1/17–
3/31/181 |
| Per-Share Data |
| Net asset value at beginning of period | $16.44 | $15.73 | $10.63 | $12.09 | $11.85 | $10.65 |
| Income (loss) from investment operations: | | | | | | |
| Net investment income (loss)2 | 0.12 | 0.33 | 0.27 | 0.32 | 0.29 | 0.28 |
| Net realized and unrealized gains (losses) | (3.45) | 0.69 | 5.08 | (1.52) | 0.18 | 1.09 |
| Total from investment operations | (3.33) | 1.02 | 5.35 | (1.20) | 0.47 | 1.37 |
| Less distributions: | | | | | | |
| Distributions from net investment income | — | (0.30) | (0.24) | (0.26) | (0.23) | (0.17) |
| Distributions from net realized gains | — | (0.01) | (0.01) | (0.00) 3 | — | (0.00) 3 |
| Total distributions | — | (0.31) | (0.25) | (0.26) | (0.23) | (0.17) |
| Net asset value at end of period | $13.11 | $16.44 | $15.73 | $10.63 | $12.09 | $11.85 |
| Total return | (20.26%) 4 | 6.37% | 50.43% | (10.35%) | 4.23% | 12.85% |
| Ratios/Supplemental Data |
| Ratios to average net assets: | | | | | | |
| Net operating expenses5 | 0.04% 6,7 | 0.03% | 0.03% | 0.03% | 0.03% | 0.03% |
| Gross operating expenses5 | 0.08% 6,7 | 0.08% | 0.08% | 0.08% | 0.08% | 0.08% |
| Net investment income (loss) | 1.60% 6 | 1.94% | 1.93% | 2.55% | 2.48% | 2.37% |
| Portfolio turnover rate | 1% 4 | 8% | 6% | 3% | 0% 8 | 15% |
| Net assets, end of period (x 1,000) | $396,761 | $449,921 | $321,048 | $146,944 | $88,727 | $37,619 |
| * | Unaudited. |
| 1 | Effective July 24, 2017, the Investor Shares and Institutional Shares share classes were combined into a single class of shares of the fund. The financial history as shown in the financial highlights is that of the former Institutional Shares. |
| 2 | Calculated based on the average shares outstanding during the period. |
| 3 | Per-share amount was less than $0.005. |
| 4 | Not annualized. |
| 5 | Ratio excludes acquired fund fees and expenses, which are indirect expenses incurred by the fund through its investments in underlying funds. If the expenses incurred by the underlying funds were included in these ratios they would have increased by 0.04% (annualized), 0.05%, 0.05%, 0.05%, 0.05% and 0.05%, respectively, for the periods ended September 30, 2022, March 31, 2022 March 31, 2021, March 31, 2020, March 31, 2019 and March 31, 2018 (see financial note 4). |
| 6 | Annualized (except for proxy expenses). |
| 7 | Ratio includes less than 0.005% of non-routine proxy expenses. |
| 8 | Less than 0.5% |
Schwab Target Index Funds | Semiannual Report
Schwab Target 2050 Index Fund
Portfolio Holdings as of September 30, 2022 (Unaudited)
This section shows all the securities in the fund’s portfolio and their values as of the report date, including a summary of the fund’s transactions with its affiliated underlying funds during the period.
The fund files its complete schedule of portfolio holdings with the U.S. Securities and Exchange Commission (SEC) for the first and third quarters of each fiscal year on Form N-PORT Part F. The fund’s Form N-PORT Part F is available on the SEC’s website at www.sec.gov. You can also obtain this information at no cost on the fund’s website at www.schwabassetmanagement.com/schwabfunds_prospectus, by calling 1-866-414-6349, or by sending an email request to orders@mysummaryprospectus.com.The fund also makes available its complete schedule of portfolio holdings 15 to 20 days after the end of the month on the fund’s website.
| SECURITY | VALUE AT
3/31/22 | PURCHASES | SALES | REALIZED
GAINS (LOSSES) | NET CHANGE IN
UNREALIZED
APPRECIATION
(DEPRECIATION) | VALUE AT
9/30/22 | BALANCE
OF SHARES
HELD AT
9/30/22 | DISTRIBUTIONS
RECEIVED(a) |
| AFFILIATED UNDERLYING FUNDS 99.4% OF NET ASSETS |
| |
| U.S. Stocks 54.2% |
| Large-Cap 48.2% |
| Schwab U.S. Large-Cap ETF | $218,249,581 | $24,389,171 | ($2,375,387) | ($355,697) | ($48,661,209) | $191,246,459 | 4,515,855 | $1,650,263 |
| Small-Cap 6.0% |
| Schwab U.S. Small-Cap ETF | 27,124,114 | 2,799,311 | (299,217) | (77,800) | (5,659,605) | 23,886,803 | 631,926 | 171,489 |
| | | | | | | 215,133,262 | | |
| |
| International Stocks 31.2% |
| Developed Markets 24.6% |
| Schwab International Equity ETF | 110,560,028 | 15,050,429 | (316,852) | (60,480) | (27,697,638) | 97,535,487 | 3,467,312 | 851,198 |
| Emerging Markets 6.6% |
| Schwab Emerging Markets Equity ETF | 28,832,813 | 3,575,783 | (386,731) | (94,791) | (5,900,671) | 26,026,403 | 1,161,893 | 80,668 |
| | | | | | | 123,561,890 | | |
| |
| Real Estate 6.4% |
| U.S. REITs 6.4% |
| Schwab U.S. REIT ETF | 29,272,855 | 4,525,048 | (699,562) | (25,811) | (7,650,747) | 25,421,783 | 1,360,181 | 362,802 |
| |
| Fixed Income 7.6% |
| Intermediate-Term Bond 7.6% |
| Schwab U.S. Aggregate Bond ETF | 32,687,841 | 2,546,706 | (1,592,120) | (235,276) | (3,271,923) | 30,135,228 | 665,090 | 381,156 |
| |
| Money Market Funds 0.0% |
| Schwab Variable Share Price Money Fund, Ultra Shares, 3.01% (b) | 62,935 | 371 | — | — | 19 | 63,325 | 63,306 | 450 |
Total Affiliated Underlying Funds
(Cost $420,750,089) | $446,790,167 | $52,886,819 | ($5,669,869) | ($849,855) | ($98,841,774) | $394,315,488 | | $3,498,026 |
Total Investments in Securities
(Cost $420,750,089) | | | | | | $394,315,488 | | |
| (a) | Distributions received include distributions from net investment income and capital gains, if any, from the underlying funds. Amounts shown are only presented for affiliated underlying funds, which are presented in the corresponding line-item in the Statement of Operations, if applicable (See financial note 2(d) for additional information). |
| (b) | The rate shown is the 7-day yield. |
| ETF — | Exchange traded fund |
| REIT — | Real Estate Investment Trust |
At September 30, 2022, all of the fund’s investment securities were classified as Level 1. Fund investments in mutual funds and ETFs are classified as Level 1, without consideration to the classification level of the underlying securities held by the mutual funds and ETFs, which could be Level 1, Level 2 or Level 3. (See financial note 2(a) for additional information).
Schwab Target Index Funds | Semiannual Report
Schwab Target 2050 Index Fund
Statement of Assets and Liabilities
As of September 30, 2022; unaudited
| Assets |
| Investments in securities, at value - affiliated (cost $420,750,089) | | $394,315,488 |
| Cash | | 3,646,468 |
| Receivables: | | |
| Fund shares sold | | 587,741 |
| Investments sold | | 400,395 |
| Dividends | + | 84 |
| Total assets | | 398,950,176 |
| Liabilities |
| Payables: | | |
| Investments bought | | 1,768,324 |
| Fund shares redeemed | | 408,214 |
| Investment adviser fees | + | 12,648 |
| Total liabilities | | 2,189,186 |
| Net assets | | $396,760,990 |
| Net Assets by Source |
| Capital received from investors | | $421,764,924 |
| Total distributable loss | + | (25,003,934) |
| Net assets | | $396,760,990 |
| Net Asset Value (NAV) |
| Net Assets | ÷ | Shares
Outstanding | = | NAV |
| $396,760,990 | | 30,253,270 | | $13.11 |
| | | | | |
| | | | | |
Schwab Target Index Funds | Semiannual Report
Schwab Target 2050 Index Fund
Statement of Operations
| For the period April 1, 2022 through September 30, 2022; unaudited |
| Investment Income |
| Dividends received from securities - affiliated | | $3,498,026 |
| Interest received from securities - unaffiliated | + | 11,964 |
| Total investment income | | 3,509,990 |
| Expenses |
| Investment adviser fees | | 172,653 |
| Proxy fees1 | + | 18,992 |
| Total expenses | | 191,645 |
| Expense reduction | – | 99,891 |
| Net expenses | – | 91,754 |
| Net investment income | | 3,418,236 |
| REALIZED AND UNREALIZED GAINS (LOSSES) |
| Net realized losses on sales of securities - affiliated | | (849,855) |
| Net change in unrealized appreciation (depreciation) on securities - affiliated | + | (98,841,774) |
| Net realized and unrealized losses | | (99,691,629) |
| Decrease in net assets resulting from operations | | ($96,273,393) |
| 1 | Proxy fees are non-routine expenses (see financial note 2(e) for additional information). |
Schwab Target Index Funds | Semiannual Report
Schwab Target 2050 Index Fund
Statement of Changes in Net Assets
For the current and prior report periods
Figures for the current period are unaudited
| OPERATIONS |
| | 4/1/22-9/30/22 | 4/1/21-3/31/22 |
| Net investment income | | $3,418,236 | $7,695,423 |
| Net realized losses | | (849,855) | (900,940) |
| Net change in unrealized appreciation (depreciation) | + | (98,841,774) | 12,823,606 |
| Increase (decrease) in net assets resulting from operations | | ($96,273,393) | $19,618,089 |
| DISTRIBUTIONS TO SHAREHOLDERS |
| Total distributions | | $— | ($7,672,924) |
| TRANSACTIONS IN FUND SHARES |
| | 4/1/22-9/30/22 | 4/1/21-3/31/22 |
| | | SHARES | VALUE | SHARES | VALUE |
| Shares sold | | 4,707,517 | $70,119,820 | 10,162,295 | $170,527,200 |
| Shares reinvested | | — | — | 433,775 | 7,543,343 |
| Shares redeemed | + | (1,819,039) | (27,006,590) | (3,640,541) | (61,142,731) |
| Net transactions in fund shares | | 2,888,478 | $43,113,230 | 6,955,529 | $116,927,812 |
| SHARES OUTSTANDING AND NET ASSETS |
| | 4/1/22-9/30/22 | 4/1/21-3/31/22 |
| | | SHARES | NET ASSETS | SHARES | NET ASSETS |
| Beginning of period | | 27,364,792 | $449,921,153 | 20,409,263 | $321,048,176 |
| Total increase (decrease) | + | 2,888,478 | (53,160,163) | 6,955,529 | 128,872,977 |
| End of period | | 30,253,270 | $396,760,990 | 27,364,792 | $449,921,153 |
Schwab Target Index Funds | Semiannual Report
Schwab Target 2055 Index Fund
Financial Statements
FINANCIAL HIGHLIGHTS
| | 4/1/22–
9/30/22* | 4/1/21–
3/31/22 | 4/1/20–
3/31/21 | 4/1/19–
3/31/20 | 4/1/18–
3/31/19 | 4/1/17–
3/31/181 |
| Per-Share Data |
| Net asset value at beginning of period | $16.62 | $15.88 | $10.60 | $12.14 | $11.91 | $10.67 |
| Income (loss) from investment operations: | | | | | | |
| Net investment income (loss)2 | 0.12 | 0.33 | 0.27 | 0.32 | 0.31 | 0.27 |
| Net realized and unrealized gains (losses) | (3.52) | 0.73 | 5.25 | (1.60) | 0.15 | 1.15 |
| Total from investment operations | (3.40) | 1.06 | 5.52 | (1.28) | 0.46 | 1.42 |
| Less distributions: | | | | | | |
| Distributions from net investment income | — | (0.31) | (0.24) | (0.26) | (0.23) | (0.18) |
| Distributions from net realized gains | — | (0.01) | (0.00) 3 | (0.00) 3 | — | (0.00) 3 |
| Total distributions | — | (0.32) | (0.24) | (0.26) | (0.23) | (0.18) |
| Net asset value at end of period | $13.22 | $16.62 | $15.88 | $10.60 | $12.14 | $11.91 |
| Total return | (20.46%) 4 | 6.51% | 52.24% | (10.96%) | 4.15% | 13.25% |
| Ratios/Supplemental Data |
| Ratios to average net assets: | | | | | | |
| Net operating expenses5 | 0.04% 6,7 | 0.03% | 0.03% | 0.03% | 0.03% | 0.03% |
| Gross operating expenses5 | 0.08% 6,7 | 0.08% | 0.08% | 0.08% | 0.08% | 0.08% |
| Net investment income (loss) | 1.59% 6 | 1.94% | 1.92% | 2.57% | 2.60% | 2.33% |
| Portfolio turnover rate | 1% 4 | 7% | 6% | 3% | 6% | 23% |
| Net assets, end of period (x 1,000) | $252,505 | $278,992 | $189,841 | $84,957 | $50,403 | $17,713 |
| * | Unaudited. |
| 1 | Effective July 24, 2017, the Investor Shares and Institutional Shares share classes were combined into a single class of shares of the fund. The financial history as shown in the financial highlights is that of the former Institutional Shares. |
| 2 | Calculated based on the average shares outstanding during the period. |
| 3 | Per-share amount was less than $0.005. |
| 4 | Not annualized. |
| 5 | Ratio excludes acquired fund fees and expenses, which are indirect expenses incurred by the fund through its investments in underlying funds. If the expenses incurred by the underlying funds were included in these ratios they would have increased by 0.04% (annualized), 0.05%, 0.05%, 0.05%, 0.05% and 0.05%, respectively, for the periods ended September 30, 2022, March 31, 2022 March 31, 2021, March 31, 2020, March 31, 2019 and March 31, 2018 (see financial note 4). |
| 6 | Annualized (except for proxy expenses). |
| 7 | Ratio includes less than 0.005% of non-routine proxy expenses. |
Schwab Target Index Funds | Semiannual Report
Schwab Target 2055 Index Fund
Portfolio Holdings as of September 30, 2022 (Unaudited)
This section shows all the securities in the fund’s portfolio and their values as of the report date, including a summary of the fund’s transactions with its affiliated underlying funds during the period.
The fund files its complete schedule of portfolio holdings with the U.S. Securities and Exchange Commission (SEC) for the first and third quarters of each fiscal year on Form N-PORT Part F. The fund’s Form N-PORT Part F is available on the SEC’s website at www.sec.gov. You can also obtain this information at no cost on the fund’s website at www.schwabassetmanagement.com/schwabfunds_prospectus, by calling 1-866-414-6349, or by sending an email request to orders@mysummaryprospectus.com.The fund also makes available its complete schedule of portfolio holdings 15 to 20 days after the end of the month on the fund’s website.
| SECURITY | VALUE AT
3/31/22 | PURCHASES | SALES | REALIZED
GAINS (LOSSES) | NET CHANGE IN
UNREALIZED
APPRECIATION
(DEPRECIATION) | VALUE AT
9/30/22 | BALANCE
OF SHARES
HELD AT
9/30/22 | DISTRIBUTIONS
RECEIVED(a) |
| AFFILIATED UNDERLYING FUNDS 99.5% OF NET ASSETS |
| |
| U.S. Stocks 55.2% |
| Large-Cap 48.9% |
| Schwab U.S. Large-Cap ETF | $137,049,489 | $19,309,596 | ($1,641,570) | ($253,156) | ($31,031,896) | $123,432,463 | 2,914,580 | $1,062,847 |
| Small-Cap 6.3% |
| Schwab U.S. Small-Cap ETF | 17,625,876 | 2,290,475 | (302,748) | (68,417) | (3,707,931) | 15,837,255 | 418,975 | 114,679 |
| | | | | | | 139,269,718 | | |
| |
| International Stocks 32.2% |
| Developed Markets 25.2% |
| Schwab International Equity ETF | 70,210,843 | 11,484,885 | (191,678) | (34,531) | (17,865,311) | 63,604,208 | 2,261,081 | 549,673 |
| Emerging Markets 7.0% |
| Schwab Emerging Markets Equity ETF | 19,074,297 | 2,830,345 | (146,540) | (32,450) | (4,007,498) | 17,718,154 | 790,989 | 54,225 |
| | | | | | | 81,322,362 | | |
| |
| Real Estate 6.5% |
| U.S. REITs 6.5% |
| Schwab U.S. REIT ETF | 18,630,588 | 3,231,824 | (382,263) | (17,810) | (4,948,995) | 16,513,344 | 883,539 | 237,130 |
| |
| Fixed Income 5.6% |
| Intermediate-Term Bond 5.6% |
| Schwab U.S. Aggregate Bond ETF | 14,668,991 | 1,097,933 | (178,694) | (24,650) | (1,564,285) | 13,999,295 | 308,967 | 174,371 |
| |
| Money Market Funds 0.0% |
| Schwab Variable Share Price Money Fund, Ultra Shares, 3.01% (b) | 66,699 | 393 | — | — | 20 | 67,112 | 67,092 | 477 |
Total Affiliated Underlying Funds
(Cost $270,511,877) | $277,326,783 | $40,245,451 | ($2,843,493) | ($431,014) | ($63,125,896) | $251,171,831 | | $2,193,402 |
Total Investments in Securities
(Cost $270,511,877) | | | | | | $251,171,831 | | |
| (a) | Distributions received include distributions from net investment income and capital gains, if any, from the underlying funds. Amounts shown are only presented for affiliated underlying funds, which are presented in the corresponding line-item in the Statement of Operations, if applicable (See financial note 2(d) for additional information). |
| (b) | The rate shown is the 7-day yield. |
| ETF — | Exchange traded fund |
| REIT — | Real Estate Investment Trust |
At September 30, 2022, all of the fund’s investment securities were classified as Level 1. Fund investments in mutual funds and ETFs are classified as Level 1, without consideration to the classification level of the underlying securities held by the mutual funds and ETFs, which could be Level 1, Level 2 or Level 3. (See financial note 2(a) for additional information).
Schwab Target Index Funds | Semiannual Report
Schwab Target 2055 Index Fund
Statement of Assets and Liabilities
As of September 30, 2022; unaudited
| Assets |
| Investments in securities, at value - affiliated (cost $270,511,877) | | $251,171,831 |
| Cash | | 2,073,127 |
| Receivables: | | |
| Fund shares sold | | 373,874 |
| Dividends | + | 89 |
| Total assets | | 253,618,921 |
| Liabilities |
| Payables: | | |
| Investments bought | | 1,024,948 |
| Fund shares redeemed | | 81,439 |
| Investment adviser fees | + | 7,706 |
| Total liabilities | | 1,114,093 |
| Net assets | | $252,504,828 |
| Net Assets by Source |
| Capital received from investors | | $271,070,274 |
| Total distributable loss | + | (18,565,446) |
| Net assets | | $252,504,828 |
| Net Asset Value (NAV) |
| Net Assets | ÷ | Shares
Outstanding | = | NAV |
| $252,504,828 | | 19,106,976 | | $13.22 |
| | | | | |
| | | | | |
Schwab Target Index Funds | Semiannual Report
Schwab Target 2055 Index Fund
Statement of Operations
| For the period April 1, 2022 through September 30, 2022; unaudited |
| Investment Income |
| Dividends received from securities - affiliated | | $2,193,402 |
| Interest received from securities - unaffiliated | + | 6,376 |
| Total investment income | | 2,199,778 |
| Expenses |
| Investment adviser fees | | 108,969 |
| Proxy fees1 | + | 11,949 |
| Total expenses | | 120,918 |
| Expense reduction | – | 63,868 |
| Net expenses | – | 57,050 |
| Net investment income | | 2,142,728 |
| REALIZED AND UNREALIZED GAINS (LOSSES) |
| Net realized losses on sales of securities - affiliated | | (431,014) |
| Net change in unrealized appreciation (depreciation) on securities - affiliated | + | (63,125,896) |
| Net realized and unrealized losses | | (63,556,910) |
| Decrease in net assets resulting from operations | | ($61,414,182) |
| 1 | Proxy fees are non-routine expenses (see financial note 2(e) for additional information). |
Schwab Target Index Funds | Semiannual Report
Schwab Target 2055 Index Fund
Statement of Changes in Net Assets
For the current and prior report periods
Figures for the current period are unaudited
| OPERATIONS |
| | 4/1/22-9/30/22 | 4/1/21-3/31/22 |
| Net investment income | | $2,142,728 | $4,668,051 |
| Net realized losses | | (431,014) | (499,859) |
| Net change in unrealized appreciation (depreciation) | + | (63,125,896) | 8,024,938 |
| Increase (decrease) in net assets resulting from operations | | ($61,414,182) | $12,193,130 |
| DISTRIBUTIONS TO SHAREHOLDERS |
| Total distributions | | $— | ($4,624,727) |
| TRANSACTIONS IN FUND SHARES |
| | 4/1/22-9/30/22 | 4/1/21-3/31/22 |
| | | SHARES | VALUE | SHARES | VALUE |
| Shares sold | | 3,421,105 | $51,368,043 | 6,778,512 | $114,807,471 |
| Shares reinvested | | — | — | 254,269 | 4,472,592 |
| Shares redeemed | + | (1,100,101) | (16,440,799) | (2,205,164) | (37,697,947) |
| Net transactions in fund shares | | 2,321,004 | $34,927,244 | 4,827,617 | $81,582,116 |
| SHARES OUTSTANDING AND NET ASSETS |
| | 4/1/22-9/30/22 | 4/1/21-3/31/22 |
| | | SHARES | NET ASSETS | SHARES | NET ASSETS |
| Beginning of period | | 16,785,972 | $278,991,766 | 11,958,355 | $189,841,247 |
| Total increase (decrease) | + | 2,321,004 | (26,486,938) | 4,827,617 | 89,150,519 |
| End of period | | 19,106,976 | $252,504,828 | 16,785,972 | $278,991,766 |
Schwab Target Index Funds | Semiannual Report
Schwab Target 2060 Index Fund
Financial Statements
FINANCIAL HIGHLIGHTS
| | 4/1/22–
9/30/22* | 4/1/21–
3/31/22 | 4/1/20–
3/31/21 | 4/1/19–
3/31/20 | 4/1/18–
3/31/19 | 4/1/17–
3/31/181 |
| Per-Share Data |
| Net asset value at beginning of period | $16.73 | $15.95 | $10.55 | $12.16 | $11.92 | $10.68 |
| Income (loss) from investment operations: | | | | | | |
| Net investment income (loss)2 | 0.12 | 0.33 | 0.27 | 0.32 | 0.30 | 0.29 |
| Net realized and unrealized gains (losses) | (3.59) | 0.77 | 5.38 | (1.66) | 0.17 | 1.12 |
| Total from investment operations | (3.47) | 1.10 | 5.65 | (1.34) | 0.47 | 1.41 |
| Less distributions: | | | | | | |
| Distributions from net investment income | — | (0.31) | (0.24) | (0.27) | (0.23) | (0.17) |
| Distributions from net realized gains | — | (0.01) | (0.01) | (0.00) 3 | (0.00) 3 | (0.00) 3 |
| Total distributions | — | (0.32) | (0.25) | (0.27) | (0.23) | (0.17) |
| Net asset value at end of period | $13.26 | $16.73 | $15.95 | $10.55 | $12.16 | $11.92 |
| Total return | (20.74%) 4 | 6.74% | 53.70% | (11.50%) | 4.23% | 13.22% |
| Ratios/Supplemental Data |
| Ratios to average net assets: | | | | | | |
| Net operating expenses5 | 0.04% 6,7 | 0.03% | 0.03% | 0.03% | 0.03% | 0.03% |
| Gross operating expenses5 | 0.08% 6,7 | 0.08% | 0.08% | 0.08% | 0.08% | 0.08% |
| Net investment income (loss) | 1.56% 6 | 1.95% | 1.92% | 2.54% | 2.50% | 2.43% |
| Portfolio turnover rate | 1% 4 | 6% | 7% | 4% | 2% | 19% |
| Net assets, end of period (x 1,000) | $306,137 | $345,015 | $226,973 | $100,674 | $58,895 | $24,224 |
| * | Unaudited. |
| 1 | Effective July 24, 2017, the Investor Shares and Institutional Shares share classes were combined into a single class of shares of the fund. The financial history as shown in the financial highlights is that of the former Institutional Shares. |
| 2 | Calculated based on the average shares outstanding during the period. |
| 3 | Per-share amount was less than $0.005. |
| 4 | Not annualized. |
| 5 | Ratio excludes acquired fund fees and expenses, which are indirect expenses incurred by the fund through its investments in underlying funds. If the expenses incurred by the underlying funds were included in these ratios they would have increased by 0.04% (annualized), 0.05%, 0.05%, 0.05%, 0.05% and 0.05%, respectively, for the periods ended September 30, 2022, March 31, 2022 March 31, 2021, March 31, 2020, March 31, 2019 and March 31, 2018 (see financial note 4). |
| 6 | Annualized (except for proxy expenses). |
| 7 | Ratio includes less than 0.005% of non-routine proxy expenses. |
Schwab Target Index Funds | Semiannual Report
Schwab Target 2060 Index Fund
Portfolio Holdings as of September 30, 2022 (Unaudited)
This section shows all the securities in the fund’s portfolio and their values as of the report date, including a summary of the fund’s transactions with its affiliated underlying funds during the period.
The fund files its complete schedule of portfolio holdings with the U.S. Securities and Exchange Commission (SEC) for the first and third quarters of each fiscal year on Form N-PORT Part F. The fund’s Form N-PORT Part F is available on the SEC’s website at www.sec.gov. You can also obtain this information at no cost on the fund’s website at www.schwabassetmanagement.com/schwabfunds_prospectus, by calling 1-866-414-6349, or by sending an email request to orders@mysummaryprospectus.com.The fund also makes available its complete schedule of portfolio holdings 15 to 20 days after the end of the month on the fund’s website.
| SECURITY | VALUE AT
3/31/22 | PURCHASES | SALES | REALIZED
GAINS (LOSSES) | NET CHANGE IN
UNREALIZED
APPRECIATION
(DEPRECIATION) | VALUE AT
9/30/22 | BALANCE
OF SHARES
HELD AT
9/30/22 | DISTRIBUTIONS
RECEIVED(a) |
| AFFILIATED UNDERLYING FUNDS 99.5% OF NET ASSETS |
| |
| U.S. Stocks 56.1% |
| Large-Cap 49.4% |
| Schwab U.S. Large-Cap ETF | $171,493,026 | $20,896,125 | ($2,283,697) | ($447,924) | ($38,461,974) | $151,195,556 | 3,570,143 | $1,310,926 |
| Small-Cap 6.7% |
| Schwab U.S. Small-Cap ETF | 22,836,234 | 2,775,043 | (230,838) | (62,791) | (4,835,075) | 20,482,573 | 541,867 | 147,391 |
| | | | | | | 171,678,129 | | |
| |
| International Stocks 33.3% |
| Developed Markets 25.9% |
| Schwab International Equity ETF | 88,809,523 | 13,052,079 | (165,473) | (30,598) | (22,420,001) | 79,245,530 | 2,817,118 | 689,444 |
| Emerging Markets 7.4% |
| Schwab Emerging Markets Equity ETF | 25,014,772 | 3,640,460 | (924,033) | (307,844) | (4,927,752) | 22,495,603 | 1,004,268 | 70,063 |
| | | | | | | 101,741,133 | | |
| |
| Real Estate 6.7% |
| U.S. REITs 6.7% |
| Schwab U.S. REIT ETF | 23,469,453 | 3,780,172 | (515,238) | (11,696) | (6,165,093) | 20,557,598 | 1,099,925 | 294,283 |
| |
| Fixed Income 3.4% |
| Intermediate-Term Bond 3.4% |
| Schwab U.S. Aggregate Bond ETF | 11,274,935 | 442,484 | — | — | (1,206,904) | 10,510,515 | 231,969 | 132,910 |
Total Affiliated Underlying Funds
(Cost $329,750,806) | $342,897,943 | $44,586,363 | ($4,119,279) | ($860,853) | ($78,016,799) | $304,487,375 | | $2,645,017 |
Total Investments in Securities
(Cost $329,750,806) | | | | | | $304,487,375 | | |
| (a) | Distributions received include distributions from net investment income and capital gains, if any, from the underlying funds. Amounts shown are only presented for affiliated underlying funds, which are presented in the corresponding line-item in the Statement of Operations, if applicable (See financial note 2(d) for additional information). |
| ETF — | Exchange traded fund |
| REIT — | Real Estate Investment Trust |
At September 30, 2022, all of the fund’s investment securities were classified as Level 1. Fund investments in ETFs are classified as Level 1, without consideration to the classification level of the underlying securities held by the ETFs, which could be Level 1, Level 2 or Level 3. (See financial note 2(a) for additional information)
Schwab Target Index Funds | Semiannual Report
Schwab Target 2060 Index Fund
Statement of Assets and Liabilities
As of September 30, 2022; unaudited
| Assets |
| Investments in securities, at value - affiliated (cost $329,750,806) | | $304,487,375 |
| Cash | | 2,630,746 |
| Receivables: | | |
| Fund shares sold | + | 300,607 |
| Total assets | | 307,418,728 |
| Liabilities |
| Payables: | | |
| Investments bought | | 1,139,355 |
| Fund shares redeemed | | 133,438 |
| Investment adviser fees | + | 9,283 |
| Total liabilities | | 1,282,076 |
| Net assets | | $306,136,652 |
| Net Assets by Source |
| Capital received from investors | | $331,233,293 |
| Total distributable loss | + | (25,096,641) |
| Net assets | | $306,136,652 |
| Net Asset Value (NAV) |
| Net Assets | ÷ | Shares
Outstanding | = | NAV |
| $306,136,652 | | 23,085,334 | | $13.26 |
| | | | | |
| | | | | |
Schwab Target Index Funds | Semiannual Report
Schwab Target 2060 Index Fund
Statement of Operations
| For the period April 1, 2022 through September 30, 2022; unaudited |
| Investment Income |
| Dividends received from securities - affiliated | | $2,645,017 |
| Interest received from securities - unaffiliated | + | 7,849 |
| Total investment income | | 2,652,866 |
| Expenses |
| Investment adviser fees | | 133,403 |
| Proxy fees1 | + | 14,665 |
| Total expenses | | 148,068 |
| Expense reduction | – | 78,792 |
| Net expenses | – | 69,276 |
| Net investment income | | 2,583,590 |
| REALIZED AND UNREALIZED GAINS (LOSSES) |
| Net realized losses on sales of securities - affiliated | | (860,853) |
| Net change in unrealized appreciation (depreciation) on securities - affiliated | + | (78,016,799) |
| Net realized and unrealized losses | | (78,877,652) |
| Decrease in net assets resulting from operations | | ($76,294,062) |
| 1 | Proxy fees are non-routine expenses (see financial note 2(e) for additional information). |
Schwab Target Index Funds | Semiannual Report
Schwab Target 2060 Index Fund
Statement of Changes in Net Assets
For the current and prior report periods
Figures for the current period are unaudited
| OPERATIONS |
| | 4/1/22-9/30/22 | 4/1/21-3/31/22 |
| Net investment income | | $2,583,590 | $5,754,499 |
| Net realized losses | | (860,853) | (709,421) |
| Net change in unrealized appreciation (depreciation) | + | (78,016,799) | 9,723,828 |
| Increase (decrease) in net assets resulting from operations | | ($76,294,062) | $14,768,906 |
| DISTRIBUTIONS TO SHAREHOLDERS |
| Total distributions | | $— | ($5,689,319) |
| TRANSACTIONS IN FUND SHARES |
| | 4/1/22-9/30/22 | 4/1/21-3/31/22 |
| | | SHARES | VALUE | SHARES | VALUE |
| Shares sold | | 4,068,656 | $61,397,829 | 8,866,949 | $151,012,110 |
| Shares reinvested | | — | — | 313,021 | 5,543,605 |
| Shares redeemed | + | (1,604,487) | (23,982,285) | (2,789,127) | (47,592,743) |
| Net transactions in fund shares | | 2,464,169 | $37,415,544 | 6,390,843 | $108,962,972 |
| SHARES OUTSTANDING AND NET ASSETS |
| | 4/1/22-9/30/22 | 4/1/21-3/31/22 |
| | | SHARES | NET ASSETS | SHARES | NET ASSETS |
| Beginning of period | | 20,621,165 | $345,015,170 | 14,230,322 | $226,972,611 |
| Total increase (decrease) | + | 2,464,169 | (38,878,518) | 6,390,843 | 118,042,559 |
| End of period | | 23,085,334 | $306,136,652 | 20,621,165 | $345,015,170 |
Schwab Target Index Funds | Semiannual Report
Schwab Target 2065 Index Fund
Financial Statements
FINANCIAL HIGHLIGHTS
| | 4/1/22–
9/30/22* | 4/1/21–
3/31/22 | 2/26/21 1–
3/31/21 | | | |
| Per-Share Data |
| Net asset value at beginning of period | $10.76 | $10.21 | $10.00 | | | |
| Income (loss) from investment operations: | | | | | | |
| Net investment income (loss)2 | 0.08 | 0.25 | 0.02 | | | |
| Net realized and unrealized gains (losses) | (2.32) | 0.44 3 | 0.19 | | | |
| Total from investment operations | (2.24) | 0.69 | 0.21 | | | |
| Less distributions: | | | | | | |
| Distributions from net investment income | — | (0.14) | — | | | |
| Net asset value at end of period | $8.52 | $10.76 | $10.21 | | | |
| Total return | (20.82%) 4 | 6.69% | 2.10% 4 | | | |
| Ratios/Supplemental Data |
| Ratios to average net assets: | | | | | | |
| Net operating expenses5 | 0.04% 6,7 | 0.03% | 0.04% 8 | | | |
| Gross operating expenses5 | 0.08% 6,7 | 0.08% | 0.08% 8 | | | |
| Net investment income (loss) | 1.59% 6 | 2.30% | 2.46% 8 | | | |
| Portfolio turnover rate | 5% 4 | 19% | 0% 4,9 | | | |
| Net assets, end of period (x 1,000) | $32,602 | $29,071 | $1,820 | | | |
| * | Unaudited. |
| 1 | Commencement of operations. |
| 2 | Calculated based on the average shares outstanding during the period. |
| 3 | The per share amount does not accord with the change in aggregate gains and losses in securities during the period because of the timing of sales and repurchases of fund shares in relation to fluctuating market values. |
| 4 | Not annualized. |
| 5 | Ratio excludes acquired fund fees and expenses, which are indirect expenses incurred by the fund through its investments in underlying funds. If the expenses incurred by the underlying funds were included in these ratios they would have increased by 0.04% (annualized), 0.05% and 0.04% (annualized), respectively, for the periods ended September 30, 2022, March 31, 2022 and March 31, 2021 (see financial note 4). |
| 6 | Annualized (except for proxy expenses). |
| 7 | Ratio includes less than 0.005% of non-routine proxy expenses. |
| 8 | Annualized. |
| 9 | Portfolio turnover was 0%; portfolio turnover is calculated by factoring in the lesser of long-term purchases or sales of securities. The fund had no sales of securities during the period. |
Schwab Target Index Funds | Semiannual Report
Schwab Target 2065 Index Fund
Portfolio Holdings as of September 30, 2022 (Unaudited)
This section shows all the securities in the fund’s portfolio and their values as of the report date, including a summary of the fund’s transactions with its affiliated underlying funds during the period.
The fund files its complete schedule of portfolio holdings with the U.S. Securities and Exchange Commission (SEC) for the first and third quarters of each fiscal year on Form N-PORT Part F. The fund’s Form N-PORT Part F is available on the SEC’s website at www.sec.gov. You can also obtain this information at no cost on the fund’s website at www.schwabassetmanagement.com/schwabfunds_prospectus, by calling 1-866-414-6349, or by sending an email request to orders@mysummaryprospectus.com.The fund also makes available its complete schedule of portfolio holdings 15 to 20 days after the end of the month on the fund’s website.
| SECURITY | VALUE AT
3/31/22 | PURCHASES | SALES | REALIZED
GAINS (LOSSES) | NET CHANGE IN
UNREALIZED
APPRECIATION
(DEPRECIATION) | VALUE AT
9/30/22 | BALANCE
OF SHARES
HELD AT
9/30/22 | DISTRIBUTIONS
RECEIVED(a) |
| AFFILIATED UNDERLYING FUNDS 99.4% OF NET ASSETS |
| |
| U.S. Stocks 56.3% |
| Large-Cap 49.5% |
| Schwab U.S. Large-Cap ETF | $14,477,626 | $6,222,544 | ($802,618) | ($129,561) | ($3,630,862) | $16,137,129 | 381,042 | $129,937 |
| Small-Cap 6.8% |
| Schwab U.S. Small-Cap ETF | 1,973,302 | 824,347 | (114,052) | (26,979) | (449,401) | 2,207,217 | 58,392 | 14,621 |
| | | | | | | 18,344,346 | | |
| |
| International Stocks 33.7% |
| Developed Markets 26.1% |
| Schwab International Equity ETF | 7,610,147 | 3,498,155 | (387,776) | (88,289) | (2,106,934) | 8,525,303 | 303,068 | 63,930 |
| Emerging Markets 7.6% |
| Schwab Emerging Markets Equity ETF | 2,169,031 | 870,048 | (58,201) | (14,281) | (502,619) | 2,463,978 | 109,999 | 6,577 |
| | | | | | | 10,989,281 | | |
| |
| Real Estate 6.8% |
| U.S. REITs 6.8% |
| Schwab U.S. REIT ETF | 1,970,168 | 981,503 | (105,471) | (9,058) | (609,051) | 2,228,091 | 119,213 | 29,266 |
| |
| Fixed Income 2.6% |
| Intermediate-Term Bond 2.6% |
| Schwab U.S. Aggregate Bond ETF | 703,580 | 226,278 | — | — | (88,497) | 841,361 | 18,569 | 9,282 |
Total Affiliated Underlying Funds
(Cost $40,183,032) | $28,903,854 | $12,622,875 | ($1,468,118) | ($268,168) | ($7,387,364) | $32,403,079 | | $253,613 |
Total Investments in Securities
(Cost $40,183,032) | | | | | | $32,403,079 | | |
| (a) | Distributions received include distributions from net investment income and capital gains, if any, from the underlying funds. Amounts shown are only presented for affiliated underlying funds, which are presented in the corresponding line-item in the Statement of Operations, if applicable (See financial note 2(d) for additional information). |
| ETF — | Exchange traded fund |
| REIT — | Real Estate Investment Trust |
At September 30, 2022, all of the fund’s investment securities were classified as Level 1. Fund investments in ETFs are classified as Level 1, without consideration to the classification level of the underlying securities held by the ETFs, which could be Level 1, Level 2 or Level 3. (See financial note 2(a) for additional information)
Schwab Target Index Funds | Semiannual Report
Schwab Target 2065 Index Fund
Statement of Assets and Liabilities
As of September 30, 2022; unaudited
| Assets |
| Investments in securities, at value - affiliated (cost $40,183,032) | | $32,403,079 |
| Cash | | 329,014 |
| Receivables: | | |
| Fund shares sold | + | 102,977 |
| Total assets | | 32,835,070 |
| Liabilities |
| Payables: | | |
| Investments bought | | 208,599 |
| Fund shares redeemed | | 23,095 |
| Investment adviser fees | + | 972 |
| Total liabilities | | 232,666 |
| Net assets | | $32,602,404 |
| Net Assets by Source |
| Capital received from investors | | $40,528,873 |
| Total distributable loss | + | (7,926,469) |
| Net assets | | $32,602,404 |
| Net Asset Value (NAV) |
| Net Assets | ÷ | Shares
Outstanding | = | NAV |
| $32,602,404 | | 3,824,434 | | $8.52 |
| | | | | |
| | | | | |
Schwab Target Index Funds | Semiannual Report
Schwab Target 2065 Index Fund
Statement of Operations
| For the period April 1, 2022 through September 30, 2022; unaudited |
| Investment Income |
| Dividends received from securities - affiliated | | $253,613 |
| Interest received from securities - unaffiliated | + | 1,021 |
| Total investment income | | 254,634 |
| Expenses |
| Investment adviser fees | | 12,628 |
| Proxy fees1 | + | 1,327 |
| Total expenses | | 13,955 |
| Expense reduction | – | 7,521 |
| Net expenses | – | 6,434 |
| Net investment income | | 248,200 |
| REALIZED AND UNREALIZED GAINS (LOSSES) |
| Net realized losses on sales of securities - affiliated | | (268,168) |
| Net change in unrealized appreciation (depreciation) on securities - affiliated | + | (7,387,364) |
| Net realized and unrealized losses | | (7,655,532) |
| Decrease in net assets resulting from operations | | ($7,407,332) |
| 1 | Proxy fees are non-routine expenses (see financial note 2(e) for additional information). |
Schwab Target Index Funds | Semiannual Report
Schwab Target 2065 Index Fund
Statement of Changes in Net Assets
For the current and prior report periods
Figures for the current period are unaudited
| OPERATIONS |
| | 4/1/22-9/30/22 | 4/1/21-3/31/22 |
| Net investment income | | $248,200 | $340,443 |
| Net realized losses | | (268,168) | (174,445) |
| Net change in unrealized appreciation (depreciation) | + | (7,387,364) | (409,849) |
| Decrease in net assets from operations | | ($7,407,332) | ($243,851) |
| DISTRIBUTIONS TO SHAREHOLDERS |
| Total distributions | | $— | ($294,976) |
| TRANSACTIONS IN FUND SHARES |
| | 4/1/22-9/30/22 | 4/1/21-3/31/22 |
| | | SHARES | VALUE | SHARES | VALUE |
| Shares sold | | 1,522,423 | $14,806,174 | 2,995,048 | $32,934,520 |
| Shares reinvested | | — | — | 24,515 | 279,218 |
| Shares redeemed | + | (398,629) | (3,867,075) | (497,239) | (5,424,360) |
| Net transactions in fund shares | | 1,123,794 | $10,939,099 | 2,522,324 | $27,789,378 |
| SHARES OUTSTANDING AND NET ASSETS |
| | 4/1/22-9/30/22 | 4/1/21-3/31/22 |
| | | SHARES | NET ASSETS | SHARES | NET ASSETS |
| Beginning of period | | 2,700,640 | $29,070,637 | 178,316 | $1,820,086 |
| Total increase | + | 1,123,794 | 3,531,767 | 2,522,324 | 27,250,551 |
| End of period | | 3,824,434 | $32,602,404 | 2,700,640 | $29,070,637 |
Schwab Target Index Funds | Semiannual Report
Schwab Target Index Funds
Financial Notes, unaudited
1. Business Structure of the Funds:
Each of the funds in this report is a series of Schwab Capital Trust (the trust), a no-load, open-end management investment company. The trust is organized as a Massachusetts business trust and is registered under the Investment Company Act of 1940, as amended (the 1940 Act). The list below shows all the funds in the trust as of the end of the period, including the funds discussed in this report, which are highlighted:
| SCHWAB CAPITAL TRUST (ORGANIZED MAY 7, 1993) |
| Schwab Target 2010 Index Fund | Schwab Dividend Equity Fund |
| Schwab Target 2015 Index Fund | Schwab Large-Cap Growth Fund |
| Schwab Target 2020 Index Fund | Schwab Small-Cap Equity Fund |
| Schwab Target 2025 Index Fund | Schwab Health Care Fund |
| Schwab Target 2030 Index Fund | Schwab International Core Equity Fund |
| Schwab Target 2035 Index Fund | Schwab Target 2010 Fund |
| Schwab Target 2040 Index Fund | Schwab Target 2015 Fund |
| Schwab Target 2045 Index Fund | Schwab Target 2020 Fund |
| Schwab Target 2050 Index Fund | Schwab Target 2025 Fund |
| Schwab Target 2055 Index Fund | Schwab Target 2030 Fund |
| Schwab Target 2060 Index Fund | Schwab Target 2035 Fund |
| Schwab Target 2065 Index Fund | Schwab Target 2040 Fund |
| Schwab S&P 500 Index Fund | Schwab Target 2045 Fund |
| Schwab Small-Cap Index Fund® | Schwab Target 2050 Fund |
| Schwab Total Stock Market Index Fund® | Schwab Target 2055 Fund |
| Schwab U.S. Large-Cap Growth Index Fund | Schwab Target 2060 Fund |
| Schwab U.S. Large-Cap Value Index Fund | Schwab Target 2065 Fund |
| Schwab U.S. Mid-Cap Index Fund | Schwab Fundamental US Large Company Index Fund |
| Schwab International Index Fund® | Schwab Fundamental US Small Company Index Fund |
| Schwab MarketTrack All Equity Portfolio™ | Schwab Fundamental International Large Company Index Fund |
| Schwab MarketTrack Growth Portfolio™ | Schwab Fundamental International Small Company Index Fund |
| Schwab MarketTrack Balanced Portfolio™ | Schwab Fundamental Emerging Markets Large Company Index Fund |
| Schwab MarketTrack Conservative Portfolio™ | Schwab Fundamental Global Real Estate Index Fund |
| Schwab International Opportunities Fund | Schwab Monthly Income Fund - Target Payout |
| Schwab Balanced Fund | Schwab Monthly Income Fund - Flexible Payout |
| Schwab Core Equity Fund | Schwab Monthly Income Fund - Income Payout |
The Schwab Target Index Funds are “funds of funds.” Each of the funds seeks to achieve its investment objective by investing primarily in affiliated Schwab exchange-traded funds (ETFs). The funds may also invest in affiliated Schwab Funds and unaffiliated third-party ETFs and mutual funds (all such ETFs and mutual funds referred to herein as "underlying funds"), in accordance with their target portfolio allocation. Each fund may also invest directly in equity and fixed-income securities, cash and cash equivalents, including money market securities.
Each fund in this report offers one share class. Shares are bought and sold at closing net asset value per share (NAV), which is the price for all outstanding shares of a fund. Each share has a par value of 1/1,000 of a cent, and the funds’ Board of Trustees (the Board) may authorize the issuance of as many shares as necessary.
Each fund maintains its own account for purposes of holding assets and accounting, and is considered a separate entity for tax purposes. Within its account, each fund may also keep certain assets in segregated accounts, as required by securities law.
2. Significant Accounting Policies:
The following is a summary of the significant accounting policies the funds use in their preparation of financial statements. The funds follow the investment company accounting and reporting guidance of the Financial Accounting Standards Board (FASB) Accounting Standard Codification Topic 946 Financial Services — Investment Companies. The accounting policies are in conformity with accounting principles generally accepted in the United States of America (GAAP).
The financial statements of the funds should be read in conjunction with the underlying funds’ financial statements. For more information about the underlying funds’ operations and policies, please refer to those funds’ semiannual and annual reports, which are filed with the U.S. Securities and Exchange Commission (SEC) and are available on the SEC’s website at www.sec.gov.
Schwab Target Index Funds | Semiannual Report
Schwab Target Index Funds
Financial Notes, unaudited (continued)
2. Significant Accounting Policies (continued):
(a) Security Valuation:
Pursuant to Rule 2a-5 under the 1940 Act, the Board has designated authority to a Valuation Designee, the funds’ investment adviser, to make fair valuation determinations under adopted procedures, subject to Board oversight. The investment adviser has formed a Pricing Committee to administer the pricing and valuation of portfolio securities and other assets and to ensure that prices used for internal purposes or provided by third parties reasonably reflect fair value. The Valuation Designee may utilize independent pricing services, quotations from securities and financial instrument dealers and other market sources to determine fair value.
Securities held in the fund’s portfolio are valued every business day. The following valuation policies and procedures are used by the Valuation Designee to value various types of securities:
• Securities traded on an exchange or over-the-counter: Traded securities are valued at the closing value for the day, or, on days when no closing value has been reported, at the mean of the most recent bid and ask quotes.
• Mutual funds: Mutual funds are valued at their respective NAVs.
• Cash management sweep time deposits: Balances held in cash management sweep time deposits are accounted for on a cost basis, which approximates fair value.
• Securities for which no quoted value is available: The Valuation Designee has adopted procedures to fair value a fund’s securities when market prices are not “readily available” or are unreliable. For example, a security may be fair valued when it’s de-listed or its trading is halted or suspended; when a security’s primary pricing source is unable or unwilling to provide a price; or when a security’s primary trading market is closed during regular market hours. Fair value determinations are made in good faith in accordance with adopted valuation procedures. The Valuation Designee considers a number of factors, including unobservable market inputs, when arriving at fair value. The Valuation Designee may employ methods such as the review of related or comparable assets or liabilities, related market activities, recent transactions, market multiples, book values, transactional back-testing, disposition analysis and other relevant information. Due to the subjective and variable nature of fair value pricing, there can be no assurance that a fund could obtain the fair value assigned to the security upon the sale of such security.
In accordance with the authoritative guidance on fair value measurements and disclosures under GAAP, the funds disclose the fair value of their investments in a hierarchy that prioritizes the significant inputs to valuation methods used to measure the fair value. The hierarchy gives the highest priority to valuations based upon unadjusted quoted prices in active markets for identical assets or liabilities (Level 1 measurements) and the lowest priority to valuations based upon unobservable inputs that are significant to the valuation (Level 3 measurements). If inputs used to measure the financial instruments fall within different levels of the hierarchy, the categorization is based on the lowest level input that is significant to the valuation. If it is determined that either the volume and/or level of activity for an asset or liability has significantly decreased (from normal conditions for that asset or liability) or price quotations or observable inputs are not associated with orderly transactions, increased analysis and management judgment will be required to estimate fair value.
The three levels of the fair value hierarchy are as follows:
• Level 1 — quoted prices in active markets for identical investments — Investments whose values are based on quoted market prices in active markets, and whose values are therefore classified as Level 1 prices, include active listed equities, mutual funds and ETFs. Investments in mutual funds are valued daily at their NAVs, and investments in ETFs are valued daily at the last reported sale price or the official closing price, which are classified as Level 1 prices, without consideration to the classification level of the underlying securities held by an underlying fund.
• Level 2 — other significant observable inputs (including quoted prices for similar securities, interest rates, prepayment speeds, credit risk, etc.) — Investments that trade in markets that are not considered to be active, but whose values are based on quoted market prices, dealer quotations or valuations provided by alternative pricing sources supported by observable inputs are classified as Level 2 prices. These generally include U.S. government and sovereign obligations, most government agency securities, investment-grade corporate bonds, certain mortgage products, less liquid listed equities, and state, municipal and provincial obligations.
• Level 3 — significant unobservable inputs (including the Valuation Designee’s assumptions in determining the fair value of investments) — Investments whose values are classified as Level 3 prices have significant unobservable inputs, as they may trade infrequently or not at all. When observable prices are not readily available for these securities, one or more valuation methods are used for which sufficient and reliable data is available. The inputs used in estimating the value of Level 3 prices may include the original transaction price, quoted prices for similar securities or assets in active markets, completed or
Schwab Target Index Funds | Semiannual Report
Schwab Target Index Funds
Financial Notes, unaudited (continued)
2. Significant Accounting Policies (continued):
pending third-party transactions in the underlying investment or comparable issuers, and changes in financial ratios or cash flows. Level 3 prices may also be adjusted to reflect illiquidity and/or non-transferability, with the amount of such discount estimated in the absence of market information. Assumptions used due to the lack of observable inputs may significantly impact the resulting fair value and therefore the funds’ results of operations.
The inputs or methodology used for valuing securities are not necessarily an indication of the risk associated with investing in those securities.
The levels associated with valuing the funds’ investments as of September 30, 2022 are disclosed in the Portfolio Holdings.
(b) Accounting Policies for certain Portfolio Investments (if held):
Cash Management Transactions: Effective May 23, 2022 Brown Brothers Harriman & Co. (BBH) was replaced by Citibank, N.A as custodian of the funds. The funds no longer subscribes to the BBH Cash Management Service Sweep (CMS Sweep). The BBH CMS Sweep was an investment product that automatically swept the funds’ cash balances into overnight offshore time deposits with either the BBH Grand Cayman branch or a branch of a pre-approved commercial bank. This fully automated program allowed the funds to earn interest on cash balances. Excess cash invested with deposit institutions domiciled outside of the U.S., as with any offshore deposit, was subject to sovereign actions in the jurisdiction of the deposit institution including, but not limited to, freeze, seizure or diminution. The funds assumed the risk associated with the repayment of principal and payment of interest on such instruments by the institution with which the deposit was ultimately placed. The funds terminated the CMS Sweep program and cash was returned to the funds prior to terminating services with BBH.
Cash Investments: The funds may invest a portion of their assets in cash. Cash includes cash bank balances in an interest-bearing demand deposit account with maturity on demand by the funds.
(c) Security Transactions:
Security transactions are recorded as of the date the order to buy or sell the security is executed. Realized gains and losses from security transactions are based on the identified costs of the securities involved.
(d) Investment Income:
Interest income is recorded as it accrues. Dividends and distributions from portfolio securities and underlying funds are recorded on the date they are effective (the ex-dividend date). Any distributions from underlying funds are recorded in accordance with the character of the distributions as designated by the underlying funds.
(e) Expenses:
Pursuant to the Amended and Restated Advisory Agreement (Advisory Agreement) between the investment adviser and the funds, the investment adviser will pay the operating expenses of each fund, including the cost of transfer agency, custody, fund administration, legal, audit and other services, but excluding shareholder servicing fees, acquired fund fees and expenses, taxes, any brokerage expenses and extraordinary or non-routine expenses. Acquired fund fees and expenses, are indirect expenses incurred by the funds through its investments in underlying funds and are contractually waived by the investment adviser (see financial note 4 for additional information).
(f) Distributions to Shareholders:
The funds make distributions from net investment income and net realized capital gains, if any, once a year. To receive a distribution, you must be a registered shareholder on the record date. Distributions are paid to shareholders on the payable date.
(g) Accounting Estimates:
The accounting policies described in this report conform to GAAP. Notwithstanding this, shareholders should understand that in order to follow these principles, fund management has to make estimates and assumptions that affect the information reported in the financial statements. It’s possible that once the results are known, they may turn out to be different from these estimates and these differences may be material.
Schwab Target Index Funds | Semiannual Report
Schwab Target Index Funds
Financial Notes, unaudited (continued)
2. Significant Accounting Policies (continued):
(h) Federal Income Taxes:
The funds intend to meet federal income and excise tax requirements for regulated investment companies under subchapter M of the Internal Revenue Code, as amended. Accordingly, the funds distribute substantially all of their net investment income and net realized capital gains, if any, to their respective shareholders each year. As long as a fund meets the tax requirements, it is not required to pay federal income tax.
(i) Indemnification:
Under the funds’ organizational documents, the officers and trustees are indemnified against certain liabilities arising out of the performance of their duties to the funds. In addition, in the normal course of business the funds enter into contracts with their vendors and others that provide general indemnifications. The funds’ maximum exposure under these arrangements is unknown as this would involve future claims that may be made against the funds. However, based on experience, the funds expect the risk of loss attributable to these arrangements to be remote.
(j) Regulatory Update:
In October 2022, the SEC adopted rule and form amendments to require mutual funds and ETFs to transmit concise and visually engaging streamlined annual and semiannual reports to shareholders that highlight key information deemed important for retail investors to assess and monitor their fund investments. Other information, including financial statements, will no longer appear in funds’ streamlined shareholder reports but must be available online, delivered free of charge upon request, and filed on a semiannual basis on Form N-CSR. The rule and form amendments are effective 60 days after publication in the Federal Register. The compliance date is 18 months following the effective date. At this time, management is evaluating the impact of these rule and form amendment changes on the content of the current shareholder report and the newly created annual and semiannual streamlined shareholder reports.
3. Risk Factors:
Investing in the funds may involve certain risks, as discussed in the funds’ prospectus, including, but not limited to, those described below. Any of these risks could cause an investor to lose money.
Asset Allocation Risk. The funds are subject to the risk that the selection of the underlying funds and the allocation of a fund’s assets among the various asset classes and market segments may cause the fund to underperform other funds with a similar investment objective. The funds are not managed to maximize tax efficiency for taxable shareholder accounts. Investors should consider whether a fund is an appropriate investment in light of their current financial position and retirement needs.
Conflicts of Interest Risk. The investment adviser’s authority to select and substitute underlying funds from a variety of affiliated and unaffiliated mutual funds and ETFs may create a conflict of interest because the fees paid to it and its affiliates by some underlying funds are higher than the fees paid by other underlying funds. The investment adviser also may have an incentive to select an affiliated underlying fund for other reasons, including to increase assets under management or to support new investment strategies. In addition, other conflicts of interest may exist where the best interests of the affiliated underlying fund may not be aligned with those of a fund. However, the investment adviser is a fiduciary to each fund and is legally obligated to act in the fund’s best interests when selecting underlying funds.
Market Risk. Financial markets rise and fall in response to a variety of factors, sometimes rapidly and unpredictably. Markets may be impacted by economic, political, regulatory and other conditions, including economic sanctions and other government actions. In addition, the occurrence of global events, such as war, terrorism, environmental disasters, natural disasters and epidemics, may also negatively affect the financial markets. As with any investment whose performance is tied to these markets, the value of an investment in the funds will fluctuate, which means that an investor could lose money over short or long periods.
ETF Risk. When a fund invests in an ETF, it will bear a proportionate share of the ETF’s expenses. In addition, lack of liquidity in the market for an ETF’s shares can result in its value being more volatile than the underlying portfolio of securities.
Direct Investment Risk. The funds may invest directly in cash, cash equivalents and equity and fixed-income securities, including money market securities, to maintain their asset allocations. A fund’s direct investment in these securities is subject to the same or similar risks as an underlying fund’s investment in the same securities.
Underlying Fund Investment Risk. Before investing in the funds, investors should assess the risks associated with the underlying funds in which the funds may invest, which include any combination of the risks described below.
Schwab Target Index Funds | Semiannual Report
Schwab Target Index Funds
Financial Notes, unaudited (continued)
3. Risk Factors (continued):
• Investment Risk. The funds may experience losses with respect to their investment in an underlying fund. Further, there is no guarantee that an underlying fund will be able to achieve its objective.
• Fixed-Income Risk. Interest rates rise and fall over time, which will affect an underlying fund’s yield and share price. A change in a central bank’s monetary policy or economic conditions, among other things, may result in a change in interest rates. A rise in interest rates could cause an underlying fund’s share price to fall. The credit quality of a portfolio investment could also cause an underlying fund’s share price to fall. An underlying fund could lose money if the issuer or guarantor of a portfolio investment or the counterparty to a derivatives contract fails to make timely principal or interest payments or otherwise honor its obligations. Fixed-income securities may be paid off earlier or later than expected. Either situation could cause an underlying fund to hold securities paying lower-than-market rates of interest, which could hurt an underlying fund’s yield or share price. Below investment-grade bonds (junk bonds) involve greater credit risk, are more volatile, involve greater risk of price declines and may be more susceptible to economic downturns than investment-grade securities.
• Equity Risk. The prices of equity securities rise and fall daily. These price movements may result from factors affecting individual companies, industries or the securities market as a whole. In addition, equity markets tend to move in cycles, which may cause stock prices to fall over short or extended periods of time.
• Market Capitalization Risk. Securities issued by companies of different market capitalizations tend to go in and out of favor based on market and economic conditions. During a period when securities of a particular market capitalization fall behind other types of investments, an underlying fund’s performance could be impacted.
• Money Market Fund Risk. The funds may invest in underlying money market funds that either seek to maintain a stable $1.00 net asset value (“stable share price money market funds”) or that have a share price that fluctuates (“variable share price money market funds”). Although an underlying stable share price money market fund seeks to maintain a stable $1.00 net asset value, it is possible to lose money by investing in such a money market fund. Because the share price of an underlying variable share price money market fund will fluctuate, when a fund sells the shares it owns they may be worth more or less than what the fund originally paid for them. In addition, neither type of money market fund is designed to offer capital appreciation. Certain underlying money market funds may impose a fee upon the sale of shares or may temporarily suspend the ability to sell shares if such fund’s liquidity falls below required minimums.
• Foreign Investment Risk. An underlying fund’s investments in securities of foreign issuers involve certain risks that may be greater than those associated with investments in securities of U.S. issuers. These include risks of adverse changes in foreign economic, political, regulatory and other conditions; changes in currency exchange rates or exchange control regulations (including limitations on currency movements and exchanges); the imposition of economic sanctions or other government restrictions; differing accounting, auditing, financial reporting and legal standards and practices; differing securities market structures; and higher transaction costs. These risks may negatively impact the value or liquidity of an underlying fund’s investments, and could impair the underlying fund’s ability to meet its investment objective or invest in accordance with its investment strategy. There is a risk that investments in securities denominated in, and/or receiving revenues in, foreign currencies will decline in value relative to the U.S. dollar.
• Emerging Markets Risk. Emerging market countries may be more likely to experience political turmoil or rapid changes in market or economic conditions than more developed countries. Emerging market countries often have less uniformity in accounting, auditing, financial reporting and recordkeeping requirements and greater risk associated with the custody of securities. In addition, the financial stability of issuers (including governments) in emerging market countries may be more precarious than in developed countries. As a result, there may be an increased risk of illiquidity and price volatility associated with an underlying fund’s investments in emerging market countries, which may be magnified by currency fluctuations relative to the U.S. dollar, and, at times, it may be difficult to value such investments.
• Derivatives Risk. An underlying fund may use derivatives to enhance returns or hedge against market declines. Examples of derivatives are options, futures, options on futures and swaps. An option is the right, but not the obligation, to buy or sell an instrument at a specific price on or before a specific date. A future is an agreement to buy or sell a financial instrument at a specific price on a specific day. A swap is an agreement whereby two parties agree to exchange payment streams calculated in relation to a rate, index, instrument or certain securities and a predetermined amount. A credit default swap is an agreement in which the seller agrees to make a payment to the buyer in the event of a specified credit event in exchange for a fixed payment or series of fixed payments.
An underlying fund’s use of derivative instruments involves risks different from, or possibly greater than, the risks associated with investing directly in securities and other traditional investments. Certain of these risks, such as leverage risk, liquidity risk and market risk, are discussed elsewhere in this section. An underlying fund’s use of derivatives is also subject to lack of
Schwab Target Index Funds | Semiannual Report
Schwab Target Index Funds
Financial Notes, unaudited (continued)
3. Risk Factors (continued):
availability risk, valuation risk, correlation risk and tax risk. Lack of availability risk is the risk that suitable derivative transactions may not be available in all circumstances for risk management or other purposes. Valuation risk is the risk that a particular derivative may be valued incorrectly. Correlation risk is the risk that changes in the value of the derivative may not correlate perfectly with the underlying asset, rate or index. Tax risk is the risk that the use of derivatives may cause an underlying fund to realize higher amounts of short-term capital gains. An underlying fund’s use of derivatives could reduce the underlying fund’s performance, increase its volatility, and could cause the underlying fund to lose more than the initial amount invested. The use of derivatives that are subject to regulation by the Commodity Futures Trading Commission (CFTC) by an underlying fund could cause a fund to become a commodity pool, which would require the fund to comply with certain CFTC rules.
• Leverage Risk. Certain underlying fund transactions, such as derivatives transactions, short sales, reverse repurchase agreements, and mortgage dollar rolls, may give rise to a form of leverage and may expose an underlying fund to greater risk. Leverage tends to magnify the effect of any decrease or increase in the value of an underlying fund’s portfolio securities, which means even a small amount of leverage can have a disproportionately large impact on the underlying fund.
• Concentration Risk. To the extent that an underlying fund’s portfolio is concentrated in the securities of issuers in a particular market, industry, group of industries, sector or asset class, the underlying fund may be adversely affected by the performance of those securities, may be subject to increased price volatility and may be more vulnerable to adverse economic, market, political or regulatory occurrences affecting that market, industry, group of industries, sector or asset class.
• Investment Style Risk. Certain underlying funds seek to track the performance of various segments of the stock market, as measured by their respective indices. Such underlying funds follow these stocks during upturns as well as downturns. Because of their indexing strategy, these underlying funds do not take steps to reduce market exposure or to lessen the effects of a declining market. In addition, because of an underlying fund’s expenses, the underlying fund’s performance is normally below that of the index. Errors relating to an index may occur from time to time and may not be identified by the underlying fund’s index provider for a period of time. In addition, market disruptions could cause delays in an underlying fund’s index’s rebalancing schedule. Such errors and/or market disruptions may result in losses for an underlying fund.
• Liquidity Risk. An underlying fund may be unable to sell certain securities, such as illiquid securities, readily at a favorable time or price, or the underlying fund may have to sell them at a loss.
• Portfolio Turnover Risk. Certain of the underlying funds may buy and sell portfolio securities actively. If they do, their portfolio turnover rate and transaction costs will rise, which may lower the underlying fund’s performance and may increase the likelihood of capital gains distributions.
Please refer to the funds’ prospectus for a more complete description of the principal risks of investing in the funds.
4. Affiliates and Affiliated Transactions:
Investment Adviser
Charles Schwab Investment Management, Inc., dba Schwab Asset Management, a wholly owned subsidiary of The Charles Schwab Corporation, serves as each fund’s investment adviser pursuant to the Advisory Agreement between it and the trust.
For its advisory and administrative services to the funds, the investment adviser is entitled to receive an annual fee of 0.08%, payable monthly, based on a percentage of each fund’s average daily net assets.
Contractual Expense Limitations
The investment adviser and its affiliates have agreed with the funds, for so long as the investment adviser serves as the investment adviser to the funds, which may only be amended or terminated with the approval of the Board, to maintain the “net operating expenses” of each of the funds (including acquired fund fees and expenses, but excluding taxes and certain non-routine expenses) at 0.08%.
In the above agreement, the investment adviser and its affiliates have contractually agreed to waive acquired fund fees and expenses of the underlying funds in which the funds invest.
Schwab Target Index Funds | Semiannual Report
Schwab Target Index Funds
Financial Notes, unaudited (continued)
4. Affiliates and Affiliated Transactions (continued):
Investments in Affiliates
The funds may engage in certain transactions involving related parties. Pursuant to an exemptive order issued by the SEC, the funds may invest in other related funds. As of September 30, 2022, each Schwab Target Index Fund’s ownership percentages of other related funds’ shares are:
| UNDERLYING FUNDS | SCHWAB
TARGET
2010
INDEX
FUND | SCHWAB
TARGET
2015
INDEX
FUND | SCHWAB
TARGET
2020
INDEX
FUND | SCHWAB
TARGET
2025
INDEX
FUND | SCHWAB
TARGET
2030
INDEX
FUND | SCHWAB
TARGET
2035
INDEX
FUND | SCHWAB
TARGET
2040
INDEX
FUND | SCHWAB
TARGET
2045
INDEX
FUND | SCHWAB
TARGET
2050
INDEX
FUND | SCHWAB
TARGET
2055
INDEX
FUND | SCHWAB
TARGET
2060
INDEX
FUND | SCHWAB
TARGET
2065
INDEX
FUND |
| Schwab Emerging Markets Equity ETF | —% | —% | —% | 0.1% | 0.3% | 0.2% | 0.3% | 0.3% | 0.3% | 0.2% | 0.3% | 0.0%* |
| Schwab International Equity ETF | 0.0%* | 0.0%* | 0.1% | 0.3% | 0.5% | 0.4% | 0.5% | 0.3% | 0.4% | 0.3% | 0.3% | 0.0%* |
| Schwab Short-Term U.S. Treasury ETF | 0.0%* | 0.0%* | 0.2% | 0.2% | 0.2% | 0.1% | 0.1% | 0.0%* | —% | —% | —% | —% |
| Schwab U.S. Aggregate Bond ETF | 0.3% | 0.4% | 1.4% | 2.3% | 3.0% | 1.4% | 1.3% | 0.5% | 0.5% | 0.2% | 0.2% | 0.0%* |
| Schwab U.S. Large-Cap ETF | 0.0%* | 0.1% | 0.2% | 0.5% | 1.0% | 0.7% | 0.9% | 0.6% | 0.7% | 0.5% | 0.6% | 0.1% |
| Schwab U.S. REIT ETF | 0.0%* | 0.0%* | 0.1% | 0.3% | 0.6% | 0.4% | 0.6% | 0.4% | 0.5% | 0.3% | 0.4% | 0.0%* |
| Schwab U.S. Small-Cap ETF | 0.0%* | 0.0%* | 0.0%* | 0.1% | 0.2% | 0.1% | 0.2% | 0.1% | 0.2% | 0.1% | 0.2% | 0.0%* |
| Schwab U.S. TIPS ETF | 0.0%* | 0.0%* | 0.1% | 0.1% | 0.0%* | —% | —% | —% | —% | —% | —% | —% |
| Schwab Variable Share Price Money Fund, Ultra Shares | 0.1% | 0.1% | 0.2% | 0.3% | 0.2% | 0.1% | 0.1% | 0.0%* | 0.0%* | 0.0%* | —% | —% |
Interfund Transactions
The funds may engage in direct transactions with certain other funds in the Fund Complex (for definition refer to the Trustees and Officers section) in accordance with procedures adopted by the Board pursuant to Rule 17a-7 under the 1940 Act. When one fund is seeking to sell a security that another is seeking to buy, an interfund transaction can allow both funds to benefit by reducing transaction costs. This practice is limited to funds that share the same investment adviser, trustees and/or officers. For the period ended September 30, 2022, each fund’s purchases and sales of securities with other funds in the Fund Complex as well as any realized gains (losses) were as follows:
| | PURCHASE COST | SALE PROCEEDS | REALIZED GAINS (LOSSES) |
| Schwab Target 2010 Index Fund | $113,013 | $620,946 | ($37,475) |
| Schwab Target 2015 Index Fund | 155,356 | 896,972 | (30,617) |
| Schwab Target 2020 Index Fund | 140,364 | 1,121,981 | (65,214) |
| Schwab Target 2025 Index Fund | 460,879 | 1,902,349 | (343,260) |
| Schwab Target 2030 Index Fund | 971,214 | 15,559 | (1,942) |
| Schwab Target 2035 Index Fund | 469,673 | 8,094 | (1,024) |
| Schwab Target 2040 Index Fund | 315,980 | 4,992 | (631) |
| Schwab Target 2045 Index Fund | 341,257 | 185,634 | (33,224) |
| Schwab Target 2050 Index Fund | 897,681 | 297,540 | (56,628) |
| Schwab Target 2055 Index Fund | 1,075,172 | 178,781 | (32,198) |
| Schwab Target 2060 Index Fund | 841,141 | 154,321 | (28,525) |
| Schwab Target 2065 Index Fund | 471,098 | 553,633 | (97,931) |
| | | | |
Schwab Target Index Funds | Semiannual Report
Schwab Target Index Funds
Financial Notes, unaudited (continued)
4. Affiliates and Affiliated Transactions (continued):
Interfund Borrowing and Lending
Pursuant to an exemptive order issued by the SEC, the funds may enter into interfund borrowing and lending transactions with other funds in the Fund Complex. All loans are for temporary or emergency purposes and the interest rate to be charged will be the average of the overnight repurchase agreement rate and the short-term bank loan rate. All loans are subject to numerous conditions designed to ensure fair and equitable treatment of all participating funds. The interfund lending facility is subject to the oversight and periodic review by the Board. The funds had no interfund borrowing or lending activity during the period.
5. Board of Trustees:
The Board may include people who are officers and/or directors of the investment adviser or its affiliates. Federal securities law limits the percentage of such “interested persons” who may serve on a trust’s board, and the trust was in compliance with these limitations throughout the report period. The trust does not pay any interested or non-interested trustees (independent trustees). The independent trustees are paid by the investment adviser. For information regarding the trustees, please refer to the Trustees and Officers table at the end of this report.
6. Borrowing from Banks:
During the period, the funds were participants with other funds in the Fund Complex in a joint, syndicated, committed $850 million line of credit (the Syndicated Credit Facility), which matured on September 29, 2022. On September 29, 2022, the Syndicated Credit Facility was amended to run for a new 364 day period with the line of credit amount increasing to $1 billion, maturing on September 28, 2023. Under the terms of the Syndicated Credit Facility, in addition to interest charged on any borrowings by a fund, the investment adviser paid a commitment fee of 0.15% per annum on the funds’ proportionate share of the unused portion of the Syndicated Credit Facility.
During the period, the funds were participants with other funds in the Fund Complex in a joint, unsecured, uncommitted $400 million line of credit (the Uncommitted Credit Facility), with State Street Bank and Trust Company, which matured on September 29, 2022. On September 29, 2022, the Uncommitted Credit Facility was amended to run for a new 364 day period with the line of credit amount remaining unchanged, maturing on September 28, 2023. Under the terms of the Uncommitted Credit Facility, the investment adviser pays interest on the amount a fund borrows. There were no borrowings from either line of credit during the period.
The funds also have access to custodian overdraft facilities. A fund may have utilized the overdraft facility and incurred an interest expense, which is paid by the investment adviser. The interest expense is determined based on a negotiated rate above the current Federal Funds Rate.
7. Purchases and Sales of Investment Securities:
For the period ended September 30, 2022, purchases and sales of securities (excluding short-term obligations) were as follows:
| | PURCHASES
OF SECURITIES | SALES
OF SECURITIES |
| Schwab Target 2010 Index Fund | $3,204,328 | $6,452,052 |
| Schwab Target 2015 Index Fund | 4,859,210 | 10,438,396 |
| Schwab Target 2020 Index Fund | 19,336,607 | 23,636,330 |
| Schwab Target 2025 Index Fund | 32,398,985 | 26,144,412 |
| Schwab Target 2030 Index Fund | 69,769,361 | 30,497,761 |
| Schwab Target 2035 Index Fund | 53,545,581 | 16,298,730 |
| Schwab Target 2040 Index Fund | 65,356,486 | 14,498,223 |
| Schwab Target 2045 Index Fund | 51,635,667 | 6,442,904 |
| Schwab Target 2050 Index Fund | 52,886,819 | 5,669,869 |
| Schwab Target 2055 Index Fund | 40,245,451 | 2,843,493 |
| Schwab Target 2060 Index Fund | 44,586,363 | 4,119,279 |
| Schwab Target 2065 Index Fund | 12,622,875 | 1,468,118 |
Schwab Target Index Funds | Semiannual Report
Schwab Target Index Funds
Financial Notes, unaudited (continued)
As of September 30, 2022, the tax basis cost of the funds’ investments and gross unrealized appreciation and depreciation were as follows:
| | TAX COST | GROSS UNREALIZED
APPRECIATION | GROSS UNREALIZED
DEPRECIATION | NET UNREALIZED
APPRECIATION
(DEPRECIATION) |
| Schwab Target 2010 Index Fund | $45,648,316 | $1,975,445 | ($3,709,488) | ($1,734,043) |
| Schwab Target 2015 Index Fund | 60,023,765 | 3,091,187 | (4,168,955) | (1,077,768) |
| Schwab Target 2020 Index Fund | 247,650,846 | 11,584,548 | (21,465,761) | (9,881,213) |
| Schwab Target 2025 Index Fund | 456,866,722 | 19,726,823 | (42,329,361) | (22,602,538) |
| Schwab Target 2030 Index Fund | 731,469,967 | 22,021,535 | (67,338,127) | (45,316,592) |
| Schwab Target 2035 Index Fund | 451,953,739 | 11,982,290 | (39,101,081) | (27,118,791) |
| Schwab Target 2040 Index Fund | 580,568,950 | 15,268,889 | (49,815,797) | (34,546,908) |
| Schwab Target 2045 Index Fund | 343,172,960 | 9,057,526 | (27,948,663) | (18,891,137) |
| Schwab Target 2050 Index Fund | 423,074,107 | 7,079,258 | (35,837,877) | (28,758,619) |
| Schwab Target 2055 Index Fund | 272,187,197 | 2,050,528 | (23,065,894) | (21,015,366) |
| Schwab Target 2060 Index Fund | 332,267,630 | 988,851 | (28,769,106) | (27,780,255) |
| Schwab Target 2065 Index Fund | 40,611,923 | - | (8,208,844) | (8,208,844) |
Capital loss carryforwards have no expiration and may be used to offset future realized capital gains for federal income tax purposes. As of March 31, 2022, the funds had capital loss carryforwards available as follows:
| | |
| Schwab Target 2010 Index Fund | $— |
| Schwab Target 2015 Index Fund | — |
| Schwab Target 2020 Index Fund | — |
| Schwab Target 2025 Index Fund | — |
| Schwab Target 2030 Index Fund | — |
| Schwab Target 2035 Index Fund | — |
| Schwab Target 2040 Index Fund | — |
| Schwab Target 2045 Index Fund | — |
| Schwab Target 2050 Index Fund | — |
| Schwab Target 2055 Index Fund | — |
| Schwab Target 2060 Index Fund | — |
| Schwab Target 2065 Index Fund | 13,722 |
For tax purposes, net realized capital losses and late-year ordinary losses incurred after October 31, may be deferred and treated as occurring on the first day of the following fiscal year. For the fiscal year ended March 31, 2022, the funds had capital losses deferred as follows:
| Schwab Target 2010 Index Fund | $4,100 |
| Schwab Target 2015 Index Fund | 16,400 |
| Schwab Target 2020 Index Fund | 278,513 |
| Schwab Target 2025 Index Fund | 206,491 |
| Schwab Target 2030 Index Fund | 674,908 |
| Schwab Target 2035 Index Fund | 297,333 |
| Schwab Target 2040 Index Fund | 880,426 |
| Schwab Target 2045 Index Fund | 357,884 |
| Schwab Target 2050 Index Fund | 312,573 |
| Schwab Target 2055 Index Fund | 134,098 |
| Schwab Target 2060 Index Fund | 198,866 |
| Schwab Target 2065 Index Fund | — |
Schwab Target Index Funds | Semiannual Report
Schwab Target Index Funds
Financial Notes, unaudited (continued)
8. Federal Income Taxes (continued):
The tax-basis components of distributions and components of distributable earnings on a tax basis are finalized at fiscal year-end; accordingly, tax basis balances have not been determined as of September 30, 2022. The tax-basis components of distributions paid during the fiscal year ended March 31, 2022 were as follows:
| | PRIOR FISCAL YEAR END DISTRIBUTIONS |
| | ORDINARY
INCOME | LONG-TERM
CAPITAL
GAINS |
| Schwab Target 2010 Index Fund | $1,158,303 | $302,416 |
| Schwab Target 2015 Index Fund | 1,536,817 | 589,578 |
| Schwab Target 2020 Index Fund | 6,195,620 | 1,112,540 |
| Schwab Target 2025 Index Fund | 9,855,412 | 361,318 |
| Schwab Target 2030 Index Fund | 14,401,824 | 290,007 |
| Schwab Target 2035 Index Fund | 8,510,965 | 140,021 |
| Schwab Target 2040 Index Fund | 10,942,651 | 159,731 |
| Schwab Target 2045 Index Fund | 6,427,587 | 57,798 |
| Schwab Target 2050 Index Fund | 7,629,666 | 43,258 |
| Schwab Target 2055 Index Fund | 4,600,497 | 24,230 |
| Schwab Target 2060 Index Fund | 5,654,421 | 34,898 |
| Schwab Target 2065 Index Fund | 294,976 | — |
Distributions paid to shareholders are based on net investment income and net realized gains determined on a tax basis, which may differ from net investment income and net realized gains for financial reporting purposes. These differences reflect the differing character of certain income items and net realized gains and losses for financial statement and tax purposes, and may result in reclassification among certain capital accounts on the financial statements. The fund may also designate a portion of the amount paid to redeeming shareholders as a distribution for tax purposes.
As of March 31, 2022, management has reviewed the tax positions for open periods (for federal purposes, three years from the date of filing and for state purposes, four years from the date of filing) as applicable to the funds, and has determined that no provision for income tax is required in the funds’ financial statements. The funds recognize interest and penalties, if any, related to unrecognized tax benefits as income tax expense in the Statement of Operations. During the fiscal year ended March 31, 2022, the funds did not incur any interest or penalties.
9. Subsequent Events:
Management has determined there are no subsequent events or transactions through the date the financial statements were issued that would have materially impacted the financial statements as presented.
Schwab Target Index Funds | Semiannual Report
Schwab Target Index Funds
Shareholder Vote Results (unaudited)
A Special Meeting of Shareholders of Schwab Capital Trust (the “Trust”) was held on June 1, 2022, for the purpose of seeking shareholder approval to elect the following individuals as trustees of the Trust: Walter W. Bettinger II, Richard A. Wurster, Michael J. Beer, Robert W. Burns, Nancy F. Heller, David L. Mahoney, Jane P. Moncreiff, Kiran M. Patel, Kimberly S. Patmore, and J. Derek Penn. The number of votes necessary to conduct the Special Meeting and approve the proposal was obtained. The results of the shareholder vote are listed below:
Proposal – To elect each of the
following individuals as trustees of the Trust: | For | Withheld |
| Walter W. Bettinger II | 1,095,577,106.505 | 115,838,980.968 |
| Richard A. Wurster | 1,117,598,789.555 | 93,817,297.918 |
| Michael J. Beer | 1,116,890,447.505 | 94,525,639.968 |
| Robert W. Burns | 1,117,915,860.110 | 93,500,227.363 |
| Nancy F. Heller | 1,119,878,732.134 | 91,537,355.339 |
| David L. Mahoney | 1,069,125,022.434 | 142,291,065.039 |
| Jane P. Moncreiff | 1,120,187,927.838 | 91,228,159.635 |
| Kiran M. Patel | 1,116,689,111.571 | 94,726,975.902 |
| Kimberly S. Patmore | 1,119,941,056.059 | 91,475,031.414 |
| J. Derek Penn | 1,117,666,014.121 | 93,750,073.352 |
Schwab Target Index Funds | Semiannual Report
Schwab Target Index Funds
Liquidity Risk Management Program (unaudited)
The funds have adopted and implemented a liquidity risk management program (the “program”) as required by Rule 22e-4 under the Investment Company Act of 1940, as amended. The funds’ Board of Trustees (the “Board”) has designated the funds’ investment adviser, Charles Schwab Investment Management, Inc., dba Schwab Asset Management, as the administrator of the program. Personnel of the investment adviser or its affiliates conduct the day-to-day operation of the program.
Under the program, the investment adviser manages a fund’s liquidity risk, which is the risk that the fund could not meet shareholder redemption requests without significant dilution of remaining shareholders’ interests in the fund. The program is reasonably designed to assess and manage a fund’s liquidity risk, taking into consideration the fund’s investment strategy and the liquidity of its portfolio investments during normal and reasonably foreseeable stressed conditions; its historical redemption history and shareholder concentrations; and its cash holdings and access to other funding sources, including the custodian overdraft facility and lines of credit. The investment adviser’s process of determining the degree of liquidity of each fund’s investments is supported by third-party liquidity assessment vendors.
The funds’ Board reviewed a report at its meeting held on September 19, 2022 prepared by the investment adviser regarding the operation and effectiveness of the program for the period June 1, 2021, through May 31, 2022, which included individual fund liquidity risk metrics. No significant liquidity events impacting any of the funds were noted in the report. In addition, the investment adviser provided its assessment that the program had been operating effectively in managing each fund’s liquidity risk.
Schwab Target Index Funds | Semiannual Report
Schwab Target Index Funds
Investment Advisory Agreement Approval
The Investment Company Act of 1940, as amended (the 1940 Act), requires that the continuation of a fund’s investment advisory agreement must be specifically approved (1) by the vote of the trustees or by a vote of the shareholders of the fund, and (2) by the vote of a majority of the trustees who are not parties to the investment advisory agreement or “interested persons” of any party (the Independent Trustees), cast in person at a meeting called for the purpose of voting on such approval. In connection with such approvals, the fund’s trustees must request and evaluate, and the investment adviser is required to furnish, such information as may be reasonably necessary to evaluate the terms of the investment advisory agreement.
The Board of Trustees (the Board or the Trustees, as appropriate) calls and holds one or more meetings each year that are dedicated, in whole or in part, to considering whether to renew the investment advisory agreement (the Agreement) between Schwab Capital Trust (the Trust) and Charles Schwab Investment Management, Inc. (dba Schwab Asset Management) (the investment adviser) with respect to the existing funds in the Trust, including Schwab Target 2010 Index Fund, Schwab Target 2015 Index Fund, Schwab Target 2020 Index Fund, Schwab Target 2025 Index Fund, Schwab Target 2030 Index Fund, Schwab Target 2035 Index Fund, Schwab Target 2040 Index Fund, Schwab Target 2045 Index Fund, Schwab Target 2050 Index Fund, Schwab Target 2055 Index Fund, Schwab Target 2060 Index Fund, and Schwab Target 2065 Index Fund (the Funds), and to review certain other agreements pursuant to which the investment adviser provides investment advisory services to certain other registered investment companies. In preparation for the meeting(s), the Board requests and reviews a wide variety of materials provided by the investment adviser, including information about the investment adviser’s affiliates, personnel, business goals and priorities, profitability, third-party oversight, corporate structure and operations. As part of the renewal process, the Independent Trustees’ legal counsel, on behalf of the Independent Trustees, sends an information request letter to the investment adviser seeking certain relevant information. The responses by the investment adviser are provided to the Trustees in the Board materials for their review prior to their meeting, and the Trustees are provided with the opportunity to request any additional materials. The Board also receives data provided by an independent provider of investment company data. This information is in addition to the detailed information about the Funds that the Board reviews during the course of each year, including information that relates to the Funds’ operations and performance, legal and compliance matters, risk management, portfolio turnover, and sales and marketing activity. In considering the renewal, the Independent Trustees receive advice from Independent Trustees’ legal counsel, including a
memorandum regarding the responsibilities of trustees for the approval of investment advisory agreements. In addition, the Independent Trustees participate in question and answer sessions with representatives of the investment adviser and meet in executive session outside the presence of Fund management.
The Board, including a majority of the Independent Trustees, considered information specifically relating to the continuance of the Agreement with respect to the Funds at meetings held on May 16, 2022 and June 8, 2022, and approved the renewal of the Agreement with respect to the Funds for an additional one-year term at the meeting on June 8, 2022 called for the purpose of voting on such approval.
The Board’s approval of the continuance of the Agreement with respect to the Funds was based on consideration and evaluation of a variety of specific factors discussed at these meetings and at prior meetings, including:
| 1. | the nature, extent and quality of the services provided to each Fund under the Agreement, including the resources of the investment adviser and its affiliates dedicated to the Funds; |
| 2. | each Fund’s investment performance and how it compared to that of certain other comparable mutual funds and benchmark data; |
| 3. | each Fund’s expenses and how those expenses compared to those of certain other similar mutual funds; |
| 4. | the profitability of the investment adviser and its affiliates, including Charles Schwab & Co., Inc. (Schwab), with respect to each Fund, including both direct and indirect benefits accruing to the investment adviser and its affiliates; and |
| 5. | the extent to which economies of scale would be realized as each Fund grows and whether fee levels in the Agreement reflect those economies of scale for the benefit of Fund investors. |
Nature, Extent and Quality of Services. The Board considered the nature, extent and quality of the services provided by the investment adviser to the Funds and the resources of the investment adviser and its affiliates dedicated to the Funds. In this regard, the Trustees evaluated, among other things, the investment adviser’s experience, track record, compliance program, resources dedicated to hiring and retaining skilled personnel and specialized talent, and information security resources. The Trustees also considered information provided by the investment adviser relating to services and support provided with respect to each Fund’s portfolio management team, portfolio strategy, and internal investment guidelines, as well as trading infrastructure, liquidity management, product design and analysis, shareholder communications, securities
Schwab Target Index Funds | Semiannual Report
Schwab Target Index Funds
valuation, fund accounting and custody, and vendor and risk oversight. The Trustees also considered investments the investment adviser has made in its infrastructure, including modernizing the investment adviser’s technology and use of data, increasing expertise in key areas (including portfolio management and trade operations), and improving business continuity, cybersecurity, due diligence, risk management processes, and information security programs, which are designed to provide enhanced services to the Funds and their shareholders. The Trustees considered Schwab’s overall financial condition and its reputation as a full service brokerage firm as well as the wide range of products, services and account features that benefit Fund shareholders who are brokerage clients of Schwab. Following such evaluation, the Board concluded, within the context of its full deliberations, that the nature, extent and quality of services provided by the investment adviser to the Funds and the resources of the investment adviser and its affiliates dedicated to the Funds supported renewal of the Agreement with respect to the Funds.
Fund Performance. The Board considered each Fund’s performance in determining whether to renew the Agreement with respect to such Fund. Specifically, the Trustees considered each Fund’s performance relative to a peer category of other mutual funds and applicable indices/benchmarks, in light of portfolio yield and market trends, as well as in consideration of each Fund’s investment style and strategy attributes and disclosures. As part of this review, the Trustees considered the composition of the peer category, selection criteria and the reputation of the independent provider of investment company data who prepared the peer category analysis. In evaluating the performance of each Fund, the Trustees considered the risk profile for such Fund and the appropriateness of the benchmark used to compare the performance of each Fund. The Trustees further considered the level of Fund performance in the context of their review of Fund expenses and the investment adviser’s profitability discussed below and also noted that the Board and a designated committee of the Board review performance throughout the year. Following such evaluation, the Board concluded, within the context of its full deliberations, that the performance of each Fund supported renewal of the Agreement with respect to such Fund.
Fund Expenses. With respect to each Fund’s expenses, the Trustees considered the rate of compensation called for by the Agreement and each Fund’s operating expense ratio, in each case, in comparison to those of other similar mutual funds, such peer groups and comparisons having been selected and calculated by an independent provider of investment company data. The investment adviser reported to the Board, and the Board took into account, the risk assumed by the investment adviser in the development of the Funds and provision of services as well as the competitive marketplace for financial products. The Trustees considered the effects of the investment adviser’s and Schwab’s practice of waiving certain
fees to prevent total annual operating expenses of each Fund from exceeding a specified cap. The Trustees also considered the investment adviser’s contractual commitment to keep each Fund’s expense cap for so long as it serves as the adviser to the Fund. The Trustees also considered fees charged by the investment adviser to other mutual funds and to other types of accounts, but, with respect to such other types of accounts, accorded less weight to such comparisons due to the different legal, regulatory, compliance and operating features of mutual funds as compared to these other types of accounts, and any differences in the nature and scope of the services the investment adviser provides to these other accounts, and any differences in the market for these types of accounts. The Trustees noted that the pro rata share of the fees and expenses of the underlying funds in which the Funds invest are covered by the expense limitation agreement. Following such evaluation, the Board concluded, within the context of its full deliberations, that the expenses of each Fund are reasonable and supported renewal of the Agreement with respect to such Fund.
Profitability. The Trustees considered the compensation flowing to the investment adviser and its affiliates, directly or indirectly and reviewed profitability on a pre-tax basis, without regard to distribution expenses. In this connection, the Trustees reviewed management’s profitability analyses. The Trustees also reviewed profitability of the investment adviser relating to the Schwab fund complex as a whole, noting the benefits to Fund shareholders of being part of the Schwab fund complex, including the allocations of certain fixed costs across the Funds and other funds in the complex. The Trustees also considered any other benefits derived by the investment adviser from its relationship with the Funds, such as whether, by virtue of its management of the Funds, the investment adviser obtains investment information or other research resources that aid it in providing advisory services to other clients. Also, because each Fund invests a portion of its assets in other funds within the Schwab fund complex, the Trustees considered the indirect benefits to the investment adviser from such Fund’s investments in other underlying funds managed by the investment adviser. The Trustees considered whether the compensation and profitability with respect to the Funds under the Agreement and other service agreements were reasonable and justified in light of the quality of all services rendered to the Funds by the investment adviser and its affiliates. The Trustees noted that the investment adviser continues to invest substantial sums in its business in order to provide enhanced research capabilities, services and systems to benefit the Funds. Based on this evaluation, the Board concluded, within the context of its full deliberations, that the profitability of the investment adviser with respect to each Fund is reasonable and supported renewal of the Agreement with respect to such Fund.
Economies of Scale. Although the Trustees recognized the difficulty of determining economies of scale with precision, the Trustees considered the potential existence of any economies
Schwab Target Index Funds | Semiannual Report
Schwab Target Index Funds
of scale and whether those are passed along to a Fund’s shareholders through (i) the enhancement of services provided to the Funds in return for fees paid, including through investments by the investment adviser in its infrastructure, including modernizing the investment adviser’s technology and use of data, increasing expertise and capabilities in key areas (including portfolio and trade operations), and improving business continuity, cybersecurity, due diligence and information security programs, which are designed to provide enhanced services to the Funds and their shareholders; and (ii) pricing a fund to scale and keeping overall expenses down as the fund grows. The Trustees acknowledged that the investment adviser has shared any economies of scale with the Funds by investing in the investment adviser’s infrastructure, as discussed above, over time and that the investment adviser’s internal costs of providing investment management, technology, administrative, legal and compliance services to the Funds continue to increase as a result of regulatory or other developments. The Trustees considered that the
investment adviser and its affiliates employ contractual expense caps to protect shareholders from high fees, including for example, when fund assets are relatively small. Based on this evaluation, the Board concluded, within the context of its full deliberations, that each Fund obtains reasonable benefits from economies of scale.
In the course of their deliberations, the Trustees may have accorded different weights to various factors and did not identify any particular information or factor that was all important or controlling. Based on the Trustees’ deliberation and their evaluation of the information described above, the Board, including all of the Independent Trustees, approved the continuation of the Agreement with respect to the Funds and concluded that the compensation under the Agreement with respect to the Funds is fair and reasonable in light of the services provided and the related expenses borne by the investment adviser and its affiliates and such other matters as the Trustees considered to be relevant in the exercise of their reasonable judgment.
Schwab Target Index Funds | Semiannual Report
Schwab Target Index Funds
Trustees and Officers
The tables below give information about the trustees and officers of Schwab Capital Trust, which includes the funds covered in this report. The “Fund Complex” includes The Charles Schwab Family of Funds, Schwab Capital Trust, Schwab Investments, Schwab Annuity Portfolios, Schwab Strategic Trust and Laudus Trust. The Fund Complex includes 105 funds.
The address for all trustees and officers is 211 Main Street, San Francisco, CA 94105. You can find more information about the trustees and officers in the funds’ Statement of Additional Information, which is available free by calling 1-877-824-5615.
| Independent Trustees |
Name, Year of Birth, and
Position(s) with the trust
(Terms of office, and
length of Time Served1) | Principal Occupations
During the Past Five Years | Number of
Portfolios in
Fund Complex
Overseen by
the Trustee | Other Directorships |
Michael J. Beer
1961
Trustee
(Trustee of The Charles Schwab Family of Funds, Schwab Investments, Schwab Capital Trust, Schwab Annuity Portfolios, Schwab Strategic Trust and Laudus Trust since 2022) | Retired. Director, President and Chief Executive Officer (Dec. 2016 – Sept. 2019), Principal Funds (investment management). | 105 | Director (2016 – 2019), Principal Funds, Inc. |
Robert W. Burns
1959
Trustee
(Trustee of Schwab Strategic Trust since 2009; The Charles Schwab Family of Funds, Schwab Investments, Schwab Capital Trust, Schwab Annuity Portfolios and Laudus Trust since 2016) | Retired/Private Investor. | 105 | None |
Nancy F. Heller
1956
Trustee
(Trustee of The Charles Schwab Family of Funds, Schwab Investments, Schwab Capital Trust, Schwab Annuity Portfolios, Schwab Strategic Trust and Laudus Trust since 2018) | Retired. | 105 | None |
David L. Mahoney
1954
Trustee
(Trustee of The Charles Schwab Family of Funds, Schwab Investments, Schwab Capital Trust, Schwab Annuity Portfolios and Laudus Trust since 2011; Schwab Strategic Trust since 2016) | Private Investor. | 105 | Director (2004 – present), Corcept Therapeutics Incorporated
Director (2009 – 2021), Adamas Pharmaceuticals, Inc.
Director (2003 – 2019), Symantec Corporation |
Jane P. Moncreiff
1961
Trustee
(Trustee of The Charles Schwab Family of Funds, Schwab Investments, Schwab Capital Trust, Schwab Annuity Portfolios, Schwab Strategic Trust and Laudus Trust since 2019) | Consultant (2018 – present), Fulham Advisers LLC (management consulting); Chief Investment Officer (2009 – 2017), CareGroup Healthcare System, Inc. (healthcare). | 105 | None |
Schwab Target Index Funds | Semiannual Report
Schwab Target Index Funds
| Independent Trustees (continued) |
Name, Year of Birth, and
Position(s) with the trust
(Terms of office, and
length of Time Served1) | Principal Occupations
During the Past Five Years | Number of
Portfolios in
Fund Complex
Overseen by
the Trustee | Other Directorships |
Kiran M. Patel
1948
Trustee
(Trustee of The Charles Schwab Family of Funds, Schwab Investments, Schwab Capital Trust, Schwab Annuity Portfolios and Laudus Trust since 2011; Schwab Strategic Trust since 2016) | Retired. | 105 | Director (2008 – present), KLA-Tencor Corporation |
Kimberly S. Patmore
1956
Trustee
(Trustee of The Charles Schwab Family of Funds, Schwab Investments, Schwab Capital Trust, Schwab Annuity Portfolios, Schwab Strategic Trust and Laudus Trust since 2016) | Consultant (2008 – present), Patmore Management Consulting (management consulting). | 105 | None |
J. Derek Penn
1957
Trustee
(Trustee of The Charles Schwab Family of Funds, Schwab Investments, Schwab Capital Trust, Schwab Annuity Portfolios, Schwab Strategic Trust and Laudus Trust since 2021) | Head of Equity Sales and Trading (2006 – 2018), BNY Mellon (financial services). | 105 | None |
| Interested Trustees |
Name, Year of Birth, and
Position(s) with the trust
(Terms of office, and
length of Time Served1) | Principal Occupations
During the Past Five Years | Number of
Portfolios in
Fund Complex
Overseen by
the Trustee | Other Directorships |
Walter W. Bettinger II2
1960
Chairman and Trustee
(Trustee of The Charles Schwab Family of Funds, Schwab Investments, Schwab Capital Trust and Schwab Annuity Portfolios since 2008; Schwab Strategic Trust since 2009; Laudus Trust since 2010) | Co-Chairman of the Board (July 2022 – present), Director and Chief Executive Officer (Oct. 2008 – present) and President (Feb. 2007 – Oct. 2021), The Charles Schwab Corporation; President and Chief Executive Officer (Oct. 2008 – Oct. 2021) and Director (May 2008 – Oct. 2021), Charles Schwab & Co., Inc.; Director (Apr. 2006 – present), Charles Schwab Bank, SSB; Director (Nov. 2017 – present), Charles Schwab Premier Bank, SSB; Director (July 2019 – present), Charles Schwab Trust Bank; Director (May 2008 – present), Chief Executive Officer (Aug. 2017 – present) and President (Aug. 2017 – Nov. 2021), Schwab Holdings, Inc.; Director (Oct. 2020 – present), TD Ameritrade Holding Corporation; Director (July 2016 – Oct. 2021), Charles Schwab Investment Management, Inc. | 105 | Director (2008 – present), The Charles Schwab Corporation |
Schwab Target Index Funds | Semiannual Report
Schwab Target Index Funds
| Interested Trustees (continued) |
Name, Year of Birth, and
Position(s) with the trust
(Terms of office, and
length of Time Served1) | Principal Occupations
During the Past Five Years | Number of
Portfolios in
Fund Complex
Overseen by
the Trustee | Other Directorships |
Richard A. Wurster2
1973
Trustee
(Trustee of The Charles Schwab Family of Funds, Schwab Investments, Schwab Capital Trust, Schwab Annuity Portfolios, Schwab Strategic Trust and Laudus Trust since 2022) | President (Oct. 2021 – present) and Executive Vice President – Schwab Asset Management Solutions (Apr. 2019 – Oct. 2021), The Charles Schwab Corporation; President, Director (Oct. 2021 – present), Executive Vice President – Schwab Asset Management Solutions (July 2019 – Oct. 2021) and Senior Vice President – Advisory (May 2016 – July 2019), Charles Schwab & Co., Inc.; President (Nov. 2021 – present), Schwab Holdings, Inc.; Director (Oct. 2021 – present) and Chief Executive Officer (Nov. 2019 – Jan. 2022), Charles Schwab Investment Management, Inc.; Director, Chief Executive Officer and President (Mar. 2018 – present), Charles Schwab Investment Advisory, Inc.; Chief Executive Officer (July 2016 – Apr. 2018) and President (Mar. 2017 – Apr. 2018), ThomasPartners, Inc.; Chief Executive Officer (July 2016 – Apr. 2018), Windhaven Investment Management, Inc. | 105 | None |
| Officers of the Trust |
Name, Year of Birth, and Position(s) with the trust
(Terms of office, and length of Time Served3) | Principal Occupations During the Past Five Years |
Jonathan de St. Paer
1973
President and Chief Executive Officer
(Officer of The Charles Schwab Family of Funds, Schwab Investments, Schwab Capital Trust, Schwab Annuity Portfolios, Schwab Strategic Trust and Laudus Trust since 2018) | Director (Apr. 2019 – present), President (Oct. 2018 – present), Chief Operating Officer (Jan. 2021 – present), and Chief Executive Officer (Apr. 2019 – Nov. 2019), Charles Schwab Investment Management, Inc.; Senior Vice President (June 2020 – Mar. 2022) and Chief Operating Officer (Jan. 2021 – Mar. 2022), Charles Schwab Investment Advisory, Inc.; Chief Executive Officer (Apr. 2019 – present), President (Nov. 2018 – present) and Trustee (Apr. 2019 – Dec. 2020), Schwab Funds, Laudus Trust and Schwab ETFs; Director (Mar. 2019 – Apr. 2022), Charles Schwab Worldwide Funds plc and Charles Schwab Asset Management (Ireland) Limited; Managing Director (May 2022 – present), Senior Vice President (Apr. 2019 – May 2022) and Senior Vice President – Strategy and Product Development (CSIM) (Jan. 2014 – Mar. 2019), Charles Schwab & Co., Inc. |
Mark Fischer
1970
Treasurer, Chief Financial Officer and Chief Operating Officer
(Officer of The Charles Schwab Family of Funds, Schwab Investments, Schwab Capital Trust, Schwab Annuity Portfolios, Schwab Strategic Trust and Laudus Trust since 2013) | Treasurer and Chief Financial Officer (Jan. 2016 – present) and Chief Operating Officer (Dec. 2020 – present), Schwab Funds, Laudus Trust and Schwab ETFs; Chief Financial Officer (Mar. 2020 – present) and Vice President (Oct. 2013 – present), Charles Schwab Investment Management, Inc.; Director (July 2020 – Apr. 2022), Charles Schwab Worldwide Funds plc and Charles Schwab Asset Management (Ireland) Limited. |
Omar Aguilar
1970
Vice President and Chief Investment Officer
(Officer of The Charles Schwab Family of Funds, Schwab Investments, Schwab Capital Trust, Schwab Annuity Portfolios, Schwab Strategic Trust and Laudus Trust since 2011) | Chief Executive Officer (Jan. 2022 – present), Chief Investment Officer (Apr. 2011 – present) and Senior Vice President (Apr. 2011 – Dec. 2021), Charles Schwab Investment Management, Inc.; Vice President and Chief Investment Officer (June 2011 – present), Schwab Funds, Laudus Trust and Schwab ETFs. |
Brett Wander
1961
Vice President and Chief Investment Officer
(Officer of The Charles Schwab Family of Funds, Schwab Investments, Schwab Capital Trust, Schwab Annuity Portfolios, Schwab Strategic Trust and Laudus Trust since 2011) | Senior Vice President and Chief Investment Officer (Apr. 2011 – present), Charles Schwab Investment Management, Inc.; Vice President and Chief Investment Officer (June 2011 – present), Schwab Funds, Laudus Trust and Schwab ETFs. |
William P. McMahon, Jr.
1972
Vice President and Chief Investment Officer
(Officer of The Charles Schwab Family of Funds, Schwab Investments, Schwab Capital Trust, Schwab Annuity Portfolios, Schwab Strategic Trust and Laudus Trust since 2021) | Senior Vice President and Chief Investment Officer (Jan. 2020 – present), Charles Schwab Investment Management, Inc.; Vice President and Chief Investment Officer (June 2021 – present), Schwab Funds, Laudus Trust and Schwab ETFs; Senior Vice President and Chief Investment Officer – ThomasPartners Strategies (Apr. 2018 – Dec. 2019), Charles Schwab Investment Advisory, Inc.; Senior Vice President and Chief Investment Officer (May 2001 – Apr. 2018), ThomasPartners, Inc. |
Schwab Target Index Funds | Semiannual Report
Schwab Target Index Funds
| Officers of the Trust (continued) |
Name, Year of Birth, and Position(s) with the trust
(Terms of office, and length of Time Served3) | Principal Occupations During the Past Five Years |
Catherine MacGregor
1964
Chief Legal Officer and Secretary, Schwab Funds and Schwab ETFs
Chief Legal Officer, Vice President and Clerk, Laudus Trust
(Officer of The Charles Schwab Family of Funds, Schwab Investments, Schwab Capital Trust, Schwab Annuity Portfolios and Laudus Trust since 2005; Schwab Strategic Trust since 2009) | Chief Legal Officer (Mar. 2022 – present) and Vice President (Sept. 2005 – present), Charles Schwab Investment Management, Inc.; Managing Director (May 2022 – present) and Vice President (July 2005 – May 2022), Charles Schwab & Co., Inc.; Vice President (Dec. 2005 – present) and Chief Legal Officer and Clerk (Mar. 2007 – present), Laudus Trust; Chief Legal Officer and Secretary (Oct. 2021 – present), Vice President (Nov. 2005 – Oct. 2021) and Assistant Secretary (June 2007 – Oct. 2021), Schwab Funds; Chief Legal Officer and Secretary (Oct. 2021 – present), Vice President and Assistant Secretary (Oct. 2009 – Oct. 2021), Schwab ETFs. |
| 1 | Each Trustee shall hold office until the election and qualification of his or her successor, or until he or she dies, resigns or is removed. The retirement policy requires that each independent trustee retire by December 31 of the year in which the Trustee turns 74 or the Trustee’s twentieth year of service as an independent trustee on any trust in the Fund Complex, whichever occurs first. |
| 2 | Mr. Bettinger and Mr. Wurster are Interested Trustees. Mr. Bettinger and Mr. Wurster are Interested Trustees because each owns stock of The Charles Schwab Corporation (CSC), the parent company of Charles Schwab Investment Management, Inc., the investment adviser for the trusts in the Fund Complex, and is an employee of Charles Schwab & Co., Inc. (Schwab), the principal underwriter for The Charles Schwab Family of Funds, Schwab Investments, Schwab Capital Trust, Schwab Annuity Portfolios and Laudus Trust. |
| 3 | The President, Treasurer and Secretary/Clerk hold office until their respective successors are chosen and qualified or until he or she sooner dies, resigns, is removed or becomes disqualified. Each of the other officers serves at the pleasure of the Board. |
Schwab Target Index Funds | Semiannual Report
Schwab Target Index Funds
asset allocation The practice of dividing a portfolio among different asset classes, with each asset class assigned a particular percentage.
asset class A group of securities with similar structure and basic characteristics. Stocks, bonds and cash are the three main examples of asset classes.
Bloomberg US Aggregate Bond Index An index that is a broad-based benchmark measuring the performance of the U.S. investment grade, taxable bond market, including U.S. Treasuries, government-related and corporate bonds, mortgage pass-through securities, commercial mortgage-backed securities, and asset-backed securities that are publicly available for sale in the United States. To be eligible for inclusion in the index, securities must be fixed rate, non-convertible, U.S. dollar-denominated with at least $300 million or more of outstanding face value and have one or more years remaining to maturity. The index excludes certain types of securities, including tax-exempt state and local government series bonds, structured notes embedded with swaps or other special features, private placements, floating rate securities, inflation-linked bonds and Eurobonds. The index is market capitalization weighted and the securities in the index are updated on the last business day of each month.
Bloomberg US Treasury 1–3 Year Index An index which includes all publicly-issued U.S. Treasury securities that have a remaining maturity of greater than or equal to one year and less than three years, are rated investment grade, and have $300 million or more of outstanding face value. The securities in the index must be denominated in U.S. dollars and must be fixed-rate and non-convertible. The index excludes state and local government series bonds and coupon issues that have been stripped from bonds. The index is market capitalization weighted and the securities in the index are updated on the last business day of each month.
Bloomberg US Treasury Bills 1–3 Month Index An index that includes all publicly issued zero-coupon U.S. Treasury Bills that have a remaining maturity of less than 3 months but more than 1 month, are rated investment grade and have $300 million or more of outstanding face value. It excludes zero-coupon STRIPS.
Bloomberg US Treasury Inflation-Linked Bond Index (Series-L) An index which includes all publicly-issued U.S. Treasury Inflation-Protected Securities (TIPS) that have at least one year remaining to maturity, are rated investment grade and have $500 million or more of outstanding face value. The TIPS in the index must be denominated in U.S. dollars and must be fixed-rate and non-convertible. The index is market capitalization weighted and the TIPS in the index are updated on the last business day of each month. TIPS are publicly issued, dollar denominated U.S. Government securities issued by the U.S. Treasury that have principal and interest payments linked to an official inflation measure (as measured by the Consumer Price Index, or CPI) and their payments are supported by the full faith and credit of the United States.
bond A security representing a loan from the investor to the issuer. A bond typically pays interest at a fixed rate (the coupon rate) until a specified date (the maturity date), at which time the issuer returns the money borrowed (principal or face value) to the bondholder. Because of their structure, bonds are sometimes called “fixed-income securities” or “debt securities.”
An individual bond is subject to the credit risk of the issuer. Changes in interest rates can affect a bond’s market value prior to call or maturity. There is no guarantee that a bond’s yield to call or maturity will provide a positive return over the rate of inflation.
bond fund A bond fund is subject to the same credit, interest rate, and inflation risks as bonds. In addition, a bond fund incurs ongoing fees and expenses. A bond fund’s net asset value will fluctuate with the price of the underlying bonds and the portfolio turnover activity; return of principal is not guaranteed.
cap, capitalization See “market cap.”
capital gain, capital loss the difference between the amount paid for an investment and its value at a later time. If the investment has been sold, the capital gain or loss is considered a realized gain or loss. If the investment is still held, the capital gain or loss is considered unrealized appreciation or depreciation.
Dow Jones Equity All REIT Capped Index A float-adjusted market cap weighted index that is designed to measure all equity real estate investment trusts (REITs) in the Dow Jones U.S. Total Stock Market Index, as defined by the S&P Dow Jones Indices REIT/RESI Industry Classification Hierarchy, that meet the minimum float market capitalization (FMC) and liquidity thresholds. The aggregate weight of all companies weighing more than 4.5% cannot exceed 22.5%, and no single company’s weight can exceed 10%. The index is reviewed daily based on each company’s capped market capitalization weight. Daily capping is only performed when the sum of companies with weights great than 5% exceeds 25%.
Dow Jones U.S. Large-Cap Total Stock Market Index An index that is a subset of the Dow Jones U.S. Total Stock Market Index, and is designed to measure the performance of large-cap U.S. equity securities. The index is a float-adjusted market capitalization weighted index.
Dow Jones U.S. Select REIT Index An index that is a float-adjusted market-capitalization weighted index comprised of income-producing commercial and/or residential real estate investment trusts (REITs). The index excludes mortgage REITs, net-lease REITs, real estate finance companies, mortgage brokers and bankers, commercial and residential real estate brokers and estate agents, homebuilders, large landowners and sub-dividers of unimproved land, hybrid REITs, timber REITs and companies that have more than 25% of their assets in direct mortgage investments.
Dow Jones U.S. Small-Cap Total Stock Market Index An index that is a subset of the Dow Jones U.S. Total Stock Market Index, and is designed to measure the performance of small-cap U.S. equity securities. The index is a float-adjusted market capitalization weighted index.
Dow Jones U.S. Total Stock Market Index An index which includes all U.S. equity issues with readily available prices. The index is a float-adjusted market capitalization weighted index that reflects the shares of securities actually available to investors in the marketplace.
expense ratio The amount that is taken from a mutual fund’s assets each year to cover the fund’s operating expenses. An expense ratio of 0.50% means that a fund’s expenses amount to half of one percent of its average net assets a year.
FTSE Developed ex US Index (Net) An index that is comprised of large- and mid-capitalization companies in developed countries outside the United States, as defined by the index provider. The index defines the large- and mid-capitalization universe as approximately the top 90% of the eligible universe. The Net version of the index reflects reinvested dividends net of withholding taxes, but reflects no deductions for expenses or other taxes.
Schwab Target Index Funds | Semiannual Report
Schwab Target Index Funds
FTSE Emerging Index (Net) An index that is comprised of large- and mid-capitalization companies in emerging market countries, as defined by the index provider. The index defines the large- and mid-capitalization universe as approximately the top 90% of the eligible universe. The Net version of the index reflects reinvested dividends net of withholding taxes, but reflects no deductions for expenses or other taxes.
market cap, market capitalization The value of a company as determined by the total value of all shares of its stock outstanding.
MSCI EAFE Index (Net) A free float-adjusted market capitalization index that is designed to measure the equity market performance of developed markets in Europe, Australasia, and the Far East. The Net version of the index reflects reinvested dividends net of withholding taxes, but reflects no deductions for expenses or other taxes; returns are calculated applying dividend withholding rates applicable to non-resident persons who do not benefit from double taxation treaties.
MSCI Emerging Markets Index (Net) A free float-adjusted market capitalization weighted index that is designed to measure equity market performance in the global emerging markets. This series approximates the minimum possible dividend reinvestment. The returns are calculated applying dividend withholding rates applicable to non-resident persons who do not benefit from double taxation treaties.
net asset value (NAV) The value of one share of a mutual fund. NAV is calculated by taking the fund’s total assets, subtracting liabilities, and dividing by the number of shares outstanding.
outstanding shares, shares outstanding When speaking of a company or mutual fund, indicates all shares currently held by investors.
Russell 1000 Index An index that measures the performance of the 1,000 largest companies in the Russell 3000 Index, and represents approximately 92% of the total market capitalization of the Russell 3000 Index. The Russell 3000 Index measures the performance of the largest 3,000 U.S. companies representing approximately 98% of the investable U.S. equity market.
Russell 2000 Index An index that measures the performance of the 2,000 smallest companies in the Russell 3000 Index. The Russell 3000 Index measures the performance of the largest 3,000 U.S. companies representing approximately 98% of the investable U.S. equity market.
S&P 500 Index An index that is designed to measure the performance of 500 leading publicly traded companies from a broad range of industries.
stock A share of ownership, or equity, in the issuing company.
Target 2010 Passive Composite Index A custom blended index developed by Schwab Asset Management based on the Target 2010 Index Fund’s asset allocation glide schedule and will become more conservative as time elapses. Effective July 1, 2020 the Dow Jones U.S. Select REIT Index was replaced with the Dow Jones Equity All REIT Capped Index. Effective February 1, 2022, the composite is derived using the following portion allocations: 23.7% Dow Jones U.S. Large-Cap Total Stock Market Index, 1.5% Dow Jones U.S. Small-Cap Total Stock Market Index, 9.6% FTSE Developed ex US Index (Net), 2.6% Dow Jones Equity All REIT Capped Index, 8.6% Bloomberg US Treasury 1-3 Year Index, 43.2% Bloomberg US Aggregate Bond Index, 6.3% Bloomberg US Treasury Inflation-Linked Bond Index (Series-L), and 4.5% Bloomberg US Treasury Bills 1-3 Month Index. The components that make up the composite index may vary over time. The composite index represents target allocations for 2022. Percentages listed may not total to 100% due to rounding.
Target 2015 Passive Composite Index A custom blended index developed by Schwab Asset Management based on the Target 2015 Index Fund’s asset allocation glide schedule and will become more conservative as time elapses. Effective July 1, 2020 the Dow Jones U.S. Select REIT Index was replaced with the Dow Jones Equity All REIT Capped Index. Effective February 1, 2022, the composite is derived using the following portion allocations: 25.6% Dow Jones U.S. Large-Cap Total Stock Market Index, 1.7% Dow Jones U.S. Small-Cap Total Stock Market Index, 10.8% FTSE Developed ex US Index (Net), 2.9% Dow Jones Equity All REIT Capped Index, 8.0% Bloomberg US Treasury 1-3 Year Index, 41.1% Bloomberg US Aggregate Bond Index, 5.9% Bloomberg US Treasury Inflation-Linked Bond Index (Series-L), and 4.1% Bloomberg US Treasury Bills 1-3 Month Index. The components that make up the composite index may vary over time. The composite index represents target allocations for 2022. Percentages listed may not total to 100% due to rounding.
Target 2020 Passive Composite Index A custom blended index developed by Schwab Asset Management based on the Target 2020 Index Fund’s asset allocation glide schedule and will become more conservative as time elapses. Effective July 1, 2020 the Dow Jones U.S. Select REIT Index was replaced with the Dow Jones Equity All REIT Capped Index. Effective February 1, 2022, the composite is derived using the following portion allocations: 26.7% Dow Jones U.S. Large-Cap Total Stock Market Index, 1.8% Dow Jones U.S. Small-Cap Total Stock Market Index, 11.8% FTSE Developed ex US Index (Net), 3.0% Dow Jones Equity All REIT Capped Index, 7.5% Bloomberg US Treasury 1-3 Year Index, 39.7% Bloomberg US Aggregate Bond Index, 5.7% Bloomberg US Treasury Inflation-Linked Bond Index (Series-L), and 3.8% Bloomberg US Treasury Bills 1-3 Month Index. The components that make up the composite index may vary over time. The composite index represents target allocations for 2022. Percentages listed may not total to 100% due to rounding.
Target 2025 Passive Composite Index A custom blended index developed by Schwab Asset Management based on the Target 2025 Index Fund’s asset allocation glide schedule and will become more conservative as time elapses. Effective July 1, 2020 the Dow Jones U.S. Select REIT Index was replaced with the Dow Jones Equity All REIT Capped Index. Effective February 1, 2022, the composite is derived using the following portion allocations: 31.5% Dow Jones U.S. Large-Cap Total Stock Market Index, 2.3% Dow Jones U.S. Small-Cap Total Stock Market Index, 14.2% FTSE Developed ex US Index (Net), 1.6% FTSE Emerging Index (Net), 3.7% Dow Jones Equity All REIT Capped Index, 5.0% Bloomberg US Treasury 1-3 Year Index, 35.3% Bloomberg US Aggregate Bond Index, 3.2% Bloomberg US Treasury Inflation-Linked Bond Index (Series-L), and 3.1% Bloomberg US Treasury Bills 1-3 Month Index. The components that make up the composite index may vary over time. The composite index represents target allocations for 2022. Percentages listed may not total to 100% due to rounding.
Target 2030 Passive Composite Index A custom blended index developed by Schwab Asset Management based on the Target 2030 Index Fund’s asset allocation glide schedule and will become more conservative as time elapses. Effective July 1, 2020 the Dow Jones U.S. Select REIT Index was replaced with the Dow Jones Equity All REIT Capped Index. Effective February 1, 2022, the composite is derived using the following portion allocations: 37.7% Dow Jones U.S. Large-Cap Total Stock Market Index, 3.2% Dow Jones U.S. Small-Cap Total Stock Market Index, 17.5% FTSE Developed ex US Index (Net), 2.7% FTSE Emerging Index (Net), 4.6% Dow Jones Equity All REIT Capped Index, 2.6% Bloomberg US Treasury 1-3 Year Index, 28.4% Bloomberg US Aggregate Bond Index, 1.0% Bloomberg US
Schwab Target Index Funds | Semiannual Report
Schwab Target Index Funds
Treasury Inflation-Linked Bond Index (Series-L), and 2.3% Bloomberg US Treasury Bills 1-3 Month Index. The components that make up the composite index may vary over time. The composite index represents target allocations for 2022. Percentages listed may not total to 100% due to rounding.
Target 2035 Passive Composite Index A custom blended index developed by Schwab Asset Management based on the Target 2035 Index Fund’s asset allocation glide schedule and will become more conservative as time elapses. Effective July 1, 2020 the Dow Jones U.S. Select REIT Index was replaced with the Dow Jones Equity All REIT Capped Index. Effective February 1, 2022, the composite is derived using the following portion allocations: 41.8% Dow Jones U.S. Large-Cap Total Stock Market Index, 4.0% Dow Jones U.S. Small-Cap Total Stock Market Index, 20.0% FTSE Developed ex US Index (Net), 3.8% FTSE Emerging Index (Net), 5.2% Dow Jones Equity All REIT Capped Index, 1.5% Bloomberg US Treasury 1-3 Year Index, 22.0% Bloomberg US Aggregate Bond Index, and 1.8% Bloomberg US Treasury Bills 1-3 Month Index. The components that make up the composite index may vary over time. The composite index represents target allocations for 2022. Percentages listed may not total to 100% due to rounding.
Target 2040 Passive Composite Index A custom blended index developed by Schwab Asset Management based on the Target 2040 Index Fund’s asset allocation glide schedule and will become more conservative as time elapses. Effective July 1, 2020 the Dow Jones U.S. Select REIT Index was replaced with the Dow Jones Equity All REIT Capped Index. Effective February 1, 2022, the composite is derived using the following portion allocations: 45.0% Dow Jones U.S. Large-Cap Total Stock Market Index, 4.8% Dow Jones U.S. Small-Cap Total Stock Market Index, 22.0% FTSE Developed ex US Index (Net), 4.8% FTSE Emerging Index (Net), 5.8% Dow Jones Equity All REIT Capped Index, 0.9% Bloomberg US Treasury 1-3 Year Index, 15.5% Bloomberg US Aggregate Bond Index, and 1.3% Bloomberg US Treasury Bills 1-3 Month Index. The components that make up the composite index may vary over time. The composite index represents target allocations for 2022. Percentages listed may not total to 100% due to rounding.
Target 2045 Passive Composite Index A custom blended index developed by Schwab Asset Management based on the Target 2045 Index Fund’s asset allocation glide schedule and will become more conservative as time elapses. Effective July 1, 2020 the Dow Jones U.S. Select REIT Index was replaced with the Dow Jones Equity All REIT Capped Index. Effective February 1, 2022, the composite is derived using the following portion allocations: 47.2% Dow Jones U.S. Large-Cap Total Stock Market Index, 5.6% Dow Jones U.S. Small-Cap Total Stock Market Index, 23.7% FTSE Developed ex US Index (Net), 5.8% FTSE Emerging Index (Net), 6.2% Dow Jones Equity All REIT Capped Index, 0.5% Bloomberg US Treasury 1-3 Year Index, 10.2% Bloomberg US Aggregate Bond Index, and 0.9% Bloomberg US Treasury Bills 1-3 Month Index. The components that make up the composite index may vary over time. The composite index represents target allocations for 2022. Percentages listed may not total to 100% due to rounding.
Target 2050 Passive Composite Index A custom blended index developed by Schwab Asset Management based on the Target 2050 Index Fund’s asset allocation glide schedule and will become more conservative as time elapses. Effective July 1, 2020 the Dow Jones U.S. Select REIT Index was replaced with the Dow Jones Equity All REIT Capped Index. Effective February 1, 2022, the composite is derived using the following portion allocations: 48.3% Dow Jones U.S. Large-Cap Total Stock Market Index, 6.1% Dow Jones
U.S. Small-Cap Total Stock Market Index, 24.7% FTSE Developed ex US Index (Net), 6.5% FTSE Emerging Index (Net), 6.4% Dow Jones Equity All REIT Capped Index, 7.3% Bloomberg US Aggregate Bond Index, and 0.6% Bloomberg US Treasury Bills 1-3 Month Index. The components that make up the composite index may vary over time. The composite index represents target allocations for 2022. Percentages listed may not total to 100% due to rounding.
Target 2055 Passive Composite Index A custom blended index developed by Schwab Asset Management based on the Target 2055 Index Fund’s asset allocation glide schedule and will become more conservative as time elapses. Effective July 1, 2020 the Dow Jones U.S. Select REIT Index was replaced with the Dow Jones Equity All REIT Capped Index. Effective February 1, 2022, the composite is derived using the following portion allocations: 49.0% Dow Jones U.S. Large-Cap Total Stock Market Index, 6.4% Dow Jones U.S. Small-Cap Total Stock Market Index, 25.3% FTSE Developed ex US Index (Net), 6.9% FTSE Emerging Index (Net), 6.6% Dow Jones Equity All REIT Capped Index, 5.3% Bloomberg US Aggregate Bond Index, and 0.5% Bloomberg US Treasury Bills 1-3 Month Index. The components that make up the composite index may vary over time. The composite index represents target allocations for 2022. Percentages listed may not total to 100% due to rounding.
Target 2060 Passive Composite Index A custom blended index developed by Schwab Asset Management based on the Target 2060 Index Fund’s asset allocation glide schedule and will become more conservative as time elapses. Effective July 1, 2020 the Dow Jones U.S. Select REIT Index was replaced with the Dow Jones Equity All REIT Capped Index. Effective February 1, 2022, the composite is derived using the following portion allocations: 49.6% Dow Jones U.S. Large-Cap Total Stock Market Index, 6.7% Dow Jones U.S. Small-Cap Total Stock Market Index, 25.9% FTSE Developed ex US Index (Net), 7.4% FTSE Emerging Index (Net), 6.7% Dow Jones Equity All REIT Capped Index, 3.3% Bloomberg US Aggregate Bond Index, and 0.5% Bloomberg US Treasury Bills 1-3 Month Index. The components that make up the composite index may vary over time. The composite index represents target allocations for 2022. Percentages listed may not total to 100% due to rounding.
Target 2065 Passive Composite Index A custom blended index developed by Schwab Asset Management based on the Target 2065 Index Fund’s asset allocation glide schedule and will become more conservative as time elapses. Effective February 1, 2022, the composite is derived using the following portion allocations: 49.8% Dow Jones U.S. Large-Cap Total Stock Market Index, 6.8% Dow Jones U.S. Small-Cap Total Stock Market Index, 26.1% FTSE Developed ex US Index (Net), 7.5% FTSE Emerging Index (Net), 6.8% Dow Jones Equity All REIT Capped Index, 2.5% Bloomberg US Aggregate Bond Index, and 0.5% Bloomberg US Treasury Bills 1-3 Month Index. The components that make up the composite index may vary over time. The composite index represents target allocations for 2022. Percentages listed may not total to 100% due to rounding.
total return The percentage that an investor would have earned or lost on an investment in the fund assuming dividends and distributions were reinvested.
weighted average For mutual funds, an average that gives the same weight to each security as the security represents in the fund’s portfolio.
yield The income paid out by an investment, expressed as a percentage of the investment’s market value.
Schwab Target Index Funds | Semiannual Report
Schwab Target Index Funds
Schwab Asset Management
With a straightforward lineup of core products and solutions for building the foundation of a portfolio, Schwab Asset Management advocates for investors of all sizes with a steadfast focus on lowering costs and reducing unnecessary complexity. The list below shows all currently available Schwab Funds®.
Investors should carefully consider information contained in the prospectus, or if available, the summary prospectus, including investment objectives, risks, charges and expenses before investing. Please call 1-877-824-5615 for a prospectus for any Schwab Fund. Please read the prospectus carefully before you invest. This report must be preceded or accompanied by a current prospectus.
Proxy Voting Policies, Procedures and Results
A description of the proxy voting policies and procedures used to determine how to vote proxies on behalf of the funds is available without charge, upon request, by visiting the Schwab Funds’ website at www.schwabassetmanagement.com/schwabfunds_prospectus, the SEC’s website at www.sec.gov, or by contacting Schwab Funds at 1-877-824-5615.
Information regarding how a fund voted proxies relating to portfolio securities during the most recent twelve-month period ended June 30 is available, without charge, by visiting the fund’s website at www.schwabassetmanagement.com/schwabfunds_prospectus or the SEC’s website at www.sec.gov.
Equity Funds
Schwab Core Equity Fund
Schwab Dividend Equity Fund
Schwab Large-Cap Growth Fund
Schwab Small-Cap Equity Fund
Schwab Health Care Fund
Schwab International Core Equity Fund
Schwab International Opportunities Fund
Schwab Select Large Cap Growth Fund
Schwab Fundamental US Large Company Index Fund
Schwab Fundamental US Small Company Index Fund
Schwab Fundamental International Large Company Index Fund
Schwab Fundamental International Small Company Index Fund
Schwab Fundamental Emerging Markets Large Company Index Fund
Schwab Fundamental Global Real Estate Index Fund
Schwab Global Real Estate Fund
Schwab S&P 500 Index Fund
Schwab 1000 Index® Fund
Schwab Small-Cap Index Fund®
Schwab Total Stock Market Index Fund®
Schwab U.S. Large-Cap Growth Index Fund
Schwab U.S. Large-Cap Value Index Fund
Schwab U.S. Mid-Cap Index Fund
Schwab International Index Fund®
Asset Allocation Funds
Schwab Balanced Fund
Schwab MarketTrack Portfolios®
Schwab Target Funds
Schwab Target Index Funds
Schwab Monthly Income Funds
Bond Funds
Schwab Treasury Inflation Protected Securities Index Fund
Schwab U.S. Aggregate Bond Index Fund
Schwab Short-Term Bond Index Fund
Schwab Tax-Free Bond Fund1
Schwab California Tax-Free Bond Fund1
Schwab Opportunistic Municipal Bond Fund
Schwab Money Funds2
Schwab provides a broad choice of taxable and tax-exempt money market funds for both retail and institutional client types.
Investment Adviser
Charles Schwab Investment Management, Inc., dba Schwab Asset Management
211 Main Street, San Francisco, CA 94105
Funds
Schwab Funds
1-877-824-5615
© 2022 Charles Schwab & Co., Inc. All rights reserved.
Member SIPC®
Printed on recycled paper.
| ¹ | State, local, and the Federal Alternative Minimum Tax may apply. Capital gains are not exempt from Federal Taxation. |
| ² | You could lose money by investing in the Schwab Money Funds. All Schwab Money Funds with the exception of Schwab Variable Share Price Money Fund seek to preserve the value of your investment at $1.00 per share, but cannot guarantee they will do so. Because the share price of Schwab Variable Share Price Money Fund will fluctuate, when you sell your shares they may be worth more or less than what you originally paid for them. All Schwab Money Funds with the exception of Schwab Government Money Fund, Schwab Retirement Government Money Fund, Schwab U.S. Treasury Money Fund, Schwab Treasury Obligations Money Fund and Schwab Government Money Market Portfolio may impose a fee upon the sale of your shares or may temporarily suspend your ability to sell shares if the Fund’s liquidity falls below required minimums because of market conditions or other factors. An investment in the Schwab Money Funds is not insured or guaranteed by the Federal Deposit Insurance Corporation or any other government agency. The Schwab Money Funds’ sponsor has no legal obligation to provide financial support to the Funds, and you should not expect that the sponsor will provide financial support to the Funds at any time. |
This page is intentionally left blank.
Item 2: Code of Ethics.
Not applicable to this semi-annual report.
Item 3: Audit Committee Financial Expert.
Not applicable to this semi-annual report.
Item 4: Principal Accountant Fees and Services.
Not applicable to this semi-annual report.
Item 5: Audit Committee of Listed Registrants.
Not applicable.
Item 6: Schedule of Investments.
The schedules of investments are included as part of the report to shareholders filed under Item 1 of this Form.
Item 7: Disclosure of Proxy Voting Policies and Procedures for Closed-End Management Investment Companies.
Not applicable.
Item 8: Portfolio Managers of Closed-End Management Investment Companies.
Not applicable.
Item 9: Purchases of Equity Securities by Closed-End Management Investment Company and Affiliated Purchasers.
Not applicable.
Item 10: Submission of Matters to a Vote of Security Holders.
Not applicable.
Item 11: Controls and Procedures.
| (a) | Based on their evaluation of Registrant’s disclosure controls and procedures, as of a date within 90 days of the filing date, Registrant’s Chief Executive Officer, Jonathan de St. Paer and Registrant’s Chief Financial Officer, Mark Fischer, have concluded that Registrant’s disclosure controls and procedures are: (i) reasonably designed to ensure that information required to be disclosed in this report is appropriately communicated to Registrant’s officers to allow timely decisions regarding disclosures required in this report; (ii) reasonably designed to ensure that information required to be disclosed in this report is recorded, processed, summarized and reported in a timely manner; and (iii) are effective in achieving the goals described in (i) and (ii) above. |
| (b) | During the period covered by this report, there have been no changes in Registrant’s internal control over financial reporting that the above officers believe to have materially affected, or to be reasonably likely to materially affect, Registrant’s internal control over financial reporting. |
Item 12: Disclosure of Securities Lending Activities for Closed-End Management Investment Companies.
Not applicable.
Item 13: Exhibits.
| (a) | (1) Code of ethics – not applicable to this semi-annual report. |
Pursuant to the requirements of the Securities Exchange Act of 1934 and the Investment Company Act of 1940, the registrant has duly caused this report to be signed on its behalf by the undersigned, thereunto duly authorized.
(Registrant) Schwab Capital Trust – Schwab Target Index Funds
| | |
| By: | | /s/ Jonathan de St. Paer |
| | Jonathan de St. Paer Chief Executive Officer |
| |
| Date: | | November 16, 2022 |
Pursuant to the requirements of the Securities Exchange Act of 1934 and the Investment Company Act of 1940, this report has been signed below by the following persons on behalf of the registrant and in the capacities and on the dates indicated.
| | |
| By: | | /s/ Jonathan de St. Paer |
| | Jonathan de St. Paer Chief Executive Officer |
| |
| Date: | | November 16, 2022 |
| | |
| By: | | /s/ Mark Fischer |
| | Mark Fischer Chief Financial Officer |
| |
| Date: | | November 16, 2022 |