UNITED STATES
SECURITIES AND EXCHANGE COMMISSION
Washington, D.C. 20549
FORM N-CSR
CERTIFIED SHAREHOLDER REPORT OF REGISTERED
MANAGEMENT INVESTMENT COMPANIES
Investment Company Act file number: 811-07704
Schwab Capital Trust
(Exact name of registrant as specified in charter)
211 Main Street, San Francisco, California 94105
(Address of principal executive offices) (Zip code)
Jonathan de St. Paer
Schwab Capital Trust
211 Main Street, San Francisco, California 94105
(Name and address of agent for service)
Registrant’s telephone number, including area code: (415) 636-7000
Date of fiscal year end: October 31
Date of reporting period: October 31, 2022
Item 1: Report(s) to Shareholders.

| Total Return for the 12 Months Ended October 31, 2022 | |
| Schwab International Opportunities Fund1 (Ticker Symbol: SWMIX) | -34.83% 2 |
| MSCI EAFE® Index (Net)3 | -23.00% |
| Fund Category: Morningstar Foreign Large Growth4 | -32.07% |
| Performance Details | pages 7-10 |
| 1 | The fund’s performance relative to the index may be affected by fair-value pricing and timing differences in foreign exchange calculations. See financial note 2 for more information. |
| 2 | Total return for the report period presented in the table differs from the return in the Financial Highlights. The total return presented in the above table is calculated based on the net asset value (NAV) at which shareholder transactions were processed. The total return presented in the Financial Highlights section of the report is calculated in the same manner, but also takes into account certain adjustments that are necessary under generally accepted accounting principles required in the annual and semiannual reports. |
| 3 | The net version of the index reflects reinvested dividends net of withholding taxes but reflects no deductions for expenses or other taxes. |
| 4 | Source for category information: Morningstar, Inc. The Morningstar Category return represents all active and index mutual funds and ETFs within the category as of the report date. |

President of Schwab Asset
Management and the fund
covered in this report.

| * | The net version of the index reflects reinvested dividends net of withholding taxes but reflects no deductions for expenses or other taxes. |

| * | The net version of the index reflects reinvested dividends net of withholding taxes but reflects no deductions for expenses or other taxes. |
 | John Greves, CFA, Managing Director and Head of Multi-Asset Strategies, is responsible for the day-to-day co-management of the fund. Prior to joining Schwab in 2016, Mr. Greves worked at Russell Investment Management Company (Russell Investments) for 13 years, most recently as a portfolio manager for multi-asset solutions where he managed multiple target date funds, chaired the multi-asset advisory team, and co-authored papers on glide path methodology and benchmarking. Prior to that, he served in several roles for Russell Investments including associate portfolio manager for multi-asset solutions and senior portfolio analyst for multi-asset solutions. |
 | Tony Creasy, CFA, Senior Portfolio Manager, is responsible for the day-to-day co-management of the fund. Prior to his current role, he was a portfolio manager on the Multi-Asset Strategies Team, responsible for the daily management of several multi-asset portfolios. He also spent several years as lead analyst on the Schwab Asset Management Investment Manager Research Team. Prior to that, Mr. Creasy was an institutional investment analyst for Schwab’s retirement investment services group, providing mutual fund analysis to support the Schwab Focus List™. |
 | Daniel Piquet, CFA, Portfolio Manager, is responsible for the day-to-day co-management of the fund. Prior to joining Schwab, Mr. Piquet spent two years as an analyst at Santander Asset Management providing sub-adviser oversight in the firm’s global multi-asset solutions team. Before that, he was a portfolio analyst with Natixis Global Asset Management, performing portfolio risk analysis as well as equity, fixed income, and alternative mutual fund research. He also spent six years at The Vanguard Group, including two years as an investment analyst. |
 | Chuck Craig, CFA, Senior Portfolio Manager, is responsible for the oversight and day-to-day co-management of the portion of the fund that is invested in accordance with a particular index. Prior to joining Schwab in 2012, Mr. Craig worked at Guggenheim Funds (formerly Claymore Group), where he spent more than five years as a managing director of portfolio management and supervision, and three years as vice president of product research and development. Prior to that, he worked as an equity research analyst at First Trust Portfolios (formerly Niké Securities), and a trader and analyst at PMA Securities, Inc. |
 | David Rios, Portfolio Manager, is responsible for the day-to-day co-management of the portion of the fund that is invested in accordance with a particular index. Prior to this role, Mr. Rios was an associate portfolio manager on the equity index strategies team for four years. His first role with Schwab Asset Management was as a trade operations specialist. Prior to joining Schwab in 2008, Mr. Rios was a senior fund accountant at Investors Bank & Trust (subsequently acquired by State Street Corporation). |
| 1 | Total return for the report period above differs from the return in the Financial Highlights. The total return presented above is calculated based on the net asset value (NAV) at which shareholder transactions were processed. The total return presented in the Financial Highlights section of the report is calculated in the same manner, but also takes into account certain adjustments that are necessary under generally accepted accounting principles required in the annual and semiannual reports. |
| 2 | The total return cited for the index reflects reinvested dividends net of withholding taxes but reflects no deductions for expenses or other taxes. |
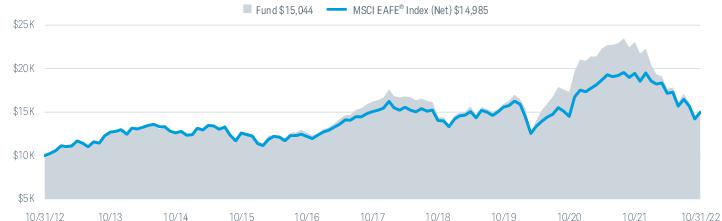
| Fund and Inception Date | 1 Year | 5 Years | 10 Years |
| Fund: Schwab International Opportunities Fund (4/2/04)2 | -34.83% 4 | -1.48% | 4.17% |
| MSCI EAFE® Index (Net)5 | -23.00% | -0.09% | 4.13% |
| Fund Category: Morningstar Foreign Large Growth6 | -32.07% | 0.81% | 4.87% |
| Fund Expense Ratio7: 0.83% | |||
| 1 | Fund expenses may have been partially absorbed by the investment adviser and its affiliates. Without these reductions, the fund’s returns would have been lower. These returns do not reflect the deduction of taxes that a shareholder would pay on fund distributions or the redemption of fund shares. |
| 2 | The fund commenced operations on October 16, 1996 which became the Schwab International Opportunities Fund (formerly Laudus International MarketMasters Fund) Investor Shares. The Investor Shares were consolidated into Select Shares on February 26, 2019. The performance presented is that of the former Select Shares which commenced operations on April 2, 2004. |
| 3 | The fund’s performance relative to the index may be affected by fair-value pricing. See financial note 2 for more information. |
| 4 | Total return for the report period presented in the table differs from the return in the Financial Highlights. The total return presented in the above table is calculated based on the net asset value (NAV) at which shareholder transactions were processed. The total return presented in the Financial Highlights section of the report is calculated in the same manner, but also takes into account certain adjustments that are necessary under generally accepted accounting principles required in the annual and semiannual reports. |
| 5 | The net version of the index reflects reinvested dividends net of withholding taxes but reflects no deductions for expenses or other taxes. |
| 6 | Source for category information: Morningstar, Inc. The Morningstar Category return represents all active and index mutual funds and ETFs within the category as of the report date. |
| 7 | As stated in the prospectus. Reflects the total annual fund operating expenses without contractual fee waivers. For actual expense ratios during the period, refer to the financial highlights section of the financial statements. |
| Investment Managers | Investment Style | % of Net Assets |
| American Century Investment Management, Inc. | International Small-Cap Growth | 27.0% |
| Harris Associates L.P. | International Large-Cap Value | 21.7% |
| Charles Schwab Investment Management, Inc., dba Schwab Asset Management2 | International Large-Cap Developed | 21.0% |
| Mondrian Investment Partners Limited | International Small-Cap Value | 17.2% |
| Baillie Gifford Overseas Limited | International Growth | 7.0% |
| Cash and other assets3 | 6.1% |
| 1 | For more information about each of the investment manager’s investment styles, refer to the fund’s prospectus. |
| 2 | Charles Schwab Investment Management, Inc. manages a portion of the fund by primarily investing in stocks that are included in the FTSE Developed ex US Quality Factor Index. The Schwab International Opportunities Fund has been developed solely by Schwab Asset Management. Index Ownership – The fund is not in any way connected to or sponsored, endorsed, sold or promoted by the London Stock Exchange Group plc and its group undertakings (collectively, the LSE Group). FTSE Russell is a trading name of certain of the LSE Group companies. All rights in the FTSE Developed ex US Quality Factor Index (the Index) vest in the relevant LSE Group company which owns the Index. “FTSE®” is a trade mark of the relevant LSE Group company and is used by any other LSE Group company under license. |
| 3 | Charles Schwab Investment Management, Inc. can allocate a portion of the fund to particular market sectors, such as emerging markets, utilizing securities, exchange-traded funds (ETFs) and/or other registered investment companies and may also directly manage additional portions of the fund during transitions between investment managers. Charles Schwab Investment Management, Inc. also manages the cash portion of the fund. |
| Number of Holdings | 1,338 |
| Weighted Average Market Cap (millions) | $32,634 |
| Price/Earnings Ratio (P/E) | 12.4 |
| Price/Book Ratio (P/B) | 1.7 |
| Portfolio Turnover Rate | 81% |
| 1 | Excludes derivatives. |
| 2 | This list is not a recommendation of any security by the investment adviser. |
| 3 | The percentage may differ from the Portfolio Holdings because the above calculation is based on a percentage of total investments, excluding derivatives, whereas the calculation in the Portfolio Holdings is based on a percentage of net assets. |
| EXPENSE RATIO (ANNUALIZED) 1 | BEGINNING ACCOUNT VALUE AT 5/1/22 | ENDING ACCOUNT VALUE (NET OF EXPENSES) AT 10/31/22 | EXPENSES PAID DURING PERIOD 5/1/22-10/31/22 2 | |
| Schwab International Opportunities Fund | ||||
| Actual Return | 0.85% | $1,000.00 | $ 851.80 | $3.97 |
| Hypothetical 5% Return | 0.85% | $1,000.00 | $1,020.92 | $4.33 |
| 1 | Based on the most recent six-month expense ratio; may differ from the expense ratio provided in the Financial Highlights. |
| 2 | Expenses for the fund are equal to its annualized expense ratio, multiplied by the average account value over the period, multiplied by the 184 days of the period, and divided by the 365 days of the fiscal year. |
| 11/1/21– 10/31/22 | 11/1/20– 10/31/21 | 11/1/19– 10/31/20 | 11/1/18– 10/31/191 | 11/1/17– 10/31/18 | ||
| Per-Share Data | ||||||
| Net asset value at beginning of period | $30.60 | $24.37 | $22.89 | $22.89 | $26.96 | |
| Income (loss) from investment operations: | ||||||
| Net investment income (loss)2 | 0.26 | 0.01 | 0.00 3 | 0.31 | 0.24 | |
| Net realized and unrealized gains (losses) | (9.58) | 7.94 | 1.95 | 1.74 | (3.09) | |
| Total from investment operations | (9.32) | 7.95 | 1.95 | 2.05 | (2.85) | |
| Less distributions: | ||||||
| Distributions from net investment income | (0.28) | — | (0.43) | (0.29) | (0.36) | |
| Distributions from net realized gains | (4.10) | (1.72) | (0.04) | (1.76) | (0.86) | |
| Total distributions | (4.38) | (1.72) | (0.47) | (2.05) | (1.22) | |
| Net asset value at end of period | $16.90 | $30.60 | $24.37 | $22.89 | $22.89 | |
| Total return | (34.79%) | 33.50% | 8.56% | 10.50% | (11.09%) | |
| Ratios/Supplemental Data | ||||||
| Ratios to average net assets: | ||||||
| Net operating expenses | 0.99% 4,5 | 1.25% | 1.25% | 1.25% | 1.25% | |
| Gross operating expenses | 1.08% 5 | 1.47% | 1.51% | 1.50% | 1.51% | |
| Net investment income (loss) | 1.24% | 0.05% | 0.00% 6 | 1.43% | 0.92% | |
| Portfolio turnover rate | 81% | 59% | 65% | 54% | 69% | |
| Net assets, end of period (x 1,000,000) | $982 | $1,495 | $1,243 | $1,413 | $1,127 | |
| 1 | Effective February 26, 2019, the Investor Share class, and the Select Share class were consolidated into a single class of shares of the fund. The financial history as shown in the financial highlights is that of the former Select Shares. |
| 2 | Calculated based on the average shares outstanding during the period. |
| 3 | Per-share amount was less than $0.005. |
| 4 | Effective February 25, 2022, the net operating expense limitation was lowered from 1.25% to 0.86%. The ratio presented for the period ended October 31, 2022 is a blended ratio. |
| 5 | Ratio includes less than 0.005% of non-routine proxy expenses. |
| 6 | Less than 0.005% |
| SECURITY | NUMBER OF SHARES | VALUE ($) |
| COMMON STOCKS 92.3% OF NET ASSETS | ||
| Argentina 0.8% | ||
| MercadoLibre, Inc. * | 8,760 | 7,898,191 |
| Australia 5.9% | ||
| Adbri Ltd. | 9,208 | 9,283 |
| AGL Energy Ltd. | 10,925 | 47,598 |
| Allkem Ltd. * | 143,776 | 1,328,441 |
| ALS Ltd. | 375,539 | 2,747,075 |
| Altium Ltd. | 57,555 | 1,299,551 |
| Alumina Ltd. | 54,895 | 47,443 |
| Amcor plc | 30,415 | 353,217 |
| AMP Ltd. * | 16,292 | 13,138 |
| Ampol Ltd. | 7,053 | 123,017 |
| Ansell Ltd. | 2,232 | 40,295 |
| APA Group | 17,529 | 118,012 |
| Appen Ltd. | 497,996 | 806,807 |
| Aristocrat Leisure Ltd. | 16,525 | 392,236 |
| Atlas Arteria Ltd. | 13,334 | 56,133 |
| Aurizon Holdings Ltd. | 35,902 | 83,198 |
| Bank of Queensland Ltd. | 6,540 | 30,799 |
| Beach Energy Ltd. | 54,515 | 55,745 |
| Bendigo & Adelaide Bank Ltd. | 6,166 | 35,594 |
| BHP Group Ltd. | 156,818 | 3,766,800 |
| BlueScope Steel Ltd. | 11,759 | 118,413 |
| Boral Ltd. | 9,720 | 17,910 |
| Brambles Ltd. | 31,756 | 237,749 |
| carsales.com Ltd. | 120,403 | 1,559,679 |
| Centuria Office REIT | 2,093,054 | 2,016,230 |
| Challenger Ltd. | 8,129 | 36,526 |
| Charter Hall Group | 15,764 | 130,855 |
| Charter Hall Long Wale REIT | 816,064 | 2,275,443 |
| Cleanaway Waste Management Ltd. | 32,988 | 57,060 |
| Cochlear Ltd. | 2,000 | 255,487 |
| Computershare Ltd. | 19,663 | 318,305 |
| Corporate Travel Management Ltd. | 131,635 | 1,469,657 |
| Costa Group Holdings Ltd. | 883,057 | 1,436,932 |
| CSR Ltd. | 15,997 | 47,387 |
| Deterra Royalties Ltd. | 9,191 | 24,117 |
| Domino's Pizza Enterprises Ltd. | 944 | 38,490 |
| Downer EDI Ltd. | 12,852 | 36,936 |
| Endeavour Group Ltd. | 34,672 | 158,704 |
| Flight Centre Travel Group Ltd. * | 1,720 | 18,307 |
| Goodman Group | 61,296 | 666,944 |
| Harvey Norman Holdings Ltd. | 11,820 | 31,445 |
| IDP Education Ltd. | 159,245 | 3,004,442 |
| IGO Ltd. | 288,016 | 2,816,781 |
| Iluka Resources Ltd. | 11,830 | 65,544 |
| Inghams Group Ltd. | 1,617,309 | 2,616,523 |
| Insignia Financial Ltd. | 7,089 | 14,291 |
| James Hardie Industries plc | 13,510 | 294,964 |
| JB Hi-Fi Ltd. | 3,480 | 95,394 |
| Johns Lyng Group Ltd. | 354,331 | 1,473,268 |
| Lendlease Corp., Ltd. | 2,690 | 14,958 |
| Lynas Rare Earths Ltd. * | 496,751 | 2,649,564 |
| SECURITY | NUMBER OF SHARES | VALUE ($) |
| Magellan Financial Group Ltd. | 9,921 | 62,907 |
| Medibank Pvt Ltd. | 192,604 | 346,816 |
| Metcash Ltd. | 19,684 | 51,673 |
| Mirvac Group | 88,148 | 116,793 |
| National Storage REIT | 1,193,695 | 1,997,449 |
| NEXTDC Ltd. * | 395,665 | 2,099,467 |
| Northern Star Resources Ltd. | 22,309 | 124,509 |
| Nufarm Ltd. | 3,357 | 11,964 |
| Orica Ltd. | 200,131 | 1,780,213 |
| Orora Ltd. | 18,391 | 35,688 |
| OZ Minerals Ltd. | 112,345 | 1,739,553 |
| Perpetual Ltd. | 2,946 | 46,945 |
| Pilbara Minerals Ltd. * | 80,589 | 261,934 |
| Pinnacle Investment Management Group Ltd. | 193,036 | 1,003,250 |
| Platinum Asset Management Ltd. | 40,306 | 46,144 |
| Pro Medicus Ltd. | 1,258 | 44,819 |
| Qantas Airways Ltd. * | 20,843 | 77,885 |
| Qube Holdings Ltd. | 37,739 | 65,702 |
| REA Group Ltd. | 1,683 | 130,442 |
| Reece Ltd. | 3,067 | 30,455 |
| Rio Tinto Ltd. | 10,765 | 610,909 |
| SEEK Ltd. | 6,777 | 93,291 |
| Seven Group Holdings Ltd. | 3,085 | 36,176 |
| Shopping Centres Australasia Property Group | 1,206,331 | 2,101,086 |
| Sims Ltd. | 5,369 | 41,977 |
| Sonic Healthcare Ltd. | 12,537 | 262,468 |
| South32 Ltd. | 88,050 | 202,010 |
| Steadfast Group Ltd. | 881,753 | 2,856,655 |
| Stockland | 65,166 | 150,149 |
| Tabcorp Holdings Ltd. | 70,263 | 43,379 |
| Technology One Ltd. | 226,762 | 1,744,482 |
| Telstra Group Ltd. | 72,617 | 182,082 |
| The GPT Group | 59,430 | 164,239 |
| The Lottery Corp., Ltd. * | 34,067 | 93,458 |
| The Star Entertainment Grp Ltd. * | 10,437 | 19,633 |
| TPG Telecom Ltd. | 6,138 | 19,255 |
| Treasury Wine Estates Ltd. | 10,615 | 87,964 |
| Vicinity Ltd. | 113,255 | 141,191 |
| Washington H Soul Pattinson & Co., Ltd. | 6,136 | 109,810 |
| Wesfarmers Ltd. | 23,616 | 685,313 |
| Whitehaven Coal Ltd. | 26,346 | 153,039 |
| WiseTech Global Ltd. | 4,547 | 168,162 |
| Woodside Energy Group Ltd. | 45,486 | 1,051,566 |
| Worley Ltd. | 185,136 | 1,691,053 |
| 58,136,642 | ||
| Austria 0.0% | ||
| ANDRITZ AG | 857 | 39,831 |
| Erste Group Bank AG | 1,360 | 33,517 |
| OMV AG | 4,043 | 186,153 |
| Telekom Austria AG * | 2,982 | 17,334 |
| Verbund AG | 1,289 | 100,974 |
| Voestalpine AG | 1,926 | 41,814 |
| 419,623 | ||
| SECURITY | NUMBER OF SHARES | VALUE ($) |
| Belgium 0.7% | ||
| Ackermans & van Haaren N.V. | 226 | 31,487 |
| Ageas S.A./N.V. | 745 | 25,790 |
| Anheuser-Busch InBev S.A./N.V. | 76,400 | 3,821,557 |
| D'ieteren Group | 486 | 80,884 |
| Elia Group S.A./N.V. | 890 | 112,525 |
| Etablissements Franz Colruyt N.V. | 774 | 18,657 |
| Euronav N.V. | 110,042 | 1,918,448 |
| Groupe Bruxelles Lambert N.V. | 428 | 31,555 |
| Proximus SADP | 2,892 | 30,319 |
| Sofina S.A. | 974 | 189,929 |
| UCB S.A. | 2,238 | 168,673 |
| Umicore S.A. | 4,773 | 157,346 |
| Warehouses De Pauw CVA | 4,150 | 106,514 |
| 6,693,684 | ||
| Brazil 1.4% | ||
| Cia Brasileira de Aluminio | 402,900 | 861,101 |
| Locaweb Servicos de Internet S.A. * | 1,363,100 | 2,884,267 |
| Multiplan Empreendimentos Imobiliarios S.A. | 857,900 | 4,377,939 |
| Santos Brasil Participacoes S.A. | 1,165,900 | 2,053,952 |
| TOTVS S.A. | 557,400 | 3,578,237 |
| YDUQS Participacoes S.A. | 137,800 | 430,300 |
| 14,185,796 | ||
| Canada 7.2% | ||
| Agnico Eagle Mines Ltd. | 6,980 | 307,051 |
| Alimentation Couche-Tard, Inc. | 22,140 | 991,331 |
| Altus Group Ltd. | 63,849 | 2,268,822 |
| Aritzia, Inc. * | 112,649 | 4,369,195 |
| ATS Automation Tooling Systems, Inc. * | 55,169 | 1,745,355 |
| Barrick Gold Corp. | 28,686 | 431,443 |
| BCE, Inc. | 4,500 | 202,977 |
| Boralex, Inc., Class A | 164,696 | 4,670,024 |
| Brookfield Infrastructure Corp., Class A | 85,733 | 3,696,807 |
| Canadian National Railway Co. | 16,308 | 1,932,037 |
| Canadian Natural Resources Ltd. | 31,870 | 1,911,475 |
| Canadian Tire Corp., Ltd., Class A | 896 | 100,422 |
| Canadian Utilities Ltd., Class A | 1,907 | 50,742 |
| Capstone Copper Corp. * | 616,286 | 1,429,489 |
| Cenovus Energy, Inc. | 24,001 | 485,182 |
| CGI, Inc. * | 4,216 | 339,607 |
| Colliers International Group, Inc. | 10,680 | 1,002,345 |
| Constellation Software, Inc. | 347 | 501,745 |
| Dollarama, Inc. | 7,439 | 442,021 |
| Fairfax Financial Holdings Ltd. | 774 | 380,134 |
| Finning International, Inc. | 110,195 | 2,343,267 |
| Franco-Nevada Corp. | 4,108 | 507,579 |
| George Weston Ltd. | 1,037 | 114,140 |
| Hydro One Ltd. | 4,658 | 116,796 |
| IGM Financial, Inc. | 3,571 | 95,595 |
| Imperial Oil Ltd. | 6,079 | 330,689 |
| Innergex Renewable Energy, Inc. | 269,008 | 2,961,882 |
| Kinaxis, Inc. * | 29,669 | 3,166,711 |
| Loblaw Cos., Ltd. | 2,552 | 209,090 |
| Magna International, Inc. | 6,614 | 368,580 |
| Metro, Inc. | 4,497 | 235,586 |
| Mullen Group Ltd. | 278,294 | 2,796,524 |
| Open Text Corp. | 110,851 | 3,210,761 |
| Pason Systems, Inc. | 274,123 | 2,911,557 |
| Restaurant Brands International, Inc. | 17,612 | 1,045,801 |
| Ritchie Bros. Auctioneers, Inc. | 23,004 | 1,502,812 |
| Saputo, Inc. | 3,298 | 80,274 |
| Shaw Communications, Inc., Class B | 7,845 | 201,488 |
| SECURITY | NUMBER OF SHARES | VALUE ($) |
| Shopify, Inc., Class A * | 24,920 | 853,012 |
| SNC-Lavalin Group, Inc. | 83,551 | 1,446,741 |
| Spin Master Corp. | 71,955 | 2,223,588 |
| Stantec, Inc. | 81,308 | 3,978,413 |
| Suncor Energy, Inc. | 35,306 | 1,214,401 |
| SunOpta, Inc. * | 162,415 | 1,823,920 |
| The Descartes Systems Group, Inc. * | 36,522 | 2,519,960 |
| Thomson Reuters Corp. | 11,771 | 1,251,881 |
| Tourmaline Oil Corp. | 7,800 | 439,482 |
| Vermilion Energy, Inc. | 87,184 | 2,034,411 |
| Waste Connections, Inc. | 4,754 | 627,458 |
| Wheaton Precious Metals Corp. | 9,607 | 314,298 |
| Whitecap Resources, Inc. | 296,211 | 2,296,024 |
| 70,480,925 | ||
| China 1.5% | ||
| Alibaba Group Holding Ltd. * | 588,020 | 4,571,801 |
| Kerry Properties Ltd. | 14,000 | 22,147 |
| Meituan, B Shares * | 230,700 | 3,693,630 |
| NIO, Inc., ADR * | 68,321 | 660,664 |
| Tencent Holdings Ltd. | 85,900 | 2,257,175 |
| Tongcheng Travel Holdings Ltd. * | 1,225,200 | 1,912,449 |
| Vipshop Holdings Ltd., ADR * | 237,423 | 1,654,838 |
| 14,772,704 | ||
| Denmark 2.1% | ||
| ALK-Abello A/S * | 123,063 | 2,034,707 |
| AP Moller - Maersk A/S, Class A | 97 | 194,066 |
| AP Moller - Maersk A/S, Class B | 174 | 363,516 |
| Carlsberg A/S, Class B | 2,059 | 242,438 |
| Coloplast A/S, Class B | 4,126 | 459,926 |
| Danske Bank A/S | 1,958 | 31,585 |
| Demant A/S * | 2,377 | 64,909 |
| DSV A/S | 17,700 | 2,391,770 |
| Genmab A/S * | 8,321 | 3,205,312 |
| GN Store Nord A/S | 2,625 | 55,785 |
| H Lundbeck A/S | 3,243 | 12,134 |
| Jyske Bank A/S * | 59,817 | 3,228,273 |
| NKT A/S * | 42,084 | 2,100,294 |
| Novo Nordisk A/S, Class B | 48,276 | 5,249,110 |
| Novozymes A/S, B Shares | 4,744 | 249,015 |
| Orsted A/S | 4,786 | 394,873 |
| Pandora A/S | 3,026 | 159,178 |
| Rockwool A/S, Class B | 191 | 38,038 |
| Royal Unibrew A/S | 1,190 | 67,978 |
| SimCorp A/S | 1,241 | 74,101 |
| Vestas Wind Systems A/S | 18,628 | 367,226 |
| 20,984,234 | ||
| Finland 0.8% | ||
| Elisa Oyj | 3,750 | 181,224 |
| Fortum Oyj | 7,829 | 110,187 |
| Huhtamaki Oyj | 81,309 | 2,922,194 |
| Kesko Oyj, B Shares | 6,516 | 126,806 |
| Kojamo Oyj | 6,668 | 86,781 |
| Kone Oyj, B Shares | 12,208 | 499,866 |
| Metso Outotec Oyj | 270,251 | 2,050,960 |
| Neste Oyj | 12,942 | 567,228 |
| Orion Oyj, B Shares | 3,112 | 143,209 |
| Stora Enso Oyj, R Shares | 8,347 | 108,835 |
| UPM-Kymmene Oyj | 24,800 | 833,712 |
| Valmet Oyj | 5,006 | 113,853 |
| Wartsila Oyj Abp | 12,174 | 82,993 |
| 7,827,848 | ||
| SECURITY | NUMBER OF SHARES | VALUE ($) |
| France 7.5% | ||
| Accor S.A. * | 186,132 | 4,459,992 |
| Aeroports de Paris * | 237 | 32,050 |
| Airbus SE | 9,375 | 1,014,410 |
| Alstom S.A. | 3,861 | 79,464 |
| Alten S.A. | 10,974 | 1,282,095 |
| Amundi S.A. | 1,625 | 76,667 |
| ArcelorMittal S.A. | 16,620 | 371,518 |
| Arkema S.A. | 1,209 | 95,678 |
| BioMerieux | 1,158 | 102,458 |
| BNP Paribas S.A. | 153,103 | 7,179,593 |
| Bollore SE | 10,455 | 52,291 |
| Bouygues S.A. | 3,961 | 113,012 |
| Bureau Veritas S.A. | 4,262 | 105,443 |
| Capgemini SE | 14,500 | 2,376,415 |
| Carrefour S.A. | 9,147 | 147,225 |
| Cie de Saint-Gobain | 8,596 | 351,412 |
| Cie Generale des Etablissements Michelin S.C.A. | 11,920 | 303,770 |
| Covivio | 409 | 21,898 |
| Danone S.A. | 48,500 | 2,410,425 |
| Dassault Aviation S.A. | 731 | 108,567 |
| Dassault Systemes SE | 10,636 | 356,506 |
| Edenred | 40,700 | 2,086,533 |
| Eiffage S.A. | 1,160 | 104,889 |
| Electricite de France S.A. | 10,768 | 127,170 |
| Elis S.A. | 192,012 | 2,198,903 |
| Eurazeo SE | 3,431 | 195,791 |
| Euroapi S.A. * | 1,101 | 19,266 |
| Faurecia SE * | 1,418 | 21,169 |
| Gaztransport Et Technigaz S.A. | 32,351 | 3,763,667 |
| Gecina S.A. | 598 | 53,314 |
| Hermes International | 2,876 | 3,722,651 |
| Ipsen S.A. | 973 | 99,993 |
| JCDecaux SE * | 910 | 11,489 |
| Kering S.A. | 18,034 | 8,258,866 |
| Klepierre S.A. * | 1,026 | 20,621 |
| Korian S.A. | 170,088 | 1,607,134 |
| La Francaise des Jeux SAEM | 2,604 | 84,861 |
| L'Oreal S.A. | 11,442 | 3,592,836 |
| LVMH Moet Hennessy Louis Vuitton SE | 5,201 | 3,281,803 |
| Neoen S.A. | 348 | 12,138 |
| OVH Groupe SAS * | 131,652 | 1,709,471 |
| Publicis Groupe S.A. | 69,970 | 3,918,626 |
| Remy Cointreau S.A. | 514 | 78,610 |
| Rexel S.A. * | 3,054 | 54,500 |
| Rubis S.C.A. | 113,834 | 2,585,094 |
| Sartorius Stedim Biotech | 763 | 242,130 |
| SCOR SE | 832 | 12,512 |
| SEB S.A. | 493 | 32,095 |
| SOITEC * | 397 | 50,834 |
| Somfy S.A. | 261 | 27,803 |
| STMicroelectronics N.V. | 17,707 | 550,580 |
| Teleperformance | 912 | 244,352 |
| TotalEnergies SE | 48,641 | 2,653,530 |
| UbiSoft Entertainment S.A. * | 1,146 | 31,442 |
| Valeo S.A. | 188,509 | 3,105,304 |
| Verallia S.A. | 96,596 | 2,737,038 |
| Vivendi SE | 17,223 | 140,970 |
| Wendel SE | 1,481 | 115,965 |
| Worldline S.A. * | 115,500 | 5,041,165 |
| 73,636,004 | ||
| Germany 8.7% | ||
| 1&1 AG | 773 | 10,183 |
| adidas AG | 42,378 | 4,136,731 |
| SECURITY | NUMBER OF SHARES | VALUE ($) |
| AIXTRON SE | 67,573 | 1,660,514 |
| Allianz SE | 33,770 | 6,075,372 |
| Aroundtown S.A. | 4,419 | 8,760 |
| BASF SE | 18,013 | 808,255 |
| Bayer AG | 100,723 | 5,296,119 |
| Bayerische Motoren Werke AG | 77,400 | 6,075,270 |
| Bechtle AG | 822 | 28,397 |
| Beiersdorf AG | 2,878 | 276,274 |
| Carl Zeiss Meditec AG, Class B | 1,039 | 125,764 |
| Commerzbank AG * | 3,187 | 25,463 |
| Continental AG | 102,156 | 5,291,238 |
| Covestro AG | 4,906 | 166,539 |
| CTS Eventim AG & Co., KGaA * | 1,850 | 88,313 |
| Daimler Truck Holding AG * | 160,431 | 4,279,108 |
| Delivery Hero SE * | 104,077 | 3,425,058 |
| Dermapharm Holding SE | 55,654 | 2,115,986 |
| Deutsche Lufthansa AG * | 3,093 | 21,147 |
| Deutsche Post AG | 21,092 | 745,598 |
| Duerr AG | 88,882 | 2,349,393 |
| DWS Group GmbH & Co. KGaA | 1,832 | 49,531 |
| Eckert & Ziegler Strahlen- und Medizintechnik AG | 26,437 | 1,045,153 |
| Evonik Industries AG | 3,504 | 64,550 |
| Evotec SE * | 1,124 | 21,438 |
| Fielmann AG | 65,601 | 2,089,819 |
| Fraport AG Frankfurt Airport Services Worldwide * | 403 | 15,526 |
| Fresenius Medical Care AG & Co. KGaA | 66,300 | 1,833,896 |
| Fresenius SE & Co. KGaA | 201,300 | 4,632,545 |
| Friedrich Vorwerk Group SE | 65,404 | 1,266,517 |
| FUCHS PETROLUB SE | 1,104 | 26,618 |
| GEA Group AG | 4,907 | 171,521 |
| Gerresheimer AG | 29,140 | 1,669,390 |
| HeidelbergCement AG | 2,296 | 105,586 |
| HelloFresh SE * | 5,495 | 109,840 |
| Henkel AG & Co. KGaA | 56,747 | 3,331,338 |
| Infineon Technologies AG | 23,234 | 563,784 |
| KION Group AG | 1,140 | 25,274 |
| Knorr-Bremse AG | 1,184 | 53,305 |
| LANXESS AG | 441 | 14,914 |
| LEG Immobilien SE | 2,288 | 149,372 |
| Mercedes-Benz Group AG | 113,894 | 6,592,361 |
| Merck KGaA | 2,100 | 342,226 |
| METRO AG * | 1,999 | 15,249 |
| MTU Aero Engines AG | 961 | 171,979 |
| Nemetschek SE | 1,468 | 69,990 |
| Norma Group SE | 105,071 | 1,665,652 |
| Novem Group S.A. | 182,905 | 1,141,699 |
| Puma SE | 1,683 | 74,407 |
| QIAGEN N.V. * | 4,679 | 202,054 |
| Rational AG | 155 | 87,374 |
| Rheinmetall AG | 877 | 142,558 |
| RTL Group S.A. * | 1,152 | 39,106 |
| RWE AG | 15,297 | 588,860 |
| SAP SE | 47,900 | 4,610,507 |
| Sartorius AG | 28 | 8,254 |
| Scout24 SE | 2,137 | 109,510 |
| Siemens AG | 37,500 | 4,095,336 |
| Siemens Energy AG (a) | 9,077 | 105,816 |
| Sixt SE | 149 | 13,975 |
| Telefonica Deutschland Holding AG | 19,382 | 42,231 |
| ThyssenKrupp AG * | 476,177 | 2,506,562 |
| United Internet AG | 1,725 | 32,246 |
| Vantage Towers AG | 1,813 | 50,990 |
| Varta AG | 331 | 8,870 |
| Volkswagen AG | 380 | 64,954 |
| Wacker Chemie AG | 401 | 46,687 |
| SECURITY | NUMBER OF SHARES | VALUE ($) |
| Zalando SE * | 83,819 | 1,931,874 |
| 85,010,726 | ||
| Hong Kong 1.4% | ||
| ASMPT Ltd. | 217,000 | 1,193,609 |
| BOC Aviation Ltd. | 2,600 | 17,399 |
| Budweiser Brewing Co. APAC Ltd. | 54,100 | 113,866 |
| Cafe de Coral Holdings Ltd. | 1,496,000 | 1,745,889 |
| Chow Tai Fook Jewellery Group Ltd. | 52,600 | 90,055 |
| CK Asset Holdings Ltd. | 33,500 | 185,207 |
| CK Infrastructure Holdings Ltd. | 9,000 | 42,757 |
| CLP Holdings Ltd. | 32,000 | 214,778 |
| ESR Group Ltd. | 35,800 | 61,052 |
| First Pacific Co., Ltd. | 44,000 | 11,651 |
| Hang Lung Properties Ltd. | 14,000 | 17,611 |
| Henderson Land Development Co., Ltd. | 14,000 | 34,276 |
| HKBN Ltd. | 2,162,983 | 1,460,867 |
| Hong Kong & China Gas Co., Ltd. | 205,000 | 158,008 |
| Hongkong Land Holdings Ltd. | 2,700 | 10,395 |
| Hysan Development Co., Ltd. | 4,000 | 8,718 |
| JS Global Lifestyle Co., Ltd. | 34,500 | 27,790 |
| Kerry Logistics Network Ltd. | 9,500 | 15,080 |
| Lenovo Group Ltd. | 164,000 | 131,070 |
| L'Occitane International S.A. | 9,750 | 23,938 |
| Man Wah Holdings Ltd. | 46,000 | 25,667 |
| MTR Corp., Ltd. | 22,500 | 99,004 |
| New World Development Co., Ltd. | 6,000 | 12,273 |
| Nexteer Automotive Group Ltd. | 26,000 | 14,072 |
| NWS Holdings Ltd. | 16,000 | 11,346 |
| Orient Overseas International Ltd. | 4,500 | 65,759 |
| PCCW Ltd. | 63,000 | 24,069 |
| Power Assets Holdings Ltd. | 42,500 | 203,216 |
| Prada S.p.A. | 13,800 | 62,871 |
| Samsonite International S.A. * | 1,430,400 | 3,073,138 |
| Sands China Ltd. * | 29,200 | 51,048 |
| Sino Land Co., Ltd. | 80,000 | 85,425 |
| SITC International Holdings Co., Ltd. | 40,000 | 65,512 |
| SUNeVision Holdings Ltd. | 4,022,000 | 2,130,708 |
| Swire Pacific Ltd., A Shares | 6,500 | 43,118 |
| Swire Pacific Ltd., B Shares | 12,500 | 12,881 |
| Swire Properties Ltd. | 10,000 | 19,219 |
| The Bank of East Asia Ltd. | 10,452 | 10,017 |
| The Wharf Holdings Ltd. | 13,000 | 37,225 |
| United Energy Group Ltd. | 238,000 | 23,025 |
| Vitasoy International Holdings Ltd. * | 8,000 | 13,661 |
| VTech Holdings Ltd. | 3,700 | 19,696 |
| Want Want China Holdings Ltd. | 88,000 | 57,806 |
| WH Group Ltd. | 202,500 | 102,265 |
| Wynn Macau Ltd. * | 19,600 | 7,814 |
| Xinyi Glass Holdings Ltd. | 67,000 | 86,105 |
| Yue Yuen Industrial Holdings Ltd. | 1,365,000 | 1,387,722 |
| 13,308,678 | ||
| India 2.2% | ||
| Axis Bank Ltd. | 100,532 | 1,102,482 |
| Max Healthcare Institute Ltd. * | 880,782 | 4,855,388 |
| Persistent Systems Ltd. | 51,067 | 2,278,656 |
| Prestige Estates Projects Ltd. | 450,067 | 2,407,258 |
| PVR Ltd. * | 90,767 | 1,948,844 |
| Varun Beverages Ltd. | 242,364 | 3,075,322 |
| WNS Holdings Ltd., ADR * | 69,701 | 5,999,862 |
| 21,667,812 | ||
| SECURITY | NUMBER OF SHARES | VALUE ($) |
| Ireland 0.7% | ||
| Bank of Ireland Group plc | 3,798 | 27,348 |
| Glanbia plc | 177,701 | 2,052,316 |
| Kingspan Group plc | 2,088 | 105,270 |
| Ryanair Holdings plc ADR * | 59,021 | 4,065,957 |
| Smurfit Kappa Group plc | 4,175 | 137,703 |
| 6,388,594 | ||
| Israel 1.1% | ||
| Airport City Ltd. * | 2,114 | 35,002 |
| Alony Hetz Properties & Investments Ltd. | 2,017 | 23,658 |
| Amot Investments Ltd. | 361,370 | 2,186,004 |
| Ashtrom Group Ltd. | 709 | 15,431 |
| Azrieli Group Ltd. | 946 | 70,085 |
| Bezeq The Israeli Telecommunication Corp., Ltd. | 46,009 | 81,447 |
| Big Shopping Centers Ltd. | 255 | 28,593 |
| CyberArk Software Ltd. * | 14,837 | 2,328,074 |
| Delek Group Ltd. * | 220 | 33,497 |
| Elbit Systems Ltd. | 472 | 95,502 |
| Energix-Renewable Energies Ltd. | 2,550 | 8,902 |
| Enlight Renewable Energy Ltd. * | 13,145 | 26,622 |
| Fattal Holdings 1998 Ltd. * | 113 | 11,478 |
| Fox Wizel Ltd. | 162 | 19,749 |
| ICL Group Ltd. | 21,359 | 192,607 |
| Inmode Ltd. * | 104,094 | 3,572,506 |
| Israel Corp., Ltd. | 91 | 39,390 |
| Kenon Holdings Ltd. | 331 | 12,681 |
| Maytronics Ltd. | 1,166 | 12,572 |
| Melisron Ltd. | 403 | 29,900 |
| Mivne Real Estate KD Ltd. | 15,049 | 46,788 |
| Mizrahi Tefahot Bank Ltd. | 879 | 33,228 |
| Nice Ltd. * | 1,806 | 340,375 |
| Nova Ltd. *(b) | 395 | 28,909 |
| Nova Ltd. *(b) | 18,373 | 1,354,274 |
| Paz Oil Co., Ltd. * | 324 | 38,706 |
| Sapiens International Corp. N.V. | 798 | 15,679 |
| Shikun & Binui Ltd. * | 3,109 | 12,343 |
| Shufersal Ltd. | 3,051 | 20,828 |
| Strauss Group Ltd. | 1,082 | 27,069 |
| Teva Pharmaceutical Industries Ltd. * | 17,615 | 157,494 |
| The First International Bank of Israel Ltd. | 392 | 16,927 |
| The Phoenix Holdings Ltd. | 1,294 | 14,017 |
| Tower Semiconductor Ltd. * | 2,532 | 108,207 |
| 11,038,544 | ||
| Italy 1.9% | ||
| A2A S.p.A. | 36,704 | 40,699 |
| Amplifon S.p.A. | 1,673 | 41,564 |
| Brembo S.p.A. | 126,067 | 1,317,953 |
| Buzzi Unicem S.p.A. | 1,722 | 28,580 |
| Davide Campari-Milano N.V. | 9,828 | 88,259 |
| De'Longhi S.p.A. | 1,841 | 31,764 |
| DiaSorin S.p.A. | 106 | 13,858 |
| Enel S.p.A. | 142,649 | 637,263 |
| Eni S.p.A. | 50,420 | 662,202 |
| Esprinet S.p.A. | 184,393 | 1,228,302 |
| Ferrari N.V. | 20,906 | 4,121,373 |
| FinecoBank Banca Fineco S.p.A. | 3,350 | 45,143 |
| Hera S.p.A. | 18,461 | 43,987 |
| Infrastrutture Wireless Italiane S.p.A. | 4,835 | 42,674 |
| Intercos S.p.A. * | 125,917 | 1,253,085 |
| Interpump Group S.p.A. | 1,272 | 49,246 |
| Intesa Sanpaolo S.p.A. | 3,729,400 | 7,110,203 |
| Italgas S.p.A. | 9,579 | 49,353 |
| SECURITY | NUMBER OF SHARES | VALUE ($) |
| Leonardo S.p.A. | 183,497 | 1,474,232 |
| Mediobanca Banca di Credito Finanziario S.p.A. | 3,586 | 32,488 |
| Moncler S.p.A. | 4,031 | 173,914 |
| Pirelli & C S.p.A. | 6,102 | 23,017 |
| Poste Italiane S.p.A. | 1,941 | 16,914 |
| Prysmian S.p.A. | 4,165 | 135,563 |
| Recordati Industria Chimica e Farmaceutica S.p.A. | 2,513 | 94,417 |
| Reply S.p.A. | 568 | 61,783 |
| Telecom Italia S.p.A. * | 78,920 | 15,440 |
| Tenaris S.A. | 7,737 | 121,093 |
| 18,954,369 | ||
| Japan 13.7% | ||
| ABC-Mart, Inc. | 800 | 35,658 |
| Acom Co., Ltd. | 14,100 | 30,804 |
| Activia Properties, Inc. | 6 | 17,772 |
| Advance Residence Investment Corp. | 14 | 32,594 |
| Advantest Corp. | 5,200 | 273,736 |
| AEON REIT Investment Corp. | 17 | 18,303 |
| AGC, Inc. | 3,900 | 122,206 |
| Aica Kogyo Co., Ltd. | 1,300 | 27,940 |
| Ain Holdings, Inc. | 700 | 29,407 |
| Air Water, Inc. | 2,900 | 32,378 |
| Aisin Corp. | 2,200 | 56,473 |
| Alfresa Holdings Corp. | 2,900 | 33,387 |
| Amada Co., Ltd. | 9,800 | 68,929 |
| Amano Corp. | 2,000 | 34,225 |
| ANA Holdings, Inc. * | 1,900 | 36,934 |
| Anritsu Corp. | 3,900 | 39,253 |
| Aozora Bank Ltd. | 800 | 13,761 |
| Ariake Japan Co., Ltd. | 400 | 13,858 |
| As One Corp. | 500 | 21,321 |
| Asahi Intecc Co., Ltd. | 2,400 | 40,884 |
| Asahi Kasei Corp. | 20,700 | 132,727 |
| Asics Corp. | 182,900 | 2,802,710 |
| ASKUL Corp. | 1,100 | 11,488 |
| Astellas Pharma, Inc. | 31,900 | 440,162 |
| Azbil Corp. | 3,700 | 100,550 |
| Bandai Namco Holdings, Inc. | 6,300 | 416,448 |
| BayCurrent Consulting, Inc. | 222,000 | 6,228,693 |
| Benefit One, Inc. | 1,600 | 22,135 |
| Benesse Holdings, Inc. | 900 | 13,277 |
| Bic Camera, Inc. | 1,500 | 11,662 |
| BIPROGY, Inc. | 800 | 17,281 |
| Brother Industries Ltd. | 4,000 | 68,144 |
| Calbee, Inc. | 1,600 | 32,139 |
| Canon Marketing Japan, Inc. | 800 | 16,882 |
| Canon, Inc. | 18,200 | 385,794 |
| Capcom Co., Ltd. | 6,000 | 166,890 |
| Casio Computer Co., Ltd. | 4,200 | 36,505 |
| Chugai Pharmaceutical Co., Ltd. | 16,100 | 373,067 |
| COMSYS Holdings Corp. | 1,500 | 24,574 |
| Comture Corp. | 166,500 | 2,708,983 |
| Concordia Financial Group Ltd. | 6,200 | 18,918 |
| Cosmo Energy Holdings Co., Ltd. | 1,200 | 30,911 |
| Cosmos Pharmaceutical Corp. | 300 | 29,014 |
| Credit Saison Co., Ltd. | 900 | 9,620 |
| CyberAgent, Inc. | 9,600 | 78,866 |
| Dai Nippon Printing Co., Ltd. | 5,600 | 112,172 |
| Daicel Corp. | 4,500 | 25,676 |
| Daido Steel Co., Ltd. | 500 | 12,964 |
| Daifuku Co., Ltd. | 2,942 | 134,670 |
| Daiichikosho Co., Ltd. | 800 | 22,938 |
| Daikin Industries Ltd. | 4,700 | 704,000 |
| Daio Paper Corp. | 1,000 | 7,378 |
| SECURITY | NUMBER OF SHARES | VALUE ($) |
| Daito Trust Construction Co., Ltd. | 1,900 | 188,145 |
| Daiwa Office Investment Corp. | 2 | 9,449 |
| Daiwa Securities Group, Inc. | 8,900 | 34,725 |
| Daiwa Securities Living Investments Corp. | 18 | 13,972 |
| Dena Co., Ltd. | 900 | 11,738 |
| Denka Co., Ltd. | 1,600 | 37,066 |
| Dentsu Group, Inc. | 3,500 | 108,862 |
| Descente Ltd. | 1,300 | 31,201 |
| DIC Corp. | 700 | 11,753 |
| Digital Arts, Inc. | 56,900 | 2,391,167 |
| Disco Corp. | 800 | 191,344 |
| DMG Mori Co., Ltd. | 1,700 | 19,673 |
| Dowa Holdings Co., Ltd. | 1,400 | 44,453 |
| Ebara Corp. | 2,300 | 74,732 |
| Eisai Co., Ltd. | 5,200 | 313,576 |
| Electric Power Development Co., Ltd. | 2,900 | 40,332 |
| ENEOS Holdings, Inc. | 68,700 | 226,618 |
| en-japan, Inc. | 120,100 | 2,086,251 |
| Exeo Group, Inc. | 1,599 | 23,428 |
| Ezaki Glico Co., Ltd. | 800 | 17,998 |
| Fancl Corp. | 1,900 | 35,996 |
| FANUC Corp. | 6,000 | 785,110 |
| Fast Retailing Co., Ltd. | 1,200 | 668,569 |
| Food & Life Cos., Ltd. | 1,600 | 26,914 |
| FP Corp. | 700 | 16,653 |
| Frontier Real Estate Investment Corp. | 6 | 21,183 |
| Fuji Electric Co., Ltd. | 2,100 | 81,196 |
| Fujitsu Ltd. | 8,400 | 966,492 |
| Fukuoka Financial Group, Inc. | 900 | 15,314 |
| GMO Financial Gate, Inc. | 17,400 | 1,623,686 |
| GMO Payment Gateway, Inc. | 300 | 21,572 |
| Goldwin, Inc. | 1,100 | 57,446 |
| GS Yuasa Corp. | 800 | 12,179 |
| GungHo Online Entertainment, Inc. | 1,000 | 14,781 |
| H.U. Group Holdings, Inc. | 800 | 14,892 |
| Hakuhodo DY Holdings, Inc. | 1,300 | 10,953 |
| Hamamatsu Photonics K.K. | 4,000 | 180,965 |
| Hankyu Hanshin Holdings, Inc. | 2,900 | 86,132 |
| Haseko Corp. | 4,400 | 45,312 |
| Heiwa Corp. | 900 | 14,520 |
| Hikari Tsushin, Inc. | 200 | 24,159 |
| Hino Motors Ltd. * | 4,700 | 19,532 |
| Hirose Electric Co., Ltd. | 700 | 90,805 |
| Hisamitsu Pharmaceutical Co., Inc. | 1,400 | 34,540 |
| Hitachi Construction Machinery Co., Ltd. | 1,500 | 29,346 |
| Hitachi Metals Ltd. * | 500 | 7,302 |
| Hitachi Transport System Ltd. * | 600 | 35,908 |
| Horiba Ltd. | 900 | 36,925 |
| Hoshizaki Corp. | 3,500 | 100,275 |
| House Foods Group, Inc. | 1,200 | 22,443 |
| Hoya Corp. | 9,200 | 855,244 |
| Hulic Co., Ltd. | 4,100 | 29,784 |
| Ibiden Co., Ltd. | 1,800 | 60,673 |
| Idemitsu Kosan Co., Ltd. | 6,600 | 144,410 |
| IHI Corp. | 89,000 | 1,985,057 |
| Iida Group Holdings Co., Ltd. | 900 | 12,497 |
| Industrial & Infrastructure Fund Investment Corp. | 23 | 24,291 |
| Infomart Corp. | 365,100 | 1,181,107 |
| Information Services International-Dentsu Ltd. | 500 | 15,292 |
| Inpex Corp. | 23,100 | 233,134 |
| Insource Co., Ltd. | 136,000 | 2,746,177 |
| Internet Initiative Japan, Inc. | 167,000 | 2,621,304 |
| Invincible Investment Corp. | 14,615 | 4,587,844 |
| Isetan Mitsukoshi Holdings Ltd. | 1,500 | 13,323 |
| Isuzu Motors Ltd. | 7,900 | 92,901 |
| ITOCHU Corp. | 24,200 | 625,438 |
| SECURITY | NUMBER OF SHARES | VALUE ($) |
| Itochu Techno-Solutions Corp. | 1,800 | 41,731 |
| Iwatani Corp. | 834 | 30,709 |
| Izumi Co., Ltd. | 500 | 10,087 |
| J. Front Retailing Co., Ltd. | 2,500 | 20,208 |
| Japan Airlines Co., Ltd. * | 1,500 | 28,017 |
| Japan Airport Terminal Co., Ltd. * | 39,300 | 1,682,075 |
| Japan Aviation Electronics Industry Ltd. | 900 | 14,008 |
| Japan Logistics Fund, Inc. | 9 | 19,282 |
| Japan Post Bank Co., Ltd. | 2,200 | 14,659 |
| Japan Post Insurance Co., Ltd. | 1,100 | 16,283 |
| Japan Prime Realty Investment Corp. | 10 | 27,158 |
| Japan Tobacco, Inc. | 19,500 | 326,575 |
| JCR Pharmaceuticals Co., Ltd. | 900 | 13,376 |
| JEOL Ltd. | 37,500 | 1,372,244 |
| JFE Holdings, Inc. | 10,200 | 93,443 |
| JGC Holdings Corp. | 3,300 | 39,691 |
| JMDC, Inc. | 60,500 | 2,142,576 |
| JSR Corp. | 600 | 11,401 |
| JTEKT Corp. | 3,600 | 25,415 |
| Justsystems Corp. | 800 | 16,826 |
| Kadokawa Corp. | 1,400 | 25,066 |
| Kagome Co., Ltd. | 600 | 11,992 |
| Kajima Corp. | 4,800 | 45,183 |
| Kakaku.com, Inc. | 3,500 | 59,195 |
| Kaken Pharmaceutical Co., Ltd. | 506 | 12,951 |
| Kamigumi Co., Ltd. | 2,700 | 51,345 |
| Kandenko Co., Ltd. | 2,600 | 14,614 |
| Kaneka Corp. | 1,100 | 27,277 |
| Kansai Paint Co., Ltd. | 2,400 | 31,318 |
| Kawasaki Heavy Industries Ltd. | 2,200 | 37,416 |
| Kawasaki Kisen Kaisha Ltd. | 3,600 | 54,588 |
| KDDI Corp. | 47,100 | 1,392,133 |
| Keihan Holdings Co., Ltd. | 1,100 | 28,299 |
| Keikyu Corp. | 3,500 | 35,928 |
| Keio Corp. | 1,100 | 38,567 |
| Keisei Electric Railway Co., Ltd. | 1,500 | 39,813 |
| Kenedix Office Investment Corp. | 6 | 13,668 |
| Kewpie Corp. | 2,000 | 31,575 |
| Keyence Corp. | 6,200 | 2,337,803 |
| Kikkoman Corp. | 4,300 | 233,017 |
| Kinden Corp. | 3,700 | 37,649 |
| Kobayashi Pharmaceutical Co., Ltd. | 1,200 | 63,680 |
| Kobe Bussan Co., Ltd. | 1,500 | 32,536 |
| Kobe Steel Ltd. | 6,100 | 25,015 |
| Koei Tecmo Holdings Co., Ltd. | 4,000 | 60,356 |
| Koito Manufacturing Co., Ltd. | 6,400 | 90,860 |
| Kokuyo Co., Ltd. | 2,600 | 32,249 |
| Komatsu Ltd. | 126,100 | 2,470,323 |
| Konami Group Corp. | 3,000 | 131,494 |
| Kose Corp. | 700 | 69,874 |
| Kotobuki Spirits Co., Ltd. | 600 | 30,758 |
| K's Holdings Corp. | 2,600 | 20,375 |
| Kuraray Co., Ltd. | 5,000 | 34,383 |
| Kurita Water Industries Ltd. | 1,900 | 69,549 |
| Kyocera Corp. | 5,200 | 251,817 |
| Kyowa Kirin Co., Ltd. | 4,900 | 115,403 |
| Kyudenko Corp. | 154,700 | 3,281,251 |
| Kyushu Electric Power Co., Inc. | 5,700 | 28,221 |
| Kyushu Railway Co. | 2,400 | 50,193 |
| LaSalle Logiport REIT | 18 | 19,212 |
| Lawson, Inc. | 400 | 12,779 |
| Lintec Corp. | 1,400 | 21,005 |
| Lion Corp. | 4,700 | 47,501 |
| Lixil Corp. | 3,700 | 55,890 |
| M3, Inc. | 98,700 | 2,941,277 |
| Mabuchi Motor Co., Ltd. | 1,400 | 37,988 |
| Mani, Inc. | 1,200 | 17,481 |
| Marubeni Corp. | 24,600 | 215,346 |
| SECURITY | NUMBER OF SHARES | VALUE ($) |
| Marui Group Co., Ltd. | 2,200 | 35,993 |
| Maruichi Steel Tube Ltd. | 1,800 | 33,976 |
| MatsukiyoCocokara & Co. | 120,600 | 4,390,882 |
| Mazda Motor Corp. | 10,300 | 69,350 |
| Medipal Holdings Corp. | 3,100 | 38,434 |
| Meidensha Corp. | 204,000 | 2,714,076 |
| MEIJI Holdings Co., Ltd. | 1,900 | 78,183 |
| Menicon Co., Ltd. | 100,900 | 1,722,762 |
| Milbon Co., Ltd. | 19,500 | 804,058 |
| MINEBEA MITSUMI, Inc. | 5,800 | 85,715 |
| MISUMI Group, Inc. | 8,700 | 185,305 |
| Mitsubishi Chemical Group Corp. | 21,300 | 96,220 |
| Mitsubishi Electric Corp. | 50,400 | 443,450 |
| Mitsubishi Gas Chemical Co., Inc. | 4,300 | 54,641 |
| Mitsubishi HC Capital, Inc. | 6,300 | 27,034 |
| Mitsubishi Logistics Corp. | 1,100 | 24,138 |
| Mitsubishi Materials Corp. | 1,900 | 24,834 |
| Mitsubishi Motors Corp. * | 16,100 | 54,237 |
| Mitsui & Co., Ltd. | 30,800 | 681,579 |
| Mitsui Chemicals, Inc. | 2,700 | 49,974 |
| Mitsui Fudosan Logistics Park, Inc. | 5 | 16,589 |
| Mitsui High-Tec, Inc. | 200 | 10,338 |
| Mitsui Mining & Smelting Co., Ltd. | 1,300 | 26,257 |
| Mitsui O.S.K. Lines Ltd. | 5,800 | 114,812 |
| Miura Co., Ltd. | 2,900 | 59,060 |
| MonotaRO Co., Ltd. | 7,100 | 107,777 |
| Mori Hills Reit Investment Corp. | 14 | 15,335 |
| Morinaga & Co., Ltd. | 1,000 | 25,012 |
| m-up Holdings, Inc. | 229,300 | 2,420,187 |
| Murata Manufacturing Co., Ltd. | 9,800 | 463,926 |
| Musashi Seimitsu Industry Co., Ltd. | 131,800 | 1,521,134 |
| Nabtesco Corp. | 3,400 | 72,217 |
| Nagoya Railroad Co., Ltd. | 115,400 | 1,767,814 |
| Nankai Electric Railway Co., Ltd. | 1,200 | 24,275 |
| NEC Networks & System Integration Corp. | 1,900 | 20,360 |
| Nexon Co., Ltd. | 12,300 | 205,831 |
| Nextage Co., Ltd. | 123,600 | 2,382,329 |
| NGK Insulators Ltd. | 4,900 | 57,164 |
| NGK Spark Plug Co., Ltd. | 4,000 | 72,976 |
| NHK Spring Co., Ltd. | 3,800 | 21,052 |
| Nichirei Corp. | 900 | 13,997 |
| Nifco, Inc. | 93,200 | 2,164,518 |
| Nihon Kohden Corp. | 1,200 | 26,871 |
| Nihon M&A Center Holdings, Inc. | 19,900 | 224,548 |
| Nikon Corp. | 5,100 | 49,323 |
| Nintendo Co., Ltd. | 32,700 | 1,327,590 |
| Nippon Accommodations Fund, Inc. | 4 | 17,033 |
| Nippon Electric Glass Co., Ltd. | 2,000 | 34,631 |
| Nippon Express Holdings, Inc. | 1,200 | 60,298 |
| Nippon Gas Co., Ltd. | 235,000 | 3,413,845 |
| Nippon Kayaku Co., Ltd. | 5,000 | 39,716 |
| Nippon Sanso Holdings Corp. | 2,100 | 33,435 |
| Nippon Shinyaku Co., Ltd. | 1,000 | 55,366 |
| Nippon Shokubai Co., Ltd. | 900 | 32,284 |
| Nippon Steel Corp. | 19,000 | 260,652 |
| Nippon Yusen K.K. | 10,800 | 195,636 |
| Nishi-Nippon Railroad Co., Ltd. | 1,300 | 25,498 |
| Nissan Chemical Corp. | 4,314 | 194,196 |
| Nisshin Seifun Group, Inc. | 2,400 | 25,934 |
| Nissin Foods Holdings Co., Ltd. | 1,700 | 110,039 |
| Nitori Holdings Co., Ltd. | 2,300 | 208,419 |
| Nitto Denko Corp. | 4,600 | 242,354 |
| Noevir Holdings Co., Ltd. | 500 | 18,483 |
| NOF Corp. | 2,100 | 72,233 |
| NOK Corp. | 2,600 | 21,269 |
| Nomura Real Estate Holdings, Inc. | 1,000 | 22,604 |
| NS Solutions Corp. | 700 | 16,089 |
| NSK Ltd. | 5,300 | 28,012 |
| SECURITY | NUMBER OF SHARES | VALUE ($) |
| Obayashi Corp. | 10,200 | 65,470 |
| OBIC Business Consultants Co., Ltd. | 700 | 20,121 |
| Obic Co., Ltd. | 1,100 | 165,069 |
| Odakyu Electric Railway Co., Ltd. | 2,800 | 33,286 |
| Oji Holdings Corp. | 14,500 | 50,268 |
| OKUMA Corp. | 900 | 30,127 |
| Ono Pharmaceutical Co., Ltd. | 10,300 | 242,396 |
| Open House Group Co., Ltd. | 2,300 | 81,810 |
| Oracle Corp. Japan | 1,000 | 53,272 |
| Oriental Land Co., Ltd. | 3,400 | 455,354 |
| Orix JREIT, Inc. | 22 | 29,516 |
| Osaka Gas Co., Ltd. | 7,200 | 106,615 |
| OSG Corp. | 2,400 | 30,512 |
| Otsuka Corp. | 2,200 | 69,283 |
| Otsuka Holdings Co., Ltd. | 6,700 | 214,765 |
| PALTAC Corp. | 98,900 | 2,809,335 |
| Pan Pacific International Holdings Corp. | 8,300 | 136,209 |
| Park24 Co., Ltd. * | 1,800 | 23,990 |
| PeptiDream, Inc. * | 2,000 | 21,881 |
| Persol Holdings Co., Ltd. | 5,500 | 110,123 |
| Pigeon Corp. | 2,000 | 26,198 |
| Pola Orbis Holdings, Inc. | 2,400 | 26,508 |
| Prestige International, Inc. | 371,300 | 1,793,419 |
| Rakuten Group, Inc. | 3,500 | 15,625 |
| Recruit Holdings Co., Ltd. | 46,100 | 1,418,551 |
| Relo Group, Inc. | 2,300 | 32,417 |
| Renesas Electronics Corp. * | 1,500 | 12,549 |
| Rengo Co., Ltd. | 2,800 | 15,556 |
| Resorttrust, Inc. | 1,100 | 16,931 |
| Ricoh Co., Ltd. | 3,100 | 22,716 |
| Rinnai Corp. | 1,000 | 68,065 |
| Rohm Co., Ltd. | 1,800 | 126,476 |
| Rohto Pharmaceutical Co., Ltd. | 92,600 | 2,880,605 |
| Ryohin Keikaku Co., Ltd. | 7,100 | 66,811 |
| Sankyo Co., Ltd. | 1,400 | 46,231 |
| Sankyu, Inc. | 1,400 | 41,743 |
| Sanrio Co., Ltd. | 1,144 | 30,505 |
| Santen Pharmaceutical Co., Ltd. | 6,000 | 41,058 |
| Sanwa Holdings Corp. | 3,716 | 32,010 |
| SCREEN Holdings Co., Ltd. | 1,100 | 60,376 |
| SCSK Corp. | 84,300 | 1,243,717 |
| Secom Co., Ltd. | 5,800 | 330,429 |
| Sega Sammy Holdings, Inc. | 4,600 | 58,840 |
| Seibu Holdings, Inc. | 3,000 | 26,854 |
| Seiko Epson Corp. | 2,200 | 29,868 |
| Seino Holdings Co., Ltd. | 3,900 | 29,967 |
| Sekisui Chemical Co., Ltd. | 10,000 | 124,880 |
| Sekisui House REIT, Inc. | 38 | 20,476 |
| Seven Bank Ltd. | 8,100 | 14,611 |
| SG Holdings Co., Ltd. | 11,200 | 148,412 |
| SHIFT, Inc. * | 100 | 15,614 |
| Shikoku Electric Power Co., Inc. | 2,000 | 9,622 |
| Shimadzu Corp. | 8,300 | 218,646 |
| Shimamura Co., Ltd. | 700 | 56,607 |
| Shimano, Inc. | 2,500 | 386,858 |
| Shimizu Corp. | 5,900 | 29,441 |
| Shin-Etsu Chemical Co., Ltd. | 12,900 | 1,340,696 |
| Shinko Electric Industries Co., Ltd. | 1,700 | 40,853 |
| Shionogi & Co., Ltd. | 4,200 | 195,036 |
| Shiseido Co., Ltd. | 11,000 | 379,909 |
| Shizuoka Financial Group, Inc. | 2,900 | 18,313 |
| SHO-BOND Holdings Co., Ltd. | 69,000 | 2,984,945 |
| Shochiku Co., Ltd. | 100 | 7,938 |
| Showa Denko K.K. | 3,700 | 54,015 |
| Skylark Holdings Co., Ltd. * | 1,900 | 20,268 |
| SMC Corp. | 1,800 | 722,524 |
| SMS Co., Ltd. | 1,400 | 32,117 |
| Sohgo Security Services Co., Ltd. | 1,900 | 47,362 |
| SECURITY | NUMBER OF SHARES | VALUE ($) |
| Sojitz Corp. | 3,000 | 44,226 |
| Sotetsu Holdings, Inc. | 800 | 12,115 |
| Square Enix Holdings Co., Ltd. | 2,400 | 107,093 |
| Stanley Electric Co., Ltd. | 3,900 | 66,302 |
| Subaru Corp. | 9,000 | 140,677 |
| Sugi Holdings Co., Ltd. | 800 | 32,084 |
| SUMCO Corp. | 3,800 | 48,164 |
| Sumitomo Bakelite Co., Ltd. | 800 | 21,653 |
| Sumitomo Chemical Co., Ltd. | 24,600 | 82,835 |
| Sumitomo Forestry Co., Ltd. | 3,600 | 56,317 |
| Sumitomo Heavy Industries Ltd. | 2,200 | 41,700 |
| Sumitomo Metal Mining Co., Ltd. | 5,800 | 162,579 |
| Sumitomo Rubber Industries Ltd. | 3,000 | 25,737 |
| Sundrug Co., Ltd. | 1,400 | 32,554 |
| Suntory Beverage & Food Ltd. | 2,500 | 83,642 |
| Suzuken Co., Ltd. | 1,700 | 37,848 |
| Suzuki Motor Corp. | 7,900 | 267,098 |
| Sysmex Corp. | 3,800 | 204,531 |
| Systena Corp. | 1,433,200 | 4,017,085 |
| T&D Holdings, Inc. | 2,600 | 25,715 |
| Taisei Corp. | 3,300 | 89,894 |
| Taisho Pharmaceutical Holdings Co., Ltd. | 700 | 25,248 |
| Taiyo Yuden Co., Ltd. | 2,100 | 57,144 |
| Takara Bio, Inc. | 800 | 9,360 |
| Takashimaya Co., Ltd. | 1,900 | 23,504 |
| TechnoPro Holdings, Inc. | 1,300 | 31,187 |
| Teijin Ltd. | 2,100 | 19,066 |
| The Bank of Kyoto Ltd. | 400 | 14,414 |
| The Chiba Bank Ltd. | 3,600 | 19,725 |
| The Chugoku Electric Power Co., Inc. | 3,500 | 16,421 |
| The Japan Steel Works Ltd. | 1,400 | 28,908 |
| The Kansai Electric Power Co., Inc. | 11,200 | 84,843 |
| The Yokohama Rubber Co., Ltd. | 2,300 | 35,965 |
| THK Co., Ltd. | 2,000 | 34,880 |
| TIS, Inc. | 5,600 | 150,986 |
| Tobu Railway Co., Ltd. | 2,200 | 50,891 |
| Toda Corp. | 3,300 | 16,494 |
| Toho Co., Ltd. | 3,400 | 120,899 |
| Toho Gas Co., Ltd. | 1,700 | 31,674 |
| Tohoku Electric Power Co., Inc. | 6,000 | 25,202 |
| Tokai Carbon Co., Ltd. | 3,300 | 21,536 |
| Tokyo Century Corp. | 500 | 17,054 |
| Tokyo Electric Power Co. Holdings, Inc. * | 20,900 | 68,083 |
| Tokyo Electron Ltd. | 3,900 | 1,026,076 |
| Tokyo Gas Co., Ltd. | 7,600 | 135,823 |
| Tokyo Ohka Kogyo Co., Ltd. | 31,600 | 1,362,329 |
| Tokyo Tatemono Co., Ltd. | 1,400 | 19,253 |
| Tokyu Fudosan Holdings Corp. | 3,000 | 15,221 |
| Toppan, Inc. | 5,100 | 76,062 |
| Toray Industries, Inc. | 23,600 | 114,633 |
| Toshiba Corp. | 9,700 | 336,605 |
| Toshiba TEC Corp. | 400 | 10,356 |
| Tosoh Corp. | 9,000 | 97,915 |
| TOTO Ltd. | 4,200 | 119,795 |
| Toyo Seikan Group Holdings Ltd. | 3,700 | 42,319 |
| Toyo Suisan Kaisha Ltd. | 102,700 | 3,853,014 |
| Toyo Tire Corp. | 1,600 | 18,770 |
| Toyoda Gosei Co., Ltd. | 900 | 14,388 |
| Toyota Boshoku Corp. | 1,500 | 19,087 |
| Trend Micro, Inc. | 2,800 | 141,186 |
| TS Tech Co., Ltd. | 2,400 | 25,098 |
| Tsuruha Holdings, Inc. | 400 | 23,238 |
| UBE Corp. | 1,400 | 18,057 |
| Ulvac, Inc. | 1,400 | 55,189 |
| Unicharm Corp. | 7,500 | 227,936 |
| United Urban Investment Corp. | 23 | 24,335 |
| Ushio, Inc. | 37,000 | 384,222 |
| USS Co., Ltd. | 6,529 | 98,514 |
| SECURITY | NUMBER OF SHARES | VALUE ($) |
| Visional, Inc. * | 41,000 | 2,786,972 |
| Welcia Holdings Co., Ltd. | 600 | 12,541 |
| West Holdings Corp. | 82,800 | 2,474,364 |
| Yakult Honsha Co., Ltd. | 2,800 | 155,117 |
| Yamada Holdings Co., Ltd. | 6,500 | 20,946 |
| Yamaha Corp. | 4,900 | 184,996 |
| Yamaha Motor Co., Ltd. | 6,400 | 132,112 |
| Yamato Holdings Co., Ltd. | 10,200 | 151,055 |
| Yamato Kogyo Co., Ltd. | 1,000 | 29,040 |
| Yamazaki Baking Co., Ltd. | 1,600 | 16,303 |
| Yaskawa Electric Corp. | 6,700 | 185,518 |
| Yokogawa Electric Corp. | 6,800 | 113,704 |
| Zenkoku Hosho Co., Ltd. | 2,800 | 92,391 |
| Zensho Holdings Co., Ltd. | 1,500 | 37,436 |
| Zeon Corp. | 4,500 | 37,932 |
| ZOZO, Inc. | 3,600 | 76,386 |
| 134,451,393 | ||
| Luxembourg 0.0% | ||
| Eurofins Scientific SE | 2,124 | 135,967 |
| Mexico 0.7% | ||
| Controladora Vuela Cia de Aviacion S.A.B. de C.V. ADR * | 79,602 | 667,065 |
| Grupo Aeroportuario del Centro Norte S.A.B. de C.V. | 260,857 | 2,078,114 |
| Grupo Televisa S.A.B. ADR | 234,790 | 1,232,647 |
| Regional SAB de C.V. | 403,535 | 2,820,040 |
| 6,797,866 | ||
| Netherlands 5.4% | ||
| Aalberts N.V. | 2,097 | 72,748 |
| ABN AMRO Bank N.V., GDR | 1,501 | 14,756 |
| Adyen N.V. * | 4,301 | 6,140,102 |
| Aegon N.V. | 6,785 | 31,409 |
| Akzo Nobel N.V. | 8,721 | 538,395 |
| Alfen Beheer B.V. * | 14,106 | 1,496,346 |
| AMG Advanced Metallurgical Group N.V. | 83,177 | 2,598,691 |
| Arcadis N.V. | 65,685 | 2,229,155 |
| ASM International N.V. | 1,385 | 306,389 |
| ASML Holding N.V. | 32,497 | 15,243,907 |
| ASR Nederland N.V. | 50,447 | 2,221,326 |
| B&S Group Sarl | 262,840 | 1,376,046 |
| Basic-Fit N.V. * | 62,266 | 1,568,229 |
| BE Semiconductor Industries N.V. | 2,543 | 129,603 |
| CTP N.V. | 2,457 | 25,484 |
| Euronext N.V. | 341 | 21,643 |
| EXOR N.V. * | 73,443 | 4,935,442 |
| InPost S.A. * | 3,770 | 24,032 |
| JDE Peet's N.V. | 1,451 | 41,535 |
| Koninklijke DSM N.V. | 3,984 | 468,639 |
| Koninklijke KPN N.V. | 64,095 | 179,280 |
| Koninklijke Philips N.V. | 189,924 | 2,409,163 |
| Koninklijke Vopak N.V. | 886 | 18,103 |
| Marel HF | 580,484 | 2,082,397 |
| OCI N.V. | 46,067 | 1,761,965 |
| Prosus N.V. * | 116,386 | 5,032,725 |
| Randstad N.V. | 3,247 | 161,828 |
| Signify N.V. | 1,938 | 53,693 |
| Stellantis N.V. | 48,859 | 659,184 |
| Universal Music Group N.V. | 15,818 | 310,594 |
| Wolters Kluwer N.V. | 4,807 | 510,785 |
| 52,663,594 | ||
| SECURITY | NUMBER OF SHARES | VALUE ($) |
| New Zealand 0.2% | ||
| Auckland International Airport Ltd. * | 13,737 | 61,410 |
| Contact Energy Ltd. | 14,701 | 64,485 |
| EBOS Group Ltd. | 507 | 11,053 |
| Fisher & Paykel Healthcare Corp., Ltd. | 16,408 | 186,477 |
| Fletcher Building Ltd. | 13,265 | 39,608 |
| Infratil Ltd. | 6,992 | 35,504 |
| Kiwi Property Group Ltd. | 39,307 | 20,636 |
| Mainfreight Ltd. | 2,599 | 114,860 |
| Mercury NZ Ltd. | 9,364 | 31,662 |
| Meridian Energy Ltd. | 25,026 | 70,939 |
| Ryman Healthcare Ltd. | 6,364 | 30,995 |
| SKYCITY Entertainment Group Ltd. * | 8,695 | 14,659 |
| Spark New Zealand Ltd. | 44,928 | 133,740 |
| The a2 Milk Co., Ltd. *(b) | 20,349 | 68,553 |
| The a2 Milk Co., Ltd. *(b) | 345,790 | 1,162,013 |
| 2,046,594 | ||
| Norway 0.7% | ||
| Aker A.S.A., A Shares | 967 | 68,235 |
| Aker BP A.S.A. (a) | 9,717 | 308,674 |
| Bakkafrost P/F | 23,611 | 1,180,971 |
| Equinor A.S.A. | 28,511 | 1,038,762 |
| FLEX LNG Ltd. | 39,646 | 1,231,444 |
| Gjensidige Forsikring A.S.A. | 6,202 | 113,365 |
| Kongsberg Gruppen A.S.A. | 2,230 | 79,969 |
| Leroy Seafood Group A.S.A. | 6,023 | 27,734 |
| Mowi A.S.A. | 9,395 | 140,228 |
| Nordic Semiconductor A.S.A. * | 4,616 | 65,165 |
| Norsk Hydro A.S.A. | 26,297 | 166,889 |
| Orkla A.S.A. | 13,261 | 89,448 |
| Salmar A.S.A. | 814 | 27,596 |
| Schibsted A.S.A., A Shares | 1,097 | 16,931 |
| Schibsted A.S.A., B Shares | 945 | 14,049 |
| Telenor A.S.A. | 11,562 | 105,074 |
| TGS A.S.A. | 137,567 | 1,872,951 |
| Tomra Systems A.S.A. | 6,718 | 108,506 |
| Var Energi A.S.A. | 10,432 | 35,458 |
| Yara International A.S.A. | 3,480 | 155,317 |
| 6,846,766 | ||
| Poland 0.1% | ||
| Allegro.eu S.A. * | 6,807 | 33,015 |
| Dino Polska S.A. * | 1,302 | 84,985 |
| KGHM Polska Miedz S.A. | 3,142 | 62,817 |
| LPP S.A. | 32 | 55,448 |
| Polski Koncern Naftowy Orlen S.A. | 11,514 | 132,221 |
| Polskie Gornictwo Naftowe i Gazownictwo S.A. *(c) | 37,953 | 40,167 |
| Powszechna Kasa Oszczednosci Bank Polski S.A. | 5,051 | 27,525 |
| Powszechny Zaklad Ubezpieczen S.A. | 2,627 | 14,717 |
| 450,895 | ||
| Portugal 0.0% | ||
| EDP - Energias de Portugal S.A. | 46,938 | 205,087 |
| Galp Energia, SGPS, S.A. | 9,782 | 99,318 |
| Jeronimo Martins, SGPS, S.A. | 6,176 | 127,800 |
| 432,205 | ||
| Republic of Korea 1.7% | ||
| Amorepacific Corp. | 810 | 52,590 |
| AMOREPACIFIC Group | 871 | 15,081 |
| SECURITY | NUMBER OF SHARES | VALUE ($) |
| BGF retail Co., Ltd. | 163 | 21,316 |
| BNK Financial Group, Inc. | 3,277 | 14,726 |
| Celltrion Pharm, Inc. * | 618 | 29,317 |
| Celltrion, Inc. | 3,334 | 448,152 |
| Cheil Worldwide, Inc. | 2,361 | 40,456 |
| CJ CheilJedang Corp. | 117 | 33,970 |
| CJ Corp. | 143 | 7,197 |
| CJ ENM Co., Ltd. | 221 | 11,363 |
| CJ Logistics Corp. * | 144 | 8,868 |
| Coway Co., Ltd. | 974 | 37,768 |
| Daewoo Engineering & Construction Co., Ltd. * | 5,129 | 15,105 |
| DB Insurance Co., Ltd. | 732 | 28,889 |
| DL E&C Co., Ltd. | 827 | 19,952 |
| DL Holdings Co., Ltd. | 285 | 12,281 |
| Dongsuh Cos., Inc. | 978 | 13,990 |
| Doosan Bobcat, Inc. | 523 | 12,274 |
| Ecopro BM Co., Ltd. | 302 | 24,324 |
| F&F Co., Ltd. | 519 | 52,880 |
| Fila Holdings Corp. | 1,423 | 32,591 |
| GS Engineering & Construction Corp. | 818 | 12,429 |
| GS Holdings Corp. | 542 | 17,482 |
| Hankook Tire & Technology Co., Ltd. | 1,571 | 40,240 |
| Hanmi Pharm Co., Ltd. | 152 | 26,967 |
| Hanon Systems | 2,765 | 15,109 |
| Hanwha Aerospace Co., Ltd. | 797 | 37,117 |
| Hanwha Corp. | 638 | 11,352 |
| HD Hyundai Co., Ltd. | 669 | 28,559 |
| Hite Jinro Co., Ltd. | 64,722 | 1,163,742 |
| HL Mando Co., Ltd. | 479 | 16,585 |
| HMM Co., Ltd. | 8,964 | 119,911 |
| Hotel Shilla Co., Ltd. | 754 | 34,335 |
| Hyundai Department Store Co., Ltd. | 347 | 13,161 |
| Hyundai Doosan Infracore Co., Ltd. * | 2,184 | 8,491 |
| Hyundai Engineering & Construction Co., Ltd. | 1,352 | 33,053 |
| Hyundai Glovis Co., Ltd. | 547 | 66,672 |
| Hyundai Heavy Industries Co., Ltd. * | 177 | 13,521 |
| Hyundai Marine & Fire Insurance Co., Ltd. | 752 | 17,562 |
| Hyundai Mipo Dockyard Co., Ltd. * | 323 | 20,787 |
| Hyundai Mobis Co., Ltd. | 1,726 | 264,733 |
| Hyundai Wia Corp. | 276 | 11,807 |
| Industrial Bank of Korea | 2,894 | 21,209 |
| Kakao Games Corp. * | 317 | 8,768 |
| KakaoBank Corp. * | 1,960 | 23,462 |
| Kakaopay Corp. * | 282 | 6,979 |
| Kangwon Land, Inc. * | 3,285 | 52,965 |
| KCC Corp. | 59 | 10,077 |
| KEPCO Plant Service & Engineering Co., Ltd. | 654 | 14,626 |
| Kia Corp. | 7,566 | 351,598 |
| Korea Aerospace Industries Ltd. | 1,132 | 37,594 |
| Korea Electric Power Corp. * | 3,125 | 36,645 |
| Korea Investment Holdings Co., Ltd. | 780 | 27,077 |
| Korea Shipbuilding & Offshore Engineering Co., Ltd. * | 569 | 28,986 |
| Korea Zinc Co., Ltd. | 230 | 103,144 |
| Korean Air Lines Co., Ltd. * | 1,974 | 31,967 |
| Krafton, Inc. * | 442 | 54,903 |
| KT&G Corp. | 3,390 | 227,678 |
| Kumho Petrochemical Co., Ltd. | 377 | 34,561 |
| LG Corp. | 2,757 | 153,049 |
| LG Display Co., Ltd. | 3,900 | 34,805 |
| LG Electronics, Inc. | 2,044 | 116,754 |
| LG Energy Solution Ltd. * | 889 | 328,947 |
| LG H&H Co., Ltd. | 253 | 90,392 |
| LG Innotek Co., Ltd. | 432 | 89,625 |
| LG Uplus Corp. | 3,806 | 30,563 |
| SECURITY | NUMBER OF SHARES | VALUE ($) |
| Lotte Chemical Corp. | 368 | 38,132 |
| LOTTE Fine Chemical Co., Ltd. | 393 | 15,454 |
| Mirae Asset Securities Co., Ltd. | 3,541 | 15,763 |
| NAVER Corp. | 24,735 | 2,934,022 |
| NCSoft Corp. | 386 | 105,447 |
| NH Investment & Securities Co., Ltd. | 2,332 | 14,663 |
| NongShim Co., Ltd. | 82 | 17,369 |
| OCI Co., Ltd. | 176 | 12,571 |
| Orion Corp. | 639 | 45,472 |
| Pan Ocean Co., Ltd. | 4,883 | 14,704 |
| Posco International Corp. | 911 | 13,181 |
| S-1 Corp. | 573 | 25,078 |
| Samsung Biologics Co., Ltd. * | 343 | 210,786 |
| Samsung C&T Corp. | 1,902 | 157,888 |
| Samsung Card Co., Ltd. | 657 | 14,243 |
| Samsung Electro-Mechanics Co., Ltd. | 1,524 | 129,070 |
| Samsung Electronics Co., Ltd. | 139,002 | 5,785,239 |
| Samsung Engineering Co., Ltd. * | 3,940 | 65,819 |
| Samsung Heavy Industries Co., Ltd. * | 4,238 | 15,300 |
| Samsung Life Insurance Co., Ltd. | 770 | 36,388 |
| Samsung SDI Co., Ltd. | 871 | 449,362 |
| Samsung SDS Co., Ltd. | 1,026 | 89,887 |
| Samsung Securities Co., Ltd. | 1,069 | 23,784 |
| SD Biosensor, Inc. | 807 | 16,696 |
| Seegene, Inc. | 787 | 15,822 |
| Shinsegae, Inc. | 138 | 20,547 |
| SK Biopharmaceuticals Co., Ltd. * | 455 | 18,524 |
| SK Bioscience Co., Ltd. * | 570 | 30,151 |
| SK Hynix, Inc. | 14,936 | 864,668 |
| SK Square Co., Ltd. * | 412 | 10,653 |
| SK Telecom Co., Ltd. | 1,197 | 42,065 |
| S-Oil Corp. | 1,261 | 76,460 |
| SSANGYONG C&E Co., Ltd. | 2,250 | 8,966 |
| Wemade Co., Ltd. | 515 | 15,966 |
| Yuhan Corp. | 1,319 | 55,304 |
| 16,228,523 | ||
| Singapore 0.9% | ||
| CapitaLand Ascendas REIT | 75,500 | 139,689 |
| CapitaLand Ascott Trust | 30,500 | 20,563 |
| CapitaLand Integrated Commercial Trust | 93,700 | 124,354 |
| Capitaland Investment Ltd. | 34,800 | 74,007 |
| ComfortDelGro Corp., Ltd. | 58,500 | 52,515 |
| ESR-LOGOS REIT | 8,207,514 | 1,970,163 |
| Frasers Logistics & Commercial Trust | 86,300 | 67,071 |
| Genting Singapore Ltd. | 143,800 | 81,775 |
| Golden Agri-Resources Ltd. | 146,400 | 30,021 |
| Hutchison Port Holdings Trust, Class U | 74,900 | 12,233 |
| Jardine Cycle & Carriage Ltd. | 2,100 | 44,108 |
| Jardine Matheson Holdings Ltd. | 4,000 | 184,272 |
| Keppel Corp., Ltd. | 18,400 | 90,565 |
| Keppel DC REIT | 35,800 | 44,493 |
| Keppel REIT | 25,200 | 15,932 |
| Mapletree Industrial Trust | 40,800 | 63,441 |
| Mapletree Logistics Trust | 74,200 | 79,637 |
| Mapletree Pan Asia Commercial Trust | 32,600 | 36,584 |
| Nanofilm Technologies International Ltd. | 923,100 | 1,135,749 |
| NetLink NBN Trust | 49,500 | 29,900 |
| Olam Group Ltd. | 12,400 | 11,740 |
| SATS Ltd. * | 1,034,100 | 1,996,091 |
| Sembcorp Industries Ltd. | 16,700 | 34,329 |
| Sheng Siong Group Ltd. | 1,557,600 | 1,717,918 |
| Singapore Airlines Ltd. * | 23,400 | 86,798 |
| Singapore Exchange Ltd. | 56,100 | 333,606 |
| Singapore Post Ltd. | 32,700 | 12,487 |
| Singapore Technologies Engineering Ltd. | 35,800 | 83,462 |
| Singapore Telecommunications Ltd. | 126,500 | 222,734 |
| SECURITY | NUMBER OF SHARES | VALUE ($) |
| Suntec Real Estate Investment Trust | 30,800 | 28,090 |
| UOL Group Ltd. | 3,100 | 13,540 |
| Venture Corp., Ltd. | 6,400 | 72,021 |
| Wilmar International Ltd. | 26,100 | 71,502 |
| 8,981,390 | ||
| South Africa 0.3% | ||
| The Bidvest Group Ltd. | 233,051 | 2,695,811 |
| Spain 0.7% | ||
| Acciona S.A. | 217 | 39,073 |
| Amadeus IT Group S.A. * | 56,600 | 2,951,988 |
| Bankinter S.A. | 4,524 | 27,365 |
| Corp. ACCIONA Energias Renovables S.A. | 695 | 27,328 |
| EDP Renovaveis S.A. | 3,070 | 64,600 |
| Enagas S.A. | 3,149 | 51,121 |
| Endesa S.A. | 7,408 | 123,773 |
| Fluidra S.A. | 2,271 | 30,842 |
| Gestamp Automocion S.A. | 420,460 | 1,480,562 |
| Grifols S.A. * | 1,236 | 10,515 |
| Industria de Diseno Textil S.A. | 34,224 | 776,823 |
| Inmobiliaria Colonial Socimi S.A. | 3,310 | 17,456 |
| Merlin Properties Socimi S.A. | 3,167 | 26,845 |
| Naturgy Energy Group S.A. | 3,903 | 100,161 |
| Red Electrica Corp. S.A. | 9,868 | 159,622 |
| Repsol S.A. | 27,996 | 380,871 |
| Siemens Gamesa Renewable Energy S.A. * | 3,344 | 59,285 |
| Telefonica S.A. | 84,368 | 290,833 |
| 6,619,063 | ||
| Sweden 4.4% | ||
| AAK AB | 83,530 | 1,217,654 |
| AddTech AB, B Shares | 43,803 | 529,286 |
| AFRY AB | 186,378 | 2,502,830 |
| Alfa Laval AB | 4,169 | 102,621 |
| Alleima AB * | 2,979 | 10,150 |
| Assa Abloy AB, B Shares | 13,595 | 274,511 |
| Atlas Copco AB, A Shares | 59,115 | 630,949 |
| Atlas Copco AB, B Shares | 126,070 | 1,219,243 |
| Avanza Bank Holding AB | 90,853 | 1,812,248 |
| Axfood AB | 60,926 | 1,508,443 |
| Beijer Ref AB | 1,216 | 18,851 |
| Boliden AB | 6,735 | 195,860 |
| Bravida Holding AB | 302,859 | 2,837,462 |
| Castellum AB | 5,250 | 60,029 |
| Electrolux AB, B Shares | 2,466 | 30,424 |
| Epiroc AB, A Shares | 15,987 | 244,736 |
| Epiroc AB, B Shares | 8,588 | 115,313 |
| EQT AB | 16,692 | 328,498 |
| Evolution AB | 3,980 | 371,265 |
| Fastighets AB Balder, B Shares * | 13,223 | 49,634 |
| Fortnox AB | 341,865 | 1,452,859 |
| Getinge AB, B Shares | 3,777 | 76,647 |
| H & M Hennes & Mauritz AB, B Shares | 241,056 | 2,427,953 |
| Holmen AB, B Shares | 27,056 | 981,874 |
| Husqvarna AB, B Shares | 4,755 | 28,231 |
| Industrivarden AB, A Shares | 13,005 | 294,536 |
| Industrivarden AB, C Shares | 10,500 | 235,782 |
| Indutrade AB | 3,981 | 69,699 |
| Investment AB Latour, B Shares | 7,526 | 127,131 |
| Investor AB, A Shares | 31,166 | 529,970 |
| Investor AB, B Shares | 106,794 | 1,742,943 |
| Kinnevik AB, B Shares * | 55,483 | 685,406 |
| L E Lundbergfortagen AB, B Shares | 2,250 | 88,802 |
| Lifco AB, B Shares | 3,417 | 49,375 |
| SECURITY | NUMBER OF SHARES | VALUE ($) |
| Lindab International AB | 141,494 | 1,505,093 |
| Nibe Industrier AB, B Shares | 18,012 | 143,678 |
| Saab AB, B Shares | 111,886 | 3,953,384 |
| Sagax AB, Class B | 4,604 | 84,839 |
| Sandvik AB | 28,100 | 439,112 |
| Securitas AB, B Shares | 3,192 | 26,081 |
| SKF AB, B Shares | 232,842 | 3,370,530 |
| Spotify Technology S.A. * | 23,477 | 1,891,777 |
| Svenska Cellulosa AB, S.C.A., B Shares | 7,330 | 86,478 |
| Sweco AB, B Shares | 3,392 | 25,486 |
| Swedish Match AB | 31,272 | 321,629 |
| Swedish Orphan Biovitrum AB * | 2,625 | 48,351 |
| Tele2 AB, B Shares | 9,337 | 76,526 |
| Telefonaktiebolaget LM Ericsson, B Shares | 62,676 | 348,437 |
| Telia Co. AB | 29,707 | 78,717 |
| Thule Group AB | 76,413 | 1,505,383 |
| Trelleborg AB, B Shares | 106,544 | 2,345,998 |
| Vitrolife AB | 48,025 | 776,174 |
| Volvo AB, A Shares | 3,347 | 57,172 |
| Volvo AB, B Shares | 193,863 | 3,172,941 |
| Volvo Car AB, Class B * | 10,506 | 44,588 |
| 43,153,589 | ||
| Switzerland 5.8% | ||
| ABB Ltd. | 44,224 | 1,228,114 |
| Accelleron Industries AG * | 2,324 | 39,408 |
| Adecco Group AG | 2,543 | 79,586 |
| Bachem Holding AG, Class B | 382 | 27,392 |
| Baloise Holding AG | 198 | 27,051 |
| Banque Cantonale Vaudoise | 125 | 11,124 |
| Barry Callebaut AG | 52 | 98,379 |
| Belimo Holding AG | 291 | 118,526 |
| BKW AG | 228 | 26,599 |
| Burckhardt Compression Holding AG | 4,255 | 1,840,706 |
| Chocoladefabriken Lindt & Spruengli AG | 2 | 194,378 |
| Chocoladefabriken Lindt & Spruengli AG, Participation Certificates | 23 | 220,732 |
| Cie Financiere Richemont S.A., Class A | 24,989 | 2,442,263 |
| Clariant AG * | 2,762 | 44,388 |
| Credit Suisse Group AG | 1,100,539 | 4,558,938 |
| DKSH Holding AG | 810 | 58,434 |
| Emmi AG | 44 | 35,110 |
| EMS-Chemie Holding AG | 233 | 146,508 |
| Flughafen Zuerich AG * | 221 | 34,285 |
| Geberit AG | 1,149 | 510,773 |
| Georg Fischer AG | 1,722 | 95,372 |
| Glencore plc | 1,088,690 | 6,241,534 |
| Helvetia Holding AG | 156 | 15,491 |
| Holcim AG * | 101,653 | 4,618,331 |
| Kuehne & Nagel International AG | 1,664 | 354,209 |
| Logitech International S.A. | 4,302 | 213,947 |
| Nestle S.A. | 52,294 | 5,692,662 |
| Novartis AG | 78,243 | 6,329,132 |
| Partners Group Holding AG | 1,675 | 1,503,451 |
| PSP Swiss Property AG | 894 | 95,506 |
| Roche Holding AG | 25,269 | 8,384,207 |
| Roche Holding AG, Bearer Shares | 840 | 340,948 |
| Schindler Holding AG | 579 | 91,146 |
| Schindler Holding AG, Participation Certificates | 9,297 | 1,516,024 |
| SGS S.A. | 131 | 288,791 |
| Siegfried Holding AG * | 1,074 | 639,329 |
| SIG Group AG * | 67,793 | 1,303,190 |
| Sika AG | 2,654 | 598,413 |
| Sonova Holding AG | 1,309 | 309,400 |
| Straumann Holding AG | 3,286 | 312,733 |
| Swisscom AG | 553 | 273,065 |
| SECURITY | NUMBER OF SHARES | VALUE ($) |
| Tecan Group AG | 9,106 | 3,340,386 |
| Temenos AG | 1,301 | 77,486 |
| The Swatch Group AG | 1,189 | 49,675 |
| The Swatch Group AG, Bearer Shares | 8,831 | 1,984,409 |
| VAT Group AG | 844 | 192,686 |
| 56,604,217 | ||
| Taiwan 1.0% | ||
| Airtac International Group | 32,297 | 739,066 |
| ASPEED Technology, Inc. | 16,600 | 860,557 |
| Chailease Holding Co., Ltd. | 73,713 | 340,015 |
| E Ink Holdings, Inc. | 547,000 | 3,475,731 |
| Pegavision Corp. | 213,000 | 1,859,550 |
| Sinbon Electronics Co., Ltd. | 345,000 | 2,679,131 |
| 9,954,050 | ||
| Thailand 0.3% | ||
| Bangkok Bank PCL NVDR | 347,400 | 1,330,330 |
| Central Retail Corp. PCL | 1,840,100 | 2,030,589 |
| 3,360,919 | ||
| United Kingdom 11.4% | ||
| 3i Group plc | 68,925 | 917,968 |
| abrdn plc | 132,274 | 241,027 |
| Admiral Group plc | 20,491 | 473,867 |
| Airtel Africa plc | 22,905 | 29,648 |
| Allfunds Group plc | 2,492 | 15,672 |
| Anglo American plc | 37,619 | 1,126,847 |
| Antofagasta plc | 9,640 | 129,903 |
| Ashtead Group plc | 43,100 | 2,245,209 |
| Associated British Foods plc | 5,696 | 88,284 |
| Auction Technology Group plc * | 104,397 | 893,455 |
| Auto Trader Group plc | 28,499 | 170,589 |
| AVEVA Group plc | 1,266 | 45,308 |
| B&M European Value Retail S.A. | 11,974 | 44,251 |
| Barratt Developments plc | 31,616 | 136,363 |
| Bellway plc | 3,791 | 80,624 |
| Berkeley Group Holdings plc | 567 | 22,559 |
| Bodycote plc | 359,058 | 2,040,720 |
| Britvic plc | 157,171 | 1,311,272 |
| Burberry Group plc | 10,390 | 216,498 |
| Centrica plc | 101,959 | 89,593 |
| CNH Industrial N.V. | 374,292 | 4,842,245 |
| Coats Group plc | 5,116,773 | 3,549,823 |
| Coca-Cola HBC AG * | 3,483 | 76,080 |
| Compass Group plc | 57,400 | 1,208,948 |
| ConvaTec Group plc | 718,675 | 1,798,286 |
| Croda International plc | 2,921 | 226,289 |
| DCC plc | 2,016 | 111,890 |
| Dechra Pharmaceuticals plc | 1,484 | 44,612 |
| Derwent London plc | 1,165 | 28,833 |
| Diageo plc | 41,694 | 1,715,811 |
| Diploma plc | 181,524 | 5,163,063 |
| Direct Line Insurance Group plc | 26,588 | 61,430 |
| Dr. Martens plc | 13,143 | 37,377 |
| DS Smith plc | 20,531 | 68,469 |
| Dunelm Group plc | 276,817 | 2,752,323 |
| Endava plc, ADR * | 11,939 | 910,229 |
| Endeavour Mining plc | 2,693 | 46,840 |
| Experian plc | 16,957 | 540,678 |
| Ferguson plc | 4,729 | 515,738 |
| Forterra plc | 643,342 | 1,612,059 |
| Fresnillo plc | 5,326 | 44,528 |
| Golar LNG Ltd. * | 93,518 | 2,601,671 |
| Greggs plc | 58,156 | 1,348,139 |
| SECURITY | NUMBER OF SHARES | VALUE ($) |
| GSK plc | 63,548 | 1,040,985 |
| Haleon plc * | 130,760 | 400,969 |
| Halma plc | 7,970 | 193,267 |
| Hargreaves Lansdown plc | 27,190 | 237,630 |
| Hikma Pharmaceuticals plc | 3,306 | 47,458 |
| Hill & Smith Holdings plc | 194,498 | 2,198,590 |
| Hiscox Ltd. | 2,856 | 29,422 |
| HomeServe plc | 13,210 | 179,795 |
| Howden Joinery Group plc | 15,185 | 89,449 |
| IMI plc | 4,069 | 57,319 |
| Imperial Brands plc | 18,497 | 450,570 |
| Inchcape plc | 428,426 | 3,654,859 |
| Informa plc | 321,197 | 2,046,641 |
| InterContinental Hotels Group plc | 2,552 | 137,121 |
| Intermediate Capital Group plc | 11,928 | 145,244 |
| International Distributions Services plc | 12,720 | 29,426 |
| Intertek Group plc | 2,271 | 95,139 |
| ITV plc | 67,049 | 51,625 |
| J Sainsbury plc | 14,004 | 31,216 |
| J.D. Sports Fashion plc | 47,052 | 52,577 |
| John Wood Group plc * | 1,329,336 | 2,137,398 |
| Johnson Matthey plc | 4,528 | 100,511 |
| Kainos Group plc | 173,915 | 2,469,368 |
| Kingfisher plc | 40,990 | 102,985 |
| Land Securities Group plc | 15,923 | 104,119 |
| Liberty Global plc, Class A * | 145,000 | 2,444,700 |
| Lloyds Banking Group plc | 12,688,310 | 6,093,777 |
| M&G plc | 7,137 | 14,343 |
| Mondi plc | 11,876 | 199,261 |
| Next plc | 3,363 | 189,941 |
| Ocado Group plc * | 334,088 | 1,811,189 |
| Pearson plc | 10,062 | 111,216 |
| Pennon Group plc | 2,678 | 25,735 |
| Pepco Group N.V. * | 1,883 | 13,230 |
| Persimmon plc | 9,742 | 145,778 |
| Phoenix Group Holdings plc | 1,671 | 10,400 |
| Prudential plc | 355,500 | 3,302,474 |
| Reckitt Benckiser Group plc | 28,961 | 1,921,967 |
| RELX plc | 33,304 | 894,562 |
| Renishaw plc | 877 | 35,191 |
| Rightmove plc | 27,439 | 154,514 |
| Rio Tinto plc | 35,013 | 1,829,836 |
| Rolls-Royce Holdings plc * | 781,333 | 700,748 |
| RS Group plc | 240,397 | 2,645,188 |
| Schroders plc | 814,341 | 3,656,396 |
| Segro plc | 39,579 | 356,211 |
| Shell plc | 159,491 | 4,418,153 |
| Smiths Group plc | 72,936 | 1,306,469 |
| Spectris plc | 88,876 | 3,080,351 |
| Spirax-Sarco Engineering plc | 1,865 | 229,830 |
| SSE plc | 16,938 | 302,697 |
| SSP Group plc * | 981,719 | 2,282,736 |
| St. James's Place plc | 1,688 | 20,613 |
| Tate & Lyle plc | 248,965 | 2,000,479 |
| Taylor Wimpey plc | 110,342 | 118,632 |
| The British Land Co., plc | 27,877 | 116,941 |
| The Sage Group plc | 24,743 | 206,226 |
| The Unite Group plc | 6,266 | 64,007 |
| The Weir Group plc | 77,112 | 1,343,585 |
| Tritax Big Box REIT plc | 1,436,342 | 2,309,555 |
| Vesuvius plc | 620,099 | 2,412,150 |
| Victrex plc | 89,473 | 1,699,341 |
| Vodafone Group plc | 411,885 | 480,835 |
| Watches of Switzerland Group plc * | 259,609 | 2,314,839 |
| Whitbread plc | 2,459 | 72,374 |
| Wise plc, Class A * | 292,497 | 2,227,888 |
| SECURITY | NUMBER OF SHARES | VALUE ($) |
| WPP plc | 346,100 | 3,045,731 |
| 112,318,790 | ||
| United States 1.1% | ||
| Ginkgo Bioworks Holdings, Inc. * | 190,149 | 519,107 |
| Illumina, Inc. * | 10,179 | 2,329,159 |
| Moderna, Inc. * | 29,399 | 4,419,552 |
| NVIDIA Corp. | 4,334 | 584,960 |
| Tesla, Inc. * | 11,551 | 2,628,314 |
| 10,481,092 | ||
| Total Common Stocks (Cost $1,037,392,513) | 905,627,098 | |
| PREFERRED STOCKS 0.5% OF NET ASSETS | ||
| Germany 0.1% | ||
| Bayerische Motoren Werke AG | 872 | 64,305 |
| FUCHS PETROLUB SE | 2,112 | 60,486 |
| Henkel AG & Co. KGaA | 3,477 | 219,046 |
| Sartorius AG | 565 | 199,213 |
| 543,050 | ||
| Italy 0.0% | ||
| Telecom Italia S.p.A. - RSP * | 123,110 | 23,533 |
| Republic of Korea 0.4% | ||
| Hyundai Motor Co., Ltd. | 293 | 16,106 |
| Hyundai Motor Co., Ltd. 2nd | 346 | 19,357 |
| LG Chem Ltd. | 75 | 15,201 |
| LG Electronics, Inc. | 171 | 4,751 |
| LG H&H Co., Ltd. | 83 | 16,326 |
| Samsung Electronics Co., Ltd. | 105,876 | 3,956,786 |
| 4,028,527 | ||
| Total Preferred Stocks (Cost $6,622,067) | 4,595,110 | |
| AFFILIATED INVESTMENT COMPANIES 4.0% OF NET ASSETS | ||
| United States 4.0% | ||
| Schwab Emerging Markets Equity ETF | 1,804,984 | 39,114,003 |
| Total Affiliated Investment Companies (Cost $53,555,600) | 39,114,003 | |
| SECURITY | NUMBEROF SHARES | VALUE ($) |
| SHORT-TERM INVESTMENTS 2.9% OF NET ASSETS | ||
| Money Market Funds 2.9% | ||
| State Street Institutional U.S. Government Money Market Fund, Premier Class 3.01% (d) | 28,594,419 | 28,594,419 |
| State Street Institutional U.S. Government Money Market Fund, Premier Class 3.01% (d)(e) | 400,270 | 400,270 |
| 28,994,689 | ||
| Total Short-Term Investments (Cost $28,994,689) | 28,994,689 | |
| Total Investments in Securities (Cost $1,126,564,869) | 978,330,900 | |
| NUMBER OF CONTRACTS | NOTIONAL AMOUNT ($) | CURRENT VALUE/ UNREALIZED APPRECIATION ($) | |
| FUTURES CONTRACTS | |||
| Long | |||
| MSCI EAFE Index, expires 12/16/22 | 238 | 20,895,210 | 767,044 |
| * | Non-income producing security. |
| (a) | All or a portion of this security is on loan. Securities on loan were valued at $374,495. |
| (b) | Security is traded on separate exchanges for the same issuer. |
| (c) | Fair-valued using significant unobservable inputs (see financial note 2(a), Securities for which no quoted value is available, for additional information). |
| (d) | The rate shown is the annualized 7-day yield. |
| (e) | Security purchased with cash collateral received for securities on loan. |
| ADR — | American Depositary Receipt |
| CVA — | Dutch Certificate |
| ETF — | Exchange traded fund |
| GDR — | Global Depositary Receipt |
| NVDR — | Non-Voting Depositary Receipt |
| REIT — | Real Estate Investment Trust |
| RSP — | Risparmio (Savings Shares) |
| SECURITY | VALUE AT 10/31/21 | PURCHASES | SALES | REALIZED GAINS (LOSSES) | NET CHANGE IN UNREALIZED APPRECIATION (DEPRECIATION) | VALUE AT 10/31/22 | BALANCE OF SHARES HELD AT 10/31/22 | DISTRIBUTIONS RECEIVED(a) |
| AFFILIATED INVESTMENT COMPANIES 4.0% OF NET ASSETS | ||||||||
| United States 4.0% | ||||||||
| Schwab Emerging Markets Equity ETF | $— | $59,607,100 | ($4,916,387) | ($1,135,113) | ($14,441,597) | $39,114,003 | 1,804,984 | $151,176 |
| (a) | Distributions received include distributions from net investment income and capital gains, if any, from the affiliated underlying fund. |
| DESCRIPTION | QUOTED PRICES IN ACTIVE MARKETS FOR IDENTICAL ASSETS (LEVEL 1) | OTHER SIGNIFICANT OBSERVABLE INPUTS (LEVEL 2) | SIGNIFICANT UNOBSERVABLE INPUTS (LEVEL 3) | TOTAL |
| Assets | ||||
| Common Stocks1 | $— | $393,576,748 | $— | $393,576,748 |
| Argentina | 7,898,191 | — | — | 7,898,191 |
| Australia | 182,082 | 57,954,560 | — | 58,136,642 |
| Brazil | 14,185,796 | — | — | 14,185,796 |
| Canada | 70,480,925 | — | — | 70,480,925 |
| China | 2,315,502 | 12,457,202 | — | 14,772,704 |
| India | 5,999,862 | 15,667,950 | — | 21,667,812 |
| Ireland | 4,065,957 | 2,322,637 | — | 6,388,594 |
| Israel | 7,254,854 | 3,783,690 | — | 11,038,544 |
| Italy | 1,253,085 | 17,701,284 | — | 18,954,369 |
| Mexico | 6,797,866 | — | — | 6,797,866 |
| Netherlands | 7,017,839 | 45,645,755 | — | 52,663,594 |
| Poland | — | 410,728 | 40,167 | 450,895 |
| South Africa | 2,695,811 | — | — | 2,695,811 |
| Sweden | 1,901,927 | 41,251,662 | — | 43,153,589 |
| Switzerland | 39,408 | 56,564,809 | — | 56,604,217 |
| Thailand | 2,030,589 | 1,330,330 | — | 3,360,919 |
| United Kingdom | 16,085,124 | 96,233,666 | — | 112,318,790 |
| United States | 10,481,092 | — | — | 10,481,092 |
| Preferred Stocks1 | — | 4,595,110 | — | 4,595,110 |
| Affiliated Investment Companies1 | 39,114,003 | — | — | 39,114,003 |
| Short-Term Investments1 | 28,994,689 | — | — | 28,994,689 |
| Futures Contracts2 | 767,044 | — | — | 767,044 |
| Total | $229,561,646 | $749,496,131 | $40,167 | $979,097,944 |
| 1 | As categorized in the Portfolio Holdings. |
| 2 | Futures contracts are reported at cumulative unrealized appreciation or depreciation. |
| Assets | ||
| Investments in securities, at value - affiliated (cost $53,555,600) | $39,114,003 | |
| Investments in securities, at value - unaffiliated (cost $1,073,009,269) including securities on loan of $374,495 | 939,216,897 | |
| Cash | 57,437 | |
| Foreign currency, at value (cost $630,110) | 627,102 | |
| Deposit with broker for futures contracts | 4,561,920 | |
| Receivables: | ||
| Investments sold | 3,293,191 | |
| Foreign tax reclaims | 1,668,804 | |
| Dividends | 1,328,197 | |
| Fund shares sold | 695,818 | |
| Income from securities on loan | 322 | |
| Prepaid expenses | + | 16,048 |
| Total assets | 990,579,739 | |
| Liabilities | ||
| Collateral held for securities on loan | 400,270 | |
| Payables: | ||
| Investments bought | 3,983,068 | |
| Fund shares redeemed | 2,600,261 | |
| Foreign capital gains tax | 580,339 | |
| Investment adviser and administrator fees | 483,377 | |
| Variation margin on futures contracts | 219,486 | |
| Shareholder service fees | 125,399 | |
| Independent trustees’ fees | 47 | |
| Accrued expenses | + | 535,598 |
| Total liabilities | 8,927,845 | |
| Net assets | $981,651,894 | |
| Net Assets by Source | ||
| Capital received from investors | $1,122,327,758 | |
| Total distributable loss | + | (140,675,864) |
| Net assets | $981,651,894 | |
| Net Asset Value (NAV) | ||||
| Net Assets | ÷ | Shares Outstanding | = | NAV |
| $981,651,894 | 58,073,255 | $16.90 | ||
| For the period November 1, 2021 through October 31, 2022 | ||
| Investment Income | ||
| Dividends received from securities - unaffiliated (net of foreign withholding tax of $2,600,188) | $26,797,763 | |
| Interest received from securities - unaffiliated | 338,885 | |
| Dividends received from securities - affiliated | 151,176 | |
| Securities on loan, net | + | 8,058 |
| Total investment income | 27,295,882 | |
| Expenses | ||
| Investment adviser and administrator fees | 10,582,968 | |
| Shareholder service fees | 1,912,725 | |
| Custodian fees | 329,873 | |
| Portfolio accounting fees | 148,553 | |
| Professional fees | 67,317 1 | |
| Registration fees | 30,274 | |
| Shareholder reports | 19,302 | |
| Independent trustees’ fees | 10,225 | |
| Transfer agent fees | 5,421 | |
| Proxy fees2 | 201 | |
| Other expenses | + | 96,733 |
| Total expenses | 13,203,592 | |
| Expense reduction | – | 1,039,893 1 |
| Net expenses | – | 12,163,699 |
| Net investment income | 15,132,183 | |
| REALIZED AND UNREALIZED GAINS (LOSSES) | ||
| Net realized losses on sales of securities - affiliated | (1,135,113) | |
| Net realized gains on sales of securities - unaffiliated (net of foreign capital gains tax paid of ($75,691)) | 35,504,750 | |
| Net realized losses on futures contracts | (9,817,529) | |
| Net realized gains on forward foreign currency exchange contracts | 390,863 | |
| Net realized losses on foreign currency transactions | + | (489,399) |
| Net realized gains | 24,453,572 | |
| Net change in unrealized appreciation (depreciation) on securities - affiliated | (14,441,597) | |
| Net change in unrealized appreciation (depreciation) on securities - unaffiliated (net of change in foreign capital gains tax of ($329,109)) | (559,900,963) | |
| Net change in unrealized appreciation (depreciation) on futures contracts | 900,478 | |
| Net change in unrealized appreciation (depreciation) on forward foreign currency exchange contracts | (71,094) | |
| Net change in unrealized appreciation (depreciation) on foreign currency translations | + | (76,678) |
| Net change in unrealized appreciation (depreciation) | + | (573,589,854) |
| Net realized and unrealized losses | (549,136,282) | |
| Decrease in net assets resulting from operations | ($534,004,099) | |
| 1 | Includes professional fees of $13,635 associated with the filing of tax claims in the European Union deemed to be non-contingent and non-routine expenses of the fund (see financial notes 2(d) and 4 for additional information). |
| 2 | Proxy fees are non-routine expenses (see financial note 4 for additional information). |
| OPERATIONS | |||
| 11/1/21-10/31/22 | 11/1/20-10/31/21 | ||
| Net investment income | $15,132,183 | $666,951 | |
| Net realized gains | 24,453,572 | 214,727,710 | |
| Net change in unrealized appreciation (depreciation) | + | (573,589,854) | 187,355,101 |
| Increase (decrease) in net assets resulting from operations | ($534,004,099) | $402,749,762 | |
| DISTRIBUTIONS TO SHAREHOLDERS | |||
| Total distributions | ($214,877,749) | ($85,551,526) | |
| TRANSACTIONS IN FUND SHARES | |||||
| 11/1/21-10/31/22 | 11/1/20-10/31/21 | ||||
| SHARES | VALUE | SHARES | VALUE | ||
| Shares sold | 12,166,159 | $258,391,714 | 2,560,644 | $74,676,320 | |
| Shares reinvested | 7,035,847 | 170,408,203 | 2,533,275 | 68,955,738 | |
| Shares redeemed | + | (9,976,603) | (192,980,903) | (7,230,462) | (208,820,997) |
| Net transactions in fund shares | 9,225,403 | $235,819,014 | (2,136,543) | ($65,188,939) | |
| SHARES OUTSTANDING AND NET ASSETS | |||||
| 11/1/21-10/31/22 | 11/1/20-10/31/21 | ||||
| SHARES | NET ASSETS | SHARES | NET ASSETS | ||
| Beginning of period | 48,847,852 | $1,494,714,728 | 50,984,395 | $1,242,705,431 | |
| Total increase (decrease) | + | 9,225,403 | (513,062,834) | (2,136,543) | 252,009,297 |
| End of period | 58,073,255 | $981,651,894 | 48,847,852 | $1,494,714,728 | |
| SCHWAB CAPITAL TRUST (ORGANIZED MAY 7, 1993) | |
| Schwab International Opportunities Fund | Schwab Target 2045 Fund |
| Schwab S&P 500 Index Fund | Schwab Target 2050 Fund |
| Schwab Small-Cap Index Fund® | Schwab Target 2055 Fund |
| Schwab Total Stock Market Index Fund® | Schwab Target 2060 Fund |
| Schwab U.S. Large-Cap Growth Index Fund | Schwab Target 2065 Fund |
| Schwab U.S. Large-Cap Value Index Fund | Schwab Fundamental US Large Company Index Fund |
| Schwab U.S. Mid-Cap Index Fund | Schwab Fundamental US Small Company Index Fund |
| Schwab International Index Fund® | Schwab Fundamental International Large Company Index Fund |
| Schwab MarketTrack All Equity Portfolio™ | Schwab Fundamental International Small Company Index Fund |
| Schwab MarketTrack Growth Portfolio™ | Schwab Fundamental Emerging Markets Large Company Index Fund |
| Schwab MarketTrack Balanced Portfolio™ | Schwab Fundamental Global Real Estate Index Fund |
| Schwab MarketTrack Conservative Portfolio™ | Schwab Target 2010 Index Fund |
| Schwab Balanced Fund | Schwab Target 2015 Index Fund |
| Schwab Core Equity Fund | Schwab Target 2020 Index Fund |
| Schwab Dividend Equity Fund | Schwab Target 2025 Index Fund |
| Schwab Large-Cap Growth Fund | Schwab Target 2030 Index Fund |
| Schwab Small-Cap Equity Fund | Schwab Target 2035 Index Fund |
| Schwab Health Care Fund | Schwab Target 2040 Index Fund |
| Schwab International Core Equity Fund | Schwab Target 2045 Index Fund |
| Schwab Target 2010 Fund | Schwab Target 2050 Index Fund |
| Schwab Target 2015 Fund | Schwab Target 2055 Index Fund |
| Schwab Target 2020 Fund | Schwab Target 2060 Index Fund |
| Schwab Target 2025 Fund | Schwab Target 2065 Index Fund |
| Schwab Target 2030 Fund | Schwab Monthly Income Fund – Target Payout |
| Schwab Target 2035 Fund | Schwab Monthly Income Fund – Flexible Payout |
| Schwab Target 2040 Fund | Schwab Monthly Income Fund – Income Payout |
| 3. Risk Factors: |
| 4. Affiliates and Affiliated Transactions: |
| % OF AVERAGE DAILY NET ASSETS | |
| First $500 million | 1.29% |
| $500 million to $1 billion | 1.275% |
| Over $1 billion | 1.25% |
| Schwab Balanced Fund | 5.8% |
| Schwab Target 2010 Fund | 0.2% |
| Schwab Target 2015 Fund | 0.3% |
| Schwab Target 2020 Fund | 2.5% |
| Schwab Target 2025 Fund | 4.2% |
| Schwab Target 2030 Fund | 9.5% |
| Schwab Target 2035 Fund | 5.7% |
| Schwab Target 2040 Fund | 12.4% |
| Schwab Target 2045 Fund | 2.9% |
| Schwab Target 2050 Fund | 3.0% |
| Schwab Target 2055 Fund | 2.0% |
| Schwab Target 2060 Fund | 0.6% |
| Schwab Target 2065 Fund | 0.1% |
| Schwab Emerging Markets Equity ETF | 0.5% |
| PURCHASES OF SECURITIES | SALES OF SECURITIES |
| $991,287,110 | $956,319,513 |
| ASSET DERIVATIVES | FAIR VALUE |
| Equity Index Futures Contracts1 | $767,044 |
| Forward Foreign Currency Exchange Contracts2 | — |
| LIABILITY DERIVATIVES | FAIR VALUE |
| Equity Index Futures Contracts3 | $— |
| Forward Foreign Currency Exchange Contracts4 | — |
| 1 | Includes cumulative unrealized appreciation of futures contracts as reported in the Portfolio Holdings. Only current day’s variation margin on futures contracts is reported within the Statement of Assets and Liabilities. |
| 2 | Statement of Assets and Liabilities location: Unrealized appreciation on forward foreign currency exchange contracts. |
| 3 | Includes cumulative unrealized depreciation of futures contracts as reported in the Portfolio Holdings. Only current day’s variation margin on futures contracts is reported within the Statement of Assets and Liabilities. |
| 4 | Statement of Assets and Liabilities location: Unrealized depreciation on forward foreign currency exchange contracts. |
| Equity Index Futures Contracts | |
| Realized losses1 | ($9,817,529) |
| Net change in unrealized appreciation (depreciation)2 | 900,478 |
| Forward Foreign Currency Exchange Contracts | |
| Realized gains1 | 390,863 |
| Net change in unrealized appreciation (depreciation)2 | (71,094) |
| 1 | Statement of Operations location: Net realized losses on futures contracts and net realized gains on forward foreign currency exchange contracts. |
| 2 | Statement of Operations location: Net change in unrealized appreciation (depreciation) on futures contracts and net change in unrealized appreciation (depreciation) on forward foreign currency exchange contracts. |
| TAX COST | GROSS UNREALIZED APPRECIATION | GROSS UNREALIZED DEPRECIATION | NET UNREALIZED APPRECIATION (DEPRECIATION) |
| $1,154,118,992 | $75,759,897 | ($250,780,945) | ($175,021,048) |
| UNDISTRIBUTED ORDINARY INCOME | UNDISTRIBUTED LONG-TERM CAPITAL GAINS | NET UNREALIZED APPRECIATION (DEPRECIATION) ON INVESTMENTS | NET OTHER UNREALIZED APPRECIATION (DEPRECIATION) | TOTAL |
| $8,753,846 | $26,256,614 | ($175,021,048) | ($665,276) | ($140,675,864) |
| CURRENT FISCAL YEAR END DISTRIBUTIONS | PRIOR FISCAL YEAR END DISTRIBUTIONS | |||
| ORDINARY INCOME | LONG-TERM CAPITAL GAINS | ORDINARY INCOME | LONG-TERM CAPITAL GAINS | |
| $57,006,279 | $157,871,470 | $— | $85,551,526 | |
Denver, Colorado
December 16, 2022
| Proposal – To elect each of the following individuals as trustees of the Trust: | For | Withheld |
| Walter W. Bettinger II | 1,095,577,106.505 | 115,838,980.968 |
| Richard A. Wurster | 1,117,598,789.555 | 93,817,297.918 |
| Michael J. Beer | 1,116,890,447.505 | 94,525,639.968 |
| Robert W. Burns | 1,117,915,860.110 | 93,500,227.363 |
| Nancy F. Heller | 1,119,878,732.134 | 91,537,355.339 |
| David L. Mahoney | 1,069,125,022.434 | 142,291,065.039 |
| Jane P. Moncreiff | 1,120,187,927.838 | 91,228,159.635 |
| Kiran M. Patel | 1,116,689,111.571 | 94,726,975.902 |
| Kimberly S. Patmore | 1,119,941,056.059 | 91,475,031.414 |
| J. Derek Penn | 1,117,666,014.121 | 93,750,073.352 |
| 1. | the nature, extent and quality of the services provided to the Fund under the Agreements, including the resources of the investment adviser and its affiliates, and the Sub-Advisers, dedicated to the Fund; |
| 2. | the Fund’s investment performance and how it compared to that of certain other comparable mutual funds and benchmark data; |
| 3. | the Fund’s expenses and how those expenses compared to those of certain other similar mutual funds; |
| 4. | the profitability of the investment adviser and its affiliates, including Charles Schwab & Co., Inc. (Schwab), with respect to the Fund, including both direct and indirect benefits accruing to the investment adviser and its affiliates, as well as the profitability of the Sub-Advisers; and |
| 5. | the extent to which economies of scale would be realized as the Fund grows and whether fee levels in the Agreements reflect those economies of scale for the benefit of Fund investors. |
| Independent Trustees | |||
| Name, Year of Birth, and Position(s) with the trust (Terms of office, and length of Time Served1) | Principal Occupations During the Past Five Years | Number of Portfolios in Fund Complex Overseen by the Trustee | Other Directorships |
Michael J. Beer 1961 Trustee (Trustee of The Charles Schwab Family of Funds, Schwab Investments, Schwab Capital Trust, Schwab Annuity Portfolios, Schwab Strategic Trust and Laudus Trust since 2022) | Retired. Director, President and Chief Executive Officer (Dec. 2016 – Sept. 2019), Principal Funds (investment management). | 105 | Director (2016 – 2019), Principal Funds, Inc. |
| Robert W. Burns 1959 Trustee (Trustee of Schwab Strategic Trust since 2009; The Charles Schwab Family of Funds, Schwab Investments, Schwab Capital Trust, Schwab Annuity Portfolios and Laudus Trust since 2016) | Retired/Private Investor. | 105 | None |
| Nancy F. Heller 1956 Trustee (Trustee of The Charles Schwab Family of Funds, Schwab Investments, Schwab Capital Trust, Schwab Annuity Portfolios, Schwab Strategic Trust and Laudus Trust since 2018) | Retired. | 105 | None |
| David L. Mahoney 1954 Trustee (Trustee of The Charles Schwab Family of Funds, Schwab Investments, Schwab Capital Trust, Schwab Annuity Portfolios and Laudus Trust since 2011; Schwab Strategic Trust since 2016) | Private Investor. | 105 | Director (2004 – present), Corcept Therapeutics Incorporated Director (2009 – 2021), Adamas Pharmaceuticals, Inc. Director (2003 – 2019), Symantec Corporation |
| Jane P. Moncreiff 1961 Trustee (Trustee of The Charles Schwab Family of Funds, Schwab Investments, Schwab Capital Trust, Schwab Annuity Portfolios, Schwab Strategic Trust and Laudus Trust since 2019) | Consultant (2018 – present), Fulham Advisers LLC (management consulting); Chief Investment Officer (2009 – 2017), CareGroup Healthcare System, Inc. (healthcare). | 105 | None |
| Independent Trustees (continued) | |||
| Name, Year of Birth, and Position(s) with the trust (Terms of office, and length of Time Served1) | Principal Occupations During the Past Five Years | Number of Portfolios in Fund Complex Overseen by the Trustee | Other Directorships |
| Kiran M. Patel 1948 Trustee (Trustee of The Charles Schwab Family of Funds, Schwab Investments, Schwab Capital Trust, Schwab Annuity Portfolios and Laudus Trust since 2011; Schwab Strategic Trust since 2016) | Retired. | 105 | Director (2008 – present), KLA-Tencor Corporation |
| Kimberly S. Patmore 1956 Trustee (Trustee of The Charles Schwab Family of Funds, Schwab Investments, Schwab Capital Trust, Schwab Annuity Portfolios, Schwab Strategic Trust and Laudus Trust since 2016) | Consultant (2008 – present), Patmore Management Consulting (management consulting). | 105 | None |
J. Derek Penn 1957 Trustee (Trustee of The Charles Schwab Family of Funds, Schwab Investments, Schwab Capital Trust, Schwab Annuity Portfolios, Schwab Strategic Trust and Laudus Trust since 2021) | Head of Equity Sales and Trading (2006 – 2018), BNY Mellon (financial services). | 105 | None |
| Interested Trustees | |||
| Name, Year of Birth, and Position(s) with the trust (Terms of office, and length of Time Served1) | Principal Occupations During the Past Five Years | Number of Portfolios in Fund Complex Overseen by the Trustee | Other Directorships |
| Walter W. Bettinger II2 1960 Chairman and Trustee (Trustee of The Charles Schwab Family of Funds, Schwab Investments, Schwab Capital Trust and Schwab Annuity Portfolios since 2008; Schwab Strategic Trust since 2009; Laudus Trust since 2010) | Co-Chairman of the Board (July 2022 – present), Director and Chief Executive Officer (Oct. 2008 – present) and President (Feb. 2007 – Oct. 2021), The Charles Schwab Corporation; President and Chief Executive Officer (Oct. 2008 – Oct. 2021) and Director (May 2008 – Oct. 2021), Charles Schwab & Co., Inc.; Director (Apr. 2006 – present), Charles Schwab Bank, SSB; Director (Nov. 2017 – present), Charles Schwab Premier Bank, SSB; Director (July 2019 – present), Charles Schwab Trust Bank; Director (May 2008 – present), Chief Executive Officer (Aug. 2017 – present) and President (Aug. 2017 – Nov. 2021), Schwab Holdings, Inc.; Director (Oct. 2020 – present), TD Ameritrade Holding Corporation; Director (July 2016 – Oct. 2021), Charles Schwab Investment Management, Inc. | 105 | Director (2008 – present), The Charles Schwab Corporation |
| Interested Trustees (continued) | |||
| Name, Year of Birth, and Position(s) with the trust (Terms of office, and length of Time Served1) | Principal Occupations During the Past Five Years | Number of Portfolios in Fund Complex Overseen by the Trustee | Other Directorships |
| Richard A. Wurster2 1973 Trustee (Trustee of The Charles Schwab Family of Funds, Schwab Investments, Schwab Capital Trust, Schwab Annuity Portfolios, Schwab Strategic Trust and Laudus Trust since 2022) | President (Oct. 2021 – present) and Executive Vice President – Schwab Asset Management Solutions (Apr. 2019 – Oct. 2021), The Charles Schwab Corporation; President, Director (Oct. 2021 – present), Executive Vice President – Schwab Asset Management Solutions (July 2019 – Oct. 2021) and Senior Vice President – Advisory (May 2016 – July 2019), Charles Schwab & Co., Inc.; President (Nov. 2021 – present), Schwab Holdings, Inc.; Director (Oct. 2021 – present) and Chief Executive Officer (Nov. 2019 – Jan. 2022), Charles Schwab Investment Management, Inc.; Director, Chief Executive Officer and President (Mar. 2018 – Oct. 2022), Charles Schwab Investment Advisory, Inc.; Chief Executive Officer (July 2016 – Apr. 2018) and President (Mar. 2017 – Apr. 2018), ThomasPartners, Inc.; Chief Executive Officer (July 2016 – Apr. 2018), Windhaven Investment Management, Inc. | 105 | None |
| Officers of the Trust | |
| Name, Year of Birth, and Position(s) with the trust (Terms of office, and length of Time Served3) | Principal Occupations During the Past Five Years |
| Jonathan de St. Paer 1973 President and Chief Executive Officer (Officer of The Charles Schwab Family of Funds, Schwab Investments, Schwab Capital Trust, Schwab Annuity Portfolios, Schwab Strategic Trust and Laudus Trust since 2018) | Director (Apr. 2019 – present), President (Oct. 2018 – present), Chief Operating Officer (Jan. 2021 – present), and Chief Executive Officer (Apr. 2019 – Nov. 2019), Charles Schwab Investment Management, Inc.; Senior Vice President (June 2020 – Mar. 2022) and Chief Operating Officer (Jan. 2021 – Mar. 2022), Charles Schwab Investment Advisory, Inc.; Chief Executive Officer (Apr. 2019 – present), President (Nov. 2018 – present) and Trustee (Apr. 2019 – Dec. 2020), Schwab Funds, Laudus Trust and Schwab ETFs; Managing Director (May 2022 – present), Senior Vice President (Apr. 2019 – May 2022) and Senior Vice President – Strategy and Product Development (CSIM) (Jan. 2014 – Mar. 2019), Charles Schwab & Co., Inc. |
| Mark Fischer 1970 Treasurer, Chief Financial Officer and Chief Operating Officer (Officer of The Charles Schwab Family of Funds, Schwab Investments, Schwab Capital Trust, Schwab Annuity Portfolios, Schwab Strategic Trust and Laudus Trust since 2013) | Treasurer and Chief Financial Officer (Jan. 2016 – present) and Chief Operating Officer (Dec. 2020 – present), Schwab Funds, Laudus Trust and Schwab ETFs; Chief Financial Officer (Mar. 2020 – present) and Vice President (Oct. 2013 – present), Charles Schwab Investment Management, Inc. |
| Omar Aguilar 1970 Vice President and Chief Investment Officer (Officer of The Charles Schwab Family of Funds, Schwab Investments, Schwab Capital Trust, Schwab Annuity Portfolios, Schwab Strategic Trust and Laudus Trust since 2011) | Chief Executive Officer (Jan. 2022 – present), Chief Investment Officer (Apr. 2011 – present) and Senior Vice President (Apr. 2011 – Dec. 2021), Charles Schwab Investment Management, Inc.; Director, Chief Executive Officer and President (Oct. 2022 – present), Charles Schwab Investment Advisory, Inc.; Vice President and Chief Investment Officer (June 2011 – present), Schwab Funds, Laudus Trust and Schwab ETFs. |
| Brett Wander 1961 Vice President and Chief Investment Officer (Officer of The Charles Schwab Family of Funds, Schwab Investments, Schwab Capital Trust, Schwab Annuity Portfolios, Schwab Strategic Trust and Laudus Trust since 2011) | Senior Vice President and Chief Investment Officer (Apr. 2011 – present), Charles Schwab Investment Management, Inc.; Vice President and Chief Investment Officer (June 2011 – present), Schwab Funds, Laudus Trust and Schwab ETFs. |
| William P. McMahon, Jr. 1972 Vice President and Chief Investment Officer (Officer of The Charles Schwab Family of Funds, Schwab Investments, Schwab Capital Trust, Schwab Annuity Portfolios, Schwab Strategic Trust and Laudus Trust since 2021) | Senior Vice President and Chief Investment Officer (Jan. 2020 – present), Charles Schwab Investment Management, Inc.; Vice President and Chief Investment Officer (June 2021 – present), Schwab Funds, Laudus Trust and Schwab ETFs; Senior Vice President and Chief Investment Officer – ThomasPartners Strategies (Apr. 2018 – Dec. 2019), Charles Schwab Investment Advisory, Inc.; Senior Vice President and Chief Investment Officer (May 2001 – Apr. 2018), ThomasPartners, Inc. |
| Officers of the Trust (continued) | |
| Name, Year of Birth, and Position(s) with the trust (Terms of office, and length of Time Served3) | Principal Occupations During the Past Five Years |
| Catherine MacGregor 1964 Chief Legal Officer and Secretary, Schwab Funds and Schwab ETFs Chief Legal Officer, Vice President and Clerk, Laudus Trust (Officer of The Charles Schwab Family of Funds, Schwab Investments, Schwab Capital Trust, Schwab Annuity Portfolios and Laudus Trust since 2005; Schwab Strategic Trust since 2009) | Chief Legal Officer (Mar. 2022 – present) and Vice President (Sept. 2005 – present), Charles Schwab Investment Management, Inc.; Managing Director (May 2022 – present) and Vice President (July 2005 – May 2022), Charles Schwab & Co., Inc.; Vice President (Dec. 2005 – present) and Chief Legal Officer and Clerk (Mar. 2007 – present), Laudus Trust; Chief Legal Officer and Secretary (Oct. 2021 – present), Vice President (Nov. 2005 – Oct. 2021) and Assistant Secretary (June 2007 – Oct. 2021), Schwab Funds; Chief Legal Officer and Secretary (Oct. 2021 – present), Vice President and Assistant Secretary (Oct. 2009 – Oct. 2021), Schwab ETFs. |
| 1 | Each Trustee shall hold office until the election and qualification of his or her successor, or until he or she dies, resigns or is removed. The retirement policy requires that each independent trustee retire by December 31 of the year in which the Trustee turns 74 or the Trustee’s twentieth year of service as an independent trustee on any trust in the Fund Complex, whichever occurs first. |
| 2 | Mr. Bettinger and Mr. Wurster are Interested Trustees. Mr. Bettinger and Mr. Wurster are Interested Trustees because each owns stock of The Charles Schwab Corporation (CSC), the parent company of Charles Schwab Investment Management, Inc., the investment adviser for the trusts in the Fund Complex, and is an employee of Charles Schwab & Co., Inc. (Schwab), the principal underwriter for The Charles Schwab Family of Funds, Schwab Investments, Schwab Capital Trust, Schwab Annuity Portfolios and Laudus Trust. |
| 3 | The President, Treasurer and Secretary/Clerk hold office until their respective successors are chosen and qualified or until he or she sooner dies, resigns, is removed or becomes disqualified. Each of the other officers serves at the pleasure of the Board. |
Schwab Funds
Member SIPC®
Printed on recycled paper.
| ¹ | State, local, and the Federal Alternative Minimum Tax may apply. Capital gains are not exempt from Federal Taxation. |
| ² | You could lose money by investing in the Schwab Money Funds. All Schwab Money Funds with the exception of Schwab Variable Share Price Money Fund seek to preserve the value of your investment at $1.00 per share, but cannot guarantee they will do so. Because the share price of Schwab Variable Share Price Money Fund will fluctuate, when you sell your shares they may be worth more or less than what you originally paid for them. All Schwab Money Funds with the exception of Schwab Government Money Fund, Schwab Retirement Government Money Fund, Schwab U.S. Treasury Money Fund, Schwab Treasury Obligations Money Fund and Schwab Government Money Market Portfolio may impose a fee upon the sale of your shares or may temporarily suspend your ability to sell shares if the Fund’s liquidity falls below required minimums because of market conditions or other factors. An investment in the Schwab Money Funds is not insured or guaranteed by the Federal Deposit Insurance Corporation or any other government agency. The Schwab Money Funds’ sponsor has no legal obligation to provide financial support to the Funds, and you should not expect that the sponsor will provide financial support to the Funds at any time. |

| Total Return for the 12 Months Ended October 31, 2022 | |
| Schwab Core Equity Fund (Ticker Symbol: SWANX) | -13.84% |
| S&P 500® Index | -14.61% |
| Fund Category: Morningstar Large Blend1 | -14.48% |
| Performance Details | pages 8-10 |
| Schwab Dividend Equity Fund2 (Ticker Symbol: SWDSX) | -3.96% |
| Russell 1000® Value Index | -7.00% |
| Fund Category: Morningstar Large Value1 | -4.53% |
| Performance Details | pages 11-13 |
| Schwab Large-Cap Growth Fund (Ticker Symbol: SWLSX) | -22.45% |
| Russell 1000® Growth Index | -24.60% |
| Fund Category: Morningstar Large Growth1 | -28.11% |
| Performance Details | pages 14-16 |
| Schwab Small-Cap Equity Fund (Ticker Symbol: SWSCX) | -10.25% |
| Russell 2000® Index | -18.54% |
| Fund Category: Morningstar Small Blend1 | -13.55% |
| Performance Details | pages 17-19 |
| Schwab Health Care Fund2 (Ticker Symbol: SWHFX) | -3.82% |
| Dow Jones Global Health Care Index | -10.03% |
| Fund Category: Morningstar Health1 | -17.14% |
| Performance Details | pages 20-22 |
| Schwab International Core Equity Fund2 (Ticker Symbol: SICNX) | -22.40% |
| MSCI EAFE® Index (Net)3 | -23.00% |
| Fund Category: Morningstar Foreign Large Blend1 | -24.04% |
| Performance Details | pages 23-25 |
| 1 | Source for category information: Morningstar, Inc. The Morningstar Category return represents all active and index mutual funds and ETFs within the category as of the report date. |
| 2 | The fund’s performance relative to the index may be affected by fair-value pricing and timing differences in foreign exchange calculations. See financial note 2 for more information. |
| 3 | The net version of the index reflects reinvested dividends net of withholding taxes but reflects no deductions for expenses or other taxes. |

President of Schwab Asset
Management and the funds
covered in this report.

| * | The net version of the index reflects reinvested dividends net of withholding taxes but reflects no deductions for expenses or other taxes. |

| * | The net version of the index reflects reinvested dividends net of withholding taxes but reflects no deductions for expenses or other taxes. |
 | Bill McMahon, CFA, Managing Director and Chief Investment Officer of Active Equity Strategies for Schwab Asset Management, is responsible for the day-to-day co-management of the Schwab Large-Cap Growth Fund, Schwab Core Equity Fund, and Schwab Dividend Equity Fund. Mr. McMahon has more than 20 years of experience in the financial services industry. Prior to his current role, Mr. McMahon was an SVP in Charles Schwab Investment Advisory, Inc. (CSIA), serving as CIO and as a member of the portfolio management team for the ThomasPartners Strategies. Mr. McMahon co-founded ThomasPartners, Inc. in 2001 and served as partner of the firm until its acquisition by the Charles Schwab Corporation in 2012 and subsequent merger with CSIA in 2018. Mr. McMahon began his career at State Street Corporation, with the latter half of his tenure with State Street Global Advisors. |
 | Iain Clayton, CFA, FRM, Senior Portfolio Manager and Head of Quantitative Portfolio Management for Schwab Asset Management, is responsible for the day-to-day co-management of the Schwab Core Equity Fund, Schwab International Core Equity Fund, Schwab Small-Cap Equity Fund, and Schwab Health Care Fund. Prior to joining Schwab in 2013, Mr. Clayton spent more than five years at SSI Investment Management where he was a portfolio manager and the director of quantitative research. In these roles, Mr. Clayton co-managed multiple investment strategies and developed quantitative models and valuation approaches. From 2004 to 2008, he worked as a portfolio manager and director at RCM Capital Management (now known as Allianz Global Investors) and helped manage various equity portfolios and developed fundamental-based stock selection models. Prior to that, he was a vice president at Eureka Investment Advisors for almost three years and also served as a senior quantitative analyst and assistant portfolio manager. He has also worked as a quantitative research analyst at RCM Capital Management. |
 | Brian Hillburn, CFA, Senior Portfolio Manager and the Director of Fundamental Research for Schwab Asset Management, is responsible for the day-to-day co-management of the Schwab Core Equity Fund. Mr. Hillburn also provides fundamental equity research coverage for the ThomasPartners Strategies and the Schwab Active Equity Funds. Previously, Mr. Hillburn was a senior equity research analyst for the ThomasPartners Strategies at Schwab Asset Management. Prior to joining the ThomasPartners Strategies, Mr. Hillburn was an equity analyst at Rockland Trust, and earlier positions include equity research analysis roles on mutual fund teams at Wells Capital and Morgan Stanley Investment Management. |
 | Wei Li, Ph.D., CFA, Senior Portfolio Manager, is responsible for the day-to-day co-management of the Schwab International Core Equity Fund, Schwab Dividend Equity Fund, Schwab Small-Cap Equity Fund, and Schwab Health Care Fund. Prior to joining Schwab in 2012, Ms. Li spent more than 10 years at Barclays Global Investors (now known as BlackRock), where she held a number of positions. From 2001 to 2009, she worked in various roles in the global advanced active group, including portfolio management and quantitative research for both U.S. and international equity markets. After 2009, she worked in the defined contribution research and product development area for almost two years. |
 | Gretchen Novak, CFA, Senior Portfolio Manager, is responsible for the day-to-day co-management of the Schwab Large-Cap Growth Fund. Ms. Novak also provides fundamental equity research coverage of certain industry sectors for the ThomasPartners Strategies and the Schwab Active Equity Funds. Previously, Ms. Novak was a director and senior equity research analyst for the ThomasPartners Strategies at Schwab Asset Management. Prior to joining the ThomasPartners Strategies, Ms. Novak was a senior portfolio manager at Mazama Capital Management, Inc., where she oversaw the equity research and portfolio management of the firm’s consumer discretionary and staples sectors. Prior to Mazama Capital, Ms. Novak was an equity analyst at Cramer Rosenthal McGlynn, LLC. |
 | Jim Serhant, CFA, Senior Portfolio Manager, is responsible for the day-to-day co-management of the Schwab Dividend Equity Fund and the ThomasPartners Balanced Strategies. Mr. Serhant also provides fundamental equity research coverage of certain industry sectors for the ThomasPartners Strategies and the Schwab Active Equity Funds. Prior to joining Schwab in 2016, Mr. Serhant was an executive vice president at Hartford Investment Management where he was the head of high yield and a senior portfolio manager, overseeing the credit research and portfolio management of the firm’s high yield strategies. Previously, he was a fixed income analyst at Delaware Investments and JP Morgan. |
 | Holly Emerson, CFA, Portfolio Manager, is responsible for the day-to-day co-management of the Schwab Large-Cap Growth Fund and Schwab Small-Cap Equity Fund. Prior to joining Schwab in 2014, Ms. Emerson spent nearly 10 years at Algert Coldiron Investors LLC (now known as Algert Global), a quantitative market-neutral hedge fund manager. She held a number of positions at Algert, including assistant portfolio manager and director of operations. In her various roles, she acted as the lead portfolio manager for the Canadian fund, conducted macroeconomic research, and managed relationships with prime brokerage investment banks. |
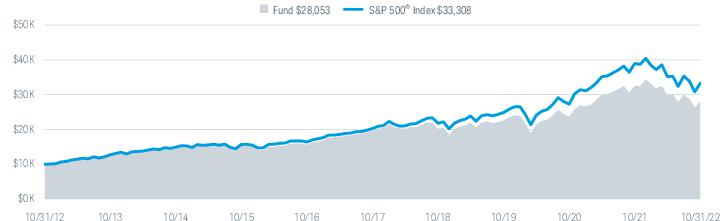
| Fund and Inception Date | 1 Year | 5 Years | 10 Years |
| Fund: Schwab Core Equity Fund (7/1/96) | -13.84% | 7.38% | 10.87% |
| S&P 500® Index | -14.61% | 10.44% | 12.79% |
| Fund Category: Morningstar Large Blend2 | -14.48% | 9.03% | 11.44% |
| Fund Expense Ratio3: 0.73% | |||
| 1 | Fund expenses may have been partially absorbed by the investment adviser and its affiliates. Without these reductions, the fund’s returns would have been lower. These returns do not reflect the deduction of taxes that a shareholder would pay on fund distributions or the redemption of fund shares. |
| 2 | Source for category information: Morningstar, Inc. The Morningstar Category return represents all active and index mutual funds and ETFs within the category as of the report date. |
| 3 | As stated in the prospectus. Reflects the total annual fund operating expenses without contractual fee waivers. For actual expense ratios during the period, refer to the financial highlights section of the financial statements. |
| Number of Holdings | 56 |
| Weighted Average Market Cap (millions) | $563,952 |
| Price/Earnings Ratio (P/E) | 18.8 |
| Price/Book Ratio (P/B) | 3.8 |
| Portfolio Turnover Rate | 28% |
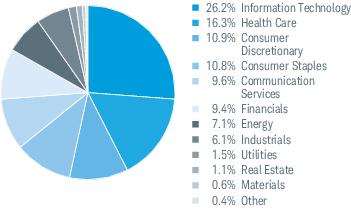
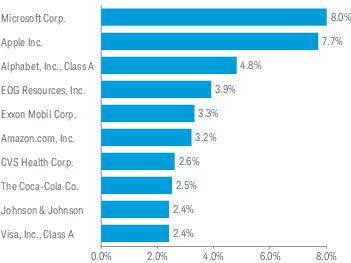
| 1 | The percentage may differ from the Portfolio Holdings because the above calculation is based on a percentage of total investments, whereas the calculation in the Portfolio Holdings is based on a percentage of net assets. |
| 2 | This list is not a recommendation of any security by the investment adviser. |
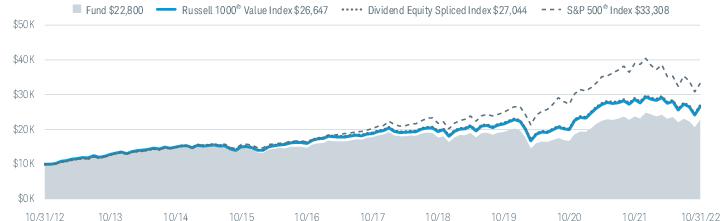
| Fund and Inception Date | 1 Year | 5 Years | 10 Years |
| Fund: Schwab Dividend Equity Fund (9/2/03) | -3.96% | 5.09% | 8.59% |
| Russell 1000® Value Index | -7.00% | 7.21% | 10.30% |
| Dividend Equity Spliced Index | -7.00% | 7.21% | 10.46% |
| S&P 500® Index | -14.61% | 10.44% | 12.79% |
| Fund Category: Morningstar Large Value3 | -4.53% | 7.67% | 10.21% |
| Fund Expense Ratios4: Net 0.89%; Gross 0.90% | |||
| 30-Day SEC Yield | 2.15% |
| 1 | Fund expenses may have been partially absorbed by the investment adviser and its affiliates. Without these reductions, the fund’s returns would have been lower. These returns do not reflect the deduction of taxes that a shareholder would pay on fund distributions or the redemption of fund shares. |
| 2 | The fund’s performance relative to the index may be affected by fair-value pricing. See financial note 2 for more information. |
| 3 | Source for category information: Morningstar, Inc. The Morningstar Category return represents all active and index mutual funds and ETFs within the category as of the report date. |
| 4 | As stated in the prospectus. Net Expense: Expenses reduced by a contractual fee waiver in effect for so long as Schwab Asset Management serves as the investment adviser to the fund. Gross Expense: Does not reflect the effect of contractual fee waivers. For actual expense ratios during the period, refer to the financial highlights section of the financial statements. |
| Number of Holdings | 54 |
| Weighted Average Market Cap (millions) | $266,208 |
| Price/Earnings Ratio (P/E) | 16.7 |
| Price/Book Ratio (P/B) | 3.2 |
| Portfolio Turnover Rate | 27% |
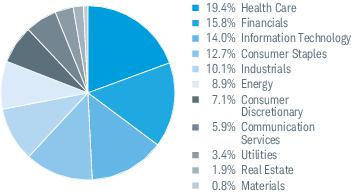
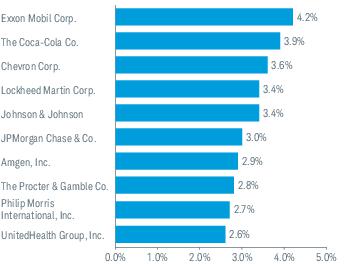
| 1 | The percentage may differ from the Portfolio Holdings because the above calculation is based on a percentage of total investments, whereas the calculation in the Portfolio Holdings is based on a percentage of net assets. |
| 2 | This list is not a recommendation of any security by the investment adviser. |
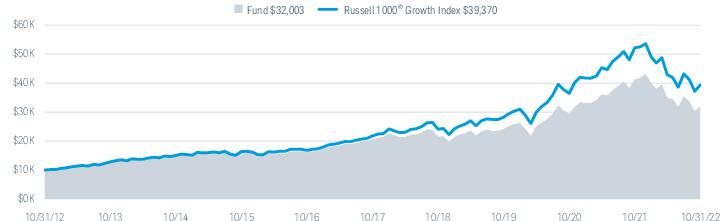
| Fund and Inception Date | 1 Year | 5 Years | 10 Years |
| Fund: Schwab Large-Cap Growth Fund (10/3/05) | -22.45% | 9.18% | 12.34% |
| Russell 1000® Growth Index | -24.60% | 12.59% | 14.69% |
| Fund Category: Morningstar Large Growth2 | -28.11% | 9.51% | 12.37% |
| Fund Expense Ratios3: Net 0.99%; Gross 1.02% | |||
| 1 | Fund expenses may have been partially absorbed by the investment adviser and its affiliates. Without these reductions, the fund’s returns would have been lower. These returns do not reflect the deduction of taxes that a shareholder would pay on fund distributions or the redemption of fund shares. |
| 2 | Source for category information: Morningstar, Inc. The Morningstar Category return represents all active and index mutual funds and ETFs within the category as of the report date. |
| 3 | As stated in the prospectus. Net Expense: Expenses reduced by a contractual fee waiver in effect for so long as Schwab Asset Management serves as the investment adviser to the fund. Gross Expense: Does not reflect the effect of contractual fee waivers. For actual expense ratios during the period, refer to the financial highlights section of the financial statements. |
| Number of Holdings | 58 |
| Weighted Average Market Cap (millions) | $794,215 |
| Price/Earnings Ratio (P/E) | 26.3 |
| Price/Book Ratio (P/B) | 8.3 |
| Portfolio Turnover Rate | 19% |
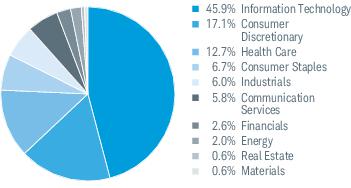
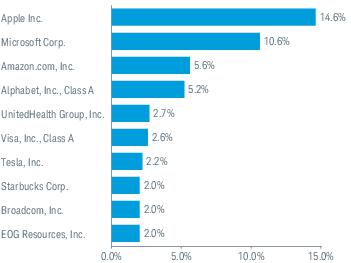
| 1 | Excludes derivatives. |
| 2 | The percentage may differ from the Portfolio Holdings because the above calculation is based on a percentage of total investments, excluding derivatives, whereas the calculation in the Portfolio Holdings is based on a percentage of net assets. |
| 3 | This list is not a recommendation of any security by the investment adviser. |
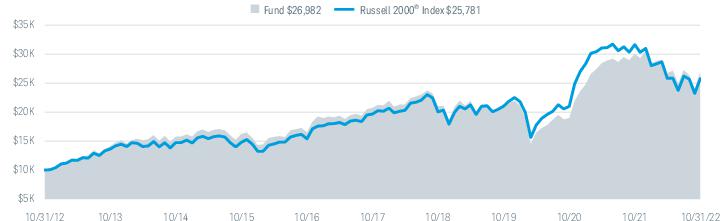
| Fund and Inception Date | 1 Year | 5 Years | 10 Years |
| Fund: Schwab Small-Cap Equity Fund (7/1/03) | -10.25% | 5.41% | 10.44% |
| Russell 2000® Index | -18.54% | 5.56% | 9.93% |
| Fund Category: Morningstar Small Blend2 | -13.55% | 5.76% | 9.75% |
| Fund Expense Ratio3: 1.08% | |||
| 1 | Fund expenses may have been partially absorbed by the investment adviser and its affiliates. Without these reductions, the fund’s returns would have been lower. These returns do not reflect the deduction of taxes that a shareholder would pay on fund distributions or the redemption of fund shares. |
| 2 | Source for category information: Morningstar, Inc. The Morningstar Category return represents all active and index mutual funds and ETFs within the category as of the report date. |
| 3 | As stated in the prospectus. Reflects the total annual fund operating expenses without contractual fee waivers. For actual expense ratios during the period, refer to the financial highlights section of the financial statements. |
| Number of Holdings | 328 |
| Weighted Average Market Cap (millions) | $3,143 |
| Price/Earnings Ratio (P/E) | 9.9 |
| Price/Book Ratio (P/B) | 2.0 |
| Portfolio Turnover Rate | 74% |
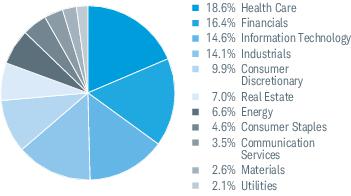

| 1 | The percentage may differ from the Portfolio Holdings because the above calculation is based on a percentage of total investments, whereas the calculation in the Portfolio Holdings is based on a percentage of net assets. |
| 2 | This list is not a recommendation of any security by the investment adviser. |
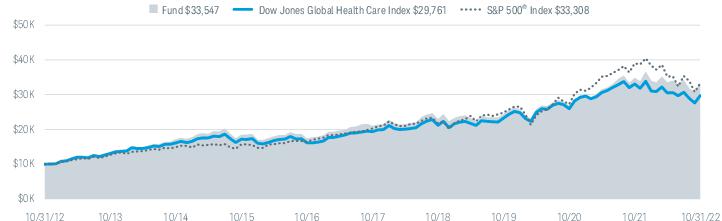
| Fund and Inception Date | 1 Year | 5 Years | 10 Years |
| Fund: Schwab Health Care Fund (7/3/00) | -3.82% | 9.75% | 12.87% |
| Dow Jones Global Health Care Index | -10.03% | 8.96% | 11.52% |
| S&P 500® Index | -14.61% | 10.44% | 12.79% |
| Fund Category: Morningstar Health3 | -17.14% | 7.81% | 12.76% |
| Fund Expense Ratio4: 0.80% | |||
| 1 | Fund expenses may have been partially absorbed by the investment adviser and its affiliates. Without these reductions, the fund’s returns would have been lower. These returns do not reflect the deduction of taxes that a shareholder would pay on fund distributions or the redemption of fund shares. |
| 2 | The fund’s performance relative to the index may be affected by fair-value pricing. See financial note 2 for more information. |
| 3 | Source for category information: Morningstar, Inc. The Morningstar Category return represents all active and index mutual funds and ETFs within the category as of the report date. |
| 4 | As stated in the prospectus. Reflects the total annual fund operating expenses without contractual fee waivers. For actual expense ratios during the period, refer to the financial highlights section of the financial statements. |
| Number of Holdings | 81 |
| Weighted Average Market Cap (millions) | $170,955 |
| Price/Earnings Ratio (P/E) | 19.6 |
| Price/Book Ratio (P/B) | 4.3 |
| Portfolio Turnover Rate | 59% |
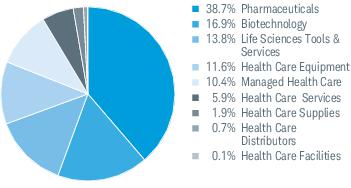
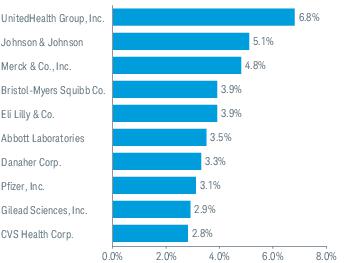
| 1 | This list is not a recommendation of any security by the investment adviser. |
| 1 | The total return cited for the index reflects reinvested dividends net of withholding taxes but reflects no deductions for expenses or other taxes. |
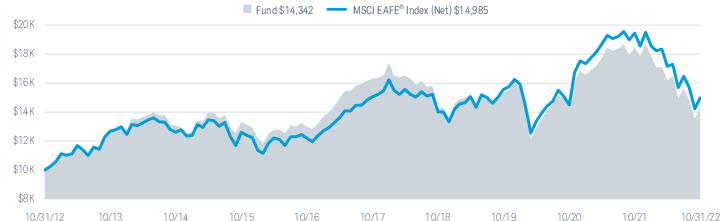
| Fund and Inception Date | 1 Year | 5 Years | 10 Years |
| Fund: Schwab International Core Equity Fund (5/30/08) | -22.40% | -2.55% | 3.67% |
| MSCI EAFE® Index (Net)3 | -23.00% | -0.09% | 4.13% |
| Fund Category: Morningstar Foreign Large Blend4 | -24.04% | -0.51% | 3.75% |
| Fund Expense Ratio5: 0.86% | |||
| 1 | Fund expenses may have been partially absorbed by the investment adviser and its affiliates. Without these reductions, the fund’s returns would have been lower. These returns do not reflect the deduction of taxes that a shareholder would pay on fund distributions or the redemption of fund shares. |
| 2 | The fund’s performance relative to the index may be affected by fair-value pricing. See financial note 2 for more information. |
| 3 | The net version of the index reflects reinvested dividends net of withholding taxes but reflects no deductions for expenses or other taxes. |
| 4 | Source for category information: Morningstar, Inc. The Morningstar Category return represents all active and index mutual funds and ETFs within the category as of the report date. |
| 5 | As stated in the prospectus. Reflects the total annual fund operating expenses without contractual fee waivers. For actual expense ratios during the period, refer to the financial highlights section of the financial statements. |
| Number of Holdings | 143 |
| Weighted Average Market Cap (millions) | $82,736 |
| Price/Earnings Ratio (P/E) | 9.6 |
| Price/Book Ratio (P/B) | 1.5 |
| Portfolio Turnover Rate | 94% |
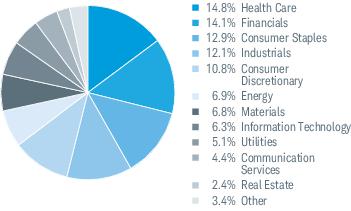
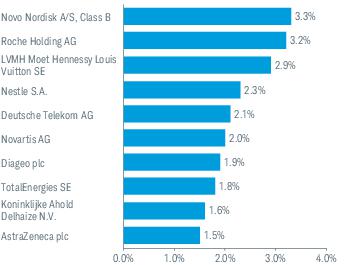
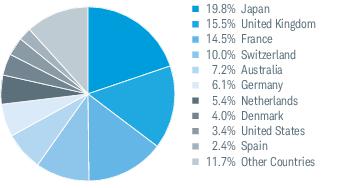
| 1 | This list is not a recommendation of any security by the investment adviser. |
| 2 | The percentage may differ from the Portfolio Holdings because the above calculation is based on a percentage of total investments, whereas the calculation in the Portfolio Holdings is based on a percentage of net assets. |
| EXPENSE RATIO (ANNUALIZED) 1 | BEGINNING ACCOUNT VALUE AT 5/1/22 | ENDING ACCOUNT VALUE (NET OF EXPENSES) AT 10/31/22 | EXPENSES PAID DURING PERIOD 5/1/22-10/31/22 2 | |
| Schwab Core Equity Fund | ||||
| Actual Return | 0.73% | $1,000.00 | $ 938.30 | $3.57 |
| Hypothetical 5% Return | 0.73% | $1,000.00 | $1,021.53 | $3.72 |
| Schwab Dividend Equity Fund | ||||
| Actual Return | 0.89% | $1,000.00 | $ 990.20 | $4.46 |
| Hypothetical 5% Return | 0.89% | $1,000.00 | $1,020.72 | $4.53 |
| Schwab Large-Cap Growth Fund | ||||
| Actual Return | 0.99% | $1,000.00 | $ 915.10 | $4.78 |
| Hypothetical 5% Return | 0.99% | $1,000.00 | $1,020.21 | $5.04 |
| Schwab Small-Cap Equity Fund | ||||
| Actual Return | 1.09% | $1,000.00 | $1,009.10 | $5.52 |
| Hypothetical 5% Return | 1.09% | $1,000.00 | $1,019.71 | $5.55 |
| Schwab Health Care Fund | ||||
| Actual Return | 0.80% | $1,000.00 | $1,000.00 | $4.03 |
| Hypothetical 5% Return | 0.80% | $1,000.00 | $1,021.17 | $4.08 |
| Schwab International Core Equity Fund | ||||
| Actual Return | 0.86% | $1,000.00 | $ 886.10 | $4.09 |
| Hypothetical 5% Return | 0.86% | $1,000.00 | $1,020.87 | $4.38 |
| 1 | Based on the most recent six-month expense ratio. |
| 2 | Expenses for each fund are equal to its annualized expense ratio, multiplied by the average account value over the period, multiplied by the 184 days of the period, and divided by the 365 days of the fiscal year. |
| 11/1/21– 10/31/22 | 11/1/20– 10/31/21 | 11/1/19– 10/31/20 | 11/1/18– 10/31/19 | 11/1/17– 10/31/18 | ||
| Per-Share Data | ||||||
| Net asset value at beginning of period | $29.22 | $22.24 | $21.87 | $22.40 | $24.36 | |
| Income (loss) from investment operations: | ||||||
| Net investment income (loss)1 | 0.26 | 0.21 | 0.20 | 0.21 | 0.26 | |
| Net realized and unrealized gains (losses) | (3.16) | 7.90 | 0.82 | 1.99 | 0.41 | |
| Total from investment operations | (2.90) | 8.11 | 1.02 | 2.20 | 0.67 | |
| Less distributions: | ||||||
| Distributions from net investment income | (0.26) | (0.20) | (0.20) | (0.27) | (0.34) | |
| Distributions from net realized gains | (6.60) | (0.93) | (0.45) | (2.46) | (2.29) | |
| Total distributions | (6.86) | (1.13) | (0.65) | (2.73) | (2.63) | |
| Net asset value at end of period | $19.46 | $29.22 | $22.24 | $21.87 | $22.40 | |
| Total return | (13.84%) | 37.62% | 4.65% | 12.02% | 2.71% | |
| Ratios/Supplemental Data | ||||||
| Ratios to average net assets: | ||||||
| Net operating expenses | 0.73% 2 | 0.73% | 0.73% | 0.73% | 0.73% | |
| Gross operating expenses | 0.73% 2 | 0.73% | 0.73% | 0.73% | 0.73% | |
| Net investment income (loss) | 1.18% | 0.81% | 0.91% | 1.01% | 1.12% | |
| Portfolio turnover rate | 28% | 86% | 97% | 98% | 101% | |
| Net assets, end of period (x 1,000,000) | $1,268 | $1,860 | $1,957 | $2,182 | $2,138 | |
| 1 | Calculated based on the average shares outstanding during the period. |
| 2 | Ratio includes less than 0.005% of non-routine proxy expenses. |
| SECURITY | NUMBER OF SHARES | VALUE ($) |
| COMMON STOCKS 99.7% OF NET ASSETS | ||
| Banks 4.9% | ||
| Bank of America Corp. | 600,340 | 21,636,253 |
| East West Bancorp, Inc. | 311,867 | 22,320,321 |
| Truist Financial Corp. | 419,687 | 18,797,781 |
| 62,754,355 | ||
| Capital Goods 4.9% | ||
| A.O. Smith Corp. | 259,182 | 14,197,990 |
| General Dynamics Corp. | 45,415 | 11,344,667 |
| Parker-Hannifin Corp. | 100,411 | 29,181,445 |
| Watsco, Inc. | 25,796 | 6,989,684 |
| 61,713,786 | ||
| Consumer Durables & Apparel 2.0% | ||
| Deckers Outdoor Corp. * | 18,493 | 6,471,255 |
| PulteGroup, Inc. | 290,887 | 11,632,571 |
| VF Corp. | 253,575 | 7,163,494 |
| 25,267,320 | ||
| Consumer Services 2.0% | ||
| Starbucks Corp. | 295,544 | 25,591,155 |
| Diversified Financials 4.4% | ||
| Berkshire Hathaway, Inc., Class B * | 91,198 | 26,911,618 |
| CME Group, Inc. | 113,889 | 19,736,964 |
| Moody's Corp. | 35,012 | 9,273,628 |
| 55,922,210 | ||
| Energy 7.2% | ||
| EOG Resources, Inc. | 357,784 | 48,844,672 |
| Exxon Mobil Corp. | 377,413 | 41,821,134 |
| 90,665,806 | ||
| Food & Staples Retailing 3.2% | ||
| Costco Wholesale Corp. | 26,388 | 13,233,582 |
| Walmart, Inc. | 188,952 | 26,893,538 |
| 40,127,120 | ||
| Food, Beverage & Tobacco 4.7% | ||
| Constellation Brands, Inc., Class A | 77,750 | 19,210,470 |
| Diageo plc, ADR | 54,716 | 9,135,931 |
| The Coca-Cola Co. | 518,913 | 31,056,943 |
| 59,403,344 | ||
| Health Care Equipment & Services 6.6% | ||
| Abbott Laboratories | 186,054 | 18,408,183 |
| Boston Scientific Corp. * | 421,563 | 18,173,581 |
| SECURITY | NUMBER OF SHARES | VALUE ($) |
| CVS Health Corp. | 350,654 | 33,206,934 |
| Intuitive Surgical, Inc. * | 58,916 | 14,521,026 |
| 84,309,724 | ||
| Household & Personal Products 3.0% | ||
| L'Oreal S.A., ADR | 141,090 | 8,851,986 |
| The Estee Lauder Cos., Inc., Class A | 28,288 | 5,671,461 |
| The Procter & Gamble Co. | 170,943 | 23,020,894 |
| 37,544,341 | ||
| Materials 0.5% | ||
| Linde plc | 23,368 | 6,948,475 |
| Media & Entertainment 5.9% | ||
| Alphabet, Inc., Class A * | 649,580 | 61,391,806 |
| Meta Platforms, Inc., Class A * | 144,501 | 13,461,713 |
| 74,853,519 | ||
| Pharmaceuticals, Biotechnology & Life Sciences 9.7% | ||
| Eli Lilly & Co. | 51,632 | 18,695,431 |
| Johnson & Johnson | 177,193 | 30,826,266 |
| Pfizer, Inc. | 633,044 | 29,468,198 |
| Roche Holding AG ADR | 288,704 | 11,935,024 |
| Thermo Fisher Scientific, Inc. | 32,190 | 16,544,694 |
| Zoetis, Inc. | 100,333 | 15,128,210 |
| 122,597,823 | ||
| Real Estate 1.1% | ||
| American Tower Corp. | 67,674 | 14,021,376 |
| Retailing 6.9% | ||
| Amazon.com, Inc. * | 394,176 | 40,379,389 |
| O'Reilly Automotive, Inc. * | 17,489 | 14,641,266 |
| The Home Depot, Inc. | 36,635 | 10,848,723 |
| The TJX Cos., Inc. | 308,204 | 22,221,508 |
| 88,090,886 | ||
| Semiconductors & Semiconductor Equipment 3.1% | ||
| ASML Holding N.V. NY Registry Shares | 20,750 | 9,802,715 |
| Broadcom, Inc. | 62,750 | 29,500,030 |
| 39,302,745 | ||
| Software & Services 15.4% | ||
| Accenture plc, Class A | 37,155 | 10,548,304 |
| Adobe, Inc. * | 21,000 | 6,688,500 |
| Fidelity National Information Services, Inc. | 217,118 | 18,018,623 |
| Microsoft Corp. | 434,007 | 100,746,045 |
| PayPal Holdings, Inc. * | 347,411 | 29,036,611 |
| SECURITY | NUMBER OF SHARES | VALUE ($) |
| Visa, Inc., Class A | 146,522 | 30,353,498 |
| 195,391,581 | ||
| Technology Hardware & Equipment 7.7% | ||
| Apple Inc. | 640,588 | 98,227,764 |
| Telecommunication Services 3.7% | ||
| AT&T, Inc. | 921,690 | 16,802,409 |
| Verizon Communications, Inc. | 795,451 | 29,726,004 |
| 46,528,413 | ||
| Transportation 1.3% | ||
| United Parcel Service, Inc., Class B | 95,449 | 16,013,479 |
| Utilities 1.5% | ||
| Duke Energy Corp. | 209,354 | 19,507,606 |
| Total Common Stocks (Cost $1,003,389,974) | 1,264,782,828 | |
| SECURITY | NUMBEROF SHARES | VALUE ($) |
| SHORT-TERM INVESTMENTS 0.4% OF NET ASSETS | ||
| Money Market Funds 0.4% | ||
| State Street Institutional U.S. Government Money Market Fund, Premier Class 3.01% (a) | 4,883,277 | 4,883,277 |
| Total Short-Term Investments (Cost $4,883,277) | 4,883,277 | |
| Total Investments in Securities (Cost $1,008,273,251) | 1,269,666,105 | |
| * | Non-income producing security. |
| (a) | The rate shown is the annualized 7-day yield. |
| ADR — | American Depositary Receipt |
| DESCRIPTION | QUOTED PRICES IN ACTIVE MARKETS FOR IDENTICAL ASSETS (LEVEL 1) | OTHER SIGNIFICANT OBSERVABLE INPUTS (LEVEL 2) | SIGNIFICANT UNOBSERVABLE INPUTS (LEVEL 3) | TOTAL |
| Assets | ||||
| Common Stocks1 | $1,264,782,828 | $— | $— | $1,264,782,828 |
| Short-Term Investments1 | 4,883,277 | — | — | 4,883,277 |
| Total | $1,269,666,105 | $— | $— | $1,269,666,105 |
| 1 | As categorized in the Portfolio Holdings. |
| Assets | ||
| Investments in securities, at value - unaffiliated (cost $1,008,273,251) | $1,269,666,105 | |
| Receivables: | ||
| Dividends | 1,573,220 | |
| Fund shares sold | 702,323 | |
| Foreign tax reclaims | 390,386 | |
| Prepaid expenses | + | 13,526 |
| Total assets | 1,272,345,560 | |
| Liabilities | ||
| Payables: | ||
| Fund shares redeemed | 3,626,656 | |
| Investment adviser and administrator fees | 462,747 | |
| Shareholder service fees | 240,578 | |
| Independent trustees’ fees | 51 | |
| Accrued expenses | + | 181,301 |
| Total liabilities | 4,511,333 | |
| Net assets | $1,267,834,227 | |
| Net Assets by Source | ||
| Capital received from investors | $831,501,272 | |
| Total distributable earnings | + | 436,332,955 |
| Net assets | $1,267,834,227 | |
| Net Asset Value (NAV) | ||||
| Net Assets | ÷ | Shares Outstanding | = | NAV |
| $1,267,834,227 | 65,142,870 | $19.46 | ||
| For the period November 1, 2021 through October 31, 2022 | ||
| Investment Income | ||
| Dividends received from securities - unaffiliated (net of foreign withholding tax of $82,597) | $28,719,565 | |
| Expenses | ||
| Investment adviser and administrator fees | 7,063,747 | |
| Shareholder service fees | 3,617,715 | |
| Proxy fees1 | 70,453 | |
| Portfolio accounting fees | 63,794 | |
| Shareholder reports | 53,939 | |
| Professional fees | 33,722 | |
| Registration fees | 33,556 | |
| Custodian fees | 19,882 | |
| Independent trustees’ fees | 10,948 | |
| Transfer agent fees | 6,888 | |
| Other expenses | + | 19,851 |
| Total expenses | 10,994,495 | |
| Expense reduction | – | 6,888 |
| Net expenses | – | 10,987,607 |
| Net investment income | 17,731,958 | |
| REALIZED AND UNREALIZED GAINS (LOSSES) | ||
| Net realized gains on sales of securities - unaffiliated | 162,404,437 | |
| Net realized losses on futures contracts | + | (461,367) |
| Net realized gains | 161,943,070 | |
| Net change in unrealized appreciation (depreciation) on securities - unaffiliated | + | (384,220,325) |
| Net realized and unrealized losses | (222,277,255) | |
| Decrease in net assets resulting from operations | ($204,545,297) | |
| 1 | Proxy fees are non-routine expenses (see financial note 4 for additional information). |
| OPERATIONS | |||
| 11/1/21-10/31/22 | 11/1/20-10/31/21 | ||
| Net investment income | $17,731,958 | $15,761,570 | |
| Net realized gains | 161,943,070 | 425,880,076 | |
| Net change in unrealized appreciation (depreciation) | + | (384,220,325) | 181,824,785 |
| Increase (decrease) in net assets resulting from operations | ($204,545,297) | $623,466,431 | |
| DISTRIBUTIONS TO SHAREHOLDERS | |||
| Total distributions | ($439,343,161) | ($97,998,756) | |
| TRANSACTIONS IN FUND SHARES | |||||
| 11/1/21-10/31/22 | 11/1/20-10/31/21 | ||||
| SHARES | VALUE | SHARES | VALUE | ||
| Shares sold | 2,450,800 | $60,722,098 | 3,613,563 | $92,083,552 | |
| Shares reinvested | 10,780,617 | 251,727,418 | 3,088,327 | 73,440,411 | |
| Shares redeemed | + | (11,757,059) | (260,849,903) | (31,031,079) | (787,773,255) |
| Net transactions in fund shares | 1,474,358 | $51,599,613 | (24,329,189) | ($622,249,292) | |
| SHARES OUTSTANDING AND NET ASSETS | |||||
| 11/1/21-10/31/22 | 11/1/20-10/31/21 | ||||
| SHARES | NET ASSETS | SHARES | NET ASSETS | ||
| Beginning of period | 63,668,512 | $1,860,123,072 | 87,997,701 | $1,956,904,689 | |
| Total increase (decrease) | + | 1,474,358 | (592,288,845) | (24,329,189) | (96,781,617) |
| End of period | 65,142,870 | $1,267,834,227 | 63,668,512 | $1,860,123,072 | |
| 11/1/21– 10/31/22 | 11/1/20– 10/31/21 | 11/1/19– 10/31/20 | 11/1/18– 10/31/19 | 11/1/17– 10/31/18 | ||
| Per-Share Data | ||||||
| Net asset value at beginning of period | $16.92 | $12.14 | $15.07 | $15.43 | $17.21 | |
| Income (loss) from investment operations: | ||||||
| Net investment income (loss)1 | 0.29 | 0.31 | 0.28 | 0.23 | 0.22 | |
| Net realized and unrealized gains (losses) | (0.81) | 4.80 | (2.15) | 0.93 | (0.27) | |
| Total from investment operations | (0.52) | 5.11 | (1.87) | 1.16 | (0.05) | |
| Less distributions: | ||||||
| Distributions from net investment income | (0.29) | (0.33) | (0.26) | (0.24) | (0.30) | |
| Distributions from net realized gains | (2.19) | — | (0.80) | (1.28) | (1.43) | |
| Total distributions | (2.48) | (0.33) | (1.06) | (1.52) | (1.73) | |
| Net asset value at end of period | $13.92 | $16.92 | $12.14 | $15.07 | $15.43 | |
| Total return | (3.96%) | 42.38% | (13.30%) | 8.78% | (0.63%) | |
| Ratios/Supplemental Data | ||||||
| Ratios to average net assets: | ||||||
| Net operating expenses | 0.89% 2 | 0.89% | 0.89% | 0.89% | 0.88% | |
| Gross operating expenses | 0.90% 2 | 0.90% | 0.90% | 0.89% | 0.88% | |
| Net investment income (loss) | 1.99% | 2.01% | 2.16% | 1.58% | 1.36% | |
| Portfolio turnover rate | 27% | 83% | 70% | 70% | 79% | |
| Net assets, end of period (x 1,000) | $524,330 | $670,765 | $576,701 | $846,955 | $1,249,124 | |
| 1 | Calculated based on the average shares outstanding during the period. |
| 2 | Ratio includes less than 0.005% of non-routine proxy expenses. |
| SECURITY | NUMBER OF SHARES | VALUE ($) |
| COMMON STOCKS 99.4% OF NET ASSETS | ||
| Banks 9.2% | ||
| Bank of America Corp. | 300,000 | 10,812,000 |
| Citizens Financial Group, Inc. | 165,000 | 6,748,500 |
| Huntington Bancshares, Inc. | 340,000 | 5,161,200 |
| JPMorgan Chase & Co. | 125,000 | 15,735,000 |
| Truist Financial Corp. | 215,000 | 9,629,850 |
| 48,086,550 | ||
| Capital Goods 8.2% | ||
| General Dynamics Corp. | 21,000 | 5,245,800 |
| Illinois Tool Works, Inc. | 18,500 | 3,950,305 |
| Lockheed Martin Corp. | 37,000 | 18,007,160 |
| Parker-Hannifin Corp. | 16,500 | 4,795,230 |
| Raytheon Technologies Corp. | 58,000 | 5,499,560 |
| Watsco, Inc. | 20,000 | 5,419,200 |
| 42,917,255 | ||
| Consumer Services 2.1% | ||
| McDonald’s Corp. | 40,000 | 10,906,400 |
| Diversified Financials 4.5% | ||
| BlackRock, Inc. | 16,500 | 10,657,515 |
| Morgan Stanley | 155,000 | 12,736,350 |
| 23,393,865 | ||
| Energy 8.9% | ||
| Chevron Corp. | 105,000 | 18,994,500 |
| Exxon Mobil Corp. | 200,000 | 22,162,000 |
| Kinder Morgan, Inc. | 290,000 | 5,254,800 |
| 46,411,300 | ||
| Food & Staples Retailing 2.0% | ||
| Walmart, Inc. | 75,000 | 10,674,750 |
| Food, Beverage & Tobacco 7.7% | ||
| Altria Group, Inc. | 130,000 | 6,015,100 |
| Philip Morris International, Inc. | 155,000 | 14,236,750 |
| The Coca-Cola Co. | 340,000 | 20,349,000 |
| 40,600,850 | ||
| Health Care Equipment & Services 7.7% | ||
| Abbott Laboratories | 77,000 | 7,618,380 |
| CVS Health Corp. | 103,000 | 9,754,100 |
| Medtronic plc | 105,000 | 9,170,700 |
| UnitedHealth Group, Inc. | 25,000 | 13,878,750 |
| 40,421,930 | ||
| SECURITY | NUMBER OF SHARES | VALUE ($) |
| Household & Personal Products 2.8% | ||
| The Procter & Gamble Co. | 110,000 | 14,813,700 |
| Insurance 2.0% | ||
| The Allstate Corp. | 85,000 | 10,731,250 |
| Materials 0.8% | ||
| PPG Industries, Inc. | 37,000 | 4,224,660 |
| Media & Entertainment 3.2% | ||
| Activision Blizzard, Inc. | 40,000 | 2,912,000 |
| Alphabet, Inc., Class A * | 42,300 | 3,997,773 |
| Comcast Corp., Class A | 200,000 | 6,348,000 |
| Omnicom Group, Inc. | 45,000 | 3,273,750 |
| 16,531,523 | ||
| Pharmaceuticals, Biotechnology & Life Sciences 11.5% | ||
| Amgen, Inc. | 57,000 | 15,409,950 |
| Johnson & Johnson | 103,000 | 17,918,910 |
| Pfizer, Inc. | 295,000 | 13,732,250 |
| Roche Holding AG | 40,663 | 13,491,907 |
| 60,553,017 | ||
| Real Estate 1.9% | ||
| Crown Castle, Inc. | 48,750 | 6,496,425 |
| Lamar Advertising Co., Class A | 40,000 | 3,689,200 |
| 10,185,625 | ||
| Retailing 5.0% | ||
| Genuine Parts Co. | 35,000 | 6,225,100 |
| The Home Depot, Inc. | 35,000 | 10,364,550 |
| The TJX Cos., Inc. | 135,000 | 9,733,500 |
| 26,323,150 | ||
| Semiconductors & Semiconductor Equipment 2.5% | ||
| Broadcom, Inc. | 27,500 | 12,928,300 |
| Software & Services 7.8% | ||
| Accenture plc, Class A | 36,500 | 10,362,350 |
| International Business Machines Corp. | 85,000 | 11,754,650 |
| Microsoft Corp. | 45,000 | 10,445,850 |
| Visa, Inc., Class A | 40,000 | 8,286,400 |
| 40,849,250 | ||
| Technology Hardware & Equipment 3.6% | ||
| Apple Inc. | 35,000 | 5,366,900 |
| Cisco Systems, Inc. | 300,000 | 13,629,000 |
| 18,995,900 | ||
| SECURITY | NUMBER OF SHARES | VALUE ($) |
| Telecommunication Services 2.7% | ||
| BCE, Inc. | 100,000 | 4,510,000 |
| Verizon Communications, Inc. | 260,000 | 9,716,200 |
| 14,226,200 | ||
| Transportation 1.9% | ||
| United Parcel Service, Inc., Class B | 58,000 | 9,730,660 |
| Utilities 3.4% | ||
| Duke Energy Corp. | 110,000 | 10,249,800 |
| NRG Energy, Inc. | 110,000 | 4,884,000 |
| SECURITY | NUMBER OF SHARES | VALUE ($) |
| UGI Corp. | 70,000 | 2,473,100 |
| 17,606,900 | ||
| Total Common Stocks (Cost $455,958,523) | 521,113,035 | |
| Total Investments in Securities (Cost $455,958,523) | 521,113,035 | |
| * | Non-income producing security. |
| DESCRIPTION | QUOTED PRICES IN ACTIVE MARKETS FOR IDENTICAL ASSETS (LEVEL 1) | OTHER SIGNIFICANT OBSERVABLE INPUTS (LEVEL 2) | SIGNIFICANT UNOBSERVABLE INPUTS (LEVEL 3) | TOTAL |
| Assets | ||||
| Common Stocks1 | $460,560,018 | $— | $— | $460,560,018 |
| Pharmaceuticals, Biotechnology & Life Sciences | 47,061,110 | 13,491,907 | — | 60,553,017 |
| Total | $507,621,128 | $13,491,907 | $— | $521,113,035 |
| 1 | As categorized in the Portfolio Holdings. |
| Assets | ||
| Investments in securities, at value - unaffiliated (cost $455,958,523) | $521,113,035 | |
| Cash | 757,578 | |
| Deposit with broker for futures contracts | 1,840,000 | |
| Receivables: | ||
| Dividends | 731,433 | |
| Fund shares sold | 522,670 | |
| Foreign tax reclaims | 235,248 | |
| Prepaid expenses | + | 15,086 |
| Total assets | 525,215,050 | |
| Liabilities | ||
| Payables: | ||
| Fund shares redeemed | 402,981 | |
| Investment adviser and administrator fees | 239,749 | |
| Shareholder service fees | 94,490 | |
| Independent trustees’ fees | 40 | |
| Accrued expenses | + | 147,777 |
| Total liabilities | 885,037 | |
| Net assets | $524,330,013 | |
| Net Assets by Source | ||
| Capital received from investors | $435,960,897 | |
| Total distributable earnings | + | 88,369,116 |
| Net assets | $524,330,013 | |
| Net Asset Value (NAV) | ||||
| Net Assets | ÷ | Shares Outstanding | = | NAV |
| $524,330,013 | 37,661,284 | $13.92 | ||
| For the period November 1, 2021 through October 31, 2022 | ||
| Investment Income | ||
| Dividends received from securities - unaffiliated (net of foreign withholding tax of $87,227) | $17,300,671 | |
| Interest received from securities - unaffiliated | 4,690 | |
| Securities on loan, net | + | 10 |
| Total investment income | 17,305,371 | |
| Expenses | ||
| Investment adviser and administrator fees | 3,724,068 | |
| Shareholder service fees | 1,431,584 | |
| Portfolio accounting fees | 102,287 | |
| Registration fees | 47,494 | |
| Shareholder reports | 34,000 | |
| Professional fees | 30,627 | |
| Proxy fees1 | 28,000 | |
| Custodian fees | 12,010 | |
| Independent trustees’ fees | 8,422 | |
| Transfer agent fees | 5,266 | |
| Other expenses | + | 10,686 |
| Total expenses | 5,434,444 | |
| Expense reduction | – | 60,387 |
| Net expenses | – | 5,374,057 |
| Net investment income | 11,931,314 | |
| REALIZED AND UNREALIZED GAINS (LOSSES) | ||
| Net realized gains on sales of securities - unaffiliated | 21,838,363 | |
| Net realized gains on futures contracts | 412,195 | |
| Net realized losses on foreign currency transactions | + | (7,747) |
| Net realized gains | 22,242,811 | |
| Net change in unrealized appreciation (depreciation) on securities - unaffiliated | (57,083,526) | |
| Net change in unrealized appreciation (depreciation) on foreign currency translations | + | (21,732) |
| Net change in unrealized appreciation (depreciation) | + | (57,105,258) |
| Net realized and unrealized losses | (34,862,447) | |
| Decrease in net assets resulting from operations | ($22,931,133) | |
| 1 | Proxy fees are non-routine expenses (see financial note 4 for additional information). |
| OPERATIONS | |||
| 11/1/21-10/31/22 | 11/1/20-10/31/21 | ||
| Net investment income | $11,931,314 | $12,850,464 | |
| Net realized gains | 22,242,811 | 115,287,705 | |
| Net change in unrealized appreciation (depreciation) | + | (57,105,258) | 90,530,602 |
| Increase (decrease) in net assets resulting from operations | ($22,931,133) | $218,668,771 | |
| DISTRIBUTIONS TO SHAREHOLDERS | |||
| Total distributions | ($97,765,390) | ($13,599,106) | |
| TRANSACTIONS IN FUND SHARES | |||||
| 11/1/21-10/31/22 | 11/1/20-10/31/21 | ||||
| SHARES | VALUE | SHARES | VALUE | ||
| Shares sold | 2,342,249 | $34,630,897 | 3,539,840 | $56,507,561 | |
| Shares reinvested | 5,269,146 | 79,189,907 | 674,614 | 10,361,404 | |
| Shares redeemed | + | (9,583,602) | (139,558,823) | (12,099,793) | (177,875,463) |
| Net transactions in fund shares | (1,972,207) | ($25,738,019) | (7,885,339) | ($111,006,498) | |
| SHARES OUTSTANDING AND NET ASSETS | |||||
| 11/1/21-10/31/22 | 11/1/20-10/31/21 | ||||
| SHARES | NET ASSETS | SHARES | NET ASSETS | ||
| Beginning of period | 39,633,491 | $670,764,555 | 47,518,830 | $576,701,388 | |
| Total increase (decrease) | + | (1,972,207) | (146,434,542) | (7,885,339) | 94,063,167 |
| End of period | 37,661,284 | $524,330,013 | 39,633,491 | $670,764,555 | |
| 11/1/21– 10/31/22 | 11/1/20– 10/31/21 | 11/1/19– 10/31/20 | 11/1/18– 10/31/19 | 11/1/17– 10/31/18 | ||
| Per-Share Data | ||||||
| Net asset value at beginning of period | $28.96 | $20.85 | $18.07 | $18.04 | $18.65 | |
| Income (loss) from investment operations: | ||||||
| Net investment income (loss)1 | (0.01) | (0.06) | 0.00 2 | 0.06 | 0.06 | |
| Net realized and unrealized gains (losses) | (5.97) | 8.42 | 3.76 | 1.79 | 0.75 | |
| Total from investment operations | (5.98) | 8.36 | 3.76 | 1.85 | 0.81 | |
| Less distributions: | ||||||
| Distributions from net investment income | — | — | (0.03) | (0.07) | (0.07) | |
| Distributions from net realized gains | (2.18) | (0.25) | (0.95) | (1.75) | (1.35) | |
| Total distributions | (2.18) | (0.25) | (0.98) | (1.82) | (1.42) | |
| Net asset value at end of period | $20.80 | $28.96 | $20.85 | $18.07 | $18.04 | |
| Total return | (22.45%) | 40.41% | 21.60% | 12.18% | 4.46% | |
| Ratios/Supplemental Data | ||||||
| Ratios to average net assets: | ||||||
| Net operating expenses | 0.99% 3 | 0.99% | 0.99% | 0.99% | 0.99% | |
| Gross operating expenses | 1.02% 3 | 1.02% | 1.02% | 1.03% | 1.02% | |
| Net investment income (loss) | (0.05%) | (0.23%) | 0.01% | 0.34% | 0.30% | |
| Portfolio turnover rate | 19% | 42% | 65% | 67% | 88% | |
| Net assets, end of period (x 1,000) | $218,329 | $292,447 | $210,033 | $180,809 | $242,770 | |
| 1 | Calculated based on the average shares outstanding during the period. |
| 2 | Per-share amount was less than $0.005. |
| 3 | Ratio includes less than 0.005% of non-routine proxy expenses. |
| SECURITY | NUMBER OF SHARES | VALUE ($) |
| COMMON STOCKS 97.7% OF NET ASSETS | ||
| Automobiles & Components 2.2% | ||
| Tesla, Inc. * | 21,393 | 4,867,763 |
| Banks 0.7% | ||
| Citizens Financial Group, Inc. | 38,348 | 1,568,433 |
| Capital Goods 4.8% | ||
| AGCO Corp. | 9,743 | 1,209,788 |
| Illinois Tool Works, Inc. | 4,799 | 1,024,731 |
| Lockheed Martin Corp. | 7,652 | 3,724,075 |
| Parker-Hannifin Corp. | 10,673 | 3,101,787 |
| Quanta Services, Inc. | 9,885 | 1,404,066 |
| 10,464,447 | ||
| Consumer Durables & Apparel 3.2% | ||
| Deckers Outdoor Corp. * | 8,287 | 2,899,870 |
| Lululemon Athletica, Inc. * | 4,211 | 1,385,587 |
| NIKE, Inc., Class B | 28,300 | 2,622,844 |
| 6,908,301 | ||
| Consumer Services 2.0% | ||
| Starbucks Corp. | 50,583 | 4,379,982 |
| Diversified Financials 1.8% | ||
| CME Group, Inc. | 8,130 | 1,408,929 |
| Moody's Corp. | 4,467 | 1,183,174 |
| MSCI, Inc. | 2,815 | 1,319,841 |
| 3,911,944 | ||
| Energy 2.0% | ||
| EOG Resources, Inc. | 31,449 | 4,293,417 |
| Food & Staples Retailing 1.7% | ||
| Costco Wholesale Corp. | 7,253 | 3,637,380 |
| Food, Beverage & Tobacco 3.4% | ||
| Constellation Brands, Inc., Class A | 7,145 | 1,765,386 |
| Diageo plc, ADR | 8,976 | 1,498,723 |
| PepsiCo, Inc. | 14,805 | 2,688,292 |
| Philip Morris International, Inc. | 14,946 | 1,372,790 |
| 7,325,191 | ||
| Health Care Equipment & Services 6.4% | ||
| Abbott Laboratories | 28,139 | 2,784,073 |
| IDEXX Laboratories, Inc. * | 3,556 | 1,279,022 |
| Intuitive Surgical, Inc. * | 16,517 | 4,070,945 |
| SECURITY | NUMBER OF SHARES | VALUE ($) |
| UnitedHealth Group, Inc. | 10,514 | 5,836,847 |
| 13,970,887 | ||
| Household & Personal Products 1.5% | ||
| The Estee Lauder Cos., Inc., Class A | 16,531 | 3,314,300 |
| Materials 0.5% | ||
| The Sherwin-Williams Co. | 5,335 | 1,200,535 |
| Media & Entertainment 5.6% | ||
| Alphabet, Inc., Class A * | 120,240 | 11,363,882 |
| Meta Platforms, Inc., Class A * | 10,080 | 939,053 |
| 12,302,935 | ||
| Pharmaceuticals, Biotechnology & Life Sciences 6.0% | ||
| Avantor, Inc. * | 50,508 | 1,018,746 |
| Eli Lilly & Co. | 10,599 | 3,837,792 |
| Pfizer, Inc. | 43,226 | 2,012,170 |
| Roche Holding AG ADR | 34,387 | 1,421,559 |
| Thermo Fisher Scientific, Inc. | 4,939 | 2,538,498 |
| Zoetis, Inc. | 15,542 | 2,343,423 |
| 13,172,188 | ||
| Real Estate 0.6% | ||
| American Tower Corp. | 6,424 | 1,330,989 |
| Retailing 9.3% | ||
| Amazon.com, Inc. * | 118,933 | 12,183,497 |
| O'Reilly Automotive, Inc. * | 3,247 | 2,718,291 |
| The Home Depot, Inc. | 12,073 | 3,575,177 |
| The TJX Cos., Inc. | 25,285 | 1,823,048 |
| 20,300,013 | ||
| Semiconductors & Semiconductor Equipment 5.5% | ||
| Advanced Micro Devices, Inc. * | 21,181 | 1,272,131 |
| ASML Holding N.V. NY Registry Shares | 5,852 | 2,764,602 |
| Broadcom, Inc. | 9,252 | 4,349,550 |
| NVIDIA Corp. | 27,403 | 3,698,583 |
| 12,084,866 | ||
| Software & Services 24.8% | ||
| Accenture plc, Class A | 8,194 | 2,326,277 |
| Adobe, Inc. * | 8,776 | 2,795,156 |
| Fortinet, Inc. * | 27,385 | 1,565,327 |
| Gartner, Inc. * | 10,548 | 3,184,652 |
| Intuit, Inc. | 4,573 | 1,954,958 |
| Mastercard, Inc., Class A | 11,969 | 3,927,986 |
| Microsoft Corp. | 99,364 | 23,065,365 |
| Palo Alto Networks, Inc. * | 11,676 | 2,003,485 |
| Paychex, Inc. | 13,902 | 1,644,746 |
| PayPal Holdings, Inc. * | 39,156 | 3,272,658 |
| SECURITY | NUMBER OF SHARES | VALUE ($) |
| ServiceNow, Inc. * | 2,645 | 1,112,857 |
| Synopsys, Inc. * | 5,560 | 1,626,578 |
| Visa, Inc., Class A | 27,048 | 5,603,264 |
| 54,083,309 | ||
| Technology Hardware & Equipment 14.6% | ||
| Apple Inc. | 207,728 | 31,853,012 |
| Transportation 1.1% | ||
| United Parcel Service, Inc., Class B | 14,196 | 2,381,663 |
| Total Common Stocks (Cost $130,058,782) | 213,351,555 | |
| Total Investments in Securities (Cost $130,058,782) | 213,351,555 | |
| NUMBER OF CONTRACTS | NOTIONAL AMOUNT ($) | CURRENT VALUE/ UNREALIZED DEPRECIATION ($) | |
| FUTURES CONTRACTS | |||
| Long | |||
| S&P 500 Index, e-mini, expires 12/16/22 | 6 | 1,164,900 | (61,037) |
| * | Non-income producing security. |
| ADR — | American Depositary Receipt |
| DESCRIPTION | QUOTED PRICES IN ACTIVE MARKETS FOR IDENTICAL ASSETS (LEVEL 1) | OTHER SIGNIFICANT OBSERVABLE INPUTS (LEVEL 2) | SIGNIFICANT UNOBSERVABLE INPUTS (LEVEL 3) | TOTAL |
| Assets | ||||
| Common Stocks1 | $213,351,555 | $— | $— | $213,351,555 |
| Liabilities | ||||
| Futures Contracts2 | (61,037) | — | — | (61,037) |
| Total | $213,290,518 | $— | $— | $213,290,518 |
| 1 | As categorized in the Portfolio Holdings. |
| 2 | Futures contracts are reported at cumulative unrealized appreciation or depreciation. |
| Assets | ||
| Investments in securities, at value - unaffiliated (cost $130,058,782) | $213,351,555 | |
| Cash | 5,036,144 | |
| Deposit with broker for futures contracts | 72,000 | |
| Receivables: | ||
| Fund shares sold | 179,985 | |
| Dividends | 45,532 | |
| Foreign tax reclaims | 4,943 | |
| Prepaid expenses | + | 16,036 |
| Total assets | 218,706,195 | |
| Liabilities | ||
| Payables: | ||
| Fund shares redeemed | 122,820 | |
| Investment adviser and administrator fees | 115,579 | |
| Shareholder service fees | 41,848 | |
| Variation margin on futures contracts | 8,475 | |
| Independent trustees’ fees | 35 | |
| Accrued expenses | + | 88,240 |
| Total liabilities | 376,997 | |
| Net assets | $218,329,198 | |
| Net Assets by Source | ||
| Capital received from investors | $130,825,519 | |
| Total distributable earnings | + | 87,503,679 |
| Net assets | $218,329,198 | |
| Net Asset Value (NAV) | ||||
| Net Assets | ÷ | Shares Outstanding | = | NAV |
| $218,329,198 | 10,494,105 | $20.80 | ||
| For the period November 1, 2021 through October 31, 2022 | ||
| Investment Income | ||
| Dividends received from securities - unaffiliated (net of foreign withholding tax of $7,800) | $2,378,398 | |
| Interest received from securities - unaffiliated | + | 18,146 |
| Total investment income | 2,396,544 | |
| Expenses | ||
| Investment adviser and administrator fees | 1,834,685 | |
| Shareholder service fees | 609,226 | |
| Portfolio accounting fees | 50,561 | |
| Professional fees | 33,473 | |
| Registration fees | 28,745 | |
| Shareholder reports | 17,809 | |
| Proxy fees1 | 11,855 | |
| Independent trustees’ fees | 7,457 | |
| Custodian fees | 6,581 | |
| Transfer agent fees | 2,580 | |
| Other expenses | + | 6,736 |
| Total expenses | 2,609,708 | |
| Expense reduction | – | 75,161 |
| Net expenses | – | 2,534,547 |
| Net investment loss | (138,003) | |
| REALIZED AND UNREALIZED GAINS (LOSSES) | ||
| Net realized gains on sales of securities - unaffiliated | 4,537,319 | |
| Net realized losses on futures contracts | + | (126,575) |
| Net realized gains | 4,410,744 | |
| Net change in unrealized appreciation (depreciation) on securities - unaffiliated | (69,103,192) | |
| Net change in unrealized appreciation (depreciation) on futures contracts | + | (89,137) |
| Net change in unrealized appreciation (depreciation) | + | (69,192,329) |
| Net realized and unrealized losses | (64,781,585) | |
| Decrease in net assets resulting from operations | ($64,919,588) | |
| 1 | Proxy fees are non-routine expenses (see financial note 4 for additional information). |
| OPERATIONS | |||
| 11/1/21-10/31/22 | 11/1/20-10/31/21 | ||
| Net investment loss | ($138,003) | ($577,485) | |
| Net realized gains | 4,410,744 | 22,809,697 | |
| Net change in unrealized appreciation (depreciation) | + | (69,192,329) | 61,527,745 |
| Increase (decrease) in net assets resulting from operations | ($64,919,588) | $83,759,957 | |
| DISTRIBUTIONS TO SHAREHOLDERS | |||
| Total distributions | ($22,163,876) | ($2,530,978) | |
| TRANSACTIONS IN FUND SHARES | |||||
| 11/1/21-10/31/22 | 11/1/20-10/31/21 | ||||
| SHARES | VALUE | SHARES | VALUE | ||
| Shares sold | 1,374,258 | $34,040,262 | 2,017,391 | $50,557,323 | |
| Shares reinvested | 704,838 | 19,242,083 | 94,152 | 2,163,612 | |
| Shares redeemed | + | (1,681,639) | (40,316,352) | (2,086,140) | (51,536,257) |
| Net transactions in fund shares | 397,457 | $12,965,993 | 25,403 | $1,184,678 | |
| SHARES OUTSTANDING AND NET ASSETS | |||||
| 11/1/21-10/31/22 | 11/1/20-10/31/21 | ||||
| SHARES | NET ASSETS | SHARES | NET ASSETS | ||
| Beginning of period | 10,096,648 | $292,446,669 | 10,071,245 | $210,033,012 | |
| Total increase (decrease) | + | 397,457 | (74,117,471) | 25,403 | 82,413,657 |
| End of period | 10,494,105 | $218,329,198 | 10,096,648 | $292,446,669 | |
| 11/1/21– 10/31/22 | 11/1/20– 10/31/21 | 11/1/19– 10/31/20 | 11/1/18– 10/31/19 | 11/1/17– 10/31/18 | ||
| Per-Share Data | ||||||
| Net asset value at beginning of period | $23.77 | $15.02 | $16.68 | $20.87 | $23.58 | |
| Income (loss) from investment operations: | ||||||
| Net investment income (loss)1 | 0.03 | 0.02 | 0.03 | 0.02 | 0.01 | |
| Net realized and unrealized gains (losses) | (2.27) | 8.76 | (1.67) | (0.35) 2 | 0.32 | |
| Total from investment operations | (2.24) | 8.78 | (1.64) | (0.33) | 0.33 | |
| Less distributions: | ||||||
| Distributions from net investment income | (0.03) | (0.03) | (0.02) | (0.01) | — | |
| Distributions from net realized gains | (2.56) | — | — | (3.85) | (3.04) | |
| Total distributions | (2.59) | (0.03) | (0.02) | (3.86) | (3.04) | |
| Net asset value at end of period | $18.94 | $23.77 | $15.02 | $16.68 | $20.87 | |
| Total return | (10.25%) | 58.55% | (9.86%) | 0.08% | 1.37% | |
| Ratios/Supplemental Data | ||||||
| Ratios to average net assets: | ||||||
| Net operating expenses | 1.09% 3 | 1.08% | 1.09% | 1.09% | 1.09% | |
| Gross operating expenses | 1.09% 3 | 1.08% | 1.10% | 1.09% | 1.09% | |
| Net investment income (loss) | 0.13% | 0.11% | 0.17% | 0.09% | 0.06% | |
| Portfolio turnover rate | 74% | 84% | 113% | 117% | 111% | |
| Net assets, end of period (x 1,000) | $542,600 | $669,489 | $491,478 | $579,143 | $573,406 | |
| 1 | Calculated based on the average shares outstanding during the period. |
| 2 | The per share amount does not accord with the change in aggregate gains and losses in securities during the period because of the timing of sales and repurchases of fund shares in relation to fluctuating market values. |
| 3 | Ratio includes less than 0.005% of non-routine proxy expenses. |
| SECURITY | NUMBER OF SHARES | VALUE ($) |
| COMMON STOCKS 99.1% OF NET ASSETS | ||
| Automobiles & Components 2.3% | ||
| American Axle & Manufacturing Holdings, Inc. * | 276,405 | 2,678,365 |
| LCI Industries | 18,783 | 1,993,064 |
| Modine Manufacturing Co. * | 123,507 | 2,213,245 |
| Patrick Industries, Inc. | 39,066 | 1,785,707 |
| The Goodyear Tire & Rubber Co. * | 63,926 | 811,860 |
| Winnebago Industries, Inc. | 48,238 | 2,879,326 |
| 12,361,567 | ||
| Banks 11.3% | ||
| Associated Banc-Corp. | 258,793 | 6,301,610 |
| Axos Financial, Inc. * | 12,857 | 500,909 |
| Banner Corp. | 7,886 | 589,479 |
| Cathay General Bancorp | 92,606 | 4,222,834 |
| Community Trust Bancorp, Inc. | 5,199 | 245,861 |
| Customers Bancorp, Inc. * | 34,710 | 1,169,380 |
| Eagle Bancorp, Inc. | 36,652 | 1,659,603 |
| Enterprise Financial Services Corp. | 24,536 | 1,311,940 |
| Essent Group Ltd. | 27,018 | 1,069,372 |
| First BanCorp | 220,731 | 3,485,342 |
| Great Southern Bancorp, Inc. | 70,177 | 4,349,570 |
| Hancock Whitney Corp. | 114,827 | 6,415,385 |
| Hanmi Financial Corp. | 55,564 | 1,488,004 |
| Hope Bancorp, Inc. | 127,362 | 1,728,302 |
| International Bancshares Corp. | 106,880 | 5,301,248 |
| Metropolitan Bank Holding Corp. * | 23,146 | 1,527,636 |
| MGIC Investment Corp. | 95,345 | 1,301,459 |
| Northfield Bancorp, Inc. | 217,924 | 3,495,501 |
| OceanFirst Financial Corp. | 81,549 | 1,841,376 |
| Radian Group, Inc. | 87,198 | 1,819,822 |
| Renasant Corp. | 66,293 | 2,676,248 |
| Republic Bancorp, Inc., Class A | 30,525 | 1,414,834 |
| UMB Financial Corp. | 34,705 | 2,888,150 |
| Washington Federal, Inc. | 106,704 | 4,129,445 |
| Western New England Bancorp, Inc. | 44,667 | 390,836 |
| 61,324,146 | ||
| Capital Goods 10.4% | ||
| AAR Corp. * | 53,345 | 2,364,250 |
| Applied Industrial Technologies, Inc. | 6,332 | 787,574 |
| Atkore, Inc. * | 68,169 | 6,496,506 |
| AZZ, Inc. | 38,600 | 1,551,720 |
| Boise Cascade Co. | 21,256 | 1,419,263 |
| Ducommun, Inc. * | 24,724 | 1,167,220 |
| EMCOR Group, Inc. | 36,702 | 5,178,652 |
| Encore Wire Corp. | 23,614 | 3,249,050 |
| GrafTech International Ltd. | 241,374 | 1,228,594 |
| Helios Technologies, Inc. | 19,804 | 1,122,689 |
| Herc Holdings, Inc. | 13,090 | 1,539,515 |
| Hillenbrand, Inc. | 24,439 | 1,079,715 |
| IES Holdings, Inc. * | 16,376 | 541,063 |
| Maxar Technologies, Inc. | 17,709 | 395,619 |
| SECURITY | NUMBER OF SHARES | VALUE ($) |
| Moog, Inc., Class A | 70,232 | 5,952,162 |
| Mueller Industries, Inc. | 80,718 | 5,056,175 |
| MYR Group, Inc. * | 11,863 | 1,038,131 |
| NV5 Global, Inc. * | 9,232 | 1,338,178 |
| Preformed Line Products Co. | 9,869 | 783,303 |
| Proto Labs, Inc. * | 13,625 | 520,339 |
| Standex International Corp. | 2,939 | 291,108 |
| Sterling Infrastructure, Inc. * | 93,342 | 2,519,301 |
| Terex Corp. | 40,650 | 1,647,951 |
| Titan International, Inc. * | 86,118 | 1,288,325 |
| Titan Machinery, Inc. * | 20,665 | 710,463 |
| UFP Industries, Inc. | 37,001 | 2,635,581 |
| V2X, Inc. * | 64,236 | 2,633,034 |
| Wabash National Corp. | 42,901 | 928,807 |
| Zurn Water Solutions Corp. | 45,113 | 1,059,704 |
| 56,523,992 | ||
| Commercial & Professional Services 2.4% | ||
| ACCO Brands Corp. | 41,872 | 192,611 |
| Casella Waste Systems, Inc., Class A * | 14,668 | 1,199,989 |
| Heidrick & Struggles International, Inc. | 21,602 | 608,312 |
| Kforce, Inc. | 38,447 | 2,432,542 |
| Korn Ferry | 30,082 | 1,672,258 |
| Mastech Digital, Inc. * | 28,042 | 423,715 |
| SP Plus Corp. * | 82,548 | 3,056,752 |
| Tetra Tech, Inc. | 9,540 | 1,347,811 |
| The GEO Group, Inc. * | 30,437 | 257,497 |
| TriNet Group, Inc. * | 26,525 | 1,723,595 |
| 12,915,082 | ||
| Consumer Durables & Apparel 0.7% | ||
| MasterCraft Boat Holdings, Inc. * | 44,820 | 975,283 |
| Oxford Industries, Inc. | 9,747 | 991,562 |
| Skyline Champion Corp. * | 17,212 | 1,001,911 |
| Vista Outdoor, Inc. * | 36,811 | 1,068,992 |
| 4,037,748 | ||
| Consumer Services 4.4% | ||
| Bloomin' Brands, Inc. | 119,304 | 2,864,489 |
| Bluegreen Vacations Holding Corp. | 11,100 | 192,141 |
| Boyd Gaming Corp. | 34,708 | 2,004,734 |
| Dave & Buster's Entertainment, Inc. * | 54,281 | 2,163,098 |
| Everi Holdings, Inc. * | 91,398 | 1,734,734 |
| Golden Entertainment, Inc. * | 34,712 | 1,465,541 |
| Hilton Grand Vacations, Inc. * | 69,546 | 2,728,985 |
| PlayAGS, Inc. * | 102,958 | 691,878 |
| Red Rock Resorts, Inc., Class A | 35,663 | 1,485,364 |
| Scientific Games Corp., Class A * | 22,522 | 1,264,385 |
| SeaWorld Entertainment, Inc. * | 40,447 | 2,352,398 |
| Stride, Inc. * | 77,210 | 2,587,307 |
| Texas Roadhouse, Inc. | 23,691 | 2,344,224 |
| 23,879,278 | ||
| SECURITY | NUMBER OF SHARES | VALUE ($) |
| Diversified Financials 2.7% | ||
| Donnelley Financial Solutions, Inc. * | 28,342 | 1,145,867 |
| Enova International, Inc. * | 49,221 | 1,845,295 |
| OneMain Holdings, Inc. | 80,201 | 3,092,551 |
| Oportun Financial Corp. * | 64,300 | 353,650 |
| Piper Sandler Cos. | 6,029 | 771,531 |
| Regional Management Corp. | 56,991 | 1,935,414 |
| StepStone Group, Inc., Class A | 38,659 | 1,141,214 |
| Stifel Financial Corp. | 42,385 | 2,622,360 |
| Virtus Investment Partners, Inc. | 11,410 | 1,956,701 |
| 14,864,583 | ||
| Energy 6.6% | ||
| Arch Resources, Inc. | 5,983 | 911,151 |
| Callon Petroleum Co. * | 13,910 | 611,484 |
| ChampionX Corp. | 10,647 | 304,717 |
| CONSOL Energy, Inc. | 19,809 | 1,248,363 |
| CVR Energy, Inc. | 77,969 | 3,045,469 |
| Delek US Holdings, Inc. | 89,594 | 2,657,358 |
| Equitrans Midstream Corp. | 175,127 | 1,474,569 |
| Liberty Energy, Inc., Class A * | 96,622 | 1,633,878 |
| Magnolia Oil & Gas Corp., Class A | 68,725 | 1,764,858 |
| Matador Resources Co. | 44,260 | 2,941,077 |
| NexTier Oilfield Solutions, Inc. * | 32,212 | 324,697 |
| Oceaneering International, Inc. * | 93,370 | 1,306,246 |
| Ovintiv, Inc. | 28,257 | 1,431,217 |
| Patterson-UTI Energy, Inc. | 44,997 | 794,197 |
| PBF Energy, Inc., Class A | 74,207 | 3,283,660 |
| PDC Energy, Inc. | 14,829 | 1,069,764 |
| Peabody Energy Corp. * | 27,391 | 654,645 |
| REX American Resources Corp. * | 68,575 | 2,056,564 |
| SM Energy Co. | 64,847 | 2,916,818 |
| Southwestern Energy Co. * | 289,338 | 2,005,112 |
| Teekay Corp. * | 150,033 | 586,629 |
| Teekay Tankers Ltd., Class A * | 6,448 | 203,048 |
| US Silica Holdings, Inc. * | 100,940 | 1,452,527 |
| W&T Offshore, Inc. * | 126,667 | 961,403 |
| 35,639,451 | ||
| Food & Staples Retailing 1.4% | ||
| BJ's Wholesale Club Holdings, Inc. * | 62,320 | 4,823,568 |
| United Natural Foods, Inc. * | 67,928 | 2,880,827 |
| 7,704,395 | ||
| Food, Beverage & Tobacco 2.9% | ||
| Coca-Cola Consolidated, Inc. | 7,603 | 3,702,737 |
| Darling Ingredients, Inc. * | 33,562 | 2,633,946 |
| National Beverage Corp. | 34,764 | 1,648,509 |
| Primo Water Corp. | 189,849 | 2,769,897 |
| The Simply Good Foods Co. * | 28,400 | 1,087,720 |
| Vector Group Ltd. | 355,243 | 3,772,680 |
| 15,615,489 | ||
| Health Care Equipment & Services 7.3% | ||
| Accuray, Inc. * | 283,668 | 578,683 |
| Addus HomeCare Corp. * | 2,483 | 254,309 |
| AirSculpt Technologies, Inc. | 44,104 | 299,025 |
| Alignment Healthcare, Inc. * | 54,831 | 725,962 |
| Allscripts Healthcare Solutions, Inc. * | 85,456 | 1,256,203 |
| AMN Healthcare Services, Inc. * | 40,201 | 5,045,226 |
| Apollo Medical Holdings, Inc. * | 6,329 | 224,426 |
| Avanos Medical, Inc. * | 97,721 | 2,164,520 |
| Cerus Corp. * | 270,093 | 988,540 |
| SECURITY | NUMBER OF SHARES | VALUE ($) |
| Cross Country Healthcare, Inc. * | 17,202 | 638,022 |
| Evolent Health, Inc., Class A * | 65,652 | 2,088,390 |
| Inspire Medical Systems, Inc. * | 5,549 | 1,081,778 |
| Lantheus Holdings, Inc. * | 36,689 | 2,714,619 |
| LeMaitre Vascular, Inc. | 13,251 | 575,093 |
| LivaNova plc * | 18,242 | 859,198 |
| Merit Medical Systems, Inc. * | 52,497 | 3,610,219 |
| ModivCare, Inc. * | 4,961 | 482,408 |
| NextGen Healthcare, Inc. * | 54,903 | 1,100,256 |
| NuVasive, Inc. * | 11,539 | 509,216 |
| Option Care Health, Inc. * | 60,660 | 1,835,572 |
| Progyny, Inc. * | 19,342 | 860,139 |
| Shockwave Medical, Inc. * | 12,663 | 3,712,158 |
| STAAR Surgical Co. * | 25,572 | 1,812,288 |
| Tenet Healthcare Corp. * | 7,942 | 352,307 |
| The Ensign Group, Inc. | 42,417 | 3,808,198 |
| Utah Medical Products, Inc. | 4,981 | 446,049 |
| Varex Imaging Corp. * | 7,027 | 155,367 |
| Zynex, Inc. | 116,814 | 1,331,680 |
| 39,509,851 | ||
| Household & Personal Products 0.3% | ||
| BellRing Brands, Inc. * | 23,135 | 560,330 |
| Nature's Sunshine Products, Inc. * | 94,898 | 800,939 |
| 1,361,269 | ||
| Insurance 2.2% | ||
| American Equity Investment Life Holding Co. | 64,756 | 2,789,689 |
| CNO Financial Group, Inc. | 201,889 | 4,453,671 |
| Investors Title Co. | 1,858 | 273,033 |
| Kinsale Capital Group, Inc. | 2,736 | 862,305 |
| National Western Life Group, Inc., Class A | 5,892 | 1,166,734 |
| Stewart Information Services Corp. | 42,339 | 1,649,527 |
| United Fire Group, Inc. | 26,505 | 718,286 |
| 11,913,245 | ||
| Materials 2.6% | ||
| AdvanSix, Inc. | 17,366 | 631,775 |
| Alcoa Corp. | 15,260 | 595,598 |
| Alpha Metallurgical Resources, Inc. | 3,848 | 649,735 |
| Avient Corp. | 71,456 | 2,464,518 |
| Constellium SE * | 125,507 | 1,383,087 |
| Ecovyst, Inc. * | 151,979 | 1,512,191 |
| Ingevity Corp. * | 14,245 | 958,261 |
| LSB Industries, Inc. * | 39,787 | 701,445 |
| Rayonier Advanced Materials, Inc. * | 105,791 | 481,349 |
| Ryerson Holding Corp. | 64,864 | 2,176,187 |
| Schnitzer Steel Industries, Inc., Class A | 260 | 7,017 |
| TimkenSteel Corp. * | 40,991 | 714,883 |
| Tronox Holdings plc, Class A | 84,904 | 1,018,848 |
| Valhi, Inc. | 26,078 | 712,451 |
| 14,007,345 | ||
| Media & Entertainment 2.1% | ||
| Cargurus, Inc. * | 30,336 | 441,692 |
| Cars.com, Inc. * | 141,524 | 1,964,353 |
| Entravision Communications Corp., Class A | 227,618 | 1,065,252 |
| Gaia, Inc. * | 84,982 | 198,858 |
| Gannett Co., Inc. * | 148,450 | 215,253 |
| iHeartMedia, Inc., Class A * | 97,406 | 806,522 |
| Outbrain, Inc. * | 72,000 | 308,160 |
| Shutterstock, Inc. | 29,062 | 1,453,972 |
| Yelp, Inc. * | 87,001 | 3,341,708 |
| SECURITY | NUMBER OF SHARES | VALUE ($) |
| Ziff Davis, Inc. * | 20,224 | 1,565,135 |
| 11,360,905 | ||
| Pharmaceuticals, Biotechnology & Life Sciences 11.1% | ||
| 2seventy bio, Inc. * | 39,172 | 622,051 |
| ACADIA Pharmaceuticals, Inc. * | 80,050 | 1,283,202 |
| Agios Pharmaceuticals, Inc. * | 22,874 | 629,950 |
| Alkermes plc * | 157,317 | 3,571,096 |
| Amicus Therapeutics, Inc. * | 152,254 | 1,522,540 |
| Amneal Pharmaceuticals, Inc. * | 447,489 | 984,476 |
| Amphastar Pharmaceuticals, Inc. * | 35,764 | 1,105,108 |
| Arrowhead Pharmaceuticals, Inc. * | 32,572 | 1,133,831 |
| Beam Therapeutics, Inc. * | 12,397 | 546,212 |
| BioCryst Pharmaceuticals, Inc. * | 37,920 | 506,232 |
| C4 Therapeutics, Inc. * | 40,507 | 389,677 |
| CareDx, Inc. * | 31,127 | 619,739 |
| Catalyst Pharmaceuticals, Inc. * | 160,588 | 2,227,356 |
| Chinook Therapeutics, Inc. * | 42,118 | 916,067 |
| Codexis, Inc. * | 145,726 | 818,980 |
| Corcept Therapeutics, Inc. * | 88,465 | 2,530,099 |
| Cytokinetics, Inc. * | 6,500 | 283,790 |
| Denali Therapeutics, Inc. * | 22,087 | 633,455 |
| Dynavax Technologies Corp. * | 58,385 | 668,508 |
| Dyne Therapeutics, Inc. * | 25,035 | 285,399 |
| Eagle Pharmaceuticals, Inc. * | 15,172 | 477,463 |
| Emergent BioSolutions, Inc. * | 38,740 | 808,116 |
| FibroGen, Inc. * | 20,833 | 339,161 |
| Halozyme Therapeutics, Inc. * | 31,584 | 1,510,031 |
| Harmony Biosciences Holdings, Inc. * | 10,880 | 565,760 |
| Harrow Health, Inc. * | 108,046 | 1,299,793 |
| Harvard Bioscience, Inc. * | 182,521 | 490,982 |
| Horizon Therapeutics plc * | 32,557 | 2,028,952 |
| ImmunoGen, Inc. * | 46,972 | 279,014 |
| Inhibrx, Inc. * | 19,120 | 615,282 |
| Intercept Pharmaceuticals, Inc. * | 96,998 | 1,345,362 |
| Ironwood Pharmaceuticals, Inc. * | 75,889 | 830,226 |
| Jounce Therapeutics, Inc. * | 133,701 | 291,468 |
| Karuna Therapeutics, Inc. * | 5,315 | 1,165,792 |
| Kiniksa Pharmaceuticals Ltd., Class A * | 125,336 | 1,431,337 |
| Kymera Therapeutics, Inc. * | 11,109 | 337,047 |
| Ligand Pharmaceuticals, Inc. * | 14,524 | 1,273,029 |
| Medpace Holdings, Inc. * | 25,005 | 5,550,610 |
| MiMedx Group, Inc. * | 91,031 | 269,452 |
| NeoGenomics, Inc. * | 26,010 | 197,806 |
| NGM Biopharmaceuticals, Inc. * | 39,957 | 213,370 |
| Nkarta, Inc. * | 9,968 | 125,696 |
| Nurix Therapeutics, Inc. * | 50,141 | 638,295 |
| Organogenesis Holdings, Inc. * | 265,465 | 870,725 |
| Phibro Animal Health Corp., Class A | 112,016 | 1,645,515 |
| Prestige Consumer Healthcare, Inc. * | 39,968 | 2,177,457 |
| Prothena Corp. plc * | 19,242 | 1,182,228 |
| PTC Therapeutics, Inc. * | 30,085 | 1,137,815 |
| Repligen Corp. * | 2,446 | 446,371 |
| Rigel Pharmaceuticals, Inc. * | 407,364 | 296,805 |
| Syneos Health, Inc. * | 48,296 | 2,433,152 |
| Theravance Biopharma, Inc. * | 73,922 | 737,002 |
| Travere Therapeutics, Inc. * | 50,236 | 1,089,116 |
| Vanda Pharmaceuticals, Inc. * | 196,999 | 2,062,580 |
| Veracyte, Inc. * | 31,001 | 623,430 |
| Vericel Corp. * | 18,406 | 494,753 |
| Vir Biotechnology, Inc. * | 36,407 | 800,226 |
| Xencor, Inc. * | 34,439 | 964,292 |
| 60,323,279 | ||
| SECURITY | NUMBER OF SHARES | VALUE ($) |
| Real Estate 7.0% | ||
| Apple Hospitality REIT, Inc. | 393,403 | 6,735,059 |
| Armada Hoffler Properties, Inc. | 222,938 | 2,606,145 |
| BRT Apartments Corp. | 104,014 | 2,304,950 |
| CareTrust REIT, Inc. | 38,134 | 712,343 |
| EastGroup Properties, Inc. | 26,644 | 4,174,848 |
| eXp World Holdings, Inc. | 63,942 | 844,674 |
| Global Medical REIT, Inc. | 57,377 | 524,426 |
| National Storage Affiliates Trust | 72,860 | 3,108,208 |
| Paramount Group, Inc. | 502,627 | 3,251,997 |
| Piedmont Office Realty Trust, Inc., Class A | 377,224 | 3,941,991 |
| PotlatchDeltic Corp. | 28,440 | 1,265,296 |
| RPT Realty | 107,553 | 1,000,243 |
| Sabra Health Care REIT, Inc. | 65,306 | 892,080 |
| SITE Centers Corp. | 172,722 | 2,138,298 |
| The Necessity Retail REIT, Inc. | 488,060 | 3,338,330 |
| Uniti Group, Inc. | 115,959 | 899,842 |
| 37,738,730 | ||
| Retailing 2.4% | ||
| AutoNation, Inc. * | 9,105 | 967,953 |
| Caleres, Inc. | 52,750 | 1,441,658 |
| Duluth Holdings, Inc., Class B * | 119,269 | 1,037,640 |
| Group 1 Automotive, Inc. | 12,089 | 2,091,397 |
| Macy's, Inc. | 182,154 | 3,797,911 |
| Revolve Group, Inc. * | 22,446 | 538,704 |
| Signet Jewelers Ltd. | 14,784 | 964,508 |
| The Buckle, Inc. | 19,762 | 777,239 |
| The Children's Place, Inc. * | 35,151 | 1,422,912 |
| 13,039,922 | ||
| Semiconductors & Semiconductor Equipment 2.9% | ||
| Ambarella, Inc. * | 11,827 | 647,292 |
| Amkor Technology, Inc. | 38,926 | 809,271 |
| Axcelis Technologies, Inc. * | 52,597 | 3,050,626 |
| Diodes, Inc. * | 18,066 | 1,294,790 |
| Lattice Semiconductor Corp. * | 117,988 | 5,723,598 |
| MaxLinear, Inc. * | 41,976 | 1,296,219 |
| Semtech Corp. * | 53,218 | 1,473,606 |
| Synaptics, Inc. * | 17,031 | 1,508,947 |
| 15,804,349 | ||
| Software & Services 7.7% | ||
| 8x8, Inc. * | 110,988 | 469,479 |
| A10 Networks, Inc. | 162,526 | 2,730,437 |
| Agilysys, Inc. * | 38,914 | 2,497,111 |
| American Software, Inc., Class A | 9,898 | 169,553 |
| Box, Inc., Class A * | 151,386 | 4,397,763 |
| CommVault Systems, Inc. * | 76,423 | 4,653,397 |
| CoreCard Corp. * | 25,317 | 620,267 |
| Domo, Inc., Class B * | 65,005 | 1,148,638 |
| eGain Corp. * | 193,849 | 1,560,484 |
| EngageSmart, Inc. * | 26,596 | 522,345 |
| EVERTEC, Inc. | 35,373 | 1,266,707 |
| ExlService Holdings, Inc. * | 16,836 | 3,061,627 |
| LiveRamp Holdings, Inc. * | 8,203 | 150,607 |
| Model N, Inc. * | 31,812 | 1,208,856 |
| Progress Software Corp. | 18,295 | 933,594 |
| Qualys, Inc. * | 45,840 | 6,534,950 |
| Sprout Social, Inc., Class A * | 38,659 | 2,332,297 |
| Tenable Holdings, Inc. * | 16,251 | 660,441 |
| The Hackett Group, Inc. | 105,303 | 2,299,818 |
| Unisys Corp. * | 105,652 | 898,042 |
| Verra Mobility Corp. * | 76,334 | 1,303,021 |
| SECURITY | NUMBER OF SHARES | VALUE ($) |
| Workiva, Inc. * | 27,481 | 2,138,297 |
| Zuora, Inc., Class A * | 63,916 | 491,514 |
| 42,049,245 | ||
| Technology Hardware & Equipment 3.8% | ||
| Avid Technology, Inc. * | 80,856 | 2,222,731 |
| Belden, Inc. | 31,827 | 2,216,114 |
| Calix, Inc. * | 3,678 | 270,848 |
| Cambium Networks Corp. * | 36,173 | 699,947 |
| Casa Systems, Inc. * | 179,731 | 566,153 |
| CommScope Holding Co., Inc. * | 103,478 | 1,370,049 |
| Extreme Networks, Inc. * | 241,441 | 4,331,451 |
| Fabrinet * | 12,842 | 1,469,125 |
| Super Micro Computer, Inc. * | 22,120 | 1,539,331 |
| Vishay Intertechnology, Inc. | 293,538 | 6,137,880 |
| 20,823,629 | ||
| Telecommunication Services 1.4% | ||
| Cogent Communications Holdings, Inc. | 16,173 | 849,244 |
| Iridium Communications, Inc. * | 67,554 | 3,481,058 |
| Liberty Latin America Ltd., Class A * | 353,075 | 2,746,923 |
| Ooma, Inc. * | 32,459 | 526,810 |
| 7,604,035 | ||
| Transportation 1.2% | ||
| ArcBest Corp. | 10,697 | 849,663 |
| Forward Air Corp. | 31,808 | 3,367,513 |
| SECURITY | NUMBER OF SHARES | VALUE ($) |
| Hub Group, Inc., Class A * | 1,336 | 103,674 |
| Matson, Inc. | 21,713 | 1,597,642 |
| Radiant Logistics, Inc. * | 69,136 | 419,655 |
| 6,338,147 | ||
| Utilities 2.0% | ||
| Chesapeake Utilities Corp. | 4,243 | 527,744 |
| Clearway Energy, Inc., Class A | 97,753 | 3,160,354 |
| Consolidated Water Co., Ltd. | 35,962 | 660,262 |
| Genie Energy Ltd., Class B | 99,801 | 975,056 |
| Otter Tail Corp. | 63,730 | 4,296,677 |
| Via Renewables, Inc. | 192,739 | 1,347,246 |
| 10,967,339 | ||
| Total Common Stocks (Cost $520,280,153) | 537,707,021 | |
| Total Investments in Securities (Cost $520,280,153) | 537,707,021 | |
| * | Non-income producing security. |
| REIT — | Real Estate Investment Trust |
| DESCRIPTION | QUOTED PRICES IN ACTIVE MARKETS FOR IDENTICAL ASSETS (LEVEL 1) | OTHER SIGNIFICANT OBSERVABLE INPUTS (LEVEL 2) | SIGNIFICANT UNOBSERVABLE INPUTS (LEVEL 3) | TOTAL |
| Assets | ||||
| Common Stocks1 | $537,707,021 | $— | $— | $537,707,021 |
| Total | $537,707,021 | $— | $— | $537,707,021 |
| 1 | As categorized in the Portfolio Holdings. |
| Assets | ||
| Investments in securities, at value - unaffiliated (cost $520,280,153) | $537,707,021 | |
| Cash | 14,734,558 | |
| Deposit with broker for futures contracts | 720,005 | |
| Receivables: | ||
| Fund shares sold | 250,583 | |
| Dividends | 70,610 | |
| Income from securities on loan | 316 | |
| Prepaid expenses | + | 12,280 |
| Total assets | 553,495,373 | |
| Liabilities | ||
| Payables: | ||
| Fund shares redeemed | 10,133,410 | |
| Investment adviser and administrator fees | 335,711 | |
| Investments bought | 207,452 | |
| Shareholder service fees | 102,763 | |
| Independent trustees’ fees | 40 | |
| Accrued expenses | + | 115,653 |
| Total liabilities | 10,895,029 | |
| Net assets | $542,600,344 | |
| Net Assets by Source | ||
| Capital received from investors | $478,067,479 | |
| Total distributable earnings | + | 64,532,865 |
| Net assets | $542,600,344 | |
| Net Asset Value (NAV) | ||||
| Net Assets | ÷ | Shares Outstanding | = | NAV |
| $542,600,344 | 28,651,758 | $18.94 | ||
| For the period November 1, 2021 through October 31, 2022 | ||
| Investment Income | ||
| Dividends received from securities - unaffiliated (net of foreign withholding tax of $18,223) | $7,181,711 | |
| Interest received from securities - unaffiliated | 60,972 | |
| Securities on loan, net | + | 19,952 |
| Total investment income | 7,262,635 | |
| Expenses | ||
| Investment adviser and administrator fees | 4,823,124 | |
| Shareholder service fees | 1,464,356 | |
| Portfolio accounting fees | 57,787 | |
| Professional fees | 34,916 | |
| Registration fees | 28,240 | |
| Proxy fees1 | 27,583 | |
| Shareholder reports | 26,876 | |
| Custodian fees | 26,131 | |
| Independent trustees’ fees | 8,407 | |
| Transfer agent fees | 2,899 | |
| Other expenses | + | 10,115 |
| Total expenses | 6,510,434 | |
| Expense reduction | – | 2,899 |
| Net expenses | – | 6,507,535 |
| Net investment income | 755,100 | |
| REALIZED AND UNREALIZED GAINS (LOSSES) | ||
| Net realized gains on sales of securities - unaffiliated | 48,206,692 | |
| Net realized losses on futures contracts | + | (1,094,071) |
| Net realized gains | 47,112,621 | |
| Net change in unrealized appreciation (depreciation) on securities - unaffiliated | (116,646,799) | |
| Net change in unrealized appreciation (depreciation) on futures contracts | + | (87,707) |
| Net change in unrealized appreciation (depreciation) | + | (116,734,506) |
| Net realized and unrealized losses | (69,621,885) | |
| Decrease in net assets resulting from operations | ($68,866,785) | |
| 1 | Proxy fees are non-routine expenses (see financial note 4 for additional information). |
| OPERATIONS | |||
| 11/1/21-10/31/22 | 11/1/20-10/31/21 | ||
| Net investment income | $755,100 | $674,136 | |
| Net realized gains | 47,112,621 | 163,410,747 | |
| Net change in unrealized appreciation (depreciation) | + | (116,734,506) | 107,558,534 |
| Increase (decrease) in net assets resulting from operations | ($68,866,785) | $271,643,417 | |
| DISTRIBUTIONS TO SHAREHOLDERS | |||
| Total distributions | ($73,439,993) | ($1,114,839) | |
| TRANSACTIONS IN FUND SHARES | |||||
| 11/1/21-10/31/22 | 11/1/20-10/31/21 | ||||
| SHARES | VALUE | SHARES | VALUE | ||
| Shares sold | 2,182,967 | $45,773,419 | 2,049,026 | $42,785,760 | |
| Shares reinvested | 2,701,118 | 55,345,927 | 44,417 | 820,369 | |
| Shares redeemed | + | (4,395,790) | (85,701,441) | (6,658,460) | (136,123,410) |
| Net transactions in fund shares | 488,295 | $15,417,905 | (4,565,017) | ($92,517,281) | |
| SHARES OUTSTANDING AND NET ASSETS | |||||
| 11/1/21-10/31/22 | 11/1/20-10/31/21 | ||||
| SHARES | NET ASSETS | SHARES | NET ASSETS | ||
| Beginning of period | 28,163,463 | $669,489,217 | 32,728,480 | $491,477,920 | |
| Total increase (decrease) | + | 488,295 | (126,888,873) | (4,565,017) | 178,011,297 |
| End of period | 28,651,758 | $542,600,344 | 28,163,463 | $669,489,217 | |
| 11/1/21– 10/31/22 | 11/1/20– 10/31/21 | 11/1/19– 10/31/20 | 11/1/18– 10/31/19 | 11/1/17– 10/31/18 | ||
| Per-Share Data | ||||||
| Net asset value at beginning of period | $30.58 | $26.27 | $25.08 | $25.85 | $25.44 | |
| Income (loss) from investment operations: | ||||||
| Net investment income (loss)1 | 0.20 | 0.21 | 0.26 | 0.26 | 0.23 | |
| Net realized and unrealized gains (losses) | (1.13) | 7.09 | 2.11 | 1.27 | 1.96 | |
| Total from investment operations | (0.93) | 7.30 | 2.37 | 1.53 | 2.19 | |
| Less distributions: | ||||||
| Distributions from net investment income | (0.23) | (0.23) | (0.29) | (0.24) | (0.24) | |
| Distributions from net realized gains | (3.34) | (2.76) | (0.89) | (2.06) | (1.54) | |
| Total distributions | (3.57) | (2.99) | (1.18) | (2.30) | (1.78) | |
| Net asset value at end of period | $26.08 | $30.58 | $26.27 | $25.08 | $25.85 | |
| Total return | (3.82%) | 30.02% | 9.57% | 6.51% | 9.13% | |
| Ratios/Supplemental Data | ||||||
| Ratios to average net assets: | ||||||
| Net operating expenses | 0.80% 2 | 0.80% | 0.80% | 0.80% | 0.80% | |
| Gross operating expenses | 0.80% 2 | 0.80% | 0.80% | 0.80% | 0.80% | |
| Net investment income (loss) | 0.76% | 0.76% | 1.01% | 1.05% | 0.91% | |
| Portfolio turnover rate | 59% | 70% | 73% | 45% | 45% | |
| Net assets, end of period (x 1,000) | $829,028 | $901,637 | $745,705 | $778,753 | $825,769 | |
| 1 | Calculated based on the average shares outstanding during the period. |
| 2 | Ratio includes less than 0.005% of non-routine proxy expenses. |
| SECURITY | NUMBER OF SHARES | VALUE ($) |
| COMMON STOCKS 99.6% OF NET ASSETS | ||
| Australia 0.3% | ||
| Ansell Ltd. | 151,541 | 2,735,784 |
| Denmark 2.5% | ||
| Genmab A/S * | 2,297 | 884,822 |
| Novo Nordisk A/S, Class B | 178,806 | 19,441,800 |
| 20,326,622 | ||
| France 2.3% | ||
| EssilorLuxottica S.A. | 10,206 | 1,613,856 |
| Ipsen S.A. | 54,470 | 5,597,762 |
| Sanofi | 137,712 | 11,851,191 |
| 19,062,809 | ||
| Germany 0.3% | ||
| Bayer AG | 42,629 | 2,241,477 |
| Hong Kong 0.4% | ||
| CSPC Pharmaceutical Group Ltd. | 3,632,000 | 3,730,650 |
| Ireland 2.1% | ||
| Medtronic plc | 197,227 | 17,225,806 |
| Japan 3.7% | ||
| Astellas Pharma, Inc. | 189,600 | 2,616,135 |
| Chugai Pharmaceutical Co., Ltd. | 137,300 | 3,181,496 |
| Daiichi Sankyo Co., Ltd. | 100,000 | 3,201,076 |
| Eisai Co., Ltd. | 22,000 | 1,326,669 |
| Hoya Corp. | 91,800 | 8,533,851 |
| JEOL Ltd. | 29,000 | 1,061,202 |
| Kyowa Kirin Co., Ltd. | 36,000 | 847,861 |
| Nihon Kohden Corp. | 85,700 | 1,919,005 |
| Olympus Corp. | 72,900 | 1,537,059 |
| Ono Pharmaceutical Co., Ltd. | 280,400 | 6,598,807 |
| 30,823,161 | ||
| Switzerland 5.5% | ||
| Lonza Group AG | 12,762 | 6,569,672 |
| Novartis AG | 158,884 | 12,852,240 |
| Roche Holding AG | 57,464 | 19,066,447 |
| Sonova Holding AG | 30,701 | 7,256,600 |
| 45,744,959 | ||
| United Kingdom 3.3% | ||
| AstraZeneca plc | 147,669 | 17,326,316 |
| GSK plc | 619,632 | 10,150,238 |
| 27,476,554 | ||
| SECURITY | NUMBER OF SHARES | VALUE ($) |
| United States 79.2% | ||
| Abbott Laboratories | 295,112 | 29,198,381 |
| AbbVie, Inc. | 104,205 | 15,255,612 |
| Agilent Technologies, Inc. | 110,469 | 15,283,386 |
| Amgen, Inc. | 73,265 | 19,807,193 |
| AMN Healthcare Services, Inc. * | 6,906 | 866,703 |
| Avanos Medical, Inc. * | 118,742 | 2,630,135 |
| Axonics, Inc. * | 19,800 | 1,448,172 |
| BioMarin Pharmaceutical, Inc. * | 53,423 | 4,628,035 |
| Bio-Techne Corp. | 20,178 | 5,977,934 |
| Bristol-Myers Squibb Co. | 421,465 | 32,650,894 |
| Catalyst Pharmaceuticals, Inc. * | 364,830 | 5,060,192 |
| Cigna Corp. | 56,278 | 18,181,171 |
| CVS Health Corp. | 245,493 | 23,248,187 |
| Danaher Corp. | 107,240 | 26,989,091 |
| Edwards Lifesciences Corp. * | 9,205 | 666,718 |
| Elanco Animal Health, Inc. * | 93,844 | 1,237,802 |
| Elevance Health, Inc. | 32,134 | 17,569,907 |
| Eli Lilly & Co. | 88,884 | 32,184,008 |
| Exelixis, Inc. * | 222,178 | 3,683,711 |
| Gilead Sciences, Inc. | 301,607 | 23,664,085 |
| Halozyme Therapeutics, Inc. * | 174,247 | 8,330,749 |
| Harmony Biosciences Holdings, Inc. * | 8,478 | 440,856 |
| Hologic, Inc. * | 84,520 | 5,730,456 |
| Horizon Therapeutics plc * | 45,644 | 2,844,534 |
| Humana, Inc. | 10,857 | 6,059,075 |
| Integra LifeSciences Holdings Corp. * | 35,979 | 1,807,945 |
| Intuitive Surgical, Inc. * | 36,759 | 9,059,991 |
| IQVIA Holdings, Inc. * | 59,038 | 12,378,497 |
| Jazz Pharmaceuticals plc * | 13,255 | 1,905,936 |
| Johnson & Johnson | 241,917 | 42,086,301 |
| Laboratory Corp. of America Holdings | 13,434 | 2,980,467 |
| Lantheus Holdings, Inc. * | 14,993 | 1,109,332 |
| McKesson Corp. | 14,150 | 5,509,586 |
| Medpace Holdings, Inc. * | 15,000 | 3,329,700 |
| Merck & Co., Inc. | 390,307 | 39,499,068 |
| Mettler-Toledo International, Inc. * | 9,751 | 12,334,332 |
| Moderna, Inc. * | 90,338 | 13,580,512 |
| Molina Healthcare, Inc. * | 18,418 | 6,609,484 |
| NuVasive, Inc. * | 97,199 | 4,289,392 |
| Pfizer, Inc. | 542,651 | 25,260,404 |
| Prestige Consumer Healthcare, Inc. * | 105,946 | 5,771,938 |
| QIAGEN N.V. * | 31,352 | 1,365,693 |
| Quest Diagnostics, Inc. | 23,885 | 3,431,080 |
| Regeneron Pharmaceuticals, Inc. * | 14,980 | 11,216,275 |
| ResMed, Inc. | 7,304 | 1,633,832 |
| STERIS plc | 7,001 | 1,208,233 |
| Tenet Healthcare Corp. * | 13,425 | 595,533 |
| Thermo Fisher Scientific, Inc. | 35,421 | 18,205,331 |
| United Therapeutics Corp. * | 18,983 | 4,376,151 |
| UnitedHealth Group, Inc. | 101,293 | 56,232,809 |
| Veracyte, Inc. * | 89,093 | 1,791,660 |
| Vertex Pharmaceuticals, Inc. * | 72,451 | 22,604,712 |
| Vir Biotechnology, Inc. * | 129,400 | 2,844,212 |
| Waters Corp. * | 37,131 | 11,108,481 |
| Zimmer Biomet Holdings, Inc. | 109,212 | 12,379,180 |
| SECURITY | NUMBER OF SHARES | VALUE ($) |
| Zoetis, Inc. | 108,276 | 16,325,855 |
| 656,468,909 | ||
| Total Common Stocks (Cost $559,065,545) | 825,836,731 | |
| Total Investments in Securities (Cost $559,065,545) | 825,836,731 | |
| * | Non-income producing security. |
| DESCRIPTION | QUOTED PRICES IN ACTIVE MARKETS FOR IDENTICAL ASSETS (LEVEL 1) | OTHER SIGNIFICANT OBSERVABLE INPUTS (LEVEL 2) | SIGNIFICANT UNOBSERVABLE INPUTS (LEVEL 3) | TOTAL |
| Assets | ||||
| Common Stocks1 | $673,694,715 | $— | $— | $673,694,715 |
| Australia | — | 2,735,784 | — | 2,735,784 |
| Denmark | — | 20,326,622 | — | 20,326,622 |
| France | — | 19,062,809 | — | 19,062,809 |
| Germany | — | 2,241,477 | — | 2,241,477 |
| Hong Kong | — | 3,730,650 | — | 3,730,650 |
| Japan | — | 30,823,161 | — | 30,823,161 |
| Switzerland | — | 45,744,959 | — | 45,744,959 |
| United Kingdom | — | 27,476,554 | — | 27,476,554 |
| Total | $673,694,715 | $152,142,016 | $— | $825,836,731 |
| 1 | As categorized in the Portfolio Holdings. |
| Assets | ||
| Investments in securities, at value - unaffiliated (cost $559,065,545) | $825,836,731 | |
| Cash | 1,897,669 | |
| Receivables: | ||
| Dividends | 900,757 | |
| Foreign tax reclaims | 889,393 | |
| Fund shares sold | 848,665 | |
| Interest | 977 | |
| Prepaid expenses | + | 14,362 |
| Total assets | 830,388,554 | |
| Liabilities | ||
| Payables: | ||
| Fund shares redeemed | 687,529 | |
| Investment adviser and administrator fees | 332,232 | |
| Shareholder service fees | 151,511 | |
| Due to sub-custodian | 12,359 | |
| Independent trustees’ fees | 43 | |
| Accrued expenses | + | 176,818 |
| Total liabilities | 1,360,492 | |
| Net assets | $829,028,062 | |
| Net Assets by Source | ||
| Capital received from investors | $529,862,905 | |
| Total distributable earnings | + | 299,165,157 |
| Net assets | $829,028,062 | |
| Net Asset Value (NAV) | ||||
| Net Assets | ÷ | Shares Outstanding | = | NAV |
| $829,028,062 | 31,782,891 | $26.08 | ||
| For the period November 1, 2021 through October 31, 2022 | ||
| Investment Income | ||
| Dividends received from securities - unaffiliated (net of foreign withholding tax of $353,130) | $13,251,924 | |
| Interest received from securities - unaffiliated | + | 9,004 |
| Total investment income | 13,260,928 | |
| Expenses | ||
| Investment adviser and administrator fees | 4,489,115 | |
| Shareholder service fees | 1,994,351 | |
| Portfolio accounting fees | 99,353 | |
| Custodian fees | 51,237 | |
| Shareholder reports | 50,392 | |
| Proxy fees1 | 38,730 | |
| Registration fees | 37,482 | |
| Professional fees | 33,222 | |
| Independent trustees’ fees | 9,058 | |
| Transfer agent fees | 7,984 | |
| Other expenses | + | 15,815 |
| Total expenses | 6,826,739 | |
| Expense reduction | – | 7,984 |
| Net expenses | – | 6,818,755 |
| Net investment income | 6,442,173 | |
| REALIZED AND UNREALIZED GAINS (LOSSES) | ||
| Net realized gains on sales of securities - unaffiliated | 27,132,567 | |
| Net realized losses on foreign currency transactions | + | (2,417) |
| Net realized gains | 27,130,150 | |
| Net change in unrealized appreciation (depreciation) on securities - unaffiliated | (67,488,611) | |
| Net change in unrealized appreciation (depreciation) on foreign currency translations | + | (117,591) |
| Net change in unrealized appreciation (depreciation) | + | (67,606,202) |
| Net realized and unrealized losses | (40,476,052) | |
| Decrease in net assets resulting from operations | ($34,033,879) | |
| 1 | Proxy fees are non-routine expenses (see financial note 4 for additional information). |
| OPERATIONS | |||
| 11/1/21-10/31/22 | 11/1/20-10/31/21 | ||
| Net investment income | $6,442,173 | $6,385,761 | |
| Net realized gains | 27,130,150 | 98,827,356 | |
| Net change in unrealized appreciation (depreciation) | + | (67,606,202) | 109,531,575 |
| Increase (decrease) in net assets resulting from operations | ($34,033,879) | $214,744,692 | |
| DISTRIBUTIONS TO SHAREHOLDERS | |||
| Total distributions | ($104,700,574) | ($84,424,068) | |
| TRANSACTIONS IN FUND SHARES | |||||
| 11/1/21-10/31/22 | 11/1/20-10/31/21 | ||||
| SHARES | VALUE | SHARES | VALUE | ||
| Shares sold | 2,461,080 | $66,220,931 | 2,830,876 | $80,007,562 | |
| Shares reinvested | 3,264,406 | 91,174,878 | 2,869,075 | 73,390,942 | |
| Shares redeemed | + | (3,426,455) | (91,270,455) | (4,601,633) | (127,787,260) |
| Net transactions in fund shares | 2,299,031 | $66,125,354 | 1,098,318 | $25,611,244 | |
| SHARES OUTSTANDING AND NET ASSETS | |||||
| 11/1/21-10/31/22 | 11/1/20-10/31/21 | ||||
| SHARES | NET ASSETS | SHARES | NET ASSETS | ||
| Beginning of period | 29,483,860 | $901,637,161 | 28,385,542 | $745,705,293 | |
| Total increase (decrease) | + | 2,299,031 | (72,609,099) | 1,098,318 | 155,931,868 |
| End of period | 31,782,891 | $829,028,062 | 29,483,860 | $901,637,161 | |
| 11/1/21– 10/31/22 | 11/1/20– 10/31/21 | 11/1/19– 10/31/20 | 11/1/18– 10/31/19 | 11/1/17– 10/31/18 | ||
| Per-Share Data | ||||||
| Net asset value at beginning of period | $11.55 | $9.11 | $10.04 | $9.64 | $11.27 | |
| Income (loss) from investment operations: | ||||||
| Net investment income (loss)1 | 0.34 | 0.21 | 0.14 | 0.24 | 0.24 | |
| Net realized and unrealized gains (losses) | (2.86) | 2.34 | (0.71) | 0.41 | (1.58) | |
| Total from investment operations | (2.52) | 2.55 | (0.57) | 0.65 | (1.34) | |
| Less distributions: | ||||||
| Distributions from net investment income | (0.32) | (0.11) | (0.36) | (0.25) | (0.26) | |
| Distributions from net realized gains | — | — | — | — | (0.03) | |
| Total distributions | (0.32) | (0.11) | (0.36) | (0.25) | (0.29) | |
| Net asset value at end of period | $8.71 | $11.55 | $9.11 | $10.04 | $9.64 | |
| Total return | (22.40%) | 28.12% | (6.01%) | 7.08% | (12.18%) | |
| Ratios/Supplemental Data | ||||||
| Ratios to average net assets: | ||||||
| Net operating expenses | 0.86% 2 | 0.86% | 0.86% | 0.86% | 0.86% | |
| Gross operating expenses | 0.89% 2 | 0.86% | 0.88% | 0.87% | 0.89% | |
| Net investment income (loss) | 3.40% | 1.93% | 1.51% | 2.44% | 2.22% | |
| Portfolio turnover rate | 94% | 103% | 97% | 91% | 98% | |
| Net assets, end of period (x 1,000) | $507,380 | $692,619 | $664,487 | $975,511 | $1,166,280 | |
| 1 | Calculated based on the average shares outstanding during the period. |
| 2 | Ratio includes less than 0.005% of non-routine proxy expenses. |
| SECURITY | NUMBER OF SHARES | VALUE ($) |
| COMMON STOCKS 97.4% OF NET ASSETS | ||
| Australia 7.3% | ||
| Aristocrat Leisure Ltd. | 195,174 | 4,632,638 |
| Australia & New Zealand Banking Group Ltd. | 308,667 | 5,057,119 |
| BHP Group Ltd. | 264,228 | 6,346,810 |
| Commonwealth Bank of Australia | 38,688 | 2,593,905 |
| Fortescue Metals Group Ltd. | 103,861 | 978,475 |
| Genworth Mortgage Insurance Australia Ltd. | 321,522 | 558,112 |
| JB Hi-Fi Ltd. | 60,314 | 1,653,324 |
| Origin Energy Ltd. | 346,914 | 1,239,377 |
| QBE Insurance Group Ltd. | 176,098 | 1,379,721 |
| Rio Tinto Ltd. | 78,202 | 4,437,932 |
| Sonic Healthcare Ltd. | 147,750 | 3,093,218 |
| South32 Ltd. | 1,131,324 | 2,595,560 |
| Suncorp Group Ltd. | 316,867 | 2,317,885 |
| 36,884,076 | ||
| Austria 0.6% | ||
| Erste Group Bank AG | 33,073 | 815,082 |
| Wienerberger AG | 99,268 | 2,269,148 |
| 3,084,230 | ||
| Brazil 0.1% | ||
| JBS S.A. | 136,300 | 658,610 |
| Canada 1.9% | ||
| Cenovus Energy, Inc. | 108,000 | 2,183,228 |
| CGI, Inc. * | 38,509 | 3,101,977 |
| Loblaw Cos., Ltd. | 37,160 | 3,044,591 |
| Suncor Energy, Inc. | 45,200 | 1,554,719 |
| 9,884,515 | ||
| Denmark 4.1% | ||
| AP Moller - Maersk A/S, Class B | 834 | 1,742,369 |
| Carlsberg A/S, Class B | 17,452 | 2,054,896 |
| Novo Nordisk A/S, Class B | 154,198 | 16,766,141 |
| 20,563,406 | ||
| Finland 0.2% | ||
| Sampo Oyj, A Shares | 19,928 | 911,262 |
| France 14.6% | ||
| Air Liquide S.A. | 19,938 | 2,608,163 |
| BNP Paribas S.A. | 35,323 | 1,656,432 |
| Capgemini SE | 17,943 | 2,940,691 |
| Cie de Saint-Gobain | 118,432 | 4,841,610 |
| Credit Agricole S.A. | 75,415 | 684,290 |
| Dassault Aviation S.A. | 34,141 | 5,070,564 |
| SECURITY | NUMBER OF SHARES | VALUE ($) |
| Eiffage S.A. | 61,687 | 5,577,848 |
| Engie S.A. | 476,133 | 6,186,564 |
| Hermes International | 1,212 | 1,568,795 |
| Ipsen S.A. | 6,510 | 669,018 |
| L'Oreal S.A. | 19,511 | 6,126,535 |
| LVMH Moet Hennessy Louis Vuitton SE | 23,682 | 14,943,214 |
| Pernod-Ricard S.A. | 21,211 | 3,722,767 |
| Sanofi | 24,076 | 2,071,927 |
| Societe Generale S.A. | 111,673 | 2,561,446 |
| Thales S.A. | 28,605 | 3,637,981 |
| TotalEnergies SE | 167,289 | 9,126,176 |
| 73,994,021 | ||
| Germany 6.1% | ||
| Bayer AG | 22,689 | 1,193,011 |
| Bayerische Motoren Werke AG | 42,033 | 3,299,249 |
| Deutsche Post AG | 57,879 | 2,046,010 |
| Deutsche Telekom AG | 565,352 | 10,671,293 |
| Hugo Boss AG | 52,088 | 2,399,035 |
| Mercedes-Benz Group AG | 73,492 | 4,253,831 |
| Merck KGaA | 17,342 | 2,826,139 |
| RWE AG | 114,374 | 4,402,843 |
| 31,091,411 | ||
| Greece 0.6% | ||
| Hellenic Telecommunications Organization S.A. | 204,286 | 3,208,218 |
| Hong Kong 0.8% | ||
| CK Asset Holdings Ltd. | 524,000 | 2,896,969 |
| CK Infrastructure Holdings Ltd. | 101,000 | 479,823 |
| Sino Land Co., Ltd. | 460,000 | 491,195 |
| 3,867,987 | ||
| Italy 1.6% | ||
| Assicurazioni Generali S.p.A. | 61,244 | 919,095 |
| Eni S.p.A. | 351,371 | 4,614,807 |
| UniCredit S.p.A. | 187,662 | 2,327,246 |
| 7,861,148 | ||
| Japan 19.9% | ||
| Advantest Corp. | 29,000 | 1,526,606 |
| Bandai Namco Holdings, Inc. | 29,000 | 1,916,983 |
| Central Glass Co., Ltd. | 88,000 | 2,077,912 |
| Dai-ichi Life Holdings, Inc. | 220,000 | 3,494,204 |
| DMG Mori Co., Ltd. | 248,000 | 2,870,010 |
| Electric Power Development Co., Ltd. | 76,000 | 1,056,985 |
| Fujikura Ltd. | 208,800 | 1,236,300 |
| Hokkaido Electric Power Co., Inc. | 159,300 | 484,746 |
| Honda Motor Co., Ltd. | 70,000 | 1,596,173 |
| Hoya Corp. | 52,003 | 4,834,268 |
| Inpex Corp. | 267,000 | 2,694,670 |
| Invincible Investment Corp. | 5,460 | 1,713,967 |
| SECURITY | NUMBER OF SHARES | VALUE ($) |
| Japan Post Holdings Co., Ltd. | 777,300 | 5,227,013 |
| Japan Tobacco, Inc. | 382,782 | 6,410,614 |
| KDDI Corp. | 137,200 | 4,055,216 |
| Keyence Corp. | 12,900 | 4,864,139 |
| Lawson, Inc. | 21,100 | 674,082 |
| Marubeni Corp. | 241,000 | 2,109,693 |
| Meitec Corp. | 160,500 | 2,703,428 |
| NGK Spark Plug Co., Ltd. | 114,000 | 2,079,822 |
| Nikon Corp. | 197,000 | 1,905,213 |
| Nintendo Co., Ltd. | 74,000 | 3,004,333 |
| Nippon Building Fund, Inc. | 799 | 3,551,749 |
| Nippon Gas Co., Ltd. | 130,700 | 1,898,679 |
| Ono Pharmaceutical Co., Ltd. | 83,500 | 1,965,051 |
| ORIX Corp. | 399,700 | 5,870,670 |
| Recruit Holdings Co., Ltd. | 111,200 | 3,421,754 |
| Sankyu, Inc. | 114,200 | 3,405,067 |
| SCREEN Holdings Co., Ltd. | 45,900 | 2,519,309 |
| Seino Holdings Co., Ltd. | 282,000 | 2,166,834 |
| Senko Group Holdings Co., Ltd. | 168,000 | 1,122,224 |
| Shimamura Co., Ltd. | 14,400 | 1,164,490 |
| Shin-Etsu Chemical Co., Ltd. | 41,700 | 4,333,878 |
| Sumitomo Forestry Co., Ltd. | 102,000 | 1,595,644 |
| Suntory Beverage & Food Ltd. | 76,500 | 2,559,436 |
| Takeda Pharmaceutical Co., Ltd. | 78,500 | 2,073,106 |
| Tokyotokeiba Co., Ltd. | 44,800 | 1,247,287 |
| Tokyu REIT, Inc. | 1,601 | 2,280,371 |
| Toyota Motor Corp. | 101,800 | 1,412,434 |
| 101,124,360 | ||
| Netherlands 5.4% | ||
| ASML Holding N.V. | 16,157 | 7,579,032 |
| Koninklijke Ahold Delhaize N.V. | 283,787 | 7,914,327 |
| OCI N.V. | 121,433 | 4,644,556 |
| Stellantis N.V. | 148,492 | 2,003,390 |
| Wolters Kluwer N.V. | 49,762 | 5,287,636 |
| 27,428,941 | ||
| Norway 1.8% | ||
| DNO A.S.A. | 1,660,442 | 2,159,792 |
| Equinor A.S.A. | 197,347 | 7,190,085 |
| 9,349,877 | ||
| Republic of Korea 1.8% | ||
| Kia Corp. | 52,747 | 2,451,195 |
| Samsung Electro-Mechanics Co., Ltd. | 6,004 | 508,488 |
| Samsung Electronics Co., Ltd. | 112,168 | 4,668,412 |
| Samsung SDI Co., Ltd. | 3,254 | 1,678,787 |
| 9,306,882 | ||
| Singapore 0.6% | ||
| Jardine Cycle & Carriage Ltd. | 145,500 | 3,056,032 |
| Spain 2.5% | ||
| Banco Santander S.A. (a) | 1,956,502 | 5,074,140 |
| Iberdrola S.A. | 506,451 | 5,150,239 |
| Repsol S.A. | 169,613 | 2,307,494 |
| 12,531,873 | ||
| Sweden 1.3% | ||
| Atlas Copco AB, A Shares | 110,418 | 1,178,519 |
| Nordea Bank Abp | 488,290 | 4,664,398 |
| SECURITY | NUMBER OF SHARES | VALUE ($) |
| Telefonaktiebolaget LM Ericsson, B Shares | 126,417 | 702,796 |
| 6,545,713 | ||
| Switzerland 10.1% | ||
| Cie Financiere Richemont S.A., Class A | 49,500 | 4,837,809 |
| Mobilezone Holding AG | 37,011 | 586,982 |
| Nestle S.A. | 106,712 | 11,616,540 |
| Novartis AG | 122,819 | 9,934,916 |
| Roche Holding AG | 48,873 | 16,215,970 |
| Sonova Holding AG | 5,961 | 1,408,964 |
| UBS Group AG | 432,276 | 6,853,369 |
| 51,454,550 | ||
| Taiwan 0.4% | ||
| Taiwan Semiconductor Manufacturing Co., Ltd. | 176,000 | 2,115,908 |
| United Kingdom 15.7% | ||
| Airtel Africa plc | 1,296,071 | 1,677,640 |
| Anglo American plc | 114,396 | 3,426,641 |
| AstraZeneca plc | 64,895 | 7,614,268 |
| BAE Systems plc | 645,680 | 6,039,409 |
| Centrica plc | 5,648,329 | 4,963,249 |
| Diageo plc | 229,839 | 9,458,441 |
| Glencore plc | 252,972 | 1,450,306 |
| GSK plc | 307,590 | 5,038,656 |
| Howden Joinery Group plc | 292,851 | 1,725,066 |
| HSBC Holdings plc | 1,381,205 | 7,088,412 |
| Imperial Brands plc | 267,305 | 6,511,301 |
| Investec plc | 921,614 | 4,618,846 |
| Land Securities Group plc | 194,625 | 1,272,630 |
| Legal & General Group plc | 996,297 | 2,665,353 |
| Man Group plc | 1,472,933 | 3,664,078 |
| Plus500 Ltd. | 55,752 | 1,154,051 |
| Reckitt Benckiser Group plc | 48,920 | 3,246,525 |
| RELX plc | 18,767 | 504,091 |
| Rio Tinto plc | 31,784 | 1,661,083 |
| Shell plc | 122,004 | 3,379,704 |
| Unilever plc | 49,748 | 2,261,262 |
| 79,421,012 | ||
| Total Common Stocks (Cost $512,004,437) | 494,344,032 | |
| SECURITY | NUMBEROF SHARES | VALUE ($) |
| SHORT-TERM INVESTMENTS 3.5% OF NET ASSETS | ||
| Money Market Funds 3.5% | ||
| State Street Institutional U.S. Government Money Market Fund, Premier Class 3.01% (b) | 12,946,847 | 12,946,847 |
| State Street Institutional U.S. Government Money Market Fund, Premier Class 3.01% (b)(c) | 4,656,400 | 4,656,400 |
| 17,603,247 | ||
| Total Short-Term Investments (Cost $17,603,247) | 17,603,247 | |
| Total Investments in Securities (Cost $529,607,684) | 511,947,279 | |
| * | Non-income producing security. |
| (a) | All or a portion of this security is on loan. Securities on loan were valued at $4,312,951. |
| (b) | The rate shown is the annualized 7-day yield. |
| (c) | Security purchased with cash collateral received for securities on loan. |
| REIT — | Real Estate Investment Trust |
| DESCRIPTION | QUOTED PRICES IN ACTIVE MARKETS FOR IDENTICAL ASSETS (LEVEL 1) | OTHER SIGNIFICANT OBSERVABLE INPUTS (LEVEL 2) | SIGNIFICANT UNOBSERVABLE INPUTS (LEVEL 3) | TOTAL |
| Assets | ||||
| Common Stocks1 | $— | $404,379,895 | $— | $404,379,895 |
| Brazil | 658,610 | — | — | 658,610 |
| Canada | 9,884,515 | — | — | 9,884,515 |
| United Kingdom | 1,154,051 | 78,266,961 | — | 79,421,012 |
| Short-Term Investments1 | 17,603,247 | — | — | 17,603,247 |
| Total | $29,300,423 | $482,646,856 | $— | $511,947,279 |
| 1 | As categorized in the Portfolio Holdings. |
| Assets | ||
| Investments in securities, at value - unaffiliated (cost $529,607,684) including securities on loan of $4,312,951 | $511,947,279 | |
| Foreign currency, at value (cost $544,231) | 543,425 | |
| Deposit with broker for futures contracts | 830,882 | |
| Receivables: | ||
| Foreign tax reclaims | 1,096,772 | |
| Dividends | 1,042,624 | |
| Investments sold | 287,934 | |
| Fund shares sold | 243,400 | |
| Income from securities on loan | 3,448 | |
| Prepaid expenses | + | 12,762 |
| Total assets | 516,008,526 | |
| Liabilities | ||
| Collateral held for securities on loan | 4,656,400 | |
| Payables: | ||
| Fund shares redeemed | 2,933,697 | |
| Investments bought | 490,615 | |
| Investment adviser and administrator fees | 217,894 | |
| Shareholder service fees | 94,842 | |
| Independent trustees’ fees | 39 | |
| Accrued expenses | + | 234,992 |
| Total liabilities | 8,628,479 | |
| Net assets | $507,380,047 | |
| Net Assets by Source | ||
| Capital received from investors | $618,882,093 | |
| Total distributable loss | + | (111,502,046) |
| Net assets | $507,380,047 | |
| Net Asset Value (NAV) | ||||
| Net Assets | ÷ | Shares Outstanding | = | NAV |
| $507,380,047 | 58,267,915 | $8.71 | ||
| For the period November 1, 2021 through October 31, 2022 | ||
| Investment Income | ||
| Dividends received from securities - unaffiliated (net of foreign withholding tax of $2,344,443) | $25,628,161 | |
| Interest received from securities - unaffiliated (net of foreign withholding tax of $4) | 163,645 | |
| Securities on loan, net | + | 111,106 |
| Total investment income | 25,902,912 | |
| Expenses | ||
| Investment adviser and administrator fees | 3,525,060 | |
| Shareholder service fees | 1,501,221 | |
| Portfolio accounting fees | 97,400 | |
| Custodian fees | 94,011 | |
| Professional fees | 47,631 1 | |
| Shareholder reports | 31,057 | |
| Proxy fees2 | 28,666 | |
| Registration fees | 27,326 | |
| Transfer agent fees | 14,996 | |
| Independent trustees’ fees | 8,446 | |
| Other expenses | + | 14,237 |
| Total expenses | 5,390,051 | |
| Expense reduction | – | 133,495 1 |
| Net expenses | – | 5,256,556 |
| Net investment income | 20,646,356 | |
| REALIZED AND UNREALIZED GAINS (LOSSES) | ||
| Net realized losses on sales of securities - unaffiliated | (33,748,621) | |
| Net realized losses on futures contracts | (212,919) | |
| Net realized losses on foreign currency transactions | + | (772,637) |
| Net realized losses | (34,734,177) | |
| Net change in unrealized appreciation (depreciation) on securities - unaffiliated | (139,410,764) | |
| Net change in unrealized appreciation (depreciation) on foreign currency translations | + | (155,194) |
| Net change in unrealized appreciation (depreciation) | + | (139,565,958) |
| Net realized and unrealized losses | (174,300,135) | |
| Decrease in net assets resulting from operations | ($153,653,779) | |
| 1 | Includes professional fees of $8,059 associated with the filing of tax claims in the European Union deemed to be non-contingent and non-routine expenses of the fund (see financial notes 2(d) and 4 for additional information). |
| 2 | Proxy fees are non-routine expenses (see financial note 4 for additional information). |
| OPERATIONS | |||
| 11/1/21-10/31/22 | 11/1/20-10/31/21 | ||
| Net investment income | $20,646,356 | $13,811,857 | |
| Net realized gains (losses) | (34,734,177) | 108,593,613 | |
| Net change in unrealized appreciation (depreciation) | + | (139,565,958) | 55,427,976 |
| Increase (decrease) in net assets resulting from operations | ($153,653,779) | $177,833,446 | |
| DISTRIBUTIONS TO SHAREHOLDERS | |||
| Total distributions | ($19,624,124) | ($7,674,015) | |
| TRANSACTIONS IN FUND SHARES | |||||
| 11/1/21-10/31/22 | 11/1/20-10/31/21 | ||||
| SHARES | VALUE | SHARES | VALUE | ||
| Shares sold | 7,796,290 | $80,239,327 | 4,866,510 | $53,723,390 | |
| Shares reinvested | 1,446,960 | 16,191,478 | 602,440 | 6,235,261 | |
| Shares redeemed | + | (10,921,575) | (108,391,973) | (18,494,429) | (201,985,524) |
| Net transactions in fund shares | (1,678,325) | ($11,961,168) | (13,025,479) | ($142,026,873) | |
| SHARES OUTSTANDING AND NET ASSETS | |||||
| 11/1/21-10/31/22 | 11/1/20-10/31/21 | ||||
| SHARES | NET ASSETS | SHARES | NET ASSETS | ||
| Beginning of period | 59,946,240 | $692,619,118 | 72,971,719 | $664,486,560 | |
| Total increase (decrease) | + | (1,678,325) | (185,239,071) | (13,025,479) | 28,132,558 |
| End of period | 58,267,915 | $507,380,047 | 59,946,240 | $692,619,118 | |
| SCHWAB CAPITAL TRUST (ORGANIZED MAY 7, 1993) | |
| Schwab Core Equity Fund | Schwab Target 2045 Fund |
| Schwab Dividend Equity Fund | Schwab Target 2050 Fund |
| Schwab Large-Cap Growth Fund | Schwab Target 2055 Fund |
| Schwab Small-Cap Equity Fund | Schwab Target 2060 Fund |
| Schwab Health Care Fund | Schwab Target 2065 Fund |
| Schwab International Core Equity Fund | Schwab Fundamental US Large Company Index Fund |
| Schwab S&P 500 Index Fund | Schwab Fundamental US Small Company Index Fund |
| Schwab Small-Cap Index Fund® | Schwab Fundamental International Large Company Index Fund |
| Schwab Total Stock Market Index Fund® | Schwab Fundamental International Small Company Index Fund |
| Schwab U.S. Large-Cap Growth Index Fund | Schwab Fundamental Emerging Markets Large Company Index Fund |
| Schwab U.S. Large-Cap Value Index Fund | Schwab Fundamental Global Real Estate Index Fund |
| Schwab U.S. Mid-Cap Index Fund | Schwab Target 2010 Index Fund |
| Schwab International Index Fund® | Schwab Target 2015 Index Fund |
| Schwab MarketTrack All Equity Portfolio™ | Schwab Target 2020 Index Fund |
| Schwab MarketTrack Growth Portfolio™ | Schwab Target 2025 Index Fund |
| Schwab MarketTrack Balanced Portfolio™ | Schwab Target 2030 Index Fund |
| Schwab MarketTrack Conservative Portfolio™ | Schwab Target 2035 Index Fund |
| Schwab International Opportunities Fund | Schwab Target 2040 Index Fund |
| Schwab Balanced Fund | Schwab Target 2045 Index Fund |
| Schwab Target 2010 Fund | Schwab Target 2050 Index Fund |
| Schwab Target 2015 Fund | Schwab Target 2055 Index Fund |
| Schwab Target 2020 Fund | Schwab Target 2060 Index Fund |
| Schwab Target 2025 Fund | Schwab Target 2065 Index Fund |
| Schwab Target 2030 Fund | Schwab Monthly Income Fund - Target Payout |
| Schwab Target 2035 Fund | Schwab Monthly Income Fund - Flexible Payout |
| Schwab Target 2040 Fund | Schwab Monthly Income Fund - Income Payout |
| 4. Affiliates and Affiliated Transactions: |
| % OF AVERAGE DAILY NET ASSETS | SCHWAB CORE EQUITY FUND | SCHWAB DIVIDEND EQUITY FUND | SCHWAB LARGE-CAP GROWTH FUND | SCHWAB SMALL-CAP EQUITY FUND | SCHWAB INTERNATIONAL CORE EQUITY FUND |
| Flat rate | 0.47% | 0.62% | 0.72% | 0.81% | 0.58% |
| % OF AVERAGE DAILY NET ASSETS | SCHWAB HEALTH CARE FUND |
| First $500 million | 0.54% |
| $500 million to $1 billion | 0.515% |
| Over $1 billion | 0.49% |
| SCHWAB CORE EQUITY FUND | SCHWAB DIVIDEND EQUITY FUND | SCHWAB LARGE-CAP GROWTH FUND | SCHWAB SMALL-CAP EQUITY FUND | SCHWAB HEALTH CARE FUND | SCHWAB INTERNATIONAL CORE EQUITY FUND |
| 0.75% | 0.89% | 0.99% | 1.12% | 0.82% | 0.86% |
| UNDERLYING FUNDS | |||
| SCHWAB CORE EQUITY FUND | SCHWAB SMALL-CAP EQUITY FUND | SCHWAB INTERNATIONAL CORE EQUITY FUND | |
| Schwab Balanced Fund | 13.3% | 10.2% | —% |
| Schwab Target 2010 Fund | 0.1% | 0.1% | 0.3% |
| Schwab Target 2015 Fund | 0.1% | 0.2% | 0.5% |
| Schwab Target 2020 Fund | 0.7% | 1.1% | 3.4% |
| Schwab Target 2025 Fund | 1.1% | 2.0% | 5.7% |
| Schwab Target 2030 Fund | 2.6% | 5.0% | 12.9% |
| Schwab Target 2035 Fund | 1.5% | 3.6% | 7.8% |
| Schwab Target 2040 Fund | 3.3% | 8.0% | 16.4% |
| Schwab Target 2045 Fund | 0.7% | 2.1% | 3.7% |
| Schwab Target 2050 Fund | 0.7% | 2.2% | 4.0% |
| Schwab Target 2055 Fund | 0.5% | 1.5% | 2.8% |
| Schwab Target 2060 Fund | 0.2% | 0.4% | 0.8% |
| Schwab Target 2065 Fund | 0.0%* | 0.1% | 0.1% |
| * | Less than 0.05% |
| PURCHASE COST | SALE PROCEEDS | REALIZED GAINS (LOSSES) | |
| Schwab Core Equity Fund | $— | $— | $— |
| Schwab Dividend Equity Fund | — | 897,419 | (215,231) |
| Schwab Large-Cap Growth Fund | — | — | — |
| Schwab Small-Cap Equity Fund | — | 44,900 | 22,309 |
| Schwab Health Care Fund | — | — | — |
| Schwab International Core Equity Fund | — | — | — |
| 7. Purchases and Sales of Investment Securities: |
| PURCHASES OF SECURITIES | SALES OF SECURITIES | |
| Schwab Core Equity Fund | $414,349,370 | $780,574,609 |
| Schwab Dividend Equity Fund | 159,028,506 | 267,387,267 |
| Schwab Large-Cap Growth Fund | 47,256,269 | 51,705,048 |
| Schwab Small-Cap Equity Fund | 435,754,313 | 492,042,044 |
| Schwab Health Care Fund | 500,492,097 | 532,816,624 |
| Schwab International Core Equity Fund | 557,678,033 | 580,244,949 |
| NOTIONAL AMOUNTS | NUMBER OF CONTRACTS | |
| Schwab Core Equity Fund | $20,417,452* | 88* |
| Schwab Dividend Equity Fund | 2,891,277* | 14* |
| Schwab Large-Cap Growth Fund | 1,268,019 | 6 |
| Schwab Small-Cap Equity Fund | 1,922,402 | 17 |
| Schwab Health Care Fund | — | — |
| Schwab International Core Equity Fund | 2,738,123 | 24 |
| * | During the period, the fund did not hold futures contracts at any month-end. The average value and number of contracts were calculated by aggregating the highest daily values held each month during the period. |
| TAX COST | GROSS UNREALIZED APPRECIATION | GROSS UNREALIZED DEPRECIATION | NET UNREALIZED APPRECIATION (DEPRECIATION) | |
| Schwab Core Equity Fund | $1,008,324,332 | $355,219,915 | ($93,878,142) | $261,341,773 |
| Schwab Dividend Equity Fund | 457,126,283 | 86,608,054 | (22,621,302) | 63,986,752 |
| Schwab Large-Cap Growth Fund | 129,997,745 | 95,136,345 | (11,843,572) | 83,292,773 |
| Schwab Small-Cap Equity Fund | 520,891,682 | 91,998,452 | (75,183,113) | 16,815,339 |
| Schwab Health Care Fund | 561,027,188 | 283,715,176 | (18,905,633) | 264,809,543 |
| Schwab International Core Equity Fund | 530,565,748 | 37,834,286 | (56,452,755) | (18,618,469) |
| UNDISTRIBUTED ORDINARY INCOME | UNDISTRIBUTED LONG-TERM CAPITAL GAINS | NET UNREALIZED APPRECIATION (DEPRECIATION) ON INVESTMENTS | NET OTHER UNREALIZED APPRECIATION (DEPRECIATION) | CAPITAL LOSS CARRYFORWARDS AND OTHER LOSSES | TOTAL | |
| Schwab Core Equity Fund | $13,779,061 | $161,212,121 | $261,341,773 | $— | $— | $436,332,955 |
| Schwab Dividend Equity Fund | 1,165,643 | 23,230,303 | 63,986,752 | (13,582) | — | 88,369,116 |
| Schwab Large-Cap Growth Fund | — | 4,291,751 | 83,292,773 | — | (80,845) | 87,503,679 |
| Schwab Small-Cap Equity Fund | 216,053 | 47,501,473 | 16,815,339 | — | — | 64,532,865 |
| Schwab Health Care Fund | 6,001,093 | 28,428,704 | 264,809,543 | (74,183) | — | 299,165,157 |
| Schwab International Core Equity Fund | 16,771,074 | — | (18,618,469) | (133,208) | (109,521,443) | (111,502,046) |
| Schwab Core Equity Fund | $— |
| Schwab Dividend Equity Fund | — |
| Schwab Large-Cap Growth Fund | — |
| Schwab Small-Cap Equity Fund | — |
| Schwab Health Care Fund | — |
| Schwab International Core Equity Fund | 109,521,443 |
| CURRENT FISCAL YEAR END DISTRIBUTIONS | PRIOR FISCAL YEAR END DISTRIBUTIONS | |||
| ORDINARY INCOME | LONG-TERM CAPITAL GAINS | ORDINARY INCOME | LONG-TERM CAPITAL GAINS | |
| Schwab Core Equity Fund | $194,345,554 | $244,997,607 | $17,230,074 | $80,768,682 |
| Schwab Dividend Equity Fund | 30,011,611 | 67,753,779 | 13,599,106 | — |
| Schwab Large-Cap Growth Fund | 5,704,425 | 16,459,451 | — | 2,530,978 |
| Schwab Small-Cap Equity Fund | 825,168 | 72,614,825 | 1,114,839 | — |
| Schwab Health Care Fund | 28,840,838 | 75,859,736 | 6,419,244 | 78,004,824 |
| Schwab International Core Equity Fund | 19,624,124 | — | 7,674,015 | — |
Denver, Colorado
December 16, 2022
| Schwab Core Equity Fund | 15.52% |
| Schwab Dividend Equity Fund | 68.73% |
| Schwab Large-Cap Growth Fund | 29.12% |
| Schwab Small-Cap Equity Fund | 100.00% |
| Schwab Health Care Fund | 37.88% |
| Schwab International Core Equity Fund | —% |
| Schwab Core Equity Fund | $31,580,500 |
| Schwab Dividend Equity Fund | 21,729,739 |
| Schwab Large-Cap Growth Fund | 1,863,412 |
| Schwab Small-Cap Equity Fund | 825,168 |
| Schwab Health Care Fund | 13,467,930 |
| Schwab International Core Equity Fund | 19,624,124 |
| Schwab Core Equity Fund | $244,997,607 |
| Schwab Dividend Equity Fund | 67,753,779 |
| Schwab Large-Cap Growth Fund | 16,459,451 |
| Schwab Small-Cap Equity Fund | 72,614,825 |
| Schwab Health Care Fund | 75,859,736 |
| Schwab International Core Equity Fund | — |
| Schwab Core Equity Fund | $1,271,668 |
| Schwab Dividend Equity Fund | 981,810 |
| Schwab Large-Cap Growth Fund | 110,998 |
| Schwab Small-Cap Equity Fund | — |
| Schwab Health Care Fund | — |
| Schwab International Core Equity Fund | — |
| Proposal – To elect each of the following individuals as trustees of the Trust: | For | Withheld |
| Walter W. Bettinger II | 1,095,577,106.505 | 115,838,980.968 |
| Richard A. Wurster | 1,117,598,789.555 | 93,817,297.918 |
| Michael J. Beer | 1,116,890,447.505 | 94,525,639.968 |
| Robert W. Burns | 1,117,915,860.110 | 93,500,227.363 |
| Nancy F. Heller | 1,119,878,732.134 | 91,537,355.339 |
| David L. Mahoney | 1,069,125,022.434 | 142,291,065.039 |
| Jane P. Moncreiff | 1,120,187,927.838 | 91,228,159.635 |
| Kiran M. Patel | 1,116,689,111.571 | 94,726,975.902 |
| Kimberly S. Patmore | 1,119,941,056.059 | 91,475,031.414 |
| J. Derek Penn | 1,117,666,014.121 | 93,750,073.352 |
| 1. | the nature, extent and quality of the services provided to each Fund under the Agreement, including the resources of the investment adviser and its affiliates dedicated to the Funds; |
| 2. | each Fund’s investment performance and how it compared to that of certain other comparable mutual funds and benchmark data; |
| 3. | each Fund’s expenses and how those expenses compared to those of certain other similar mutual funds; |
| 4. | the profitability of the investment adviser and its affiliates, including Charles Schwab & Co., Inc. (Schwab), with respect to each Fund, including both direct and indirect benefits accruing to the investment adviser and its affiliates; and |
| 5. | the extent to which economies of scale would be realized as each Fund grows and whether fee levels in the Agreement reflect those economies of scale for the benefit of Fund investors. |
| Independent Trustees | |||
| Name, Year of Birth, and Position(s) with the trust (Terms of office, and length of Time Served1) | Principal Occupations During the Past Five Years | Number of Portfolios in Fund Complex Overseen by the Trustee | Other Directorships |
Michael J. Beer 1961 Trustee (Trustee of The Charles Schwab Family of Funds, Schwab Investments, Schwab Capital Trust, Schwab Annuity Portfolios, Schwab Strategic Trust and Laudus Trust since 2022) | Retired. Director, President and Chief Executive Officer (Dec. 2016 – Sept. 2019), Principal Funds (investment management). | 105 | Director (2016 – 2019), Principal Funds, Inc. |
| Robert W. Burns 1959 Trustee (Trustee of Schwab Strategic Trust since 2009; The Charles Schwab Family of Funds, Schwab Investments, Schwab Capital Trust, Schwab Annuity Portfolios and Laudus Trust since 2016) | Retired/Private Investor. | 105 | None |
| Nancy F. Heller 1956 Trustee (Trustee of The Charles Schwab Family of Funds, Schwab Investments, Schwab Capital Trust, Schwab Annuity Portfolios, Schwab Strategic Trust and Laudus Trust since 2018) | Retired. | 105 | None |
| David L. Mahoney 1954 Trustee (Trustee of The Charles Schwab Family of Funds, Schwab Investments, Schwab Capital Trust, Schwab Annuity Portfolios and Laudus Trust since 2011; Schwab Strategic Trust since 2016) | Private Investor. | 105 | Director (2004 – present), Corcept Therapeutics Incorporated Director (2009 – 2021), Adamas Pharmaceuticals, Inc. Director (2003 – 2019), Symantec Corporation |
| Jane P. Moncreiff 1961 Trustee (Trustee of The Charles Schwab Family of Funds, Schwab Investments, Schwab Capital Trust, Schwab Annuity Portfolios, Schwab Strategic Trust and Laudus Trust since 2019) | Consultant (2018 – present), Fulham Advisers LLC (management consulting); Chief Investment Officer (2009 – 2017), CareGroup Healthcare System, Inc. (healthcare). | 105 | None |
| Independent Trustees (continued) | |||
| Name, Year of Birth, and Position(s) with the trust (Terms of office, and length of Time Served1) | Principal Occupations During the Past Five Years | Number of Portfolios in Fund Complex Overseen by the Trustee | Other Directorships |
| Kiran M. Patel 1948 Trustee (Trustee of The Charles Schwab Family of Funds, Schwab Investments, Schwab Capital Trust, Schwab Annuity Portfolios and Laudus Trust since 2011; Schwab Strategic Trust since 2016) | Retired. | 105 | Director (2008 – present), KLA-Tencor Corporation |
| Kimberly S. Patmore 1956 Trustee (Trustee of The Charles Schwab Family of Funds, Schwab Investments, Schwab Capital Trust, Schwab Annuity Portfolios, Schwab Strategic Trust and Laudus Trust since 2016) | Consultant (2008 – present), Patmore Management Consulting (management consulting). | 105 | None |
J. Derek Penn 1957 Trustee (Trustee of The Charles Schwab Family of Funds, Schwab Investments, Schwab Capital Trust, Schwab Annuity Portfolios, Schwab Strategic Trust and Laudus Trust since 2021) | Head of Equity Sales and Trading (2006 – 2018), BNY Mellon (financial services). | 105 | None |
| Interested Trustees | |||
| Name, Year of Birth, and Position(s) with the trust (Terms of office, and length of Time Served1) | Principal Occupations During the Past Five Years | Number of Portfolios in Fund Complex Overseen by the Trustee | Other Directorships |
| Walter W. Bettinger II2 1960 Chairman and Trustee (Trustee of The Charles Schwab Family of Funds, Schwab Investments, Schwab Capital Trust and Schwab Annuity Portfolios since 2008; Schwab Strategic Trust since 2009; Laudus Trust since 2010) | Co-Chairman of the Board (July 2022 – present), Director and Chief Executive Officer (Oct. 2008 – present) and President (Feb. 2007 – Oct. 2021), The Charles Schwab Corporation; President and Chief Executive Officer (Oct. 2008 – Oct. 2021) and Director (May 2008 – Oct. 2021), Charles Schwab & Co., Inc.; Director (Apr. 2006 – present), Charles Schwab Bank, SSB; Director (Nov. 2017 – present), Charles Schwab Premier Bank, SSB; Director (July 2019 – present), Charles Schwab Trust Bank; Director (May 2008 – present), Chief Executive Officer (Aug. 2017 – present) and President (Aug. 2017 – Nov. 2021), Schwab Holdings, Inc.; Director (Oct. 2020 – present), TD Ameritrade Holding Corporation; Director (July 2016 – Oct. 2021), Charles Schwab Investment Management, Inc. | 105 | Director (2008 – present), The Charles Schwab Corporation |
| Interested Trustees (continued) | |||
| Name, Year of Birth, and Position(s) with the trust (Terms of office, and length of Time Served1) | Principal Occupations During the Past Five Years | Number of Portfolios in Fund Complex Overseen by the Trustee | Other Directorships |
| Richard A. Wurster2 1973 Trustee (Trustee of The Charles Schwab Family of Funds, Schwab Investments, Schwab Capital Trust, Schwab Annuity Portfolios, Schwab Strategic Trust and Laudus Trust since 2022) | President (Oct. 2021 – present) and Executive Vice President – Schwab Asset Management Solutions (Apr. 2019 – Oct. 2021), The Charles Schwab Corporation; President, Director (Oct. 2021 – present), Executive Vice President – Schwab Asset Management Solutions (July 2019 – Oct. 2021) and Senior Vice President – Advisory (May 2016 – July 2019), Charles Schwab & Co., Inc.; President (Nov. 2021 – present), Schwab Holdings, Inc.; Director (Oct. 2021 – present) and Chief Executive Officer (Nov. 2019 – Jan. 2022), Charles Schwab Investment Management, Inc.; Director, Chief Executive Officer and President (Mar. 2018 – Oct. 2022), Charles Schwab Investment Advisory, Inc.; Chief Executive Officer (July 2016 – Apr. 2018) and President (Mar. 2017 – Apr. 2018), ThomasPartners, Inc.; Chief Executive Officer (July 2016 – Apr. 2018), Windhaven Investment Management, Inc. | 105 | None |
| Officers of the Trust | |
| Name, Year of Birth, and Position(s) with the trust (Terms of office, and length of Time Served3) | Principal Occupations During the Past Five Years |
| Jonathan de St. Paer 1973 President and Chief Executive Officer (Officer of The Charles Schwab Family of Funds, Schwab Investments, Schwab Capital Trust, Schwab Annuity Portfolios, Schwab Strategic Trust and Laudus Trust since 2018) | Director (Apr. 2019 – present), President (Oct. 2018 – present), Chief Operating Officer (Jan. 2021 – present), and Chief Executive Officer (Apr. 2019 – Nov. 2019), Charles Schwab Investment Management, Inc.; Senior Vice President (June 2020 – Mar. 2022) and Chief Operating Officer (Jan. 2021 – Mar. 2022), Charles Schwab Investment Advisory, Inc.; Chief Executive Officer (Apr. 2019 – present), President (Nov. 2018 – present) and Trustee (Apr. 2019 – Dec. 2020), Schwab Funds, Laudus Trust and Schwab ETFs; Managing Director (May 2022 – present), Senior Vice President (Apr. 2019 – May 2022) and Senior Vice President – Strategy and Product Development (CSIM) (Jan. 2014 – Mar. 2019), Charles Schwab & Co., Inc. |
| Mark Fischer 1970 Treasurer, Chief Financial Officer and Chief Operating Officer (Officer of The Charles Schwab Family of Funds, Schwab Investments, Schwab Capital Trust, Schwab Annuity Portfolios, Schwab Strategic Trust and Laudus Trust since 2013) | Treasurer and Chief Financial Officer (Jan. 2016 – present) and Chief Operating Officer (Dec. 2020 – present), Schwab Funds, Laudus Trust and Schwab ETFs; Chief Financial Officer (Mar. 2020 – present) and Vice President (Oct. 2013 – present), Charles Schwab Investment Management, Inc. |
| Omar Aguilar 1970 Vice President and Chief Investment Officer (Officer of The Charles Schwab Family of Funds, Schwab Investments, Schwab Capital Trust, Schwab Annuity Portfolios, Schwab Strategic Trust and Laudus Trust since 2011) | Chief Executive Officer (Jan. 2022 – present), Chief Investment Officer (Apr. 2011 – present) and Senior Vice President (Apr. 2011 – Dec. 2021), Charles Schwab Investment Management, Inc.; Director, Chief Executive Officer and President (Oct. 2022 – present), Charles Schwab Investment Advisory, Inc.; Vice President and Chief Investment Officer (June 2011 – present), Schwab Funds, Laudus Trust and Schwab ETFs. |
| Brett Wander 1961 Vice President and Chief Investment Officer (Officer of The Charles Schwab Family of Funds, Schwab Investments, Schwab Capital Trust, Schwab Annuity Portfolios, Schwab Strategic Trust and Laudus Trust since 2011) | Senior Vice President and Chief Investment Officer (Apr. 2011 – present), Charles Schwab Investment Management, Inc.; Vice President and Chief Investment Officer (June 2011 – present), Schwab Funds, Laudus Trust and Schwab ETFs. |
| William P. McMahon, Jr. 1972 Vice President and Chief Investment Officer (Officer of The Charles Schwab Family of Funds, Schwab Investments, Schwab Capital Trust, Schwab Annuity Portfolios, Schwab Strategic Trust and Laudus Trust since 2021) | Senior Vice President and Chief Investment Officer (Jan. 2020 – present), Charles Schwab Investment Management, Inc.; Vice President and Chief Investment Officer (June 2021 – present), Schwab Funds, Laudus Trust and Schwab ETFs; Senior Vice President and Chief Investment Officer – ThomasPartners Strategies (Apr. 2018 – Dec. 2019), Charles Schwab Investment Advisory, Inc.; Senior Vice President and Chief Investment Officer (May 2001 – Apr. 2018), ThomasPartners, Inc. |
| Officers of the Trust (continued) | |
| Name, Year of Birth, and Position(s) with the trust (Terms of office, and length of Time Served3) | Principal Occupations During the Past Five Years |
| Catherine MacGregor 1964 Chief Legal Officer and Secretary, Schwab Funds and Schwab ETFs Chief Legal Officer, Vice President and Clerk, Laudus Trust (Officer of The Charles Schwab Family of Funds, Schwab Investments, Schwab Capital Trust, Schwab Annuity Portfolios and Laudus Trust since 2005; Schwab Strategic Trust since 2009) | Chief Legal Officer (Mar. 2022 – present) and Vice President (Sept. 2005 – present), Charles Schwab Investment Management, Inc.; Managing Director (May 2022 – present) and Vice President (July 2005 – May 2022), Charles Schwab & Co., Inc.; Vice President (Dec. 2005 – present) and Chief Legal Officer and Clerk (Mar. 2007 – present), Laudus Trust; Chief Legal Officer and Secretary (Oct. 2021 – present), Vice President (Nov. 2005 – Oct. 2021) and Assistant Secretary (June 2007 – Oct. 2021), Schwab Funds; Chief Legal Officer and Secretary (Oct. 2021 – present), Vice President and Assistant Secretary (Oct. 2009 – Oct. 2021), Schwab ETFs. |
| 1 | Each Trustee shall hold office until the election and qualification of his or her successor, or until he or she dies, resigns or is removed. The retirement policy requires that each independent trustee retire by December 31 of the year in which the Trustee turns 74 or the Trustee’s twentieth year of service as an independent trustee on any trust in the Fund Complex, whichever occurs first. |
| 2 | Mr. Bettinger and Mr. Wurster are Interested Trustees. Mr. Bettinger and Mr. Wurster are Interested Trustees because each owns stock of The Charles Schwab Corporation (CSC), the parent company of Charles Schwab Investment Management, Inc., the investment adviser for the trusts in the Fund Complex, and is an employee of Charles Schwab & Co., Inc. (Schwab), the principal underwriter for The Charles Schwab Family of Funds, Schwab Investments, Schwab Capital Trust, Schwab Annuity Portfolios and Laudus Trust. |
| 3 | The President, Treasurer and Secretary/Clerk hold office until their respective successors are chosen and qualified or until he or she sooner dies, resigns, is removed or becomes disqualified. Each of the other officers serves at the pleasure of the Board. |
Schwab Funds
Member SIPC®
Printed on recycled paper.
| ¹ | State, local, and the Federal Alternative Minimum Tax may apply. Capital gains are not exempt from Federal Taxation. |
| ² | You could lose money by investing in the Schwab Money Funds. All Schwab Money Funds with the exception of Schwab Variable Share Price Money Fund seek to preserve the value of your investment at $1.00 per share, but cannot guarantee they will do so. Because the share price of Schwab Variable Share Price Money Fund will fluctuate, when you sell your shares they may be worth more or less than what you originally paid for them. All Schwab Money Funds with the exception of Schwab Government Money Fund, Schwab Retirement Government Money Fund, Schwab U.S. Treasury Money Fund, Schwab Treasury Obligations Money Fund and Schwab Government Money Market Portfolio may impose a fee upon the sale of your shares or may temporarily suspend your ability to sell shares if the Fund’s liquidity falls below required minimums because of market conditions or other factors. An investment in the Schwab Money Funds is not insured or guaranteed by the Federal Deposit Insurance Corporation or any other government agency. The Schwab Money Funds’ sponsor has no legal obligation to provide financial support to the Funds, and you should not expect that the sponsor will provide financial support to the Funds at any time. |

| Total Return for the 12 Months Ended October 31, 2022 | |
| Schwab Balanced Fund (Ticker Symbol: SWOBX) | -18.51% |
| Balanced Blended Index | -15.32% |
| Fund Category: Morningstar Allocation—50% to 70% Equity1 | -14.00% |
| Performance Details | pages 7-9 |
| 1 | Source for category information: Morningstar, Inc. The Morningstar Category return represents all active and index mutual funds and ETFs within the category as of the report date. |

President of Schwab Asset
Management and the fund
covered in this report.

| * | The net version of the index reflects reinvested dividends net of withholding taxes but reflects no deductions for expenses or other taxes. |

| * | The net version of the index reflects reinvested dividends net of withholding taxes but reflects no deductions for expenses or other taxes. |
 | Zifan Tang, Ph.D., CFA, Senior Portfolio Manager, is responsible for the co-management of the fund. Prior to joining Schwab in 2012, Ms. Tang was a product manager at Thomson Reuters and from 1997 to 2009 worked as a portfolio manager at Barclays Global Investors (now known as BlackRock). |
 | Patrick Kwok, CFA, Portfolio Manager, is responsible for the co-management of the fund. Previously, Mr. Kwok served as an associate portfolio manager from 2012 to 2016. Prior to that, he worked as a fund administration manager, where he was responsible for oversight of sub-advisers, trading, cash management, and fund administration supporting the Charles Schwab Trust Bank Collective Investment Trusts and multi-asset Schwab Funds. Prior to joining Schwab Asset Management in 2008, Mr. Kwok spent two years as an asset operations specialist at Charles Schwab Trust Company. He also worked for one year at State Street Bank & Trust as a portfolio accountant and pricing specialist. |
| 1 | The total return cited for the index reflects reinvested dividends net of withholding taxes but reflects no deductions for expenses or other taxes. |
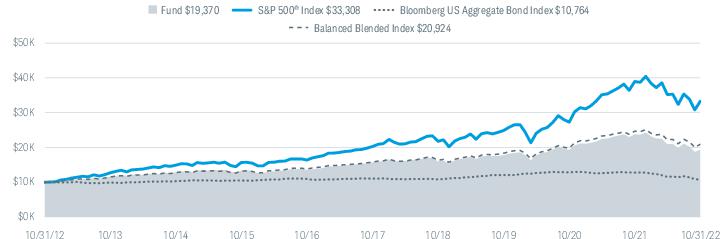
| Fund and Inception Date | 1 Year | 5 Years | 10 Years |
| Fund: Schwab Balanced Fund (11/18/96) | -18.51% | 4.32% | 6.84% |
| S&P 500® Index | -14.61% | 10.44% | 12.79% |
| Bloomberg US Aggregate Bond Index | -15.68% | -0.54% | 0.74% |
| Balanced Blended Index | -15.32% | 5.78% | 7.66% |
| Fund Category: Morningstar Allocation—50% to 70% Equity2 | -14.00% | 4.25% | 6.15% |
| Fund Expense Ratios3: Net 0.50%; Gross 0.52% | |||
| 1 | Fund expenses may have been partially absorbed by the investment adviser and its affiliates. Without these reductions, the fund’s returns would have been lower. These returns do not reflect the deduction of taxes that a shareholder would pay on fund distributions or the redemption of fund shares. |
| 2 | Source for category information: Morningstar, Inc. The Morningstar Category return represents all active and index mutual funds and ETFs within the category as of the report date. |
| 3 | As stated in the prospectus. Includes 0.50% of acquired fund fees and expenses (AFFE), which are indirect expenses incurred by the fund through its investments in the underlying funds. Net Expense: Expenses reduced by a contractual fee waiver in effect for so long as Schwab Asset Management serves as the investment adviser to the fund. Gross Expense: Does not reflect the effect of contractual fee waivers. For actual expense ratios during the period, not including AFFE, refer to the financial highlights section of the financial statements. |
| Number of Holdings | 7 |
| Portfolio Turnover Rate | 31% |
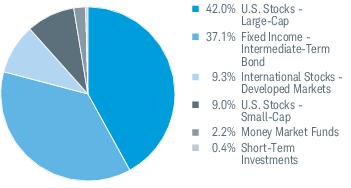
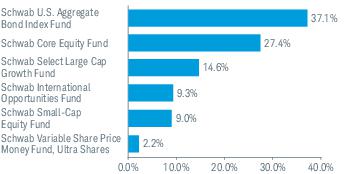
| 1 | The percentage may differ from the Portfolio Holdings because the above calculation is based on a percentage of total investments, whereas the calculation in the Portfolio Holdings is based on a percentage of net assets. |
| 2 | This list is not a recommendation of any security by the investment adviser. |
| 3 | The holdings listed exclude any temporary liquidity investments. |
| EXPENSE RATIO (ANNUALIZED)1,2 | EFFECTIVE EXPENSE RATIO (ANNUALIZED)3,4 | BEGINNING ACCOUNT VALUE AT 5/1/22 | ENDING ACCOUNT VALUE (NET OF EXPENSES) AT 10/31/22 | EXPENSES PAID DURING PERIOD 5/1/22-10/31/222,5 | EFFECTIVE EXPENSES PAID DURING PERIOD 5/1/22-10/31/224,5 | |
| Schwab Balanced Fund | ||||||
| Actual Return | 0.00% | 0.50% | $1,000.00 | $ 925.30 | $0.00 | $2.43 |
| Hypothetical 5% Return | 0.00% | 0.50% | $1,000.00 | $1,025.21 | $0.00 | $2.55 |
| 1 | Based on the most recent six-month expense ratio. |
| 2 | Excludes acquired fund fees and expenses, which are indirect expenses incurred by the fund through its investments in underlying funds. |
| 3 | Based on the most recent six-month acquired fund fees and expenses and the expense ratio; may differ from the acquired fund fees and expenses and the expense ratio in the prospectus. |
| 4 | Includes acquired fund fees and expenses, which are indirect expenses incurred by the fund through its investments in underlying funds. |
| 5 | Expenses for each fund are equal to its annualized expense ratio, multiplied by the average account value over the period, multiplied by the 184 days of the period, and divided by the 365 days of the fiscal year. |
| 11/1/21– 10/31/22 | 11/1/20– 10/31/21 | 11/1/19– 10/31/20 | 11/1/18– 10/31/19 | 11/1/17– 10/31/18 | ||
| Per-Share Data | ||||||
| Net asset value at beginning of period | $19.74 | $16.50 | $15.99 | $15.41 | $15.60 | |
| Income (loss) from investment operations: | ||||||
| Net investment income (loss)1 | 0.21 | 0.19 | 0.20 | 0.24 | 0.23 | |
| Net realized and unrealized gains (losses) | (3.62) | 3.58 | 1.13 | 1.32 | 0.08 2 | |
| Total from investment operations | (3.41) | 3.77 | 1.33 | 1.56 | 0.31 | |
| Less distributions: | ||||||
| Distributions from net investment income | (0.85) | (0.19) | (0.22) | (0.37) | (0.48) | |
| Distributions from net realized gains | (0.37) | (0.34) | (0.60) | (0.61) | (0.02) | |
| Total distributions | (1.22) | (0.53) | (0.82) | (0.98) | (0.50) | |
| Net asset value at end of period | $15.11 | $19.74 | $16.50 | $15.99 | $15.41 | |
| Total return | (18.51%) | 23.20% | 8.58% | 11.19% | 1.94% | |
| Ratios/Supplemental Data | ||||||
| Ratios to average net assets: | ||||||
| Net operating expenses3 | 0.00% 4 | 0.00% | 0.00% | 0.00% | 0.00% | |
| Gross operating expenses3 | 0.03% 4 | 0.02% | 0.03% | 0.04% | 0.04% | |
| Net investment income (loss) | 1.25% | 1.01% | 1.26% | 1.55% | 1.44% | |
| Portfolio turnover rate | 31% | 6% | 18% | 32% | 6% | |
| Net assets, end of period (x 1,000) | $619,501 | $803,812 | $577,427 | $526,174 | $446,626 | |
| 1 | Calculated based on the average shares outstanding during the period. |
| 2 | The per share amount does not accord with the change in aggregate gains and losses in securities during the period because of the timing of sales and repurchases of fund shares in relation to fluctuating market values. |
| 3 | Ratio excludes acquired fund fees and expenses, which are indirect expenses incurred by the fund through its investments in underlying funds. |
| 4 | Ratio includes less than 0.005% of non-routine proxy expenses. |
| SECURITY | VALUE AT 10/31/21 | PURCHASES | SALES | REALIZED GAINS (LOSSES) | NET CHANGE IN UNREALIZED APPRECIATION (DEPRECIATION) | VALUE AT 10/31/22 | BALANCE OF SHARES HELD AT 10/31/22 | DISTRIBUTIONS RECEIVED(a) |
| AFFILIATED UNDERLYING FUNDS 99.2% OF NET ASSETS | ||||||||
| U.S. Stocks 50.8% | ||||||||
| Large-Cap 41.9% | ||||||||
| Schwab Core Equity Fund | $281,181,209 | $32,188,090 | ($47,508,250) | ($7,468,844) | ($89,268,434) | $169,123,771 | 8,690,841 | $70,412,412 |
| Schwab Select Large Cap Growth Fund (formerly Laudus U.S. Large Cap Growth Fund) * | 127,249,981 | 52,063,086 | (21,746,372) | (4,447,850) | (62,777,486) | 90,341,359 | 4,583,529 | 16,447,928 |
| Schwab U.S. Large-Cap ETF | — | 68,830,829 | (68,019,047) | (811,782) | — | — | — | 7,795 |
| 259,465,130 | ||||||||
| Small-Cap 8.9% | ||||||||
| Schwab Small-Cap Equity Fund | 80,221,848 | 16,963,923 | (24,362,221) | (251,490) | (17,381,511) | 55,190,549 | 2,913,968 | 9,532,082 |
| 314,655,679 | ||||||||
| International Stocks 9.2% | ||||||||
| Developed Markets 9.2% | ||||||||
| Schwab International Opportunities Fund (formerly Laudus International MarketMasters Fund) | — | 82,505,714 | (5,341,444) | (1,299,991) | (18,716,124) | 57,148,155 | 3,383,550 | — |
| Fixed Income 37.0% | ||||||||
| Intermediate-Term Bond 37.0% | ||||||||
| Schwab U.S. Aggregate Bond Index Fund | 290,913,616 | 50,749,452 | (59,867,656) | (6,418,371) | (46,246,634) | 229,130,407 | 26,643,071 | 6,245,985 |
| Money Market Funds 2.2% | ||||||||
| Schwab Variable Share Price Money Fund, Ultra Shares, 3.10% (b) | 13,719,523 | 118,164 | (327) | — | (4,124) | 13,833,236 | 13,833,236 | 135,170 |
| Total Affiliated Underlying Funds (Cost $662,230,507) | $793,286,177 | $303,419,258 | ($226,845,317) | ($20,698,328) | ($234,394,313) | $614,767,477 | $102,781,372 | |
| UNAFFILIATED UNDERLYING FUNDS 0.4% OF NET ASSETS | ||||||||
| Money Market Funds 0.4% | ||||||||
| State Street Institutional U.S. Government Money Market Fund, Premier Class, 3.01% (b) | $2,427,733 | 2,427,733 | ||||||
| Total Unaffiliated Underlying Funds (Cost $2,427,733) | $2,427,733 | |||||||
| Total Investments in Securities (Cost $664,658,240) | $617,195,210 | |||||||
| * | Non-income producing security. |
| (a) | Distributions received include distributions from net investment income and capital gains, if any, from the underlying funds. Amounts shown are only presented for affiliated underlying funds, which are presented in the corresponding line-item in the Statement of Operations, if applicable (See financial note 2(c) for additional information). |
| (b) | The rate shown is the annualized 7-day yield. |
| ETF — | Exchange traded fund |
| Assets | ||
| Investments in securities, at value - affiliated (cost $662,230,507) | $614,767,477 | |
| Investments in securities, at value - unaffiliated (cost $2,427,733) | 2,427,733 | |
| Receivables: | ||
| Investments sold | 7,023,183 | |
| Fund shares sold | 563,076 | |
| Dividends | 519,579 | |
| Due from investment adviser | 16,026 | |
| Prepaid expenses | + | 24,814 |
| Total assets | 625,341,888 | |
| Liabilities | ||
| Payables: | ||
| Investments bought | 4,891,560 | |
| Fund shares redeemed | 878,954 | |
| Independent trustees’ fees | 41 | |
| Accrued expenses | + | 70,420 |
| Total liabilities | 5,840,975 | |
| Net assets | $619,500,913 | |
| Net Assets by Source | ||
| Capital received from investors | $627,557,271 | |
| Total distributable loss | + | (8,056,358) |
| Net assets | $619,500,913 | |
| Net Asset Value (NAV) | ||||
| Net Assets | ÷ | Shares Outstanding | = | NAV |
| $619,500,913 | 41,000,195 | $15.11 | ||
| For the period November 1, 2021 through October 31, 2022 | ||
| Investment Income | ||
| Dividends received from securities - affiliated | $9,193,798 | |
| Dividends received from securities - unaffiliated | + | 53,741 |
| Total investment income | 9,247,539 | |
| Expenses | ||
| Registration fees | 52,810 | |
| Shareholder reports | 38,074 | |
| Proxy fees1 | 34,639 | |
| Portfolio accounting fees | 29,950 | |
| Professional fees | 23,548 | |
| Independent trustees’ fees | 8,803 | |
| Transfer agent fees | 7,143 | |
| Custodian fees | 1,024 | |
| Other expenses | + | 11,248 |
| Total expenses | 207,239 | |
| Expense reduction | – | 172,600 |
| Net expenses | – | 34,639 |
| Net investment income | 9,212,900 | |
| REALIZED AND UNREALIZED GAINS (LOSSES) | ||
| Realized capital gain distributions received from underlying funds - affiliated | 93,587,574 | |
| Net realized losses on sales of securities - affiliated | + | (20,698,328) |
| Net realized gains | 72,889,246 | |
| Net change in unrealized appreciation (depreciation) on securities - affiliated | + | (234,394,313) |
| Net realized and unrealized losses | (161,505,067) | |
| Decrease in net assets resulting from operations | ($152,292,167) | |
| 1 | Proxy fees are non-routine expenses (see financial note 4 for additional information). |
| OPERATIONS | |||
| 11/1/21-10/31/22 | 11/1/20-10/31/21 | ||
| Net investment income | $9,212,900 | $7,230,817 | |
| Net realized gains | 72,889,246 | 16,382,779 | |
| Net change in unrealized appreciation (depreciation) | + | (234,394,313) | 117,082,895 |
| Increase (decrease) in net assets resulting from operations | ($152,292,167) | $140,696,491 | |
| DISTRIBUTIONS TO SHAREHOLDERS | |||
| Total distributions | ($53,966,826) | ($18,699,512) | |
| TRANSACTIONS IN FUND SHARES | |||||
| 11/1/21-10/31/22 | 11/1/20-10/31/21 | ||||
| SHARES | VALUE | SHARES | VALUE | ||
| Shares sold | 10,090,100 | $184,284,944 | 10,659,191 | $196,407,644 | |
| Shares reinvested | 2,499,461 | 47,414,756 | 946,955 | 16,600,121 | |
| Shares redeemed | + | (12,303,468) | (209,751,334) | (5,882,203) | (108,620,302) |
| Net transactions in fund shares | 286,093 | $21,948,366 | 5,723,943 | $104,387,463 | |
| SHARES OUTSTANDING AND NET ASSETS | |||||
| 11/1/21-10/31/22 | 11/1/20-10/31/21 | ||||
| SHARES | NET ASSETS | SHARES | NET ASSETS | ||
| Beginning of period | 40,714,102 | $803,811,540 | 34,990,159 | $577,427,098 | |
| Total increase (decrease) | + | 286,093 | (184,310,627) | 5,723,943 | 226,384,442 |
| End of period | 41,000,195 | $619,500,913 | 40,714,102 | $803,811,540 | |
| SCHWAB CAPITAL TRUST (ORGANIZED MAY 7, 1993) | |
| Schwab Balanced Fund | Schwab Target 2045 Fund |
| Schwab S&P 500 Index Fund | Schwab Target 2050 Fund |
| Schwab Small-Cap Index Fund® | Schwab Target 2055 Fund |
| Schwab Total Stock Market Index Fund® | Schwab Target 2060 Fund |
| Schwab U.S. Large-Cap Growth Index Fund | Schwab Target 2065 Fund |
| Schwab U.S. Large-Cap Value Index Fund | Schwab Fundamental US Large Company Index Fund |
| Schwab U.S. Mid-Cap Index Fund | Schwab Fundamental US Small Company Index Fund |
| Schwab International Index Fund® | Schwab Fundamental International Large Company Index Fund |
| Schwab MarketTrack All Equity Portfolio™ | Schwab Fundamental International Small Company Index Fund |
| Schwab MarketTrack Growth Portfolio™ | Schwab Fundamental Emerging Markets Large Company Index Fund |
| Schwab MarketTrack Balanced Portfolio™ | Schwab Fundamental Global Real Estate Index Fund |
| Schwab MarketTrack Conservative Portfolio™ | Schwab Target 2010 Index Fund |
| Schwab International Opportunities Fund | Schwab Target 2015 Index Fund |
| Schwab Core Equity Fund | Schwab Target 2020 Index Fund |
| Schwab Dividend Equity Fund | Schwab Target 2025 Index Fund |
| Schwab Large-Cap Growth Fund | Schwab Target 2030 Index Fund |
| Schwab Small-Cap Equity Fund | Schwab Target 2035 Index Fund |
| Schwab Health Care Fund | Schwab Target 2040 Index Fund |
| Schwab International Core Equity Fund | Schwab Target 2045 Index Fund |
| Schwab Target 2010 Fund | Schwab Target 2050 Index Fund |
| Schwab Target 2015 Fund | Schwab Target 2055 Index Fund |
| Schwab Target 2020 Fund | Schwab Target 2060 Index Fund |
| Schwab Target 2025 Fund | Schwab Target 2065 Index Fund |
| Schwab Target 2030 Fund | Schwab Monthly Income Fund – Target Payout |
| Schwab Target 2035 Fund | Schwab Monthly Income Fund – Flexible Payout |
| Schwab Target 2040 Fund | Schwab Monthly Income Fund – Income Payout |
| Schwab Core Equity Fund | 13.3% |
| Schwab International Opportunities Fund | 5.8% |
| Schwab Select Large Cap Growth Fund | 4.6% |
| Schwab Small-Cap Equity Fund | 10.2% |
| Schwab U.S. Aggregate Bond Index Fund | 5.6% |
| Schwab Variable Share Price Money Fund, Ultra Shares | 0.3% |
| PURCHASE COST | SALE PROCEEDS | REALIZED GAINS (LOSSES) | |
| $— | $39,355,550 | ($1,058,783) | |
| 6. Borrowing from Banks: |
| PURCHASES OF SECURITIES | SALES OF SECURITIES |
| $303,419,258 | $226,845,317 |
| TAX COST | GROSS UNREALIZED APPRECIATION | GROSS UNREALIZED DEPRECIATION | NET UNREALIZED APPRECIATION (DEPRECIATION) |
| $677,641,506 | $13,075,176 | ($73,521,472) | ($60,446,296) |
| UNDISTRIBUTED ORDINARY INCOME | UNDISTRIBUTED LONG-TERM CAPITAL GAINS | NET UNREALIZED APPRECIATION (DEPRECIATION) ON INVESTMENTS | TOTAL |
| $5,260,171 | $47,129,767 | ($60,446,296) | ($8,056,358) |
| CURRENT FISCAL YEAR END DISTRIBUTIONS | PRIOR FISCAL YEAR END DISTRIBUTIONS | |||
| ORDINARY INCOME | LONG-TERM CAPITAL GAINS | ORDINARY INCOME | LONG-TERM CAPITAL GAINS | |
| $38,253,293 | $15,713,533 | $7,375,819 | $11,323,693 | |
Denver, Colorado
December 16, 2022
| Proposal – To elect each of the following individuals as trustees of the Trust: | For | Withheld |
| Walter W. Bettinger II | 1,095,577,106.505 | 115,838,980.968 |
| Richard A. Wurster | 1,117,598,789.555 | 93,817,297.918 |
| Michael J. Beer | 1,116,890,447.505 | 94,525,639.968 |
| Robert W. Burns | 1,117,915,860.110 | 93,500,227.363 |
| Nancy F. Heller | 1,119,878,732.134 | 91,537,355.339 |
| David L. Mahoney | 1,069,125,022.434 | 142,291,065.039 |
| Jane P. Moncreiff | 1,120,187,927.838 | 91,228,159.635 |
| Kiran M. Patel | 1,116,689,111.571 | 94,726,975.902 |
| Kimberly S. Patmore | 1,119,941,056.059 | 91,475,031.414 |
| J. Derek Penn | 1,117,666,014.121 | 93,750,073.352 |
| 1. | the nature, extent and quality of the services provided to the Fund under the Agreement, including the resources of the investment adviser and its affiliates dedicated to the Fund; |
| 2. | the Fund’s investment performance and how it compared to that of certain other comparable mutual funds and benchmark data; |
| 3. | the Fund’s expenses and how those expenses compared to those of certain other similar mutual funds; |
| 4. | the profitability of the investment adviser and its affiliates, including Charles Schwab & Co., Inc. (Schwab), with respect to the Fund, including both direct and indirect benefits accruing to the investment adviser and its affiliates; and |
| 5. | the extent to which economies of scale would be realized as the Fund grows and whether fee levels in the Agreement reflect those economies of scale for the benefit of Fund investors. |
| Independent Trustees | |||
| Name, Year of Birth, and Position(s) with the trust (Terms of office, and length of Time Served1) | Principal Occupations During the Past Five Years | Number of Portfolios in Fund Complex Overseen by the Trustee | Other Directorships |
Michael J. Beer 1961 Trustee (Trustee of The Charles Schwab Family of Funds, Schwab Investments, Schwab Capital Trust, Schwab Annuity Portfolios, Schwab Strategic Trust and Laudus Trust since 2022) | Retired. Director, President and Chief Executive Officer (Dec. 2016 – Sept. 2019), Principal Funds (investment management). | 105 | Director (2016 – 2019), Principal Funds, Inc. |
| Robert W. Burns 1959 Trustee (Trustee of Schwab Strategic Trust since 2009; The Charles Schwab Family of Funds, Schwab Investments, Schwab Capital Trust, Schwab Annuity Portfolios and Laudus Trust since 2016) | Retired/Private Investor. | 105 | None |
| Nancy F. Heller 1956 Trustee (Trustee of The Charles Schwab Family of Funds, Schwab Investments, Schwab Capital Trust, Schwab Annuity Portfolios, Schwab Strategic Trust and Laudus Trust since 2018) | Retired. | 105 | None |
| David L. Mahoney 1954 Trustee (Trustee of The Charles Schwab Family of Funds, Schwab Investments, Schwab Capital Trust, Schwab Annuity Portfolios and Laudus Trust since 2011; Schwab Strategic Trust since 2016) | Private Investor. | 105 | Director (2004 – present), Corcept Therapeutics Incorporated Director (2009 – 2021), Adamas Pharmaceuticals, Inc. Director (2003 – 2019), Symantec Corporation |
| Jane P. Moncreiff 1961 Trustee (Trustee of The Charles Schwab Family of Funds, Schwab Investments, Schwab Capital Trust, Schwab Annuity Portfolios, Schwab Strategic Trust and Laudus Trust since 2019) | Consultant (2018 – present), Fulham Advisers LLC (management consulting); Chief Investment Officer (2009 – 2017), CareGroup Healthcare System, Inc. (healthcare). | 105 | None |
| Independent Trustees (continued) | |||
| Name, Year of Birth, and Position(s) with the trust (Terms of office, and length of Time Served1) | Principal Occupations During the Past Five Years | Number of Portfolios in Fund Complex Overseen by the Trustee | Other Directorships |
| Kiran M. Patel 1948 Trustee (Trustee of The Charles Schwab Family of Funds, Schwab Investments, Schwab Capital Trust, Schwab Annuity Portfolios and Laudus Trust since 2011; Schwab Strategic Trust since 2016) | Retired. | 105 | Director (2008 – present), KLA-Tencor Corporation |
| Kimberly S. Patmore 1956 Trustee (Trustee of The Charles Schwab Family of Funds, Schwab Investments, Schwab Capital Trust, Schwab Annuity Portfolios, Schwab Strategic Trust and Laudus Trust since 2016) | Consultant (2008 – present), Patmore Management Consulting (management consulting). | 105 | None |
J. Derek Penn 1957 Trustee (Trustee of The Charles Schwab Family of Funds, Schwab Investments, Schwab Capital Trust, Schwab Annuity Portfolios, Schwab Strategic Trust and Laudus Trust since 2021) | Head of Equity Sales and Trading (2006 – 2018), BNY Mellon (financial services). | 105 | None |
| Interested Trustees | |||
| Name, Year of Birth, and Position(s) with the trust (Terms of office, and length of Time Served1) | Principal Occupations During the Past Five Years | Number of Portfolios in Fund Complex Overseen by the Trustee | Other Directorships |
| Walter W. Bettinger II2 1960 Chairman and Trustee (Trustee of The Charles Schwab Family of Funds, Schwab Investments, Schwab Capital Trust and Schwab Annuity Portfolios since 2008; Schwab Strategic Trust since 2009; Laudus Trust since 2010) | Co-Chairman of the Board (July 2022 – present), Director and Chief Executive Officer (Oct. 2008 – present) and President (Feb. 2007 – Oct. 2021), The Charles Schwab Corporation; President and Chief Executive Officer (Oct. 2008 – Oct. 2021) and Director (May 2008 – Oct. 2021), Charles Schwab & Co., Inc.; Director (Apr. 2006 – present), Charles Schwab Bank, SSB; Director (Nov. 2017 – present), Charles Schwab Premier Bank, SSB; Director (July 2019 – present), Charles Schwab Trust Bank; Director (May 2008 – present), Chief Executive Officer (Aug. 2017 – present) and President (Aug. 2017 – Nov. 2021), Schwab Holdings, Inc.; Director (Oct. 2020 – present), TD Ameritrade Holding Corporation; Director (July 2016 – Oct. 2021), Charles Schwab Investment Management, Inc. | 105 | Director (2008 – present), The Charles Schwab Corporation |
| Interested Trustees (continued) | |||
| Name, Year of Birth, and Position(s) with the trust (Terms of office, and length of Time Served1) | Principal Occupations During the Past Five Years | Number of Portfolios in Fund Complex Overseen by the Trustee | Other Directorships |
| Richard A. Wurster2 1973 Trustee (Trustee of The Charles Schwab Family of Funds, Schwab Investments, Schwab Capital Trust, Schwab Annuity Portfolios, Schwab Strategic Trust and Laudus Trust since 2022) | President (Oct. 2021 – present) and Executive Vice President – Schwab Asset Management Solutions (Apr. 2019 – Oct. 2021), The Charles Schwab Corporation; President, Director (Oct. 2021 – present), Executive Vice President – Schwab Asset Management Solutions (July 2019 – Oct. 2021) and Senior Vice President – Advisory (May 2016 – July 2019), Charles Schwab & Co., Inc.; President (Nov. 2021 – present), Schwab Holdings, Inc.; Director (Oct. 2021 – present) and Chief Executive Officer (Nov. 2019 – Jan. 2022), Charles Schwab Investment Management, Inc.; Director, Chief Executive Officer and President (Mar. 2018 – Oct. 2022), Charles Schwab Investment Advisory, Inc.; Chief Executive Officer (July 2016 – Apr. 2018) and President (Mar. 2017 – Apr. 2018), ThomasPartners, Inc.; Chief Executive Officer (July 2016 – Apr. 2018), Windhaven Investment Management, Inc. | 105 | None |
| Officers of the Trust | |
| Name, Year of Birth, and Position(s) with the trust (Terms of office, and length of Time Served3) | Principal Occupations During the Past Five Years |
| Jonathan de St. Paer 1973 President and Chief Executive Officer (Officer of The Charles Schwab Family of Funds, Schwab Investments, Schwab Capital Trust, Schwab Annuity Portfolios, Schwab Strategic Trust and Laudus Trust since 2018) | Director (Apr. 2019 – present), President (Oct. 2018 – present), Chief Operating Officer (Jan. 2021 – present), and Chief Executive Officer (Apr. 2019 – Nov. 2019), Charles Schwab Investment Management, Inc.; Senior Vice President (June 2020 – Mar. 2022) and Chief Operating Officer (Jan. 2021 – Mar. 2022), Charles Schwab Investment Advisory, Inc.; Chief Executive Officer (Apr. 2019 – present), President (Nov. 2018 – present) and Trustee (Apr. 2019 – Dec. 2020), Schwab Funds, Laudus Trust and Schwab ETFs; Managing Director (May 2022 – present), Senior Vice President (Apr. 2019 – May 2022) and Senior Vice President – Strategy and Product Development (CSIM) (Jan. 2014 – Mar. 2019), Charles Schwab & Co., Inc. |
| Mark Fischer 1970 Treasurer, Chief Financial Officer and Chief Operating Officer (Officer of The Charles Schwab Family of Funds, Schwab Investments, Schwab Capital Trust, Schwab Annuity Portfolios, Schwab Strategic Trust and Laudus Trust since 2013) | Treasurer and Chief Financial Officer (Jan. 2016 – present) and Chief Operating Officer (Dec. 2020 – present), Schwab Funds, Laudus Trust and Schwab ETFs; Chief Financial Officer (Mar. 2020 – present) and Vice President (Oct. 2013 – present), Charles Schwab Investment Management, Inc. |
| Omar Aguilar 1970 Vice President and Chief Investment Officer (Officer of The Charles Schwab Family of Funds, Schwab Investments, Schwab Capital Trust, Schwab Annuity Portfolios, Schwab Strategic Trust and Laudus Trust since 2011) | Chief Executive Officer (Jan. 2022 – present), Chief Investment Officer (Apr. 2011 – present) and Senior Vice President (Apr. 2011 – Dec. 2021), Charles Schwab Investment Management, Inc.; Director, Chief Executive Officer and President (Oct. 2022 – present), Charles Schwab Investment Advisory, Inc.; Vice President and Chief Investment Officer (June 2011 – present), Schwab Funds, Laudus Trust and Schwab ETFs. |
| Brett Wander 1961 Vice President and Chief Investment Officer (Officer of The Charles Schwab Family of Funds, Schwab Investments, Schwab Capital Trust, Schwab Annuity Portfolios, Schwab Strategic Trust and Laudus Trust since 2011) | Senior Vice President and Chief Investment Officer (Apr. 2011 – present), Charles Schwab Investment Management, Inc.; Vice President and Chief Investment Officer (June 2011 – present), Schwab Funds, Laudus Trust and Schwab ETFs. |
| William P. McMahon, Jr. 1972 Vice President and Chief Investment Officer (Officer of The Charles Schwab Family of Funds, Schwab Investments, Schwab Capital Trust, Schwab Annuity Portfolios, Schwab Strategic Trust and Laudus Trust since 2021) | Senior Vice President and Chief Investment Officer (Jan. 2020 – present), Charles Schwab Investment Management, Inc.; Vice President and Chief Investment Officer (June 2021 – present), Schwab Funds, Laudus Trust and Schwab ETFs; Senior Vice President and Chief Investment Officer – ThomasPartners Strategies (Apr. 2018 – Dec. 2019), Charles Schwab Investment Advisory, Inc.; Senior Vice President and Chief Investment Officer (May 2001 – Apr. 2018), ThomasPartners, Inc. |
| Officers of the Trust (continued) | |
| Name, Year of Birth, and Position(s) with the trust (Terms of office, and length of Time Served3) | Principal Occupations During the Past Five Years |
| Catherine MacGregor 1964 Chief Legal Officer and Secretary, Schwab Funds and Schwab ETFs Chief Legal Officer, Vice President and Clerk, Laudus Trust (Officer of The Charles Schwab Family of Funds, Schwab Investments, Schwab Capital Trust, Schwab Annuity Portfolios and Laudus Trust since 2005; Schwab Strategic Trust since 2009) | Chief Legal Officer (Mar. 2022 – present) and Vice President (Sept. 2005 – present), Charles Schwab Investment Management, Inc.; Managing Director (May 2022 – present) and Vice President (July 2005 – May 2022), Charles Schwab & Co., Inc.; Vice President (Dec. 2005 – present) and Chief Legal Officer and Clerk (Mar. 2007 – present), Laudus Trust; Chief Legal Officer and Secretary (Oct. 2021 – present), Vice President (Nov. 2005 – Oct. 2021) and Assistant Secretary (June 2007 – Oct. 2021), Schwab Funds; Chief Legal Officer and Secretary (Oct. 2021 – present), Vice President and Assistant Secretary (Oct. 2009 – Oct. 2021), Schwab ETFs. |
| 1 | Each Trustee shall hold office until the election and qualification of his or her successor, or until he or she dies, resigns or is removed. The retirement policy requires that each independent trustee retire by December 31 of the year in which the Trustee turns 74 or the Trustee’s twentieth year of service as an independent trustee on any trust in the Fund Complex, whichever occurs first. |
| 2 | Mr. Bettinger and Mr. Wurster are Interested Trustees. Mr. Bettinger and Mr. Wurster are Interested Trustees because each owns stock of The Charles Schwab Corporation (CSC), the parent company of Charles Schwab Investment Management, Inc., the investment adviser for the trusts in the Fund Complex, and is an employee of Charles Schwab & Co., Inc. (Schwab), the principal underwriter for The Charles Schwab Family of Funds, Schwab Investments, Schwab Capital Trust, Schwab Annuity Portfolios and Laudus Trust. |
| 3 | The President, Treasurer and Secretary/Clerk hold office until their respective successors are chosen and qualified or until he or she sooner dies, resigns, is removed or becomes disqualified. Each of the other officers serves at the pleasure of the Board. |
Schwab Funds
Member SIPC®
Printed on recycled paper.
| ¹ | State, local, and the Federal Alternative Minimum Tax may apply. Capital gains are not exempt from Federal Taxation. |
| ² | You could lose money by investing in the Schwab Money Funds. All Schwab Money Funds with the exception of Schwab Variable Share Price Money Fund seek to preserve the value of your investment at $1.00 per share, but cannot guarantee they will do so. Because the share price of Schwab Variable Share Price Money Fund will fluctuate, when you sell your shares they may be worth more or less than what you originally paid for them. All Schwab Money Funds with the exception of Schwab Government Money Fund, Schwab Retirement Government Money Fund, Schwab U.S. Treasury Money Fund, Schwab Treasury Obligations Money Fund and Schwab Government Money Market Portfolio may impose a fee upon the sale of your shares or may temporarily suspend your ability to sell shares if the Fund’s liquidity falls below required minimums because of market conditions or other factors. An investment in the Schwab Money Funds is not insured or guaranteed by the Federal Deposit Insurance Corporation or any other government agency. The Schwab Money Funds’ sponsor has no legal obligation to provide financial support to the Funds, and you should not expect that the sponsor will provide financial support to the Funds at any time. |

Index Fund
Index Fund
| Total Return for the 12 Months Ended October 31, 2022 | |
| Schwab S&P 500 Index Fund (Ticker Symbol: SWPPX) | -14.63% |
| S&P 500® Index | -14.61% |
| Fund Category: Morningstar Large Blend1 | -14.48% |
| Performance Details | pages 7-9 |
| Schwab 1000 Index Fund (Ticker Symbol: SNXFX) | -16.73% |
| Schwab 1000 Index® | -16.69% |
| Russell 1000® Index | -16.38% |
| Fund Category: Morningstar Large Blend1 | -14.48% |
| Performance Details | pages 10-12 |
| Schwab Small-Cap Index Fund (Ticker Symbol: SWSSX) | -18.53% |
| Russell 2000® Index | -18.54% |
| Fund Category: Morningstar Small Blend1 | -13.55% |
| Performance Details | pages 13-15 |
| Schwab Total Stock Market Index Fund (Ticker Symbol: SWTSX) | -16.94% |
| Dow Jones U.S. Total Stock Market IndexSM | -16.94% |
| Fund Category: Morningstar Large Blend1 | -14.48% |
| Performance Details | pages 16-18 |
| Total Return for the 12 Months Ended October 31, 2022 | |
| Schwab U.S. Large-Cap Growth Index Fund (Ticker Symbol: SWLGX) | -24.63% |
| Russell 1000® Growth Index | -24.60% |
| Fund Category: Morningstar Large Growth1 | -28.11% |
| Performance Details | pages 19-21 |
| Schwab U.S. Large-Cap Value Index Fund (Ticker Symbol: SWLVX) | -7.04% |
| Russell 1000® Value Index | -7.00% |
| Fund Category: Morningstar Large Value1 | -4.53% |
| Performance Details | pages 22-24 |
| Schwab U.S. Mid-Cap Index Fund (Ticker Symbol: SWMCX) | -17.15% |
| Russell Midcap® Index | -17.17% |
| Fund Category: Morningstar Mid-Cap Blend1 | -12.33% |
| Performance Details | pages 25-27 |
| Schwab International Index Fund2 (Ticker Symbol: SWISX) | -23.12% |
| MSCI EAFE® Index (Net)3 | -23.00% |
| Fund Category: Morningstar Foreign Large Blend1 | -24.04% |
| Performance Details | pages 28-30 |
| 1 | Source for category information: Morningstar, Inc. The Morningstar Category return represents all active and index mutual funds and ETFs within the category as of the report date. |
| 2 | The fund’s performance relative to the index may be affected by fair-value pricing and timing differences in foreign exchange calculations. See financial note 2 for more information. |
| 3 | The net version of the index reflects reinvested dividends net of withholding taxes but reflects no deductions for expenses or other taxes. |

President of Schwab Asset
Management and the funds
covered in this report.

| * | The net version of the index reflects reinvested dividends net of withholding taxes but reflects no deductions for expenses or other taxes. |

| * | The net version of the index reflects reinvested dividends net of withholding taxes but reflects no deductions for expenses or other taxes. |
 | Christopher Bliss, CFA, Managing Director and Head of Passive Equity Strategies for Schwab Asset Management, is responsible for overseeing the investment process and portfolio management of investment strategies for passive equity Schwab Funds and Schwab ETFs. Before joining Schwab in 2016, Mr. Bliss spent 12 years at BlackRock (formerly Barclays Global Investors) managing and leading institutional index teams, most recently as a managing director and the head of the Americas institutional index team. In this role, Mr. Bliss was responsible for overseeing a team of portfolio managers managing domestic, developed international and emerging markets index strategies. Prior to BlackRock, he worked as an equity analyst and portfolio manager for Harris Bretall and before that, as a research analyst for JP Morgan. |
 | Jeremy Brown, CFA, Senior Portfolio Manager, is responsible for the day-to-day co-management of the funds, except for the Schwab International Index Fund. Prior to joining Schwab in 2017, Mr. Brown spent six years with ALPS Advisors, Inc. in Denver, most recently as a senior analyst on the ETF portfolio management and research team where he performed portfolio management, trading, and analytics/research functions for ALPS ETFs and passive funds. Additionally, Mr. Brown led a number of investment research, commentary, industry trend analysis, and sales and marketing support initiatives. |
 | Chuck Craig, CFA, Senior Portfolio Manager, is responsible for the oversight and day-to-day co-management of the Schwab International Index Fund. Prior to joining Schwab in 2012, Mr. Craig worked at Guggenheim Funds (formerly Claymore Group), where he spent more than five years as a managing director of portfolio management and supervision, and three years as vice president of product research and development. Prior to that, he worked as an equity research analyst at First Trust Portfolios (formerly Niké Securities), and a trader and analyst at PMA Securities, Inc. |
 | Ferian Juwono, CFA, Senior Portfolio Manager, is responsible for the day-to-day co-management of the funds, except for the Schwab International Index Fund. Prior to joining Schwab in 2010, Mr. Juwono worked at BlackRock (formerly Barclays Global Investors) where he spent more than three years as a portfolio manager, managing equity index funds for institutional clients, and two years as a senior business analyst. Prior to that, Mr. Juwono worked for more than four years as a senior financial analyst with Union Bank of California. |
 | David Rios, Portfolio Manager, is responsible for the day-to-day co-management of the Schwab International Index Fund. Prior to this role, Mr. Rios was an associate portfolio manager on the equity index strategies team for four years. His first role with Schwab Asset Management was as a trade operations specialist. Prior to joining Schwab in 2008, Mr. Rios was a senior fund accountant at Investors Bank & Trust (subsequently acquired by State Street Corporation). |
 | Sabya Sinha, Portfolio Manager, is responsible for the day-to-day co-management of the funds, except for the Schwab International Index Fund. Prior to joining Schwab in 2015, Mr. Sinha spent a year at F-Squared Investments on the product development and analytics team. Prior to F-Squared, he worked at IndexIQ Advisors as a senior index portfolio manager for three years and for Bank of America’s Columbia Management subsidiary as a portfolio manager for three years. Mr. Sinha also spent time as a software consultant at DPM Mellon, LLC and an equity trader at Jane Street Capital. |
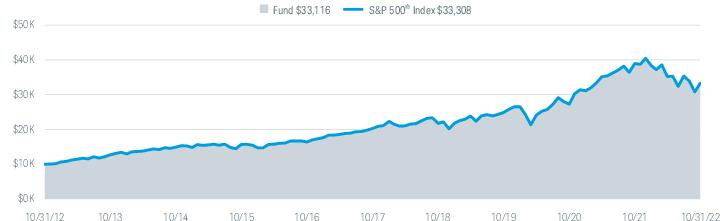
| Fund and Inception Date | 1 Year | 5 Years | 10 Years |
| Fund: Schwab S&P 500 Index Fund (5/19/97) | -14.63% | 10.41% | 12.72% |
| S&P 500® Index | -14.61% | 10.44% | 12.79% |
| Fund Category: Morningstar Large Blend2 | -14.48% | 9.03% | 11.44% |
| Fund Expense Ratio3: 0.02% | |||
| 1 | Performance does not reflect the deduction of taxes that a shareholder would pay on fund distributions or the redemption of fund shares. |
| 2 | Source for category information: Morningstar, Inc. The Morningstar Category return represents all active and index mutual funds and ETFs within the category as of the report date. |
| 3 | As stated in the prospectus. |
| Number of Holdings | 503 |
| Weighted Average Market Cap (millions) | $474,291 |
| Price/Earnings Ratio (P/E) | 19.2 |
| Price/Book Ratio (P/B) | 3.6 |
| Portfolio Turnover Rate | 2% |
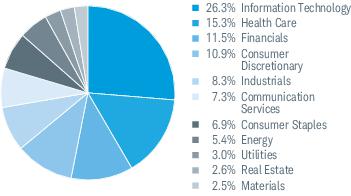
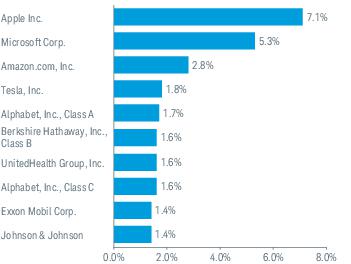
| 1 | Excludes derivatives. |
| 2 | The percentage may differ from the Portfolio Holdings because the above calculation is based on a percentage of total investments, excluding derivatives, whereas the calculation in the Portfolio Holdings is based on a percentage of net assets. |
| 3 | This list is not a recommendation of any security by the investment adviser. |
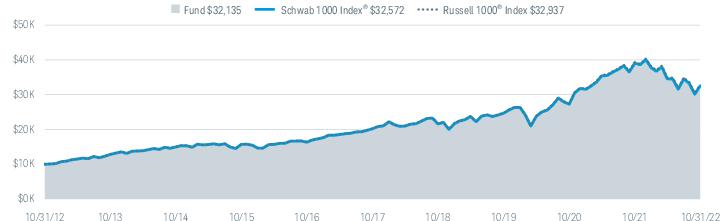
| Fund and Inception Date | 1 Year | 5 Years | 10 Years |
| Fund: Schwab 1000 Index Fund (4/2/91) | -16.73% | 9.97% | 12.38% |
| Schwab 1000 Index® | -16.69% | 10.02% | 12.53% |
| Russell 1000® Index | -16.38% | 10.19% | 12.66% |
| Fund Category: Morningstar Large Blend2 | -14.48% | 9.03% | 11.44% |
| Fund Expense Ratio3: 0.05% | |||
| 1 | Performance does not reflect the deduction of taxes that a shareholder would pay on fund distributions or the redemption of fund shares. |
| 2 | Source for category information: Morningstar, Inc. The Morningstar Category return represents all active and index mutual funds and ETFs within the category as of the report date. |
| 3 | As stated in the prospectus. |
| Number of Holdings | 992 2 |
| Weighted Average Market Cap (millions) | $427,530 |
| Price/Earnings Ratio (P/E) | 18.7 |
| Price/Book Ratio (P/B) | 3.5 |
| Portfolio Turnover Rate | 2% 3 |

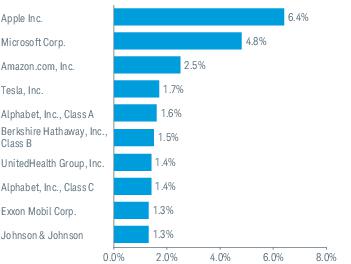
| 1 | Excludes derivatives. |
| 2 | As a result of the Schwab 1000 Index®’s once per year reconstitution and the effects of certain corporate actions, the fund may hold more or less than 1,000 securities. |
| 3 | Portfolio turnover rate excludes in-kind transactions. |
| 4 | The percentage may differ from the Portfolio Holdings because the above calculation is based on a percentage of total investments, excluding derivatives, whereas the calculation in the Portfolio Holdings is based on a percentage of net assets. |
| 5 | This list is not a recommendation of any security by the investment adviser. |
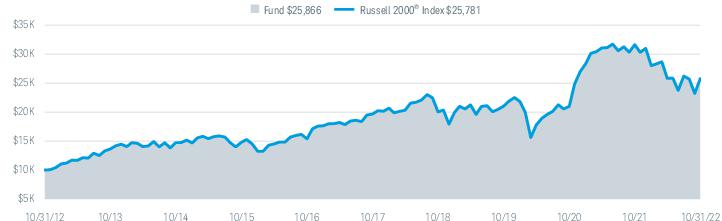
| Fund and Inception Date | 1 Year | 5 Years | 10 Years |
| Fund: Schwab Small-Cap Index Fund (5/19/97) | -18.53% | 5.62% | 9.97% |
| Russell 2000® Index | -18.54% | 5.56% | 9.93% |
| Fund Category: Morningstar Small Blend2 | -13.55% | 5.76% | 9.75% |
| Fund Expense Ratio3: 0.04% | |||
| 1 | Performance does not reflect the deduction of taxes that a shareholder would pay on fund distributions or the redemption of fund shares. |
| 2 | Source for category information: Morningstar, Inc. The Morningstar Category return represents all active and index mutual funds and ETFs within the category as of the report date. |
| 3 | As stated in the prospectus. |
| Number of Holdings | 1,964 |
| Weighted Average Market Cap (millions) | $2,797 |
| Price/Earnings Ratio (P/E) | 11.2 |
| Price/Book Ratio (P/B) | 1.9 |
| Portfolio Turnover Rate | 16% 2 |
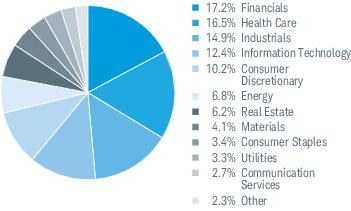
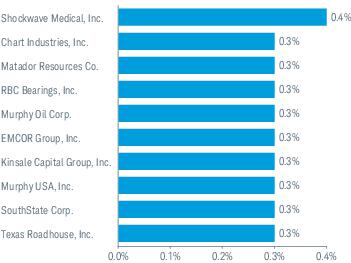
| 1 | Excludes derivatives. |
| 2 | Portfolio turnover rate excludes in-kind transactions. |
| 3 | The percentage may differ from the Portfolio Holdings because the above calculation is based on a percentage of total investments, excluding derivatives, whereas the calculation in the Portfolio Holdings is based on a percentage of net assets. |
| 4 | This list is not a recommendation of any security by the investment adviser. |
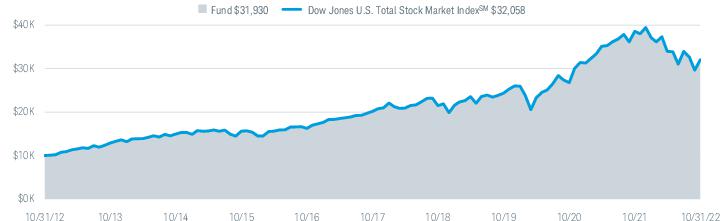
| Fund and Inception Date | 1 Year | 5 Years | 10 Years |
| Fund: Schwab Total Stock Market Index Fund (6/1/99) | -16.94% | 9.69% | 12.31% |
| Dow Jones U.S. Total Stock Market IndexSM | -16.94% | 9.72% | 12.36% |
| Fund Category: Morningstar Large Blend2 | -14.48% | 9.03% | 11.44% |
| Fund Expense Ratio3: 0.03% | |||
| 1 | Performance does not reflect the deduction of taxes that a shareholder would pay on fund distributions or the redemption of fund shares. |
| 2 | Source for category information: Morningstar, Inc. The Morningstar Category return represents all active and index mutual funds and ETFs within the category as of the report date. |
| 3 | As stated in the prospectus. |
| Number of Holdings | 3,517 |
| Weighted Average Market Cap (millions) | $402,286 |
| Price/Earnings Ratio (P/E) | 18.0 |
| Price/Book Ratio (P/B) | 3.3 |
| Portfolio Turnover Rate | 2% |
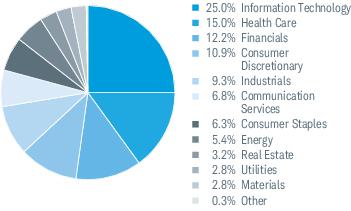
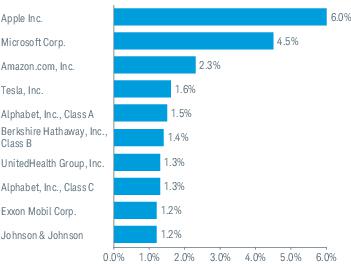
| 1 | Excludes derivatives. |
| 2 | The percentage may differ from the Portfolio Holdings because the above calculation is based on a percentage of total investments, excluding derivatives, whereas the calculation in the Portfolio Holdings is based on a percentage of net assets. |
| 3 | This list is not a recommendation of any security by the investment adviser. |
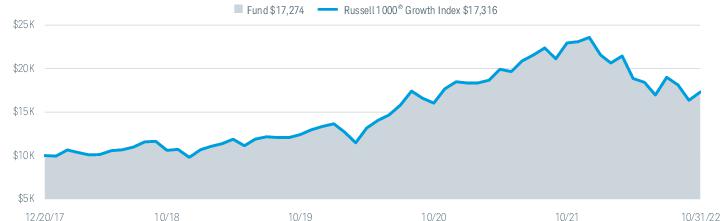
| Fund and Inception Date | 1 Year | 3 Years | Since Inception |
| Fund: Schwab U.S. Large-Cap Growth Index Fund (12/20/17) | -24.63% | 11.69% | 11.89% |
| Russell 1000® Growth Index | -24.60% | 11.75% | 11.95% |
| Fund Category: Morningstar Large Growth2 | -28.11% | 8.07% | N/A |
| Fund Expense Ratio3: 0.035% | |||
| 1 | Performance does not reflect the deduction of taxes that a shareholder would pay on fund distributions or the redemption of fund shares. |
| 2 | Source for category information: Morningstar, Inc. The Morningstar Category return represents all active and index mutual funds and ETFs within the category as of the report date. |
| 3 | As stated in the prospectus. |
| Number of Holdings | 514 |
| Weighted Average Market Cap (millions) | $721,291 |
| Price/Earnings Ratio (P/E) | 25.4 |
| Price/Book Ratio (P/B) | 8.8 |
| Portfolio Turnover Rate | 18% |
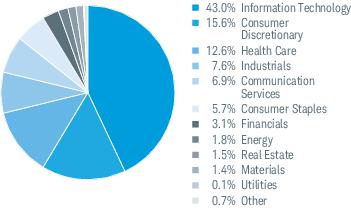
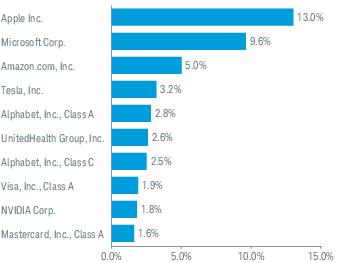
| 1 | Excludes derivatives. |
| 2 | The percentage may differ from the Portfolio Holdings because the above calculation is based on a percentage of total investments, excluding derivatives, whereas the calculation in the Portfolio Holdings is based on a percentage of net assets. |
| 3 | This list is not a recommendation of any security by the investment adviser. |

| Fund and Inception Date | 1 Year | 3 Years | Since Inception |
| Fund: Schwab U.S. Large-Cap Value Index Fund (12/20/17) | -7.04% | 7.23% | 6.41% |
| Russell 1000® Value Index | -7.00% | 7.31% | 6.49% |
| Fund Category: Morningstar Large Value2 | -4.53% | 8.42% | N/A |
| Fund Expense Ratio3: 0.035% | |||
| 1 | Performance does not reflect the deduction of taxes that a shareholder would pay on fund distributions or the redemption of fund shares. |
| 2 | Source for category information: Morningstar, Inc. The Morningstar Category return represents all active and index mutual funds and ETFs within the category as of the report date. |
| 3 | As stated in the prospectus. |
| Number of Holdings | 851 |
| Weighted Average Market Cap (millions) | $147,180 |
| Price/Earnings Ratio (P/E) | 14.7 |
| Price/Book Ratio (P/B) | 2.2 |
| Portfolio Turnover Rate | 15% 2 |
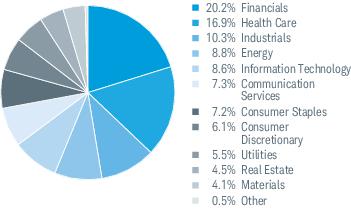
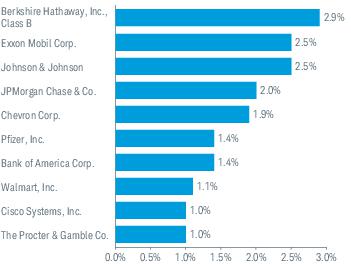
| 1 | Excludes derivatives. |
| 2 | Portfolio turnover rate excludes in-kind transactions. |
| 3 | The percentage may differ from the Portfolio Holdings because the above calculation is based on a percentage of total investments, excluding derivatives, whereas the calculation in the Portfolio Holdings is based on a percentage of net assets. |
| 4 | This list is not a recommendation of any security by the investment adviser. |
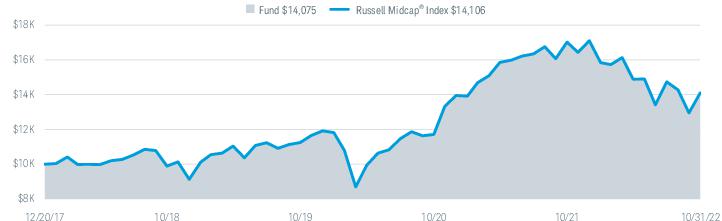
| Fund and Inception Date | 1 Year | 3 Years | Since Inception |
| Fund: Schwab U.S. Mid-Cap Index Fund (12/20/17) | -17.15% | 7.81% | 7.28% |
| Russell Midcap® Index | -17.17% | 7.84% | 7.33% |
| Fund Category: Morningstar Mid-Cap Blend2 | -12.33% | 8.05% | N/A |
| Fund Expense Ratio3: 0.04% | |||
| 1 | Performance does not reflect the deduction of taxes that a shareholder would pay on fund distributions or the redemption of fund shares. |
| 2 | Source for category information: Morningstar, Inc. The Morningstar Category return represents all active and index mutual funds and ETFs within the category as of the report date. |
| 3 | As stated in the prospectus. |
| Number of Holdings | 819 |
| Weighted Average Market Cap (millions) | $21,220 |
| Price/Earnings Ratio (P/E) | 15.8 |
| Price/Book Ratio (P/B) | 2.7 |
| Portfolio Turnover Rate | 11% 2 |
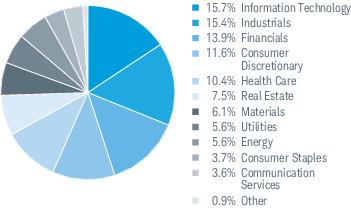
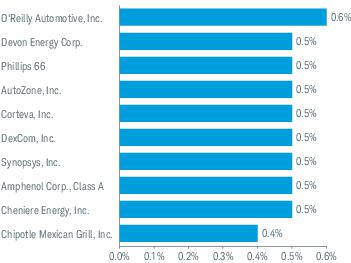
| 1 | Excludes derivatives. |
| 2 | Portfolio turnover rate excludes in-kind transactions. |
| 3 | The percentage may differ from the Portfolio Holdings because the above calculation is based on a percentage of total investments, excluding derivatives, whereas the calculation in the Portfolio Holdings is based on a percentage of net assets. |
| 4 | This list is not a recommendation of any security by the investment adviser. |
| 1 | The total return cited for the index reflects reinvested dividends net of withholding taxes but reflects no deductions for expenses or other taxes. |
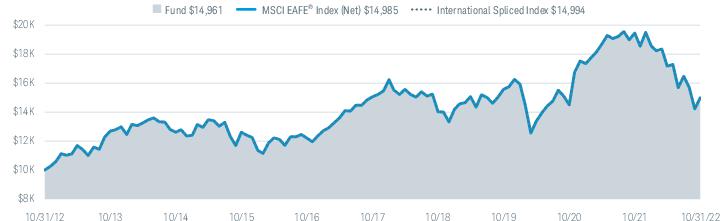
| Fund and Inception Date | 1 Year | 5 Years | 10 Years |
| Fund: Schwab International Index Fund (5/19/97) | -23.12% | -0.07% | 4.11% |
| MSCI EAFE® Index (Net)3 | -23.00% | -0.09% | 4.13% |
| International Spliced Index | -23.00% | -0.09% | 4.13% |
| Fund Category: Morningstar Foreign Large Blend4 | -24.04% | -0.51% | 3.75% |
| Fund Expense Ratio5: 0.06% | |||
| 1 | Performance does not reflect the deduction of taxes that a shareholder would pay on fund distributions or the redemption of fund shares. |
| 2 | The fund’s performance relative to the index may be affected by fair-value pricing. See financial note 2 for more information. |
| 3 | The net version of the index reflects reinvested dividends net of withholding taxes but reflects no deductions for expenses or other taxes. |
| 4 | Source for category information: Morningstar, Inc. The Morningstar Category return represents all active and index mutual funds and ETFs within the category as of the report date. |
| 5 | As stated in the prospectus. |
| Number of Holdings | 801 |
| Weighted Average Market Cap (millions) | $69,437 |
| Price/Earnings Ratio (P/E) | 11.5 |
| Price/Book Ratio (P/B) | 1.5 |
| Portfolio Turnover Rate | 5% |
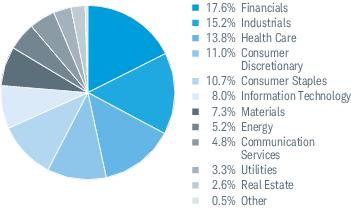
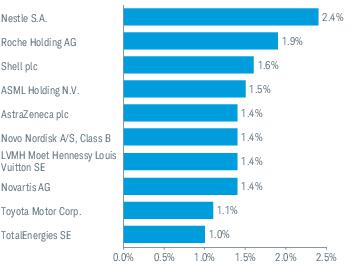
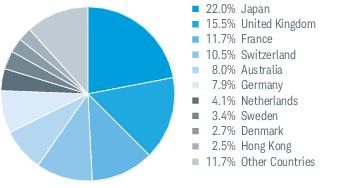
| 1 | Excludes derivatives. |
| 2 | This list is not a recommendation of any security by the investment adviser. |
| 3 | The percentage may differ from the Portfolio Holdings because the above calculation is based on a percentage of total investments, excluding derivatives, whereas the calculation in the Portfolio Holdings is based on a percentage of net assets. |
| EXPENSE RATIO (ANNUALIZED) 1 | BEGINNING ACCOUNT VALUE AT 5/1/22 | ENDING ACCOUNT VALUE (NET OF EXPENSES) AT 10/31/22 | EXPENSES PAID DURING PERIOD 5/1/22-10/31/22 2 | |
| Schwab S&P 500 Index Fund | ||||
| Actual Return | 0.02% | $1,000.00 | $ 944.90 | $0.10 |
| Hypothetical 5% Return | 0.02% | $1,000.00 | $1,025.10 | $0.10 |
| Schwab 1000 Index Fund | ||||
| Actual Return | 0.05% | $1,000.00 | $ 941.70 | $0.24 |
| Hypothetical 5% Return | 0.05% | $1,000.00 | $1,024.95 | $0.26 |
| Schwab Small-Cap Index Fund | ||||
| Actual Return | 0.04% | $1,000.00 | $ 998.00 | $0.20 |
| Hypothetical 5% Return | 0.04% | $1,000.00 | $1,025.00 | $0.20 |
| Schwab Total Stock Market Index Fund | ||||
| Actual Return | 0.03% | $1,000.00 | $ 943.50 | $0.15 |
| Hypothetical 5% Return | 0.03% | $1,000.00 | $1,025.05 | $0.15 |
| Schwab U.S. Large-Cap Growth Index Fund | ||||
| Actual Return | 0.035% | $1,000.00 | $ 917.50 | $0.17 |
| Hypothetical 5% Return | 0.035% | $1,000.00 | $1,025.03 | $0.18 |
| Schwab U.S. Large-Cap Value Index Fund | ||||
| Actual Return | 0.035% | $1,000.00 | $ 967.80 | $0.17 |
| Hypothetical 5% Return | 0.035% | $1,000.00 | $1,025.03 | $0.18 |
| Schwab U.S. Mid-Cap Index Fund | ||||
| Actual Return | 0.04% | $1,000.00 | $ 947.20 | $0.20 |
| Hypothetical 5% Return | 0.04% | $1,000.00 | $1,025.00 | $0.20 |
| Schwab International Index Fund | ||||
| Actual Return | 0.06% | $1,000.00 | $ 881.20 | $0.28 |
| Hypothetical 5% Return | 0.06% | $1,000.00 | $1,024.90 | $0.31 |
| 1 | Based on the most recent six-month expense ratio. |
| 2 | Expenses for each fund are equal to its annualized expense ratio, multiplied by the average account value over the period, multiplied by the 184 days of the period, and divided by the 365 days of the fiscal year. |
| 11/1/21– 10/31/22 | 11/1/20– 10/31/21 | 11/1/19– 10/31/20 | 11/1/18– 10/31/19 | 11/1/17– 10/31/18 | ||
| Per-Share Data | ||||||
| Net asset value at beginning of period | $71.21 | $50.75 | $47.17 | $42.41 | $40.23 | |
| Income (loss) from investment operations: | ||||||
| Net investment income (loss)1 | 0.97 | 0.90 | 1.02 | 0.92 | 0.80 | |
| Net realized and unrealized gains (losses) | (11.23) | 20.60 | 3.52 | 4.86 | 2.12 | |
| Total from investment operations | (10.26) | 21.50 | 4.54 | 5.78 | 2.92 | |
| Less distributions: | ||||||
| Distributions from net investment income | (0.86) | (1.04) | (0.87) | (0.84) | (0.72) | |
| Distributions from net realized gains | (0.07) | — | (0.09) | (0.18) | (0.02) | |
| Total distributions | (0.93) | (1.04) | (0.96) | (1.02) | (0.74) | |
| Net asset value at end of period | $60.02 | $71.21 | $50.75 | $47.17 | $42.41 | |
| Total return | (14.63%) | 42.89% | 9.69% | 14.30% | 7.29% | |
| Ratios/Supplemental Data | ||||||
| Ratios to average net assets: | ||||||
| Total expenses | 0.02% 2 | 0.02% | 0.02% | 0.02% 3 | 0.03% | |
| Net investment income (loss) | 1.49% | 1.42% | 2.11% | 2.11% | 1.88% | |
| Portfolio turnover rate | 2% | 3% | 4% | 3% | 2% | |
| Net assets, end of period (x 1,000,000) | $61,068 | $67,401 | $44,184 | $40,232 | $34,410 | |
| 1 | Calculated based on the average shares outstanding during the period. |
| 2 | Ratio includes less than 0.005% of non-routine proxy expenses. |
| 3 | Effective December 20, 2018, the annual operating expense ratio was reduced to 0.02%. The ratio presented for period ended 10/31/19 is a blended ratio. |
| SECURITY | NUMBER OF SHARES | VALUE ($) |
| COMMON STOCKS 99.6% OF NET ASSETS | ||
| Automobiles & Components 2.3% | ||
| Aptiv plc * | 506,421 | 46,119,760 |
| BorgWarner, Inc. | 443,720 | 16,652,812 |
| Ford Motor Co. | 7,384,468 | 98,730,337 |
| General Motors Co. | 2,726,310 | 107,007,667 |
| Tesla, Inc. * | 4,979,879 | 1,133,121,668 |
| 1,401,632,244 | ||
| Banks 3.9% | ||
| Bank of America Corp. | 13,070,837 | 471,072,966 |
| Citigroup, Inc. | 3,621,368 | 166,075,936 |
| Citizens Financial Group, Inc. | 927,053 | 37,916,468 |
| Comerica, Inc. | 243,532 | 17,169,006 |
| Fifth Third Bancorp | 1,282,432 | 45,769,998 |
| First Republic Bank | 341,246 | 40,983,645 |
| Huntington Bancshares, Inc. | 2,697,431 | 40,947,003 |
| JPMorgan Chase & Co. | 5,483,143 | 690,218,041 |
| KeyCorp | 1,746,000 | 31,201,020 |
| M&T Bank Corp. | 328,849 | 55,368,307 |
| Regions Financial Corp. | 1,744,377 | 38,289,075 |
| Signature Bank | 117,985 | 18,704,162 |
| SVB Financial Group * | 110,442 | 25,507,684 |
| The PNC Financial Services Group, Inc. | 766,881 | 124,104,352 |
| Truist Financial Corp. | 2,480,374 | 111,095,951 |
| U.S. Bancorp | 2,528,013 | 107,314,152 |
| Wells Fargo & Co. | 7,092,427 | 326,180,718 |
| Zions Bancorp NA | 280,374 | 14,562,626 |
| 2,362,481,110 | ||
| Capital Goods 5.7% | ||
| 3M Co. | 1,035,051 | 130,199,065 |
| A.O. Smith Corp. | 240,561 | 13,177,932 |
| Allegion plc | 163,982 | 17,180,394 |
| AMETEK, Inc. | 429,179 | 55,647,349 |
| Carrier Global Corp. | 1,575,186 | 62,629,395 |
| Caterpillar, Inc. | 987,068 | 213,660,739 |
| Cummins, Inc. | 263,248 | 64,366,769 |
| Deere & Co. | 520,037 | 205,841,045 |
| Dover Corp. | 267,899 | 35,011,720 |
| Eaton Corp. plc | 745,018 | 111,804,851 |
| Emerson Electric Co. | 1,105,950 | 95,775,270 |
| Fastenal Co. | 1,072,912 | 51,853,837 |
| Fortive Corp. | 664,852 | 42,484,043 |
| Fortune Brands Home & Security, Inc. | 241,526 | 14,568,848 |
| Generac Holdings, Inc. * | 118,996 | 13,792,826 |
| General Dynamics Corp. | 420,450 | 105,028,410 |
| General Electric Co. | 2,050,270 | 159,531,509 |
| Honeywell International, Inc. | 1,259,611 | 256,985,836 |
| Howmet Aerospace, Inc. | 693,109 | 24,640,025 |
| Huntington Ingalls Industries, Inc. | 74,823 | 19,234,749 |
| IDEX Corp. | 141,424 | 31,439,970 |
| Illinois Tool Works, Inc. | 526,778 | 112,482,906 |
| SECURITY | NUMBER OF SHARES | VALUE ($) |
| Ingersoll Rand, Inc. | 753,991 | 38,076,546 |
| Johnson Controls International plc | 1,288,192 | 74,509,025 |
| L3Harris Technologies, Inc. | 357,856 | 88,200,768 |
| Lockheed Martin Corp. | 441,214 | 214,730,030 |
| Masco Corp. | 423,385 | 19,590,024 |
| Nordson Corp. | 101,454 | 22,827,150 |
| Northrop Grumman Corp. | 271,915 | 149,284,054 |
| Otis Worldwide Corp. | 785,502 | 55,487,861 |
| PACCAR, Inc. | 649,239 | 62,865,813 |
| Parker-Hannifin Corp. | 240,277 | 69,829,302 |
| Pentair plc | 306,848 | 13,179,122 |
| Quanta Services, Inc. | 266,906 | 37,911,328 |
| Raytheon Technologies Corp. | 2,760,601 | 261,760,187 |
| Rockwell Automation, Inc. | 215,503 | 55,017,916 |
| Snap-on, Inc. | 99,829 | 22,167,030 |
| Stanley Black & Decker, Inc. | 277,454 | 21,777,365 |
| Textron, Inc. | 396,345 | 27,125,852 |
| The Boeing Co. * | 1,043,630 | 148,727,711 |
| Trane Technologies plc | 433,418 | 69,186,515 |
| TransDigm Group, Inc. | 96,199 | 55,387,536 |
| United Rentals, Inc. * | 130,875 | 41,318,546 |
| W.W. Grainger, Inc. | 84,603 | 49,437,763 |
| Westinghouse Air Brake Technologies Corp. | 339,883 | 31,704,286 |
| Xylem, Inc. | 336,903 | 34,508,974 |
| 3,501,948,192 | ||
| Commercial & Professional Services 0.8% | ||
| Cintas Corp. | 160,938 | 68,809,042 |
| Copart, Inc. * | 399,611 | 45,963,257 |
| CoStar Group, Inc. * | 741,391 | 61,327,864 |
| Equifax, Inc. | 228,757 | 38,783,462 |
| Jacobs Solutions, Inc. | 237,910 | 27,411,990 |
| Leidos Holdings, Inc. | 255,092 | 25,914,796 |
| Republic Services, Inc. | 383,423 | 50,849,558 |
| Robert Half International, Inc. | 204,070 | 15,603,192 |
| Rollins, Inc. | 430,697 | 18,123,730 |
| Verisk Analytics, Inc. | 293,056 | 53,579,428 |
| Waste Management, Inc. | 703,396 | 111,396,825 |
| 517,763,144 | ||
| Consumer Durables & Apparel 0.8% | ||
| D.R. Horton, Inc. | 590,941 | 45,431,544 |
| Garmin Ltd. | 289,150 | 25,456,766 |
| Hasbro, Inc. | 241,579 | 15,763,030 |
| Lennar Corp., Class A | 476,796 | 38,477,437 |
| Mohawk Industries, Inc. * | 98,136 | 9,298,386 |
| Newell Brands, Inc. | 700,388 | 9,672,358 |
| NIKE, Inc., Class B | 2,362,592 | 218,965,027 |
| NVR, Inc. * | 5,778 | 24,485,720 |
| PulteGroup, Inc. | 430,874 | 17,230,651 |
| Ralph Lauren Corp. | 79,809 | 7,397,496 |
| Tapestry, Inc. | 470,561 | 14,907,372 |
| VF Corp. | 620,883 | 17,539,945 |
| SECURITY | NUMBER OF SHARES | VALUE ($) |
| Whirlpool Corp. | 101,436 | 14,022,513 |
| 458,648,245 | ||
| Consumer Services 2.0% | ||
| Booking Holdings, Inc. * | 74,237 | 138,784,587 |
| Caesars Entertainment, Inc. * | 399,740 | 17,480,630 |
| Carnival Corp. * | 1,836,728 | 16,640,756 |
| Chipotle Mexican Grill, Inc. * | 51,948 | 77,835,247 |
| Darden Restaurants, Inc. | 229,528 | 32,854,638 |
| Domino’s Pizza, Inc. | 67,337 | 22,372,045 |
| Expedia Group, Inc. * | 284,773 | 26,617,732 |
| Hilton Worldwide Holdings, Inc. | 512,219 | 69,282,742 |
| Las Vegas Sands Corp. * | 616,601 | 23,437,004 |
| Marriott International, Inc., Class A | 516,148 | 82,640,456 |
| McDonald’s Corp. | 1,375,502 | 375,044,375 |
| MGM Resorts International | 607,375 | 21,604,329 |
| Norwegian Cruise Line Holdings Ltd. * | 784,974 | 13,258,211 |
| Royal Caribbean Cruises Ltd. * | 411,732 | 21,978,254 |
| Starbucks Corp. | 2,145,202 | 185,753,041 |
| Wynn Resorts Ltd. * | 194,092 | 12,402,479 |
| Yum! Brands, Inc. | 531,153 | 62,808,842 |
| 1,200,795,368 | ||
| Diversified Financials 5.2% | ||
| American Express Co. | 1,121,535 | 166,491,871 |
| Ameriprise Financial, Inc. | 202,615 | 62,632,349 |
| Berkshire Hathaway, Inc., Class B * | 3,374,664 | 995,829,600 |
| BlackRock, Inc. | 281,962 | 182,122,075 |
| Capital One Financial Corp. | 718,212 | 76,144,836 |
| Cboe Global Markets, Inc. | 199,081 | 24,785,584 |
| CME Group, Inc. | 672,149 | 116,483,422 |
| Discover Financial Services | 510,183 | 53,293,716 |
| FactSet Research Systems, Inc. | 70,969 | 30,196,600 |
| Franklin Resources, Inc. | 530,004 | 12,428,594 |
| Intercontinental Exchange, Inc. | 1,044,400 | 99,813,308 |
| Invesco Ltd. | 847,736 | 12,987,316 |
| MarketAxess Holdings, Inc. | 70,157 | 17,121,114 |
| Moody's Corp. | 295,321 | 78,221,673 |
| Morgan Stanley | 2,504,308 | 205,778,988 |
| MSCI, Inc. | 150,692 | 70,653,451 |
| Nasdaq, Inc. | 633,951 | 39,457,110 |
| Northern Trust Corp. | 389,102 | 32,820,754 |
| Raymond James Financial, Inc. | 362,771 | 42,857,766 |
| S&P Global, Inc. | 637,080 | 204,661,950 |
| State Street Corp. | 686,991 | 50,837,334 |
| Synchrony Financial | 901,682 | 32,063,812 |
| T. Rowe Price Group, Inc. | 421,400 | 44,735,824 |
| The Bank of New York Mellon Corp. | 1,377,489 | 58,006,062 |
| The Charles Schwab Corp. (a) | 2,843,646 | 226,553,277 |
| The Goldman Sachs Group, Inc. | 638,376 | 219,926,916 |
| 3,156,905,302 | ||
| Energy 5.3% | ||
| APA Corp. | 611,576 | 27,802,245 |
| Baker Hughes Co. | 1,890,976 | 52,304,396 |
| Chevron Corp. | 3,367,043 | 609,098,079 |
| ConocoPhillips | 2,380,299 | 300,131,901 |
| Coterra Energy, Inc. | 1,487,104 | 46,293,548 |
| Devon Energy Corp. | 1,224,350 | 94,703,472 |
| Diamondback Energy, Inc. | 332,251 | 52,199,955 |
| EOG Resources, Inc. | 1,095,768 | 149,594,247 |
| EQT Corp. | 689,662 | 28,855,458 |
| Exxon Mobil Corp. | 7,792,294 | 863,464,098 |
| Halliburton Co. | 1,695,123 | 61,736,380 |
| Hess Corp. | 521,452 | 73,566,448 |
| SECURITY | NUMBER OF SHARES | VALUE ($) |
| Kinder Morgan, Inc. | 3,709,744 | 67,220,561 |
| Marathon Oil Corp. | 1,267,200 | 38,586,240 |
| Marathon Petroleum Corp. | 932,322 | 105,930,426 |
| Occidental Petroleum Corp. | 1,393,353 | 101,157,428 |
| ONEOK, Inc. | 834,830 | 49,522,116 |
| Phillips 66 | 899,435 | 93,802,076 |
| Pioneer Natural Resources Co. | 446,250 | 114,422,962 |
| Schlumberger N.V. | 2,645,110 | 137,625,073 |
| Targa Resources Corp. | 422,758 | 28,903,964 |
| The Williams Cos., Inc. | 2,279,470 | 74,607,053 |
| Valero Energy Corp. | 736,643 | 92,485,529 |
| 3,264,013,655 | ||
| Food & Staples Retailing 1.6% | ||
| Costco Wholesale Corp. | 828,178 | 415,331,267 |
| Sysco Corp. | 952,791 | 82,473,589 |
| The Kroger Co. | 1,219,153 | 57,653,745 |
| Walgreens Boots Alliance, Inc. | 1,340,345 | 48,922,593 |
| Walmart, Inc. | 2,664,998 | 379,309,165 |
| 983,690,359 | ||
| Food, Beverage & Tobacco 3.7% | ||
| Altria Group, Inc. | 3,366,508 | 155,768,325 |
| Archer-Daniels-Midland Co. | 1,048,144 | 101,649,005 |
| Brown-Forman Corp., Class B | 341,350 | 23,211,800 |
| Campbell Soup Co. | 375,536 | 19,869,610 |
| Conagra Brands, Inc. | 899,195 | 33,000,456 |
| Constellation Brands, Inc., Class A | 298,139 | 73,664,184 |
| General Mills, Inc. | 1,114,327 | 90,906,797 |
| Hormel Foods Corp. | 542,570 | 25,202,377 |
| Kellogg Co. | 477,222 | 36,660,194 |
| Keurig Dr Pepper, Inc. | 1,590,676 | 61,781,856 |
| Lamb Weston Holdings, Inc. | 268,685 | 23,166,021 |
| McCormick & Co., Inc. - Non Voting Shares | 468,846 | 36,870,049 |
| Molson Coors Beverage Co., Class B | 351,061 | 17,704,006 |
| Mondelez International, Inc., Class A | 2,561,677 | 157,491,902 |
| Monster Beverage Corp. * | 719,894 | 67,468,466 |
| PepsiCo, Inc. | 2,580,110 | 468,496,374 |
| Philip Morris International, Inc. | 2,898,107 | 266,191,128 |
| The Coca-Cola Co. | 7,276,485 | 435,497,627 |
| The Hershey Co. | 274,950 | 65,649,811 |
| The JM Smucker Co. | 199,553 | 30,064,655 |
| The Kraft Heinz Co. | 1,487,615 | 57,228,549 |
| Tyson Foods, Inc., Class A | 540,634 | 36,952,334 |
| 2,284,495,526 | ||
| Health Care Equipment & Services 6.4% | ||
| Abbott Laboratories | 3,273,868 | 323,916,500 |
| ABIOMED, Inc. * | 85,266 | 21,493,853 |
| Align Technology, Inc. * | 136,161 | 26,456,082 |
| AmerisourceBergen Corp. | 290,573 | 45,683,887 |
| Baxter International, Inc. | 941,912 | 51,192,917 |
| Becton, Dickinson & Co. | 533,079 | 125,790,652 |
| Boston Scientific Corp. * | 2,676,428 | 115,380,811 |
| Cardinal Health, Inc. | 509,580 | 38,677,122 |
| Centene Corp. * | 1,068,790 | 90,986,093 |
| Cigna Corp. | 570,526 | 184,314,130 |
| CVS Health Corp. | 2,454,666 | 232,456,870 |
| DaVita, Inc. * | 103,669 | 7,568,874 |
| Dentsply Sirona, Inc. | 403,458 | 12,434,576 |
| DexCom, Inc. * | 734,556 | 88,719,674 |
| Edwards Lifesciences Corp. * | 1,159,217 | 83,962,087 |
| Elevance Health, Inc. | 448,750 | 245,363,037 |
| HCA Healthcare, Inc. | 402,584 | 87,549,942 |
| SECURITY | NUMBER OF SHARES | VALUE ($) |
| Henry Schein, Inc. * | 253,273 | 17,339,070 |
| Hologic, Inc. * | 466,294 | 31,614,733 |
| Humana, Inc. | 236,621 | 132,053,448 |
| IDEXX Laboratories, Inc. * | 155,451 | 55,912,616 |
| Intuitive Surgical, Inc. * | 667,592 | 164,541,400 |
| Laboratory Corp. of America Holdings | 169,040 | 37,503,214 |
| McKesson Corp. | 268,742 | 104,640,072 |
| Medtronic plc | 2,483,786 | 216,933,869 |
| Molina Healthcare, Inc. * | 108,634 | 38,984,397 |
| Quest Diagnostics, Inc. | 218,376 | 31,369,712 |
| ResMed, Inc. | 274,095 | 61,312,311 |
| STERIS plc | 186,855 | 32,247,436 |
| Stryker Corp. | 629,341 | 144,270,131 |
| Teleflex, Inc. | 87,780 | 18,834,077 |
| The Cooper Cos., Inc. | 92,498 | 25,288,028 |
| UnitedHealth Group, Inc. | 1,748,915 | 970,910,162 |
| Universal Health Services, Inc., Class B | 122,303 | 14,171,249 |
| Zimmer Biomet Holdings, Inc. | 392,136 | 44,448,616 |
| 3,924,321,648 | ||
| Household & Personal Products 1.6% | ||
| Church & Dwight Co., Inc. | 455,269 | 33,749,091 |
| Colgate-Palmolive Co. | 1,558,820 | 115,103,269 |
| Kimberly-Clark Corp. | 631,335 | 78,575,954 |
| The Clorox Co. | 230,166 | 33,613,443 |
| The Estee Lauder Cos., Inc., Class A | 433,523 | 86,917,026 |
| The Procter & Gamble Co. | 4,467,460 | 601,632,838 |
| 949,591,621 | ||
| Insurance 2.4% | ||
| Aflac, Inc. | 1,076,180 | 70,070,080 |
| American International Group, Inc. | 1,422,542 | 81,084,894 |
| Aon plc, Class A | 394,322 | 110,997,700 |
| Arch Capital Group Ltd. * | 690,182 | 39,685,465 |
| Arthur J. Gallagher & Co. | 393,642 | 73,642,545 |
| Assurant, Inc. | 99,739 | 13,550,541 |
| Brown & Brown, Inc. | 437,896 | 25,743,906 |
| Chubb Ltd. | 780,779 | 167,781,599 |
| Cincinnati Financial Corp. | 298,034 | 30,792,873 |
| Everest Re Group Ltd. | 73,379 | 23,676,468 |
| Globe Life, Inc. | 169,244 | 19,551,067 |
| Lincoln National Corp. | 288,297 | 15,530,560 |
| Loews Corp. | 372,414 | 21,235,046 |
| Marsh & McLennan Cos., Inc. | 932,809 | 150,639,326 |
| MetLife, Inc. | 1,253,212 | 91,747,651 |
| Principal Financial Group, Inc. | 433,594 | 38,212,639 |
| Prudential Financial, Inc. | 696,059 | 73,218,446 |
| The Allstate Corp. | 505,989 | 63,881,111 |
| The Hartford Financial Services Group, Inc. | 604,049 | 43,739,188 |
| The Progressive Corp. | 1,093,593 | 140,417,341 |
| The Travelers Cos., Inc. | 443,985 | 81,897,473 |
| W.R. Berkley Corp. | 382,643 | 28,460,986 |
| Willis Towers Watson plc | 205,448 | 44,830,808 |
| 1,450,387,713 | ||
| Materials 2.5% | ||
| Air Products & Chemicals, Inc. | 414,796 | 103,864,919 |
| Albemarle Corp. | 218,743 | 61,219,604 |
| Amcor plc | 2,805,926 | 32,492,623 |
| Avery Dennison Corp. | 152,062 | 25,782,112 |
| Ball Corp. | 588,913 | 29,086,413 |
| Celanese Corp. | 185,527 | 17,832,855 |
| CF Industries Holdings, Inc. | 372,579 | 39,590,245 |
| SECURITY | NUMBER OF SHARES | VALUE ($) |
| Corteva, Inc. | 1,343,990 | 87,816,307 |
| Dow, Inc. | 1,344,137 | 62,824,963 |
| DuPont de Nemours, Inc. | 935,582 | 53,515,290 |
| Eastman Chemical Co. | 228,608 | 17,559,381 |
| Ecolab, Inc. | 463,717 | 72,836,029 |
| FMC Corp. | 235,336 | 27,981,450 |
| Freeport-McMoRan, Inc. | 2,674,412 | 84,752,116 |
| International Flavors & Fragrances, Inc. | 476,225 | 46,484,322 |
| International Paper Co. | 674,790 | 22,679,692 |
| Linde plc | 931,893 | 277,098,384 |
| LyondellBasell Industries N.V., Class A | 475,902 | 36,382,708 |
| Martin Marietta Materials, Inc. | 116,836 | 39,254,559 |
| Newmont Corp. | 1,485,270 | 62,856,626 |
| Nucor Corp. | 488,768 | 64,214,340 |
| Packaging Corp. of America | 175,361 | 21,080,146 |
| PPG Industries, Inc. | 438,946 | 50,118,854 |
| Sealed Air Corp. | 272,683 | 12,985,165 |
| The Mosaic Co. | 646,023 | 34,723,736 |
| The Sherwin-Williams Co. | 441,011 | 99,240,705 |
| Vulcan Materials Co. | 248,854 | 40,737,400 |
| WestRock Co. | 474,667 | 16,167,158 |
| 1,541,178,102 | ||
| Media & Entertainment 6.1% | ||
| Activision Blizzard, Inc. | 1,331,138 | 96,906,847 |
| Alphabet, Inc., Class A * | 11,210,938 | 1,059,545,750 |
| Alphabet, Inc., Class C * | 10,024,769 | 948,944,634 |
| Charter Communications, Inc., Class A * | 207,464 | 76,267,916 |
| Comcast Corp., Class A | 8,233,311 | 261,325,291 |
| DISH Network Corp., Class A * | 474,787 | 7,079,074 |
| Electronic Arts, Inc. | 494,411 | 62,276,010 |
| Fox Corp., Class A | 576,644 | 16,647,712 |
| Fox Corp., Class B | 261,864 | 7,122,701 |
| Live Nation Entertainment, Inc. * | 264,422 | 21,050,636 |
| Match Group, Inc. * | 530,677 | 22,925,246 |
| Meta Platforms, Inc., Class A * | 4,264,157 | 397,248,866 |
| Netflix, Inc. * | 831,459 | 242,686,253 |
| News Corp., Class A | 717,362 | 12,101,897 |
| News Corp., Class B | 225,271 | 3,858,892 |
| Omnicom Group, Inc. | 383,735 | 27,916,721 |
| Paramount Global, Class B | 939,609 | 17,213,637 |
| Take-Two Interactive Software, Inc. * | 293,115 | 34,728,265 |
| The Interpublic Group of Cos., Inc. | 732,842 | 21,831,363 |
| The Walt Disney Co. * | 3,408,393 | 363,130,190 |
| Warner Bros Discovery, Inc. * | 4,126,456 | 53,643,928 |
| 3,754,451,829 | ||
| Pharmaceuticals, Biotechnology & Life Sciences 8.8% | ||
| AbbVie, Inc. | 3,305,660 | 483,948,624 |
| Agilent Technologies, Inc. | 558,775 | 77,306,521 |
| Amgen, Inc. | 1,000,025 | 270,356,759 |
| Biogen, Inc. * | 271,547 | 76,967,282 |
| Bio-Rad Laboratories, Inc., Class A * | 40,152 | 14,121,860 |
| Bio-Techne Corp. | 73,156 | 21,673,197 |
| Bristol-Myers Squibb Co. | 3,991,960 | 309,257,141 |
| Catalent, Inc. * | 335,553 | 22,055,899 |
| Charles River Laboratories International, Inc. * | 95,368 | 20,241,858 |
| Danaher Corp. | 1,223,838 | 308,003,309 |
| Eli Lilly & Co. | 1,474,504 | 533,903,153 |
| Gilead Sciences, Inc. | 2,342,970 | 183,829,426 |
| Illumina, Inc. * | 294,065 | 67,287,953 |
| Incyte Corp. * | 345,992 | 25,721,045 |
| SECURITY | NUMBER OF SHARES | VALUE ($) |
| IQVIA Holdings, Inc. * | 349,038 | 73,182,797 |
| Johnson & Johnson | 4,915,583 | 855,163,974 |
| Merck & Co., Inc. | 4,736,208 | 479,304,250 |
| Mettler-Toledo International, Inc. * | 42,134 | 53,296,561 |
| Moderna, Inc. * | 629,143 | 94,579,067 |
| Organon & Co. | 478,099 | 12,516,632 |
| PerkinElmer, Inc. | 235,922 | 31,514,461 |
| Pfizer, Inc. | 10,493,140 | 488,455,667 |
| Regeneron Pharmaceuticals, Inc. * | 200,398 | 150,048,002 |
| Thermo Fisher Scientific, Inc. | 732,388 | 376,425,460 |
| Vertex Pharmaceuticals, Inc. * | 479,464 | 149,592,768 |
| Viatris, Inc. | 2,270,485 | 23,000,013 |
| Waters Corp. * | 111,827 | 33,455,284 |
| West Pharmaceutical Services, Inc. | 138,757 | 31,927,986 |
| Zoetis, Inc. | 875,056 | 131,940,944 |
| 5,399,077,893 | ||
| Real Estate 2.6% | ||
| Alexandria Real Estate Equities, Inc. | 277,933 | 40,383,665 |
| American Tower Corp. | 870,636 | 180,387,073 |
| AvalonBay Communities, Inc. | 261,081 | 45,720,505 |
| Boston Properties, Inc. | 266,758 | 19,393,307 |
| Camden Property Trust | 198,500 | 22,936,675 |
| CBRE Group, Inc., Class A * | 600,171 | 42,576,131 |
| Crown Castle, Inc. | 809,881 | 107,924,742 |
| Digital Realty Trust, Inc. | 536,649 | 53,799,062 |
| Equinix, Inc. | 170,336 | 96,485,124 |
| Equity Residential | 632,836 | 39,881,325 |
| Essex Property Trust, Inc. | 121,461 | 26,993,493 |
| Extra Space Storage, Inc. | 249,947 | 44,350,596 |
| Federal Realty Investment Trust | 135,768 | 13,438,317 |
| Healthpeak Properties, Inc. | 1,008,708 | 23,936,641 |
| Host Hotels & Resorts, Inc. | 1,337,062 | 25,243,730 |
| Invitation Homes, Inc. | 1,085,313 | 34,393,569 |
| Iron Mountain, Inc. | 544,985 | 27,287,399 |
| Kimco Realty Corp. | 1,156,229 | 24,720,176 |
| Mid-America Apartment Communities, Inc. | 215,239 | 33,889,380 |
| Prologis, Inc. | 1,726,555 | 191,215,966 |
| Public Storage | 295,558 | 91,549,090 |
| Realty Income Corp. | 1,155,641 | 71,961,765 |
| Regency Centers Corp. | 289,085 | 17,492,533 |
| SBA Communications Corp. | 202,073 | 54,539,503 |
| Simon Property Group, Inc. | 612,631 | 66,764,526 |
| UDR, Inc. | 569,057 | 22,625,706 |
| Ventas, Inc. | 746,322 | 29,203,580 |
| VICI Properties, Inc. | 1,798,306 | 57,581,758 |
| Vornado Realty Trust | 300,400 | 7,086,436 |
| Welltower, Inc. | 865,130 | 52,807,535 |
| Weyerhaeuser Co. | 1,385,349 | 42,848,845 |
| 1,609,418,153 | ||
| Retailing 5.8% | ||
| Advance Auto Parts, Inc. | 113,473 | 21,550,792 |
| Amazon.com, Inc. * | 16,571,504 | 1,697,584,870 |
| AutoZone, Inc. * | 36,440 | 92,298,147 |
| Bath & Body Works, Inc. | 424,854 | 14,181,627 |
| Best Buy Co., Inc. | 374,874 | 25,645,130 |
| CarMax, Inc. * | 297,006 | 18,714,348 |
| Dollar General Corp. | 424,477 | 108,262,859 |
| Dollar Tree, Inc. * | 394,064 | 62,459,144 |
| eBay, Inc. | 1,026,924 | 40,912,652 |
| Etsy, Inc. * | 237,163 | 22,271,977 |
| Genuine Parts Co. | 264,890 | 47,113,335 |
| LKQ Corp. | 485,919 | 27,036,533 |
| Lowe’s Cos., Inc. | 1,195,041 | 232,973,243 |
| SECURITY | NUMBER OF SHARES | VALUE ($) |
| O'Reilly Automotive, Inc. * | 119,208 | 99,797,361 |
| Pool Corp. | 74,275 | 22,596,683 |
| Ross Stores, Inc. | 654,853 | 62,662,884 |
| Target Corp. | 867,054 | 142,413,620 |
| The Home Depot, Inc. | 1,921,638 | 569,054,661 |
| The TJX Cos., Inc. | 2,190,858 | 157,960,862 |
| Tractor Supply Co. | 207,454 | 45,592,166 |
| Ulta Beauty, Inc. * | 96,856 | 40,618,501 |
| 3,551,701,395 | ||
| Semiconductors & Semiconductor Equipment 4.7% | ||
| Advanced Micro Devices, Inc. * | 3,018,117 | 181,268,107 |
| Analog Devices, Inc. | 971,651 | 138,576,866 |
| Applied Materials, Inc. | 1,626,309 | 143,586,822 |
| Broadcom, Inc. | 754,969 | 354,926,026 |
| Enphase Energy, Inc. * | 253,389 | 77,790,423 |
| Intel Corp. | 7,676,487 | 218,242,525 |
| KLA Corp. | 265,249 | 83,938,046 |
| Lam Research Corp. | 256,125 | 103,674,277 |
| Microchip Technology, Inc. | 1,034,259 | 63,855,151 |
| Micron Technology, Inc. | 2,062,431 | 111,577,517 |
| Monolithic Power Systems, Inc. | 83,162 | 28,229,341 |
| NVIDIA Corp. | 4,681,668 | 631,884,730 |
| NXP Semiconductors N.V. | 491,383 | 71,781,229 |
| ON Semiconductor Corp. * | 810,232 | 49,772,552 |
| Qorvo, Inc. * | 191,995 | 16,526,930 |
| QUALCOMM, Inc. | 2,099,588 | 247,037,524 |
| Skyworks Solutions, Inc. | 299,393 | 25,750,792 |
| SolarEdge Technologies, Inc. * | 104,306 | 23,993,509 |
| Teradyne, Inc. | 293,936 | 23,911,693 |
| Texas Instruments, Inc. | 1,708,116 | 274,374,673 |
| 2,870,698,733 | ||
| Software & Services 12.7% | ||
| Accenture plc, Class A | 1,182,673 | 335,760,865 |
| Adobe, Inc. * | 874,973 | 278,678,900 |
| Akamai Technologies, Inc. * | 296,574 | 26,196,381 |
| ANSYS, Inc. * | 162,790 | 36,002,636 |
| Autodesk, Inc. * | 406,360 | 87,082,948 |
| Automatic Data Processing, Inc. | 776,898 | 187,776,247 |
| Broadridge Financial Solutions, Inc. | 218,834 | 32,838,230 |
| Cadence Design Systems, Inc. * | 512,319 | 77,559,973 |
| Ceridian HCM Holding, Inc. * | 284,748 | 18,847,470 |
| Cognizant Technology Solutions Corp., Class A | 969,370 | 60,343,283 |
| DXC Technology Co. * | 427,773 | 12,298,474 |
| EPAM Systems, Inc. * | 107,223 | 37,528,050 |
| Fidelity National Information Services, Inc. | 1,136,750 | 94,338,882 |
| Fiserv, Inc. * | 1,195,838 | 122,860,396 |
| FleetCor Technologies, Inc. * | 140,550 | 26,159,166 |
| Fortinet, Inc. * | 1,224,626 | 69,999,622 |
| Gartner, Inc. * | 147,810 | 44,626,795 |
| Global Payments, Inc. | 518,790 | 59,276,945 |
| International Business Machines Corp. | 1,688,670 | 233,526,174 |
| Intuit, Inc. | 527,369 | 225,450,247 |
| Jack Henry & Associates, Inc. | 135,832 | 27,038,718 |
| Mastercard, Inc., Class A | 1,595,261 | 523,532,755 |
| Microsoft Corp. | 13,944,006 | 3,236,822,113 |
| NortonLifeLock, Inc. | 1,109,996 | 25,008,210 |
| Oracle Corp. | 2,839,915 | 221,712,164 |
| Paychex, Inc. | 599,583 | 70,936,665 |
| Paycom Software, Inc. * | 90,950 | 31,468,700 |
| PayPal Holdings, Inc. * | 2,162,277 | 180,723,112 |
| PTC, Inc. * | 196,713 | 23,178,693 |
| SECURITY | NUMBER OF SHARES | VALUE ($) |
| Roper Technologies, Inc. | 198,301 | 82,203,697 |
| Salesforce, Inc. * | 1,860,280 | 302,462,925 |
| ServiceNow, Inc. * | 377,653 | 158,893,723 |
| Synopsys, Inc. * | 286,116 | 83,703,236 |
| Tyler Technologies, Inc. * | 77,866 | 25,176,414 |
| VeriSign, Inc. * | 174,654 | 35,011,141 |
| Visa, Inc., Class A | 3,056,991 | 633,286,256 |
| 7,728,310,206 | ||
| Technology Hardware & Equipment 8.8% | ||
| Amphenol Corp., Class A | 1,112,181 | 84,336,685 |
| Apple Inc. | 28,244,698 | 4,331,041,991 |
| Arista Networks, Inc. * | 460,038 | 55,600,193 |
| CDW Corp. | 252,820 | 43,689,824 |
| Cisco Systems, Inc. | 7,742,811 | 351,755,904 |
| Corning, Inc. | 1,421,601 | 45,732,904 |
| F5, Inc. * | 110,747 | 15,826,854 |
| Hewlett Packard Enterprise Co. | 2,431,102 | 34,691,825 |
| HP, Inc. | 1,700,377 | 46,964,413 |
| Juniper Networks, Inc. | 602,018 | 18,421,751 |
| Keysight Technologies, Inc. * | 335,974 | 58,509,872 |
| Motorola Solutions, Inc. | 312,226 | 77,965,953 |
| NetApp, Inc. | 411,600 | 28,511,532 |
| Seagate Technology Holdings plc | 365,759 | 18,163,592 |
| TE Connectivity Ltd. | 598,278 | 73,127,520 |
| Teledyne Technologies, Inc. * | 87,577 | 34,853,894 |
| Trimble, Inc. * | 463,985 | 27,913,338 |
| Western Digital Corp. * | 584,502 | 20,089,334 |
| Zebra Technologies Corp., Class A * | 97,029 | 27,480,553 |
| 5,394,677,932 | ||
| Telecommunication Services 1.2% | ||
| AT&T, Inc. | 13,324,096 | 242,898,270 |
| Lumen Technologies, Inc. | 1,772,767 | 13,047,565 |
| T-Mobile US, Inc. * | 1,125,646 | 170,602,908 |
| Verizon Communications, Inc. | 7,852,359 | 293,442,656 |
| 719,991,399 | ||
| Transportation 1.7% | ||
| Alaska Air Group, Inc. * | 237,505 | 10,559,472 |
| American Airlines Group, Inc. * | 1,215,633 | 17,237,676 |
| C.H. Robinson Worldwide, Inc. | 232,246 | 22,695,079 |
| CSX Corp. | 4,003,360 | 116,337,642 |
| Delta Air Lines, Inc. * | 1,198,575 | 40,667,650 |
| Expeditors International of Washington, Inc. | 306,169 | 29,958,637 |
| FedEx Corp. | 447,304 | 71,693,885 |
| JB Hunt Transport Services, Inc. | 155,109 | 26,534,497 |
| Norfolk Southern Corp. | 439,159 | 100,158,993 |
| Old Dominion Freight Line, Inc. | 171,457 | 47,082,092 |
| Southwest Airlines Co. * | 1,107,805 | 40,268,712 |
| Union Pacific Corp. | 1,167,587 | 230,178,101 |
| United Airlines Holdings, Inc. * | 611,594 | 26,347,469 |
| SECURITY | NUMBER OF SHARES | VALUE ($) |
| United Parcel Service, Inc., Class B | 1,367,951 | 229,501,139 |
| 1,009,221,044 | ||
| Utilities 3.0% | ||
| Alliant Energy Corp. | 470,604 | 24,551,411 |
| Ameren Corp. | 483,103 | 39,382,556 |
| American Electric Power Co., Inc. | 960,699 | 84,464,656 |
| American Water Works Co., Inc. | 339,494 | 49,342,058 |
| Atmos Energy Corp. | 262,055 | 27,921,960 |
| CenterPoint Energy, Inc. | 1,179,452 | 33,744,122 |
| CMS Energy Corp. | 541,406 | 30,887,212 |
| Consolidated Edison, Inc. | 664,019 | 58,407,111 |
| Constellation Energy Corp. | 610,235 | 57,691,617 |
| Dominion Energy, Inc. | 1,556,082 | 108,879,057 |
| DTE Energy Co. | 362,152 | 40,600,861 |
| Duke Energy Corp. | 1,439,571 | 134,139,226 |
| Edison International | 712,600 | 42,784,504 |
| Entergy Corp. | 380,335 | 40,749,092 |
| Evergy, Inc. | 429,171 | 26,235,223 |
| Eversource Energy | 646,776 | 49,336,073 |
| Exelon Corp. | 1,855,471 | 71,602,626 |
| FirstEnergy Corp. | 1,014,697 | 38,264,224 |
| NextEra Energy, Inc. | 3,673,570 | 284,701,675 |
| NiSource, Inc. | 759,802 | 19,519,313 |
| NRG Energy, Inc. | 437,620 | 19,430,328 |
| PG&E Corp. * | 3,014,434 | 45,005,500 |
| Pinnacle West Capital Corp. | 210,365 | 14,138,632 |
| PPL Corp. | 1,378,573 | 36,518,399 |
| Public Service Enterprise Group, Inc. | 933,885 | 52,362,932 |
| Sempra Energy | 587,728 | 88,711,664 |
| The AES Corp. | 1,250,130 | 32,703,401 |
| The Southern Co. | 1,987,464 | 130,139,143 |
| WEC Energy Group, Inc. | 588,996 | 53,793,005 |
| Xcel Energy, Inc. | 1,023,703 | 66,653,302 |
| 1,802,660,883 | ||
| Total Common Stocks (Cost $30,115,261,432) | 60,838,061,696 | |
| Total Investments in Securities (Cost $30,115,261,432) | 60,838,061,696 | |
| NUMBER OF CONTRACTS | NOTIONAL AMOUNT ($) | CURRENT VALUE/ UNREALIZED APPRECIATION ($) | |
| FUTURES CONTRACTS | |||
| Long | |||
| S&P 500 Index, e-mini, expires 12/16/22 | 1,188 | 230,650,200 | 8,073,980 |
| * | Non-income producing security. |
| (a) | Issuer is affiliated with the fund’s investment adviser. |
| SECURITY | VALUE AT 10/31/21 | PURCHASES | SALES | REALIZED GAINS (LOSSES) | NET CHANGE IN UNREALIZED APPRECIATION (DEPRECIATION) | VALUE AT 10/31/22 | BALANCE OF SHARES HELD AT 10/31/22 | DIVIDENDS RECEIVED |
| COMMON STOCKS 0.4% OF NET ASSETS | ||||||||
| Diversified Financials 0.4% | ||||||||
| The Charles Schwab Corp. | $210,537,870 | $21,918,562 | ($445,373) | ($5,215) | ($5,452,567) | $226,553,277 | 2,843,646 | $2,159,346 |
| DESCRIPTION | QUOTED PRICES IN ACTIVE MARKETS FOR IDENTICAL ASSETS (LEVEL 1) | OTHER SIGNIFICANT OBSERVABLE INPUTS (LEVEL 2) | SIGNIFICANT UNOBSERVABLE INPUTS (LEVEL 3) | TOTAL |
| Assets | ||||
| Common Stocks1 | $60,838,061,696 | $— | $— | $60,838,061,696 |
| Futures Contracts2 | 8,073,980 | — | — | 8,073,980 |
| Total | $60,846,135,676 | $— | $— | $60,846,135,676 |
| 1 | As categorized in the Portfolio Holdings. |
| 2 | Futures contracts are reported at cumulative unrealized appreciation or depreciation. |
| Assets | ||
| Investments in securities, at value - affiliated (cost $92,203,920) | $226,553,277 | |
| Investments in securities, at value - unaffiliated (cost $30,023,057,512) | 60,611,508,419 | |
| Cash | 344,194,263 | |
| Deposit with broker for futures contracts | 18,900,000 | |
| Receivables: | ||
| Fund shares sold | 59,214,222 | |
| Dividends | 44,815,579 | |
| Income from securities on loan | + | 1,200 |
| Total assets | 61,305,186,960 | |
| Liabilities | ||
| Payables: | ||
| Investments bought | 152,291,357 | |
| Fund shares redeemed | 82,061,073 | |
| Variation margin on futures contracts | 1,560,103 | |
| Investment adviser fees | + | 930,633 |
| Total liabilities | 236,843,166 | |
| Net assets | $61,068,343,794 | |
| Net Assets by Source | ||
| Capital received from investors | $30,062,293,837 | |
| Total distributable earnings | + | 31,006,049,957 |
| Net assets | $61,068,343,794 | |
| Net Asset Value (NAV) | ||||
| Net Assets | ÷ | Shares Outstanding | = | NAV |
| $61,068,343,794 | 1,017,497,203 | $60.02 | ||
| For the period November 1, 2021 through October 31, 2022 | ||
| Investment Income | ||
| Dividends received from securities - unaffiliated (net of foreign withholding tax of $222,410) | $977,922,706 | |
| Dividends received from securities - affiliated | 2,159,346 | |
| Interest received from securities - unaffiliated | 1,283,070 | |
| Securities on loan, net | + | 22,236 |
| Total investment income | 981,387,358 | |
| Expenses | ||
| Investment adviser fees | 12,965,469 | |
| Proxy fees1 | + | 1,474,631 |
| Total expenses | – | 14,440,100 |
| Net investment income | 966,947,258 | |
| REALIZED AND UNREALIZED GAINS (LOSSES) | ||
| Net realized losses on sales of securities - affiliated | (5,215) | |
| Net realized losses on sales of securities - unaffiliated | (116,133,262) | |
| Net realized losses on futures contracts | + | (46,274,693) |
| Net realized losses | (162,413,170) | |
| Net change in unrealized appreciation (depreciation) on securities - affiliated | (5,452,567) | |
| Net change in unrealized appreciation (depreciation) on securities - unaffiliated | (11,085,028,625) | |
| Net change in unrealized appreciation (depreciation) on futures contracts | + | (6,755,572) |
| Net change in unrealized appreciation (depreciation) | + | (11,097,236,764) |
| Net realized and unrealized losses | (11,259,649,934) | |
| Decrease in net assets resulting from operations | ($10,292,702,676) | |
| 1 | Proxy fees are non-routine expenses (see financial note 2(e) for additional information). |
| OPERATIONS | |||
| 11/1/21-10/31/22 | 11/1/20-10/31/21 | ||
| Net investment income | $966,947,258 | $819,770,960 | |
| Net realized gains (losses) | (162,413,170) | 171,562,608 | |
| Net change in unrealized appreciation (depreciation) | + | (11,097,236,764) | 18,463,816,059 |
| Increase (decrease) in net assets resulting from operations | ($10,292,702,676) | $19,455,149,627 | |
| DISTRIBUTIONS TO SHAREHOLDERS | |||
| Total distributions | ($892,809,698) | ($913,293,066) | |
| TRANSACTIONS IN FUND SHARES | |||||
| 11/1/21-10/31/22 | 11/1/20-10/31/21 | ||||
| SHARES | VALUE | SHARES | VALUE | ||
| Shares sold | 210,459,089 | $13,861,852,248 | 196,724,074 | $12,273,054,924 | |
| Shares reinvested | 10,113,772 | 728,899,804 | 13,207,873 | 748,622,260 | |
| Shares redeemed | + | (149,593,128) | (9,738,121,330) | (133,977,878) | (8,346,566,792) |
| Net transactions in fund shares | 70,979,733 | $4,852,630,722 | 75,954,069 | $4,675,110,392 | |
| SHARES OUTSTANDING AND NET ASSETS | |||||
| 11/1/21-10/31/22 | 11/1/20-10/31/21 | ||||
| SHARES | NET ASSETS | SHARES | NET ASSETS | ||
| Beginning of period | 946,517,470 | $67,401,225,446 | 870,563,401 | $44,184,258,493 | |
| Total increase (decrease) | + | 70,979,733 | (6,332,881,652) | 75,954,069 | 23,216,966,953 |
| End of period | 1,017,497,203 | $61,068,343,794 | 946,517,470 | $67,401,225,446 | |
| 11/1/21– 10/31/22 | 11/1/20– 10/31/21 | 11/1/19– 10/31/20 | 11/1/18– 10/31/19 | 11/1/17– 10/31/18 | ||
| Per-Share Data | ||||||
| Net asset value at beginning of period | $102.69 | $73.73 | $68.68 | $64.19 | $62.61 | |
| Income (loss) from investment operations: | ||||||
| Net investment income (loss)1 | 1.29 | 1.24 | 1.38 | 1.38 | 1.18 | |
| Net realized and unrealized gains (losses) | (18.14) | 30.02 | 5.81 | 6.73 | 3.05 | |
| Total from investment operations | (16.85) | 31.26 | 7.19 | 8.11 | 4.23 | |
| Less distributions: | ||||||
| Distributions from net investment income | (1.23) | (1.42) | (1.29) | (1.28) | (1.10) | |
| Distributions from net realized gains | (0.58) | (0.88) | (0.85) | (2.34) | (1.55) | |
| Total distributions | (1.81) | (2.30) | (2.14) | (3.62) | (2.65) | |
| Net asset value at end of period | $84.03 | $102.69 | $73.73 | $68.68 | $64.19 | |
| Total return | (16.73%) | 43.16% | 10.60% | 14.20% | 6.84% | |
| Ratios/Supplemental Data | ||||||
| Ratios to average net assets: | ||||||
| Total expenses | 0.05% 2 | 0.05% | 0.05% | 0.05% | 0.05% | |
| Net investment income (loss) | 1.40% | 1.36% | 1.97% | 2.15% | 1.82% | |
| Portfolio turnover rate | 2% 3 | 5% 3 | 4% | 5% | 4% | |
| Net assets, end of period (x 1,000,000) | $11,888 | $14,222 | $9,774 | $9,346 | $7,909 | |
| 1 | Calculated based on the average shares outstanding during the period. |
| 2 | Ratio includes less than 0.005% of non-routine proxy expenses. |
| 3 | Portfolio turnover rate excludes in-kind transactions. |
| SECURITY | NUMBER OF SHARES | VALUE ($) |
| COMMON STOCKS 99.5% OF NET ASSETS | ||
| Automobiles & Components 2.2% | ||
| Aptiv plc * | 88,348 | 8,045,852 |
| Autoliv, Inc. | 25,769 | 2,070,539 |
| BorgWarner, Inc. | 76,930 | 2,887,183 |
| Ford Motor Co. | 1,289,595 | 17,241,885 |
| General Motors Co. | 476,059 | 18,685,316 |
| Gentex Corp. | 77,278 | 2,047,094 |
| Harley-Davidson, Inc. | 43,452 | 1,868,436 |
| Lear Corp. | 19,253 | 2,670,584 |
| Lucid Group, Inc. *(a) | 191,372 | 2,734,706 |
| Rivian Automotive, Inc., Class A * | 178,128 | 6,229,136 |
| Tesla, Inc. * | 869,582 | 197,864,688 |
| Thor Industries, Inc. | 17,868 | 1,455,706 |
| 263,801,125 | ||
| Banks 4.0% | ||
| Bank of America Corp. | 2,282,382 | 82,257,047 |
| Bank OZK | 35,969 | 1,545,948 |
| BOK Financial Corp. | 9,558 | 1,053,196 |
| Cadence Bank | 59,396 | 1,642,299 |
| Citigroup, Inc. | 632,223 | 28,993,747 |
| Citizens Financial Group, Inc. | 161,661 | 6,611,935 |
| Comerica, Inc. | 42,559 | 3,000,409 |
| Commerce Bancshares, Inc. | 35,445 | 2,510,924 |
| Cullen/Frost Bankers, Inc. | 20,943 | 3,247,212 |
| East West Bancorp, Inc. | 45,840 | 3,280,769 |
| Essent Group Ltd. | 35,671 | 1,411,858 |
| F.N.B. Corp. | 114,430 | 1,653,513 |
| Fifth Third Bancorp | 223,616 | 7,980,855 |
| First Citizens BancShares, Inc., Class A | 4,312 | 3,544,981 |
| First Financial Bankshares, Inc. | 42,182 | 1,623,585 |
| First Horizon Corp. | 175,717 | 4,306,824 |
| First Interstate BancSystem, Inc., Class A | 29,610 | 1,350,512 |
| First Republic Bank | 59,762 | 7,177,416 |
| Glacier Bancorp, Inc. | 36,125 | 2,069,240 |
| Home BancShares, Inc. | 62,038 | 1,581,349 |
| Huntington Bancshares, Inc. | 471,347 | 7,155,047 |
| JPMorgan Chase & Co. | 957,436 | 120,522,044 |
| KeyCorp | 303,910 | 5,430,872 |
| M&T Bank Corp. | 57,376 | 9,660,397 |
| MGIC Investment Corp. | 98,427 | 1,343,529 |
| New York Community Bancorp, Inc. | 153,235 | 1,426,618 |
| Old National Bancorp | 95,535 | 1,868,665 |
| Pinnacle Financial Partners, Inc. | 25,092 | 2,082,385 |
| Popular, Inc. | 24,436 | 1,728,114 |
| Prosperity Bancshares, Inc. | 29,960 | 2,144,237 |
| Regions Financial Corp. | 304,749 | 6,689,241 |
| ServisFirst Bancshares, Inc. | 15,982 | 1,203,924 |
| Signature Bank | 20,442 | 3,240,670 |
| SouthState Corp. | 24,727 | 2,236,063 |
| SVB Financial Group * | 19,238 | 4,443,208 |
| Synovus Financial Corp. | 47,027 | 1,874,026 |
| SECURITY | NUMBER OF SHARES | VALUE ($) |
| The PNC Financial Services Group, Inc. | 133,950 | 21,677,128 |
| Truist Financial Corp. | 433,254 | 19,405,447 |
| U.S. Bancorp | 441,633 | 18,747,321 |
| UMB Financial Corp. | 14,165 | 1,178,811 |
| United Bankshares, Inc. | 43,908 | 1,859,504 |
| Valley National Bancorp | 137,143 | 1,627,887 |
| Webster Financial Corp. | 57,341 | 3,111,323 |
| Wells Fargo & Co. | 1,238,401 | 56,954,062 |
| Western Alliance Bancorp | 35,470 | 2,382,520 |
| Wintrust Financial Corp. | 19,780 | 1,851,804 |
| Zions Bancorp NA | 49,477 | 2,569,835 |
| 471,258,301 | ||
| Capital Goods 6.1% | ||
| 3M Co. | 180,747 | 22,736,165 |
| A.O. Smith Corp. | 41,669 | 2,282,628 |
| Acuity Brands, Inc. | 10,678 | 1,960,160 |
| Advanced Drainage Systems, Inc. | 20,966 | 2,429,540 |
| AECOM | 45,526 | 3,427,197 |
| AGCO Corp. | 20,208 | 2,509,227 |
| Allegion plc | 28,759 | 3,013,080 |
| AMETEK, Inc. | 75,058 | 9,732,020 |
| Axon Enterprise, Inc. * | 22,044 | 3,206,079 |
| Bloom Energy Corp., Class A * | 57,569 | 1,077,116 |
| Builders FirstSource, Inc. * | 51,004 | 3,144,907 |
| BWX Technologies, Inc. | 29,879 | 1,702,505 |
| Carlisle Cos., Inc. | 16,831 | 4,019,243 |
| Carrier Global Corp. | 275,037 | 10,935,471 |
| Caterpillar, Inc. | 172,342 | 37,305,149 |
| ChargePoint Holdings, Inc. *(a) | 84,637 | 1,183,225 |
| Chart Industries, Inc. * | 11,679 | 2,603,016 |
| Crane Holdings Co. | 15,679 | 1,573,231 |
| Cummins, Inc. | 46,016 | 11,251,372 |
| Curtiss-Wright Corp. | 12,541 | 2,104,756 |
| Deere & Co. | 90,800 | 35,940,456 |
| Donaldson Co., Inc. | 40,632 | 2,334,308 |
| Dover Corp. | 46,783 | 6,114,070 |
| Eaton Corp. plc | 130,116 | 19,526,508 |
| EMCOR Group, Inc. | 16,055 | 2,265,360 |
| Emerson Electric Co. | 193,224 | 16,733,198 |
| Evoqua Water Technologies Corp. * | 39,594 | 1,551,293 |
| Fastenal Co. | 187,755 | 9,074,199 |
| Fortive Corp. | 116,194 | 7,424,797 |
| Fortune Brands Home & Security, Inc. | 41,852 | 2,524,513 |
| Generac Holdings, Inc. * | 20,737 | 2,403,626 |
| General Dynamics Corp. | 73,398 | 18,334,820 |
| General Electric Co. | 358,119 | 27,865,239 |
| Graco, Inc. | 55,441 | 3,857,585 |
| HEICO Corp. | 12,866 | 2,092,526 |
| HEICO Corp., Class A | 22,829 | 2,906,132 |
| Hexcel Corp. | 27,397 | 1,526,013 |
| Honeywell International, Inc. | 219,913 | 44,866,650 |
| Howmet Aerospace, Inc. | 120,763 | 4,293,125 |
| Hubbell, Inc. | 17,438 | 4,141,176 |
| Huntington Ingalls Industries, Inc. | 13,066 | 3,358,877 |
| IDEX Corp. | 24,633 | 5,476,162 |
| SECURITY | NUMBER OF SHARES | VALUE ($) |
| Illinois Tool Works, Inc. | 92,018 | 19,648,604 |
| Ingersoll Rand, Inc. | 131,694 | 6,650,547 |
| ITT, Inc. | 27,189 | 2,076,968 |
| Johnson Controls International plc | 225,026 | 13,015,504 |
| L3Harris Technologies, Inc. | 62,471 | 15,397,227 |
| Lennox International, Inc. | 10,522 | 2,457,624 |
| Lincoln Electric Holdings, Inc. | 18,801 | 2,669,742 |
| Lockheed Martin Corp. | 77,019 | 37,483,607 |
| Masco Corp. | 73,638 | 3,407,230 |
| MasTec, Inc. * | 19,359 | 1,492,192 |
| MDU Resources Group, Inc. | 66,130 | 1,883,382 |
| Nordson Corp. | 17,697 | 3,981,825 |
| Northrop Grumman Corp. | 47,468 | 26,060,407 |
| nVent Electric plc | 54,686 | 1,996,039 |
| Oshkosh Corp. | 21,236 | 1,868,768 |
| Otis Worldwide Corp. | 137,316 | 9,700,002 |
| Owens Corning | 31,289 | 2,678,651 |
| PACCAR, Inc. | 113,489 | 10,989,140 |
| Parker-Hannifin Corp. | 41,899 | 12,176,687 |
| Parsons Corp. * | 10,807 | 506,632 |
| Pentair plc | 54,001 | 2,319,343 |
| Plug Power, Inc. * | 169,236 | 2,704,391 |
| Quanta Services, Inc. | 46,771 | 6,643,353 |
| Raytheon Technologies Corp. | 481,802 | 45,684,466 |
| RBC Bearings, Inc. * | 9,507 | 2,410,310 |
| Regal Rexnord Corp. | 21,695 | 2,745,285 |
| Rockwell Automation, Inc. | 37,727 | 9,631,703 |
| Sensata Technologies Holding plc | 50,322 | 2,023,448 |
| SiteOne Landscape Supply, Inc. * | 14,826 | 1,717,889 |
| Snap-on, Inc. | 17,359 | 3,854,566 |
| Stanley Black & Decker, Inc. | 48,259 | 3,787,849 |
| Sunrun, Inc. * | 69,213 | 1,557,985 |
| Textron, Inc. | 69,062 | 4,726,603 |
| The Boeing Co. * | 182,282 | 25,977,008 |
| The Middleby Corp. * | 17,694 | 2,474,683 |
| The Timken Co. | 21,865 | 1,558,756 |
| The Toro Co. | 33,978 | 3,582,301 |
| Trane Technologies plc | 75,718 | 12,086,864 |
| TransDigm Group, Inc. | 16,839 | 9,695,223 |
| Trex Co., Inc. * | 35,957 | 1,729,172 |
| UFP Industries, Inc. | 20,143 | 1,434,786 |
| United Rentals, Inc. * | 22,860 | 7,217,131 |
| Univar Solutions, Inc. * | 54,393 | 1,385,934 |
| Valmont Industries, Inc. | 6,963 | 2,222,729 |
| Vertiv Holdings Co. | 99,551 | 1,424,575 |
| W.W. Grainger, Inc. | 14,743 | 8,615,072 |
| Watsco, Inc. | 10,829 | 2,934,226 |
| WESCO International, Inc. * | 14,563 | 2,006,345 |
| Westinghouse Air Brake Technologies Corp. | 59,247 | 5,526,560 |
| WillScot Mobile Mini Holdings Corp. * | 69,747 | 2,966,340 |
| Woodward, Inc. | 19,749 | 1,810,983 |
| Xylem, Inc. | 58,718 | 6,014,485 |
| Zurn Water Solutions Corp. | 47,551 | 1,116,973 |
| 720,534,835 | ||
| Commercial & Professional Services 1.1% | ||
| ASGN, Inc. * | 16,586 | 1,406,161 |
| Booz Allen Hamilton Holding Corp. | 43,342 | 4,717,777 |
| CACI International, Inc., Class A * | 7,688 | 2,337,383 |
| Casella Waste Systems, Inc., Class A * | 16,536 | 1,352,810 |
| Cintas Corp. | 28,102 | 12,015,010 |
| Clarivate plc * | 140,745 | 1,453,896 |
| Clean Harbors, Inc. * | 16,507 | 2,021,447 |
| Copart, Inc. * | 69,722 | 8,019,424 |
| CoStar Group, Inc. * | 129,274 | 10,693,545 |
| Driven Brands Holdings, Inc. * | 17,974 | 574,809 |
| SECURITY | NUMBER OF SHARES | VALUE ($) |
| Dun & Bradstreet Holdings, Inc. | 70,789 | 909,639 |
| Equifax, Inc. | 39,878 | 6,760,916 |
| Exponent, Inc. | 16,538 | 1,575,410 |
| FTI Consulting, Inc. * | 11,303 | 1,759,086 |
| IAA, Inc. * | 43,310 | 1,642,748 |
| Insperity, Inc. | 11,710 | 1,382,014 |
| Jacobs Solutions, Inc. | 41,730 | 4,808,131 |
| KBR, Inc. | 45,175 | 2,248,360 |
| Leidos Holdings, Inc. | 44,485 | 4,519,231 |
| MSA Safety, Inc. | 12,118 | 1,626,720 |
| Republic Services, Inc. | 67,166 | 8,907,555 |
| Robert Half International, Inc. | 35,630 | 2,724,270 |
| Rollins, Inc. | 75,436 | 3,174,347 |
| Science Applications International Corp. | 18,220 | 1,973,955 |
| Stericycle, Inc. * | 29,791 | 1,328,083 |
| Tetra Tech, Inc. | 17,323 | 2,447,393 |
| TransUnion | 63,137 | 3,742,130 |
| TriNet Group, Inc. * | 11,827 | 768,518 |
| Verisk Analytics, Inc. | 51,146 | 9,351,023 |
| Waste Management, Inc. | 122,808 | 19,449,103 |
| 125,690,894 | ||
| Consumer Durables & Apparel 0.9% | ||
| Brunswick Corp. | 24,452 | 1,728,023 |
| Capri Holdings Ltd. * | 45,089 | 2,059,666 |
| Columbia Sportswear Co. | 11,637 | 866,957 |
| Crocs, Inc. * | 20,274 | 1,434,386 |
| D.R. Horton, Inc. | 103,358 | 7,946,163 |
| Deckers Outdoor Corp. * | 8,666 | 3,032,493 |
| Garmin Ltd. | 50,270 | 4,425,771 |
| Hasbro, Inc. | 42,303 | 2,760,271 |
| Leggett & Platt, Inc. | 43,871 | 1,480,646 |
| Lennar Corp., Class A | 82,952 | 6,694,226 |
| Lululemon Athletica, Inc. * | 37,956 | 12,489,042 |
| Mattel, Inc. * | 115,874 | 2,196,971 |
| Mohawk Industries, Inc. * | 17,384 | 1,647,134 |
| Newell Brands, Inc. | 123,952 | 1,711,777 |
| NIKE, Inc., Class B | 412,438 | 38,224,754 |
| NVR, Inc. * | 1,003 | 4,250,463 |
| Polaris, Inc. | 18,384 | 1,867,814 |
| PulteGroup, Inc. | 75,744 | 3,029,003 |
| Skechers U.S.A., Inc., Class A * | 44,306 | 1,525,456 |
| Tapestry, Inc. | 82,583 | 2,616,229 |
| Tempur Sealy International, Inc. | 56,742 | 1,525,792 |
| Toll Brothers, Inc. | 34,931 | 1,504,828 |
| TopBuild Corp. * | 10,503 | 1,786,980 |
| VF Corp. | 107,903 | 3,048,260 |
| Whirlpool Corp. | 17,810 | 2,462,054 |
| 112,315,159 | ||
| Consumer Services 2.2% | ||
| ADT, Inc. | 69,869 | 591,092 |
| Airbnb, Inc., Class A * | 130,387 | 13,939,674 |
| Aramark | 84,397 | 3,080,491 |
| Booking Holdings, Inc. * | 12,965 | 24,237,808 |
| Boyd Gaming Corp. | 26,622 | 1,537,687 |
| Caesars Entertainment, Inc. * | 69,957 | 3,059,220 |
| Carnival Corp. * | 321,366 | 2,911,576 |
| Chipotle Mexican Grill, Inc. * | 9,071 | 13,591,351 |
| Choice Hotels International, Inc. | 9,523 | 1,236,466 |
| Churchill Downs, Inc. | 10,858 | 2,257,487 |
| Darden Restaurants, Inc. | 40,066 | 5,735,047 |
| Domino’s Pizza, Inc. | 11,670 | 3,877,241 |
| DraftKings, Inc., Class A * | 146,478 | 2,314,352 |
| Expedia Group, Inc. * | 49,520 | 4,628,634 |
| SECURITY | NUMBER OF SHARES | VALUE ($) |
| H&R Block, Inc. | 52,270 | 2,150,911 |
| Hilton Grand Vacations, Inc. * | 26,584 | 1,043,156 |
| Hilton Worldwide Holdings, Inc. | 89,625 | 12,122,678 |
| Hyatt Hotels Corp., Class A * | 16,401 | 1,545,138 |
| Las Vegas Sands Corp. * | 107,433 | 4,083,528 |
| Marriott International, Inc., Class A | 90,108 | 14,427,192 |
| Marriott Vacations Worldwide Corp. | 12,849 | 1,898,568 |
| McDonald’s Corp. | 240,137 | 65,475,754 |
| MGM Resorts International | 106,679 | 3,794,572 |
| Norwegian Cruise Line Holdings Ltd. * | 137,825 | 2,327,864 |
| Penn Entertainment, Inc. * | 51,730 | 1,712,263 |
| Planet Fitness, Inc., Class A * | 27,678 | 1,812,355 |
| Royal Caribbean Cruises Ltd. * | 71,618 | 3,822,969 |
| Scientific Games Corp., Class A * | 30,572 | 1,716,312 |
| Service Corp. International | 51,319 | 3,110,445 |
| Starbucks Corp. | 374,575 | 32,434,449 |
| Texas Roadhouse, Inc. | 21,891 | 2,166,115 |
| The Wendy's Co. | 55,855 | 1,160,667 |
| Vail Resorts, Inc. | 13,080 | 2,866,220 |
| Wyndham Hotels & Resorts, Inc. | 29,447 | 2,235,911 |
| Wynn Resorts Ltd. * | 33,682 | 2,152,280 |
| Yum! Brands, Inc. | 92,722 | 10,964,377 |
| 258,021,850 | ||
| Diversified Financials 5.4% | ||
| Affiliated Managers Group, Inc. | 12,345 | 1,532,755 |
| AGNC Investment Corp. | 172,161 | 1,415,163 |
| Ally Financial, Inc. | 100,677 | 2,774,658 |
| American Express Co. | 195,851 | 29,074,081 |
| Ameriprise Financial, Inc. | 35,353 | 10,928,319 |
| Annaly Capital Management, Inc. | 140,702 | 2,610,022 |
| Apollo Global Management, Inc. | 141,864 | 7,853,591 |
| Ares Management Corp., Class A | 50,605 | 3,837,377 |
| Berkshire Hathaway, Inc., Class B * | 589,217 | 173,872,045 |
| BlackRock, Inc. | 49,251 | 31,811,713 |
| Blackstone Mortgage Trust, Inc., Class A | 55,475 | 1,384,656 |
| Blackstone, Inc. | 229,207 | 20,889,926 |
| Blue Owl Capital, Inc. | 109,654 | 1,098,733 |
| Capital One Financial Corp. | 125,366 | 13,291,303 |
| Cboe Global Markets, Inc. | 34,526 | 4,298,487 |
| CME Group, Inc. | 117,379 | 20,341,781 |
| Coinbase Global, Inc., Class A *(a) | 51,423 | 3,406,774 |
| Credit Acceptance Corp. * | 1,984 | 923,790 |
| Discover Financial Services | 89,270 | 9,325,144 |
| Equitable Holdings, Inc. | 113,675 | 3,480,729 |
| FactSet Research Systems, Inc. | 12,363 | 5,260,333 |
| Franklin Resources, Inc. | 93,409 | 2,190,441 |
| Interactive Brokers Group, Inc., Class A | 33,618 | 2,694,483 |
| Intercontinental Exchange, Inc. | 182,424 | 17,434,262 |
| Invesco Ltd. | 148,360 | 2,272,875 |
| Jefferies Financial Group, Inc. | 60,720 | 2,089,375 |
| KKR & Co., Inc. | 188,348 | 9,159,363 |
| LPL Financial Holdings, Inc. | 26,075 | 6,666,074 |
| MarketAxess Holdings, Inc. | 12,231 | 2,984,853 |
| Moody's Corp. | 51,594 | 13,665,703 |
| Morgan Stanley | 437,256 | 35,929,326 |
| Morningstar, Inc. | 8,194 | 1,902,483 |
| MSCI, Inc. | 26,241 | 12,303,355 |
| Nasdaq, Inc. | 110,902 | 6,902,540 |
| Northern Trust Corp. | 67,905 | 5,727,787 |
| OneMain Holdings, Inc. | 40,268 | 1,552,734 |
| Raymond James Financial, Inc. | 63,284 | 7,476,372 |
| Rithm Capital Corp. | 154,262 | 1,300,429 |
| Robinhood Markets, Inc., Class A * | 164,446 | 1,920,729 |
| S&P Global, Inc. | 111,253 | 35,740,026 |
| SECURITY | NUMBER OF SHARES | VALUE ($) |
| SEI Investments Co. | 33,405 | 1,813,892 |
| SoFi Technologies, Inc. * | 264,905 | 1,441,083 |
| Starwood Property Trust, Inc. | 100,255 | 2,071,268 |
| State Street Corp. | 119,865 | 8,870,010 |
| Stifel Financial Corp. | 34,901 | 2,159,325 |
| Synchrony Financial | 157,366 | 5,595,935 |
| T. Rowe Price Group, Inc. | 73,795 | 7,834,077 |
| The Bank of New York Mellon Corp. | 240,501 | 10,127,497 |
| The Carlyle Group, Inc. | 70,775 | 2,001,517 |
| The Charles Schwab Corp. (b) | 496,197 | 39,532,015 |
| The Goldman Sachs Group, Inc. | 111,437 | 38,391,161 |
| Tradeweb Markets, Inc., Class A | 35,315 | 1,945,150 |
| Voya Financial, Inc. | 31,957 | 2,184,581 |
| 643,292,101 | ||
| Energy 5.3% | ||
| Antero Resources Corp. * | 92,082 | 3,375,726 |
| APA Corp. | 106,740 | 4,852,400 |
| Baker Hughes Co. | 330,621 | 9,144,977 |
| ChampionX Corp. | 66,345 | 1,898,794 |
| Cheniere Energy, Inc. | 81,577 | 14,390,999 |
| Chesapeake Energy Corp. | 31,597 | 3,231,425 |
| Chevron Corp. | 587,832 | 106,338,809 |
| Chord Energy Corp. | 13,550 | 2,074,369 |
| Civitas Resources, Inc. | 16,937 | 1,184,066 |
| Comstock Resources, Inc. * | 29,735 | 558,423 |
| ConocoPhillips | 415,454 | 52,384,595 |
| Continental Resources, Inc. | 17,837 | 1,319,403 |
| Coterra Energy, Inc. | 260,071 | 8,096,010 |
| Denbury, Inc. * | 16,235 | 1,484,041 |
| Devon Energy Corp. | 213,734 | 16,532,325 |
| Diamondback Energy, Inc. | 58,072 | 9,123,692 |
| DTE Midstream LLC * | 31,576 | 1,885,087 |
| EOG Resources, Inc. | 191,255 | 26,110,133 |
| EQT Corp. | 121,072 | 5,065,652 |
| Exxon Mobil Corp. | 1,360,664 | 150,775,178 |
| Halliburton Co. | 296,191 | 10,787,276 |
| Helmerich & Payne, Inc. | 34,416 | 1,703,936 |
| Hess Corp. | 90,960 | 12,832,637 |
| HF Sinclair Corp. | 47,503 | 2,905,759 |
| Kinder Morgan, Inc. | 647,926 | 11,740,419 |
| Magnolia Oil & Gas Corp., Class A | 54,893 | 1,409,652 |
| Marathon Oil Corp. | 221,304 | 6,738,707 |
| Marathon Petroleum Corp. | 162,758 | 18,492,564 |
| Matador Resources Co. | 36,679 | 2,437,320 |
| Murphy Oil Corp. | 47,728 | 2,315,285 |
| New Fortress Energy, Inc. | 15,611 | 859,698 |
| NOV, Inc. | 128,461 | 2,877,526 |
| Occidental Petroleum Corp. | 243,261 | 17,660,749 |
| ONEOK, Inc. | 145,544 | 8,633,670 |
| Ovintiv, Inc. | 83,110 | 4,209,521 |
| PBF Energy, Inc., Class A | 35,124 | 1,554,237 |
| PDC Energy, Inc. | 31,468 | 2,270,102 |
| Phillips 66 | 157,081 | 16,381,977 |
| Pioneer Natural Resources Co. | 77,883 | 19,969,980 |
| Range Resources Corp. | 80,971 | 2,306,054 |
| Schlumberger N.V. | 461,622 | 24,018,193 |
| SM Energy Co. | 40,061 | 1,801,944 |
| Southwestern Energy Co. * | 364,076 | 2,523,047 |
| Targa Resources Corp. | 74,027 | 5,061,226 |
| Texas Pacific Land Corp. | 2,022 | 4,658,425 |
| The Williams Cos., Inc. | 397,987 | 13,026,115 |
| Valero Energy Corp. | 128,630 | 16,149,496 |
| 635,151,619 | ||
| SECURITY | NUMBER OF SHARES | VALUE ($) |
| Food & Staples Retailing 1.5% | ||
| Albertsons Cos., Inc., Class A | 52,139 | 1,069,371 |
| BJ's Wholesale Club Holdings, Inc. * | 44,240 | 3,424,176 |
| Casey's General Stores, Inc. | 12,222 | 2,844,182 |
| Costco Wholesale Corp. | 144,625 | 72,529,438 |
| Performance Food Group Co. * | 50,859 | 2,646,702 |
| Sysco Corp. | 166,423 | 14,405,575 |
| The Kroger Co. | 212,167 | 10,033,377 |
| U.S. Foods Holding Corp. * | 66,632 | 1,982,968 |
| Walgreens Boots Alliance, Inc. | 233,795 | 8,533,518 |
| Walmart, Inc. | 465,340 | 66,231,842 |
| 183,701,149 | ||
| Food, Beverage & Tobacco 3.5% | ||
| Altria Group, Inc. | 588,035 | 27,208,379 |
| Archer-Daniels-Midland Co. | 183,072 | 17,754,323 |
| Brown-Forman Corp., Class B | 59,521 | 4,047,428 |
| Bunge Ltd. | 49,645 | 4,899,961 |
| Campbell Soup Co. | 65,667 | 3,474,441 |
| Celsius Holdings, Inc. * | 12,988 | 1,182,947 |
| Conagra Brands, Inc. | 156,598 | 5,747,147 |
| Constellation Brands, Inc., Class A | 52,029 | 12,855,325 |
| Darling Ingredients, Inc. * | 52,239 | 4,099,717 |
| Flowers Foods, Inc. | 62,916 | 1,806,318 |
| General Mills, Inc. | 194,698 | 15,883,463 |
| Hormel Foods Corp. | 94,751 | 4,401,184 |
| Ingredion, Inc. | 21,270 | 1,895,582 |
| Kellogg Co. | 83,234 | 6,394,036 |
| Keurig Dr Pepper, Inc. | 277,796 | 10,789,597 |
| Lamb Weston Holdings, Inc. | 46,752 | 4,030,957 |
| Lancaster Colony Corp. | 6,463 | 1,165,150 |
| McCormick & Co., Inc. - Non Voting Shares | 81,984 | 6,447,222 |
| Molson Coors Beverage Co., Class B | 61,580 | 3,105,479 |
| Mondelez International, Inc., Class A | 447,503 | 27,512,484 |
| Monster Beverage Corp. * | 125,694 | 11,780,042 |
| National Beverage Corp. | 7,583 | 359,586 |
| PepsiCo, Inc. | 450,473 | 81,796,887 |
| Philip Morris International, Inc. | 506,083 | 46,483,724 |
| Pilgrim's Pride Corp. * | 14,119 | 325,443 |
| Post Holdings, Inc. * | 17,618 | 1,593,020 |
| Seaboard Corp. | 83 | 310,950 |
| The Coca-Cola Co. | 1,270,431 | 76,035,295 |
| The Hershey Co. | 47,952 | 11,449,499 |
| The JM Smucker Co. | 34,810 | 5,244,475 |
| The Kraft Heinz Co. | 260,323 | 10,014,626 |
| Tyson Foods, Inc., Class A | 94,718 | 6,473,975 |
| 416,568,662 | ||
| Health Care Equipment & Services 6.3% | ||
| Abbott Laboratories | 571,796 | 56,573,496 |
| ABIOMED, Inc. * | 14,808 | 3,732,801 |
| Acadia Healthcare Co., Inc. * | 29,743 | 2,418,106 |
| agilon health, Inc. * | 64,395 | 1,278,241 |
| Align Technology, Inc. * | 23,708 | 4,606,464 |
| AmerisourceBergen Corp. | 50,634 | 7,960,677 |
| AMN Healthcare Services, Inc. * | 14,076 | 1,766,538 |
| Baxter International, Inc. | 164,370 | 8,933,509 |
| Becton, Dickinson & Co. | 93,135 | 21,977,066 |
| Boston Scientific Corp. * | 467,614 | 20,158,840 |
| Cardinal Health, Inc. | 88,713 | 6,733,317 |
| Centene Corp. * | 186,709 | 15,894,537 |
| Chemed Corp. | 4,872 | 2,274,591 |
| Cigna Corp. | 99,654 | 32,194,221 |
| CVS Health Corp. | 428,670 | 40,595,049 |
| SECURITY | NUMBER OF SHARES | VALUE ($) |
| DaVita, Inc. * | 18,181 | 1,327,395 |
| Dentsply Sirona, Inc. | 70,749 | 2,180,484 |
| DexCom, Inc. * | 128,134 | 15,476,025 |
| Edwards Lifesciences Corp. * | 202,550 | 14,670,696 |
| Elevance Health, Inc. | 78,377 | 42,854,192 |
| Encompass Health Corp. | 32,284 | 1,757,541 |
| Envista Holdings Corp. * | 53,744 | 1,774,089 |
| Globus Medical, Inc., Class A * | 24,993 | 1,674,531 |
| Guardant Health, Inc. * | 33,136 | 1,640,232 |
| HCA Healthcare, Inc. | 70,324 | 15,293,360 |
| HealthEquity, Inc. * | 27,381 | 2,133,254 |
| Henry Schein, Inc. * | 44,334 | 3,035,106 |
| Hologic, Inc. * | 81,305 | 5,512,479 |
| Humana, Inc. | 41,332 | 23,066,563 |
| IDEXX Laboratories, Inc. * | 27,206 | 9,785,454 |
| Inspire Medical Systems, Inc. * | 8,947 | 1,744,218 |
| Insulet Corp. * | 22,604 | 5,850,141 |
| Intuitive Surgical, Inc. * | 116,645 | 28,749,493 |
| iRhythm Technologies, Inc. * | 9,810 | 1,250,677 |
| Laboratory Corp. of America Holdings | 29,554 | 6,556,850 |
| Lantheus Holdings, Inc. * | 22,460 | 1,661,815 |
| LHC Group, Inc. * | 10,053 | 1,679,856 |
| Masimo Corp. * | 15,738 | 2,071,121 |
| McKesson Corp. | 46,936 | 18,275,470 |
| Medtronic plc | 433,865 | 37,893,769 |
| Molina Healthcare, Inc. * | 18,995 | 6,816,546 |
| Novocure Ltd. * | 29,197 | 2,063,060 |
| Oak Street Health, Inc. * | 37,805 | 764,795 |
| Omnicell, Inc. * | 14,509 | 1,121,836 |
| Option Care Health, Inc. * | 50,500 | 1,528,130 |
| Penumbra, Inc. * | 12,346 | 2,116,969 |
| Premier, Inc., Class A | 38,461 | 1,341,520 |
| Privia Health Group, Inc. * | 16,001 | 535,713 |
| Quest Diagnostics, Inc. | 38,035 | 5,463,728 |
| QuidelOrtho Corp. * | 17,696 | 1,589,455 |
| R1 RCM, Inc. * | 44,028 | 777,534 |
| ResMed, Inc. | 47,780 | 10,687,908 |
| Shockwave Medical, Inc. * | 11,745 | 3,443,047 |
| Signify Health, Inc., Class A * | 22,500 | 657,675 |
| STAAR Surgical Co. * | 15,532 | 1,100,753 |
| STERIS plc | 32,595 | 5,625,245 |
| Stryker Corp. | 109,977 | 25,211,127 |
| Teladoc Health, Inc. * | 52,207 | 1,547,415 |
| Teleflex, Inc. | 15,276 | 3,277,619 |
| Tenet Healthcare Corp. * | 34,966 | 1,551,092 |
| The Cooper Cos., Inc. | 16,185 | 4,424,817 |
| The Ensign Group, Inc. | 18,065 | 1,621,876 |
| UnitedHealth Group, Inc. | 305,404 | 169,545,031 |
| Universal Health Services, Inc., Class B | 21,411 | 2,480,893 |
| Veeva Systems, Inc., Class A * | 45,659 | 7,667,972 |
| Zimmer Biomet Holdings, Inc. | 68,605 | 7,776,377 |
| 745,750,397 | ||
| Household & Personal Products 1.4% | ||
| Church & Dwight Co., Inc. | 79,517 | 5,894,595 |
| Colgate-Palmolive Co. | 272,300 | 20,106,632 |
| Coty, Inc., Class A * | 119,241 | 800,107 |
| Kimberly-Clark Corp. | 110,164 | 13,711,011 |
| Olaplex Holdings, Inc. * | 27,559 | 121,260 |
| Reynolds Consumer Products, Inc. | 17,599 | 537,474 |
| The Clorox Co. | 40,131 | 5,860,731 |
| The Estee Lauder Cos., Inc., Class A | 75,764 | 15,189,924 |
| The Procter & Gamble Co. | 780,146 | 105,062,262 |
| 167,283,996 | ||
| SECURITY | NUMBER OF SHARES | VALUE ($) |
| Insurance 2.4% | ||
| Aflac, Inc. | 187,828 | 12,229,481 |
| American Financial Group, Inc. | 22,830 | 3,312,861 |
| American International Group, Inc. | 248,390 | 14,158,230 |
| Aon plc, Class A | 68,862 | 19,383,964 |
| Arch Capital Group Ltd. * | 120,784 | 6,945,080 |
| Arthur J. Gallagher & Co. | 68,624 | 12,838,178 |
| Assurant, Inc. | 17,269 | 2,346,166 |
| Axis Capital Holdings Ltd. | 25,175 | 1,376,317 |
| Brown & Brown, Inc. | 76,344 | 4,488,264 |
| Chubb Ltd. | 136,314 | 29,292,516 |
| Cincinnati Financial Corp. | 52,022 | 5,374,913 |
| CNA Financial Corp. | 8,422 | 351,197 |
| Erie Indemnity Co., Class A | 8,115 | 2,085,636 |
| Everest Re Group Ltd. | 12,868 | 4,151,989 |
| Fidelity National Financial, Inc. | 90,212 | 3,552,549 |
| First American Financial Corp. | 33,953 | 1,711,231 |
| Globe Life, Inc. | 29,671 | 3,427,594 |
| Kinsale Capital Group, Inc. | 7,044 | 2,220,058 |
| Lincoln National Corp. | 50,488 | 2,719,789 |
| Loews Corp. | 65,434 | 3,731,047 |
| Markel Corp. * | 4,410 | 5,318,901 |
| Marsh & McLennan Cos., Inc. | 162,914 | 26,308,982 |
| MetLife, Inc. | 218,972 | 16,030,940 |
| Old Republic International Corp. | 93,154 | 2,162,104 |
| Primerica, Inc. | 12,334 | 1,784,730 |
| Principal Financial Group, Inc. | 75,778 | 6,678,315 |
| Prudential Financial, Inc. | 121,566 | 12,787,528 |
| Reinsurance Group of America, Inc. | 21,883 | 3,220,521 |
| RenaissanceRe Holdings Ltd. | 14,352 | 2,219,967 |
| RLI Corp. | 13,205 | 1,717,574 |
| Ryan Specialty Group Holdings, Inc., Class A * | 27,067 | 1,213,955 |
| Selective Insurance Group, Inc. | 19,704 | 1,932,568 |
| The Allstate Corp. | 88,304 | 11,148,380 |
| The Hanover Insurance Group, Inc. | 11,628 | 1,703,386 |
| The Hartford Financial Services Group, Inc. | 105,642 | 7,649,537 |
| The Progressive Corp. | 191,006 | 24,525,171 |
| The Travelers Cos., Inc. | 77,385 | 14,274,437 |
| Unum Group | 61,506 | 2,804,059 |
| W.R. Berkley Corp. | 66,422 | 4,940,468 |
| Willis Towers Watson plc | 35,949 | 7,844,431 |
| 291,963,014 | ||
| Materials 2.7% | ||
| Air Products & Chemicals, Inc. | 72,478 | 18,148,491 |
| Albemarle Corp. | 38,262 | 10,708,386 |
| Alcoa Corp. | 58,812 | 2,295,432 |
| Amcor plc | 489,463 | 5,667,982 |
| AptarGroup, Inc. | 21,171 | 2,099,105 |
| Ashland, Inc. | 16,097 | 1,688,897 |
| Avery Dennison Corp. | 26,615 | 4,512,573 |
| Axalta Coating Systems Ltd. * | 71,862 | 1,675,822 |
| Balchem Corp. | 10,470 | 1,463,706 |
| Ball Corp. | 102,692 | 5,071,958 |
| Berry Global Group, Inc. * | 40,818 | 1,931,508 |
| Celanese Corp. | 32,518 | 3,125,630 |
| CF Industries Holdings, Inc. | 65,147 | 6,922,520 |
| Cleveland-Cliffs, Inc. * | 169,109 | 2,196,726 |
| Commercial Metals Co. | 39,488 | 1,796,704 |
| Corteva, Inc. | 234,341 | 15,311,841 |
| Crown Holdings, Inc. | 39,560 | 2,713,420 |
| Dow, Inc. | 234,721 | 10,970,860 |
| DuPont de Nemours, Inc. | 163,640 | 9,360,208 |
| Eagle Materials, Inc. | 12,259 | 1,499,398 |
| SECURITY | NUMBER OF SHARES | VALUE ($) |
| Eastman Chemical Co. | 40,057 | 3,076,778 |
| Ecolab, Inc. | 81,026 | 12,726,754 |
| Element Solutions, Inc. | 73,404 | 1,262,549 |
| FMC Corp. | 41,191 | 4,897,610 |
| Freeport-McMoRan, Inc. | 466,249 | 14,775,431 |
| Graphic Packaging Holding Co. | 100,515 | 2,307,824 |
| Huntsman Corp. | 61,742 | 1,652,216 |
| International Flavors & Fragrances, Inc. | 83,139 | 8,115,198 |
| International Paper Co. | 118,177 | 3,971,929 |
| Linde plc | 162,708 | 48,381,224 |
| Livent Corp. * | 58,549 | 1,848,392 |
| LyondellBasell Industries N.V., Class A | 83,136 | 6,355,747 |
| Martin Marietta Materials, Inc. | 20,351 | 6,837,529 |
| MP Materials Corp. * | 30,162 | 906,067 |
| Newmont Corp. | 259,142 | 10,966,889 |
| Nucor Corp. | 85,440 | 11,225,107 |
| Olin Corp. | 44,094 | 2,334,777 |
| Packaging Corp. of America | 30,501 | 3,666,525 |
| PPG Industries, Inc. | 76,797 | 8,768,681 |
| Reliance Steel & Aluminum Co. | 19,716 | 3,972,380 |
| Royal Gold, Inc. | 21,480 | 2,039,741 |
| RPM International, Inc. | 41,937 | 3,965,982 |
| Sealed Air Corp. | 47,609 | 2,267,141 |
| Silgan Holdings, Inc. | 27,344 | 1,295,012 |
| Sonoco Products Co. | 31,686 | 1,967,067 |
| Steel Dynamics, Inc. | 56,648 | 5,327,744 |
| The Chemours Co. | 50,827 | 1,455,177 |
| The Mosaic Co. | 112,880 | 6,067,300 |
| The Sherwin-Williams Co. | 77,034 | 17,334,961 |
| United States Steel Corp. | 77,578 | 1,579,488 |
| Valvoline, Inc. | 57,447 | 1,686,644 |
| Vulcan Materials Co. | 43,364 | 7,098,687 |
| Westlake Corp. | 11,185 | 1,081,030 |
| WestRock Co. | 83,492 | 2,843,738 |
| 323,220,486 | ||
| Media & Entertainment 5.9% | ||
| Activision Blizzard, Inc. | 232,527 | 16,927,966 |
| Alphabet, Inc., Class A * | 1,957,524 | 185,005,593 |
| Alphabet, Inc., Class C * | 1,750,524 | 165,704,602 |
| AMC Entertainment Holdings, Inc., Class A *(a) | 170,145 | 1,133,166 |
| Cable One, Inc. | 1,583 | 1,360,478 |
| Charter Communications, Inc., Class A * | 36,209 | 13,311,153 |
| Comcast Corp., Class A | 1,437,799 | 45,635,740 |
| DISH Network Corp., Class A * | 82,957 | 1,236,889 |
| Electronic Arts, Inc. | 86,341 | 10,875,512 |
| Endeavor Group Holdings, Inc., Class A * | 56,036 | 1,223,826 |
| Fox Corp., Class A | 99,780 | 2,880,649 |
| Fox Corp., Class B | 46,486 | 1,264,419 |
| Getty Images Holdings, Inc. * | 9,491 | 64,539 |
| IAC, Inc. * | 25,564 | 1,244,456 |
| Liberty Broadband Corp., Class C * | 40,513 | 3,420,513 |
| Liberty Media Corp. - Liberty Formula One, Class C * | 67,247 | 3,882,169 |
| Liberty Media Corp. - Liberty SiriusXM, Class C * | 50,078 | 2,112,791 |
| Live Nation Entertainment, Inc. * | 46,450 | 3,697,885 |
| Match Group, Inc. * | 92,464 | 3,994,445 |
| Meta Platforms, Inc., Class A * | 744,664 | 69,372,898 |
| Netflix, Inc. * | 145,210 | 42,383,895 |
| News Corp., Class A | 124,999 | 2,108,733 |
| SECURITY | NUMBER OF SHARES | VALUE ($) |
| Nexstar Media Group, Inc., Class A | 12,691 | 2,173,968 |
| Omnicom Group, Inc. | 66,847 | 4,863,119 |
| Paramount Global, Class B | 164,988 | 3,022,580 |
| Pinterest, Inc., Class A * | 190,584 | 4,688,366 |
| Playtika Holding Corp. * | 32,468 | 306,823 |
| ROBLOX Corp., Class A * | 117,630 | 5,262,766 |
| Roku, Inc. * | 39,189 | 2,176,557 |
| Sirius XM Holdings, Inc. (a) | 230,207 | 1,390,450 |
| Snap, Inc., Class A * | 337,140 | 3,341,057 |
| Take-Two Interactive Software, Inc. * | 51,203 | 6,066,531 |
| TEGNA, Inc. | 73,064 | 1,525,576 |
| The Interpublic Group of Cos., Inc. | 127,075 | 3,785,564 |
| The New York Times Co., Class A | 53,634 | 1,553,241 |
| The Trade Desk, Inc., Class A * | 144,666 | 7,702,018 |
| The Walt Disney Co. * | 595,309 | 63,424,221 |
| Warner Bros Discovery, Inc. * | 720,696 | 9,369,048 |
| ZoomInfo Technologies, Inc. * | 88,312 | 3,932,533 |
| 703,426,735 | ||
| Pharmaceuticals, Biotechnology & Life Sciences 8.6% | ||
| AbbVie, Inc. | 577,225 | 84,505,740 |
| Agilent Technologies, Inc. | 97,583 | 13,500,608 |
| Alnylam Pharmaceuticals, Inc. * | 39,244 | 8,133,711 |
| Amgen, Inc. | 174,618 | 47,207,976 |
| Apellis Pharmaceuticals, Inc. * | 30,340 | 1,835,267 |
| Arrowhead Pharmaceuticals, Inc. * | 34,273 | 1,193,043 |
| Avantor, Inc. * | 220,214 | 4,441,716 |
| Biogen, Inc. * | 47,397 | 13,434,206 |
| Biohaven Ltd. * | 18,604 | 308,268 |
| BioMarin Pharmaceutical, Inc. * | 60,505 | 5,241,548 |
| Bio-Rad Laboratories, Inc., Class A * | 6,985 | 2,456,694 |
| Bio-Techne Corp. | 12,861 | 3,810,200 |
| Blueprint Medicines Corp. * | 19,591 | 1,015,597 |
| Bristol-Myers Squibb Co. | 697,084 | 54,003,098 |
| Bruker Corp. | 33,105 | 2,047,213 |
| Catalent, Inc. * | 58,413 | 3,839,487 |
| Cerevel Therapeutics Holdings, Inc. * | 20,827 | 582,323 |
| Charles River Laboratories International, Inc. * | 16,680 | 3,540,330 |
| CRISPR Therapeutics AG * | 25,451 | 1,332,105 |
| Cytokinetics, Inc. * | 30,754 | 1,342,720 |
| Danaher Corp. | 213,744 | 53,792,953 |
| Elanco Animal Health, Inc. * | 145,398 | 1,917,800 |
| Eli Lilly & Co. | 257,486 | 93,233,106 |
| Exact Sciences Corp. * | 57,550 | 2,001,589 |
| Exelixis, Inc. * | 105,582 | 1,750,550 |
| Gilead Sciences, Inc. | 409,182 | 32,104,420 |
| Halozyme Therapeutics, Inc. * | 45,186 | 2,160,343 |
| Horizon Therapeutics plc * | 75,170 | 4,684,594 |
| Illumina, Inc. * | 51,273 | 11,732,288 |
| Incyte Corp. * | 60,360 | 4,487,162 |
| Intellia Therapeutics, Inc. * | 24,779 | 1,307,836 |
| Intra-Cellular Therapies, Inc. * | 28,684 | 1,309,998 |
| Ionis Pharmaceuticals, Inc. * | 46,331 | 2,047,830 |
| IQVIA Holdings, Inc. * | 60,937 | 12,776,661 |
| Jazz Pharmaceuticals plc * | 20,403 | 2,933,747 |
| Johnson & Johnson | 858,326 | 149,322,974 |
| Karuna Therapeutics, Inc. * | 8,737 | 1,916,374 |
| Medpace Holdings, Inc. * | 8,180 | 1,815,796 |
| Merck & Co., Inc. | 827,006 | 83,693,007 |
| Mettler-Toledo International, Inc. * | 7,355 | 9,303,560 |
| Mirati Therapeutics, Inc. * | 16,197 | 1,090,382 |
| Moderna, Inc. * | 109,866 | 16,516,156 |
| Natera, Inc. * | 31,625 | 1,485,110 |
| Neurocrine Biosciences, Inc. * | 31,366 | 3,610,854 |
| Organon & Co. | 83,695 | 2,191,135 |
| PerkinElmer, Inc. | 41,123 | 5,493,210 |
| SECURITY | NUMBER OF SHARES | VALUE ($) |
| Perrigo Co., plc | 43,542 | 1,753,872 |
| Pfizer, Inc. | 1,832,282 | 85,292,727 |
| Regeneron Pharmaceuticals, Inc. * | 34,999 | 26,205,501 |
| Repligen Corp. * | 16,805 | 3,066,744 |
| Royalty Pharma plc, Class A | 120,062 | 5,081,024 |
| Sarepta Therapeutics, Inc. * | 28,667 | 3,268,611 |
| Seagen, Inc. * | 44,631 | 5,675,278 |
| Sotera Health Co. * | 31,432 | 216,252 |
| Syneos Health, Inc. * | 33,620 | 1,693,776 |
| Thermo Fisher Scientific, Inc. | 127,905 | 65,739,333 |
| United Therapeutics Corp. * | 14,819 | 3,416,224 |
| Vertex Pharmaceuticals, Inc. * | 83,742 | 26,127,504 |
| Viatris, Inc. | 397,447 | 4,026,138 |
| Waters Corp. * | 19,569 | 5,854,458 |
| West Pharmaceutical Services, Inc. | 24,117 | 5,549,322 |
| Zoetis, Inc. | 152,885 | 23,052,000 |
| 1,024,470,049 | ||
| Real Estate 3.0% | ||
| Agree Realty Corp. | 26,094 | 1,792,658 |
| Alexandria Real Estate Equities, Inc. | 48,382 | 7,029,905 |
| American Homes 4 Rent, Class A | 98,795 | 3,155,512 |
| American Tower Corp. | 152,008 | 31,494,537 |
| Americold Realty Trust, Inc. | 87,521 | 2,122,384 |
| Apartment Income REIT Corp. | 49,923 | 1,918,541 |
| AvalonBay Communities, Inc. | 45,648 | 7,993,878 |
| Boston Properties, Inc. | 46,399 | 3,373,207 |
| Brixmor Property Group, Inc. | 98,553 | 2,100,164 |
| Camden Property Trust | 34,927 | 4,035,815 |
| CBRE Group, Inc., Class A * | 104,621 | 7,421,814 |
| Crown Castle, Inc. | 141,403 | 18,843,364 |
| CubeSmart | 73,307 | 3,069,364 |
| Digital Realty Trust, Inc. | 93,661 | 9,389,515 |
| EastGroup Properties, Inc. | 14,218 | 2,227,818 |
| Equinix, Inc. | 29,743 | 16,847,625 |
| Equity LifeStyle Properties, Inc. | 56,920 | 3,640,603 |
| Equity Residential | 110,788 | 6,981,860 |
| Essex Property Trust, Inc. | 21,251 | 4,722,822 |
| Extra Space Storage, Inc. | 43,780 | 7,768,323 |
| Federal Realty Investment Trust | 23,599 | 2,335,829 |
| First Industrial Realty Trust, Inc. | 42,770 | 2,037,135 |
| Gaming & Leisure Properties, Inc. | 83,472 | 4,183,617 |
| Healthcare Realty Trust, Inc. | 124,441 | 2,529,886 |
| Healthpeak Properties, Inc. | 175,489 | 4,164,354 |
| Host Hotels & Resorts, Inc. | 232,874 | 4,396,661 |
| Independence Realty Trust, Inc. | 72,389 | 1,213,240 |
| Invitation Homes, Inc. | 189,811 | 6,015,111 |
| Iron Mountain, Inc. | 94,667 | 4,739,977 |
| Jones Lang LaSalle, Inc. * | 15,651 | 2,489,918 |
| Kilroy Realty Corp. | 34,076 | 1,456,408 |
| Kimco Realty Corp. | 201,876 | 4,316,109 |
| Kite Realty Group Trust | 71,343 | 1,401,176 |
| Lamar Advertising Co., Class A | 28,487 | 2,627,356 |
| Life Storage, Inc. | 27,551 | 3,047,416 |
| Medical Properties Trust, Inc. | 194,930 | 2,231,948 |
| Mid-America Apartment Communities, Inc. | 37,620 | 5,923,269 |
| National Retail Properties, Inc. | 57,814 | 2,429,922 |
| National Storage Affiliates Trust | 27,808 | 1,186,289 |
| Omega Healthcare Investors, Inc. | 76,852 | 2,442,357 |
| Prologis, Inc. | 301,480 | 33,388,910 |
| Public Storage | 51,621 | 15,989,605 |
| Rayonier, Inc. | 48,096 | 1,620,835 |
| Realty Income Corp. | 201,903 | 12,572,500 |
| Regency Centers Corp. | 50,100 | 3,031,551 |
| Rexford Industrial Realty, Inc. | 55,888 | 3,089,489 |
| Ryman Hospitality Properties, Inc. | 17,993 | 1,599,938 |
| SECURITY | NUMBER OF SHARES | VALUE ($) |
| SBA Communications Corp. | 35,215 | 9,504,528 |
| Simon Property Group, Inc. | 106,947 | 11,655,084 |
| Spirit Realty Capital, Inc. | 44,775 | 1,738,613 |
| STAG Industrial, Inc. | 58,921 | 1,861,314 |
| STORE Capital Corp. | 86,452 | 2,749,174 |
| Sun Communities, Inc. | 40,364 | 5,443,085 |
| Terreno Realty Corp. | 21,648 | 1,236,967 |
| UDR, Inc. | 99,710 | 3,964,470 |
| Ventas, Inc. | 130,164 | 5,093,317 |
| VICI Properties, Inc. | 314,545 | 10,071,731 |
| Vornado Realty Trust | 53,164 | 1,254,139 |
| Welltower, Inc. | 151,600 | 9,253,664 |
| Weyerhaeuser Co. | 242,082 | 7,487,596 |
| WP Carey, Inc. | 67,899 | 5,180,694 |
| Zillow Group, Inc., Class C * | 53,602 | 1,654,158 |
| 356,539,049 | ||
| Retailing 5.5% | ||
| Advance Auto Parts, Inc. | 19,748 | 3,750,540 |
| Amazon.com, Inc. * | 2,893,691 | 296,429,706 |
| AutoNation, Inc. * | 12,644 | 1,344,184 |
| AutoZone, Inc. * | 6,362 | 16,114,183 |
| Bath & Body Works, Inc. | 74,583 | 2,489,581 |
| Best Buy Co., Inc. | 65,461 | 4,478,187 |
| Burlington Stores, Inc. * | 21,488 | 3,071,924 |
| CarMax, Inc. * | 51,895 | 3,269,904 |
| Dick's Sporting Goods, Inc. | 18,527 | 2,107,631 |
| Dollar General Corp. | 74,102 | 18,899,715 |
| Dollar Tree, Inc. * | 68,997 | 10,936,024 |
| DoorDash, Inc., Class A * | 85,403 | 3,717,593 |
| eBay, Inc. | 179,626 | 7,156,300 |
| Etsy, Inc. * | 41,226 | 3,871,534 |
| Five Below, Inc. * | 18,014 | 2,636,349 |
| Floor & Decor Holdings, Inc., Class A * | 34,379 | 2,522,387 |
| GameStop Corp., Class A *(a) | 81,948 | 2,319,948 |
| Genuine Parts Co. | 46,124 | 8,203,615 |
| Lithia Motors, Inc. | 9,002 | 1,783,746 |
| LKQ Corp. | 85,153 | 4,737,913 |
| Lowe’s Cos., Inc. | 208,633 | 40,673,003 |
| Macy's, Inc. | 88,168 | 1,838,303 |
| Murphy USA, Inc. | 7,042 | 2,214,779 |
| O'Reilly Automotive, Inc. * | 20,809 | 17,420,671 |
| Penske Automotive Group, Inc. | 8,517 | 950,668 |
| Pool Corp. | 12,943 | 3,937,649 |
| RH * | 6,523 | 1,656,385 |
| Ross Stores, Inc. | 114,378 | 10,944,831 |
| Target Corp. | 151,341 | 24,857,759 |
| The Home Depot, Inc. | 335,506 | 99,353,392 |
| The TJX Cos., Inc. | 382,491 | 27,577,601 |
| Tractor Supply Co. | 36,285 | 7,974,354 |
| Ulta Beauty, Inc. * | 16,946 | 7,106,644 |
| Williams-Sonoma, Inc. | 22,475 | 2,783,079 |
| 649,130,082 | ||
| Semiconductors & Semiconductor Equipment 4.5% | ||
| Advanced Micro Devices, Inc. * | 527,201 | 31,663,692 |
| Allegro MicroSystems, Inc. * | 20,818 | 528,985 |
| Amkor Technology, Inc. | 33,417 | 694,740 |
| Analog Devices, Inc. | 169,703 | 24,203,042 |
| Applied Materials, Inc. | 284,082 | 25,081,600 |
| Broadcom, Inc. | 131,828 | 61,974,979 |
| Cirrus Logic, Inc. * | 18,175 | 1,219,906 |
| Enphase Energy, Inc. * | 44,250 | 13,584,750 |
| Entegris, Inc. | 48,519 | 3,849,498 |
| First Solar, Inc. * | 32,247 | 4,694,196 |
| GLOBALFOUNDRIES, Inc. *(a) | 22,922 | 1,299,677 |
| SECURITY | NUMBER OF SHARES | VALUE ($) |
| Intel Corp. | 1,340,286 | 38,104,331 |
| KLA Corp. | 46,313 | 14,655,749 |
| Lam Research Corp. | 44,731 | 18,106,214 |
| Lattice Semiconductor Corp. * | 45,036 | 2,184,696 |
| Marvell Technology, Inc. | 277,838 | 11,024,612 |
| Microchip Technology, Inc. | 180,481 | 11,142,897 |
| Micron Technology, Inc. | 360,153 | 19,484,277 |
| MKS Instruments, Inc. | 18,751 | 1,540,395 |
| Monolithic Power Systems, Inc. | 14,466 | 4,910,484 |
| NVIDIA Corp. | 817,600 | 110,351,472 |
| NXP Semiconductors N.V. | 85,815 | 12,535,855 |
| ON Semiconductor Corp. * | 141,591 | 8,697,935 |
| Qorvo, Inc. * | 33,613 | 2,893,407 |
| QUALCOMM, Inc. | 366,624 | 43,136,980 |
| Skyworks Solutions, Inc. | 52,275 | 4,496,173 |
| SolarEdge Technologies, Inc. * | 18,114 | 4,166,764 |
| Synaptics, Inc. * | 13,074 | 1,158,356 |
| Teradyne, Inc. | 51,121 | 4,158,693 |
| Texas Instruments, Inc. | 298,226 | 47,904,042 |
| Universal Display Corp. | 14,283 | 1,360,027 |
| Wolfspeed, Inc. * | 40,261 | 3,170,554 |
| 533,978,978 | ||
| Software & Services 13.0% | ||
| Accenture plc, Class A | 206,497 | 58,624,498 |
| Adobe, Inc. * | 152,806 | 48,668,711 |
| Affirm Holdings, Inc. * | 67,206 | 1,348,824 |
| Akamai Technologies, Inc. * | 51,924 | 4,586,447 |
| Amdocs Ltd. | 40,160 | 3,466,210 |
| ANSYS, Inc. * | 28,371 | 6,274,530 |
| AppLovin Corp., Class A *(a) | 39,967 | 677,840 |
| Aspen Technology, Inc. * | 9,370 | 2,262,387 |
| Autodesk, Inc. * | 70,967 | 15,208,228 |
| Automatic Data Processing, Inc. | 135,652 | 32,787,088 |
| Bentley Systems, Inc., Class B | 64,123 | 2,262,259 |
| Bill.com Holdings, Inc. * | 30,547 | 4,073,748 |
| Black Knight, Inc. * | 50,707 | 3,066,252 |
| Block, Inc. * | 173,090 | 10,397,516 |
| Broadridge Financial Solutions, Inc. | 38,146 | 5,724,189 |
| Cadence Design Systems, Inc. * | 89,477 | 13,545,923 |
| CCC Intelligent Solutions Holdings, Inc. * | 34,008 | 317,295 |
| Ceridian HCM Holding, Inc. * | 49,913 | 3,303,741 |
| Cloudflare, Inc., Class A * | 92,187 | 5,191,972 |
| Cognizant Technology Solutions Corp., Class A | 169,259 | 10,536,373 |
| Concentrix Corp. | 14,001 | 1,711,342 |
| Coupa Software, Inc. * | 24,400 | 1,298,812 |
| Crowdstrike Holdings, Inc., Class A * | 69,730 | 11,240,476 |
| Datadog, Inc., Class A * | 80,824 | 6,507,140 |
| DocuSign, Inc. * | 65,383 | 3,157,999 |
| Dolby Laboratories, Inc., Class A | 20,072 | 1,341,612 |
| DoubleVerify Holdings, Inc. * | 20,842 | 609,212 |
| Dropbox, Inc., Class A * | 89,035 | 1,936,511 |
| DXC Technology Co. * | 75,061 | 2,158,004 |
| Dynatrace, Inc. * | 65,382 | 2,304,062 |
| Elastic N.V. * | 25,054 | 1,602,203 |
| EPAM Systems, Inc. * | 18,692 | 6,542,200 |
| Euronet Worldwide, Inc. * | 15,367 | 1,290,982 |
| ExlService Holdings, Inc. * | 10,805 | 1,964,889 |
| Fair Isaac Corp. * | 8,255 | 3,952,824 |
| Fidelity National Information Services, Inc. | 198,531 | 16,476,088 |
| Fiserv, Inc. * | 208,806 | 21,452,728 |
| Five9, Inc. * | 22,880 | 1,378,749 |
| FleetCor Technologies, Inc. * | 24,512 | 4,562,173 |
| Fortinet, Inc. * | 213,847 | 12,223,495 |
| SECURITY | NUMBER OF SHARES | VALUE ($) |
| Gartner, Inc. * | 25,858 | 7,807,047 |
| Genpact Ltd. | 54,794 | 2,657,509 |
| Global Payments, Inc. | 90,585 | 10,350,242 |
| GoDaddy, Inc., Class A * | 51,100 | 4,108,440 |
| Guidewire Software, Inc. * | 27,193 | 1,615,536 |
| HubSpot, Inc. * | 15,684 | 4,651,247 |
| Informatica, Inc., Class A * | 12,317 | 238,457 |
| International Business Machines Corp. | 294,834 | 40,772,594 |
| Intuit, Inc. | 92,115 | 39,379,163 |
| Jack Henry & Associates, Inc. | 23,877 | 4,752,956 |
| Manhattan Associates, Inc. * | 20,388 | 2,480,608 |
| Mastercard, Inc., Class A | 278,534 | 91,409,288 |
| Microsoft Corp. | 2,434,860 | 565,204,052 |
| MongoDB, Inc. * | 22,206 | 4,064,364 |
| NCR Corp. * | 44,759 | 951,576 |
| NortonLifeLock, Inc. | 193,505 | 4,359,668 |
| Nutanix, Inc., Class A * | 72,710 | 1,992,254 |
| Okta, Inc. * | 49,301 | 2,766,772 |
| Oracle Corp. | 495,923 | 38,716,709 |
| Palantir Technologies, Inc., Class A * | 570,720 | 5,016,629 |
| Palo Alto Networks, Inc. * | 97,621 | 16,750,787 |
| Paychex, Inc. | 104,700 | 12,387,057 |
| Paycom Software, Inc. * | 15,812 | 5,470,952 |
| Paycor HCM, Inc. * | 15,359 | 467,989 |
| Paylocity Holding Corp. * | 13,357 | 3,096,019 |
| PayPal Holdings, Inc. * | 377,666 | 31,565,324 |
| Procore Technologies, Inc. * | 22,269 | 1,217,224 |
| PTC, Inc. * | 34,587 | 4,075,386 |
| Qualys, Inc. * | 11,402 | 1,625,469 |
| Roper Technologies, Inc. | 34,627 | 14,354,277 |
| Salesforce, Inc. * | 324,908 | 52,826,792 |
| SentinelOne, Inc., Class A * | 65,128 | 1,487,524 |
| ServiceNow, Inc. * | 65,964 | 27,753,693 |
| Smartsheet, Inc., Class A * | 42,623 | 1,488,395 |
| Snowflake, Inc., Class A * | 92,463 | 14,821,819 |
| Splunk, Inc. * | 48,359 | 4,019,116 |
| SPS Commerce, Inc. * | 11,746 | 1,486,104 |
| SS&C Technologies Holdings, Inc. | 72,246 | 3,714,889 |
| Switch, Inc., Class A | 45,331 | 1,543,521 |
| Synopsys, Inc. * | 49,967 | 14,617,846 |
| Tenable Holdings, Inc. * | 36,426 | 1,480,353 |
| The Western Union Co. | 125,768 | 1,699,126 |
| Toast, Inc., Class A * | 98,300 | 2,171,447 |
| Twilio, Inc., Class A * | 56,705 | 4,217,151 |
| Tyler Technologies, Inc. * | 13,577 | 4,389,851 |
| UiPath, Inc., Class A * | 113,097 | 1,430,677 |
| Unity Software, Inc. * | 58,389 | 1,722,476 |
| VeriSign, Inc. * | 30,513 | 6,116,636 |
| Visa, Inc., Class A | 533,775 | 110,576,829 |
| VMware, Inc., Class A | 67,530 | 7,599,151 |
| WEX, Inc. * | 14,374 | 2,359,348 |
| Workday, Inc., Class A * | 65,052 | 10,136,403 |
| Zendesk, Inc. * | 40,089 | 3,074,425 |
| Zoom Video Communications, Inc., Class A * | 72,372 | 6,038,720 |
| Zscaler, Inc. * | 27,343 | 4,213,556 |
| 1,551,326,975 | ||
| Technology Hardware & Equipment 8.2% | ||
| Amphenol Corp., Class A | 194,334 | 14,736,347 |
| Apple Inc. | 4,932,019 | 756,275,793 |
| Arista Networks, Inc. * | 80,557 | 9,736,119 |
| Arrow Electronics, Inc. * | 20,909 | 2,117,245 |
| CDW Corp. | 44,100 | 7,620,921 |
| Ciena Corp. * | 48,788 | 2,336,945 |
| Cisco Systems, Inc. | 1,352,033 | 61,422,859 |
| SECURITY | NUMBER OF SHARES | VALUE ($) |
| Cognex Corp. | 56,281 | 2,601,871 |
| Coherent Corp. * | 42,123 | 1,415,754 |
| Corning, Inc. | 248,062 | 7,980,155 |
| Dell Technologies, Inc., Class C | 86,811 | 3,333,542 |
| F5, Inc. * | 19,415 | 2,774,598 |
| Hewlett Packard Enterprise Co. | 422,739 | 6,032,485 |
| HP, Inc. | 297,386 | 8,213,801 |
| IPG Photonics Corp. * | 10,749 | 920,759 |
| Jabil, Inc. | 44,836 | 2,880,713 |
| Juniper Networks, Inc. | 104,827 | 3,207,706 |
| Keysight Technologies, Inc. * | 58,791 | 10,238,453 |
| Littelfuse, Inc. | 8,104 | 1,784,906 |
| Lumentum Holdings, Inc. * | 22,425 | 1,669,541 |
| Motorola Solutions, Inc. | 54,546 | 13,620,682 |
| National Instruments Corp. | 42,750 | 1,632,195 |
| NetApp, Inc. | 71,702 | 4,966,798 |
| Novanta, Inc. * | 11,729 | 1,658,481 |
| Pure Storage, Inc., Class A * | 90,559 | 2,794,651 |
| Rogers Corp. * | 6,118 | 1,439,749 |
| Seagate Technology Holdings plc | 63,779 | 3,167,265 |
| TD SYNNEX Corp. | 13,774 | 1,260,459 |
| TE Connectivity Ltd. | 104,474 | 12,769,857 |
| Teledyne Technologies, Inc. * | 15,329 | 6,100,635 |
| Trimble, Inc. * | 80,735 | 4,857,018 |
| Ubiquiti, Inc. | 1,380 | 478,515 |
| Western Digital Corp. * | 101,783 | 3,498,282 |
| Zebra Technologies Corp., Class A * | 16,900 | 4,786,418 |
| 970,331,518 | ||
| Telecommunication Services 1.1% | ||
| AT&T, Inc. | 2,326,173 | 42,406,134 |
| Frontier Communications Parent, Inc. * | 72,723 | 1,703,173 |
| Iridium Communications, Inc. * | 41,810 | 2,154,469 |
| Liberty Global plc, Class C * | 90,454 | 1,597,417 |
| Lumen Technologies, Inc. | 311,855 | 2,295,253 |
| T-Mobile US, Inc. * | 196,523 | 29,785,026 |
| Verizon Communications, Inc. | 1,371,011 | 51,234,681 |
| 131,176,153 | ||
| Transportation 1.8% | ||
| Alaska Air Group, Inc. * | 41,600 | 1,849,536 |
| AMERCO | 3,231 | 1,858,439 |
| American Airlines Group, Inc. * | 211,014 | 2,992,178 |
| Avis Budget Group, Inc. * | 9,431 | 2,230,054 |
| C.H. Robinson Worldwide, Inc. | 40,498 | 3,957,465 |
| CSX Corp. | 698,960 | 20,311,778 |
| Delta Air Lines, Inc. * | 209,843 | 7,119,973 |
| Expeditors International of Washington, Inc. | 53,458 | 5,230,865 |
| FedEx Corp. | 78,070 | 12,513,060 |
| GXO Logistics, Inc. * | 38,675 | 1,413,184 |
| Hertz Global Holdings, Inc. * | 58,900 | 1,083,760 |
| JB Hunt Transport Services, Inc. | 27,135 | 4,641,984 |
| Knight-Swift Transportation Holdings, Inc. | 52,573 | 2,525,081 |
| Landstar System, Inc. | 11,826 | 1,847,458 |
| Lyft, Inc., Class A * | 100,086 | 1,465,259 |
| Norfolk Southern Corp. | 76,682 | 17,488,864 |
| Old Dominion Freight Line, Inc. | 29,913 | 8,214,110 |
| Saia, Inc. * | 8,658 | 1,721,730 |
| Southwest Airlines Co. * | 193,379 | 7,029,327 |
| Uber Technologies, Inc. * | 646,669 | 17,181,995 |
| Union Pacific Corp. | 203,838 | 40,184,623 |
| United Airlines Holdings, Inc. * | 106,722 | 4,597,584 |
| United Parcel Service, Inc., Class B | 238,792 | 40,062,134 |
| SECURITY | NUMBER OF SHARES | VALUE ($) |
| XPO Logistics, Inc. * | 37,571 | 1,943,923 |
| 209,464,364 | ||
| Utilities 2.9% | ||
| Alliant Energy Corp. | 81,683 | 4,261,402 |
| Ameren Corp. | 84,273 | 6,869,935 |
| American Electric Power Co., Inc. | 167,876 | 14,759,658 |
| American Water Works Co., Inc. | 59,332 | 8,623,313 |
| Atmos Energy Corp. | 45,586 | 4,857,188 |
| Avangrid, Inc. | 23,070 | 938,488 |
| Black Hills Corp. | 21,135 | 1,381,595 |
| CenterPoint Energy, Inc. | 205,368 | 5,875,578 |
| CMS Energy Corp. | 94,580 | 5,395,789 |
| Consolidated Edison, Inc. | 115,701 | 10,177,060 |
| Constellation Energy Corp. | 106,519 | 10,070,306 |
| Dominion Energy, Inc. | 271,872 | 19,022,884 |
| DTE Energy Co. | 63,328 | 7,099,702 |
| Duke Energy Corp. | 251,357 | 23,421,445 |
| Edison International | 124,249 | 7,459,910 |
| Entergy Corp. | 66,283 | 7,101,561 |
| Essential Utilities, Inc. | 77,536 | 3,428,642 |
| Evergy, Inc. | 74,709 | 4,566,961 |
| Eversource Energy | 113,276 | 8,640,693 |
| Exelon Corp. | 324,093 | 12,506,749 |
| FirstEnergy Corp. | 177,472 | 6,692,469 |
| Hawaiian Electric Industries, Inc. | 35,479 | 1,349,621 |
| IDACORP, Inc. | 16,635 | 1,741,684 |
| National Fuel Gas Co. | 29,908 | 2,018,491 |
| New Jersey Resources Corp. | 31,403 | 1,401,830 |
| NextEra Energy, Inc. | 641,572 | 49,721,830 |
| NiSource, Inc. | 132,847 | 3,412,839 |
| NRG Energy, Inc. | 76,540 | 3,398,376 |
| OGE Energy Corp. | 65,125 | 2,385,529 |
| ONE Gas, Inc. | 17,650 | 1,367,522 |
| Ormat Technologies, Inc. | 14,653 | 1,325,364 |
| PG&E Corp. * | 526,036 | 7,853,717 |
| Pinnacle West Capital Corp. | 37,006 | 2,487,173 |
| PNM Resources, Inc. | 27,978 | 1,300,138 |
| Portland General Electric Co. | 28,961 | 1,301,507 |
| PPL Corp. | 239,695 | 6,349,521 |
| Public Service Enterprise Group, Inc. | 163,096 | 9,144,793 |
| Sempra Energy | 102,657 | 15,495,048 |
| South Jersey Industries, Inc. | 40,155 | 1,392,174 |
| Southwest Gas Holdings, Inc. | 20,127 | 1,470,680 |
| The AES Corp. | 217,374 | 5,686,504 |
| The Southern Co. | 347,099 | 22,728,043 |
| SECURITY | NUMBER OF SHARES | VALUE ($) |
| UGI Corp. | 67,991 | 2,402,122 |
| Vistra Corp. | 128,068 | 2,941,722 |
| WEC Energy Group, Inc. | 103,139 | 9,419,685 |
| Xcel Energy, Inc. | 178,917 | 11,649,286 |
| 342,896,527 | ||
| Total Common Stocks (Cost $3,290,259,237) | 11,831,294,018 | |
| SHORT-TERM INVESTMENTS 0.6% OF NET ASSETS | ||
| Money Market Funds 0.6% | ||
| State Street Institutional U.S. Government Money Market Fund, Premier Class 3.01% (c) | 56,315,472 | 56,315,472 |
| State Street Institutional U.S. Government Money Market Fund, Premier Class 3.01% (c)(d) | 11,148,600 | 11,148,600 |
| 67,464,072 | ||
| Total Short-Term Investments (Cost $67,464,072) | 67,464,072 | |
| Total Investments in Securities (Cost $3,357,723,309) | 11,898,758,090 | |
| NUMBER OF CONTRACTS | NOTIONAL AMOUNT ($) | CURRENT VALUE/ UNREALIZED APPRECIATION ($) | |
| FUTURES CONTRACTS | |||
| Long | |||
| S&P 500 Index, e-mini, expires 12/16/22 | 287 | 55,721,050 | 1,748,573 |
| * | Non-income producing security. |
| (a) | All or a portion of this security is on loan. Securities on loan were valued at $10,725,058. |
| (b) | Issuer is affiliated with the fund’s investment adviser. |
| (c) | The rate shown is the annualized 7-day yield. |
| (d) | Security purchased with cash collateral received for securities on loan. |
| REIT — | Real Estate Investment Trust |
| SECURITY | VALUE AT 10/31/21 | PURCHASES | SALES | REALIZED GAINS (LOSSES) | NET CHANGE IN UNREALIZED APPRECIATION (DEPRECIATION) | VALUE AT 10/31/22 | BALANCE OF SHARES HELD AT 10/31/22 | DIVIDENDS RECEIVED |
| COMMON STOCKS 0.3% OF NET ASSETS | ||||||||
| Diversified Financials 0.3% | ||||||||
| The Charles Schwab Corp. | $39,021,425 | $1,641,146 | ($162,866) | ($27,508) | ($940,182) | $39,532,015 | 496,197 | $385,674 |
| DESCRIPTION | QUOTED PRICES IN ACTIVE MARKETS FOR IDENTICAL ASSETS (LEVEL 1) | OTHER SIGNIFICANT OBSERVABLE INPUTS (LEVEL 2) | SIGNIFICANT UNOBSERVABLE INPUTS (LEVEL 3) | TOTAL |
| Assets | ||||
| Common Stocks1 | $11,831,294,018 | $— | $— | $11,831,294,018 |
| Short-Term Investments1 | 67,464,072 | — | — | 67,464,072 |
| Futures Contracts2 | 1,748,573 | — | — | 1,748,573 |
| Total | $11,900,506,663 | $— | $— | $11,900,506,663 |
| 1 | As categorized in the Portfolio Holdings. |
| 2 | Futures contracts are reported at cumulative unrealized appreciation or depreciation. |
| Assets | ||
| Investments in securities, at value - affiliated (cost $5,291,952) | $39,532,015 | |
| Investments in securities, at value - unaffiliated (cost $3,352,431,357) including securities on loan of $10,725,058 | 11,859,226,075 | |
| Cash | 11,867,524 | |
| Deposit with broker for futures contracts | 3,660,000 | |
| Receivables: | ||
| Dividends | 8,976,097 | |
| Fund shares sold | 6,691,489 | |
| Income from securities on loan | + | 52,724 |
| Total assets | 11,930,005,924 | |
| Liabilities | ||
| Collateral held for securities on loan | 11,148,600 | |
| Payables: | ||
| Investments bought | 22,467,303 | |
| Fund shares redeemed | 7,521,166 | |
| Investment adviser fees | 453,248 | |
| Variation margin on futures contracts | + | 311,463 |
| Total liabilities | 41,901,780 | |
| Net assets | $11,888,104,144 | |
| Net Assets by Source | ||
| Capital received from investors | $3,281,992,498 | |
| Total distributable earnings | + | 8,606,111,646 |
| Net assets | $11,888,104,144 | |
| Net Asset Value (NAV) | ||||
| Net Assets | ÷ | Shares Outstanding | = | NAV |
| $11,888,104,144 | 141,466,820 | $84.03 | ||
| For the period November 1, 2021 through October 31, 2022 | ||
| Investment Income | ||
| Dividends received from securities - unaffiliated (net of foreign withholding tax of $45,162) | $187,505,742 | |
| Dividends received from securities - affiliated | 385,674 | |
| Securities on loan, net | + | 509,697 |
| Total investment income | 188,401,113 | |
| Expenses | ||
| Investment adviser fees | 6,461,785 | |
| Proxy fees1 | + | 594,498 |
| Total expenses | – | 7,056,283 |
| Net investment income | 181,344,830 | |
| REALIZED AND UNREALIZED GAINS (LOSSES) | ||
| Net realized losses on sales of securities - affiliated | (27,508) | |
| Net realized losses on sales of securities - unaffiliated | (83,154,477) | |
| Net realized gains on sales of in-kind redemptions - unaffiliated | 118,772,535 | |
| Net realized losses on futures contracts | + | (10,990,124) |
| Net realized gains | 24,600,426 | |
| Net change in unrealized appreciation (depreciation) on securities - affiliated | (940,182) | |
| Net change in unrealized appreciation (depreciation) on securities - unaffiliated | (2,587,358,510) | |
| Net change in unrealized appreciation (depreciation) on futures contracts | + | (344,068) |
| Net change in unrealized appreciation (depreciation) | + | (2,588,642,760) |
| Net realized and unrealized losses | (2,564,042,334) | |
| Decrease in net assets resulting from operations | ($2,382,697,504) | |
| 1 | Proxy fees are non-routine expenses (see financial note 2(e) for additional information). |
| OPERATIONS | |||
| 11/1/21-10/31/22 | 11/1/20-10/31/21 | ||
| Net investment income | $181,344,830 | $171,096,348 | |
| Net realized gains | 24,600,426 | 158,449,688 | |
| Net change in unrealized appreciation (depreciation) | + | (2,588,642,760) | 3,932,270,152 |
| Increase (decrease) in net assets resulting from operations | ($2,382,697,504) | $4,261,816,188 | |
| DISTRIBUTIONS TO SHAREHOLDERS | |||
| Total distributions | ($249,966,849) | ($306,286,999) | |
| TRANSACTIONS IN FUND SHARES | |||||
| 11/1/21-10/31/22 | 11/1/20-10/31/21 | ||||
| SHARES | VALUE | SHARES | VALUE | ||
| Shares sold | 15,172,044 | $1,385,599,712 | 15,568,422 | $1,394,601,301 | |
| Shares reinvested | 1,982,815 | 202,881,568 | 3,026,807 | 250,256,414 | |
| Shares redeemed | + | (14,187,727) | (1,289,927,639) | (12,663,564) | (1,152,112,463) |
| Net transactions in fund shares | 2,967,132 | $298,553,641 | 5,931,665 | $492,745,252 | |
| SHARES OUTSTANDING AND NET ASSETS | |||||
| 11/1/21-10/31/22 | 11/1/20-10/31/21 | ||||
| SHARES | NET ASSETS | SHARES | NET ASSETS | ||
| Beginning of period | 138,499,688 | $14,222,214,856 | 132,568,023 | $9,773,940,415 | |
| Total increase (decrease) | + | 2,967,132 | (2,334,110,712) | 5,931,665 | 4,448,274,441 |
| End of period | 141,466,820 | $11,888,104,144 | 138,499,688 | $14,222,214,856 | |
| 11/1/21– 10/31/22 | 11/1/20– 10/31/21 | 11/1/19– 10/31/20 | 11/1/18– 10/31/19 | 11/1/17– 10/31/18 | ||
| Per-Share Data | ||||||
| Net asset value at beginning of period | $39.97 | $27.18 | $28.84 | $30.48 | $31.45 | |
| Income (loss) from investment operations: | ||||||
| Net investment income (loss)1 | 0.40 | 0.37 | 0.35 | 0.40 | 0.43 | |
| Net realized and unrealized gains (losses) | (7.31) | 13.29 | (0.23) | 0.54 | 0.20 | |
| Total from investment operations | (6.91) | 13.66 | 0.12 | 0.94 | 0.63 | |
| Less distributions: | ||||||
| Distributions from net investment income | (0.42) | (0.38) | (0.42) | (0.40) | (0.39) | |
| Distributions from net realized gains | (2.77) | (0.49) | (1.36) | (2.18) | (1.21) | |
| Total distributions | (3.19) | (0.87) | (1.78) | (2.58) | (1.60) | |
| Net asset value at end of period | $29.87 | $39.97 | $27.18 | $28.84 | $30.48 | |
| Total return | (18.53%) | 50.82% | 0.00% | 4.95% | 1.93% | |
| Ratios/Supplemental Data | ||||||
| Ratios to average net assets: | ||||||
| Total expenses | 0.04% 2 | 0.04% | 0.04% | 0.04% 3 | 0.05% | |
| Net investment income (loss) | 1.25% | 0.98% | 1.31% | 1.43% | 1.33% | |
| Portfolio turnover rate | 16% 4 | 19% 4 | 21% | 14% | 17% | |
| Net assets, end of period (x 1,000,000) | $5,372 | $6,587 | $3,988 | $4,187 | $3,874 | |
| 1 | Calculated based on the average shares outstanding during the period. |
| 2 | Ratio includes less than 0.005% of non-routine proxy expenses. |
| 3 | Effective December 20, 2018, the annual operating expense ratio was reduced to 0.04%. The ratio presented for period ended 10/31/19 is a blended ratio. |
| 4 | Portfolio turnover rate excludes in-kind transactions. |
| SECURITY | NUMBER OF SHARES | VALUE ($) |
| COMMON STOCKS 99.8% OF NET ASSETS | ||
| Automobiles & Components 1.6% | ||
| Adient plc * | 212,356 | 7,428,213 |
| American Axle & Manufacturing Holdings, Inc. * | 253,407 | 2,455,514 |
| Canoo, Inc. *(a) | 311,031 | 426,112 |
| Cenntro Electric Group Ltd. * | 416,026 | 424,346 |
| Dana, Inc. | 288,723 | 4,608,019 |
| Dorman Products, Inc. * | 58,962 | 4,812,478 |
| Faraday Future Intelligent Electric, Inc. *(a) | 224,288 | 121,138 |
| Fisker, Inc. *(a) | 363,951 | 2,966,201 |
| Fox Factory Holding Corp. * | 94,915 | 8,338,283 |
| Gentherm, Inc. * | 74,109 | 4,329,448 |
| Holley, Inc. *(a) | 116,742 | 464,633 |
| LCI Industries | 55,588 | 5,898,443 |
| Lordstown Motors Corp., Class A *(a) | 375,943 | 680,457 |
| Luminar Technologies, Inc. *(a) | 551,669 | 4,463,002 |
| Modine Manufacturing Co. * | 111,127 | 1,991,396 |
| Motorcar Parts of America, Inc. * | 42,004 | 798,076 |
| Mullen Automotive, Inc. * | 726,941 | 346,315 |
| Patrick Industries, Inc. | 49,157 | 2,246,966 |
| Solid Power, Inc. *(a) | 294,436 | 1,651,786 |
| Standard Motor Products, Inc. | 45,313 | 1,718,722 |
| Stoneridge, Inc. * | 58,775 | 1,226,634 |
| Tenneco, Inc., Class A * | 184,621 | 3,637,034 |
| The Goodyear Tire & Rubber Co. * | 627,700 | 7,971,790 |
| Visteon Corp. * | 62,240 | 8,120,453 |
| Winnebago Industries, Inc. | 69,474 | 4,146,903 |
| Workhorse Group, Inc. *(a) | 340,701 | 919,893 |
| XPEL, Inc. * | 48,179 | 3,333,505 |
| 85,525,760 | ||
| Banks 11.7% | ||
| 1st Source Corp. | 36,060 | 2,097,250 |
| ACNB Corp. | 18,607 | 680,830 |
| Amalgamated Financial Corp. | 30,875 | 709,816 |
| Amerant Bancorp, Inc. | 61,761 | 1,859,006 |
| American National Bankshares, Inc. | 23,233 | 849,631 |
| Ameris Bancorp | 148,069 | 7,627,034 |
| Arrow Financial Corp. | 31,711 | 1,104,177 |
| Associated Banc-Corp. | 333,828 | 8,128,712 |
| Atlantic Union Bankshares Corp. | 167,549 | 5,787,142 |
| Axos Financial, Inc. * | 128,220 | 4,995,451 |
| Banc of California, Inc. | 118,235 | 1,972,160 |
| BancFirst Corp. | 43,985 | 4,214,643 |
| Bank First Corp. | 14,235 | 1,226,345 |
| Bank of Marin Bancorp | 34,867 | 1,258,699 |
| BankUnited, Inc. | 174,139 | 6,260,297 |
| Bankwell Financial Group, Inc. | 12,382 | 379,384 |
| Banner Corp. | 76,461 | 5,715,460 |
| Bar Harbor Bankshares | 33,024 | 991,050 |
| Baycom Corp. | 28,223 | 542,728 |
| BCB Bancorp, Inc. | 32,457 | 637,780 |
| Berkshire Hills Bancorp, Inc. | 98,494 | 2,880,949 |
| SECURITY | NUMBER OF SHARES | VALUE ($) |
| Blue Foundry Bancorp * | 58,885 | 724,874 |
| Blue Ridge Bankshares, Inc. | 38,550 | 503,078 |
| Bridgewater Bancshares, Inc. * | 45,382 | 867,704 |
| Brookline Bancorp, Inc. | 168,656 | 2,319,020 |
| Business First Bancshares, Inc. | 47,345 | 1,173,209 |
| Byline Bancorp, Inc. | 55,216 | 1,276,594 |
| Cadence Bank | 405,840 | 11,221,476 |
| Cambridge Bancorp | 15,343 | 1,347,883 |
| Camden National Corp. | 32,307 | 1,406,001 |
| Capital Bancorp, Inc. | 20,392 | 503,275 |
| Capital City Bank Group, Inc. | 30,238 | 1,071,030 |
| Capitol Federal Financial, Inc. | 291,367 | 2,383,382 |
| Capstar Financial Holdings, Inc. | 45,528 | 804,935 |
| Carter Bankshares, Inc. * | 54,487 | 975,317 |
| Cathay General Bancorp | 161,034 | 7,343,150 |
| Central Pacific Financial Corp. | 60,113 | 1,233,519 |
| Citizens & Northern Corp. | 33,752 | 802,623 |
| City Holding Co. | 32,925 | 3,320,486 |
| Civista Bancshares, Inc. | 33,937 | 804,307 |
| CNB Financial Corp. | 36,036 | 916,035 |
| Coastal Financial Corp. * | 23,292 | 1,085,873 |
| Colony Bankcorp, Inc. | 37,078 | 511,676 |
| Columbia Banking System, Inc. | 176,282 | 5,900,159 |
| Columbia Financial, Inc. * | 76,509 | 1,571,495 |
| Community Bank System, Inc. | 119,461 | 7,457,950 |
| Community Trust Bancorp, Inc. | 35,110 | 1,660,352 |
| ConnectOne Bancorp, Inc. | 83,029 | 2,079,876 |
| CrossFirst Bankshares, Inc. * | 102,256 | 1,422,381 |
| Customers Bancorp, Inc. * | 68,385 | 2,303,891 |
| CVB Financial Corp. | 298,272 | 8,566,372 |
| Dime Community Bancshares, Inc. | 72,718 | 2,510,953 |
| Eagle Bancorp, Inc. | 70,935 | 3,211,937 |
| Eastern Bankshares, Inc. | 348,885 | 6,688,125 |
| Enact Holdings, Inc. | 67,464 | 1,729,777 |
| Enterprise Bancorp, Inc. | 21,008 | 657,130 |
| Enterprise Financial Services Corp. | 78,898 | 4,218,676 |
| Equity Bancshares, Inc., Class A | 33,945 | 1,212,515 |
| Esquire Financial Holdings, Inc. | 15,613 | 705,395 |
| Essent Group Ltd. | 235,723 | 9,329,916 |
| Farmers & Merchants Bancorp, Inc. | 27,128 | 793,765 |
| Farmers National Banc Corp. | 70,143 | 963,765 |
| FB Financial Corp. | 80,072 | 3,359,821 |
| Federal Agricultural Mortgage Corp., Class C | 20,306 | 2,339,251 |
| Finance Of America Cos., Inc., Class A * | 85,397 | 137,489 |
| Financial Institutions, Inc. | 34,041 | 811,197 |
| First BanCorp | 415,077 | 6,554,066 |
| First Bancorp/Southern Pines NC | 78,969 | 3,519,648 |
| First Bank | 35,240 | 553,973 |
| First Busey Corp. | 115,679 | 3,055,082 |
| First Business Financial Services, Inc. | 18,093 | 690,248 |
| First Commonwealth Financial Corp. | 208,992 | 2,996,945 |
| First Community Bankshares, Inc. | 35,652 | 1,327,680 |
| First Financial Bancorp | 208,444 | 5,434,135 |
| First Financial Bankshares, Inc. | 290,814 | 11,193,431 |
| First Financial Corp. | 24,743 | 1,199,788 |
| First Foundation, Inc. | 114,011 | 1,819,616 |
| First Guaranty Bancshares, Inc. | 13,326 | 307,431 |
| SECURITY | NUMBER OF SHARES | VALUE ($) |
| First Internet Bancorp | 19,897 | 511,154 |
| First Interstate BancSystem, Inc., Class A | 204,522 | 9,328,248 |
| First Merchants Corp. | 128,063 | 5,750,029 |
| First Mid Bancshares, Inc. | 41,796 | 1,496,715 |
| First Western Financial, Inc. * | 17,910 | 494,495 |
| Five Star Bancorp | 28,118 | 815,703 |
| Flagstar Bancorp, Inc. | 116,965 | 4,526,545 |
| Flushing Financial Corp. | 63,498 | 1,250,911 |
| Fulton Financial Corp. | 362,875 | 6,615,211 |
| FVCBankcorp, Inc. * | 27,013 | 548,904 |
| German American Bancorp, Inc. | 62,101 | 2,439,948 |
| Glacier Bancorp, Inc. | 248,734 | 14,247,484 |
| Great Southern Bancorp, Inc. | 20,817 | 1,290,238 |
| Greene County Bancorp, Inc. | 7,450 | 496,170 |
| Guaranty Bancshares, Inc. | 18,335 | 678,945 |
| Hancock Whitney Corp. | 192,841 | 10,774,027 |
| Hanmi Financial Corp. | 67,719 | 1,813,515 |
| HarborOne Bancorp, Inc. | 99,628 | 1,517,334 |
| HBT Financial, Inc. | 23,136 | 471,743 |
| Heartland Financial USA, Inc. | 91,896 | 4,532,311 |
| Heritage Commerce Corp. | 131,573 | 1,881,494 |
| Heritage Financial Corp. | 77,587 | 2,613,906 |
| Hilltop Holdings, Inc. | 111,586 | 3,230,415 |
| Home Bancorp, Inc. | 16,460 | 703,665 |
| Home BancShares, Inc. | 425,459 | 10,844,950 |
| Home Point Capital, Inc. | 19,614 | 34,128 |
| HomeStreet, Inc. | 40,307 | 1,046,370 |
| HomeTrust Bancshares, Inc. | 31,967 | 768,167 |
| Hope Bancorp, Inc. | 259,225 | 3,517,683 |
| Horizon Bancorp, Inc. | 90,198 | 1,344,852 |
| Independent Bank Corp. | 102,512 | 8,919,569 |
| Independent Bank Corp., Michigan | 44,636 | 1,032,431 |
| Independent Bank Group, Inc. | 80,071 | 5,051,679 |
| International Bancshares Corp. | 119,901 | 5,947,090 |
| John Marshall Bancorp, Inc. | 25,736 | 741,197 |
| Kearny Financial Corp. | 134,775 | 1,366,618 |
| Lakeland Bancorp, Inc. | 138,728 | 2,587,277 |
| Lakeland Financial Corp. | 54,909 | 4,538,229 |
| Live Oak Bancshares, Inc. | 73,283 | 2,379,499 |
| Luther Burbank Corp. | 32,660 | 412,496 |
| Macatawa Bank Corp. | 59,374 | 637,083 |
| Mercantile Bank Corp. | 34,598 | 1,209,200 |
| Merchants Bancorp | 35,445 | 848,908 |
| Metrocity Bankshares, Inc. | 41,717 | 928,203 |
| Metropolitan Bank Holding Corp. * | 23,084 | 1,523,544 |
| Mid Penn Bancorp, Inc. | 32,063 | 1,095,913 |
| Midland States Bancorp, Inc. | 47,095 | 1,320,544 |
| MidWestOne Financial Group, Inc. | 31,666 | 1,063,978 |
| Mr Cooper Group, Inc. * | 157,481 | 6,218,925 |
| MVB Financial Corp. | 23,072 | 571,263 |
| National Bank Holdings Corp., Class A | 65,485 | 2,869,553 |
| NBT Bancorp, Inc. | 93,522 | 4,432,008 |
| Nicolet Bankshares, Inc. * | 27,398 | 2,090,193 |
| NMI Holdings, Inc., Class A * | 186,146 | 4,082,182 |
| Northeast Bank | 14,739 | 620,512 |
| Northfield Bancorp, Inc. | 96,563 | 1,548,871 |
| Northwest Bancshares, Inc. | 271,815 | 4,093,534 |
| OceanFirst Financial Corp. | 130,189 | 2,939,668 |
| OFG Bancorp | 104,269 | 2,907,020 |
| Old National Bancorp | 656,238 | 12,836,015 |
| Old Second Bancorp, Inc. | 95,038 | 1,520,608 |
| Origin Bancorp, Inc. | 50,084 | 2,069,972 |
| Orrstown Financial Services, Inc. | 23,160 | 613,045 |
| Pacific Premier Bancorp, Inc. | 209,772 | 7,637,799 |
| Park National Corp. | 32,098 | 4,734,455 |
| Parke Bancorp, Inc. | 22,949 | 494,780 |
| Pathward Financial, Inc. | 64,277 | 2,701,562 |
| SECURITY | NUMBER OF SHARES | VALUE ($) |
| PCB Bancorp | 26,336 | 487,216 |
| PCSB Financial Corp. | 28,286 | 551,294 |
| Peapack-Gladstone Financial Corp. | 38,780 | 1,534,525 |
| PennyMac Financial Services, Inc. | 62,760 | 3,346,363 |
| Peoples Bancorp, Inc. | 62,216 | 1,883,278 |
| Peoples Financial Services Corp. | 15,674 | 861,913 |
| Pioneer Bancorp, Inc. * | 26,534 | 273,566 |
| Preferred Bank | 29,717 | 2,284,346 |
| Premier Financial Corp. | 79,508 | 2,293,806 |
| Primis Financial Corp. | 49,901 | 643,224 |
| Professional Holding Corp., Class A * | 29,162 | 789,415 |
| Provident Bancorp, Inc. | 32,571 | 402,578 |
| Provident Financial Services, Inc. | 163,512 | 3,665,939 |
| QCR Holdings, Inc. | 35,773 | 1,814,049 |
| Radian Group, Inc. | 362,551 | 7,566,439 |
| RBB Bancorp | 32,699 | 736,054 |
| Red River Bancshares, Inc. | 9,857 | 561,060 |
| Renasant Corp. | 122,428 | 4,942,418 |
| Republic Bancorp, Inc., Class A | 19,351 | 896,919 |
| Republic First Bancorp, Inc. * | 106,268 | 300,738 |
| S&T Bancorp, Inc. | 87,484 | 3,307,770 |
| Sandy Spring Bancorp, Inc. | 97,727 | 3,463,445 |
| Seacoast Banking Corp. of Florida | 135,396 | 4,183,736 |
| ServisFirst Bancshares, Inc. | 112,258 | 8,456,395 |
| Shore Bancshares, Inc. | 39,953 | 796,663 |
| Sierra Bancorp | 30,459 | 671,621 |
| Silvergate Capital Corp., Class A * | 70,135 | 3,980,863 |
| Simmons First National Corp., Class A | 274,940 | 6,562,818 |
| SmartFinancial, Inc. | 34,731 | 1,015,534 |
| South Plains Financial, Inc. | 22,284 | 696,821 |
| Southern First Bancshares, Inc. * | 16,981 | 758,711 |
| Southern Missouri Bancorp, Inc. | 17,576 | 900,770 |
| Southside Bancshares, Inc. | 68,526 | 2,346,330 |
| SouthState Corp. | 167,768 | 15,171,260 |
| Stellar Bancorp, Inc. | 101,440 | 3,331,290 |
| Sterling Bancorp, Inc. * | 37,651 | 239,837 |
| Stock Yards Bancorp, Inc. | 64,062 | 5,009,008 |
| Summit Financial Group, Inc. | 24,989 | 726,430 |
| Texas Capital Bancshares, Inc. * | 111,879 | 6,712,740 |
| The Bancorp, Inc. * | 123,365 | 3,402,407 |
| The Bank of N.T. Butterfield & Son Ltd. | 111,217 | 3,841,435 |
| The First BanCorp, Inc. | 21,794 | 666,025 |
| The First Bancshares, Inc. | 44,137 | 1,445,045 |
| The First of Long Island Corp. | 49,424 | 868,874 |
| The Hingham Institution For Savings | 3,267 | 807,766 |
| Third Coast Bancshares, Inc. * | 28,813 | 558,972 |
| Tompkins Financial Corp. | 31,135 | 2,579,223 |
| Towne Bank | 150,608 | 4,961,028 |
| TriCo Bancshares | 69,782 | 4,041,076 |
| Triumph Bancorp, Inc. * | 52,242 | 2,690,463 |
| TrustCo Bank Corp. | 42,114 | 1,571,694 |
| Trustmark Corp. | 136,997 | 5,009,980 |
| UMB Financial Corp. | 98,512 | 8,198,169 |
| United Bankshares, Inc. | 292,136 | 12,371,960 |
| United Community Banks, Inc. | 237,851 | 9,157,263 |
| Unity Bancorp, Inc. | 15,476 | 443,542 |
| Univest Financial Corp. | 65,276 | 1,836,867 |
| USCB Financial Holdings, Inc. * | 23,684 | 318,076 |
| Valley National Bancorp | 963,887 | 11,441,339 |
| Velocity Financial, Inc. * | 19,685 | 191,141 |
| Veritex Holdings, Inc. | 117,522 | 3,711,345 |
| Walker & Dunlop, Inc. | 68,674 | 6,177,913 |
| Washington Federal, Inc. | 144,958 | 5,609,875 |
| Washington Trust Bancorp, Inc. | 38,085 | 1,847,122 |
| Waterstone Financial, Inc. | 43,363 | 736,304 |
| WesBanco, Inc. | 130,563 | 5,279,968 |
| West Bancorp, Inc. | 36,265 | 814,875 |
| Westamerica Bancorp | 58,281 | 3,655,967 |
| SECURITY | NUMBER OF SHARES | VALUE ($) |
| WSFS Financial Corp. | 141,375 | 6,582,420 |
| 627,954,221 | ||
| Capital Goods 10.6% | ||
| 3D Systems Corp. * | 283,651 | 2,504,638 |
| AAON, Inc. | 98,144 | 6,329,307 |
| AAR Corp. * | 75,644 | 3,352,542 |
| Aerojet Rocketdyne Holdings, Inc. * | 177,616 | 8,605,495 |
| AeroVironment, Inc. * | 55,195 | 5,050,343 |
| AerSale Corp. * | 35,617 | 755,080 |
| Alamo Group, Inc. | 22,514 | 3,423,929 |
| Albany International Corp., Class A | 69,766 | 6,391,961 |
| Allied Motion Technologies, Inc. | 29,900 | 1,011,218 |
| Alta Equipment Group, Inc. | 46,277 | 565,968 |
| Altra Industrial Motion Corp. | 145,462 | 8,748,085 |
| Ameresco, Inc., Class A * | 71,165 | 4,304,059 |
| American Woodmark Corp. * | 36,956 | 1,675,955 |
| API Group Corp. * | 462,940 | 7,633,881 |
| Apogee Enterprises, Inc. | 49,767 | 2,283,310 |
| Applied Industrial Technologies, Inc. | 85,656 | 10,653,893 |
| Archer Aviation, Inc., Class A * | 318,671 | 908,212 |
| Arcosa, Inc. | 108,386 | 6,958,381 |
| Argan, Inc. | 29,989 | 1,039,719 |
| Array Technologies, Inc. * | 337,390 | 6,106,759 |
| Astec Industries, Inc. | 50,953 | 2,224,098 |
| Astra Space, Inc. * | 335,254 | 211,344 |
| Astronics Corp. * | 57,485 | 532,311 |
| Atkore, Inc. * | 92,238 | 8,790,281 |
| AZZ, Inc. | 54,748 | 2,200,870 |
| Babcock & Wilcox Enterprises, Inc. * | 135,891 | 619,663 |
| Barnes Group, Inc. | 109,556 | 3,874,996 |
| Beacon Roofing Supply, Inc. * | 114,944 | 6,477,094 |
| Berkshire Grey, Inc. * | 107,250 | 143,715 |
| Blink Charging Co. *(a) | 79,700 | 1,179,560 |
| Bloom Energy Corp., Class A * | 393,549 | 7,363,302 |
| Blue Bird Corp. * | 38,321 | 351,404 |
| BlueLinx Holdings, Inc. * | 20,023 | 1,410,821 |
| Boise Cascade Co. | 88,392 | 5,901,934 |
| Brookfield Business Corp., Class A | 57,846 | 1,482,015 |
| Cadre Holdings, Inc. | 42,511 | 1,248,548 |
| Caesarstone Ltd. | 51,397 | 456,405 |
| Chart Industries, Inc. * | 82,196 | 18,319,844 |
| CIRCOR International, Inc. * | 41,534 | 858,508 |
| Columbus McKinnon Corp. | 62,691 | 1,787,947 |
| Comfort Systems USA, Inc. | 79,308 | 9,777,090 |
| Concrete Pumping Holdings, Inc. * | 59,374 | 380,290 |
| Construction Partners, Inc., Class A * | 89,298 | 2,780,740 |
| CSW Industrials, Inc. | 32,711 | 4,217,102 |
| Custom Truck One Source, Inc. * | 134,052 | 928,980 |
| Desktop Metal, Inc., Class A *(a) | 590,931 | 1,495,055 |
| Distribution Solutions Group, Inc. * | 10,769 | 323,932 |
| Douglas Dynamics, Inc. | 50,328 | 1,708,636 |
| Ducommun, Inc. * | 24,699 | 1,166,040 |
| DXP Enterprises, Inc. * | 33,961 | 971,624 |
| Dycom Industries, Inc. * | 64,611 | 7,635,728 |
| EMCOR Group, Inc. | 109,437 | 15,441,561 |
| Encore Wire Corp. | 41,309 | 5,683,705 |
| Energy Recovery, Inc. * | 123,131 | 3,168,161 |
| Energy Vault Holdings, Inc. *(a) | 142,347 | 458,357 |
| Enerpac Tool Group Corp. | 130,839 | 3,324,619 |
| EnerSys | 91,306 | 6,052,675 |
| Enovix Corp. * | 243,425 | 4,593,430 |
| EnPro Industries, Inc. | 46,566 | 4,959,279 |
| ESCO Technologies, Inc. | 57,660 | 4,968,562 |
| ESS Tech, Inc. *(a) | 181,832 | 769,149 |
| Evoqua Water Technologies Corp. * | 263,241 | 10,313,782 |
| SECURITY | NUMBER OF SHARES | VALUE ($) |
| Fathom Digital Manufacturing Corp., Class A * | 22,178 | 56,332 |
| Federal Signal Corp. | 133,667 | 6,235,566 |
| Fluence Energy, Inc. *(a) | 80,688 | 1,204,672 |
| Fluor Corp. * | 318,516 | 9,638,294 |
| Franklin Electric Co., Inc. | 103,143 | 8,451,537 |
| FTC Solar, Inc. * | 94,269 | 195,137 |
| FuelCell Energy, Inc. * | 871,716 | 2,719,754 |
| GATX Corp. | 79,455 | 8,319,733 |
| Gibraltar Industries, Inc. * | 71,053 | 3,629,387 |
| Global Industrial Co. | 29,026 | 921,285 |
| GMS, Inc. * | 96,767 | 4,567,402 |
| GrafTech International Ltd. | 434,491 | 2,211,559 |
| Granite Construction, Inc. | 99,041 | 3,340,653 |
| Great Lakes Dredge & Dock Corp. * | 146,403 | 1,106,807 |
| Griffon Corp. | 103,048 | 3,311,963 |
| H&E Equipment Services, Inc. | 71,502 | 2,699,916 |
| Heliogen, Inc. *(a) | 199,959 | 359,926 |
| Helios Technologies, Inc. | 72,815 | 4,127,882 |
| Herc Holdings, Inc. | 57,426 | 6,753,872 |
| Hillenbrand, Inc. | 155,025 | 6,849,005 |
| Hillman Solutions Corp. * | 301,660 | 2,355,965 |
| Hudson Technologies, Inc. * | 97,069 | 894,005 |
| Hydrofarm Holdings Group, Inc. * | 95,161 | 245,515 |
| Hyliion Holdings Corp. *(a) | 296,407 | 844,760 |
| Hyster-Yale Materials Handling, Inc. | 24,380 | 710,921 |
| Hyzon Motors, Inc. *(a) | 197,533 | 377,288 |
| IES Holdings, Inc. * | 19,343 | 639,093 |
| Insteel Industries, Inc. | 41,987 | 1,106,357 |
| Janus International Group, Inc. * | 182,720 | 1,759,594 |
| JELD-WEN Holding, Inc. * | 187,315 | 1,987,412 |
| John Bean Technologies Corp. | 70,783 | 6,455,410 |
| Kadant, Inc. | 25,969 | 4,621,184 |
| Kaman Corp. | 62,557 | 2,008,080 |
| Karat Packaging, Inc. * | 12,467 | 204,209 |
| Kennametal, Inc. | 182,104 | 4,863,998 |
| Kratos Defense & Security Solutions, Inc. * | 276,586 | 3,064,573 |
| Lightning eMotors, Inc. *(a) | 86,027 | 132,482 |
| Lindsay Corp. | 24,628 | 4,169,520 |
| Luxfer Holdings plc | 60,801 | 879,790 |
| Markforged Holding Corp. *(a) | 243,036 | 529,818 |
| Masonite International Corp. * | 49,789 | 3,561,407 |
| Maxar Technologies, Inc. | 164,572 | 3,676,538 |
| McGrath RentCorp | 54,206 | 5,098,074 |
| Microvast Holdings, Inc. * | 376,904 | 923,415 |
| Miller Industries, Inc. | 25,020 | 636,259 |
| Momentus, Inc. * | 119,773 | 174,869 |
| Moog, Inc., Class A | 64,051 | 5,428,322 |
| MRC Global, Inc. * | 185,979 | 1,865,369 |
| Mueller Industries, Inc. | 125,185 | 7,841,588 |
| Mueller Water Products, Inc., Class A | 348,961 | 4,082,844 |
| MYR Group, Inc. * | 36,678 | 3,209,692 |
| National Presto Industries, Inc. | 11,500 | 810,635 |
| Nikola Corp. *(a) | 721,519 | 2,734,557 |
| Northwest Pipe Co. * | 21,989 | 747,406 |
| NOW, Inc. * | 246,805 | 3,141,828 |
| NuScale Power Corp. *(a) | 70,203 | 791,890 |
| NV5 Global, Inc. * | 30,257 | 4,385,752 |
| Omega Flex, Inc. | 7,332 | 692,141 |
| Park Aerospace Corp. | 44,466 | 553,157 |
| Parsons Corp. * | 75,256 | 3,528,001 |
| PGT Innovations, Inc. * | 129,247 | 2,754,254 |
| Powell Industries, Inc. | 20,801 | 513,161 |
| Preformed Line Products Co. | 5,494 | 436,059 |
| Primoris Services Corp. | 118,964 | 2,401,883 |
| Proterra, Inc. * | 494,999 | 3,088,794 |
| Proto Labs, Inc. * | 61,677 | 2,355,445 |
| SECURITY | NUMBER OF SHARES | VALUE ($) |
| Quanex Building Products Corp. | 74,128 | 1,642,676 |
| RBC Bearings, Inc. * | 63,828 | 16,182,313 |
| Redwire Corp. * | 42,522 | 116,510 |
| Resideo Technologies, Inc. * | 323,546 | 7,642,157 |
| REV Group, Inc. | 75,634 | 1,039,211 |
| Rocket Lab USA, Inc. * | 483,280 | 2,459,895 |
| Rush Enterprises, Inc., Class A | 94,980 | 4,738,552 |
| Rush Enterprises, Inc., Class B | 14,723 | 789,447 |
| Sarcos Technology and Robotics Corp. *(a) | 247,920 | 500,798 |
| Shoals Technologies Group, Inc., Class A * | 250,295 | 5,784,317 |
| Simpson Manufacturing Co., Inc. | 97,006 | 8,292,073 |
| SPX Technologies, Inc. * | 97,968 | 6,450,213 |
| Standex International Corp. | 26,771 | 2,651,668 |
| Stem, Inc. * | 322,493 | 4,385,905 |
| Sterling Infrastructure, Inc. * | 65,576 | 1,769,896 |
| SunPower Corp. * | 183,115 | 3,385,796 |
| Tennant Co. | 41,534 | 2,419,356 |
| Terex Corp. | 149,191 | 6,048,203 |
| Terran Orbital Corp. *(a) | 52,616 | 137,854 |
| Textainer Group Holdings Ltd. | 100,986 | 3,021,501 |
| The Gorman-Rupp Co. | 51,016 | 1,384,574 |
| The Greenbrier Cos., Inc. | 70,978 | 2,506,233 |
| The Manitowoc Co., Inc. * | 78,000 | 711,360 |
| The Shyft Group, Inc. | 77,268 | 1,775,619 |
| Thermon Group Holdings, Inc. * | 73,907 | 1,312,588 |
| Titan International, Inc. * | 114,509 | 1,713,055 |
| Titan Machinery, Inc. * | 45,348 | 1,559,064 |
| TPI Composites, Inc. * | 81,666 | 813,393 |
| Transcat, Inc. * | 15,897 | 1,315,636 |
| Trinity Industries, Inc. | 183,858 | 5,245,469 |
| Triton International Ltd. | 137,507 | 8,345,300 |
| Triumph Group, Inc. * | 143,586 | 1,299,453 |
| Tutor Perini Corp. * | 94,355 | 700,114 |
| UFP Industries, Inc. | 133,799 | 9,530,503 |
| V2X, Inc. * | 26,889 | 1,102,180 |
| Velo3D, Inc. *(a) | 126,556 | 498,631 |
| Veritiv Corp. * | 30,287 | 3,521,167 |
| Vicor Corp. * | 49,270 | 2,353,628 |
| View, Inc. *(a) | 246,431 | 332,682 |
| Virgin Galactic Holdings, Inc. *(a) | 511,063 | 2,361,111 |
| Wabash National Corp. | 108,825 | 2,356,061 |
| Watts Water Technologies, Inc., Class A | 61,237 | 8,962,647 |
| Xos, Inc. * | 120,236 | 135,867 |
| Zurn Water Solutions Corp. | 277,888 | 6,527,589 |
| 570,662,153 | ||
| Commercial & Professional Services 3.1% | ||
| ABM Industries, Inc. | 150,034 | 6,678,013 |
| ACCO Brands Corp. | 205,594 | 945,732 |
| ACV Auctions, Inc., Class A * | 258,395 | 2,356,562 |
| Alight, Inc., Class A * | 759,738 | 6,298,228 |
| Aris Water Solution, Inc., Class A | 49,458 | 842,270 |
| ASGN, Inc. * | 109,804 | 9,309,183 |
| Atlas Technical Consultants, Inc. * | 41,272 | 312,842 |
| Barrett Business Services, Inc. | 15,535 | 1,354,963 |
| Brady Corp., Class A | 102,109 | 4,671,487 |
| BrightView Holdings, Inc. * | 99,081 | 883,803 |
| Casella Waste Systems, Inc., Class A * | 111,732 | 9,140,795 |
| CBIZ, Inc. * | 108,431 | 5,382,515 |
| Cimpress plc * | 39,665 | 923,401 |
| CompX International, Inc. | 3,395 | 60,533 |
| CoreCivic, Inc. * | 261,285 | 2,735,654 |
| CRA International, Inc. | 15,465 | 1,588,874 |
| Deluxe Corp. | 96,490 | 1,773,486 |
| Ennis, Inc. | 56,590 | 1,276,670 |
| SECURITY | NUMBER OF SHARES | VALUE ($) |
| Exponent, Inc. | 113,802 | 10,840,779 |
| First Advantage Corp. * | 131,398 | 1,846,142 |
| Forrester Research, Inc. * | 25,202 | 1,066,549 |
| Franklin Covey Co. * | 27,108 | 1,371,665 |
| Harsco Corp. * | 174,447 | 922,825 |
| Healthcare Services Group, Inc. | 166,403 | 2,322,986 |
| Heidrick & Struggles International, Inc. | 43,451 | 1,223,580 |
| Heritage-Crystal Clean, Inc. * | 34,979 | 960,873 |
| HireRight Holdings Corp. * | 47,706 | 642,123 |
| HNI Corp. | 92,178 | 2,672,240 |
| Huron Consulting Group, Inc. * | 46,002 | 3,387,127 |
| ICF International, Inc. | 41,299 | 4,940,599 |
| Insperity, Inc. | 81,200 | 9,583,224 |
| Interface, Inc. | 131,260 | 1,484,551 |
| KAR Auction Services, Inc. * | 257,113 | 3,735,852 |
| Kelly Services, Inc., Class A | 75,350 | 1,231,219 |
| Kforce, Inc. | 45,621 | 2,886,441 |
| Kimball International, Inc., Class B | 81,701 | 603,770 |
| Korn Ferry | 121,456 | 6,751,739 |
| LegalZoom.com, Inc. * | 215,205 | 1,990,646 |
| Li-Cycle Holdings Corp. *(a) | 307,032 | 1,829,911 |
| Matthews International Corp., Class A | 66,567 | 1,789,321 |
| MillerKnoll, Inc. | 170,094 | 3,602,591 |
| Montrose Environmental Group, Inc. * | 61,527 | 2,693,652 |
| NL Industries, Inc. | 18,784 | 164,548 |
| Pitney Bowes, Inc. | 387,757 | 1,205,924 |
| Planet Labs PBC * | 348,533 | 1,829,798 |
| Quad Graphics, Inc. * | 76,817 | 213,551 |
| Red Violet, Inc. * | 21,589 | 376,512 |
| Resources Connection, Inc. | 72,107 | 1,317,395 |
| Skillsoft Corp. * | 178,447 | 319,420 |
| SP Plus Corp. * | 51,829 | 1,919,228 |
| Spire Global, Inc. *(a) | 273,832 | 394,318 |
| Steelcase, Inc., Class A | 194,968 | 1,514,901 |
| Sterling Check Corp. * | 52,980 | 1,034,699 |
| The Brink's Co. | 103,863 | 6,193,351 |
| The GEO Group, Inc. *(a) | 265,227 | 2,243,820 |
| TriNet Group, Inc. * | 83,798 | 5,445,194 |
| TrueBlue, Inc. * | 72,330 | 1,422,008 |
| UniFirst Corp. | 33,499 | 6,164,151 |
| Upwork, Inc. * | 268,323 | 3,608,944 |
| Viad Corp. * | 45,368 | 1,691,319 |
| VSE Corp. | 23,761 | 1,099,897 |
| Willdan Group, Inc. * | 25,962 | 358,795 |
| 165,433,189 | ||
| Consumer Durables & Apparel 2.5% | ||
| Acushnet Holdings Corp. | 75,491 | 3,515,616 |
| Allbirds, Inc., Class A *(a) | 217,340 | 747,650 |
| AMMO, Inc. *(a) | 196,546 | 638,775 |
| Aterian, Inc. *(a) | 145,213 | 159,734 |
| Beazer Homes USA, Inc. * | 66,936 | 757,046 |
| Cavco Industries, Inc. * | 19,934 | 4,518,440 |
| Century Communities, Inc. | 64,130 | 2,854,426 |
| Clarus Corp. | 64,654 | 782,960 |
| Crocs, Inc. * | 135,771 | 9,605,798 |
| Dream Finders Homes, Inc., Class A * | 47,139 | 523,243 |
| Ermenegildo Zegna N.V. (a) | 106,495 | 1,167,185 |
| Ethan Allen Interiors, Inc. | 50,491 | 1,292,065 |
| Fossil Group, Inc. * | 104,873 | 445,710 |
| G-III Apparel Group Ltd. * | 97,508 | 1,901,406 |
| GoPro, Inc., Class A * | 290,122 | 1,581,165 |
| Green Brick Partners, Inc. * | 60,476 | 1,398,810 |
| Helen of Troy Ltd. * | 53,199 | 5,033,689 |
| Hovnanian Enterprises, Inc., Class A * | 11,682 | 471,135 |
| Installed Building Products, Inc. | 53,257 | 4,580,102 |
| iRobot Corp. * | 60,063 | 3,393,560 |
| SECURITY | NUMBER OF SHARES | VALUE ($) |
| Johnson Outdoors, Inc., Class A | 12,002 | 631,545 |
| KB Home | 176,105 | 5,075,346 |
| Kontoor Brands, Inc. | 124,320 | 4,438,224 |
| Landsea Homes Corp. * | 22,748 | 110,555 |
| Latham Group, Inc. * | 97,554 | 431,189 |
| La-Z-Boy, Inc. | 95,843 | 2,374,031 |
| Legacy Housing Corp. * | 19,950 | 370,272 |
| LGI Homes, Inc. * | 45,910 | 4,226,015 |
| Lifetime Brands, Inc. | 28,014 | 239,940 |
| M.D.C. Holdings, Inc. | 127,947 | 3,897,266 |
| M/I Homes, Inc. * | 60,316 | 2,502,511 |
| Malibu Boats, Inc., Class A * | 45,640 | 2,414,356 |
| Marine Products Corp. | 18,875 | 188,750 |
| MasterCraft Boat Holdings, Inc. * | 39,968 | 869,704 |
| Meritage Homes Corp. * | 81,258 | 6,188,609 |
| Movado Group, Inc. | 34,362 | 1,136,351 |
| Oxford Industries, Inc. | 33,828 | 3,441,322 |
| PLBY Group, Inc. *(a) | 68,766 | 248,933 |
| Purple Innovation, Inc. * | 122,975 | 432,872 |
| Rocky Brands, Inc. | 15,725 | 309,547 |
| Skyline Champion Corp. * | 119,344 | 6,947,014 |
| Smith & Wesson Brands, Inc. | 101,112 | 1,141,554 |
| Snap One Holdings Corp. * | 40,993 | 488,637 |
| Solo Brands, Inc., Class A *(a) | 48,272 | 199,363 |
| Sonos, Inc. * | 285,572 | 4,603,421 |
| Steven Madden Ltd. | 174,695 | 5,218,140 |
| Sturm, Ruger & Co., Inc. | 38,431 | 2,157,132 |
| Superior Group of Cos., Inc. | 26,971 | 267,552 |
| Taylor Morrison Home Corp. * | 245,547 | 6,467,708 |
| The Lovesac Co. * | 31,297 | 761,769 |
| Topgolf Callaway Brands Corp. * | 313,032 | 5,859,959 |
| Traeger, Inc. * | 70,397 | 292,148 |
| Tri Pointe Homes, Inc. * | 225,656 | 3,779,738 |
| Tupperware Brands Corp. * | 99,327 | 767,798 |
| Unifi, Inc. * | 30,460 | 277,795 |
| Universal Electronics, Inc. * | 27,230 | 555,764 |
| Vista Outdoor, Inc. * | 125,022 | 3,630,639 |
| Vizio Holding Corp., Class A * | 151,442 | 1,696,150 |
| Vuzix Corp. *(a) | 132,925 | 664,625 |
| Weber, Inc., Class A (a) | 59,485 | 396,170 |
| Wolverine World Wide, Inc. | 173,243 | 2,967,653 |
| 134,036,582 | ||
| Consumer Services 3.4% | ||
| 2U, Inc. * | 167,184 | 1,034,869 |
| Accel Entertainment, Inc. * | 128,423 | 1,261,114 |
| Adtalem Global Education, Inc. * | 100,421 | 4,187,556 |
| American Public Education, Inc. * | 42,144 | 539,865 |
| Bally's Corp. * | 81,646 | 1,840,301 |
| Biglari Holdings, Inc., Class B * | 1,620 | 223,479 |
| BJ's Restaurants, Inc. * | 50,503 | 1,659,024 |
| Bloomin' Brands, Inc. | 197,526 | 4,742,599 |
| Bluegreen Vacations Holding Corp. | 26,849 | 464,756 |
| Bowlero Corp. *(a) | 90,043 | 1,311,026 |
| Brinker International, Inc. * | 97,295 | 3,248,680 |
| Carriage Services, Inc. | 29,525 | 720,705 |
| Century Casinos, Inc. * | 59,838 | 475,712 |
| Chegg, Inc. * | 278,388 | 6,004,829 |
| Chuy's Holdings, Inc. * | 42,070 | 1,232,651 |
| Coursera, Inc. * | 255,400 | 3,292,106 |
| Cracker Barrel Old Country Store, Inc. | 50,930 | 5,817,225 |
| Dave & Buster's Entertainment, Inc. * | 96,095 | 3,829,386 |
| Denny's Corp. * | 125,632 | 1,423,411 |
| Dine Brands Global, Inc. | 33,136 | 2,388,774 |
| Duolingo, Inc. * | 52,682 | 4,311,495 |
| El Pollo Loco Holdings, Inc. | 44,232 | 444,089 |
| European Wax Center, Inc., Class A | 54,406 | 782,358 |
| SECURITY | NUMBER OF SHARES | VALUE ($) |
| Everi Holdings, Inc. * | 193,044 | 3,663,975 |
| F45 Training Holdings, Inc. * | 79,535 | 265,647 |
| First Watch Restaurant Group, Inc. * | 21,823 | 372,082 |
| Frontdoor, Inc. * | 185,291 | 4,087,519 |
| Full House Resorts, Inc. * | 72,490 | 508,155 |
| Golden Entertainment, Inc. * | 45,131 | 1,905,431 |
| Graham Holdings Co., Class B | 8,333 | 5,198,709 |
| Hilton Grand Vacations, Inc. * | 196,605 | 7,714,780 |
| Inspirato, Inc. * | 45,298 | 96,938 |
| Inspired Entertainment, Inc. * | 47,484 | 486,236 |
| International Game Technology plc | 219,831 | 4,407,612 |
| Jack in the Box, Inc. | 47,397 | 4,181,837 |
| Krispy Kreme, Inc. | 161,015 | 2,310,565 |
| Kura Sushi USA, Inc., Class A * | 10,397 | 821,675 |
| Laureate Education, Inc., Class A | 242,145 | 3,060,713 |
| Life Time Group Holdings, Inc. * | 93,749 | 983,427 |
| Lindblad Expeditions Holdings, Inc. * | 76,136 | 638,781 |
| Monarch Casino & Resort, Inc. * | 29,773 | 2,364,274 |
| NEOGAMES S.A. * | 28,925 | 497,510 |
| Nerdy, Inc. * | 124,321 | 302,100 |
| Noodles & Co. * | 92,816 | 540,189 |
| OneSpaWorld Holdings Ltd. * | 147,862 | 1,341,108 |
| Papa John's International, Inc. | 72,997 | 5,301,772 |
| Perdoceo Education Corp. * | 150,964 | 1,725,519 |
| Portillo's, Inc., Class A *(a) | 52,144 | 1,117,967 |
| RCI Hospitality Holdings, Inc. | 19,174 | 1,618,861 |
| Red Rock Resorts, Inc., Class A | 113,501 | 4,727,317 |
| Rover Group, Inc. *(a) | 207,690 | 911,759 |
| Rush Street Interactive, Inc. * | 135,867 | 563,848 |
| Ruth's Hospitality Group, Inc. | 71,586 | 1,487,557 |
| Scientific Games Corp., Class A * | 211,349 | 11,865,133 |
| SeaWorld Entertainment, Inc. * | 94,139 | 5,475,124 |
| Shake Shack, Inc., Class A * | 83,908 | 4,662,768 |
| Sonder Holdings, Inc. *(a) | 425,418 | 931,665 |
| StoneMor, Inc. * | 60,164 | 209,972 |
| Strategic Education, Inc. | 50,814 | 3,506,166 |
| Stride, Inc. * | 90,846 | 3,044,249 |
| Sweetgreen, Inc., Class A * | 196,101 | 3,647,479 |
| Target Hospitality Corp. * | 65,557 | 797,829 |
| Texas Roadhouse, Inc. | 150,050 | 14,847,447 |
| The Beachbody Co., Inc. *(a) | 229,991 | 232,291 |
| The Cheesecake Factory, Inc. | 110,189 | 3,945,868 |
| The ONE Group Hospitality, Inc. * | 49,618 | 371,143 |
| Udemy, Inc. * | 161,651 | 2,352,022 |
| Universal Technical Institute, Inc. * | 73,377 | 506,301 |
| Vacasa, Inc., Class A *(a) | 250,745 | 915,219 |
| Vivint Smart Home, Inc. * | 211,544 | 1,618,312 |
| Wingstop, Inc. | 67,082 | 10,625,118 |
| WW International, Inc. * | 122,166 | 552,190 |
| Xponential Fitness, Inc., Class A * | 39,195 | 758,423 |
| 185,304,592 | ||
| Diversified Financials 3.8% | ||
| AFC Gamma, Inc. | 35,143 | 602,000 |
| Alerus Financial Corp. | 33,913 | 756,260 |
| A-Mark Precious Metals, Inc. | 40,295 | 1,225,371 |
| Angel Oak Mortgage, Inc. (a) | 26,214 | 270,791 |
| Apollo Commercial Real Estate Finance, Inc. | 315,031 | 3,547,249 |
| Arbor Realty Trust, Inc. | 369,825 | 5,092,490 |
| Ares Commercial Real Estate Corp. | 114,293 | 1,410,376 |
| ARMOUR Residential REIT, Inc. | 254,414 | 1,353,482 |
| Artisan Partners Asset Management, Inc., Class A | 134,478 | 3,833,968 |
| Assetmark Financial Holdings, Inc. * | 48,204 | 998,305 |
| Associated Capital Group, Inc., Class A | 3,950 | 159,185 |
| Atlanticus Holdings Corp. * | 9,469 | 270,435 |
| SECURITY | NUMBER OF SHARES | VALUE ($) |
| B. Riley Financial, Inc. | 46,082 | 1,874,616 |
| Bakkt Holdings, Inc. *(a) | 140,127 | 298,471 |
| Banco Latinoamericano de Comercio Exterior S.A., Class E | 61,532 | 965,437 |
| BGC Partners, Inc., Class A | 715,088 | 2,831,748 |
| Blackstone Mortgage Trust, Inc., Class A | 381,225 | 9,515,376 |
| Blucora, Inc. * | 106,653 | 2,349,566 |
| Bread Financial Holdings, Inc. | 112,044 | 4,045,909 |
| Brightsphere Investment Group, Inc. | 71,919 | 1,353,516 |
| BrightSpire Capital, Inc., Class A | 208,599 | 1,602,040 |
| Broadmark Realty Capital, Inc. | 291,648 | 1,697,391 |
| Cannae Holdings, Inc. * | 159,582 | 3,695,919 |
| Chicago Atlantic Real Estate Finance, Inc. | 12,008 | 177,959 |
| Chimera Investment Corp. | 520,675 | 3,514,556 |
| Claros Mortgage Trust, Inc. (a) | 205,916 | 3,294,656 |
| Cohen & Steers, Inc. | 56,828 | 3,418,772 |
| Compass Diversified Holdings | 138,653 | 2,950,536 |
| Consumer Portfolio Services, Inc. * | 20,900 | 134,178 |
| Cowen, Inc., Class A | 58,898 | 2,274,641 |
| Curo Group Holdings Corp. | 47,866 | 247,467 |
| Diamond Hill Investment Group, Inc. | 6,583 | 1,184,611 |
| Donnelley Financial Solutions, Inc. * | 57,922 | 2,341,786 |
| Dynex Capital, Inc. | 97,453 | 1,163,589 |
| Ellington Financial, Inc. | 126,662 | 1,694,738 |
| Encore Capital Group, Inc. * | 52,945 | 2,695,959 |
| Enova International, Inc. * | 70,119 | 2,628,761 |
| EZCORP, Inc., Class A * | 111,868 | 1,080,645 |
| Federated Hermes, Inc. | 191,021 | 6,637,980 |
| FirstCash Holdings, Inc. | 86,366 | 8,502,733 |
| Focus Financial Partners, Inc., Class A * | 129,801 | 4,515,777 |
| Franklin BSP Realty Trust, Inc. (a) | 188,820 | 2,660,474 |
| GCM Grosvenor, Inc., Class A | 92,279 | 763,147 |
| Granite Point Mortgage Trust, Inc. | 116,799 | 918,040 |
| Green Dot Corp., Class A * | 107,736 | 2,050,216 |
| Hamilton Lane, Inc., Class A | 78,993 | 4,725,361 |
| Hannon Armstrong Sustainable Infrastructure Capital, Inc. | 190,732 | 5,184,096 |
| Houlihan Lokey, Inc. | 111,928 | 9,997,409 |
| Invesco Mortgage Capital, Inc. | 74,374 | 870,920 |
| Jackson Financial, Inc., Class A | 171,056 | 6,561,708 |
| KKR Real Estate Finance Trust, Inc. | 128,165 | 2,232,634 |
| Ladder Capital Corp. REIT | 254,320 | 2,713,594 |
| LendingClub Corp. * | 229,646 | 2,443,433 |
| LendingTree, Inc. * | 23,463 | 591,971 |
| MarketWise, Inc. * | 37,407 | 92,021 |
| MFA Financial, Inc. | 229,927 | 2,290,073 |
| Moelis & Co., Class A | 142,625 | 6,055,857 |
| Moneylion, Inc. * | 274,360 | 307,283 |
| Navient Corp. | 249,285 | 3,774,175 |
| Nelnet, Inc., Class A | 32,642 | 2,908,076 |
| NerdWallet, Inc., Class A *(a) | 57,867 | 679,359 |
| New York Mortgage Trust, Inc. | 853,038 | 2,294,672 |
| Nexpoint Real Estate Finance, Inc. | 18,128 | 318,509 |
| Open Lending Corp., Class A * | 235,296 | 1,687,072 |
| Oportun Financial Corp. * | 63,540 | 349,470 |
| Oppenheimer Holdings, Inc., Class A | 18,509 | 637,080 |
| OppFi, Inc. *(a) | 29,587 | 67,162 |
| Orchid Island Capital, Inc. (a) | 79,446 | 800,017 |
| PennyMac Mortgage Investment Trust | 203,317 | 2,820,007 |
| Perella Weinberg Partners, Class A | 92,562 | 729,389 |
| Piper Sandler Cos. | 38,029 | 4,866,571 |
| PJT Partners, Inc., Class A | 52,838 | 3,931,147 |
| PRA Group, Inc. * | 86,218 | 2,888,303 |
| PROG Holdings, Inc. * | 112,125 | 1,852,305 |
| Ready Capital Corp. | 165,398 | 2,004,624 |
| Redwood Trust, Inc. | 260,167 | 1,854,991 |
| Regional Management Corp. | 17,341 | 588,900 |
| SECURITY | NUMBER OF SHARES | VALUE ($) |
| Sculptor Capital Management, Inc. | 57,426 | 609,290 |
| Silvercrest Asset Management Group, Inc., Class A | 21,812 | 414,210 |
| StepStone Group, Inc., Class A | 119,211 | 3,519,109 |
| StoneX Group, Inc. * | 38,492 | 3,592,073 |
| Sunlight Financial Holdings, Inc. *(a) | 53,414 | 64,631 |
| SWK Holdings Corp. * | 7,819 | 145,433 |
| TPG RE Finance Trust, Inc. | 155,094 | 1,313,646 |
| Two Harbors Investment Corp. | 773,703 | 2,754,383 |
| Value Line, Inc. | 2,028 | 108,701 |
| Victory Capital Holdings, Inc., Class A | 36,910 | 1,067,437 |
| Virtus Investment Partners, Inc. | 15,545 | 2,665,812 |
| WisdomTree Investments, Inc. | 304,849 | 1,655,330 |
| World Acceptance Corp. * | 8,744 | 710,188 |
| 202,339,554 | ||
| Energy 7.0% | ||
| Aemetis, Inc. * | 67,039 | 496,089 |
| Alto Ingredients, Inc. * | 163,263 | 674,276 |
| Amplify Energy Corp. * | 80,340 | 794,563 |
| Arch Resources, Inc. | 34,087 | 5,191,109 |
| Archaea Energy, Inc. * | 133,467 | 3,444,783 |
| Archrock, Inc. | 302,040 | 2,268,320 |
| Ardmore Shipping Corp. * | 78,555 | 1,062,849 |
| Battalion Oil Corp. * | 5,513 | 72,386 |
| Berry Corp. | 174,185 | 1,545,021 |
| Borr Drilling Ltd. * | 437,779 | 2,149,495 |
| Brigham Minerals, Inc., Class A | 117,134 | 3,631,154 |
| Bristow Group, Inc. * | 52,059 | 1,558,646 |
| Cactus, Inc., Class A | 131,897 | 6,821,713 |
| California Resources Corp. | 169,943 | 7,666,129 |
| Callon Petroleum Co. * | 110,110 | 4,840,436 |
| Centrus Energy Corp., Class A * | 23,946 | 1,132,885 |
| ChampionX Corp. | 457,211 | 13,085,379 |
| Chord Energy Corp. | 92,955 | 14,230,481 |
| Civitas Resources, Inc. | 164,996 | 11,534,870 |
| Clean Energy Fuels Corp. * | 380,061 | 2,550,209 |
| CNX Resources Corp. * | 418,917 | 7,041,995 |
| Comstock Resources, Inc. * | 205,078 | 3,851,365 |
| CONSOL Energy, Inc. | 76,795 | 4,839,621 |
| Crescent Energy Co., Class A (a) | 72,543 | 999,643 |
| CVR Energy, Inc. | 66,243 | 2,587,452 |
| Delek US Holdings, Inc. | 157,700 | 4,677,382 |
| Denbury, Inc. * | 112,138 | 10,250,535 |
| DHT Holdings, Inc. | 306,824 | 2,733,802 |
| Diamond Offshore Drilling, Inc. * | 227,113 | 2,237,063 |
| DMC Global, Inc. * | 42,234 | 913,944 |
| Dorian LPG Ltd. | 68,505 | 1,237,885 |
| Dril-Quip, Inc. * | 76,292 | 1,898,145 |
| Earthstone Energy, Inc., Class A * | 100,844 | 1,629,639 |
| Empire Petroleum Corp. * | 22,237 | 355,792 |
| Energy Fuels, Inc. *(a) | 347,996 | 2,505,571 |
| Equitrans Midstream Corp. | 919,901 | 7,745,566 |
| Excelerate Energy, Inc., Class A | 41,511 | 1,146,534 |
| Expro Group Holdings N.V. * | 173,528 | 3,284,885 |
| FLEX LNG Ltd. * | 63,598 | 1,987,437 |
| Frontline Ltd. (a) | 278,980 | 3,503,989 |
| Gevo, Inc. * | 438,412 | 986,427 |
| Golar LNG Ltd. * | 225,808 | 6,281,979 |
| Green Plains, Inc. * | 117,957 | 3,407,778 |
| Gulfport Energy Corp. * | 25,119 | 2,248,402 |
| Helix Energy Solutions Group, Inc. * | 318,591 | 2,230,137 |
| Helmerich & Payne, Inc. | 230,026 | 11,388,587 |
| HighPeak Energy, Inc. | 14,816 | 345,509 |
| International Seaways, Inc. | 110,222 | 4,674,515 |
| Kinetik Holdings, Inc. | 39,391 | 1,448,801 |
| Kosmos Energy Ltd. * | 1,010,224 | 6,556,354 |
| SECURITY | NUMBER OF SHARES | VALUE ($) |
| Laredo Petroleum, Inc. * | 37,742 | 2,440,020 |
| Liberty Energy, Inc., Class A * | 319,455 | 5,401,984 |
| Magnolia Oil & Gas Corp., Class A | 373,248 | 9,585,009 |
| Matador Resources Co. | 251,862 | 16,736,230 |
| Murphy Oil Corp. | 329,772 | 15,997,240 |
| Nabors Industries Ltd. * | 20,301 | 3,532,983 |
| NACCO Industries, Inc., Class A | 9,219 | 521,427 |
| National Energy Services Reunited Corp. * | 86,075 | 650,727 |
| Newpark Resources, Inc. * | 191,203 | 699,803 |
| NextDecade Corp. * | 73,358 | 513,506 |
| NexTier Oilfield Solutions, Inc. * | 392,955 | 3,960,986 |
| Noble Corp. plc * | 165,327 | 5,958,385 |
| Nordic American Tankers Ltd. | 441,586 | 1,364,501 |
| Northern Oil and Gas, Inc. | 149,745 | 5,112,294 |
| Oceaneering International, Inc. * | 224,422 | 3,139,664 |
| Oil States International, Inc. * | 142,152 | 919,723 |
| Par Pacific Holdings, Inc. * | 109,350 | 2,501,928 |
| Patterson-UTI Energy, Inc. | 479,999 | 8,471,982 |
| PBF Energy, Inc., Class A | 216,609 | 9,584,948 |
| Peabody Energy Corp. * | 263,439 | 6,296,192 |
| Permian Resources Corp., Class A * | 460,198 | 4,496,134 |
| ProFrac Holding Corp., Class A * | 36,069 | 790,272 |
| ProPetro Holding Corp. * | 195,439 | 2,313,998 |
| Ranger Oil Corp., Class A | 44,743 | 1,829,989 |
| REX American Resources Corp. * | 35,341 | 1,059,877 |
| Riley Exploration Permian, Inc. | 23,508 | 683,378 |
| Ring Energy, Inc. * | 195,801 | 624,605 |
| RPC, Inc. | 165,756 | 1,844,864 |
| SandRidge Energy, Inc. * | 71,051 | 1,342,153 |
| Scorpio Tankers, Inc. | 109,099 | 5,230,206 |
| Select Energy Services, Inc., Class A | 159,134 | 1,535,643 |
| SFL Corp., Ltd. | 257,380 | 2,625,276 |
| SilverBow Resources, Inc. * | 26,342 | 934,351 |
| Sitio Royalties Corp. (a) | 26,216 | 743,486 |
| SM Energy Co. | 271,003 | 12,189,715 |
| Solaris Oilfield Infrastructure, Inc., Class A | 70,973 | 966,652 |
| Talos Energy, Inc. * | 147,979 | 3,148,993 |
| Teekay Corp. * | 158,425 | 619,442 |
| Teekay Tankers Ltd., Class A * | 50,961 | 1,604,762 |
| Tellurian, Inc. * | 1,141,626 | 3,082,390 |
| TETRA Technologies, Inc. * | 277,329 | 1,370,005 |
| Tidewater, Inc. * | 95,145 | 3,225,415 |
| Uranium Energy Corp. *(a) | 718,204 | 3,023,639 |
| Ur-Energy, Inc. *(a) | 471,434 | 608,150 |
| US Silica Holdings, Inc. * | 166,198 | 2,391,589 |
| VAALCO Energy, Inc. | 237,769 | 1,224,510 |
| Valaris Ltd. * | 136,312 | 9,123,362 |
| Vertex Energy, Inc. * | 121,273 | 1,034,459 |
| W&T Offshore, Inc. * | 211,774 | 1,607,365 |
| Weatherford International plc * | 158,164 | 6,592,275 |
| World Fuel Services Corp. | 137,154 | 3,496,055 |
| 374,500,069 | ||
| Food & Staples Retailing 0.6% | ||
| HF Foods Group, Inc. * | 79,646 | 368,761 |
| Ingles Markets, Inc., Class A | 31,811 | 3,002,004 |
| Natural Grocers by Vitamin Cottage, Inc. | 20,414 | 234,761 |
| PriceSmart, Inc. | 55,058 | 3,522,060 |
| Rite Aid Corp. *(a) | 122,810 | 641,068 |
| SpartanNash Co. | 79,981 | 2,856,122 |
| Sprouts Farmers Market, Inc. * | 240,717 | 7,101,152 |
| The Andersons, Inc. | 71,831 | 2,533,479 |
| The Chefs' Warehouse, Inc. * | 76,462 | 2,800,803 |
| United Natural Foods, Inc. * | 130,038 | 5,514,912 |
| Village Super Market, Inc., Class A | 18,575 | 413,108 |
| SECURITY | NUMBER OF SHARES | VALUE ($) |
| Weis Markets, Inc. | 36,775 | 3,444,714 |
| 32,432,944 | ||
| Food, Beverage & Tobacco 1.9% | ||
| 22nd Century Group, Inc. *(a) | 366,917 | 480,661 |
| Alico, Inc. | 14,250 | 436,335 |
| AppHarvest, Inc. *(a) | 168,178 | 358,219 |
| B&G Foods, Inc. (a) | 158,435 | 2,595,165 |
| Benson Hill, Inc. * | 382,840 | 1,297,828 |
| Beyond Meat, Inc. *(a) | 137,740 | 2,162,518 |
| Brookfield Realty Capital Corp., Class A *(a) | 58,186 | 421,848 |
| Calavo Growers, Inc. | 38,696 | 1,338,495 |
| Cal-Maine Foods, Inc. | 84,827 | 4,793,574 |
| Celsius Holdings, Inc. * | 124,304 | 11,321,608 |
| Coca-Cola Consolidated, Inc. | 10,511 | 5,118,962 |
| Fresh Del Monte Produce, Inc. | 68,134 | 1,776,935 |
| Hostess Brands, Inc. * | 304,424 | 8,061,147 |
| J&J Snack Foods Corp. | 34,014 | 5,020,807 |
| John B. Sanfilippo & Son, Inc. | 20,044 | 1,671,870 |
| Lancaster Colony Corp. | 43,507 | 7,843,442 |
| Landec Corp. * | 59,401 | 591,040 |
| Local Bounti Corp. *(a) | 94,637 | 280,126 |
| MGP Ingredients, Inc. | 31,404 | 3,518,818 |
| Mission Produce, Inc. * | 89,218 | 1,484,587 |
| National Beverage Corp. | 52,870 | 2,507,095 |
| Primo Water Corp. | 352,549 | 5,143,690 |
| Seneca Foods Corp., Class A * | 12,180 | 768,680 |
| Sovos Brands, Inc. * | 85,265 | 1,181,773 |
| SunOpta, Inc. * | 218,713 | 2,456,147 |
| Tattooed Chef, Inc. *(a) | 110,153 | 523,227 |
| The Duckhorn Portfolio, Inc. * | 82,922 | 1,212,320 |
| The Hain Celestial Group, Inc. * | 168,254 | 3,148,032 |
| The Simply Good Foods Co. * | 201,492 | 7,717,144 |
| The Vita Coco Co., Inc. * | 62,744 | 643,753 |
| Tootsie Roll Industries, Inc. | 34,777 | 1,404,643 |
| TreeHouse Foods, Inc. * | 113,805 | 5,717,563 |
| Turning Point Brands, Inc. | 33,525 | 789,849 |
| Universal Corp. | 54,183 | 2,742,202 |
| Utz Brands, Inc. | 147,422 | 2,389,711 |
| Vector Group Ltd. | 321,685 | 3,416,295 |
| Vintage Wine Estates, Inc. * | 70,706 | 195,856 |
| Vital Farms, Inc. * | 67,102 | 888,430 |
| Whole Earth Brands, Inc. * | 89,374 | 308,340 |
| 103,728,735 | ||
| Health Care Equipment & Services 7.3% | ||
| 1Life Healthcare, Inc. * | 403,489 | 6,899,662 |
| 23andMe Holding Co., Class A *(a) | 579,618 | 1,820,000 |
| Accolade, Inc. * | 146,096 | 1,574,915 |
| AdaptHealth Corp. * | 161,628 | 3,685,118 |
| Addus HomeCare Corp. * | 34,584 | 3,542,093 |
| Agiliti, Inc. * | 62,625 | 1,094,059 |
| AirSculpt Technologies, Inc. | 27,204 | 184,443 |
| Alignment Healthcare, Inc. * | 188,928 | 2,501,407 |
| Allscripts Healthcare Solutions, Inc. * | 244,670 | 3,596,649 |
| Alphatec Holdings, Inc. * | 161,483 | 1,653,586 |
| American Well Corp., Class A * | 511,669 | 2,092,726 |
| AMN Healthcare Services, Inc. * | 96,845 | 12,154,047 |
| AngioDynamics, Inc. * | 83,498 | 1,176,487 |
| Apollo Medical Holdings, Inc. * | 87,113 | 3,089,027 |
| Artivion, Inc. * | 86,719 | 967,784 |
| ATI Physical Therapy, Inc. * | 164,381 | 179,175 |
| AtriCure, Inc. * | 102,025 | 4,297,293 |
| Atrion Corp. | 3,070 | 1,842,952 |
| Avanos Medical, Inc. * | 103,793 | 2,299,015 |
| SECURITY | NUMBER OF SHARES | VALUE ($) |
| Aveanna Healthcare Holdings, Inc. * | 97,815 | 135,963 |
| AxoGen, Inc. * | 91,160 | 1,041,047 |
| Axonics, Inc. * | 109,685 | 8,022,361 |
| Babylon Holdings Ltd., Class A * | 239,249 | 113,284 |
| Bioventus, Inc., Class A * | 71,493 | 581,953 |
| Brookdale Senior Living, Inc. * | 414,872 | 1,854,478 |
| Butterfly Network, Inc. * | 295,922 | 1,450,018 |
| Cano Health, Inc. * | 362,263 | 1,296,901 |
| Cardiovascular Systems, Inc. * | 89,202 | 1,288,077 |
| CareMax, Inc. * | 133,357 | 938,833 |
| Castle Biosciences, Inc. * | 55,198 | 1,408,653 |
| Cerus Corp. * | 386,932 | 1,416,171 |
| Clover Health Investments Corp. * | 860,500 | 1,359,590 |
| Community Health Systems, Inc. * | 279,864 | 803,210 |
| Computer Programs & Systems, Inc. * | 31,813 | 1,027,560 |
| CONMED Corp. | 65,160 | 5,195,207 |
| CorVel Corp. * | 19,835 | 3,257,105 |
| Cross Country Healthcare, Inc. * | 81,986 | 3,040,861 |
| Cue Health, Inc. * | 242,494 | 962,701 |
| Cutera, Inc. * | 37,141 | 1,707,372 |
| DocGo, Inc. * | 180,678 | 1,788,712 |
| Embecta Corp. | 130,275 | 4,028,103 |
| Evolent Health, Inc., Class A * | 183,500 | 5,837,135 |
| Figs, Inc., Class A * | 285,439 | 2,106,540 |
| Fulgent Genetics, Inc. * | 48,239 | 1,911,712 |
| Glaukos Corp. * | 102,375 | 5,740,166 |
| Haemonetics Corp. * | 113,650 | 9,654,567 |
| Health Catalyst, Inc. * | 122,329 | 1,078,942 |
| HealthEquity, Inc. * | 185,759 | 14,472,484 |
| HealthStream, Inc. * | 53,865 | 1,330,465 |
| Heska Corp. * | 21,610 | 1,550,734 |
| Hims & Hers Health, Inc. * | 272,880 | 1,238,875 |
| Inari Medical, Inc. * | 107,961 | 8,305,440 |
| Innovage Holding Corp. *(a) | 42,380 | 262,332 |
| Inogen, Inc. * | 51,241 | 1,161,121 |
| Inspire Medical Systems, Inc. * | 63,169 | 12,314,796 |
| Integer Holdings Corp. * | 73,754 | 4,597,087 |
| Invitae Corp. *(a) | 525,618 | 1,356,094 |
| iRadimed Corp. | 16,071 | 466,863 |
| iRhythm Technologies, Inc. * | 66,777 | 8,513,400 |
| Lantheus Holdings, Inc. * | 152,896 | 11,312,775 |
| LeMaitre Vascular, Inc. | 43,731 | 1,897,925 |
| LHC Group, Inc. * | 66,737 | 11,151,753 |
| LifeStance Health Group, Inc. *(a) | 161,161 | 1,216,766 |
| LivaNova plc * | 120,149 | 5,659,018 |
| Meridian Bioscience, Inc. * | 96,201 | 3,075,546 |
| Merit Medical Systems, Inc. * | 125,093 | 8,602,646 |
| Mesa Laboratories, Inc. | 11,220 | 1,483,396 |
| ModivCare, Inc. * | 28,311 | 2,752,962 |
| Multiplan Corp. * | 846,273 | 2,428,803 |
| Nano-X Imaging Ltd. *(a) | 101,939 | 1,447,534 |
| National HealthCare Corp. | 28,063 | 1,709,598 |
| National Research Corp. | 31,343 | 1,276,600 |
| Neogen Corp. * | 242,333 | 3,198,796 |
| Nevro Corp. * | 78,109 | 2,994,699 |
| NextGen Healthcare, Inc. * | 126,899 | 2,543,056 |
| Nutex Health, Inc. * | 85,197 | 68,584 |
| NuVasive, Inc. * | 117,189 | 5,171,551 |
| Omnicell, Inc. * | 98,287 | 7,599,551 |
| OPKO Health, Inc. * | 900,537 | 1,711,020 |
| OptimizeRx Corp. * | 39,408 | 607,474 |
| Option Care Health, Inc. * | 349,780 | 10,584,343 |
| OraSure Technologies, Inc. * | 161,880 | 705,797 |
| Orthofix Medical, Inc. * | 43,194 | 693,696 |
| OrthoPediatrics Corp. * | 33,211 | 1,411,135 |
| Outset Medical, Inc. * | 107,315 | 1,667,675 |
| Owens & Minor, Inc. | 165,152 | 2,807,584 |
| Owlet, Inc. * | 36,191 | 34,653 |
| SECURITY | NUMBER OF SHARES | VALUE ($) |
| P3 Health Partners, Inc. *(a) | 53,288 | 263,776 |
| Paragon 28, Inc. *(a) | 102,822 | 2,053,355 |
| Patterson Cos., Inc. | 195,103 | 5,066,825 |
| Pear Therapeutics, Inc. *(a) | 150,851 | 414,840 |
| Pediatrix Medical Group, Inc. * | 185,907 | 3,606,596 |
| PetIQ, Inc. * | 61,041 | 501,757 |
| Phreesia, Inc. * | 109,958 | 3,004,053 |
| Privia Health Group, Inc. * | 99,840 | 3,342,643 |
| PROCEPT BioRobotics Corp. * | 57,333 | 2,604,638 |
| Progyny, Inc. * | 167,413 | 7,444,856 |
| Pulmonx Corp. * | 76,123 | 1,017,003 |
| R1 RCM, Inc. * | 336,302 | 5,939,093 |
| RadNet, Inc. * | 111,815 | 2,137,903 |
| RxSight, Inc. * | 46,308 | 576,071 |
| Schrodinger, Inc. * | 120,856 | 2,896,918 |
| SeaSpine Holdings Corp. * | 80,727 | 519,075 |
| Select Medical Holdings Corp. | 233,040 | 5,984,467 |
| Sema4 Holdings Corp. * | 360,012 | 370,812 |
| Senseonics Holdings, Inc. *(a) | 1,027,893 | 1,212,914 |
| Sharecare, Inc. * | 655,284 | 1,258,145 |
| Shockwave Medical, Inc. * | 79,663 | 23,353,208 |
| SI-BONE, Inc. * | 75,631 | 1,470,267 |
| Sight Sciences, Inc. * | 49,303 | 386,042 |
| Silk Road Medical, Inc. * | 77,339 | 3,409,103 |
| Simulations Plus, Inc. | 34,988 | 1,452,002 |
| STAAR Surgical Co. * | 107,305 | 7,604,705 |
| Surgery Partners, Inc. * | 88,877 | 2,416,566 |
| Surmodics, Inc. * | 30,337 | 1,035,705 |
| Tactile Systems Technology, Inc. * | 43,239 | 321,698 |
| Tenon Medical, Inc. *(a) | 7,088 | 12,617 |
| The Ensign Group, Inc. | 120,556 | 10,823,518 |
| The Joint Corp. * | 31,059 | 513,095 |
| The Oncology Institute, Inc. * | 76,583 | 347,687 |
| The Pennant Group, Inc. * | 57,916 | 712,946 |
| TransMedics Group, Inc. * | 68,267 | 3,291,835 |
| Treace Medical Concepts, Inc. * | 74,886 | 1,833,209 |
| U.S. Physical Therapy, Inc. | 28,782 | 2,555,842 |
| UFP Technologies, Inc. * | 15,208 | 1,427,271 |
| Utah Medical Products, Inc. | 7,741 | 693,207 |
| Varex Imaging Corp. * | 86,146 | 1,904,688 |
| Vicarious Surgical, Inc. * | 120,032 | 464,524 |
| ViewRay, Inc. * | 329,985 | 1,415,636 |
| Zimvie, Inc. * | 47,407 | 415,759 |
| Zynex, Inc. | 49,395 | 563,103 |
| 393,722,260 | ||
| Household & Personal Products 1.0% | ||
| BellRing Brands, Inc. * | 295,144 | 7,148,388 |
| Central Garden & Pet Co. * | 21,790 | 899,273 |
| Central Garden & Pet Co., Class A * | 90,021 | 3,523,422 |
| Edgewell Personal Care Co. | 115,317 | 4,519,273 |
| elf Beauty, Inc. * | 108,336 | 4,686,615 |
| Energizer Holdings, Inc. | 149,251 | 4,311,861 |
| Herbalife Nutrition Ltd. * | 219,236 | 4,660,957 |
| Inter Parfums, Inc. | 40,176 | 3,249,435 |
| Medifast, Inc. | 24,344 | 2,848,005 |
| Nature's Sunshine Products, Inc. * | 29,877 | 252,162 |
| Nu Skin Enterprises, Inc., Class A | 111,757 | 4,268,000 |
| The Beauty Health Co. * | 223,205 | 2,551,233 |
| The Honest Co., Inc. * | 143,335 | 474,439 |
| Thorne HealthTech, Inc. * | 30,226 | 146,898 |
| USANA Health Sciences, Inc. * | 25,101 | 1,318,054 |
| Veru, Inc. *(a) | 145,940 | 1,786,306 |
| WD-40 Co. | 30,567 | 4,895,611 |
| 51,539,932 | ||
| SECURITY | NUMBER OF SHARES | VALUE ($) |
| Insurance 2.1% | ||
| Ambac Financial Group, Inc. * | 98,556 | 1,384,712 |
| American Equity Investment Life Holding Co. | 161,974 | 6,977,840 |
| AMERISAFE, Inc. | 42,611 | 2,488,908 |
| Argo Group International Holdings Ltd. | 71,105 | 1,768,381 |
| Bright Health Group, Inc. *(a) | 439,758 | 452,951 |
| BRP Group, Inc., Class A * | 133,385 | 3,781,465 |
| CNO Financial Group, Inc. | 253,922 | 5,601,519 |
| Crawford & Co., Class A | 33,903 | 203,079 |
| Donegal Group, Inc., Class A | 34,289 | 501,991 |
| eHealth, Inc. * | 53,376 | 143,048 |
| Employers Holdings, Inc. | 61,021 | 2,661,126 |
| Enstar Group Ltd. * | 25,144 | 5,041,875 |
| Genworth Financial, Inc., Class A * | 1,123,334 | 5,245,970 |
| Goosehead Insurance, Inc., Class A * | 42,628 | 1,769,488 |
| Greenlight Capital Re Ltd., Class A * | 59,457 | 501,817 |
| HCI Group, Inc. | 14,610 | 535,310 |
| Hippo Holdings, Inc. * | 35,748 | 617,730 |
| Horace Mann Educators Corp. | 91,958 | 3,628,663 |
| Investors Title Co. | 2,856 | 419,689 |
| James River Group Holdings Ltd. | 82,060 | 2,073,656 |
| Kinsale Capital Group, Inc. | 48,431 | 15,263,998 |
| Lemonade, Inc. *(a) | 104,031 | 2,517,550 |
| MBIA, Inc. * | 108,129 | 1,163,468 |
| Mercury General Corp. | 60,113 | 1,743,277 |
| National Western Life Group, Inc., Class A | 5,072 | 1,004,357 |
| NI Holdings, Inc. * | 19,074 | 259,025 |
| Oscar Health, Inc., Class A * | 264,102 | 985,100 |
| Palomar Holdings, Inc. * | 54,332 | 4,833,375 |
| ProAssurance Corp. | 120,805 | 2,683,079 |
| RLI Corp. | 87,368 | 11,363,956 |
| Root, Inc., Class A *(a) | 17,055 | 145,480 |
| Safety Insurance Group, Inc. | 31,877 | 2,771,705 |
| Selective Insurance Group, Inc. | 133,533 | 13,096,917 |
| Selectquote, Inc. * | 292,939 | 197,441 |
| SiriusPoint Ltd. * | 207,585 | 1,332,696 |
| Stewart Information Services Corp. | 60,042 | 2,339,236 |
| Tiptree, Inc. | 55,880 | 680,618 |
| Trean Insurance Group, Inc. * | 49,665 | 182,271 |
| Trupanion, Inc. * | 87,254 | 4,403,709 |
| United Fire Group, Inc. | 47,720 | 1,293,212 |
| Universal Insurance Holdings, Inc. | 59,251 | 594,880 |
| 114,654,568 | ||
| Materials 4.2% | ||
| 5E Advanced Materials, Inc. * | 74,036 | 990,602 |
| AdvanSix, Inc. | 60,703 | 2,208,375 |
| Alpha Metallurgical Resources, Inc. | 37,047 | 6,255,386 |
| American Vanguard Corp. | 65,447 | 1,522,952 |
| Amyris, Inc. *(a) | 439,405 | 1,234,728 |
| Arconic Corp. * | 229,762 | 4,769,859 |
| Aspen Aerogels, Inc. * | 69,241 | 877,976 |
| ATI, Inc. * | 277,728 | 8,265,185 |
| Avient Corp. | 203,689 | 7,025,234 |
| Balchem Corp. | 71,292 | 9,966,622 |
| Cabot Corp. | 124,417 | 9,142,161 |
| Carpenter Technology Corp. | 106,916 | 3,998,658 |
| Century Aluminum Co. * | 116,716 | 841,522 |
| Chase Corp. | 16,888 | 1,591,018 |
| Clearwater Paper Corp. * | 37,269 | 1,657,725 |
| Coeur Mining, Inc. * | 624,555 | 2,360,818 |
| Commercial Metals Co. | 270,766 | 12,319,853 |
| Compass Minerals International, Inc. | 76,739 | 3,034,260 |
| Constellium SE * | 282,839 | 3,116,886 |
| SECURITY | NUMBER OF SHARES | VALUE ($) |
| Cryptyde, Inc. * | 40,327 | 21,886 |
| Dakota Gold Corp. * | 116,224 | 400,973 |
| Danimer Scientific, Inc. *(a) | 203,912 | 534,249 |
| Diversey Holdings Ltd. * | 174,576 | 942,710 |
| Ecovyst, Inc. * | 170,880 | 1,700,256 |
| Ferroglobe Representation and Warranty Insurance Trust *(b) | 108,500 | 0 |
| FutureFuel Corp. | 56,783 | 388,396 |
| Glatfelter Corp. | 101,328 | 286,758 |
| Greif, Inc., Class A | 57,863 | 3,831,109 |
| Greif, Inc., Class B | 12,056 | 853,685 |
| H.B. Fuller Co. | 118,752 | 8,278,202 |
| Hawkins, Inc. | 43,325 | 1,950,925 |
| Haynes International, Inc. | 27,358 | 1,338,080 |
| Hecla Mining Co. | 1,238,051 | 5,657,893 |
| Hycroft Mining Holding Corp. * | 331,668 | 228,718 |
| Ingevity Corp. * | 85,485 | 5,750,576 |
| Innospec, Inc. | 55,393 | 5,538,746 |
| Intrepid Potash, Inc. * | 24,858 | 1,124,824 |
| Ivanhoe Electric, Inc. *(a) | 32,010 | 334,825 |
| Kaiser Aluminum Corp. | 35,437 | 2,862,955 |
| Koppers Holdings, Inc. | 45,146 | 1,126,844 |
| Kronos Worldwide, Inc. | 49,799 | 473,091 |
| Livent Corp. * | 362,665 | 11,449,334 |
| LSB Industries, Inc. * | 70,885 | 1,249,703 |
| Materion Corp. | 45,680 | 3,915,233 |
| Mativ Holdings, Inc. | 121,766 | 2,890,726 |
| Minerals Technologies, Inc. | 72,505 | 3,988,500 |
| Myers Industries, Inc. | 81,216 | 1,647,873 |
| Novagold Resources, Inc. * | 535,907 | 2,481,249 |
| O-I Glass, Inc. * | 348,256 | 5,680,055 |
| Olympic Steel, Inc. | 21,698 | 590,403 |
| Origin Materials, Inc. * | 233,965 | 1,328,921 |
| Orion Engineered Carbons S.A. | 135,670 | 2,165,293 |
| Pactiv Evergreen, Inc. | 96,890 | 1,057,070 |
| Perimeter Solutions S.A. * | 273,202 | 2,182,884 |
| Piedmont Lithium, Inc. * | 38,895 | 2,420,047 |
| PolyMet Mining Corp. * | 66,038 | 197,454 |
| PureCycle Technologies, Inc. *(a) | 238,192 | 1,969,848 |
| Quaker Chemical Corp. | 30,313 | 4,930,106 |
| Ramaco Resources, Inc. | 50,596 | 571,229 |
| Ranpak Holdings Corp. * | 94,933 | 360,745 |
| Rayonier Advanced Materials, Inc. * | 137,433 | 625,320 |
| Resolute Forest Products, Inc. * | 103,149 | 2,146,531 |
| Ryerson Holding Corp. | 43,320 | 1,453,386 |
| Schnitzer Steel Industries, Inc., Class A | 57,975 | 1,564,745 |
| Sensient Technologies Corp. | 93,859 | 6,707,164 |
| Stepan Co. | 47,783 | 4,990,457 |
| Summit Materials, Inc., Class A * | 265,264 | 6,989,706 |
| SunCoke Energy, Inc. | 185,447 | 1,346,345 |
| Sylvamo Corp. | 79,416 | 3,825,469 |
| TimkenSteel Corp. * | 103,456 | 1,804,273 |
| Tredegar Corp. | 61,192 | 666,381 |
| TriMas Corp. | 93,774 | 2,142,736 |
| Trinseo plc | 78,630 | 1,479,817 |
| Tronox Holdings plc, Class A | 261,735 | 3,140,820 |
| United States Lime & Minerals, Inc. | 4,589 | 578,902 |
| Valhi, Inc. | 5,287 | 144,441 |
| Warrior Met Coal, Inc. | 115,215 | 4,279,085 |
| Worthington Industries, Inc. | 70,311 | 3,343,991 |
| 223,111,763 | ||
| Media & Entertainment 1.9% | ||
| AdTheorent Holding Co., Inc. *(a) | 80,170 | 169,960 |
| Advantage Solutions, Inc. * | 187,093 | 632,374 |
| AMC Networks, Inc., Class A * | 67,424 | 1,517,714 |
| Audacy, Inc., Class A * | 266,264 | 92,021 |
| SECURITY | NUMBER OF SHARES | VALUE ($) |
| Boston Omaha Corp., Class A * | 48,858 | 1,361,672 |
| Bumble, Inc., Class A * | 193,034 | 4,903,064 |
| Cardlytics, Inc. * | 71,994 | 678,903 |
| Cargurus, Inc. * | 228,365 | 3,324,994 |
| Cars.com, Inc. * | 151,280 | 2,099,766 |
| Cinemark Holdings, Inc. * | 243,977 | 2,588,596 |
| Clear Channel Outdoor Holdings, Inc. * | 822,116 | 1,175,626 |
| Cumulus Media, Inc., Class A * | 38,913 | 286,789 |
| Daily Journal Corp. * | 2,708 | 726,421 |
| DHI Group, Inc. * | 96,597 | 618,221 |
| Entravision Communications Corp., Class A | 134,235 | 628,220 |
| Eventbrite, Inc., Class A * | 172,301 | 1,132,018 |
| EverQuote, Inc., Class A * | 44,086 | 268,484 |
| fuboTV, Inc. *(a) | 398,629 | 1,458,982 |
| Gambling.com Group Ltd. * | 19,065 | 159,765 |
| Gannett Co., Inc. * | 323,952 | 469,730 |
| Gray Television, Inc. | 183,782 | 2,600,515 |
| iHeartMedia, Inc., Class A * | 270,407 | 2,238,970 |
| IMAX Corp. * | 104,759 | 1,333,582 |
| Innovid Corp. *(a) | 168,381 | 629,745 |
| Integral Ad Science Holding Corp. * | 85,775 | 722,226 |
| John Wiley & Sons, Inc., Class A | 96,158 | 4,056,906 |
| Leafly Holdings, Inc. * | 67,445 | 59,790 |
| Liberty Media Corp. - Liberty Braves, Class A * | 22,253 | 709,648 |
| Liberty Media Corp. - Liberty Braves, Class C * | 84,516 | 2,633,519 |
| Lions Gate Entertainment Corp., Class A * | 130,729 | 1,053,676 |
| Lions Gate Entertainment Corp., Class B * | 258,188 | 1,959,647 |
| Loyalty Ventures, Inc. * | 44,080 | 52,014 |
| Madison Square Garden Entertainment Corp. * | 57,651 | 2,826,629 |
| Magnite, Inc. * | 292,062 | 2,129,132 |
| MediaAlpha, Inc., Class A * | 53,547 | 587,946 |
| Outbrain, Inc. * | 87,040 | 372,531 |
| Playstudios, Inc. * | 178,129 | 803,362 |
| PubMatic, Inc., Class A * | 95,803 | 1,666,972 |
| QuinStreet, Inc. * | 115,619 | 1,319,213 |
| Reservoir Media, Inc. * | 44,949 | 260,704 |
| Scholastic Corp. | 66,703 | 2,544,052 |
| Shutterstock, Inc. | 54,274 | 2,715,328 |
| Sinclair Broadcast Group, Inc., Class A | 89,966 | 1,602,295 |
| Skillz, Inc. *(a) | 705,959 | 727,138 |
| Stagwell, Inc. * | 174,031 | 1,320,895 |
| TechTarget, Inc. * | 61,359 | 3,960,723 |
| TEGNA, Inc. | 498,676 | 10,412,355 |
| The Arena Group Holdings, Inc. * | 24,915 | 351,302 |
| The E.W. Scripps Co., Class A * | 130,913 | 1,857,656 |
| The Marcus Corp. | 53,012 | 797,301 |
| Thryv Holdings, Inc. * | 56,600 | 1,158,036 |
| TrueCar, Inc. * | 203,165 | 365,697 |
| Urban One, Inc. * | 24,134 | 119,946 |
| Urban One, Inc. * | 19,434 | 117,187 |
| Vimeo, Inc. * | 320,858 | 1,219,260 |
| Vinco Ventures, Inc. *(a) | 515,848 | 470,247 |
| Wejo Group Ltd. * | 50,427 | 54,461 |
| WideOpenWest, Inc. * | 120,003 | 1,645,241 |
| Yelp, Inc. * | 153,876 | 5,910,377 |
| Ziff Davis, Inc. * | 102,230 | 7,911,580 |
| ZipRecruiter, Inc., Class A * | 178,800 | 2,998,476 |
| 100,569,600 | ||
| SECURITY | NUMBER OF SHARES | VALUE ($) |
| Pharmaceuticals, Biotechnology & Life Sciences 9.5% | ||
| 2seventy bio, Inc. * | 83,287 | 1,322,598 |
| 4D Molecular Therapeutics, Inc. * | 67,494 | 584,498 |
| Aadi Bioscience, Inc. * | 32,925 | 425,226 |
| AbCellera Biologics, Inc. *(a) | 463,357 | 5,481,513 |
| Absci Corp. *(a) | 115,388 | 364,626 |
| ACADIA Pharmaceuticals, Inc. * | 268,983 | 4,311,797 |
| Aclaris Therapeutics, Inc. * | 144,732 | 2,259,266 |
| Adaptive Biotechnologies Corp. * | 250,286 | 1,947,225 |
| Adicet Bio, Inc. * | 63,097 | 1,040,470 |
| ADMA Biologics, Inc. * | 414,978 | 1,170,238 |
| Aerie Pharmaceuticals, Inc. * | 106,764 | 1,624,948 |
| Aerovate Therapeutics, Inc. * | 20,978 | 409,281 |
| Affimed N.V. * | 317,498 | 558,796 |
| Agenus, Inc. * | 635,546 | 1,595,220 |
| Agios Pharmaceuticals, Inc. * | 122,102 | 3,362,689 |
| Akero Therapeutics, Inc. * | 62,724 | 2,650,716 |
| Akoya Biosciences, Inc. * | 35,694 | 490,792 |
| Albireo Pharma, Inc. * | 38,329 | 786,511 |
| Alector, Inc. * | 139,514 | 1,283,529 |
| Alkermes plc * | 364,800 | 8,280,960 |
| Allogene Therapeutics, Inc. * | 178,782 | 1,841,455 |
| Allovir, Inc. * | 68,859 | 477,193 |
| Alpha Teknova, Inc. * | 13,552 | 62,204 |
| Alpine Immune Sciences, Inc. * | 34,323 | 202,849 |
| ALX Oncology Holdings, Inc. * | 48,734 | 591,631 |
| Amicus Therapeutics, Inc. * | 617,018 | 6,170,180 |
| Amneal Pharmaceuticals, Inc. * | 230,165 | 506,363 |
| Amphastar Pharmaceuticals, Inc. * | 85,741 | 2,649,397 |
| Amylyx Pharmaceuticals, Inc. *(a) | 78,876 | 2,813,507 |
| AN2 Therapeutics, Inc. * | 11,027 | 159,009 |
| AnaptysBio, Inc. * | 45,351 | 1,308,376 |
| Anavex Life Sciences Corp. * | 155,442 | 1,891,729 |
| ANI Pharmaceuticals, Inc. * | 28,157 | 1,086,579 |
| Anika Therapeutics, Inc. * | 32,616 | 926,947 |
| Apellis Pharmaceuticals, Inc. * | 209,818 | 12,691,891 |
| Arbutus Biopharma Corp. * | 244,362 | 571,807 |
| Arcellx, Inc. * | 65,825 | 1,545,571 |
| Arcturus Therapeutics Holdings, Inc. * | 51,531 | 912,099 |
| Arcus Biosciences, Inc. * | 114,902 | 2,927,703 |
| Arcutis Biotherapeutics, Inc. * | 91,748 | 1,622,105 |
| Arrowhead Pharmaceuticals, Inc. * | 230,282 | 8,016,116 |
| Arvinas, Inc. * | 108,826 | 5,409,740 |
| Atara Biotherapeutics, Inc. * | 206,699 | 963,217 |
| Atea Pharmaceuticals, Inc. * | 170,066 | 1,020,396 |
| Athira Pharma, Inc. * | 74,945 | 248,068 |
| Aura Biosciences, Inc. * | 41,119 | 509,464 |
| Aurinia Pharmaceuticals, Inc. *(a) | 300,513 | 2,443,171 |
| Avid Bioservices, Inc. * | 136,750 | 2,316,545 |
| Avidity Biosciences, Inc. * | 114,944 | 1,641,400 |
| Axsome Therapeutics, Inc. * | 66,544 | 3,004,462 |
| Beam Therapeutics, Inc. * | 142,197 | 6,265,200 |
| Berkeley Lights, Inc. * | 122,300 | 271,506 |
| BioCryst Pharmaceuticals, Inc. * | 415,003 | 5,540,290 |
| Biohaven Ltd. * | 70,999 | 1,176,453 |
| BioLife Solutions, Inc. * | 75,707 | 1,780,629 |
| Bionano Genomics, Inc. *(a) | 655,029 | 1,532,768 |
| Bioxcel Therapeutics, Inc. *(a) | 42,834 | 539,280 |
| Bluebird Bio, Inc. * | 172,242 | 1,079,957 |
| Blueprint Medicines Corp. * | 133,694 | 6,930,697 |
| Bridgebio Pharma, Inc. * | 234,467 | 2,445,491 |
| C4 Therapeutics, Inc. * | 94,126 | 905,492 |
| Cara Therapeutics, Inc. * | 100,211 | 941,983 |
| CareDx, Inc. * | 113,591 | 2,261,597 |
| Caribou Biosciences, Inc. * | 124,865 | 1,216,185 |
| Cassava Sciences, Inc. *(a) | 85,341 | 3,109,826 |
| Catalyst Pharmaceuticals, Inc. * | 214,318 | 2,972,591 |
| SECURITY | NUMBER OF SHARES | VALUE ($) |
| Celldex Therapeutics, Inc. * | 102,537 | 3,602,125 |
| Celularity, Inc. * | 148,312 | 345,567 |
| Century Therapeutics, Inc. *(a) | 45,787 | 480,763 |
| Cerevel Therapeutics Holdings, Inc. * | 121,582 | 3,399,433 |
| Chimerix, Inc. * | 184,631 | 326,797 |
| Chinook Therapeutics, Inc. * | 111,797 | 2,431,585 |
| CinCor Pharma, Inc. *(a) | 45,028 | 1,514,742 |
| Codexis, Inc. * | 135,589 | 762,010 |
| Cogent Biosciences, Inc. * | 143,563 | 1,959,635 |
| Coherus Biosciences, Inc. * | 164,576 | 1,431,811 |
| Collegium Pharmaceutical, Inc. * | 75,704 | 1,358,130 |
| Corcept Therapeutics, Inc. * | 190,744 | 5,455,278 |
| Crinetics Pharmaceuticals, Inc. * | 118,132 | 2,180,717 |
| CryoPort, Inc. * | 98,018 | 2,720,980 |
| CTI BioPharma Corp. * | 222,878 | 1,092,102 |
| Cullinan Oncology, Inc. * | 67,998 | 893,494 |
| Cytek Biosciences, Inc. * | 255,497 | 3,965,313 |
| Cytokinetics, Inc. * | 183,697 | 8,020,211 |
| Day One Biopharmaceuticals, Inc. * | 61,642 | 1,303,112 |
| Deciphera Pharmaceuticals, Inc. * | 100,548 | 1,630,889 |
| Denali Therapeutics, Inc. * | 220,435 | 6,322,076 |
| Design Therapeutics, Inc. * | 75,577 | 1,180,513 |
| DICE Therapeutics, Inc. * | 63,779 | 2,264,792 |
| Dynavax Technologies Corp. * | 264,763 | 3,031,536 |
| Dyne Therapeutics, Inc. * | 70,809 | 807,223 |
| Eagle Pharmaceuticals, Inc. * | 23,107 | 727,177 |
| Edgewise Therapeutics, Inc. * | 66,853 | 635,772 |
| Editas Medicine, Inc. * | 155,181 | 1,947,522 |
| Eiger BioPharmaceuticals, Inc. * | 92,051 | 470,381 |
| Emergent BioSolutions, Inc. * | 112,831 | 2,353,655 |
| Enanta Pharmaceuticals, Inc. * | 43,896 | 1,980,149 |
| Enochian Biosciences, Inc. * | 43,414 | 88,130 |
| EQRx, Inc. *(a) | 450,324 | 2,314,665 |
| Erasca, Inc. *(a) | 144,541 | 1,180,900 |
| Esperion Therapeutics, Inc. * | 148,753 | 1,209,362 |
| Evolus, Inc. * | 79,498 | 680,503 |
| EyePoint Pharmaceuticals, Inc. * | 59,603 | 321,856 |
| Fate Therapeutics, Inc. * | 185,966 | 3,890,409 |
| FibroGen, Inc. * | 195,745 | 3,186,729 |
| Foghorn Therapeutics, Inc. *(a) | 44,129 | 385,687 |
| Fulcrum Therapeutics, Inc. * | 77,321 | 429,905 |
| Gelesis Holdings, Inc. * | 35,034 | 13,057 |
| Generation Bio Co. * | 106,621 | 545,900 |
| Geron Corp. * | 806,768 | 1,791,025 |
| Gossamer Bio, Inc. * | 140,419 | 1,558,651 |
| GreenLight Biosciences Holdings PBC *(a) | 159,497 | 283,905 |
| Halozyme Therapeutics, Inc. * | 303,622 | 14,516,168 |
| Harmony Biosciences Holdings, Inc. * | 58,650 | 3,049,800 |
| Heron Therapeutics, Inc. * | 228,346 | 879,132 |
| HilleVax, Inc. * | 29,325 | 626,968 |
| Humacyte, Inc. *(a) | 38,779 | 133,594 |
| Icosavax, Inc. * | 48,839 | 167,518 |
| Ideaya Biosciences, Inc. * | 80,011 | 1,351,386 |
| IGM Biosciences, Inc. * | 24,001 | 480,020 |
| Imago Biosciences, Inc. * | 58,727 | 998,359 |
| ImmunityBio, Inc. *(a) | 184,206 | 1,013,133 |
| ImmunoGen, Inc. * | 480,515 | 2,854,259 |
| Immunovant, Inc. * | 90,272 | 1,011,046 |
| Inhibrx, Inc. * | 65,317 | 2,101,901 |
| Innoviva, Inc. * | 141,192 | 1,914,564 |
| Inotiv, Inc. * | 39,167 | 813,890 |
| Inovio Pharmaceuticals, Inc. * | 552,840 | 1,194,134 |
| Insmed, Inc. * | 266,815 | 4,621,236 |
| Instil Bio, Inc. * | 155,472 | 513,058 |
| Intellia Therapeutics, Inc. * | 168,715 | 8,904,778 |
| Intercept Pharmaceuticals, Inc. * | 55,077 | 763,918 |
| Intra-Cellular Therapies, Inc. * | 204,984 | 9,361,619 |
| SECURITY | NUMBER OF SHARES | VALUE ($) |
| Invivyd, Inc. * | 112,840 | 445,718 |
| Iovance Biotherapeutics, Inc. * | 337,358 | 3,150,924 |
| Ironwood Pharmaceuticals, Inc. * | 305,723 | 3,344,610 |
| iTeos Therapeutics, Inc. * | 52,441 | 1,021,551 |
| IVERIC bio, Inc. * | 265,137 | 6,342,077 |
| Janux Therapeutics, Inc. *(a) | 38,809 | 701,667 |
| Jounce Therapeutics, Inc. * | 92,459 | 201,561 |
| KalVista Pharmaceuticals, Inc. * | 54,264 | 275,118 |
| Karuna Therapeutics, Inc. * | 66,808 | 14,653,667 |
| Karyopharm Therapeutics, Inc. * | 170,694 | 812,503 |
| Keros Therapeutics, Inc. * | 40,412 | 2,034,340 |
| Kezar Life Sciences, Inc. * | 117,494 | 882,967 |
| Kiniksa Pharmaceuticals Ltd., Class A * | 70,115 | 800,713 |
| Kinnate Biopharma, Inc. * | 65,765 | 554,399 |
| Kodiak Sciences, Inc. * | 75,418 | 541,501 |
| Kronos Bio, Inc. * | 90,167 | 266,894 |
| Krystal Biotech, Inc. * | 47,715 | 3,650,197 |
| Kura Oncology, Inc. * | 142,344 | 2,209,179 |
| Kymera Therapeutics, Inc. * | 84,919 | 2,576,442 |
| Lexicon Pharmaceuticals, Inc. * | 183,411 | 394,334 |
| Ligand Pharmaceuticals, Inc. * | 33,820 | 2,964,323 |
| Liquidia Corp. * | 105,805 | 517,386 |
| Lyell Immunopharma, Inc. *(a) | 387,211 | 2,276,801 |
| MacroGenics, Inc. * | 136,729 | 700,052 |
| Madrigal Pharmaceuticals, Inc. * | 28,582 | 2,024,177 |
| MannKind Corp. * | 559,221 | 1,890,167 |
| MaxCyte, Inc. * | 193,640 | 1,339,989 |
| Medpace Holdings, Inc. * | 56,789 | 12,606,022 |
| MeiraGTx Holdings plc * | 68,201 | 495,821 |
| Mersana Therapeutics, Inc. * | 200,724 | 1,577,691 |
| MiMedx Group, Inc. * | 253,295 | 749,753 |
| Mirum Pharmaceuticals, Inc. * | 40,478 | 912,779 |
| Monte Rosa Therapeutics, Inc. * | 64,436 | 592,811 |
| Morphic Holding, Inc. * | 57,842 | 1,620,154 |
| Myriad Genetics, Inc. * | 177,891 | 3,689,459 |
| NanoString Technologies, Inc. * | 104,324 | 1,091,229 |
| Nautilus Biotechnology, Inc. * | 104,750 | 258,732 |
| Nektar Therapeutics * | 406,495 | 1,528,421 |
| NeoGenomics, Inc. * | 282,196 | 2,146,101 |
| NGM Biopharmaceuticals, Inc. * | 88,652 | 473,402 |
| Nkarta, Inc. * | 72,450 | 913,594 |
| Nurix Therapeutics, Inc. * | 103,353 | 1,315,684 |
| Nuvalent, Inc., Class A * | 37,773 | 1,348,874 |
| Nuvation Bio, Inc. * | 260,365 | 572,803 |
| Ocugen, Inc. *(a) | 477,831 | 821,869 |
| Ocular Therapeutix, Inc. * | 173,463 | 626,201 |
| Organogenesis Holdings, Inc. * | 156,729 | 514,071 |
| Outlook Therapeutics, Inc. *(a) | 266,760 | 309,442 |
| Pacific Biosciences of California, Inc. * | 505,427 | 4,265,804 |
| Pacira BioSciences, Inc. * | 100,503 | 5,202,035 |
| Pardes Biosciences, Inc. * | 75,704 | 90,845 |
| PepGen, Inc. *(a) | 21,133 | 259,513 |
| Phathom Pharmaceuticals, Inc. * | 52,056 | 551,794 |
| Phibro Animal Health Corp., Class A | 45,620 | 670,158 |
| PMV Pharmaceuticals, Inc. * | 82,973 | 1,021,398 |
| Point Biopharma Global, Inc. * | 165,036 | 1,539,786 |
| Praxis Precision Medicines, Inc. * | 84,185 | 165,844 |
| Precigen, Inc. * | 227,116 | 367,928 |
| Prestige Consumer Healthcare, Inc. * | 111,403 | 6,069,235 |
| Prometheus Biosciences, Inc. * | 68,489 | 3,597,042 |
| Protagonist Therapeutics, Inc. * | 102,668 | 831,611 |
| Prothena Corp. plc * | 79,370 | 4,876,493 |
| Provention Bio, Inc. * | 131,989 | 916,004 |
| PTC Therapeutics, Inc. * | 157,164 | 5,943,942 |
| Quanterix Corp. * | 75,914 | 840,368 |
| Quantum-Si, Inc. * | 206,210 | 624,816 |
| Rallybio Corp. * | 35,048 | 335,059 |
| RAPT Therapeutics, Inc. * | 57,918 | 1,263,771 |
| SECURITY | NUMBER OF SHARES | VALUE ($) |
| Reata Pharmaceuticals, Inc., Class A * | 61,546 | 1,981,781 |
| Recursion Pharmaceuticals, Inc., Class A * | 305,753 | 3,225,694 |
| REGENXBIO, Inc. * | 90,027 | 2,130,939 |
| Relay Therapeutics, Inc. * | 171,156 | 3,803,086 |
| Relmada Therapeutics, Inc. * | 61,410 | 392,410 |
| Replimune Group, Inc. * | 90,531 | 1,662,149 |
| Revance Therapeutics, Inc. * | 160,507 | 3,580,911 |
| REVOLUTION Medicines, Inc. * | 166,596 | 3,375,235 |
| Rigel Pharmaceuticals, Inc. * | 380,139 | 276,969 |
| Rocket Pharmaceuticals, Inc. * | 97,586 | 1,820,955 |
| Sage Therapeutics, Inc. * | 116,533 | 4,388,633 |
| Sana Biotechnology, Inc. * | 199,802 | 1,158,852 |
| Sangamo Therapeutics, Inc. * | 285,099 | 1,251,585 |
| Science 37 Holdings, Inc. * | 136,794 | 198,351 |
| Seer, Inc. * | 115,164 | 901,734 |
| Seres Therapeutics, Inc. * | 157,681 | 1,397,054 |
| SIGA Technologies, Inc. | 105,712 | 971,493 |
| Singular Genomics Systems, Inc. *(a) | 126,875 | 337,487 |
| SomaLogic, Inc. * | 335,875 | 1,165,486 |
| Sorrento Therapeutics, Inc. * | 854,496 | 1,341,559 |
| SpringWorks Therapeutics, Inc. * | 77,811 | 1,868,242 |
| Stoke Therapeutics, Inc. * | 50,512 | 750,103 |
| Supernus Pharmaceuticals, Inc. * | 109,597 | 3,755,889 |
| Sutro Biopharma, Inc. * | 110,497 | 809,943 |
| Syndax Pharmaceuticals, Inc. * | 119,031 | 2,732,952 |
| Talaris Therapeutics, Inc. * | 50,489 | 76,238 |
| Tango Therapeutics, Inc. * | 102,798 | 826,496 |
| Tarsus Pharmaceuticals, Inc. * | 40,786 | 751,278 |
| Tenaya Therapeutics, Inc. * | 61,401 | 164,555 |
| TG Therapeutics, Inc. * | 298,052 | 1,734,663 |
| Theravance Biopharma, Inc. * | 144,305 | 1,438,721 |
| Theseus Pharmaceuticals, Inc. * | 37,327 | 200,819 |
| Travere Therapeutics, Inc. * | 136,257 | 2,954,052 |
| Tricida, Inc. *(a) | 74,893 | 24,887 |
| Twist Bioscience Corp. * | 125,578 | 4,122,726 |
| Tyra Biosciences, Inc. * | 28,831 | 199,511 |
| Vanda Pharmaceuticals, Inc. * | 124,053 | 1,298,835 |
| Vaxart, Inc. *(a) | 276,951 | 462,508 |
| Vaxcyte, Inc. * | 150,984 | 6,584,412 |
| VBI Vaccines, Inc. * | 440,434 | 317,157 |
| Ventyx Biosciences, Inc. * | 49,976 | 1,617,723 |
| Vera Therapeutics, Inc. * | 31,143 | 580,506 |
| Veracyte, Inc. * | 160,370 | 3,225,041 |
| Vericel Corp. * | 105,633 | 2,839,415 |
| Verve Therapeutics, Inc. * | 101,797 | 3,837,747 |
| Vir Biotechnology, Inc. * | 162,244 | 3,566,123 |
| Viridian Therapeutics, Inc. * | 59,054 | 1,175,175 |
| VistaGen Therapeutics, Inc. * | 427,939 | 56,745 |
| Xencor, Inc. * | 128,422 | 3,595,816 |
| Xeris Biopharma Holdings, Inc. * | 300,770 | 481,232 |
| Y-mAbs Therapeutics, Inc. * | 82,029 | 296,125 |
| Zentalis Pharmaceuticals, Inc. * | 105,164 | 2,638,565 |
| 507,716,852 | ||
| Real Estate 6.4% | ||
| Acadia Realty Trust | 208,357 | 2,910,747 |
| Agree Realty Corp. | 176,542 | 12,128,435 |
| Alexander & Baldwin, Inc. | 162,063 | 3,156,987 |
| Alexander's, Inc. | 4,789 | 1,124,888 |
| American Assets Trust, Inc. | 110,539 | 3,037,612 |
| American Realty Investors, Inc. * | 3,281 | 58,172 |
| Anywhere Real Estate, Inc. * | 251,421 | 1,868,058 |
| Apartment Investment & Management Co., Class A | 335,086 | 2,660,583 |
| Apple Hospitality REIT, Inc. | 481,348 | 8,240,678 |
| Armada Hoffler Properties, Inc. | 150,095 | 1,754,611 |
| SECURITY | NUMBER OF SHARES | VALUE ($) |
| Ashford Hospitality Trust, Inc. * | 78,017 | 633,498 |
| Bluerock Homes Trust, Inc. * | 7,987 | 202,071 |
| Braemar Hotels & Resorts, Inc. | 153,801 | 758,239 |
| Brandywine Realty Trust | 380,398 | 2,495,411 |
| Broadstone Net Lease, Inc. | 373,312 | 6,398,568 |
| BRT Apartments Corp. | 26,640 | 590,342 |
| CareTrust REIT, Inc. | 216,089 | 4,036,543 |
| CBL & Associates Properties, Inc. | 59,612 | 1,712,653 |
| Centerspace | 34,396 | 2,383,643 |
| Chatham Lodging Trust * | 107,910 | 1,399,593 |
| City Office REIT, Inc. | 91,139 | 967,896 |
| Clipper Realty, Inc. | 26,341 | 186,758 |
| Community Healthcare Trust, Inc. | 52,924 | 1,831,170 |
| Compass, Inc., Class A * | 612,928 | 1,618,130 |
| Corporate Office Properties Trust | 252,103 | 6,718,545 |
| CTO Realty Growth, Inc. | 39,172 | 787,357 |
| Cushman & Wakefield plc * | 355,695 | 4,108,277 |
| DiamondRock Hospitality Co. | 469,289 | 4,383,159 |
| DigitalBridge Group, Inc. | 362,747 | 4,643,165 |
| Diversified Healthcare Trust | 537,555 | 731,075 |
| Doma Holdings, Inc. * | 300,934 | 163,287 |
| Douglas Elliman, Inc. | 169,624 | 783,663 |
| Easterly Government Properties, Inc. | 204,072 | 3,548,812 |
| Elme Communities | 195,605 | 3,734,099 |
| Empire State Realty Trust, Inc., Class A | 302,633 | 2,230,405 |
| Equity Commonwealth | 238,336 | 6,234,870 |
| Essential Properties Realty Trust, Inc. | 314,526 | 6,768,600 |
| eXp World Holdings, Inc. (a) | 155,912 | 2,059,598 |
| Farmland Partners, Inc. | 108,007 | 1,513,178 |
| Forestar Group, Inc. * | 40,339 | 467,126 |
| Four Corners Property Trust, Inc. | 181,805 | 4,657,844 |
| Franklin Street Properties Corp. | 221,253 | 637,209 |
| FRP Holdings, Inc. * | 14,951 | 906,479 |
| Getty Realty Corp. | 94,445 | 2,974,073 |
| Gladstone Commercial Corp. | 87,282 | 1,535,290 |
| Gladstone Land Corp. | 72,391 | 1,473,157 |
| Global Medical REIT, Inc. | 135,445 | 1,237,967 |
| Global Net Lease, Inc. | 233,102 | 2,855,499 |
| Hersha Hospitality Trust | 71,030 | 649,924 |
| Independence Realty Trust, Inc. | 496,096 | 8,314,569 |
| Indus Realty Trust, Inc. | 12,044 | 623,759 |
| Industrial Logistics Properties Trust | 146,817 | 687,104 |
| Innovative Industrial Properties, Inc. | 62,149 | 6,718,307 |
| InvenTrust Properties Corp. | 151,610 | 3,820,572 |
| iStar, Inc. | 152,046 | 1,593,442 |
| Kennedy-Wilson Holdings, Inc. | 264,317 | 4,390,305 |
| Kite Realty Group Trust | 487,524 | 9,574,971 |
| LTC Properties, Inc. | 89,413 | 3,457,601 |
| LXP Industrial Trust | 618,129 | 5,983,489 |
| Marcus & Millichap, Inc. | 57,214 | 2,107,764 |
| National Health Investors, Inc. | 96,187 | 5,453,803 |
| NETSTREIT Corp. | 136,418 | 2,567,387 |
| Newmark Group, Inc., Class A | 316,965 | 2,595,943 |
| NexPoint Residential Trust, Inc. | 50,772 | 2,315,203 |
| Offerpad Solutions, Inc. *(a) | 150,020 | 146,194 |
| Office Properties Income Trust | 106,999 | 1,637,085 |
| One Liberty Properties, Inc. | 36,487 | 822,417 |
| Orion Office REIT, Inc. | 128,215 | 1,201,375 |
| Outfront Media, Inc. | 327,680 | 5,914,624 |
| Paramount Group, Inc. | 430,139 | 2,782,999 |
| Pebblebrook Hotel Trust | 290,624 | 4,661,609 |
| Phillips Edison & Co., Inc. | 262,164 | 7,901,623 |
| Physicians Realty Trust | 503,489 | 7,582,544 |
| Piedmont Office Realty Trust, Inc., Class A | 275,304 | 2,876,927 |
| Plymouth Industrial REIT, Inc. | 84,457 | 1,557,387 |
| Postal Realty Trust, Inc., Class A | 39,805 | 624,142 |
| PotlatchDeltic Corp. | 178,052 | 7,921,533 |
| SECURITY | NUMBER OF SHARES | VALUE ($) |
| RE/MAX Holdings, Inc., Class A | 41,044 | 798,716 |
| Redfin Corp. * | 236,933 | 1,139,648 |
| Retail Opportunity Investments Corp. | 269,749 | 3,905,966 |
| RLJ Lodging Trust | 358,862 | 4,367,351 |
| RPT Realty | 188,540 | 1,753,422 |
| Ryman Hospitality Properties, Inc. | 120,422 | 10,707,924 |
| Sabra Health Care REIT, Inc. | 516,491 | 7,055,267 |
| Safehold, Inc. | 48,761 | 1,426,259 |
| Saul Centers, Inc. | 26,286 | 1,076,412 |
| Service Properties Trust | 368,410 | 2,987,805 |
| SITE Centers Corp. | 435,824 | 5,395,501 |
| STAG Industrial, Inc. | 403,726 | 12,753,704 |
| Stratus Properties, Inc. | 13,143 | 388,507 |
| Summit Hotel Properties, Inc. | 234,385 | 2,025,086 |
| Sunstone Hotel Investors, Inc. | 474,629 | 5,292,113 |
| Tanger Factory Outlet Centers, Inc. | 226,919 | 4,086,811 |
| Tejon Ranch Co. * | 46,661 | 790,437 |
| Terreno Realty Corp. | 166,319 | 9,503,468 |
| The Macerich Co. | 481,966 | 5,364,282 |
| The Necessity Retail REIT, Inc. | 299,044 | 2,045,461 |
| The RMR Group, Inc., Class A | 34,160 | 934,959 |
| The St. Joe Co. | 77,152 | 2,741,211 |
| Transcontinental Realty Investors, Inc. * | 2,760 | 113,408 |
| UMH Properties, Inc. | 110,566 | 1,939,328 |
| Uniti Group, Inc. | 531,156 | 4,121,771 |
| Universal Health Realty Income Trust | 28,810 | 1,402,183 |
| Urban Edge Properties | 256,005 | 3,614,791 |
| Urstadt Biddle Properties, Inc., Class A | 66,347 | 1,243,343 |
| Veris Residential, Inc. * | 193,193 | 3,058,245 |
| Whitestone REIT | 104,291 | 981,378 |
| Xenia Hotels & Resorts, Inc. | 255,917 | 4,371,062 |
| 341,178,441 | ||
| Retailing 2.9% | ||
| 1-800-Flowers.com, Inc., Class A * | 61,116 | 445,536 |
| 1stdibs.com, Inc. * | 53,589 | 362,798 |
| Abercrombie & Fitch Co., Class A * | 110,644 | 1,945,122 |
| Academy Sports & Outdoors, Inc. | 185,161 | 8,152,639 |
| aka Brands Holding Corp. *(a) | 25,881 | 52,797 |
| American Eagle Outfitters, Inc. | 345,108 | 3,920,427 |
| America's Car-Mart, Inc. * | 13,385 | 914,999 |
| Arko Corp. | 187,193 | 1,918,728 |
| Asbury Automotive Group, Inc. * | 49,573 | 7,820,141 |
| BARK, Inc. * | 271,168 | 496,237 |
| Bed Bath & Beyond, Inc. *(a) | 177,790 | 812,500 |
| Big 5 Sporting Goods Corp. (a) | 48,422 | 624,160 |
| Big Lots, Inc. | 63,433 | 1,196,981 |
| Boot Barn Holdings, Inc. * | 66,057 | 3,752,038 |
| Boxed, Inc. * | 126,619 | 63,297 |
| Build-A-Bear Workshop, Inc. | 32,240 | 567,102 |
| Caleres, Inc. | 78,975 | 2,158,387 |
| Camping World Holdings, Inc., Class A (a) | 86,182 | 2,398,445 |
| CarParts.com, Inc. * | 113,148 | 529,533 |
| Chico's FAS, Inc. * | 273,316 | 1,607,098 |
| Citi Trends, Inc. * | 18,427 | 416,634 |
| Conn's, Inc. * | 28,662 | 235,315 |
| ContextLogic, Inc., Class A * | 1,292,778 | 1,012,245 |
| Designer Brands, Inc., Class A | 125,652 | 1,913,680 |
| Destination XL Group, Inc. * | 130,731 | 873,283 |
| Dillard's, Inc., Class A | 9,164 | 3,013,032 |
| Duluth Holdings, Inc., Class B * | 29,107 | 253,231 |
| EVgo, Inc. *(a) | 151,246 | 1,120,733 |
| Express, Inc. * | 141,166 | 172,223 |
| Foot Locker, Inc. | 182,893 | 5,797,708 |
| Franchise Group, Inc. | 61,646 | 1,870,956 |
| Funko, Inc., Class A * | 71,268 | 1,471,684 |
| SECURITY | NUMBER OF SHARES | VALUE ($) |
| Genesco, Inc. * | 29,389 | 1,382,459 |
| Group 1 Automotive, Inc. | 34,223 | 5,920,579 |
| Groupon, Inc. *(a) | 48,635 | 358,440 |
| GrowGeneration Corp. *(a) | 130,424 | 465,614 |
| Guess?, Inc. | 75,857 | 1,288,052 |
| Haverty Furniture Cos., Inc. | 33,006 | 877,299 |
| Hibbett, Inc. | 28,667 | 1,789,394 |
| JOANN, Inc. (a) | 24,227 | 128,161 |
| Lands' End, Inc. * | 33,817 | 354,402 |
| Liquidity Services, Inc. * | 54,581 | 937,702 |
| LL Flooring Holdings, Inc. * | 64,103 | 533,337 |
| Lulu's Fashion Lounge Holdings, Inc. * | 36,636 | 229,341 |
| MarineMax, Inc. * | 47,335 | 1,529,394 |
| Monro, Inc. | 71,521 | 3,415,128 |
| Murphy USA, Inc. | 48,378 | 15,215,365 |
| National Vision Holdings, Inc. * | 175,580 | 6,503,483 |
| OneWater Marine, Inc., Class A * | 25,300 | 834,900 |
| Overstock.com, Inc. * | 95,439 | 2,218,957 |
| Party City Holdco, Inc. * | 240,702 | 406,786 |
| PetMed Express, Inc. | 45,075 | 960,999 |
| Porch Group, Inc. * | 179,660 | 244,338 |
| Poshmark, Inc., Class A * | 103,064 | 1,840,723 |
| Quotient Technology, Inc. * | 201,688 | 496,152 |
| Qurate Retail, Inc., Class A | 786,073 | 1,839,411 |
| Rent the Runway, Inc., Class A *(a) | 103,424 | 201,677 |
| Rent-A-Center, Inc. | 118,874 | 2,478,523 |
| Revolve Group, Inc. * | 91,082 | 2,185,968 |
| RumbleON, Inc., Class B * | 22,694 | 371,501 |
| Sally Beauty Holdings, Inc. * | 239,717 | 3,046,803 |
| Shoe Carnival, Inc. | 38,643 | 926,659 |
| Signet Jewelers Ltd. | 102,477 | 6,685,599 |
| Sleep Number Corp. * | 47,830 | 1,326,804 |
| Sonic Automotive, Inc., Class A | 44,668 | 2,088,229 |
| Sportsman's Warehouse Holdings, Inc. * | 97,100 | 871,958 |
| Stitch Fix, Inc., Class A * | 180,462 | 721,848 |
| The Aaron's Co., Inc. | 67,891 | 707,424 |
| The Buckle, Inc. | 67,749 | 2,664,568 |
| The Cato Corp., Class A | 40,280 | 479,735 |
| The Children's Place, Inc. * | 28,651 | 1,159,792 |
| The Container Store Group, Inc. * | 72,643 | 394,451 |
| The ODP Corp. * | 95,106 | 3,763,344 |
| The RealReal, Inc. * | 189,657 | 320,520 |
| ThredUp, Inc., Class A * | 127,326 | 156,611 |
| Tile Shop Holdings, Inc. | 79,998 | 315,192 |
| Tilly's, Inc., Class A | 50,699 | 449,193 |
| Torrid Holdings, Inc. *(a) | 32,709 | 161,255 |
| TravelCenters of America, Inc. * | 28,167 | 1,790,858 |
| Urban Outfitters, Inc. * | 142,943 | 3,410,620 |
| Vivid Seats, Inc., Class A * | 58,160 | 476,912 |
| Volta, Inc. *(a) | 267,275 | 296,675 |
| Warby Parker, Inc., Class A *(a) | 186,790 | 2,997,980 |
| Weyco Group, Inc. | 12,962 | 334,808 |
| Winmark Corp. | 6,321 | 1,590,616 |
| Xometry, Inc., Class A * | 75,616 | 4,541,497 |
| Zumiez, Inc. * | 35,029 | 785,700 |
| 155,363,425 | ||
| Semiconductors & Semiconductor Equipment 2.2% | ||
| ACM Research, Inc., Class A * | 107,990 | 691,136 |
| Alpha & Omega Semiconductor Ltd. * | 49,196 | 1,611,169 |
| Ambarella, Inc. * | 81,505 | 4,460,769 |
| Amkor Technology, Inc. | 227,021 | 4,719,767 |
| Atomera, Inc. *(a) | 46,490 | 418,875 |
| Axcelis Technologies, Inc. * | 73,100 | 4,239,800 |
| AXT, Inc. * | 89,727 | 407,361 |
| CEVA, Inc. * | 51,140 | 1,414,532 |
| Cohu, Inc. * | 107,454 | 3,537,386 |
| SECURITY | NUMBER OF SHARES | VALUE ($) |
| Credo Technology Group Holding Ltd. *(a) | 216,031 | 2,968,266 |
| CyberOptics Corp. * | 16,148 | 871,507 |
| Diodes, Inc. * | 99,589 | 7,137,544 |
| FormFactor, Inc. * | 172,514 | 3,486,508 |
| Ichor Holdings Ltd. * | 62,777 | 1,597,047 |
| Impinj, Inc. * | 47,028 | 5,390,820 |
| indie Semiconductor, Inc., Class A *(a) | 229,042 | 1,791,108 |
| Kulicke & Soffa Industries, Inc. | 127,714 | 5,356,325 |
| MACOM Technology Solutions Holdings, Inc. * | 113,092 | 6,544,634 |
| MaxLinear, Inc. * | 162,746 | 5,025,596 |
| Onto Innovation, Inc. * | 110,924 | 7,414,160 |
| PDF Solutions, Inc. * | 66,785 | 1,574,790 |
| Photronics, Inc. * | 134,287 | 2,178,135 |
| Power Integrations, Inc. | 126,903 | 8,465,699 |
| Rambus, Inc. * | 245,233 | 7,396,227 |
| Rigetti Computing, Inc., Class A * | 78,046 | 163,897 |
| Rockley Photonics Holdings Ltd. *(a) | 220,930 | 112,696 |
| Semtech Corp. * | 141,625 | 3,921,596 |
| Silicon Laboratories, Inc. * | 75,992 | 8,733,001 |
| SiTime Corp. * | 36,259 | 3,256,421 |
| SkyWater Technology, Inc. *(a) | 23,597 | 191,372 |
| SMART Global Holdings, Inc. * | 109,613 | 1,483,064 |
| Synaptics, Inc. * | 88,763 | 7,864,402 |
| Transphorm, Inc. * | 50,138 | 345,952 |
| Ultra Clean Holdings, Inc. * | 101,045 | 3,143,510 |
| Veeco Instruments, Inc. * | 113,713 | 2,072,988 |
| 119,988,060 | ||
| Software & Services 6.8% | ||
| 8x8, Inc. * | 267,316 | 1,130,747 |
| A10 Networks, Inc. | 147,844 | 2,483,779 |
| ACI Worldwide, Inc. * | 256,301 | 6,235,803 |
| Adeia, Inc. | 233,914 | 2,615,159 |
| Agilysys, Inc. * | 44,345 | 2,845,619 |
| Alarm.com Holdings, Inc. * | 107,632 | 6,333,067 |
| Alkami Technology, Inc. * | 79,929 | 1,266,875 |
| Altair Engineering, Inc., Class A * | 116,315 | 5,705,251 |
| American Software, Inc., Class A | 79,967 | 1,369,835 |
| Amplitude, Inc., Class A * | 124,761 | 2,095,985 |
| Appfolio, Inc., Class A * | 42,632 | 5,344,774 |
| Appian Corp. * | 89,591 | 4,373,833 |
| Applied Blockchain, Inc. * | 17,721 | 39,872 |
| Arteris, Inc. * | 39,233 | 217,351 |
| Asana, Inc., Class A * | 164,799 | 3,394,859 |
| Avaya Holdings Corp. *(a) | 193,166 | 305,202 |
| AvePoint, Inc. *(a) | 289,044 | 1,263,122 |
| AvidXchange Holdings, Inc. * | 328,027 | 2,985,046 |
| Benefitfocus, Inc. * | 56,854 | 400,821 |
| BigCommerce Holdings, Inc. * | 143,810 | 2,137,017 |
| Blackbaud, Inc. * | 103,939 | 5,685,463 |
| Blackline, Inc. * | 123,610 | 6,922,160 |
| Blend Labs, Inc., Class A *(a) | 413,939 | 1,038,987 |
| Box, Inc., Class A * | 312,925 | 9,090,471 |
| Brightcove, Inc. * | 92,920 | 622,564 |
| BTRS Holdings, Inc., Class A * | 224,680 | 2,120,979 |
| C3.ai, Inc., Class A * | 154,299 | 2,022,860 |
| Cantaloupe, Inc. * | 132,760 | 444,746 |
| Cass Information Systems, Inc. | 29,983 | 1,282,673 |
| Cerberus Cyber Sentinel Corp. *(a) | 100,363 | 347,256 |
| Cerence, Inc. * | 88,000 | 1,513,600 |
| ChannelAdvisor Corp. * | 63,593 | 1,465,183 |
| Cipher Mining, Inc. * | 85,850 | 86,709 |
| Cleanspark, Inc. *(a) | 100,401 | 349,395 |
| Clear Secure, Inc., Class A * | 139,220 | 3,761,724 |
| CommVault Systems, Inc. * | 99,632 | 6,066,592 |
| SECURITY | NUMBER OF SHARES | VALUE ($) |
| Conduent, Inc. * | 380,545 | 1,567,845 |
| Consensus Cloud Solutions, Inc. * | 35,660 | 2,001,952 |
| Core Scientific, Inc., Class A *(a) | 601,879 | 120,376 |
| Couchbase, Inc. * | 59,191 | 757,645 |
| CS Disco, Inc. * | 49,790 | 533,749 |
| CSG Systems International, Inc. | 70,849 | 4,581,805 |
| Cvent Holding Corp. * | 102,255 | 598,192 |
| Cyxtera Technologies, Inc. * | 81,237 | 196,594 |
| Digimarc Corp. *(a) | 30,443 | 497,439 |
| Digital Turbine, Inc. * | 210,113 | 3,067,650 |
| DigitalOcean Holdings, Inc. * | 156,069 | 5,605,998 |
| Domo, Inc., Class B * | 67,944 | 1,200,570 |
| Duck Creek Technologies, Inc. * | 173,228 | 2,068,342 |
| E2open Parent Holdings, Inc. * | 445,802 | 2,599,026 |
| Ebix, Inc. | 58,939 | 1,166,403 |
| Edgio, Inc. * | 309,180 | 831,694 |
| eGain Corp. * | 47,745 | 384,347 |
| Enfusion, Inc., Class A * | 58,448 | 828,208 |
| EngageSmart, Inc. * | 78,359 | 1,538,971 |
| Envestnet, Inc. * | 123,026 | 6,066,412 |
| Everbridge, Inc. * | 88,588 | 2,775,462 |
| EverCommerce, Inc. * | 54,806 | 477,360 |
| EVERTEC, Inc. | 140,021 | 5,014,152 |
| Evo Payments, Inc., Class A * | 105,803 | 3,564,503 |
| ExlService Holdings, Inc. * | 72,457 | 13,176,305 |
| Fastly, Inc., Class A * | 250,096 | 2,123,315 |
| Flywire Corp. * | 125,115 | 2,746,274 |
| ForgeRock, Inc., Class A * | 67,539 | 1,523,680 |
| Greenidge Generation Holdings, Inc. *(a) | 28,120 | 27,338 |
| Grid Dynamics Holdings, Inc. * | 108,394 | 1,475,242 |
| I3 Verticals, Inc., Class A * | 49,569 | 1,078,621 |
| IBEX Holdings Ltd. * | 12,767 | 245,509 |
| Information Services Group, Inc. | 77,612 | 421,433 |
| Instructure Holdings, Inc. * | 38,624 | 912,299 |
| Intapp, Inc. * | 31,497 | 707,423 |
| InterDigital, Inc. | 66,459 | 3,314,310 |
| International Money Express, Inc. * | 71,836 | 1,941,727 |
| IronNet, Inc. * | 142,429 | 101,125 |
| Kaleyra, Inc. * | 64,791 | 55,727 |
| KnowBe4, Inc., Class A * | 162,992 | 4,006,343 |
| Latch, Inc. * | 239,507 | 320,939 |
| LivePerson, Inc. * | 156,711 | 1,656,435 |
| LiveRamp Holdings, Inc. * | 147,850 | 2,714,526 |
| LiveVox Holdings, Inc. * | 48,844 | 151,905 |
| Marathon Digital Holdings, Inc. *(a) | 248,274 | 3,254,872 |
| Marqeta, Inc., Class A * | 971,469 | 7,655,176 |
| Matterport, Inc. *(a) | 496,430 | 1,732,541 |
| Maximus, Inc. | 135,525 | 8,357,827 |
| MeridianLink, Inc. * | 51,401 | 925,218 |
| MicroStrategy, Inc., Class A *(a) | 21,054 | 5,632,156 |
| Mitek Systems, Inc. * | 94,412 | 1,067,800 |
| Model N, Inc. * | 82,050 | 3,117,900 |
| Momentive Global, Inc. * | 292,613 | 2,270,677 |
| MoneyGram International, Inc. * | 210,025 | 2,224,165 |
| N-Able, Inc. * | 153,164 | 1,658,766 |
| NextNav, Inc. *(a) | 147,440 | 505,719 |
| Olo, Inc., Class A * | 200,871 | 1,769,674 |
| ON24, Inc. * | 92,793 | 755,335 |
| OneSpan, Inc. * | 89,021 | 978,341 |
| PagerDuty, Inc. * | 190,407 | 4,748,751 |
| Paya Holdings, Inc. * | 194,818 | 1,566,337 |
| Payoneer Global, Inc. * | 484,416 | 3,754,224 |
| Paysafe Ltd. * | 760,977 | 1,111,026 |
| Perficient, Inc. * | 76,460 | 5,120,526 |
| PFSweb, Inc. * | 38,021 | 363,861 |
| PowerSchool Holdings, Inc., Class A * | 102,071 | 2,041,420 |
| Priority Technology Holdings, Inc. * | 39,369 | 201,963 |
| Progress Software Corp. | 97,838 | 4,992,673 |
| SECURITY | NUMBER OF SHARES | VALUE ($) |
| PROS Holdings, Inc. * | 91,718 | 2,288,364 |
| Q2 Holdings, Inc. * | 125,028 | 3,880,869 |
| Qualys, Inc. * | 86,299 | 12,302,785 |
| Rackspace Technology, Inc. * | 129,419 | 666,508 |
| Rapid7, Inc. * | 130,002 | 5,885,191 |
| Remitly Global, Inc. * | 220,815 | 2,565,870 |
| Repay Holdings Corp. * | 196,576 | 1,197,148 |
| Rimini Street, Inc. * | 109,269 | 612,999 |
| Riot Blockchain, Inc. *(a) | 302,850 | 2,086,636 |
| Sabre Corp. * | 729,801 | 4,240,144 |
| Sapiens International Corp. N.V. | 68,806 | 1,353,414 |
| SecureWorks Corp., Class A * | 22,039 | 180,279 |
| ShotSpotter, Inc. * | 20,238 | 769,044 |
| SolarWinds Corp. * | 107,816 | 1,005,923 |
| Sprout Social, Inc., Class A * | 102,830 | 6,203,734 |
| SPS Commerce, Inc. * | 81,155 | 10,267,731 |
| Squarespace, Inc., Class A * | 70,123 | 1,557,432 |
| StoneCo Ltd., Class A * | 620,193 | 6,512,026 |
| Sumo Logic, Inc. * | 254,474 | 1,961,995 |
| Telos Corp. * | 119,878 | 1,270,707 |
| Tenable Holdings, Inc. * | 245,996 | 9,997,277 |
| Terawulf, Inc. * | 46,971 | 53,547 |
| The Hackett Group, Inc. | 60,104 | 1,312,671 |
| TTEC Holdings, Inc. | 42,068 | 1,870,764 |
| Tucows, Inc., Class A * | 22,161 | 996,137 |
| Unisys Corp. * | 148,202 | 1,259,717 |
| Upland Software, Inc. * | 65,083 | 523,267 |
| UserTesting, Inc. *(a) | 106,364 | 787,094 |
| Varonis Systems, Inc. * | 243,809 | 6,526,767 |
| Verint Systems, Inc. * | 142,388 | 5,044,807 |
| Veritone, Inc. *(a) | 68,701 | 509,074 |
| Verra Mobility Corp. * | 320,644 | 5,473,393 |
| Viant Technology, Inc., Class A * | 30,775 | 140,334 |
| Weave Communications, Inc. * | 68,795 | 378,372 |
| WM Technology, Inc. * | 157,675 | 323,234 |
| Workiva, Inc. * | 106,694 | 8,301,860 |
| Xperi, Inc. * | 92,751 | 1,295,729 |
| Yext, Inc. * | 253,881 | 1,350,647 |
| Zeta Global Holdings Corp., Class A * | 245,316 | 2,045,935 |
| Zuora, Inc., Class A * | 272,286 | 2,093,879 |
| 365,010,802 | ||
| Technology Hardware & Equipment 3.7% | ||
| 908 Devices, Inc. * | 48,682 | 778,425 |
| ADTRAN Holdings, Inc. | 157,422 | 3,535,698 |
| Advanced Energy Industries, Inc. | 84,075 | 6,612,499 |
| Aeva Technologies, Inc. * | 219,781 | 439,562 |
| AEye, Inc. * | 58,044 | 50,527 |
| Akoustis Technologies, Inc. * | 114,846 | 382,437 |
| Arlo Technologies, Inc. * | 194,173 | 999,991 |
| Aviat Networks, Inc. * | 24,862 | 811,993 |
| Avid Technology, Inc. * | 79,833 | 2,194,609 |
| Badger Meter, Inc. | 65,474 | 7,364,516 |
| Belden, Inc. | 96,630 | 6,728,347 |
| Benchmark Electronics, Inc. | 78,132 | 2,218,167 |
| Calix, Inc. * | 127,026 | 9,354,195 |
| Cambium Networks Corp. * | 26,022 | 503,526 |
| Casa Systems, Inc. * | 77,742 | 244,887 |
| Cepton, Inc. *(a) | 104,245 | 229,339 |
| Clearfield, Inc. * | 25,864 | 3,141,700 |
| CommScope Holding Co., Inc. * | 458,964 | 6,076,683 |
| CompoSecure, Inc. * | 17,135 | 91,501 |
| Comtech Telecommunications Corp. | 58,364 | 644,922 |
| Corsair Gaming, Inc. *(a) | 85,442 | 1,179,100 |
| CTS Corp. | 70,938 | 2,803,470 |
| Diebold Nixdorf, Inc. * | 165,357 | 411,739 |
| Digi International, Inc. * | 76,460 | 3,083,632 |
| SECURITY | NUMBER OF SHARES | VALUE ($) |
| DZS, Inc. * | 39,398 | 626,034 |
| Eastman Kodak Co. * | 128,955 | 689,909 |
| ePlus, Inc. * | 59,367 | 2,892,360 |
| Evolv Technologies Holdings, Inc. * | 184,944 | 541,886 |
| Extreme Networks, Inc. * | 282,565 | 5,069,216 |
| Fabrinet * | 82,638 | 9,453,787 |
| FARO Technologies, Inc. * | 41,158 | 1,202,225 |
| Focus Universal, Inc. * | 40,116 | 408,381 |
| Harmonic, Inc. * | 205,968 | 3,182,206 |
| Identiv, Inc. * | 49,874 | 600,982 |
| Infinera Corp. * | 422,330 | 2,369,271 |
| Inseego Corp. * | 189,191 | 427,572 |
| Insight Enterprises, Inc. * | 70,268 | 6,641,029 |
| IonQ, Inc. *(a) | 264,628 | 1,558,659 |
| Itron, Inc. * | 100,962 | 4,936,032 |
| Kimball Electronics, Inc. * | 53,582 | 1,107,540 |
| Knowles Corp. * | 200,752 | 2,760,340 |
| Lightwave Logic, Inc. *(a) | 250,107 | 2,118,406 |
| Methode Electronics, Inc. | 81,126 | 3,344,825 |
| MicroVision, Inc. *(a) | 371,467 | 1,359,569 |
| Mirion Technologies, Inc. * | 306,794 | 2,478,896 |
| Napco Security Technologies, Inc. * | 65,567 | 1,863,414 |
| NETGEAR, Inc. * | 63,126 | 1,240,426 |
| NetScout Systems, Inc. * | 152,898 | 5,492,096 |
| nLight, Inc. * | 99,571 | 1,072,380 |
| Novanta, Inc. * | 79,495 | 11,240,593 |
| Ondas Holdings, Inc. *(a) | 78,825 | 315,300 |
| OSI Systems, Inc. * | 36,267 | 2,980,422 |
| Ouster, Inc. *(a) | 318,070 | 397,587 |
| PAR Technology Corp. * | 59,101 | 1,700,927 |
| PC Connection, Inc. | 25,087 | 1,333,123 |
| Plexus Corp. * | 61,436 | 6,045,302 |
| Ribbon Communications, Inc. * | 164,941 | 437,094 |
| Rogers Corp. * | 41,985 | 9,880,330 |
| Sanmina Corp. * | 127,600 | 7,151,980 |
| ScanSource, Inc. * | 56,225 | 1,741,850 |
| SmartRent, Inc. *(a) | 271,430 | 746,432 |
| Super Micro Computer, Inc. * | 101,608 | 7,070,901 |
| TTM Technologies, Inc. * | 226,729 | 3,471,221 |
| Turtle Beach Corp. * | 34,654 | 270,301 |
| Velodyne Lidar, Inc. * | 438,918 | 433,432 |
| Viavi Solutions, Inc. * | 509,283 | 7,690,173 |
| Vishay Intertechnology, Inc. | 295,864 | 6,186,516 |
| Vishay Precision Group, Inc. * | 27,873 | 940,714 |
| Xerox Holdings Corp. | 255,904 | 3,743,876 |
| 197,096,980 | ||
| Telecommunication Services 0.8% | ||
| Anterix, Inc. * | 41,017 | 1,573,002 |
| ATN International, Inc. | 24,697 | 1,064,935 |
| Bandwidth, Inc., Class A * | 51,924 | 616,338 |
| Charge Enterprises, Inc. * | 293,814 | 652,267 |
| Cogent Communications Holdings, Inc. | 96,293 | 5,056,345 |
| Consolidated Communications Holdings, Inc. * | 165,922 | 857,817 |
| EchoStar Corp., Class A * | 74,939 | 1,414,099 |
| Globalstar, Inc. * | 1,530,904 | 3,322,062 |
| Gogo, Inc. * | 111,989 | 1,592,484 |
| IDT Corp., Class B * | 32,996 | 859,876 |
| Iridium Communications, Inc. * | 285,036 | 14,687,905 |
| KORE Group Holdings, Inc. * | 77,119 | 235,984 |
| Liberty Latin America Ltd., Class A * | 85,207 | 662,910 |
| Liberty Latin America Ltd., Class C * | 334,133 | 2,602,896 |
| Ooma, Inc. * | 51,431 | 834,725 |
| Radius Global Infrastructure, Inc., Class A * | 170,961 | 1,598,485 |
| Shenandoah Telecommunications Co. | 108,411 | 2,456,593 |
| SECURITY | NUMBER OF SHARES | VALUE ($) |
| Starry Group Holdings, Inc., Class A * | 52,270 | 11,552 |
| Telephone & Data Systems, Inc. | 225,653 | 3,836,101 |
| United States Cellular Corp. * | 33,384 | 1,040,579 |
| 44,976,955 | ||
| Transportation 1.5% | ||
| Air Transport Services Group, Inc. * | 132,136 | 3,858,371 |
| Allegiant Travel Co. * | 34,550 | 2,592,978 |
| ArcBest Corp. | 54,697 | 4,344,583 |
| Atlas Air Worldwide Holdings, Inc. * | 62,664 | 6,337,837 |
| Bird Global, Inc., Class A * | 376,646 | 163,540 |
| Blade Air Mobility, Inc. * | 126,759 | 570,416 |
| Costamare, Inc. | 118,380 | 1,117,507 |
| Covenant Logistics Group, Inc. | 22,789 | 862,336 |
| Daseke, Inc. * | 91,961 | 548,088 |
| Eagle Bulk Shipping, Inc. | 30,048 | 1,453,722 |
| Eneti, Inc. | 52,253 | 429,520 |
| Forward Air Corp. | 60,138 | 6,366,810 |
| Frontier Group Holdings, Inc. * | 83,994 | 1,101,161 |
| Genco Shipping & Trading Ltd. | 82,211 | 1,101,627 |
| Golden Ocean Group Ltd. (a) | 275,228 | 2,292,649 |
| Hawaiian Holdings, Inc. * | 113,438 | 1,636,910 |
| Heartland Express, Inc. | 104,624 | 1,556,805 |
| Hub Group, Inc., Class A * | 75,179 | 5,833,890 |
| Joby Aviation, Inc. *(a) | 562,759 | 2,712,498 |
| Marten Transport Ltd. | 130,534 | 2,450,123 |
| Matson, Inc. | 86,260 | 6,347,011 |
| P.A.M. Transportation Services, Inc. * | 14,960 | 416,636 |
| Radiant Logistics, Inc. * | 85,915 | 521,504 |
| Safe Bulkers, Inc. | 160,788 | 406,794 |
| Saia, Inc. * | 59,436 | 11,819,443 |
| SkyWest, Inc. * | 111,558 | 1,972,345 |
| Spirit Airlines, Inc. | 243,925 | 5,366,350 |
| Sun Country Airlines Holdings, Inc. * | 73,878 | 1,202,734 |
| TuSimple Holdings, Inc., Class A *(a) | 313,729 | 1,076,090 |
| Universal Logistics Holdings, Inc. | 16,038 | 513,216 |
| Werner Enterprises, Inc. | 141,714 | 5,555,189 |
| Wheels Up Experience, Inc. * | 362,352 | 641,363 |
| 83,170,046 | ||
| Utilities 3.3% | ||
| ALLETE, Inc. | 128,276 | 7,218,090 |
| Altus Power, Inc. * | 94,241 | 938,640 |
| American States Water Co. | 82,650 | 7,476,519 |
| Artesian Resources Corp., Class A | 18,378 | 960,802 |
| Avista Corp. | 162,167 | 6,653,712 |
| Black Hills Corp. | 145,505 | 9,511,662 |
| Brookfield Infrastructure Corp., Class A | 219,163 | 9,450,309 |
| California Water Service Group | 121,490 | 7,539,669 |
| Chesapeake Utilities Corp. | 38,963 | 4,846,218 |
| Clearway Energy, Inc., Class A | 77,766 | 2,514,175 |
| Clearway Energy, Inc., Class C | 183,631 | 6,379,341 |
| Global Water Resources, Inc. | 30,428 | 388,261 |
| MGE Energy, Inc. | 81,473 | 5,547,497 |
| Middlesex Water Co. | 38,881 | 3,478,683 |
| Montauk Renewables, Inc. * | 144,288 | 2,159,991 |
| New Jersey Resources Corp. | 215,432 | 9,616,884 |
| Northwest Natural Holding Co. | 77,586 | 3,731,111 |
| NorthWestern Corp. | 126,199 | 6,667,093 |
| ONE Gas, Inc. | 120,339 | 9,323,866 |
| Ormat Technologies, Inc. | 101,482 | 9,179,047 |
| Otter Tail Corp. | 92,044 | 6,205,606 |
| SECURITY | NUMBER OF SHARES | VALUE ($) |
| PNM Resources, Inc. | 191,239 | 8,886,876 |
| Portland General Electric Co. | 200,271 | 9,000,179 |
| Pure Cycle Corp. * | 42,868 | 369,951 |
| SJW Group | 60,495 | 4,275,787 |
| South Jersey Industries, Inc. | 274,759 | 9,525,895 |
| Southwest Gas Holdings, Inc. | 149,937 | 10,955,897 |
| Spire, Inc. | 114,096 | 7,965,042 |
| Sunnova Energy International, Inc. * | 222,160 | 4,118,846 |
| The York Water Co. | 31,594 | 1,376,235 |
| Unitil Corp. | 35,473 | 1,869,782 |
| Via Renewables, Inc. | 27,362 | 191,260 |
| 178,322,926 | ||
| Total Common Stocks (Cost $4,285,532,226) | 5,358,340,409 | |
| RIGHTS 0.0% OF NET ASSETS | ||
| Pharmaceuticals, Biotechnology & Life Sciences 0.0% | ||
| Aduro Biotech, Inc. CVR *(b) | 27,867 | 49,949 |
| Oncternal Therapeutics, Inc. CVR *(b) | 592 | 1,213 |
| Tobira Therapeutics, Inc. CVR *(b) | 14,029 | 167,575 |
| Zogenix, Inc. CVR *(b) | 124,832 | 84,886 |
| 303,623 | ||
| Total Rights (Cost $86,941) | 303,623 | |
| SHORT-TERM INVESTMENTS 2.3% OF NET ASSETS | ||
| Money Market Funds 2.3% | ||
| State Street Institutional U.S. Government Money Market Fund, Premier Class 3.01% (c)(d) | 125,060,461 | 125,060,461 |
| Total Short-Term Investments (Cost $125,060,461) | 125,060,461 | |
| Total Investments in Securities (Cost $4,410,679,628) | 5,483,704,493 | |
| NUMBER OF CONTRACTS | NOTIONAL AMOUNT ($) | CURRENT VALUE/ UNREALIZED APPRECIATION ($) | |
| FUTURES CONTRACTS | |||
| Long | |||
| Russell 2000 Index, e-mini, expires 12/16/22 | 133 | 12,322,450 | 276,685 |
| * | Non-income producing security. |
| (a) | All or a portion of this security is on loan. Securities on loan were valued at $119,230,437. |
| (b) | Fair-valued using significant unobservable inputs (see financial note 2(a), Securities for which no quoted value is available, for additional information). |
| (c) | The rate shown is the annualized 7-day yield. |
| (d) | Security purchased with cash collateral received for securities on loan. |
| CVR — | Contingent Value Rights |
| REIT — | Real Estate Investment Trust |
| DESCRIPTION | QUOTED PRICES IN ACTIVE MARKETS FOR IDENTICAL ASSETS (LEVEL 1) | OTHER SIGNIFICANT OBSERVABLE INPUTS (LEVEL 2) | SIGNIFICANT UNOBSERVABLE INPUTS (LEVEL 3) | TOTAL |
| Assets | ||||
| Common Stocks1 | $5,135,228,646 | $— | $— | $5,135,228,646 |
| Materials | 223,111,763 | — | 0* | 223,111,763 |
| Rights 1 | ||||
| Pharmaceuticals, Biotechnology & Life Sciences | — | — | 303,623 | 303,623 |
| Short-Term Investments1 | 125,060,461 | — | — | 125,060,461 |
| Futures Contracts2 | 276,685 | — | — | 276,685 |
| Total | $5,483,677,555 | $— | $303,623 | $5,483,981,178 |
| * | Level 3 amount shown includes securities determined to have no value at October 31, 2022. |
| 1 | As categorized in the Portfolio Holdings. |
| 2 | Futures contracts are reported at cumulative unrealized appreciation or depreciation. |
| Assets | ||
| Investments in securities, at value - unaffiliated (cost $4,410,679,628) including securities on loan of $119,230,437 | $5,483,704,493 | |
| Cash | 16,883,257 | |
| Deposit with broker for futures contracts | 962,500 | |
| Receivables: | ||
| Fund shares sold | 6,691,790 | |
| Dividends | 1,723,532 | |
| Investments sold | 903,248 | |
| Income from securities on loan | 610,370 | |
| Interest | 41,683 | |
| Variation margin on future contracts | 10,253 | |
| Foreign tax reclaims | + | 994 |
| Total assets | 5,511,532,120 | |
| Liabilities | ||
| Collateral held for securities on loan | 125,060,461 | |
| Payables: | ||
| Fund shares redeemed | 13,158,404 | |
| Investments bought | 1,422,337 | |
| Investment adviser fees | + | 161,725 |
| Total liabilities | 139,802,927 | |
| Net assets | $5,371,729,193 | |
| Net Assets by Source | ||
| Capital received from investors | $4,549,585,969 | |
| Total distributable earnings | + | 822,143,224 |
| Net assets | $5,371,729,193 | |
| Net Asset Value (NAV) | ||||
| Net Assets | ÷ | Shares Outstanding | = | NAV |
| $5,371,729,193 | 179,817,041 | $29.87 | ||
| For the period November 1, 2021 through October 31, 2022 | ||
| Investment Income | ||
| Dividends received from securities - unaffiliated (net of foreign withholding tax of $104,449) | $69,425,348 | |
| Interest received from securities - unaffiliated | 138,495 | |
| Securities on loan, net | + | 5,109,502 |
| Total investment income | 74,673,345 | |
| Expenses | ||
| Investment adviser fees | 2,306,027 | |
| Proxy fees1 | + | 265,829 |
| Total expenses | – | 2,571,856 |
| Net investment income | 72,101,489 | |
| REALIZED AND UNREALIZED GAINS (LOSSES) | ||
| Net realized losses on sales of securities - unaffiliated | (133,054,315) | |
| Net realized gains on sales of in-kind redemptions - unaffiliated | 121,547,069 | |
| Net realized losses on futures contracts | + | (5,981,747) |
| Net realized losses | (17,488,993) | |
| Net change in unrealized appreciation (depreciation) on securities - unaffiliated | (1,287,117,071) | |
| Net change in unrealized appreciation (depreciation) on futures contracts | + | (179,482) |
| Net change in unrealized appreciation (depreciation) | + | (1,287,296,553) |
| Net realized and unrealized losses | (1,304,785,546) | |
| Decrease in net assets resulting from operations | ($1,232,684,057) | |
| 1 | Proxy fees are non-routine expenses (see financial note 2(e) for additional information). |
| OPERATIONS | |||
| 11/1/21-10/31/22 | 11/1/20-10/31/21 | ||
| Net investment income | $72,101,489 | $58,753,702 | |
| Net realized gains (losses) | (17,488,993) | 428,156,754 | |
| Net change in unrealized appreciation (depreciation) | + | (1,287,296,553) | 1,575,126,021 |
| Increase (decrease) in net assets resulting from operations | ($1,232,684,057) | $2,062,036,477 | |
| DISTRIBUTIONS TO SHAREHOLDERS | |||
| Total distributions | ($531,629,821) | ($129,889,789) | |
| TRANSACTIONS IN FUND SHARES | |||||
| 11/1/21-10/31/22 | 11/1/20-10/31/21 | ||||
| SHARES | VALUE | SHARES | VALUE | ||
| Shares sold | 45,597,167 | $1,444,544,971 | 42,300,482 | $1,579,406,837 | |
| Shares reinvested | 12,345,025 | 436,396,621 | 3,127,037 | 106,319,237 | |
| Shares redeemed | + | (42,926,031) | (1,331,894,500) | (27,339,753) | (1,019,048,338) |
| Net transactions in fund shares | 15,016,161 | $549,047,092 | 18,087,766 | $666,677,736 | |
| SHARES OUTSTANDING AND NET ASSETS | |||||
| 11/1/21-10/31/22 | 11/1/20-10/31/21 | ||||
| SHARES | NET ASSETS | SHARES | NET ASSETS | ||
| Beginning of period | 164,800,880 | $6,586,995,979 | 146,713,114 | $3,988,171,555 | |
| Total increase (decrease) | + | 15,016,161 | (1,215,266,786) | 18,087,766 | 2,598,824,424 |
| End of period | 179,817,041 | $5,371,729,193 | 164,800,880 | $6,586,995,979 | |
| 11/1/21– 10/31/22 | 11/1/20– 10/31/21 | 11/1/19– 10/31/20 | 11/1/18– 10/31/19 | 11/1/17– 10/31/18 | ||
| Per-Share Data | ||||||
| Net asset value at beginning of period | $81.64 | $57.62 | $53.42 | $48.38 | $46.25 | |
| Income (loss) from investment operations: | ||||||
| Net investment income (loss)1 | 1.05 | 1.00 | 1.07 | 0.99 | 0.88 | |
| Net realized and unrealized gains (losses) | (14.67) | 24.10 | 4.21 | 5.18 | 2.12 | |
| Total from investment operations | (13.62) | 25.10 | 5.28 | 6.17 | 3.00 | |
| Less distributions: | ||||||
| Distributions from net investment income | (0.96) | (1.08) | (0.94) | (0.90) | (0.76) | |
| Distributions from net realized gains | (0.24) | — | (0.14) | (0.23) | (0.11) | |
| Total distributions | (1.20) | (1.08) | (1.08) | (1.13) | (0.87) | |
| Net asset value at end of period | $66.82 | $81.64 | $57.62 | $53.42 | $48.38 | |
| Total return | (16.94%) | 44.01% | 9.94% | 13.37% | 6.51% | |
| Ratios/Supplemental Data | ||||||
| Ratios to average net assets: | ||||||
| Total expenses | 0.03% 2 | 0.03% | 0.03% | 0.03% | 0.03% | |
| Net investment income (loss) | 1.44% | 1.37% | 1.96% | 1.99% | 1.80% | |
| Portfolio turnover rate | 2% | 3% | 4% | 3% | 4% | |
| Net assets, end of period (x 1,000,000) | $16,046 | $18,232 | $11,487 | $10,220 | $8,410 | |
| 1 | Calculated based on the average shares outstanding during the period. |
| 2 | Ratio includes less than 0.005% of non-routine proxy expenses. |
| SECURITY | NUMBER OF SHARES | VALUE ($) |
| COMMON STOCKS 99.6% OF NET ASSETS | ||
| Automobiles & Components 2.2% | ||
| Adient plc * | 39,012 | 1,364,640 |
| American Axle & Manufacturing Holdings, Inc. * | 47,903 | 464,180 |
| Aptiv plc * | 111,983 | 10,198,292 |
| Arcimoto, Inc. *(a) | 15,996 | 11,804 |
| Autoliv, Inc. | 32,195 | 2,586,868 |
| BorgWarner, Inc. | 98,811 | 3,708,377 |
| Canoo, Inc. *(a) | 57,247 | 78,428 |
| Cooper-Standard Holdings, Inc. * | 8,444 | 80,218 |
| Dana, Inc. | 52,540 | 838,538 |
| Dorman Products, Inc. * | 11,775 | 961,076 |
| Envirotech Vehicles, Inc. * | 9,637 | 33,633 |
| Fisker, Inc. *(a) | 64,146 | 522,790 |
| Ford Motor Co. | 1,638,269 | 21,903,657 |
| Fox Factory Holding Corp. * | 17,484 | 1,535,969 |
| Garrett Motion, Inc. * | 22,121 | 146,883 |
| General Motors Co. | 604,895 | 23,742,129 |
| Gentex Corp. | 97,710 | 2,588,338 |
| Gentherm, Inc. * | 13,478 | 787,385 |
| Harley-Davidson, Inc. | 55,608 | 2,391,144 |
| Holley, Inc. *(a) | 22,922 | 91,230 |
| Horizon Global Corp. * | 7,908 | 5,061 |
| LCI Industries | 10,466 | 1,110,547 |
| Lear Corp. | 24,847 | 3,446,527 |
| Lordstown Motors Corp., Class A *(a) | 79,965 | 144,737 |
| Lucid Group, Inc. *(a) | 244,831 | 3,498,635 |
| Luminar Technologies, Inc. *(a) | 97,181 | 786,194 |
| Modine Manufacturing Co. * | 20,348 | 364,636 |
| Motorcar Parts of America, Inc. * | 7,218 | 137,142 |
| Mullen Automotive, Inc. * | 208,607 | 99,380 |
| NII Holdings, Inc. Escrow *(b) | 28,127 | 16,736 |
| Patrick Industries, Inc. | 9,154 | 418,429 |
| QuantumScape Corp. *(a) | 112,565 | 937,667 |
| Rivian Automotive, Inc., Class A * | 225,599 | 7,889,197 |
| Solid Power, Inc. * | 46,229 | 259,345 |
| Standard Motor Products, Inc. | 7,798 | 295,778 |
| Stoneridge, Inc. * | 11,655 | 243,240 |
| Strattec Security Corp. * | 1,500 | 39,000 |
| Superior Industries International, Inc. * | 10,350 | 47,403 |
| Tenneco, Inc., Class A * | 33,485 | 659,655 |
| Tesla, Inc. * | 1,104,784 | 251,382,551 |
| The Goodyear Tire & Rubber Co. * | 117,250 | 1,489,075 |
| Thor Industries, Inc. | 22,679 | 1,847,658 |
| Visteon Corp. * | 11,858 | 1,547,113 |
| Winnebago Industries, Inc. | 13,374 | 798,294 |
| Workhorse Group, Inc. *(a) | 70,136 | 189,367 |
| XL Fleet Corp. * | 69,465 | 54,877 |
| XPEL, Inc. * | 8,067 | 558,156 |
| 352,301,979 | ||
| SECURITY | NUMBER OF SHARES | VALUE ($) |
| Banks 4.4% | ||
| 1895 Bancorp of Wisconsin, Inc. * | 5,086 | 51,369 |
| 1st Source Corp. | 6,934 | 403,281 |
| ACNB Corp. | 3,576 | 130,846 |
| Affinity Bancshares, Inc. * | 3,276 | 47,535 |
| Amalgamated Financial Corp. | 7,518 | 172,839 |
| Amerant Bancorp, Inc. | 10,892 | 327,849 |
| American National Bankshares, Inc. | 4,310 | 157,617 |
| Ameris Bancorp | 26,942 | 1,387,782 |
| Ames National Corp. | 4,056 | 89,719 |
| Arrow Financial Corp. | 6,759 | 235,348 |
| Associated Banc-Corp. | 64,231 | 1,564,025 |
| Atlantic Union Bankshares Corp. | 30,666 | 1,059,204 |
| Axos Financial, Inc. * | 22,045 | 858,873 |
| Banc of California, Inc. | 23,171 | 386,492 |
| BancFirst Corp. | 6,997 | 670,453 |
| Bank First Corp. | 2,307 | 198,748 |
| Bank of America Corp. | 2,900,123 | 104,520,433 |
| Bank of Hawaii Corp. | 16,382 | 1,244,213 |
| Bank of Marin Bancorp | 5,400 | 194,940 |
| Bank of South Carolina Corp. | 3,436 | 56,728 |
| Bank OZK | 45,975 | 1,976,005 |
| Bank7 Corp. | 2,054 | 51,350 |
| BankFinancial Corp. | 6,650 | 64,838 |
| BankUnited, Inc. | 32,097 | 1,153,887 |
| Bankwell Financial Group, Inc. | 2,376 | 72,801 |
| Banner Corp. | 14,087 | 1,053,003 |
| Bar Harbor Bankshares | 5,508 | 165,295 |
| Baycom Corp. | 4,901 | 94,246 |
| Bayfirst Financial Corp. | 2,665 | 43,973 |
| BCB Bancorp, Inc. | 7,033 | 138,198 |
| Berkshire Hills Bancorp, Inc. | 19,410 | 567,742 |
| Blue Foundry Bancorp * | 12,834 | 157,987 |
| Blue Ridge Bankshares, Inc. | 5,502 | 71,801 |
| Bogota Financial Corp. * | 1,050 | 11,771 |
| BOK Financial Corp. | 12,146 | 1,338,368 |
| Bridgewater Bancshares, Inc. * | 8,542 | 163,323 |
| Broadway Financial Corp. * | 20,059 | 22,667 |
| Brookline Bancorp, Inc. | 34,765 | 478,019 |
| Business First Bancshares, Inc. | 9,475 | 234,790 |
| Byline Bancorp, Inc. | 10,054 | 232,448 |
| C&F Financial Corp. | 1,200 | 67,872 |
| Cadence Bank | 75,211 | 2,079,584 |
| California BanCorp * | 2,455 | 53,028 |
| Cambridge Bancorp | 2,859 | 251,163 |
| Camden National Corp. | 5,912 | 257,290 |
| Capital Bancorp, Inc. | 2,904 | 71,671 |
| Capital City Bank Group, Inc. | 5,558 | 196,864 |
| Capitol Federal Financial, Inc. | 53,473 | 437,409 |
| Capstar Financial Holdings, Inc. | 7,364 | 130,196 |
| Carter Bankshares, Inc. * | 9,825 | 175,867 |
| Cathay General Bancorp | 30,168 | 1,375,661 |
| CB Financial Services, Inc. | 2,090 | 44,684 |
| Central Pacific Financial Corp. | 11,311 | 232,102 |
| Central Valley Community Bancorp | 3,998 | 74,363 |
| CF Bankshares, Inc. | 896 | 19,891 |
| Chemung Financial Corp. | 948 | 40,347 |
| SECURITY | NUMBER OF SHARES | VALUE ($) |
| ChoiceOne Financial Services, Inc. | 2,484 | 54,946 |
| Citigroup, Inc. | 803,202 | 36,834,844 |
| Citizens & Northern Corp. | 5,947 | 141,420 |
| Citizens Community Bancorp Inc/WI | 3,309 | 41,859 |
| Citizens Financial Group, Inc. | 204,955 | 8,382,659 |
| Citizens Holdings Co. | 2,977 | 44,357 |
| City Holding Co. | 6,012 | 606,310 |
| Civista Bancshares, Inc. | 5,755 | 136,394 |
| CNB Financial Corp. | 6,920 | 175,906 |
| Coastal Financial Corp. * | 3,761 | 175,338 |
| Codorus Valley Bancorp, Inc. | 6,467 | 138,264 |
| Colony Bankcorp, Inc. | 7,200 | 99,360 |
| Columbia Banking System, Inc. | 32,189 | 1,077,366 |
| Columbia Financial, Inc. * | 14,396 | 295,694 |
| Comerica, Inc. | 54,539 | 3,844,999 |
| Commerce Bancshares, Inc. | 45,214 | 3,202,960 |
| Community Bank System, Inc. | 22,437 | 1,400,742 |
| Community Trust Bancorp, Inc. | 6,370 | 301,237 |
| Community West Bancshares | 3,580 | 51,051 |
| ConnectOne Bancorp, Inc. | 14,768 | 369,938 |
| CrossFirst Bankshares, Inc. * | 17,616 | 245,039 |
| Cullen/Frost Bankers, Inc. | 26,628 | 4,128,671 |
| Cullman Bancorp, Inc. | 4,552 | 49,571 |
| Customers Bancorp, Inc. * | 12,356 | 416,274 |
| CVB Financial Corp. | 54,047 | 1,552,230 |
| Dime Community Bancshares, Inc. | 13,235 | 457,005 |
| Eagle Bancorp Montana, Inc. | 2,563 | 47,774 |
| Eagle Bancorp, Inc. | 12,882 | 583,297 |
| East West Bancorp, Inc. | 58,472 | 4,184,841 |
| Eastern Bankshares, Inc. | 67,979 | 1,303,157 |
| ECB Bancorp, Inc. * | 4,412 | 69,886 |
| Emclaire Financial Corp. | 1,474 | 44,043 |
| Enact Holdings, Inc. | 11,655 | 298,834 |
| Enterprise Bancorp, Inc. | 4,403 | 137,726 |
| Enterprise Financial Services Corp. | 14,895 | 796,436 |
| Equity Bancshares, Inc., Class A | 6,351 | 226,858 |
| Esquire Financial Holdings, Inc. | 2,171 | 98,086 |
| ESSA Bancorp, Inc. | 3,176 | 63,520 |
| Essent Group Ltd. | 45,880 | 1,815,930 |
| Evans Bancorp, Inc. | 2,622 | 95,388 |
| F.N.B. Corp. | 143,905 | 2,079,427 |
| Farmers & Merchants Bancorp, Inc. | 4,577 | 133,923 |
| Farmers National Banc Corp. | 12,275 | 168,658 |
| FB Financial Corp. | 14,601 | 612,658 |
| Federal Agricultural Mortgage Corp., Class C | 4,048 | 466,330 |
| Fidelity D&D Bancorp, Inc. | 1,427 | 66,641 |
| Fifth Third Bancorp | 284,782 | 10,163,870 |
| Finance Of America Cos., Inc., Class A * | 18,960 | 30,526 |
| Financial Institutions, Inc. | 6,134 | 146,173 |
| Finward Bancorp | 1,806 | 57,341 |
| Finwise Bancorp * | 4,562 | 41,651 |
| First BanCorp | 76,777 | 1,212,309 |
| First Bancorp/Southern Pines NC | 14,330 | 638,688 |
| First Bank | 6,140 | 96,521 |
| First Busey Corp. | 21,193 | 559,707 |
| First Business Financial Services, Inc. | 2,369 | 90,377 |
| First Capital, Inc. | 1,074 | 26,324 |
| First Citizens BancShares, Inc., Class A | 5,460 | 4,488,775 |
| First Commonwealth Financial Corp. | 37,864 | 542,970 |
| First Community Bankshares, Inc. | 6,489 | 241,650 |
| First Community Corp. | 1,891 | 35,683 |
| First Financial Bancorp | 38,797 | 1,011,438 |
| First Financial Bankshares, Inc. | 53,266 | 2,050,208 |
| First Financial Corp. | 4,975 | 241,238 |
| First Financial Northwest, Inc. | 2,960 | 43,986 |
| SECURITY | NUMBER OF SHARES | VALUE ($) |
| First Foundation, Inc. | 20,411 | 325,760 |
| First Guaranty Bancshares, Inc. | 2,887 | 66,603 |
| First Hawaiian, Inc. | 52,019 | 1,330,646 |
| First Horizon Corp. | 222,347 | 5,449,725 |
| First Internet Bancorp | 3,435 | 88,245 |
| First Interstate BancSystem, Inc., Class A | 37,438 | 1,707,547 |
| First Merchants Corp. | 24,619 | 1,105,393 |
| First Mid Bancshares, Inc. | 7,599 | 272,120 |
| First National Corp/VA | 2,648 | 44,036 |
| First Northwest Bancorp | 3,416 | 51,616 |
| First Republic Bank | 75,926 | 9,118,713 |
| First Savings Financial Group, Inc. | 2,389 | 54,111 |
| First United Corp. | 2,849 | 54,046 |
| First Western Financial, Inc. * | 2,786 | 76,921 |
| Five Star Bancorp | 4,893 | 141,946 |
| Flagstar Bancorp, Inc. | 21,489 | 831,624 |
| Flushing Financial Corp. | 12,108 | 238,528 |
| FNCB Bancorp, Inc. | 8,643 | 65,687 |
| Franklin Financial Services Corp. | 1,992 | 64,760 |
| FS Bancorp, Inc. | 3,171 | 91,927 |
| Fulton Financial Corp. | 68,243 | 1,244,070 |
| FVCBankcorp, Inc. * | 3,533 | 71,791 |
| German American Bancorp, Inc. | 10,863 | 426,807 |
| Glacier Bancorp, Inc. | 45,472 | 2,604,636 |
| Great Southern Bancorp, Inc. | 4,013 | 248,726 |
| Greene County Bancorp, Inc. | 1,606 | 106,960 |
| Guaranty Bancshares, Inc. | 3,536 | 130,938 |
| Guild Holdings Co., Class A | 7,526 | 64,046 |
| Hancock Whitney Corp. | 35,128 | 1,962,601 |
| Hanmi Financial Corp. | 11,514 | 308,345 |
| HarborOne Bancorp, Inc. | 18,808 | 286,446 |
| Hawthorn Bancshares, Inc. | 1,986 | 45,549 |
| HBT Financial, Inc. | 4,303 | 87,738 |
| Heartland Financial USA, Inc. | 15,796 | 779,059 |
| Heritage Commerce Corp. | 26,186 | 374,460 |
| Heritage Financial Corp. | 16,019 | 539,680 |
| Hilltop Holdings, Inc. | 18,769 | 543,363 |
| HMN Financial, Inc. | 2,233 | 51,046 |
| Home Bancorp, Inc. | 3,387 | 144,794 |
| Home BancShares, Inc. | 79,073 | 2,015,571 |
| HomeStreet, Inc. | 6,840 | 177,566 |
| HomeTrust Bancshares, Inc. | 6,363 | 152,903 |
| Hope Bancorp, Inc. | 50,215 | 681,418 |
| Horizon Bancorp, Inc. | 16,744 | 249,653 |
| Huntington Bancshares, Inc. | 600,572 | 9,116,683 |
| IF Bancorp, Inc. | 2,488 | 46,476 |
| Independent Bank Corp. | 19,247 | 1,674,681 |
| Independent Bank Corp., Michigan | 9,444 | 218,440 |
| Independent Bank Group, Inc. | 14,400 | 908,496 |
| International Bancshares Corp. | 22,040 | 1,093,184 |
| Investar Holding Corp. | 3,333 | 71,793 |
| John Marshall Bancorp, Inc. | 4,443 | 127,958 |
| JPMorgan Chase & Co. | 1,216,596 | 153,145,104 |
| Kearny Financial Corp. | 26,602 | 269,744 |
| KeyCorp | 387,909 | 6,931,934 |
| Lakeland Bancorp, Inc. | 25,893 | 482,904 |
| Lakeland Financial Corp. | 10,277 | 849,394 |
| Landmark Bancorp, Inc. | 1,884 | 49,078 |
| LCNB Corp. | 4,732 | 83,331 |
| Limestone Bancorp, Inc. | 2,401 | 61,706 |
| Live Oak Bancshares, Inc. | 14,105 | 457,989 |
| loanDepot, Inc., Class A | 37,097 | 66,033 |
| Luther Burbank Corp. | 2,989 | 37,751 |
| M&T Bank Corp. | 72,804 | 12,258,009 |
| Macatawa Bank Corp. | 10,493 | 112,590 |
| Magyar Bancorp, Inc. | 3,877 | 48,307 |
| MainStreet Bancshares, Inc. | 3,000 | 83,340 |
| SECURITY | NUMBER OF SHARES | VALUE ($) |
| Malvern Bancorp, Inc. * | 3,772 | 54,883 |
| Mercantile Bank Corp. | 5,802 | 202,780 |
| Merchants Bancorp | 10,145 | 242,973 |
| Meridian Corp. | 1,923 | 59,209 |
| Metrocity Bankshares, Inc. | 7,678 | 170,835 |
| Metropolitan Bank Holding Corp. * | 4,799 | 316,734 |
| MGIC Investment Corp. | 126,784 | 1,730,602 |
| Mid Penn Bancorp, Inc. | 5,597 | 191,305 |
| Middlefield Banc Corp. | 1,808 | 52,432 |
| Midland States Bancorp, Inc. | 8,267 | 231,807 |
| MidWestOne Financial Group, Inc. | 5,792 | 194,611 |
| Mr Cooper Group, Inc. * | 30,004 | 1,184,858 |
| MVB Financial Corp. | 4,605 | 114,020 |
| National Bank Holdings Corp., Class A | 12,545 | 549,722 |
| National Bankshares, Inc. | 2,506 | 91,845 |
| NBT Bancorp, Inc. | 17,646 | 836,244 |
| New York Community Bancorp, Inc. (a) | 196,979 | 1,833,874 |
| Nicolet Bankshares, Inc. * | 4,999 | 381,374 |
| NMI Holdings, Inc., Class A * | 36,089 | 791,432 |
| Northeast Bank | 2,194 | 92,367 |
| Northeast Community Bancorp, Inc. | 7,802 | 102,674 |
| Northfield Bancorp, Inc. | 18,804 | 301,616 |
| Northrim BanCorp, Inc. | 2,596 | 126,503 |
| Northwest Bancshares, Inc. | 55,216 | 831,553 |
| Norwood Financial Corp. | 3,060 | 86,904 |
| Oak Valley Bancorp | 3,417 | 67,383 |
| OceanFirst Financial Corp. | 25,110 | 566,984 |
| Ocwen Financial Corp. * | 3,090 | 96,532 |
| OFG Bancorp | 18,949 | 528,298 |
| Ohio Valley Banc Corp. | 2,640 | 68,640 |
| Old National Bancorp | 122,564 | 2,397,352 |
| Old Point Financial Corp. | 887 | 23,284 |
| Old Second Bancorp, Inc. | 15,202 | 243,232 |
| OP Bancorp | 5,203 | 58,586 |
| Orange County Bancorp, Inc. | 2,281 | 101,117 |
| Origin Bancorp, Inc. | 12,052 | 498,109 |
| Orrstown Financial Services, Inc. | 4,595 | 121,630 |
| Pacific Premier Bancorp, Inc. | 38,895 | 1,416,167 |
| PacWest Bancorp | 49,961 | 1,242,030 |
| Park National Corp. | 5,896 | 869,660 |
| Parke Bancorp, Inc. | 4,518 | 97,408 |
| Partners Bancorp | 5,380 | 50,142 |
| Pathfinder Bancorp, Inc. | 2,303 | 42,859 |
| Pathward Financial, Inc. | 11,847 | 497,929 |
| PCB Bancorp | 6,102 | 112,887 |
| PCSB Financial Corp. | 6,385 | 124,444 |
| Peapack-Gladstone Financial Corp. | 6,657 | 263,417 |
| Penns Woods Bancorp, Inc. | 2,250 | 54,270 |
| PennyMac Financial Services, Inc. | 12,693 | 676,791 |
| Peoples Bancorp of North Carolina, Inc. | 1,896 | 53,372 |
| Peoples Bancorp, Inc. | 12,394 | 375,166 |
| Peoples Financial Services Corp. | 2,448 | 134,616 |
| Pinnacle Financial Partners, Inc. | 31,497 | 2,613,936 |
| Pioneer Bancorp, Inc. * | 2,061 | 21,249 |
| Plumas Bancorp | 2,267 | 75,038 |
| Ponce Financial Group, Inc. * | 10,983 | 101,483 |
| Popular, Inc. | 31,665 | 2,239,349 |
| Preferred Bank | 5,863 | 450,689 |
| Premier Financial Corp. | 14,638 | 422,306 |
| Primis Financial Corp. | 10,278 | 132,483 |
| Professional Holding Corp., Class A * | 5,436 | 147,153 |
| Prosperity Bancshares, Inc. | 37,937 | 2,715,151 |
| Provident Bancorp, Inc. | 6,035 | 74,593 |
| Provident Financial Holdings, Inc. | 3,562 | 48,621 |
| Provident Financial Services, Inc. | 30,378 | 681,075 |
| SECURITY | NUMBER OF SHARES | VALUE ($) |
| QCR Holdings, Inc. | 7,130 | 361,562 |
| Radian Group, Inc. | 66,032 | 1,378,088 |
| RBB Bancorp | 6,055 | 136,298 |
| Red River Bancshares, Inc. | 1,974 | 112,360 |
| Regions Financial Corp. | 386,839 | 8,491,116 |
| Renasant Corp. | 23,632 | 954,024 |
| Republic Bancorp, Inc., Class A | 3,781 | 175,249 |
| Republic First Bancorp, Inc. * | 17,184 | 48,631 |
| Richmond Mutual BanCorp., Inc. | 4,348 | 57,046 |
| Riverview Bancorp, Inc. | 11,437 | 77,085 |
| Rocket Cos., Inc., Class A (a) | 49,082 | 338,666 |
| S&T Bancorp, Inc. | 16,257 | 614,677 |
| Salisbury Bancorp, Inc. | 2,188 | 56,954 |
| Sandy Spring Bancorp, Inc. | 18,400 | 652,096 |
| SB Financial Group, Inc. | 3,301 | 55,292 |
| Seacoast Banking Corp. of Florida | 25,432 | 785,849 |
| Security National Financial Corp., Class A * | 6,714 | 41,963 |
| ServisFirst Bancshares, Inc. | 20,269 | 1,526,864 |
| Shore Bancshares, Inc. | 7,290 | 145,363 |
| Sierra Bancorp | 5,854 | 129,081 |
| Signature Bank | 25,950 | 4,113,853 |
| Silvergate Capital Corp., Class A * | 12,843 | 728,969 |
| Simmons First National Corp., Class A | 52,982 | 1,264,680 |
| SmartFinancial, Inc. | 6,197 | 181,200 |
| Sound Financial Bancorp, Inc. | 596 | 24,138 |
| South Plains Financial, Inc. | 5,663 | 177,082 |
| Southern First Bancshares, Inc. * | 2,967 | 132,566 |
| Southern Missouri Bancorp, Inc. | 3,254 | 166,768 |
| Southern States Bancshares, Inc. | 2,910 | 83,051 |
| Southside Bancshares, Inc. | 12,464 | 426,767 |
| SouthState Corp. | 31,437 | 2,842,848 |
| Stellar Bancorp, Inc. | 18,265 | 599,823 |
| Sterling Bancorp, Inc. * | 3,743 | 23,843 |
| Stock Yards Bancorp, Inc. | 12,183 | 952,589 |
| Summit Financial Group, Inc. | 3,433 | 99,797 |
| Summit State Bank | 3,172 | 46,977 |
| SVB Financial Group * | 24,631 | 5,688,776 |
| Synovus Financial Corp. | 60,161 | 2,397,416 |
| TC Bancshares, Inc. | 4,307 | 63,011 |
| Territorial Bancorp, Inc. | 4,386 | 90,571 |
| Texas Capital Bancshares, Inc. * | 20,746 | 1,244,760 |
| TFS Financial Corp. | 19,389 | 272,415 |
| The Bancorp, Inc. * | 23,768 | 655,521 |
| The Bank of Princeton | 1,590 | 50,403 |
| The Community Financial Corp. | 1,951 | 73,748 |
| The First BanCorp, Inc. | 3,588 | 109,649 |
| The First Bancshares, Inc. | 10,929 | 357,815 |
| The First of Long Island Corp. | 9,603 | 168,821 |
| The Hingham Institution For Savings | 533 | 131,784 |
| The PNC Financial Services Group, Inc. | 169,897 | 27,494,432 |
| Third Coast Bancshares, Inc. * | 6,287 | 121,968 |
| Timberland Bancorp, Inc. | 2,533 | 75,027 |
| Tompkins Financial Corp. | 4,799 | 397,549 |
| Towne Bank | 26,450 | 871,263 |
| TriCo Bancshares | 13,554 | 784,912 |
| Triumph Bancorp, Inc. * | 9,395 | 483,842 |
| Truist Financial Corp. | 549,878 | 24,629,036 |
| TrustCo Bank Corp. | 7,608 | 283,931 |
| Trustmark Corp. | 24,755 | 905,290 |
| U.S. Bancorp | 560,229 | 23,781,721 |
| UMB Financial Corp. | 18,114 | 1,507,447 |
| Umpqua Holdings Corp. | 88,846 | 1,766,258 |
| Union Bankshares, Inc. | 2,125 | 52,403 |
| United Bancorp, Inc. | 3,371 | 50,632 |
| United Bankshares, Inc. | 56,393 | 2,388,244 |
| SECURITY | NUMBER OF SHARES | VALUE ($) |
| United Community Banks, Inc. | 44,102 | 1,697,927 |
| United Security Bancshares | 6,461 | 44,710 |
| Unity Bancorp, Inc. | 2,383 | 68,297 |
| Univest Financial Corp. | 13,447 | 378,399 |
| USCB Financial Holdings, Inc. * | 5,422 | 72,817 |
| UWM Holdings Corp. (a) | 36,026 | 118,165 |
| Valley National Bancorp | 177,130 | 2,102,533 |
| Velocity Financial, Inc. * | 8,532 | 82,846 |
| Veritex Holdings, Inc. | 22,152 | 699,560 |
| Virginia National Bankshares Corp. | 1,424 | 46,992 |
| Walker & Dunlop, Inc. | 13,263 | 1,193,139 |
| Washington Federal, Inc. | 26,538 | 1,027,021 |
| Washington Trust Bancorp, Inc. | 7,375 | 357,687 |
| Waterstone Financial, Inc. | 8,861 | 150,460 |
| Webster Financial Corp. | 73,655 | 3,996,520 |
| Wells Fargo & Co. | 1,572,378 | 72,313,664 |
| WesBanco, Inc. | 25,094 | 1,014,801 |
| West Bancorp, Inc. | 6,294 | 141,426 |
| Westamerica Bancorp | 11,038 | 692,414 |
| Western Alliance Bancorp | 44,480 | 2,987,722 |
| Western New England Bancorp, Inc. | 10,349 | 90,554 |
| William Penn Bancorp, Inc. | 4,788 | 54,392 |
| Wintrust Financial Corp. | 25,034 | 2,343,683 |
| WSFS Financial Corp. | 26,399 | 1,229,137 |
| Zions Bancorp NA | 62,399 | 3,241,004 |
| 701,595,443 | ||
| Capital Goods 6.4% | ||
| 3D Systems Corp. * | 59,443 | 524,882 |
| 3M Co. | 229,964 | 28,927,172 |
| A.O. Smith Corp. | 53,267 | 2,917,966 |
| AAON, Inc. | 17,415 | 1,123,093 |
| AAR Corp. * | 13,484 | 597,611 |
| Acuity Brands, Inc. | 13,654 | 2,506,465 |
| Advanced Drainage Systems, Inc. | 26,601 | 3,082,524 |
| Advent Technologies Holdings, Inc. *(a) | 18,150 | 41,019 |
| AECOM | 57,945 | 4,362,100 |
| Aerojet Rocketdyne Holdings, Inc. * | 32,114 | 1,555,923 |
| AeroVironment, Inc. * | 10,567 | 966,880 |
| AerSale Corp. * | 7,373 | 156,308 |
| AGCO Corp. | 25,551 | 3,172,668 |
| AgEagle Aerial Systems, Inc. * | 34,491 | 18,318 |
| Air Lease Corp. | 42,321 | 1,493,508 |
| Alamo Group, Inc. | 4,314 | 656,073 |
| Albany International Corp., Class A | 12,832 | 1,175,668 |
| Allegion plc | 36,500 | 3,824,105 |
| Allied Motion Technologies, Inc. | 5,231 | 176,912 |
| Allison Transmission Holdings, Inc. | 39,446 | 1,666,593 |
| Alpha Pro Tech Ltd. * | 5,970 | 24,716 |
| Alta Equipment Group, Inc. | 12,019 | 146,992 |
| Altra Industrial Motion Corp. | 26,548 | 1,596,597 |
| Ameresco, Inc., Class A * | 13,944 | 843,333 |
| American Superconductor Corp. * | 9,332 | 42,181 |
| American Woodmark Corp. * | 7,275 | 329,921 |
| AMETEK, Inc. | 95,226 | 12,347,003 |
| API Group Corp. * | 82,246 | 1,356,237 |
| Apogee Enterprises, Inc. | 8,715 | 399,844 |
| Applied Industrial Technologies, Inc. | 15,780 | 1,962,716 |
| Archer Aviation, Inc., Class A * | 53,649 | 152,900 |
| Arcosa, Inc. | 19,870 | 1,275,654 |
| Argan, Inc. | 6,506 | 225,563 |
| Armstrong World Industries, Inc. | 18,985 | 1,434,696 |
| Array Technologies, Inc. * | 57,509 | 1,040,913 |
| Astec Industries, Inc. | 9,069 | 395,862 |
| Astronics Corp. * | 9,549 | 88,424 |
| Atkore, Inc. * | 17,280 | 1,646,784 |
| SECURITY | NUMBER OF SHARES | VALUE ($) |
| Axon Enterprise, Inc. * | 28,195 | 4,100,681 |
| AZZ, Inc. | 10,234 | 411,407 |
| Babcock & Wilcox Enterprises, Inc. * | 30,009 | 136,841 |
| Barnes Group, Inc. | 20,674 | 731,239 |
| Beacon Roofing Supply, Inc. * | 20,723 | 1,167,741 |
| Beam Global *(a) | 3,328 | 41,766 |
| Berkshire Grey, Inc. * | 16,368 | 21,933 |
| BitNile Holdings, Inc. * | 163,474 | 27,872 |
| Blink Charging Co. *(a) | 16,166 | 239,257 |
| Bloom Energy Corp., Class A * | 72,039 | 1,347,850 |
| Blue Bird Corp. * | 5,055 | 46,354 |
| BlueLinx Holdings, Inc. * | 3,850 | 271,271 |
| Boise Cascade Co. | 16,397 | 1,094,828 |
| Bowman Consulting Group Ltd. * | 3,474 | 53,673 |
| Broadwind, Inc. * | 16,291 | 28,672 |
| Builders FirstSource, Inc. * | 64,441 | 3,973,432 |
| BWX Technologies, Inc. | 37,907 | 2,159,941 |
| Byrna Technologies, Inc. * | 5,967 | 42,187 |
| Cadre Holdings, Inc. | 6,467 | 189,936 |
| Carlisle Cos., Inc. | 21,414 | 5,113,663 |
| Carrier Global Corp. | 348,744 | 13,866,061 |
| Caterpillar, Inc. | 219,010 | 47,406,905 |
| ChargePoint Holdings, Inc. *(a) | 106,767 | 1,492,603 |
| Chart Industries, Inc. * | 14,865 | 3,313,111 |
| CIRCOR International, Inc. * | 7,526 | 155,562 |
| Columbus McKinnon Corp. | 11,251 | 320,879 |
| Comfort Systems USA, Inc. | 14,527 | 1,790,889 |
| Commercial Vehicle Group, Inc. * | 13,417 | 67,622 |
| Concrete Pumping Holdings, Inc. * | 13,877 | 88,882 |
| Construction Partners, Inc., Class A * | 17,169 | 534,643 |
| Core & Main, Inc., Class A * | 29,780 | 702,212 |
| Crane Holdings Co. | 19,757 | 1,982,417 |
| CSW Industrials, Inc. | 6,445 | 830,889 |
| Cummins, Inc. | 58,414 | 14,282,807 |
| Curtiss-Wright Corp. | 15,856 | 2,661,112 |
| Custom Truck One Source, Inc. * | 22,116 | 153,264 |
| Deere & Co. | 115,369 | 45,665,358 |
| Desktop Metal, Inc., Class A *(a) | 101,606 | 257,063 |
| Distribution Solutions Group, Inc. * | 2,320 | 69,786 |
| Donaldson Co., Inc. | 51,364 | 2,950,862 |
| Douglas Dynamics, Inc. | 8,714 | 295,840 |
| Dover Corp. | 59,700 | 7,802,193 |
| Ducommun, Inc. * | 4,035 | 190,492 |
| DXP Enterprises, Inc. * | 6,811 | 194,863 |
| Dycom Industries, Inc. * | 12,249 | 1,447,587 |
| Eaton Corp. plc | 165,239 | 24,797,417 |
| EMCOR Group, Inc. | 20,561 | 2,901,157 |
| Emerson Electric Co. | 245,236 | 21,237,438 |
| Encore Wire Corp. | 8,052 | 1,107,875 |
| Energous Corp. * | 53,756 | 66,120 |
| Energy Recovery, Inc. * | 23,239 | 597,939 |
| Energy Vault Holdings, Inc. *(a) | 23,890 | 76,926 |
| Enerpac Tool Group Corp. | 25,007 | 635,428 |
| EnerSys | 16,708 | 1,107,573 |
| Enovix Corp. * | 45,893 | 866,001 |
| EnPro Industries, Inc. | 8,337 | 887,891 |
| Eos Energy Enterprises, Inc. * | 26,736 | 41,441 |
| Esab Corp. | 19,291 | 719,554 |
| ESCO Technologies, Inc. | 10,618 | 914,953 |
| ESS Tech, Inc. *(a) | 28,078 | 118,770 |
| EVI Industries, Inc. * | 2,765 | 53,918 |
| Evoqua Water Technologies Corp. * | 49,929 | 1,956,218 |
| Fastenal Co. | 237,893 | 11,497,369 |
| Federal Signal Corp. | 25,198 | 1,175,487 |
| Flowserve Corp. | 54,166 | 1,553,481 |
| Fluence Energy, Inc. *(a) | 15,762 | 235,327 |
| Fluor Corp. * | 59,154 | 1,790,000 |
| Fortive Corp. | 147,498 | 9,425,122 |
| SECURITY | NUMBER OF SHARES | VALUE ($) |
| Fortune Brands Home & Security, Inc. | 54,311 | 3,276,040 |
| Franklin Electric Co., Inc. | 15,771 | 1,292,276 |
| FTC Solar, Inc. * | 19,667 | 40,711 |
| FuelCell Energy, Inc. * | 162,139 | 505,874 |
| Gates Industrial Corp. plc * | 43,540 | 485,471 |
| GATX Corp. | 15,005 | 1,571,174 |
| Gencor Industries, Inc. * | 5,594 | 53,143 |
| Generac Holdings, Inc. * | 26,566 | 3,079,265 |
| General Dynamics Corp. | 93,288 | 23,303,342 |
| General Electric Co. | 455,463 | 35,439,576 |
| Gibraltar Industries, Inc. * | 13,337 | 681,254 |
| Global Industrial Co. | 6,016 | 190,948 |
| GMS, Inc. * | 17,591 | 830,295 |
| Graco, Inc. | 69,925 | 4,865,381 |
| GrafTech International Ltd. | 82,134 | 418,062 |
| Graham Corp. | 6,306 | 56,123 |
| Granite Construction, Inc. | 18,734 | 631,898 |
| Great Lakes Dredge & Dock Corp. * | 25,323 | 191,442 |
| Griffon Corp. | 19,452 | 625,187 |
| H&E Equipment Services, Inc. | 13,285 | 501,642 |
| Hayward Holdings, Inc. * | 42,995 | 397,704 |
| HEICO Corp. | 16,822 | 2,735,930 |
| HEICO Corp., Class A | 28,413 | 3,616,975 |
| Heliogen, Inc. * | 38,222 | 68,800 |
| Helios Technologies, Inc. | 14,143 | 801,767 |
| Herc Holdings, Inc. | 10,699 | 1,258,309 |
| Hexcel Corp. | 35,190 | 1,960,083 |
| Hillenbrand, Inc. | 29,023 | 1,282,236 |
| Hillman Solutions Corp. * | 51,861 | 405,034 |
| Honeywell International, Inc. | 279,420 | 57,007,268 |
| Howmet Aerospace, Inc. | 152,823 | 5,432,858 |
| Hubbell, Inc. | 22,282 | 5,291,529 |
| Hudson Technologies, Inc. * | 13,002 | 119,748 |
| Huntington Ingalls Industries, Inc. | 16,666 | 4,284,329 |
| Hurco Cos., Inc. | 3,214 | 74,404 |
| Hyliion Holdings Corp. *(a) | 59,911 | 170,746 |
| Hyster-Yale Materials Handling, Inc. | 5,176 | 150,932 |
| Hyzon Motors, Inc. *(a) | 34,280 | 65,475 |
| Ideal Power, Inc. * | 3,471 | 40,298 |
| IDEX Corp. | 31,222 | 6,940,963 |
| IES Holdings, Inc. * | 3,807 | 125,783 |
| Illinois Tool Works, Inc. | 116,632 | 24,904,431 |
| Ingersoll Rand, Inc. | 166,831 | 8,424,965 |
| INNOVATE Corp. * | 23,119 | 17,057 |
| Innovative Solutions and Support, Inc. * | 6,865 | 65,218 |
| Insteel Industries, Inc. | 7,815 | 205,925 |
| iSun, Inc. * | 7,289 | 15,744 |
| ITT, Inc. | 34,184 | 2,611,316 |
| Janus International Group, Inc. * | 33,335 | 321,016 |
| JELD-WEN Holding, Inc. * | 37,821 | 401,281 |
| John Bean Technologies Corp. | 13,192 | 1,203,110 |
| Johnson Controls International plc | 285,816 | 16,531,597 |
| Kadant, Inc. | 4,726 | 840,992 |
| Kaman Corp. | 10,950 | 351,495 |
| Karat Packaging, Inc. * | 3,014 | 49,369 |
| Kennametal, Inc. | 33,677 | 899,513 |
| Kratos Defense & Security Solutions, Inc. * | 51,756 | 573,456 |
| KULR Technology Group, Inc. * | 32,998 | 67,646 |
| L.B. Foster Co., Class A * | 5,290 | 52,900 |
| L3Harris Technologies, Inc. | 79,513 | 19,597,569 |
| Lennox International, Inc. | 13,263 | 3,097,839 |
| Lightning eMotors, Inc. * | 12,049 | 18,555 |
| Limbach Holdings, Inc. * | 5,228 | 43,497 |
| Lincoln Electric Holdings, Inc. | 24,028 | 3,411,976 |
| Lindsay Corp. | 4,639 | 785,383 |
| Lockheed Martin Corp. | 97,813 | 47,603,631 |
| SECURITY | NUMBER OF SHARES | VALUE ($) |
| LSI Industries, Inc. | 8,731 | 67,054 |
| Luxfer Holdings plc | 12,212 | 176,708 |
| Manitex International, Inc. * | 9,465 | 43,160 |
| Markforged Holding Corp. * | 47,003 | 102,467 |
| Masco Corp. | 93,385 | 4,320,924 |
| Masonite International Corp. * | 9,341 | 668,162 |
| MasTec, Inc. * | 24,310 | 1,873,815 |
| Matrix Service Co. * | 10,847 | 53,150 |
| Maxar Technologies, Inc. | 31,403 | 701,543 |
| Mayville Engineering Co., Inc. * | 3,327 | 22,125 |
| McGrath RentCorp | 9,861 | 927,427 |
| MDU Resources Group, Inc. | 84,810 | 2,415,389 |
| Mercury Systems, Inc. * | 23,829 | 1,153,324 |
| Microvast Holdings, Inc. * | 78,617 | 192,612 |
| Miller Industries, Inc. | 5,104 | 129,795 |
| Moog, Inc., Class A | 11,760 | 996,660 |
| MRC Global, Inc. * | 35,400 | 355,062 |
| MSC Industrial Direct Co., Inc., Class A | 19,657 | 1,631,138 |
| Mueller Industries, Inc. | 23,532 | 1,474,044 |
| Mueller Water Products, Inc., Class A | 66,450 | 777,465 |
| MYR Group, Inc. * | 6,883 | 602,331 |
| National Presto Industries, Inc. | 2,215 | 156,135 |
| NeoVolta, Inc. * | 12,964 | 48,874 |
| Nikola Corp. *(a) | 137,436 | 520,882 |
| Nordson Corp. | 22,448 | 5,050,800 |
| Northrop Grumman Corp. | 60,315 | 33,113,538 |
| Northwest Pipe Co. * | 4,286 | 145,681 |
| NOW, Inc. * | 46,130 | 587,235 |
| NuScale Power Corp. *(a) | 7,866 | 88,728 |
| Nuvve Holding Corp. * | 5,571 | 5,682 |
| NV5 Global, Inc. * | 5,195 | 753,015 |
| nVent Electric plc | 68,891 | 2,514,521 |
| Ocean Power Technologies, Inc. * | 48,625 | 35,496 |
| Omega Flex, Inc. | 1,422 | 134,237 |
| Orion Energy Systems, Inc. * | 16,987 | 28,878 |
| Orion Group Holdings, Inc. * | 16,674 | 38,017 |
| Oshkosh Corp. | 26,910 | 2,368,080 |
| Otis Worldwide Corp. | 174,087 | 12,297,506 |
| Owens Corning | 39,875 | 3,413,699 |
| PACCAR, Inc. | 144,118 | 13,954,946 |
| Park Aerospace Corp. | 8,310 | 103,376 |
| Parker-Hannifin Corp. | 53,225 | 15,468,249 |
| Park-Ohio Holdings Corp. | 3,931 | 44,695 |
| Parsons Corp. * | 13,686 | 641,600 |
| Pentair plc | 68,135 | 2,926,398 |
| Perma-Pipe International Holdings, Inc. * | 3,363 | 32,890 |
| PGT Innovations, Inc. * | 25,562 | 544,726 |
| Plug Power, Inc. * | 217,339 | 3,473,077 |
| Powell Industries, Inc. | 4,706 | 116,097 |
| Preformed Line Products Co. | 1,010 | 80,164 |
| Primoris Services Corp. | 21,965 | 443,473 |
| Proterra, Inc. * | 83,106 | 518,581 |
| Proto Labs, Inc. * | 11,556 | 441,324 |
| Quanex Building Products Corp. | 13,404 | 297,033 |
| Quanta Services, Inc. | 59,387 | 8,435,329 |
| Raytheon Technologies Corp. | 611,921 | 58,022,349 |
| RBC Bearings, Inc. * | 12,100 | 3,067,713 |
| Redwire Corp. * | 10,290 | 28,195 |
| Regal Rexnord Corp. | 27,506 | 3,480,609 |
| Resideo Technologies, Inc. * | 60,154 | 1,420,837 |
| REV Group, Inc. | 13,601 | 186,878 |
| Rocket Lab USA, Inc. * | 90,768 | 462,009 |
| Rockwell Automation, Inc. | 47,945 | 12,240,358 |
| Rush Enterprises, Inc., Class A | 17,689 | 882,504 |
| Rush Enterprises, Inc., Class B | 3,737 | 200,378 |
| SECURITY | NUMBER OF SHARES | VALUE ($) |
| Sarcos Technology and Robotics Corp. *(a) | 36,550 | 73,831 |
| Sensata Technologies Holding plc | 63,593 | 2,557,075 |
| SES AI Corp. *(a) | 59,899 | 359,993 |
| Shoals Technologies Group, Inc., Class A * | 43,531 | 1,006,001 |
| Simpson Manufacturing Co., Inc. | 17,866 | 1,527,186 |
| SiteOne Landscape Supply, Inc. * | 18,549 | 2,149,273 |
| SKYX Platforms Corp. * | 16,813 | 56,828 |
| Snap-on, Inc. | 22,000 | 4,885,100 |
| Spirit AeroSystems Holdings, Inc., Class A | 43,131 | 998,914 |
| SPX Technologies, Inc. * | 18,681 | 1,229,957 |
| Standex International Corp. | 4,978 | 493,071 |
| Stanley Black & Decker, Inc. | 61,653 | 4,839,144 |
| Stem, Inc. * | 59,957 | 815,415 |
| Sterling Infrastructure, Inc. * | 13,724 | 370,411 |
| SunPower Corp. * | 35,778 | 661,535 |
| Sunrun, Inc. * | 87,614 | 1,972,191 |
| Sunworks, Inc. * | 17,256 | 38,999 |
| Symbotic, Inc. *(a) | 4,338 | 53,531 |
| Tecnoglass, Inc. | 7,303 | 149,931 |
| Tennant Co. | 7,658 | 446,079 |
| Terex Corp. | 28,047 | 1,137,025 |
| Terran Orbital Corp. *(a) | 23,493 | 61,552 |
| Textron, Inc. | 87,466 | 5,986,173 |
| The AZEK Co., Inc. * | 45,856 | 802,939 |
| The Boeing Co. * | 231,741 | 33,025,410 |
| The Eastern Co. | 3,338 | 69,798 |
| The Gorman-Rupp Co. | 9,748 | 264,561 |
| The Greenbrier Cos., Inc. | 13,430 | 474,213 |
| The LS Starrett Co., Class A * | 2,865 | 24,438 |
| The Manitowoc Co., Inc. * | 15,925 | 145,236 |
| The Middleby Corp. * | 22,373 | 3,129,088 |
| The Shyft Group, Inc. | 13,268 | 304,899 |
| The Timken Co. | 27,449 | 1,956,839 |
| The Toro Co. | 43,256 | 4,560,480 |
| Thermon Group Holdings, Inc. * | 14,491 | 257,360 |
| Titan International, Inc. * | 20,997 | 314,115 |
| Titan Machinery, Inc. * | 7,620 | 261,976 |
| TPI Composites, Inc. * | 16,645 | 165,784 |
| Trane Technologies plc | 95,892 | 15,307,240 |
| Transcat, Inc. * | 2,965 | 245,383 |
| TransDigm Group, Inc. | 21,422 | 12,333,931 |
| Trex Co., Inc. * | 46,047 | 2,214,400 |
| Trinity Industries, Inc. | 34,521 | 984,884 |
| Triton International Ltd. | 26,045 | 1,580,671 |
| Triumph Group, Inc. * | 27,104 | 245,291 |
| Tutor Perini Corp. * | 16,006 | 118,765 |
| Twin Disc, Inc. * | 5,599 | 72,843 |
| UFP Industries, Inc. | 25,174 | 1,793,144 |
| Ultralife Corp. * | 6,691 | 33,120 |
| United Rentals, Inc. * | 29,052 | 9,172,007 |
| Univar Solutions, Inc. * | 70,027 | 1,784,288 |
| Urban-Gro, Inc. * | 4,382 | 17,791 |
| V2X, Inc. * | 4,770 | 195,522 |
| Valmont Industries, Inc. | 8,827 | 2,817,755 |
| Velo3D, Inc. * | 23,266 | 91,668 |
| Veritiv Corp. * | 6,089 | 707,907 |
| Vertiv Holdings Co. | 125,128 | 1,790,582 |
| Vicor Corp. * | 9,399 | 448,990 |
| View, Inc. *(a) | 23,483 | 31,702 |
| Virgin Galactic Holdings, Inc. *(a) | 96,719 | 446,842 |
| VirTra, Inc. * | 8,132 | 42,286 |
| W.W. Grainger, Inc. | 18,811 | 10,992,208 |
| Wabash National Corp. | 19,725 | 427,046 |
| Watsco, Inc. | 13,730 | 3,720,281 |
| SECURITY | NUMBER OF SHARES | VALUE ($) |
| Watts Water Technologies, Inc., Class A | 11,465 | 1,678,017 |
| WESCO International, Inc. * | 18,376 | 2,531,662 |
| Westinghouse Air Brake Technologies Corp. | 75,242 | 7,018,574 |
| Westwater Resources, Inc. * | 34,475 | 38,957 |
| Willis Lease Finance Corp. * | 625 | 23,813 |
| WillScot Mobile Mini Holdings Corp. * | 88,763 | 3,775,090 |
| Woodward, Inc. | 25,403 | 2,329,455 |
| Xos, Inc. * | 22,000 | 24,860 |
| Xylem, Inc. | 74,771 | 7,658,794 |
| Zurn Water Solutions Corp. | 60,218 | 1,414,521 |
| 1,019,345,519 | ||
| Commercial & Professional Services 1.2% | ||
| ABM Industries, Inc. | 27,133 | 1,207,690 |
| ACCO Brands Corp. | 38,516 | 177,174 |
| Acme United Corp. | 1,454 | 34,765 |
| ACV Auctions, Inc., Class A * | 45,433 | 414,349 |
| Alight, Inc., Class A * | 112,914 | 936,057 |
| Aqua Metals, Inc. * | 23,651 | 19,753 |
| ARC Document Solutions, Inc. | 19,042 | 46,082 |
| Aris Water Solution, Inc., Class A | 11,072 | 188,556 |
| ASGN, Inc. * | 20,796 | 1,763,085 |
| Atlas Technical Consultants, Inc. * | 15,557 | 117,922 |
| Aurora Innovation, Inc. * | 153,867 | 316,966 |
| Barrett Business Services, Inc. | 3,084 | 268,986 |
| BGSF, Inc. | 5,301 | 66,634 |
| BlackSky Technology, Inc. * | 21,423 | 34,491 |
| Booz Allen Hamilton Holding Corp. | 54,733 | 5,957,687 |
| Brady Corp., Class A | 19,596 | 896,517 |
| BrightView Holdings, Inc. * | 13,694 | 122,150 |
| CACI International, Inc., Class A * | 9,745 | 2,962,772 |
| Casella Waste Systems, Inc., Class A * | 20,731 | 1,696,003 |
| CBIZ, Inc. * | 21,051 | 1,044,972 |
| CECO Environmental Corp. * | 14,190 | 167,726 |
| Cimpress plc * | 8,208 | 191,082 |
| Cintas Corp. | 35,614 | 15,226,766 |
| Clarivate plc * | 177,552 | 1,834,112 |
| Clean Harbors, Inc. * | 20,712 | 2,536,391 |
| Copart, Inc. * | 88,331 | 10,159,832 |
| CoreCivic, Inc. * | 49,662 | 519,961 |
| CoStar Group, Inc. * | 164,366 | 13,596,355 |
| CRA International, Inc. | 2,770 | 284,590 |
| Deluxe Corp. | 16,881 | 310,273 |
| DLH Holdings Corp. * | 3,968 | 51,663 |
| Driven Brands Holdings, Inc. * | 22,131 | 707,749 |
| Dun & Bradstreet Holdings, Inc. | 89,669 | 1,152,247 |
| Ennis, Inc. | 10,401 | 234,647 |
| Equifax, Inc. | 50,796 | 8,611,954 |
| Exponent, Inc. | 20,864 | 1,987,505 |
| First Advantage Corp. * | 24,470 | 343,803 |
| FiscalNote Holdings, Inc. * | 31,549 | 156,798 |
| Forrester Research, Inc. * | 4,414 | 186,800 |
| Franklin Covey Co. * | 4,552 | 230,331 |
| FTI Consulting, Inc. * | 14,419 | 2,244,029 |
| GEE Group, Inc. * | 66,522 | 41,922 |
| Harsco Corp. * | 34,248 | 181,172 |
| Healthcare Services Group, Inc. | 30,803 | 430,010 |
| Heidrick & Struggles International, Inc. | 9,032 | 254,341 |
| Heritage-Crystal Clean, Inc. * | 7,053 | 193,746 |
| Hill International, Inc. * | 27,687 | 93,305 |
| HireQuest, Inc. | 3,059 | 47,782 |
| HireRight Holdings Corp. * | 8,556 | 115,164 |
| HNI Corp. | 16,275 | 471,812 |
| Hudson Global, Inc. * | 1,522 | 51,748 |
| SECURITY | NUMBER OF SHARES | VALUE ($) |
| Huron Consulting Group, Inc. * | 8,754 | 644,557 |
| IAA, Inc. * | 55,868 | 2,119,073 |
| ICF International, Inc. | 6,901 | 825,567 |
| Insperity, Inc. | 14,863 | 1,754,131 |
| Interface, Inc. | 23,118 | 261,465 |
| Jacobs Solutions, Inc. | 52,648 | 6,066,103 |
| KAR Auction Services, Inc. * | 49,738 | 722,693 |
| KBR, Inc. | 57,784 | 2,875,910 |
| Kelly Services, Inc., Class A | 14,539 | 237,567 |
| Kforce, Inc. | 8,111 | 513,183 |
| Kimball International, Inc., Class B | 17,567 | 129,820 |
| Knightscope, Inc., Class A * | 18,211 | 61,189 |
| Korn Ferry | 22,978 | 1,277,347 |
| LegalZoom.com, Inc. * | 41,173 | 380,850 |
| Leidos Holdings, Inc. | 56,466 | 5,736,381 |
| ManpowerGroup, Inc. | 21,509 | 1,685,015 |
| Mastech Digital, Inc. * | 3,073 | 46,433 |
| Matthews International Corp., Class A | 12,972 | 348,687 |
| MillerKnoll, Inc. | 30,369 | 643,215 |
| Mistras Group, Inc. * | 7,028 | 32,329 |
| Montrose Environmental Group, Inc. * | 10,915 | 477,859 |
| MSA Safety, Inc. | 15,059 | 2,021,520 |
| NL Industries, Inc. | 5,834 | 51,106 |
| Odyssey Marine Exploration, Inc. * | 9,740 | 29,707 |
| Performant Financial Corp. * | 24,843 | 57,636 |
| Perma-Fix Environmental Services, Inc. * | 10,441 | 43,435 |
| Pitney Bowes, Inc. | 64,043 | 199,174 |
| Planet Labs PBC * | 77,306 | 405,856 |
| Quad Graphics, Inc. * | 18,674 | 51,914 |
| Quest Resource Holding Corp. * | 7,972 | 70,632 |
| RCM Technologies, Inc. * | 3,160 | 55,300 |
| Red Violet, Inc. * | 5,306 | 92,537 |
| Republic Services, Inc. | 85,070 | 11,281,983 |
| Resources Connection, Inc. | 13,566 | 247,851 |
| Robert Half International, Inc. | 45,301 | 3,463,714 |
| Rollins, Inc. | 96,157 | 4,046,287 |
| Science Applications International Corp. | 23,168 | 2,510,021 |
| Skillsoft Corp. * | 35,359 | 63,293 |
| SP Plus Corp. * | 10,202 | 377,780 |
| Spire Global, Inc. *(a) | 38,120 | 54,893 |
| Steelcase, Inc., Class A | 36,886 | 286,604 |
| Stericycle, Inc. * | 37,932 | 1,691,009 |
| Sterling Check Corp. * | 9,867 | 192,702 |
| Team, Inc. * | 22,840 | 15,874 |
| Tetra Tech, Inc. | 22,221 | 3,139,383 |
| The Brink's Co. | 19,918 | 1,187,710 |
| The GEO Group, Inc. * | 52,634 | 445,284 |
| TransUnion | 79,646 | 4,720,618 |
| TriNet Group, Inc. * | 14,865 | 965,928 |
| TrueBlue, Inc. * | 14,017 | 275,574 |
| UniFirst Corp. | 6,161 | 1,133,686 |
| Upwork, Inc. * | 50,122 | 674,141 |
| Verisk Analytics, Inc. | 64,888 | 11,863,473 |
| Viad Corp. * | 8,115 | 302,527 |
| VSE Corp. | 3,733 | 172,801 |
| Waste Management, Inc. | 155,732 | 24,663,277 |
| Willdan Group, Inc. * | 5,928 | 81,925 |
| 184,664,756 | ||
| Consumer Durables & Apparel 1.1% | ||
| Acushnet Holdings Corp. | 13,529 | 630,046 |
| Allbirds, Inc., Class A * | 39,597 | 136,214 |
| American Outdoor Brands, Inc. * | 6,310 | 56,285 |
| AMMO, Inc. *(a) | 41,078 | 133,503 |
| Aterian, Inc. *(a) | 25,581 | 28,139 |
| SECURITY | NUMBER OF SHARES | VALUE ($) |
| Bassett Furniture Industries, Inc. | 4,101 | 74,556 |
| Beazer Homes USA, Inc. * | 12,137 | 137,269 |
| Brunswick Corp. | 30,438 | 2,151,053 |
| Capri Holdings Ltd. * | 57,338 | 2,619,200 |
| Carter's, Inc. | 16,340 | 1,108,996 |
| Cavco Industries, Inc. * | 3,514 | 796,518 |
| Century Communities, Inc. | 11,888 | 529,135 |
| Clarus Corp. | 11,806 | 142,971 |
| Columbia Sportswear Co. | 14,813 | 1,103,568 |
| Cricut, Inc., Class A *(a) | 18,379 | 163,389 |
| Crocs, Inc. * | 25,300 | 1,789,975 |
| Culp, Inc. * | 8,788 | 44,116 |
| D.R. Horton, Inc. | 130,666 | 10,045,602 |
| Deckers Outdoor Corp. * | 11,036 | 3,861,827 |
| Delta Apparel, Inc. * | 1,907 | 28,815 |
| Dream Finders Homes, Inc., Class A * | 7,252 | 80,497 |
| Escalade, Inc. | 3,803 | 41,301 |
| Ethan Allen Interiors, Inc. | 9,223 | 236,017 |
| Flexsteel Industries, Inc. | 2,656 | 40,823 |
| Fossil Group, Inc. * | 19,967 | 84,860 |
| Garmin Ltd. | 64,119 | 5,645,037 |
| G-III Apparel Group Ltd. * | 17,626 | 343,707 |
| GoPro, Inc., Class A * | 54,737 | 298,317 |
| Green Brick Partners, Inc. * | 10,978 | 253,921 |
| Hamilton Beach Brands Holding Co., Class A | 4,511 | 53,140 |
| Hanesbrands, Inc. | 148,070 | 1,009,837 |
| Hasbro, Inc. | 53,626 | 3,499,096 |
| Helen of Troy Ltd. * | 10,307 | 975,248 |
| Hooker Furnishings Corp. | 5,571 | 84,122 |
| Hovnanian Enterprises, Inc., Class A * | 2,021 | 81,507 |
| Installed Building Products, Inc. | 9,861 | 848,046 |
| iRobot Corp. * | 11,608 | 655,852 |
| JAKKS Pacific, Inc. * | 3,907 | 70,873 |
| Johnson Outdoors, Inc., Class A | 2,060 | 108,397 |
| KB Home | 35,481 | 1,022,562 |
| Kontoor Brands, Inc. | 20,392 | 727,994 |
| Lakeland Industries, Inc. * | 3,608 | 42,683 |
| Landsea Homes Corp. * | 6,542 | 31,794 |
| Latham Group, Inc. * | 20,641 | 91,233 |
| La-Z-Boy, Inc. | 16,981 | 420,619 |
| Legacy Housing Corp. * | 2,853 | 52,952 |
| Leggett & Platt, Inc. | 54,279 | 1,831,916 |
| Lennar Corp., Class A | 110,430 | 8,911,701 |
| Levi Strauss & Co., Class A | 40,543 | 606,523 |
| LGI Homes, Inc. * | 8,271 | 761,346 |
| Lifetime Brands, Inc. | 5,690 | 48,735 |
| Live Ventures, Inc. * | 537 | 12,942 |
| Lululemon Athletica, Inc. * | 48,219 | 15,865,980 |
| M.D.C. Holdings, Inc. | 23,964 | 729,943 |
| M/I Homes, Inc. * | 11,544 | 478,961 |
| Malibu Boats, Inc., Class A * | 8,904 | 471,022 |
| Marine Products Corp. | 5,165 | 51,650 |
| MasterCraft Boat Holdings, Inc. * | 6,845 | 148,947 |
| Mattel, Inc. * | 146,022 | 2,768,577 |
| Meritage Homes Corp. * | 14,848 | 1,130,824 |
| Mohawk Industries, Inc. * | 22,184 | 2,101,934 |
| Movado Group, Inc. | 6,936 | 229,373 |
| Nautilus, Inc. * | 11,457 | 19,019 |
| Newell Brands, Inc. | 155,134 | 2,142,401 |
| NIKE, Inc., Class B | 524,204 | 48,583,227 |
| NVR, Inc. * | 1,277 | 5,411,607 |
| Oxford Industries, Inc. | 6,214 | 632,150 |
| Peloton Interactive, Inc., Class A * | 125,763 | 1,056,409 |
| PLBY Group, Inc. *(a) | 20,435 | 73,975 |
| Polaris, Inc. | 23,502 | 2,387,803 |
| PulteGroup, Inc. | 95,447 | 3,816,925 |
| Purple Innovation, Inc. * | 16,803 | 59,147 |
| SECURITY | NUMBER OF SHARES | VALUE ($) |
| PVH Corp. | 27,331 | 1,402,627 |
| Ralph Lauren Corp. | 17,538 | 1,625,597 |
| Rocky Brands, Inc. | 2,880 | 56,693 |
| Skechers U.S.A., Inc., Class A * | 55,479 | 1,910,142 |
| Skyline Champion Corp. * | 21,373 | 1,244,122 |
| Smith & Wesson Brands, Inc. | 17,932 | 202,452 |
| Snap One Holdings Corp. * | 5,366 | 63,963 |
| Solo Brands, Inc., Class A * | 6,658 | 27,498 |
| Sonos, Inc. * | 51,400 | 828,568 |
| Steven Madden Ltd. | 30,371 | 907,182 |
| Sturm, Ruger & Co., Inc. | 7,246 | 406,718 |
| Superior Group of Cos., Inc. | 5,398 | 53,548 |
| Tapestry, Inc. | 104,651 | 3,315,344 |
| Taylor Morrison Home Corp. * | 46,041 | 1,212,720 |
| Tempur Sealy International, Inc. | 71,463 | 1,921,640 |
| The Lovesac Co. * | 6,938 | 168,871 |
| Toll Brothers, Inc. | 43,711 | 1,883,070 |
| TopBuild Corp. * | 13,395 | 2,279,025 |
| Topgolf Callaway Brands Corp. * | 57,175 | 1,070,316 |
| Traeger, Inc. * | 40,014 | 166,058 |
| Tri Pointe Homes, Inc. * | 40,729 | 682,211 |
| Tupperware Brands Corp. * | 18,352 | 141,861 |
| Under Armour, Inc., Class A * | 77,611 | 578,202 |
| Under Armour, Inc., Class C * | 81,326 | 533,499 |
| Unifi, Inc. * | 5,875 | 53,580 |
| Universal Electronics, Inc. * | 5,590 | 114,092 |
| Vera Bradley, Inc. * | 11,087 | 36,033 |
| VF Corp. | 137,584 | 3,886,748 |
| Vista Outdoor, Inc. * | 23,977 | 696,292 |
| Vizio Holding Corp., Class A * | 23,851 | 267,131 |
| VOXX International Corp. * | 5,522 | 51,078 |
| Vuzix Corp. *(a) | 26,677 | 133,385 |
| Weber, Inc., Class A (a) | 6,753 | 44,975 |
| Whirlpool Corp. | 22,522 | 3,113,441 |
| Wolverine World Wide, Inc. | 31,423 | 538,276 |
| YETI Holdings, Inc. * | 36,672 | 1,176,438 |
| 175,508,045 | ||
| Consumer Services 2.2% | ||
| 2U, Inc. * | 30,895 | 191,240 |
| Accel Entertainment, Inc. * | 23,774 | 233,461 |
| ADT, Inc. | 88,932 | 752,365 |
| Adtalem Global Education, Inc. * | 18,735 | 781,250 |
| Airbnb, Inc., Class A * | 165,775 | 17,723,005 |
| American Public Education, Inc. * | 7,053 | 90,349 |
| Aramark | 106,819 | 3,898,894 |
| Bally's Corp. *(a) | 11,844 | 266,964 |
| Biglari Holdings, Inc., Class B * | 514 | 70,906 |
| BJ's Restaurants, Inc. * | 10,764 | 353,597 |
| Bloomin' Brands, Inc. | 36,977 | 887,818 |
| Bluegreen Vacations Holding Corp. | 5,069 | 87,744 |
| Booking Holdings, Inc. * | 16,479 | 30,807,161 |
| Bowlero Corp. *(a) | 13,311 | 193,808 |
| Boyd Gaming Corp. | 33,791 | 1,951,768 |
| Bright Horizons Family Solutions, Inc. * | 24,488 | 1,599,556 |
| Brinker International, Inc. * | 17,379 | 580,285 |
| Caesars Entertainment, Inc. * | 88,306 | 3,861,621 |
| Canterbury Park Holding Corp. | 2,134 | 46,628 |
| Carnival Corp. * | 415,071 | 3,760,543 |
| Carriage Services, Inc. | 5,752 | 140,406 |
| Carrols Restaurant Group, Inc. * | 10,728 | 18,774 |
| Century Casinos, Inc. * | 13,792 | 109,646 |
| Chegg, Inc. * | 53,844 | 1,161,415 |
| Chipotle Mexican Grill, Inc. * | 11,516 | 17,254,768 |
| Choice Hotels International, Inc. | 11,898 | 1,544,836 |
| Churchill Downs, Inc. | 13,776 | 2,864,168 |
| SECURITY | NUMBER OF SHARES | VALUE ($) |
| Chuy's Holdings, Inc. * | 8,193 | 240,055 |
| Coursera, Inc. * | 35,520 | 457,853 |
| Cracker Barrel Old Country Store, Inc. | 9,479 | 1,082,691 |
| Darden Restaurants, Inc. | 50,770 | 7,267,218 |
| Dave & Buster's Entertainment, Inc. * | 17,690 | 704,947 |
| Denny's Corp. * | 21,907 | 248,206 |
| Dine Brands Global, Inc. | 6,555 | 472,550 |
| Domino’s Pizza, Inc. | 14,820 | 4,923,797 |
| DraftKings, Inc., Class A * | 185,083 | 2,924,311 |
| Drive Shack, Inc. * | 31,442 | 19,944 |
| Duolingo, Inc. * | 10,274 | 840,824 |
| Dutch Bros, Inc., Class A *(a) | 10,054 | 371,093 |
| El Pollo Loco Holdings, Inc. | 9,086 | 91,223 |
| European Wax Center, Inc., Class A | 10,756 | 154,671 |
| Everi Holdings, Inc. * | 38,486 | 730,464 |
| Expedia Group, Inc. * | 62,950 | 5,883,936 |
| F45 Training Holdings, Inc. * | 21,969 | 73,376 |
| Fiesta Restaurant Group, Inc. * | 9,485 | 65,731 |
| First Watch Restaurant Group, Inc. * | 4,397 | 74,969 |
| Frontdoor, Inc. * | 33,738 | 744,260 |
| Full House Resorts, Inc. * | 15,255 | 106,938 |
| Global Business Travel Group I * | 6,663 | 36,913 |
| Golden Entertainment, Inc. * | 9,398 | 396,784 |
| Graham Holdings Co., Class B | 1,610 | 1,004,431 |
| Grand Canyon Education, Inc. * | 13,228 | 1,331,134 |
| H&R Block, Inc. | 65,559 | 2,697,753 |
| Hall of Fame Resort & Entertainment Co. * | 68,131 | 37,234 |
| Hilton Grand Vacations, Inc. * | 33,286 | 1,306,143 |
| Hilton Worldwide Holdings, Inc. | 113,813 | 15,394,346 |
| Hyatt Hotels Corp., Class A * | 21,180 | 1,995,368 |
| Inspired Entertainment, Inc. * | 10,938 | 112,005 |
| Jack in the Box, Inc. | 8,975 | 791,864 |
| Krispy Kreme, Inc. (a) | 28,002 | 401,829 |
| Kura Sushi USA, Inc., Class A * | 1,489 | 117,676 |
| Las Vegas Sands Corp. * | 136,449 | 5,186,426 |
| Laureate Education, Inc., Class A | 46,768 | 591,148 |
| Life Time Group Holdings, Inc. * | 24,073 | 252,526 |
| Lincoln Educational Services Corp. * | 10,639 | 59,046 |
| Lindblad Expeditions Holdings, Inc. * | 13,166 | 110,463 |
| Marriott International, Inc., Class A | 114,408 | 18,317,865 |
| Marriott Vacations Worldwide Corp. | 16,196 | 2,393,121 |
| McDonald’s Corp. | 304,988 | 83,158,028 |
| Membership Collective Group, Inc., Class A * | 21,516 | 98,543 |
| MGM Resorts International | 134,604 | 4,787,864 |
| Mister Car Wash, Inc. *(a) | 34,014 | 300,344 |
| Monarch Casino & Resort, Inc. * | 5,326 | 422,938 |
| Nathan's Famous, Inc. | 1,549 | 101,072 |
| Nerdy, Inc. * | 26,826 | 65,187 |
| Noodles & Co. * | 16,309 | 94,918 |
| Norwegian Cruise Line Holdings Ltd. * | 178,090 | 3,007,940 |
| OneSpaWorld Holdings Ltd. * | 25,869 | 234,632 |
| Papa John's International, Inc. | 13,521 | 982,030 |
| Penn Entertainment, Inc. * | 64,919 | 2,148,819 |
| Perdoceo Education Corp. * | 25,826 | 295,191 |
| Planet Fitness, Inc., Class A * | 34,852 | 2,282,109 |
| Playa Hotels & Resorts N.V. * | 53,100 | 327,627 |
| PlayAGS, Inc. * | 10,629 | 71,427 |
| Portillo's, Inc., Class A *(a) | 12,012 | 257,537 |
| Potbelly Corp. * | 7,813 | 38,909 |
| RCI Hospitality Holdings, Inc. | 3,268 | 275,917 |
| Red Robin Gourmet Burgers, Inc. * | 6,715 | 55,197 |
| Red Rock Resorts, Inc., Class A | 20,415 | 850,285 |
| Rover Group, Inc. *(a) | 43,669 | 191,707 |
| Royal Caribbean Cruises Ltd. * | 90,583 | 4,835,321 |
| Rush Street Interactive, Inc. * | 20,546 | 85,266 |
| Ruth's Hospitality Group, Inc. | 11,936 | 248,030 |
| SECURITY | NUMBER OF SHARES | VALUE ($) |
| Scientific Games Corp., Class A * | 38,874 | 2,182,386 |
| SeaWorld Entertainment, Inc. * | 17,307 | 1,006,575 |
| Service Corp. International | 65,074 | 3,944,135 |
| Shake Shack, Inc., Class A * | 15,122 | 840,330 |
| Six Flags Entertainment Corp. * | 30,964 | 690,497 |
| Sonder Holdings, Inc. * | 52,572 | 115,133 |
| Starbucks Corp. | 475,821 | 41,201,340 |
| StoneMor, Inc. * | 9,993 | 34,876 |
| Strategic Education, Inc. | 9,128 | 629,832 |
| Stride, Inc. * | 16,676 | 558,813 |
| Sweetgreen, Inc., Class A * | 30,982 | 576,265 |
| Target Hospitality Corp. * | 11,875 | 144,519 |
| Texas Roadhouse, Inc. | 27,917 | 2,762,387 |
| The Beachbody Co., Inc. *(a) | 37,405 | 37,779 |
| The Cheesecake Factory, Inc. | 20,167 | 722,180 |
| The ONE Group Hospitality, Inc. * | 8,160 | 61,037 |
| The Wendy's Co. | 71,543 | 1,486,664 |
| Travel & Leisure Co. | 34,458 | 1,308,715 |
| Udemy, Inc. * | 27,212 | 395,935 |
| Universal Technical Institute, Inc. * | 13,710 | 94,599 |
| Vacasa, Inc., Class A * | 39,127 | 142,814 |
| Vail Resorts, Inc. | 16,745 | 3,669,332 |
| Vivint Smart Home, Inc. * | 22,131 | 169,302 |
| Wingstop, Inc. | 12,506 | 1,980,825 |
| WW International, Inc. * | 20,206 | 91,331 |
| Wyndham Hotels & Resorts, Inc. | 37,798 | 2,870,002 |
| Wynn Resorts Ltd. * | 43,252 | 2,763,803 |
| Xponential Fitness, Inc., Class A * | 7,482 | 144,777 |
| XWELL, Inc. * | 36,286 | 24,674 |
| Yum! Brands, Inc. | 117,864 | 13,937,418 |
| 361,051,221 | ||
| Diversified Financials 5.4% | ||
| Acacia Research Corp. * | 18,555 | 74,034 |
| ACRES Commercial Realty Corp. * | 3,144 | 33,578 |
| AFC Gamma, Inc. | 8,451 | 144,766 |
| Affiliated Managers Group, Inc. | 15,685 | 1,947,450 |
| AG Mortgage Investment Trust, Inc. | 10,503 | 51,570 |
| AGNC Investment Corp. | 214,927 | 1,766,700 |
| Alerus Financial Corp. | 6,417 | 143,099 |
| Ally Financial, Inc. | 128,259 | 3,534,818 |
| A-Mark Precious Metals, Inc. | 8,142 | 247,598 |
| American Express Co. | 248,811 | 36,935,993 |
| Ameriprise Financial, Inc. | 44,850 | 13,864,032 |
| Angel Oak Mortgage, Inc. (a) | 9,942 | 102,701 |
| Annaly Capital Management, Inc. | 179,226 | 3,324,642 |
| Apollo Commercial Real Estate Finance, Inc. | 52,949 | 596,206 |
| Apollo Global Management, Inc. | 179,452 | 9,934,463 |
| Arbor Realty Trust, Inc. | 70,442 | 969,986 |
| Ares Commercial Real Estate Corp. | 22,535 | 278,082 |
| Ares Management Corp., Class A | 63,721 | 4,831,963 |
| Arlington Asset Investment Corp., Class A * | 17,051 | 51,835 |
| ARMOUR Residential REIT, Inc. | 48,493 | 257,983 |
| Artisan Partners Asset Management, Inc., Class A | 27,121 | 773,220 |
| Assetmark Financial Holdings, Inc. * | 8,185 | 169,511 |
| Associated Capital Group, Inc., Class A | 1,818 | 73,265 |
| Atlanticus Holdings Corp. * | 2,144 | 61,233 |
| B. Riley Financial, Inc. | 6,796 | 276,461 |
| Bakkt Holdings, Inc. *(a) | 25,312 | 53,915 |
| Berkshire Hathaway, Inc., Class B * | 748,599 | 220,904,079 |
| BGC Partners, Inc., Class A | 138,704 | 549,268 |
| BlackRock, Inc. | 62,575 | 40,417,818 |
| SECURITY | NUMBER OF SHARES | VALUE ($) |
| Blackstone Mortgage Trust, Inc., Class A | 71,938 | 1,795,572 |
| Blackstone, Inc. | 291,272 | 26,546,530 |
| Blucora, Inc. * | 19,812 | 436,458 |
| Blue Owl Capital, Inc. | 139,346 | 1,396,247 |
| Bread Financial Holdings, Inc. | 20,614 | 744,372 |
| Bridge Investment Group Holdings, Inc., Class A | 9,932 | 155,535 |
| Brightsphere Investment Group, Inc. | 14,000 | 263,480 |
| BrightSpire Capital, Inc., Class A | 37,342 | 286,787 |
| Broadmark Realty Capital, Inc. | 53,330 | 310,381 |
| Cannae Holdings, Inc. * | 33,716 | 780,863 |
| Capital One Financial Corp. | 158,968 | 16,853,787 |
| Cboe Global Markets, Inc. | 44,221 | 5,505,514 |
| Cherry Hill Mortgage Investment Corp. | 7,830 | 42,517 |
| Chicago Atlantic Real Estate Finance, Inc. | 2,817 | 41,748 |
| Chimera Investment Corp. | 93,681 | 632,347 |
| Claros Mortgage Trust, Inc. | 50,991 | 815,856 |
| CME Group, Inc. | 149,073 | 25,834,351 |
| Cohen & Steers, Inc. | 10,168 | 611,707 |
| Coinbase Global, Inc., Class A *(a) | 65,330 | 4,328,112 |
| Consumer Portfolio Services, Inc. * | 5,099 | 32,736 |
| Cowen, Inc., Class A | 11,322 | 437,256 |
| Credit Acceptance Corp. * | 2,493 | 1,160,791 |
| Curo Group Holdings Corp. | 9,738 | 50,345 |
| Diamond Hill Investment Group, Inc. | 1,364 | 245,452 |
| Discover Financial Services | 113,599 | 11,866,552 |
| Donnelley Financial Solutions, Inc. * | 10,245 | 414,205 |
| Dynex Capital, Inc. | 18,156 | 216,783 |
| Elevate Credit, Inc. * | 18,040 | 18,401 |
| Ellington Financial, Inc. | 26,120 | 349,486 |
| Ellington Residential Mortgage REIT | 4,517 | 30,219 |
| Encore Capital Group, Inc. * | 9,929 | 505,585 |
| Enova International, Inc. * | 13,316 | 499,217 |
| Equitable Holdings, Inc. | 143,706 | 4,400,278 |
| Evercore, Inc., Class A | 14,684 | 1,543,288 |
| EZCORP, Inc., Class A * | 20,871 | 201,614 |
| FactSet Research Systems, Inc. | 15,789 | 6,718,062 |
| Federated Hermes, Inc. | 34,946 | 1,214,373 |
| FirstCash Holdings, Inc. | 15,825 | 1,557,971 |
| Focus Financial Partners, Inc., Class A * | 23,656 | 822,992 |
| Forge Global Holdings, Inc. *(a) | 41,278 | 63,981 |
| Franklin BSP Realty Trust, Inc. | 34,676 | 488,585 |
| Franklin Resources, Inc. | 118,679 | 2,783,023 |
| GCM Grosvenor, Inc., Class A | 19,770 | 163,498 |
| Granite Point Mortgage Trust, Inc. | 21,343 | 167,756 |
| Great Ajax Corp. | 9,397 | 79,780 |
| Green Dot Corp., Class A * | 20,026 | 381,095 |
| Greenhill & Co., Inc. | 6,539 | 46,361 |
| Hamilton Lane, Inc., Class A | 14,301 | 855,486 |
| Hannon Armstrong Sustainable Infrastructure Capital, Inc. | 36,920 | 1,003,486 |
| Houlihan Lokey, Inc. | 20,612 | 1,841,064 |
| Interactive Brokers Group, Inc., Class A | 42,883 | 3,437,072 |
| Intercontinental Exchange, Inc. | 231,717 | 22,145,194 |
| Invesco Ltd. | 190,024 | 2,911,168 |
| Invesco Mortgage Capital, Inc. | 17,470 | 204,574 |
| Jackson Financial, Inc., Class A | 24,284 | 931,534 |
| Janus Henderson Group plc | 55,087 | 1,254,331 |
| Jefferies Financial Group, Inc. | 77,498 | 2,666,706 |
| Katapult Holdings, Inc. * | 22,914 | 21,768 |
| KKR & Co., Inc. | 238,619 | 11,604,042 |
| KKR Real Estate Finance Trust, Inc. | 24,272 | 422,818 |
| SECURITY | NUMBER OF SHARES | VALUE ($) |
| Ladder Capital Corp. REIT | 45,751 | 488,163 |
| Lazard Ltd., Class A | 46,094 | 1,738,205 |
| LendingClub Corp. * | 41,850 | 445,284 |
| LendingTree, Inc. * | 4,731 | 119,363 |
| LPL Financial Holdings, Inc. | 33,100 | 8,462,015 |
| Lument Finance Trust, Inc. | 24,035 | 52,156 |
| MarketAxess Holdings, Inc. | 15,563 | 3,797,994 |
| MarketWise, Inc. * | 11,705 | 28,794 |
| Medallion Financial Corp. | 10,486 | 77,806 |
| MFA Financial, Inc. | 38,698 | 385,432 |
| Moelis & Co., Class A | 26,577 | 1,128,459 |
| Moneylion, Inc. * | 35,694 | 39,977 |
| Moody's Corp. | 65,480 | 17,343,688 |
| Morgan Stanley | 555,747 | 45,665,731 |
| Morningstar, Inc. | 10,331 | 2,398,652 |
| MSCI, Inc. | 33,406 | 15,662,737 |
| Nasdaq, Inc. | 140,779 | 8,762,085 |
| Navient Corp. | 45,502 | 688,900 |
| Nelnet, Inc., Class A | 7,358 | 655,524 |
| NerdWallet, Inc., Class A *(a) | 14,084 | 165,346 |
| New York Mortgage Trust, Inc. | 148,104 | 398,400 |
| Nexpoint Real Estate Finance, Inc. | 3,307 | 58,104 |
| Nicholas Financial, Inc. * | 6,032 | 42,586 |
| Northern Trust Corp. | 86,193 | 7,270,380 |
| OneMain Holdings, Inc. | 50,954 | 1,964,786 |
| Open Lending Corp., Class A * | 41,232 | 295,633 |
| Oportun Financial Corp. * | 13,044 | 71,742 |
| Oppenheimer Holdings, Inc., Class A | 3,500 | 120,470 |
| OppFi, Inc. *(a) | 7,166 | 16,267 |
| Orchid Island Capital, Inc. (a) | 13,873 | 139,699 |
| P10, Inc., Class A | 14,773 | 153,491 |
| PennyMac Mortgage Investment Trust | 37,798 | 524,258 |
| Perella Weinberg Partners, Class A | 14,490 | 114,181 |
| Piper Sandler Cos. | 5,914 | 756,815 |
| PJT Partners, Inc., Class A | 10,087 | 750,473 |
| PRA Group, Inc. * | 17,181 | 575,563 |
| PROG Holdings, Inc. * | 19,702 | 325,477 |
| Raymond James Financial, Inc. | 80,651 | 9,528,109 |
| Ready Capital Corp. | 41,326 | 500,871 |
| Redwood Trust, Inc. | 48,185 | 343,559 |
| Regional Management Corp. | 3,411 | 115,838 |
| Rithm Capital Corp. | 191,132 | 1,611,243 |
| Robinhood Markets, Inc., Class A * | 209,153 | 2,442,907 |
| S&P Global, Inc. | 141,363 | 45,412,864 |
| Sachem Capital Corp. | 16,351 | 64,423 |
| Safeguard Scientifics, Inc. * | 12,218 | 43,252 |
| Sculptor Capital Management, Inc. | 7,668 | 81,357 |
| SEI Investments Co. | 42,718 | 2,319,587 |
| Seven Hills Realty Trust | 2,626 | 24,290 |
| Silvercrest Asset Management Group, Inc., Class A | 3,213 | 61,015 |
| SLM Corp. | 102,861 | 1,706,464 |
| SoFi Technologies, Inc. * | 334,999 | 1,822,395 |
| Starwood Property Trust, Inc. | 126,464 | 2,612,746 |
| State Street Corp. | 152,779 | 11,305,646 |
| StepStone Group, Inc., Class A | 20,302 | 599,315 |
| Stifel Financial Corp. | 43,694 | 2,703,348 |
| StoneX Group, Inc. * | 7,373 | 688,048 |
| Sunlight Financial Holdings, Inc. *(a) | 16,772 | 20,294 |
| SWK Holdings Corp. * | 1,451 | 26,989 |
| Synchrony Financial | 198,989 | 7,076,049 |
| T. Rowe Price Group, Inc. | 93,397 | 9,915,025 |
| The Bank of New York Mellon Corp. | 305,030 | 12,844,813 |
| The Carlyle Group, Inc. | 90,414 | 2,556,908 |
| The Charles Schwab Corp. (c) | 630,137 | 50,203,015 |
| The Goldman Sachs Group, Inc. | 141,606 | 48,784,683 |
| TPG RE Finance Trust, Inc. | 22,683 | 192,125 |
| TPG, Inc. | 21,577 | 663,493 |
| SECURITY | NUMBER OF SHARES | VALUE ($) |
| Tradeweb Markets, Inc., Class A | 44,943 | 2,475,460 |
| Two Harbors Investment Corp. | 141,244 | 502,829 |
| U.S. Global Investors, Inc., Class A | 6,234 | 18,079 |
| Upstart Holdings, Inc. *(a) | 28,886 | 669,577 |
| Victory Capital Holdings, Inc., Class A | 11,391 | 329,428 |
| Virtu Financial, Inc., Class A | 39,712 | 888,755 |
| Virtus Investment Partners, Inc. | 2,899 | 497,149 |
| Voya Financial, Inc. | 40,236 | 2,750,533 |
| Western Asset Mortgage Capital Corp. | 2,307 | 24,892 |
| Westwood Holdings Group, Inc. | 2,653 | 26,848 |
| WisdomTree Investments, Inc. | 44,670 | 242,558 |
| World Acceptance Corp. * | 1,349 | 109,566 |
| 862,002,342 | ||
| Energy 5.3% | ||
| Adams Resources & Energy, Inc. | 1,489 | 47,871 |
| Aemetis, Inc. * | 14,199 | 105,073 |
| Alto Ingredients, Inc. * | 33,727 | 139,293 |
| American Resources Corp. * | 17,208 | 34,244 |
| Amplify Energy Corp. * | 12,340 | 122,043 |
| Antero Midstream Corp. | 139,563 | 1,486,346 |
| Antero Resources Corp. * | 116,604 | 4,274,703 |
| APA Corp. | 135,714 | 6,169,558 |
| Arch Resources, Inc. | 7,593 | 1,156,338 |
| Archaea Energy, Inc. * | 30,634 | 790,664 |
| Archrock, Inc. | 54,444 | 408,874 |
| Baker Hughes Co. | 421,603 | 11,661,539 |
| Berry Corp. | 27,783 | 246,435 |
| Brigham Minerals, Inc., Class A | 23,841 | 739,071 |
| Bristow Group, Inc. * | 9,727 | 291,226 |
| Cactus, Inc., Class A | 24,986 | 1,292,276 |
| California Resources Corp. | 31,519 | 1,421,822 |
| Callon Petroleum Co. * | 21,006 | 923,424 |
| Camber Energy, Inc. * | 150,141 | 21,380 |
| Centrus Energy Corp., Class A * | 4,789 | 226,568 |
| ChampionX Corp. | 83,380 | 2,386,336 |
| Cheniere Energy, Inc. | 103,479 | 18,254,730 |
| Chesapeake Energy Corp. | 40,163 | 4,107,470 |
| Chevron Corp. | 746,738 | 135,084,904 |
| Chord Energy Corp. | 17,391 | 2,662,388 |
| Civitas Resources, Inc. | 21,319 | 1,490,411 |
| Clean Energy Fuels Corp. * | 70,975 | 476,242 |
| CNX Resources Corp. * | 77,783 | 1,307,532 |
| Comstock Resources, Inc. * | 36,308 | 681,864 |
| ConocoPhillips | 527,919 | 66,565,307 |
| CONSOL Energy, Inc. | 13,692 | 862,870 |
| Continental Resources, Inc. | 22,240 | 1,645,093 |
| Core Laboratories N.V. | 19,266 | 374,916 |
| Coterra Energy, Inc. | 330,467 | 10,287,438 |
| Crescent Energy Co., Class A | 16,190 | 223,098 |
| CVR Energy, Inc. | 11,947 | 466,650 |
| Delek US Holdings, Inc. | 29,062 | 861,979 |
| Denbury, Inc. * | 20,566 | 1,879,938 |
| Devon Energy Corp. | 271,674 | 21,013,984 |
| Diamond Offshore Drilling, Inc. * | 43,981 | 433,213 |
| Diamondback Energy, Inc. | 73,887 | 11,608,387 |
| DMC Global, Inc. * | 7,222 | 156,284 |
| Dorian LPG Ltd. | 14,057 | 254,010 |
| Dril-Quip, Inc. * | 13,780 | 342,846 |
| DTE Midstream LLC * | 40,074 | 2,392,418 |
| Earthstone Energy, Inc., Class A * | 15,789 | 255,150 |
| Ecoark Holdings, Inc. * | 10,671 | 8,110 |
| Empire Petroleum Corp. * | 3,665 | 58,640 |
| Enviva, Inc. | 12,691 | 759,429 |
| EOG Resources, Inc. | 243,278 | 33,212,313 |
| Epsilon Energy Ltd. | 5,425 | 37,812 |
| SECURITY | NUMBER OF SHARES | VALUE ($) |
| EQT Corp. | 152,990 | 6,401,102 |
| Equitrans Midstream Corp. | 180,517 | 1,519,953 |
| Evolution Petroleum Corp. | 11,036 | 87,074 |
| Excelerate Energy, Inc., Class A | 7,154 | 197,593 |
| Expro Group Holdings N.V. * | 29,238 | 553,475 |
| Exxon Mobil Corp. | 1,728,262 | 191,508,712 |
| Forum Energy Technologies, Inc. * | 1,428 | 37,685 |
| Geospace Technologies Corp. * | 8,343 | 33,706 |
| Gevo, Inc. * | 101,823 | 229,102 |
| Green Plains, Inc. * | 24,261 | 700,900 |
| Gulf Island Fabrication, Inc. * | 6,007 | 28,473 |
| Gulfport Energy Corp. * | 4,920 | 440,389 |
| Hallador Energy Co. * | 10,747 | 83,719 |
| Halliburton Co. | 375,729 | 13,684,050 |
| Helix Energy Solutions Group, Inc. * | 60,683 | 424,781 |
| Helmerich & Payne, Inc. | 44,341 | 2,195,323 |
| Hess Corp. | 115,828 | 16,341,014 |
| HF Sinclair Corp. | 60,395 | 3,694,362 |
| HighPeak Energy, Inc. (a) | 5,507 | 128,423 |
| Houston American Energy Corp. *(a) | 4,107 | 15,648 |
| Independence Contract Drilling, Inc. * | 7,301 | 31,467 |
| International Seaways, Inc. | 16,766 | 711,046 |
| Kinder Morgan, Inc. | 824,023 | 14,931,297 |
| Kinetik Holdings, Inc. | 7,736 | 284,530 |
| KLX Energy Services Holdings, Inc. * | 4,291 | 66,038 |
| Kosmos Energy Ltd. * | 187,969 | 1,219,919 |
| Laredo Petroleum, Inc. * | 7,011 | 453,261 |
| Liberty Energy, Inc., Class A * | 64,955 | 1,098,389 |
| Lightbridge Corp. * | 5,562 | 28,922 |
| Magnolia Oil & Gas Corp., Class A | 71,593 | 1,838,508 |
| Mammoth Energy Services, Inc. * | 10,739 | 62,716 |
| Marathon Oil Corp. | 281,610 | 8,575,025 |
| Marathon Petroleum Corp. | 206,653 | 23,479,914 |
| Matador Resources Co. | 46,490 | 3,089,261 |
| Murphy Oil Corp. | 61,048 | 2,961,438 |
| Nabors Industries Ltd. * | 3,753 | 653,135 |
| NACCO Industries, Inc., Class A | 1,966 | 111,197 |
| Natural Gas Services Group, Inc. * | 4,213 | 48,450 |
| New Fortress Energy, Inc. | 19,464 | 1,071,882 |
| Newpark Resources, Inc. * | 39,958 | 146,246 |
| NextDecade Corp. *(a) | 17,851 | 124,957 |
| NexTier Oilfield Solutions, Inc. * | 64,762 | 652,801 |
| Nine Energy Service, Inc. * | 5,821 | 34,111 |
| Noble Corp. plc * | 41,470 | 1,494,579 |
| Northern Oil and Gas, Inc. | 28,421 | 970,293 |
| NOV, Inc. | 164,826 | 3,692,102 |
| Occidental Petroleum Corp. | 309,126 | 22,442,548 |
| Oceaneering International, Inc. * | 41,714 | 583,579 |
| Oil States International, Inc. * | 23,526 | 152,213 |
| ONEOK, Inc. | 185,781 | 11,020,529 |
| Overseas Shipholding Group, Inc., Class A * | 21,455 | 62,649 |
| Ovintiv, Inc. | 105,402 | 5,338,611 |
| Par Pacific Holdings, Inc. * | 23,324 | 533,653 |
| Patterson-UTI Energy, Inc. | 88,058 | 1,554,224 |
| PBF Energy, Inc., Class A | 44,934 | 1,988,330 |
| PDC Energy, Inc. | 39,732 | 2,866,266 |
| Peabody Energy Corp. * | 47,994 | 1,147,057 |
| Permian Resources Corp., Class A * | 84,244 | 823,064 |
| Phillips 66 | 199,602 | 20,816,493 |
| PHX Minerals, Inc. | 18,808 | 74,856 |
| Pioneer Natural Resources Co. | 99,046 | 25,396,386 |
| ProFrac Holding Corp., Class A * | 10,021 | 219,560 |
| ProPetro Holding Corp. * | 34,664 | 410,422 |
| Range Resources Corp. | 103,388 | 2,944,490 |
| Ranger Energy Services, Inc. * | 5,075 | 53,288 |
| Ranger Oil Corp., Class A | 7,550 | 308,795 |
| REX American Resources Corp. * | 6,150 | 184,439 |
| SECURITY | NUMBER OF SHARES | VALUE ($) |
| Riley Exploration Permian, Inc. | 1,796 | 52,210 |
| Ring Energy, Inc. * | 39,328 | 125,456 |
| RPC, Inc. | 36,343 | 404,498 |
| SandRidge Energy, Inc. * | 12,685 | 239,620 |
| Schlumberger N.V. | 587,733 | 30,579,748 |
| SEACOR Marine Holdings, Inc. * | 10,252 | 79,658 |
| Select Energy Services, Inc., Class A | 29,810 | 287,667 |
| SilverBow Resources, Inc. * | 5,751 | 203,988 |
| Sitio Royalties Corp. (a) | 6,118 | 173,506 |
| SM Energy Co. | 50,733 | 2,281,970 |
| Smart Sand, Inc. * | 17,439 | 43,249 |
| Solaris Oilfield Infrastructure, Inc., Class A | 12,245 | 166,777 |
| Southwestern Energy Co. * | 460,192 | 3,189,131 |
| Talos Energy, Inc. * | 27,180 | 578,390 |
| Targa Resources Corp. | 93,679 | 6,404,833 |
| TechnipFMC plc * | 186,408 | 1,974,061 |
| Tellurian, Inc. * | 211,754 | 571,736 |
| TETRA Technologies, Inc. * | 48,014 | 237,189 |
| Texas Pacific Land Corp. | 2,567 | 5,914,034 |
| The Williams Cos., Inc. | 505,473 | 16,544,131 |
| Tidewater, Inc. * | 19,756 | 669,728 |
| Transocean Ltd. * | 273,705 | 1,007,234 |
| U.S. Well Services, Inc. * | 4,816 | 35,687 |
| Uranium Energy Corp. * | 134,408 | 565,858 |
| US Silica Holdings, Inc. * | 30,626 | 440,708 |
| VAALCO Energy, Inc. | 43,433 | 223,680 |
| Valaris Ltd. * | 24,762 | 1,657,321 |
| Valero Energy Corp. | 163,470 | 20,523,658 |
| Vertex Energy, Inc. * | 25,874 | 220,705 |
| W&T Offshore, Inc. * | 41,992 | 318,719 |
| Weatherford International plc * | 26,737 | 1,114,398 |
| World Fuel Services Corp. | 25,958 | 661,669 |
| 854,260,147 | ||
| Food & Staples Retailing 1.5% | ||
| Albertsons Cos., Inc., Class A | 67,384 | 1,382,046 |
| BJ's Wholesale Club Holdings, Inc. * | 56,257 | 4,354,292 |
| Blue Apron Holdings, Inc., Class A *(a) | 9,121 | 21,982 |
| Casey's General Stores, Inc. | 15,340 | 3,569,771 |
| Costco Wholesale Corp. | 183,715 | 92,133,072 |
| Grocery Outlet Holding Corp. * | 35,880 | 1,240,372 |
| HF Foods Group, Inc. * | 16,494 | 76,367 |
| Ingles Markets, Inc., Class A | 5,747 | 542,344 |
| MedAvail Holdings, Inc. * | 11,882 | 7,999 |
| Natural Grocers by Vitamin Cottage, Inc. | 4,452 | 51,198 |
| Performance Food Group Co. * | 65,042 | 3,384,786 |
| PriceSmart, Inc. | 10,189 | 651,790 |
| Rite Aid Corp. * | 22,587 | 117,904 |
| SpartanNash Co. | 15,368 | 548,791 |
| Sprouts Farmers Market, Inc. * | 44,312 | 1,307,204 |
| Sysco Corp. | 211,330 | 18,292,725 |
| The Andersons, Inc. | 12,958 | 457,029 |
| The Chefs' Warehouse, Inc. * | 13,517 | 495,128 |
| The Kroger Co. | 270,504 | 12,792,134 |
| U.S. Foods Holding Corp. * | 85,985 | 2,558,914 |
| United Natural Foods, Inc. * | 24,168 | 1,024,965 |
| Village Super Market, Inc., Class A | 1,726 | 38,386 |
| Walgreens Boots Alliance, Inc. | 296,856 | 10,835,244 |
| Walmart, Inc. | 591,153 | 84,138,806 |
| Weis Markets, Inc. | 7,027 | 658,219 |
| 240,681,468 | ||
| SECURITY | NUMBER OF SHARES | VALUE ($) |
| Food, Beverage & Tobacco 3.4% | ||
| 22nd Century Group, Inc. *(a) | 102,448 | 134,207 |
| Alico, Inc. | 2,213 | 67,762 |
| Altria Group, Inc. | 747,810 | 34,601,169 |
| Archer-Daniels-Midland Co. | 232,170 | 22,515,847 |
| B&G Foods, Inc. (a) | 28,943 | 474,086 |
| Benson Hill, Inc. * | 52,088 | 176,578 |
| Beyond Meat, Inc. *(a) | 25,353 | 398,042 |
| Brookfield Realty Capital Corp., Class A * | 13,382 | 97,020 |
| Brown-Forman Corp., Class A | 23,351 | 1,605,848 |
| Brown-Forman Corp., Class B | 76,027 | 5,169,836 |
| Bunge Ltd. | 63,178 | 6,235,669 |
| Calavo Growers, Inc. | 7,291 | 252,196 |
| Cal-Maine Foods, Inc. | 15,947 | 901,165 |
| Campbell Soup Co. | 83,276 | 4,406,133 |
| Celsius Holdings, Inc. * | 16,505 | 1,503,275 |
| Coca-Cola Consolidated, Inc. | 1,891 | 920,936 |
| Conagra Brands, Inc. | 199,657 | 7,327,412 |
| Constellation Brands, Inc., Class A | 66,173 | 16,350,025 |
| Darling Ingredients, Inc. * | 66,349 | 5,207,070 |
| Farmer Brothers Co. * | 11,781 | 70,686 |
| Flowers Foods, Inc. | 80,856 | 2,321,376 |
| Fresh Del Monte Produce, Inc. | 12,446 | 324,592 |
| Freshpet, Inc. * | 20,176 | 1,189,375 |
| General Mills, Inc. | 246,969 | 20,147,731 |
| Hormel Foods Corp. | 120,067 | 5,577,112 |
| Hostess Brands, Inc. * | 55,868 | 1,479,385 |
| Ingredion, Inc. | 27,042 | 2,409,983 |
| J&J Snack Foods Corp. | 6,222 | 918,429 |
| John B. Sanfilippo & Son, Inc. | 3,596 | 299,942 |
| Kellogg Co. | 105,909 | 8,135,929 |
| Keurig Dr Pepper, Inc. | 352,039 | 13,673,195 |
| Lamb Weston Holdings, Inc. | 59,490 | 5,129,228 |
| Lancaster Colony Corp. | 8,128 | 1,465,316 |
| Landec Corp. * | 10,427 | 103,749 |
| Limoneira Co. | 7,226 | 86,206 |
| Local Bounti Corp. *(a) | 14,734 | 43,613 |
| McCormick & Co., Inc. - Non Voting Shares | 103,888 | 8,169,752 |
| MGP Ingredients, Inc. | 6,407 | 717,904 |
| Mission Produce, Inc. * | 18,304 | 304,579 |
| Molson Coors Beverage Co., Class B | 77,910 | 3,929,001 |
| Mondelez International, Inc., Class A | 567,856 | 34,911,787 |
| Monster Beverage Corp. * | 159,402 | 14,939,155 |
| National Beverage Corp. | 9,307 | 441,338 |
| PepsiCo, Inc. | 572,189 | 103,898,079 |
| Philip Morris International, Inc. | 642,971 | 59,056,886 |
| Pilgrim's Pride Corp. * | 19,708 | 454,269 |
| Post Holdings, Inc. * | 22,299 | 2,016,276 |
| Seaboard Corp. | 109 | 408,355 |
| Seneca Foods Corp., Class A * | 2,612 | 164,843 |
| Sovos Brands, Inc. * | 17,729 | 245,724 |
| Tattooed Chef, Inc. *(a) | 17,444 | 82,859 |
| The Alkaline Water Co., Inc. * | 39,797 | 11,947 |
| The Boston Beer Co., Inc., Class A * | 4,062 | 1,516,304 |
| The Coca-Cola Co. | 1,613,639 | 96,576,294 |
| The Duckhorn Portfolio, Inc. * | 19,046 | 278,453 |
| The Hain Celestial Group, Inc. * | 38,429 | 719,007 |
| The Hershey Co. | 60,847 | 14,528,438 |
| The JM Smucker Co. | 44,286 | 6,672,129 |
| The Kraft Heinz Co. | 330,987 | 12,733,070 |
| The Real Good Food Co., Inc. * | 3,502 | 23,428 |
| The Simply Good Foods Co. * | 36,405 | 1,394,311 |
| The Vita Coco Co., Inc. * | 10,382 | 106,519 |
| Tootsie Roll Industries, Inc. | 6,819 | 275,419 |
| TreeHouse Foods, Inc. * | 21,142 | 1,062,174 |
| SECURITY | NUMBER OF SHARES | VALUE ($) |
| Turning Point Brands, Inc. | 6,017 | 141,761 |
| Tyson Foods, Inc., Class A | 120,072 | 8,206,921 |
| Universal Corp. | 10,446 | 528,672 |
| Utz Brands, Inc. | 27,580 | 447,072 |
| Vector Group Ltd. | 53,886 | 572,269 |
| Vintage Wine Estates, Inc. * | 13,866 | 38,409 |
| Vital Farms, Inc. * | 11,214 | 148,473 |
| Whole Earth Brands, Inc. * | 12,768 | 44,050 |
| Zevia PBC, Class A * | 20,011 | 93,852 |
| 547,579,902 | ||
| Health Care Equipment & Services 6.3% | ||
| 1Life Healthcare, Inc. * | 69,236 | 1,183,936 |
| 23andMe Holding Co., Class A * | 110,987 | 348,499 |
| Abbott Laboratories | 726,047 | 71,835,090 |
| ABIOMED, Inc. * | 18,845 | 4,750,448 |
| Acadia Healthcare Co., Inc. * | 37,945 | 3,084,928 |
| Accelerate Diagnostics, Inc. * | 30,507 | 38,744 |
| Accolade, Inc. * | 24,013 | 258,860 |
| Accuray, Inc. * | 36,635 | 74,735 |
| AdaptHealth Corp. * | 32,243 | 735,140 |
| Addus HomeCare Corp. * | 6,672 | 683,346 |
| Agiliti, Inc. * | 12,735 | 222,480 |
| agilon health, Inc. * | 81,447 | 1,616,723 |
| AirSculpt Technologies, Inc. | 4,242 | 28,761 |
| Akumin, Inc. * | 29,384 | 51,422 |
| Align Technology, Inc. * | 30,210 | 5,869,803 |
| Alignment Healthcare, Inc. * | 34,645 | 458,700 |
| Allscripts Healthcare Solutions, Inc. * | 45,635 | 670,834 |
| Alphatec Holdings, Inc. * | 27,056 | 277,053 |
| Amedisys, Inc. * | 13,354 | 1,303,217 |
| American Well Corp., Class A * | 105,430 | 431,209 |
| AmerisourceBergen Corp. | 64,506 | 10,141,633 |
| AMN Healthcare Services, Inc. * | 17,777 | 2,231,013 |
| AngioDynamics, Inc. * | 16,851 | 237,431 |
| Apollo Endosurgery, Inc. * | 17,198 | 110,755 |
| Apollo Medical Holdings, Inc. * | 16,232 | 575,587 |
| Apyx Medical Corp. * | 12,488 | 62,440 |
| Artivion, Inc. * | 17,724 | 197,800 |
| Asensus Surgical, Inc. * | 139,946 | 58,777 |
| ATI Physical Therapy, Inc. * | 22,162 | 24,157 |
| AtriCure, Inc. * | 19,289 | 812,453 |
| Atrion Corp. | 563 | 337,974 |
| Avanos Medical, Inc. * | 18,588 | 411,724 |
| AxoGen, Inc. * | 16,795 | 191,799 |
| Axonics, Inc. * | 20,371 | 1,489,935 |
| Baxter International, Inc. | 209,357 | 11,378,553 |
| Becton, Dickinson & Co. | 118,270 | 27,908,172 |
| Beyond Air, Inc. *(a) | 8,697 | 59,053 |
| Biotricity, Inc. * | 16,000 | 20,640 |
| Bioventus, Inc., Class A * | 16,149 | 131,453 |
| Boston Scientific Corp. * | 593,570 | 25,588,803 |
| Brookdale Senior Living, Inc. * | 79,540 | 355,544 |
| Butterfly Network, Inc. * | 62,200 | 304,780 |
| Cano Health, Inc. * | 71,119 | 254,606 |
| Cardinal Health, Inc. | 113,258 | 8,596,282 |
| Cardiovascular Systems, Inc. * | 15,854 | 228,932 |
| CareMax, Inc. * | 30,662 | 215,860 |
| Castle Biosciences, Inc. * | 9,781 | 249,611 |
| Centene Corp. * | 237,294 | 20,200,838 |
| Certara, Inc. * | 44,147 | 539,918 |
| Cerus Corp. * | 76,254 | 279,090 |
| Chemed Corp. | 6,207 | 2,897,862 |
| Cigna Corp. | 126,542 | 40,880,658 |
| ClearPoint Neuro, Inc. * | 10,369 | 103,794 |
| Clover Health Investments Corp. * | 144,282 | 227,966 |
| Co-Diagnostics, Inc. * | 11,070 | 38,413 |
| SECURITY | NUMBER OF SHARES | VALUE ($) |
| Community Health Systems, Inc. * | 51,561 | 147,980 |
| Computer Programs & Systems, Inc. * | 6,539 | 211,210 |
| Conformis, Inc. * | 77,113 | 10,410 |
| CONMED Corp. | 12,630 | 1,006,990 |
| CorVel Corp. * | 4,322 | 709,716 |
| Cross Country Healthcare, Inc. * | 14,884 | 552,047 |
| Cue Health, Inc. * | 41,972 | 166,629 |
| Cutera, Inc. * | 6,934 | 318,756 |
| CVRx, Inc. * | 6,715 | 67,687 |
| CVS Health Corp. | 544,447 | 51,559,131 |
| CytoSorbents Corp. * | 15,994 | 29,909 |
| DarioHealth Corp. * | 10,290 | 45,585 |
| DaVita, Inc. * | 23,146 | 1,689,889 |
| Definitive Healthcare Corp. * | 15,392 | 242,886 |
| Dentsply Sirona, Inc. | 89,188 | 2,748,774 |
| DexCom, Inc. * | 162,636 | 19,643,176 |
| DocGo, Inc. * | 34,222 | 338,798 |
| Doximity, Inc., Class A * | 47,525 | 1,257,987 |
| Edwards Lifesciences Corp. * | 257,324 | 18,637,977 |
| ElectroCore, Inc. * | 45,528 | 11,851 |
| Electromed, Inc. * | 5,840 | 62,021 |
| Elevance Health, Inc. | 99,544 | 54,427,673 |
| Embecta Corp. | 23,706 | 732,989 |
| Encompass Health Corp. | 42,092 | 2,291,488 |
| Enhabit, Inc. * | 20,321 | 252,387 |
| Enovis Corp. * | 20,745 | 1,025,840 |
| Envista Holdings Corp. * | 67,994 | 2,244,482 |
| Enzo Biochem, Inc. * | 13,471 | 28,828 |
| Evolent Health, Inc., Class A * | 35,218 | 1,120,285 |
| Figs, Inc., Class A * | 52,953 | 390,793 |
| FONAR Corp. * | 4,150 | 66,815 |
| Forian, Inc. * | 7,513 | 28,925 |
| Fulgent Genetics, Inc. * | 8,120 | 321,796 |
| Glaukos Corp. * | 20,229 | 1,134,240 |
| Globus Medical, Inc., Class A * | 32,276 | 2,162,492 |
| GoodRx Holdings, Inc., Class A * | 28,804 | 154,677 |
| Guardant Health, Inc. * | 42,720 | 2,114,640 |
| Haemonetics Corp. * | 21,648 | 1,838,998 |
| HCA Healthcare, Inc. | 89,387 | 19,438,991 |
| Health Catalyst, Inc. * | 21,299 | 187,857 |
| HealthEquity, Inc. * | 34,744 | 2,706,905 |
| HealthStream, Inc. * | 9,574 | 236,478 |
| Henry Schein, Inc. * | 56,667 | 3,879,423 |
| Heska Corp. * | 4,006 | 287,471 |
| Hims & Hers Health, Inc. * | 47,200 | 214,288 |
| Hologic, Inc. * | 103,945 | 7,047,471 |
| Humana, Inc. | 52,497 | 29,297,526 |
| Hyperfine, Inc. *(a) | 36,085 | 32,837 |
| ICAD, Inc. * | 9,349 | 17,857 |
| ICU Medical, Inc. * | 8,234 | 1,222,008 |
| IDEXX Laboratories, Inc. * | 34,576 | 12,436,296 |
| Inari Medical, Inc. * | 20,488 | 1,576,142 |
| InfuSystem Holdings, Inc. * | 7,155 | 54,593 |
| Innovage Holding Corp. * | 7,015 | 43,423 |
| Inogen, Inc. * | 10,293 | 233,239 |
| Inspire Medical Systems, Inc. * | 11,682 | 2,277,406 |
| Insulet Corp. * | 28,716 | 7,431,988 |
| Integer Holdings Corp. * | 13,515 | 842,390 |
| Integra LifeSciences Holdings Corp. * | 30,669 | 1,541,117 |
| Intuitive Surgical, Inc. * | 148,289 | 36,548,790 |
| Invacare Corp. *(a) | 20,165 | 14,968 |
| Invitae Corp. *(a) | 83,900 | 216,462 |
| iRadimed Corp. | 3,278 | 95,226 |
| iRhythm Technologies, Inc. * | 12,579 | 1,603,697 |
| KORU Medical Systems, Inc. * | 21,377 | 51,305 |
| Laboratory Corp. of America Holdings | 37,538 | 8,328,181 |
| Lantheus Holdings, Inc. * | 28,271 | 2,091,771 |
| LeMaitre Vascular, Inc. | 7,713 | 334,744 |
| SECURITY | NUMBER OF SHARES | VALUE ($) |
| LENSAR, Inc. * | 12,582 | 59,890 |
| LHC Group, Inc. * | 12,819 | 2,142,055 |
| LifeStance Health Group, Inc. *(a) | 40,123 | 302,929 |
| LivaNova plc * | 23,087 | 1,087,398 |
| Masimo Corp. * | 19,984 | 2,629,894 |
| McKesson Corp. | 59,520 | 23,175,302 |
| Medtronic plc | 551,135 | 48,136,131 |
| Meridian Bioscience, Inc. * | 18,440 | 589,527 |
| Merit Medical Systems, Inc. * | 23,844 | 1,639,752 |
| Mesa Laboratories, Inc. | 2,222 | 293,771 |
| ModivCare, Inc. * | 5,394 | 524,513 |
| Molina Healthcare, Inc. * | 24,039 | 8,626,635 |
| Multiplan Corp. * | 95,617 | 274,421 |
| National HealthCare Corp. | 5,672 | 345,538 |
| National Research Corp. | 5,356 | 218,150 |
| Neogen Corp. * | 88,945 | 1,174,074 |
| Neuronetics, Inc. * | 13,837 | 46,077 |
| NeuroPace, Inc. * | 4,356 | 13,068 |
| Nevro Corp. * | 14,202 | 544,505 |
| NextGen Healthcare, Inc. * | 22,354 | 447,974 |
| Novocure Ltd. * | 37,428 | 2,644,662 |
| NuVasive, Inc. * | 22,656 | 999,809 |
| Oak Street Health, Inc. * | 47,938 | 969,786 |
| Omnicell, Inc. * | 18,125 | 1,401,425 |
| OPKO Health, Inc. * | 159,773 | 303,569 |
| OptimizeRx Corp. * | 6,885 | 106,132 |
| Option Care Health, Inc. * | 63,723 | 1,928,258 |
| OraSure Technologies, Inc. * | 30,500 | 132,980 |
| Orthofix Medical, Inc. * | 7,702 | 123,694 |
| OrthoPediatrics Corp. * | 5,687 | 241,641 |
| Outset Medical, Inc. * | 20,864 | 324,227 |
| Owens & Minor, Inc. | 31,113 | 528,921 |
| Owlet, Inc. * | 28,926 | 27,697 |
| P3 Health Partners, Inc. *(a) | 8,952 | 44,312 |
| Paragon 28, Inc. *(a) | 11,248 | 224,623 |
| Patterson Cos., Inc. | 37,626 | 977,147 |
| PAVmed, Inc. *(a) | 28,787 | 35,696 |
| Pear Therapeutics, Inc. * | 19,890 | 54,697 |
| Pediatrix Medical Group, Inc. * | 35,753 | 693,608 |
| Penumbra, Inc. * | 15,882 | 2,723,286 |
| PetIQ, Inc. * | 11,858 | 97,473 |
| Phreesia, Inc. * | 22,302 | 609,291 |
| Premier, Inc., Class A | 49,475 | 1,725,688 |
| Privia Health Group, Inc. * | 20,312 | 680,046 |
| PROCEPT BioRobotics Corp. * | 13,654 | 620,301 |
| Progyny, Inc. * | 31,229 | 1,388,754 |
| Pulmonx Corp. * | 15,144 | 202,324 |
| Quest Diagnostics, Inc. | 48,224 | 6,927,378 |
| QuidelOrtho Corp. * | 22,384 | 2,010,531 |
| R1 RCM, Inc. * | 57,448 | 1,014,532 |
| RadNet, Inc. * | 20,892 | 399,455 |
| ResMed, Inc. | 60,664 | 13,569,930 |
| RxSight, Inc. * | 7,004 | 87,130 |
| Sanara Medtech, Inc. * | 1,654 | 48,925 |
| Schrodinger, Inc. * | 22,939 | 549,848 |
| SeaSpine Holdings Corp. * | 12,552 | 80,709 |
| Select Medical Holdings Corp. | 42,445 | 1,089,988 |
| Sema4 Holdings Corp. * | 114,403 | 117,835 |
| Semler Scientific, Inc. * | 1,873 | 78,685 |
| Senseonics Holdings, Inc. *(a) | 180,529 | 213,024 |
| Sensus Healthcare, Inc. * | 6,026 | 84,786 |
| Sharecare, Inc. * | 125,041 | 240,079 |
| Shockwave Medical, Inc. * | 14,812 | 4,342,138 |
| SI-BONE, Inc. * | 13,781 | 267,903 |
| Sight Sciences, Inc. * | 12,978 | 101,618 |
| Signify Health, Inc., Class A * | 28,702 | 838,959 |
| Silk Road Medical, Inc. * | 14,726 | 649,122 |
| Simulations Plus, Inc. | 6,313 | 261,989 |
| SECURITY | NUMBER OF SHARES | VALUE ($) |
| Sonida Senior Living, Inc. * | 1,604 | 25,792 |
| STAAR Surgical Co. * | 19,593 | 1,388,556 |
| Stereotaxis, Inc. * | 22,696 | 42,441 |
| STERIS plc | 41,466 | 7,156,202 |
| Streamline Health Solutions, Inc. * | 29,028 | 52,250 |
| Stryker Corp. | 139,674 | 32,018,868 |
| Surgery Partners, Inc. * | 16,249 | 441,810 |
| Surmodics, Inc. * | 5,273 | 180,020 |
| Tabula Rasa HealthCare, Inc. * | 11,729 | 45,978 |
| Tactile Systems Technology, Inc. * | 7,843 | 58,352 |
| Talkspace, Inc. * | 38,082 | 27,609 |
| Tandem Diabetes Care, Inc. * | 26,352 | 1,479,665 |
| Teladoc Health, Inc. * | 66,992 | 1,985,643 |
| Teleflex, Inc. | 19,464 | 4,176,196 |
| Tenet Healthcare Corp. * | 44,264 | 1,963,551 |
| The Cooper Cos., Inc. | 20,558 | 5,620,352 |
| The Ensign Group, Inc. | 22,891 | 2,055,154 |
| The Joint Corp. * | 5,490 | 90,695 |
| The Oncology Institute, Inc. * | 11,011 | 49,990 |
| The Pennant Group, Inc. * | 10,680 | 131,471 |
| TransMedics Group, Inc. * | 12,993 | 626,522 |
| Treace Medical Concepts, Inc. * | 13,697 | 335,303 |
| U.S. Physical Therapy, Inc. | 5,493 | 487,778 |
| UFP Technologies, Inc. * | 2,930 | 274,980 |
| UnitedHealth Group, Inc. | 387,904 | 215,344,906 |
| Universal Health Services, Inc., Class B | 27,675 | 3,206,702 |
| UpHealth, Inc. * | 28,000 | 14,974 |
| Utah Medical Products, Inc. | 1,365 | 122,236 |
| Varex Imaging Corp. * | 17,095 | 377,970 |
| Veeva Systems, Inc., Class A * | 58,361 | 9,801,146 |
| Vicarious Surgical, Inc. * | 13,695 | 53,000 |
| ViewRay, Inc. * | 56,246 | 241,295 |
| Vivani Medical, Inc. * | 5,513 | 9,978 |
| VolitionRX Ltd. * | 15,384 | 30,614 |
| Zimmer Biomet Holdings, Inc. | 87,099 | 9,872,672 |
| Zimvie, Inc. * | 8,294 | 72,738 |
| Zomedica Corp. * | 343,967 | 79,044 |
| Zynex, Inc. | 7,546 | 86,024 |
| 1,006,440,533 | ||
| Household & Personal Products 1.4% | ||
| BellRing Brands, Inc. * | 56,195 | 1,361,043 |
| Central Garden & Pet Co. * | 4,564 | 188,356 |
| Central Garden & Pet Co., Class A * | 18,320 | 717,045 |
| Church & Dwight Co., Inc. | 100,400 | 7,442,652 |
| Colgate-Palmolive Co. | 345,364 | 25,501,678 |
| Coty, Inc., Class A * | 148,801 | 998,455 |
| Edgewell Personal Care Co. | 22,085 | 865,511 |
| elf Beauty, Inc. * | 20,376 | 881,466 |
| Energizer Holdings, Inc. | 27,581 | 796,815 |
| Herbalife Nutrition Ltd. * | 41,704 | 886,627 |
| Inter Parfums, Inc. | 7,370 | 596,086 |
| Kimberly-Clark Corp. | 140,231 | 17,453,150 |
| LifeMD, Inc. * | 20,209 | 44,258 |
| Medifast, Inc. | 4,730 | 553,363 |
| Nature's Sunshine Products, Inc. * | 4,762 | 40,191 |
| Nu Skin Enterprises, Inc., Class A | 20,689 | 790,113 |
| Oil-Dri Corp. of America | 2,782 | 82,153 |
| Olaplex Holdings, Inc. * | 35,606 | 156,666 |
| Reynolds Consumer Products, Inc. | 22,884 | 698,877 |
| Spectrum Brands Holdings, Inc. | 16,690 | 770,077 |
| The Beauty Health Co. * | 44,301 | 506,360 |
| The Clorox Co. | 50,920 | 7,436,357 |
| The Estee Lauder Cos., Inc., Class A | 96,232 | 19,293,554 |
| The Honest Co., Inc. * | 28,282 | 93,613 |
| The Procter & Gamble Co. | 990,920 | 133,447,196 |
| SECURITY | NUMBER OF SHARES | VALUE ($) |
| Thorne HealthTech, Inc. * | 3,990 | 19,391 |
| USANA Health Sciences, Inc. * | 4,815 | 252,836 |
| Veru, Inc. * | 21,463 | 262,707 |
| WD-40 Co. | 5,696 | 912,271 |
| 223,048,867 | ||
| Insurance 2.4% | ||
| Aflac, Inc. | 238,329 | 15,517,601 |
| Ambac Financial Group, Inc. * | 18,028 | 253,293 |
| American Equity Investment Life Holding Co. | 29,803 | 1,283,913 |
| American Financial Group, Inc. | 28,965 | 4,203,111 |
| American International Group, Inc. | 315,092 | 17,960,244 |
| AMERISAFE, Inc. | 8,109 | 473,647 |
| Aon plc, Class A | 87,420 | 24,607,856 |
| Arch Capital Group Ltd. * | 153,054 | 8,800,605 |
| Argo Group International Holdings Ltd. | 14,607 | 363,276 |
| Arthur J. Gallagher & Co. | 87,200 | 16,313,376 |
| Assurant, Inc. | 22,251 | 3,023,021 |
| Assured Guaranty Ltd. | 25,302 | 1,497,625 |
| Axis Capital Holdings Ltd. | 32,185 | 1,759,554 |
| Bright Health Group, Inc. *(a) | 113,463 | 116,867 |
| Brighthouse Financial, Inc. * | 29,618 | 1,690,299 |
| Brown & Brown, Inc. | 97,385 | 5,725,264 |
| BRP Group, Inc., Class A * | 25,134 | 712,549 |
| Chubb Ltd. | 173,000 | 37,175,970 |
| Cincinnati Financial Corp. | 66,448 | 6,865,407 |
| Citizens, Inc. * | 24,606 | 66,190 |
| CNA Financial Corp. | 10,634 | 443,438 |
| CNO Financial Group, Inc. | 48,193 | 1,063,138 |
| Crawford & Co., Class A | 10,215 | 61,188 |
| Donegal Group, Inc., Class A | 6,507 | 95,262 |
| Employers Holdings, Inc. | 11,498 | 501,428 |
| Enstar Group Ltd. * | 5,989 | 1,200,914 |
| Erie Indemnity Co., Class A | 10,282 | 2,642,577 |
| Everest Re Group Ltd. | 16,416 | 5,296,786 |
| Fidelity National Financial, Inc. | 115,011 | 4,529,133 |
| First American Financial Corp. | 42,749 | 2,154,550 |
| Genworth Financial, Inc., Class A * | 212,439 | 992,090 |
| Globe Life, Inc. | 37,580 | 4,341,242 |
| Goosehead Insurance, Inc., Class A * | 8,507 | 353,126 |
| Greenlight Capital Re Ltd., Class A * | 13,165 | 111,113 |
| Hagerty, Inc., Class A *(a) | 11,439 | 103,980 |
| Hallmark Financial Services, Inc. * | 12,358 | 11,686 |
| HCI Group, Inc. | 3,137 | 114,940 |
| Heritage Insurance Holdings, Inc. | 17,646 | 26,469 |
| Hippo Holdings, Inc. * | 6,682 | 115,475 |
| Horace Mann Educators Corp. | 16,921 | 667,703 |
| Investors Title Co. | 697 | 102,424 |
| James River Group Holdings Ltd. | 17,575 | 444,120 |
| Kemper Corp. | 27,177 | 1,295,528 |
| Kingsway Financial Services, Inc. * | 9,776 | 66,966 |
| Kinsale Capital Group, Inc. | 8,975 | 2,828,651 |
| Lemonade, Inc. *(a) | 18,176 | 439,859 |
| Lincoln National Corp. | 63,879 | 3,441,162 |
| Loews Corp. | 82,497 | 4,703,979 |
| Maiden Holdings Ltd. * | 32,952 | 73,483 |
| Markel Corp. * | 5,634 | 6,795,167 |
| Marsh & McLennan Cos., Inc. | 206,697 | 33,379,498 |
| MBIA, Inc. * | 19,104 | 205,559 |
| Mercury General Corp. | 11,235 | 325,815 |
| MetLife, Inc. | 277,481 | 20,314,384 |
| National Western Life Group, Inc., Class A | 904 | 179,010 |
| NI Holdings, Inc. * | 3,782 | 51,359 |
| Old Republic International Corp. | 119,724 | 2,778,794 |
| SECURITY | NUMBER OF SHARES | VALUE ($) |
| Oscar Health, Inc., Class A * | 48,793 | 181,998 |
| Palomar Holdings, Inc. * | 10,660 | 948,314 |
| Primerica, Inc. | 15,424 | 2,231,853 |
| Principal Financial Group, Inc. | 95,691 | 8,433,248 |
| ProAssurance Corp. | 22,265 | 494,506 |
| Prudential Financial, Inc. | 154,615 | 16,263,952 |
| Reinsurance Group of America, Inc. | 27,786 | 4,089,266 |
| RenaissanceRe Holdings Ltd. | 18,561 | 2,871,015 |
| RLI Corp. | 16,563 | 2,154,349 |
| Ryan Specialty Group Holdings, Inc., Class A * | 33,933 | 1,521,895 |
| Safety Insurance Group, Inc. | 6,559 | 570,305 |
| Selective Insurance Group, Inc. | 25,005 | 2,452,490 |
| SiriusPoint Ltd. * | 42,729 | 274,320 |
| Stewart Information Services Corp. | 10,910 | 425,054 |
| The Allstate Corp. | 112,343 | 14,183,304 |
| The Hanover Insurance Group, Inc. | 14,638 | 2,144,321 |
| The Hartford Financial Services Group, Inc. | 134,324 | 9,726,401 |
| The Progressive Corp. | 242,633 | 31,154,077 |
| The Travelers Cos., Inc. | 98,314 | 18,135,000 |
| Tiptree, Inc. | 7,504 | 91,399 |
| Trean Insurance Group, Inc. * | 8,248 | 30,270 |
| Trupanion, Inc. * | 14,284 | 720,913 |
| United Fire Group, Inc. | 9,091 | 246,366 |
| United Insurance Holdings Corp. | 19,297 | 7,875 |
| Universal Insurance Holdings, Inc. | 12,847 | 128,984 |
| Unum Group | 78,158 | 3,563,223 |
| W.R. Berkley Corp. | 84,428 | 6,279,755 |
| White Mountains Insurance Group Ltd. | 1,045 | 1,479,877 |
| Willis Towers Watson plc | 45,519 | 9,932,701 |
| 391,398,695 | ||
| Materials 2.8% | ||
| 5E Advanced Materials, Inc. * | 11,374 | 152,184 |
| Advanced Emissions Solutions, Inc. * | 5,901 | 16,936 |
| AdvanSix, Inc. | 11,778 | 428,484 |
| AgroFresh Solutions, Inc. * | 24,132 | 65,639 |
| Air Products & Chemicals, Inc. | 91,997 | 23,036,049 |
| Albemarle Corp. | 48,647 | 13,614,836 |
| Alcoa Corp. | 73,976 | 2,887,283 |
| Alpha Metallurgical Resources, Inc. | 6,417 | 1,083,510 |
| Amcor plc | 621,747 | 7,199,830 |
| American Vanguard Corp. | 11,255 | 261,904 |
| Ampco-Pittsburgh Corp. * | 7,848 | 23,936 |
| Amyris, Inc. *(a) | 98,157 | 275,821 |
| AptarGroup, Inc. | 27,260 | 2,702,829 |
| Arconic Corp. * | 42,544 | 883,213 |
| Ascent Industries Co. * | 4,646 | 67,599 |
| Ashland, Inc. | 20,552 | 2,156,316 |
| Aspen Aerogels, Inc. * | 11,432 | 144,958 |
| ATI, Inc. * | 53,557 | 1,593,856 |
| Avery Dennison Corp. | 33,762 | 5,724,347 |
| Avient Corp. | 35,198 | 1,213,979 |
| Axalta Coating Systems Ltd. * | 90,692 | 2,114,937 |
| Balchem Corp. | 13,365 | 1,868,427 |
| Ball Corp. | 130,276 | 6,434,332 |
| Berry Global Group, Inc. * | 52,077 | 2,464,284 |
| Cabot Corp. | 23,218 | 1,706,059 |
| Carpenter Technology Corp. | 19,822 | 741,343 |
| Celanese Corp. | 41,267 | 3,966,584 |
| Century Aluminum Co. * | 19,701 | 142,044 |
| CF Industries Holdings, Inc. | 82,776 | 8,795,778 |
| Chase Corp. | 3,075 | 289,696 |
| Clearwater Paper Corp. * | 6,439 | 286,407 |
| Cleveland-Cliffs, Inc. * | 214,557 | 2,787,095 |
| SECURITY | NUMBER OF SHARES | VALUE ($) |
| Coeur Mining, Inc. * | 116,862 | 441,738 |
| Commercial Metals Co. | 50,623 | 2,303,347 |
| Compass Minerals International, Inc. | 14,554 | 575,465 |
| Contango ORE, Inc. * | 1,750 | 42,175 |
| Core Molding Technologies, Inc. * | 5,001 | 49,560 |
| Corteva, Inc. | 297,974 | 19,469,621 |
| Crown Holdings, Inc. | 50,336 | 3,452,546 |
| Dakota Gold Corp. * | 24,511 | 84,563 |
| Danimer Scientific, Inc. *(a) | 34,263 | 89,769 |
| Diversey Holdings Ltd. * | 34,563 | 186,640 |
| Dow, Inc. | 297,832 | 13,920,668 |
| DuPont de Nemours, Inc. | 208,442 | 11,922,882 |
| Eagle Materials, Inc. | 15,463 | 1,891,280 |
| Eastman Chemical Co. | 50,815 | 3,903,100 |
| Ecolab, Inc. | 102,673 | 16,126,848 |
| Ecovyst, Inc. * | 30,335 | 301,833 |
| Element Solutions, Inc. | 93,645 | 1,610,694 |
| Flotek Industries, Inc. * | 33,484 | 38,172 |
| FMC Corp. | 52,408 | 6,231,311 |
| Freeport-McMoRan, Inc. | 592,390 | 18,772,839 |
| Friedman Industries, Inc. | 2,834 | 27,206 |
| FutureFuel Corp. | 9,399 | 64,289 |
| Gatos Silver, Inc. * | 17,898 | 59,063 |
| Ginkgo Bioworks Holdings, Inc. *(a) | 351,146 | 958,629 |
| Glatfelter Corp. | 18,834 | 53,300 |
| Gold Resource Corp. | 39,537 | 63,259 |
| Golden Minerals Co. * | 74,652 | 19,335 |
| Graphic Packaging Holding Co. | 127,829 | 2,934,954 |
| Greif, Inc., Class A | 13,364 | 884,830 |
| H.B. Fuller Co. | 21,775 | 1,517,935 |
| Hawkins, Inc. | 7,358 | 331,331 |
| Haynes International, Inc. | 5,389 | 263,576 |
| Hecla Mining Co. | 228,540 | 1,044,428 |
| Huntsman Corp. | 79,104 | 2,116,823 |
| Hycroft Mining Holding Corp. * | 60,156 | 41,484 |
| Idaho Strategic Resources, Inc. * | 4,628 | 26,750 |
| Ingevity Corp. * | 14,768 | 993,443 |
| Innospec, Inc. | 10,607 | 1,060,594 |
| International Flavors & Fragrances, Inc. | 105,687 | 10,316,108 |
| International Paper Co. | 149,754 | 5,033,232 |
| Intrepid Potash, Inc. * | 3,965 | 179,416 |
| Kaiser Aluminum Corp. | 6,881 | 555,916 |
| Koppers Holdings, Inc. | 8,623 | 215,230 |
| Kronos Worldwide, Inc. | 9,190 | 87,305 |
| Linde plc | 206,600 | 61,432,510 |
| Livent Corp. * | 75,115 | 2,371,381 |
| Loop Industries, Inc. *(a) | 9,523 | 28,283 |
| Louisiana-Pacific Corp. | 31,145 | 1,764,364 |
| LSB Industries, Inc. * | 15,818 | 278,871 |
| LyondellBasell Industries N.V., Class A | 105,291 | 8,049,497 |
| Martin Marietta Materials, Inc. | 25,858 | 8,687,771 |
| Materion Corp. | 8,274 | 709,165 |
| Mativ Holdings, Inc. | 23,942 | 568,383 |
| McEwen Mining, Inc. * | 18,705 | 68,273 |
| Mercer International, Inc. | 15,176 | 203,662 |
| Minerals Technologies, Inc. | 13,718 | 754,627 |
| MP Materials Corp. * | 38,060 | 1,143,322 |
| Myers Industries, Inc. | 14,310 | 290,350 |
| NewMarket Corp. | 2,823 | 859,152 |
| Newmont Corp. | 328,909 | 13,919,429 |
| Northern Technologies International Corp. | 5,289 | 73,253 |
| Nucor Corp. | 108,692 | 14,279,955 |
| O-I Glass, Inc. * | 65,831 | 1,073,704 |
| Olin Corp. | 56,058 | 2,968,271 |
| Olympic Steel, Inc. | 4,090 | 111,289 |
| SECURITY | NUMBER OF SHARES | VALUE ($) |
| Origin Materials, Inc. * | 53,958 | 306,481 |
| Orion Engineered Carbons S.A. | 24,587 | 392,409 |
| Packaging Corp. of America | 39,011 | 4,689,512 |
| Pactiv Evergreen, Inc. | 19,237 | 209,876 |
| Perimeter Solutions S.A. *(a) | 65,529 | 523,577 |
| Piedmont Lithium, Inc. * | 6,862 | 426,954 |
| PPG Industries, Inc. | 97,702 | 11,155,614 |
| PureCycle Technologies, Inc. *(a) | 55,133 | 455,950 |
| Quaker Chemical Corp. | 5,529 | 899,237 |
| Ramaco Resources, Inc. | 10,591 | 119,572 |
| Ranpak Holdings Corp. * | 15,372 | 58,414 |
| Rayonier Advanced Materials, Inc. * | 26,864 | 122,231 |
| Reliance Steel & Aluminum Co. | 24,889 | 5,014,636 |
| Resolute Forest Products, Inc. * | 18,295 | 380,719 |
| Royal Gold, Inc. | 27,247 | 2,587,375 |
| RPM International, Inc. | 53,440 | 5,053,821 |
| Ryerson Holding Corp. | 8,289 | 278,096 |
| Schnitzer Steel Industries, Inc., Class A | 10,451 | 282,072 |
| Sealed Air Corp. | 60,580 | 2,884,820 |
| Sensient Technologies Corp. | 17,088 | 1,221,108 |
| Silgan Holdings, Inc. | 34,923 | 1,653,953 |
| Smith-Midland Corp. * | 1,800 | 41,436 |
| Sonoco Products Co. | 40,699 | 2,526,594 |
| Steel Dynamics, Inc. | 72,003 | 6,771,882 |
| Stepan Co. | 8,581 | 896,200 |
| Summit Materials, Inc., Class A * | 48,664 | 1,282,296 |
| SunCoke Energy, Inc. | 34,174 | 248,103 |
| Sylvamo Corp. | 13,219 | 636,759 |
| The Chemours Co. | 63,918 | 1,829,972 |
| The Mosaic Co. | 143,560 | 7,716,350 |
| The Scotts Miracle-Gro Co. | 16,561 | 760,316 |
| The Sherwin-Williams Co. | 97,897 | 22,029,762 |
| TimkenSteel Corp. * | 16,743 | 291,998 |
| Tredegar Corp. | 10,770 | 117,285 |
| TriMas Corp. | 17,344 | 396,310 |
| Trinseo plc | 14,826 | 279,025 |
| Tronox Holdings plc, Class A | 47,310 | 567,720 |
| U.S. Antimony Corp. * | 59,275 | 22,525 |
| U.S. Gold Corp. * | 7,270 | 26,826 |
| United States Lime & Minerals, Inc. | 691 | 87,170 |
| United States Steel Corp. | 98,419 | 2,003,811 |
| Universal Stainless & Alloy Products, Inc. * | 5,210 | 38,294 |
| Valvoline, Inc. | 73,776 | 2,166,063 |
| Vulcan Materials Co. | 55,171 | 9,031,493 |
| Warrior Met Coal, Inc. | 20,726 | 769,764 |
| Westlake Corp. | 14,450 | 1,396,593 |
| WestRock Co. | 104,888 | 3,572,485 |
| Worthington Industries, Inc. | 12,362 | 587,937 |
| 449,840,890 | ||
| Media & Entertainment 5.7% | ||
| Activision Blizzard, Inc. | 294,677 | 21,452,486 |
| AdTheorent Holding Co., Inc. * | 21,011 | 44,543 |
| Advantage Solutions, Inc. * | 42,984 | 145,286 |
| Alphabet, Inc., Class A * | 2,487,065 | 235,052,513 |
| Alphabet, Inc., Class C * | 2,223,850 | 210,509,641 |
| Altice USA, Inc., Class A * | 87,610 | 579,102 |
| AMC Entertainment Holdings, Inc., Class A *(a) | 215,612 | 1,435,976 |
| AMC Networks, Inc., Class A * | 11,743 | 264,335 |
| Angi, Inc. * | 33,311 | 71,619 |
| Boston Omaha Corp., Class A * | 8,095 | 225,608 |
| Bumble, Inc., Class A * | 32,728 | 831,291 |
| BuzzFeed, Inc. * | 14,995 | 27,441 |
| Cable One, Inc. | 2,018 | 1,734,330 |
| SECURITY | NUMBER OF SHARES | VALUE ($) |
| Cardlytics, Inc. * | 14,367 | 135,481 |
| Cargurus, Inc. * | 38,772 | 564,520 |
| Cars.com, Inc. * | 29,801 | 413,638 |
| Charter Communications, Inc., Class A * | 46,059 | 16,932,210 |
| Chicken Soup For The Soul Entertainment, Inc. *(a) | 2,990 | 21,498 |
| Cinedigm Corp., Class A * | 54,801 | 29,001 |
| Cinemark Holdings, Inc. * | 44,949 | 476,909 |
| Clear Channel Outdoor Holdings, Inc. * | 193,206 | 276,285 |
| Comcast Corp., Class A | 1,827,590 | 58,007,707 |
| Cumulus Media, Inc., Class A * | 7,422 | 54,700 |
| Daily Journal Corp. * | 511 | 137,076 |
| DHI Group, Inc. * | 17,605 | 112,672 |
| DISH Network Corp., Class A * | 104,399 | 1,556,589 |
| Electronic Arts, Inc. | 109,536 | 13,797,155 |
| Emerald Holding, Inc. * | 15,388 | 51,396 |
| Endeavor Group Holdings, Inc., Class A * | 70,455 | 1,538,737 |
| Entravision Communications Corp., Class A | 23,831 | 111,529 |
| Eventbrite, Inc., Class A * | 32,039 | 210,496 |
| EverQuote, Inc., Class A * | 8,283 | 50,444 |
| FaZe Holdings, Inc. *(a) | 10,557 | 34,205 |
| Fluent, Inc. * | 30,212 | 38,671 |
| Fox Corp., Class A | 127,074 | 3,668,626 |
| Fox Corp., Class B | 58,734 | 1,597,565 |
| fuboTV, Inc. *(a) | 81,432 | 298,041 |
| Gaia, Inc. * | 10,263 | 24,015 |
| Gannett Co., Inc. * | 56,389 | 81,764 |
| Genius Brands International, Inc. * | 106,285 | 69,085 |
| Golden Matrix Group, Inc. * | 8,251 | 20,628 |
| Gray Television, Inc. | 36,454 | 515,824 |
| Harte Hanks, Inc. * | 3,347 | 38,390 |
| IAC, Inc. * | 32,808 | 1,597,093 |
| iHeartMedia, Inc., Class A * | 43,715 | 361,960 |
| Innovid Corp. *(a) | 35,745 | 133,686 |
| Integral Ad Science Holding Corp. * | 17,311 | 145,759 |
| IZEA Worldwide, Inc. * | 34,489 | 23,691 |
| John Wiley & Sons, Inc., Class A | 17,949 | 757,268 |
| Leafly Holdings, Inc. * | 12,341 | 10,940 |
| Lee Enterprises, Inc. * | 1,545 | 29,324 |
| Liberty Broadband Corp., Class A * | 6,963 | 594,083 |
| Liberty Broadband Corp., Class C * | 51,792 | 4,372,799 |
| Liberty Media Corp. - Liberty Braves, Class A * | 5,453 | 173,896 |
| Liberty Media Corp. - Liberty Braves, Class C * | 15,115 | 470,983 |
| Liberty Media Corp. - Liberty Formula One, Class A * | 9,643 | 501,629 |
| Liberty Media Corp. - Liberty Formula One, Class C * | 85,693 | 4,947,057 |
| Liberty Media Corp. - Liberty SiriusXM, Class A * | 30,594 | 1,298,409 |
| Liberty Media Corp. - Liberty SiriusXM, Class C * | 64,011 | 2,700,624 |
| Lions Gate Entertainment Corp., Class A * | 25,512 | 205,627 |
| Lions Gate Entertainment Corp., Class B * | 50,349 | 382,149 |
| Live Nation Entertainment, Inc. * | 59,214 | 4,714,027 |
| LiveOne, Inc. * | 39,793 | 28,420 |
| Madison Square Garden Entertainment Corp. * | 11,111 | 544,772 |
| Madison Square Garden Sports Corp. | 7,569 | 1,185,381 |
| Magnite, Inc. * | 47,801 | 348,469 |
| SECURITY | NUMBER OF SHARES | VALUE ($) |
| Marchex, Inc., Class B * | 24,313 | 39,144 |
| Match Group, Inc. * | 117,842 | 5,090,774 |
| MediaAlpha, Inc., Class A * | 8,473 | 93,034 |
| Meta Platforms, Inc., Class A * | 946,150 | 88,143,334 |
| National CineMedia, Inc. | 46,329 | 20,431 |
| Netflix, Inc. * | 184,548 | 53,865,870 |
| News Corp., Class A | 157,600 | 2,658,712 |
| News Corp., Class B | 53,135 | 910,203 |
| Nexstar Media Group, Inc., Class A | 16,049 | 2,749,194 |
| Nextdoor Holdings, Inc. * | 50,057 | 135,655 |
| Omnicom Group, Inc. | 84,624 | 6,156,396 |
| Outbrain, Inc. * | 17,672 | 75,636 |
| Paramount Global, Class B | 211,736 | 3,879,004 |
| Pinterest, Inc., Class A * | 242,139 | 5,956,619 |
| Playstudios, Inc. * | 32,347 | 145,885 |
| Playtika Holding Corp. * | 42,036 | 397,240 |
| PubMatic, Inc., Class A * | 17,470 | 303,978 |
| QuinStreet, Inc. * | 21,564 | 246,045 |
| Reading International, Inc., Class B * | 3,627 | 72,322 |
| Reservoir Media, Inc. * | 14,527 | 84,257 |
| ROBLOX Corp., Class A * | 149,410 | 6,684,603 |
| Roku, Inc. * | 50,759 | 2,819,155 |
| Saga Communications, Inc., Class A | 1,314 | 30,353 |
| Scholastic Corp. | 12,105 | 461,685 |
| Sciplay Corp., Class A * | 10,406 | 145,580 |
| Shutterstock, Inc. | 9,934 | 496,998 |
| Sinclair Broadcast Group, Inc., Class A | 17,890 | 318,621 |
| Sirius XM Holdings, Inc. (a) | 292,389 | 1,766,030 |
| Skillz, Inc. *(a) | 144,679 | 149,019 |
| Snap, Inc., Class A * | 428,674 | 4,248,159 |
| Stagwell, Inc. * | 43,953 | 333,603 |
| System1, Inc. * | 6,938 | 35,939 |
| Take-Two Interactive Software, Inc. * | 65,169 | 7,721,223 |
| TechTarget, Inc. * | 10,886 | 702,691 |
| TEGNA, Inc. | 91,837 | 1,917,557 |
| The Arena Group Holdings, Inc. * | 4,958 | 69,908 |
| The E.W. Scripps Co., Class A * | 22,843 | 324,142 |
| The Interpublic Group of Cos., Inc. | 161,190 | 4,801,850 |
| The Marcus Corp. | 10,398 | 156,386 |
| The New York Times Co., Class A | 67,939 | 1,967,513 |
| The Trade Desk, Inc., Class A * | 184,567 | 9,826,347 |
| The Walt Disney Co. * | 756,441 | 80,591,224 |
| Thryv Holdings, Inc. * | 12,739 | 260,640 |
| Townsquare Media, Inc., Class A * | 2,521 | 19,059 |
| Travelzoo * | 4,020 | 20,944 |
| TripAdvisor, Inc. * | 42,436 | 1,002,338 |
| TrueCar, Inc. * | 41,115 | 74,007 |
| Urban One, Inc. * | 12,414 | 61,698 |
| Vimeo, Inc. * | 62,096 | 235,965 |
| Vinco Ventures, Inc. *(a) | 68,845 | 62,759 |
| Warner Bros Discovery, Inc. * | 916,477 | 11,914,201 |
| Warner Music Group Corp., Class A | 47,996 | 1,248,856 |
| Wejo Group Ltd. * | 19,449 | 21,005 |
| WideOpenWest, Inc. * | 20,526 | 281,411 |
| World Wrestling Entertainment, Inc., Class A | 18,071 | 1,425,621 |
| Yelp, Inc. * | 28,463 | 1,093,264 |
| Zedge, Inc., Class B * | 4,350 | 9,222 |
| Ziff Davis, Inc. * | 19,491 | 1,508,409 |
| ZipRecruiter, Inc., Class A * | 23,798 | 399,092 |
| ZoomInfo Technologies, Inc. * | 112,544 | 5,011,584 |
| 920,009,468 | ||
| Pharmaceuticals, Biotechnology & Life Sciences 8.7% | ||
| 10X Genomics, Inc., Class A * | 40,155 | 1,091,413 |
| 2seventy bio, Inc. * | 16,616 | 263,862 |
| SECURITY | NUMBER OF SHARES | VALUE ($) |
| 4D Molecular Therapeutics, Inc. * | 11,190 | 96,905 |
| 89bio, Inc. * | 15,302 | 146,134 |
| 9 Meters Biopharma, Inc. * | 5,388 | 13,846 |
| Aadi Bioscience, Inc. * | 4,421 | 57,097 |
| AbbVie, Inc. | 733,192 | 107,339,309 |
| Absci Corp. *(a) | 23,263 | 73,511 |
| ACADIA Pharmaceuticals, Inc. * | 50,473 | 809,082 |
| AcelRx Pharmaceuticals, Inc. * | 6,381 | 16,846 |
| Achieve Life Sciences, Inc. * | 8,279 | 18,297 |
| Aclaris Therapeutics, Inc. * | 21,790 | 340,142 |
| Actinium Pharmaceuticals, Inc. * | 7,539 | 102,078 |
| Acumen Pharmaceuticals, Inc. * | 9,845 | 68,127 |
| Adamis Pharmaceuticals Corp. * | 56,257 | 7,876 |
| Adaptive Biotechnologies Corp. * | 43,198 | 336,080 |
| Adicet Bio, Inc. * | 13,243 | 218,377 |
| ADMA Biologics, Inc. * | 69,227 | 195,220 |
| Adverum Biotechnologies, Inc. * | 62,914 | 54,421 |
| Aerie Pharmaceuticals, Inc. * | 21,427 | 326,119 |
| Aerovate Therapeutics, Inc. * | 3,663 | 71,465 |
| Agenus, Inc. * | 98,112 | 246,261 |
| Agilent Technologies, Inc. | 124,011 | 17,156,922 |
| Agios Pharmaceuticals, Inc. * | 22,582 | 621,908 |
| Akebia Therapeutics, Inc. * | 132,370 | 33,688 |
| Akero Therapeutics, Inc. * | 13,474 | 569,411 |
| Akouos, Inc. * | 10,685 | 140,721 |
| Akoya Biosciences, Inc. * | 7,848 | 107,910 |
| Alaunos Therapeutics, Inc. *(a) | 82,975 | 95,421 |
| Albireo Pharma, Inc. * | 8,505 | 174,523 |
| Aldeyra Therapeutics, Inc. * | 22,201 | 121,217 |
| Alector, Inc. * | 26,074 | 239,881 |
| Alkermes plc * | 69,307 | 1,573,269 |
| Allakos, Inc. * | 36,806 | 214,579 |
| Allogene Therapeutics, Inc. * | 38,872 | 400,382 |
| Allovir, Inc. * | 18,004 | 124,768 |
| Alnylam Pharmaceuticals, Inc. * | 49,729 | 10,306,833 |
| Alpha Teknova, Inc. * | 2,787 | 12,792 |
| Alpine Immune Sciences, Inc. * | 5,500 | 32,505 |
| Altimmune, Inc. * | 17,274 | 216,616 |
| ALX Oncology Holdings, Inc. * | 7,977 | 96,841 |
| Amgen, Inc. | 221,709 | 59,939,028 |
| Amicus Therapeutics, Inc. * | 106,825 | 1,068,250 |
| Amneal Pharmaceuticals, Inc. * | 43,587 | 95,891 |
| Amphastar Pharmaceuticals, Inc. * | 16,546 | 511,271 |
| Amylyx Pharmaceuticals, Inc. * | 16,143 | 575,821 |
| AnaptysBio, Inc. * | 7,720 | 222,722 |
| Anavex Life Sciences Corp. * | 30,282 | 368,532 |
| ANI Pharmaceuticals, Inc. * | 4,883 | 188,435 |
| Anika Therapeutics, Inc. * | 5,811 | 165,149 |
| Anixa Biosciences, Inc. * | 12,785 | 71,596 |
| Annexon, Inc. * | 19,332 | 92,407 |
| Annovis Bio, Inc. * | 2,061 | 25,866 |
| Apellis Pharmaceuticals, Inc. * | 38,509 | 2,329,409 |
| Apexigen, Inc. * | 8,029 | 18,105 |
| AquaBounty Technologies, Inc. * | 44,032 | 31,483 |
| Arbutus Biopharma Corp. * | 50,681 | 118,594 |
| Arcellx, Inc. * | 11,614 | 272,697 |
| Arcturus Therapeutics Holdings, Inc. * | 8,656 | 153,211 |
| Arcus Biosciences, Inc. * | 21,937 | 558,955 |
| Arcutis Biotherapeutics, Inc. * | 17,059 | 301,603 |
| Ardelyx, Inc. * | 50,000 | 75,000 |
| Arrowhead Pharmaceuticals, Inc. * | 43,314 | 1,507,760 |
| Arvinas, Inc. * | 20,555 | 1,021,789 |
| Assembly Biosciences, Inc. * | 32,452 | 53,221 |
| Assertio Holdings, Inc. * | 23,152 | 59,732 |
| Astria Therapeutics, Inc. * | 2,432 | 23,396 |
| Atara Biotherapeutics, Inc. * | 43,101 | 200,851 |
| Atea Pharmaceuticals, Inc. * | 33,404 | 200,424 |
| Athira Pharma, Inc. * | 13,857 | 45,867 |
| SECURITY | NUMBER OF SHARES | VALUE ($) |
| Atossa Therapeutics, Inc. * | 45,962 | 45,282 |
| aTyr Pharma, Inc. * | 10,000 | 24,700 |
| Aura Biosciences, Inc. * | 6,688 | 82,864 |
| Avantor, Inc. * | 279,527 | 5,638,060 |
| AVEO Pharmaceuticals, Inc. * | 11,178 | 165,099 |
| Avid Bioservices, Inc. * | 24,799 | 420,095 |
| Avidity Biosciences, Inc. * | 22,625 | 323,085 |
| Avita Medical, Inc. * | 10,054 | 49,164 |
| Avrobio, Inc. * | 37,231 | 25,332 |
| Axcella Health, Inc. * | 18,250 | 21,900 |
| Axsome Therapeutics, Inc. * | 12,826 | 579,094 |
| Azenta, Inc. | 30,816 | 1,368,230 |
| Beam Therapeutics, Inc. * | 24,638 | 1,085,550 |
| BioAtla, Inc. * | 13,027 | 89,756 |
| BioCryst Pharmaceuticals, Inc. * | 76,932 | 1,027,042 |
| Biogen, Inc. * | 60,261 | 17,080,378 |
| Biohaven Ltd. * | 23,686 | 392,477 |
| BioLife Solutions, Inc. * | 13,293 | 312,651 |
| BioMarin Pharmaceutical, Inc. * | 77,109 | 6,679,953 |
| Biomea Fusion, Inc. * | 7,680 | 84,480 |
| Bionano Genomics, Inc. *(a) | 121,204 | 283,617 |
| Biora Therapeutics, Inc. * | 45,000 | 17,154 |
| Bio-Rad Laboratories, Inc., Class A * | 8,863 | 3,117,206 |
| Bio-Techne Corp. | 16,268 | 4,819,558 |
| Bioxcel Therapeutics, Inc. *(a) | 12,322 | 155,134 |
| Bluebird Bio, Inc. * | 30,202 | 189,367 |
| Blueprint Medicines Corp. * | 24,573 | 1,273,864 |
| BrainStorm Cell Therapeutics, Inc. * | 11,287 | 40,182 |
| Bridgebio Pharma, Inc. * | 42,565 | 443,953 |
| Bright Green Corp. * | 28,510 | 17,226 |
| Bristol-Myers Squibb Co. | 885,484 | 68,598,445 |
| Bruker Corp. | 41,933 | 2,593,137 |
| C4 Therapeutics, Inc. * | 16,467 | 158,413 |
| Capricor Therapeutics, Inc. * | 6,502 | 36,151 |
| Cara Therapeutics, Inc. * | 16,617 | 156,200 |
| Cardiff Oncology, Inc. * | 16,399 | 26,730 |
| CareDx, Inc. * | 22,269 | 443,376 |
| Caribou Biosciences, Inc. * | 23,459 | 228,491 |
| CASI Pharmaceuticals, Inc. * | 5,406 | 10,650 |
| Cassava Sciences, Inc. *(a) | 15,959 | 581,546 |
| Catalent, Inc. * | 74,408 | 4,890,838 |
| Catalyst Pharmaceuticals, Inc. * | 37,080 | 514,300 |
| Celcuity, Inc. * | 4,926 | 49,260 |
| Celldex Therapeutics, Inc. * | 19,973 | 701,651 |
| CEL-SCI Corp. *(a) | 16,481 | 57,189 |
| Celularity, Inc. *(a) | 27,363 | 63,756 |
| Century Therapeutics, Inc. *(a) | 10,076 | 105,798 |
| Cerevel Therapeutics Holdings, Inc. * | 26,524 | 741,611 |
| Charles River Laboratories International, Inc. * | 21,012 | 4,459,797 |
| Checkpoint Therapeutics, Inc. *(a) | 33,712 | 33,712 |
| Chimerix, Inc. * | 37,732 | 66,786 |
| Chinook Therapeutics, Inc. * | 20,422 | 444,178 |
| ChromaDex Corp. * | 24,667 | 37,494 |
| CinCor Pharma, Inc. *(a) | 7,319 | 246,211 |
| Citius Pharmaceuticals, Inc. * | 76,073 | 82,159 |
| Clearside Biomedical, Inc. * | 20,216 | 23,046 |
| Clene, Inc. *(a) | 7,741 | 7,664 |
| Clovis Oncology, Inc. *(a) | 58,000 | 59,740 |
| Codexis, Inc. * | 29,943 | 168,280 |
| Cogent Biosciences, Inc. * | 27,590 | 376,603 |
| Coherus Biosciences, Inc. * | 26,548 | 230,968 |
| Collegium Pharmaceutical, Inc. * | 14,303 | 256,596 |
| Compass Therapeutics, Inc. * | 31,736 | 100,286 |
| Concert Pharmaceuticals, Inc. * | 15,686 | 93,332 |
| Corbus Pharmaceuticals Holdings, Inc. * | 99,416 | 12,924 |
| Corcept Therapeutics, Inc. * | 39,875 | 1,140,425 |
| SECURITY | NUMBER OF SHARES | VALUE ($) |
| CorMedix, Inc. * | 13,948 | 42,820 |
| Crinetics Pharmaceuticals, Inc. * | 18,689 | 344,999 |
| CRISPR Therapeutics AG * | 32,384 | 1,694,979 |
| CryoPort, Inc. * | 19,272 | 534,991 |
| CTI BioPharma Corp. * | 37,496 | 183,730 |
| Cue Biopharma, Inc. * | 12,652 | 33,654 |
| Cullinan Oncology, Inc. * | 13,170 | 173,054 |
| Curis, Inc. * | 57,090 | 45,683 |
| Cymabay Therapeutics, Inc. * | 34,566 | 120,290 |
| Cytek Biosciences, Inc. * | 33,714 | 523,241 |
| Cytokinetics, Inc. * | 38,646 | 1,687,284 |
| CytomX Therapeutics, Inc. * | 42,221 | 55,310 |
| Danaher Corp. | 271,467 | 68,320,100 |
| Dare Bioscience, Inc. * | 30,532 | 29,616 |
| Day One Biopharmaceuticals, Inc. * | 11,713 | 247,613 |
| Decibel Therapeutics, Inc. * | 10,345 | 38,277 |
| Deciphera Pharmaceuticals, Inc. * | 19,146 | 310,548 |
| Denali Therapeutics, Inc. * | 44,929 | 1,288,564 |
| DermTech, Inc. *(a) | 10,214 | 32,889 |
| Design Therapeutics, Inc. * | 12,455 | 194,547 |
| DICE Therapeutics, Inc. * | 13,633 | 484,108 |
| Durect Corp. * | 113,441 | 73,737 |
| Dynavax Technologies Corp. * | 48,083 | 550,550 |
| Dyne Therapeutics, Inc. * | 10,151 | 115,721 |
| Eagle Pharmaceuticals, Inc. * | 4,393 | 138,248 |
| Edgewise Therapeutics, Inc. * | 12,223 | 116,241 |
| Editas Medicine, Inc. * | 27,610 | 346,505 |
| Eiger BioPharmaceuticals, Inc. * | 16,477 | 84,197 |
| Elanco Animal Health, Inc. * | 183,578 | 2,421,394 |
| Eli Lilly & Co. | 327,146 | 118,456,295 |
| Emergent BioSolutions, Inc. * | 18,800 | 392,168 |
| Enanta Pharmaceuticals, Inc. * | 7,950 | 358,624 |
| Enochian Biosciences, Inc. *(a) | 7,537 | 15,300 |
| Entrada Therapeutics, Inc. *(a) | 7,643 | 174,184 |
| EQRx, Inc. * | 91,140 | 468,460 |
| Erasca, Inc. * | 26,687 | 218,033 |
| Esperion Therapeutics, Inc. * | 23,247 | 188,998 |
| Eton Pharmaceuticals, Inc. * | 13,239 | 33,759 |
| Evelo Biosciences, Inc. * | 31,345 | 63,944 |
| Evolus, Inc. * | 13,267 | 113,566 |
| Exact Sciences Corp. * | 74,609 | 2,594,901 |
| Exagen, Inc. * | 4,095 | 10,033 |
| Exelixis, Inc. * | 135,557 | 2,247,535 |
| Eyenovia Inc. * | 24,562 | 53,054 |
| EyePoint Pharmaceuticals, Inc. * | 11,679 | 63,067 |
| Fate Therapeutics, Inc. * | 33,551 | 701,887 |
| FibroGen, Inc. * | 35,771 | 582,352 |
| Finch Therapeutics Group, Inc. * | 18,783 | 24,418 |
| Foghorn Therapeutics, Inc. *(a) | 8,974 | 78,433 |
| Fortress Biotech, Inc. * | 29,965 | 24,874 |
| Frequency Therapeutics, Inc. * | 23,364 | 40,420 |
| F-star Therapeutics, Inc. *(a) | 4,676 | 26,045 |
| Fulcrum Therapeutics, Inc. * | 17,307 | 96,227 |
| G1 Therapeutics, Inc. * | 15,530 | 165,550 |
| Galectin Therapeutics, Inc. * | 17,413 | 24,030 |
| Gelesis Holdings, Inc. * | 16,733 | 6,236 |
| Generation Bio Co. * | 16,915 | 86,605 |
| Genprex, Inc. *(a) | 29,742 | 40,449 |
| Geron Corp. * | 140,170 | 311,177 |
| Gilead Sciences, Inc. | 519,677 | 40,773,857 |
| Gossamer Bio, Inc. * | 32,860 | 364,746 |
| Graphite Bio, Inc. * | 17,740 | 62,267 |
| GreenLight Biosciences Holdings PBC *(a) | 24,360 | 43,361 |
| Gritstone bio, Inc. * | 21,400 | 68,908 |
| Halozyme Therapeutics, Inc. * | 57,362 | 2,742,477 |
| Harmony Biosciences Holdings, Inc. * | 12,379 | 643,708 |
| Harrow Health, Inc. * | 12,577 | 151,301 |
| SECURITY | NUMBER OF SHARES | VALUE ($) |
| Harvard Bioscience, Inc. * | 14,274 | 38,397 |
| Hepion Pharmaceuticals, Inc. * | 31,535 | 16,792 |
| Heron Therapeutics, Inc. * | 40,824 | 157,172 |
| HilleVax, Inc. * | 5,558 | 118,830 |
| Homology Medicines, Inc. * | 21,971 | 32,737 |
| Hookipa Pharma, Inc. * | 36,285 | 46,808 |
| Horizon Therapeutics plc * | 95,701 | 5,964,086 |
| Humacyte, Inc. *(a) | 22,996 | 79,221 |
| iBio, Inc. * | 7,231 | 15,836 |
| Ideaya Biosciences, Inc. * | 12,679 | 214,148 |
| IGM Biosciences, Inc. * | 4,577 | 91,540 |
| Ikena Oncology, Inc. * | 12,066 | 33,182 |
| Illumina, Inc. * | 65,305 | 14,943,090 |
| Imago Biosciences, Inc. * | 10,740 | 182,580 |
| Immuneering Corp., Class A * | 8,677 | 120,176 |
| Immunic, Inc. *(a) | 11,662 | 20,642 |
| ImmunityBio, Inc. *(a) | 46,639 | 256,515 |
| ImmunoGen, Inc. * | 86,212 | 512,099 |
| Immunovant, Inc. * | 17,821 | 199,595 |
| Impel Pharmaceuticals, Inc. * | 6,722 | 26,283 |
| Incyte Corp. * | 76,598 | 5,694,295 |
| Infinity Pharmaceuticals, Inc. * | 29,948 | 37,136 |
| Inhibrx, Inc. * | 11,950 | 384,551 |
| Inmune Bio, Inc. * | 5,159 | 39,570 |
| Innoviva, Inc. * | 30,325 | 411,207 |
| Inotiv, Inc. * | 6,479 | 134,634 |
| Inovio Pharmaceuticals, Inc. * | 98,258 | 212,237 |
| Inozyme Pharma, Inc. * | 16,549 | 29,126 |
| Insmed, Inc. * | 55,472 | 960,775 |
| Instil Bio, Inc. * | 28,883 | 95,314 |
| Intellia Therapeutics, Inc. * | 31,551 | 1,665,262 |
| Intercept Pharmaceuticals, Inc. * | 11,183 | 155,108 |
| Intra-Cellular Therapies, Inc. * | 36,344 | 1,659,830 |
| Invivyd, Inc. *(a) | 24,069 | 95,073 |
| Ionis Pharmaceuticals, Inc. * | 59,618 | 2,635,116 |
| Iovance Biotherapeutics, Inc. * | 54,425 | 508,329 |
| IQVIA Holdings, Inc. * | 77,384 | 16,225,103 |
| Ironwood Pharmaceuticals, Inc. * | 56,987 | 623,438 |
| iTeos Therapeutics, Inc. * | 10,503 | 204,598 |
| IVERIC bio, Inc. * | 46,723 | 1,117,614 |
| Janux Therapeutics, Inc. *(a) | 8,881 | 160,568 |
| Jazz Pharmaceuticals plc * | 26,025 | 3,742,135 |
| Johnson & Johnson | 1,090,297 | 189,678,969 |
| Jounce Therapeutics, Inc. * | 16,599 | 36,186 |
| KalVista Pharmaceuticals, Inc. * | 8,852 | 44,880 |
| Karuna Therapeutics, Inc. * | 11,014 | 2,415,811 |
| Karyopharm Therapeutics, Inc. * | 32,474 | 154,576 |
| KemPharm, Inc. *(a) | 11,139 | 62,378 |
| Keros Therapeutics, Inc. * | 7,120 | 358,421 |
| Kezar Life Sciences, Inc. * | 22,737 | 170,869 |
| Kiniksa Pharmaceuticals Ltd., Class A * | 10,106 | 115,411 |
| Kinnate Biopharma, Inc. * | 6,937 | 58,479 |
| Kodiak Sciences, Inc. * | 13,152 | 94,431 |
| Kronos Bio, Inc. * | 16,500 | 48,840 |
| Krystal Biotech, Inc. * | 9,566 | 731,799 |
| Kura Oncology, Inc. * | 24,705 | 383,422 |
| Kymera Therapeutics, Inc. * | 14,238 | 431,981 |
| Larimar Therapeutics, Inc. * | 4,106 | 13,550 |
| Leap Therapeutics, Inc. * | 32,000 | 27,232 |
| Lexicon Pharmaceuticals, Inc. * | 46,637 | 100,270 |
| Ligand Pharmaceuticals, Inc. * | 6,316 | 553,597 |
| Lineage Cell Therapeutics, Inc. *(a) | 45,545 | 62,852 |
| Lipocine, Inc. * | 50,000 | 20,450 |
| Liquidia Corp. * | 20,793 | 101,678 |
| Lyell Immunopharma, Inc. * | 61,098 | 359,256 |
| Lyra Therapeutics, Inc. * | 9,060 | 42,491 |
| MacroGenics, Inc. * | 24,123 | 123,510 |
| SECURITY | NUMBER OF SHARES | VALUE ($) |
| Madrigal Pharmaceuticals, Inc. * | 5,052 | 357,783 |
| Magenta Therapeutics, Inc. * | 27,369 | 35,306 |
| MannKind Corp. * | 106,331 | 359,399 |
| Maravai LifeSciences Holdings, Inc., Class A * | 44,584 | 740,094 |
| Marinus Pharmaceuticals, Inc. * | 12,809 | 73,652 |
| Matinas BioPharma Holdings, Inc. * | 78,387 | 61,142 |
| MaxCyte, Inc. * | 38,683 | 267,686 |
| MediciNova, Inc. * | 17,843 | 36,400 |
| Medpace Holdings, Inc. * | 10,386 | 2,305,484 |
| Merck & Co., Inc. | 1,050,565 | 106,317,178 |
| Mersana Therapeutics, Inc. * | 38,382 | 301,683 |
| Mettler-Toledo International, Inc. * | 9,309 | 11,775,233 |
| MiMedx Group, Inc. * | 51,298 | 151,842 |
| Mirati Therapeutics, Inc. * | 21,261 | 1,431,291 |
| Miromatrix Medical, Inc. * | 11,036 | 40,281 |
| Mirum Pharmaceuticals, Inc. * | 10,568 | 238,308 |
| Moderna, Inc. * | 139,576 | 20,982,460 |
| Monte Rosa Therapeutics, Inc. * | 13,679 | 125,847 |
| Morphic Holding, Inc. * | 12,118 | 339,425 |
| Mustang Bio, Inc. * | 31,286 | 16,945 |
| MyMD Pharmaceuticals, Inc. * | 13,965 | 38,683 |
| Myovant Sciences Ltd. * | 16,883 | 451,451 |
| Myriad Genetics, Inc. * | 33,473 | 694,230 |
| NanoString Technologies, Inc. * | 18,579 | 194,336 |
| Natera, Inc. * | 40,292 | 1,892,112 |
| Nautilus Biotechnology, Inc. * | 22,256 | 54,972 |
| Nektar Therapeutics * | 73,818 | 277,556 |
| NeoGenomics, Inc. * | 52,485 | 399,148 |
| Neubase Therapeutics, Inc. * | 29,716 | 8,528 |
| Neurocrine Biosciences, Inc. * | 40,008 | 4,605,721 |
| NextCure, Inc. * | 10,000 | 25,000 |
| NGM Biopharmaceuticals, Inc. * | 15,070 | 80,474 |
| NightHawk Biosciences, Inc. *(a) | 9,763 | 14,840 |
| Nkarta, Inc. * | 14,673 | 185,027 |
| Novan, Inc. * | 17,180 | 21,303 |
| Novavax, Inc. * | 31,948 | 711,482 |
| Nurix Therapeutics, Inc. * | 17,330 | 220,611 |
| Nuvalent, Inc., Class A * | 8,473 | 302,571 |
| Nuvation Bio, Inc. * | 52,407 | 115,295 |
| Ocugen, Inc. *(a) | 92,871 | 159,738 |
| Ocular Therapeutix, Inc. * | 31,066 | 112,148 |
| Ocuphire Pharma, Inc. * | 14,928 | 35,081 |
| Olema Pharmaceuticals, Inc. * | 18,580 | 69,861 |
| Omega Therapeutics, Inc. * | 9,399 | 45,209 |
| Omeros Corp. *(a) | 21,844 | 72,304 |
| Oncocyte Corp. * | 62,284 | 42,590 |
| Oncternal Therapeutics, Inc. * | 32,249 | 33,861 |
| Opiant Pharmaceuticals, Inc. * | 2,300 | 21,919 |
| Optinose, Inc. * | 17,121 | 59,752 |
| Oragenics, Inc. * | 100,778 | 21,667 |
| Organogenesis Holdings, Inc. * | 24,028 | 78,812 |
| Organon & Co. | 104,421 | 2,733,742 |
| Orgenesis, Inc. * | 9,467 | 12,686 |
| ORIC Pharmaceuticals, Inc. * | 16,653 | 44,464 |
| Osmotica Pharmaceuticals plc * | 13,322 | 25,312 |
| Outlook Therapeutics, Inc. *(a) | 62,495 | 72,494 |
| Ovid therapeutics, Inc. * | 19,452 | 31,707 |
| Oyster Point Pharma, Inc. *(a) | 8,713 | 68,310 |
| Pacific Biosciences of California, Inc. * | 97,405 | 822,098 |
| Pacira BioSciences, Inc. * | 18,578 | 961,597 |
| Palatin Technologies, Inc. * | 5,171 | 28,700 |
| Paratek Pharmaceuticals, Inc. * | 17,405 | 61,962 |
| Pardes Biosciences, Inc. * | 13,159 | 15,791 |
| Passage Bio, Inc. * | 7,891 | 9,627 |
| PDS Biotechnology Corp. * | 7,907 | 41,433 |
| PepGen, Inc. *(a) | 2,561 | 31,449 |
| PerkinElmer, Inc. | 52,507 | 7,013,885 |
| SECURITY | NUMBER OF SHARES | VALUE ($) |
| Perrigo Co., plc | 57,008 | 2,296,282 |
| Pfizer, Inc. | 2,327,892 | 108,363,373 |
| Phathom Pharmaceuticals, Inc. * | 6,778 | 71,847 |
| Phibro Animal Health Corp., Class A | 8,185 | 120,238 |
| Pieris Pharmaceuticals, Inc. * | 35,732 | 39,663 |
| Pliant Therapeutics, Inc. * | 13,382 | 332,810 |
| PMV Pharmaceuticals, Inc. * | 14,570 | 179,357 |
| Point Biopharma Global, Inc. * | 29,078 | 271,298 |
| Poseida Therapeutics, Inc. * | 27,657 | 113,394 |
| Precigen, Inc. * | 66,913 | 108,399 |
| Precision BioSciences, Inc. * | 51,273 | 71,782 |
| Prelude Therapeutics, Inc. * | 7,515 | 50,275 |
| Prestige Consumer Healthcare, Inc. * | 20,626 | 1,123,704 |
| ProKidney Corp. *(a) | 6,842 | 69,241 |
| Prometheus Biosciences, Inc. * | 12,049 | 632,813 |
| ProPhase Labs, Inc. | 5,896 | 71,047 |
| Protagonist Therapeutics, Inc. * | 18,129 | 146,845 |
| Prothena Corp. plc * | 14,317 | 879,636 |
| Provention Bio, Inc. * | 35,185 | 244,184 |
| PTC Therapeutics, Inc. * | 29,513 | 1,116,182 |
| Puma Biotechnology, Inc. * | 9,429 | 20,555 |
| Pyxis Oncology, Inc. * | 17,739 | 33,172 |
| Quanterix Corp. * | 14,993 | 165,973 |
| Quantum-Si, Inc. *(a) | 32,018 | 97,015 |
| Quince Therapeutics, Inc. * | 11,013 | 11,013 |
| Rain Therapeutics, Inc. * | 8,522 | 48,746 |
| Rallybio Corp. * | 5,199 | 49,702 |
| Rani Therapeutics Holdings, Inc., Class A * | 2,793 | 17,037 |
| Rapid Micro Biosystems, Inc., Class A * | 6,797 | 19,847 |
| RAPT Therapeutics, Inc. * | 9,685 | 211,327 |
| Reata Pharmaceuticals, Inc., Class A * | 11,755 | 378,511 |
| Recursion Pharmaceuticals, Inc., Class A * | 49,917 | 526,624 |
| Regeneron Pharmaceuticals, Inc. * | 44,459 | 33,288,676 |
| REGENXBIO, Inc. * | 14,834 | 351,121 |
| Regulus Therapeutics, Inc. * | 9,113 | 14,125 |
| Relay Therapeutics, Inc. * | 36,689 | 815,230 |
| Relmada Therapeutics, Inc. * | 9,988 | 63,823 |
| Repligen Corp. * | 21,513 | 3,925,907 |
| Replimune Group, Inc. * | 15,440 | 283,478 |
| Revance Therapeutics, Inc. * | 33,153 | 739,643 |
| REVOLUTION Medicines, Inc. * | 30,019 | 608,185 |
| Rhythm Pharmaceuticals, Inc. * | 16,923 | 425,952 |
| Rigel Pharmaceuticals, Inc. * | 82,091 | 59,812 |
| Rocket Pharmaceuticals, Inc. * | 20,736 | 386,934 |
| Roivant Sciences Ltd. * | 51,436 | 264,381 |
| Royalty Pharma plc, Class A | 152,719 | 6,463,068 |
| SAB Biotherapeutics, Inc. * | 16,238 | 14,614 |
| Sage Therapeutics, Inc. * | 21,754 | 819,256 |
| Sana Biotechnology, Inc. * | 34,162 | 198,140 |
| Sangamo Therapeutics, Inc. * | 57,765 | 253,588 |
| Sarepta Therapeutics, Inc. * | 36,504 | 4,162,186 |
| Satsuma Pharmaceuticals, Inc. * | 5,234 | 27,112 |
| Savara, Inc. * | 42,882 | 52,745 |
| Scholar Rock Holding Corp. * | 17,416 | 169,980 |
| SCYNEXIS, Inc. * | 8,875 | 20,501 |
| Seagen, Inc. * | 56,836 | 7,227,266 |
| Seelos Therapeutics, Inc. * | 39,148 | 34,035 |
| Seer, Inc. * | 13,439 | 105,227 |
| Selecta Biosciences, Inc. * | 59,796 | 94,478 |
| SELLAS Life Sciences Group, Inc. * | 16,238 | 75,994 |
| Seres Therapeutics, Inc. * | 40,525 | 359,051 |
| Sesen Bio, Inc. * | 67,895 | 37,899 |
| Shattuck Labs, Inc. * | 20,881 | 55,335 |
| SIGA Technologies, Inc. | 17,097 | 157,121 |
| Silverback Therapeutics, Inc. * | 9,417 | 58,574 |
| SECURITY | NUMBER OF SHARES | VALUE ($) |
| Singular Genomics Systems, Inc. *(a) | 23,488 | 62,478 |
| Societal CDMO, Inc. * | 37,047 | 67,426 |
| SomaLogic, Inc. * | 61,519 | 213,471 |
| Sorrento Therapeutics, Inc. *(a) | 153,031 | 240,259 |
| Sotera Health Co. * | 40,149 | 276,225 |
| Spectrum Pharmaceuticals, Inc. * | 82,687 | 38,036 |
| SpringWorks Therapeutics, Inc. * | 13,701 | 328,961 |
| SQZ Biotechnologies Co. * | 7,793 | 22,210 |
| Standard BioTools, Inc. * | 27,127 | 32,010 |
| Stoke Therapeutics, Inc. * | 9,346 | 138,788 |
| Supernus Pharmaceuticals, Inc. * | 22,262 | 762,919 |
| Surface Oncology, Inc. * | 12,172 | 15,093 |
| Surrozen, Inc. * | 8,548 | 19,233 |
| Sutro Biopharma, Inc. * | 23,381 | 171,383 |
| Synaptogenix, Inc. * | 4,572 | 31,547 |
| Syndax Pharmaceuticals, Inc. * | 21,112 | 484,732 |
| Syneos Health, Inc. * | 42,088 | 2,120,393 |
| Synlogic, Inc. * | 25,000 | 20,940 |
| Synthetic Biologics, Inc. * | 13,567 | 10,284 |
| Syros Pharmaceuticals, Inc. *(a) | 4,670 | 23,446 |
| T2 Biosystems, Inc. *(a) | 3,402 | 6,294 |
| Talaris Therapeutics, Inc. * | 3,539 | 5,344 |
| Tango Therapeutics, Inc. * | 24,311 | 195,460 |
| Tarsus Pharmaceuticals, Inc. * | 8,807 | 162,225 |
| Taysha Gene Therapies, Inc. *(a) | 16,140 | 27,761 |
| Tenaya Therapeutics, Inc. * | 4,937 | 13,231 |
| Terns Pharmaceuticals, Inc. * | 12,408 | 85,739 |
| TFF Pharmaceuticals, Inc. * | 11,966 | 29,915 |
| TG Therapeutics, Inc. * | 53,453 | 311,096 |
| Theravance Biopharma, Inc. * | 24,661 | 245,870 |
| Thermo Fisher Scientific, Inc. | 162,451 | 83,494,940 |
| Theseus Pharmaceuticals, Inc. * | 6,000 | 32,280 |
| Travere Therapeutics, Inc. * | 22,407 | 485,784 |
| Trevi Therapeutics, Inc. * | 12,557 | 24,863 |
| Tricida, Inc. * | 14,891 | 4,948 |
| Twist Bioscience Corp. * | 23,587 | 774,361 |
| Tyra Biosciences, Inc. * | 4,200 | 29,064 |
| Ultragenyx Pharmaceutical, Inc. * | 28,884 | 1,168,647 |
| uniQure N.V. * | 18,083 | 336,705 |
| United Therapeutics Corp. * | 18,910 | 4,359,322 |
| UNITY Biotechnology, Inc. * | 4,595 | 13,142 |
| Vanda Pharmaceuticals, Inc. * | 24,287 | 254,285 |
| Vaxart, Inc. *(a) | 53,313 | 89,033 |
| Vaxcyte, Inc. * | 24,658 | 1,075,335 |
| Vaxxinity, Inc., Class A * | 22,917 | 30,250 |
| VBI Vaccines, Inc. * | 95,399 | 68,697 |
| Ventyx Biosciences, Inc. * | 9,301 | 301,073 |
| Vera Therapeutics, Inc. * | 6,747 | 125,764 |
| Veracyte, Inc. * | 30,348 | 610,298 |
| Verastem, Inc. * | 198,221 | 83,253 |
| Vericel Corp. * | 18,920 | 508,570 |
| Verrica Pharmaceuticals, Inc. * | 12,572 | 31,304 |
| Vertex Pharmaceuticals, Inc. * | 106,358 | 33,183,696 |
| Verve Therapeutics, Inc. * | 16,991 | 640,561 |
| Viatris, Inc. | 501,623 | 5,081,441 |
| Vigil Neuroscience, Inc. *(a) | 5,235 | 82,085 |
| Viking Therapeutics, Inc. * | 28,966 | 118,761 |
| Vir Biotechnology, Inc. * | 30,375 | 667,642 |
| Viracta Therapeutics, Inc. * | 12,430 | 48,850 |
| Viridian Therapeutics, Inc. * | 15,205 | 302,580 |
| Vor BioPharma, Inc. * | 10,875 | 52,309 |
| Voyager Therapeutics, Inc. * | 12,446 | 64,470 |
| Waters Corp. * | 24,741 | 7,401,765 |
| WaVe Life Sciences Ltd. * | 29,975 | 143,580 |
| Werewolf Therapeutics, Inc. * | 6,982 | 20,667 |
| West Pharmaceutical Services, Inc. | 30,811 | 7,089,611 |
| X4 Pharmaceuticals, Inc. * | 42,386 | 80,533 |
| XBiotech, Inc. * | 10,477 | 36,774 |
| SECURITY | NUMBER OF SHARES | VALUE ($) |
| Xencor, Inc. * | 24,000 | 672,000 |
| Xeris Biopharma Holdings, Inc. * | 47,467 | 75,947 |
| XOMA Corp. * | 4,338 | 71,837 |
| Y-mAbs Therapeutics, Inc. * | 13,495 | 48,717 |
| Zentalis Pharmaceuticals, Inc. * | 17,233 | 432,376 |
| Zoetis, Inc. | 194,370 | 29,307,109 |
| Zynerba Pharmaceuticals, Inc. * | 37,596 | 27,449 |
| 1,391,065,896 | ||
| Real Estate 3.2% | ||
| Acadia Realty Trust | 40,417 | 564,625 |
| Agree Realty Corp. | 33,547 | 2,304,679 |
| Alexander & Baldwin, Inc. | 28,776 | 560,556 |
| Alexander's, Inc. | 799 | 187,677 |
| Alexandria Real Estate Equities, Inc. | 61,555 | 8,943,941 |
| Alpine Income Property Trust, Inc. | 4,623 | 85,294 |
| Altisource Portfolio Solutions S.A. * | 2,202 | 25,191 |
| American Assets Trust, Inc. | 21,772 | 598,295 |
| American Homes 4 Rent, Class A | 125,324 | 4,002,849 |
| American Tower Corp. | 193,073 | 40,002,795 |
| Americold Realty Trust, Inc. | 111,270 | 2,698,297 |
| Anywhere Real Estate, Inc. * | 48,041 | 356,945 |
| Apartment Income REIT Corp. | 63,773 | 2,450,796 |
| Apartment Investment & Management Co., Class A | 64,227 | 509,962 |
| Apple Hospitality REIT, Inc. | 87,143 | 1,491,888 |
| Armada Hoffler Properties, Inc. | 28,123 | 328,758 |
| Ashford Hospitality Trust, Inc. * | 11,867 | 96,360 |
| AvalonBay Communities, Inc. | 57,838 | 10,128,591 |
| Bluerock Homes Trust, Inc. * | 1,536 | 38,861 |
| Boston Properties, Inc. | 59,003 | 4,289,518 |
| Braemar Hotels & Resorts, Inc. | 24,766 | 122,096 |
| Brandywine Realty Trust | 69,309 | 454,667 |
| Brixmor Property Group, Inc. | 123,425 | 2,630,187 |
| Broadstone Net Lease, Inc. | 72,575 | 1,243,936 |
| BRT Apartments Corp. | 5,530 | 122,545 |
| Camden Property Trust | 44,318 | 5,120,945 |
| CareTrust REIT, Inc. | 40,241 | 751,702 |
| CBL & Associates Properties, Inc. | 10,443 | 300,027 |
| CBRE Group, Inc., Class A * | 133,200 | 9,449,208 |
| Centerspace | 6,268 | 434,372 |
| Chatham Lodging Trust * | 18,688 | 242,383 |
| City Office REIT, Inc. | 16,407 | 174,242 |
| Clipper Realty, Inc. | 5,283 | 37,456 |
| Community Healthcare Trust, Inc. | 10,035 | 347,211 |
| Compass, Inc., Class A * | 110,080 | 290,611 |
| Corporate Office Properties Trust | 45,685 | 1,217,505 |
| Cousins Properties, Inc. | 64,055 | 1,521,947 |
| Creative Media & Community Trust Corp. | 3,238 | 21,921 |
| Crown Castle, Inc. | 179,567 | 23,929,098 |
| CTO Realty Growth, Inc. | 7,821 | 157,202 |
| CubeSmart | 92,599 | 3,877,120 |
| Cushman & Wakefield plc * | 66,084 | 763,270 |
| DiamondRock Hospitality Co. | 88,294 | 824,666 |
| Digital Realty Trust, Inc. | 119,429 | 11,972,757 |
| DigitalBridge Group, Inc. | 61,036 | 781,264 |
| Diversified Healthcare Trust | 96,849 | 131,715 |
| Douglas Elliman, Inc. | 26,736 | 123,520 |
| Douglas Emmett, Inc. | 71,613 | 1,259,673 |
| Easterly Government Properties, Inc. | 38,052 | 661,724 |
| EastGroup Properties, Inc. | 18,293 | 2,866,330 |
| Elme Communities | 36,405 | 694,971 |
| Empire State Realty Trust, Inc., Class A | 58,131 | 428,425 |
| EPR Properties | 30,556 | 1,179,462 |
| Equinix, Inc. | 37,707 | 21,358,753 |
| SECURITY | NUMBER OF SHARES | VALUE ($) |
| Equity Commonwealth | 45,821 | 1,198,677 |
| Equity LifeStyle Properties, Inc. | 72,573 | 4,641,769 |
| Equity Residential | 139,994 | 8,822,422 |
| Essential Properties Realty Trust, Inc. | 58,921 | 1,267,980 |
| Essex Property Trust, Inc. | 27,172 | 6,038,705 |
| eXp World Holdings, Inc. (a) | 31,554 | 416,828 |
| Extra Space Storage, Inc. | 55,580 | 9,862,115 |
| Farmland Partners, Inc. | 21,207 | 297,110 |
| Federal Realty Investment Trust | 30,333 | 3,002,360 |
| First Industrial Realty Trust, Inc. | 54,948 | 2,617,173 |
| Forestar Group, Inc. * | 6,845 | 79,265 |
| Four Corners Property Trust, Inc. | 34,160 | 875,179 |
| Franklin Street Properties Corp. | 36,290 | 104,515 |
| FRP Holdings, Inc. * | 2,400 | 145,512 |
| Gaming & Leisure Properties, Inc. | 106,148 | 5,320,138 |
| Getty Realty Corp. | 17,969 | 565,844 |
| Gladstone Commercial Corp. | 16,360 | 287,772 |
| Gladstone Land Corp. | 12,206 | 248,392 |
| Global Medical REIT, Inc. | 26,096 | 238,517 |
| Global Net Lease, Inc. | 47,002 | 575,775 |
| Global Self Storage, Inc. | 8,286 | 39,939 |
| Healthcare Realty Trust, Inc. | 157,803 | 3,208,135 |
| Healthpeak Properties, Inc. | 224,516 | 5,327,765 |
| Hersha Hospitality Trust | 15,131 | 138,449 |
| Highwoods Properties, Inc. | 43,773 | 1,235,712 |
| Host Hotels & Resorts, Inc. | 297,914 | 5,624,616 |
| Hudson Pacific Properties, Inc. | 56,547 | 624,279 |
| Independence Realty Trust, Inc. | 93,616 | 1,569,004 |
| Indus Realty Trust, Inc. | 1,735 | 89,856 |
| Industrial Logistics Properties Trust | 25,951 | 121,451 |
| Innovative Industrial Properties, Inc. | 11,457 | 1,238,502 |
| InvenTrust Properties Corp. | 27,718 | 698,494 |
| Invitation Homes, Inc. | 240,298 | 7,615,044 |
| Iron Mountain, Inc. | 120,671 | 6,041,997 |
| iStar, Inc. | 34,333 | 359,810 |
| JBG SMITH Properties | 43,209 | 850,353 |
| Jones Lang LaSalle, Inc. * | 19,916 | 3,168,436 |
| Kennedy-Wilson Holdings, Inc. | 47,376 | 786,915 |
| Kilroy Realty Corp. | 44,547 | 1,903,939 |
| Kimco Realty Corp. | 257,282 | 5,500,689 |
| Kite Realty Group Trust | 93,450 | 1,835,358 |
| Lamar Advertising Co., Class A | 36,155 | 3,334,576 |
| Life Storage, Inc. | 35,122 | 3,884,844 |
| LTC Properties, Inc. | 16,483 | 637,398 |
| LXP Industrial Trust | 114,282 | 1,106,250 |
| Marcus & Millichap, Inc. | 10,209 | 376,100 |
| Maui Land & Pineapple Co., Inc. * | 3,498 | 29,733 |
| Medical Properties Trust, Inc. | 250,788 | 2,871,523 |
| Mid-America Apartment Communities, Inc. | 47,959 | 7,551,145 |
| Modiv, Inc., Class C | 3,196 | 33,750 |
| National Health Investors, Inc. | 18,522 | 1,050,197 |
| National Retail Properties, Inc. | 73,444 | 3,086,851 |
| National Storage Affiliates Trust | 36,469 | 1,555,768 |
| NETSTREIT Corp. | 23,067 | 434,121 |
| New Century Financial Corp. *(b) | 3,600 | 0 |
| New York City REIT, Inc., Class A | 6,185 | 19,174 |
| Newmark Group, Inc., Class A | 53,804 | 440,655 |
| NexPoint Residential Trust, Inc. | 9,644 | 439,766 |
| Offerpad Solutions, Inc. *(a) | 27,533 | 26,831 |
| Office Properties Income Trust | 20,035 | 306,536 |
| Omega Healthcare Investors, Inc. | 97,507 | 3,098,772 |
| One Liberty Properties, Inc. | 6,163 | 138,914 |
| Opendoor Technologies, Inc. * | 209,386 | 542,310 |
| Orion Office REIT, Inc. | 24,022 | 225,086 |
| Outfront Media, Inc. | 61,207 | 1,104,786 |
| Paramount Group, Inc. | 74,241 | 480,339 |
| Park Hotels & Resorts, Inc. | 93,264 | 1,219,893 |
| SECURITY | NUMBER OF SHARES | VALUE ($) |
| Pebblebrook Hotel Trust | 54,296 | 870,908 |
| Phillips Edison & Co., Inc. | 48,822 | 1,471,495 |
| Physicians Realty Trust | 93,146 | 1,402,779 |
| Piedmont Office Realty Trust, Inc., Class A | 49,325 | 515,446 |
| Plymouth Industrial REIT, Inc. | 15,389 | 283,773 |
| Postal Realty Trust, Inc., Class A | 7,337 | 115,044 |
| PotlatchDeltic Corp. | 33,010 | 1,468,589 |
| Power REIT * | 1,270 | 11,113 |
| Presidio Property Trust, Inc., Class A | 8,865 | 10,372 |
| Prologis, Inc. | 382,980 | 42,415,035 |
| Public Storage | 65,416 | 20,262,606 |
| Rayonier, Inc. | 60,689 | 2,045,219 |
| RE/MAX Holdings, Inc., Class A | 7,039 | 136,979 |
| Realty Income Corp. | 256,127 | 15,949,028 |
| Redfin Corp. * | 46,168 | 222,068 |
| Regency Centers Corp. | 63,366 | 3,834,277 |
| Retail Opportunity Investments Corp. | 49,679 | 719,352 |
| Rexford Industrial Realty, Inc. | 71,300 | 3,941,464 |
| RLJ Lodging Trust | 65,496 | 797,086 |
| RPT Realty | 33,736 | 313,745 |
| Ryman Hospitality Properties, Inc. | 23,078 | 2,052,096 |
| Sabra Health Care REIT, Inc. | 95,077 | 1,298,752 |
| Safehold, Inc. | 6,687 | 195,595 |
| Saul Centers, Inc. | 5,768 | 236,200 |
| SBA Communications Corp. | 44,717 | 12,069,118 |
| Seritage Growth Properties, Class A *(a) | 13,603 | 145,960 |
| Service Properties Trust | 69,542 | 563,986 |
| Simon Property Group, Inc. | 135,914 | 14,811,908 |
| SITE Centers Corp. | 74,504 | 922,360 |
| SL Green Realty Corp. | 26,542 | 1,053,187 |
| Spirit Realty Capital, Inc. | 56,714 | 2,202,205 |
| STAG Industrial, Inc. | 73,599 | 2,324,992 |
| STORE Capital Corp. | 110,321 | 3,508,208 |
| Stratus Properties, Inc. | 3,398 | 100,445 |
| Summit Hotel Properties, Inc. | 47,221 | 407,989 |
| Sun Communities, Inc. | 51,287 | 6,916,052 |
| Sunstone Hotel Investors, Inc. | 87,253 | 972,871 |
| Tanger Factory Outlet Centers, Inc. | 42,171 | 759,500 |
| Tejon Ranch Co. * | 11,108 | 188,170 |
| Terreno Realty Corp. | 27,290 | 1,559,351 |
| The Howard Hughes Corp. * | 14,938 | 916,446 |
| The Macerich Co. | 89,804 | 999,519 |
| The Necessity Retail REIT, Inc. | 54,360 | 371,822 |
| The RMR Group, Inc., Class A | 6,145 | 168,189 |
| The St. Joe Co. | 14,358 | 510,140 |
| Transcontinental Realty Investors, Inc. * | 851 | 34,968 |
| Trinity Place Holdings, Inc. * | 31,763 | 24,140 |
| UDR, Inc. | 126,530 | 5,030,833 |
| UMH Properties, Inc. | 22,187 | 389,160 |
| Uniti Group, Inc. | 99,003 | 768,263 |
| Universal Health Realty Income Trust | 4,762 | 231,767 |
| Urban Edge Properties | 49,559 | 699,773 |
| Urstadt Biddle Properties, Inc., Class A | 13,664 | 256,063 |
| Ventas, Inc. | 165,586 | 6,479,380 |
| Veris Residential, Inc. * | 32,057 | 507,462 |
| VICI Properties, Inc. | 399,362 | 12,787,571 |
| Vornado Realty Trust | 68,363 | 1,612,683 |
| Welltower, Inc. | 192,201 | 11,731,949 |
| WeWork, Inc., Class A *(a) | 100,911 | 259,341 |
| Weyerhaeuser Co. | 306,148 | 9,469,158 |
| Whitestone REIT | 20,066 | 188,821 |
| WP Carey, Inc. | 86,225 | 6,578,967 |
| Xenia Hotels & Resorts, Inc. | 46,347 | 791,607 |
| Zillow Group, Inc., Class A * | 24,333 | 752,620 |
| SECURITY | NUMBER OF SHARES | VALUE ($) |
| Zillow Group, Inc., Class C * | 68,016 | 2,098,974 |
| 516,473,837 | ||
| Retailing 5.4% | ||
| 1-800-Flowers.com, Inc., Class A * | 11,856 | 86,430 |
| 1stdibs.com, Inc. * | 9,755 | 66,041 |
| Abercrombie & Fitch Co., Class A * | 21,678 | 381,099 |
| Academy Sports & Outdoors, Inc. | 34,739 | 1,529,558 |
| Advance Auto Parts, Inc. | 25,267 | 4,798,709 |
| Amazon.com, Inc. * | 3,676,510 | 376,621,684 |
| American Eagle Outfitters, Inc. | 66,855 | 759,473 |
| America's Car-Mart, Inc. * | 2,256 | 154,220 |
| Arhaus, Inc. * | 17,098 | 142,426 |
| Arko Corp. | 30,423 | 311,836 |
| Asbury Automotive Group, Inc. * | 9,135 | 1,441,046 |
| AutoNation, Inc. * | 15,816 | 1,681,399 |
| AutoZone, Inc. * | 8,082 | 20,470,736 |
| BARK, Inc. * | 57,147 | 104,579 |
| Barnes & Noble Education, Inc. * | 11,885 | 33,159 |
| Bath & Body Works, Inc. | 95,233 | 3,178,878 |
| Bed Bath & Beyond, Inc. *(a) | 27,450 | 125,447 |
| Best Buy Co., Inc. | 83,044 | 5,681,040 |
| Big 5 Sporting Goods Corp. (a) | 7,723 | 99,549 |
| Big Lots, Inc. | 11,917 | 224,874 |
| Boot Barn Holdings, Inc. * | 12,536 | 712,045 |
| Brilliant Earth Group, Inc., Class A * | 4,000 | 32,040 |
| Build-A-Bear Workshop, Inc. | 6,224 | 109,480 |
| Burlington Stores, Inc. * | 27,430 | 3,921,393 |
| Caleres, Inc. | 14,963 | 408,939 |
| Camping World Holdings, Inc., Class A (a) | 15,765 | 438,740 |
| CarMax, Inc. * | 66,714 | 4,203,649 |
| CarParts.com, Inc. * | 25,457 | 119,139 |
| Carvana Co. *(a) | 41,387 | 559,966 |
| Chewy, Inc., Class A * | 37,157 | 1,439,091 |
| Chico's FAS, Inc. * | 51,645 | 303,673 |
| Citi Trends, Inc. * | 3,328 | 75,246 |
| Conn's, Inc. * | 7,390 | 60,672 |
| ContextLogic, Inc., Class A * | 236,454 | 185,143 |
| Designer Brands, Inc., Class A | 22,259 | 339,005 |
| Destination XL Group, Inc. * | 23,026 | 153,814 |
| Dick's Sporting Goods, Inc. | 23,603 | 2,685,077 |
| Dillard's, Inc., Class A | 1,500 | 493,185 |
| Dollar General Corp. | 94,095 | 23,998,930 |
| Dollar Tree, Inc. * | 87,403 | 13,853,375 |
| DoorDash, Inc., Class A * | 108,430 | 4,719,958 |
| Duluth Holdings, Inc., Class B * | 5,930 | 51,591 |
| eBay, Inc. | 229,071 | 9,126,189 |
| Etsy, Inc. * | 52,456 | 4,926,143 |
| EVgo, Inc. *(a) | 28,647 | 212,274 |
| Five Below, Inc. * | 22,897 | 3,350,976 |
| Floor & Decor Holdings, Inc., Class A * | 44,514 | 3,265,992 |
| Foot Locker, Inc. | 32,883 | 1,042,391 |
| Franchise Group, Inc. | 11,469 | 348,084 |
| Funko, Inc., Class A * | 14,201 | 293,251 |
| GameStop Corp., Class A *(a) | 105,656 | 2,991,121 |
| Genesco, Inc. * | 5,301 | 249,359 |
| Genuine Parts Co. | 58,624 | 10,426,865 |
| Group 1 Automotive, Inc. | 6,427 | 1,111,871 |
| Groupon, Inc. *(a) | 8,149 | 60,058 |
| Grove Collaborative Holdings *(a) | 17,338 | 23,060 |
| GrowGeneration Corp. * | 25,514 | 91,085 |
| Guess?, Inc. | 14,753 | 250,506 |
| Haverty Furniture Cos., Inc. | 5,993 | 159,294 |
| Hibbett, Inc. | 5,232 | 326,581 |
| J Jill Inc. * | 2,772 | 57,242 |
| JOANN, Inc. (a) | 5,197 | 27,492 |
| SECURITY | NUMBER OF SHARES | VALUE ($) |
| Kirkland's, Inc. *(a) | 6,028 | 22,846 |
| Kohl's Corp. | 53,924 | 1,615,024 |
| Lands' End, Inc. * | 4,426 | 46,384 |
| Lazydays Holdings, Inc. * | 2,659 | 33,051 |
| Leslie's, Inc. * | 61,714 | 866,465 |
| Liquidity Services, Inc. * | 10,485 | 180,132 |
| Lithia Motors, Inc. | 11,498 | 2,278,329 |
| LKQ Corp. | 107,764 | 5,995,989 |
| LL Flooring Holdings, Inc. * | 9,682 | 80,554 |
| Lowe’s Cos., Inc. | 264,915 | 51,645,179 |
| Lulu's Fashion Lounge Holdings, Inc. * | 2,659 | 16,645 |
| Macy's, Inc. | 112,809 | 2,352,068 |
| MarineMax, Inc. * | 8,793 | 284,102 |
| Monro, Inc. | 13,330 | 636,507 |
| Murphy USA, Inc. | 8,920 | 2,805,429 |
| National Vision Holdings, Inc. * | 32,814 | 1,215,431 |
| Nordstrom, Inc. | 46,290 | 941,539 |
| Ollie's Bargain Outlet Holdings, Inc. * | 23,953 | 1,341,368 |
| OneWater Marine, Inc., Class A * | 4,282 | 141,306 |
| O'Reilly Automotive, Inc. * | 26,425 | 22,122,217 |
| Overstock.com, Inc. * | 19,472 | 452,724 |
| Party City Holdco, Inc. * | 42,981 | 72,638 |
| Penske Automotive Group, Inc. | 10,535 | 1,175,917 |
| Petco Health & Wellness Co., Inc. * | 33,512 | 352,881 |
| PetMed Express, Inc. | 10,374 | 221,174 |
| Polished.Com, Inc. * | 39,276 | 25,145 |
| Pool Corp. | 16,440 | 5,001,541 |
| Porch Group, Inc. * | 33,000 | 44,880 |
| Poshmark, Inc., Class A * | 18,105 | 323,355 |
| Quotient Technology, Inc. * | 36,556 | 89,928 |
| Qurate Retail, Inc., Class A | 145,107 | 339,550 |
| Rent the Runway, Inc., Class A *(a) | 22,080 | 43,056 |
| Rent-A-Center, Inc. | 22,343 | 465,852 |
| Revolve Group, Inc. * | 16,774 | 402,576 |
| RH * | 8,245 | 2,093,653 |
| Ross Stores, Inc. | 145,446 | 13,917,728 |
| RumbleON, Inc., Class B * | 3,322 | 54,381 |
| Sally Beauty Holdings, Inc. * | 43,486 | 552,707 |
| Shift Technologies, Inc. * | 60,782 | 32,214 |
| Shoe Carnival, Inc. | 6,398 | 153,424 |
| Signet Jewelers Ltd. | 19,313 | 1,259,980 |
| Sleep Number Corp. * | 9,204 | 255,319 |
| Sonic Automotive, Inc., Class A | 7,938 | 371,102 |
| Sportsman's Warehouse Holdings, Inc. * | 18,342 | 164,711 |
| Stitch Fix, Inc., Class A * | 32,183 | 128,732 |
| Target Corp. | 192,465 | 31,612,376 |
| The Aaron's Co., Inc. | 12,845 | 133,845 |
| The Buckle, Inc. | 12,022 | 472,825 |
| The Cato Corp., Class A | 7,948 | 94,661 |
| The Children's Place, Inc. * | 5,926 | 239,884 |
| The Container Store Group, Inc. * | 14,357 | 77,959 |
| The Gap, Inc. | 87,050 | 981,053 |
| The Home Depot, Inc. | 426,146 | 126,194,615 |
| The ODP Corp. * | 17,930 | 709,490 |
| The TJX Cos., Inc. | 485,775 | 35,024,377 |
| Tile Shop Holdings, Inc. | 15,152 | 59,699 |
| Tilly's, Inc., Class A | 9,759 | 86,465 |
| Torrid Holdings, Inc. *(a) | 4,414 | 21,761 |
| Tractor Supply Co. | 46,132 | 10,138,430 |
| TravelCenters of America, Inc. * | 5,495 | 349,372 |
| Ulta Beauty, Inc. * | 21,497 | 9,015,197 |
| Urban Outfitters, Inc. * | 24,076 | 574,453 |
| Victoria's Secret & Co. * | 34,060 | 1,280,656 |
| Vivid Seats, Inc., Class A * | 9,000 | 73,800 |
| Volta, Inc. *(a) | 46,753 | 51,896 |
| Vroom, Inc. *(a) | 52,000 | 54,080 |
| Warby Parker, Inc., Class A *(a) | 26,700 | 428,535 |
| SECURITY | NUMBER OF SHARES | VALUE ($) |
| Wayfair, Inc., Class A * | 31,566 | 1,196,983 |
| Weyco Group, Inc. | 3,125 | 80,719 |
| Williams-Sonoma, Inc. | 28,677 | 3,551,073 |
| Winmark Corp. | 1,169 | 294,167 |
| Xometry, Inc., Class A * | 12,314 | 739,579 |
| Zumiez, Inc. * | 6,961 | 156,135 |
| 861,405,986 | ||
| Semiconductors & Semiconductor Equipment 4.3% | ||
| ACM Research, Inc., Class A * | 17,500 | 112,000 |
| Advanced Micro Devices, Inc. * | 669,824 | 40,229,629 |
| Aehr Test Systems *(a) | 10,009 | 205,885 |
| Allegro MicroSystems, Inc. * | 26,836 | 681,903 |
| Alpha & Omega Semiconductor Ltd. * | 8,697 | 284,827 |
| Ambarella, Inc. * | 15,018 | 821,935 |
| Amkor Technology, Inc. | 40,555 | 843,138 |
| Amtech Systems, Inc. * | 6,347 | 58,519 |
| Analog Devices, Inc. | 215,456 | 30,728,335 |
| Applied Materials, Inc. | 360,801 | 31,855,120 |
| Atomera, Inc. *(a) | 8,289 | 74,684 |
| Axcelis Technologies, Inc. * | 13,316 | 772,328 |
| AXT, Inc. * | 15,887 | 72,127 |
| Broadcom, Inc. | 167,422 | 78,708,431 |
| CEVA, Inc. * | 9,184 | 254,029 |
| Cirrus Logic, Inc. * | 23,294 | 1,563,493 |
| Cohu, Inc. * | 20,399 | 671,535 |
| Credo Technology Group Holding Ltd. * | 37,719 | 518,259 |
| CyberOptics Corp. * | 2,642 | 142,589 |
| Diodes, Inc. * | 18,319 | 1,312,923 |
| Enphase Energy, Inc. * | 56,248 | 17,268,136 |
| Entegris, Inc. | 61,682 | 4,893,851 |
| Everspin Technologies, Inc. * | 9,720 | 58,612 |
| First Solar, Inc. * | 41,103 | 5,983,364 |
| FormFactor, Inc. * | 31,997 | 646,659 |
| Ichor Holdings Ltd. * | 12,049 | 306,527 |
| Impinj, Inc. * | 8,664 | 993,154 |
| indie Semiconductor, Inc., Class A *(a) | 28,439 | 222,393 |
| Intel Corp. | 1,702,857 | 48,412,225 |
| inTEST Corp. * | 4,591 | 37,187 |
| KLA Corp. | 58,787 | 18,603,146 |
| Kopin Corp. * | 40,189 | 43,404 |
| Kulicke & Soffa Industries, Inc. | 24,818 | 1,040,867 |
| Lam Research Corp. | 56,830 | 23,003,647 |
| Lattice Semiconductor Corp. * | 56,590 | 2,745,181 |
| MACOM Technology Solutions Holdings, Inc. * | 21,011 | 1,215,907 |
| Marvell Technology, Inc. | 351,849 | 13,961,368 |
| MaxLinear, Inc. * | 31,788 | 981,613 |
| Meta Materials, Inc. * | 164,284 | 174,141 |
| Microchip Technology, Inc. | 229,403 | 14,163,341 |
| Micron Technology, Inc. | 457,489 | 24,750,155 |
| MKS Instruments, Inc. | 23,985 | 1,970,368 |
| Monolithic Power Systems, Inc. | 18,572 | 6,304,265 |
| Navitas Semiconductor Corp. * | 34,387 | 144,769 |
| NVE Corp. | 1,912 | 118,563 |
| NVIDIA Corp. | 1,038,721 | 140,196,173 |
| NXP Semiconductors N.V. | 108,999 | 15,922,574 |
| ON Semiconductor Corp. * | 179,906 | 11,051,626 |
| Onto Innovation, Inc. * | 21,213 | 1,417,877 |
| PDF Solutions, Inc. * | 12,456 | 293,713 |
| Photronics, Inc. * | 25,270 | 409,879 |
| Pixelworks, Inc. * | 21,959 | 30,962 |
| Power Integrations, Inc. | 23,718 | 1,582,228 |
| Qorvo, Inc. * | 43,113 | 3,711,167 |
| QUALCOMM, Inc. | 465,695 | 54,793,674 |
| QuickLogic Corp. * | 7,578 | 51,303 |
| SECURITY | NUMBER OF SHARES | VALUE ($) |
| Rambus, Inc. * | 45,028 | 1,358,045 |
| Rigetti Computing, Inc., Class A * | 30,086 | 63,181 |
| Rockley Photonics Holdings Ltd. * | 41,332 | 21,083 |
| Semtech Corp. * | 25,993 | 719,746 |
| Silicon Laboratories, Inc. * | 14,216 | 1,633,703 |
| SiTime Corp. * | 6,332 | 568,677 |
| SkyWater Technology, Inc. * | 2,749 | 22,294 |
| Skyworks Solutions, Inc. | 66,278 | 5,700,571 |
| SMART Global Holdings, Inc. * | 20,089 | 271,804 |
| SolarEdge Technologies, Inc. * | 22,992 | 5,288,850 |
| Synaptics, Inc. * | 16,128 | 1,428,941 |
| Teradyne, Inc. | 64,949 | 5,283,601 |
| Texas Instruments, Inc. | 378,700 | 60,830,581 |
| Transphorm, Inc. * | 11,592 | 79,985 |
| Ultra Clean Holdings, Inc. * | 18,706 | 581,944 |
| Universal Display Corp. | 18,394 | 1,751,477 |
| Veeco Instruments, Inc. * | 24,066 | 438,723 |
| Wolfspeed, Inc. * | 51,175 | 4,030,031 |
| 697,488,945 | ||
| Software & Services 12.7% | ||
| 8x8, Inc. * | 52,591 | 222,460 |
| A10 Networks, Inc. | 27,651 | 464,537 |
| Accenture plc, Class A | 262,202 | 74,439,148 |
| ACI Worldwide, Inc. * | 46,724 | 1,136,795 |
| Adeia, Inc. | 42,590 | 476,156 |
| Adobe, Inc. * | 194,109 | 61,823,716 |
| Affirm Holdings, Inc. * | 84,607 | 1,698,062 |
| AgileThought, Inc. *(a) | 8,500 | 38,250 |
| Agilysys, Inc. * | 8,166 | 524,012 |
| Akamai Technologies, Inc. * | 65,757 | 5,808,316 |
| Alarm.com Holdings, Inc. * | 20,557 | 1,209,574 |
| Alkami Technology, Inc. * | 15,859 | 251,365 |
| Altair Engineering, Inc., Class A * | 21,241 | 1,041,871 |
| Alteryx, Inc., Class A * | 24,835 | 1,210,210 |
| American Software, Inc., Class A | 13,798 | 236,360 |
| Amplitude, Inc., Class A * | 21,750 | 365,400 |
| ANSYS, Inc. * | 36,069 | 7,977,020 |
| Appfolio, Inc., Class A * | 7,738 | 970,113 |
| Appian Corp. * | 16,978 | 828,866 |
| AppLovin Corp., Class A * | 50,523 | 856,870 |
| Arteris, Inc. * | 9,920 | 54,957 |
| Asana, Inc., Class A * | 31,239 | 643,523 |
| Aspen Technology, Inc. * | 12,084 | 2,917,682 |
| Asure Software, Inc. * | 7,413 | 48,926 |
| AudioEye, Inc. * | 4,308 | 23,005 |
| Autodesk, Inc. * | 90,169 | 19,323,217 |
| Automatic Data Processing, Inc. | 172,242 | 41,630,891 |
| AvePoint, Inc. * | 34,675 | 151,530 |
| AvidXchange Holdings, Inc. * | 56,022 | 509,800 |
| Backblaze, Inc., Class A * | 5,377 | 25,218 |
| Benefitfocus, Inc. * | 12,031 | 84,819 |
| Bentley Systems, Inc., Class B | 80,599 | 2,843,533 |
| BigCommerce Holdings, Inc. * | 23,831 | 354,129 |
| Bill.com Holdings, Inc. * | 38,996 | 5,200,507 |
| Black Knight, Inc. * | 64,734 | 3,914,465 |
| Blackbaud, Inc. * | 18,530 | 1,013,591 |
| Blackline, Inc. * | 22,646 | 1,268,176 |
| Blend Labs, Inc., Class A *(a) | 73,956 | 185,630 |
| Block, Inc. * | 220,360 | 13,237,025 |
| Box, Inc., Class A * | 59,314 | 1,723,072 |
| Braze, Inc., Class A *(a) | 12,447 | 368,556 |
| Brightcove, Inc. * | 15,409 | 103,240 |
| Broadridge Financial Solutions, Inc. | 48,489 | 7,276,259 |
| BTRS Holdings, Inc., Class A * | 38,657 | 364,922 |
| C3.ai, Inc., Class A * | 34,968 | 458,430 |
| Cadence Design Systems, Inc. * | 113,554 | 17,190,940 |
| SECURITY | NUMBER OF SHARES | VALUE ($) |
| Cantaloupe, Inc. * | 26,721 | 89,515 |
| Cass Information Systems, Inc. | 4,994 | 213,643 |
| CCC Intelligent Solutions Holdings, Inc. * | 44,273 | 413,067 |
| Cerberus Cyber Sentinel Corp. *(a) | 16,788 | 58,086 |
| Cerence, Inc. * | 16,591 | 285,365 |
| Ceridian HCM Holding, Inc. * | 64,139 | 4,245,360 |
| ChannelAdvisor Corp. * | 13,078 | 301,317 |
| Cipher Mining, Inc. * | 16,000 | 16,160 |
| Cleanspark, Inc. *(a) | 17,826 | 62,034 |
| Clear Secure, Inc., Class A * | 29,467 | 796,198 |
| Clearwater Analytics Holdings, Inc., Class A * | 21,692 | 353,363 |
| Cloudflare, Inc., Class A * | 117,405 | 6,612,250 |
| Cognizant Technology Solutions Corp., Class A | 215,087 | 13,389,166 |
| CommVault Systems, Inc. * | 18,396 | 1,120,132 |
| Computer Task Group, Inc. * | 7,864 | 60,160 |
| Concentrix Corp. | 17,911 | 2,189,262 |
| Conduent, Inc. * | 68,566 | 282,492 |
| Confluent, Inc., Class A * | 57,998 | 1,558,986 |
| Consensus Cloud Solutions, Inc. * | 7,116 | 399,492 |
| Core Scientific, Inc., Class A *(a) | 115,010 | 23,002 |
| CoreCard Corp. * | 2,218 | 54,341 |
| Couchbase, Inc. * | 10,823 | 138,534 |
| Coupa Software, Inc. * | 31,724 | 1,688,668 |
| Crowdstrike Holdings, Inc., Class A * | 88,684 | 14,295,861 |
| CS Disco, Inc. * | 8,360 | 89,619 |
| CSG Systems International, Inc. | 13,804 | 892,705 |
| Cvent Holding Corp. * | 28,902 | 169,077 |
| Cyxtera Technologies, Inc. * | 25,255 | 61,117 |
| Datadog, Inc., Class A * | 102,281 | 8,234,643 |
| Digimarc Corp. *(a) | 5,752 | 93,988 |
| Digital Turbine, Inc. * | 36,295 | 529,907 |
| DigitalOcean Holdings, Inc. * | 25,176 | 904,322 |
| DocuSign, Inc. * | 83,127 | 4,015,034 |
| Dolby Laboratories, Inc., Class A | 25,720 | 1,719,125 |
| Domo, Inc., Class B * | 11,799 | 208,488 |
| DoubleVerify Holdings, Inc. * | 26,360 | 770,503 |
| Dropbox, Inc., Class A * | 114,985 | 2,500,924 |
| Duck Creek Technologies, Inc. * | 30,427 | 363,298 |
| DXC Technology Co. * | 96,179 | 2,765,146 |
| Dynatrace, Inc. * | 83,057 | 2,926,929 |
| E2open Parent Holdings, Inc. * | 72,014 | 419,842 |
| Ebix, Inc. | 10,319 | 204,213 |
| Edgio, Inc. * | 50,335 | 135,401 |
| eGain Corp. * | 7,634 | 61,454 |
| Elastic N.V. * | 31,652 | 2,024,145 |
| Enfusion, Inc., Class A * | 7,152 | 101,344 |
| EngageSmart, Inc. * | 12,468 | 244,872 |
| Envestnet, Inc. * | 23,278 | 1,147,838 |
| EPAM Systems, Inc. * | 23,820 | 8,337,000 |
| Euronet Worldwide, Inc. * | 19,929 | 1,674,235 |
| Everbridge, Inc. * | 16,799 | 526,313 |
| EverCommerce, Inc. * | 12,868 | 112,080 |
| EVERTEC, Inc. | 28,074 | 1,005,330 |
| Evo Payments, Inc., Class A * | 20,481 | 690,005 |
| ExlService Holdings, Inc. * | 13,619 | 2,476,615 |
| Expensify, Inc., Class A * | 18,547 | 242,780 |
| Fair Isaac Corp. * | 10,452 | 5,004,836 |
| Fastly, Inc., Class A * | 47,725 | 405,185 |
| Fidelity National Information Services, Inc. | 252,117 | 20,923,190 |
| Fiserv, Inc. * | 265,214 | 27,248,086 |
| Five9, Inc. * | 28,901 | 1,741,574 |
| FleetCor Technologies, Inc. * | 31,009 | 5,771,395 |
| Flywire Corp. * | 25,620 | 562,359 |
| ForgeRock, Inc., Class A * | 12,643 | 285,226 |
| SECURITY | NUMBER OF SHARES | VALUE ($) |
| Fortinet, Inc. * | 271,539 | 15,521,169 |
| Freshworks, Inc., Class A * | 60,347 | 820,116 |
| Gartner, Inc. * | 32,863 | 9,921,997 |
| Genpact Ltd. | 69,934 | 3,391,799 |
| Gitlab, Inc., Class A * | 22,050 | 1,068,543 |
| Global Payments, Inc. | 114,833 | 13,120,819 |
| GoDaddy, Inc., Class A * | 64,792 | 5,209,277 |
| Grid Dynamics Holdings, Inc. * | 20,547 | 279,645 |
| Guidewire Software, Inc. * | 34,292 | 2,037,288 |
| HashiCorp, Inc., Class A * | 16,352 | 502,497 |
| HubSpot, Inc. * | 19,963 | 5,920,227 |
| I3 Verticals, Inc., Class A * | 8,999 | 195,818 |
| Informatica, Inc., Class A * | 15,704 | 304,029 |
| Information Services Group, Inc. | 16,112 | 87,488 |
| Innodata, Inc. * | 7,993 | 26,457 |
| Instructure Holdings, Inc. * | 7,414 | 175,119 |
| Intapp, Inc. * | 7,641 | 171,617 |
| InterDigital, Inc. | 12,475 | 622,128 |
| International Business Machines Corp. | 374,488 | 51,787,945 |
| International Money Express, Inc. * | 13,887 | 375,366 |
| Intrusion, Inc. * | 5,866 | 29,213 |
| Intuit, Inc. | 117,034 | 50,032,035 |
| Ipsidy, Inc. * | 7,100 | 8,520 |
| IronNet, Inc. * | 13,000 | 9,230 |
| Issuer Direct Corp. * | 1,318 | 27,849 |
| Jack Henry & Associates, Inc. | 30,230 | 6,017,584 |
| Jamf Holding Corp. * | 19,093 | 451,931 |
| Kaltura, Inc. * | 33,164 | 62,017 |
| KnowBe4, Inc., Class A * | 33,494 | 823,283 |
| Kyndryl Holdings, Inc. * | 85,848 | 830,150 |
| LivePerson, Inc. * | 29,329 | 310,008 |
| LiveRamp Holdings, Inc. * | 27,198 | 499,355 |
| Manhattan Associates, Inc. * | 25,752 | 3,133,246 |
| Marathon Digital Holdings, Inc. *(a) | 44,384 | 581,874 |
| Marqeta, Inc., Class A * | 165,336 | 1,302,848 |
| Mastercard, Inc., Class A | 353,757 | 116,095,972 |
| Matterport, Inc. * | 91,473 | 319,241 |
| Maximus, Inc. | 24,920 | 1,536,816 |
| MeridianLink, Inc. * | 8,842 | 159,156 |
| Microsoft Corp. | 3,093,292 | 718,045,872 |
| MicroStrategy, Inc., Class A *(a) | 4,015 | 1,074,053 |
| Mitek Systems, Inc. * | 18,641 | 210,830 |
| Model N, Inc. * | 14,770 | 561,260 |
| Momentive Global, Inc. * | 51,553 | 400,051 |
| MoneyGram International, Inc. * | 42,227 | 447,184 |
| MongoDB, Inc. * | 28,187 | 5,159,067 |
| N-Able, Inc. * | 27,358 | 296,287 |
| nCino, Inc. * | 31,691 | 997,633 |
| NCR Corp. * | 57,044 | 1,212,755 |
| New Relic, Inc. * | 23,513 | 1,392,910 |
| NextNav, Inc. * | 7,000 | 24,010 |
| NortonLifeLock, Inc. | 246,228 | 5,547,517 |
| Nutanix, Inc., Class A * | 92,241 | 2,527,403 |
| Okta, Inc. * | 62,102 | 3,485,164 |
| Olo, Inc., Class A * | 44,208 | 389,472 |
| OMNIQ Corp. * | 3,906 | 23,358 |
| ON24, Inc. * | 17,135 | 139,479 |
| OneSpan, Inc. * | 12,949 | 142,309 |
| Oracle Corp. | 629,918 | 49,177,698 |
| PagerDuty, Inc. * | 33,688 | 840,179 |
| Palantir Technologies, Inc., Class A * | 725,964 | 6,381,224 |
| Palo Alto Networks, Inc. * | 124,080 | 21,290,887 |
| Park City Group, Inc. | 6,299 | 30,676 |
| Paya Holdings, Inc. * | 32,804 | 263,744 |
| Paychex, Inc. | 132,841 | 15,716,419 |
| Paycom Software, Inc. * | 20,229 | 6,999,234 |
| Paycor HCM, Inc. * | 21,166 | 644,928 |
| SECURITY | NUMBER OF SHARES | VALUE ($) |
| Paylocity Holding Corp. * | 17,115 | 3,967,086 |
| Paymentus Holdings, Inc., Class A * | 8,752 | 91,021 |
| Payoneer Global, Inc. * | 82,495 | 639,336 |
| PayPal Holdings, Inc. * | 480,011 | 40,119,319 |
| Paysign, Inc. * | 18,698 | 45,810 |
| Pegasystems, Inc. | 17,128 | 637,333 |
| Perficient, Inc. * | 14,160 | 948,295 |
| PFSweb, Inc. * | 6,123 | 58,597 |
| Phunware, Inc. *(a) | 55,482 | 64,914 |
| PowerSchool Holdings, Inc., Class A * | 13,708 | 274,160 |
| Priority Technology Holdings, Inc. * | 9,469 | 48,576 |
| Procore Technologies, Inc. * | 28,242 | 1,543,708 |
| Progress Software Corp. | 18,097 | 923,490 |
| PROS Holdings, Inc. * | 17,218 | 429,589 |
| PTC, Inc. * | 43,889 | 5,171,441 |
| Q2 Holdings, Inc. * | 23,269 | 722,270 |
| Qualtrics International, Inc., Class A * | 43,174 | 516,793 |
| Qualys, Inc. * | 14,280 | 2,035,757 |
| Quantum Computing, Inc. *(a) | 10,216 | 22,782 |
| Rackspace Technology, Inc. * | 24,535 | 126,355 |
| Rapid7, Inc. * | 23,968 | 1,085,031 |
| Remitly Global, Inc. * | 40,093 | 465,881 |
| Repay Holdings Corp. * | 32,506 | 197,962 |
| Rimini Street, Inc. * | 21,843 | 122,539 |
| RingCentral, Inc., Class A * | 32,103 | 1,140,299 |
| Riot Blockchain, Inc. *(a) | 57,291 | 394,735 |
| Roper Technologies, Inc. | 43,988 | 18,234,785 |
| Ryvyl, Inc. * | 10,419 | 10,068 |
| Sabre Corp. * | 132,063 | 767,286 |
| Salesforce, Inc. * | 412,852 | 67,125,607 |
| Samsara, Inc., Class A * | 33,703 | 414,884 |
| SecureWorks Corp., Class A * | 5,067 | 41,448 |
| SEMrush Holdings, Inc., Class A * | 13,062 | 159,748 |
| SentinelOne, Inc., Class A * | 82,245 | 1,878,476 |
| ServiceNow, Inc. * | 83,811 | 35,262,640 |
| Shift4 Payments, Inc., Class A * | 20,937 | 962,474 |
| ShotSpotter, Inc. * | 3,910 | 148,580 |
| Smartsheet, Inc., Class A * | 54,857 | 1,915,606 |
| Smith Micro Software, Inc. * | 24,721 | 55,869 |
| Snowflake, Inc., Class A * | 117,556 | 18,844,227 |
| SolarWinds Corp. * | 17,754 | 165,645 |
| Soluna Holdings, Inc. * | 5,346 | 5,934 |
| SoundHound AI, Inc., Class A *(a) | 45,830 | 124,199 |
| Splunk, Inc. * | 61,598 | 5,119,410 |
| Sprinklr, Inc., Class A * | 25,637 | 237,142 |
| Sprout Social, Inc., Class A * | 19,288 | 1,163,645 |
| SPS Commerce, Inc. * | 14,979 | 1,895,143 |
| Squarespace, Inc., Class A * | 17,641 | 391,807 |
| SRAX, Inc. * | 9,789 | 16,054 |
| SS&C Technologies Holdings, Inc. | 92,249 | 4,743,444 |
| Sumo Logic, Inc. * | 46,233 | 356,456 |
| Switch, Inc., Class A | 58,846 | 2,003,706 |
| Synchronoss Technologies, Inc. * | 37,860 | 40,132 |
| Synopsys, Inc. * | 63,431 | 18,556,739 |
| TaskUS, Inc., Class A * | 10,367 | 209,310 |
| Telos Corp. * | 24,709 | 261,915 |
| Tenable Holdings, Inc. * | 46,032 | 1,870,740 |
| Teradata Corp. * | 43,028 | 1,359,255 |
| The Hackett Group, Inc. | 11,502 | 251,204 |
| The Western Union Co. | 159,351 | 2,152,832 |
| Thoughtworks Holding, Inc. * | 27,607 | 265,303 |
| Toast, Inc., Class A * | 123,884 | 2,736,598 |
| TTEC Holdings, Inc. | 7,597 | 337,839 |
| Tucows, Inc., Class A * | 4,136 | 185,913 |
| Twilio, Inc., Class A * | 72,193 | 5,368,993 |
| Tyler Technologies, Inc. * | 17,230 | 5,570,976 |
| UiPath, Inc., Class A * | 143,198 | 1,811,455 |
| Unisys Corp. * | 28,890 | 245,565 |
| SECURITY | NUMBER OF SHARES | VALUE ($) |
| Unity Software, Inc. * | 73,573 | 2,170,403 |
| Upland Software, Inc. * | 13,488 | 108,444 |
| UserTesting, Inc. * | 19,882 | 147,127 |
| Varonis Systems, Inc. * | 44,934 | 1,202,883 |
| Verint Systems, Inc. * | 26,918 | 953,705 |
| VeriSign, Inc. * | 38,787 | 7,775,242 |
| Veritone, Inc. *(a) | 11,260 | 83,437 |
| Verra Mobility Corp. * | 59,168 | 1,009,998 |
| Vertex, Inc., Class A * | 15,520 | 279,670 |
| Viant Technology, Inc., Class A * | 10,390 | 47,378 |
| VirnetX Holding Corp. * | 26,091 | 32,875 |
| Visa, Inc., Class A | 677,954 | 140,444,951 |
| VMware, Inc., Class A | 85,405 | 9,610,625 |
| Weave Communications, Inc. * | 12,631 | 69,470 |
| WEX, Inc. * | 18,445 | 3,027,562 |
| WM Technology, Inc. * | 18,000 | 36,900 |
| Workday, Inc., Class A * | 82,498 | 12,854,838 |
| Workiva, Inc. * | 18,949 | 1,474,422 |
| Xperi, Inc. * | 17,036 | 237,993 |
| Yext, Inc. * | 50,326 | 267,734 |
| Zendesk, Inc. * | 51,340 | 3,937,265 |
| ZeroFox Holdings, Inc. *(a) | 12,914 | 56,305 |
| Zeta Global Holdings Corp., Class A * | 52,022 | 433,863 |
| Zoom Video Communications, Inc., Class A * | 91,780 | 7,658,123 |
| Zscaler, Inc. * | 34,786 | 5,360,523 |
| Zuora, Inc., Class A * | 48,922 | 376,210 |
| 2,040,643,093 | ||
| Technology Hardware & Equipment 7.9% | ||
| 908 Devices, Inc. * | 8,267 | 132,189 |
| ADTRAN Holdings, Inc. | 29,034 | 652,104 |
| Advanced Energy Industries, Inc. | 15,124 | 1,189,503 |
| Aeva Technologies, Inc. * | 37,597 | 75,194 |
| AEye, Inc. * | 40,414 | 35,180 |
| Airgain, Inc. * | 7,096 | 51,517 |
| Airspan Networks Holdings, Inc. * | 16,700 | 39,579 |
| Akoustis Technologies, Inc. * | 28,099 | 93,570 |
| Alpine 4 Holdings, Inc. * | 57,587 | 41,578 |
| Amphenol Corp., Class A | 246,453 | 18,688,531 |
| Apple Inc. | 6,265,763 | 960,792,098 |
| Applied Optoelectronics, Inc. *(a) | 21,899 | 60,222 |
| Arista Networks, Inc. * | 101,981 | 12,325,424 |
| Arlo Technologies, Inc. * | 36,675 | 188,876 |
| Arrow Electronics, Inc. * | 26,688 | 2,702,427 |
| AstroNova, Inc. * | 4,313 | 51,109 |
| Aviat Networks, Inc. * | 4,009 | 130,934 |
| Avid Technology, Inc. * | 13,251 | 364,270 |
| Avnet, Inc. | 38,792 | 1,559,051 |
| Badger Meter, Inc. | 12,197 | 1,371,919 |
| Bel Fuse, Inc., Class B | 5,485 | 177,769 |
| Belden, Inc. | 18,105 | 1,260,651 |
| Benchmark Electronics, Inc. | 14,875 | 422,301 |
| Boxlight Corp., Class A * | 46,965 | 24,882 |
| CalAmp Corp. * | 14,173 | 53,857 |
| Calix, Inc. * | 23,585 | 1,736,799 |
| Cambium Networks Corp. * | 4,047 | 78,309 |
| Casa Systems, Inc. * | 13,736 | 43,268 |
| CDW Corp. | 56,148 | 9,702,936 |
| Cepton, Inc. *(a) | 18,174 | 39,983 |
| Ciena Corp. * | 62,551 | 2,996,193 |
| Cisco Systems, Inc. | 1,717,229 | 78,013,713 |
| Clearfield, Inc. * | 4,833 | 587,065 |
| Cognex Corp. | 72,309 | 3,342,845 |
| Coherent Corp. * | 54,005 | 1,815,108 |
| CommScope Holding Co., Inc. * | 88,343 | 1,169,661 |
| Comtech Telecommunications Corp. | 11,741 | 129,738 |
| SECURITY | NUMBER OF SHARES | VALUE ($) |
| Corning, Inc. | 314,810 | 10,127,438 |
| Corsair Gaming, Inc. *(a) | 17,044 | 235,207 |
| CPI Card Group, Inc. * | 2,603 | 51,253 |
| CTS Corp. | 13,324 | 526,565 |
| Daktronics, Inc. * | 14,170 | 48,461 |
| Dell Technologies, Inc., Class C | 109,515 | 4,205,376 |
| Diebold Nixdorf, Inc. * | 28,307 | 70,484 |
| Digi International, Inc. * | 15,032 | 606,241 |
| DZS, Inc. * | 6,832 | 108,560 |
| Eastman Kodak Co. * | 26,841 | 143,599 |
| EMCORE Corp. * | 11,147 | 17,055 |
| ePlus, Inc. * | 11,248 | 548,003 |
| Evolv Technologies Holdings, Inc. * | 21,918 | 64,220 |
| Extreme Networks, Inc. * | 51,702 | 927,534 |
| F5, Inc. * | 24,821 | 3,547,169 |
| Fabrinet * | 15,120 | 1,729,728 |
| FARO Technologies, Inc. * | 8,279 | 241,830 |
| Focus Universal, Inc. * | 7,000 | 71,260 |
| Genasys, Inc. * | 20,918 | 59,616 |
| Harmonic, Inc. * | 43,209 | 667,579 |
| Hewlett Packard Enterprise Co. | 537,460 | 7,669,554 |
| HP, Inc. | 377,792 | 10,434,615 |
| Identiv, Inc. * | 8,288 | 99,870 |
| Immersion Corp. * | 13,101 | 69,959 |
| Infinera Corp. * | 80,673 | 452,576 |
| Inseego Corp. * | 33,215 | 75,066 |
| Insight Enterprises, Inc. * | 12,638 | 1,194,417 |
| Intevac, Inc. * | 15,485 | 69,218 |
| IonQ, Inc. *(a) | 62,676 | 369,162 |
| IPG Photonics Corp. * | 13,678 | 1,171,658 |
| Iteris, Inc. * | 14,737 | 44,211 |
| Itron, Inc. * | 19,746 | 965,382 |
| Jabil, Inc. | 56,943 | 3,658,588 |
| Juniper Networks, Inc. | 133,750 | 4,092,750 |
| Keysight Technologies, Inc. * | 74,430 | 12,961,985 |
| Kimball Electronics, Inc. * | 10,963 | 226,605 |
| Knowles Corp. * | 38,215 | 525,456 |
| KVH Industries, Inc. * | 5,414 | 58,092 |
| Lantronix, Inc. * | 11,128 | 56,196 |
| Lightwave Logic, Inc. *(a) | 49,166 | 416,436 |
| Littelfuse, Inc. | 10,354 | 2,280,469 |
| Lumentum Holdings, Inc. * | 28,982 | 2,157,710 |
| Luna Innovations, Inc. * | 11,699 | 60,718 |
| Methode Electronics, Inc. | 15,172 | 625,542 |
| MicroVision, Inc. *(a) | 65,500 | 239,730 |
| MICT, Inc. * | 40,861 | 29,902 |
| Mirion Technologies, Inc. * | 52,479 | 424,030 |
| Motorola Solutions, Inc. | 69,243 | 17,290,670 |
| Movano, Inc. * | 16,747 | 37,178 |
| Napco Security Technologies, Inc. * | 12,442 | 353,602 |
| National Instruments Corp. | 55,528 | 2,120,059 |
| Neonode, Inc. * | 4,440 | 16,206 |
| NetApp, Inc. | 91,234 | 6,319,779 |
| NETGEAR, Inc. * | 11,235 | 220,768 |
| NetScout Systems, Inc. * | 28,598 | 1,027,240 |
| nLight, Inc. * | 17,442 | 187,850 |
| Novanta, Inc. * | 14,759 | 2,086,923 |
| Ondas Holdings, Inc. *(a) | 14,133 | 56,532 |
| One Stop Systems, Inc. * | 12,911 | 41,573 |
| OSI Systems, Inc. * | 6,538 | 537,293 |
| PAR Technology Corp. * | 12,016 | 345,820 |
| PC Connection, Inc. | 4,459 | 236,951 |
| PCTEL, Inc. * | 8,960 | 41,664 |
| Plexus Corp. * | 11,573 | 1,138,783 |
| Powerfleet, Inc. * | 22,541 | 59,734 |
| Pure Storage, Inc., Class A * | 116,774 | 3,603,646 |
| Quantum Corp. * | 57,798 | 81,495 |
| Red Cat Holdings, Inc. * | 18,398 | 24,837 |
| SECURITY | NUMBER OF SHARES | VALUE ($) |
| Research Frontiers, Inc. * | 21,870 | 53,363 |
| RF Industries Ltd. * | 7,044 | 38,108 |
| Ribbon Communications, Inc. * | 38,255 | 101,376 |
| Richardson Electronics Ltd/United States | 5,554 | 133,796 |
| Rogers Corp. * | 7,848 | 1,846,870 |
| Sanmina Corp. * | 23,680 | 1,327,264 |
| ScanSource, Inc. * | 10,228 | 316,863 |
| Seagate Technology Holdings plc | 80,957 | 4,020,325 |
| SmartRent, Inc. *(a) | 54,496 | 149,864 |
| Sono-Tek Corp. * | 2,719 | 19,386 |
| Super Micro Computer, Inc. * | 18,786 | 1,307,318 |
| TD SYNNEX Corp. | 17,326 | 1,585,502 |
| TE Connectivity Ltd. | 132,380 | 16,180,807 |
| Teledyne Technologies, Inc. * | 19,500 | 7,760,610 |
| Trimble, Inc. * | 103,198 | 6,208,392 |
| TTM Technologies, Inc. * | 43,639 | 668,113 |
| Turtle Beach Corp. * | 6,086 | 47,471 |
| Ubiquiti, Inc. | 1,706 | 591,556 |
| Velodyne Lidar, Inc. * | 75,343 | 74,401 |
| ViaSat, Inc. * | 31,766 | 1,301,135 |
| Viavi Solutions, Inc. * | 96,616 | 1,458,902 |
| Vishay Intertechnology, Inc. | 53,739 | 1,123,683 |
| Vishay Precision Group, Inc. * | 5,394 | 182,048 |
| Vontier Corp. | 65,254 | 1,246,351 |
| Wayside Technology Group, Inc. | 2,316 | 72,746 |
| Western Digital Corp. * | 130,425 | 4,482,707 |
| Wrap Technologies, Inc. *(a) | 24,437 | 28,958 |
| Xerox Holdings Corp. | 48,642 | 711,632 |
| Zebra Technologies Corp., Class A * | 21,537 | 6,099,709 |
| 1,271,535,287 | ||
| Telecommunication Services 1.1% | ||
| Anterix, Inc. * | 7,462 | 286,168 |
| AST SpaceMobile, Inc. *(a) | 19,782 | 143,024 |
| AT&T, Inc. | 2,955,516 | 53,879,057 |
| ATN International, Inc. | 4,947 | 213,314 |
| Bandwidth, Inc., Class A * | 9,570 | 113,596 |
| Charge Enterprises, Inc. * | 38,686 | 85,883 |
| Cogent Communications Holdings, Inc. | 17,518 | 919,870 |
| Consolidated Communications Holdings, Inc. * | 28,849 | 149,149 |
| EchoStar Corp., Class A * | 15,741 | 297,033 |
| Frontier Communications Parent, Inc. * | 91,781 | 2,149,511 |
| Globalstar, Inc. * | 311,151 | 675,198 |
| Gogo, Inc. * | 27,853 | 396,070 |
| IDT Corp., Class B * | 8,928 | 232,664 |
| Iridium Communications, Inc. * | 52,464 | 2,703,470 |
| KORE Group Holdings, Inc. * | 12,000 | 36,720 |
| Liberty Global plc, Class A * | 70,809 | 1,193,840 |
| Liberty Global plc, Class C * | 116,530 | 2,057,920 |
| Liberty Latin America Ltd., Class A * | 21,685 | 168,709 |
| Liberty Latin America Ltd., Class C * | 68,742 | 535,500 |
| Lumen Technologies, Inc. | 398,859 | 2,935,602 |
| Ooma, Inc. * | 9,711 | 157,609 |
| Radius Global Infrastructure, Inc., Class A * | 30,999 | 289,841 |
| Shenandoah Telecommunications Co. | 20,103 | 455,534 |
| Spok Holdings, Inc. | 10,025 | 88,120 |
| Starry Group Holdings, Inc., Class A * | 42,774 | 9,453 |
| Telephone & Data Systems, Inc. | 41,799 | 710,583 |
| T-Mobile US, Inc. * | 249,432 | 37,803,914 |
| United States Cellular Corp. * | 5,896 | 183,778 |
| SECURITY | NUMBER OF SHARES | VALUE ($) |
| Verizon Communications, Inc. | 1,742,180 | 65,105,266 |
| 173,976,396 | ||
| Transportation 1.8% | ||
| Air T, Inc. * | 1,445 | 31,660 |
| Air Transport Services Group, Inc. * | 24,772 | 723,342 |
| Alaska Air Group, Inc. * | 53,561 | 2,381,322 |
| Allegiant Travel Co. * | 6,136 | 460,507 |
| AMERCO | 4,034 | 2,320,316 |
| American Airlines Group, Inc. * | 269,132 | 3,816,292 |
| ArcBest Corp. | 10,126 | 804,308 |
| Atlas Air Worldwide Holdings, Inc. * | 10,949 | 1,107,382 |
| Avis Budget Group, Inc. * | 12,076 | 2,855,491 |
| Bird Global, Inc., Class A * | 105,731 | 45,908 |
| Blade Air Mobility, Inc. * | 17,729 | 79,781 |
| C.H. Robinson Worldwide, Inc. | 51,399 | 5,022,710 |
| Covenant Logistics Group, Inc. | 3,394 | 128,429 |
| CSX Corp. | 887,771 | 25,798,625 |
| Daseke, Inc. * | 25,341 | 151,032 |
| Delta Air Lines, Inc. * | 267,338 | 9,070,778 |
| Eagle Bulk Shipping, Inc. | 4,187 | 202,567 |
| Expeditors International of Washington, Inc. | 67,839 | 6,638,046 |
| FedEx Corp. | 99,325 | 15,919,811 |
| Forward Air Corp. | 10,979 | 1,162,347 |
| Frontier Group Holdings, Inc. * | 16,091 | 210,953 |
| FTAI Infrastructure, Inc. * | 43,117 | 118,572 |
| Genco Shipping & Trading Ltd. | 14,965 | 200,531 |
| GXO Logistics, Inc. * | 49,069 | 1,792,981 |
| Hawaiian Holdings, Inc. * | 20,206 | 291,573 |
| Heartland Express, Inc. | 18,795 | 279,670 |
| Hertz Global Holdings, Inc. * | 73,728 | 1,356,595 |
| Hub Group, Inc., Class A * | 13,809 | 1,071,578 |
| JB Hunt Transport Services, Inc. | 34,465 | 5,895,928 |
| JetBlue Airways Corp. * | 132,935 | 1,068,797 |
| Joby Aviation, Inc. *(a) | 118,668 | 571,980 |
| Kirby Corp. * | 24,458 | 1,705,946 |
| Knight-Swift Transportation Holdings, Inc. | 67,088 | 3,222,237 |
| Landstar System, Inc. | 15,003 | 2,343,769 |
| Lyft, Inc., Class A * | 125,069 | 1,831,010 |
| Marten Transport Ltd. | 24,450 | 458,927 |
| Matson, Inc. | 16,980 | 1,249,388 |
| Mesa Air Group, Inc. * | 22,871 | 33,849 |
| Norfolk Southern Corp. | 97,405 | 22,215,158 |
| Old Dominion Freight Line, Inc. | 37,962 | 10,424,365 |
| P.A.M. Transportation Services, Inc. * | 1,961 | 54,614 |
| Pangaea Logistics Solutions Ltd. | 13,298 | 64,229 |
| Radiant Logistics, Inc. * | 16,850 | 102,280 |
| Ryder System, Inc. | 21,359 | 1,719,613 |
| Saia, Inc. * | 11,056 | 2,198,596 |
| Schneider National, Inc., Class B | 14,219 | 316,231 |
| SkyWest, Inc. * | 20,970 | 370,750 |
| Southwest Airlines Co. * | 245,436 | 8,921,599 |
| Spirit Airlines, Inc. | 45,820 | 1,008,040 |
| Sun Country Airlines Holdings, Inc. * | 14,296 | 232,739 |
| TuSimple Holdings, Inc., Class A * | 58,585 | 200,947 |
| Uber Technologies, Inc. * | 822,244 | 21,847,023 |
| Union Pacific Corp. | 258,881 | 51,035,800 |
| United Airlines Holdings, Inc. * | 136,481 | 5,879,601 |
| United Parcel Service, Inc., Class B | 303,294 | 50,883,634 |
| Universal Logistics Holdings, Inc. | 3,300 | 105,600 |
| US Xpress Enterprises, Inc., Class A * | 8,327 | 19,402 |
| Werner Enterprises, Inc. | 23,950 | 938,840 |
| Wheels Up Experience, Inc. * | 67,393 | 119,286 |
| XPO Logistics, Inc. * | 48,289 | 2,498,473 |
| SECURITY | NUMBER OF SHARES | VALUE ($) |
| Yellow Corp. * | 13,029 | 57,718 |
| 283,639,476 | ||
| Utilities 2.8% | ||
| ALLETE, Inc. | 23,316 | 1,311,991 |
| Alliant Energy Corp. | 104,010 | 5,426,202 |
| Altus Power, Inc. * | 13,336 | 132,827 |
| Ameren Corp. | 107,072 | 8,728,509 |
| American Electric Power Co., Inc. | 213,169 | 18,741,819 |
| American States Water Co. | 15,159 | 1,371,283 |
| American Water Works Co., Inc. | 75,749 | 11,009,360 |
| Artesian Resources Corp., Class A | 2,941 | 153,756 |
| Atmos Energy Corp. | 58,205 | 6,201,743 |
| Avangrid, Inc. | 29,783 | 1,211,572 |
| Avista Corp. | 29,804 | 1,222,858 |
| Black Hills Corp. | 26,602 | 1,738,973 |
| Cadiz, Inc. * | 15,822 | 30,853 |
| California Water Service Group | 22,389 | 1,389,461 |
| CenterPoint Energy, Inc. | 261,774 | 7,489,354 |
| Chesapeake Utilities Corp. | 7,111 | 884,466 |
| Clearway Energy, Inc., Class A | 14,344 | 463,742 |
| Clearway Energy, Inc., Class C | 33,157 | 1,151,874 |
| CMS Energy Corp. | 120,766 | 6,889,700 |
| Consolidated Edison, Inc. | 147,218 | 12,949,295 |
| Consolidated Water Co., Ltd. | 4,898 | 89,927 |
| Constellation Energy Corp. | 135,678 | 12,826,998 |
| Dominion Energy, Inc. | 344,628 | 24,113,621 |
| DTE Energy Co. | 80,315 | 9,004,115 |
| Duke Energy Corp. | 319,097 | 29,733,459 |
| Edison International | 157,747 | 9,471,130 |
| Entergy Corp. | 84,753 | 9,080,436 |
| Essential Utilities, Inc. | 98,999 | 4,377,736 |
| Evergy, Inc. | 95,610 | 5,844,639 |
| Eversource Energy | 144,127 | 10,994,008 |
| Exelon Corp. | 410,789 | 15,852,348 |
| FirstEnergy Corp. | 225,733 | 8,512,391 |
| Genie Energy Ltd., Class B | 6,776 | 66,202 |
| Global Water Resources, Inc. | 4,694 | 59,895 |
| Hawaiian Electric Industries, Inc. | 45,090 | 1,715,224 |
| IDACORP, Inc. | 20,845 | 2,182,472 |
| MGE Energy, Inc. | 14,691 | 1,000,310 |
| Middlesex Water Co. | 7,852 | 702,518 |
| Montauk Renewables, Inc. * | 25,936 | 388,262 |
| National Fuel Gas Co. | 38,209 | 2,578,725 |
| New Jersey Resources Corp. | 40,011 | 1,786,091 |
| NextEra Energy, Inc. | 814,916 | 63,155,990 |
| NiSource, Inc. | 168,378 | 4,325,631 |
| Northwest Natural Holding Co. | 14,215 | 683,599 |
| NorthWestern Corp. | 23,430 | 1,237,807 |
| NRG Energy, Inc. | 97,250 | 4,317,900 |
| OGE Energy Corp. | 82,465 | 3,020,693 |
| ONE Gas, Inc. | 22,158 | 1,716,802 |
| Ormat Technologies, Inc. | 18,201 | 1,646,281 |
| Otter Tail Corp. | 17,852 | 1,203,582 |
| PG&E Corp. * | 666,570 | 9,951,890 |
| Pinnacle West Capital Corp. | 46,637 | 3,134,473 |
| PNM Resources, Inc. | 36,396 | 1,691,322 |
| Portland General Electric Co. | 37,443 | 1,682,688 |
| PPL Corp. | 306,458 | 8,118,072 |
| Public Service Enterprise Group, Inc. | 206,997 | 11,606,322 |
| Pure Cycle Corp. * | 8,445 | 72,880 |
| RGC Resources, Inc. | 3,883 | 83,290 |
| Sempra Energy | 130,313 | 19,669,444 |
| SJW Group | 10,919 | 771,755 |
| South Jersey Industries, Inc. | 51,842 | 1,797,362 |
| Southwest Gas Holdings, Inc. | 25,522 | 1,864,893 |
| Spire, Inc. | 21,367 | 1,491,630 |
| SECURITY | NUMBER OF SHARES | VALUE ($) |
| Sunnova Energy International, Inc. * | 41,254 | 764,849 |
| The AES Corp. | 278,415 | 7,283,336 |
| The Southern Co. | 440,228 | 28,826,129 |
| The York Water Co. | 6,196 | 269,898 |
| UGI Corp. | 86,600 | 3,059,578 |
| Unitil Corp. | 7,063 | 372,291 |
| Via Renewables, Inc. | 6,556 | 45,826 |
| Vistra Corp. | 160,737 | 3,692,129 |
| WEC Energy Group, Inc. | 130,645 | 11,931,808 |
| Xcel Energy, Inc. | 227,072 | 14,784,658 |
| 453,154,953 | ||
| Total Common Stocks (Cost $9,413,955,696) | 15,979,113,144 | |
| PREFERRED STOCKS 0.0% OF NET ASSETS | ||
| Software & Services 0.0% | ||
| SRAX, Inc. *(b) | 9,789 | 587 |
| Total Preferred Stocks (Cost $530) | 587 | |
| RIGHTS 0.0% OF NET ASSETS | ||
| Consumer Durables & Apparel 0.0% | ||
| ZAGG, Inc. CVR *(b) | 8,000 | 720 |
| Pharmaceuticals, Biotechnology & Life Sciences 0.0% | ||
| Aduro Biotech, Inc. CVR *(b) | 5,747 | 10,301 |
| F-star Therapeutics, Inc. Agonist CVR *(b) | 975 | 415 |
| F-star Therapeutics, Inc. Antagonist CVR *(b) | 975 | 415 |
| 11,131 | ||
| Total Rights (Cost $720) | 11,851 | |
| SHORT-TERM INVESTMENTS 0.2% OF NET ASSETS | ||
| Money Market Funds 0.2% | ||
| State Street Institutional U.S. Government Money Market Fund, Premier Class 3.01% (d)(e) | 41,672,354 | 41,672,354 |
| Total Short-Term Investments (Cost $41,672,354) | 41,672,354 | |
| Total Investments in Securities (Cost $9,455,629,300) | 16,020,797,936 | |
| NUMBER OF CONTRACTS | NOTIONAL AMOUNT ($) | CURRENT VALUE/ UNREALIZED APPRECIATION ($) | |
| FUTURES CONTRACTS | |||
| Long | |||
| Russell 2000 Index, e-mini, expires 12/16/22 | 114 | 10,562,100 | 579,686 |
| S&P 500 Index, e-mini, expires 12/16/22 | 307 | 59,604,050 | 2,368,565 |
| Net Unrealized Appreciation | 2,948,251 | ||
| * | Non-income producing security. |
| (a) | All or a portion of this security is on loan. Securities on loan were valued at $39,625,164. |
| (b) | Fair-valued using significant unobservable inputs (see financial note 2(a), Securities for which no quoted value is available, for additional information). |
| (c) | Issuer is affiliated with the fund’s investment adviser. |
| (d) | The rate shown is the annualized 7-day yield. |
| (e) | Security purchased with cash collateral received for securities on loan. |
| CVR — | Contingent Value Rights |
| REIT — | Real Estate Investment Trust |
| SECURITY | VALUE AT 10/31/21 | PURCHASES | SALES | REALIZED GAINS (LOSSES) | NET CHANGE IN UNREALIZED APPRECIATION (DEPRECIATION) | VALUE AT 10/31/22 | BALANCE OF SHARES HELD AT 10/31/22 | DIVIDENDS RECEIVED |
| COMMON STOCKS 0.3% OF NET ASSETS | ||||||||
| Diversified Financials 0.3% | ||||||||
| The Charles Schwab Corp. | $46,634,301 | $4,717,931 | $— | $— | ($1,149,217) | $50,203,015 | 630,137 | $476,594 |
| DESCRIPTION | QUOTED PRICES IN ACTIVE MARKETS FOR IDENTICAL ASSETS (LEVEL 1) | OTHER SIGNIFICANT OBSERVABLE INPUTS (LEVEL 2) | SIGNIFICANT UNOBSERVABLE INPUTS (LEVEL 3) | TOTAL |
| Assets | ||||
| Common Stocks1 | $15,110,337,328 | $— | $— | $15,110,337,328 |
| Automobiles & Components | 352,285,243 | — | 16,736 | 352,301,979 |
| Real Estate | 516,473,837 | — | 0* | 516,473,837 |
| Preferred Stocks1 | ||||
| Software & Services | — | — | 587 | 587 |
| Rights 1 | ||||
| Consumer Durables & Apparel | — | — | 720 | 720 |
| Pharmaceuticals, Biotechnology & Life Sciences | — | — | 11,131 | 11,131 |
| Short-Term Investments1 | 41,672,354 | — | — | 41,672,354 |
| Futures Contracts2 | 2,948,251 | — | — | 2,948,251 |
| Total | $16,023,717,013 | $— | $29,174 | $16,023,746,187 |
| * | Level 3 amount shown includes securities determined to have no value at October 31, 2022. |
| 1 | As categorized in the Portfolio Holdings. |
| 2 | Futures contracts are reported at cumulative unrealized appreciation or depreciation. |
| Assets | ||
| Investments in securities, at value - affiliated (cost $23,776,365) | $50,203,015 | |
| Investments in securities, at value - unaffiliated (cost $9,431,852,935) including securities on loan of $39,625,164 | 15,970,594,921 | |
| Cash | 64,521,734 | |
| Deposit with broker for futures contracts | 3,647,001 | |
| Receivables: | ||
| Fund shares sold | 13,880,553 | |
| Dividends | 11,576,025 | |
| Income from securities on loan | + | 234,103 |
| Total assets | 16,114,657,352 | |
| Liabilities | ||
| Collateral held for securities on loan | 41,672,354 | |
| Payables: | ||
| Fund shares redeemed | 26,045,127 | |
| Variation margin on futures contracts | 375,495 | |
| Investment adviser fees | + | 366,711 |
| Total liabilities | 68,459,687 | |
| Net assets | $16,046,197,665 | |
| Net Assets by Source | ||
| Capital received from investors | $9,456,152,539 | |
| Total distributable earnings | + | 6,590,045,126 |
| Net assets | $16,046,197,665 | |
| Net Asset Value (NAV) | ||||
| Net Assets | ÷ | Shares Outstanding | = | NAV |
| $16,046,197,665 | 240,127,163 | $66.82 | ||
| For the period November 1, 2021 through October 31, 2022 | ||
| Investment Income | ||
| Dividends received from securities - unaffiliated (net of foreign withholding tax of $61,432) | $247,713,044 | |
| Dividends received from securities - affiliated | 476,594 | |
| Interest received from securities - unaffiliated | 312,974 | |
| Securities on loan, net | + | 2,824,819 |
| Total investment income | 251,327,431 | |
| Expenses | ||
| Investment adviser fees | 5,132,595 | |
| Proxy fees1 | + | 431,115 |
| Total expenses | – | 5,563,710 |
| Net investment income | 245,763,721 | |
| REALIZED AND UNREALIZED GAINS (LOSSES) | ||
| Net realized losses on sales of securities - unaffiliated | (50,051,270) | |
| Net realized losses on futures contracts | + | (12,721,600) |
| Net realized losses | (62,772,870) | |
| Net change in unrealized appreciation (depreciation) on securities - affiliated | (1,149,217) | |
| Net change in unrealized appreciation (depreciation) on securities - unaffiliated | (3,392,134,174) | |
| Net change in unrealized appreciation (depreciation) on futures contracts | + | (296,828) |
| Net change in unrealized appreciation (depreciation) | + | (3,393,580,219) |
| Net realized and unrealized losses | (3,456,353,089) | |
| Decrease in net assets resulting from operations | ($3,210,589,368) | |
| 1 | Proxy fees are non-routine expenses (see financial note 2(e) for additional information). |
| OPERATIONS | |||
| 11/1/21-10/31/22 | 11/1/20-10/31/21 | ||
| Net investment income | $245,763,721 | $213,096,831 | |
| Net realized gains (losses) | (62,772,870) | 34,732,921 | |
| Net change in unrealized appreciation (depreciation) | + | (3,393,580,219) | 5,009,497,999 |
| Increase (decrease) in net assets resulting from operations | ($3,210,589,368) | $5,257,327,751 | |
| DISTRIBUTIONS TO SHAREHOLDERS | |||
| Total distributions | ($271,189,903) | ($218,157,695) | |
| TRANSACTIONS IN FUND SHARES | |||||
| 11/1/21-10/31/22 | 11/1/20-10/31/21 | ||||
| SHARES | VALUE | SHARES | VALUE | ||
| Shares sold | 42,748,598 | $3,156,883,859 | 45,495,323 | $3,270,028,626 | |
| Shares reinvested | 2,402,741 | 195,366,859 | 2,374,705 | 156,303,072 | |
| Shares redeemed | + | (28,345,522) | (2,055,951,707) | (23,925,141) | (1,721,261,599) |
| Net transactions in fund shares | 16,805,817 | $1,296,299,011 | 23,944,887 | $1,705,070,099 | |
| SHARES OUTSTANDING AND NET ASSETS | |||||
| 11/1/21-10/31/22 | 11/1/20-10/31/21 | ||||
| SHARES | NET ASSETS | SHARES | NET ASSETS | ||
| Beginning of period | 223,321,346 | $18,231,677,925 | 199,376,459 | $11,487,437,770 | |
| Total increase (decrease) | + | 16,805,817 | (2,185,480,260) | 23,944,887 | 6,744,240,155 |
| End of period | 240,127,163 | $16,046,197,665 | 223,321,346 | $18,231,677,925 | |
| 11/1/21– 10/31/22 | 11/1/20– 10/31/21 | 11/1/19– 10/31/20 | 11/1/18– 10/31/19 | 12/20/17 1– 10/31/18 | ||
| Per-Share Data | ||||||
| Net asset value at beginning of period | $89.23 | $62.76 | $49.06 | $42.37 | $40.00 | |
| Income (loss) from investment operations: | ||||||
| Net investment income (loss)2 | 0.64 | 0.56 | 0.55 | 0.57 | 0.46 | |
| Net realized and unrealized gains (losses) | (22.20) | 26.39 | 13.65 | 6.52 | 1.91 3 | |
| Total from investment operations | (21.56) | 26.95 | 14.20 | 7.09 | 2.37 | |
| Less distributions: | ||||||
| Distributions from net investment income | (0.51) | (0.48) | (0.50) | (0.40) | — | |
| Distributions from net realized gains | (1.07) | — | — | — | — | |
| Total distributions | (1.58) | (0.48) | (0.50) | (0.40) | — | |
| Net asset value at end of period | $66.09 | $89.23 | $62.76 | $49.06 | $42.37 | |
| Total return | (24.63%) | 43.14% | 29.16% | 17.04% | 5.93% 4 | |
| Ratios/Supplemental Data | ||||||
| Ratios to average net assets: | ||||||
| Total expenses | 0.035% 5 | 0.035% | 0.035% | 0.035% 6 | 0.040% 7,8 | |
| Net operating expenses | N/A | N/A | N/A | N/A | 0.02% 7,8 | |
| Net investment income (loss) | 0.86% | 0.73% | 0.97% | 1.27% | 1.23% 7 | |
| Portfolio turnover rate | 18% | 18% | 41% | 46% | 23% 4 | |
| Net assets, end of period (x 1,000) | $928,988 | $881,159 | $487,205 | $165,819 | $92,752 | |
| 1 | Commencement of operations. |
| 2 | Calculated based on the average shares outstanding during the period. |
| 3 | The per share amount does not accord with the change in aggregate gains and losses in securities during the period because of the timing of sales and repurchases of fund shares in relation to fluctuating market values. |
| 4 | Not annualized. |
| 5 | Ratio includes less than 0.0005% of non-routine proxy expenses. |
| 6 | Effective December 20, 2018, the annual operating expense ratio was reduced to 0.035%. The ratio presented for period ended 10/31/19 is a blended ratio. |
| 7 | Annualized. |
| 8 | The investment adviser voluntarily agreed to waive the fund’s management fees to 0.00% beginning with the fund’s commencement of operations through June 30, 2018. The ratio presented for period ended 10/31/18 is a blended ratio. |
| SECURITY | NUMBER OF SHARES | VALUE ($) |
| COMMON STOCKS 99.1% OF NET ASSETS | ||
| Automobiles & Components 3.3% | ||
| Aptiv plc * | 3,488 | 317,652 |
| Lucid Group, Inc. *(a) | 25,664 | 366,739 |
| Tesla, Inc. * | 130,967 | 29,800,231 |
| 30,484,622 | ||
| Banks 0.1% | ||
| First Citizens BancShares, Inc., Class A | 154 | 126,606 |
| Rocket Cos., Inc., Class A | 3,221 | 22,225 |
| Signature Bank | 154 | 24,414 |
| SVB Financial Group * | 1,930 | 445,753 |
| UWM Holdings Corp. | 3,500 | 11,480 |
| Western Alliance Bancorp | 3,301 | 221,728 |
| 852,206 | ||
| Capital Goods 4.2% | ||
| A.O. Smith Corp. | 1,561 | 85,512 |
| Advanced Drainage Systems, Inc. | 3,294 | 381,709 |
| AECOM | 369 | 27,778 |
| AGCO Corp. | 418 | 51,903 |
| Allegion plc | 3,559 | 372,876 |
| Allison Transmission Holdings, Inc. | 3,823 | 161,522 |
| Armstrong World Industries, Inc. | 1,312 | 99,148 |
| Axon Enterprise, Inc. * | 2,687 | 390,797 |
| BWX Technologies, Inc. | 1,798 | 102,450 |
| Carlisle Cos., Inc. | 2,226 | 531,569 |
| Caterpillar, Inc. | 23,680 | 5,125,773 |
| ChargePoint Holdings, Inc. *(a) | 12,749 | 178,231 |
| Core & Main, Inc., Class A * | 1,252 | 29,522 |
| Deere & Co. | 14,436 | 5,714,057 |
| Donaldson Co., Inc. | 1,034 | 59,403 |
| Emerson Electric Co. | 9,691 | 839,241 |
| Fastenal Co. | 29,616 | 1,431,341 |
| Fortune Brands Home & Security, Inc. | 2,274 | 137,168 |
| Generac Holdings, Inc. * | 3,197 | 370,564 |
| General Electric Co. | 3,167 | 246,424 |
| Graco, Inc. | 5,931 | 412,679 |
| HEICO Corp. | 2,211 | 359,597 |
| HEICO Corp., Class A | 3,734 | 475,338 |
| Honeywell International, Inc. | 10,207 | 2,082,432 |
| Howmet Aerospace, Inc. | 1,818 | 64,630 |
| Huntington Ingalls Industries, Inc. | 436 | 112,083 |
| IDEX Corp. | 696 | 154,728 |
| Illinois Tool Works, Inc. | 14,366 | 3,067,572 |
| Lincoln Electric Holdings, Inc. | 2,877 | 408,534 |
| Lockheed Martin Corp. | 12,225 | 5,949,663 |
| Masco Corp. | 593 | 27,438 |
| Nordson Corp. | 705 | 158,625 |
| Northrop Grumman Corp. | 884 | 485,325 |
| Otis Worldwide Corp. | 2,647 | 186,984 |
| Parker-Hannifin Corp. | 1,501 | 436,221 |
| Plug Power, Inc. * | 13,312 | 212,726 |
| Quanta Services, Inc. | 3,988 | 566,455 |
| SECURITY | NUMBER OF SHARES | VALUE ($) |
| Rockwell Automation, Inc. | 4,031 | 1,029,114 |
| SiteOne Landscape Supply, Inc. * | 1,391 | 161,175 |
| Spirit AeroSystems Holdings, Inc., Class A | 5,062 | 117,236 |
| The Boeing Co. * | 8,782 | 1,251,523 |
| The Middleby Corp. * | 187 | 26,154 |
| The Toro Co. | 5,362 | 565,316 |
| Trane Technologies plc | 6,974 | 1,113,260 |
| TransDigm Group, Inc. | 1,018 | 586,124 |
| Trex Co., Inc. * | 5,677 | 273,007 |
| United Rentals, Inc. * | 1,647 | 519,974 |
| Valmont Industries, Inc. | 142 | 45,329 |
| Vertiv Holdings Co. | 2,398 | 34,315 |
| W.W. Grainger, Inc. | 2,346 | 1,370,885 |
| Watsco, Inc. | 894 | 242,238 |
| WESCO International, Inc. * | 1,211 | 166,839 |
| WillScot Mobile Mini Holdings Corp. * | 5,696 | 242,251 |
| Xylem, Inc. | 1,292 | 132,340 |
| 39,375,098 | ||
| Commercial & Professional Services 1.2% | ||
| Booz Allen Hamilton Holding Corp. | 6,747 | 734,411 |
| Cintas Corp. | 4,158 | 1,777,753 |
| Copart, Inc. * | 10,965 | 1,261,194 |
| CoStar Group, Inc. * | 2,907 | 240,467 |
| Driven Brands Holdings, Inc. * | 148 | 4,733 |
| Equifax, Inc. | 3,131 | 530,830 |
| FTI Consulting, Inc. * | 727 | 113,143 |
| IAA, Inc. * | 5,656 | 214,532 |
| KBR, Inc. | 4,625 | 230,186 |
| MSA Safety, Inc. | 713 | 95,713 |
| Republic Services, Inc. | 690 | 91,508 |
| Robert Half International, Inc. | 4,891 | 373,966 |
| Rollins, Inc. | 11,025 | 463,932 |
| Tetra Tech, Inc. | 1,107 | 156,397 |
| TransUnion | 7,265 | 430,597 |
| Verisk Analytics, Inc. | 8,003 | 1,463,188 |
| Waste Management, Inc. | 20,027 | 3,171,676 |
| 11,354,226 | ||
| Consumer Durables & Apparel 1.1% | ||
| Brunswick Corp. | 667 | 47,137 |
| D.R. Horton, Inc. | 8,578 | 659,477 |
| Deckers Outdoor Corp. * | 1,196 | 418,516 |
| Lululemon Athletica, Inc. * | 5,749 | 1,891,651 |
| Mattel, Inc. * | 8,679 | 164,554 |
| NIKE, Inc., Class B | 63,124 | 5,850,332 |
| NVR, Inc. * | 112 | 474,628 |
| Polaris, Inc. | 2,153 | 218,745 |
| PulteGroup, Inc. | 4,608 | 184,274 |
| Skechers U.S.A., Inc., Class A * | 1,040 | 35,807 |
| Tapestry, Inc. | 1,692 | 53,602 |
| Toll Brothers, Inc. | 2,833 | 122,046 |
| TopBuild Corp. * | 1,406 | 239,217 |
| YETI Holdings, Inc. * | 4,455 | 142,916 |
| 10,502,902 | ||
| SECURITY | NUMBER OF SHARES | VALUE ($) |
| Consumer Services 2.3% | ||
| Airbnb, Inc., Class A * | 20,108 | 2,149,746 |
| Booking Holdings, Inc. * | 2,044 | 3,821,217 |
| Bright Horizons Family Solutions, Inc. * | 820 | 53,562 |
| Caesars Entertainment, Inc. * | 7,253 | 317,174 |
| Chipotle Mexican Grill, Inc. * | 1,432 | 2,145,609 |
| Choice Hotels International, Inc. | 1,720 | 223,325 |
| Churchill Downs, Inc. | 1,863 | 387,336 |
| Darden Restaurants, Inc. | 4,585 | 656,297 |
| Domino’s Pizza, Inc. | 1,351 | 448,856 |
| DraftKings, Inc., Class A * | 16,709 | 264,002 |
| Expedia Group, Inc. * | 7,788 | 727,944 |
| H&R Block, Inc. | 6,801 | 279,861 |
| Hilton Worldwide Holdings, Inc. | 10,055 | 1,360,039 |
| Las Vegas Sands Corp. * | 6,349 | 241,326 |
| Marriott International, Inc., Class A | 14,137 | 2,263,475 |
| McDonald’s Corp. | 9,258 | 2,524,286 |
| Mister Car Wash, Inc. * | 2,985 | 26,358 |
| Norwegian Cruise Line Holdings Ltd. * | 1,568 | 26,484 |
| Planet Fitness, Inc., Class A * | 3,198 | 209,405 |
| Six Flags Entertainment Corp. * | 1,828 | 40,764 |
| Starbucks Corp. | 21,271 | 1,841,856 |
| The Wendy's Co. | 8,686 | 180,495 |
| Travel & Leisure Co. | 2,942 | 111,737 |
| Vail Resorts, Inc. | 1,952 | 427,742 |
| Wyndham Hotels & Resorts, Inc. | 3,122 | 237,054 |
| Wynn Resorts Ltd. * | 685 | 43,772 |
| Yum! Brands, Inc. | 1,684 | 199,133 |
| 21,208,855 | ||
| Diversified Financials 1.8% | ||
| American Express Co. | 1,964 | 291,556 |
| Ameriprise Financial, Inc. | 3,552 | 1,097,994 |
| Apollo Global Management, Inc. | 17,997 | 996,314 |
| Ares Management Corp., Class A | 7,789 | 590,640 |
| Blackstone, Inc. | 36,051 | 3,285,688 |
| Blue Owl Capital, Inc. | 21,261 | 213,035 |
| Credit Acceptance Corp. * | 33 | 15,365 |
| FactSet Research Systems, Inc. | 1,955 | 831,833 |
| LPL Financial Holdings, Inc. | 4,098 | 1,047,654 |
| MarketAxess Holdings, Inc. | 1,912 | 466,605 |
| Moody's Corp. | 7,773 | 2,058,835 |
| Morningstar, Inc. | 1,157 | 268,632 |
| MSCI, Inc. | 3,058 | 1,433,774 |
| Raymond James Financial, Inc. | 826 | 97,584 |
| The Charles Schwab Corp. (b) | 43,238 | 3,444,771 |
| Tradeweb Markets, Inc., Class A | 3,517 | 193,716 |
| Upstart Holdings, Inc. *(a) | 699 | 16,203 |
| 16,350,199 | ||
| Energy 1.8% | ||
| Antero Resources Corp. * | 9,705 | 355,785 |
| Cheniere Energy, Inc. | 7,363 | 1,298,907 |
| Continental Resources, Inc. | 1,411 | 104,372 |
| Coterra Energy, Inc. | 6,569 | 204,493 |
| Devon Energy Corp. | 16,555 | 1,280,529 |
| Diamondback Energy, Inc. | 5,091 | 799,847 |
| Enviva, Inc. | 1,539 | 92,094 |
| EOG Resources, Inc. | 22,021 | 3,006,307 |
| Halliburton Co. | 20,974 | 763,873 |
| Hess Corp. | 11,343 | 1,600,270 |
| New Fortress Energy, Inc. | 2,480 | 136,574 |
| Occidental Petroleum Corp. | 34,791 | 2,525,827 |
| ONEOK, Inc. | 2,529 | 150,020 |
| Ovintiv, Inc. | 9,350 | 473,577 |
| SECURITY | NUMBER OF SHARES | VALUE ($) |
| PDC Energy, Inc. | 2,591 | 186,915 |
| Pioneer Natural Resources Co. | 6,726 | 1,724,614 |
| Range Resources Corp. | 8,730 | 248,630 |
| Southwestern Energy Co. * | 3,925 | 27,200 |
| Targa Resources Corp. | 11,629 | 795,075 |
| Texas Pacific Land Corp. | 295 | 679,642 |
| 16,454,551 | ||
| Food & Staples Retailing 1.5% | ||
| BJ's Wholesale Club Holdings, Inc. * | 4,354 | 337,000 |
| Costco Wholesale Corp. | 22,804 | 11,436,206 |
| Grocery Outlet Holding Corp. * | 288 | 9,956 |
| Performance Food Group Co. * | 2,405 | 125,156 |
| Sysco Corp. | 26,118 | 2,260,774 |
| 14,169,092 | ||
| Food, Beverage & Tobacco 2.7% | ||
| Brown-Forman Corp., Class A | 1,340 | 92,152 |
| Brown-Forman Corp., Class B | 5,555 | 377,740 |
| Darling Ingredients, Inc. * | 573 | 44,969 |
| Freshpet, Inc. * | 1,317 | 77,637 |
| Kellogg Co. | 7,086 | 544,347 |
| Lamb Weston Holdings, Inc. | 7,390 | 637,166 |
| Monster Beverage Corp. * | 17,688 | 1,657,719 |
| PepsiCo, Inc. | 60,172 | 10,926,032 |
| Pilgrim's Pride Corp. * | 1,284 | 29,596 |
| The Boston Beer Co., Inc., Class A * | 460 | 171,713 |
| The Coca-Cola Co. | 150,840 | 9,027,774 |
| The Hershey Co. | 6,512 | 1,554,870 |
| 25,141,715 | ||
| Health Care Equipment & Services 5.8% | ||
| Abbott Laboratories | 11,677 | 1,155,322 |
| ABIOMED, Inc. * | 2,291 | 577,515 |
| agilon health, Inc. * | 9,001 | 178,670 |
| Align Technology, Inc. * | 3,018 | 586,397 |
| AmerisourceBergen Corp. | 7,586 | 1,192,671 |
| Baxter International, Inc. | 4,034 | 219,248 |
| Certara, Inc. * | 3,875 | 47,391 |
| Chemed Corp. | 261 | 121,853 |
| Cigna Corp. | 2,451 | 791,820 |
| DaVita, Inc. * | 2,880 | 210,269 |
| Definitive Healthcare Corp. * | 826 | 13,034 |
| DexCom, Inc. * | 20,146 | 2,433,234 |
| Doximity, Inc., Class A * | 2,591 | 68,584 |
| Edwards Lifesciences Corp. * | 31,800 | 2,303,274 |
| Elevance Health, Inc. | 3,774 | 2,063,510 |
| Globus Medical, Inc., Class A * | 222 | 14,874 |
| Guardant Health, Inc. * | 5,016 | 248,292 |
| HCA Healthcare, Inc. | 682 | 148,315 |
| Humana, Inc. | 4,594 | 2,563,819 |
| ICU Medical, Inc. * | 187 | 27,753 |
| IDEXX Laboratories, Inc. * | 4,288 | 1,542,308 |
| Insulet Corp. * | 3,538 | 915,670 |
| Intuitive Surgical, Inc. * | 16,972 | 4,183,089 |
| Masimo Corp. * | 1,869 | 245,960 |
| McKesson Corp. | 1,466 | 570,816 |
| Molina Healthcare, Inc. * | 2,284 | 819,636 |
| Novocure Ltd. * | 5,305 | 374,851 |
| Penumbra, Inc. * | 1,833 | 314,304 |
| ResMed, Inc. | 7,429 | 1,661,793 |
| Signify Health, Inc., Class A * | 172 | 5,028 |
| Stryker Corp. | 9,679 | 2,218,814 |
| Tandem Diabetes Care, Inc. * | 3,032 | 170,247 |
| Teladoc Health, Inc. * | 840 | 24,898 |
| SECURITY | NUMBER OF SHARES | VALUE ($) |
| UnitedHealth Group, Inc. | 43,831 | 24,332,780 |
| Veeva Systems, Inc., Class A * | 7,171 | 1,204,298 |
| 53,550,337 | ||
| Household & Personal Products 1.5% | ||
| Church & Dwight Co., Inc. | 5,622 | 416,759 |
| Colgate-Palmolive Co. | 26,221 | 1,936,159 |
| Kimberly-Clark Corp. | 10,243 | 1,274,844 |
| Olaplex Holdings, Inc. * | 6,386 | 28,098 |
| The Clorox Co. | 5,244 | 765,834 |
| The Estee Lauder Cos., Inc., Class A | 11,825 | 2,370,794 |
| The Procter & Gamble Co. | 52,489 | 7,068,693 |
| 13,861,181 | ||
| Insurance 1.3% | ||
| Aon plc, Class A | 10,210 | 2,874,013 |
| Arch Capital Group Ltd. * | 5,886 | 338,445 |
| Arthur J. Gallagher & Co. | 1,233 | 230,670 |
| Assurant, Inc. | 161 | 21,873 |
| Brown & Brown, Inc. | 897 | 52,735 |
| Erie Indemnity Co., Class A | 959 | 246,472 |
| Everest Re Group Ltd. | 613 | 197,790 |
| Lincoln National Corp. | 1,745 | 94,003 |
| Markel Corp. * | 157 | 189,358 |
| Marsh & McLennan Cos., Inc. | 23,082 | 3,727,512 |
| RenaissanceRe Holdings Ltd. | 1,210 | 187,163 |
| Ryan Specialty Group Holdings, Inc., Class A * | 4,245 | 190,388 |
| The Progressive Corp. | 26,174 | 3,360,742 |
| 11,711,164 | ||
| Materials 1.4% | ||
| Albemarle Corp. | 3,102 | 868,157 |
| Ardagh Metal Packaging S.A. | 2,149 | 9,542 |
| Avery Dennison Corp. | 2,583 | 437,948 |
| Axalta Coating Systems Ltd. * | 2,767 | 64,526 |
| Ball Corp. | 6,334 | 312,836 |
| Berry Global Group, Inc. * | 3,100 | 146,692 |
| CF Industries Holdings, Inc. | 10,230 | 1,087,040 |
| Crown Holdings, Inc. | 5,284 | 362,430 |
| Eagle Materials, Inc. | 1,585 | 193,861 |
| Ecolab, Inc. | 11,280 | 1,771,750 |
| FMC Corp. | 2,214 | 263,245 |
| Ginkgo Bioworks Holdings, Inc. * | 8,165 | 22,290 |
| Graphic Packaging Holding Co. | 12,041 | 276,461 |
| Linde plc | 5,449 | 1,620,260 |
| Louisiana-Pacific Corp. | 342 | 19,374 |
| Martin Marietta Materials, Inc. | 282 | 94,746 |
| MP Materials Corp. * | 4,640 | 139,386 |
| PPG Industries, Inc. | 6,422 | 733,264 |
| Royal Gold, Inc. | 212 | 20,132 |
| RPM International, Inc. | 323 | 30,546 |
| Sealed Air Corp. | 7,507 | 357,483 |
| Southern Copper Corp. | 2,888 | 135,649 |
| The Chemours Co. | 4,751 | 136,021 |
| The Mosaic Co. | 2,176 | 116,960 |
| The Scotts Miracle-Gro Co. | 687 | 31,540 |
| The Sherwin-Williams Co. | 12,315 | 2,771,245 |
| Valvoline, Inc. | 8,983 | 263,741 |
| Vulcan Materials Co. | 3,333 | 545,612 |
| 12,832,737 | ||
| SECURITY | NUMBER OF SHARES | VALUE ($) |
| Media & Entertainment 6.9% | ||
| Alphabet, Inc., Class A * | 268,975 | 25,420,827 |
| Alphabet, Inc., Class C * | 241,505 | 22,860,863 |
| Cable One, Inc. | 185 | 158,995 |
| Charter Communications, Inc., Class A * | 5,700 | 2,095,434 |
| Electronic Arts, Inc. | 930 | 117,143 |
| Liberty Broadband Corp., Class A * | 470 | 40,100 |
| Liberty Broadband Corp., Class C * | 2,948 | 248,900 |
| Liberty Media Corp. - Liberty Formula One, Class C * | 1,303 | 75,222 |
| Liberty Media Corp. - Liberty SiriusXM, Class A * | 1,208 | 51,268 |
| Liberty Media Corp. - Liberty SiriusXM, Class C * | 2,133 | 89,991 |
| Live Nation Entertainment, Inc. * | 3,986 | 317,325 |
| Madison Square Garden Sports Corp. | 492 | 77,052 |
| Match Group, Inc. * | 13,832 | 597,542 |
| Meta Platforms, Inc., Class A * | 25,238 | 2,351,172 |
| Netflix, Inc. * | 10,169 | 2,968,128 |
| Nexstar Media Group, Inc., Class A | 174 | 29,806 |
| Pinterest, Inc., Class A * | 6,440 | 158,424 |
| Playtika Holding Corp. * | 4,983 | 47,089 |
| ROBLOX Corp., Class A * | 22,675 | 1,014,480 |
| Roku, Inc. * | 1,748 | 97,084 |
| Spotify Technology S.A. * | 7,295 | 587,831 |
| Take-Two Interactive Software, Inc. * | 6,979 | 826,872 |
| The Trade Desk, Inc., Class A * | 22,580 | 1,202,159 |
| The Walt Disney Co. * | 6,340 | 675,464 |
| TripAdvisor, Inc. * | 529 | 12,495 |
| Warner Bros Discovery, Inc. * | 89,100 | 1,158,300 |
| World Wrestling Entertainment, Inc., Class A | 2,229 | 175,846 |
| ZoomInfo Technologies, Inc. * | 14,267 | 635,310 |
| 64,091,122 | ||
| Pharmaceuticals, Biotechnology & Life Sciences 6.8% | ||
| 10X Genomics, Inc., Class A * | 4,239 | 115,216 |
| AbbVie, Inc. | 90,998 | 13,322,107 |
| Agilent Technologies, Inc. | 13,861 | 1,917,669 |
| Alnylam Pharmaceuticals, Inc. * | 6,205 | 1,286,048 |
| Amgen, Inc. | 23,093 | 6,243,193 |
| Avantor, Inc. * | 29,063 | 586,201 |
| Bio-Techne Corp. | 1,995 | 591,039 |
| Bruker Corp. | 5,587 | 345,500 |
| Catalent, Inc. * | 2,787 | 183,190 |
| Charles River Laboratories International, Inc. * | 2,418 | 513,220 |
| Danaher Corp. | 2,289 | 576,073 |
| Eli Lilly & Co. | 35,318 | 12,788,295 |
| Exact Sciences Corp. * | 1,634 | 56,831 |
| Exelixis, Inc. * | 14,034 | 232,684 |
| Horizon Therapeutics plc * | 10,749 | 669,878 |
| Incyte Corp. * | 8,109 | 602,823 |
| Ionis Pharmaceuticals, Inc. * | 6,664 | 294,549 |
| IQVIA Holdings, Inc. * | 9,548 | 2,001,929 |
| Maravai LifeSciences Holdings, Inc., Class A * | 5,659 | 93,939 |
| Merck & Co., Inc. | 54,589 | 5,524,407 |
| Mettler-Toledo International, Inc. * | 1,152 | 1,457,199 |
| Moderna, Inc. * | 1,050 | 157,846 |
| Natera, Inc. * | 4,078 | 191,503 |
| Neurocrine Biosciences, Inc. * | 4,867 | 560,289 |
| Novavax, Inc. *(a) | 4,032 | 89,793 |
| Regeneron Pharmaceuticals, Inc. * | 780 | 584,025 |
| Repligen Corp. * | 2,025 | 369,542 |
| Sarepta Therapeutics, Inc. * | 4,319 | 492,452 |
| SECURITY | NUMBER OF SHARES | VALUE ($) |
| Seagen, Inc. * | 6,989 | 888,721 |
| Sotera Health Co. * | 5,024 | 34,565 |
| Syneos Health, Inc. * | 886 | 44,637 |
| Thermo Fisher Scientific, Inc. | 2,468 | 1,268,478 |
| Ultragenyx Pharmaceutical, Inc. * | 2,664 | 107,785 |
| Vertex Pharmaceuticals, Inc. * | 12,430 | 3,878,160 |
| Waters Corp. * | 3,082 | 922,042 |
| West Pharmaceutical Services, Inc. | 3,809 | 876,451 |
| Zoetis, Inc. | 24,239 | 3,654,756 |
| 63,523,035 | ||
| Real Estate 1.5% | ||
| American Tower Corp. | 18,330 | 3,797,793 |
| Apartment Income REIT Corp. | 507 | 19,484 |
| Camden Property Trust | 436 | 50,380 |
| CBRE Group, Inc., Class A * | 8,092 | 574,047 |
| Crown Castle, Inc. | 22,219 | 2,960,904 |
| Equinix, Inc. | 3,528 | 1,998,400 |
| Equity LifeStyle Properties, Inc. | 5,596 | 357,920 |
| Extra Space Storage, Inc. | 812 | 144,081 |
| Iron Mountain, Inc. | 11,091 | 555,326 |
| Lamar Advertising Co., Class A | 3,892 | 358,959 |
| Opendoor Technologies, Inc. * | 6,600 | 17,094 |
| Public Storage | 6,392 | 1,979,922 |
| SBA Communications Corp. | 1,257 | 339,264 |
| Simon Property Group, Inc. | 8,123 | 885,245 |
| Zillow Group, Inc., Class C * | 669 | 20,645 |
| 14,059,464 | ||
| Retailing 8.9% | ||
| Advance Auto Parts, Inc. | 244 | 46,340 |
| Amazon.com, Inc. * | 457,193 | 46,834,851 |
| AutoZone, Inc. * | 909 | 2,302,388 |
| Best Buy Co., Inc. | 3,228 | 220,828 |
| Burlington Stores, Inc. * | 3,173 | 453,612 |
| CarMax, Inc. * | 958 | 60,364 |
| Carvana Co. *(a) | 5,321 | 71,993 |
| Dollar General Corp. | 11,773 | 3,002,704 |
| Dollar Tree, Inc. * | 3,389 | 537,157 |
| DoorDash, Inc., Class A * | 11,409 | 496,634 |
| eBay, Inc. | 3,860 | 153,782 |
| Etsy, Inc. * | 6,547 | 614,829 |
| Five Below, Inc. * | 2,804 | 410,365 |
| Floor & Decor Holdings, Inc., Class A * | 5,306 | 389,301 |
| Genuine Parts Co. | 613 | 109,028 |
| Leslie's, Inc. * | 7,241 | 101,664 |
| Lowe’s Cos., Inc. | 28,425 | 5,541,454 |
| Nordstrom, Inc. | 4,934 | 100,358 |
| Ollie's Bargain Outlet Holdings, Inc. * | 140 | 7,840 |
| O'Reilly Automotive, Inc. * | 1,319 | 1,104,227 |
| Pool Corp. | 1,986 | 604,201 |
| RH * | 379 | 96,239 |
| Ross Stores, Inc. | 7,515 | 719,110 |
| Target Corp. | 13,142 | 2,158,574 |
| The Home Depot, Inc. | 30,867 | 9,140,645 |
| The TJX Cos., Inc. | 60,459 | 4,359,094 |
| Tractor Supply Co. | 5,751 | 1,263,897 |
| Ulta Beauty, Inc. * | 2,644 | 1,108,814 |
| Victoria's Secret & Co. * | 3,054 | 114,830 |
| Wayfair, Inc., Class A * | 2,589 | 98,175 |
| Williams-Sonoma, Inc. | 2,780 | 344,247 |
| 82,567,545 | ||
| SECURITY | NUMBER OF SHARES | VALUE ($) |
| Semiconductors & Semiconductor Equipment 6.4% | ||
| Advanced Micro Devices, Inc. * | 65,550 | 3,936,933 |
| Allegro MicroSystems, Inc. * | 3,294 | 83,700 |
| Analog Devices, Inc. | 5,419 | 772,858 |
| Applied Materials, Inc. | 44,727 | 3,948,947 |
| Broadcom, Inc. | 20,340 | 9,562,241 |
| Enphase Energy, Inc. * | 6,733 | 2,067,031 |
| Entegris, Inc. | 7,611 | 603,857 |
| GLOBALFOUNDRIES, Inc. * | 781 | 44,283 |
| KLA Corp. | 7,302 | 2,310,718 |
| Lam Research Corp. | 7,046 | 2,852,080 |
| Lattice Semiconductor Corp. * | 6,972 | 338,212 |
| Microchip Technology, Inc. | 23,636 | 1,459,287 |
| Micron Technology, Inc. | 10,726 | 580,276 |
| Monolithic Power Systems, Inc. | 2,333 | 791,937 |
| NVIDIA Corp. | 124,010 | 16,737,630 |
| ON Semiconductor Corp. * | 13,931 | 855,781 |
| QUALCOMM, Inc. | 57,700 | 6,788,982 |
| Teradyne, Inc. | 7,293 | 593,285 |
| Texas Instruments, Inc. | 32,539 | 5,226,739 |
| Universal Display Corp. | 2,230 | 212,341 |
| 59,767,118 | ||
| Software & Services 22.5% | ||
| Accenture plc, Class A | 32,643 | 9,267,348 |
| Adobe, Inc. * | 24,307 | 7,741,779 |
| Alteryx, Inc., Class A * | 3,020 | 147,165 |
| ANSYS, Inc. * | 2,366 | 523,265 |
| AppLovin Corp., Class A * | 11,326 | 192,089 |
| Aspen Technology, Inc. * | 1,389 | 335,374 |
| Atlassian Corp., Class A * | 7,041 | 1,427,422 |
| Autodesk, Inc. * | 11,209 | 2,402,089 |
| Automatic Data Processing, Inc. | 19,746 | 4,772,608 |
| Bentley Systems, Inc., Class B | 8,706 | 307,148 |
| Black Knight, Inc. * | 726 | 43,901 |
| Broadridge Financial Solutions, Inc. | 5,446 | 817,227 |
| Cadence Design Systems, Inc. * | 14,052 | 2,127,332 |
| CCC Intelligent Solutions Holdings, Inc. * | 3,482 | 32,487 |
| Ceridian HCM Holding, Inc. * | 1,334 | 88,297 |
| Cloudflare, Inc., Class A * | 14,376 | 809,656 |
| Confluent, Inc., Class A * | 6,431 | 172,865 |
| Coupa Software, Inc. * | 2,156 | 114,764 |
| Crowdstrike Holdings, Inc., Class A * | 10,820 | 1,744,184 |
| Datadog, Inc., Class A * | 13,665 | 1,100,169 |
| DocuSign, Inc. * | 10,154 | 490,438 |
| DoubleVerify Holdings, Inc. * | 2,825 | 82,575 |
| Dropbox, Inc., Class A * | 13,233 | 287,818 |
| Dynatrace, Inc. * | 10,258 | 361,492 |
| Elastic N.V. * | 3,993 | 255,352 |
| EPAM Systems, Inc. * | 2,823 | 988,050 |
| Euronet Worldwide, Inc. * | 1,803 | 151,470 |
| Fair Isaac Corp. * | 1,264 | 605,254 |
| Fiserv, Inc. * | 2,764 | 283,973 |
| Five9, Inc. * | 3,563 | 214,706 |
| FleetCor Technologies, Inc. * | 3,746 | 697,206 |
| Fortinet, Inc. * | 33,227 | 1,899,255 |
| Gartner, Inc. * | 3,950 | 1,192,584 |
| Genpact Ltd. | 4,844 | 234,934 |
| Globant S.A. * | 2,094 | 395,096 |
| GoDaddy, Inc., Class A * | 1,106 | 88,922 |
| HubSpot, Inc. * | 2,348 | 696,323 |
| Informatica, Inc., Class A * | 276 | 5,343 |
| International Business Machines Corp. | 30,959 | 4,281,320 |
| Intuit, Inc. | 14,197 | 6,069,217 |
| Jack Henry & Associates, Inc. | 3,726 | 741,698 |
| Jamf Holding Corp. * | 2,893 | 68,477 |
| SECURITY | NUMBER OF SHARES | VALUE ($) |
| Manhattan Associates, Inc. * | 2,012 | 244,800 |
| Mastercard, Inc., Class A | 44,336 | 14,550,188 |
| Microsoft Corp. | 385,024 | 89,375,621 |
| MongoDB, Inc. * | 3,346 | 612,418 |
| nCino, Inc. * | 701 | 22,067 |
| NCR Corp. * | 385 | 8,185 |
| New Relic, Inc. * | 2,688 | 159,237 |
| NortonLifeLock, Inc. | 10,468 | 235,844 |
| Nutanix, Inc., Class A * | 5,709 | 156,427 |
| Okta, Inc. * | 1,044 | 58,589 |
| Oracle Corp. | 53,547 | 4,180,414 |
| Palantir Technologies, Inc., Class A * | 93,148 | 818,771 |
| Palo Alto Networks, Inc. * | 15,135 | 2,597,015 |
| Paychex, Inc. | 16,604 | 1,964,419 |
| Paycom Software, Inc. * | 2,638 | 912,748 |
| Paylocity Holding Corp. * | 2,044 | 473,779 |
| PayPal Holdings, Inc. * | 18,373 | 1,535,615 |
| Pegasystems, Inc. | 2,098 | 78,067 |
| Procore Technologies, Inc. * | 2,608 | 142,553 |
| PTC, Inc. * | 5,416 | 638,167 |
| RingCentral, Inc., Class A * | 4,366 | 155,080 |
| Salesforce, Inc. * | 10,627 | 1,727,844 |
| SentinelOne, Inc., Class A * | 6,670 | 152,343 |
| ServiceNow, Inc. * | 10,317 | 4,340,775 |
| Shift4 Payments, Inc., Class A * | 2,575 | 118,373 |
| Smartsheet, Inc., Class A * | 6,464 | 225,723 |
| Snowflake, Inc., Class A * | 14,771 | 2,367,791 |
| Splunk, Inc. * | 8,265 | 686,904 |
| Switch, Inc., Class A | 4,473 | 152,306 |
| Synopsys, Inc. * | 7,853 | 2,297,395 |
| Teradata Corp. * | 2,840 | 89,716 |
| The Western Union Co. | 6,502 | 87,842 |
| Thoughtworks Holding, Inc. * | 4,191 | 40,276 |
| Toast, Inc., Class A * | 12,678 | 280,057 |
| Twilio, Inc., Class A * | 3,337 | 248,173 |
| Tyler Technologies, Inc. * | 1,849 | 597,837 |
| UiPath, Inc., Class A * | 1,781 | 22,530 |
| Unity Software, Inc. * | 7,247 | 213,787 |
| VeriSign, Inc. * | 521 | 104,440 |
| Visa, Inc., Class A | 84,786 | 17,564,268 |
| VMware, Inc., Class A | 5,249 | 590,670 |
| WEX, Inc. * | 1,633 | 268,041 |
| Wix.com Ltd. * | 2,151 | 180,899 |
| Workday, Inc., Class A * | 10,167 | 1,584,222 |
| Zendesk, Inc. * | 6,252 | 479,466 |
| Zoom Video Communications, Inc., Class A * | 6,555 | 546,949 |
| Zscaler, Inc. * | 4,289 | 660,935 |
| 208,808,238 | ||
| Technology Hardware & Equipment 14.0% | ||
| Amphenol Corp., Class A | 22,779 | 1,727,332 |
| Apple Inc. | 786,911 | 120,664,933 |
| Arista Networks, Inc. * | 12,672 | 1,531,538 |
| Arrow Electronics, Inc. * | 173 | 17,518 |
| CDW Corp. | 6,960 | 1,202,758 |
| Cognex Corp. | 8,326 | 384,911 |
| Coherent Corp. * | 1,010 | 33,946 |
| Corning, Inc. | 2,285 | 73,509 |
| Dell Technologies, Inc., Class C | 2,085 | 80,064 |
| HP, Inc. | 24,647 | 680,750 |
| Jabil, Inc. | 5,641 | 362,434 |
| Keysight Technologies, Inc. * | 8,555 | 1,489,853 |
| National Instruments Corp. | 833 | 31,804 |
| NetApp, Inc. | 11,409 | 790,301 |
| Pure Storage, Inc., Class A * | 14,577 | 449,846 |
| Ubiquiti, Inc. | 87 | 30,167 |
| SECURITY | NUMBER OF SHARES | VALUE ($) |
| Vontier Corp. | 5,013 | 95,748 |
| Zebra Technologies Corp., Class A * | 1,093 | 309,560 |
| 129,956,972 | ||
| Transportation 2.1% | ||
| C.H. Robinson Worldwide, Inc. | 1,677 | 163,876 |
| CSX Corp. | 27,806 | 808,042 |
| Delta Air Lines, Inc. * | 32,911 | 1,116,670 |
| Expeditors International of Washington, Inc. | 2,563 | 250,790 |
| GXO Logistics, Inc. * | 570 | 20,828 |
| JB Hunt Transport Services, Inc. | 3,811 | 651,948 |
| Landstar System, Inc. | 1,638 | 255,888 |
| Lyft, Inc., Class A * | 12,790 | 187,246 |
| Old Dominion Freight Line, Inc. | 5,170 | 1,419,682 |
| Uber Technologies, Inc. * | 84,254 | 2,238,629 |
| Union Pacific Corp. | 32,332 | 6,373,930 |
| United Parcel Service, Inc., Class B | 33,790 | 5,668,948 |
| XPO Logistics, Inc. * | 393 | 20,334 |
| 19,176,811 | ||
| Utilities 0.0% | ||
| National Fuel Gas Co. | 360 | 24,297 |
| The AES Corp. | 6,177 | 161,590 |
| Vistra Corp. | 12,232 | 280,969 |
| 466,856 | ||
| Total Common Stocks (Cost $793,019,382) | 920,266,046 | |
| INVESTMENT COMPANIES 0.1% OF NET ASSETS | ||
| Equity Funds 0.1% | ||
| iShares Russell 1000 Growth ETF | 3,900 | 868,062 |
| Total Investment Companies (Cost $840,722) | 868,062 | |
| SHORT-TERM INVESTMENTS 0.5% OF NET ASSETS | ||
| Money Market Funds 0.5% | ||
| State Street Institutional U.S. Government Money Market Fund, Premier Class 3.01% (c) | 4,505,176 | 4,505,176 |
| State Street Institutional U.S. Government Money Market Fund, Premier Class 3.01% (c)(d) | 693,895 | 693,895 |
| 5,199,071 | ||
| Total Short-Term Investments (Cost $5,199,071) | 5,199,071 | |
| Total Investments in Securities (Cost $799,059,175) | 926,333,179 | |
| NUMBER OF CONTRACTS | NOTIONAL AMOUNT ($) | CURRENT VALUE/ UNREALIZED APPRECIATION (DEPRECIATION) ($) | |
| FUTURES CONTRACTS | |||
| Long | |||
| Russell 1000 Growth Index, e-mini, expires 12/16/22 | 67 | 7,537,500 | 121,047 |
| S&P 500 Index, e-mini, expires 12/16/22 | 1 | 194,150 | (10,173) |
| Net Unrealized Appreciation | 110,874 | ||
| * | Non-income producing security. |
| (a) | All or a portion of this security is on loan. Securities on loan were valued at $674,746. |
| (b) | Issuer is affiliated with the fund’s investment adviser. |
| (c) | The rate shown is the annualized 7-day yield. |
| (d) | Security purchased with cash collateral received for securities on loan. |
| ETF — | Exchange traded fund |
| REIT — | Real Estate Investment Trust |
| SECURITY | VALUE AT 10/31/21 | PURCHASES | SALES | REALIZED GAINS (LOSSES) | NET CHANGE IN UNREALIZED APPRECIATION (DEPRECIATION) | VALUE AT 10/31/22 | BALANCE OF SHARES HELD AT 10/31/22 | DIVIDENDS RECEIVED |
| COMMON STOCKS 0.4% OF NET ASSETS | ||||||||
| Diversified Financials 0.4% | ||||||||
| The Charles Schwab Corp. | $— | $2,927,104 | ($128,426) | $1,923 | $644,170 | $3,444,771 | 43,238 | $9,224 |
| DESCRIPTION | QUOTED PRICES IN ACTIVE MARKETS FOR IDENTICAL ASSETS (LEVEL 1) | OTHER SIGNIFICANT OBSERVABLE INPUTS (LEVEL 2) | SIGNIFICANT UNOBSERVABLE INPUTS (LEVEL 3) | TOTAL |
| Assets | ||||
| Common Stocks1 | $920,266,046 | $— | $— | $920,266,046 |
| Investment Companies1 | 868,062 | — | — | 868,062 |
| Short-Term Investments1 | 5,199,071 | — | — | 5,199,071 |
| Futures Contracts2 | 121,047 | — | — | 121,047 |
| Liabilities | ||||
| Futures Contracts2 | (10,173) | — | — | (10,173) |
| Total | $926,444,053 | $— | $— | $926,444,053 |
| 1 | As categorized in the Portfolio Holdings. |
| 2 | Futures contracts are reported at cumulative unrealized appreciation or depreciation. |
| Assets | ||
| Investments in securities, at value - affiliated (cost $2,800,601) | $3,444,771 | |
| Investments in securities, at value - unaffiliated (cost $796,258,574) including securities on loan of $674,746 | 922,888,408 | |
| Cash | 1,963,860 | |
| Deposit with broker for futures contracts | 463,600 | |
| Receivables: | ||
| Fund shares sold | 1,471,632 | |
| Dividends | 488,787 | |
| Income from securities on loan | + | 1,795 |
| Total assets | 930,722,853 | |
| Liabilities | ||
| Collateral held for securities on loan | 693,895 | |
| Payables: | ||
| Fund shares redeemed | 955,366 | |
| Variation margin on futures contracts | 61,054 | |
| Investment adviser fees | + | 24,508 |
| Total liabilities | 1,734,823 | |
| Net assets | $928,988,030 | |
| Net Assets by Source | ||
| Capital received from investors | $848,819,896 | |
| Total distributable earnings | + | 80,168,134 |
| Net assets | $928,988,030 | |
| Net Asset Value (NAV) | ||||
| Net Assets | ÷ | Shares Outstanding | = | NAV |
| $928,988,030 | 14,056,773 | $66.09 | ||
| For the period November 1, 2021 through October 31, 2022 | ||
| Investment Income | ||
| Dividends received from securities - unaffiliated (net of foreign withholding tax of $1,391) | $7,917,292 | |
| Dividends received from securities - affiliated | 9,224 | |
| Securities on loan, net | + | 27,888 |
| Total investment income | 7,954,404 | |
| Expenses | ||
| Investment adviser fees | 311,233 | |
| Proxy fees1 | + | 4,001 |
| Total expenses | – | 315,234 |
| Net investment income | 7,639,170 | |
| REALIZED AND UNREALIZED GAINS (LOSSES) | ||
| Net realized gains on sales of securities - affiliated | 1,923 | |
| Net realized losses on sales of securities - unaffiliated | (43,110,083) | |
| Net realized losses on futures contracts | + | (869,520) |
| Net realized losses | (43,977,680) | |
| Net change in unrealized appreciation (depreciation) on securities - affiliated | 644,170 | |
| Net change in unrealized appreciation (depreciation) on securities - unaffiliated | (211,896,756) | |
| Net change in unrealized appreciation (depreciation) on futures contracts | + | 83,645 |
| Net change in unrealized appreciation (depreciation) | + | (211,168,941) |
| Net realized and unrealized losses | (255,146,621) | |
| Decrease in net assets resulting from operations | ($247,507,451) | |
| 1 | Proxy fees are non-routine expenses (see financial note 2(e) for additional information). |
| OPERATIONS | |||
| 11/1/21-10/31/22 | 11/1/20-10/31/21 | ||
| Net investment income | $7,639,170 | $5,029,957 | |
| Net realized gains (losses) | (43,977,680) | 16,292,898 | |
| Net change in unrealized appreciation (depreciation) | + | (211,168,941) | 214,527,301 |
| Increase (decrease) in net assets resulting from operations | ($247,507,451) | $235,850,156 | |
| DISTRIBUTIONS TO SHAREHOLDERS | |||
| Total distributions | ($16,277,055) | ($3,820,481) | |
| TRANSACTIONS IN FUND SHARES | |||||
| 11/1/21-10/31/22 | 11/1/20-10/31/21 | ||||
| SHARES | VALUE | SHARES | VALUE | ||
| Shares sold | 7,588,954 | $563,493,219 | 4,598,477 | $352,197,876 | |
| Shares reinvested | 157,797 | 14,184,348 | 45,814 | 3,263,376 | |
| Shares redeemed | + | (3,565,449) | (266,064,240) | (2,532,061) | (193,536,712) |
| Net transactions in fund shares | 4,181,302 | $311,613,327 | 2,112,230 | $161,924,540 | |
| SHARES OUTSTANDING AND NET ASSETS | |||||
| 11/1/21-10/31/22 | 11/1/20-10/31/21 | ||||
| SHARES | NET ASSETS | SHARES | NET ASSETS | ||
| Beginning of period | 9,875,471 | $881,159,209 | 7,763,241 | $487,204,994 | |
| Total increase | + | 4,181,302 | 47,828,821 | 2,112,230 | 393,954,215 |
| End of period | 14,056,773 | $928,988,030 | 9,875,471 | $881,159,209 | |
| 11/1/21– 10/31/22 | 11/1/20– 10/31/21 | 11/1/19– 10/31/20 | 11/1/18– 10/31/19 | 12/20/17 1– 10/31/18 | ||
| Per-Share Data | ||||||
| Net asset value at beginning of period | $53.65 | $38.09 | $43.06 | $39.51 | $40.00 | |
| Income (loss) from investment operations: | ||||||
| Net investment income (loss)2 | 1.01 | 0.97 | 1.00 | 1.13 | 0.82 | |
| Net realized and unrealized gains (losses) | (4.60) | 15.47 | (4.07) | 3.10 | (1.31) | |
| Total from investment operations | (3.59) | 16.44 | (3.07) | 4.23 | (0.49) | |
| Less distributions: | ||||||
| Distributions from net investment income | (0.91) | (0.88) | (1.06) | (0.62) | — | |
| Distributions from net realized gains | (1.64) | — | (0.84) | (0.06) | — | |
| Total distributions | (2.55) | (0.88) | (1.90) | (0.68) | — | |
| Net asset value at end of period | $47.51 | $53.65 | $38.09 | $43.06 | $39.51 | |
| Total return | (7.04%) | 43.70% | (7.69%) | 11.08% | (1.23%) 3 | |
| Ratios/Supplemental Data | ||||||
| Ratios to average net assets: | ||||||
| Total expenses | 0.035% 4 | 0.035% | 0.035% | 0.035% 5 | 0.040% 6,7 | |
| Net operating expenses | N/A | N/A | N/A | N/A | 0.02% 6,7 | |
| Net investment income (loss) | 2.05% | 1.97% | 2.57% | 2.79% | 2.36% 6 | |
| Portfolio turnover rate | 15% 8 | 20% | 50% | 22% | 22% 3 | |
| Net assets, end of period (x 1,000) | $647,796 | $575,972 | $331,322 | $212,213 | $69,749 | |
| 1 | Commencement of operations. |
| 2 | Calculated based on the average shares outstanding during the period. |
| 3 | Not annualized. |
| 4 | Ratio includes less than 0.0005% of non-routine proxy expenses. |
| 5 | Effective December 20, 2018, the annual operating expense ratio was reduced to 0.035%. The ratio presented for period ended 10/31/19 is a blended ratio. |
| 6 | Annualized. |
| 7 | The investment adviser voluntarily agreed to waive the fund’s management fees to 0.00% beginning with the fund’s commencement of operations through June 30, 2018. The ratio presented for period ended 10/31/18 is a blended ratio. |
| 8 | Portfolio turnover rate excludes in-kind transactions. |
| SECURITY | NUMBER OF SHARES | VALUE ($) |
| COMMON STOCKS 99.3% OF NET ASSETS | ||
| Automobiles & Components 1.0% | ||
| Aptiv plc * | 7,159 | 651,970 |
| BorgWarner, Inc. | 8,365 | 313,938 |
| Ford Motor Co. | 139,527 | 1,865,476 |
| General Motors Co. | 51,482 | 2,020,669 |
| Gentex Corp. | 8,283 | 219,417 |
| Harley-Davidson, Inc. | 4,779 | 205,497 |
| Lear Corp. | 2,109 | 292,539 |
| Lucid Group, Inc. * | 1,195 | 17,077 |
| QuantumScape Corp. *(a) | 8,891 | 74,062 |
| Rivian Automotive, Inc., Class A * | 18,370 | 642,399 |
| Thor Industries, Inc. | 1,873 | 152,593 |
| 6,455,637 | ||
| Banks 7.5% | ||
| Bank of America Corp. | 248,727 | 8,964,121 |
| Bank of Hawaii Corp. | 1,403 | 106,558 |
| Bank OZK | 3,954 | 169,943 |
| BOK Financial Corp. | 1,038 | 114,377 |
| Citigroup, Inc. | 68,554 | 3,143,886 |
| Citizens Financial Group, Inc. | 17,267 | 706,220 |
| Comerica, Inc. | 4,632 | 326,556 |
| Commerce Bancshares, Inc. | 3,881 | 274,930 |
| Cullen/Frost Bankers, Inc. | 2,068 | 320,643 |
| East West Bancorp, Inc. | 5,013 | 358,780 |
| F.N.B. Corp. | 12,394 | 179,093 |
| Fifth Third Bancorp | 24,096 | 859,986 |
| First Citizens BancShares, Inc., Class A | 325 | 267,189 |
| First Hawaiian, Inc. | 4,536 | 116,031 |
| First Horizon Corp. | 18,688 | 458,043 |
| First Republic Bank | 6,429 | 772,123 |
| Huntington Bancshares, Inc. | 50,740 | 770,233 |
| JPMorgan Chase & Co. | 103,296 | 13,002,901 |
| KeyCorp | 32,840 | 586,851 |
| M&T Bank Corp. | 6,188 | 1,041,874 |
| MGIC Investment Corp. | 10,729 | 146,451 |
| New York Community Bancorp, Inc. | 16,376 | 152,461 |
| PacWest Bancorp | 4,138 | 102,871 |
| Pinnacle Financial Partners, Inc. | 2,656 | 220,421 |
| Popular, Inc. | 2,604 | 184,155 |
| Prosperity Bancshares, Inc. | 3,102 | 222,010 |
| Regions Financial Corp. | 33,051 | 725,470 |
| Rocket Cos., Inc., Class A | 1,726 | 11,909 |
| Signature Bank | 2,085 | 330,535 |
| SVB Financial Group * | 754 | 174,144 |
| Synovus Financial Corp. | 5,069 | 202,000 |
| TFS Financial Corp. | 1,782 | 25,037 |
| The PNC Financial Services Group, Inc. | 14,619 | 2,365,793 |
| Truist Financial Corp. | 47,071 | 2,108,310 |
| U.S. Bancorp | 47,520 | 2,017,224 |
| Umpqua Holdings Corp. | 7,626 | 151,605 |
| UWM Holdings Corp. (a) | 281 | 922 |
| Webster Financial Corp. | 6,190 | 335,869 |
| Wells Fargo & Co. | 134,315 | 6,177,147 |
| SECURITY | NUMBER OF SHARES | VALUE ($) |
| Western Alliance Bancorp | 1,460 | 98,068 |
| Wintrust Financial Corp. | 2,109 | 197,445 |
| Zions Bancorp NA | 5,279 | 274,191 |
| 48,764,376 | ||
| Capital Goods 7.9% | ||
| 3M Co. | 20,096 | 2,527,876 |
| A.O. Smith Corp. | 3,406 | 186,581 |
| Acuity Brands, Inc. | 1,148 | 210,738 |
| AECOM | 4,382 | 329,877 |
| AGCO Corp. | 1,900 | 235,923 |
| Air Lease Corp. | 3,691 | 130,255 |
| Allegion plc | 649 | 67,996 |
| Allison Transmission Holdings, Inc. | 717 | 30,293 |
| AMETEK, Inc. | 8,154 | 1,057,248 |
| Armstrong World Industries, Inc. | 698 | 52,748 |
| Axon Enterprise, Inc. * | 540 | 78,538 |
| Builders FirstSource, Inc. * | 5,468 | 337,157 |
| BWX Technologies, Inc. | 1,952 | 111,225 |
| Carlisle Cos., Inc. | 287 | 68,536 |
| Carrier Global Corp. | 30,000 | 1,192,800 |
| Caterpillar, Inc. | 2,408 | 521,236 |
| Core & Main, Inc., Class A * | 1,657 | 39,072 |
| Crane Holdings Co. | 1,661 | 166,665 |
| Cummins, Inc. | 4,991 | 1,220,349 |
| Curtiss-Wright Corp. | 1,357 | 227,745 |
| Donaldson Co., Inc. | 3,613 | 207,567 |
| Dover Corp. | 5,088 | 664,951 |
| Eaton Corp. plc | 14,134 | 2,121,089 |
| Emerson Electric Co. | 14,239 | 1,233,097 |
| Esab Corp. | 1,785 | 66,580 |
| Flowserve Corp. | 4,637 | 132,989 |
| Fortive Corp. | 12,694 | 811,147 |
| Fortune Brands Home & Security, Inc. | 2,996 | 180,719 |
| Gates Industrial Corp. plc * | 3,834 | 42,749 |
| General Dynamics Corp. | 8,616 | 2,152,277 |
| General Electric Co. | 36,604 | 2,848,157 |
| Graco, Inc. | 1,867 | 129,906 |
| Hayward Holdings, Inc. * | 2,367 | 21,895 |
| HEICO Corp. | 98 | 15,939 |
| HEICO Corp., Class A | 177 | 22,532 |
| Hexcel Corp. | 2,978 | 165,875 |
| Honeywell International, Inc. | 16,854 | 3,438,553 |
| Howmet Aerospace, Inc. | 11,935 | 424,289 |
| Hubbell, Inc. | 1,891 | 449,075 |
| Huntington Ingalls Industries, Inc. | 1,088 | 279,692 |
| IDEX Corp. | 2,205 | 490,193 |
| Illinois Tool Works, Inc. | 1,111 | 237,232 |
| Ingersoll Rand, Inc. | 14,368 | 725,584 |
| ITT, Inc. | 2,941 | 224,663 |
| Johnson Controls International plc | 24,619 | 1,423,963 |
| L3Harris Technologies, Inc. | 6,811 | 1,678,707 |
| Lennox International, Inc. | 1,133 | 264,635 |
| Masco Corp. | 7,533 | 348,552 |
| MasTec, Inc. * | 2,152 | 165,876 |
| MDU Resources Group, Inc. | 7,159 | 203,888 |
| Mercury Systems, Inc. * | 2,006 | 97,090 |
| SECURITY | NUMBER OF SHARES | VALUE ($) |
| MSC Industrial Direct Co., Inc., Class A | 1,622 | 134,594 |
| Nordson Corp. | 1,573 | 353,925 |
| Northrop Grumman Corp. | 4,578 | 2,513,368 |
| nVent Electric plc | 5,816 | 212,284 |
| Oshkosh Corp. | 2,326 | 204,688 |
| Otis Worldwide Corp. | 13,151 | 928,987 |
| Owens Corning | 3,435 | 294,070 |
| PACCAR, Inc. | 12,072 | 1,168,932 |
| Parker-Hannifin Corp. | 3,502 | 1,017,751 |
| Pentair plc | 5,833 | 250,527 |
| Plug Power, Inc. * | 9,237 | 147,607 |
| Quanta Services, Inc. | 2,291 | 325,414 |
| Raytheon Technologies Corp. | 52,661 | 4,993,316 |
| Regal Rexnord Corp. | 2,363 | 299,014 |
| Rockwell Automation, Inc. | 1,341 | 342,357 |
| Sensata Technologies Holding plc | 5,441 | 218,783 |
| SiteOne Landscape Supply, Inc. * | 613 | 71,028 |
| Snap-on, Inc. | 1,855 | 411,903 |
| Spirit AeroSystems Holdings, Inc., Class A | 177 | 4,099 |
| Stanley Black & Decker, Inc. | 5,212 | 409,090 |
| Sunrun, Inc. * | 7,269 | 163,625 |
| Textron, Inc. | 7,462 | 510,699 |
| The AZEK Co., Inc. * | 3,880 | 67,939 |
| The Boeing Co. * | 13,368 | 1,905,074 |
| The Middleby Corp. * | 1,765 | 246,853 |
| The Timken Co. | 2,214 | 157,836 |
| Trane Technologies plc | 3,455 | 551,522 |
| TransDigm Group, Inc. | 1,114 | 641,397 |
| United Rentals, Inc. * | 1,340 | 423,051 |
| Univar Solutions, Inc. * | 5,783 | 147,351 |
| Valmont Industries, Inc. | 637 | 203,343 |
| Vertiv Holdings Co. | 9,055 | 129,577 |
| Watsco, Inc. | 548 | 148,486 |
| WESCO International, Inc. * | 748 | 103,052 |
| Westinghouse Air Brake Technologies Corp. | 6,398 | 596,805 |
| WillScot Mobile Mini Holdings Corp. * | 3,418 | 145,367 |
| Woodward, Inc. | 2,071 | 189,911 |
| Xylem, Inc. | 5,444 | 557,629 |
| 51,253,573 | ||
| Commercial & Professional Services 0.9% | ||
| CACI International, Inc., Class A * | 821 | 249,609 |
| Cintas Corp. | 206 | 88,075 |
| Clarivate plc * | 16,769 | 173,224 |
| Clean Harbors, Inc. * | 1,808 | 221,408 |
| CoStar Group, Inc. * | 11,911 | 985,278 |
| Driven Brands Holdings, Inc. * | 1,830 | 58,523 |
| Dun & Bradstreet Holdings, Inc. | 8,934 | 114,802 |
| Equifax, Inc. | 2,155 | 365,359 |
| FTI Consulting, Inc. * | 693 | 107,852 |
| IAA, Inc. * | 811 | 30,761 |
| Jacobs Solutions, Inc. | 4,515 | 520,218 |
| KBR, Inc. | 1,707 | 84,957 |
| Leidos Holdings, Inc. | 4,811 | 488,750 |
| ManpowerGroup, Inc. | 1,829 | 143,284 |
| MSA Safety, Inc. | 797 | 106,989 |
| Republic Services, Inc. | 6,833 | 906,192 |
| Robert Half International, Inc. | 446 | 34,101 |
| Rollins, Inc. | 588 | 24,743 |
| Science Applications International Corp. | 1,959 | 212,238 |
| Stericycle, Inc. * | 3,236 | 144,261 |
| Tetra Tech, Inc. | 1,112 | 157,103 |
| TransUnion | 1,831 | 108,523 |
| Waste Management, Inc. | 926 | 146,651 |
| 5,472,901 | ||
| SECURITY | NUMBER OF SHARES | VALUE ($) |
| Consumer Durables & Apparel 0.8% | ||
| Brunswick Corp. | 2,155 | 152,294 |
| Capri Holdings Ltd. * | 4,770 | 217,894 |
| Carter's, Inc. | 1,345 | 91,285 |
| Columbia Sportswear Co. | 1,275 | 94,988 |
| D.R. Horton, Inc. | 5,357 | 411,846 |
| Deckers Outdoor Corp. * | 110 | 38,492 |
| Garmin Ltd. | 5,446 | 479,466 |
| Hanesbrands, Inc. | 12,283 | 83,770 |
| Hasbro, Inc. | 4,659 | 304,000 |
| Leggett & Platt, Inc. | 4,724 | 159,435 |
| Lennar Corp., Class A | 8,872 | 715,970 |
| Lennar Corp., Class B | 514 | 33,523 |
| Mattel, Inc. * | 6,453 | 122,349 |
| Mohawk Industries, Inc. * | 1,865 | 176,709 |
| Newell Brands, Inc. | 13,387 | 184,874 |
| NVR, Inc. * | 30 | 127,132 |
| Peloton Interactive, Inc., Class A * | 10,647 | 89,435 |
| Polaris, Inc. | 519 | 52,730 |
| PulteGroup, Inc. | 4,974 | 198,910 |
| PVH Corp. | 2,386 | 122,450 |
| Ralph Lauren Corp. | 1,485 | 137,645 |
| Skechers U.S.A., Inc., Class A * | 4,034 | 138,891 |
| Tapestry, Inc. | 7,722 | 244,633 |
| Tempur Sealy International, Inc. | 5,970 | 160,533 |
| Toll Brothers, Inc. | 1,830 | 78,836 |
| TopBuild Corp. * | 178 | 30,285 |
| Under Armour, Inc., Class A * | 6,833 | 50,906 |
| Under Armour, Inc., Class C * | 7,038 | 46,169 |
| VF Corp. | 12,328 | 348,266 |
| Whirlpool Corp. | 1,890 | 261,274 |
| 5,354,990 | ||
| Consumer Services 2.0% | ||
| ADT, Inc. | 7,418 | 62,756 |
| Aramark | 8,213 | 299,774 |
| Boyd Gaming Corp. | 2,777 | 160,400 |
| Bright Horizons Family Solutions, Inc. * | 1,454 | 94,975 |
| Caesars Entertainment, Inc. * | 2,283 | 99,836 |
| Carnival Corp. * | 33,945 | 307,542 |
| Darden Restaurants, Inc. | 1,174 | 168,046 |
| Domino’s Pizza, Inc. | 340 | 112,962 |
| Grand Canyon Education, Inc. * | 1,116 | 112,303 |
| H&R Block, Inc. | 996 | 40,985 |
| Hilton Worldwide Holdings, Inc. | 2,653 | 358,845 |
| Hyatt Hotels Corp., Class A * | 1,752 | 165,056 |
| Las Vegas Sands Corp. * | 7,354 | 279,526 |
| Marriott Vacations Worldwide Corp. | 1,349 | 199,328 |
| McDonald’s Corp. | 19,813 | 5,402,213 |
| MGM Resorts International | 11,583 | 412,007 |
| Mister Car Wash, Inc. * | 726 | 6,411 |
| Norwegian Cruise Line Holdings Ltd. * | 13,730 | 231,900 |
| Penn Entertainment, Inc. * | 5,550 | 183,705 |
| Planet Fitness, Inc., Class A * | 786 | 51,467 |
| Royal Caribbean Cruises Ltd. * | 7,773 | 414,923 |
| Service Corp. International | 5,474 | 331,779 |
| Six Flags Entertainment Corp. * | 1,287 | 28,700 |
| Starbucks Corp. | 25,988 | 2,250,301 |
| Travel & Leisure Co. | 827 | 31,409 |
| Vail Resorts, Inc. | 80 | 17,530 |
| Wyndham Hotels & Resorts, Inc. | 948 | 71,982 |
| Wynn Resorts Ltd. * | 3,229 | 206,333 |
| Yum! Brands, Inc. | 8,968 | 1,060,466 |
| 13,163,460 | ||
| SECURITY | NUMBER OF SHARES | VALUE ($) |
| Diversified Financials 9.0% | ||
| Affiliated Managers Group, Inc. | 1,334 | 165,629 |
| AGNC Investment Corp. | 18,552 | 152,497 |
| Ally Financial, Inc. | 10,931 | 301,258 |
| American Express Co. | 19,974 | 2,965,140 |
| Ameriprise Financial, Inc. | 1,388 | 429,059 |
| Annaly Capital Management, Inc. | 15,267 | 283,203 |
| Apollo Global Management, Inc. | 3,888 | 215,240 |
| Berkshire Hathaway, Inc., Class B * | 63,891 | 18,853,595 |
| BlackRock, Inc. | 5,313 | 3,431,720 |
| Capital One Financial Corp. | 13,474 | 1,428,513 |
| Cboe Global Markets, Inc. | 3,741 | 465,755 |
| CME Group, Inc. | 12,700 | 2,200,910 |
| Coinbase Global, Inc., Class A * | 5,571 | 369,079 |
| Credit Acceptance Corp. * | 213 | 99,177 |
| Discover Financial Services | 9,650 | 1,008,039 |
| Equitable Holdings, Inc. | 13,260 | 406,021 |
| Evercore, Inc., Class A | 1,288 | 135,369 |
| Franklin Resources, Inc. | 10,117 | 237,244 |
| Interactive Brokers Group, Inc., Class A | 3,294 | 264,014 |
| Intercontinental Exchange, Inc. | 19,538 | 1,867,247 |
| Invesco Ltd. | 13,237 | 202,791 |
| Janus Henderson Group plc | 4,844 | 110,298 |
| Jefferies Financial Group, Inc. | 7,208 | 248,027 |
| KKR & Co., Inc. | 20,225 | 983,542 |
| Lazard Ltd., Class A | 3,184 | 120,069 |
| Moody's Corp. | 327 | 86,612 |
| Morgan Stanley | 44,351 | 3,644,322 |
| Morningstar, Inc. | 85 | 19,735 |
| MSCI, Inc. | 691 | 323,982 |
| Nasdaq, Inc. | 12,165 | 757,150 |
| Northern Trust Corp. | 7,269 | 613,140 |
| OneMain Holdings, Inc. | 4,115 | 158,674 |
| Raymond James Financial, Inc. | 6,334 | 748,299 |
| Rithm Capital Corp. | 15,150 | 127,715 |
| Robinhood Markets, Inc., Class A * | 19,931 | 232,794 |
| S&P Global, Inc. | 11,801 | 3,791,071 |
| SEI Investments Co. | 3,650 | 198,195 |
| SLM Corp. | 8,890 | 147,485 |
| SoFi Technologies, Inc. * | 28,292 | 153,908 |
| Starwood Property Trust, Inc. | 10,343 | 213,686 |
| State Street Corp. | 12,978 | 960,372 |
| Stifel Financial Corp. | 3,663 | 226,630 |
| Synchrony Financial | 16,965 | 603,275 |
| T. Rowe Price Group, Inc. | 7,914 | 840,150 |
| The Bank of New York Mellon Corp. | 25,996 | 1,094,692 |
| The Carlyle Group, Inc. | 7,342 | 207,632 |
| The Charles Schwab Corp. (b) | 23,820 | 1,897,739 |
| The Goldman Sachs Group, Inc. | 11,782 | 4,059,017 |
| Tradeweb Markets, Inc., Class A | 1,393 | 76,726 |
| Upstart Holdings, Inc. * | 2,010 | 46,592 |
| Virtu Financial, Inc., Class A | 3,404 | 76,182 |
| Voya Financial, Inc. | 3,430 | 234,475 |
| 58,483,686 | ||
| Energy 8.8% | ||
| Antero Midstream Corp. | 11,905 | 126,788 |
| Antero Resources Corp. * | 3,587 | 131,499 |
| APA Corp. | 11,496 | 522,608 |
| Baker Hughes Co. | 33,657 | 930,953 |
| Cheniere Energy, Inc. | 3,741 | 659,950 |
| Chesapeake Energy Corp. | 4,275 | 437,204 |
| Chevron Corp. | 69,596 | 12,589,916 |
| ConocoPhillips | 45,095 | 5,686,029 |
| Continental Resources, Inc. | 323 | 23,892 |
| Coterra Energy, Inc. | 23,229 | 723,119 |
| SECURITY | NUMBER OF SHARES | VALUE ($) |
| Devon Energy Corp. | 11,892 | 919,846 |
| Diamondback Energy, Inc. | 2,621 | 411,785 |
| DTE Midstream LLC * | 3,435 | 205,070 |
| EOG Resources, Inc. | 5,568 | 760,143 |
| EQT Corp. | 13,021 | 544,799 |
| Exxon Mobil Corp. | 147,692 | 16,365,751 |
| Halliburton Co. | 17,380 | 632,980 |
| Hess Corp. | 2,167 | 305,720 |
| HF Sinclair Corp. | 5,167 | 316,065 |
| Kinder Morgan, Inc. | 70,326 | 1,274,307 |
| Marathon Oil Corp. | 23,882 | 727,207 |
| Marathon Petroleum Corp. | 17,627 | 2,002,780 |
| NOV, Inc. | 13,877 | 310,845 |
| Occidental Petroleum Corp. | 5,053 | 366,848 |
| ONEOK, Inc. | 13,943 | 827,099 |
| Ovintiv, Inc. | 2,595 | 131,437 |
| PDC Energy, Inc. | 1,552 | 111,961 |
| Phillips 66 | 17,028 | 1,775,850 |
| Pioneer Natural Resources Co. | 3,785 | 970,512 |
| Range Resources Corp. | 3,053 | 86,949 |
| Schlumberger N.V. | 50,012 | 2,602,124 |
| Southwestern Energy Co. * | 36,661 | 254,061 |
| The Williams Cos., Inc. | 43,096 | 1,410,532 |
| Valero Energy Corp. | 13,915 | 1,747,028 |
| 56,893,657 | ||
| Food & Staples Retailing 1.6% | ||
| Albertsons Cos., Inc., Class A | 5,979 | 122,629 |
| BJ's Wholesale Club Holdings, Inc. * | 1,749 | 135,373 |
| Casey's General Stores, Inc. | 1,313 | 305,548 |
| Grocery Outlet Holding Corp. * | 2,887 | 99,804 |
| Performance Food Group Co. * | 3,726 | 193,901 |
| The Kroger Co. | 23,194 | 1,096,844 |
| U.S. Foods Holding Corp. * | 7,154 | 212,903 |
| Walgreens Boots Alliance, Inc. | 25,378 | 926,297 |
| Walmart, Inc. | 51,050 | 7,265,946 |
| 10,359,245 | ||
| Food, Beverage & Tobacco 4.3% | ||
| Altria Group, Inc. | 64,130 | 2,967,295 |
| Archer-Daniels-Midland Co. | 19,824 | 1,922,531 |
| Brown-Forman Corp., Class A | 674 | 46,351 |
| Brown-Forman Corp., Class B | 2,673 | 181,764 |
| Bunge Ltd. | 4,949 | 488,466 |
| Campbell Soup Co. | 6,836 | 361,693 |
| Conagra Brands, Inc. | 16,640 | 610,688 |
| Constellation Brands, Inc., Class A | 5,361 | 1,324,596 |
| Darling Ingredients, Inc. * | 5,258 | 412,648 |
| Flowers Foods, Inc. | 6,657 | 191,122 |
| Freshpet, Inc. * | 701 | 41,324 |
| General Mills, Inc. | 21,097 | 1,721,093 |
| Hormel Foods Corp. | 10,126 | 470,353 |
| Ingredion, Inc. | 2,322 | 206,937 |
| Kellogg Co. | 4,047 | 310,891 |
| Keurig Dr Pepper, Inc. | 30,344 | 1,178,561 |
| McCormick & Co., Inc. - Non Voting Shares | 8,867 | 697,301 |
| Molson Coors Beverage Co., Class B | 6,170 | 311,153 |
| Mondelez International, Inc., Class A | 48,941 | 3,008,893 |
| Monster Beverage Corp. * | 984 | 92,220 |
| PepsiCo, Inc. | 7,593 | 1,378,737 |
| Philip Morris International, Inc. | 54,876 | 5,040,361 |
| Pilgrim's Pride Corp. * | 818 | 18,855 |
| Post Holdings, Inc. * | 1,924 | 173,968 |
| Seaboard Corp. | 9 | 33,717 |
| The Boston Beer Co., Inc., Class A * | 16 | 5,973 |
| The Coca-Cola Co. | 34,584 | 2,069,852 |
| SECURITY | NUMBER OF SHARES | VALUE ($) |
| The Hershey Co. | 690 | 164,751 |
| The JM Smucker Co. | 3,642 | 548,704 |
| The Kraft Heinz Co. | 24,736 | 951,594 |
| Tyson Foods, Inc., Class A | 10,075 | 688,626 |
| 27,621,018 | ||
| Health Care Equipment & Services 6.6% | ||
| Abbott Laboratories | 52,708 | 5,214,929 |
| Acadia Healthcare Co., Inc. * | 3,156 | 256,583 |
| agilon health, Inc. * | 462 | 9,171 |
| Align Technology, Inc. * | 698 | 135,621 |
| Amedisys, Inc. * | 1,139 | 111,155 |
| Baxter International, Inc. | 15,026 | 816,663 |
| Becton, Dickinson & Co. | 10,054 | 2,372,442 |
| Boston Scientific Corp. * | 50,523 | 2,178,046 |
| Cardinal Health, Inc. | 9,632 | 731,069 |
| Centene Corp. * | 20,114 | 1,712,305 |
| Certara, Inc. * | 1,448 | 17,709 |
| Chemed Corp. | 333 | 155,468 |
| Cigna Corp. | 8,913 | 2,879,434 |
| CVS Health Corp. | 46,420 | 4,395,974 |
| Definitive Healthcare Corp. * | 621 | 9,799 |
| Dentsply Sirona, Inc. | 7,598 | 234,170 |
| Doximity, Inc., Class A * | 2,048 | 54,211 |
| Elevance Health, Inc. | 5,941 | 3,248,361 |
| Encompass Health Corp. | 3,480 | 189,451 |
| Enhabit, Inc. * | 1,732 | 21,511 |
| Enovis Corp. * | 1,779 | 87,972 |
| Envista Holdings Corp. * | 5,770 | 190,468 |
| Globus Medical, Inc., Class A * | 2,534 | 169,778 |
| HCA Healthcare, Inc. | 7,281 | 1,583,399 |
| Henry Schein, Inc. * | 4,768 | 326,417 |
| Hologic, Inc. * | 8,696 | 589,589 |
| Humana, Inc. | 1,315 | 733,875 |
| ICU Medical, Inc. * | 577 | 85,633 |
| Integra LifeSciences Holdings Corp. * | 2,576 | 129,444 |
| Intuitive Surgical, Inc. * | 998 | 245,977 |
| Laboratory Corp. of America Holdings | 3,195 | 708,843 |
| Masimo Corp. * | 393 | 51,719 |
| McKesson Corp. | 4,130 | 1,608,098 |
| Medtronic plc | 47,330 | 4,133,802 |
| Molina Healthcare, Inc. * | 454 | 162,922 |
| Oak Street Health, Inc. * | 4,148 | 83,914 |
| Premier, Inc., Class A | 4,153 | 144,857 |
| Quest Diagnostics, Inc. | 4,135 | 593,993 |
| QuidelOrtho Corp. * | 1,747 | 156,916 |
| Signify Health, Inc., Class A * | 2,353 | 68,778 |
| STERIS plc | 3,527 | 608,690 |
| Stryker Corp. | 5,784 | 1,325,924 |
| Tandem Diabetes Care, Inc. * | 150 | 8,422 |
| Teladoc Health, Inc. * | 5,167 | 153,150 |
| Teleflex, Inc. | 1,664 | 357,028 |
| Tenet Healthcare Corp. * | 3,769 | 167,193 |
| The Cooper Cos., Inc. | 1,716 | 469,137 |
| UnitedHealth Group, Inc. | 2,981 | 1,654,902 |
| Universal Health Services, Inc., Class B | 2,253 | 261,055 |
| Zimmer Biomet Holdings, Inc. | 7,422 | 841,284 |
| 42,447,251 | ||
| Household & Personal Products 1.3% | ||
| Church & Dwight Co., Inc. | 4,708 | 349,004 |
| Colgate-Palmolive Co. | 11,286 | 833,358 |
| Coty, Inc., Class A * | 12,340 | 82,802 |
| Kimberly-Clark Corp. | 4,841 | 602,511 |
| Reynolds Consumer Products, Inc. | 1,942 | 59,309 |
| Spectrum Brands Holdings, Inc. | 1,388 | 64,042 |
| SECURITY | NUMBER OF SHARES | VALUE ($) |
| The Clorox Co. | 752 | 109,822 |
| The Procter & Gamble Co. | 48,578 | 6,541,999 |
| 8,642,847 | ||
| Insurance 3.6% | ||
| Aflac, Inc. | 22,184 | 1,444,400 |
| American Financial Group, Inc. | 2,385 | 346,087 |
| American International Group, Inc. | 26,930 | 1,535,010 |
| Aon plc, Class A | 432 | 121,604 |
| Arch Capital Group Ltd. * | 8,440 | 485,300 |
| Arthur J. Gallagher & Co. | 6,519 | 1,219,575 |
| Assurant, Inc. | 1,772 | 240,744 |
| Assured Guaranty Ltd. | 2,100 | 124,299 |
| Axis Capital Holdings Ltd. | 2,761 | 150,944 |
| Brighthouse Financial, Inc. * | 2,504 | 142,903 |
| Brown & Brown, Inc. | 7,717 | 453,682 |
| Chubb Ltd. | 14,719 | 3,162,966 |
| Cincinnati Financial Corp. | 5,525 | 570,843 |
| CNA Financial Corp. | 948 | 39,532 |
| Erie Indemnity Co., Class A | 227 | 58,341 |
| Everest Re Group Ltd. | 953 | 307,495 |
| Fidelity National Financial, Inc. | 9,301 | 366,273 |
| First American Financial Corp. | 3,584 | 180,634 |
| Globe Life, Inc. | 3,154 | 364,350 |
| Kemper Corp. | 2,267 | 108,068 |
| Lincoln National Corp. | 4,769 | 256,906 |
| Loews Corp. | 7,065 | 402,846 |
| Markel Corp. * | 365 | 440,227 |
| Marsh & McLennan Cos., Inc. | 1,905 | 307,639 |
| MetLife, Inc. | 23,776 | 1,740,641 |
| Old Republic International Corp. | 10,020 | 232,564 |
| Primerica, Inc. | 1,309 | 189,412 |
| Principal Financial Group, Inc. | 8,724 | 768,846 |
| Prudential Financial, Inc. | 13,275 | 1,396,397 |
| Reinsurance Group of America, Inc. | 2,369 | 348,646 |
| RenaissanceRe Holdings Ltd. | 695 | 107,503 |
| The Allstate Corp. | 9,529 | 1,203,036 |
| The Hanover Insurance Group, Inc. | 1,244 | 182,234 |
| The Hartford Financial Services Group, Inc. | 11,405 | 825,836 |
| The Progressive Corp. | 2,695 | 346,038 |
| The Travelers Cos., Inc. | 8,385 | 1,546,697 |
| Unum Group | 7,099 | 323,643 |
| W.R. Berkley Corp. | 7,275 | 541,115 |
| White Mountains Insurance Group Ltd. | 100 | 141,615 |
| Willis Towers Watson plc | 3,868 | 844,036 |
| 23,568,927 | ||
| Materials 4.1% | ||
| Air Products & Chemicals, Inc. | 7,841 | 1,963,386 |
| Albemarle Corp. | 2,006 | 561,419 |
| Alcoa Corp. | 6,374 | 248,777 |
| Amcor plc | 53,037 | 614,168 |
| AptarGroup, Inc. | 2,321 | 230,127 |
| Ardagh Metal Packaging S.A. | 3,498 | 15,531 |
| Ashland, Inc. | 1,781 | 186,863 |
| Avery Dennison Corp. | 1,104 | 187,183 |
| Axalta Coating Systems Ltd. * | 5,919 | 138,031 |
| Ball Corp. | 6,585 | 325,233 |
| Berry Global Group, Inc. * | 2,284 | 108,079 |
| Celanese Corp. | 3,840 | 369,101 |
| Cleveland-Cliffs, Inc. * | 18,116 | 235,327 |
| Corteva, Inc. | 25,645 | 1,675,644 |
| Crown Holdings, Inc. | 486 | 33,335 |
| Dow, Inc. | 25,438 | 1,188,972 |
| DuPont de Nemours, Inc. | 17,746 | 1,015,071 |
| Eagle Materials, Inc. | 219 | 26,786 |
| SECURITY | NUMBER OF SHARES | VALUE ($) |
| Eastman Chemical Co. | 4,339 | 333,279 |
| Ecolab, Inc. | 1,032 | 162,096 |
| Element Solutions, Inc. | 8,026 | 138,047 |
| FMC Corp. | 2,939 | 349,447 |
| Freeport-McMoRan, Inc. | 50,449 | 1,598,729 |
| Ginkgo Bioworks Holdings, Inc. * | 25,274 | 68,998 |
| Graphic Packaging Holding Co. | 2,501 | 57,423 |
| Huntsman Corp. | 6,722 | 179,881 |
| International Flavors & Fragrances, Inc. | 9,015 | 879,954 |
| International Paper Co. | 12,762 | 428,931 |
| Linde plc | 14,057 | 4,179,849 |
| Louisiana-Pacific Corp. | 2,351 | 133,184 |
| LyondellBasell Industries N.V., Class A | 9,092 | 695,083 |
| Martin Marietta Materials, Inc. | 2,006 | 673,976 |
| NewMarket Corp. | 208 | 63,303 |
| Newmont Corp. | 28,118 | 1,189,954 |
| Nucor Corp. | 9,258 | 1,216,316 |
| Olin Corp. | 4,741 | 251,036 |
| Packaging Corp. of America | 3,261 | 392,005 |
| PPG Industries, Inc. | 3,903 | 445,645 |
| Reliance Steel & Aluminum Co. | 2,126 | 428,346 |
| Royal Gold, Inc. | 2,172 | 206,253 |
| RPM International, Inc. | 4,273 | 404,098 |
| Silgan Holdings, Inc. | 2,956 | 139,996 |
| Sonoco Products Co. | 3,449 | 214,114 |
| Southern Copper Corp. | 1,045 | 49,084 |
| SSR Mining, Inc. | 7,514 | 103,693 |
| Steel Dynamics, Inc. | 6,120 | 575,586 |
| The Chemours Co. | 2,163 | 61,927 |
| The Mosaic Co. | 10,691 | 574,641 |
| The Scotts Miracle-Gro Co. | 938 | 43,064 |
| United States Steel Corp. | 8,280 | 168,581 |
| Vulcan Materials Co. | 2,405 | 393,699 |
| Westlake Corp. | 1,173 | 113,370 |
| WestRock Co. | 8,986 | 306,063 |
| 26,342,684 | ||
| Media & Entertainment 5.1% | ||
| Activision Blizzard, Inc. | 27,500 | 2,002,000 |
| Alphabet, Inc., Class A * | 27,697 | 2,617,644 |
| Alphabet, Inc., Class C * | 24,859 | 2,353,153 |
| Altice USA, Inc., Class A * | 7,426 | 49,086 |
| AMC Entertainment Holdings, Inc., Class A *(a) | 18,384 | 122,437 |
| Cable One, Inc. | 80 | 68,754 |
| Comcast Corp., Class A | 155,072 | 4,921,985 |
| DISH Network Corp., Class A * | 8,799 | 131,193 |
| Electronic Arts, Inc. | 9,194 | 1,158,076 |
| Fox Corp., Class A | 10,669 | 308,014 |
| Fox Corp., Class B | 5,059 | 137,605 |
| IAC, Inc. * | 2,750 | 133,870 |
| Liberty Broadband Corp., Class A * | 346 | 29,521 |
| Liberty Broadband Corp., Class C * | 2,344 | 197,904 |
| Liberty Media Corp. - Liberty Formula One, Class A * | 667 | 34,697 |
| Liberty Media Corp. - Liberty Formula One, Class C * | 6,314 | 364,507 |
| Liberty Media Corp. - Liberty SiriusXM, Class A * | 1,927 | 81,782 |
| Liberty Media Corp. - Liberty SiriusXM, Class C * | 3,951 | 166,693 |
| Live Nation Entertainment, Inc. * | 2,731 | 217,415 |
| Madison Square Garden Sports Corp. | 338 | 52,934 |
| Match Group, Inc. * | 612 | 26,438 |
| Meta Platforms, Inc., Class A * | 63,900 | 5,952,924 |
| Netflix, Inc. * | 8,510 | 2,483,899 |
| SECURITY | NUMBER OF SHARES | VALUE ($) |
| News Corp., Class A | 13,710 | 231,288 |
| News Corp., Class B | 4,252 | 72,837 |
| Nexstar Media Group, Inc., Class A | 1,201 | 205,731 |
| Omnicom Group, Inc. | 7,188 | 522,927 |
| Paramount Global, Class A | 350 | 7,378 |
| Paramount Global, Class B | 20,453 | 374,699 |
| Pinterest, Inc., Class A * | 16,296 | 400,882 |
| Playtika Holding Corp. * | 295 | 2,788 |
| Roku, Inc. * | 3,054 | 169,619 |
| Sirius XM Holdings, Inc. (a) | 24,821 | 149,919 |
| Take-Two Interactive Software, Inc. * | 999 | 118,362 |
| The Interpublic Group of Cos., Inc. | 13,876 | 413,366 |
| The New York Times Co., Class A | 5,818 | 168,489 |
| The Walt Disney Co. * | 60,195 | 6,413,175 |
| TripAdvisor, Inc. * | 3,286 | 77,615 |
| Warner Bros Discovery, Inc. * | 22,259 | 289,367 |
| 33,230,973 | ||
| Pharmaceuticals, Biotechnology & Life Sciences 10.3% | ||
| 10X Genomics, Inc., Class A * | 314 | 8,535 |
| Agilent Technologies, Inc. | 1,088 | 150,525 |
| Amgen, Inc. | 3,025 | 817,809 |
| Avantor, Inc. * | 1,488 | 30,013 |
| Azenta, Inc. | 2,610 | 115,884 |
| Biogen, Inc. * | 5,156 | 1,461,417 |
| BioMarin Pharmaceutical, Inc. * | 6,520 | 564,828 |
| Bio-Rad Laboratories, Inc., Class A * | 758 | 266,596 |
| Bristol-Myers Squibb Co. | 75,418 | 5,842,632 |
| Catalent, Inc. * | 4,122 | 270,939 |
| Charles River Laboratories International, Inc. * | 116 | 24,621 |
| Danaher Corp. | 21,364 | 5,376,678 |
| Elanco Animal Health, Inc. * | 15,771 | 208,019 |
| Eli Lilly & Co. | 5,549 | 2,009,237 |
| Exact Sciences Corp. * | 5,036 | 175,152 |
| Exelixis, Inc. * | 1,494 | 24,771 |
| Gilead Sciences, Inc. | 44,449 | 3,487,469 |
| Horizon Therapeutics plc * | 544 | 33,902 |
| Illumina, Inc. * | 5,560 | 1,272,239 |
| Incyte Corp. * | 874 | 64,973 |
| Ionis Pharmaceuticals, Inc. * | 415 | 18,343 |
| Jazz Pharmaceuticals plc * | 2,160 | 310,586 |
| Johnson & Johnson | 93,201 | 16,214,178 |
| Merck & Co., Inc. | 52,049 | 5,267,359 |
| Mirati Therapeutics, Inc. * | 1,534 | 103,269 |
| Moderna, Inc. * | 11,245 | 1,690,461 |
| Natera, Inc. * | 231 | 10,848 |
| Organon & Co. | 9,000 | 235,620 |
| PerkinElmer, Inc. | 4,457 | 595,366 |
| Perrigo Co., plc | 4,727 | 190,404 |
| Pfizer, Inc. | 200,152 | 9,317,076 |
| QIAGEN N.V. * | 8,043 | 350,353 |
| Regeneron Pharmaceuticals, Inc. * | 3,134 | 2,346,582 |
| Repligen Corp. * | 566 | 103,289 |
| Royalty Pharma plc, Class A | 12,970 | 548,890 |
| Syneos Health, Inc. * | 3,006 | 151,442 |
| Thermo Fisher Scientific, Inc. | 12,165 | 6,252,445 |
| Ultragenyx Pharmaceutical, Inc. * | 526 | 21,282 |
| United Therapeutics Corp. * | 1,581 | 364,468 |
| Vertex Pharmaceuticals, Inc. * | 510 | 159,120 |
| Viatris, Inc. | 42,768 | 433,240 |
| 66,890,860 | ||
| Real Estate 4.5% | ||
| Alexandria Real Estate Equities, Inc. | 5,728 | 832,278 |
| American Homes 4 Rent, Class A | 10,754 | 343,483 |
| SECURITY | NUMBER OF SHARES | VALUE ($) |
| American Tower Corp. | 3,828 | 793,123 |
| Americold Realty Trust, Inc. | 9,514 | 230,715 |
| Apartment Income REIT Corp. | 5,014 | 192,688 |
| AvalonBay Communities, Inc. | 4,941 | 865,268 |
| Boston Properties, Inc. | 5,531 | 402,104 |
| Brixmor Property Group, Inc. | 10,506 | 223,883 |
| Camden Property Trust | 3,351 | 387,208 |
| CBRE Group, Inc., Class A * | 5,789 | 410,672 |
| Cousins Properties, Inc. | 5,372 | 127,639 |
| CubeSmart | 7,925 | 331,820 |
| Digital Realty Trust, Inc. | 10,045 | 1,007,011 |
| Douglas Emmett, Inc. | 6,019 | 105,874 |
| EastGroup Properties, Inc. | 1,458 | 228,454 |
| EPR Properties | 2,619 | 101,093 |
| Equinix, Inc. | 793 | 449,187 |
| Equity LifeStyle Properties, Inc. | 2,414 | 154,399 |
| Equity Residential | 13,102 | 825,688 |
| Essex Property Trust, Inc. | 2,297 | 510,485 |
| Extra Space Storage, Inc. | 4,129 | 732,650 |
| Federal Realty Investment Trust | 2,845 | 281,598 |
| First Industrial Realty Trust, Inc. | 4,670 | 222,432 |
| Gaming & Leisure Properties, Inc. | 8,616 | 431,834 |
| Healthcare Realty Trust, Inc. | 13,447 | 273,378 |
| Healthpeak Properties, Inc. | 19,041 | 451,843 |
| Highwoods Properties, Inc. | 3,661 | 103,350 |
| Host Hotels & Resorts, Inc. | 24,999 | 471,981 |
| Hudson Pacific Properties, Inc. | 4,825 | 53,268 |
| Invitation Homes, Inc. | 21,575 | 683,712 |
| Iron Mountain, Inc. | 2,573 | 128,830 |
| JBG SMITH Properties | 3,769 | 74,174 |
| Jones Lang LaSalle, Inc. * | 1,692 | 269,180 |
| Kilroy Realty Corp. | 4,130 | 176,516 |
| Kimco Realty Corp. | 21,318 | 455,779 |
| Lamar Advertising Co., Class A | 376 | 34,678 |
| Life Storage, Inc. | 2,983 | 329,950 |
| Medical Properties Trust, Inc. | 21,053 | 241,057 |
| Mid-America Apartment Communities, Inc. | 4,060 | 639,247 |
| National Retail Properties, Inc. | 6,217 | 261,301 |
| National Storage Affiliates Trust | 3,008 | 128,321 |
| Omega Healthcare Investors, Inc. | 8,332 | 264,791 |
| Opendoor Technologies, Inc. * | 11,889 | 30,793 |
| Park Hotels & Resorts, Inc. | 7,871 | 102,953 |
| Prologis, Inc. | 32,595 | 3,609,896 |
| Public Storage | 1,143 | 354,044 |
| Rayonier, Inc. | 5,125 | 172,713 |
| Realty Income Corp. | 21,866 | 1,361,596 |
| Regency Centers Corp. | 6,075 | 367,598 |
| Rexford Industrial Realty, Inc. | 6,072 | 335,660 |
| SBA Communications Corp. | 2,912 | 785,949 |
| Simon Property Group, Inc. | 5,941 | 647,450 |
| SL Green Realty Corp. | 2,254 | 89,439 |
| Spirit Realty Capital, Inc. | 4,781 | 185,646 |
| STORE Capital Corp. | 9,009 | 286,486 |
| Sun Communities, Inc. | 4,299 | 579,720 |
| The Howard Hughes Corp. * | 1,292 | 79,264 |
| UDR, Inc. | 11,435 | 454,656 |
| Ventas, Inc. | 14,111 | 552,163 |
| VICI Properties, Inc. | 34,035 | 1,089,801 |
| Vornado Realty Trust | 6,252 | 147,485 |
| Welltower, Inc. | 16,411 | 1,001,727 |
| WeWork, Inc., Class A *(a) | 4,682 | 12,033 |
| Weyerhaeuser Co. | 26,340 | 814,696 |
| WP Carey, Inc. | 6,755 | 515,406 |
| Zillow Group, Inc., Class A * | 1,897 | 58,674 |
| Zillow Group, Inc., Class C * | 5,345 | 164,947 |
| 29,033,737 | ||
| SECURITY | NUMBER OF SHARES | VALUE ($) |
| Retailing 2.2% | ||
| Advance Auto Parts, Inc. | 1,984 | 376,801 |
| AutoNation, Inc. * | 1,353 | 143,837 |
| AutoZone, Inc. * | 63 | 159,571 |
| Bath & Body Works, Inc. | 8,114 | 270,845 |
| Best Buy Co., Inc. | 4,899 | 335,141 |
| Burlington Stores, Inc. * | 144 | 20,586 |
| CarMax, Inc. * | 5,029 | 316,877 |
| Dick's Sporting Goods, Inc. | 1,929 | 219,443 |
| Dollar Tree, Inc. * | 5,187 | 822,140 |
| DoorDash, Inc., Class A * | 1,018 | 44,314 |
| eBay, Inc. | 16,900 | 673,296 |
| GameStop Corp., Class A *(a) | 9,520 | 269,511 |
| Genuine Parts Co. | 4,515 | 803,038 |
| Kohl's Corp. | 4,549 | 136,243 |
| Leslie's, Inc. * | 575 | 8,073 |
| Lithia Motors, Inc. | 961 | 190,422 |
| LKQ Corp. | 9,069 | 504,599 |
| Lowe’s Cos., Inc. | 3,101 | 604,540 |
| Macy's, Inc. | 9,514 | 198,367 |
| Nordstrom, Inc. | 559 | 11,370 |
| Ollie's Bargain Outlet Holdings, Inc. * | 2,087 | 116,872 |
| O'Reilly Automotive, Inc. * | 1,314 | 1,100,041 |
| Penske Automotive Group, Inc. | 955 | 106,597 |
| Petco Health & Wellness Co., Inc. * | 2,807 | 29,558 |
| RH * | 435 | 110,460 |
| Ross Stores, Inc. | 7,029 | 672,605 |
| Target Corp. | 7,363 | 1,209,373 |
| The Gap, Inc. | 7,050 | 79,454 |
| The Home Depot, Inc. | 15,369 | 4,551,222 |
| Victoria's Secret & Co. * | 834 | 31,358 |
| Wayfair, Inc., Class A * | 1,008 | 38,223 |
| Williams-Sonoma, Inc. | 500 | 61,915 |
| 14,216,692 | ||
| Semiconductors & Semiconductor Equipment 2.2% | ||
| Advanced Micro Devices, Inc. * | 12,118 | 727,807 |
| Analog Devices, Inc. | 14,771 | 2,106,640 |
| Cirrus Logic, Inc. * | 1,978 | 132,763 |
| First Solar, Inc. * | 3,752 | 546,179 |
| GLOBALFOUNDRIES, Inc. *(a) | 1,695 | 96,106 |
| Intel Corp. | 144,928 | 4,120,303 |
| Marvell Technology, Inc. | 30,009 | 1,190,757 |
| Microchip Technology, Inc. | 2,794 | 172,502 |
| Micron Technology, Inc. | 31,641 | 1,711,778 |
| MKS Instruments, Inc. | 2,037 | 167,340 |
| ON Semiconductor Corp. * | 5,757 | 353,652 |
| Qorvo, Inc. * | 3,650 | 314,192 |
| Skyworks Solutions, Inc. | 5,682 | 488,709 |
| Teradyne, Inc. | 511 | 41,570 |
| Texas Instruments, Inc. | 10,290 | 1,652,883 |
| Wolfspeed, Inc. * | 4,080 | 321,300 |
| 14,144,481 | ||
| Software & Services 4.1% | ||
| Affirm Holdings, Inc. * | 6,259 | 125,618 |
| Akamai Technologies, Inc. * | 5,532 | 488,642 |
| Amdocs Ltd. | 4,260 | 367,681 |
| ANSYS, Inc. * | 1,459 | 322,672 |
| Automatic Data Processing, Inc. | 1,216 | 293,907 |
| Bill.com Holdings, Inc. * | 3,445 | 459,425 |
| Black Knight, Inc. * | 4,970 | 300,536 |
| Block, Inc. * | 18,680 | 1,122,108 |
| Broadridge Financial Solutions, Inc. | 381 | 57,173 |
| CCC Intelligent Solutions Holdings, Inc. * | 3,626 | 33,831 |
| SECURITY | NUMBER OF SHARES | VALUE ($) |
| Ceridian HCM Holding, Inc. * | 3,930 | 260,127 |
| Cognizant Technology Solutions Corp., Class A | 18,414 | 1,146,272 |
| Concentrix Corp. | 1,527 | 186,645 |
| Coupa Software, Inc. * | 1,180 | 62,811 |
| Dolby Laboratories, Inc., Class A | 2,168 | 144,909 |
| DoubleVerify Holdings, Inc. * | 273 | 7,980 |
| Dropbox, Inc., Class A * | 632 | 13,746 |
| DXC Technology Co. * | 8,156 | 234,485 |
| Euronet Worldwide, Inc. * | 416 | 34,948 |
| Fidelity National Information Services, Inc. | 21,598 | 1,792,418 |
| Fiserv, Inc. * | 18,947 | 1,946,615 |
| Genpact Ltd. | 2,992 | 145,112 |
| Global Payments, Inc. | 9,729 | 1,111,636 |
| GoDaddy, Inc., Class A * | 4,783 | 384,553 |
| Guidewire Software, Inc. * | 2,974 | 176,685 |
| Informatica, Inc., Class A * | 1,083 | 20,967 |
| International Business Machines Corp. | 10,581 | 1,463,246 |
| Jamf Holding Corp. * | 360 | 8,521 |
| Kyndryl Holdings, Inc. * | 7,125 | 68,899 |
| Manhattan Associates, Inc. * | 853 | 103,785 |
| nCino, Inc. * | 1,959 | 61,669 |
| NCR Corp. * | 4,218 | 89,675 |
| NortonLifeLock, Inc. | 13,006 | 293,025 |
| Nutanix, Inc., Class A * | 3,642 | 99,791 |
| Okta, Inc. * | 4,570 | 256,468 |
| Oracle Corp. | 16,761 | 1,308,531 |
| Paycor HCM, Inc. * | 1,700 | 51,799 |
| PayPal Holdings, Inc. * | 28,364 | 2,370,663 |
| Procore Technologies, Inc. * | 685 | 37,442 |
| Roper Technologies, Inc. | 3,735 | 1,548,307 |
| Salesforce, Inc. * | 26,781 | 4,354,323 |
| SentinelOne, Inc., Class A * | 1,937 | 44,241 |
| Snowflake, Inc., Class A * | 698 | 111,889 |
| SS&C Technologies Holdings, Inc. | 7,874 | 404,881 |
| Switch, Inc., Class A | 2,126 | 72,390 |
| Teradata Corp. * | 1,643 | 51,902 |
| The Western Union Co. | 9,036 | 122,076 |
| Twilio, Inc., Class A * | 3,784 | 281,416 |
| Tyler Technologies, Inc. * | 187 | 60,463 |
| UiPath, Inc., Class A * | 12,059 | 152,546 |
| Unity Software, Inc. * | 2,390 | 70,505 |
| VeriSign, Inc. * | 2,964 | 594,163 |
| VMware, Inc., Class A | 3,801 | 427,727 |
| WEX, Inc. * | 425 | 69,760 |
| Wix.com Ltd. * | 425 | 35,743 |
| Zoom Video Communications, Inc., Class A * | 4,443 | 370,724 |
| 26,228,072 | ||
| Technology Hardware & Equipment 2.4% | ||
| Amphenol Corp., Class A | 5,086 | 385,671 |
| Arrow Electronics, Inc. * | 2,153 | 218,013 |
| Avnet, Inc. | 3,344 | 134,395 |
| Ciena Corp. * | 5,280 | 252,912 |
| Cisco Systems, Inc. | 147,234 | 6,688,841 |
| Cognex Corp. | 442 | 20,434 |
| Coherent Corp. * | 3,823 | 128,491 |
| Corning, Inc. | 25,130 | 808,432 |
| Dell Technologies, Inc., Class C | 7,781 | 298,790 |
| F5, Inc. * | 2,112 | 301,826 |
| Hewlett Packard Enterprise Co. | 45,925 | 655,350 |
| HP, Inc. | 19,788 | 546,544 |
| IPG Photonics Corp. * | 1,183 | 101,336 |
| Jabil, Inc. | 870 | 55,897 |
| Juniper Networks, Inc. | 11,333 | 346,790 |
| Keysight Technologies, Inc. * | 475 | 82,721 |
| SECURITY | NUMBER OF SHARES | VALUE ($) |
| Littelfuse, Inc. | 855 | 188,314 |
| Lumentum Holdings, Inc. * | 2,437 | 181,435 |
| Motorola Solutions, Inc. | 5,825 | 1,454,561 |
| National Instruments Corp. | 4,028 | 153,789 |
| TD SYNNEX Corp. | 1,509 | 138,088 |
| Teledyne Technologies, Inc. * | 1,637 | 651,493 |
| Trimble, Inc. * | 8,819 | 530,551 |
| Ubiquiti, Inc. | 147 | 50,972 |
| ViaSat, Inc. * | 2,538 | 103,956 |
| Vontier Corp. | 2,086 | 39,843 |
| Western Digital Corp. * | 11,064 | 380,270 |
| Zebra Technologies Corp., Class A * | 1,080 | 305,878 |
| 15,205,593 | ||
| Telecommunication Services 2.1% | ||
| AT&T, Inc. | 253,535 | 4,621,943 |
| Frontier Communications Parent, Inc. * | 8,684 | 203,379 |
| Lumen Technologies, Inc. | 36,431 | 268,132 |
| T-Mobile US, Inc. * | 21,097 | 3,197,461 |
| Verizon Communications, Inc. | 148,823 | 5,561,516 |
| 13,852,431 | ||
| Transportation 1.5% | ||
| Alaska Air Group, Inc. * | 4,353 | 193,534 |
| AMERCO | 317 | 182,335 |
| American Airlines Group, Inc. * | 22,895 | 324,651 |
| Avis Budget Group, Inc. * | 1,048 | 247,810 |
| C.H. Robinson Worldwide, Inc. | 3,166 | 309,382 |
| Copa Holdings S.A., Class A * | 1,013 | 76,208 |
| CSX Corp. | 56,655 | 1,646,394 |
| Expeditors International of Washington, Inc. | 3,996 | 391,009 |
| FedEx Corp. | 8,497 | 1,361,899 |
| GXO Logistics, Inc. * | 3,328 | 121,605 |
| Hertz Global Holdings, Inc. * | 7,236 | 133,142 |
| JB Hunt Transport Services, Inc. | 326 | 55,769 |
| JetBlue Airways Corp. * | 11,421 | 91,825 |
| Kirby Corp. * | 2,119 | 147,800 |
| Knight-Swift Transportation Holdings, Inc. | 5,526 | 265,414 |
| Landstar System, Inc. | 142 | 22,183 |
| Lyft, Inc., Class A * | 2,153 | 31,520 |
| Norfolk Southern Corp. | 8,298 | 1,892,525 |
| Ryder System, Inc. | 1,755 | 141,295 |
| Schneider National, Inc., Class B | 1,920 | 42,701 |
| Southwest Airlines Co. * | 20,942 | 761,242 |
| Uber Technologies, Inc. * | 8,986 | 238,758 |
| United Airlines Holdings, Inc. * | 11,518 | 496,196 |
| United Parcel Service, Inc., Class B | 2,807 | 470,930 |
| XPO Logistics, Inc. * | 3,332 | 172,398 |
| 9,818,525 | ||
| Utilities 5.5% | ||
| Alliant Energy Corp. | 8,850 | 461,704 |
| Ameren Corp. | 9,106 | 742,321 |
| American Electric Power Co., Inc. | 18,203 | 1,600,408 |
| American Water Works Co., Inc. | 6,433 | 934,972 |
| Atmos Energy Corp. | 4,876 | 519,538 |
| Avangrid, Inc. | 2,504 | 101,863 |
| Brookfield Renewable Corp., Class A | 4,534 | 140,690 |
| CenterPoint Energy, Inc. | 22,284 | 637,545 |
| CMS Energy Corp. | 10,231 | 583,679 |
| Consolidated Edison, Inc. | 12,566 | 1,105,305 |
| Constellation Energy Corp. | 11,553 | 1,092,221 |
| Dominion Energy, Inc. | 29,472 | 2,062,156 |
| DTE Energy Co. | 6,826 | 765,263 |
| SECURITY | NUMBER OF SHARES | VALUE ($) |
| Duke Energy Corp. | 27,275 | 2,541,484 |
| Edison International | 13,291 | 797,992 |
| Entergy Corp. | 7,181 | 769,372 |
| Essential Utilities, Inc. | 8,203 | 362,737 |
| Evergy, Inc. | 7,850 | 479,870 |
| Eversource Energy | 12,193 | 930,082 |
| Exelon Corp. | 35,148 | 1,356,361 |
| FirstEnergy Corp. | 19,210 | 724,409 |
| Hawaiian Electric Industries, Inc. | 3,852 | 146,530 |
| IDACORP, Inc. | 1,783 | 186,680 |
| National Fuel Gas Co. | 2,851 | 192,414 |
| NextEra Energy, Inc. | 69,526 | 5,388,265 |
| NiSource, Inc. | 14,397 | 369,859 |
| NRG Energy, Inc. | 8,325 | 369,630 |
| OGE Energy Corp. | 7,075 | 259,157 |
| PG&E Corp. * | 54,863 | 819,105 |
| Pinnacle West Capital Corp. | 4,001 | 268,907 |
| PPL Corp. | 26,070 | 690,594 |
| Public Service Enterprise Group, Inc. | 17,611 | 987,449 |
| Sempra Energy | 11,137 | 1,681,019 |
| The AES Corp. | 19,319 | 505,385 |
| The Southern Co. | 37,595 | 2,461,721 |
| UGI Corp. | 7,423 | 262,255 |
| Vistra Corp. | 6,184 | 142,046 |
| WEC Energy Group, Inc. | 11,167 | 1,019,882 |
| Xcel Energy, Inc. | 19,291 | 1,256,037 |
| 35,716,907 | ||
| Total Common Stocks (Cost $559,167,998) | 643,162,523 | |
| INVESTMENT COMPANIES 0.1% OF NET ASSETS | ||
| Equity Funds 0.1% | ||
| iShares Russell 1000 Value ETF | 4,150 | 621,421 |
| Total Investment Companies (Cost $580,088) | 621,421 | |
| SHORT-TERM INVESTMENTS 0.5% OF NET ASSETS | ||
| Money Market Funds 0.5% | ||
| State Street Institutional U.S. Government Money Market Fund, Premier Class 3.01% (c) | 2,663,955 | 2,663,955 |
| State Street Institutional U.S. Government Money Market Fund, Premier Class 3.01% (c)(d) | 686,224 | 686,224 |
| 3,350,179 | ||
| Total Short-Term Investments (Cost $3,350,179) | 3,350,179 | |
| Total Investments in Securities (Cost $563,098,265) | 647,134,123 | |
| NUMBER OF CONTRACTS | NOTIONAL AMOUNT ($) | CURRENT VALUE/ UNREALIZED APPRECIATION ($) | |
| FUTURES CONTRACTS | |||
| Long | |||
| Russell 1000 Value Index, e-mini, expires 12/16/22 | 48 | 3,546,720 | 108,463 |
| S&P 500 Index, e-mini, expires 12/16/22 | 1 | 194,150 | 661 |
| Net Unrealized Appreciation | 109,124 | ||
| * | Non-income producing security. |
| (a) | All or a portion of this security is on loan. Securities on loan were valued at $670,319. |
| (b) | Issuer is affiliated with the fund’s investment adviser. |
| (c) | The rate shown is the annualized 7-day yield. |
| (d) | Security purchased with cash collateral received for securities on loan. |
| ETF — | Exchange traded fund |
| REIT — | Real Estate Investment Trust |
| SECURITY | VALUE AT 10/31/21 | PURCHASES | SALES | REALIZED GAINS (LOSSES) | NET CHANGE IN UNREALIZED APPRECIATION (DEPRECIATION) | VALUE AT 10/31/22 | BALANCE OF SHARES HELD AT 10/31/22 | DIVIDENDS RECEIVED |
| COMMON STOCKS 0.3% OF NET ASSETS | ||||||||
| Diversified Financials 0.3% | ||||||||
| The Charles Schwab Corp. | $3,397,519 | $854,830 | ($1,862,661) | $285,654 | ($777,603) | $1,897,739 | 23,820 | $30,673 |
| DESCRIPTION | QUOTED PRICES IN ACTIVE MARKETS FOR IDENTICAL ASSETS (LEVEL 1) | OTHER SIGNIFICANT OBSERVABLE INPUTS (LEVEL 2) | SIGNIFICANT UNOBSERVABLE INPUTS (LEVEL 3) | TOTAL |
| Assets | ||||
| Common Stocks1 | $643,162,523 | $— | $— | $643,162,523 |
| Investment Companies1 | 621,421 | — | — | 621,421 |
| Short-Term Investments1 | 3,350,179 | — | — | 3,350,179 |
| Futures Contracts2 | 109,124 | — | — | 109,124 |
| Total | $647,243,247 | $— | $— | $647,243,247 |
| 1 | As categorized in the Portfolio Holdings. |
| 2 | Futures contracts are reported at cumulative unrealized appreciation or depreciation. |
| Assets | ||
| Investments in securities, at value - affiliated (cost $1,039,263) | $1,897,739 | |
| Investments in securities, at value - unaffiliated (cost $562,059,002) including securities on loan of $670,319 | 645,236,384 | |
| Cash | 129,853 | |
| Deposit with broker for futures contracts | 164,000 | |
| Receivables: | ||
| Fund shares sold | 1,012,934 | |
| Dividends | 616,262 | |
| Income from securities on loan | + | 4,123 |
| Total assets | 649,061,295 | |
| Liabilities | ||
| Collateral held for securities on loan | 686,224 | |
| Payables: | ||
| Fund shares redeemed | 542,954 | |
| Variation margin on futures contracts | 19,280 | |
| Investment adviser fees | + | 16,867 |
| Total liabilities | 1,265,325 | |
| Net assets | $647,795,970 | |
| Net Assets by Source | ||
| Capital received from investors | $582,325,155 | |
| Total distributable earnings | + | 65,470,815 |
| Net assets | $647,795,970 | |
| Net Asset Value (NAV) | ||||
| Net Assets | ÷ | Shares Outstanding | = | NAV |
| $647,795,970 | 13,634,563 | $47.51 | ||
| For the period November 1, 2021 through October 31, 2022 | ||
| Investment Income | ||
| Dividends received from securities - unaffiliated (net of foreign withholding tax of $3,229) | $12,704,310 | |
| Dividends received from securities - affiliated | 30,673 | |
| Securities on loan, net | + | 26,865 |
| Total investment income | 12,761,848 | |
| Expenses | ||
| Investment adviser fees | 214,388 | |
| Proxy fees1 | + | 2,757 |
| Total expenses | – | 217,145 |
| Net investment income | 12,544,703 | |
| REALIZED AND UNREALIZED GAINS (LOSSES) | ||
| Net realized losses on sales of securities - affiliated | (180,340) | |
| Net realized losses on sales of securities - unaffiliated | (4,434,022) | |
| Net realized gains on sales of in-kind redemptions - affiliated | 465,994 | |
| Net realized gains on sales of in-kind redemptions - unaffiliated | 9,972,950 | |
| Net realized losses on futures contracts | + | (378,084) |
| Net realized gains | 5,446,498 | |
| Net change in unrealized appreciation (depreciation) on securities - affiliated | (777,603) | |
| Net change in unrealized appreciation (depreciation) on securities - unaffiliated | (62,636,956) | |
| Net change in unrealized appreciation (depreciation) on futures contracts | + | 93,006 |
| Net change in unrealized appreciation (depreciation) | + | (63,321,553) |
| Net realized and unrealized losses | (57,875,055) | |
| Decrease in net assets resulting from operations | ($45,330,352) | |
| 1 | Proxy fees are non-routine expenses (see financial note 2(e) for additional information). |
| OPERATIONS | |||
| 11/1/21-10/31/22 | 11/1/20-10/31/21 | ||
| Net investment income | $12,544,703 | $9,554,564 | |
| Net realized gains | 5,446,498 | 18,696,413 | |
| Net change in unrealized appreciation (depreciation) | + | (63,321,553) | 125,598,537 |
| Increase (decrease) in net assets resulting from operations | ($45,330,352) | $153,849,514 | |
| DISTRIBUTIONS TO SHAREHOLDERS | |||
| Total distributions | ($27,740,131) | ($7,759,956) | |
| TRANSACTIONS IN FUND SHARES | |||||
| 11/1/21-10/31/22 | 11/1/20-10/31/21 | ||||
| SHARES | VALUE | SHARES | VALUE | ||
| Shares sold | 5,720,926 | $280,961,274 | 3,972,069 | $193,635,977 | |
| Shares reinvested | 416,349 | 21,312,908 | 129,214 | 5,614,330 | |
| Shares redeemed | + | (3,237,613) | (157,379,862) | (2,064,619) | (100,690,119) |
| Net transactions in fund shares | 2,899,662 | $144,894,320 | 2,036,664 | $98,560,188 | |
| SHARES OUTSTANDING AND NET ASSETS | |||||
| 11/1/21-10/31/22 | 11/1/20-10/31/21 | ||||
| SHARES | NET ASSETS | SHARES | NET ASSETS | ||
| Beginning of period | 10,734,901 | $575,972,133 | 8,698,237 | $331,322,387 | |
| Total increase | + | 2,899,662 | 71,823,837 | 2,036,664 | 244,649,746 |
| End of period | 13,634,563 | $647,795,970 | 10,734,901 | $575,972,133 | |
| 11/1/21– 10/31/22 | 11/1/20– 10/31/21 | 11/1/19– 10/31/20 | 11/1/18– 10/31/19 | 12/20/17 1– 10/31/18 | ||
| Per-Share Data | ||||||
| Net asset value at beginning of period | $64.44 | $44.98 | $44.29 | $39.55 | $40.00 | |
| Income (loss) from investment operations: | ||||||
| Net investment income (loss)2 | 0.79 | 0.69 | 0.72 | 0.70 | 0.59 | |
| Net realized and unrealized gains (losses) | (11.54) | 19.54 | 1.09 | 4.54 | (1.04) | |
| Total from investment operations | (10.75) | 20.23 | 1.81 | 5.24 | (0.45) | |
| Less distributions: | ||||||
| Distributions from net investment income | (0.63) | (0.77) | (0.64) | (0.42) | — | |
| Distributions from net realized gains | (1.22) | — | (0.48) | (0.08) | — | |
| Total distributions | (1.85) | (0.77) | (1.12) | (0.50) | — | |
| Net asset value at end of period | $51.84 | $64.44 | $44.98 | $44.29 | $39.55 | |
| Total return | (17.15%) | 45.35% | 4.04% | 13.61% | (1.13%) 3 | |
| Ratios/Supplemental Data | ||||||
| Ratios to average net assets: | ||||||
| Total expenses | 0.04% 4 | 0.04% | 0.04% | 0.04% 5 | 0.05% 6,7 | |
| Net operating expenses | N/A | N/A | N/A | N/A | 0.03% 6,7 | |
| Net investment income (loss) | 1.41% | 1.19% | 1.69% | 1.67% | 1.65% 6 | |
| Portfolio turnover rate | 11% 8 | 14% | 29% | 21% | 15% 3 | |
| Net assets, end of period (x 1,000) | $903,303 | $890,697 | $482,977 | $356,596 | $171,278 | |
| 1 | Commencement of operations. |
| 2 | Calculated based on the average shares outstanding during the period. |
| 3 | Not annualized. |
| 4 | Ratio includes less than 0.005% of non-routine proxy expenses. |
| 5 | Effective December 20, 2018, the annual operating expense ratio was reduced to 0.04%. The ratio presented for period ended 10/31/19 is a blended ratio. |
| 6 | Annualized. |
| 7 | The investment adviser voluntarily agreed to waive the fund’s management fees to 0.00% beginning with the fund’s commencement of operations through June 30, 2018. The ratio presented for period ended 10/31/18 is a blended ratio. |
| 8 | Portfolio turnover rate excludes in-kind transactions. |
| SECURITY | NUMBER OF SHARES | VALUE ($) |
| COMMON STOCKS 98.9% OF NET ASSETS | ||
| Automobiles & Components 0.9% | ||
| Aptiv plc * | 25,657 | 2,336,583 |
| BorgWarner, Inc. | 22,410 | 841,047 |
| Gentex Corp. | 22,338 | 591,734 |
| Harley-Davidson, Inc. | 12,740 | 547,820 |
| Lear Corp. | 5,651 | 783,850 |
| Lucid Group, Inc. *(a) | 50,504 | 721,702 |
| QuantumScape Corp. *(a) | 24,135 | 201,045 |
| Rivian Automotive, Inc., Class A * | 49,323 | 1,724,825 |
| Thor Industries, Inc. | 5,007 | 407,920 |
| 8,156,526 | ||
| Banks 3.4% | ||
| Bank of Hawaii Corp. | 3,738 | 283,901 |
| Bank OZK | 10,592 | 455,244 |
| BOK Financial Corp. | 2,792 | 307,651 |
| Citizens Financial Group, Inc. | 46,346 | 1,895,551 |
| Comerica, Inc. | 12,398 | 874,059 |
| Commerce Bancshares, Inc. | 10,401 | 736,807 |
| Cullen/Frost Bankers, Inc. | 5,536 | 858,357 |
| East West Bancorp, Inc. | 13,423 | 960,684 |
| F.N.B. Corp. | 33,118 | 478,555 |
| Fifth Third Bancorp | 64,677 | 2,308,322 |
| First Citizens BancShares, Inc., Class A | 1,156 | 950,371 |
| First Hawaiian, Inc. | 12,083 | 309,083 |
| First Horizon Corp. | 50,218 | 1,230,843 |
| First Republic Bank | 17,261 | 2,073,046 |
| Huntington Bancshares, Inc. | 136,218 | 2,067,789 |
| KeyCorp | 88,197 | 1,576,080 |
| M&T Bank Corp. | 16,602 | 2,795,279 |
| MGIC Investment Corp. | 28,649 | 391,059 |
| New York Community Bancorp, Inc. | 43,778 | 407,573 |
| PacWest Bancorp | 11,039 | 274,430 |
| Pinnacle Financial Partners, Inc. | 7,096 | 588,897 |
| Popular, Inc. | 6,955 | 491,858 |
| Prosperity Bancshares, Inc. | 8,318 | 595,319 |
| Regions Financial Corp. | 88,721 | 1,947,426 |
| Rocket Cos., Inc., Class A | 10,961 | 75,631 |
| Signature Bank | 5,881 | 932,315 |
| SVB Financial Group * | 5,572 | 1,286,909 |
| Synovus Financial Corp. | 13,694 | 545,706 |
| TFS Financial Corp. | 4,825 | 67,791 |
| Umpqua Holdings Corp. | 20,443 | 406,407 |
| UWM Holdings Corp. (a) | 8,652 | 28,379 |
| Webster Financial Corp. | 16,576 | 899,414 |
| Western Alliance Bancorp | 10,037 | 674,185 |
| Wintrust Financial Corp. | 5,672 | 531,013 |
| Zions Bancorp NA | 14,143 | 734,587 |
| 31,040,521 | ||
| Capital Goods 10.0% | ||
| A.O. Smith Corp. | 12,043 | 659,716 |
| Acuity Brands, Inc. | 3,100 | 569,067 |
| SECURITY | NUMBER OF SHARES | VALUE ($) |
| Advanced Drainage Systems, Inc. | 6,082 | 704,782 |
| AECOM | 12,499 | 940,925 |
| AGCO Corp. | 5,896 | 732,106 |
| Air Lease Corp. | 9,854 | 347,748 |
| Allegion plc | 8,317 | 871,372 |
| Allison Transmission Holdings, Inc. | 9,175 | 387,644 |
| AMETEK, Inc. | 21,871 | 2,835,794 |
| Armstrong World Industries, Inc. | 4,373 | 330,468 |
| Axon Enterprise, Inc. * | 6,411 | 932,416 |
| Builders FirstSource, Inc. * | 14,635 | 902,394 |
| BWX Technologies, Inc. | 8,648 | 492,763 |
| Carlisle Cos., Inc. | 4,879 | 1,165,105 |
| Carrier Global Corp. | 80,471 | 3,199,527 |
| ChargePoint Holdings, Inc. *(a) | 23,809 | 332,850 |
| Core & Main, Inc., Class A * | 6,737 | 158,858 |
| Crane Holdings Co. | 4,464 | 447,918 |
| Cummins, Inc. | 13,378 | 3,271,055 |
| Curtiss-Wright Corp. | 3,640 | 610,901 |
| Donaldson Co., Inc. | 11,680 | 671,016 |
| Dover Corp. | 13,657 | 1,784,833 |
| Esab Corp. | 4,835 | 180,346 |
| Fastenal Co. | 54,644 | 2,640,945 |
| Flowserve Corp. | 12,384 | 355,173 |
| Fortive Corp. | 34,052 | 2,175,923 |
| Fortune Brands Home & Security, Inc. | 12,255 | 739,222 |
| Gates Industrial Corp. plc * | 10,279 | 114,611 |
| Generac Holdings, Inc. * | 5,917 | 685,840 |
| Graco, Inc. | 15,930 | 1,108,409 |
| Hayward Holdings, Inc. * | 6,425 | 59,431 |
| HEICO Corp. | 4,259 | 692,684 |
| HEICO Corp., Class A | 7,504 | 955,259 |
| Hexcel Corp. | 7,943 | 442,425 |
| Howmet Aerospace, Inc. | 35,577 | 1,264,762 |
| Hubbell, Inc. | 5,081 | 1,206,636 |
| Huntington Ingalls Industries, Inc. | 3,735 | 960,156 |
| IDEX Corp. | 7,210 | 1,602,855 |
| Ingersoll Rand, Inc. | 38,559 | 1,947,230 |
| ITT, Inc. | 7,924 | 605,314 |
| Lennox International, Inc. | 3,033 | 708,418 |
| Lincoln Electric Holdings, Inc. | 5,317 | 755,014 |
| Masco Corp. | 21,377 | 989,114 |
| MasTec, Inc. * | 5,779 | 445,445 |
| MDU Resources Group, Inc. | 19,170 | 545,962 |
| Mercury Systems, Inc. * | 5,406 | 261,650 |
| MSC Industrial Direct Co., Inc., Class A | 4,385 | 363,867 |
| Nordson Corp. | 5,497 | 1,236,825 |
| nVent Electric plc | 15,690 | 572,685 |
| Oshkosh Corp. | 6,215 | 546,920 |
| Otis Worldwide Corp. | 40,167 | 2,837,397 |
| Owens Corning | 9,197 | 787,355 |
| PACCAR, Inc. | 32,385 | 3,135,840 |
| Parker-Hannifin Corp. | 12,149 | 3,530,742 |
| Pentair plc | 15,631 | 671,351 |
| Plug Power, Inc. * | 49,308 | 787,942 |
| Quanta Services, Inc. | 13,506 | 1,918,392 |
| Regal Rexnord Corp. | 6,359 | 804,668 |
| Rockwell Automation, Inc. | 11,038 | 2,818,001 |
| Sensata Technologies Holding plc | 14,537 | 584,533 |
| SECURITY | NUMBER OF SHARES | VALUE ($) |
| SiteOne Landscape Supply, Inc. * | 4,212 | 488,044 |
| Snap-on, Inc. | 4,989 | 1,107,807 |
| Spirit AeroSystems Holdings, Inc., Class A | 9,927 | 229,909 |
| Stanley Black & Decker, Inc. | 14,015 | 1,100,037 |
| Sunrun, Inc. * | 19,472 | 438,315 |
| Textron, Inc. | 20,053 | 1,372,427 |
| The AZEK Co., Inc. * | 10,498 | 183,820 |
| The Middleby Corp. * | 5,078 | 710,209 |
| The Timken Co. | 5,896 | 420,326 |
| The Toro Co. | 9,903 | 1,044,073 |
| Trane Technologies plc | 22,148 | 3,535,485 |
| TransDigm Group, Inc. | 4,875 | 2,806,830 |
| Trex Co., Inc. * | 10,482 | 504,079 |
| United Rentals, Inc. * | 6,629 | 2,092,842 |
| Univar Solutions, Inc. * | 15,608 | 397,692 |
| Valmont Industries, Inc. | 1,994 | 636,525 |
| Vertiv Holdings Co. | 28,862 | 413,015 |
| W.W. Grainger, Inc. | 4,325 | 2,527,314 |
| Watsco, Inc. | 3,127 | 847,292 |
| WESCO International, Inc. * | 4,234 | 583,318 |
| Westinghouse Air Brake Technologies Corp. | 17,181 | 1,602,644 |
| WillScot Mobile Mini Holdings Corp. * | 19,752 | 840,053 |
| Woodward, Inc. | 5,573 | 511,044 |
| Xylem, Inc. | 17,002 | 1,741,515 |
| 90,523,215 | ||
| Commercial & Professional Services 3.3% | ||
| Booz Allen Hamilton Holding Corp. | 12,458 | 1,356,053 |
| CACI International, Inc., Class A * | 2,194 | 667,042 |
| Cintas Corp. | 8,217 | 3,513,178 |
| Clarivate plc * | 44,723 | 461,989 |
| Clean Harbors, Inc. * | 4,837 | 592,339 |
| Copart, Inc. * | 20,231 | 2,326,970 |
| CoStar Group, Inc. * | 37,302 | 3,085,621 |
| Driven Brands Holdings, Inc. * | 5,241 | 167,607 |
| Dun & Bradstreet Holdings, Inc. | 23,872 | 306,755 |
| Equifax, Inc. | 11,538 | 1,956,152 |
| FTI Consulting, Inc. * | 3,198 | 497,705 |
| IAA, Inc. * | 12,702 | 481,787 |
| Jacobs Solutions, Inc. | 12,132 | 1,397,849 |
| KBR, Inc. | 13,176 | 655,770 |
| Leidos Holdings, Inc. | 12,928 | 1,313,355 |
| ManpowerGroup, Inc. | 4,893 | 383,318 |
| MSA Safety, Inc. | 3,504 | 470,377 |
| Republic Services, Inc. | 19,574 | 2,595,904 |
| Robert Half International, Inc. | 10,217 | 781,192 |
| Rollins, Inc. | 21,986 | 925,171 |
| Science Applications International Corp. | 5,269 | 570,843 |
| Stericycle, Inc. * | 8,715 | 388,515 |
| Tetra Tech, Inc. | 5,056 | 714,312 |
| TransUnion | 18,268 | 1,082,744 |
| Verisk Analytics, Inc. | 14,746 | 2,696,011 |
| 29,388,559 | ||
| Consumer Durables & Apparel 2.5% | ||
| Brunswick Corp. | 7,013 | 495,609 |
| Capri Holdings Ltd. * | 12,788 | 584,156 |
| Carter's, Inc. | 3,618 | 245,554 |
| Columbia Sportswear Co. | 3,420 | 254,790 |
| D.R. Horton, Inc. | 30,259 | 2,326,312 |
| Deckers Outdoor Corp. * | 2,499 | 874,475 |
| Garmin Ltd. | 14,634 | 1,288,377 |
| Hanesbrands, Inc. | 32,988 | 224,978 |
| Hasbro, Inc. | 12,477 | 814,124 |
| Leggett & Platt, Inc. | 12,608 | 425,520 |
| Lennar Corp., Class A | 23,826 | 1,922,758 |
| SECURITY | NUMBER OF SHARES | VALUE ($) |
| Lennar Corp., Class B | 1,376 | 89,743 |
| Lululemon Athletica, Inc. * | 10,602 | 3,488,482 |
| Mattel, Inc. * | 33,397 | 633,207 |
| Mohawk Industries, Inc. * | 4,979 | 471,760 |
| Newell Brands, Inc. | 35,828 | 494,785 |
| NVR, Inc. * | 285 | 1,207,759 |
| Peloton Interactive, Inc., Class A * | 28,815 | 242,046 |
| Polaris, Inc. | 5,360 | 544,576 |
| PulteGroup, Inc. | 21,861 | 874,221 |
| PVH Corp. | 6,396 | 328,243 |
| Ralph Lauren Corp. | 4,023 | 372,892 |
| Skechers U.S.A., Inc., Class A * | 12,682 | 436,641 |
| Tapestry, Inc. | 23,912 | 757,532 |
| Tempur Sealy International, Inc. | 15,922 | 428,142 |
| Toll Brothers, Inc. | 10,201 | 439,459 |
| TopBuild Corp. * | 3,071 | 522,500 |
| Under Armour, Inc., Class A * | 18,000 | 134,100 |
| Under Armour, Inc., Class C * | 18,846 | 123,630 |
| VF Corp. | 33,171 | 937,081 |
| Whirlpool Corp. | 5,068 | 700,600 |
| YETI Holdings, Inc. * | 8,158 | 261,709 |
| 22,945,761 | ||
| Consumer Services 3.4% | ||
| ADT, Inc. | 19,594 | 165,765 |
| Aramark | 22,003 | 803,110 |
| Boyd Gaming Corp. | 7,418 | 428,464 |
| Bright Horizons Family Solutions, Inc. * | 5,478 | 357,823 |
| Caesars Entertainment, Inc. * | 19,471 | 851,467 |
| Carnival Corp. * | 90,904 | 823,590 |
| Chipotle Mexican Grill, Inc. * | 2,641 | 3,957,090 |
| Choice Hotels International, Inc. | 3,204 | 416,007 |
| Churchill Downs, Inc. | 3,442 | 715,626 |
| Darden Restaurants, Inc. | 11,618 | 1,663,001 |
| Domino’s Pizza, Inc. | 3,409 | 1,132,606 |
| DraftKings, Inc., Class A * | 30,690 | 484,902 |
| Expedia Group, Inc. * | 14,352 | 1,341,482 |
| Grand Canyon Education, Inc. * | 2,976 | 299,475 |
| H&R Block, Inc. | 15,152 | 623,505 |
| Hilton Worldwide Holdings, Inc. | 25,646 | 3,468,878 |
| Hyatt Hotels Corp., Class A * | 4,679 | 440,809 |
| Las Vegas Sands Corp. * | 31,393 | 1,193,248 |
| Marriott Vacations Worldwide Corp. | 3,646 | 538,733 |
| MGM Resorts International | 31,158 | 1,108,290 |
| Mister Car Wash, Inc. * | 7,352 | 64,918 |
| Norwegian Cruise Line Holdings Ltd. * | 39,645 | 669,604 |
| Penn Entertainment, Inc. * | 14,953 | 494,944 |
| Planet Fitness, Inc., Class A * | 7,989 | 523,120 |
| Royal Caribbean Cruises Ltd. * | 20,905 | 1,115,909 |
| Service Corp. International | 14,651 | 887,997 |
| Six Flags Entertainment Corp. * | 7,050 | 157,215 |
| The Wendy's Co. | 16,248 | 337,633 |
| Travel & Leisure Co. | 7,786 | 295,712 |
| Vail Resorts, Inc. | 3,817 | 836,419 |
| Wyndham Hotels & Resorts, Inc. | 8,423 | 639,558 |
| Wynn Resorts Ltd. * | 9,908 | 633,121 |
| Yum! Brands, Inc. | 27,177 | 3,213,680 |
| 30,683,701 | ||
| Diversified Financials 5.7% | ||
| Affiliated Managers Group, Inc. | 3,594 | 446,231 |
| AGNC Investment Corp. | 49,497 | 406,865 |
| Ally Financial, Inc. | 29,269 | 806,654 |
| Ameriprise Financial, Inc. | 10,256 | 3,170,335 |
| Annaly Capital Management, Inc. | 40,885 | 758,417 |
| Apollo Global Management, Inc. | 43,595 | 2,413,419 |
| SECURITY | NUMBER OF SHARES | VALUE ($) |
| Ares Management Corp., Class A | 14,397 | 1,091,725 |
| Blue Owl Capital, Inc. | 39,482 | 395,610 |
| Cboe Global Markets, Inc. | 10,048 | 1,250,976 |
| Coinbase Global, Inc., Class A * | 14,984 | 992,690 |
| Credit Acceptance Corp. * | 636 | 296,134 |
| Discover Financial Services | 25,899 | 2,705,410 |
| Equitable Holdings, Inc. | 35,508 | 1,087,255 |
| Evercore, Inc., Class A | 3,451 | 362,700 |
| FactSet Research Systems, Inc. | 3,602 | 1,532,615 |
| Franklin Resources, Inc. | 27,125 | 636,081 |
| Interactive Brokers Group, Inc., Class A | 8,825 | 707,324 |
| Invesco Ltd. | 35,500 | 543,860 |
| Janus Henderson Group plc | 12,890 | 293,505 |
| Jefferies Financial Group, Inc. | 19,335 | 665,317 |
| KKR & Co., Inc. | 54,295 | 2,640,366 |
| Lazard Ltd., Class A | 8,470 | 319,404 |
| LPL Financial Holdings, Inc. | 7,555 | 1,931,436 |
| MarketAxess Holdings, Inc. | 3,525 | 860,241 |
| Morningstar, Inc. | 2,354 | 546,552 |
| MSCI, Inc. | 7,483 | 3,508,479 |
| Nasdaq, Inc. | 32,637 | 2,031,327 |
| Northern Trust Corp. | 19,510 | 1,645,668 |
| OneMain Holdings, Inc. | 11,050 | 426,088 |
| Raymond James Financial, Inc. | 18,476 | 2,182,755 |
| Rithm Capital Corp. | 40,444 | 340,943 |
| Robinhood Markets, Inc., Class A * | 53,269 | 622,182 |
| SEI Investments Co. | 9,735 | 528,611 |
| SLM Corp. | 23,769 | 394,328 |
| SoFi Technologies, Inc. * | 75,501 | 410,725 |
| Starwood Property Trust, Inc. | 27,791 | 574,162 |
| State Street Corp. | 34,826 | 2,577,124 |
| Stifel Financial Corp. | 9,805 | 606,635 |
| Synchrony Financial | 45,558 | 1,620,042 |
| T. Rowe Price Group, Inc. | 21,244 | 2,255,263 |
| The Bank of New York Mellon Corp. | 69,730 | 2,936,330 |
| The Carlyle Group, Inc. | 19,648 | 555,645 |
| Tradeweb Markets, Inc., Class A | 10,200 | 561,816 |
| Upstart Holdings, Inc. *(a) | 6,676 | 154,750 |
| Virtu Financial, Inc., Class A | 9,295 | 208,022 |
| Voya Financial, Inc. | 9,219 | 630,211 |
| 51,632,228 | ||
| Energy 5.6% | ||
| Antero Midstream Corp. | 31,789 | 338,553 |
| Antero Resources Corp. * | 27,449 | 1,006,280 |
| APA Corp. | 30,880 | 1,403,805 |
| Baker Hughes Co. | 90,320 | 2,498,251 |
| Cheniere Energy, Inc. | 23,629 | 4,168,392 |
| Chesapeake Energy Corp. | 11,492 | 1,175,287 |
| Continental Resources, Inc. | 3,434 | 254,013 |
| Coterra Energy, Inc. | 74,492 | 2,318,936 |
| Devon Energy Corp. | 62,450 | 4,830,508 |
| Diamondback Energy, Inc. | 16,426 | 2,580,689 |
| DTE Midstream LLC * | 9,218 | 550,315 |
| Enviva, Inc. | 2,884 | 172,579 |
| EQT Corp. | 34,975 | 1,463,354 |
| Halliburton Co. | 85,291 | 3,106,298 |
| Hess Corp. | 26,731 | 3,771,209 |
| HF Sinclair Corp. | 13,830 | 845,981 |
| Marathon Oil Corp. | 64,107 | 1,952,058 |
| New Fortress Energy, Inc. | 4,550 | 250,569 |
| NOV, Inc. | 37,145 | 832,048 |
| ONEOK, Inc. | 42,200 | 2,503,304 |
| Ovintiv, Inc. | 24,253 | 1,228,414 |
| PDC Energy, Inc. | 8,986 | 648,250 |
| Phillips 66 | 45,683 | 4,764,280 |
| Range Resources Corp. | 24,336 | 693,089 |
| SECURITY | NUMBER OF SHARES | VALUE ($) |
| Southwestern Energy Co. * | 105,699 | 732,494 |
| Targa Resources Corp. | 21,447 | 1,466,331 |
| Texas Pacific Land Corp. | 543 | 1,251,001 |
| The Williams Cos., Inc. | 115,635 | 3,784,734 |
| 50,591,022 | ||
| Food & Staples Retailing 0.7% | ||
| Albertsons Cos., Inc., Class A | 15,948 | 327,093 |
| BJ's Wholesale Club Holdings, Inc. * | 12,716 | 984,218 |
| Casey's General Stores, Inc. | 3,519 | 818,907 |
| Grocery Outlet Holding Corp. * | 8,396 | 290,250 |
| Performance Food Group Co. * | 14,437 | 751,301 |
| The Kroger Co. | 62,247 | 2,943,661 |
| U.S. Foods Holding Corp. * | 19,155 | 570,053 |
| 6,685,483 | ||
| Food, Beverage & Tobacco 2.5% | ||
| Brown-Forman Corp., Class A | 4,307 | 296,192 |
| Brown-Forman Corp., Class B | 17,434 | 1,185,512 |
| Bunge Ltd. | 13,299 | 1,312,611 |
| Campbell Soup Co. | 18,399 | 973,491 |
| Conagra Brands, Inc. | 44,682 | 1,639,829 |
| Darling Ingredients, Inc. * | 15,185 | 1,191,719 |
| Flowers Foods, Inc. | 17,749 | 509,574 |
| Freshpet, Inc. * | 4,300 | 253,485 |
| Hormel Foods Corp. | 27,217 | 1,264,230 |
| Ingredion, Inc. | 6,226 | 554,861 |
| Kellogg Co. | 23,960 | 1,840,607 |
| Lamb Weston Holdings, Inc. | 13,678 | 1,179,317 |
| McCormick & Co., Inc. - Non Voting Shares | 23,798 | 1,871,475 |
| Molson Coors Beverage Co., Class B | 16,613 | 837,794 |
| Pilgrim's Pride Corp. * | 4,487 | 103,425 |
| Post Holdings, Inc. * | 5,180 | 468,376 |
| Seaboard Corp. | 24 | 89,913 |
| The Boston Beer Co., Inc., Class A * | 894 | 333,721 |
| The Hershey Co. | 13,856 | 3,308,397 |
| The JM Smucker Co. | 9,784 | 1,474,058 |
| Tyson Foods, Inc., Class A | 27,042 | 1,848,321 |
| 22,536,908 | ||
| Health Care Equipment & Services 5.1% | ||
| ABIOMED, Inc. * | 4,241 | 1,069,071 |
| Acadia Healthcare Co., Inc. * | 8,454 | 687,310 |
| agilon health, Inc. * | 17,917 | 355,653 |
| Align Technology, Inc. * | 7,448 | 1,447,146 |
| Amedisys, Inc. * | 3,032 | 295,893 |
| AmerisourceBergen Corp. | 14,015 | 2,203,438 |
| Cardinal Health, Inc. | 25,863 | 1,963,002 |
| Certara, Inc. * | 10,927 | 133,637 |
| Chemed Corp. | 1,389 | 648,482 |
| DaVita, Inc. * | 5,336 | 389,581 |
| Definitive Healthcare Corp. * | 3,058 | 48,255 |
| Dentsply Sirona, Inc. | 20,372 | 627,865 |
| DexCom, Inc. * | 37,181 | 4,490,721 |
| Doximity, Inc., Class A * | 10,280 | 272,112 |
| Encompass Health Corp. | 9,279 | 505,149 |
| Enhabit, Inc. * | 4,555 | 56,573 |
| Enovis Corp. * | 4,800 | 237,360 |
| Envista Holdings Corp. * | 15,446 | 509,873 |
| Globus Medical, Inc., Class A * | 7,233 | 484,611 |
| Guardant Health, Inc. * | 9,226 | 456,687 |
| Henry Schein, Inc. * | 12,839 | 878,958 |
| Hologic, Inc. * | 23,350 | 1,583,130 |
| ICU Medical, Inc. * | 1,907 | 283,018 |
| IDEXX Laboratories, Inc. * | 7,915 | 2,846,867 |
| SECURITY | NUMBER OF SHARES | VALUE ($) |
| Insulet Corp. * | 6,534 | 1,691,065 |
| Integra LifeSciences Holdings Corp. * | 6,871 | 345,268 |
| Laboratory Corp. of America Holdings | 8,578 | 1,903,115 |
| Masimo Corp. * | 4,508 | 593,253 |
| Molina Healthcare, Inc. * | 5,438 | 1,951,481 |
| Novocure Ltd. * | 9,812 | 693,316 |
| Oak Street Health, Inc. * | 11,122 | 224,998 |
| Penumbra, Inc. * | 3,388 | 580,940 |
| Premier, Inc., Class A | 11,191 | 390,342 |
| Quest Diagnostics, Inc. | 11,105 | 1,595,233 |
| QuidelOrtho Corp. * | 4,674 | 419,819 |
| ResMed, Inc. | 13,716 | 3,068,132 |
| Signify Health, Inc., Class A * | 6,728 | 196,660 |
| STERIS plc | 9,473 | 1,634,850 |
| Tandem Diabetes Care, Inc. * | 6,076 | 341,167 |
| Teladoc Health, Inc. * | 15,231 | 451,447 |
| Teleflex, Inc. | 4,454 | 955,650 |
| Tenet Healthcare Corp. * | 10,071 | 446,750 |
| The Cooper Cos., Inc. | 4,612 | 1,260,875 |
| Universal Health Services, Inc., Class B | 6,020 | 697,537 |
| Veeva Systems, Inc., Class A * | 13,232 | 2,222,182 |
| Zimmer Biomet Holdings, Inc. | 19,915 | 2,257,365 |
| 46,395,837 | ||
| Household & Personal Products 0.5% | ||
| Church & Dwight Co., Inc. | 23,045 | 1,708,326 |
| Coty, Inc., Class A * | 32,930 | 220,960 |
| Olaplex Holdings, Inc. * | 11,624 | 51,146 |
| Reynolds Consumer Products, Inc. | 5,195 | 158,655 |
| Spectrum Brands Holdings, Inc. | 3,809 | 175,747 |
| The Clorox Co. | 11,695 | 1,707,938 |
| 4,022,772 | ||
| Insurance 4.8% | ||
| Aflac, Inc. | 59,485 | 3,873,068 |
| American Financial Group, Inc. | 6,386 | 926,673 |
| Arch Capital Group Ltd. * | 33,620 | 1,933,150 |
| Arthur J. Gallagher & Co. | 19,751 | 3,695,017 |
| Assurant, Inc. | 5,054 | 686,636 |
| Assured Guaranty Ltd. | 5,630 | 333,240 |
| Axis Capital Holdings Ltd. | 7,376 | 403,246 |
| Brighthouse Financial, Inc. * | 6,742 | 384,766 |
| Brown & Brown, Inc. | 22,440 | 1,319,248 |
| Cincinnati Financial Corp. | 14,845 | 1,533,785 |
| CNA Financial Corp. | 2,615 | 109,046 |
| Erie Indemnity Co., Class A | 2,380 | 611,684 |
| Everest Re Group Ltd. | 3,693 | 1,191,583 |
| Fidelity National Financial, Inc. | 25,032 | 985,760 |
| First American Financial Corp. | 9,553 | 481,471 |
| Globe Life, Inc. | 8,487 | 980,418 |
| Kemper Corp. | 6,051 | 288,451 |
| Lincoln National Corp. | 16,102 | 867,415 |
| Loews Corp. | 18,921 | 1,078,875 |
| Markel Corp. * | 1,268 | 1,529,335 |
| Old Republic International Corp. | 26,884 | 623,978 |
| Primerica, Inc. | 3,523 | 509,778 |
| Principal Financial Group, Inc. | 23,409 | 2,063,035 |
| Prudential Financial, Inc. | 35,622 | 3,747,078 |
| Reinsurance Group of America, Inc. | 6,341 | 933,205 |
| RenaissanceRe Holdings Ltd. | 4,077 | 630,630 |
| Ryan Specialty Group Holdings, Inc., Class A * | 7,822 | 350,817 |
| The Allstate Corp. | 25,573 | 3,228,591 |
| The Hanover Insurance Group, Inc. | 3,351 | 490,888 |
| The Hartford Financial Services Group, Inc. | 30,617 | 2,216,977 |
| Unum Group | 19,016 | 866,940 |
| SECURITY | NUMBER OF SHARES | VALUE ($) |
| W.R. Berkley Corp. | 19,539 | 1,453,311 |
| White Mountains Insurance Group Ltd. | 268 | 379,528 |
| Willis Towers Watson plc | 10,382 | 2,265,456 |
| 42,973,079 | ||
| Materials 6.1% | ||
| Albemarle Corp. | 11,110 | 3,109,356 |
| Alcoa Corp. | 17,075 | 666,437 |
| Amcor plc | 142,367 | 1,648,610 |
| AptarGroup, Inc. | 6,200 | 614,730 |
| Ardagh Metal Packaging S.A. (a) | 14,176 | 62,941 |
| Ashland, Inc. | 4,795 | 503,091 |
| Avery Dennison Corp. | 7,728 | 1,310,282 |
| Axalta Coating Systems Ltd. * | 20,907 | 487,551 |
| Ball Corp. | 29,273 | 1,445,793 |
| Berry Global Group, Inc. * | 11,862 | 561,310 |
| Celanese Corp. | 10,279 | 988,017 |
| CF Industries Holdings, Inc. | 18,874 | 2,005,551 |
| Cleveland-Cliffs, Inc. * | 48,505 | 630,080 |
| Corteva, Inc. | 68,789 | 4,494,673 |
| Crown Holdings, Inc. | 11,034 | 756,822 |
| DuPont de Nemours, Inc. | 47,607 | 2,723,120 |
| Eagle Materials, Inc. | 3,546 | 433,711 |
| Eastman Chemical Co. | 11,616 | 892,225 |
| Element Solutions, Inc. | 21,691 | 373,085 |
| FMC Corp. | 11,954 | 1,421,331 |
| Ginkgo Bioworks Holdings, Inc. *(a) | 82,786 | 226,006 |
| Graphic Packaging Holding Co. | 29,076 | 667,585 |
| Huntsman Corp. | 18,187 | 486,684 |
| International Flavors & Fragrances, Inc. | 24,193 | 2,361,479 |
| International Paper Co. | 34,307 | 1,153,058 |
| Louisiana-Pacific Corp. | 6,957 | 394,114 |
| LyondellBasell Industries N.V., Class A | 24,391 | 1,864,692 |
| Martin Marietta Materials, Inc. | 5,904 | 1,983,626 |
| MP Materials Corp. * | 8,571 | 257,473 |
| NewMarket Corp. | 558 | 169,822 |
| Nucor Corp. | 24,839 | 3,263,348 |
| Olin Corp. | 12,715 | 673,259 |
| Packaging Corp. of America | 8,769 | 1,054,122 |
| PPG Industries, Inc. | 22,370 | 2,554,207 |
| Reliance Steel & Aluminum Co. | 5,694 | 1,147,227 |
| Royal Gold, Inc. | 6,233 | 591,886 |
| RPM International, Inc. | 12,112 | 1,145,432 |
| Sealed Air Corp. | 13,845 | 659,299 |
| Silgan Holdings, Inc. | 7,974 | 377,649 |
| Sonoco Products Co. | 9,243 | 573,805 |
| SSR Mining, Inc. | 20,086 | 277,187 |
| Steel Dynamics, Inc. | 16,434 | 1,545,618 |
| The Chemours Co. | 14,650 | 419,430 |
| The Mosaic Co. | 32,731 | 1,759,291 |
| The Scotts Miracle-Gro Co. | 3,836 | 176,111 |
| United States Steel Corp. | 22,262 | 453,254 |
| Valvoline, Inc. | 16,748 | 491,721 |
| Vulcan Materials Co. | 12,569 | 2,057,545 |
| Westlake Corp. | 3,127 | 302,225 |
| WestRock Co. | 24,048 | 819,075 |
| 55,034,946 | ||
| Media & Entertainment 3.5% | ||
| Altice USA, Inc., Class A * | 19,803 | 130,898 |
| AMC Entertainment Holdings, Inc., Class A *(a) | 49,210 | 327,739 |
| Cable One, Inc. | 555 | 476,984 |
| DISH Network Corp., Class A * | 23,860 | 355,753 |
| Electronic Arts, Inc. | 26,308 | 3,313,756 |
| Fox Corp., Class A | 28,526 | 823,546 |
| SECURITY | NUMBER OF SHARES | VALUE ($) |
| Fox Corp., Class B | 13,558 | 368,777 |
| IAC, Inc. * | 7,386 | 359,550 |
| Liberty Broadband Corp., Class A * | 1,742 | 148,627 |
| Liberty Broadband Corp., Class C * | 11,723 | 989,773 |
| Liberty Media Corp. - Liberty Formula One, Class A * | 1,975 | 102,739 |
| Liberty Media Corp. - Liberty Formula One, Class C * | 19,058 | 1,100,218 |
| Liberty Media Corp. - Liberty SiriusXM, Class A * | 7,118 | 302,088 |
| Liberty Media Corp. - Liberty SiriusXM, Class C * | 14,680 | 619,349 |
| Live Nation Entertainment, Inc. * | 14,618 | 1,163,739 |
| Madison Square Garden Sports Corp. | 1,806 | 282,838 |
| Match Group, Inc. * | 27,044 | 1,168,301 |
| News Corp., Class A | 36,582 | 617,138 |
| News Corp., Class B | 11,505 | 197,081 |
| Nexstar Media Group, Inc., Class A | 3,544 | 607,087 |
| Omnicom Group, Inc. | 19,305 | 1,404,439 |
| Paramount Global, Class A | 815 | 17,180 |
| Paramount Global, Class B | 54,786 | 1,003,679 |
| Pinterest, Inc., Class A * | 55,274 | 1,359,740 |
| Playtika Holding Corp. * | 9,888 | 93,442 |
| ROBLOX Corp., Class A * | 41,782 | 1,869,327 |
| Roku, Inc. * | 11,385 | 632,323 |
| Sirius XM Holdings, Inc. (a) | 66,499 | 401,654 |
| Spotify Technology S.A. * | 13,289 | 1,070,828 |
| Take-Two Interactive Software, Inc. * | 15,503 | 1,836,795 |
| The Interpublic Group of Cos., Inc. | 37,301 | 1,111,197 |
| The New York Times Co., Class A | 15,566 | 450,791 |
| The Trade Desk, Inc., Class A * | 41,654 | 2,217,659 |
| TripAdvisor, Inc. * | 9,650 | 227,933 |
| Warner Bros Discovery, Inc. * | 223,931 | 2,911,103 |
| World Wrestling Entertainment, Inc., Class A | 4,093 | 322,897 |
| ZoomInfo Technologies, Inc. * | 26,087 | 1,161,654 |
| 31,548,622 | ||
| Pharmaceuticals, Biotechnology & Life Sciences 5.2% | ||
| 10X Genomics, Inc., Class A * | 8,734 | 237,390 |
| Agilent Technologies, Inc. | 28,470 | 3,938,824 |
| Alnylam Pharmaceuticals, Inc. * | 11,458 | 2,374,785 |
| Avantor, Inc. * | 57,892 | 1,167,682 |
| Azenta, Inc. | 7,052 | 313,109 |
| Biogen, Inc. * | 13,841 | 3,923,093 |
| BioMarin Pharmaceutical, Inc. * | 17,522 | 1,517,931 |
| Bio-Rad Laboratories, Inc., Class A * | 2,030 | 713,971 |
| Bio-Techne Corp. | 3,693 | 1,094,088 |
| Bruker Corp. | 10,309 | 637,509 |
| Catalent, Inc. * | 16,204 | 1,065,089 |
| Charles River Laboratories International, Inc. * | 4,786 | 1,015,828 |
| Elanco Animal Health, Inc. * | 42,219 | 556,869 |
| Exact Sciences Corp. * | 16,560 | 575,957 |
| Exelixis, Inc. * | 29,922 | 496,107 |
| Horizon Therapeutics plc * | 21,320 | 1,328,662 |
| Incyte Corp. * | 17,330 | 1,288,312 |
| Ionis Pharmaceuticals, Inc. * | 13,422 | 593,252 |
| IQVIA Holdings, Inc. * | 17,613 | 3,692,918 |
| Jazz Pharmaceuticals plc * | 5,784 | 831,681 |
| Maravai LifeSciences Holdings, Inc., Class A * | 10,400 | 172,640 |
| Mettler-Toledo International, Inc. * | 2,124 | 2,686,711 |
| Mirati Therapeutics, Inc. * | 4,074 | 274,262 |
| Natera, Inc. * | 8,164 | 383,381 |
| Neurocrine Biosciences, Inc. * | 8,998 | 1,035,850 |
| SECURITY | NUMBER OF SHARES | VALUE ($) |
| Novavax, Inc. * | 7,354 | 163,774 |
| Organon & Co. | 24,060 | 629,891 |
| PerkinElmer, Inc. | 11,974 | 1,599,487 |
| Perrigo Co., plc | 12,774 | 514,537 |
| QIAGEN N.V. * | 21,533 | 937,977 |
| Repligen Corp. * | 5,249 | 957,890 |
| Royalty Pharma plc, Class A | 34,847 | 1,474,725 |
| Sarepta Therapeutics, Inc. * | 7,988 | 910,792 |
| Seagen, Inc. * | 12,907 | 1,641,254 |
| Sotera Health Co. * | 9,211 | 63,372 |
| Syneos Health, Inc. * | 9,702 | 488,787 |
| Ultragenyx Pharmaceutical, Inc. * | 6,307 | 255,181 |
| United Therapeutics Corp. * | 4,235 | 976,295 |
| Viatris, Inc. | 115,027 | 1,165,224 |
| Waters Corp. * | 5,685 | 1,700,781 |
| West Pharmaceutical Services, Inc. | 7,030 | 1,617,603 |
| 47,013,471 | ||
| Real Estate 7.5% | ||
| Alexandria Real Estate Equities, Inc. | 15,377 | 2,234,278 |
| American Homes 4 Rent, Class A | 28,786 | 919,425 |
| Americold Realty Trust, Inc. | 25,554 | 619,684 |
| Apartment Income REIT Corp. | 14,612 | 561,539 |
| AvalonBay Communities, Inc. | 13,258 | 2,321,741 |
| Boston Properties, Inc. | 14,873 | 1,081,267 |
| Brixmor Property Group, Inc. | 28,345 | 604,032 |
| Camden Property Trust | 9,839 | 1,136,896 |
| CBRE Group, Inc., Class A * | 30,414 | 2,157,569 |
| Cousins Properties, Inc. | 14,377 | 341,598 |
| CubeSmart | 21,214 | 888,230 |
| Douglas Emmett, Inc. | 16,068 | 282,636 |
| EastGroup Properties, Inc. | 3,905 | 611,874 |
| EPR Properties | 6,997 | 270,084 |
| Equity LifeStyle Properties, Inc. | 16,857 | 1,078,174 |
| Equity Residential | 35,152 | 2,215,279 |
| Essex Property Trust, Inc. | 6,169 | 1,370,999 |
| Extra Space Storage, Inc. | 12,576 | 2,231,485 |
| Federal Realty Investment Trust | 7,621 | 754,327 |
| First Industrial Realty Trust, Inc. | 12,484 | 594,613 |
| Gaming & Leisure Properties, Inc. | 23,166 | 1,161,080 |
| Healthcare Realty Trust, Inc. | 36,043 | 732,754 |
| Healthpeak Properties, Inc. | 51,174 | 1,214,359 |
| Highwoods Properties, Inc. | 9,846 | 277,953 |
| Host Hotels & Resorts, Inc. | 67,182 | 1,268,396 |
| Hudson Pacific Properties, Inc. | 13,031 | 143,862 |
| Invitation Homes, Inc. | 57,924 | 1,835,612 |
| Iron Mountain, Inc. | 27,394 | 1,371,618 |
| JBG SMITH Properties | 10,076 | 198,296 |
| Jones Lang LaSalle, Inc. * | 4,533 | 721,155 |
| Kilroy Realty Corp. | 11,004 | 470,311 |
| Kimco Realty Corp. | 57,313 | 1,225,352 |
| Lamar Advertising Co., Class A | 8,205 | 756,747 |
| Life Storage, Inc. | 7,985 | 883,221 |
| Medical Properties Trust, Inc. | 56,477 | 646,662 |
| Mid-America Apartment Communities, Inc. | 10,898 | 1,715,890 |
| National Retail Properties, Inc. | 16,662 | 700,304 |
| National Storage Affiliates Trust | 8,035 | 342,773 |
| Omega Healthcare Investors, Inc. | 22,324 | 709,457 |
| Opendoor Technologies, Inc. * | 43,444 | 112,520 |
| Park Hotels & Resorts, Inc. | 21,165 | 276,838 |
| Rayonier, Inc. | 13,799 | 465,026 |
| Realty Income Corp. | 58,664 | 3,653,007 |
| Regency Centers Corp. | 16,261 | 983,953 |
| Rexford Industrial Realty, Inc. | 16,252 | 898,411 |
| SBA Communications Corp. | 10,123 | 2,732,198 |
| Simon Property Group, Inc. | 30,965 | 3,374,566 |
| SL Green Realty Corp. | 6,084 | 241,413 |
| SECURITY | NUMBER OF SHARES | VALUE ($) |
| Spirit Realty Capital, Inc. | 12,858 | 499,276 |
| STORE Capital Corp. | 24,147 | 767,875 |
| Sun Communities, Inc. | 11,549 | 1,557,383 |
| The Howard Hughes Corp. * | 3,497 | 214,541 |
| UDR, Inc. | 30,728 | 1,221,745 |
| Ventas, Inc. | 37,892 | 1,482,714 |
| VICI Properties, Inc. | 91,305 | 2,923,586 |
| Vornado Realty Trust | 16,765 | 395,486 |
| Welltower, Inc. | 44,037 | 2,688,018 |
| WeWork, Inc., Class A *(a) | 12,080 | 31,046 |
| Weyerhaeuser Co. | 70,666 | 2,185,699 |
| WP Carey, Inc. | 18,144 | 1,384,387 |
| Zillow Group, Inc., Class A * | 5,395 | 166,867 |
| Zillow Group, Inc., Class C * | 15,182 | 468,517 |
| 67,376,604 | ||
| Retailing 4.7% | ||
| Advance Auto Parts, Inc. | 5,796 | 1,100,776 |
| AutoNation, Inc. * | 3,612 | 383,992 |
| AutoZone, Inc. * | 1,847 | 4,678,229 |
| Bath & Body Works, Inc. | 21,720 | 725,014 |
| Best Buy Co., Inc. | 19,081 | 1,305,331 |
| Burlington Stores, Inc. * | 6,250 | 893,500 |
| CarMax, Inc. * | 15,226 | 959,390 |
| Carvana Co. *(a) | 9,922 | 134,245 |
| Dick's Sporting Goods, Inc. | 5,152 | 586,091 |
| Dollar Tree, Inc. * | 20,171 | 3,197,103 |
| DoorDash, Inc., Class A * | 23,722 | 1,032,619 |
| eBay, Inc. | 52,182 | 2,078,931 |
| Etsy, Inc. * | 12,002 | 1,127,108 |
| Five Below, Inc. * | 5,181 | 758,239 |
| Floor & Decor Holdings, Inc., Class A * | 9,799 | 718,953 |
| GameStop Corp., Class A *(a) | 25,500 | 721,905 |
| Genuine Parts Co. | 13,178 | 2,343,839 |
| Kohl's Corp. | 12,174 | 364,611 |
| Leslie's, Inc. * | 14,969 | 210,165 |
| Lithia Motors, Inc. | 2,569 | 509,047 |
| LKQ Corp. | 24,367 | 1,355,780 |
| Macy's, Inc. | 25,520 | 532,092 |
| Nordstrom, Inc. | 10,610 | 215,807 |
| Ollie's Bargain Outlet Holdings, Inc. * | 5,924 | 331,744 |
| O'Reilly Automotive, Inc. * | 5,957 | 4,987,022 |
| Penske Automotive Group, Inc. | 2,546 | 284,184 |
| Petco Health & Wellness Co., Inc. * | 7,777 | 81,892 |
| Pool Corp. | 3,661 | 1,113,786 |
| RH * | 1,872 | 475,357 |
| Ross Stores, Inc. | 32,772 | 3,135,953 |
| The Gap, Inc. | 18,711 | 210,873 |
| Tractor Supply Co. | 10,617 | 2,333,298 |
| Ulta Beauty, Inc. * | 4,878 | 2,045,687 |
| Victoria's Secret & Co. * | 7,831 | 294,446 |
| Wayfair, Inc., Class A * | 7,401 | 280,646 |
| Williams-Sonoma, Inc. | 6,482 | 802,666 |
| 42,310,321 | ||
| Semiconductors & Semiconductor Equipment 2.2% | ||
| Allegro MicroSystems, Inc. * | 6,280 | 159,575 |
| Cirrus Logic, Inc. * | 5,286 | 354,796 |
| Enphase Energy, Inc. * | 12,424 | 3,814,168 |
| Entegris, Inc. | 14,085 | 1,117,504 |
| First Solar, Inc. * | 10,082 | 1,467,637 |
| GLOBALFOUNDRIES, Inc. *(a) | 6,039 | 342,411 |
| Lattice Semiconductor Corp. * | 12,892 | 625,391 |
| Microchip Technology, Inc. | 51,076 | 3,153,432 |
| MKS Instruments, Inc. | 5,426 | 445,746 |
| Monolithic Power Systems, Inc. | 4,307 | 1,462,011 |
| SECURITY | NUMBER OF SHARES | VALUE ($) |
| ON Semiconductor Corp. * | 41,181 | 2,529,749 |
| Qorvo, Inc. * | 9,771 | 841,088 |
| Skyworks Solutions, Inc. | 15,262 | 1,312,685 |
| Teradyne, Inc. | 14,864 | 1,209,186 |
| Universal Display Corp. | 4,124 | 392,687 |
| Wolfspeed, Inc. * | 10,965 | 863,494 |
| 20,091,560 | ||
| Software & Services 9.1% | ||
| Affirm Holdings, Inc. * | 16,907 | 339,323 |
| Akamai Technologies, Inc. * | 14,863 | 1,312,849 |
| Alteryx, Inc., Class A * | 5,648 | 275,227 |
| Amdocs Ltd. | 11,464 | 989,458 |
| ANSYS, Inc. * | 8,257 | 1,826,118 |
| AppLovin Corp., Class A *(a) | 20,749 | 351,903 |
| Aspen Technology, Inc. * | 2,562 | 618,595 |
| Bentley Systems, Inc., Class B | 16,002 | 564,551 |
| Bill.com Holdings, Inc. * | 9,261 | 1,235,047 |
| Black Knight, Inc. * | 14,667 | 886,913 |
| Broadridge Financial Solutions, Inc. | 11,076 | 1,662,065 |
| Cadence Design Systems, Inc. * | 25,899 | 3,920,850 |
| CCC Intelligent Solutions Holdings, Inc. * | 16,180 | 150,959 |
| Ceridian HCM Holding, Inc. * | 12,989 | 859,742 |
| Cloudflare, Inc., Class A * | 26,522 | 1,493,719 |
| Concentrix Corp. | 4,087 | 499,554 |
| Confluent, Inc., Class A * | 11,762 | 316,163 |
| Coupa Software, Inc. * | 7,135 | 379,796 |
| Crowdstrike Holdings, Inc., Class A * | 19,959 | 3,217,391 |
| Datadog, Inc., Class A * | 25,202 | 2,029,013 |
| DocuSign, Inc. * | 18,751 | 905,673 |
| Dolby Laboratories, Inc., Class A | 5,792 | 387,137 |
| DoubleVerify Holdings, Inc. * | 6,020 | 175,965 |
| Dropbox, Inc., Class A * | 25,983 | 565,130 |
| DXC Technology Co. * | 21,789 | 626,434 |
| Dynatrace, Inc. * | 18,893 | 665,789 |
| Elastic N.V. * | 7,344 | 469,649 |
| EPAM Systems, Inc. * | 5,210 | 1,823,500 |
| Euronet Worldwide, Inc. * | 4,487 | 376,953 |
| Fair Isaac Corp. * | 2,330 | 1,115,697 |
| Five9, Inc. * | 6,536 | 393,859 |
| FleetCor Technologies, Inc. * | 6,932 | 1,290,184 |
| Fortinet, Inc. * | 61,258 | 3,501,507 |
| Gartner, Inc. * | 7,285 | 2,199,487 |
| Genpact Ltd. | 17,135 | 831,047 |
| Global Payments, Inc. | 26,112 | 2,983,557 |
| Globant S.A. * | 3,865 | 729,248 |
| GoDaddy, Inc., Class A * | 14,851 | 1,194,020 |
| Guidewire Software, Inc. * | 7,956 | 472,666 |
| HubSpot, Inc. * | 4,322 | 1,281,732 |
| Informatica, Inc., Class A * | 3,469 | 67,160 |
| Jack Henry & Associates, Inc. | 6,888 | 1,371,125 |
| Jamf Holding Corp. * | 6,225 | 147,346 |
| Kyndryl Holdings, Inc. * | 19,109 | 184,784 |
| Manhattan Associates, Inc. * | 5,956 | 724,667 |
| MongoDB, Inc. * | 6,190 | 1,132,956 |
| nCino, Inc. * | 6,637 | 208,933 |
| NCR Corp. * | 12,058 | 256,353 |
| New Relic, Inc. * | 4,973 | 294,601 |
| NortonLifeLock, Inc. | 54,218 | 1,221,532 |
| Nutanix, Inc., Class A * | 20,287 | 555,864 |
| Okta, Inc. * | 14,159 | 794,603 |
| Palantir Technologies, Inc., Class A * | 171,693 | 1,509,181 |
| Paychex, Inc. | 30,622 | 3,622,889 |
| Paycom Software, Inc. * | 4,859 | 1,681,214 |
| Paycor HCM, Inc. * | 4,472 | 136,262 |
| Paylocity Holding Corp. * | 3,768 | 873,385 |
| Pegasystems, Inc. | 3,940 | 146,607 |
| SECURITY | NUMBER OF SHARES | VALUE ($) |
| Procore Technologies, Inc. * | 6,618 | 361,740 |
| PTC, Inc. * | 9,996 | 1,177,829 |
| RingCentral, Inc., Class A * | 8,048 | 285,865 |
| SentinelOne, Inc., Class A * | 17,525 | 400,271 |
| Shift4 Payments, Inc., Class A * | 4,808 | 221,024 |
| Smartsheet, Inc., Class A * | 11,865 | 414,326 |
| Splunk, Inc. * | 15,277 | 1,269,671 |
| SS&C Technologies Holdings, Inc. | 21,182 | 1,089,178 |
| Switch, Inc., Class A | 13,858 | 471,865 |
| Synopsys, Inc. * | 14,474 | 4,234,369 |
| Teradata Corp. * | 9,685 | 305,949 |
| The Western Union Co. | 36,599 | 494,452 |
| Thoughtworks Holding, Inc. * | 8,217 | 78,965 |
| Toast, Inc., Class A * | 23,530 | 519,778 |
| Twilio, Inc., Class A * | 16,281 | 1,210,818 |
| Tyler Technologies, Inc. * | 3,906 | 1,262,927 |
| UiPath, Inc., Class A * | 35,350 | 447,177 |
| Unity Software, Inc. * | 19,798 | 584,041 |
| VeriSign, Inc. * | 8,912 | 1,786,500 |
| WEX, Inc. * | 4,177 | 685,613 |
| Wix.com Ltd. * | 5,082 | 427,396 |
| Zendesk, Inc. * | 11,537 | 884,773 |
| Zoom Video Communications, Inc., Class A * | 23,973 | 2,000,307 |
| Zscaler, Inc. * | 7,900 | 1,217,390 |
| 81,680,156 | ||
| Technology Hardware & Equipment 4.4% | ||
| Amphenol Corp., Class A | 55,598 | 4,215,996 |
| Arista Networks, Inc. * | 23,358 | 2,823,048 |
| Arrow Electronics, Inc. * | 6,054 | 613,028 |
| Avnet, Inc. | 8,952 | 359,781 |
| CDW Corp. | 12,833 | 2,217,671 |
| Ciena Corp. * | 14,159 | 678,216 |
| Cognex Corp. | 16,492 | 762,425 |
| Coherent Corp. * | 12,088 | 406,278 |
| Corning, Inc. | 71,673 | 2,305,720 |
| Dell Technologies, Inc., Class C | 24,584 | 944,026 |
| F5, Inc. * | 5,651 | 807,584 |
| Hewlett Packard Enterprise Co. | 123,263 | 1,758,963 |
| HP, Inc. | 98,214 | 2,712,671 |
| IPG Photonics Corp. * | 3,185 | 272,827 |
| Jabil, Inc. | 12,743 | 818,738 |
| Juniper Networks, Inc. | 30,343 | 928,496 |
| Keysight Technologies, Inc. * | 17,014 | 2,962,988 |
| Littelfuse, Inc. | 2,289 | 504,152 |
| Lumentum Holdings, Inc. * | 6,529 | 486,084 |
| Motorola Solutions, Inc. | 15,630 | 3,902,967 |
| National Instruments Corp. | 12,380 | 472,668 |
| NetApp, Inc. | 20,850 | 1,444,280 |
| Pure Storage, Inc., Class A * | 26,717 | 824,487 |
| TD SYNNEX Corp. | 4,045 | 370,158 |
| Teledyne Technologies, Inc. * | 4,396 | 1,749,520 |
| Trimble, Inc. * | 23,703 | 1,425,972 |
| Ubiquiti, Inc. | 567 | 196,607 |
| ViaSat, Inc. * | 6,831 | 279,798 |
| Vontier Corp. | 14,973 | 285,984 |
| Western Digital Corp. * | 29,752 | 1,022,576 |
| Zebra Technologies Corp., Class A * | 4,898 | 1,387,212 |
| 39,940,921 | ||
| Telecommunication Services 0.1% | ||
| Frontier Communications Parent, Inc. * | 23,247 | 544,445 |
| Lumen Technologies, Inc. | 97,593 | 718,284 |
| 1,262,729 | ||
| SECURITY | NUMBER OF SHARES | VALUE ($) |
| Transportation 2.1% | ||
| Alaska Air Group, Inc. * | 11,709 | 520,582 |
| AMERCO | 854 | 491,212 |
| American Airlines Group, Inc. * | 61,332 | 869,688 |
| Avis Budget Group, Inc. * | 2,828 | 668,709 |
| C.H. Robinson Worldwide, Inc. | 11,591 | 1,132,673 |
| Copa Holdings S.A., Class A * | 2,739 | 206,055 |
| Delta Air Lines, Inc. * | 60,743 | 2,061,010 |
| Expeditors International of Washington, Inc. | 15,479 | 1,514,620 |
| GXO Logistics, Inc. * | 10,050 | 367,227 |
| Hertz Global Holdings, Inc. * | 19,390 | 356,776 |
| JB Hunt Transport Services, Inc. | 7,916 | 1,354,190 |
| JetBlue Airways Corp. * | 30,519 | 245,373 |
| Kirby Corp. * | 5,648 | 393,948 |
| Knight-Swift Transportation Holdings, Inc. | 14,815 | 711,564 |
| Landstar System, Inc. | 3,430 | 535,835 |
| Lyft, Inc., Class A * | 29,441 | 431,016 |
| Old Dominion Freight Line, Inc. | 9,539 | 2,619,409 |
| Ryder System, Inc. | 4,677 | 376,545 |
| Schneider National, Inc., Class B | 5,090 | 113,202 |
| Southwest Airlines Co. * | 56,203 | 2,042,979 |
| United Airlines Holdings, Inc. * | 30,951 | 1,333,369 |
| XPO Logistics, Inc. * | 9,743 | 504,103 |
| 18,850,085 | ||
| Utilities 5.6% | ||
| Alliant Energy Corp. | 23,792 | 1,241,229 |
| Ameren Corp. | 24,437 | 1,992,104 |
| American Water Works Co., Inc. | 17,271 | 2,510,167 |
| Atmos Energy Corp. | 13,093 | 1,395,059 |
| Avangrid, Inc. | 6,694 | 272,312 |
| Brookfield Renewable Corp., Class A | 12,122 | 376,146 |
| CenterPoint Energy, Inc. | 59,801 | 1,710,907 |
| CMS Energy Corp. | 27,488 | 1,568,190 |
| Consolidated Edison, Inc. | 33,686 | 2,963,021 |
| Constellation Energy Corp. | 30,998 | 2,930,551 |
| DTE Energy Co. | 18,313 | 2,053,070 |
| Edison International | 35,690 | 2,142,828 |
| Entergy Corp. | 19,269 | 2,064,481 |
| Essential Utilities, Inc. | 21,959 | 971,027 |
| Evergy, Inc. | 21,099 | 1,289,782 |
| Eversource Energy | 32,714 | 2,495,424 |
| FirstEnergy Corp. | 51,546 | 1,943,800 |
| Hawaiian Electric Industries, Inc. | 10,347 | 393,600 |
| IDACORP, Inc. | 4,765 | 498,895 |
| National Fuel Gas Co. | 8,316 | 561,247 |
| NiSource, Inc. | 38,559 | 990,581 |
| NRG Energy, Inc. | 22,393 | 994,249 |
| OGE Energy Corp. | 18,966 | 694,725 |
| PG&E Corp. * | 147,242 | 2,198,323 |
| Pinnacle West Capital Corp. | 10,726 | 720,894 |
| PPL Corp. | 69,950 | 1,852,975 |
| Public Service Enterprise Group, Inc. | 47,271 | 2,650,485 |
| The AES Corp. | 63,323 | 1,656,530 |
| UGI Corp. | 19,874 | 702,148 |
| Vistra Corp. | 39,019 | 896,266 |
| WEC Energy Group, Inc. | 29,961 | 2,736,338 |
| Xcel Energy, Inc. | 51,771 | 3,370,810 |
| 50,838,164 | ||
| Total Common Stocks (Cost $821,431,306) | 893,523,191 | |
| SECURITY | NUMBER OF SHARES | VALUE ($) |
| INVESTMENT COMPANIES 0.1% OF NET ASSETS | ||
| Equity Funds 0.1% | ||
| iShares Russell Mid-Cap ETF | 12,700 | 858,647 |
| Total Investment Companies (Cost $807,601) | 858,647 | |
| SHORT-TERM INVESTMENTS 0.8% OF NET ASSETS | ||
| Money Market Funds 0.8% | ||
| State Street Institutional U.S. Government Money Market Fund, Premier Class 3.01% (b) | 3,134,420 | 3,134,420 |
| State Street Institutional U.S. Government Money Market Fund, Premier Class 3.01% (b)(c) | 3,709,990 | 3,709,990 |
| 6,844,410 | ||
| Total Short-Term Investments (Cost $6,844,410) | 6,844,410 | |
| Total Investments in Securities (Cost $829,083,317) | 901,226,248 | |
| NUMBER OF CONTRACTS | NOTIONAL AMOUNT ($) | CURRENT VALUE/ UNREALIZED APPRECIATION ($) | |
| FUTURES CONTRACTS | |||
| Long | |||
| S&P 400 Mid-Cap Index, e-mini, expires 12/16/22 | 36 | 8,782,560 | 205,754 |
| * | Non-income producing security. |
| (a) | All or a portion of this security is on loan. Securities on loan were valued at $3,617,681. |
| (b) | The rate shown is the annualized 7-day yield. |
| (c) | Security purchased with cash collateral received for securities on loan. |
| ETF — | Exchange traded fund |
| REIT — | Real Estate Investment Trust |
| DESCRIPTION | QUOTED PRICES IN ACTIVE MARKETS FOR IDENTICAL ASSETS (LEVEL 1) | OTHER SIGNIFICANT OBSERVABLE INPUTS (LEVEL 2) | SIGNIFICANT UNOBSERVABLE INPUTS (LEVEL 3) | TOTAL |
| Assets | ||||
| Common Stocks1 | $893,523,191 | $— | $— | $893,523,191 |
| Investment Companies1 | 858,647 | — | — | 858,647 |
| Short-Term Investments1 | 6,844,410 | — | — | 6,844,410 |
| Futures Contracts2 | 205,754 | — | — | 205,754 |
| Total | $901,432,002 | $— | $— | $901,432,002 |
| 1 | As categorized in the Portfolio Holdings. |
| 2 | Futures contracts are reported at cumulative unrealized appreciation or depreciation. |
| Assets | ||
| Investments in securities, at value - unaffiliated (cost $829,083,317) including securities on loan of $3,617,681 | $901,226,248 | |
| Cash | 3,838,173 | |
| Deposit with broker for futures contracts | 432,000 | |
| Receivables: | ||
| Fund shares sold | 1,518,788 | |
| Dividends | 474,930 | |
| Investments sold | 148,722 | |
| Income from securities on loan | + | 16,907 |
| Total assets | 907,655,768 | |
| Liabilities | ||
| Collateral held for securities on loan | 3,709,990 | |
| Payables: | ||
| Fund shares redeemed | 610,528 | |
| Investment adviser fees | 27,302 | |
| Variation margin on futures contracts | + | 4,915 |
| Total liabilities | 4,352,735 | |
| Net assets | $903,303,033 | |
| Net Assets by Source | ||
| Capital received from investors | $846,432,597 | |
| Total distributable earnings | + | 56,870,436 |
| Net assets | $903,303,033 | |
| Net Asset Value (NAV) | ||||
| Net Assets | ÷ | Shares Outstanding | = | NAV |
| $903,303,033 | 17,423,547 | $51.84 | ||
| For the period November 1, 2021 through October 31, 2022 | ||
| Investment Income | ||
| Dividends received from securities - unaffiliated (net of foreign withholding tax of $4,217) | $12,898,234 | |
| Securities on loan, net | + | 151,822 |
| Total investment income | 13,050,056 | |
| Expenses | ||
| Investment adviser fees | 358,330 | |
| Proxy fees1 | + | 40,371 |
| Total expenses | – | 398,701 |
| Net investment income | 12,651,355 | |
| REALIZED AND UNREALIZED GAINS (LOSSES) | ||
| Net realized losses on sales of securities - unaffiliated | (10,054,896) | |
| Net realized gains on sales of in-kind redemptions - unaffiliated | 10,883,121 | |
| Net realized losses on futures contracts | + | (840,379) |
| Net realized losses | (12,154) | |
| Net change in unrealized appreciation (depreciation) on securities - unaffiliated | (182,868,180) | |
| Net change in unrealized appreciation (depreciation) on futures contracts | + | 205,753 |
| Net change in unrealized appreciation (depreciation) | + | (182,662,427) |
| Net realized and unrealized losses | (182,674,581) | |
| Decrease in net assets resulting from operations | ($170,023,226) | |
| 1 | Proxy fees are non-routine expenses (see financial note 2(e) for additional information). |
| OPERATIONS | |||
| 11/1/21-10/31/22 | 11/1/20-10/31/21 | ||
| Net investment income | $12,651,355 | $8,467,009 | |
| Net realized gains (losses) | (12,154) | 17,872,949 | |
| Net change in unrealized appreciation (depreciation) | + | (182,662,427) | 208,470,779 |
| Increase (decrease) in net assets resulting from operations | ($170,023,226) | $234,810,737 | |
| DISTRIBUTIONS TO SHAREHOLDERS | |||
| Total distributions | ($26,457,808) | ($8,319,433) | |
| TRANSACTIONS IN FUND SHARES | |||||
| 11/1/21-10/31/22 | 11/1/20-10/31/21 | ||||
| SHARES | VALUE | SHARES | VALUE | ||
| Shares sold | 6,524,271 | $369,067,984 | 5,533,289 | $322,845,672 | |
| Shares reinvested | 355,335 | 21,909,932 | 134,151 | 7,065,741 | |
| Shares redeemed | + | (3,277,725) | (181,890,798) | (2,583,256) | (148,682,619) |
| Net transactions in fund shares | 3,601,881 | $209,087,118 | 3,084,184 | $181,228,794 | |
| SHARES OUTSTANDING AND NET ASSETS | |||||
| 11/1/21-10/31/22 | 11/1/20-10/31/21 | ||||
| SHARES | NET ASSETS | SHARES | NET ASSETS | ||
| Beginning of period | 13,821,666 | $890,696,949 | 10,737,482 | $482,976,851 | |
| Total increase | + | 3,601,881 | 12,606,084 | 3,084,184 | 407,720,098 |
| End of period | 17,423,547 | $903,303,033 | 13,821,666 | $890,696,949 | |
| 11/1/21– 10/31/22 | 11/1/20– 10/31/21 | 11/1/19– 10/31/20 | 11/1/18– 10/31/19 | 11/1/17– 10/31/18 | ||
| Per-Share Data | ||||||
| Net asset value at beginning of period | $24.45 | $18.56 | $20.48 | $19.00 | $21.01 | |
| Income (loss) from investment operations: | ||||||
| Net investment income (loss)1 | 0.65 | 0.64 | 0.47 | 0.64 | 0.62 | |
| Net realized and unrealized gains (losses) | (6.14) | 5.66 | (1.75) | 1.39 | (2.06) | |
| Total from investment operations | (5.49) | 6.30 | (1.28) | 2.03 | (1.44) | |
| Less distributions: | ||||||
| Distributions from net investment income | (0.79) | (0.41) | (0.64) | (0.55) | (0.57) | |
| Net asset value at end of period | $18.17 | $24.45 | $18.56 | $20.48 | $19.00 | |
| Total return | (23.12%) | 34.24% | (6.56%) | 11.27% | (7.11%) | |
| Ratios/Supplemental Data | ||||||
| Ratios to average net assets: | ||||||
| Total expenses | 0.06% 2 | 0.06% | 0.06% | 0.06% | 0.06% | |
| Net investment income (loss) | 3.12% | 2.76% | 2.47% | 3.32% | 2.99% | |
| Portfolio turnover rate | 5% | 3% | 7% | 5% | 5% | |
| Net assets, end of period (x 1,000,000) | $7,127 | $8,781 | $5,937 | $5,443 | $4,314 | |
| 1 | Calculated based on the average shares outstanding during the period. |
| 2 | Ratio includes less than 0.005% of non-routine proxy expenses. |
| SECURITY | NUMBER OF SHARES | VALUE ($) |
| COMMON STOCKS 98.9% OF NET ASSETS | ||
| Australia 8.0% | ||
| Ampol Ltd. | 131,702 | 2,297,121 |
| APA Group | 641,504 | 4,318,854 |
| Aristocrat Leisure Ltd. | 333,128 | 7,907,106 |
| ASX Ltd. | 106,960 | 4,634,413 |
| Aurizon Holdings Ltd. | 1,026,246 | 2,378,188 |
| Australia & New Zealand Banking Group Ltd. | 1,639,871 | 26,867,217 |
| BHP Group Ltd. | 2,786,149 | 66,923,865 |
| BlueScope Steel Ltd. | 269,571 | 2,714,573 |
| Brambles Ltd. | 795,373 | 5,954,746 |
| Cochlear Ltd. | 36,102 | 4,611,800 |
| Coles Group Ltd. | 731,305 | 7,646,275 |
| Commonwealth Bank of Australia | 939,056 | 62,960,648 |
| Computershare Ltd. | 296,274 | 4,796,095 |
| CSL Ltd. | 265,041 | 47,446,422 |
| Dexus | 596,704 | 2,973,437 |
| Domino's Pizza Enterprises Ltd. | 34,554 | 1,408,893 |
| Endeavour Group Ltd. | 748,673 | 3,426,902 |
| Evolution Mining Ltd. | 1,007,495 | 1,336,492 |
| Fortescue Metals Group Ltd. | 927,963 | 8,742,341 |
| Goodman Group | 924,275 | 10,056,763 |
| IDP Education Ltd. | 115,772 | 2,184,246 |
| Insurance Australia Group Ltd. | 1,354,263 | 4,250,945 |
| James Hardie Industries plc | 243,697 | 5,320,632 |
| Lendlease Corp., Ltd. | 373,987 | 2,079,652 |
| Macquarie Group Ltd. | 200,226 | 21,721,076 |
| Medibank Pvt Ltd. | 1,536,064 | 2,765,941 |
| Mineral Resources Ltd. * | 93,374 | 4,377,539 |
| Mirvac Group | 2,135,777 | 2,829,830 |
| National Australia Bank Ltd. | 1,766,656 | 36,697,053 |
| Newcrest Mining Ltd. | 494,120 | 5,472,515 |
| Northern Star Resources Ltd. | 649,434 | 3,624,555 |
| Orica Ltd. | 248,946 | 2,214,434 |
| Origin Energy Ltd. | 980,978 | 3,504,619 |
| Qantas Airways Ltd. * | 502,682 | 1,878,405 |
| QBE Insurance Group Ltd. | 813,559 | 6,374,203 |
| Ramsay Health Care Ltd. | 101,069 | 3,791,012 |
| REA Group Ltd. | 29,206 | 2,263,636 |
| Reece Ltd. | 129,087 | 1,281,817 |
| Rio Tinto Ltd. | 204,336 | 11,595,985 |
| Santos Ltd. | 1,763,257 | 8,607,615 |
| Scentre Group | 2,838,495 | 5,282,498 |
| SEEK Ltd. | 189,236 | 2,604,997 |
| Sonic Healthcare Ltd. | 252,123 | 5,278,317 |
| South32 Ltd. | 2,535,554 | 5,817,240 |
| Stockland | 1,296,282 | 2,986,761 |
| Suncorp Group Ltd. | 699,610 | 5,117,654 |
| Telstra Group Ltd. | 2,250,199 | 5,642,212 |
| The GPT Group | 1,061,761 | 2,934,246 |
| The Lottery Corp., Ltd. * | 1,229,691 | 3,373,495 |
| Transurban Group | 1,686,565 | 14,307,040 |
| Treasury Wine Estates Ltd. | 392,088 | 3,249,144 |
| Vicinity Ltd. | 2,129,427 | 2,654,678 |
| SECURITY | NUMBER OF SHARES | VALUE ($) |
| Washington H Soul Pattinson & Co., Ltd. | 117,853 | 2,109,104 |
| Wesfarmers Ltd. | 623,373 | 18,089,675 |
| Westpac Banking Corp. | 1,926,745 | 29,750,794 |
| WiseTech Global Ltd. | 79,553 | 2,942,108 |
| Woodside Energy Group Ltd. | 1,044,892 | 24,156,281 |
| Woolworths Group Ltd. | 667,940 | 14,105,409 |
| Xero Ltd. * | 74,906 | 3,719,733 |
| 566,359,247 | ||
| Austria 0.2% | ||
| Erste Group Bank AG | 191,173 | 4,711,446 |
| OMV AG | 80,765 | 3,718,690 |
| Verbund AG | 37,526 | 2,939,593 |
| Voestalpine AG | 64,382 | 1,397,751 |
| 12,767,480 | ||
| Belgium 1.0% | ||
| Ageas S.A./N.V. | 89,235 | 3,089,153 |
| Anheuser-Busch InBev S.A./N.V. | 478,128 | 23,916,147 |
| Argenx SE * | 30,283 | 11,757,386 |
| D'ieteren Group | 13,714 | 2,282,394 |
| Elia Group S.A./N.V. | 18,191 | 2,299,930 |
| Groupe Bruxelles Lambert N.V. | 54,704 | 4,033,128 |
| KBC Group N.V. | 136,757 | 6,853,677 |
| Proximus SADP | 82,234 | 862,119 |
| Sofina S.A. | 8,344 | 1,627,070 |
| Solvay S.A. | 40,432 | 3,648,618 |
| UCB S.A. | 70,116 | 5,284,487 |
| Umicore S.A. | 114,431 | 3,772,322 |
| Warehouses De Pauw CVA | 81,156 | 2,082,943 |
| 71,509,374 | ||
| Denmark 2.7% | ||
| AP Moller - Maersk A/S, Class A | 1,693 | 3,387,159 |
| AP Moller - Maersk A/S, Class B | 2,767 | 5,780,736 |
| Carlsberg A/S, Class B | 53,545 | 6,304,688 |
| Chr. Hansen Holding A/S | 58,758 | 3,263,480 |
| Coloplast A/S, Class B | 65,008 | 7,246,452 |
| Danske Bank A/S | 376,681 | 6,076,235 |
| Demant A/S * | 49,414 | 1,349,361 |
| DSV A/S | 103,243 | 13,951,045 |
| Genmab A/S * | 36,202 | 13,945,284 |
| GN Store Nord A/S | 69,369 | 1,474,183 |
| Novo Nordisk A/S, Class B | 911,238 | 99,080,046 |
| Novozymes A/S, B Shares | 113,484 | 5,956,838 |
| Orsted A/S | 103,553 | 8,543,718 |
| Pandora A/S | 49,742 | 2,616,602 |
| Rockwool A/S, Class B | 4,990 | 993,779 |
| Tryg A/S | 197,574 | 4,273,374 |
| Vestas Wind Systems A/S | 555,868 | 10,958,195 |
| 195,201,175 | ||
| SECURITY | NUMBER OF SHARES | VALUE ($) |
| Finland 1.0% | ||
| Elisa Oyj | 78,231 | 3,780,615 |
| Fortum Oyj | 243,537 | 3,427,608 |
| Kesko Oyj, B Shares | 149,674 | 2,912,754 |
| Kone Oyj, B Shares | 187,788 | 7,689,127 |
| Neste Oyj | 233,932 | 10,252,878 |
| Nokia Oyj | 2,976,739 | 13,228,369 |
| Orion Oyj, B Shares | 58,978 | 2,714,062 |
| Sampo Oyj, A Shares | 263,659 | 12,056,529 |
| Stora Enso Oyj, R Shares | 302,207 | 3,940,419 |
| UPM-Kymmene Oyj | 294,081 | 9,886,251 |
| Wartsila Oyj Abp | 261,929 | 1,785,641 |
| 71,674,253 | ||
| France 11.7% | ||
| Accor S.A. * | 92,172 | 2,208,575 |
| Aeroports de Paris * | 16,156 | 2,184,786 |
| Air Liquide S.A. | 287,916 | 37,663,353 |
| Airbus SE | 325,266 | 35,194,988 |
| Alstom S.A. | 174,069 | 3,582,553 |
| Amundi S.A. | 34,659 | 1,635,208 |
| ArcelorMittal S.A. | 291,644 | 6,519,307 |
| Arkema S.A. | 32,536 | 2,574,835 |
| AXA S.A. | 1,028,672 | 25,402,929 |
| BioMerieux | 23,030 | 2,037,660 |
| BNP Paribas S.A. | 611,506 | 28,675,888 |
| Bollore SE | 489,428 | 2,447,894 |
| Bouygues S.A. | 126,565 | 3,611,045 |
| Bureau Veritas S.A. | 160,578 | 3,972,742 |
| Capgemini SE | 90,094 | 14,765,569 |
| Carrefour S.A. | 333,178 | 5,362,649 |
| Cie de Saint-Gobain | 274,005 | 11,201,579 |
| Cie Generale des Etablissements Michelin S.C.A. | 373,270 | 9,512,431 |
| Covivio | 25,895 | 1,386,458 |
| Credit Agricole S.A. | 665,555 | 6,039,019 |
| Danone S.A. | 353,577 | 17,572,596 |
| Dassault Aviation S.A. | 13,812 | 2,051,335 |
| Dassault Systemes SE | 366,024 | 12,268,673 |
| Edenred | 136,865 | 7,016,544 |
| Eiffage S.A. | 45,217 | 4,088,601 |
| Electricite de France S.A. | 304,484 | 3,595,941 |
| Engie S.A. | 1,002,736 | 13,028,902 |
| EssilorLuxottica S.A. | 158,378 | 25,044,020 |
| Eurazeo SE | 23,599 | 1,346,687 |
| Eurofins Scientific SE | 73,566 | 4,709,311 |
| Euronext N.V. | 47,826 | 3,035,461 |
| Gecina S.A. | 25,368 | 2,261,660 |
| Getlink SE | 244,251 | 3,865,146 |
| Hermes International | 17,431 | 22,562,426 |
| Ipsen S.A. | 21,138 | 2,172,306 |
| Kering S.A. | 41,163 | 18,851,043 |
| Klepierre S.A. * | 119,571 | 2,403,168 |
| La Francaise des Jeux SAEM | 56,889 | 1,853,931 |
| Legrand S.A. | 147,081 | 11,208,251 |
| L'Oreal S.A. | 132,779 | 41,693,160 |
| LVMH Moet Hennessy Louis Vuitton SE | 152,826 | 96,432,378 |
| Orange S.A. | 1,099,169 | 10,472,786 |
| Pernod-Ricard S.A. | 115,276 | 20,232,226 |
| Publicis Groupe S.A. | 126,208 | 7,068,200 |
| Remy Cointreau S.A. | 12,675 | 1,938,487 |
| Renault S.A. * | 105,905 | 3,260,731 |
| Safran S.A. | 188,088 | 20,947,339 |
| Sanofi | 626,637 | 53,926,998 |
| Sartorius Stedim Biotech | 15,158 | 4,810,222 |
| SECURITY | NUMBER OF SHARES | VALUE ($) |
| Schneider Electric SE | 298,559 | 37,754,668 |
| SEB S.A. | 13,670 | 889,938 |
| Societe Generale S.A. | 437,732 | 10,040,268 |
| Sodexo S.A. | 48,742 | 4,317,678 |
| STMicroelectronics N.V. | 375,917 | 11,688,740 |
| Teleperformance | 32,514 | 8,711,471 |
| Thales S.A. | 58,550 | 7,446,383 |
| TotalEnergies SE | 1,364,548 | 74,440,666 |
| UbiSoft Entertainment S.A. * | 53,429 | 1,465,873 |
| Unibail-Rodamco-Westfield * | 64,132 | 3,030,851 |
| Valeo S.A. | 113,893 | 1,876,156 |
| Veolia Environnement S.A. | 366,145 | 8,170,896 |
| Vinci S.A. | 294,055 | 27,063,924 |
| Vivendi SE | 394,918 | 3,232,393 |
| Wendel SE | 15,141 | 1,185,569 |
| Worldline S.A. * | 132,115 | 5,766,351 |
| 832,779,822 | ||
| Germany 7.4% | ||
| adidas AG | 95,015 | 9,274,895 |
| Allianz SE | 224,959 | 40,471,120 |
| Aroundtown S.A. | 540,841 | 1,072,079 |
| BASF SE | 505,480 | 22,681,210 |
| Bayer AG | 540,639 | 28,427,354 |
| Bayerische Motoren Werke AG | 183,311 | 14,388,422 |
| Bechtle AG | 44,092 | 1,523,226 |
| Beiersdorf AG | 55,260 | 5,304,694 |
| Brenntag SE | 85,126 | 5,165,130 |
| Carl Zeiss Meditec AG, Class B | 22,334 | 2,703,378 |
| Commerzbank AG * | 586,058 | 4,682,427 |
| Continental AG | 60,491 | 3,133,171 |
| Covestro AG | 105,674 | 3,587,211 |
| Daimler Truck Holding AG * | 250,340 | 6,677,213 |
| Delivery Hero SE * | 90,433 | 2,976,050 |
| Deutsche Bank AG | 1,135,271 | 10,821,111 |
| Deutsche Boerse AG | 104,607 | 17,011,152 |
| Deutsche Lufthansa AG * | 319,143 | 2,181,982 |
| Deutsche Post AG | 545,667 | 19,289,211 |
| Deutsche Telekom AG | 1,785,790 | 33,707,653 |
| E.ON SE | 1,232,526 | 10,321,152 |
| Evonik Industries AG | 115,176 | 2,121,739 |
| Fresenius Medical Care AG & Co. KGaA | 113,335 | 3,134,911 |
| Fresenius SE & Co. KGaA | 231,995 | 5,338,933 |
| GEA Group AG | 82,635 | 2,888,460 |
| Hannover Rueck SE | 33,323 | 5,422,451 |
| HeidelbergCement AG | 78,950 | 3,630,656 |
| HelloFresh SE * | 91,544 | 1,829,888 |
| Henkel AG & Co. KGaA | 57,574 | 3,379,887 |
| Infineon Technologies AG | 718,761 | 17,441,070 |
| KION Group AG | 40,047 | 887,853 |
| Knorr-Bremse AG | 40,883 | 1,840,583 |
| LEG Immobilien SE | 40,878 | 2,668,727 |
| Mercedes-Benz Group AG | 441,775 | 25,570,622 |
| Merck KGaA | 70,887 | 11,552,100 |
| MTU Aero Engines AG | 29,666 | 5,308,973 |
| Muenchener Rueckversicherungs-Gesellschaft AG in Muenchen | 77,136 | 20,362,033 |
| Nemetschek SE | 32,037 | 1,527,427 |
| Puma SE | 58,657 | 2,593,275 |
| QIAGEN N.V. * | 124,507 | 5,376,604 |
| Rational AG | 2,766 | 1,559,195 |
| Rheinmetall AG | 23,699 | 3,852,311 |
| RWE AG | 353,248 | 13,598,329 |
| SAP SE | 574,787 | 55,324,836 |
| Scout24 SE | 43,264 | 2,217,062 |
| SECURITY | NUMBER OF SHARES | VALUE ($) |
| Siemens AG | 421,067 | 45,984,289 |
| Siemens Energy AG | 236,626 | 2,758,495 |
| Siemens Healthineers AG | 154,572 | 7,081,336 |
| Symrise AG | 72,615 | 7,411,994 |
| Telefonica Deutschland Holding AG | 585,979 | 1,276,789 |
| Uniper SE | 56,105 | 167,947 |
| United Internet AG | 52,224 | 976,227 |
| Volkswagen AG | 16,677 | 2,850,630 |
| Vonovia SE | 393,741 | 8,705,852 |
| Zalando SE * | 123,167 | 2,838,773 |
| 524,880,098 | ||
| Hong Kong 2.5% | ||
| AIA Group Ltd. | 6,626,800 | 50,196,620 |
| BOC Hong Kong Holdings Ltd. | 2,023,590 | 6,287,913 |
| Budweiser Brewing Co. APAC Ltd. | 951,000 | 2,001,591 |
| Chow Tai Fook Jewellery Group Ltd. | 1,082,200 | 1,852,808 |
| CK Asset Holdings Ltd. | 1,100,711 | 6,085,354 |
| CK Hutchison Holdings Ltd. | 1,480,025 | 7,367,312 |
| CK Infrastructure Holdings Ltd. | 349,000 | 1,658,002 |
| CLP Holdings Ltd. | 907,426 | 6,090,464 |
| ESR Group Ltd. | 1,086,734 | 1,853,263 |
| Futu Holdings Ltd., ADR * | 32,880 | 1,113,317 |
| Galaxy Entertainment Group Ltd. | 1,207,000 | 5,514,359 |
| Hang Lung Properties Ltd. | 1,124,000 | 1,413,950 |
| Hang Seng Bank Ltd. | 420,440 | 5,918,861 |
| Henderson Land Development Co., Ltd. | 808,735 | 1,979,993 |
| HK Electric Investments & HK Electric Investments Ltd. | 1,470,104 | 934,712 |
| HKT Trust & HKT Ltd. | 2,047,000 | 2,315,042 |
| Hong Kong & China Gas Co., Ltd. | 6,090,696 | 4,694,520 |
| Hong Kong Exchanges & Clearing Ltd. | 661,865 | 17,568,278 |
| Hongkong Land Holdings Ltd. | 627,101 | 2,414,266 |
| Jardine Matheson Holdings Ltd. | 86,717 | 3,994,879 |
| Link REIT | 1,159,500 | 6,853,355 |
| MTR Corp., Ltd. | 842,552 | 3,707,388 |
| New World Development Co., Ltd. | 824,778 | 1,687,062 |
| Power Assets Holdings Ltd. | 771,438 | 3,688,668 |
| Sands China Ltd. * | 1,353,600 | 2,366,396 |
| Sino Land Co., Ltd. | 1,919,806 | 2,049,999 |
| SITC International Holdings Co., Ltd. | 769,000 | 1,259,466 |
| Sun Hung Kai Properties Ltd. | 797,104 | 8,565,932 |
| Swire Pacific Ltd., A Shares | 277,090 | 1,838,079 |
| Swire Properties Ltd. | 620,400 | 1,192,355 |
| Techtronic Industries Co., Ltd. | 760,000 | 7,196,263 |
| WH Group Ltd. | 4,659,789 | 2,353,245 |
| Wharf Real Estate Investment Co., Ltd. | 930,188 | 3,664,996 |
| Xinyi Glass Holdings Ltd. | 973,000 | 1,250,456 |
| 178,929,164 | ||
| Ireland 0.6% | ||
| CRH plc | 420,378 | 15,141,100 |
| Flutter Entertainment plc * | 91,648 | 12,103,883 |
| Kerry Group plc, Class A | 88,085 | 7,650,608 |
| Kingspan Group plc | 84,429 | 4,256,631 |
| Smurfit Kappa Group plc | 135,940 | 4,500,014 |
| 43,652,236 | ||
| Israel 0.9% | ||
| Azrieli Group Ltd. | 23,908 | 1,771,235 |
| Bank Hapoalim B.M. | 700,987 | 6,756,992 |
| Bank Leumi Le-Israel B.M. | 848,395 | 8,093,471 |
| Bezeq The Israeli Telecommunication Corp., Ltd. | 1,132,512 | 2,004,813 |
| SECURITY | NUMBER OF SHARES | VALUE ($) |
| Check Point Software Technologies Ltd. * | 56,707 | 7,328,246 |
| CyberArk Software Ltd. * | 22,219 | 3,486,383 |
| Elbit Systems Ltd. | 14,680 | 2,970,282 |
| ICL Group Ltd. | 390,867 | 3,524,682 |
| Israel Discount Bank Ltd., A Shares | 689,239 | 3,919,073 |
| Mizrahi Tefahot Bank Ltd. | 83,673 | 3,162,969 |
| Nice Ltd. * | 34,759 | 6,551,001 |
| Teva Pharmaceutical Industries Ltd. ADR, ADR * | 614,682 | 5,482,963 |
| Tower Semiconductor Ltd. * | 59,552 | 2,545,004 |
| Wix.com Ltd. * | 31,152 | 2,619,883 |
| ZIM Integrated Shipping Services Ltd. | 45,426 | 1,067,057 |
| 61,284,054 | ||
| Italy 2.4% | ||
| Amplifon S.p.A. | 66,849 | 1,660,793 |
| Assicurazioni Generali S.p.A. | 612,868 | 9,197,371 |
| Atlantia S.p.A. | 271,050 | 6,046,452 |
| CNH Industrial N.V. | 562,218 | 7,273,458 |
| Davide Campari-Milano N.V. | 285,422 | 2,563,181 |
| DiaSorin S.p.A. | 13,779 | 1,801,406 |
| Enel S.p.A. | 4,474,238 | 19,987,975 |
| Eni S.p.A. | 1,390,243 | 18,259,060 |
| Ferrari N.V. | 69,407 | 13,682,776 |
| FinecoBank Banca Fineco S.p.A. | 335,794 | 4,525,021 |
| Infrastrutture Wireless Italiane S.p.A. | 191,722 | 1,692,170 |
| Intesa Sanpaolo S.p.A. | 9,091,774 | 17,333,716 |
| Mediobanca Banca di Credito Finanziario S.p.A. | 332,086 | 3,008,561 |
| Moncler S.p.A. | 113,654 | 4,903,511 |
| Nexi S.p.A. * | 289,875 | 2,506,109 |
| Poste Italiane S.p.A. | 284,999 | 2,483,556 |
| Prysmian S.p.A. | 139,480 | 4,539,810 |
| Recordati Industria Chimica e Farmaceutica S.p.A. | 58,915 | 2,213,524 |
| Snam S.p.A. | 1,100,504 | 4,893,402 |
| Stellantis N.V. | 1,210,972 | 16,337,909 |
| Telecom Italia S.p.A. * | 5,333,218 | 1,043,400 |
| Tenaris S.A. | 257,960 | 4,037,369 |
| Terna - Rete Elettrica Nazionale | 777,675 | 5,157,280 |
| UniCredit S.p.A. | 1,142,011 | 14,162,380 |
| 169,310,190 | ||
| Japan 21.9% | ||
| Advantest Corp. | 103,898 | 5,469,354 |
| Aeon Co., Ltd. | 359,700 | 6,708,615 |
| AGC, Inc. | 106,493 | 3,336,953 |
| Aisin Corp. | 82,000 | 2,104,918 |
| Ajinomoto Co., Inc. | 250,000 | 6,875,802 |
| ANA Holdings, Inc. * | 87,500 | 1,700,887 |
| Asahi Group Holdings Ltd. | 252,000 | 7,051,143 |
| Asahi Intecc Co., Ltd. | 120,900 | 2,059,548 |
| Asahi Kasei Corp. | 684,600 | 4,389,596 |
| Astellas Pharma, Inc. | 1,008,450 | 13,914,776 |
| Azbil Corp. | 62,600 | 1,701,197 |
| Bandai Namco Holdings, Inc. | 109,800 | 7,258,095 |
| Bridgestone Corp. | 315,657 | 11,416,192 |
| Brother Industries Ltd. | 132,400 | 2,255,554 |
| Canon, Inc. | 550,395 | 11,666,987 |
| Capcom Co., Ltd. | 97,000 | 2,698,050 |
| Central Japan Railway Co. | 79,600 | 9,215,806 |
| Chubu Electric Power Co., Inc. | 355,900 | 2,896,998 |
| Chugai Pharmaceutical Co., Ltd. | 371,500 | 8,608,345 |
| Concordia Financial Group Ltd. | 591,500 | 1,804,797 |
| CyberAgent, Inc. | 236,200 | 1,940,425 |
| SECURITY | NUMBER OF SHARES | VALUE ($) |
| Dai Nippon Printing Co., Ltd. | 122,548 | 2,454,725 |
| Daifuku Co., Ltd. | 56,630 | 2,592,234 |
| Dai-ichi Life Holdings, Inc. | 538,300 | 8,549,681 |
| Daiichi Sankyo Co., Ltd. | 964,100 | 30,861,574 |
| Daikin Industries Ltd. | 137,100 | 20,535,823 |
| Daito Trust Construction Co., Ltd. | 34,600 | 3,426,223 |
| Daiwa House Industry Co., Ltd. | 330,800 | 6,664,737 |
| Daiwa House REIT Investment Corp. | 1,201 | 2,423,972 |
| Daiwa Securities Group, Inc. | 743,300 | 2,900,112 |
| Denso Corp. | 238,200 | 11,818,508 |
| Dentsu Group, Inc. | 118,200 | 3,676,417 |
| Disco Corp. | 16,000 | 3,826,888 |
| East Japan Railway Co. | 166,160 | 8,853,896 |
| Eisai Co., Ltd. | 138,600 | 8,358,016 |
| ENEOS Holdings, Inc. | 1,703,100 | 5,617,940 |
| FANUC Corp. | 105,500 | 13,804,846 |
| Fast Retailing Co., Ltd. | 32,100 | 17,884,231 |
| Fuji Electric Co., Ltd. | 70,900 | 2,741,346 |
| FUJIFILM Holdings Corp. | 198,911 | 9,100,153 |
| Fujitsu Ltd. | 108,100 | 12,437,827 |
| GLP J-REIT | 2,362 | 2,449,588 |
| GMO Payment Gateway, Inc. | 23,400 | 1,682,596 |
| Hakuhodo DY Holdings, Inc. | 125,400 | 1,056,589 |
| Hamamatsu Photonics K.K. | 76,300 | 3,451,910 |
| Hankyu Hanshin Holdings, Inc. | 126,600 | 3,760,113 |
| Hikari Tsushin, Inc. | 10,993 | 1,327,892 |
| Hirose Electric Co., Ltd. | 16,664 | 2,161,676 |
| Hitachi Construction Machinery Co., Ltd. | 59,353 | 1,161,183 |
| Hitachi Ltd. | 532,615 | 24,166,771 |
| Honda Motor Co., Ltd. | 897,239 | 20,459,269 |
| Hoshizaki Corp. | 60,400 | 1,730,458 |
| Hoya Corp. | 201,107 | 18,695,175 |
| Hulic Co., Ltd. | 210,700 | 1,530,597 |
| Ibiden Co., Ltd. | 61,500 | 2,073,002 |
| Idemitsu Kosan Co., Ltd. | 115,703 | 2,531,608 |
| Iida Group Holdings Co., Ltd. | 81,700 | 1,134,434 |
| Inpex Corp. | 569,000 | 5,742,573 |
| Isuzu Motors Ltd. | 316,300 | 3,719,580 |
| Ito En Ltd. | 30,600 | 1,077,742 |
| ITOCHU Corp. | 654,400 | 16,912,664 |
| Itochu Techno-Solutions Corp. | 51,087 | 1,184,387 |
| Japan Airlines Co., Ltd. * | 81,200 | 1,516,664 |
| Japan Exchange Group, Inc. | 279,400 | 3,671,814 |
| Japan Metropolitan Fund Invest | 3,872 | 2,852,616 |
| Japan Post Bank Co., Ltd. | 233,500 | 1,555,841 |
| Japan Post Holdings Co., Ltd. | 1,307,600 | 8,793,056 |
| Japan Post Insurance Co., Ltd. | 109,100 | 1,615,024 |
| Japan Real Estate Investment Corp. | 675 | 2,828,444 |
| Japan Tobacco, Inc. | 660,100 | 11,054,977 |
| JFE Holdings, Inc. | 268,000 | 2,455,179 |
| JSR Corp. | 99,200 | 1,884,901 |
| Kajima Corp. | 231,200 | 2,176,327 |
| Kakaku.com, Inc. | 74,000 | 1,251,561 |
| Kao Corp. | 260,719 | 9,738,358 |
| KDDI Corp. | 887,600 | 26,234,766 |
| Keio Corp. | 56,500 | 1,980,919 |
| Keisei Electric Railway Co., Ltd. | 72,156 | 1,915,170 |
| Keyence Corp. | 107,000 | 40,345,959 |
| Kikkoman Corp. | 80,477 | 4,361,052 |
| Kintetsu Group Holdings Co., Ltd. | 95,600 | 3,230,791 |
| Kirin Holdings Co., Ltd. | 449,800 | 6,612,029 |
| Kobayashi Pharmaceutical Co., Ltd. | 29,200 | 1,549,550 |
| Kobe Bussan Co., Ltd. | 81,700 | 1,772,123 |
| Koei Tecmo Holdings Co., Ltd. | 64,600 | 974,745 |
| Koito Manufacturing Co., Ltd. | 114,000 | 1,618,439 |
| Komatsu Ltd. | 507,409 | 9,940,237 |
| Konami Group Corp. | 52,400 | 2,296,760 |
| SECURITY | NUMBER OF SHARES | VALUE ($) |
| Kose Corp. | 18,300 | 1,826,714 |
| Kubota Corp. | 564,500 | 7,874,545 |
| Kurita Water Industries Ltd. | 57,147 | 2,091,864 |
| Kyocera Corp. | 176,600 | 8,552,107 |
| Kyowa Kirin Co., Ltd. | 146,900 | 3,459,742 |
| Lasertec Corp. | 41,600 | 5,845,251 |
| Lixil Corp. | 161,087 | 2,433,264 |
| M3, Inc. | 244,500 | 7,286,143 |
| Makita Corp. | 125,800 | 2,298,807 |
| Marubeni Corp. | 845,600 | 7,402,309 |
| Mazda Motor Corp. | 312,900 | 2,106,743 |
| McDonald's Holdings Co., Japan Ltd. | 48,100 | 1,669,899 |
| MEIJI Holdings Co., Ltd. | 60,400 | 2,485,406 |
| MINEBEA MITSUMI, Inc. | 202,600 | 2,994,110 |
| MISUMI Group, Inc. | 158,700 | 3,380,222 |
| Mitsubishi Chemical Group Corp. | 698,500 | 3,155,370 |
| Mitsubishi Corp. | 695,200 | 18,832,188 |
| Mitsubishi Electric Corp. | 1,062,900 | 9,352,039 |
| Mitsubishi Estate Co., Ltd. | 647,102 | 8,137,498 |
| Mitsubishi HC Capital, Inc. | 347,338 | 1,490,447 |
| Mitsubishi Heavy Industries Ltd. | 177,400 | 6,110,375 |
| Mitsubishi UFJ Financial Group, Inc. | 6,581,509 | 31,090,054 |
| Mitsui & Co., Ltd. | 768,600 | 17,008,482 |
| Mitsui Chemicals, Inc. | 103,400 | 1,913,823 |
| Mitsui Fudosan Co., Ltd. | 498,477 | 9,545,019 |
| Mitsui O.S.K. Lines Ltd. | 187,300 | 3,707,639 |
| Mizuho Financial Group, Inc. | 1,325,513 | 14,336,035 |
| MonotaRO Co., Ltd. | 138,200 | 2,097,855 |
| MS&AD Insurance Group Holdings, Inc. | 245,562 | 6,502,777 |
| Murata Manufacturing Co., Ltd. | 315,900 | 14,954,522 |
| NEC Corp. | 135,500 | 4,485,170 |
| Nexon Co., Ltd. | 270,900 | 4,533,301 |
| NGK Insulators Ltd. | 131,600 | 1,535,253 |
| Nidec Corp. | 245,800 | 13,515,065 |
| Nihon M&A Center Holdings, Inc. | 163,700 | 1,847,158 |
| Nintendo Co., Ltd. | 607,290 | 24,655,423 |
| Nippon Building Fund, Inc. | 838 | 3,725,114 |
| Nippon Express Holdings, Inc. | 41,600 | 2,090,313 |
| Nippon Paint Holdings Co., Ltd. | 463,700 | 2,955,170 |
| Nippon Prologis REIT, Inc. | 1,184 | 2,484,378 |
| Nippon Sanso Holdings Corp. | 94,900 | 1,510,943 |
| Nippon Shinyaku Co., Ltd. | 27,200 | 1,505,962 |
| Nippon Steel Corp. | 444,341 | 6,095,701 |
| Nippon Telegraph & Telephone Corp. | 657,871 | 18,144,539 |
| Nippon Yusen K.K. | 265,700 | 4,813,011 |
| Nissan Chemical Corp. | 71,166 | 3,203,564 |
| Nissan Motor Co., Ltd. | 1,267,296 | 4,039,256 |
| Nisshin Seifun Group, Inc. | 107,800 | 1,164,845 |
| Nissin Foods Holdings Co., Ltd. | 34,900 | 2,259,037 |
| Nitori Holdings Co., Ltd. | 43,900 | 3,978,087 |
| Nitto Denko Corp. | 79,100 | 4,167,440 |
| Nomura Holdings, Inc. | 1,595,600 | 5,163,295 |
| Nomura Real Estate Holdings, Inc. | 66,600 | 1,505,414 |
| Nomura Real Estate Master Fund, Inc. | 2,317 | 2,643,307 |
| Nomura Research Institute Ltd. | 185,700 | 4,109,578 |
| NTT Data Corp. | 350,700 | 5,079,486 |
| Obayashi Corp. | 351,300 | 2,254,877 |
| Obic Co., Ltd. | 38,700 | 5,807,435 |
| Odakyu Electric Railway Co., Ltd. | 160,400 | 1,906,827 |
| Oji Holdings Corp. | 443,200 | 1,536,452 |
| Olympus Corp. | 679,300 | 14,322,694 |
| Omron Corp. | 101,600 | 4,738,456 |
| Ono Pharmaceutical Co., Ltd. | 200,400 | 4,716,123 |
| Open House Group Co., Ltd. | 45,300 | 1,611,294 |
| Oracle Corp. Japan | 20,900 | 1,113,374 |
| Oriental Land Co., Ltd. | 109,900 | 14,718,647 |
| ORIX Corp. | 655,800 | 9,632,188 |
| SECURITY | NUMBER OF SHARES | VALUE ($) |
| Osaka Gas Co., Ltd. | 206,800 | 3,062,232 |
| Otsuka Corp. | 63,200 | 1,990,303 |
| Otsuka Holdings Co., Ltd. | 214,100 | 6,862,867 |
| Pan Pacific International Holdings Corp. | 209,400 | 3,436,405 |
| Panasonic Holdings Corp. | 1,212,612 | 8,636,963 |
| Persol Holdings Co., Ltd. | 96,600 | 1,934,158 |
| Rakuten Group, Inc. | 481,420 | 2,149,235 |
| Recruit Holdings Co., Ltd. | 792,700 | 24,392,303 |
| Renesas Electronics Corp. * | 647,300 | 5,415,148 |
| Resona Holdings, Inc. | 1,187,585 | 4,475,950 |
| Ricoh Co., Ltd. | 314,000 | 2,300,925 |
| Rohm Co., Ltd. | 48,800 | 3,428,912 |
| SBI Holdings, Inc. | 136,390 | 2,463,757 |
| SCSK Corp. | 85,200 | 1,256,995 |
| Secom Co., Ltd. | 115,600 | 6,585,787 |
| Seiko Epson Corp. | 152,100 | 2,064,933 |
| Sekisui Chemical Co., Ltd. | 204,600 | 2,555,050 |
| Sekisui House Ltd. | 341,369 | 5,667,681 |
| Seven & i Holdings Co., Ltd. | 414,503 | 15,472,715 |
| SG Holdings Co., Ltd. | 159,028 | 2,107,295 |
| Sharp Corp. | 134,100 | 804,343 |
| Shimadzu Corp. | 130,600 | 3,440,378 |
| Shimano, Inc. | 40,300 | 6,236,150 |
| Shimizu Corp. | 301,200 | 1,502,985 |
| Shin-Etsu Chemical Co., Ltd. | 206,260 | 21,436,589 |
| Shionogi & Co., Ltd. | 145,200 | 6,742,688 |
| Shiseido Co., Ltd. | 221,600 | 7,653,444 |
| Shizuoka Financial Group, Inc. | 243,000 | 1,534,501 |
| SMC Corp. | 31,500 | 12,644,164 |
| Softbank Corp. | 1,581,600 | 15,601,517 |
| SoftBank Group Corp. | 663,400 | 28,477,244 |
| Sompo Holdings, Inc. | 172,100 | 7,175,242 |
| Sony Group Corp. | 693,800 | 46,786,149 |
| Square Enix Holdings Co., Ltd. | 47,100 | 2,101,698 |
| Subaru Corp. | 340,300 | 5,319,168 |
| SUMCO Corp. | 191,200 | 2,423,427 |
| Sumitomo Chemical Co., Ltd. | 812,900 | 2,737,244 |
| Sumitomo Corp. | 618,100 | 7,858,378 |
| Sumitomo Electric Industries Ltd. | 393,400 | 4,111,155 |
| Sumitomo Metal Mining Co., Ltd. | 137,100 | 3,843,027 |
| Sumitomo Mitsui Financial Group, Inc. | 719,746 | 20,211,589 |
| Sumitomo Mitsui Trust Holdings, Inc. | 186,100 | 5,353,913 |
| Sumitomo Realty & Development Co., Ltd. | 171,100 | 3,923,992 |
| Suntory Beverage & Food Ltd. | 77,700 | 2,599,584 |
| Suzuki Motor Corp. | 203,800 | 6,890,439 |
| Sysmex Corp. | 92,000 | 4,951,795 |
| T&D Holdings, Inc. | 295,000 | 2,917,609 |
| Taisei Corp. | 98,100 | 2,672,305 |
| Takeda Pharmaceutical Co., Ltd. | 826,990 | 21,839,978 |
| TDK Corp. | 213,700 | 6,675,636 |
| Terumo Corp. | 355,100 | 10,776,929 |
| The Chiba Bank Ltd. | 291,200 | 1,595,520 |
| The Kansai Electric Power Co., Inc. | 387,800 | 2,937,687 |
| TIS, Inc. | 122,700 | 3,308,204 |
| Tobu Railway Co., Ltd. | 104,900 | 2,426,597 |
| Toho Co., Ltd. | 61,008 | 2,169,350 |
| Tokio Marine Holdings, Inc. | 1,010,097 | 18,287,965 |
| Tokyo Electric Power Co. Holdings, Inc. * | 853,490 | 2,780,299 |
| Tokyo Electron Ltd. | 82,100 | 21,600,217 |
| Tokyo Gas Co., Ltd. | 221,840 | 3,964,611 |
| Tokyu Corp. | 290,900 | 3,354,222 |
| Toppan, Inc. | 145,100 | 2,164,046 |
| Toray Industries, Inc. | 772,400 | 3,751,816 |
| Toshiba Corp. | 215,217 | 7,468,360 |
| Tosoh Corp. | 145,100 | 1,578,612 |
| SECURITY | NUMBER OF SHARES | VALUE ($) |
| TOTO Ltd. | 76,500 | 2,181,984 |
| Toyota Industries Corp. | 81,500 | 4,198,489 |
| Toyota Motor Corp. | 5,837,015 | 80,986,244 |
| Toyota Tsusho Corp. | 116,569 | 3,912,742 |
| Trend Micro, Inc. | 74,000 | 3,731,338 |
| Unicharm Corp. | 220,600 | 6,704,347 |
| USS Co., Ltd. | 122,200 | 1,843,844 |
| Welcia Holdings Co., Ltd. | 51,100 | 1,068,061 |
| West Japan Railway Co. | 120,432 | 4,774,716 |
| Yakult Honsha Co., Ltd. | 69,800 | 3,866,846 |
| Yamaha Corp. | 76,600 | 2,891,976 |
| Yamaha Motor Co., Ltd. | 161,700 | 3,337,901 |
| Yamato Holdings Co., Ltd. | 157,100 | 2,326,537 |
| Yaskawa Electric Corp. | 130,800 | 3,621,759 |
| Yokogawa Electric Corp. | 128,500 | 2,148,662 |
| Z Holdings Corp. | 1,453,100 | 3,750,099 |
| ZOZO, Inc. | 69,300 | 1,470,421 |
| 1,563,056,068 | ||
| Netherlands 4.1% | ||
| ABN AMRO Bank N.V., GDR | 231,852 | 2,279,252 |
| Adyen N.V. * | 11,920 | 17,016,978 |
| Aegon N.V. | 997,771 | 4,618,839 |
| AerCap Holdings N.V. * | 73,700 | 3,936,317 |
| Akzo Nobel N.V. | 99,348 | 6,133,292 |
| ASM International N.V. | 25,733 | 5,692,646 |
| ASML Holding N.V. | 223,690 | 104,929,981 |
| Coca-Cola Europacific Partners plc | 113,364 | 5,333,776 |
| EXOR N.V. * | 60,335 | 4,054,571 |
| Heineken Holding N.V. | 55,408 | 3,780,719 |
| Heineken N.V. | 142,297 | 11,886,665 |
| IMCD N.V. | 31,356 | 4,066,697 |
| ING Groep N.V. | 2,149,896 | 21,154,085 |
| JDE Peet's N.V. | 57,138 | 1,635,581 |
| Just Eat Takeaway.com N.V * | 104,000 | 1,784,649 |
| Koninklijke Ahold Delhaize N.V. | 575,973 | 16,062,888 |
| Koninklijke DSM N.V. | 95,895 | 11,280,160 |
| Koninklijke KPN N.V. | 1,809,815 | 5,062,243 |
| Koninklijke Philips N.V. | 485,601 | 6,159,789 |
| NN Group N.V. | 153,559 | 6,502,062 |
| OCI N.V. | 58,728 | 2,246,222 |
| Prosus N.V. * | 456,051 | 19,720,405 |
| Randstad N.V. | 66,185 | 3,298,607 |
| Universal Music Group N.V. | 405,782 | 7,967,711 |
| Wolters Kluwer N.V. | 144,583 | 15,363,175 |
| 291,967,310 | ||
| New Zealand 0.2% | ||
| Auckland International Airport Ltd. * | 699,496 | 3,127,040 |
| Fisher & Paykel Healthcare Corp., Ltd. | 319,547 | 3,631,657 |
| Mercury NZ Ltd. | 363,519 | 1,229,164 |
| Meridian Energy Ltd. | 721,206 | 2,044,328 |
| Spark New Zealand Ltd. | 1,036,536 | 3,085,521 |
| 13,117,710 | ||
| Norway 0.8% | ||
| Adevinta A.S.A. * | 153,144 | 1,048,327 |
| Aker BP A.S.A. | 173,064 | 5,497,611 |
| DNB Bank A.S.A. | 510,766 | 9,033,856 |
| Equinor A.S.A. | 538,538 | 19,620,942 |
| Gjensidige Forsikring A.S.A. | 108,119 | 1,976,278 |
| Kongsberg Gruppen A.S.A. | 50,290 | 1,803,420 |
| Mowi A.S.A. | 225,251 | 3,362,046 |
| Norsk Hydro A.S.A. | 739,772 | 4,694,830 |
| Orkla A.S.A. | 417,527 | 2,816,285 |
| SECURITY | NUMBER OF SHARES | VALUE ($) |
| Salmar A.S.A. | 31,949 | 1,083,123 |
| Telenor A.S.A. | 382,793 | 3,478,772 |
| Yara International A.S.A. | 91,110 | 4,066,368 |
| 58,481,858 | ||
| Portugal 0.2% | ||
| EDP - Energias de Portugal S.A. | 1,522,544 | 6,652,473 |
| EDP Renovaveis S.A. | 157,272 | 3,309,393 |
| Galp Energia, SGPS, S.A. | 272,607 | 2,767,805 |
| Jeronimo Martins, SGPS, S.A. | 157,975 | 3,268,978 |
| 15,998,649 | ||
| Singapore 1.5% | ||
| CapitaLand Ascendas REIT | 1,863,995 | 3,448,746 |
| CapitaLand Integrated Commercial Trust | 2,894,010 | 3,840,797 |
| Capitaland Investment Ltd. | 1,423,049 | 3,026,319 |
| City Developments Ltd. | 235,200 | 1,268,107 |
| DBS Group Holdings Ltd. | 997,793 | 24,122,946 |
| Genting Singapore Ltd. | 3,274,000 | 1,861,832 |
| Grab Holdings Ltd., Class A * | 723,345 | 1,880,697 |
| Keppel Corp., Ltd. | 812,700 | 4,000,124 |
| Mapletree Logistics Trust | 1,829,628 | 1,963,684 |
| Mapletree Pan Asia Commercial Trust | 1,281,700 | 1,438,335 |
| Oversea-Chinese Banking Corp., Ltd. | 1,866,801 | 16,024,774 |
| Sea Ltd., ADR * | 198,587 | 9,865,802 |
| Singapore Airlines Ltd. * | 741,050 | 2,748,781 |
| Singapore Exchange Ltd. | 467,400 | 2,779,454 |
| Singapore Technologies Engineering Ltd. | 845,949 | 1,972,190 |
| Singapore Telecommunications Ltd. | 4,569,637 | 8,045,963 |
| United Overseas Bank Ltd. | 647,833 | 12,709,697 |
| UOL Group Ltd. | 235,272 | 1,027,618 |
| Venture Corp., Ltd. | 149,300 | 1,680,125 |
| Wilmar International Ltd. | 1,068,234 | 2,926,483 |
| 106,632,474 | ||
| Spain 2.4% | ||
| Acciona S.A. | 13,784 | 2,481,969 |
| ACS, Actividades de Construccion y Servicios S.A. | 126,653 | 3,250,076 |
| Aena SME S.A. * | 41,796 | 4,912,343 |
| Amadeus IT Group S.A. * | 247,731 | 12,920,475 |
| Banco Bilbao Vizcaya Argentaria S.A. | 3,668,857 | 18,926,855 |
| Banco Santander S.A. (a) | 9,395,900 | 24,368,037 |
| CaixaBank S.A. | 2,454,781 | 8,140,160 |
| Cellnex Telecom S.A. | 297,598 | 9,740,452 |
| Enagas S.A. | 138,842 | 2,253,947 |
| Endesa S.A. | 177,299 | 2,962,318 |
| Ferrovial S.A. | 264,533 | 6,464,752 |
| Grifols S.A. * | 161,242 | 1,371,778 |
| Iberdrola S.A. | 3,276,319 | 33,317,783 |
| Industria de Diseno Textil S.A. | 599,808 | 13,614,560 |
| Naturgy Energy Group S.A. | 79,706 | 2,045,458 |
| Red Electrica Corp. S.A. | 225,900 | 3,654,092 |
| Repsol S.A. | 797,723 | 10,852,595 |
| Siemens Gamesa Renewable Energy S.A. * | 133,201 | 2,361,475 |
| Telefonica S.A. | 2,879,407 | 9,925,875 |
| 173,565,000 | ||
| Sweden 3.4% | ||
| Alfa Laval AB | 161,276 | 3,969,857 |
| Assa Abloy AB, B Shares | 550,981 | 11,125,448 |
| SECURITY | NUMBER OF SHARES | VALUE ($) |
| Atlas Copco AB, A Shares | 1,466,522 | 15,652,554 |
| Atlas Copco AB, B Shares | 869,354 | 8,407,660 |
| Boliden AB | 149,086 | 4,335,555 |
| Electrolux AB, B Shares | 125,068 | 1,542,986 |
| Embracer Group AB *(a) | 378,349 | 1,820,143 |
| Epiroc AB, A Shares | 365,915 | 5,601,590 |
| Epiroc AB, B Shares | 209,296 | 2,810,253 |
| EQT AB | 166,042 | 3,267,696 |
| Essity AB, B Shares | 333,439 | 7,045,017 |
| Evolution AB | 101,184 | 9,438,714 |
| Fastighets AB Balder, B Shares * | 351,616 | 1,319,840 |
| Getinge AB, B Shares | 128,392 | 2,605,457 |
| H & M Hennes & Mauritz AB, B Shares (a) | 406,919 | 4,098,551 |
| Hexagon AB, B Shares | 1,068,831 | 10,566,343 |
| Holmen AB, B Shares | 51,070 | 1,853,352 |
| Husqvarna AB, B Shares | 233,228 | 1,384,709 |
| Industrivarden AB, A Shares | 70,734 | 1,601,976 |
| Industrivarden AB, C Shares | 84,874 | 1,905,881 |
| Indutrade AB | 148,335 | 2,597,042 |
| Investment AB Latour, B Shares | 80,494 | 1,359,727 |
| Investor AB, A Shares | 279,205 | 4,747,812 |
| Investor AB, B Shares | 995,581 | 16,248,489 |
| Kinnevik AB, B Shares * | 132,359 | 1,635,089 |
| L E Lundbergfortagen AB, B Shares | 40,960 | 1,616,594 |
| Lifco AB, B Shares | 126,273 | 1,824,623 |
| Nibe Industrier AB, B Shares | 840,749 | 6,706,463 |
| Nordea Bank Abp | 1,877,372 | 17,933,628 |
| Sagax AB, Class B | 103,512 | 1,907,451 |
| Sandvik AB | 588,410 | 9,194,934 |
| Securitas AB, B Shares (a) | 275,103 | 2,247,813 |
| Skandinaviska Enskilda Banken AB, A Shares | 893,103 | 9,416,334 |
| Skanska AB, B Shares | 188,369 | 2,929,391 |
| SKF AB, B Shares | 214,108 | 3,099,344 |
| Svenska Cellulosa AB, S.C.A., B Shares | 332,472 | 3,922,433 |
| Svenska Handelsbanken AB, A Shares | 797,762 | 7,412,029 |
| Swedbank AB, A Shares | 498,032 | 7,424,685 |
| Swedish Match AB | 840,059 | 8,639,913 |
| Swedish Orphan Biovitrum AB * | 93,463 | 1,721,533 |
| Tele2 AB, B Shares | 315,686 | 2,587,367 |
| Telefonaktiebolaget LM Ericsson, B Shares | 1,605,032 | 8,922,924 |
| Telia Co. AB | 1,476,497 | 3,912,370 |
| Volvo AB, A Shares | 113,553 | 1,939,670 |
| Volvo AB, B Shares | 826,078 | 13,520,358 |
| Volvo Car AB, Class B *(a) | 326,620 | 1,386,202 |
| 245,207,800 | ||
| Switzerland 10.5% | ||
| ABB Ltd. | 904,225 | 25,110,599 |
| Adecco Group AG | 88,144 | 2,758,551 |
| Alcon, Inc. | 274,999 | 16,743,410 |
| Bachem Holding AG, Class B | 18,776 | 1,346,353 |
| Baloise Holding AG | 25,430 | 3,474,301 |
| Barry Callebaut AG | 1,947 | 3,683,552 |
| Chocoladefabriken Lindt & Spruengli AG | 60 | 5,831,330 |
| Chocoladefabriken Lindt & Spruengli AG, Participation Certificates | 586 | 5,623,864 |
| Cie Financiere Richemont S.A., Class A | 287,269 | 28,075,813 |
| Clariant AG * | 117,758 | 1,892,466 |
| Credit Suisse Group AG (a) | 1,461,532 | 6,054,337 |
| EMS-Chemie Holding AG | 3,806 | 2,393,178 |
| Geberit AG | 19,723 | 8,767,610 |
| SECURITY | NUMBER OF SHARES | VALUE ($) |
| Givaudan S.A. | 5,080 | 15,173,652 |
| Holcim AG * | 305,322 | 13,871,484 |
| Julius Baer Group Ltd. | 120,928 | 5,801,988 |
| Kuehne & Nagel International AG | 30,179 | 6,424,088 |
| Logitech International S.A. | 96,326 | 4,790,476 |
| Lonza Group AG | 40,973 | 21,092,241 |
| Nestle S.A. | 1,549,496 | 168,676,278 |
| Novartis AG | 1,190,965 | 96,338,003 |
| Partners Group Holding AG | 12,545 | 11,260,178 |
| Roche Holding AG | 386,766 | 128,328,232 |
| Roche Holding AG, Bearer Shares | 14,603 | 5,927,213 |
| Schindler Holding AG | 12,585 | 1,981,132 |
| Schindler Holding AG, Participation Certificates | 22,468 | 3,663,766 |
| SGS S.A. | 3,513 | 7,744,446 |
| SIG Group AG * | 168,930 | 3,247,354 |
| Sika AG | 80,312 | 18,108,407 |
| Sonova Holding AG | 29,680 | 7,015,273 |
| Straumann Holding AG | 60,944 | 5,800,120 |
| Swiss Life Holding AG | 17,436 | 8,442,896 |
| Swiss Prime Site AG | 42,670 | 3,443,167 |
| Swiss Re AG | 165,484 | 12,292,939 |
| Swisscom AG | 14,248 | 7,035,507 |
| Temenos AG | 34,062 | 2,028,691 |
| The Swatch Group AG | 29,050 | 1,213,671 |
| The Swatch Group AG, Bearer Shares | 15,718 | 3,531,982 |
| UBS Group AG | 1,934,796 | 30,674,550 |
| VAT Group AG | 14,944 | 3,411,733 |
| Zurich Insurance Group AG | 82,820 | 35,295,720 |
| 744,370,551 | ||
| United Kingdom 15.5% | ||
| 3i Group plc | 533,444 | 7,104,601 |
| abrdn plc | 1,195,523 | 2,178,458 |
| Admiral Group plc | 99,260 | 2,295,450 |
| Anglo American plc | 699,358 | 20,948,710 |
| Antofagasta plc | 212,165 | 2,859,010 |
| Ashtead Group plc | 243,672 | 12,693,610 |
| Associated British Foods plc | 195,190 | 3,025,303 |
| AstraZeneca plc | 852,700 | 100,049,097 |
| Auto Trader Group plc | 527,134 | 3,155,304 |
| AVEVA Group plc | 65,927 | 2,359,408 |
| Aviva plc | 1,553,528 | 7,451,690 |
| BAE Systems plc | 1,735,567 | 16,233,735 |
| Barclays plc | 9,213,838 | 15,656,631 |
| Barratt Developments plc | 572,423 | 2,468,909 |
| Berkeley Group Holdings plc | 62,263 | 2,477,279 |
| BP plc | 10,634,631 | 58,837,172 |
| British American Tobacco plc | 1,185,986 | 46,838,675 |
| BT Group plc | 3,852,923 | 5,741,743 |
| Bunzl plc | 184,817 | 6,022,353 |
| Burberry Group plc | 216,185 | 4,504,668 |
| Coca-Cola HBC AG * | 113,331 | 2,475,523 |
| Compass Group plc | 981,314 | 20,668,254 |
| Croda International plc | 76,978 | 5,963,450 |
| DCC plc | 54,559 | 3,028,069 |
| Diageo plc | 1,259,184 | 51,818,521 |
| Entain plc | 327,150 | 4,732,737 |
| Experian plc | 506,659 | 16,154,954 |
| Ferguson plc | 117,963 | 12,864,888 |
| Glencore plc | 5,427,375 | 31,115,513 |
| GSK plc | 2,238,189 | 36,663,955 |
| Haleon plc * | 2,785,322 | 8,541,054 |
| Halma plc | 208,522 | 5,056,508 |
| Hargreaves Lansdown plc | 198,924 | 1,738,517 |
| Hikma Pharmaceuticals plc | 90,297 | 1,296,234 |
| HSBC Holdings plc | 11,063,365 | 56,777,735 |
| SECURITY | NUMBER OF SHARES | VALUE ($) |
| Imperial Brands plc | 497,008 | 12,106,652 |
| Informa plc | 809,296 | 5,156,767 |
| InterContinental Hotels Group plc | 100,694 | 5,410,359 |
| Intertek Group plc | 89,210 | 3,737,270 |
| J Sainsbury plc | 967,970 | 2,157,695 |
| J.D. Sports Fashion plc | 1,410,707 | 1,576,366 |
| Johnson Matthey plc | 100,739 | 2,236,163 |
| Kingfisher plc | 1,109,571 | 2,787,722 |
| Land Securities Group plc | 396,394 | 2,591,975 |
| Legal & General Group plc | 3,289,889 | 8,801,307 |
| Lloyds Banking Group plc | 38,316,715 | 18,402,255 |
| London Stock Exchange Group plc | 181,302 | 15,715,619 |
| M&G plc | 1,427,352 | 2,868,441 |
| Melrose Industries plc | 2,419,993 | 3,246,137 |
| Mondi plc | 266,149 | 4,465,572 |
| National Grid plc | 2,008,750 | 21,885,564 |
| NatWest Group plc | 2,928,845 | 7,888,261 |
| Next plc | 72,202 | 4,077,942 |
| NMC Health plc *(b) | 48,950 | 0 |
| Ocado Group plc * | 317,898 | 1,723,419 |
| Pearson plc | 365,136 | 4,035,890 |
| Persimmon plc | 172,665 | 2,583,735 |
| Phoenix Group Holdings plc | 408,360 | 2,541,621 |
| Prudential plc | 1,511,015 | 14,036,814 |
| Reckitt Benckiser Group plc | 393,665 | 26,125,167 |
| RELX plc | 1,060,517 | 28,485,998 |
| Rentokil Initial plc | 1,377,187 | 8,593,790 |
| Rio Tinto plc | 618,844 | 32,341,790 |
| Rolls-Royce Holdings plc * | 4,629,426 | 4,151,959 |
| Schroders plc | 397,888 | 1,786,519 |
| Segro plc | 660,095 | 5,940,854 |
| Severn Trent plc | 137,775 | 3,954,103 |
| Shell plc | 4,094,637 | 113,427,933 |
| Smith & Nephew plc | 478,229 | 5,651,185 |
| Smiths Group plc | 206,872 | 3,705,603 |
| Spirax-Sarco Engineering plc | 40,268 | 4,962,366 |
| SSE plc | 587,068 | 10,491,420 |
| St. James's Place plc | 302,176 | 3,690,036 |
| Standard Chartered plc | 1,389,145 | 8,299,775 |
| Taylor Wimpey plc | 1,928,750 | 2,073,653 |
| Tesco plc | 4,151,455 | 10,253,598 |
| The British Land Co., plc | 473,989 | 1,988,331 |
| The Sage Group plc | 555,623 | 4,630,968 |
| Unilever plc | 1,404,611 | 63,845,665 |
| United Utilities Group plc | 380,637 | 4,101,817 |
| Vodafone Group plc | 14,697,880 | 17,158,331 |
| Whitbread plc | 112,989 | 3,325,502 |
| WPP plc | 607,436 | 5,345,526 |
| 1,106,163,153 | ||
| Total Common Stocks (Cost $6,679,807,016) | 7,046,907,666 | |
| PREFERRED STOCKS 0.5% OF NET ASSETS | ||
| Germany 0.5% | ||
| Bayerische Motoren Werke AG | 31,951 | 2,356,190 |
| Dr Ing hc F Porsche AG * | 62,225 | 6,364,612 |
| Henkel AG & Co. KGaA | 97,918 | 6,168,692 |
| Porsche Automobil Holding SE | 83,766 | 4,680,193 |
| Sartorius AG | 13,444 | 4,740,223 |
| Volkswagen AG | 101,615 | 13,006,856 |
| 37,316,766 | ||
| Total Preferred Stocks (Cost $40,517,509) | 37,316,766 | |
| SECURITY | NUMBEROF SHARES | VALUE ($) |
| SHORT-TERM INVESTMENTS 0.5% OF NET ASSETS | ||
| Money Market Funds 0.5% | ||
| State Street Institutional U.S. Government Money Market Fund, Premier Class 3.01% (c)(d) | 37,595,691 | 37,595,691 |
| Total Short-Term Investments (Cost $37,595,691) | 37,595,691 | |
| Total Investments in Securities (Cost $6,757,920,216) | 7,121,820,123 | |
| NUMBER OF CONTRACTS | NOTIONAL AMOUNT ($) | CURRENT VALUE/ UNREALIZED APPRECIATION ($) | |
| FUTURES CONTRACTS | |||
| Long | |||
| MSCI EAFE Index, expires 12/16/22 | 507 | 44,512,065 | 483,501 |
| * | Non-income producing security. |
| (a) | All or a portion of this security is on loan. Securities on loan were valued at $34,793,118. |
| (b) | Fair-valued using significant unobservable inputs (see financial note 2(a), Securities for which no quoted value is available, for additional information). |
| (c) | The rate shown is the annualized 7-day yield. |
| (d) | Security purchased with cash collateral received for securities on loan. |
| ADR — | American Depositary Receipt |
| CVA — | Dutch Certificate |
| GDR — | Global Depositary Receipt |
| REIT — | Real Estate Investment Trust |
| DESCRIPTION | QUOTED PRICES IN ACTIVE MARKETS FOR IDENTICAL ASSETS (LEVEL 1) | OTHER SIGNIFICANT OBSERVABLE INPUTS (LEVEL 2) | SIGNIFICANT UNOBSERVABLE INPUTS (LEVEL 3) | TOTAL |
| Assets | ||||
| Common Stocks1 | $— | $4,735,572,264 | $— | $4,735,572,264 |
| Australia | 5,642,212 | 560,717,035 | — | 566,359,247 |
| Hong Kong | 1,113,317 | 177,815,847 | — | 178,929,164 |
| Israel | 19,984,532 | 41,299,522 | — | 61,284,054 |
| Netherlands | 13,324,664 | 278,642,646 | — | 291,967,310 |
| Singapore | 11,746,499 | 94,885,975 | — | 106,632,474 |
| United Kingdom | — | 1,106,163,153 | 0* | 1,106,163,153 |
| Preferred Stocks1 | ||||
| Germany | 6,364,612 | 30,952,154 | — | 37,316,766 |
| Short-Term Investments1 | 37,595,691 | — | — | 37,595,691 |
| Futures Contracts2 | 483,501 | — | — | 483,501 |
| Total | $96,255,028 | $7,026,048,596 | $— | $7,122,303,624 |
| * | Level 3 amount shown includes securities determined to have no value at October 31, 2022. |
| 1 | As categorized in the Portfolio Holdings. |
| 2 | Futures contracts are reported at cumulative unrealized appreciation or depreciation. |
| Assets | ||
| Investments in securities, at value - unaffiliated (cost $6,757,920,216) including securities on loan of $34,793,118 | $7,121,820,123 | |
| Cash | 83,678 | |
| Foreign currency, at value (cost $4,045,112) | 4,011,241 | |
| Deposit with broker for futures contracts | 2,763,613 | |
| Receivables: | ||
| Foreign tax reclaims | 18,492,420 | |
| Dividends | 17,358,669 | |
| Fund shares sold | 10,564,659 | |
| Investments sold | 1,755,544 | |
| Income from securities on loan | + | 17,983 |
| Total assets | 7,176,867,930 | |
| Liabilities | ||
| Collateral held for securities on loan | 37,595,691 | |
| Payables: | ||
| Fund shares redeemed | 11,496,403 | |
| Variation margin on futures contracts | 373,726 | |
| Investment adviser fees | + | 333,729 |
| Total liabilities | 49,799,549 | |
| Net assets | $7,127,068,381 | |
| Net Assets by Source | ||
| Capital received from investors | $7,234,981,022 | |
| Total distributable loss | + | (107,912,641) |
| Net assets | $7,127,068,381 | |
| Net Asset Value (NAV) | ||||
| Net Assets | ÷ | Shares Outstanding | = | NAV |
| $7,127,068,381 | 392,283,690 | $18.17 | ||
| For the period November 1, 2021 through October 31, 2022 | ||
| Investment Income | ||
| Dividends received from securities - unaffiliated (net of foreign withholding tax of $25,454,968) | $257,443,454 | |
| Securities on loan, net | + | 319,517 |
| Total investment income | 257,762,971 | |
| Expenses | ||
| Investment adviser fees | 4,860,768 | |
| Proxy fees1 | 374,802 | |
| Professional fees | + | 17,455 2 |
| Total expenses | 5,253,025 | |
| Expense reduction | – | 17,455 2 |
| Net expenses | – | 5,235,570 |
| Net investment income | 252,527,401 | |
| REALIZED AND UNREALIZED GAINS (LOSSES) | ||
| Net realized losses on sales of securities - unaffiliated | (170,907,944) | |
| Net realized losses on futures contracts | (17,316,756) | |
| Net realized losses on foreign currency transactions | + | (4,093,297) |
| Net realized losses | (192,317,997) | |
| Net change in unrealized appreciation (depreciation) on securities - unaffiliated | (2,182,547,937) | |
| Net change in unrealized appreciation (depreciation) on futures contracts | (62,489) | |
| Net change in unrealized appreciation (depreciation) on foreign currency translations | + | (2,392,845) |
| Net change in unrealized appreciation (depreciation) | + | (2,185,003,271) |
| Net realized and unrealized losses | (2,377,321,268) | |
| Decrease in net assets resulting from operations | ($2,124,793,867) | |
| 1 | Proxy fees are non-routine expenses (see financial note 2(e) for additional information). |
| 2 | Professional fees associated with the filing of tax claims in the European Union deemed to be non-contingent and non-routine expenses of the fund. (see financial notes 2(d) and 4 for additional information). |
| OPERATIONS | |||
| 11/1/21-10/31/22 | 11/1/20-10/31/21 | ||
| Net investment income | $252,527,401 | $220,308,471 | |
| Net realized losses | (192,317,997) | (12,480,045) | |
| Net change in unrealized appreciation (depreciation) | + | (2,185,003,271) | 1,870,184,169 |
| Increase (decrease) in net assets resulting from operations | ($2,124,793,867) | $2,078,012,595 | |
| DISTRIBUTIONS TO SHAREHOLDERS | |||
| Total distributions | ($287,643,160) | ($134,266,147) | |
| TRANSACTIONS IN FUND SHARES | |||||
| 11/1/21-10/31/22 | 11/1/20-10/31/21 | ||||
| SHARES | VALUE | SHARES | VALUE | ||
| Shares sold | 98,990,068 | $2,090,708,813 | 84,577,903 | $1,955,546,476 | |
| Shares reinvested | 8,669,015 | 198,780,492 | 4,139,456 | 90,364,312 | |
| Shares redeemed | + | (74,590,851) | (1,531,205,969) | (49,400,102) | (1,145,927,182) |
| Net transactions in fund shares | 33,068,232 | $758,283,336 | 39,317,257 | $899,983,606 | |
| SHARES OUTSTANDING AND NET ASSETS | |||||
| 11/1/21-10/31/22 | 11/1/20-10/31/21 | ||||
| SHARES | NET ASSETS | SHARES | NET ASSETS | ||
| Beginning of period | 359,215,458 | $8,781,222,072 | 319,898,201 | $5,937,492,018 | |
| Total increase (decrease) | + | 33,068,232 | (1,654,153,691) | 39,317,257 | 2,843,730,054 |
| End of period | 392,283,690 | $7,127,068,381 | 359,215,458 | $8,781,222,072 | |
| SCHWAB CAPITAL TRUST (ORGANIZED MAY 7, 1993) | |
| Schwab S&P 500 Index Fund | Schwab Target 2045 Fund |
| Schwab Small-Cap Index Fund | Schwab Target 2050 Fund |
| Schwab Total Stock Market Index Fund | Schwab Target 2055 Fund |
| Schwab U.S. Large-Cap Growth Index Fund | Schwab Target 2060 Fund |
| Schwab U.S. Large-Cap Value Index Fund | Schwab Target 2065 Fund |
| Schwab U.S. Mid-Cap Index Fund | Schwab Fundamental US Large Company Index Fund |
| Schwab International Index Fund | Schwab Fundamental US Small Company Index Fund |
| Schwab MarketTrack All Equity Portfolio™ | Schwab Fundamental International Large Company Index Fund |
| Schwab MarketTrack Growth Portfolio™ | Schwab Fundamental International Small Company Index Fund |
| Schwab MarketTrack Balanced Portfolio™ | Schwab Fundamental Emerging Markets Large Company Index Fund |
| Schwab MarketTrack Conservative Portfolio™ | Schwab Fundamental Global Real Estate Index Fund |
| Schwab International Opportunities Fund | Schwab Target 2010 Index Fund |
| Schwab Balanced Fund | Schwab Target 2015 Index Fund |
| Schwab Core Equity Fund | Schwab Target 2020 Index Fund |
| Schwab Dividend Equity Fund | Schwab Target 2025 Index Fund |
| Schwab Large-Cap Growth Fund | Schwab Target 2030 Index Fund |
| Schwab Small-Cap Equity Fund | Schwab Target 2035 Index Fund |
| Schwab Health Care Fund | Schwab Target 2040 Index Fund |
| Schwab International Core Equity Fund | Schwab Target 2045 Index Fund |
| Schwab Target 2010 Fund | Schwab Target 2050 Index Fund |
| Schwab Target 2015 Fund | Schwab Target 2055 Index Fund |
| Schwab Target 2020 Fund | Schwab Target 2060 Index Fund |
| Schwab Target 2025 Fund | Schwab Target 2065 Index Fund |
| Schwab Target 2030 Fund | Schwab Monthly Income Fund – Target Payout |
| Schwab Target 2035 Fund | Schwab Monthly Income Fund – Flexible Payout |
| Schwab Target 2040 Fund | Schwab Monthly Income Fund – Income Payout |
| SCHWAB INVESTMENTS (ORGANIZED OCTOBER 26, 1990) | |
| Schwab 1000 Index Fund | Schwab Tax-Free Bond Fund |
| Schwab Treasury Inflation Protected Securities Index Fund | Schwab California Tax-Free Bond Fund |
| Schwab U.S. Aggregate Bond Index Fund | Schwab Opportunistic Municipal Bond Fund |
| Schwab Short-Term Bond Index Fund | Schwab Global Real Estate Fund |
| 4. Affiliates and Affiliated Transactions: |
| SCHWAB S&P 500 INDEX FUND | SCHWAB 1000 INDEX FUND | SCHWAB SMALL-CAP INDEX FUND | SCHWAB TOTAL STOCK MARKET INDEX FUND | SCHWAB U.S. LARGE-CAP GROWTH INDEX FUND | SCHWAB U.S. LARGE-CAP VALUE INDEX FUND | SCHWAB U.S. MID-CAP INDEX FUND | SCHWAB INTERNATIONAL INDEX FUND |
| 0.02% | 0.05% | 0.04% | 0.03% | 0.035% | 0.035% | 0.04% | 0.06% |
| UNDERLYING FUNDS | |||||
| SCHWAB S&P 500 INDEX FUND | SCHWAB SMALL-CAP INDEX FUND | SCHWAB U.S. LARGE-CAP GROWTH INDEX FUND | SCHWAB U.S. MID-CAP INDEX FUND | SCHWAB INTERNATIONAL INDEX FUND | |
| Schwab MarketTrack All Equity Portfolio | 0.4% | 1.4% | 3.6% | —% | 1.3% |
| Schwab MarketTrack Balanced Portfolio | 0.2% | 0.6% | 1.7% | —% | 0.5% |
| Schwab MarketTrack Conservative Portfolio | 0.1% | 0.2% | 0.5% | —% | 0.2% |
| Schwab MarketTrack Growth Portfolio | 0.4% | 1.4% | 2.8% | —% | 1.1% |
| Schwab Target 2010 Fund | 0.0%* | —% | —% | 0.0%* | —% |
| Schwab Target 2015 Fund | 0.0%* | —% | —% | 0.0%* | —% |
| Schwab Target 2020 Fund | 0.1% | —% | —% | 0.4% | —% |
| Schwab Target 2025 Fund | 0.1% | —% | —% | 0.6% | —% |
| Schwab Target 2030 Fund | 0.3% | —% | —% | 1.3% | —% |
| Schwab Target 2035 Fund | 0.2% | —% | —% | 0.8% | —% |
| Schwab Target 2040 Fund | 0.3% | —% | —% | 1.7% | —% |
| Schwab Target 2045 Fund | 0.1% | —% | —% | 0.4% | —% |
| Schwab Target 2050 Fund | 0.1% | —% | —% | 0.4% | —% |
| Schwab Target 2055 Fund | 0.0%* | —% | —% | 0.3% | —% |
| Schwab Target 2060 Fund | 0.0%* | —% | —% | 0.1% | —% |
| Schwab Target 2065 Fund | 0.0%* | —% | —% | 0.0%* | —% |
| * | Less than 0.05% |
| PURCHASE COST | SALE PROCEEDS | REALIZED GAINS (LOSSES) | |
| Schwab S&P 500 Index Fund | $318,195,998 | $148,096,558 | ($58,405,895) |
| Schwab 1000 Index Fund | 108,915,902 | 72,503,471 | (52,980,385) |
| Schwab Small-Cap Index Fund | 75,675,878 | 71,460,921 | (9,946,925) |
| Schwab Total Stock Market Index Fund | 126,719,035 | 70,305,521 | (35,740,278) |
| Schwab U.S. Large-Cap Growth Index Fund | 60,900,179 | 54,811,170 | (15,209,691) |
| Schwab U.S. Large-Cap Value Index Fund | 73,511,996 | 50,433,173 | (447,208) |
| Schwab U.S. Mid-Cap Index Fund | 33,418,330 | 18,146,299 | (10,277,066) |
| Schwab International Index Fund | 26,797 | 14,543,462 | (5,047,751) |
| NOTIONAL AMOUNTS | NUMBER OF CONTRACTS | |
| Schwab S&P 500 Index Fund | $308,479,043 | 1,443 |
| Schwab 1000 Index Fund | 53,543,576 | 252 |
| Schwab Small-Cap Index Fund | 26,446,943 | 264 |
| Schwab Total Stock Market Index Fund | 83,747,872 | 462 |
| Schwab U.S. Large-Cap Growth Index Fund | 3,824,246 | 29 |
| Schwab U.S. Large-Cap Value Index Fund | 2,872,935 | 35 |
| Schwab U.S. Mid-Cap Index Fund | 4,859,089 | 19 |
| Schwab International Index Fund | 55,419,275 | 548 |
| PURCHASES OF SECURITIES | SALES OF SECURITIES | |
| Schwab S&P 500 Index Fund | $6,338,239,393 | $1,128,726,146 |
| Schwab 1000 Index Fund | 741,161,276 | 297,120,612 |
| Schwab Small-Cap Index Fund | 1,479,558,224 | 896,110,327 |
| Schwab Total Stock Market Index Fund | 1,847,143,733 | 384,654,106 |
| Schwab U.S. Large-Cap Growth Index Fund | 459,123,750 | 156,043,596 |
| Schwab U.S. Large-Cap Value Index Fund | 249,347,602 | 93,887,278 |
| Schwab U.S. Mid-Cap Index Fund | 329,236,287 | 94,784,814 |
| Schwab International Index Fund | 1,152,675,780 | 429,495,435 |
| IN-KIND PURCHASES OF SECURITIES | IN-KIND SALES OF SECURITIES | |
| Schwab 1000 Index Fund | $— | $130,625,736 |
| Schwab Small-Cap Index Fund | — | 154,617,030 |
| Schwab U.S. Large-Cap Value Index Fund | — | 22,015,146 |
| Schwab U.S. Mid-Cap Index Fund | — | 20,979,937 |
| 9. Federal Income Taxes: |
| TAX COST | GROSS UNREALIZED APPRECIATION | GROSS UNREALIZED DEPRECIATION | NET UNREALIZED APPRECIATION (DEPRECIATION) | |
| Schwab S&P 500 Index Fund | $30,532,850,603 | $32,045,615,799 | ($1,732,330,726) | $30,313,285,073 |
| Schwab 1000 Index Fund | 3,350,432,752 | 8,814,241,837 | (264,167,926) | 8,550,073,911 |
| Schwab Small-Cap Index Fund | 4,653,768,199 | 1,811,947,195 | (981,734,216) | 830,212,979 |
| Schwab Total Stock Market Index Fund | 9,606,021,717 | 7,300,977,616 | (883,253,146) | 6,417,724,470 |
| Schwab U.S. Large-Cap Growth Index Fund | 824,431,051 | 164,130,707 | (62,117,705) | 102,013,002 |
| Schwab U.S. Large-Cap Value Index Fund | 592,792,293 | 119,095,255 | (64,644,301) | 54,450,954 |
| Schwab U.S. Mid-Cap Index Fund | 855,264,291 | 160,284,467 | (114,116,756) | 46,167,711 |
| Schwab International Index Fund | 7,070,935,445 | 1,192,326,347 | (1,140,958,168) | 51,368,179 |
| UNDISTRIBUTED ORDINARY INCOME | UNDISTRIBUTED LONG-TERM CAPITAL GAINS | NET UNREALIZED APPRECIATION (DEPRECIATION) ON INVESTMENTS | NET OTHER UNREALIZED APPRECIATION (DEPRECIATION) | CAPITAL LOSS CARRYFORWARDS AND OTHER LOSSES | TOTAL | |
| Schwab S&P 500 Index Fund | $784,280,824 | $— | $30,313,285,073 | $— | ($91,515,940) | $31,006,049,957 |
| Schwab 1000 Index Fund | 146,361,782 | — | 8,550,073,911 | — | (90,324,047) | 8,606,111,646 |
| Schwab Small-Cap Index Fund | 45,118,253 | — | 830,212,979 | — | (53,188,008) | 822,143,224 |
| Schwab Total Stock Market Index Fund | 196,900,319 | — | 6,417,724,470 | — | (24,579,663) | 6,590,045,126 |
| Schwab U.S. Large-Cap Growth Index Fund | 6,352,716 | — | 102,013,002 | — | (28,197,584) | 80,168,134 |
| Schwab U.S. Large-Cap Value Index Fund | 10,224,928 | 794,933 | 54,450,954 | — | — | 65,470,815 |
| Schwab U.S. Mid-Cap Index Fund | 9,919,928 | 782,797 | 46,167,711 | — | — | 56,870,436 |
| Schwab International Index Fund | 187,757,865 | — | 51,368,179 | (2,415,662) | (344,623,023) | (107,912,641) |
| Schwab S&P 500 Index Fund | $91,515,940 |
| Schwab 1000 Index Fund | 90,324,047 |
| Schwab Small-Cap Index Fund | 53,188,008 |
| Schwab Total Stock Market Index Fund | 24,579,663 |
| Schwab U.S. Large-Cap Growth Index Fund | 28,197,584 |
| Schwab U.S. Large-Cap Value Index Fund | — |
| Schwab U.S. Mid-Cap Index Fund | — |
| Schwab International Index Fund | 344,623,023 |
| CURRENT FISCAL YEAR END DISTRIBUTIONS | PRIOR FISCAL YEAR END DISTRIBUTIONS | |||
| ORDINARY INCOME | LONG-TERM CAPITAL GAINS | ORDINARY INCOME | LONG-TERM CAPITAL GAINS | |
| Schwab S&P 500 Index Fund | $827,352,159 | $65,457,539 | $913,293,066 | $— |
| Schwab 1000 Index Fund | 170,064,667 | 79,902,182 | 189,179,998 | 117,107,001 |
| Schwab Small-Cap Index Fund | 131,927,919 | 399,701,902 | 57,108,519 | 72,781,270 |
| Schwab Total Stock Market Index Fund | 225,603,990 | 45,585,913 | 218,157,695 | — |
| Schwab U.S. Large-Cap Growth Index Fund | 6,371,109 | 9,905,946 | 3,820,481 | — |
| Schwab U.S. Large-Cap Value Index Fund | 17,495,710 | 10,244,421 | 7,759,956 | — |
| Schwab U.S. Mid-Cap Index Fund | 11,729,695 | 14,728,113 | 8,319,433 | — |
| Schwab International Index Fund | 287,643,160 | — | 134,266,147 | — |
Denver, Colorado
December 16, 2022
| Schwab S&P 500 Index Fund | 95.38% |
| Schwab 1000 Index Fund | 96.23% |
| Schwab Small-Cap Index Fund | 46.88% |
| Schwab Total Stock Market Index Fund | 91.04% |
| Schwab U.S. Large-Cap Growth Index Fund | 82.99% |
| Schwab U.S. Large-Cap Value Index Fund | 58.00% |
| Schwab U.S. Mid-Cap Index Fund | 71.49% |
| Schwab International Index Fund | —% |
| Schwab S&P 500 Index Fund | $827,352,159 |
| Schwab 1000 Index Fund | 169,571,883 |
| Schwab Small-Cap Index Fund | 93,271,782 |
| Schwab Total Stock Market Index Fund | 211,471,310 |
| Schwab U.S. Large-Cap Growth Index Fund | 5,391,873 |
| Schwab U.S. Large-Cap Value Index Fund | 10,503,674 |
| Schwab U.S. Mid-Cap Index Fund | 8,673,831 |
| Schwab International Index Fund | 247,613,149 |
| Schwab S&P 500 Index Fund | $65,457,539 |
| Schwab 1000 Index Fund | 79,902,182 |
| Schwab Small-Cap Index Fund | 399,701,902 |
| Schwab Total Stock Market Index Fund | 45,585,913 |
| Schwab U.S. Large-Cap Growth Index Fund | 9,905,946 |
| Schwab U.S. Large-Cap Value Index Fund | 10,244,421 |
| Schwab U.S. Mid-Cap Index Fund | 14,728,113 |
| Schwab International Index Fund | — |
| Schwab S&P 500 Index Fund | $— |
| Schwab 1000 Index Fund | 492,784 |
| Schwab Small-Cap Index Fund | 10,960,111 |
| Schwab Total Stock Market Index Fund | 10,371,753 |
| Schwab U.S. Large-Cap Growth Index Fund | 181,594 |
| Schwab U.S. Large-Cap Value Index Fund | 424,790 |
| Schwab U.S. Mid-Cap Index Fund | 1,143,524 |
| Schwab International Index Fund | — |
| Proposal – To elect each of the following individuals as trustees of the Trust: | For | Withheld |
| Walter W. Bettinger II | 1,095,577,106.505 | 115,838,980.968 |
| Richard A. Wurster | 1,117,598,789.555 | 93,817,297.918 |
| Michael J. Beer | 1,116,890,447.505 | 94,525,639.968 |
| Robert W. Burns | 1,117,915,860.110 | 93,500,227.363 |
| Nancy F. Heller | 1,119,878,732.134 | 91,537,355.339 |
| David L. Mahoney | 1,069,125,022.434 | 142,291,065.039 |
| Jane P. Moncreiff | 1,120,187,927.838 | 91,228,159.635 |
| Kiran M. Patel | 1,116,689,111.571 | 94,726,975.902 |
| Kimberly S. Patmore | 1,119,941,056.059 | 91,475,031.414 |
| J. Derek Penn | 1,117,666,014.121 | 93,750,073.352 |
| Proposal – To elect each of the following individuals as trustees of the Trust: | For | Withheld |
| Walter W. Bettinger II | 423,830,446.945 | 41,037,210.315 |
| Richard A. Wurster | 449,247,822.632 | 15,619,834.628 |
| Michael J. Beer | 449,188,616.594 | 15,679,040.666 |
| Robert W. Burns | 449,093,044.919 | 15,774,612.341 |
| Nancy F. Heller | 450,193,833.945 | 14,673,823.315 |
| David L. Mahoney | 419,552,571.056 | 45,315,086.204 |
| Jane P. Moncreiff | 450,325,483.733 | 14,542,173.527 |
| Kiran M. Patel | 448,721,580.221 | 16,146,077.039 |
| Kimberly S. Patmore | 449,526,424.435 | 15,341,232.825 |
| J. Derek Penn | 449,384,537.556 | 15,483,119.704 |
| 1. | the nature, extent and quality of the services provided to each Fund under the Agreements, including the resources of the investment adviser and its affiliates dedicated to the Funds; |
| 2. | each Fund’s investment performance and how it compared to that of certain other comparable mutual funds and benchmark data; |
| 3. | each Fund’s expenses and how those expenses compared to those of certain other similar mutual funds; |
| 4. | the profitability of the investment adviser and its affiliates, including Charles Schwab & Co., Inc. (Schwab), with respect to each Fund, including both direct and indirect benefits accruing to the investment adviser and its affiliates; and |
| 5. | the extent to which economies of scale would be realized as each Fund grows and whether fee levels in the Agreements reflect those economies of scale for the benefit of Fund investors. |
| Independent Trustees | |||
| Name, Year of Birth, and Position(s) with the trust (Terms of office, and length of Time Served1) | Principal Occupations During the Past Five Years | Number of Portfolios in Fund Complex Overseen by the Trustee | Other Directorships |
Michael J. Beer 1961 Trustee (Trustee of The Charles Schwab Family of Funds, Schwab Investments, Schwab Capital Trust, Schwab Annuity Portfolios, Schwab Strategic Trust and Laudus Trust since 2022) | Retired. Director, President and Chief Executive Officer (Dec. 2016 – Sept. 2019), Principal Funds (investment management). | 105 | Director (2016 – 2019), Principal Funds, Inc. |
| Robert W. Burns 1959 Trustee (Trustee of Schwab Strategic Trust since 2009; The Charles Schwab Family of Funds, Schwab Investments, Schwab Capital Trust, Schwab Annuity Portfolios and Laudus Trust since 2016) | Retired/Private Investor. | 105 | None |
| Nancy F. Heller 1956 Trustee (Trustee of The Charles Schwab Family of Funds, Schwab Investments, Schwab Capital Trust, Schwab Annuity Portfolios, Schwab Strategic Trust and Laudus Trust since 2018) | Retired. | 105 | None |
| David L. Mahoney 1954 Trustee (Trustee of The Charles Schwab Family of Funds, Schwab Investments, Schwab Capital Trust, Schwab Annuity Portfolios and Laudus Trust since 2011; Schwab Strategic Trust since 2016) | Private Investor. | 105 | Director (2004 – present), Corcept Therapeutics Incorporated Director (2009 – 2021), Adamas Pharmaceuticals, Inc. Director (2003 – 2019), Symantec Corporation |
| Jane P. Moncreiff 1961 Trustee (Trustee of The Charles Schwab Family of Funds, Schwab Investments, Schwab Capital Trust, Schwab Annuity Portfolios, Schwab Strategic Trust and Laudus Trust since 2019) | Consultant (2018 – present), Fulham Advisers LLC (management consulting); Chief Investment Officer (2009 – 2017), CareGroup Healthcare System, Inc. (healthcare). | 105 | None |
| Independent Trustees (continued) | |||
| Name, Year of Birth, and Position(s) with the trust (Terms of office, and length of Time Served1) | Principal Occupations During the Past Five Years | Number of Portfolios in Fund Complex Overseen by the Trustee | Other Directorships |
| Kiran M. Patel 1948 Trustee (Trustee of The Charles Schwab Family of Funds, Schwab Investments, Schwab Capital Trust, Schwab Annuity Portfolios and Laudus Trust since 2011; Schwab Strategic Trust since 2016) | Retired. | 105 | Director (2008 – present), KLA-Tencor Corporation |
| Kimberly S. Patmore 1956 Trustee (Trustee of The Charles Schwab Family of Funds, Schwab Investments, Schwab Capital Trust, Schwab Annuity Portfolios, Schwab Strategic Trust and Laudus Trust since 2016) | Consultant (2008 – present), Patmore Management Consulting (management consulting). | 105 | None |
J. Derek Penn 1957 Trustee (Trustee of The Charles Schwab Family of Funds, Schwab Investments, Schwab Capital Trust, Schwab Annuity Portfolios, Schwab Strategic Trust and Laudus Trust since 2021) | Head of Equity Sales and Trading (2006 – 2018), BNY Mellon (financial services). | 105 | None |
| Interested Trustees | |||
| Name, Year of Birth, and Position(s) with the trust (Terms of office, and length of Time Served1) | Principal Occupations During the Past Five Years | Number of Portfolios in Fund Complex Overseen by the Trustee | Other Directorships |
| Walter W. Bettinger II2 1960 Chairman and Trustee (Trustee of The Charles Schwab Family of Funds, Schwab Investments, Schwab Capital Trust and Schwab Annuity Portfolios since 2008; Schwab Strategic Trust since 2009; Laudus Trust since 2010) | Co-Chairman of the Board (July 2022 – present), Director and Chief Executive Officer (Oct. 2008 – present) and President (Feb. 2007 – Oct. 2021), The Charles Schwab Corporation; President and Chief Executive Officer (Oct. 2008 – Oct. 2021) and Director (May 2008 – Oct. 2021), Charles Schwab & Co., Inc.; Director (Apr. 2006 – present), Charles Schwab Bank, SSB; Director (Nov. 2017 – present), Charles Schwab Premier Bank, SSB; Director (July 2019 – present), Charles Schwab Trust Bank; Director (May 2008 – present), Chief Executive Officer (Aug. 2017 – present) and President (Aug. 2017 – Nov. 2021), Schwab Holdings, Inc.; Director (Oct. 2020 – present), TD Ameritrade Holding Corporation; Director (July 2016 – Oct. 2021), Charles Schwab Investment Management, Inc. | 105 | Director (2008 – present), The Charles Schwab Corporation |
| Interested Trustees (continued) | |||
| Name, Year of Birth, and Position(s) with the trust (Terms of office, and length of Time Served1) | Principal Occupations During the Past Five Years | Number of Portfolios in Fund Complex Overseen by the Trustee | Other Directorships |
| Richard A. Wurster2 1973 Trustee (Trustee of The Charles Schwab Family of Funds, Schwab Investments, Schwab Capital Trust, Schwab Annuity Portfolios, Schwab Strategic Trust and Laudus Trust since 2022) | President (Oct. 2021 – present) and Executive Vice President – Schwab Asset Management Solutions (Apr. 2019 – Oct. 2021), The Charles Schwab Corporation; President, Director (Oct. 2021 – present), Executive Vice President – Schwab Asset Management Solutions (July 2019 – Oct. 2021) and Senior Vice President – Advisory (May 2016 – July 2019), Charles Schwab & Co., Inc.; President (Nov. 2021 – present), Schwab Holdings, Inc.; Director (Oct. 2021 – present) and Chief Executive Officer (Nov. 2019 – Jan. 2022), Charles Schwab Investment Management, Inc.; Director, Chief Executive Officer and President (Mar. 2018 – Oct. 2022), Charles Schwab Investment Advisory, Inc.; Chief Executive Officer (July 2016 – Apr. 2018) and President (Mar. 2017 – Apr. 2018), ThomasPartners, Inc.; Chief Executive Officer (July 2016 – Apr. 2018), Windhaven Investment Management, Inc. | 105 | None |
| Officers of the Trust | |
| Name, Year of Birth, and Position(s) with the trust (Terms of office, and length of Time Served3) | Principal Occupations During the Past Five Years |
| Jonathan de St. Paer 1973 President and Chief Executive Officer (Officer of The Charles Schwab Family of Funds, Schwab Investments, Schwab Capital Trust, Schwab Annuity Portfolios, Schwab Strategic Trust and Laudus Trust since 2018) | Director (Apr. 2019 – present), President (Oct. 2018 – present), Chief Operating Officer (Jan. 2021 – present), and Chief Executive Officer (Apr. 2019 – Nov. 2019), Charles Schwab Investment Management, Inc.; Senior Vice President (June 2020 – Mar. 2022) and Chief Operating Officer (Jan. 2021 – Mar. 2022), Charles Schwab Investment Advisory, Inc.; Chief Executive Officer (Apr. 2019 – present), President (Nov. 2018 – present) and Trustee (Apr. 2019 – Dec. 2020), Schwab Funds, Laudus Trust and Schwab ETFs; Managing Director (May 2022 – present), Senior Vice President (Apr. 2019 – May 2022) and Senior Vice President – Strategy and Product Development (CSIM) (Jan. 2014 – Mar. 2019), Charles Schwab & Co., Inc. |
| Mark Fischer 1970 Treasurer, Chief Financial Officer and Chief Operating Officer (Officer of The Charles Schwab Family of Funds, Schwab Investments, Schwab Capital Trust, Schwab Annuity Portfolios, Schwab Strategic Trust and Laudus Trust since 2013) | Treasurer and Chief Financial Officer (Jan. 2016 – present) and Chief Operating Officer (Dec. 2020 – present), Schwab Funds, Laudus Trust and Schwab ETFs; Chief Financial Officer (Mar. 2020 – present) and Vice President (Oct. 2013 – present), Charles Schwab Investment Management, Inc. |
| Omar Aguilar 1970 Vice President and Chief Investment Officer (Officer of The Charles Schwab Family of Funds, Schwab Investments, Schwab Capital Trust, Schwab Annuity Portfolios, Schwab Strategic Trust and Laudus Trust since 2011) | Chief Executive Officer (Jan. 2022 – present), Chief Investment Officer (Apr. 2011 – present) and Senior Vice President (Apr. 2011 – Dec. 2021), Charles Schwab Investment Management, Inc.; Director, Chief Executive Officer and President (Oct. 2022 – present), Charles Schwab Investment Advisory, Inc.; Vice President and Chief Investment Officer (June 2011 – present), Schwab Funds, Laudus Trust and Schwab ETFs. |
| Brett Wander 1961 Vice President and Chief Investment Officer (Officer of The Charles Schwab Family of Funds, Schwab Investments, Schwab Capital Trust, Schwab Annuity Portfolios, Schwab Strategic Trust and Laudus Trust since 2011) | Senior Vice President and Chief Investment Officer (Apr. 2011 – present), Charles Schwab Investment Management, Inc.; Vice President and Chief Investment Officer (June 2011 – present), Schwab Funds, Laudus Trust and Schwab ETFs. |
| William P. McMahon, Jr. 1972 Vice President and Chief Investment Officer (Officer of The Charles Schwab Family of Funds, Schwab Investments, Schwab Capital Trust, Schwab Annuity Portfolios, Schwab Strategic Trust and Laudus Trust since 2021) | Senior Vice President and Chief Investment Officer (Jan. 2020 – present), Charles Schwab Investment Management, Inc.; Vice President and Chief Investment Officer (June 2021 – present), Schwab Funds, Laudus Trust and Schwab ETFs; Senior Vice President and Chief Investment Officer – ThomasPartners Strategies (Apr. 2018 – Dec. 2019), Charles Schwab Investment Advisory, Inc.; Senior Vice President and Chief Investment Officer (May 2001 – Apr. 2018), ThomasPartners, Inc. |
| Officers of the Trust (continued) | |
| Name, Year of Birth, and Position(s) with the trust (Terms of office, and length of Time Served3) | Principal Occupations During the Past Five Years |
| Catherine MacGregor 1964 Chief Legal Officer and Secretary, Schwab Funds and Schwab ETFs Chief Legal Officer, Vice President and Clerk, Laudus Trust (Officer of The Charles Schwab Family of Funds, Schwab Investments, Schwab Capital Trust, Schwab Annuity Portfolios and Laudus Trust since 2005; Schwab Strategic Trust since 2009) | Chief Legal Officer (Mar. 2022 – present) and Vice President (Sept. 2005 – present), Charles Schwab Investment Management, Inc.; Managing Director (May 2022 – present) and Vice President (July 2005 – May 2022), Charles Schwab & Co., Inc.; Vice President (Dec. 2005 – present) and Chief Legal Officer and Clerk (Mar. 2007 – present), Laudus Trust; Chief Legal Officer and Secretary (Oct. 2021 – present), Vice President (Nov. 2005 – Oct. 2021) and Assistant Secretary (June 2007 – Oct. 2021), Schwab Funds; Chief Legal Officer and Secretary (Oct. 2021 – present), Vice President and Assistant Secretary (Oct. 2009 – Oct. 2021), Schwab ETFs. |
| 1 | Each Trustee shall hold office until the election and qualification of his or her successor, or until he or she dies, resigns or is removed. The retirement policy requires that each independent trustee retire by December 31 of the year in which the Trustee turns 74 or the Trustee’s twentieth year of service as an independent trustee on any trust in the Fund Complex, whichever occurs first. |
| 2 | Mr. Bettinger and Mr. Wurster are Interested Trustees. Mr. Bettinger and Mr. Wurster are Interested Trustees because each owns stock of The Charles Schwab Corporation (CSC), the parent company of Charles Schwab Investment Management, Inc., the investment adviser for the trusts in the Fund Complex, and is an employee of Charles Schwab & Co., Inc. (Schwab), the principal underwriter for The Charles Schwab Family of Funds, Schwab Investments, Schwab Capital Trust, Schwab Annuity Portfolios and Laudus Trust. |
| 3 | The President, Treasurer and Secretary/Clerk hold office until their respective successors are chosen and qualified or until he or she sooner dies, resigns, is removed or becomes disqualified. Each of the other officers serves at the pleasure of the Board. |
Schwab Funds
Member SIPC®
Printed on recycled paper.
| ¹ | State, local, and the Federal Alternative Minimum Tax may apply. Capital gains are not exempt from Federal Taxation. |
| ² | You could lose money by investing in the Schwab Money Funds. All Schwab Money Funds with the exception of Schwab Variable Share Price Money Fund seek to preserve the value of your investment at $1.00 per share, but cannot guarantee they will do so. Because the share price of Schwab Variable Share Price Money Fund will fluctuate, when you sell your shares they may be worth more or less than what you originally paid for them. All Schwab Money Funds with the exception of Schwab Government Money Fund, Schwab Retirement Government Money Fund, Schwab U.S. Treasury Money Fund, Schwab Treasury Obligations Money Fund and Schwab Government Money Market Portfolio may impose a fee upon the sale of your shares or may temporarily suspend your ability to sell shares if the Fund’s liquidity falls below required minimums because of market conditions or other factors. An investment in the Schwab Money Funds is not insured or guaranteed by the Federal Deposit Insurance Corporation or any other government agency. The Schwab Money Funds’ sponsor has no legal obligation to provide financial support to the Funds, and you should not expect that the sponsor will provide financial support to the Funds at any time. |

US Large Company Index Fund
US Small Company Index Fund
Large Company Index Fund
Small Company Index Fund
Large Company Index Fund
| * | SCHWAB is a registered trademark of Charles Schwab & Co., Inc. FUNDAMENTAL INDEX is a registered trademark of Research Affiliates LLC. |
| Total Return for the 12 Months Ended October 31, 2022 | |
| Schwab Fundamental US Large Company Index Fund (Ticker Symbol: SFLNX) | -4.18% |
| Russell RAFITM US Large Company Index | -3.88% |
| Russell 1000® Index | -16.38% |
| Fund Category: Morningstar Large Value1 | -4.53% |
| Performance Details | pages 7-9 |
| Schwab Fundamental US Small Company Index Fund (Ticker Symbol: SFSNX) | -11.37% |
| Russell RAFITM US Small Company Index | -11.18% |
| Russell 2000® Index | -18.54% |
| Fund Category: Morningstar Small Blend1 | -13.55% |
| Performance Details | pages 10-12 |
| Schwab Fundamental International Large Company Index Fund2 (Ticker Symbol: SFNNX) | -17.25% |
| Russell RAFITM Developed ex US Large Company Index (Net)3 | -16.82% |
| MSCI EAFE® Index (Net)3 | -23.00% |
| Fund Category: Morningstar Foreign Large Value1 | -18.49% |
| Performance Details | pages 13-15 |
| Total Return for the 12 Months Ended October 31, 2022 | |
| Schwab Fundamental International Small Company Index Fund2 (Ticker Symbol: SFILX) | -26.61% |
| Russell RAFITM Developed ex US Small Company Index (Net)3 | -26.14% |
| S&P Developed ex-U.S. Small Cap Index (Net)3 | -30.95% |
| Fund Category: Morningstar Foreign Small/Mid Value1 | -21.18% |
| Performance Details | pages 16-18 |
| Schwab Fundamental Emerging Markets Large Company Index Fund2 (Ticker Symbol: SFENX) | -24.86% |
| Russell RAFITM Emerging Markets Large Company Index (Net)3 | -25.58% |
| MSCI Emerging Markets Index (Net)3 | -31.03% |
| Fund Category: Morningstar Diversified Emerging Markets1 | -30.38% |
| Performance Details | pages 19-21 |
| 1 | Source for category information: Morningstar, Inc. The Morningstar Category return represents all active and index mutual funds and ETFs within the category as of the report date. |
| 2 | The fund’s performance relative to the index may be affected by fair-value pricing and timing differences in foreign exchange calculations. See financial note 2 for more information. |
| 3 | The net version of the index reflects reinvested dividends net of withholding taxes but reflects no deductions for expenses or other taxes. |

President of Schwab Asset
Management and the funds
covered in this report.

| * | The net version of the index reflects reinvested dividends net of withholding taxes but reflects no deductions for expenses or other taxes. |

| * | The net version of the index reflects reinvested dividends net of withholding taxes but reflects no deductions for expenses or other taxes. |
 | Christopher Bliss, CFA, Managing Director and Head of Passive Equity Strategies for Schwab Asset Management, is responsible for overseeing the investment process and portfolio management of investment strategies for passive equity Schwab Funds and Schwab ETFs. Before joining Schwab in 2016, Mr. Bliss spent 12 years at BlackRock (formerly Barclays Global Investors) managing and leading institutional index teams, most recently as a managing director and the head of the Americas institutional index team. In this role, Mr. Bliss was responsible for overseeing a team of portfolio managers managing domestic, developed international and emerging markets index strategies. Prior to BlackRock, he worked as an equity analyst and portfolio manager for Harris Bretall and before that, as a research analyst for JP Morgan. |
 | Jeremy Brown, CFA, Senior Portfolio Manager, is responsible for the day-to-day co-management of the Schwab Fundamental US Large Company Index Fund and Schwab Fundamental US Small Company Index Fund. Prior to joining Schwab in 2017, Mr. Brown spent six years with ALPS Advisors, Inc. in Denver, most recently as a senior analyst on the ETF portfolio management and research team where he performed portfolio management, trading, and analytics/research functions for ALPS ETFs and passive funds. Additionally, Mr. Brown led a number of investment research, commentary, industry trend analysis, and sales and marketing support initiatives. |
 | Chuck Craig, CFA, Senior Portfolio Manager, is responsible for the oversight and day-to-day co-management of the Schwab Fundamental International Large Company Index Fund, Schwab Fundamental International Small Company Index Fund, and Schwab Fundamental Emerging Markets Large Company Index Fund. Prior to joining Schwab in 2012, Mr. Craig worked at Guggenheim Funds (formerly Claymore Group), where he spent more than five years as a managing director of portfolio management and supervision, and three years as vice president of product research and development. Prior to that, he worked as an equity research analyst at First Trust Portfolios (formerly Niké Securities), and a trader and analyst at PMA Securities, Inc. |
 | Ferian Juwono, CFA, Senior Portfolio Manager, is responsible for the day-to-day co-management of the Schwab Fundamental US Large Company Index Fund and Schwab Fundamental US Small Company Index Fund. Prior to joining Schwab in 2010, Mr. Juwono worked at BlackRock (formerly Barclays Global Investors) where he spent more than three years as a portfolio manager, managing equity index funds for institutional clients, and two years as a senior business analyst. Prior to that, Mr. Juwono worked for more than four years as a senior financial analyst with Union Bank of California. |
 | David Rios, Portfolio Manager, is responsible for the day-to-day co-management of the Schwab Fundamental International Large Company Index Fund, Schwab Fundamental International Small Company Index Fund, and Schwab Fundamental Emerging Markets Large Company Index Fund. Prior to this role, Mr. Rios was an associate portfolio manager on the equity index strategies team for four years. His first role with Schwab Asset Management was as a trade operations specialist. Prior to joining Schwab in 2008, Mr. Rios was a senior fund accountant at Investors Bank & Trust (subsequently acquired by State Street Corporation). |
 | Sabya Sinha, Portfolio Manager, is responsible for the day-to-day co-management of the Schwab Fundamental US Large Company Index Fund and Schwab Fundamental US Small Company Index Fund. Prior to joining Schwab in 2015, Mr. Sinha spent a year at F-Squared Investments on the product development and analytics team. Prior to F-Squared, he worked at IndexIQ Advisors as a senior index portfolio manager for three years and for Bank of America’s Columbia Management subsidiary as a portfolio manager for three years. Mr. Sinha also spent time as a software consultant at DPM Mellon, LLC and an equity trader at Jane Street Capital. |
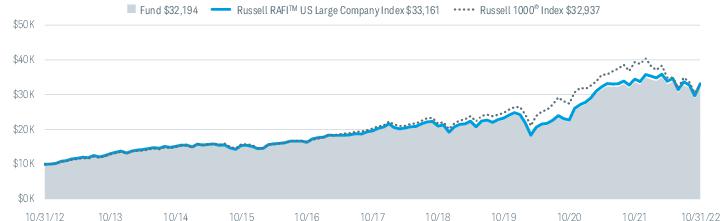
| Fund and Inception Date | 1 Year | 5 Years | 10 Years |
| Fund: Schwab Fundamental US Large Company Index Fund (4/2/07) | -4.18% | 10.84% | 12.40% |
| Russell RAFITM US Large Company Index | -3.88% | 11.10% | 12.74% |
| Russell 1000® Index | -16.38% | 10.19% | 12.66% |
| Fund Category: Morningstar Large Value2 | -4.53% | 7.67% | 10.21% |
| Fund Expense Ratio3: 0.25% | |||
| 1 | Performance does not reflect the deduction of taxes that a shareholder would pay on fund distributions or the redemption of fund shares. |
| 2 | Source for category information: Morningstar, Inc. The Morningstar Category return represents all active and index mutual funds and ETFs within the category as of the report date. |
| 3 | As stated in the prospectus. |
| Number of Holdings | 721 |
| Weighted Average Market Cap (millions) | $286,619 |
| Price/Earnings Ratio (P/E) | 13.2 |
| Price/Book Ratio (P/B) | 2.3 |
| Portfolio Turnover Rate | 13% 2 |
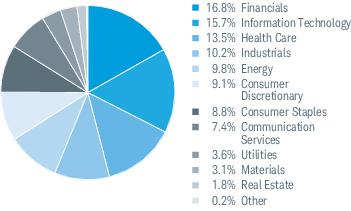
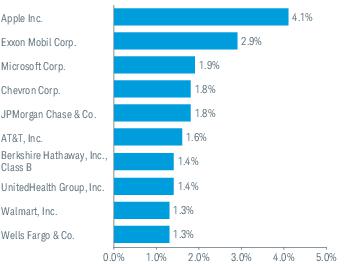
| 1 | Excludes derivatives. |
| 2 | Portfolio turnover rate excludes in-kind transactions. |
| 3 | The percentage may differ from the Portfolio Holdings because the above calculation is based on a percentage of total investments, excluding derivatives, whereas the calculation in the Portfolio Holdings is based on a percentage of net assets. |
| 4 | This list is not a recommendation of any security by the investment adviser. |
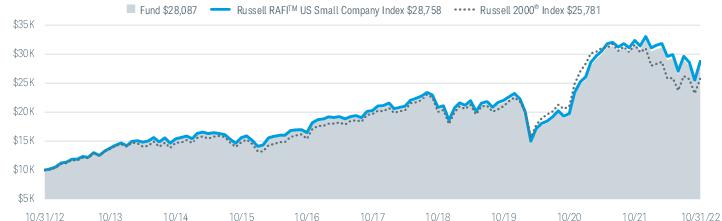
| Fund and Inception Date | 1 Year | 5 Years | 10 Years |
| Fund: Schwab Fundamental US Small Company Index Fund (4/2/07) | -11.37% | 7.05% | 10.88% |
| Russell RAFITM US Small Company Index | -11.18% | 7.24% | 11.14% |
| Russell 2000® Index | -18.54% | 5.56% | 9.93% |
| Fund Category: Morningstar Small Blend2 | -13.55% | 5.76% | 9.75% |
| Fund Expense Ratio3: 0.25% | |||
| 1 | Performance does not reflect the deduction of taxes that a shareholder would pay on fund distributions or the redemption of fund shares. |
| 2 | Source for category information: Morningstar, Inc. The Morningstar Category return represents all active and index mutual funds and ETFs within the category as of the report date. |
| 3 | As stated in the prospectus. |
| Number of Holdings | 975 |
| Weighted Average Market Cap (millions) | $4,736 |
| Price/Earnings Ratio (P/E) | 12.8 |
| Price/Book Ratio (P/B) | 1.7 |
| Portfolio Turnover Rate | 35% 2 |
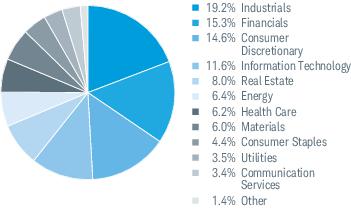
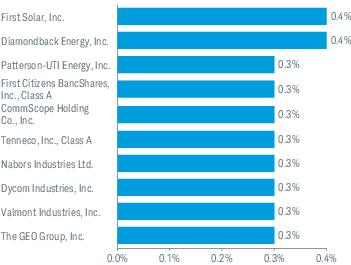
| 1 | Excludes derivatives. |
| 2 | Portfolio turnover rate excludes in-kind transactions. |
| 3 | The percentage may differ from the Portfolio Holdings because the above calculation is based on a percentage of total investments, excluding derivatives, whereas the calculation in the Portfolio Holdings is based on a percentage of net assets. |
| 4 | This list is not a recommendation of any security by the investment adviser. |
| 1 | The total return cited for the index reflects reinvested dividends net of withholding taxes but reflects no deductions for expenses or other taxes. |
| 2 | Typically, the securities in the index are valued using foreign exchange rates obtained at the close of the London foreign currency exchange (11:00 AM EST). Securities in the fund, however, are valued using foreign exchange rates obtained at the close of the New York foreign currency exchange (4:00 PM EST). This difference in closing times can result in different foreign currency exchange rates between the two exchanges, and thus different foreign currency exchange rates used in the valuation of the index’s and fund’s securities. |
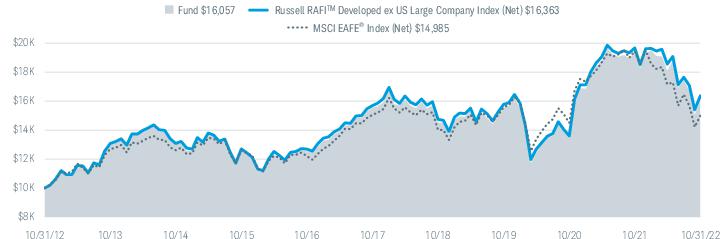
| Fund and Inception Date | 1 Year | 5 Years | 10 Years |
| Fund: Schwab Fundamental International Large Company Index Fund (4/2/07) | -17.25% | 0.67% | 4.85% |
| Russell RAFITM Developed ex US Large Company Index (Net)2 | -16.82% | 0.84% | 5.05% |
| MSCI EAFE® Index (Net)2 | -23.00% | -0.09% | 4.13% |
| Fund Category: Morningstar Foreign Large Value4 | -18.49% | -1.08% | 3.04% |
| Fund Expense Ratio5: 0.25% | |||
| 1 | Performance does not reflect the deduction of taxes that a shareholder would pay on fund distributions or the redemption of fund shares. |
| 2 | The net version of the index reflects reinvested dividends net of withholding taxes but reflects no deductions for expenses or other taxes. |
| 3 | The fund’s performance relative to the index may be affected by fair-value pricing. See financial note 2 for more information. |
| 4 | Source for category information: Morningstar, Inc. The Morningstar Category return represents all active and index mutual funds and ETFs within the category as of the report date. |
| 5 | As stated in the prospectus. |
| Number of Holdings | 948 |
| Weighted Average Market Cap (millions) | $58,156 |
| Price/Earnings Ratio (P/E) | 8.5 |
| Price/Book Ratio (P/B) | 1.0 |
| Portfolio Turnover Rate | 13% |
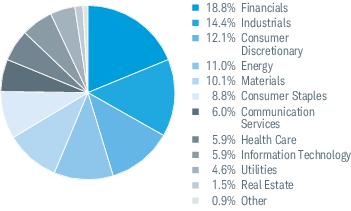
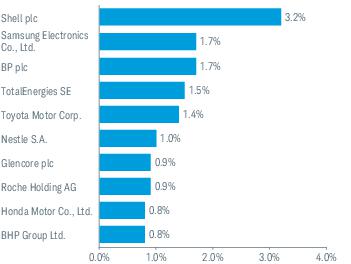
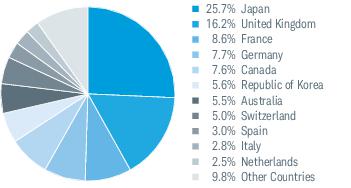
| 1 | Excludes derivatives. |
| 2 | This list is not a recommendation of any security by the investment adviser. |
| 3 | The percentage may differ from the Portfolio Holdings because the above calculation is based on a percentage of total investments, excluding derivatives, whereas the calculation in the Portfolio Holdings is based on a percentage of net assets. |
| 1 | The total return cited for the index reflects reinvested dividends net of withholding taxes but reflects no deductions for expenses or other taxes. |
| 2 | Typically, the securities in the index are valued using foreign exchange rates obtained at the close of the London foreign currency exchange (11:00 AM EST). Securities in the fund, however, are valued using foreign exchange rates obtained at the close of the New York foreign currency exchange (4:00 PM EST). This difference in closing times can result in different foreign currency exchange rates between the two exchanges, and thus different foreign currency exchange rates used in the valuation of the index’s and fund’s securities. |
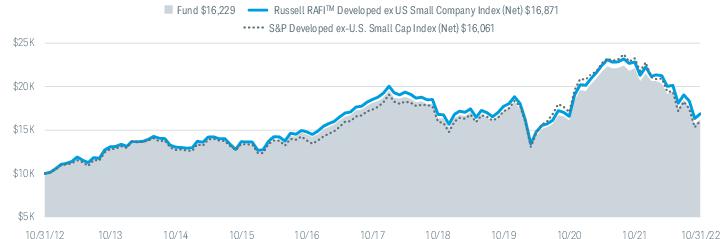
| Fund and Inception Date | 1 Year | 5 Years | 10 Years |
| Fund: Schwab Fundamental International Small Company Index Fund (1/31/08) | -26.61% | -2.19% | 4.96% |
| Russell RAFITM Developed ex US Small Company Index (Net)2 | -26.14% | -1.86% | 5.37% |
| S&P Developed ex-U.S. Small Cap Index (Net)2 | -30.95% | -1.55% | 4.85% |
| Fund Category: Morningstar Foreign Small/Mid Value4 | -21.18% | -1.47% | 4.17% |
| Fund Expense Ratio5: 0.39% | |||
| 1 | Performance does not reflect the deduction of taxes that a shareholder would pay on fund distributions or the redemption of fund shares. |
| 2 | The net version of the index reflects reinvested dividends net of withholding taxes but reflects no deductions for expenses or other taxes. |
| 3 | The fund’s performance relative to the index may be affected by fair-value pricing. See financial note 2 for more information. |
| 4 | Source for category information: Morningstar, Inc. The Morningstar Category return represents all active and index mutual funds and ETFs within the category as of the report date. |
| 5 | As stated in the prospectus. |
| Number of Holdings | 1,787 |
| Weighted Average Market Cap (millions) | $2,958 |
| Price/Earnings Ratio (P/E) | 9.2 |
| Price/Book Ratio (P/B) | 0.9 |
| Portfolio Turnover Rate | 36% |
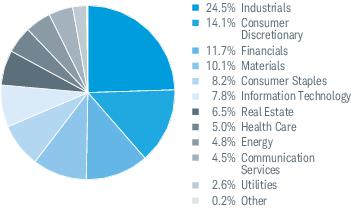
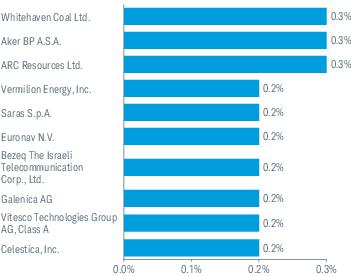
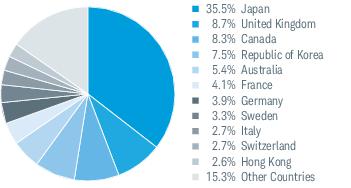
| 1 | Excludes derivatives. |
| 2 | This list is not a recommendation of any security by the investment adviser. |
| 3 | The percentage may differ from the Portfolio Holdings because the above calculation is based on a percentage of total investments, excluding derivatives, whereas the calculation in the Portfolio Holdings is based on a percentage of net assets. |
| 1 | The total return cited for the index reflects reinvested dividends net of withholding taxes but reflects no deductions for expenses or other taxes. |
| 2 | Typically, the securities in the index are valued using foreign exchange rates obtained at the close of the London foreign currency exchange (11:00 AM EST). Securities in the fund, however, are valued using foreign exchange rates obtained at the close of the New York foreign currency exchange (4:00 PM EST). This difference in closing times can result in different foreign currency exchange rates between the two exchanges, and thus different foreign currency exchange rates used in the valuation of the index’s and fund’s securities. |
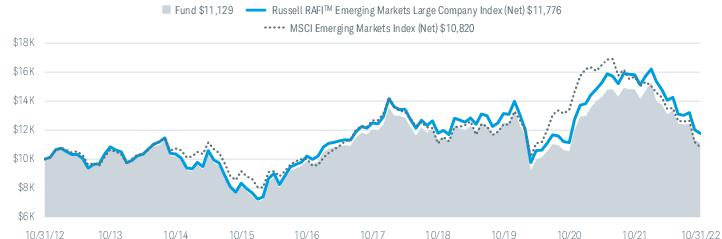
| Fund and Inception Date | 1 Year | 5 Years | 10 Years |
| Fund: Schwab Fundamental Emerging Markets Large Company Index Fund (1/31/08) | -24.86% | -1.55% | 1.08% |
| Russell RAFITM Emerging Markets Large Company Index (Net)2 | -25.58% | -1.17% | 1.65% |
| MSCI Emerging Markets Index (Net)2 | -31.03% | -3.09% | 0.79% |
| Fund Category: Morningstar Diversified Emerging Markets4 | -30.38% | -2.59% | 1.01% |
| Fund Expense Ratio5: 0.39% | |||
| 1 | Performance does not reflect the deduction of taxes that a shareholder would pay on fund distributions or the redemption of fund shares. |
| 2 | The net version of the index reflects reinvested dividends net of withholding taxes but reflects no deductions for expenses or other taxes. |
| 3 | The fund’s performance relative to the index may be affected by fair-value pricing. See financial note 2 for more information. |
| 4 | Source for category information: Morningstar, Inc. The Morningstar Category return represents all active and index mutual funds and ETFs within the category as of the report date. |
| 5 | As stated in the prospectus. |
| Number of Holdings | 330 |
| Weighted Average Market Cap (millions) | $61,096 |
| Price/Earnings Ratio (P/E) | 6.2 |
| Price/Book Ratio (P/B) | 1.1 |
| Portfolio Turnover Rate | 24% |
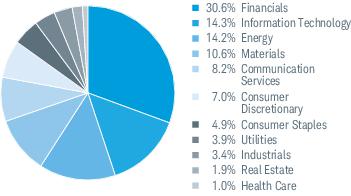
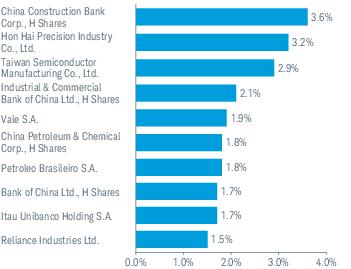
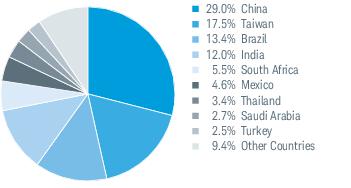
| 1 | Excludes derivatives. |
| 2 | This list is not a recommendation of any security by the investment adviser. |
| 3 | The percentage may differ from the Portfolio Holdings because the above calculation is based on a percentage of total investments, excluding derivatives, whereas the calculation in the Portfolio Holdings is based on a percentage of net assets. |
| EXPENSE RATIO (ANNUALIZED) 1 | BEGINNING ACCOUNT VALUE AT 5/1/22 | ENDING ACCOUNT VALUE (NET OF EXPENSES) AT 10/31/22 | EXPENSES PAID DURING PERIOD 5/1/22-10/31/22 2 | |
| Schwab Fundamental US Large Company Index Fund | ||||
| Actual Return | 0.25% | $1,000.00 | $ 976.90 | $1.25 |
| Hypothetical 5% Return | 0.25% | $1,000.00 | $1,023.95 | $1.28 |
| Schwab Fundamental US Small Company Index Fund | ||||
| Actual Return | 0.25% | $1,000.00 | $ 970.00 | $1.24 |
| Hypothetical 5% Return | 0.25% | $1,000.00 | $1,023.95 | $1.28 |
| Schwab Fundamental International Large Company Index Fund | ||||
| Actual Return | 0.25% | $1,000.00 | $ 887.10 | $1.19 |
| Hypothetical 5% Return | 0.25% | $1,000.00 | $1,023.95 | $1.28 |
| Schwab Fundamental International Small Company Index Fund | ||||
| Actual Return | 0.39% | $1,000.00 | $ 847.40 | $1.82 |
| Hypothetical 5% Return | 0.39% | $1,000.00 | $1,023.24 | $1.99 |
| Schwab Fundamental Emerging Markets Large Company Index Fund | ||||
| Actual Return | 0.39% | $1,000.00 | $ 850.70 | $1.82 |
| Hypothetical 5% Return | 0.39% | $1,000.00 | $1,023.24 | $1.99 |
| 1 | Based on the most recent six-month expense ratio. |
| 2 | Expenses for each fund are equal to its annualized expense ratio, multiplied by the average account value over the period, multiplied by the 184 days of the period, and divided by the 365 days of the fiscal year. |
| 11/1/21– 10/31/22 | 11/1/20– 10/31/21 | 11/1/19– 10/31/20 | 11/1/18– 10/31/19 | 11/1/17– 10/31/18 | ||
| Per-Share Data | ||||||
| Net asset value at beginning of period | $23.19 | $16.28 | $17.56 | $17.47 | $16.89 | |
| Income (loss) from investment operations: | ||||||
| Net investment income (loss)1 | 0.43 | 0.39 | 0.42 | 0.42 | 0.38 | |
| Net realized and unrealized gains (losses) | (1.33) | 7.64 | (0.75) | 1.08 | 0.76 | |
| Total from investment operations | (0.90) | 8.03 | (0.33) | 1.50 | 1.14 | |
| Less distributions: | ||||||
| Distributions from net investment income | (0.40) | (0.44) | (0.43) | (0.42) | (0.36) | |
| Distributions from net realized gains | (0.70) | (0.68) | (0.52) | (0.99) | (0.20) | |
| Total distributions | (1.10) | (1.12) | (0.95) | (1.41) | (0.56) | |
| Net asset value at end of period | $21.19 | $23.19 | $16.28 | $17.56 | $17.47 | |
| Total return | (4.18%) | 51.33% | (2.33%) | 10.56% | 6.83% | |
| Ratios/Supplemental Data | ||||||
| Ratios to average net assets: | ||||||
| Total expenses | 0.25% 2 | 0.25% | 0.25% | 0.25% | 0.25% | |
| Net investment income (loss) | 1.95% | 1.87% | 2.57% | 2.53% | 2.17% | |
| Portfolio turnover rate | 13% 3 | 16% 3 | 13% | 20% | 10% | |
| Net assets, end of period (x 1,000,000) | $6,460 | $6,821 | $4,547 | $5,237 | $4,887 | |
| 1 | Calculated based on the average shares outstanding during the period. |
| 2 | Ratio includes less than 0.005% of non-routine proxy expenses. |
| 3 | Portfolio turnover rate excludes in-kind transactions. |
| SECURITY | NUMBER OF SHARES | VALUE ($) |
| COMMON STOCKS 99.8% OF NET ASSETS | ||
| Automobiles & Components 1.6% | ||
| Adient plc * | 47,815 | 1,672,569 |
| Aptiv plc * | 49,512 | 4,509,058 |
| Autoliv, Inc. | 32,256 | 2,591,770 |
| BorgWarner, Inc. | 119,967 | 4,502,361 |
| Dana, Inc. | 106,620 | 1,701,655 |
| Ford Motor Co. | 1,892,124 | 25,297,698 |
| General Motors Co. | 951,387 | 37,341,940 |
| Gentex Corp. | 80,244 | 2,125,663 |
| Harley-Davidson, Inc. | 60,472 | 2,600,296 |
| Lear Corp. | 40,818 | 5,661,865 |
| Tesla, Inc. * | 13,957 | 3,175,776 |
| The Goodyear Tire & Rubber Co. * | 325,130 | 4,129,151 |
| Thor Industries, Inc. | 26,425 | 2,152,845 |
| Visteon Corp. * | 19,367 | 2,526,812 |
| 99,989,459 | ||
| Banks 6.9% | ||
| Bank of America Corp. | 2,012,879 | 72,544,159 |
| Citigroup, Inc. | 1,434,204 | 65,772,596 |
| Citizens Financial Group, Inc. | 169,170 | 6,919,053 |
| Comerica, Inc. | 47,291 | 3,334,016 |
| Credicorp Ltd. | 24,133 | 3,532,106 |
| East West Bancorp, Inc. | 20,441 | 1,462,962 |
| Fifth Third Bancorp | 190,721 | 6,806,833 |
| First Horizon Corp. | 70,586 | 1,730,063 |
| First Republic Bank | 11,170 | 1,341,517 |
| Huntington Bancshares, Inc. | 290,601 | 4,411,323 |
| JPMorgan Chase & Co. | 916,505 | 115,369,649 |
| KeyCorp | 237,875 | 4,250,826 |
| M&T Bank Corp. | 52,233 | 8,794,470 |
| MGIC Investment Corp. | 95,786 | 1,307,479 |
| New York Community Bancorp, Inc. | 156,261 | 1,454,790 |
| Popular, Inc. | 22,153 | 1,566,660 |
| Radian Group, Inc. | 59,640 | 1,244,687 |
| Regions Financial Corp. | 217,001 | 4,763,172 |
| Signature Bank | 5,325 | 844,172 |
| SVB Financial Group * | 3,649 | 842,773 |
| Synovus Financial Corp. | 30,726 | 1,224,431 |
| The PNC Financial Services Group, Inc. | 108,315 | 17,528,617 |
| Truist Financial Corp. | 216,709 | 9,706,396 |
| U.S. Bancorp | 434,392 | 18,439,940 |
| Wells Fargo & Co. | 1,866,309 | 85,831,551 |
| Zions Bancorp NA | 49,003 | 2,545,216 |
| 443,569,457 | ||
| Capital Goods 7.5% | ||
| 3M Co. | 172,420 | 21,688,712 |
| A.O. Smith Corp. | 28,229 | 1,546,385 |
| Acuity Brands, Inc. | 12,073 | 2,216,241 |
| AECOM | 44,529 | 3,352,143 |
| AerCap Holdings N.V. * | 46,187 | 2,466,848 |
| AGCO Corp. | 20,732 | 2,574,293 |
| SECURITY | NUMBER OF SHARES | VALUE ($) |
| Air Lease Corp. | 33,412 | 1,179,109 |
| Allegion plc | 13,652 | 1,430,320 |
| Allison Transmission Holdings, Inc. | 68,567 | 2,896,956 |
| AMETEK, Inc. | 26,567 | 3,444,677 |
| Boise Cascade Co. | 18,904 | 1,262,220 |
| Carlisle Cos., Inc. | 10,895 | 2,601,726 |
| Carrier Global Corp. | 213,771 | 8,499,535 |
| Caterpillar, Inc. | 120,863 | 26,162,005 |
| Cummins, Inc. | 54,471 | 13,318,704 |
| Curtiss-Wright Corp. | 10,292 | 1,727,306 |
| Deere & Co. | 37,892 | 14,998,411 |
| Donaldson Co., Inc. | 28,541 | 1,639,680 |
| Dover Corp. | 25,841 | 3,377,160 |
| Eaton Corp. plc | 98,304 | 14,752,481 |
| EMCOR Group, Inc. | 21,885 | 3,087,973 |
| Emerson Electric Co. | 143,760 | 12,449,616 |
| Fastenal Co. | 81,751 | 3,951,026 |
| Flowserve Corp. | 47,448 | 1,360,809 |
| Fluor Corp. * | 93,592 | 2,832,094 |
| Fortive Corp. | 34,795 | 2,223,400 |
| Fortune Brands Home & Security, Inc. | 39,993 | 2,412,378 |
| GATX Corp. | 13,566 | 1,420,496 |
| General Dynamics Corp. | 71,097 | 17,760,031 |
| General Electric Co. | 431,156 | 33,548,248 |
| Graco, Inc. | 20,253 | 1,409,204 |
| Hexcel Corp. | 27,683 | 1,541,943 |
| Honeywell International, Inc. | 141,918 | 28,954,110 |
| Howmet Aerospace, Inc. | 99,413 | 3,534,132 |
| Hubbell, Inc. | 11,864 | 2,817,463 |
| Huntington Ingalls Industries, Inc. | 16,838 | 4,328,545 |
| IDEX Corp. | 9,567 | 2,126,840 |
| Illinois Tool Works, Inc. | 57,834 | 12,349,294 |
| Ingersoll Rand, Inc. | 23,698 | 1,196,749 |
| ITT, Inc. | 18,168 | 1,387,854 |
| Johnson Controls International plc | 167,241 | 9,673,219 |
| L3Harris Technologies, Inc. | 34,011 | 8,382,691 |
| Lennox International, Inc. | 6,219 | 1,452,572 |
| Lincoln Electric Holdings, Inc. | 12,388 | 1,759,096 |
| Lockheed Martin Corp. | 51,928 | 25,272,319 |
| Masco Corp. | 58,742 | 2,717,992 |
| MasTec, Inc. * | 19,437 | 1,498,204 |
| MDU Resources Group, Inc. | 76,462 | 2,177,638 |
| MSC Industrial Direct Co., Inc., Class A | 19,606 | 1,626,906 |
| Nordson Corp. | 6,306 | 1,418,850 |
| Northrop Grumman Corp. | 30,749 | 16,881,508 |
| nVent Electric plc | 41,697 | 1,521,941 |
| Oshkosh Corp. | 29,191 | 2,568,808 |
| Otis Worldwide Corp. | 43,741 | 3,089,864 |
| Owens Corning | 38,042 | 3,256,776 |
| PACCAR, Inc. | 107,105 | 10,370,977 |
| Parker-Hannifin Corp. | 23,738 | 6,898,738 |
| Pentair plc | 40,150 | 1,724,443 |
| Quanta Services, Inc. | 31,010 | 4,404,660 |
| Raytheon Technologies Corp. | 206,635 | 19,593,131 |
| Regal Rexnord Corp. | 12,625 | 1,597,568 |
| Rockwell Automation, Inc. | 18,453 | 4,711,051 |
| Sensata Technologies Holding plc | 37,140 | 1,493,399 |
| Snap-on, Inc. | 15,579 | 3,459,317 |
| SECURITY | NUMBER OF SHARES | VALUE ($) |
| Spirit AeroSystems Holdings, Inc., Class A | 71,708 | 1,660,757 |
| Stanley Black & Decker, Inc. | 47,483 | 3,726,941 |
| Textron, Inc. | 71,385 | 4,885,589 |
| The Boeing Co. * | 167,224 | 23,831,092 |
| The Middleby Corp. * | 8,175 | 1,143,356 |
| The Timken Co. | 20,660 | 1,472,851 |
| The Toro Co. | 16,654 | 1,755,831 |
| Trane Technologies plc | 36,333 | 5,799,837 |
| TransDigm Group, Inc. | 7,918 | 4,558,868 |
| UFP Industries, Inc. | 21,227 | 1,511,999 |
| United Rentals, Inc. * | 20,965 | 6,618,860 |
| Univar Solutions, Inc. * | 64,429 | 1,641,651 |
| W.W. Grainger, Inc. | 10,092 | 5,897,260 |
| Watsco, Inc. | 7,202 | 1,951,454 |
| WESCO International, Inc. * | 16,023 | 2,207,489 |
| Westinghouse Air Brake Technologies Corp. | 27,851 | 2,597,941 |
| Xylem, Inc. | 23,513 | 2,408,437 |
| 483,048,998 | ||
| Commercial & Professional Services 0.8% | ||
| ABM Industries, Inc. | 36,217 | 1,612,019 |
| Booz Allen Hamilton Holding Corp. | 26,140 | 2,845,339 |
| CACI International, Inc., Class A * | 6,199 | 1,884,682 |
| Cintas Corp. | 10,173 | 4,349,466 |
| Copart, Inc. * | 12,852 | 1,478,237 |
| CoreCivic, Inc. * | 124,793 | 1,306,583 |
| Equifax, Inc. | 9,575 | 1,623,345 |
| Jacobs Solutions, Inc. | 31,677 | 3,649,824 |
| KBR, Inc. | 29,596 | 1,472,993 |
| Leidos Holdings, Inc. | 46,082 | 4,681,470 |
| ManpowerGroup, Inc. | 55,747 | 4,367,220 |
| Republic Services, Inc. | 33,757 | 4,476,853 |
| Robert Half International, Inc. | 31,095 | 2,377,524 |
| Science Applications International Corp. | 20,309 | 2,200,277 |
| TransUnion | 16,277 | 964,738 |
| Verisk Analytics, Inc. | 12,848 | 2,349,000 |
| Waste Management, Inc. | 66,594 | 10,546,492 |
| 52,186,062 | ||
| Consumer Durables & Apparel 1.2% | ||
| Brunswick Corp. | 24,596 | 1,738,199 |
| Capri Holdings Ltd. * | 45,265 | 2,067,705 |
| Carter's, Inc. | 19,858 | 1,347,762 |
| D.R. Horton, Inc. | 100,840 | 7,752,579 |
| Deckers Outdoor Corp. * | 4,530 | 1,585,183 |
| Hanesbrands, Inc. | 195,015 | 1,330,002 |
| Hasbro, Inc. | 26,862 | 1,752,746 |
| KB Home | 38,651 | 1,113,922 |
| Leggett & Platt, Inc. | 53,408 | 1,802,520 |
| Lennar Corp., Class A | 91,158 | 7,356,451 |
| Lululemon Athletica, Inc. * | 7,106 | 2,338,158 |
| Meritage Homes Corp. * | 17,377 | 1,323,432 |
| Mohawk Industries, Inc. * | 29,178 | 2,764,615 |
| Newell Brands, Inc. | 127,926 | 1,766,658 |
| NIKE, Inc., Class B | 136,200 | 12,623,016 |
| NVR, Inc. * | 842 | 3,568,185 |
| Polaris, Inc. | 18,141 | 1,843,126 |
| PulteGroup, Inc. | 124,134 | 4,964,119 |
| PVH Corp. | 43,297 | 2,222,002 |
| Ralph Lauren Corp. | 18,438 | 1,709,018 |
| Skechers U.S.A., Inc., Class A * | 35,174 | 1,211,041 |
| Tapestry, Inc. | 82,686 | 2,619,492 |
| Taylor Morrison Home Corp. * | 58,875 | 1,550,768 |
| Toll Brothers, Inc. | 51,042 | 2,198,889 |
| SECURITY | NUMBER OF SHARES | VALUE ($) |
| Tri Pointe Homes, Inc. * | 75,286 | 1,261,041 |
| VF Corp. | 98,535 | 2,783,614 |
| Whirlpool Corp. | 32,332 | 4,469,576 |
| 79,063,819 | ||
| Consumer Services 1.9% | ||
| Aramark | 89,414 | 3,263,611 |
| Booking Holdings, Inc. * | 7,138 | 13,344,348 |
| Carnival Corp. * | 575,276 | 5,212,001 |
| Chipotle Mexican Grill, Inc. * | 1,513 | 2,266,973 |
| Darden Restaurants, Inc. | 23,163 | 3,315,552 |
| Domino’s Pizza, Inc. | 6,030 | 2,003,407 |
| Expedia Group, Inc. * | 20,165 | 1,884,823 |
| H&R Block, Inc. | 51,300 | 2,110,995 |
| Hilton Worldwide Holdings, Inc. | 29,641 | 4,009,242 |
| Las Vegas Sands Corp. * | 134,593 | 5,115,880 |
| Marriott International, Inc., Class A | 30,375 | 4,863,341 |
| McDonald’s Corp. | 116,876 | 31,867,410 |
| MGM Resorts International | 119,366 | 4,245,849 |
| Norwegian Cruise Line Holdings Ltd. * | 116,689 | 1,970,877 |
| Royal Caribbean Cruises Ltd. * | 74,072 | 3,953,963 |
| Service Corp. International | 24,831 | 1,505,007 |
| Starbucks Corp. | 256,515 | 22,211,634 |
| Travel & Leisure Co. | 32,042 | 1,216,955 |
| Vail Resorts, Inc. | 5,916 | 1,296,373 |
| Wynn Resorts Ltd. * | 26,683 | 1,705,044 |
| Yum! Brands, Inc. | 59,380 | 7,021,685 |
| 124,384,970 | ||
| Diversified Financials 6.0% | ||
| Affiliated Managers Group, Inc. | 14,884 | 1,847,997 |
| AGNC Investment Corp. | 130,140 | 1,069,751 |
| Ally Financial, Inc. | 199,889 | 5,508,941 |
| American Express Co. | 140,156 | 20,806,158 |
| Ameriprise Financial, Inc. | 29,791 | 9,208,994 |
| Annaly Capital Management, Inc. | 72,697 | 1,348,529 |
| Berkshire Hathaway, Inc., Class A * | 83 | 36,939,150 |
| Berkshire Hathaway, Inc., Class B * | 301,588 | 88,995,603 |
| BlackRock, Inc. | 20,889 | 13,492,414 |
| Blackstone, Inc. | 32,389 | 2,951,933 |
| Bread Financial Holdings, Inc. | 60,726 | 2,192,816 |
| Capital One Financial Corp. | 196,840 | 20,868,977 |
| Cboe Global Markets, Inc. | 13,530 | 1,684,485 |
| Chimera Investment Corp. | 118,432 | 799,416 |
| CME Group, Inc. | 30,352 | 5,260,002 |
| Discover Financial Services | 124,992 | 13,056,664 |
| Equitable Holdings, Inc. | 79,941 | 2,447,793 |
| Evercore, Inc., Class A | 14,082 | 1,480,018 |
| Franklin Resources, Inc. | 172,648 | 4,048,596 |
| Intercontinental Exchange, Inc. | 57,542 | 5,499,289 |
| Invesco Ltd. | 157,848 | 2,418,231 |
| Janus Henderson Group plc | 55,293 | 1,259,022 |
| Jefferies Financial Group, Inc. | 68,526 | 2,357,980 |
| KKR & Co., Inc. | 61,558 | 2,993,566 |
| Lazard Ltd., Class A | 43,445 | 1,638,311 |
| LPL Financial Holdings, Inc. | 11,789 | 3,013,858 |
| Moody's Corp. | 12,418 | 3,289,156 |
| Morgan Stanley | 229,718 | 18,875,928 |
| MSCI, Inc. | 3,747 | 1,756,818 |
| Nasdaq, Inc. | 33,523 | 2,086,472 |
| Navient Corp. | 177,211 | 2,682,975 |
| Northern Trust Corp. | 43,927 | 3,705,242 |
| OneMain Holdings, Inc. | 60,327 | 2,326,209 |
| PROG Holdings, Inc. * | 45,542 | 752,354 |
| Raymond James Financial, Inc. | 27,145 | 3,206,910 |
| Rithm Capital Corp. | 191,896 | 1,617,683 |
| SECURITY | NUMBER OF SHARES | VALUE ($) |
| S&P Global, Inc. | 30,889 | 9,923,091 |
| SEI Investments Co. | 29,249 | 1,588,221 |
| SLM Corp. | 88,045 | 1,460,667 |
| Starwood Property Trust, Inc. | 67,626 | 1,397,153 |
| State Street Corp. | 92,014 | 6,809,036 |
| Synchrony Financial | 440,364 | 15,659,344 |
| T. Rowe Price Group, Inc. | 60,038 | 6,373,634 |
| The Bank of New York Mellon Corp. | 301,258 | 12,685,974 |
| The Charles Schwab Corp. (a) | 82,185 | 6,547,679 |
| The Goldman Sachs Group, Inc. | 92,793 | 31,968,116 |
| Voya Financial, Inc. | 25,520 | 1,744,547 |
| 389,645,703 | ||
| Energy 9.8% | ||
| Antero Resources Corp. * | 55,374 | 2,030,011 |
| APA Corp. | 73,658 | 3,348,493 |
| Baker Hughes Co. | 337,096 | 9,324,075 |
| Cheniere Energy, Inc. | 20,601 | 3,634,222 |
| Chevron Corp. | 643,872 | 116,476,445 |
| ConocoPhillips | 295,266 | 37,230,090 |
| Delek US Holdings, Inc. | 71,374 | 2,116,953 |
| Devon Energy Corp. | 55,706 | 4,308,859 |
| EOG Resources, Inc. | 103,727 | 14,160,810 |
| Equitrans Midstream Corp. | 153,756 | 1,294,625 |
| Exxon Mobil Corp. | 1,711,212 | 189,619,402 |
| Halliburton Co. | 186,705 | 6,799,796 |
| Helmerich & Payne, Inc. | 60,580 | 2,999,316 |
| Hess Corp. | 22,152 | 3,125,204 |
| HF Sinclair Corp. | 143,604 | 8,784,257 |
| Kinder Morgan, Inc. | 751,534 | 13,617,796 |
| Marathon Oil Corp. | 217,899 | 6,635,025 |
| Marathon Petroleum Corp. | 314,705 | 35,756,782 |
| Murphy Oil Corp. | 56,658 | 2,748,480 |
| NOV, Inc. | 227,252 | 5,090,445 |
| Occidental Petroleum Corp. | 235,512 | 17,098,171 |
| ONEOK, Inc. | 108,873 | 6,458,346 |
| Ovintiv, Inc. | 47,199 | 2,390,629 |
| PBF Energy, Inc., Class A | 161,864 | 7,162,482 |
| Peabody Energy Corp. * | 85,915 | 2,053,368 |
| Phillips 66 | 359,119 | 37,452,520 |
| Pioneer Natural Resources Co. | 20,302 | 5,205,636 |
| Schlumberger N.V. | 427,319 | 22,233,408 |
| Targa Resources Corp. | 53,955 | 3,688,903 |
| TechnipFMC plc * | 273,384 | 2,895,137 |
| The Williams Cos., Inc. | 274,263 | 8,976,628 |
| Valero Energy Corp. | 340,192 | 42,711,106 |
| World Fuel Services Corp. | 244,179 | 6,224,123 |
| 633,651,543 | ||
| Food & Staples Retailing 3.2% | ||
| Casey's General Stores, Inc. | 14,581 | 3,393,145 |
| Costco Wholesale Corp. | 73,563 | 36,891,844 |
| Performance Food Group Co. * | 80,060 | 4,166,322 |
| Rite Aid Corp. * | 172,650 | 901,233 |
| SpartanNash Co. | 56,139 | 2,004,724 |
| Sprouts Farmers Market, Inc. * | 57,836 | 1,706,162 |
| Sysco Corp. | 132,851 | 11,499,583 |
| The Kroger Co. | 504,701 | 23,867,310 |
| U.S. Foods Holding Corp. * | 153,894 | 4,579,885 |
| United Natural Foods, Inc. * | 42,434 | 1,799,626 |
| Walgreens Boots Alliance, Inc. | 782,650 | 28,566,725 |
| Walmart, Inc. | 603,102 | 85,839,508 |
| 205,216,067 | ||
| SECURITY | NUMBER OF SHARES | VALUE ($) |
| Food, Beverage & Tobacco 4.3% | ||
| Altria Group, Inc. | 594,393 | 27,502,564 |
| Archer-Daniels-Midland Co. | 266,061 | 25,802,596 |
| Bunge Ltd. | 79,149 | 7,812,006 |
| Campbell Soup Co. | 53,368 | 2,823,701 |
| Coca-Cola Europacific Partners plc | 75,534 | 3,553,875 |
| Conagra Brands, Inc. | 137,815 | 5,057,811 |
| Constellation Brands, Inc., Class A | 25,002 | 6,177,494 |
| Darling Ingredients, Inc. * | 22,673 | 1,779,377 |
| Flowers Foods, Inc. | 57,036 | 1,637,504 |
| General Mills, Inc. | 142,163 | 11,597,658 |
| Hormel Foods Corp. | 69,559 | 3,231,016 |
| Ingredion, Inc. | 35,408 | 3,155,561 |
| Kellogg Co. | 65,339 | 5,019,342 |
| Keurig Dr Pepper, Inc. | 108,249 | 4,204,391 |
| Lamb Weston Holdings, Inc. | 20,247 | 1,745,696 |
| McCormick & Co., Inc. - Non Voting Shares | 28,392 | 2,232,747 |
| Molson Coors Beverage Co., Class B | 94,880 | 4,784,798 |
| Mondelez International, Inc., Class A | 300,355 | 18,465,825 |
| Monster Beverage Corp. * | 45,324 | 4,247,765 |
| PepsiCo, Inc. | 229,579 | 41,686,955 |
| Philip Morris International, Inc. | 324,958 | 29,847,392 |
| Post Holdings, Inc. * | 21,954 | 1,985,081 |
| The Coca-Cola Co. | 533,111 | 31,906,693 |
| The Hershey Co. | 15,890 | 3,794,055 |
| The JM Smucker Co. | 40,294 | 6,070,694 |
| The Kraft Heinz Co. | 246,842 | 9,496,012 |
| Tyson Foods, Inc., Class A | 156,067 | 10,667,179 |
| 276,285,788 | ||
| Health Care Equipment & Services 6.6% | ||
| Abbott Laboratories | 173,748 | 17,190,627 |
| Align Technology, Inc. * | 4,335 | 842,291 |
| AmerisourceBergen Corp. | 30,733 | 4,831,842 |
| Baxter International, Inc. | 106,875 | 5,808,656 |
| Becton, Dickinson & Co. | 33,503 | 7,905,703 |
| Boston Scientific Corp. * | 115,363 | 4,973,299 |
| Cardinal Health, Inc. | 211,564 | 16,057,708 |
| Centene Corp. * | 167,648 | 14,271,874 |
| Cigna Corp. | 93,784 | 30,297,859 |
| CVS Health Corp. | 566,436 | 53,641,489 |
| DaVita, Inc. * | 46,595 | 3,401,901 |
| Dentsply Sirona, Inc. | 58,376 | 1,799,148 |
| Edwards Lifesciences Corp. * | 24,791 | 1,795,612 |
| Elevance Health, Inc. | 73,716 | 40,305,697 |
| Embecta Corp. | 6,559 | 202,804 |
| Encompass Health Corp. | 29,164 | 1,587,688 |
| Enhabit, Inc. * | 14,880 | 184,810 |
| Envista Holdings Corp. * | 33,640 | 1,110,457 |
| HCA Healthcare, Inc. | 57,581 | 12,522,140 |
| Henry Schein, Inc. * | 45,320 | 3,102,607 |
| Hologic, Inc. * | 32,790 | 2,223,162 |
| Humana, Inc. | 48,232 | 26,917,315 |
| IDEXX Laboratories, Inc. * | 3,254 | 1,170,399 |
| Intuitive Surgical, Inc. * | 14,573 | 3,591,807 |
| Laboratory Corp. of America Holdings | 21,252 | 4,714,969 |
| McKesson Corp. | 48,409 | 18,849,012 |
| Medtronic plc | 291,422 | 25,452,798 |
| Molina Healthcare, Inc. * | 11,327 | 4,064,807 |
| Patterson Cos., Inc. | 44,685 | 1,160,470 |
| Quest Diagnostics, Inc. | 38,997 | 5,601,919 |
| ResMed, Inc. | 8,744 | 1,955,945 |
| STERIS plc | 8,715 | 1,504,035 |
| Stryker Corp. | 35,341 | 8,101,571 |
| Teleflex, Inc. | 5,001 | 1,073,015 |
| SECURITY | NUMBER OF SHARES | VALUE ($) |
| Tenet Healthcare Corp. * | 39,973 | 1,773,202 |
| The Cooper Cos., Inc. | 4,523 | 1,236,543 |
| UnitedHealth Group, Inc. | 159,949 | 88,795,687 |
| Universal Health Services, Inc., Class B | 43,859 | 5,081,942 |
| Zimmer Biomet Holdings, Inc. | 37,497 | 4,250,285 |
| Zimvie, Inc. * | 6,177 | 54,172 |
| 429,407,267 | ||
| Household & Personal Products 1.3% | ||
| Church & Dwight Co., Inc. | 34,508 | 2,558,078 |
| Colgate-Palmolive Co. | 140,028 | 10,339,668 |
| Kimberly-Clark Corp. | 68,438 | 8,517,793 |
| Nu Skin Enterprises, Inc., Class A | 30,271 | 1,156,050 |
| Spectrum Brands Holdings, Inc. | 17,543 | 809,434 |
| The Clorox Co. | 24,457 | 3,571,700 |
| The Estee Lauder Cos., Inc., Class A | 17,588 | 3,526,218 |
| The Procter & Gamble Co. | 392,173 | 52,813,938 |
| 83,292,879 | ||
| Insurance 3.9% | ||
| Aflac, Inc. | 219,623 | 14,299,653 |
| American Financial Group, Inc. | 15,922 | 2,310,441 |
| American International Group, Inc. | 430,832 | 24,557,424 |
| Aon plc, Class A | 31,513 | 8,870,594 |
| Arch Capital Group Ltd. * | 56,800 | 3,266,000 |
| Arthur J. Gallagher & Co. | 18,437 | 3,449,194 |
| Assurant, Inc. | 10,600 | 1,440,116 |
| Assured Guaranty Ltd. | 38,300 | 2,266,977 |
| Brown & Brown, Inc. | 22,296 | 1,310,782 |
| Chubb Ltd. | 81,072 | 17,421,562 |
| Cincinnati Financial Corp. | 31,738 | 3,279,170 |
| CNO Financial Group, Inc. | 109,145 | 2,407,739 |
| Everest Re Group Ltd. | 9,548 | 3,080,758 |
| Fidelity National Financial, Inc. | 80,078 | 3,153,472 |
| First American Financial Corp. | 41,365 | 2,084,796 |
| Genworth Financial, Inc., Class A * | 503,914 | 2,353,278 |
| Globe Life, Inc. | 29,561 | 3,414,887 |
| Kemper Corp. | 26,186 | 1,248,287 |
| Lincoln National Corp. | 80,692 | 4,346,878 |
| Loews Corp. | 70,197 | 4,002,633 |
| Markel Corp. * | 2,161 | 2,606,382 |
| Marsh & McLennan Cos., Inc. | 57,679 | 9,314,582 |
| MetLife, Inc. | 260,302 | 19,056,709 |
| Old Republic International Corp. | 110,627 | 2,567,653 |
| Primerica, Inc. | 11,623 | 1,681,848 |
| Principal Financial Group, Inc. | 76,088 | 6,705,635 |
| Prudential Financial, Inc. | 163,559 | 17,204,771 |
| Reinsurance Group of America, Inc. | 26,409 | 3,886,612 |
| RenaissanceRe Holdings Ltd. | 8,692 | 1,344,479 |
| The Allstate Corp. | 132,235 | 16,694,669 |
| The Hanover Insurance Group, Inc. | 12,436 | 1,821,750 |
| The Hartford Financial Services Group, Inc. | 117,591 | 8,514,764 |
| The Progressive Corp. | 112,119 | 14,396,080 |
| The Travelers Cos., Inc. | 124,841 | 23,028,171 |
| Unum Group | 132,283 | 6,030,782 |
| W.R. Berkley Corp. | 39,504 | 2,938,307 |
| Willis Towers Watson plc | 18,714 | 4,083,582 |
| 250,441,417 | ||
| Materials 3.1% | ||
| Air Products & Chemicals, Inc. | 31,678 | 7,932,171 |
| Albemarle Corp. | 10,242 | 2,866,429 |
| Alcoa Corp. | 59,177 | 2,309,678 |
| AptarGroup, Inc. | 13,055 | 1,294,403 |
| SECURITY | NUMBER OF SHARES | VALUE ($) |
| Arconic Corp. * | 73,347 | 1,522,684 |
| Avery Dennison Corp. | 14,846 | 2,517,139 |
| Axalta Coating Systems Ltd. * | 50,916 | 1,187,361 |
| Ball Corp. | 41,708 | 2,059,958 |
| Berry Global Group, Inc. * | 38,647 | 1,828,776 |
| Celanese Corp. | 34,856 | 3,350,359 |
| CF Industries Holdings, Inc. | 40,838 | 4,339,446 |
| Commercial Metals Co. | 45,898 | 2,088,359 |
| Corteva, Inc. | 94,916 | 6,201,811 |
| Crown Holdings, Inc. | 23,133 | 1,586,692 |
| Dow, Inc. | 196,345 | 9,177,165 |
| DuPont de Nemours, Inc. | 212,003 | 12,126,572 |
| Eastman Chemical Co. | 53,187 | 4,085,293 |
| Ecolab, Inc. | 40,082 | 6,295,680 |
| FMC Corp. | 15,244 | 1,812,512 |
| Freeport-McMoRan, Inc. | 170,527 | 5,404,001 |
| Graphic Packaging Holding Co. | 99,582 | 2,286,403 |
| Huntsman Corp. | 81,566 | 2,182,706 |
| International Flavors & Fragrances, Inc. | 20,304 | 1,981,873 |
| International Paper Co. | 192,303 | 6,463,304 |
| Linde plc | 67,996 | 20,218,611 |
| Louisiana-Pacific Corp. | 22,554 | 1,277,684 |
| LyondellBasell Industries N.V., Class A | 128,778 | 9,845,078 |
| Martin Marietta Materials, Inc. | 8,804 | 2,957,968 |
| Newmont Corp. | 134,295 | 5,683,364 |
| Nucor Corp. | 89,178 | 11,716,206 |
| O-I Glass, Inc. * | 137,099 | 2,236,085 |
| Olin Corp. | 33,080 | 1,751,586 |
| Packaging Corp. of America | 26,955 | 3,240,261 |
| PPG Industries, Inc. | 61,019 | 6,967,149 |
| Reliance Steel & Aluminum Co. | 30,158 | 6,076,234 |
| RPM International, Inc. | 24,046 | 2,274,030 |
| Sealed Air Corp. | 38,476 | 1,832,227 |
| Sonoco Products Co. | 36,667 | 2,276,287 |
| Steel Dynamics, Inc. | 69,902 | 6,574,283 |
| Sylvamo Corp. | 34,645 | 1,668,850 |
| The Chemours Co. | 60,488 | 1,731,771 |
| The Mosaic Co. | 84,666 | 4,550,798 |
| The Sherwin-Williams Co. | 20,179 | 4,540,880 |
| United States Steel Corp. | 123,577 | 2,516,028 |
| Vulcan Materials Co. | 17,445 | 2,855,747 |
| Warrior Met Coal, Inc. | 47,012 | 1,746,026 |
| WestRock Co. | 161,435 | 5,498,476 |
| 202,936,404 | ||
| Media & Entertainment 4.2% | ||
| Activision Blizzard, Inc. | 86,411 | 6,290,721 |
| Alphabet, Inc., Class A * | 476,098 | 44,996,022 |
| Alphabet, Inc., Class C * | 446,947 | 42,308,003 |
| Charter Communications, Inc., Class A * | 43,832 | 16,113,520 |
| Comcast Corp., Class A | 1,421,028 | 45,103,429 |
| DISH Network Corp., Class A * | 127,191 | 1,896,418 |
| Electronic Arts, Inc. | 44,543 | 5,610,636 |
| Fox Corp., Class A | 97,294 | 2,808,878 |
| Fox Corp., Class B | 45,907 | 1,248,670 |
| Liberty Media Corp. - Liberty SiriusXM, Class A * | 45,340 | 1,924,230 |
| Liberty Media Corp. - Liberty SiriusXM, Class C * | 80,762 | 3,407,349 |
| Meta Platforms, Inc., Class A * | 298,977 | 27,852,697 |
| Netflix, Inc. * | 15,999 | 4,669,788 |
| News Corp., Class A | 115,532 | 1,949,025 |
| News Corp., Class B | 34,440 | 589,957 |
| Nexstar Media Group, Inc., Class A | 9,474 | 1,622,896 |
| Omnicom Group, Inc. | 69,567 | 5,060,999 |
| Paramount Global, Class B | 282,919 | 5,183,076 |
| Take-Two Interactive Software, Inc. * | 14,329 | 1,697,700 |
| SECURITY | NUMBER OF SHARES | VALUE ($) |
| TEGNA, Inc. | 66,098 | 1,380,126 |
| The Interpublic Group of Cos., Inc. | 94,212 | 2,806,576 |
| The Walt Disney Co. * | 317,835 | 33,862,141 |
| Warner Bros Discovery, Inc. * | 871,783 | 11,333,179 |
| 269,716,036 | ||
| Pharmaceuticals, Biotechnology & Life Sciences 6.8% | ||
| AbbVie, Inc. | 236,011 | 34,552,010 |
| Agilent Technologies, Inc. | 29,511 | 4,082,847 |
| Amgen, Inc. | 151,440 | 40,941,804 |
| Biogen, Inc. * | 54,455 | 15,434,725 |
| Bristol-Myers Squibb Co. | 333,561 | 25,840,971 |
| Danaher Corp. | 36,068 | 9,077,234 |
| Eli Lilly & Co. | 44,375 | 16,067,744 |
| Gilead Sciences, Inc. | 554,238 | 43,485,513 |
| ICON plc * | 7,382 | 1,460,455 |
| Illumina, Inc. * | 10,059 | 2,301,700 |
| IQVIA Holdings, Inc. * | 27,707 | 5,809,327 |
| Jazz Pharmaceuticals plc * | 14,049 | 2,020,106 |
| Johnson & Johnson | 479,943 | 83,495,684 |
| Merck & Co., Inc. | 505,468 | 51,153,362 |
| Mettler-Toledo International, Inc. * | 1,767 | 2,235,131 |
| PerkinElmer, Inc. | 9,625 | 1,285,708 |
| Perrigo Co., plc | 59,762 | 2,407,213 |
| Pfizer, Inc. | 1,288,454 | 59,977,534 |
| Regeneron Pharmaceuticals, Inc. * | 9,835 | 7,363,956 |
| Thermo Fisher Scientific, Inc. | 28,889 | 14,848,079 |
| United Therapeutics Corp. * | 8,710 | 2,007,916 |
| Vertex Pharmaceuticals, Inc. * | 9,912 | 3,092,544 |
| Viatris, Inc. | 504,101 | 5,106,543 |
| Waters Corp. * | 8,408 | 2,515,421 |
| Zoetis, Inc. | 28,301 | 4,267,225 |
| 440,830,752 | ||
| Real Estate 1.8% | ||
| Alexandria Real Estate Equities, Inc. | 11,680 | 1,697,104 |
| American Tower Corp. | 33,813 | 7,005,715 |
| Anywhere Real Estate, Inc. * | 140,800 | 1,046,144 |
| AvalonBay Communities, Inc. | 16,744 | 2,932,209 |
| Boston Properties, Inc. | 32,587 | 2,369,075 |
| Brixmor Property Group, Inc. | 75,128 | 1,600,978 |
| Camden Property Trust | 10,202 | 1,178,841 |
| CBRE Group, Inc., Class A * | 68,890 | 4,887,057 |
| Crown Castle, Inc. | 42,148 | 5,616,643 |
| Digital Realty Trust, Inc. | 29,611 | 2,968,503 |
| DigitalBridge Group, Inc. | 77,287 | 989,274 |
| Diversified Healthcare Trust | 626,582 | 852,152 |
| Equinix, Inc. | 7,661 | 4,339,497 |
| Equity Residential | 52,101 | 3,283,405 |
| Essex Property Trust, Inc. | 7,388 | 1,641,909 |
| Extra Space Storage, Inc. | 9,111 | 1,616,656 |
| Federal Realty Investment Trust | 11,591 | 1,147,277 |
| Gaming & Leisure Properties, Inc. | 30,978 | 1,552,617 |
| Healthpeak Properties, Inc. | 88,596 | 2,102,383 |
| Host Hotels & Resorts, Inc. | 263,699 | 4,978,637 |
| Invitation Homes, Inc. | 47,091 | 1,492,314 |
| Iron Mountain, Inc. | 70,304 | 3,520,121 |
| Jones Lang LaSalle, Inc. * | 18,676 | 2,971,165 |
| Kimco Realty Corp. | 83,124 | 1,777,191 |
| Lamar Advertising Co., Class A | 15,241 | 1,405,677 |
| Medical Properties Trust, Inc. | 68,503 | 784,359 |
| Mid-America Apartment Communities, Inc. | 12,134 | 1,910,498 |
| Omega Healthcare Investors, Inc. | 48,232 | 1,532,813 |
| Park Hotels & Resorts, Inc. | 126,501 | 1,654,633 |
| Prologis, Inc. | 50,711 | 5,616,243 |
| SECURITY | NUMBER OF SHARES | VALUE ($) |
| Public Storage | 11,161 | 3,457,120 |
| Realty Income Corp. | 38,418 | 2,392,289 |
| Regency Centers Corp. | 24,258 | 1,467,852 |
| SBA Communications Corp. | 4,071 | 1,098,763 |
| Service Properties Trust | 251,730 | 2,041,530 |
| Simon Property Group, Inc. | 61,165 | 6,665,762 |
| SL Green Realty Corp. | 30,887 | 1,225,596 |
| Sun Communities, Inc. | 8,573 | 1,156,069 |
| The Macerich Co. | 107,511 | 1,196,597 |
| UDR, Inc. | 32,233 | 1,281,584 |
| Ventas, Inc. | 112,758 | 4,412,221 |
| VICI Properties, Inc. | 43,565 | 1,394,951 |
| Vornado Realty Trust | 64,933 | 1,531,769 |
| Welltower, Inc. | 81,576 | 4,979,399 |
| Weyerhaeuser Co. | 189,867 | 5,872,586 |
| WP Carey, Inc. | 20,335 | 1,551,561 |
| 118,196,739 | ||
| Retailing 4.4% | ||
| Advance Auto Parts, Inc. | 16,632 | 3,158,749 |
| Amazon.com, Inc. * | 435,485 | 44,611,083 |
| American Eagle Outfitters, Inc. | 85,390 | 970,030 |
| Asbury Automotive Group, Inc. * | 8,441 | 1,331,568 |
| AutoNation, Inc. * | 26,763 | 2,845,175 |
| AutoZone, Inc. * | 1,686 | 4,270,436 |
| Bath & Body Works, Inc. | 63,658 | 2,124,904 |
| Bed Bath & Beyond, Inc. *(b) | 243,759 | 1,113,979 |
| Best Buy Co., Inc. | 136,397 | 9,330,919 |
| Big Lots, Inc. | 59,804 | 1,128,501 |
| Burlington Stores, Inc. * | 8,115 | 1,160,120 |
| CarMax, Inc. * | 45,725 | 2,881,132 |
| Dick's Sporting Goods, Inc. | 21,442 | 2,439,242 |
| Dollar General Corp. | 52,677 | 13,435,269 |
| Dollar Tree, Inc. * | 46,113 | 7,308,911 |
| eBay, Inc. | 223,567 | 8,906,909 |
| Foot Locker, Inc. | 71,415 | 2,263,856 |
| Genuine Parts Co. | 36,021 | 6,406,695 |
| Group 1 Automotive, Inc. | 11,609 | 2,008,357 |
| Kohl's Corp. | 192,866 | 5,776,337 |
| Lithia Motors, Inc. | 8,170 | 1,618,886 |
| LKQ Corp. | 72,631 | 4,041,189 |
| Lowe’s Cos., Inc. | 113,605 | 22,147,295 |
| Macy's, Inc. | 272,470 | 5,681,000 |
| Murphy USA, Inc. | 12,523 | 3,938,609 |
| Nordstrom, Inc. | 99,179 | 2,017,301 |
| O'Reilly Automotive, Inc. * | 10,613 | 8,884,885 |
| Penske Automotive Group, Inc. | 14,728 | 1,643,939 |
| Pool Corp. | 3,048 | 927,293 |
| Qurate Retail, Inc., Class A | 747,216 | 1,748,485 |
| Ross Stores, Inc. | 64,525 | 6,174,397 |
| Target Corp. | 155,648 | 25,565,184 |
| The Gap, Inc. | 199,127 | 2,244,161 |
| The Home Depot, Inc. | 151,726 | 44,930,620 |
| The ODP Corp. * | 58,274 | 2,305,902 |
| The TJX Cos., Inc. | 236,405 | 17,044,801 |
| Tractor Supply Co. | 17,663 | 3,881,798 |
| Ulta Beauty, Inc. * | 6,593 | 2,764,906 |
| Williams-Sonoma, Inc. | 15,728 | 1,947,598 |
| 282,980,421 | ||
| Semiconductors & Semiconductor Equipment 3.1% | ||
| Advanced Micro Devices, Inc. * | 59,506 | 3,573,930 |
| Analog Devices, Inc. | 41,845 | 5,967,934 |
| Applied Materials, Inc. | 128,024 | 11,303,239 |
| Broadcom, Inc. | 42,900 | 20,168,148 |
| Intel Corp. | 2,145,277 | 60,990,225 |
| SECURITY | NUMBER OF SHARES | VALUE ($) |
| KLA Corp. | 12,667 | 4,008,472 |
| Lam Research Corp. | 15,329 | 6,204,873 |
| Marvell Technology, Inc. | 36,347 | 1,442,249 |
| Microchip Technology, Inc. | 48,857 | 3,016,431 |
| Micron Technology, Inc. | 307,298 | 16,624,822 |
| MKS Instruments, Inc. | 9,955 | 817,803 |
| NVIDIA Corp. | 48,115 | 6,494,081 |
| NXP Semiconductors N.V. | 39,136 | 5,716,987 |
| ON Semiconductor Corp. * | 41,999 | 2,579,999 |
| Qorvo, Inc. * | 27,764 | 2,389,925 |
| QUALCOMM, Inc. | 182,232 | 21,441,417 |
| Skyworks Solutions, Inc. | 44,818 | 3,854,796 |
| Teradyne, Inc. | 19,077 | 1,551,914 |
| Texas Instruments, Inc. | 132,987 | 21,361,702 |
| 199,508,947 | ||
| Software & Services 5.9% | ||
| Accenture plc, Class A | 70,835 | 20,110,056 |
| Adobe, Inc. * | 23,334 | 7,431,879 |
| Akamai Technologies, Inc. * | 26,699 | 2,358,323 |
| Amdocs Ltd. | 41,016 | 3,540,091 |
| ANSYS, Inc. * | 5,114 | 1,131,012 |
| Autodesk, Inc. * | 7,253 | 1,554,318 |
| Automatic Data Processing, Inc. | 44,745 | 10,814,866 |
| Broadridge Financial Solutions, Inc. | 16,162 | 2,425,270 |
| Cadence Design Systems, Inc. * | 13,140 | 1,989,265 |
| Check Point Software Technologies Ltd. * | 20,095 | 2,596,877 |
| Cognizant Technology Solutions Corp., Class A | 172,949 | 10,766,075 |
| DXC Technology Co. * | 130,775 | 3,759,781 |
| Fidelity National Information Services, Inc. | 82,031 | 6,807,753 |
| Fiserv, Inc. * | 49,036 | 5,037,959 |
| FleetCor Technologies, Inc. * | 12,927 | 2,405,973 |
| Genpact Ltd. | 38,073 | 1,846,540 |
| Global Payments, Inc. | 29,930 | 3,419,802 |
| International Business Machines Corp. | 357,435 | 49,429,686 |
| Intuit, Inc. | 14,198 | 6,069,645 |
| Jack Henry & Associates, Inc. | 9,276 | 1,846,481 |
| Kyndryl Holdings, Inc. * | 386,809 | 3,740,443 |
| Mastercard, Inc., Class A | 52,960 | 17,380,413 |
| Maximus, Inc. | 23,502 | 1,449,368 |
| Microsoft Corp. | 515,259 | 119,607,072 |
| NCR Corp. * | 54,812 | 1,165,303 |
| NortonLifeLock, Inc. | 125,415 | 2,825,600 |
| Oracle Corp. | 404,181 | 31,554,411 |
| Palo Alto Networks, Inc. * | 6,934 | 1,189,805 |
| Paychex, Inc. | 34,519 | 4,083,943 |
| PayPal Holdings, Inc. * | 101,642 | 8,495,238 |
| Roper Technologies, Inc. | 8,635 | 3,579,553 |
| Salesforce, Inc. * | 33,438 | 5,436,684 |
| SS&C Technologies Holdings, Inc. | 27,024 | 1,389,574 |
| Synopsys, Inc. * | 6,292 | 1,840,725 |
| The Western Union Co. | 184,983 | 2,499,120 |
| VeriSign, Inc. * | 7,233 | 1,449,927 |
| Visa, Inc., Class A | 115,381 | 23,902,328 |
| VMware, Inc., Class A | 26,904 | 3,027,507 |
| 379,958,666 | ||
| Technology Hardware & Equipment 6.7% | ||
| Amphenol Corp., Class A | 63,145 | 4,788,285 |
| Apple Inc. | 1,717,697 | 263,391,658 |
| Arrow Electronics, Inc. * | 51,362 | 5,200,916 |
| Avnet, Inc. | 150,835 | 6,062,059 |
| CDW Corp. | 23,492 | 4,059,653 |
| Ciena Corp. * | 26,638 | 1,275,960 |
| SECURITY | NUMBER OF SHARES | VALUE ($) |
| Cisco Systems, Inc. | 1,306,580 | 59,357,929 |
| Corning, Inc. | 294,397 | 9,470,751 |
| Dell Technologies, Inc., Class C | 38,688 | 1,485,619 |
| F5, Inc. * | 12,670 | 1,810,670 |
| Flex Ltd. * | 252,457 | 4,943,108 |
| Hewlett Packard Enterprise Co. | 1,068,652 | 15,249,664 |
| HP, Inc. | 368,348 | 10,173,772 |
| Insight Enterprises, Inc. * | 14,927 | 1,410,751 |
| Jabil, Inc. | 67,042 | 4,307,448 |
| Juniper Networks, Inc. | 134,805 | 4,125,033 |
| Keysight Technologies, Inc. * | 10,128 | 1,763,791 |
| Motorola Solutions, Inc. | 17,715 | 4,423,613 |
| NetApp, Inc. | 65,033 | 4,504,836 |
| Sanmina Corp. * | 52,587 | 2,947,501 |
| Seagate Technology Holdings plc | 68,065 | 3,380,108 |
| TE Connectivity Ltd. | 58,619 | 7,165,000 |
| Teledyne Technologies, Inc. * | 4,546 | 1,809,217 |
| Trimble, Inc. * | 23,304 | 1,401,969 |
| Vishay Intertechnology, Inc. | 63,668 | 1,331,298 |
| Western Digital Corp. * | 164,946 | 5,669,194 |
| Xerox Holdings Corp. | 167,776 | 2,454,563 |
| Zebra Technologies Corp., Class A * | 4,566 | 1,293,183 |
| 435,257,549 | ||
| Telecommunication Services 3.3% | ||
| AT&T, Inc. | 5,810,605 | 105,927,329 |
| Liberty Global plc, Class A * | 110,618 | 1,865,019 |
| Liberty Global plc, Class C * | 215,177 | 3,800,026 |
| Liberty Latin America Ltd., Class A * | 29,005 | 225,659 |
| Liberty Latin America Ltd., Class C * | 108,349 | 844,039 |
| Lumen Technologies, Inc. | 1,107,205 | 8,149,029 |
| Telephone & Data Systems, Inc. | 101,652 | 1,728,084 |
| T-Mobile US, Inc. * | 89,471 | 13,560,225 |
| Verizon Communications, Inc. | 1,973,007 | 73,731,271 |
| 209,830,681 | ||
| Transportation 1.9% | ||
| American Airlines Group, Inc. * | 125,040 | 1,773,067 |
| Avis Budget Group, Inc. * | 14,864 | 3,514,741 |
| C.H. Robinson Worldwide, Inc. | 50,337 | 4,918,932 |
| CSX Corp. | 496,757 | 14,435,758 |
| Delta Air Lines, Inc. * | 80,928 | 2,745,887 |
| Expeditors International of Washington, Inc. | 40,039 | 3,917,816 |
| FedEx Corp. | 92,137 | 14,767,718 |
| GXO Logistics, Inc. * | 25,627 | 936,411 |
| JB Hunt Transport Services, Inc. | 17,393 | 2,975,420 |
| Knight-Swift Transportation Holdings, Inc. | 44,007 | 2,113,656 |
| Landstar System, Inc. | 11,277 | 1,761,693 |
| Norfolk Southern Corp. | 54,423 | 12,412,254 |
| Old Dominion Freight Line, Inc. | 9,590 | 2,633,414 |
| Ryder System, Inc. | 43,941 | 3,537,690 |
| Southwest Airlines Co. * | 66,531 | 2,418,402 |
| Uber Technologies, Inc. * | 51,108 | 1,357,940 |
| Union Pacific Corp. | 135,718 | 26,755,447 |
| United Airlines Holdings, Inc. * | 54,877 | 2,364,101 |
| United Parcel Service, Inc., Class B | 89,530 | 15,020,448 |
| Werner Enterprises, Inc. | 30,764 | 1,205,949 |
| XPO Logistics, Inc. * | 32,208 | 1,666,442 |
| 123,233,186 | ||
| Utilities 3.6% | ||
| Alliant Energy Corp. | 48,510 | 2,530,767 |
| Ameren Corp. | 56,333 | 4,592,266 |
| SECURITY | NUMBER OF SHARES | VALUE ($) |
| American Electric Power Co., Inc. | 127,658 | 11,223,691 |
| American Water Works Co., Inc. | 22,416 | 3,257,941 |
| Atmos Energy Corp. | 23,962 | 2,553,151 |
| Black Hills Corp. | 17,838 | 1,166,070 |
| CenterPoint Energy, Inc. | 158,659 | 4,539,234 |
| CMS Energy Corp. | 67,729 | 3,863,940 |
| Consolidated Edison, Inc. | 108,872 | 9,576,381 |
| Dominion Energy, Inc. | 180,052 | 12,598,238 |
| DTE Energy Co. | 48,785 | 5,469,286 |
| Duke Energy Corp. | 213,166 | 19,862,808 |
| Edison International | 112,211 | 6,737,148 |
| Entergy Corp. | 57,854 | 6,198,478 |
| Evergy, Inc. | 92,939 | 5,681,361 |
| Eversource Energy | 74,789 | 5,704,905 |
| Exelon Corp. | 337,083 | 13,008,033 |
| FirstEnergy Corp. | 192,928 | 7,275,315 |
| NextEra Energy, Inc. | 240,722 | 18,655,955 |
| NiSource, Inc. | 102,006 | 2,620,534 |
| NRG Energy, Inc. | 87,604 | 3,889,618 |
| OGE Energy Corp. | 57,318 | 2,099,558 |
| PG&E Corp. * | 168,442 | 2,514,839 |
| Pinnacle West Capital Corp. | 44,423 | 2,985,670 |
| Portland General Electric Co. | 30,976 | 1,392,061 |
| PPL Corp. | 314,275 | 8,325,145 |
| Public Service Enterprise Group, Inc. | 128,717 | 7,217,162 |
| Sempra Energy | 58,186 | 8,782,595 |
| Southwest Gas Holdings, Inc. | 20,484 | 1,496,766 |
| The AES Corp. | 253,723 | 6,637,394 |
| The Southern Co. | 273,802 | 17,928,555 |
| UGI Corp. | 80,134 | 2,831,134 |
| Vistra Corp. | 251,866 | 5,785,362 |
| WEC Energy Group, Inc. | 63,385 | 5,788,952 |
| Xcel Energy, Inc. | 121,923 | 7,938,407 |
| 232,728,720 | ||
| Total Common Stocks (Cost $3,916,158,604) | 6,445,361,530 | |
| SECURITY | NUMBEROF SHARES | VALUE ($) |
| SHORT-TERM INVESTMENTS 0.2% OF NET ASSETS | ||
| Money Market Funds 0.2% | ||
| State Street Institutional U.S. Government Money Market Fund, Premier Class 3.01% (c) | 12,910,350 | 12,910,350 |
| State Street Institutional U.S. Government Money Market Fund, Premier Class 3.01% (c)(d) | 1,099,962 | 1,099,962 |
| 14,010,312 | ||
| Total Short-Term Investments (Cost $14,010,312) | 14,010,312 | |
| Total Investments in Securities (Cost $3,930,168,916) | 6,459,371,842 | |
| NUMBER OF CONTRACTS | NOTIONAL AMOUNT ($) | CURRENT VALUE/ UNREALIZED APPRECIATION ($) | |
| FUTURES CONTRACTS | |||
| Long | |||
| S&P 500 Index, e-mini, expires 12/16/22 | 82 | 15,920,300 | 435,721 |
| * | Non-income producing security. |
| (a) | Issuer is affiliated with the fund’s investment adviser. |
| (b) | All or a portion of this security is on loan. Securities on loan were valued at $1,058,279. |
| (c) | The rate shown is the annualized 7-day yield. |
| (d) | Security purchased with cash collateral received for securities on loan. |
| SECURITY | VALUE AT 10/31/21 | PURCHASES | SALES | REALIZED GAINS (LOSSES) | NET CHANGE IN UNREALIZED APPRECIATION (DEPRECIATION) | VALUE AT 10/31/22 | BALANCE OF SHARES HELD AT 10/31/22 | DIVIDENDS RECEIVED |
| COMMON STOCKS 0.1% OF NET ASSETS | ||||||||
| Diversified Financials 0.1% | ||||||||
| The Charles Schwab Corp. | $7,138,251 | $1,173,243 | ($1,717,031) | $970,644 | ($1,017,428) | $6,547,679 | 82,185 | $62,429 |
| DESCRIPTION | QUOTED PRICES IN ACTIVE MARKETS FOR IDENTICAL ASSETS (LEVEL 1) | OTHER SIGNIFICANT OBSERVABLE INPUTS (LEVEL 2) | SIGNIFICANT UNOBSERVABLE INPUTS (LEVEL 3) | TOTAL |
| Assets | ||||
| Common Stocks1 | $6,445,361,530 | $— | $— | $6,445,361,530 |
| Short-Term Investments1 | 14,010,312 | — | — | 14,010,312 |
| Futures Contracts2 | 435,721 | — | — | 435,721 |
| Total | $6,459,807,563 | $— | $— | $6,459,807,563 |
| 1 | As categorized in the Portfolio Holdings. |
| 2 | Futures contracts are reported at cumulative unrealized appreciation or depreciation. |
| Assets | ||
| Investments in securities, at value - affiliated (cost $2,326,386) | $6,547,679 | |
| Investments in securities, at value - unaffiliated (cost $3,927,842,530) including securities on loan of $1,058,279 | 6,452,824,163 | |
| Cash | 2,244,476 | |
| Deposit with broker for futures contracts | 1,560,000 | |
| Receivables: | ||
| Fund shares sold | 12,482,631 | |
| Dividends | 7,014,564 | |
| Income from securities on loan | + | 7,144 |
| Total assets | 6,482,680,657 | |
| Liabilities | ||
| Collateral held for securities on loan | 1,099,962 | |
| Payables: | ||
| Fund shares redeemed | 19,815,380 | |
| Investment adviser fees | 1,216,015 | |
| Variation margin on futures contracts | + | 170,968 |
| Total liabilities | 22,302,325 | |
| Net assets | $6,460,378,332 | |
| Net Assets by Source | ||
| Capital received from investors | $3,981,828,678 | |
| Total distributable earnings | + | 2,478,549,654 |
| Net assets | $6,460,378,332 | |
| Net Asset Value (NAV) | ||||
| Net Assets | ÷ | Shares Outstanding | = | NAV |
| $6,460,378,332 | 304,807,614 | $21.19 | ||
| For the period November 1, 2021 through October 31, 2022 | ||
| Investment Income | ||
| Dividends received from securities - unaffiliated (net of foreign withholding tax of $21,682) | $148,792,888 | |
| Dividends received from securities - affiliated | 62,429 | |
| Interest received from securities - unaffiliated | 11,652 | |
| Securities on loan, net | + | 47,141 |
| Total investment income | 148,914,110 | |
| Expenses | ||
| Investment adviser fees | 16,882,430 | |
| Proxy fees1 | + | 293,924 |
| Total expenses | – | 17,176,354 |
| Net investment income | 131,737,756 | |
| REALIZED AND UNREALIZED GAINS (LOSSES) | ||
| Net realized gains on sales of securities - affiliated | 970,644 | |
| Net realized losses on sales of securities - unaffiliated | (38,768,965) | |
| Net realized gains on sales of in-kind redemptions - unaffiliated | 394,741,998 | |
| Net realized losses on futures contracts | + | (11,452,437) |
| Net realized gains | 345,491,240 | |
| Net change in unrealized appreciation (depreciation) on securities - affiliated | (1,017,428) | |
| Net change in unrealized appreciation (depreciation) on securities - unaffiliated | (773,475,449) | |
| Net change in unrealized appreciation (depreciation) on futures contracts | + | 29,817 |
| Net change in unrealized appreciation (depreciation) | + | (774,463,060) |
| Net realized and unrealized losses | (428,971,820) | |
| Decrease in net assets resulting from operations | ($297,234,064) | |
| 1 | Proxy fees are non-routine expenses (see financial note 2(e) for additional information). |
| OPERATIONS | |||
| 11/1/21-10/31/22 | 11/1/20-10/31/21 | ||
| Net investment income | $131,737,756 | $114,455,556 | |
| Net realized gains | 345,491,240 | 318,274,828 | |
| Net change in unrealized appreciation (depreciation) | + | (774,463,060) | 1,865,374,095 |
| Increase (decrease) in net assets resulting from operations | ($297,234,064) | $2,298,104,479 | |
| DISTRIBUTIONS TO SHAREHOLDERS | |||
| Total distributions | ($324,469,338) | ($308,556,282) | |
| TRANSACTIONS IN FUND SHARES | |||||
| 11/1/21-10/31/22 | 11/1/20-10/31/21 | ||||
| SHARES | VALUE | SHARES | VALUE | ||
| Shares sold | 97,191,423 | $2,125,844,925 | 81,564,828 | $1,719,788,331 | |
| Shares reinvested | 9,796,275 | 221,297,842 | 10,503,858 | 189,909,742 | |
| Shares redeemed | + | (96,242,413) | (2,085,588,810) | (77,335,254) | (1,626,034,240) |
| Net transactions in fund shares | 10,745,285 | $261,553,957 | 14,733,432 | $283,663,833 | |
| SHARES OUTSTANDING AND NET ASSETS | |||||
| 11/1/21-10/31/22 | 11/1/20-10/31/21 | ||||
| SHARES | NET ASSETS | SHARES | NET ASSETS | ||
| Beginning of period | 294,062,329 | $6,820,527,777 | 279,328,897 | $4,547,315,747 | |
| Total increase (decrease) | + | 10,745,285 | (360,149,445) | 14,733,432 | 2,273,212,030 |
| End of period | 304,807,614 | $6,460,378,332 | 294,062,329 | $6,820,527,777 | |
| 11/1/21– 10/31/22 | 11/1/20– 10/31/21 | 11/1/19– 10/31/20 | 11/1/18– 10/31/19 | 11/1/17– 10/31/18 | ||
| Per-Share Data | ||||||
| Net asset value at beginning of period | $19.32 | $11.97 | $13.85 | $14.68 | $15.32 | |
| Income (loss) from investment operations: | ||||||
| Net investment income (loss)1 | 0.22 | 0.18 | 0.17 | 0.20 | 0.22 | |
| Net realized and unrealized gains (losses) | (2.17) | 7.38 | (1.53) | 0.32 | 0.17 | |
| Total from investment operations | (1.95) | 7.56 | (1.36) | 0.52 | 0.39 | |
| Less distributions: | ||||||
| Distributions from net investment income | (0.24) | (0.21) | (0.20) | (0.22) | (0.21) | |
| Distributions from net realized gains | (1.91) | — | (0.32) | (1.13) | (0.82) | |
| Total distributions | (2.15) | (0.21) | (0.52) | (1.35) | (1.03) | |
| Net asset value at end of period | $15.22 | $19.32 | $11.97 | $13.85 | $14.68 | |
| Total return | (11.37%) | 63.73% | (10.42%) | 5.61% | 2.40% | |
| Ratios/Supplemental Data | ||||||
| Ratios to average net assets: | ||||||
| Total expenses | 0.25% 2 | 0.25% | 0.25% | 0.25% | 0.25% | |
| Net investment income (loss) | 1.35% | 1.02% | 1.43% | 1.50% | 1.42% | |
| Portfolio turnover rate | 35% 3 | 36% 3 | 28% | 34% | 30% | |
| Net assets, end of period (x 1,000,000) | $1,631 | $1,945 | $1,394 | $1,908 | $1,782 | |
| 1 | Calculated based on the average shares outstanding during the period. |
| 2 | Ratio includes less than 0.005% of non-routine proxy expenses. |
| 3 | Portfolio turnover rate excludes in-kind transactions. |
| SECURITY | NUMBER OF SHARES | VALUE ($) |
| COMMON STOCKS 99.9% OF NET ASSETS | ||
| Automobiles & Components 1.6% | ||
| American Axle & Manufacturing Holdings, Inc. * | 389,461 | 3,773,877 |
| Cooper-Standard Holdings, Inc. * | 299,397 | 2,844,271 |
| Dorman Products, Inc. * | 18,099 | 1,477,240 |
| Fox Factory Holding Corp. * | 9,515 | 835,893 |
| Gentherm, Inc. * | 24,449 | 1,428,311 |
| LCI Industries | 24,187 | 2,566,483 |
| Modine Manufacturing Co. * | 125,324 | 2,245,806 |
| Patrick Industries, Inc. | 27,418 | 1,253,277 |
| Standard Motor Products, Inc. | 36,239 | 1,374,545 |
| Stoneridge, Inc. * | 50,729 | 1,058,714 |
| Tenneco, Inc., Class A * | 256,140 | 5,045,958 |
| Winnebago Industries, Inc. | 35,555 | 2,122,278 |
| 26,026,653 | ||
| Banks 9.6% | ||
| 1st Source Corp. | 9,852 | 572,992 |
| Ameris Bancorp | 24,501 | 1,262,047 |
| Associated Banc-Corp. | 139,166 | 3,388,692 |
| Atlantic Union Bankshares Corp. | 39,386 | 1,360,392 |
| Axos Financial, Inc. * | 26,400 | 1,028,544 |
| Bank of Hawaii Corp. | 30,239 | 2,296,652 |
| Bank OZK | 71,850 | 3,088,113 |
| BankUnited, Inc. | 85,697 | 3,080,807 |
| Banner Corp. | 26,761 | 2,000,385 |
| BOK Financial Corp. | 18,854 | 2,077,522 |
| Brookline Bancorp, Inc. | 52,512 | 722,040 |
| Cadence Bank | 88,137 | 2,436,988 |
| Capitol Federal Financial, Inc. | 122,245 | 999,964 |
| Cathay General Bancorp | 48,967 | 2,232,895 |
| Central Pacific Financial Corp. | 28,761 | 590,176 |
| City Holding Co. | 8,458 | 852,989 |
| Columbia Banking System, Inc. | 56,790 | 1,900,761 |
| Commerce Bancshares, Inc. | 44,203 | 3,131,341 |
| Community Bank System, Inc. | 22,852 | 1,426,650 |
| Cullen/Frost Bankers, Inc. | 25,390 | 3,936,720 |
| Customers Bancorp, Inc. * | 11,557 | 389,355 |
| CVB Financial Corp. | 60,695 | 1,743,160 |
| Eagle Bancorp, Inc. | 19,703 | 892,152 |
| Eastern Bankshares, Inc. | 24,518 | 470,010 |
| Enterprise Financial Services Corp. | 11,027 | 589,614 |
| Essent Group Ltd. | 55,042 | 2,178,562 |
| F.N.B. Corp. | 269,436 | 3,893,350 |
| Federal Agricultural Mortgage Corp., Class C | 6,431 | 740,851 |
| First BanCorp | 94,887 | 1,498,266 |
| First Bancorp/Southern Pines NC | 12,058 | 537,425 |
| First Busey Corp. | 33,789 | 892,368 |
| First Citizens BancShares, Inc., Class A | 6,378 | 5,243,481 |
| First Commonwealth Financial Corp. | 61,773 | 885,825 |
| First Financial Bancorp | 65,703 | 1,712,877 |
| First Financial Bankshares, Inc. | 26,188 | 1,007,976 |
| First Hawaiian, Inc. | 115,725 | 2,960,246 |
| SECURITY | NUMBER OF SHARES | VALUE ($) |
| First Interstate BancSystem, Inc., Class A | 51,444 | 2,346,361 |
| First Merchants Corp. | 28,294 | 1,270,401 |
| Flagstar Bancorp, Inc. | 55,412 | 2,144,444 |
| Fulton Financial Corp. | 123,319 | 2,248,105 |
| Glacier Bancorp, Inc. | 37,590 | 2,153,155 |
| Hancock Whitney Corp. | 52,973 | 2,959,602 |
| Hanmi Financial Corp. | 26,303 | 704,394 |
| Heartland Financial USA, Inc. | 20,167 | 994,636 |
| Heritage Financial Corp. | 18,303 | 616,628 |
| Hilltop Holdings, Inc. | 58,735 | 1,700,378 |
| HomeStreet, Inc. | 12,496 | 324,396 |
| Hope Bancorp, Inc. | 111,878 | 1,518,185 |
| Independent Bank Corp. | 13,728 | 1,194,473 |
| Independent Bank Group, Inc. | 13,026 | 821,810 |
| International Bancshares Corp. | 38,024 | 1,885,990 |
| Kearny Financial Corp. | 40,062 | 406,229 |
| Lakeland Financial Corp. | 6,578 | 543,672 |
| Mr Cooper Group, Inc. * | 15,020 | 593,140 |
| National Bank Holdings Corp., Class A | 13,834 | 606,206 |
| NBT Bancorp, Inc. | 29,385 | 1,392,555 |
| NMI Holdings, Inc., Class A * | 30,658 | 672,330 |
| Northwest Bancshares, Inc. | 87,636 | 1,319,798 |
| OceanFirst Financial Corp. | 24,428 | 551,584 |
| OFG Bancorp | 34,482 | 961,358 |
| Old National Bancorp | 214,895 | 4,203,346 |
| Pacific Premier Bancorp, Inc. | 30,926 | 1,126,016 |
| PacWest Bancorp | 114,164 | 2,838,117 |
| Park National Corp. | 8,223 | 1,212,893 |
| Pathward Financial, Inc. | 13,615 | 572,239 |
| PennyMac Financial Services, Inc. | 31,473 | 1,678,140 |
| Pinnacle Financial Partners, Inc. | 24,017 | 1,993,171 |
| Prosperity Bancshares, Inc. | 44,223 | 3,165,040 |
| Provident Financial Services, Inc. | 49,054 | 1,099,791 |
| Renasant Corp. | 34,951 | 1,410,972 |
| S&T Bancorp, Inc. | 30,503 | 1,153,318 |
| Sandy Spring Bancorp, Inc. | 20,398 | 722,905 |
| Simmons First National Corp., Class A | 73,929 | 1,764,685 |
| Southside Bancshares, Inc. | 17,122 | 586,257 |
| SouthState Corp. | 24,244 | 2,192,385 |
| Texas Capital Bancshares, Inc. * | 32,708 | 1,962,480 |
| The Bank of N.T. Butterfield & Son Ltd. | 36,961 | 1,276,633 |
| Tompkins Financial Corp. | 9,140 | 757,158 |
| Towne Bank | 37,935 | 1,249,579 |
| TriCo Bancshares | 10,961 | 634,752 |
| Trustmark Corp. | 54,355 | 1,987,762 |
| UMB Financial Corp. | 20,808 | 1,731,642 |
| Umpqua Holdings Corp. | 137,328 | 2,730,081 |
| United Bankshares, Inc. | 68,682 | 2,908,683 |
| United Community Banks, Inc. | 39,317 | 1,513,705 |
| Valley National Bancorp | 222,654 | 2,642,903 |
| Walker & Dunlop, Inc. | 17,915 | 1,611,633 |
| Washington Federal, Inc. | 77,137 | 2,985,202 |
| Washington Trust Bancorp, Inc. | 9,269 | 449,547 |
| Webster Financial Corp. | 68,248 | 3,703,137 |
| WesBanco, Inc. | 39,398 | 1,593,255 |
| Westamerica Bancorp | 12,716 | 797,675 |
| Western Alliance Bancorp | 26,913 | 1,807,746 |
| SECURITY | NUMBER OF SHARES | VALUE ($) |
| Wintrust Financial Corp. | 30,894 | 2,892,296 |
| WSFS Financial Corp. | 21,770 | 1,013,611 |
| 155,920,773 | ||
| Capital Goods 11.8% | ||
| 3D Systems Corp. * | 47,483 | 419,275 |
| AAON, Inc. | 15,734 | 1,014,686 |
| AAR Corp. * | 48,283 | 2,139,903 |
| Advanced Drainage Systems, Inc. | 10,590 | 1,227,169 |
| Aerojet Rocketdyne Holdings, Inc. * | 38,406 | 1,860,771 |
| Alamo Group, Inc. | 8,745 | 1,329,940 |
| Albany International Corp., Class A | 18,986 | 1,739,497 |
| Altra Industrial Motion Corp. | 42,965 | 2,583,915 |
| American Woodmark Corp. * | 36,250 | 1,643,938 |
| API Group Corp. * | 90,225 | 1,487,810 |
| Apogee Enterprises, Inc. | 42,467 | 1,948,386 |
| Applied Industrial Technologies, Inc. | 31,415 | 3,907,398 |
| Arcosa, Inc. | 57,719 | 3,705,560 |
| Argan, Inc. | 22,814 | 790,961 |
| Armstrong World Industries, Inc. | 29,165 | 2,203,999 |
| Astec Industries, Inc. | 35,025 | 1,528,841 |
| Astronics Corp. * | 60,859 | 563,554 |
| Atkore, Inc. * | 15,074 | 1,436,552 |
| Axon Enterprise, Inc. * | 3,862 | 561,689 |
| AZZ, Inc. | 33,790 | 1,358,358 |
| Barnes Group, Inc. | 69,608 | 2,462,035 |
| Beacon Roofing Supply, Inc. * | 55,216 | 3,111,422 |
| BWX Technologies, Inc. | 68,140 | 3,882,617 |
| Columbus McKinnon Corp. | 24,540 | 699,881 |
| Comfort Systems USA, Inc. | 25,121 | 3,096,917 |
| Construction Partners, Inc., Class A * | 16,811 | 523,495 |
| Core & Main, Inc., Class A * | 25,831 | 609,095 |
| Crane Holdings Co. | 35,559 | 3,567,990 |
| CSW Industrials, Inc. | 5,519 | 711,509 |
| Douglas Dynamics, Inc. | 22,522 | 764,622 |
| DXP Enterprises, Inc. * | 24,602 | 703,863 |
| Dycom Industries, Inc. * | 41,341 | 4,885,679 |
| Encore Wire Corp. | 16,337 | 2,247,808 |
| Enerpac Tool Group Corp. | 34,805 | 884,395 |
| EnerSys | 50,918 | 3,375,354 |
| EnPro Industries, Inc. | 15,646 | 1,666,299 |
| Esab Corp. | 25,735 | 959,916 |
| ESCO Technologies, Inc. | 16,382 | 1,411,637 |
| Evoqua Water Technologies Corp. * | 26,458 | 1,036,624 |
| Federal Signal Corp. | 43,982 | 2,051,760 |
| Franklin Electric Co., Inc. | 26,091 | 2,137,897 |
| Gates Industrial Corp. plc * | 80,675 | 899,526 |
| Generac Holdings, Inc. * | 10,987 | 1,273,503 |
| Gibraltar Industries, Inc. * | 30,963 | 1,581,590 |
| GMS, Inc. * | 43,867 | 2,070,522 |
| GrafTech International Ltd. | 260,659 | 1,326,754 |
| Granite Construction, Inc. | 86,399 | 2,914,238 |
| Great Lakes Dredge & Dock Corp. * | 58,879 | 445,125 |
| Griffon Corp. | 49,936 | 1,604,943 |
| H&E Equipment Services, Inc. | 49,953 | 1,886,225 |
| HEICO Corp. | 9,101 | 1,480,187 |
| HEICO Corp., Class A | 15,583 | 1,983,716 |
| Herc Holdings, Inc. | 18,568 | 2,183,782 |
| Hillenbrand, Inc. | 52,255 | 2,308,626 |
| Hyster-Yale Materials Handling, Inc. | 33,227 | 968,899 |
| JELD-WEN Holding, Inc. * | 167,194 | 1,773,928 |
| John Bean Technologies Corp. | 14,178 | 1,293,034 |
| Kadant, Inc. | 4,630 | 823,909 |
| Kaman Corp. | 46,630 | 1,496,823 |
| Kennametal, Inc. | 100,207 | 2,676,529 |
| Kratos Defense & Security Solutions, Inc. * | 46,837 | 518,954 |
| SECURITY | NUMBER OF SHARES | VALUE ($) |
| Lindsay Corp. | 5,979 | 1,012,245 |
| Masonite International Corp. * | 29,826 | 2,133,454 |
| Maxar Technologies, Inc. | 59,375 | 1,326,438 |
| McGrath RentCorp | 18,755 | 1,763,908 |
| Mercury Systems, Inc. * | 20,340 | 984,456 |
| Moog, Inc., Class A | 42,090 | 3,567,127 |
| MRC Global, Inc. * | 219,011 | 2,196,680 |
| Mueller Industries, Inc. | 59,700 | 3,739,608 |
| Mueller Water Products, Inc., Class A | 130,797 | 1,530,325 |
| MYR Group, Inc. * | 16,108 | 1,409,611 |
| National Presto Industries, Inc. | 10,047 | 708,213 |
| NOW, Inc. * | 297,821 | 3,791,261 |
| Parsons Corp. * | 25,592 | 1,199,753 |
| PGT Innovations, Inc. * | 42,578 | 907,337 |
| Primoris Services Corp. | 108,523 | 2,191,079 |
| Proto Labs, Inc. * | 20,788 | 793,894 |
| Quanex Building Products Corp. | 51,420 | 1,139,467 |
| RBC Bearings, Inc. * | 7,594 | 1,925,307 |
| Resideo Technologies, Inc. * | 160,578 | 3,792,852 |
| REV Group, Inc. | 47,196 | 648,473 |
| Rush Enterprises, Inc., Class A | 70,286 | 3,506,569 |
| Simpson Manufacturing Co., Inc. | 24,235 | 2,071,608 |
| SiteOne Landscape Supply, Inc. * | 12,408 | 1,437,715 |
| SPX Technologies, Inc. * | 19,534 | 1,286,119 |
| Standex International Corp. | 11,100 | 1,099,455 |
| Sterling Infrastructure, Inc. * | 19,431 | 524,443 |
| Tennant Co. | 15,937 | 928,330 |
| Terex Corp. | 83,124 | 3,369,847 |
| Textainer Group Holdings Ltd. | 20,541 | 614,587 |
| The AZEK Co., Inc. * | 25,453 | 445,682 |
| The Gorman-Rupp Co. | 20,243 | 549,395 |
| The Greenbrier Cos., Inc. | 93,231 | 3,291,987 |
| The Manitowoc Co., Inc. * | 88,935 | 811,087 |
| The Shyft Group, Inc. | 19,873 | 456,682 |
| Titan Machinery, Inc. * | 23,840 | 819,619 |
| TPI Composites, Inc. * | 38,519 | 383,649 |
| Trex Co., Inc. * | 25,534 | 1,227,930 |
| Trinity Industries, Inc. | 104,758 | 2,988,746 |
| Triton International Ltd. | 59,858 | 3,632,782 |
| Tutor Perini Corp. * | 265,553 | 1,970,403 |
| V2X, Inc. * | 24,917 | 1,021,348 |
| Valmont Industries, Inc. | 14,940 | 4,769,147 |
| Veritiv Corp. * | 20,689 | 2,405,303 |
| Vertiv Holdings Co. | 41,584 | 595,067 |
| Wabash National Corp. | 139,347 | 3,016,863 |
| Watts Water Technologies, Inc., Class A | 14,710 | 2,152,956 |
| WillScot Mobile Mini Holdings Corp. * | 24,531 | 1,043,303 |
| Woodward, Inc. | 33,603 | 3,081,395 |
| Zurn Water Solutions Corp. | 49,896 | 1,172,057 |
| 193,189,392 | ||
| Commercial & Professional Services 5.2% | ||
| ACCO Brands Corp. | 244,238 | 1,123,495 |
| ASGN, Inc. * | 36,419 | 3,087,603 |
| Barrett Business Services, Inc. | 6,149 | 536,316 |
| Brady Corp., Class A | 47,427 | 2,169,785 |
| BrightView Holdings, Inc. * | 80,134 | 714,795 |
| Casella Waste Systems, Inc., Class A * | 7,243 | 592,550 |
| CBIZ, Inc. * | 29,191 | 1,449,041 |
| Cimpress plc * | 28,725 | 668,718 |
| Clarivate plc * | 57,528 | 594,264 |
| Clean Harbors, Inc. * | 35,932 | 4,400,233 |
| CoStar Group, Inc. * | 43,549 | 3,602,373 |
| Deluxe Corp. | 121,212 | 2,227,877 |
| Dun & Bradstreet Holdings, Inc. | 42,242 | 542,810 |
| Exponent, Inc. | 11,233 | 1,070,056 |
| FTI Consulting, Inc. * | 23,614 | 3,675,047 |
| SECURITY | NUMBER OF SHARES | VALUE ($) |
| Harsco Corp. * | 189,420 | 1,002,032 |
| Healthcare Services Group, Inc. | 169,311 | 2,363,582 |
| Heidrick & Struggles International, Inc. | 17,342 | 488,351 |
| HNI Corp. | 73,274 | 2,124,213 |
| Huron Consulting Group, Inc. * | 16,942 | 1,247,439 |
| IAA, Inc. * | 39,977 | 1,516,328 |
| ICF International, Inc. | 16,517 | 1,975,929 |
| Insperity, Inc. | 16,689 | 1,969,636 |
| Interface, Inc. | 95,471 | 1,079,777 |
| KAR Auction Services, Inc. * | 194,289 | 2,823,019 |
| Kelly Services, Inc., Class A | 219,716 | 3,590,159 |
| Kforce, Inc. | 23,975 | 1,516,898 |
| Kimball International, Inc., Class B | 92,342 | 682,407 |
| Korn Ferry | 40,877 | 2,272,352 |
| Matthews International Corp., Class A | 53,121 | 1,427,892 |
| MillerKnoll, Inc. | 91,162 | 1,930,811 |
| MSA Safety, Inc. | 14,839 | 1,991,987 |
| Pitney Bowes, Inc. | 642,594 | 1,998,467 |
| Resources Connection, Inc. | 59,632 | 1,089,477 |
| Rollins, Inc. | 56,009 | 2,356,859 |
| SP Plus Corp. * | 29,917 | 1,107,827 |
| Steelcase, Inc., Class A | 238,973 | 1,856,820 |
| Stericycle, Inc. * | 63,393 | 2,826,060 |
| Tetra Tech, Inc. | 22,673 | 3,203,241 |
| The Brink's Co. | 33,576 | 2,002,137 |
| The GEO Group, Inc. * | 534,325 | 4,520,389 |
| TriNet Group, Inc. * | 19,911 | 1,293,817 |
| TrueBlue, Inc. * | 104,993 | 2,064,162 |
| UniFirst Corp. | 16,484 | 3,033,221 |
| Viad Corp. * | 22,431 | 836,228 |
| 84,646,480 | ||
| Consumer Durables & Apparel 3.3% | ||
| Acushnet Holdings Corp. | 24,773 | 1,153,679 |
| Beazer Homes USA, Inc. * | 69,927 | 790,874 |
| Cavco Industries, Inc. * | 5,623 | 1,274,565 |
| Century Communities, Inc. | 31,019 | 1,380,656 |
| Columbia Sportswear Co. | 35,919 | 2,675,965 |
| Crocs, Inc. * | 18,686 | 1,322,035 |
| Ethan Allen Interiors, Inc. | 54,183 | 1,386,543 |
| Fossil Group, Inc. * | 166,399 | 707,196 |
| G-III Apparel Group Ltd. * | 113,450 | 2,212,275 |
| Helen of Troy Ltd. * | 18,243 | 1,726,153 |
| Installed Building Products, Inc. | 10,067 | 865,762 |
| iRobot Corp. *(a) | 31,358 | 1,771,727 |
| Kontoor Brands, Inc. | 37,595 | 1,342,142 |
| La-Z-Boy, Inc. | 83,109 | 2,058,610 |
| LGI Homes, Inc. * | 17,821 | 1,640,423 |
| M.D.C. Holdings, Inc. | 87,486 | 2,664,824 |
| M/I Homes, Inc. * | 51,085 | 2,119,517 |
| Malibu Boats, Inc., Class A * | 8,560 | 452,824 |
| Mattel, Inc. * | 158,488 | 3,004,932 |
| Movado Group, Inc. | 17,172 | 567,878 |
| Oxford Industries, Inc. | 14,566 | 1,481,799 |
| Skyline Champion Corp. * | 17,364 | 1,010,758 |
| Smith & Wesson Brands, Inc. | 79,739 | 900,253 |
| Sonos, Inc. * | 27,903 | 449,796 |
| Steven Madden Ltd. | 81,381 | 2,430,850 |
| Sturm, Ruger & Co., Inc. | 23,987 | 1,346,390 |
| Tempur Sealy International, Inc. | 117,328 | 3,154,950 |
| TopBuild Corp. * | 15,148 | 2,577,281 |
| Topgolf Callaway Brands Corp. * | 37,911 | 709,694 |
| Tupperware Brands Corp. * | 186,122 | 1,438,723 |
| Under Armour, Inc., Class A * | 142,725 | 1,063,301 |
| Under Armour, Inc., Class C * | 147,405 | 966,977 |
| Universal Electronics, Inc. * | 31,113 | 635,016 |
| Vera Bradley, Inc. * | 72,693 | 236,252 |
| SECURITY | NUMBER OF SHARES | VALUE ($) |
| Vista Outdoor, Inc. * | 43,540 | 1,264,402 |
| Wolverine World Wide, Inc. | 120,413 | 2,062,675 |
| YETI Holdings, Inc. * | 15,573 | 499,582 |
| 53,347,279 | ||
| Consumer Services 5.7% | ||
| ADT, Inc. | 272,233 | 2,303,091 |
| Adtalem Global Education, Inc. * | 103,092 | 4,298,936 |
| American Public Education, Inc. * | 45,959 | 588,735 |
| Arcos Dorados Holdings, Inc., Class A | 172,326 | 1,299,338 |
| Bally's Corp. *(a) | 21,052 | 474,512 |
| BJ's Restaurants, Inc. * | 42,970 | 1,411,565 |
| Bloomin' Brands, Inc. | 136,113 | 3,268,073 |
| Boyd Gaming Corp. | 41,552 | 2,400,044 |
| Bright Horizons Family Solutions, Inc. * | 24,298 | 1,587,145 |
| Brinker International, Inc. * | 72,115 | 2,407,920 |
| Caesars Entertainment, Inc. * | 28,931 | 1,265,153 |
| Choice Hotels International, Inc. | 7,985 | 1,036,772 |
| Churchill Downs, Inc. | 13,585 | 2,824,457 |
| Cracker Barrel Old Country Store, Inc. | 36,936 | 4,218,830 |
| Dave & Buster's Entertainment, Inc. * | 41,798 | 1,665,650 |
| Denny's Corp. * | 76,748 | 869,555 |
| Dine Brands Global, Inc. | 13,549 | 976,748 |
| Everi Holdings, Inc. * | 32,393 | 614,819 |
| Frontdoor, Inc. * | 33,103 | 730,252 |
| Graham Holdings Co., Class B | 6,115 | 3,814,965 |
| Grand Canyon Education, Inc. * | 32,645 | 3,285,066 |
| Hilton Grand Vacations, Inc. * | 40,882 | 1,604,210 |
| Hyatt Hotels Corp., Class A * | 45,070 | 4,246,045 |
| International Game Technology plc | 130,463 | 2,615,783 |
| Jack in the Box, Inc. | 39,434 | 3,479,262 |
| Laureate Education, Inc., Class A | 172,041 | 2,174,598 |
| Marriott Vacations Worldwide Corp. | 27,207 | 4,020,106 |
| Papa John's International, Inc. | 10,587 | 768,934 |
| Penn Entertainment, Inc. * | 97,974 | 3,242,939 |
| Perdoceo Education Corp. * | 98,936 | 1,130,839 |
| Planet Fitness, Inc., Class A * | 23,469 | 1,536,750 |
| Red Robin Gourmet Burgers, Inc. * | 68,193 | 560,547 |
| Red Rock Resorts, Inc., Class A | 29,422 | 1,225,426 |
| Regis Corp. *(a) | 788,196 | 922,189 |
| Scientific Games Corp., Class A * | 61,758 | 3,467,094 |
| SeaWorld Entertainment, Inc. * | 15,030 | 874,145 |
| Six Flags Entertainment Corp. * | 127,805 | 2,850,052 |
| Strategic Education, Inc. | 25,554 | 1,763,226 |
| Stride, Inc. * | 42,912 | 1,437,981 |
| Texas Roadhouse, Inc. | 41,552 | 4,111,570 |
| The Cheesecake Factory, Inc. | 53,705 | 1,923,176 |
| The Wendy's Co. | 167,347 | 3,477,471 |
| Wingstop, Inc. | 4,223 | 668,881 |
| WW International, Inc. * | 118,468 | 535,475 |
| Wyndham Hotels & Resorts, Inc. | 36,714 | 2,787,694 |
| 92,766,019 | ||
| Diversified Financials 3.6% | ||
| A-Mark Precious Metals, Inc. | 22,111 | 672,395 |
| Apollo Commercial Real Estate Finance, Inc. | 135,319 | 1,523,692 |
| Arbor Realty Trust, Inc. | 63,928 | 880,289 |
| Ares Management Corp., Class A | 14,441 | 1,095,061 |
| Artisan Partners Asset Management, Inc., Class A | 50,136 | 1,429,377 |
| B. Riley Financial, Inc. | 10,499 | 427,099 |
| BGC Partners, Inc., Class A | 372,342 | 1,474,474 |
| Blackstone Mortgage Trust, Inc., Class A | 85,345 | 2,130,211 |
| Brightsphere Investment Group, Inc. | 69,058 | 1,299,672 |
| BrightSpire Capital, Inc., Class A | 71,044 | 545,618 |
| SECURITY | NUMBER OF SHARES | VALUE ($) |
| Broadmark Realty Capital, Inc. | 72,826 | 423,847 |
| Cannae Holdings, Inc. * | 58,916 | 1,364,495 |
| Cohen & Steers, Inc. | 11,931 | 717,769 |
| Compass Diversified Holdings (a) | 76,461 | 1,627,090 |
| Cowen, Inc., Class A | 20,606 | 795,804 |
| Credit Acceptance Corp. * | 4,756 | 2,214,489 |
| Donnelley Financial Solutions, Inc. * | 24,778 | 1,001,775 |
| Encore Capital Group, Inc. * | 21,508 | 1,095,187 |
| Enova International, Inc. * | 41,762 | 1,565,657 |
| FactSet Research Systems, Inc. | 8,296 | 3,529,865 |
| FirstCash Holdings, Inc. | 41,643 | 4,099,753 |
| Focus Financial Partners, Inc., Class A * | 13,272 | 461,733 |
| Green Dot Corp., Class A * | 46,903 | 892,564 |
| Houlihan Lokey, Inc. | 20,107 | 1,795,957 |
| Interactive Brokers Group, Inc., Class A | 13,320 | 1,067,598 |
| Ladder Capital Corp. REIT | 139,144 | 1,484,666 |
| LendingClub Corp. * | 29,478 | 313,646 |
| LendingTree, Inc. * | 9,067 | 228,760 |
| MarketAxess Holdings, Inc. | 6,710 | 1,637,508 |
| MFA Financial, Inc. | 143,445 | 1,428,712 |
| Moelis & Co., Class A | 40,910 | 1,737,039 |
| Morningstar, Inc. | 5,304 | 1,231,483 |
| Nelnet, Inc., Class A | 15,729 | 1,401,297 |
| New York Mortgage Trust, Inc. | 365,785 | 983,962 |
| PennyMac Mortgage Investment Trust | 99,042 | 1,373,713 |
| Piper Sandler Cos. | 8,229 | 1,053,065 |
| PRA Group, Inc. * | 32,118 | 1,075,953 |
| Ready Capital Corp. | 30,581 | 370,642 |
| Redwood Trust, Inc. | 123,670 | 881,767 |
| Regional Management Corp. | 10,593 | 359,738 |
| Stifel Financial Corp. | 38,825 | 2,402,103 |
| The Carlyle Group, Inc. | 53,303 | 1,507,409 |
| TPG RE Finance Trust, Inc. | 67,942 | 575,469 |
| Tradeweb Markets, Inc., Class A | 14,434 | 795,025 |
| Two Harbors Investment Corp. | 332,107 | 1,182,301 |
| Virtu Financial, Inc., Class A | 47,965 | 1,073,457 |
| Virtus Investment Partners, Inc. | 4,060 | 696,249 |
| WisdomTree Investments, Inc. | 120,657 | 655,168 |
| World Acceptance Corp. * | 7,419 | 602,571 |
| 59,183,174 | ||
| Energy 6.5% | ||
| Alto Ingredients, Inc. * | 212,923 | 879,372 |
| Antero Midstream Corp. | 75,864 | 807,952 |
| Arch Resources, Inc. | 26,778 | 4,078,022 |
| Archrock, Inc. | 212,337 | 1,594,651 |
| Berry Corp. | 42,905 | 380,567 |
| Cactus, Inc., Class A | 10,346 | 535,095 |
| ChampionX Corp. | 62,929 | 1,801,028 |
| CNX Resources Corp. * | 226,975 | 3,815,450 |
| CONSOL Energy, Inc. | 53,157 | 3,349,954 |
| Continental Resources, Inc. | 33,394 | 2,470,154 |
| Core Laboratories N.V. | 56,635 | 1,102,117 |
| CVR Energy, Inc. | 78,363 | 3,060,859 |
| DHT Holdings, Inc. | 236,754 | 2,109,478 |
| Diamondback Energy, Inc. | 37,768 | 5,933,730 |
| Dorian LPG Ltd. | 31,819 | 574,969 |
| Dril-Quip, Inc. * | 47,885 | 1,191,379 |
| DTE Midstream LLC * | 40,799 | 2,435,700 |
| EQT Corp. | 98,970 | 4,140,905 |
| Golar LNG Ltd. * | 40,187 | 1,118,002 |
| Green Plains, Inc. * | 70,222 | 2,028,714 |
| Helix Energy Solutions Group, Inc. * | 289,463 | 2,026,241 |
| International Seaways, Inc. | 56,009 | 2,375,342 |
| Kosmos Energy Ltd. * | 370,097 | 2,401,930 |
| Liberty Energy, Inc., Class A * | 76,853 | 1,299,584 |
| Matador Resources Co. | 29,427 | 1,955,424 |
| SECURITY | NUMBER OF SHARES | VALUE ($) |
| Nabors Industries Ltd. * | 28,951 | 5,038,342 |
| NexTier Oilfield Solutions, Inc. * | 197,966 | 1,995,497 |
| Nordic American Tankers Ltd. | 441,186 | 1,363,265 |
| Oceaneering International, Inc. * | 199,542 | 2,791,593 |
| Oil States International, Inc. * | 206,359 | 1,335,143 |
| Par Pacific Holdings, Inc. * | 69,848 | 1,598,122 |
| Patterson-UTI Energy, Inc. | 312,587 | 5,517,161 |
| PDC Energy, Inc. | 39,284 | 2,833,948 |
| Permian Resources Corp., Class A * | 143,286 | 1,399,904 |
| ProPetro Holding Corp. * | 166,970 | 1,976,925 |
| Range Resources Corp. | 55,892 | 1,591,804 |
| RPC, Inc. | 69,545 | 774,036 |
| Scorpio Tankers, Inc. | 69,116 | 3,313,421 |
| SFL Corp., Ltd. | 173,262 | 1,767,272 |
| SM Energy Co. | 81,374 | 3,660,202 |
| Southwestern Energy Co. * | 285,368 | 1,977,600 |
| Talos Energy, Inc. * | 26,774 | 569,751 |
| Teekay Tankers Ltd., Class A * | 67,667 | 2,130,834 |
| Texas Pacific Land Corp. | 634 | 1,460,654 |
| Transocean Ltd. * | 1,136,642 | 4,182,843 |
| US Silica Holdings, Inc. * | 62,252 | 895,806 |
| Valaris Ltd. * | 20,939 | 1,401,447 |
| Weatherford International plc * | 66,454 | 2,769,803 |
| 105,811,992 | ||
| Food & Staples Retailing 1.0% | ||
| BJ's Wholesale Club Holdings, Inc. * | 38,125 | 2,950,875 |
| Grocery Outlet Holding Corp. * | 49,928 | 1,726,011 |
| Ingles Markets, Inc., Class A | 31,690 | 2,990,585 |
| PriceSmart, Inc. | 39,842 | 2,548,693 |
| The Andersons, Inc. | 70,010 | 2,469,253 |
| The Chefs' Warehouse, Inc. * | 23,901 | 875,494 |
| Weis Markets, Inc. | 36,517 | 3,420,547 |
| 16,981,458 | ||
| Food, Beverage & Tobacco 2.5% | ||
| Adecoagro SA | 120,996 | 1,047,825 |
| B&G Foods, Inc. (a) | 107,890 | 1,767,238 |
| Brown-Forman Corp., Class B | 56,132 | 3,816,976 |
| Calavo Growers, Inc. | 39,530 | 1,367,343 |
| Cal-Maine Foods, Inc. | 42,229 | 2,386,361 |
| Coca-Cola Consolidated, Inc. | 2,069 | 1,007,624 |
| Dole plc | 49,953 | 427,098 |
| Fresh Del Monte Produce, Inc. | 133,631 | 3,485,096 |
| Hostess Brands, Inc. * | 66,218 | 1,753,453 |
| J&J Snack Foods Corp. | 12,002 | 1,771,615 |
| John B. Sanfilippo & Son, Inc. | 15,168 | 1,265,163 |
| Lancaster Colony Corp. | 15,162 | 2,733,405 |
| Mission Produce, Inc. * | 34,570 | 575,245 |
| National Beverage Corp. | 11,921 | 565,294 |
| Nomad Foods Ltd. * | 126,253 | 1,944,296 |
| Pilgrim's Pride Corp. * | 84,562 | 1,949,154 |
| The Boston Beer Co., Inc., Class A * | 5,244 | 1,957,533 |
| The Hain Celestial Group, Inc. * | 95,715 | 1,790,828 |
| TreeHouse Foods, Inc. * | 88,272 | 4,434,785 |
| Universal Corp. | 67,074 | 3,394,615 |
| Vector Group Ltd. | 148,945 | 1,581,796 |
| 41,022,743 | ||
| Health Care Equipment & Services 3.9% | ||
| ABIOMED, Inc. * | 6,480 | 1,633,478 |
| Acadia Healthcare Co., Inc. * | 49,220 | 4,001,586 |
| Addus HomeCare Corp. * | 8,255 | 845,477 |
| Allscripts Healthcare Solutions, Inc. * | 114,328 | 1,680,622 |
| Amedisys, Inc. * | 15,185 | 1,481,904 |
| SECURITY | NUMBER OF SHARES | VALUE ($) |
| AMN Healthcare Services, Inc. * | 23,677 | 2,971,463 |
| Avanos Medical, Inc. * | 28,582 | 633,091 |
| Brookdale Senior Living, Inc. * | 348,555 | 1,558,041 |
| Chemed Corp. | 7,846 | 3,663,062 |
| Community Health Systems, Inc. * | 389,974 | 1,119,225 |
| CONMED Corp. | 10,323 | 823,053 |
| Cross Country Healthcare, Inc. * | 22,057 | 818,094 |
| DexCom, Inc. * | 9,643 | 1,164,681 |
| Enovis Corp. * | 26,477 | 1,309,288 |
| Globus Medical, Inc., Class A * | 22,273 | 1,492,291 |
| Haemonetics Corp. * | 29,968 | 2,545,782 |
| HealthEquity, Inc. * | 9,201 | 716,850 |
| ICU Medical, Inc. * | 8,741 | 1,297,252 |
| Integer Holdings Corp. * | 24,215 | 1,509,321 |
| Integra LifeSciences Holdings Corp. * | 24,467 | 1,229,467 |
| Invacare Corp. *(a) | 399,071 | 296,230 |
| LHC Group, Inc. * | 14,596 | 2,438,992 |
| LivaNova plc * | 12,882 | 606,742 |
| Masimo Corp. * | 13,238 | 1,742,121 |
| Merit Medical Systems, Inc. * | 17,883 | 1,229,814 |
| ModivCare, Inc. * | 11,299 | 1,098,715 |
| Multiplan Corp. * | 283,563 | 813,826 |
| Neogen Corp. * | 33,861 | 446,965 |
| NextGen Healthcare, Inc. * | 40,344 | 808,494 |
| NuVasive, Inc. * | 31,694 | 1,398,656 |
| Omnicell, Inc. * | 9,178 | 709,643 |
| OPKO Health, Inc. * | 189,458 | 359,970 |
| Option Care Health, Inc. * | 34,095 | 1,031,715 |
| Orthofix Medical, Inc. * | 23,210 | 372,753 |
| Owens & Minor, Inc. | 90,304 | 1,535,168 |
| Pediatrix Medical Group, Inc. * | 150,048 | 2,910,931 |
| Premier, Inc., Class A | 98,021 | 3,418,972 |
| QuidelOrtho Corp. * | 19,584 | 1,759,035 |
| RadNet, Inc. * | 19,433 | 371,559 |
| Select Medical Holdings Corp. | 112,392 | 2,886,227 |
| Teladoc Health, Inc. * | 12,800 | 379,392 |
| The Ensign Group, Inc. | 18,850 | 1,692,353 |
| U.S. Physical Therapy, Inc. | 6,947 | 616,894 |
| Varex Imaging Corp. * | 35,058 | 775,132 |
| Veeva Systems, Inc., Class A * | 8,902 | 1,495,002 |
| 63,689,329 | ||
| Household & Personal Products 0.9% | ||
| Central Garden & Pet Co., Class A * | 42,534 | 1,664,781 |
| Coty, Inc., Class A * | 302,528 | 2,029,963 |
| Edgewell Personal Care Co. | 73,395 | 2,876,350 |
| Energizer Holdings, Inc. | 59,641 | 1,723,028 |
| Herbalife Nutrition Ltd. * | 95,964 | 2,040,195 |
| Inter Parfums, Inc. | 7,772 | 628,599 |
| Medifast, Inc. | 5,898 | 690,007 |
| Reynolds Consumer Products, Inc. | 20,679 | 631,537 |
| USANA Health Sciences, Inc. * | 19,494 | 1,023,630 |
| WD-40 Co. | 5,231 | 837,797 |
| 14,145,887 | ||
| Insurance 2.3% | ||
| Ambac Financial Group, Inc. * | 79,145 | 1,111,987 |
| American Equity Investment Life Holding Co. | 102,900 | 4,432,932 |
| AMERISAFE, Inc. | 23,669 | 1,382,506 |
| Argo Group International Holdings Ltd. | 38,135 | 948,417 |
| Axis Capital Holdings Ltd. | 63,931 | 3,495,108 |
| Brighthouse Financial, Inc. * | 13,657 | 779,405 |
| CNA Financial Corp. | 36,043 | 1,502,993 |
| Employers Holdings, Inc. | 37,336 | 1,628,223 |
| Enstar Group Ltd. * | 8,577 | 1,719,860 |
| SECURITY | NUMBER OF SHARES | VALUE ($) |
| Horace Mann Educators Corp. | 32,367 | 1,277,202 |
| James River Group Holdings Ltd. | 47,538 | 1,201,285 |
| MBIA, Inc. * | 78,485 | 844,499 |
| Mercury General Corp. | 42,323 | 1,227,367 |
| ProAssurance Corp. | 108,813 | 2,416,737 |
| RLI Corp. | 13,743 | 1,787,552 |
| Safety Insurance Group, Inc. | 16,445 | 1,429,893 |
| Selective Insurance Group, Inc. | 35,886 | 3,519,699 |
| SiriusPoint Ltd. * | 99,514 | 638,880 |
| Stewart Information Services Corp. | 38,692 | 1,507,440 |
| United Fire Group, Inc. | 33,899 | 918,663 |
| Universal Insurance Holdings, Inc. | 87,077 | 874,253 |
| White Mountains Insurance Group Ltd. | 2,619 | 3,708,897 |
| 38,353,798 | ||
| Materials 6.1% | ||
| AdvanSix, Inc. | 32,265 | 1,173,801 |
| Alpha Metallurgical Resources, Inc. | 8,430 | 1,423,405 |
| American Vanguard Corp. | 22,787 | 530,253 |
| Ashland, Inc. | 37,565 | 3,941,320 |
| ATI, Inc. * | 92,417 | 2,750,330 |
| Avient Corp. | 68,833 | 2,374,050 |
| Balchem Corp. | 10,113 | 1,413,797 |
| Cabot Corp. | 50,691 | 3,724,775 |
| Carpenter Technology Corp. | 89,580 | 3,350,292 |
| Century Aluminum Co. * | 59,357 | 427,964 |
| Clearwater Paper Corp. * | 42,301 | 1,881,548 |
| Cleveland-Cliffs, Inc. * | 109,113 | 1,417,378 |
| Coeur Mining, Inc. * | 212,562 | 803,484 |
| Compass Minerals International, Inc. | 49,832 | 1,970,357 |
| Constellium SE * | 113,530 | 1,251,101 |
| Eagle Materials, Inc. | 24,645 | 3,014,330 |
| Ecovyst, Inc. * | 53,030 | 527,648 |
| Element Solutions, Inc. | 127,031 | 2,184,933 |
| Glatfelter Corp. | 122,028 | 345,339 |
| Greif, Inc., Class A | 34,381 | 2,276,366 |
| H.B. Fuller Co. | 41,386 | 2,885,018 |
| Hawkins, Inc. | 18,762 | 844,853 |
| Hecla Mining Co. | 289,695 | 1,323,906 |
| Ingevity Corp. * | 25,681 | 1,727,561 |
| Innospec, Inc. | 22,566 | 2,256,374 |
| Kaiser Aluminum Corp. | 25,176 | 2,033,969 |
| Koppers Holdings, Inc. | 38,829 | 969,172 |
| Livent Corp. * | 27,684 | 873,984 |
| Materion Corp. | 19,442 | 1,666,374 |
| Mativ Holdings, Inc. | 114,750 | 2,724,165 |
| Mercer International, Inc. | 59,065 | 792,652 |
| Minerals Technologies, Inc. | 36,427 | 2,003,849 |
| Myers Industries, Inc. | 38,909 | 789,464 |
| NewMarket Corp. | 8,091 | 2,462,415 |
| Olympic Steel, Inc. | 27,846 | 757,690 |
| Orion Engineered Carbons S.A. | 89,809 | 1,433,352 |
| Pactiv Evergreen, Inc. | 94,430 | 1,030,231 |
| Quaker Chemical Corp. | 5,365 | 872,564 |
| Rayonier Advanced Materials, Inc. * | 233,913 | 1,064,304 |
| Resolute Forest Products, Inc. * | 95,923 | 1,996,158 |
| Royal Gold, Inc. | 18,396 | 1,746,884 |
| Schnitzer Steel Industries, Inc., Class A | 56,351 | 1,520,913 |
| Sensient Technologies Corp. | 31,331 | 2,238,913 |
| Silgan Holdings, Inc. | 81,456 | 3,857,756 |
| Southern Copper Corp. | 46,407 | 2,179,737 |
| Stepan Co. | 24,754 | 2,585,308 |
| Summit Materials, Inc., Class A * | 88,588 | 2,334,294 |
| SunCoke Energy, Inc. | 209,226 | 1,518,981 |
| The Scotts Miracle-Gro Co. | 36,525 | 1,676,863 |
| TimkenSteel Corp. * | 46,633 | 813,280 |
| TriMas Corp. | 36,735 | 839,395 |
| SECURITY | NUMBER OF SHARES | VALUE ($) |
| Trinseo plc | 84,843 | 1,596,745 |
| Tronox Holdings plc, Class A | 104,517 | 1,254,204 |
| Valvoline, Inc. | 71,456 | 2,097,948 |
| Westlake Corp. | 30,687 | 2,965,899 |
| Worthington Industries, Inc. | 55,046 | 2,617,988 |
| 99,135,634 | ||
| Media & Entertainment 2.9% | ||
| AMC Entertainment Holdings, Inc., Class A *(a) | 82,386 | 548,691 |
| AMC Networks, Inc., Class A * | 107,567 | 2,421,333 |
| Audacy, Inc., Class A * | 457,674 | 158,172 |
| Bumble, Inc., Class A * | 24,870 | 631,698 |
| Cable One, Inc. | 1,829 | 1,571,897 |
| Cars.com, Inc. * | 74,178 | 1,029,591 |
| Cinemark Holdings, Inc. * | 218,435 | 2,317,595 |
| Clear Channel Outdoor Holdings, Inc. * | 1,271,527 | 1,818,284 |
| Gannett Co., Inc. * | 381,005 | 552,457 |
| Gray Television, Inc. | 116,034 | 1,641,881 |
| IAC, Inc. * | 18,230 | 887,436 |
| iHeartMedia, Inc., Class A * | 263,664 | 2,183,138 |
| John Wiley & Sons, Inc., Class A | 44,192 | 1,864,460 |
| Liberty Media Corp. - Liberty Formula One, Class A * | 3,873 | 201,473 |
| Liberty Media Corp. - Liberty Formula One, Class C * | 32,270 | 1,862,947 |
| Lions Gate Entertainment Corp., Class A * | 70,056 | 564,651 |
| Lions Gate Entertainment Corp., Class B * | 138,637 | 1,052,255 |
| Live Nation Entertainment, Inc. * | 13,842 | 1,101,962 |
| Madison Square Garden Entertainment Corp. * | 19,408 | 951,574 |
| Madison Square Garden Sports Corp. | 4,892 | 766,136 |
| Match Group, Inc. * | 35,560 | 1,536,192 |
| Pinterest, Inc., Class A * | 35,889 | 882,869 |
| Roku, Inc. * | 6,134 | 340,682 |
| Scholastic Corp. | 39,528 | 1,507,598 |
| Shutterstock, Inc. | 7,094 | 354,913 |
| Sinclair Broadcast Group, Inc., Class A | 76,081 | 1,355,003 |
| Sirius XM Holdings, Inc. (a) | 537,650 | 3,247,406 |
| Spotify Technology S.A. * | 22,002 | 1,772,921 |
| The E.W. Scripps Co., Class A * | 55,632 | 789,418 |
| The Marcus Corp. | 42,694 | 642,118 |
| The New York Times Co., Class A | 72,813 | 2,108,665 |
| The Trade Desk, Inc., Class A * | 8,366 | 445,406 |
| TripAdvisor, Inc. * | 91,259 | 2,155,538 |
| WideOpenWest, Inc. * | 33,746 | 462,658 |
| World Wrestling Entertainment, Inc., Class A | 13,572 | 1,070,695 |
| Yelp, Inc. * | 68,005 | 2,612,072 |
| Ziff Davis, Inc. * | 29,368 | 2,272,790 |
| 47,684,575 | ||
| Pharmaceuticals, Biotechnology & Life Sciences 2.4% | ||
| Alkermes plc * | 37,346 | 847,754 |
| Avantor, Inc. * | 87,332 | 1,761,486 |
| Azenta, Inc. | 15,359 | 681,940 |
| BioMarin Pharmaceutical, Inc. * | 19,134 | 1,657,578 |
| Bio-Rad Laboratories, Inc., Class A * | 4,984 | 1,752,923 |
| Bio-Techne Corp. | 4,827 | 1,430,047 |
| Bruker Corp. | 33,402 | 2,065,580 |
| Catalent, Inc. * | 29,955 | 1,968,942 |
| Charles River Laboratories International, Inc. * | 12,744 | 2,704,914 |
| SECURITY | NUMBER OF SHARES | VALUE ($) |
| Corcept Therapeutics, Inc. * | 18,885 | 540,111 |
| Eagle Pharmaceuticals, Inc. * | 11,265 | 354,510 |
| Elanco Animal Health, Inc. * | 151,980 | 2,004,616 |
| Emergent BioSolutions, Inc. * | 41,966 | 875,411 |
| Exact Sciences Corp. * | 9,741 | 338,792 |
| Exelixis, Inc. * | 97,522 | 1,616,915 |
| Horizon Therapeutics plc * | 26,734 | 1,666,063 |
| Incyte Corp. * | 31,728 | 2,358,660 |
| Ionis Pharmaceuticals, Inc. * | 11,950 | 528,190 |
| Ligand Pharmaceuticals, Inc. * | 7,017 | 615,040 |
| Medpace Holdings, Inc. * | 6,152 | 1,365,621 |
| Myriad Genetics, Inc. * | 55,699 | 1,155,197 |
| Prestige Consumer Healthcare, Inc. * | 30,309 | 1,651,234 |
| Royalty Pharma plc, Class A | 56,870 | 2,406,738 |
| Seagen, Inc. * | 5,334 | 678,271 |
| Supernus Pharmaceuticals, Inc. * | 19,073 | 653,632 |
| Syneos Health, Inc. * | 50,087 | 2,523,383 |
| West Pharmaceutical Services, Inc. | 11,294 | 2,598,749 |
| 38,802,297 | ||
| Real Estate 8.1% | ||
| Acadia Realty Trust | 60,305 | 842,461 |
| Agree Realty Corp. | 8,925 | 613,148 |
| Alexander & Baldwin, Inc. | 93,134 | 1,814,250 |
| American Assets Trust, Inc. | 32,859 | 902,965 |
| American Homes 4 Rent, Class A | 72,007 | 2,299,904 |
| Americold Realty Trust, Inc. | 99,316 | 2,408,413 |
| Apartment Income REIT Corp. | 81,449 | 3,130,085 |
| Apartment Investment & Management Co., Class A | 68,400 | 543,096 |
| Apple Hospitality REIT, Inc. | 257,339 | 4,405,644 |
| Ashford Hospitality Trust, Inc. * | 72,504 | 588,732 |
| Brandywine Realty Trust | 237,099 | 1,555,369 |
| Broadstone Net Lease, Inc. | 26,387 | 452,273 |
| CareTrust REIT, Inc. | 39,453 | 736,982 |
| Centerspace | 8,928 | 618,710 |
| Chatham Lodging Trust * | 68,572 | 889,379 |
| Corporate Office Properties Trust | 90,629 | 2,415,263 |
| Cousins Properties, Inc. | 70,737 | 1,680,711 |
| CubeSmart | 62,085 | 2,599,499 |
| Cushman & Wakefield plc * | 94,446 | 1,090,851 |
| DiamondRock Hospitality Co. | 234,286 | 2,188,231 |
| Douglas Emmett, Inc. | 116,869 | 2,055,726 |
| Easterly Government Properties, Inc. | 42,710 | 742,727 |
| EastGroup Properties, Inc. | 8,555 | 1,340,483 |
| Elme Communities | 69,599 | 1,328,645 |
| Empire State Realty Trust, Inc., Class A | 213,104 | 1,570,576 |
| EPR Properties | 57,295 | 2,211,587 |
| Equity Commonwealth | 51,786 | 1,354,722 |
| Equity LifeStyle Properties, Inc. | 49,060 | 3,137,878 |
| Essential Properties Realty Trust, Inc. | 19,591 | 421,598 |
| First Industrial Realty Trust, Inc. | 35,708 | 1,700,772 |
| Four Corners Property Trust, Inc. | 21,155 | 541,991 |
| Getty Realty Corp. | 16,278 | 512,594 |
| Global Net Lease, Inc. | 94,608 | 1,158,948 |
| Healthcare Realty Trust, Inc. | 188,575 | 3,833,730 |
| Hersha Hospitality Trust | 82,204 | 752,167 |
| Highwoods Properties, Inc. | 88,863 | 2,508,603 |
| HomeBanc Corp. *(b) | 6,875 | 0 |
| Hudson Pacific Properties, Inc. | 131,772 | 1,454,763 |
| Industrial Logistics Properties Trust | 66,433 | 310,906 |
| iStar, Inc. | 72,538 | 760,198 |
| JBG SMITH Properties | 84,259 | 1,658,217 |
| Kennedy-Wilson Holdings, Inc. | 92,360 | 1,534,100 |
| Kilroy Realty Corp. | 59,203 | 2,530,336 |
| Kite Realty Group Trust | 110,698 | 2,174,109 |
| Life Storage, Inc. | 22,091 | 2,443,486 |
| SECURITY | NUMBER OF SHARES | VALUE ($) |
| LTC Properties, Inc. | 23,468 | 907,508 |
| LXP Industrial Trust | 153,524 | 1,486,112 |
| Marcus & Millichap, Inc. | 18,532 | 682,719 |
| National Health Investors, Inc. | 24,892 | 1,411,376 |
| National Retail Properties, Inc. | 70,710 | 2,971,941 |
| National Storage Affiliates Trust | 11,626 | 495,965 |
| Newmark Group, Inc., Class A | 91,165 | 746,641 |
| Office Properties Income Trust | 90,841 | 1,389,867 |
| Outfront Media, Inc. | 158,810 | 2,866,521 |
| Paramount Group, Inc. | 308,466 | 1,995,775 |
| Pebblebrook Hotel Trust | 113,716 | 1,824,005 |
| Physicians Realty Trust | 107,134 | 1,613,438 |
| Piedmont Office Realty Trust, Inc., Class A | 185,890 | 1,942,551 |
| PotlatchDeltic Corp. | 42,277 | 1,880,904 |
| Rayonier, Inc. | 73,943 | 2,491,879 |
| Retail Opportunity Investments Corp. | 72,126 | 1,044,384 |
| Rexford Industrial Realty, Inc. | 16,147 | 892,606 |
| RLJ Lodging Trust | 305,800 | 3,721,586 |
| RPT Realty | 88,116 | 819,479 |
| Ryman Hospitality Properties, Inc. | 28,388 | 2,524,261 |
| Sabra Health Care REIT, Inc. | 184,978 | 2,526,799 |
| SITE Centers Corp. | 169,192 | 2,094,597 |
| Spirit Realty Capital, Inc. | 54,446 | 2,114,138 |
| STAG Industrial, Inc. | 49,920 | 1,576,973 |
| STORE Capital Corp. | 86,738 | 2,758,268 |
| Summit Hotel Properties, Inc. | 142,281 | 1,229,308 |
| Sunstone Hotel Investors, Inc. | 273,494 | 3,049,458 |
| Tanger Factory Outlet Centers, Inc. | 120,123 | 2,163,415 |
| Terreno Realty Corp. | 11,991 | 685,166 |
| The Howard Hughes Corp. * | 15,038 | 922,581 |
| The Necessity Retail REIT, Inc. | 101,032 | 691,059 |
| Uniti Group, Inc. | 304,664 | 2,364,193 |
| Urban Edge Properties | 94,367 | 1,332,462 |
| Veris Residential, Inc. * | 94,970 | 1,503,375 |
| Xenia Hotels & Resorts, Inc. | 154,006 | 2,630,423 |
| Zillow Group, Inc., Class A * | 7,175 | 221,923 |
| Zillow Group, Inc., Class C * | 20,134 | 621,335 |
| 132,009,819 | ||
| Retailing 4.2% | ||
| 1-800-Flowers.com, Inc., Class A * | 44,355 | 323,348 |
| Abercrombie & Fitch Co., Class A * | 104,226 | 1,832,293 |
| Academy Sports & Outdoors, Inc. | 64,640 | 2,846,099 |
| America's Car-Mart, Inc. * | 7,579 | 518,100 |
| Arko Corp. | 63,550 | 651,387 |
| Barnes & Noble Education, Inc. * | 238,006 | 664,037 |
| Big 5 Sporting Goods Corp. (a) | 47,249 | 609,040 |
| Boot Barn Holdings, Inc. * | 9,737 | 553,062 |
| Caleres, Inc. | 59,530 | 1,626,955 |
| Camping World Holdings, Inc., Class A (a) | 15,844 | 440,938 |
| Chico's FAS, Inc. * | 371,886 | 2,186,690 |
| Citi Trends, Inc. * | 21,262 | 480,734 |
| Conn's, Inc. * | 57,850 | 474,948 |
| Designer Brands, Inc., Class A | 145,756 | 2,219,864 |
| Dillard's, Inc., Class A | 8,778 | 2,886,119 |
| Etsy, Inc. * | 15,892 | 1,492,418 |
| Express, Inc. * | 300,276 | 366,337 |
| Five Below, Inc. * | 12,576 | 1,840,498 |
| Floor & Decor Holdings, Inc., Class A * | 18,302 | 1,342,818 |
| GameStop Corp., Class A *(a) | 114,636 | 3,245,345 |
| Genesco, Inc. * | 31,260 | 1,470,470 |
| Groupon, Inc. *(a) | 79,609 | 586,718 |
| Guess?, Inc. (a) | 77,468 | 1,315,407 |
| Haverty Furniture Cos., Inc. | 41,951 | 1,115,058 |
| Hibbett, Inc. | 25,928 | 1,618,426 |
| SECURITY | NUMBER OF SHARES | VALUE ($) |
| MarineMax, Inc. * | 30,368 | 981,190 |
| MercadoLibre, Inc. * | 1,435 | 1,293,825 |
| Monro, Inc. | 32,895 | 1,570,736 |
| National Vision Holdings, Inc. * | 43,411 | 1,607,943 |
| Ollie's Bargain Outlet Holdings, Inc. * | 40,131 | 2,247,336 |
| Overstock.com, Inc. * | 32,139 | 747,232 |
| Party City Holdco, Inc. * | 447,434 | 756,163 |
| PetMed Express, Inc. | 29,182 | 622,160 |
| Rent-A-Center, Inc. | 64,697 | 1,348,932 |
| RH * | 4,341 | 1,102,310 |
| Sally Beauty Holdings, Inc. * | 211,670 | 2,690,326 |
| Shoe Carnival, Inc. | 28,638 | 686,739 |
| Signet Jewelers Ltd. | 54,258 | 3,539,792 |
| Sleep Number Corp. * | 37,856 | 1,050,125 |
| Sonic Automotive, Inc., Class A | 58,447 | 2,732,397 |
| Sportsman's Warehouse Holdings, Inc. * | 54,884 | 492,858 |
| Stitch Fix, Inc., Class A * | 99,704 | 398,816 |
| The Aaron's Co., Inc. | 71,010 | 739,924 |
| The Buckle, Inc. | 37,132 | 1,460,402 |
| The Children's Place, Inc. * | 21,060 | 852,509 |
| TravelCenters of America, Inc. * | 42,465 | 2,699,925 |
| Urban Outfitters, Inc. * | 148,572 | 3,544,928 |
| Victoria's Secret & Co. * | 61,625 | 2,317,100 |
| Wayfair, Inc., Class A * | 7,464 | 283,035 |
| Zumiez, Inc. * | 30,125 | 675,704 |
| 69,149,516 | ||
| Semiconductors & Semiconductor Equipment 2.0% | ||
| Ambarella, Inc. * | 6,152 | 336,699 |
| Amkor Technology, Inc. | 129,511 | 2,692,534 |
| Axcelis Technologies, Inc. * | 8,056 | 467,248 |
| Cirrus Logic, Inc. * | 47,075 | 3,159,674 |
| Diodes, Inc. * | 26,467 | 1,896,890 |
| Entegris, Inc. | 32,189 | 2,553,875 |
| First Solar, Inc. * | 47,402 | 6,900,309 |
| FormFactor, Inc. * | 25,825 | 521,923 |
| Ichor Holdings Ltd. * | 17,651 | 449,041 |
| Kulicke & Soffa Industries, Inc. | 34,218 | 1,435,103 |
| Lattice Semiconductor Corp. * | 7,747 | 375,807 |
| Monolithic Power Systems, Inc. | 3,362 | 1,141,231 |
| Onto Innovation, Inc. * | 7,869 | 525,964 |
| Photronics, Inc. * | 71,540 | 1,160,379 |
| Power Integrations, Inc. | 15,630 | 1,042,677 |
| Semtech Corp. * | 21,103 | 584,342 |
| Silicon Laboratories, Inc. * | 9,467 | 1,087,948 |
| SMART Global Holdings, Inc. * | 24,507 | 331,580 |
| SolarEdge Technologies, Inc. * | 4,718 | 1,085,282 |
| Synaptics, Inc. * | 14,304 | 1,267,334 |
| Ultra Clean Holdings, Inc. * | 27,966 | 870,022 |
| Universal Display Corp. | 7,471 | 711,389 |
| Wolfspeed, Inc. * | 18,731 | 1,475,066 |
| 32,072,317 | ||
| Software & Services 5.0% | ||
| ACI Worldwide, Inc. * | 66,463 | 1,617,045 |
| Adeia, Inc. | 76,437 | 854,566 |
| Alarm.com Holdings, Inc. * | 7,227 | 425,237 |
| Aspen Technology, Inc. * | 9,985 | 2,410,878 |
| Avaya Holdings Corp. *(a) | 282,461 | 446,288 |
| Bentley Systems, Inc., Class B | 24,692 | 871,134 |
| Black Knight, Inc. * | 43,707 | 2,642,962 |
| Blackbaud, Inc. * | 15,405 | 842,654 |
| Block, Inc. * | 20,618 | 1,238,523 |
| Cerence, Inc. * | 32,111 | 552,309 |
| Ceridian HCM Holding, Inc. * | 8,141 | 538,853 |
| CommVault Systems, Inc. * | 20,157 | 1,227,360 |
| SECURITY | NUMBER OF SHARES | VALUE ($) |
| Concentrix Corp. | 19,396 | 2,370,773 |
| Conduent, Inc. * | 463,318 | 1,908,870 |
| Consensus Cloud Solutions, Inc. * | 14,397 | 808,248 |
| CSG Systems International, Inc. | 25,985 | 1,680,450 |
| Dolby Laboratories, Inc., Class A | 32,802 | 2,192,486 |
| Dropbox, Inc., Class A * | 83,930 | 1,825,477 |
| Ebix, Inc. | 35,633 | 705,177 |
| Envestnet, Inc. * | 14,496 | 714,798 |
| EPAM Systems, Inc. * | 7,505 | 2,626,750 |
| Euronet Worldwide, Inc. * | 30,688 | 2,578,099 |
| EVERTEC, Inc. | 27,466 | 983,557 |
| ExlService Holdings, Inc. * | 11,367 | 2,067,089 |
| Fair Isaac Corp. * | 6,349 | 3,040,155 |
| Fortinet, Inc. * | 62,512 | 3,573,186 |
| Gartner, Inc. * | 13,111 | 3,958,473 |
| Globant S.A. * | 3,977 | 750,380 |
| GoDaddy, Inc., Class A * | 34,898 | 2,805,799 |
| Guidewire Software, Inc. * | 9,801 | 582,277 |
| InterDigital, Inc. | 33,737 | 1,682,464 |
| LiveRamp Holdings, Inc. * | 71,487 | 1,312,501 |
| Manhattan Associates, Inc. * | 14,871 | 1,809,355 |
| MicroStrategy, Inc., Class A *(a) | 2,291 | 612,865 |
| Pagseguro Digital Ltd., Class A * | 79,724 | 1,090,624 |
| Paycom Software, Inc. * | 3,982 | 1,377,772 |
| Paysafe Ltd. * | 592,706 | 865,351 |
| Pegasystems, Inc. | 13,265 | 493,591 |
| Perficient, Inc. * | 9,049 | 606,012 |
| Progress Software Corp. | 27,805 | 1,418,889 |
| PTC, Inc. * | 12,912 | 1,521,421 |
| Qualys, Inc. * | 4,479 | 638,526 |
| RingCentral, Inc., Class A * | 26,379 | 936,982 |
| Sabre Corp. * | 543,053 | 3,155,138 |
| ServiceNow, Inc. * | 3,766 | 1,584,507 |
| Splunk, Inc. * | 15,227 | 1,265,516 |
| StoneCo Ltd., Class A * | 74,356 | 780,738 |
| Teradata Corp. * | 88,435 | 2,793,662 |
| TTEC Holdings, Inc. | 8,820 | 392,225 |
| Twilio, Inc., Class A * | 8,660 | 644,044 |
| Tyler Technologies, Inc. * | 4,992 | 1,614,063 |
| Unisys Corp. * | 85,626 | 727,821 |
| Verint Systems, Inc. * | 17,160 | 607,979 |
| Verra Mobility Corp. * | 29,227 | 498,905 |
| WEX, Inc. * | 15,347 | 2,519,057 |
| Workday, Inc., Class A * | 6,706 | 1,044,929 |
| Xperi, Inc. * | 30,684 | 428,655 |
| Zoom Video Communications, Inc., Class A * | 8,190 | 683,374 |
| 81,946,819 | ||
| Technology Hardware & Equipment 4.7% | ||
| ADTRAN Holdings, Inc. | 61,371 | 1,378,393 |
| Advanced Energy Industries, Inc. | 17,672 | 1,389,903 |
| Arista Networks, Inc. * | 31,163 | 3,766,360 |
| Badger Meter, Inc. | 10,456 | 1,176,091 |
| Belden, Inc. | 43,069 | 2,998,894 |
| Benchmark Electronics, Inc. | 131,136 | 3,722,951 |
| Cognex Corp. | 47,420 | 2,192,227 |
| Coherent Corp. * | 46,662 | 1,568,310 |
| CommScope Holding Co., Inc. * | 393,768 | 5,213,488 |
| Comtech Telecommunications Corp. | 55,364 | 611,772 |
| CTS Corp. | 22,318 | 882,007 |
| ePlus, Inc. * | 34,814 | 1,696,138 |
| Fabrinet * | 21,346 | 2,441,982 |
| IPG Photonics Corp. * | 23,479 | 2,011,211 |
| Itron, Inc. * | 32,602 | 1,593,912 |
| Kimball Electronics, Inc. * | 45,516 | 940,816 |
| Knowles Corp. * | 75,369 | 1,036,324 |
| SECURITY | NUMBER OF SHARES | VALUE ($) |
| Littelfuse, Inc. | 10,750 | 2,367,688 |
| Lumentum Holdings, Inc. * | 19,961 | 1,486,096 |
| Methode Electronics, Inc. | 38,418 | 1,583,974 |
| National Instruments Corp. | 86,995 | 3,321,469 |
| NETGEAR, Inc. * | 57,682 | 1,133,451 |
| NetScout Systems, Inc. * | 83,917 | 3,014,299 |
| Novanta, Inc. * | 5,995 | 847,693 |
| OSI Systems, Inc. * | 17,501 | 1,438,232 |
| PC Connection, Inc. | 30,133 | 1,601,268 |
| Plexus Corp. * | 38,406 | 3,779,150 |
| Pure Storage, Inc., Class A * | 17,855 | 551,005 |
| Rogers Corp. * | 6,178 | 1,453,869 |
| ScanSource, Inc. * | 90,418 | 2,801,150 |
| Stratasys Ltd. * | 39,788 | 575,732 |
| Super Micro Computer, Inc. * | 57,146 | 3,976,790 |
| TD SYNNEX Corp. | 35,191 | 3,220,328 |
| TTM Technologies, Inc. * | 214,822 | 3,288,925 |
| ViaSat, Inc. * | 59,008 | 2,416,968 |
| Viavi Solutions, Inc. * | 86,151 | 1,300,880 |
| Vontier Corp. | 121,477 | 2,320,211 |
| 77,099,957 | ||
| Telecommunication Services 0.5% | ||
| ATN International, Inc. | 19,114 | 824,196 |
| Cogent Communications Holdings, Inc. | 20,366 | 1,069,419 |
| Consolidated Communications Holdings, Inc. * | 265,939 | 1,374,904 |
| EchoStar Corp., Class A * | 72,696 | 1,371,773 |
| Frontier Communications Parent, Inc. * | 38,257 | 895,979 |
| Iridium Communications, Inc. * | 31,557 | 1,626,132 |
| Shenandoah Telecommunications Co. | 42,836 | 970,664 |
| 8,133,067 | ||
| Transportation 2.5% | ||
| Air Transport Services Group, Inc. * | 54,235 | 1,583,662 |
| Alaska Air Group, Inc. * | 47,567 | 2,114,829 |
| Allegiant Travel Co. * | 4,816 | 361,441 |
| AMERCO | 6,027 | 3,466,670 |
| ArcBest Corp. | 36,002 | 2,859,639 |
| Atlas Air Worldwide Holdings, Inc. * | 36,826 | 3,724,582 |
| Atlas Corp. (a) | 67,984 | 1,005,483 |
| Costamare, Inc. | 52,617 | 496,704 |
| Covenant Logistics Group, Inc. | 21,565 | 816,020 |
| Danaos Corp. (a) | 5,620 | 318,654 |
| Daseke, Inc. * | 217,700 | 1,297,492 |
| Forward Air Corp. | 21,651 | 2,292,191 |
| Golden Ocean Group Ltd. (a) | 41,864 | 348,727 |
| Hawaiian Holdings, Inc. * | 41,504 | 598,903 |
| Heartland Express, Inc. | 68,055 | 1,012,658 |
| Hub Group, Inc., Class A * | 48,924 | 3,796,502 |
| JetBlue Airways Corp. * | 204,558 | 1,644,646 |
| Kirby Corp. * | 57,006 | 3,976,169 |
| Lyft, Inc., Class A * | 42,501 | 622,215 |
| Marten Transport Ltd. | 70,402 | 1,321,446 |
| Matson, Inc. | 5,190 | 381,880 |
| Saia, Inc. * | 10,310 | 2,050,247 |
| Schneider National, Inc., Class B | 91,830 | 2,042,299 |
| SkyWest, Inc. * | 40,210 | 710,913 |
| Spirit Airlines, Inc. | 37,895 | 833,690 |
| Yellow Corp. * | 142,159 | 629,764 |
| 40,307,426 | ||
| Utilities 3.6% | ||
| ALLETE, Inc. | 55,820 | 3,140,991 |
| American States Water Co. | 14,510 | 1,312,575 |
| SECURITY | NUMBER OF SHARES | VALUE ($) |
| Atlantica Sustainable Infrastructure plc | 54,367 | 1,506,510 |
| Avangrid, Inc. | 51,281 | 2,086,111 |
| Avista Corp. | 78,909 | 3,237,636 |
| California Water Service Group | 24,208 | 1,502,349 |
| Chesapeake Utilities Corp. | 7,882 | 980,363 |
| Clearway Energy, Inc., Class A | 16,162 | 522,518 |
| Clearway Energy, Inc., Class C | 38,095 | 1,323,420 |
| Essential Utilities, Inc. | 74,341 | 3,287,359 |
| Hawaiian Electric Industries, Inc. | 99,663 | 3,791,181 |
| IDACORP, Inc. | 34,072 | 3,567,338 |
| MGE Energy, Inc. | 18,980 | 1,292,348 |
| National Fuel Gas Co. | 57,086 | 3,852,734 |
| New Jersey Resources Corp. | 75,894 | 3,387,908 |
| Northwest Natural Holding Co. | 30,678 | 1,475,305 |
| NorthWestern Corp. | 57,249 | 3,024,465 |
| ONE Gas, Inc. | 45,493 | 3,524,798 |
| Ormat Technologies, Inc. | 20,765 | 1,878,194 |
| Otter Tail Corp. | 25,627 | 1,727,772 |
| PNM Resources, Inc. | 71,080 | 3,303,088 |
| SJW Group | 14,230 | 1,005,776 |
| South Jersey Industries, Inc. | 80,730 | 2,798,909 |
| Spire, Inc. | 51,394 | 3,587,815 |
| Unitil Corp. | 16,655 | 877,885 |
| 57,995,348 | ||
| Total Common Stocks (Cost $1,290,324,185) | 1,629,421,752 | |
| SHORT-TERM INVESTMENTS 1.4% OF NET ASSETS | ||
| Money Market Funds 1.4% | ||
| State Street Institutional U.S. Government Money Market Fund, Premier Class 3.01% (c) | 8,951,488 | 8,951,488 |
| State Street Institutional U.S. Government Money Market Fund, Premier Class 3.01% (c)(d) | 14,043,476 | 14,043,476 |
| 22,994,964 | ||
| Total Short-Term Investments (Cost $22,994,964) | 22,994,964 | |
| Total Investments in Securities (Cost $1,313,319,149) | 1,652,416,716 | |
| NUMBER OF CONTRACTS | NOTIONAL AMOUNT ($) | CURRENT VALUE/ UNREALIZED APPRECIATION ($) | |
| FUTURES CONTRACTS | |||
| Long | |||
| Russell 2000 Index, e-mini, expires 12/16/22 | 20 | 1,853,000 | 70,241 |
| * | Non-income producing security. |
| (a) | All or a portion of this security is on loan. Securities on loan were valued at $13,510,408. |
| (b) | Fair-valued using significant unobservable inputs (see financial note 2(a), Securities for which no quoted value is available, for additional information). |
| (c) | The rate shown is the annualized 7-day yield. |
| (d) | Security purchased with cash collateral received for securities on loan. |
| REIT — | Real Estate Investment Trust |
| DESCRIPTION | QUOTED PRICES IN ACTIVE MARKETS FOR IDENTICAL ASSETS (LEVEL 1) | OTHER SIGNIFICANT OBSERVABLE INPUTS (LEVEL 2) | SIGNIFICANT UNOBSERVABLE INPUTS (LEVEL 3) | TOTAL |
| Assets | ||||
| Common Stocks1 | $1,497,411,933 | $— | $— | $1,497,411,933 |
| Real Estate | 132,009,819 | — | 0* | 132,009,819 |
| Short-Term Investments1 | 22,994,964 | — | — | 22,994,964 |
| Futures Contracts2 | 70,241 | — | — | 70,241 |
| Total | $1,652,486,957 | $— | $0* | $1,652,486,957 |
| * | Level 3 amount shown includes securities determined to have no value at October 31, 2022. |
| 1 | As categorized in the Portfolio Holdings. |
| 2 | Futures contracts are reported at cumulative unrealized appreciation or depreciation. |
| Assets | ||
| Investments in securities, at value - unaffiliated (cost $1,313,319,149) including securities on loan of $13,510,408 | $1,652,416,716 | |
| Foreign currency, at value (cost $34) | 23 | |
| Deposit with broker for futures contracts | 577,500 | |
| Receivables: | ||
| Fund shares sold | 1,918,757 | |
| Dividends | 593,110 | |
| Income from securities on loan | 75,852 | |
| Variation margin on future contracts | + | 6,441 |
| Total assets | 1,655,588,399 | |
| Liabilities | ||
| Collateral held for securities on loan | 14,043,476 | |
| Payables: | ||
| Investments bought | 5,523,128 | |
| Fund shares redeemed | 4,520,876 | |
| Investment adviser fees | + | 304,866 |
| Total liabilities | 24,392,346 | |
| Net assets | $1,631,196,053 | |
| Net Assets by Source | ||
| Capital received from investors | $1,271,011,958 | |
| Total distributable earnings | + | 360,184,095 |
| Net assets | $1,631,196,053 | |
| Net Asset Value (NAV) | ||||
| Net Assets | ÷ | Shares Outstanding | = | NAV |
| $1,631,196,053 | 107,153,100 | $15.22 | ||
| For the period November 1, 2021 through October 31, 2022 | ||
| Investment Income | ||
| Dividends received from securities - unaffiliated (net of foreign withholding tax of $9,568) | $27,256,470 | |
| Interest received from securities - unaffiliated | 4,296 | |
| Securities on loan, net | + | 612,429 |
| Total investment income | 27,873,195 | |
| Expenses | ||
| Investment adviser fees | 4,347,447 | |
| Proxy fees1 | + | 80,160 |
| Total expenses | – | 4,427,607 |
| Net investment income | 23,445,588 | |
| REALIZED AND UNREALIZED GAINS (LOSSES) | ||
| Net realized gains on sales of securities - unaffiliated | 78,234,626 | |
| Net realized gains on sales of in-kind redemptions - unaffiliated | 131,614,958 | |
| Net realized losses on futures contracts | + | (2,215,825) |
| Net realized gains | 207,633,759 | |
| Net change in unrealized appreciation (depreciation) on securities - unaffiliated | (445,702,431) | |
| Net change in unrealized appreciation (depreciation) on futures contracts | (35,606) | |
| Net change in unrealized appreciation (depreciation) on foreign currency translations | + | (3) |
| Net change in unrealized appreciation (depreciation) | + | (445,738,040) |
| Net realized and unrealized losses | (238,104,281) | |
| Decrease in net assets resulting from operations | ($214,658,693) | |
| 1 | Proxy fees are non-routine expenses (see financial note 2(e) for additional information). |
| OPERATIONS | |||
| 11/1/21-10/31/22 | 11/1/20-10/31/21 | ||
| Net investment income | $23,445,588 | $19,643,245 | |
| Net realized gains | 207,633,759 | 312,627,403 | |
| Net change in unrealized appreciation (depreciation) | + | (445,738,040) | 540,665,132 |
| Increase (decrease) in net assets resulting from operations | ($214,658,693) | $872,935,780 | |
| DISTRIBUTIONS TO SHAREHOLDERS | |||
| Total distributions | ($209,192,167) | ($24,462,415) | |
| TRANSACTIONS IN FUND SHARES | |||||
| 11/1/21-10/31/22 | 11/1/20-10/31/21 | ||||
| SHARES | VALUE | SHARES | VALUE | ||
| Shares sold | 39,427,994 | $631,702,221 | 33,185,229 | $573,288,196 | |
| Shares reinvested | 8,654,231 | 148,679,691 | 1,157,934 | 17,218,482 | |
| Shares redeemed | + | (41,616,527) | (670,809,902) | (50,160,481) | (887,504,519) |
| Net transactions in fund shares | 6,465,698 | $109,572,010 | (15,817,318) | ($296,997,841) | |
| SHARES OUTSTANDING AND NET ASSETS | |||||
| 11/1/21-10/31/22 | 11/1/20-10/31/21 | ||||
| SHARES | NET ASSETS | SHARES | NET ASSETS | ||
| Beginning of period | 100,687,402 | $1,945,474,903 | 116,504,720 | $1,393,999,379 | |
| Total increase (decrease) | + | 6,465,698 | (314,278,850) | (15,817,318) | 551,475,524 |
| End of period | 107,153,100 | $1,631,196,053 | 100,687,402 | $1,945,474,903 | |
| 11/1/21– 10/31/22 | 11/1/20– 10/31/21 | 11/1/19– 10/31/20 | 11/1/18– 10/31/19 | 11/1/17– 10/31/18 | ||
| Per-Share Data | ||||||
| Net asset value at beginning of period | $10.56 | $7.51 | $8.98 | $8.69 | $9.55 | |
| Income (loss) from investment operations: | ||||||
| Net investment income (loss)1 | 0.34 | 0.31 | 0.21 | 0.30 | 0.29 | |
| Net realized and unrealized gains (losses) | (2.10) | 2.96 | (1.35) | 0.27 | (0.89) | |
| Total from investment operations | (1.76) | 3.27 | (1.14) | 0.57 | (0.60) | |
| Less distributions: | ||||||
| Distributions from net investment income | (0.39) | (0.22) | (0.33) | (0.28) | (0.26) | |
| Net asset value at end of period | $8.41 | $10.56 | $7.51 | $8.98 | $8.69 | |
| Total return | (17.25%) | 44.03% | (13.29%) | 7.04% | (6.53%) | |
| Ratios/Supplemental Data | ||||||
| Ratios to average net assets: | ||||||
| Total expenses | 0.25% 2 | 0.25% | 0.25% | 0.25% | 0.25% | |
| Net investment income (loss) | 3.56% | 3.10% | 2.60% | 3.51% | 3.10% | |
| Portfolio turnover rate | 13% | 21% | 14% | 28% | 13% | |
| Net assets, end of period (x 1,000,000) | $1,565 | $1,406 | $966 | $1,327 | $1,349 | |
| 1 | Calculated based on the average shares outstanding during the period. |
| 2 | Ratio includes less than 0.005% of non-routine proxy expenses. |
| SECURITY | NUMBER OF SHARES | VALUE ($) |
| COMMON STOCKS 98.0% OF NET ASSETS | ||
| Australia 5.4% | ||
| AGL Energy Ltd. | 339,825 | 1,480,545 |
| Amcor plc | 111,021 | 1,289,313 |
| AMP Ltd. * | 992,825 | 800,642 |
| Ampol Ltd. | 56,529 | 985,968 |
| APA Group | 87,465 | 588,848 |
| Aristocrat Leisure Ltd. | 20,450 | 485,400 |
| Aurizon Holdings Ltd. | 323,030 | 748,579 |
| Australia & New Zealand Banking Group Ltd. | 336,158 | 5,507,525 |
| BGP Holdings plc *(a) | 453,854 | 726 |
| BHP Group Ltd. | 498,138 | 11,965,376 |
| BlueScope Steel Ltd. | 96,374 | 970,484 |
| Brambles Ltd. | 153,306 | 1,147,761 |
| Coles Group Ltd. | 145,528 | 1,521,591 |
| Commonwealth Bank of Australia | 119,148 | 7,988,485 |
| Computershare Ltd. | 28,641 | 463,642 |
| CSL Ltd. | 10,616 | 1,900,428 |
| Downer EDI Ltd. | 148,261 | 426,092 |
| Fortescue Metals Group Ltd. | 134,756 | 1,269,537 |
| Goodman Group | 32,712 | 355,930 |
| Incitec Pivot Ltd. | 210,834 | 507,045 |
| Insurance Australia Group Ltd. | 309,578 | 971,745 |
| James Hardie Industries plc | 13,842 | 302,212 |
| JB Hi-Fi Ltd. | 12,907 | 353,806 |
| Lendlease Corp., Ltd. | 147,108 | 818,032 |
| Macquarie Group Ltd. | 16,514 | 1,791,485 |
| Medibank Pvt Ltd. | 318,781 | 574,019 |
| Metcash Ltd. | 206,617 | 542,396 |
| Mirvac Group | 323,667 | 428,848 |
| National Australia Bank Ltd. | 270,408 | 5,616,926 |
| Newcrest Mining Ltd. | 65,947 | 730,381 |
| Orica Ltd. | 47,577 | 423,209 |
| Origin Energy Ltd. | 268,467 | 959,119 |
| Orora Ltd. | 153,374 | 297,626 |
| Qantas Airways Ltd. * | 123,392 | 461,087 |
| QBE Insurance Group Ltd. | 109,550 | 858,320 |
| Ramsay Health Care Ltd. | 11,240 | 421,603 |
| Rio Tinto Ltd. | 51,271 | 2,909,608 |
| Santos Ltd. | 144,878 | 707,245 |
| Scentre Group | 439,143 | 817,254 |
| Sims Ltd. | 36,486 | 285,260 |
| Sonic Healthcare Ltd. | 31,213 | 653,459 |
| South32 Ltd. | 480,214 | 1,101,739 |
| Stockland | 255,590 | 588,905 |
| Suncorp Group Ltd. | 197,175 | 1,442,337 |
| Tabcorp Holdings Ltd. | 184,993 | 114,211 |
| Telstra Group Ltd. | 683,263 | 1,713,233 |
| The Lottery Corp., Ltd. * | 115,370 | 316,502 |
| Transurban Group | 104,773 | 888,784 |
| Treasury Wine Estates Ltd. | 49,792 | 412,615 |
| Vicinity Ltd. | 317,418 | 395,713 |
| Viva Energy Group Ltd. | 240,496 | 436,557 |
| Wesfarmers Ltd. | 110,190 | 3,197,606 |
| Westpac Banking Corp. | 430,626 | 6,649,279 |
| SECURITY | NUMBER OF SHARES | VALUE ($) |
| Woodside Energy Group Ltd. | 155,139 | 3,586,573 |
| Woolworths Group Ltd. | 125,702 | 2,654,547 |
| Worley Ltd. | 46,586 | 425,522 |
| 85,251,680 | ||
| Austria 0.3% | ||
| BAWAG Group AG * | 8,379 | 404,503 |
| Erste Group Bank AG | 40,808 | 1,005,710 |
| OMV AG | 27,204 | 1,252,563 |
| Raiffeisen Bank International AG | 29,150 | 405,395 |
| Voestalpine AG | 37,443 | 812,898 |
| Wienerberger AG | 16,385 | 374,542 |
| 4,255,611 | ||
| Belgium 0.8% | ||
| Ageas S.A./N.V. | 27,020 | 935,383 |
| Anheuser-Busch InBev S.A./N.V. | 100,412 | 5,022,647 |
| Etablissements Franz Colruyt N.V. | 13,867 | 334,252 |
| Groupe Bruxelles Lambert N.V. | 14,557 | 1,073,235 |
| KBC Group N.V. | 25,667 | 1,286,321 |
| Proximus SADP | 36,733 | 385,099 |
| Solvay S.A. | 12,537 | 1,131,349 |
| UCB S.A. | 9,188 | 692,479 |
| Umicore S.A. | 26,362 | 869,047 |
| 11,729,812 | ||
| Canada 7.6% | ||
| Agnico Eagle Mines Ltd. | 22,617 | 994,925 |
| Algonquin Power & Utilities Corp. | 31,321 | 346,696 |
| Alimentation Couche-Tard, Inc. | 88,147 | 3,946,832 |
| AltaGas Ltd. | 20,605 | 371,611 |
| Atco Ltd., Class I | 14,093 | 437,578 |
| Bank of Montreal | 38,698 | 3,564,585 |
| Barrick Gold Corp. | 133,859 | 2,013,264 |
| Bausch Health Cos., Inc. * | 69,541 | 452,258 |
| BCE, Inc. | 32,802 | 1,479,563 |
| Brookfield Asset Management, Inc., Class A | 91,480 | 3,622,671 |
| Canadian Imperial Bank of Commerce | 64,452 | 2,927,034 |
| Canadian National Railway Co. | 31,426 | 3,723,093 |
| Canadian Natural Resources Ltd. | 78,318 | 4,697,298 |
| Canadian Pacific Railway Ltd. | 31,158 | 2,322,756 |
| Canadian Tire Corp., Ltd., Class A | 8,183 | 917,137 |
| Canadian Utilities Ltd., Class A | 13,336 | 354,850 |
| CCL Industries, Inc., Class B | 9,492 | 445,912 |
| Cenovus Energy, Inc. | 62,909 | 1,271,710 |
| CGI, Inc. * | 19,049 | 1,534,435 |
| CI Financial Corp. | 40,184 | 402,327 |
| Constellation Software, Inc. | 263 | 380,285 |
| Crescent Point Energy Corp. | 87,856 | 686,803 |
| Dollarama, Inc. | 11,047 | 656,406 |
| Emera, Inc. | 20,924 | 775,464 |
| Enbridge, Inc. | 154,786 | 6,030,786 |
| Fairfax Financial Holdings Ltd. | 2,474 | 1,215,054 |
| Finning International, Inc. | 21,534 | 457,915 |
| SECURITY | NUMBER OF SHARES | VALUE ($) |
| First Quantum Minerals Ltd. | 26,105 | 460,457 |
| Fortis, Inc. | 37,426 | 1,460,118 |
| Franco-Nevada Corp. | 2,669 | 329,778 |
| George Weston Ltd. | 11,859 | 1,305,286 |
| Gildan Activewear, Inc. | 18,142 | 572,485 |
| Great-West Lifeco, Inc. | 24,489 | 566,949 |
| Hydro One Ltd. | 24,779 | 621,317 |
| iA Financial Corp., Inc. | 8,296 | 461,704 |
| Imperial Oil Ltd. | 24,784 | 1,348,216 |
| Intact Financial Corp. | 5,216 | 792,575 |
| Keyera Corp. | 22,071 | 473,060 |
| Kinross Gold Corp. | 186,017 | 674,514 |
| Linamar Corp. | 11,062 | 473,465 |
| Loblaw Cos., Ltd. | 19,416 | 1,590,791 |
| Lundin Mining Corp. | 57,249 | 300,039 |
| Magna International, Inc. | 68,593 | 3,822,498 |
| Manulife Financial Corp. | 179,225 | 2,970,529 |
| Methanex Corp. | 9,433 | 329,239 |
| Metro, Inc. | 25,035 | 1,311,519 |
| National Bank of Canada | 18,889 | 1,286,119 |
| Nutrien Ltd. | 46,103 | 3,895,413 |
| Onex Corp. | 31,388 | 1,579,825 |
| Open Text Corp. | 15,052 | 435,976 |
| Parkland Corp. | 22,613 | 457,123 |
| Pembina Pipeline Corp. | 36,647 | 1,209,955 |
| Power Corp. of Canada | 50,420 | 1,252,034 |
| Quebecor, Inc., Class B | 20,180 | 380,389 |
| Restaurant Brands International, Inc. | 14,462 | 859,323 |
| RioCan Real Estate Investment Trust | 25,498 | 363,281 |
| Royal Bank of Canada | 86,318 | 7,986,482 |
| Saputo, Inc. | 32,395 | 788,504 |
| Shaw Communications, Inc., Class B | 37,188 | 955,120 |
| SNC-Lavalin Group, Inc. | 27,211 | 471,177 |
| Sun Life Financial, Inc. | 43,029 | 1,827,473 |
| Suncor Energy, Inc. | 205,068 | 7,053,611 |
| TC Energy Corp. | 70,400 | 3,092,257 |
| Teck Resources Ltd., Class B | 49,544 | 1,508,122 |
| TELUS Corp. | 38,585 | 805,772 |
| TFI International, Inc. | 4,856 | 442,025 |
| The Bank of Nova Scotia | 102,415 | 4,950,290 |
| The Toronto-Dominion Bank | 109,089 | 6,981,664 |
| Thomson Reuters Corp. | 8,835 | 939,629 |
| Tourmaline Oil Corp. | 8,994 | 506,756 |
| Waste Connections, Inc. | 7,695 | 1,015,626 |
| West Fraser Timber Co., Ltd. | 7,426 | 557,570 |
| Wheaton Precious Metals Corp. | 10,739 | 351,332 |
| WSP Global, Inc. | 5,633 | 692,325 |
| 118,538,960 | ||
| Denmark 0.9% | ||
| AP Moller - Maersk A/S, Class A | 384 | 768,263 |
| AP Moller - Maersk A/S, Class B | 534 | 1,115,617 |
| Carlsberg A/S, Class B | 7,490 | 881,915 |
| Coloplast A/S, Class B | 4,360 | 486,010 |
| Danske Bank A/S | 111,643 | 1,800,911 |
| DSV A/S | 6,951 | 939,276 |
| ISS A/S * | 36,918 | 678,000 |
| Novo Nordisk A/S, Class B | 42,779 | 4,651,414 |
| Novozymes A/S, B Shares | 9,014 | 473,150 |
| Orsted A/S | 9,298 | 767,139 |
| Pandora A/S | 8,942 | 470,380 |
| Vestas Wind Systems A/S | 64,201 | 1,265,637 |
| 14,297,712 | ||
| SECURITY | NUMBER OF SHARES | VALUE ($) |
| Finland 1.1% | ||
| Elisa Oyj | 9,914 | 479,107 |
| Fortum Oyj | 61,918 | 871,451 |
| Huhtamaki Oyj | 10,617 | 381,568 |
| Kesko Oyj, B Shares | 29,186 | 567,979 |
| Kone Oyj, B Shares | 27,502 | 1,126,091 |
| Neste Oyj | 31,588 | 1,384,453 |
| Nokia Oyj | 502,441 | 2,232,804 |
| Nokian Renkaat Oyj | 29,845 | 336,557 |
| Nordea Bank Abp | 345,138 | 3,298,384 |
| Outokumpu Oyj | 96,631 | 387,816 |
| Sampo Oyj, A Shares | 36,432 | 1,665,953 |
| Stora Enso Oyj, R Shares | 72,216 | 941,610 |
| UPM-Kymmene Oyj | 70,337 | 2,364,550 |
| Wartsila Oyj Abp | 63,649 | 433,913 |
| 16,472,236 | ||
| France 8.6% | ||
| Air France-KLM * | 248,883 | 327,259 |
| Air Liquide S.A. | 32,261 | 4,220,180 |
| Airbus SE | 20,517 | 2,220,016 |
| ALD S.A. | 25,121 | 268,018 |
| Alstom S.A. | 31,306 | 644,316 |
| Arkema S.A. | 10,216 | 808,474 |
| Atos SE *(b) | 51,896 | 506,417 |
| AXA S.A. | 219,958 | 5,431,836 |
| BNP Paribas S.A. | 163,657 | 7,674,512 |
| Bollore SE | 112,511 | 562,728 |
| Bouygues S.A. | 59,741 | 1,704,479 |
| Bureau Veritas S.A. | 15,660 | 387,433 |
| Capgemini SE | 8,796 | 1,441,583 |
| Carrefour S.A. | 185,505 | 2,985,786 |
| Casino Guichard Perrachon S.A. *(b) | 40,664 | 391,123 |
| Cie de Saint-Gobain | 83,367 | 3,408,120 |
| Cie Generale des Etablissements Michelin S.C.A. | 118,956 | 3,031,480 |
| Credit Agricole S.A. | 165,052 | 1,497,625 |
| Danone S.A. | 67,517 | 3,355,560 |
| Dassault Systemes SE | 9,585 | 321,277 |
| Edenred | 8,299 | 425,458 |
| Eiffage S.A. | 13,957 | 1,262,017 |
| Electricite de France S.A. | 172,722 | 2,039,838 |
| Elis S.A. | 33,705 | 385,986 |
| Engie S.A. | 322,452 | 4,189,732 |
| EssilorLuxottica S.A. | 10,857 | 1,716,797 |
| Euroapi S.A. * | 3,505 | 61,334 |
| Eutelsat Communications S.A. | 44,049 | 442,170 |
| Faurecia SE * | 52,243 | 779,938 |
| Hermes International | 495 | 640,721 |
| Kering S.A. | 3,243 | 1,485,167 |
| Klepierre S.A. * | 21,373 | 429,560 |
| Legrand S.A. | 14,311 | 1,090,564 |
| L'Oreal S.A. | 8,734 | 2,742,512 |
| LVMH Moet Hennessy Louis Vuitton SE | 7,433 | 4,690,183 |
| Orange S.A. | 559,612 | 5,331,934 |
| Pernod-Ricard S.A. | 9,055 | 1,589,254 |
| Publicis Groupe S.A. | 23,626 | 1,323,159 |
| Renault S.A. * | 112,554 | 3,465,448 |
| Rexel S.A. * | 66,973 | 1,195,153 |
| Rubis S.C.A. | 22,453 | 509,893 |
| Safran S.A. | 22,082 | 2,459,270 |
| Sanofi | 100,843 | 8,678,326 |
| Schneider Electric SE | 34,170 | 4,321,012 |
| SCOR SE | 33,673 | 506,379 |
| SEB S.A. | 3,477 | 226,358 |
| SES S.A. | 94,632 | 671,220 |
| SECURITY | NUMBER OF SHARES | VALUE ($) |
| Societe Generale S.A. | 191,837 | 4,400,169 |
| Sodexo S.A. | 11,896 | 1,053,775 |
| STMicroelectronics N.V. | 28,013 | 871,035 |
| Teleperformance | 2,114 | 566,404 |
| Thales S.A. | 7,357 | 935,663 |
| TotalEnergies SE | 433,721 | 23,660,934 |
| Valeo S.A. | 79,395 | 1,307,872 |
| Veolia Environnement S.A. | 74,038 | 1,652,233 |
| Vinci S.A. | 51,151 | 4,707,782 |
| Vivendi SE | 41,935 | 343,237 |
| Wendel SE | 5,678 | 444,598 |
| 133,791,307 | ||
| Germany 7.0% | ||
| adidas AG | 15,351 | 1,498,489 |
| Allianz SE | 50,061 | 9,006,195 |
| Aurubis AG | 12,227 | 771,527 |
| BASF SE | 202,458 | 9,084,419 |
| Bayer AG | 120,135 | 6,316,822 |
| Bayerische Motoren Werke AG | 79,961 | 6,276,288 |
| Beiersdorf AG | 5,490 | 527,014 |
| Brenntag SE | 18,112 | 1,098,969 |
| Commerzbank AG * | 197,183 | 1,575,433 |
| Continental AG | 32,857 | 1,701,850 |
| Covestro AG | 53,770 | 1,825,277 |
| Daimler Truck Holding AG * | 51,455 | 1,372,437 |
| Deutsche Bank AG | 186,482 | 1,777,498 |
| Deutsche Boerse AG | 6,104 | 992,630 |
| Deutsche Lufthansa AG * | 190,466 | 1,302,217 |
| Deutsche Post AG | 119,965 | 4,240,737 |
| Deutsche Telekom AG | 583,541 | 11,014,620 |
| E.ON SE | 253,841 | 2,125,660 |
| Evonik Industries AG | 35,992 | 663,034 |
| Freenet AG | 20,564 | 404,210 |
| Fresenius Medical Care AG & Co. KGaA | 38,395 | 1,062,028 |
| Fresenius SE & Co. KGaA | 104,507 | 2,405,034 |
| GEA Group AG | 14,513 | 507,294 |
| Hannover Rueck SE | 5,438 | 884,893 |
| HeidelbergCement AG | 36,373 | 1,672,677 |
| Henkel AG & Co. KGaA | 14,744 | 865,548 |
| Infineon Technologies AG | 55,721 | 1,352,096 |
| K+S AG | 24,643 | 544,093 |
| KION Group AG | 10,154 | 225,117 |
| Knorr-Bremse AG | 6,366 | 286,602 |
| LANXESS AG | 19,395 | 655,896 |
| Mercedes-Benz Group AG | 143,466 | 8,304,034 |
| Merck KGaA | 5,133 | 836,499 |
| METRO AG * | 64,522 | 492,199 |
| MTU Aero Engines AG | 3,049 | 545,643 |
| Muenchener Rueckversicherungs-Gesellschaft AG in Muenchen | 14,008 | 3,697,772 |
| ProSiebenSat.1 Media SE | 41,090 | 279,232 |
| Rheinmetall AG | 5,156 | 838,116 |
| RWE AG | 51,284 | 1,974,184 |
| Salzgitter AG | 13,190 | 294,777 |
| SAP SE | 62,120 | 5,979,222 |
| Siemens AG | 65,460 | 7,148,818 |
| Siemens Energy AG | 69,115 | 805,716 |
| Siemens Healthineers AG | 11,289 | 517,178 |
| Symrise AG | 4,842 | 494,235 |
| Telefonica Deutschland Holding AG | 158,886 | 346,197 |
| ThyssenKrupp AG * | 125,063 | 658,323 |
| Uniper SE | 61,792 | 184,971 |
| United Internet AG | 19,325 | 361,244 |
| Volkswagen AG | 8,073 | 1,379,932 |
| Vonovia SE | 38,182 | 844,227 |
| SECURITY | NUMBER OF SHARES | VALUE ($) |
| Zalando SE * | 9,233 | 212,804 |
| 110,231,927 | ||
| Hong Kong 1.6% | ||
| AAC Technologies Holdings, Inc. * | 157,500 | 288,505 |
| AIA Group Ltd. | 504,200 | 3,819,209 |
| BOC Hong Kong Holdings Ltd. | 341,000 | 1,059,591 |
| CK Asset Holdings Ltd. | 249,000 | 1,376,613 |
| CK Hutchison Holdings Ltd. | 655,088 | 3,260,916 |
| CLP Holdings Ltd. | 184,000 | 1,234,972 |
| Galaxy Entertainment Group Ltd. | 128,000 | 584,787 |
| Hang Seng Bank Ltd. | 56,900 | 801,026 |
| Henderson Land Development Co., Ltd. | 107,300 | 262,698 |
| Hong Kong & China Gas Co., Ltd. | 680,676 | 524,644 |
| Hong Kong Exchanges & Clearing Ltd. | 15,406 | 408,931 |
| Hongkong Land Holdings Ltd. | 98,211 | 378,101 |
| Jardine Matheson Holdings Ltd. | 24,946 | 1,149,212 |
| Lenovo Group Ltd. | 1,170,000 | 935,073 |
| Link REIT | 79,600 | 470,485 |
| MTR Corp., Ltd. | 113,643 | 500,051 |
| New World Development Co., Ltd. | 302,422 | 618,596 |
| Noble Group Ltd. *(a) | 18,617,693 | 197,277 |
| PCCW Ltd. | 880,000 | 336,205 |
| Sands China Ltd. * | 278,400 | 486,706 |
| Sun Hung Kai Properties Ltd. | 180,064 | 1,935,025 |
| Swire Pacific Ltd., A Shares | 206,800 | 1,371,810 |
| Techtronic Industries Co., Ltd. | 41,206 | 390,170 |
| The Wharf Holdings Ltd. | 176,000 | 503,975 |
| Want Want China Holdings Ltd. | 461,374 | 303,070 |
| WH Group Ltd. | 2,609,999 | 1,318,078 |
| Wharf Real Estate Investment Co., Ltd. | 126,000 | 496,447 |
| Yue Yuen Industrial Holdings Ltd. | 336,500 | 342,102 |
| 25,354,275 | ||
| Ireland 0.1% | ||
| Bank of Ireland Group plc | 83,620 | 602,116 |
| Kerry Group plc, Class A | 8,183 | 710,733 |
| Kingspan Group plc | 6,153 | 310,214 |
| 1,623,063 | ||
| Israel 0.2% | ||
| Bank Hapoalim B.M. | 69,392 | 668,887 |
| Bank Leumi Le-Israel B.M. | 87,156 | 831,446 |
| ICL Group Ltd. | 47,499 | 428,327 |
| Israel Discount Bank Ltd., A Shares | 68,520 | 389,610 |
| Teva Pharmaceutical Industries Ltd. * | 119,654 | 1,069,816 |
| 3,388,086 | ||
| Italy 2.7% | ||
| A2A S.p.A. | 281,050 | 311,639 |
| Assicurazioni Generali S.p.A. | 173,570 | 2,604,782 |
| Atlantia S.p.A. | 62,642 | 1,397,387 |
| Banco BPM S.p.A. | 195,819 | 592,453 |
| CNH Industrial N.V. | 94,831 | 1,226,836 |
| Enel S.p.A. | 1,379,698 | 6,163,590 |
| Eni S.p.A. | 610,019 | 8,011,818 |
| Ferrari N.V. | 2,646 | 521,628 |
| Hera S.p.A. | 117,994 | 281,142 |
| Intesa Sanpaolo S.p.A. | 2,522,624 | 4,809,452 |
| Leonardo S.p.A. | 97,061 | 779,797 |
| Mediobanca Banca di Credito Finanziario S.p.A. | 58,634 | 531,200 |
| Pirelli & C S.p.A. | 79,826 | 301,108 |
| Poste Italiane S.p.A. | 51,118 | 445,456 |
| SECURITY | NUMBER OF SHARES | VALUE ($) |
| Prysmian S.p.A. | 22,925 | 746,165 |
| Snam S.p.A. | 162,559 | 722,820 |
| Stellantis N.V. | 395,124 | 5,330,842 |
| Telecom Italia S.p.A. * | 7,306,211 | 1,429,400 |
| Tenaris S.A. | 45,588 | 713,504 |
| Terna - Rete Elettrica Nazionale | 85,938 | 569,912 |
| UniCredit S.p.A. | 356,136 | 4,416,537 |
| Unipol Gruppo S.p.A. | 104,971 | 451,778 |
| 42,359,246 | ||
| Japan 25.7% | ||
| Advantest Corp. | 6,700 | 352,699 |
| Aeon Co., Ltd. | 120,000 | 2,238,070 |
| AGC, Inc. | 39,600 | 1,240,864 |
| Air Water, Inc. | 42,400 | 473,388 |
| Aisin Corp. | 63,000 | 1,617,193 |
| Ajinomoto Co., Inc. | 40,500 | 1,113,880 |
| Alfresa Holdings Corp. | 86,700 | 998,166 |
| Alps Alpine Co., Ltd. | 86,400 | 742,225 |
| Amada Co., Ltd. | 61,800 | 434,675 |
| ANA Holdings, Inc. * | 28,800 | 559,835 |
| Asahi Group Holdings Ltd. | 51,200 | 1,432,613 |
| Asahi Kasei Corp. | 291,400 | 1,868,432 |
| Astellas Pharma, Inc. | 163,800 | 2,260,142 |
| Bandai Namco Holdings, Inc. | 14,800 | 978,322 |
| Bic Camera, Inc. | 46,100 | 358,413 |
| Bridgestone Corp. | 110,676 | 4,002,758 |
| Brother Industries Ltd. | 50,300 | 856,906 |
| Canon, Inc. | 182,500 | 3,868,540 |
| Casio Computer Co., Ltd. | 34,800 | 302,473 |
| Central Japan Railway Co. | 26,700 | 3,091,231 |
| Chubu Electric Power Co., Inc. | 274,185 | 2,231,844 |
| Chugai Pharmaceutical Co., Ltd. | 21,700 | 502,829 |
| Coca-Cola Bottlers Japan Holdings, Inc. | 51,400 | 464,396 |
| COMSYS Holdings Corp. | 23,200 | 380,083 |
| Concordia Financial Group Ltd. | 126,400 | 385,674 |
| Cosmo Energy Holdings Co., Ltd. | 34,000 | 875,818 |
| Dai Nippon Printing Co., Ltd. | 58,700 | 1,175,804 |
| Daicel Corp. | 83,400 | 475,865 |
| Daido Steel Co., Ltd. | 14,200 | 368,164 |
| Daifuku Co., Ltd. | 6,190 | 283,347 |
| Dai-ichi Life Holdings, Inc. | 133,100 | 2,113,993 |
| Daiichi Sankyo Co., Ltd. | 70,260 | 2,249,076 |
| Daikin Industries Ltd. | 16,800 | 2,516,425 |
| Daito Trust Construction Co., Ltd. | 13,700 | 1,356,626 |
| Daiwa House Industry Co., Ltd. | 151,881 | 3,059,997 |
| Daiwa Securities Group, Inc. | 156,200 | 609,441 |
| Daiwabo Holdings Co., Ltd. | 29,670 | 382,842 |
| Denka Co., Ltd. | 19,400 | 449,421 |
| Denso Corp. | 62,100 | 3,081,148 |
| Dentsu Group, Inc. | 21,101 | 656,312 |
| DIC Corp. | 32,300 | 542,329 |
| Dowa Holdings Co., Ltd. | 10,370 | 329,269 |
| East Japan Railway Co. | 70,218 | 3,741,592 |
| Ebara Corp. | 11,600 | 376,909 |
| EDION Corp. | 49,600 | 393,685 |
| Eisai Co., Ltd. | 23,700 | 1,429,185 |
| Electric Power Development Co., Ltd. | 65,300 | 908,172 |
| ENEOS Holdings, Inc. | 1,436,950 | 4,740,003 |
| Exeo Group, Inc. | 23,801 | 348,722 |
| FANUC Corp. | 11,200 | 1,465,538 |
| Fast Retailing Co., Ltd. | 2,200 | 1,225,711 |
| Fuji Electric Co., Ltd. | 15,100 | 583,841 |
| FUJIFILM Holdings Corp. | 40,400 | 1,848,295 |
| Fujikura Ltd. | 78,300 | 463,613 |
| Fujitsu Ltd. | 25,600 | 2,945,498 |
| Furukawa Electric Co., Ltd. | 31,000 | 478,263 |
| SECURITY | NUMBER OF SHARES | VALUE ($) |
| GS Yuasa Corp. | 21,019 | 319,995 |
| H2O Retailing Corp. | 62,900 | 529,330 |
| Hakuhodo DY Holdings, Inc. | 54,100 | 455,833 |
| Hankyu Hanshin Holdings, Inc. | 29,600 | 879,142 |
| Hanwa Co., Ltd. | 23,800 | 575,578 |
| Haseko Corp. | 74,500 | 767,217 |
| Hino Motors Ltd. * | 119,865 | 498,132 |
| Hitachi Construction Machinery Co., Ltd. | 20,350 | 398,128 |
| Hitachi Ltd. | 141,100 | 6,402,244 |
| Hitachi Metals Ltd. * | 6,300 | 92,006 |
| Hokkaido Electric Power Co., Inc. | 126,600 | 385,240 |
| Hokuriku Electric Power Co. * | 89,402 | 299,332 |
| Honda Motor Co., Ltd. | 539,900 | 12,311,055 |
| Hoya Corp. | 11,350 | 1,055,111 |
| Idemitsu Kosan Co., Ltd. | 81,969 | 1,793,501 |
| IHI Corp. | 29,300 | 653,507 |
| Iida Group Holdings Co., Ltd. | 43,600 | 605,402 |
| Inpex Corp. | 168,500 | 1,700,569 |
| Isetan Mitsukoshi Holdings Ltd. | 110,000 | 977,035 |
| Isuzu Motors Ltd. | 116,000 | 1,364,120 |
| ITOCHU Corp. | 178,800 | 4,621,003 |
| Itoham Yonekyu Holdings, Inc. | 70,861 | 316,877 |
| Iwatani Corp. | 11,551 | 425,324 |
| J. Front Retailing Co., Ltd. | 54,500 | 440,525 |
| Japan Airlines Co., Ltd. * | 32,600 | 608,907 |
| Japan Exchange Group, Inc. | 25,200 | 331,173 |
| Japan Post Holdings Co., Ltd. | 452,500 | 3,042,871 |
| Japan Post Insurance Co., Ltd. | 41,500 | 614,331 |
| Japan Tobacco, Inc. | 181,200 | 3,034,634 |
| JFE Holdings, Inc. | 200,300 | 1,834,972 |
| JGC Holdings Corp. | 50,100 | 602,581 |
| JSR Corp. | 17,500 | 332,518 |
| JTEKT Corp. | 105,100 | 741,988 |
| Kajima Corp. | 133,600 | 1,257,601 |
| Kaneka Corp. | 21,600 | 535,621 |
| Kanematsu Corp. | 33,567 | 332,121 |
| Kao Corp. | 52,047 | 1,944,056 |
| Kawasaki Heavy Industries Ltd. | 46,200 | 785,742 |
| KDDI Corp. | 245,900 | 7,268,059 |
| Keio Corp. | 11,600 | 406,702 |
| Kewpie Corp. | 25,300 | 399,419 |
| Keyence Corp. | 2,992 | 1,128,179 |
| Kikkoman Corp. | 9,200 | 498,548 |
| Kinden Corp. | 34,800 | 354,102 |
| Kintetsu Group Holdings Co., Ltd. | 21,700 | 733,349 |
| Kirin Holdings Co., Ltd. | 121,700 | 1,788,982 |
| Kobe Steel Ltd. | 212,100 | 869,799 |
| Koito Manufacturing Co., Ltd. | 42,300 | 600,526 |
| Komatsu Ltd. | 145,100 | 2,842,536 |
| Konica Minolta, Inc. | 248,900 | 758,387 |
| K's Holdings Corp. | 57,800 | 452,945 |
| Kubota Corp. | 117,000 | 1,632,102 |
| Kuraray Co., Ltd. | 105,300 | 724,099 |
| Kurita Water Industries Ltd. | 9,653 | 353,348 |
| Kyocera Corp. | 38,700 | 1,874,103 |
| Kyushu Electric Power Co., Inc. | 220,200 | 1,090,226 |
| Kyushu Railway Co. | 27,400 | 573,036 |
| Lion Corp. | 32,421 | 327,669 |
| Lixil Corp. | 47,500 | 717,501 |
| Makita Corp. | 28,990 | 529,749 |
| Marubeni Corp. | 289,600 | 2,535,133 |
| MatsukiyoCocokara & Co. | 17,300 | 629,870 |
| Mazda Motor Corp. | 285,700 | 1,923,607 |
| Medipal Holdings Corp. | 65,172 | 808,006 |
| MEIJI Holdings Co., Ltd. | 26,700 | 1,098,681 |
| MINEBEA MITSUMI, Inc. | 47,500 | 701,975 |
| MISUMI Group, Inc. | 17,500 | 372,740 |
| Mitsubishi Chemical Group Corp. | 389,500 | 1,759,508 |
| SECURITY | NUMBER OF SHARES | VALUE ($) |
| Mitsubishi Corp. | 206,700 | 5,599,271 |
| Mitsubishi Electric Corp. | 451,700 | 3,974,331 |
| Mitsubishi Estate Co., Ltd. | 115,800 | 1,456,219 |
| Mitsubishi Gas Chemical Co., Inc. | 43,687 | 555,140 |
| Mitsubishi Heavy Industries Ltd. | 81,500 | 2,807,191 |
| Mitsubishi Materials Corp. | 61,400 | 802,527 |
| Mitsubishi Motors Corp. * | 201,000 | 677,116 |
| Mitsubishi Shokuhin Co., Ltd. | 12,214 | 247,227 |
| Mitsubishi UFJ Financial Group, Inc. | 1,465,134 | 6,921,072 |
| Mitsui & Co., Ltd. | 223,500 | 4,945,870 |
| Mitsui Chemicals, Inc. | 46,100 | 853,261 |
| Mitsui Fudosan Co., Ltd. | 102,000 | 1,953,133 |
| Mitsui Mining & Smelting Co., Ltd. | 17,000 | 343,359 |
| Mitsui O.S.K. Lines Ltd. | 35,100 | 694,811 |
| Mizuho Financial Group, Inc. | 369,321 | 3,994,377 |
| Morinaga Milk Industry Co., Ltd. | 10,134 | 287,505 |
| MS&AD Insurance Group Holdings, Inc. | 68,690 | 1,818,994 |
| Murata Manufacturing Co., Ltd. | 41,900 | 1,983,522 |
| Nagase & Co., Ltd. | 43,100 | 587,208 |
| Nagoya Railroad Co., Ltd. | 36,100 | 553,016 |
| NEC Corp. | 50,800 | 1,681,525 |
| NGK Insulators Ltd. | 43,200 | 503,974 |
| NGK Spark Plug Co., Ltd. | 37,000 | 675,030 |
| NH Foods Ltd. | 36,100 | 860,316 |
| NHK Spring Co., Ltd. | 61,800 | 342,378 |
| Nichirei Corp. | 23,900 | 371,703 |
| Nidec Corp. | 19,800 | 1,088,683 |
| Nikon Corp. | 63,700 | 616,051 |
| Nintendo Co., Ltd. | 51,500 | 2,090,853 |
| Nippon Electric Glass Co., Ltd. | 18,900 | 327,265 |
| Nippon Light Metal Holdings Co., Ltd. | 31,020 | 302,306 |
| Nippon Paper Industries Co., Ltd. | 71,100 | 413,919 |
| Nippon Steel Corp. | 237,700 | 3,260,892 |
| Nippon Steel Trading Corp. | 11,800 | 406,003 |
| Nippon Suisan Kaisha Ltd. | 87,957 | 313,318 |
| Nippon Telegraph & Telephone Corp. | 234,237 | 6,460,419 |
| Nippon Yusen K.K. | 43,300 | 784,356 |
| Nissan Chemical Corp. | 7,864 | 354,001 |
| Nissan Motor Co., Ltd. | 920,100 | 2,932,638 |
| Nisshin Seifun Group, Inc. | 52,330 | 565,458 |
| Nissin Foods Holdings Co., Ltd. | 5,800 | 375,427 |
| Nitori Holdings Co., Ltd. | 6,300 | 570,887 |
| Nitto Denko Corp. | 21,200 | 1,116,937 |
| NOK Corp. | 58,300 | 476,905 |
| Nomura Holdings, Inc. | 397,200 | 1,285,323 |
| Nomura Real Estate Holdings, Inc. | 19,300 | 436,253 |
| NSK Ltd. | 152,900 | 808,111 |
| NTT Data Corp. | 61,100 | 884,963 |
| Obayashi Corp. | 221,402 | 1,421,105 |
| Odakyu Electric Railway Co., Ltd. | 29,200 | 347,128 |
| Oji Holdings Corp. | 275,100 | 953,696 |
| Olympus Corp. | 40,300 | 849,705 |
| Omron Corp. | 17,683 | 824,706 |
| Ono Pharmaceutical Co., Ltd. | 25,700 | 604,812 |
| Oriental Land Co., Ltd. | 3,600 | 482,139 |
| ORIX Corp. | 132,300 | 1,943,181 |
| Osaka Gas Co., Ltd. | 91,100 | 1,348,981 |
| Otsuka Corp. | 14,400 | 453,487 |
| Otsuka Holdings Co., Ltd. | 51,400 | 1,647,601 |
| PALTAC Corp. | 11,700 | 332,348 |
| Pan Pacific International Holdings Corp. | 29,000 | 475,911 |
| Panasonic Holdings Corp. | 572,350 | 4,076,626 |
| Penta-Ocean Construction Co., Ltd. | 76,414 | 380,022 |
| Persol Holdings Co., Ltd. | 23,400 | 468,523 |
| Recruit Holdings Co., Ltd. | 59,300 | 1,824,730 |
| Renesas Electronics Corp. * | 44,500 | 372,276 |
| Rengo Co., Ltd. | 68,517 | 380,654 |
| Resona Holdings, Inc. | 271,058 | 1,021,604 |
| SECURITY | NUMBER OF SHARES | VALUE ($) |
| Ricoh Co., Ltd. | 163,200 | 1,195,895 |
| Rinnai Corp. | 4,620 | 314,462 |
| Rohm Co., Ltd. | 8,400 | 590,222 |
| Ryohin Keikaku Co., Ltd. | 40,200 | 378,283 |
| Sankyu, Inc. | 13,700 | 408,489 |
| Santen Pharmaceutical Co., Ltd. | 44,400 | 303,829 |
| Sanwa Holdings Corp. | 37,430 | 322,426 |
| SBI Holdings, Inc. | 24,000 | 433,537 |
| Secom Co., Ltd. | 21,400 | 1,219,168 |
| Sega Sammy Holdings, Inc. | 21,747 | 278,173 |
| Seiko Epson Corp. | 53,600 | 727,682 |
| Seino Holdings Co., Ltd. | 59,300 | 455,650 |
| Sekisui Chemical Co., Ltd. | 72,300 | 902,884 |
| Sekisui House Ltd. | 118,783 | 1,972,130 |
| Seven & i Holdings Co., Ltd. | 116,900 | 4,363,685 |
| SG Holdings Co., Ltd. | 41,400 | 548,595 |
| Shikoku Electric Power Co., Inc. | 66,300 | 318,959 |
| Shimadzu Corp. | 16,100 | 424,120 |
| Shimamura Co., Ltd. | 6,000 | 485,204 |
| Shimano, Inc. | 3,600 | 557,075 |
| Shimizu Corp. | 184,200 | 919,156 |
| Shin-Etsu Chemical Co., Ltd. | 25,900 | 2,691,785 |
| Shionogi & Co., Ltd. | 17,400 | 808,008 |
| Shiseido Co., Ltd. | 22,800 | 787,448 |
| Showa Denko K.K. | 47,300 | 690,511 |
| SMC Corp. | 2,500 | 1,003,505 |
| Softbank Corp. | 404,800 | 3,993,104 |
| SoftBank Group Corp. | 274,400 | 11,778,951 |
| Sohgo Security Services Co., Ltd. | 11,701 | 291,675 |
| Sojitz Corp. | 62,460 | 920,783 |
| Sompo Holdings, Inc. | 44,000 | 1,834,461 |
| Sony Group Corp. | 67,707 | 4,565,797 |
| Stanley Electric Co., Ltd. | 28,775 | 489,189 |
| Subaru Corp. | 203,900 | 3,187,124 |
| SUMCO Corp. | 27,500 | 348,558 |
| Sumitomo Chemical Co., Ltd. | 407,100 | 1,370,811 |
| Sumitomo Corp. | 228,400 | 2,903,824 |
| Sumitomo Electric Industries Ltd. | 265,600 | 2,775,604 |
| Sumitomo Forestry Co., Ltd. | 31,600 | 494,337 |
| Sumitomo Heavy Industries Ltd. | 37,000 | 701,325 |
| Sumitomo Metal Mining Co., Ltd. | 27,800 | 779,257 |
| Sumitomo Mitsui Financial Group, Inc. | 189,710 | 5,327,352 |
| Sumitomo Mitsui Trust Holdings, Inc. | 43,800 | 1,260,083 |
| Sumitomo Realty & Development Co., Ltd. | 40,100 | 919,650 |
| Sumitomo Rubber Industries Ltd. | 76,000 | 651,996 |
| Sundrug Co., Ltd. | 17,462 | 406,043 |
| Suntory Beverage & Food Ltd. | 17,500 | 585,492 |
| Suzuken Co., Ltd. | 35,630 | 793,257 |
| Suzuki Motor Corp. | 98,800 | 3,340,409 |
| Sysmex Corp. | 8,000 | 430,591 |
| T&D Holdings, Inc. | 63,850 | 631,489 |
| Taiheiyo Cement Corp. | 57,542 | 781,944 |
| Taisei Corp. | 45,300 | 1,234,000 |
| Taiyo Yuden Co., Ltd. | 10,300 | 280,278 |
| Takashimaya Co., Ltd. | 52,500 | 649,446 |
| Takeda Pharmaceutical Co., Ltd. | 161,021 | 4,252,403 |
| TDK Corp. | 44,600 | 1,393,231 |
| Teijin Ltd. | 80,700 | 732,675 |
| Terumo Corp. | 29,700 | 901,365 |
| The Chugoku Electric Power Co., Inc. | 110,900 | 520,296 |
| The Kansai Electric Power Co., Inc. | 257,800 | 1,952,903 |
| The Yokohama Rubber Co., Ltd. | 31,400 | 491,005 |
| TIS, Inc. | 21,500 | 579,677 |
| Tobu Railway Co., Ltd. | 27,100 | 626,890 |
| Toho Gas Co., Ltd. | 20,300 | 378,225 |
| Toho Holdings Co., Ltd. | 32,200 | 437,902 |
| Tohoku Electric Power Co., Inc. | 313,200 | 1,315,567 |
| SECURITY | NUMBER OF SHARES | VALUE ($) |
| Tokio Marine Holdings, Inc. | 189,200 | 3,425,496 |
| Tokuyama Corp. | 26,575 | 309,875 |
| Tokyo Electric Power Co. Holdings, Inc. * | 1,230,200 | 4,007,456 |
| Tokyo Electron Ltd. | 6,000 | 1,578,579 |
| Tokyo Gas Co., Ltd. | 112,100 | 2,003,394 |
| Tokyu Corp. | 67,300 | 776,003 |
| Tokyu Fudosan Holdings Corp. | 113,500 | 575,850 |
| Toppan, Inc. | 78,900 | 1,176,728 |
| Toray Industries, Inc. | 383,200 | 1,861,336 |
| Toshiba Corp. | 56,100 | 1,946,756 |
| Tosoh Corp. | 80,000 | 870,358 |
| TOTO Ltd. | 17,800 | 507,703 |
| Toyo Seikan Group Holdings Ltd. | 58,500 | 669,090 |
| Toyo Suisan Kaisha Ltd. | 13,247 | 496,990 |
| Toyoda Gosei Co., Ltd. | 26,200 | 418,852 |
| Toyota Industries Corp. | 19,900 | 1,025,153 |
| Toyota Motor Corp. | 1,589,690 | 22,056,312 |
| Toyota Tsusho Corp. | 59,100 | 1,983,744 |
| TS Tech Co., Ltd. | 41,000 | 428,766 |
| Tsuruha Holdings, Inc. | 8,700 | 505,432 |
| UBE Corp. | 41,900 | 540,418 |
| Unicharm Corp. | 18,400 | 559,202 |
| West Japan Railway Co. | 42,163 | 1,671,618 |
| Yakult Honsha Co., Ltd. | 9,000 | 498,590 |
| Yamada Holdings Co., Ltd. | 335,900 | 1,082,442 |
| Yamaha Corp. | 13,600 | 513,458 |
| Yamaha Motor Co., Ltd. | 71,700 | 1,480,071 |
| Yamato Holdings Co., Ltd. | 78,100 | 1,156,604 |
| Yamazaki Baking Co., Ltd. | 44,000 | 448,330 |
| Yaskawa Electric Corp. | 15,600 | 431,953 |
| Yokogawa Electric Corp. | 30,400 | 508,322 |
| Z Holdings Corp. | 138,600 | 357,693 |
| 401,701,466 | ||
| Netherlands 2.5% | ||
| Aalberts N.V. | 9,288 | 322,216 |
| ABN AMRO Bank N.V., GDR | 98,760 | 970,873 |
| Aegon N.V. | 320,382 | 1,483,099 |
| Akzo Nobel N.V. | 32,286 | 1,993,190 |
| APERAM S.A. | 10,414 | 271,924 |
| ArcelorMittal S.A. | 167,246 | 3,738,558 |
| ASML Holding N.V. | 5,403 | 2,534,475 |
| ASR Nederland N.V. | 20,515 | 903,334 |
| EXOR N.V. * | 50,280 | 3,378,865 |
| Heineken Holding N.V. | 14,114 | 963,057 |
| Heineken N.V. | 17,022 | 1,421,919 |
| ING Groep N.V. | 507,582 | 4,994,396 |
| Koninklijke Ahold Delhaize N.V. | 231,617 | 6,459,396 |
| Koninklijke DSM N.V. | 10,949 | 1,287,935 |
| Koninklijke KPN N.V. | 405,589 | 1,134,475 |
| Koninklijke Philips N.V. | 125,475 | 1,591,635 |
| NN Group N.V. | 47,187 | 1,998,013 |
| Randstad N.V. | 27,148 | 1,353,034 |
| SBM Offshore N.V. | 28,131 | 380,709 |
| Signify N.V. | 24,208 | 670,687 |
| SNS Reaal N.V. *(a) | 124,822 | 0 |
| Unibail-Rodamco-Westfield * | 16,020 | 757,098 |
| Wolters Kluwer N.V. | 9,910 | 1,053,022 |
| 39,661,910 | ||
| New Zealand 0.1% | ||
| Fletcher Building Ltd. | 160,593 | 479,520 |
| Spark New Zealand Ltd. | 205,138 | 610,647 |
| 1,090,167 | ||
| SECURITY | NUMBER OF SHARES | VALUE ($) |
| Norway 0.7% | ||
| DNB Bank A.S.A. | 88,111 | 1,558,409 |
| Equinor A.S.A. | 116,327 | 4,238,225 |
| Mowi A.S.A. | 41,249 | 615,673 |
| Norsk Hydro A.S.A. | 169,309 | 1,074,489 |
| Orkla A.S.A. | 84,860 | 572,394 |
| Subsea 7 S.A. | 70,225 | 700,627 |
| Telenor A.S.A. | 119,388 | 1,084,982 |
| Yara International A.S.A. | 27,070 | 1,208,173 |
| 11,052,972 | ||
| Poland 0.3% | ||
| Bank Polska Kasa Opieki S.A. | 18,815 | 308,368 |
| KGHM Polska Miedz S.A. | 20,878 | 417,403 |
| PGE Polska Grupa Energetyczna S.A. * | 254,173 | 289,693 |
| Polski Koncern Naftowy Orlen S.A. | 181,496 | 2,084,214 |
| Polskie Gornictwo Naftowe i Gazownictwo S.A. *(a) | 444,720 | 470,667 |
| Powszechna Kasa Oszczednosci Bank Polski S.A. | 68,493 | 373,244 |
| Powszechny Zaklad Ubezpieczen S.A. | 106,729 | 597,929 |
| 4,541,518 | ||
| Portugal 0.2% | ||
| EDP - Energias de Portugal S.A. | 401,268 | 1,753,266 |
| Galp Energia, SGPS, S.A. | 113,252 | 1,149,859 |
| Jeronimo Martins, SGPS, S.A. | 26,788 | 554,324 |
| 3,457,449 | ||
| Republic of Korea 5.3% | ||
| Amorepacific Corp. | 3,409 | 221,334 |
| BNK Financial Group, Inc. | 83,736 | 376,301 |
| CJ CheilJedang Corp. | 1,959 | 568,779 |
| CJ Corp. | 9,643 | 485,324 |
| Coway Co., Ltd. | 7,606 | 294,929 |
| DB Insurance Co., Ltd. | 13,499 | 532,751 |
| Doosan Enerbility Co., Ltd. * | 23,984 | 222,533 |
| E-MART, Inc. | 10,334 | 612,627 |
| GS Engineering & Construction Corp. | 17,934 | 272,503 |
| GS Holdings Corp. | 27,472 | 886,124 |
| Hana Financial Group, Inc. | 53,150 | 1,536,639 |
| Hankook Tire & Technology Co., Ltd. | 22,603 | 578,959 |
| Hanwha Corp. | 29,496 | 524,827 |
| Hanwha Solutions Corp. * | 15,200 | 502,339 |
| HD Hyundai Co., Ltd. | 21,971 | 937,926 |
| Hyundai Engineering & Construction Co., Ltd. | 23,328 | 570,308 |
| Hyundai Glovis Co., Ltd. | 5,105 | 622,234 |
| Hyundai Marine & Fire Insurance Co., Ltd. | 23,301 | 544,151 |
| Hyundai Mobis Co., Ltd. | 18,710 | 2,869,727 |
| Hyundai Motor Co. | 30,610 | 3,527,449 |
| Hyundai Steel Co. | 40,548 | 797,896 |
| Industrial Bank of Korea | 61,829 | 453,121 |
| KB Financial Group, Inc. | 51,732 | 1,740,733 |
| Kia Corp. | 53,417 | 2,482,330 |
| Korea Electric Power Corp. * | 183,744 | 2,154,673 |
| Korea Gas Corp. | 13,992 | 341,462 |
| Korea Shipbuilding & Offshore Engineering Co., Ltd. * | 9,304 | 473,959 |
| Korea Zinc Co., Ltd. | 1,545 | 692,859 |
| Korean Air Lines Co., Ltd. * | 23,181 | 375,394 |
| KT&G Corp. | 16,933 | 1,137,246 |
| LG Chem Ltd. | 3,954 | 1,735,168 |
| SECURITY | NUMBER OF SHARES | VALUE ($) |
| LG Corp. | 9,814 | 544,805 |
| LG Display Co., Ltd. | 110,490 | 986,045 |
| LG Electronics, Inc. | 29,068 | 1,660,371 |
| LG H&H Co., Ltd. | 933 | 333,343 |
| LG Innotek Co., Ltd. | 1,540 | 319,495 |
| LG Uplus Corp. | 80,423 | 645,819 |
| Lotte Chemical Corp. | 6,236 | 646,164 |
| Lotte Shopping Co., Ltd. | 7,352 | 450,135 |
| NAVER Corp. | 2,692 | 319,320 |
| NCSoft Corp. | 960 | 262,252 |
| POSCO Holdings, Inc. | 26,328 | 4,588,726 |
| Posco International Corp. | 29,037 | 420,118 |
| Samsung C&T Corp. | 13,295 | 1,103,639 |
| Samsung Electro-Mechanics Co., Ltd. | 6,794 | 575,394 |
| Samsung Electronics Co., Ltd. | 649,508 | 27,032,408 |
| Samsung Fire & Marine Insurance Co., Ltd. | 7,480 | 1,049,065 |
| Samsung Life Insurance Co., Ltd. | 13,865 | 655,229 |
| Samsung SDI Co., Ltd. | 1,665 | 858,998 |
| Samsung SDS Co., Ltd. | 5,153 | 451,449 |
| Shinhan Financial Group Co., Ltd. | 82,513 | 2,097,196 |
| SK Hynix, Inc. | 67,816 | 3,925,971 |
| SK Innovation Co., Ltd. * | 14,168 | 1,715,578 |
| SK Telecom Co., Ltd. | 12,311 | 432,630 |
| SK, Inc. | 13,873 | 2,078,851 |
| S-Oil Corp. | 8,170 | 495,384 |
| Woori Financial Group, Inc. | 98,489 | 812,731 |
| 83,533,721 | ||
| Singapore 0.8% | ||
| ComfortDelGro Corp., Ltd. | 477,600 | 428,738 |
| DBS Group Holdings Ltd. | 112,544 | 2,720,898 |
| Golden Agri-Resources Ltd. | 2,044,646 | 419,272 |
| Jardine Cycle & Carriage Ltd. | 24,500 | 514,590 |
| Keppel Corp., Ltd. | 141,400 | 695,973 |
| Oversea-Chinese Banking Corp., Ltd. | 260,744 | 2,238,248 |
| Singapore Airlines Ltd. * | 138,370 | 513,257 |
| Singapore Telecommunications Ltd. | 937,486 | 1,650,673 |
| United Overseas Bank Ltd. | 92,152 | 1,807,910 |
| Venture Corp., Ltd. | 34,300 | 385,990 |
| Wilmar International Ltd. | 407,966 | 1,117,644 |
| 12,493,193 | ||
| Spain 3.0% | ||
| Acciona S.A. | 2,350 | 423,145 |
| Acerinox S.A. | 37,601 | 329,537 |
| ACS, Actividades de Construccion y Servicios S.A. | 60,526 | 1,553,173 |
| Aena SME S.A. * | 4,832 | 567,912 |
| Amadeus IT Group S.A. * | 18,844 | 982,814 |
| Banco Bilbao Vizcaya Argentaria S.A. | 1,277,204 | 6,588,825 |
| Banco De Sabadell S.A. | 1,626,639 | 1,279,846 |
| Banco Santander S.A. (b) | 4,374,694 | 11,345,662 |
| CaixaBank S.A. | 332,301 | 1,101,924 |
| Enagas S.A. | 25,413 | 412,552 |
| Endesa S.A. | 50,954 | 851,341 |
| Ferrovial S.A. | 23,130 | 565,259 |
| Grifols S.A. * | 28,933 | 246,150 |
| Iberdrola S.A. | 642,768 | 6,536,483 |
| Industria de Diseno Textil S.A. | 82,242 | 1,866,745 |
| Mapfre S.A. | 238,108 | 408,401 |
| Naturgy Energy Group S.A. | 40,503 | 1,039,409 |
| Red Electrica Corp. S.A. | 35,873 | 580,271 |
| Repsol S.A. | 352,031 | 4,789,194 |
| SECURITY | NUMBER OF SHARES | VALUE ($) |
| Telefonica S.A. | 1,783,291 | 6,147,348 |
| 47,615,991 | ||
| Sweden 1.9% | ||
| Alfa Laval AB | 18,131 | 446,300 |
| Alleima AB * | 14,611 | 49,783 |
| Assa Abloy AB, B Shares | 51,805 | 1,046,050 |
| Atlas Copco AB, A Shares | 118,335 | 1,263,019 |
| Atlas Copco AB, B Shares | 67,398 | 651,817 |
| Boliden AB | 33,799 | 982,905 |
| Electrolux AB, B Shares | 40,628 | 501,235 |
| Epiroc AB, A Shares | 25,065 | 383,706 |
| Epiroc AB, B Shares | 14,864 | 199,582 |
| Essity AB, B Shares | 56,722 | 1,198,442 |
| H & M Hennes & Mauritz AB, B Shares (b) | 141,217 | 1,422,359 |
| Hexagon AB, B Shares | 58,616 | 579,471 |
| Husqvarna AB, B Shares | 45,744 | 271,589 |
| Industrivarden AB, A Shares | 14,859 | 336,525 |
| Industrivarden AB, C Shares | 9,031 | 202,795 |
| Investor AB, A Shares | 33,145 | 563,623 |
| Investor AB, B Shares | 108,561 | 1,771,782 |
| Orron Energy AB | 93,607 | 194,184 |
| Sandvik AB | 79,658 | 1,244,795 |
| Securitas AB, B Shares (b) | 85,748 | 700,630 |
| Skandinaviska Enskilda Banken AB, A Shares | 106,115 | 1,118,812 |
| Skanska AB, B Shares | 62,516 | 972,208 |
| SKF AB, B Shares | 58,304 | 843,986 |
| SSAB AB, A Shares | 49,048 | 235,924 |
| SSAB AB, B Shares | 135,580 | 629,962 |
| Svenska Cellulosa AB, S.C.A., B Shares | 32,058 | 378,213 |
| Svenska Handelsbanken AB, A Shares | 133,683 | 1,242,053 |
| Swedbank AB, A Shares | 119,273 | 1,778,128 |
| Swedish Match AB | 72,658 | 747,279 |
| Tele2 AB, B Shares | 44,365 | 363,616 |
| Telefonaktiebolaget LM Ericsson, B Shares | 216,266 | 1,202,297 |
| Telia Co. AB | 456,224 | 1,208,886 |
| Trelleborg AB, B Shares | 23,916 | 526,608 |
| Volvo AB, A Shares | 28,392 | 484,982 |
| Volvo AB, B Shares | 204,074 | 3,340,064 |
| 29,083,610 | ||
| Switzerland 5.0% | ||
| ABB Ltd. | 107,513 | 2,985,668 |
| Accelleron Industries AG * | 5,198 | 88,143 |
| Adecco Group AG | 50,595 | 1,583,419 |
| Alcon, Inc. | 16,763 | 1,020,621 |
| Baloise Holding AG | 3,913 | 534,602 |
| Barry Callebaut AG | 200 | 378,382 |
| Chocoladefabriken Lindt & Spruengli AG | 4 | 388,755 |
| Chocoladefabriken Lindt & Spruengli AG, Participation Certificates | 37 | 355,090 |
| Cie Financiere Richemont S.A., Class A | 23,416 | 2,288,528 |
| Clariant AG * | 21,204 | 340,765 |
| Credit Suisse Group AG (b) | 286,478 | 1,186,724 |
| DKSH Holding AG | 5,706 | 411,634 |
| Dufry AG * | 10,341 | 341,124 |
| Geberit AG | 1,550 | 689,033 |
| Georg Fischer AG | 7,869 | 435,823 |
| Givaudan S.A. | 304 | 908,030 |
| Holcim AG * | 85,362 | 3,878,193 |
| Julius Baer Group Ltd. | 12,835 | 615,809 |
| Kuehne & Nagel International AG | 2,856 | 607,946 |
| Logitech International S.A. | 7,305 | 363,292 |
| SECURITY | NUMBER OF SHARES | VALUE ($) |
| Lonza Group AG | 1,547 | 796,371 |
| Nestle S.A. | 146,998 | 16,002,026 |
| Novartis AG | 120,837 | 9,774,591 |
| Partners Group Holding AG | 503 | 451,484 |
| Roche Holding AG | 39,559 | 13,125,602 |
| Roche Holding AG, Bearer Shares | 1,405 | 570,276 |
| Schindler Holding AG | 1,144 | 180,089 |
| Schindler Holding AG, Participation Certificates | 2,793 | 455,443 |
| SGS S.A. | 343 | 756,147 |
| SIG Group AG * | 17,348 | 333,482 |
| Sika AG | 3,600 | 811,713 |
| Sonova Holding AG | 1,461 | 345,327 |
| Swiss Life Holding AG | 2,522 | 1,221,208 |
| Swiss Prime Site AG | 5,051 | 407,580 |
| Swiss Re AG | 31,218 | 2,319,022 |
| Swisscom AG | 2,815 | 1,390,016 |
| The Swatch Group AG | 6,581 | 274,946 |
| The Swatch Group AG, Bearer Shares | 3,725 | 837,042 |
| UBS Group AG | 256,306 | 4,063,514 |
| Zurich Insurance Group AG | 12,188 | 5,194,207 |
| 78,711,667 | ||
| United Kingdom 16.2% | ||
| 3i Group plc | 54,819 | 730,099 |
| abrdn plc | 606,001 | 1,104,243 |
| Admiral Group plc | 13,746 | 317,885 |
| Anglo American plc | 116,833 | 3,499,639 |
| Antofagasta plc | 30,178 | 406,661 |
| Ashtead Group plc | 23,746 | 1,237,001 |
| Associated British Foods plc | 62,609 | 970,394 |
| AstraZeneca plc | 52,324 | 6,139,286 |
| Aviva plc | 438,924 | 2,105,353 |
| B&M European Value Retail S.A. | 74,212 | 274,257 |
| BAE Systems plc | 293,780 | 2,747,890 |
| Balfour Beatty plc | 146,885 | 502,985 |
| Barclays plc | 2,156,742 | 3,664,848 |
| Barratt Developments plc | 195,650 | 843,855 |
| Bellway plc | 25,891 | 550,628 |
| Berkeley Group Holdings plc | 16,585 | 659,873 |
| BP plc | 4,683,633 | 25,912,674 |
| British American Tobacco plc | 256,424 | 10,127,068 |
| BT Group plc | 2,034,669 | 3,032,126 |
| Bunzl plc | 26,353 | 858,725 |
| Burberry Group plc | 34,840 | 725,964 |
| Centrica plc | 1,914,835 | 1,682,587 |
| Coca-Cola HBC AG * | 19,983 | 436,495 |
| Compass Group plc | 143,076 | 3,013,440 |
| CRH plc | 92,544 | 3,324,426 |
| Croda International plc | 4,690 | 363,332 |
| Currys plc | 790,522 | 590,423 |
| DCC plc | 17,884 | 992,577 |
| Diageo plc | 84,727 | 3,486,725 |
| Direct Line Insurance Group plc | 297,033 | 686,276 |
| Drax Group plc | 47,969 | 286,452 |
| DS Smith plc | 219,170 | 730,915 |
| Entain plc | 22,328 | 323,009 |
| Experian plc | 31,330 | 998,965 |
| Ferguson plc | 17,554 | 1,914,416 |
| FirstGroup plc | 384,108 | 461,152 |
| Flutter Entertainment plc * | 3,857 | 511,211 |
| Glencore plc | 2,550,160 | 14,620,242 |
| GSK plc | 346,545 | 5,676,788 |
| Haleon plc * | 433,430 | 1,329,092 |
| Hays plc | 359,578 | 453,359 |
| HSBC Holdings plc | 2,204,250 | 11,312,320 |
| IMI plc | 20,863 | 293,894 |
| SECURITY | NUMBER OF SHARES | VALUE ($) |
| Imperial Brands plc | 173,928 | 4,236,724 |
| Inchcape plc | 81,523 | 695,464 |
| Informa plc | 85,045 | 541,900 |
| InterContinental Hotels Group plc | 7,285 | 391,428 |
| International Consolidated Airlines Group S.A. *(b) | 307,667 | 428,007 |
| International Distributions Services plc | 337,700 | 781,228 |
| Intertek Group plc | 10,564 | 442,557 |
| ITV plc | 681,376 | 524,630 |
| J Sainsbury plc | 565,733 | 1,261,071 |
| John Wood Group plc * | 257,096 | 413,377 |
| Johnson Matthey plc | 52,238 | 1,159,558 |
| Kingfisher plc | 556,621 | 1,398,473 |
| Land Securities Group plc | 45,354 | 296,565 |
| Legal & General Group plc | 607,693 | 1,625,737 |
| Lloyds Banking Group plc | 10,554,477 | 5,068,967 |
| London Stock Exchange Group plc | 5,486 | 475,537 |
| M&G plc | 929,878 | 1,868,705 |
| Marks & Spencer Group plc * | 631,823 | 765,185 |
| Melrose Industries plc | 391,596 | 525,280 |
| Micro Focus International plc | 109,846 | 654,970 |
| Mondi plc | 77,334 | 1,297,546 |
| National Grid plc | 366,541 | 3,993,507 |
| NatWest Group plc | 327,034 | 880,801 |
| Next plc | 9,271 | 523,623 |
| Pearson plc | 88,831 | 981,859 |
| Pennon Group plc | 30,651 | 294,547 |
| Persimmon plc | 60,910 | 911,449 |
| Phoenix Group Holdings plc | 52,803 | 328,644 |
| Prudential plc | 172,644 | 1,603,804 |
| Reckitt Benckiser Group plc | 32,993 | 2,189,546 |
| RELX plc | 74,334 | 1,996,647 |
| Rentokil Initial plc | 99,187 | 618,937 |
| Rio Tinto plc | 148,892 | 7,781,337 |
| Severn Trent plc | 18,535 | 531,949 |
| Shell plc | 1,821,714 | 50,464,364 |
| Smith & Nephew plc | 73,856 | 872,749 |
| Smiths Group plc | 35,846 | 642,093 |
| Smurfit Kappa Group plc | 29,973 | 988,596 |
| Spectris plc | 10,981 | 380,590 |
| SSE plc | 134,092 | 2,396,342 |
| St. James's Place plc | 24,441 | 298,462 |
| Standard Chartered plc | 276,500 | 1,652,014 |
| Tate & Lyle plc | 57,125 | 459,010 |
| Taylor Wimpey plc | 743,729 | 799,604 |
| Tesco plc | 1,540,257 | 3,804,251 |
| The Sage Group plc | 61,516 | 512,719 |
| The Weir Group plc | 18,888 | 329,101 |
| Travis Perkins plc | 49,941 | 470,693 |
| TUI AG *(b) | 311,017 | 469,380 |
| Unilever plc | 202,928 | 9,223,958 |
| United Utilities Group plc | 58,312 | 628,381 |
| Vodafone Group plc | 7,847,134 | 9,160,758 |
| Whitbread plc | 17,296 | 509,057 |
| WPP plc | 161,365 | 1,420,036 |
| 252,871,267 | ||
| Total Common Stocks (Cost $1,526,849,595) | 1,533,108,846 | |
| PREFERRED STOCKS 1.0% OF NET ASSETS | ||
| Germany 0.6% | ||
| Bayerische Motoren Werke AG | 13,027 | 960,661 |
| FUCHS PETROLUB SE | 14,486 | 414,865 |
| Henkel AG & Co. KGaA | 22,995 | 1,448,652 |
| SECURITY | NUMBER OF SHARES | VALUE ($) |
| Volkswagen AG | 47,603 | 6,093,248 |
| 8,917,426 | ||
| Italy 0.1% | ||
| Telecom Italia S.p.A. - RSP * | 4,198,504 | 802,545 |
| Republic of Korea 0.3% | ||
| Amorepacific Corp. | 1,026 | 26,473 |
| Hyundai Motor Co., Ltd. | 5,043 | 277,208 |
| Hyundai Motor Co., Ltd. 2nd | 7,473 | 418,077 |
| LG Chem Ltd. | 817 | 165,591 |
| LG Electronics, Inc. | 5,407 | 150,234 |
| LG H&H Co., Ltd. | 289 | 56,846 |
| Samsung Electronics Co., Ltd. | 111,979 | 4,184,867 |
| Samsung SDI Co., Ltd. | 40 | 9,556 |
| 5,288,852 | ||
| Spain 0.0% | ||
| Grifols S.A., B Shares * | 26,192 | 163,803 |
| Total Preferred Stocks (Cost $17,782,126) | 15,172,626 | |
| SHORT-TERM INVESTMENTS 0.9% OF NET ASSETS | ||
| Money Market Funds 0.9% | ||
| State Street Institutional U.S. Government Money Market Fund, Premier Class 3.01% (c)(d) | 14,379,445 | 14,379,445 |
| Total Short-Term Investments (Cost $14,379,445) | 14,379,445 | |
| Total Investments in Securities (Cost $1,559,011,166) | 1,562,660,917 | |
| NUMBER OF CONTRACTS | NOTIONAL AMOUNT ($) | CURRENT VALUE/ UNREALIZED APPRECIATION ($) | |
| FUTURES CONTRACTS | |||
| Long | |||
| MSCI EAFE Index, expires 12/16/22 | 174 | 15,276,330 | 383,407 |
| * | Non-income producing security. |
| (a) | Fair-valued using significant unobservable inputs (see financial note 2(a), Securities for which no quoted value is available, for additional information). |
| (b) | All or a portion of this security is on loan. Securities on loan were valued at $13,489,921. |
| (c) | The rate shown is the annualized 7-day yield. |
| (d) | Security purchased with cash collateral received for securities on loan. |
| GDR — | Global Depositary Receipt |
| REIT — | Real Estate Investment Trust |
| RSP — | Risparmio (Savings Shares) |
| DESCRIPTION | QUOTED PRICES IN ACTIVE MARKETS FOR IDENTICAL ASSETS (LEVEL 1) | OTHER SIGNIFICANT OBSERVABLE INPUTS (LEVEL 2) | SIGNIFICANT UNOBSERVABLE INPUTS (LEVEL 3) | TOTAL |
| Assets | ||||
| Common Stocks1 | $— | $899,093,959 | $— | $899,093,959 |
| Australia | 1,713,233 | 83,537,721 | 726 | 85,251,680 |
| Canada | 118,538,960 | — | — | 118,538,960 |
| Hong Kong | — | 25,156,998 | 197,277 | 25,354,275 |
| Netherlands | 3,378,865 | 36,283,045 | 0* | 39,661,910 |
| Poland | — | 4,070,851 | 470,667 | 4,541,518 |
| Sweden | 49,783 | 29,033,827 | — | 29,083,610 |
| Switzerland | 88,143 | 78,623,524 | — | 78,711,667 |
| United Kingdom | 502,985 | 252,368,282 | — | 252,871,267 |
| Preferred Stocks1 | — | 15,172,626 | — | 15,172,626 |
| Short-Term Investments1 | 14,379,445 | — | — | 14,379,445 |
| Futures Contracts2 | 383,407 | — | — | 383,407 |
| Total | $139,034,821 | $1,423,340,833 | $668,670 | $1,563,044,324 |
| * | Level 3 amount shown includes securities determined to have no value at October 31, 2022. |
| 1 | As categorized in the Portfolio Holdings. |
| 2 | Futures contracts are reported at cumulative unrealized appreciation or depreciation. |
| Assets | ||
| Investments in securities, at value - unaffiliated (cost $1,559,011,166) including securities on loan of $13,489,921 | $1,562,660,917 | |
| Cash | 11,762,006 | |
| Foreign currency, at value (cost $502,124) | 506,474 | |
| Deposit with broker for futures contracts | 1,578,778 | |
| Receivables: | ||
| Dividends | 5,440,199 | |
| Fund shares sold | 2,661,764 | |
| Foreign tax reclaims | 2,120,800 | |
| Investments sold | 309,668 | |
| Income from securities on loan | 9,936 | |
| Interest | + | 7,519 |
| Total assets | 1,587,058,061 | |
| Liabilities | ||
| Collateral held for securities on loan | 14,379,445 | |
| Payables: | ||
| Investments bought | 6,336,170 | |
| Fund shares redeemed | 1,241,583 | |
| Investment adviser fees | 298,766 | |
| Variation margin on futures contracts | 123,349 | |
| Accrued expenses | + | 1,354 |
| Total liabilities | 22,380,667 | |
| Net assets | $1,564,677,394 | |
| Net Assets by Source | ||
| Capital received from investors | $1,693,643,991 | |
| Total distributable loss | + | (128,966,597) |
| Net assets | $1,564,677,394 | |
| Net Asset Value (NAV) | ||||
| Net Assets | ÷ | Shares Outstanding | = | NAV |
| $1,564,677,394 | 185,965,173 | $8.41 | ||
| For the period November 1, 2021 through October 31, 2022 | ||
| Investment Income | ||
| Dividends received from securities - unaffiliated (net of foreign withholding tax of $6,197,543) | $56,917,060 | |
| Interest received from securities - unaffiliated | 10,352 | |
| Securities on loan, net | + | 139,341 |
| Total investment income | 57,066,753 | |
| Expenses | ||
| Investment adviser fees | 3,735,441 | |
| Proxy fees1 | 66,510 | |
| Professional fees | + | 1,868 2 |
| Total expenses | 3,803,819 | |
| Expense reduction | – | 1,868 2 |
| Net expenses | – | 3,801,951 |
| Net investment income | 53,264,802 | |
| REALIZED AND UNREALIZED GAINS (LOSSES) | ||
| Net realized losses on sales of securities - unaffiliated | (22,542,589) | |
| Net realized losses on futures contracts | (4,440,362) | |
| Net realized losses on foreign currency transactions | + | (1,084,210) |
| Net realized losses | (28,067,161) | |
| Net change in unrealized appreciation (depreciation) on securities - unaffiliated | (318,647,397) | |
| Net change in unrealized appreciation (depreciation) on futures contracts | 281,387 | |
| Net change in unrealized appreciation (depreciation) on foreign currency translations | + | (363,227) |
| Net change in unrealized appreciation (depreciation) | + | (318,729,237) |
| Net realized and unrealized losses | (346,796,398) | |
| Decrease in net assets resulting from operations | ($293,531,596) | |
| 1 | Proxy fees are non-routine expenses (see financial note 2(e) for additional information). |
| 2 | Professional fees associated with the filing of tax claims in the European Union deemed to be non-contingent and non-routine expenses of the fund. (see financial notes 2(d) and 4 for additional information). |
| OPERATIONS | |||
| 11/1/21-10/31/22 | 11/1/20-10/31/21 | ||
| Net investment income | $53,264,802 | $39,731,647 | |
| Net realized gains (losses) | (28,067,161) | 16,057,904 | |
| Net change in unrealized appreciation (depreciation) | + | (318,729,237) | 361,058,807 |
| Increase (decrease) in net assets resulting from operations | ($293,531,596) | $416,848,358 | |
| DISTRIBUTIONS TO SHAREHOLDERS | |||
| Total distributions | ($52,079,126) | ($28,299,152) | |
| TRANSACTIONS IN FUND SHARES | |||||
| 11/1/21-10/31/22 | 11/1/20-10/31/21 | ||||
| SHARES | VALUE | SHARES | VALUE | ||
| Shares sold | 82,237,833 | $778,069,159 | 38,348,007 | $385,853,692 | |
| Shares reinvested | 3,235,712 | 31,904,115 | 1,660,561 | 15,210,744 | |
| Shares redeemed | + | (32,691,719) | (305,948,761) | (35,535,906) | (349,380,700) |
| Net transactions in fund shares | 52,781,826 | $504,024,513 | 4,472,662 | $51,683,736 | |
| SHARES OUTSTANDING AND NET ASSETS | |||||
| 11/1/21-10/31/22 | 11/1/20-10/31/21 | ||||
| SHARES | NET ASSETS | SHARES | NET ASSETS | ||
| Beginning of period | 133,183,347 | $1,406,263,603 | 128,710,685 | $966,030,661 | |
| Total increase | + | 52,781,826 | 158,413,791 | 4,472,662 | 440,232,942 |
| End of period | 185,965,173 | $1,564,677,394 | 133,183,347 | $1,406,263,603 | |
| 11/1/21– 10/31/22 | 11/1/20– 10/31/21 | 11/1/19– 10/31/20 | 11/1/18– 10/31/19 | 11/1/17– 10/31/18 | ||
| Per-Share Data | ||||||
| Net asset value at beginning of period | $15.42 | $11.46 | $12.57 | $12.67 | $14.58 | |
| Income (loss) from investment operations: | ||||||
| Net investment income (loss)1 | 0.30 | 0.27 | 0.22 | 0.29 | 0.33 | |
| Net realized and unrealized gains (losses) | (4.21) | 3.96 | (0.97) | 0.25 | (1.70) | |
| Total from investment operations | (3.91) | 4.23 | (0.75) | 0.54 | (1.37) | |
| Less distributions: | ||||||
| Distributions from net investment income | (0.41) | (0.27) | (0.36) | (0.30) | (0.34) | |
| Distributions from net realized gains | (0.44) | — | — | (0.34) | (0.20) | |
| Total distributions | (0.85) | (0.27) | (0.36) | (0.64) | (0.54) | |
| Net asset value at end of period | $10.66 | $15.42 | $11.46 | $12.57 | $12.67 | |
| Total return | (26.61%) | 37.25% | (6.28%) | 5.13% | (9.79%) | |
| Ratios/Supplemental Data | ||||||
| Ratios to average net assets: | ||||||
| Total expenses | 0.39% 2 | 0.39% | 0.39% | 0.39% | 0.39% | |
| Net investment income (loss) | 2.37% | 1.84% | 1.89% | 2.44% | 2.30% | |
| Portfolio turnover rate | 36% | 35% | 25% | 38% | 26% | |
| Net assets, end of period (x 1,000) | $530,184 | $708,349 | $576,948 | $775,258 | $762,630 | |
| 1 | Calculated based on the average shares outstanding during the period. |
| 2 | Ratio includes less than 0.005% of non-routine proxy expenses. |
| SECURITY | NUMBER OF SHARES | VALUE ($) |
| COMMON STOCKS 99.1% OF NET ASSETS | ||
| Australia 5.4% | ||
| 29Metals Ltd. | 84,025 | 99,485 |
| Adbri Ltd. | 219,888 | 221,689 |
| ALS Ltd. | 55,744 | 407,768 |
| Ansell Ltd. | 40,987 | 739,942 |
| ARB Corp., Ltd. | 5,678 | 105,424 |
| ASX Ltd. | 10,752 | 465,868 |
| Austal Ltd. | 173,233 | 275,811 |
| Bank of Queensland Ltd. | 143,191 | 674,327 |
| Bapcor Ltd. | 61,257 | 259,034 |
| Beach Energy Ltd. | 451,094 | 461,271 |
| Bega Cheese Ltd. | 86,420 | 177,490 |
| Bendigo & Adelaide Bank Ltd. | 137,409 | 793,209 |
| Blackmores Ltd. | 2,721 | 118,256 |
| Boral Ltd. | 192,913 | 355,456 |
| Breville Group Ltd. | 13,434 | 170,225 |
| carsales.com Ltd. | 17,528 | 227,055 |
| Challenger Ltd. | 102,705 | 461,487 |
| Champion Iron Ltd. | 37,221 | 111,958 |
| Charter Hall Group | 23,966 | 198,938 |
| Charter Hall Retail REIT | 52,066 | 134,068 |
| Cleanaway Waste Management Ltd. | 190,550 | 329,600 |
| Cochlear Ltd. | 3,672 | 469,074 |
| Collins Foods Ltd. | 21,545 | 129,362 |
| Coronado Global Resources, Inc. | 213,030 | 254,173 |
| Costa Group Holdings Ltd. | 104,351 | 169,802 |
| Credit Corp. Group Ltd. | 5,650 | 67,163 |
| Cromwell Property Group | 254,501 | 114,140 |
| CSR Ltd. | 190,259 | 563,599 |
| Dexus | 108,641 | 541,369 |
| Domino's Pizza Enterprises Ltd. | 4,345 | 177,161 |
| Eagers Automotive Ltd. | 47,031 | 372,849 |
| Eclipx Group Ltd. * | 157,520 | 188,399 |
| Elders Ltd. | 29,776 | 248,252 |
| Endeavour Group Ltd. | 166,086 | 760,226 |
| Event Hospitality & Entertainment Ltd. | 23,897 | 228,150 |
| Evolution Mining Ltd. | 343,104 | 455,144 |
| Flight Centre Travel Group Ltd. * | 34,772 | 370,090 |
| G.U.D. Holdings Ltd. | 20,118 | 103,478 |
| G8 Education Ltd. | 365,095 | 225,368 |
| Genworth Mortgage Insurance Australia Ltd. | 150,730 | 261,644 |
| GrainCorp Ltd., Class A | 91,676 | 492,834 |
| GWA Group Ltd. | 98,535 | 127,927 |
| Harvey Norman Holdings Ltd. | 174,006 | 462,906 |
| Healius Ltd. | 116,380 | 254,944 |
| Humm Group Ltd. | 299,959 | 91,963 |
| IGO Ltd. | 33,044 | 323,168 |
| Iluka Resources Ltd. | 30,500 | 168,986 |
| Inghams Group Ltd. | 67,196 | 108,711 |
| Insignia Financial Ltd. | 171,676 | 346,082 |
| InvoCare Ltd. | 18,622 | 121,780 |
| IRESS Ltd. | 29,659 | 192,508 |
| Link Administration Holdings Ltd. | 109,258 | 238,937 |
| Magellan Financial Group Ltd. | 27,184 | 172,369 |
| SECURITY | NUMBER OF SHARES | VALUE ($) |
| McMillan Shakespeare Ltd. | 22,020 | 184,530 |
| Mineral Resources Ltd. * | 14,157 | 663,705 |
| Monadelphous Group Ltd. | 47,587 | 416,016 |
| Myer Holdings Ltd. | 771,718 | 313,148 |
| nib Holdings Ltd. | 92,796 | 397,078 |
| Nine Entertainment Co. Holdings Ltd. | 231,583 | 305,832 |
| Northern Star Resources Ltd. | 94,281 | 526,192 |
| NRW Holdings Ltd. | 278,426 | 454,354 |
| Nufarm Ltd. | 113,411 | 404,183 |
| oOh!media Ltd. | 130,141 | 105,265 |
| OZ Minerals Ltd. | 35,297 | 546,540 |
| Pact Group Holdings Ltd. | 70,553 | 64,725 |
| Pendal Group Ltd. | 113,163 | 355,451 |
| Perenti Global Ltd. * | 616,481 | 377,802 |
| Perpetual Ltd. | 14,565 | 232,096 |
| Perseus Mining Ltd. | 83,679 | 97,461 |
| Platinum Asset Management Ltd. | 162,281 | 185,786 |
| Premier Investments Ltd. | 12,822 | 205,337 |
| Qube Holdings Ltd. | 218,691 | 380,731 |
| Ramelius Resources Ltd. | 124,430 | 58,400 |
| REA Group Ltd. | 2,125 | 164,700 |
| Reece Ltd. | 27,090 | 269,000 |
| Regis Resources Ltd. * | 285,578 | 278,443 |
| Reliance Worldwide Corp., Ltd. | 100,127 | 205,721 |
| Sandfire Resources Ltd. | 79,278 | 176,559 |
| SEEK Ltd. | 30,253 | 416,459 |
| Service Stream Ltd. * | 183,030 | 85,982 |
| Seven Group Holdings Ltd. | 20,945 | 245,610 |
| Shopping Centres Australasia Property Group | 96,304 | 167,734 |
| Sierra Rutile Holdings Ltd. * | 30,500 | 4,037 |
| Silver Lake Resources Ltd. * | 86,201 | 61,044 |
| Southern Cross Media Group Ltd. | 163,377 | 100,885 |
| St. Barbara Ltd. * | 404,654 | 131,740 |
| Steadfast Group Ltd. | 58,906 | 190,840 |
| Super Retail Group Ltd. | 55,265 | 363,379 |
| Tassal Group Ltd. | 70,563 | 234,309 |
| The GPT Group | 203,870 | 563,408 |
| The Star Entertainment Grp Ltd. * | 339,709 | 639,037 |
| United Malt Grp Ltd. | 72,473 | 144,195 |
| Virgin Australia Holdings Pty. Ltd. (a) | 176,214 | 0 |
| Washington H Soul Pattinson & Co., Ltd. | 17,908 | 320,483 |
| Waypoint REIT Ltd. | 52,054 | 90,886 |
| Webjet Ltd. * | 24,919 | 84,151 |
| Whitehaven Coal Ltd. | 305,535 | 1,774,790 |
| 28,578,943 | ||
| Austria 0.7% | ||
| ANDRITZ AG | 18,464 | 858,143 |
| AT&S Austria Technologie & Systemtechnik AG | 4,781 | 147,661 |
| CA Immobilien Anlagen AG * | 4,827 | 152,458 |
| EVN AG | 9,717 | 161,655 |
| IMMOFINANZ AG * | 5,511 | 64,976 |
| Lenzing AG | 4,548 | 217,595 |
| Mayr Melnhof Karton AG | 2,765 | 393,456 |
| Oesterreichische Post AG | 12,018 | 341,950 |
| SECURITY | NUMBER OF SHARES | VALUE ($) |
| S IMMO AG | 2,759 | 62,034 |
| Strabag SE | 8,468 | 325,116 |
| UNIQA Insurance Group AG | 35,430 | 229,616 |
| Verbund AG | 4,078 | 319,449 |
| Vienna Insurance Group AG Wiener Versicherung Gruppe | 13,798 | 308,604 |
| 3,582,713 | ||
| Belgium 1.3% | ||
| Ackermans & van Haaren N.V. | 5,094 | 709,703 |
| Aedifica S.A. | 925 | 70,543 |
| AGFA-Gevaert N.V. * | 68,895 | 208,292 |
| Barco N.V. | 15,078 | 325,538 |
| Bekaert S.A. | 17,160 | 478,205 |
| bpost S.A. | 90,543 | 447,562 |
| Cie d'Entreprises CFE * | 2,687 | 28,528 |
| Cofinimmo S.A. * | 2,747 | 227,824 |
| Deme Group NV * | 2,578 | 287,215 |
| D'ieteren Group | 3,788 | 630,429 |
| Elia Group S.A./N.V. | 3,688 | 466,282 |
| Euronav N.V. | 55,491 | 967,418 |
| Fagron | 6,490 | 80,795 |
| KBC Ancora * | 4,237 | 150,616 |
| Melexis N.V. | 2,487 | 171,046 |
| Ontex Group N.V. * | 82,684 | 487,669 |
| Recticel S.A. | 7,591 | 104,901 |
| Sofina S.A. | 1,525 | 297,373 |
| Telenet Group Holding N.V. | 30,647 | 467,251 |
| Tessenderlo Group S.A. * | 9,272 | 281,034 |
| Warehouses De Pauw CVA | 5,574 | 143,062 |
| 7,031,286 | ||
| Canada 8.2% | ||
| Aecon Group, Inc. | 37,676 | 267,149 |
| Ag Growth International, Inc. | 6,141 | 157,317 |
| Air Canada * | 59,771 | 860,358 |
| Alamos Gold, Inc., Class A | 49,846 | 393,324 |
| Allied Properties Real Estate Investment Trust | 13,579 | 263,038 |
| Altus Group Ltd. | 4,051 | 143,949 |
| ARC Resources Ltd. | 102,831 | 1,447,718 |
| Aritzia, Inc. * | 2,789 | 108,174 |
| Artis Real Estate Investment Trust | 32,607 | 228,573 |
| ATS Automation Tooling Systems, Inc. * | 6,210 | 196,463 |
| AutoCanada, Inc. * | 10,013 | 156,257 |
| B2Gold Corp. | 192,184 | 586,843 |
| Badger Infrastructure Solutions Ltd. | 8,162 | 172,424 |
| Birchcliff Energy Ltd. | 42,887 | 333,375 |
| BlackBerry Ltd. * | 35,049 | 162,851 |
| Boardwalk Real Estate Investment Trust | 5,647 | 200,952 |
| Bombardier, Inc., Class B * | 16,759 | 492,174 |
| Boralex, Inc., Class A | 6,842 | 194,008 |
| Boyd Group Services, Inc. | 2,606 | 370,829 |
| Brookfield Infrastructure Corp., Class A | 17,150 | 739,976 |
| Brookfield Renewable Corp., Class A | 3,740 | 116,207 |
| BRP, Inc. | 4,897 | 327,425 |
| CAE, Inc. * | 33,846 | 645,940 |
| Cameco Corp. | 31,708 | 751,999 |
| Canaccord Genuity Group, Inc. | 19,879 | 101,850 |
| Canadian Apartment Properties REIT | 15,544 | 481,375 |
| Canadian Western Bank | 16,534 | 287,632 |
| Canfor Corp. * | 24,851 | 373,399 |
| Capital Power Corp. | 21,267 | 711,840 |
| Cargojet, Inc. | 826 | 80,517 |
| Cascades, Inc. | 81,326 | 527,707 |
| Celestica, Inc. * | 80,277 | 880,934 |
| SECURITY | NUMBER OF SHARES | VALUE ($) |
| Centerra Gold, Inc. | 78,918 | 366,683 |
| Chartwell Retirement Residences | 38,368 | 222,488 |
| Chemtrade Logistics Income Fund | 59,466 | 321,697 |
| Choice Properties Real Estate Investment Trust | 25,458 | 244,611 |
| Chorus Aviation, Inc. * | 120,670 | 228,523 |
| Cineplex, Inc. * | 34,529 | 234,696 |
| Cogeco Communications, Inc. | 2,922 | 149,022 |
| Cogeco, Inc. | 7,604 | 323,840 |
| Colliers International Group, Inc. | 2,437 | 228,719 |
| Crombie Real Estate Investment Trust | 13,505 | 147,803 |
| Doman Building Materials Group Ltd. | 26,931 | 109,317 |
| Dream Industrial Real Estate Investment Trust | 10,045 | 80,737 |
| Dream Office Real Estate Investment Trust | 14,212 | 160,757 |
| Dundee Precious Metals, Inc. | 21,618 | 98,065 |
| ECN Capital Corp. | 27,320 | 82,420 |
| Eldorado Gold Corp. * | 26,692 | 149,100 |
| Element Fleet Management Corp. | 48,352 | 644,173 |
| Enerflex Ltd. | 79,882 | 412,794 |
| Enerplus Corp. | 38,237 | 662,941 |
| Enghouse Systems Ltd. | 4,215 | 93,715 |
| EQB, Inc. | 2,201 | 78,001 |
| Exchange Income Corp. | 9,841 | 328,671 |
| Extendicare, Inc. | 25,179 | 129,559 |
| Fiera Capital Corp. | 13,574 | 86,385 |
| First Capital Real Estate Investment Trust | 44,468 | 517,354 |
| FirstService Corp. | 2,023 | 252,899 |
| Fortuna Silver Mines, Inc. * | 44,919 | 124,963 |
| Gibson Energy, Inc. | 44,696 | 762,786 |
| goeasy Ltd. | 1,008 | 81,781 |
| Granite Real Estate Investment Trust | 3,207 | 163,887 |
| H&R Real Estate Investment Trust | 77,563 | 638,222 |
| Hardwoods Distribution, Inc. | 4,042 | 74,262 |
| Home Capital Group, Inc. | 13,773 | 266,290 |
| Hudbay Minerals, Inc. | 84,472 | 320,564 |
| IAMGOLD Corp. * | 263,338 | 386,607 |
| IGM Financial, Inc. | 19,099 | 511,279 |
| Innergex Renewable Energy, Inc. | 14,400 | 158,550 |
| Interfor Corp. * | 20,107 | 357,169 |
| Killam Apartment Real Estate Investment Trust | 11,240 | 130,275 |
| Labrador Iron Ore Royalty Corp. | 5,293 | 109,718 |
| Laurentian Bank of Canada | 11,286 | 251,840 |
| Maple Leaf Foods, Inc. | 25,298 | 374,916 |
| Martinrea International, Inc. | 88,064 | 564,318 |
| MEG Energy Corp. * | 56,121 | 839,127 |
| Mullen Group Ltd. | 35,139 | 353,105 |
| NFI Group, Inc. | 39,052 | 252,254 |
| Northland Power, Inc. | 25,475 | 741,240 |
| NorthWest Healthcare Properties Real Estate Investment Trust | 21,831 | 172,103 |
| NuVista Energy Ltd. * | 28,414 | 281,773 |
| Obsidian Energy Ltd. * | 12,731 | 115,783 |
| OceanaGold Corp. * | 250,474 | 364,032 |
| Pan American Silver Corp. | 27,702 | 442,264 |
| Parex Resources, Inc. | 34,590 | 527,603 |
| Pason Systems, Inc. | 17,360 | 184,387 |
| Peyto Exploration & Development Corp. | 49,034 | 457,821 |
| PrairieSky Royalty Ltd. | 18,092 | 281,005 |
| Precision Drilling Corp. * | 7,733 | 570,460 |
| Premium Brands Holdings Corp. | 5,423 | 319,923 |
| Primo Water Corp. | 34,440 | 502,058 |
| Richelieu Hardware Ltd. | 9,491 | 254,770 |
| Ritchie Bros. Auctioneers, Inc. | 8,545 | 558,230 |
| Russel Metals, Inc. | 30,287 | 627,371 |
| Secure Energy Services, Inc. | 80,952 | 424,859 |
| ShawCor Ltd. * | 63,777 | 465,331 |
| SECURITY | NUMBER OF SHARES | VALUE ($) |
| Shopify, Inc., Class A * | 7,331 | 251,353 |
| Sienna Senior Living, Inc. | 16,192 | 139,653 |
| Sierra Wireless, Inc. * | 5,309 | 157,709 |
| Silvercorp Metals, Inc. | 33,339 | 81,246 |
| Sleep Country Canada Holdings, Inc. | 7,579 | 124,727 |
| SmartCentres Real Estate Investment Trust | 22,050 | 432,147 |
| SSR Mining, Inc. | 17,583 | 242,124 |
| Stantec, Inc. | 15,541 | 760,424 |
| Stelco Holdings, Inc. | 6,611 | 166,494 |
| Stella-Jones, Inc. | 19,817 | 596,830 |
| Superior Plus Corp. | 54,241 | 412,476 |
| The Descartes Systems Group, Inc. * | 2,644 | 182,432 |
| The North West Co., Inc. | 14,087 | 366,561 |
| TMX Group Ltd. | 4,337 | 416,971 |
| Torex Gold Resources, Inc. * | 33,472 | 228,003 |
| Toromont Industries Ltd. | 9,218 | 708,426 |
| TransAlta Corp. | 75,311 | 663,363 |
| TransAlta Renewables, Inc. | 8,197 | 88,026 |
| Transcontinental, Inc., Class A | 46,028 | 525,368 |
| Trican Well Service Ltd. * | 44,146 | 117,304 |
| Tricon Residential, Inc. | 13,033 | 109,824 |
| Turquoise Hill Resources Ltd. * | 12,879 | 362,637 |
| Uni-Select, Inc. * | 9,365 | 254,000 |
| Vermilion Energy, Inc. | 55,674 | 1,299,135 |
| Wajax Corp. | 9,668 | 130,861 |
| Western Forest Products, Inc. | 156,796 | 141,564 |
| Westshore Terminals Investment Corp. | 7,798 | 139,492 |
| Whitecap Resources, Inc. | 50,737 | 393,278 |
| Winpak Ltd. | 7,569 | 230,678 |
| Yamana Gold, Inc. | 158,148 | 694,187 |
| 43,547,766 | ||
| Denmark 1.6% | ||
| Alm Brand A/S | 96,530 | 131,920 |
| Chr. Hansen Holding A/S | 9,099 | 505,368 |
| D/S Norden A/S | 10,764 | 557,091 |
| Demant A/S * | 9,862 | 269,304 |
| Dfds A/S | 10,259 | 311,330 |
| FLSmidth & Co. A/S | 22,883 | 528,902 |
| Genmab A/S * | 1,378 | 530,816 |
| GN Store Nord A/S | 15,702 | 333,688 |
| H Lundbeck A/S | 72,065 | 269,645 |
| H Lundbeck A/S, Class A * | 19,805 | 67,293 |
| Jyske Bank A/S * | 12,538 | 676,665 |
| Matas A/S | 11,888 | 113,780 |
| NKT A/S * | 5,685 | 283,722 |
| Per Aarsleff Holding A/S | 9,895 | 276,455 |
| Ringkjoebing Landbobank A/S | 1,849 | 201,102 |
| Rockwool A/S, Class B | 1,471 | 292,956 |
| Royal Unibrew A/S | 6,451 | 368,508 |
| Scandinavian Tobacco Group A/S, Class A | 19,418 | 325,265 |
| Schouw & Co. A/S | 5,239 | 332,389 |
| SimCorp A/S | 3,967 | 236,872 |
| Solar A/S, B Shares | 1,734 | 130,767 |
| Spar Nord Bank A/S | 10,983 | 132,979 |
| Sydbank A/S | 16,234 | 494,331 |
| Topdanmark A/S | 5,563 | 256,750 |
| Tryg A/S | 26,914 | 582,129 |
| 8,210,027 | ||
| Finland 1.1% | ||
| Aktia Bank Oyj | 14,210 | 141,273 |
| Cargotec Oyj, B Shares | 17,367 | 653,166 |
| Finnair Oyj *(b) | 418,660 | 177,273 |
| Kamux Corp. | 13,214 | 63,909 |
| SECURITY | NUMBER OF SHARES | VALUE ($) |
| Kemira Oyj | 41,097 | 542,660 |
| Kojamo Oyj | 15,939 | 207,440 |
| Konecranes Oyj | 24,749 | 622,696 |
| Metsa Board Oyj, B Shares | 40,446 | 304,252 |
| Metso Outotec Oyj | 35,237 | 267,417 |
| Orion Oyj, B Shares | 17,749 | 816,777 |
| Sanoma Oyj | 19,297 | 225,899 |
| Terveystalo Oyj | 12,693 | 78,505 |
| TietoEVRY Oyj | 21,594 | 514,784 |
| Tokmanni Group Corp. | 13,411 | 162,154 |
| Uponor Oyj | 15,801 | 209,876 |
| Valmet Oyj | 33,713 | 766,742 |
| YIT Oyj | 91,161 | 228,602 |
| 5,983,425 | ||
| France 4.1% | ||
| Accor S.A. * | 27,080 | 648,876 |
| Aeroports de Paris * | 4,757 | 643,292 |
| Altarea S.C.A. | 734 | 97,778 |
| Alten S.A. | 4,674 | 546,064 |
| Amundi S.A. | 11,448 | 540,116 |
| Beneteau S.A. | 13,310 | 147,505 |
| BioMerieux | 4,294 | 379,927 |
| Carmila S.A. | 6,001 | 83,956 |
| CGG S.A. * | 675,124 | 573,503 |
| Cie Plastic Omnium S.A. | 35,145 | 492,451 |
| Coface S.A. | 24,169 | 269,053 |
| Covivio | 9,241 | 494,777 |
| Dassault Aviation S.A. | 3,210 | 476,744 |
| Derichebourg S.A. | 37,055 | 161,807 |
| Elior Group S.A. *(b) | 183,362 | 407,022 |
| Eramet S.A. | 2,079 | 136,199 |
| Eurazeo SE | 11,801 | 673,429 |
| Eurofins Scientific SE | 8,327 | 533,051 |
| Euronext N.V. | 6,058 | 384,494 |
| Fnac Darty S.A. | 13,862 | 428,243 |
| Gaztransport Et Technigaz S.A. | 2,235 | 260,017 |
| Gecina S.A. | 6,093 | 543,216 |
| Getlink SE | 44,783 | 708,668 |
| ICADE | 10,008 | 372,286 |
| Imerys S.A. | 20,057 | 820,967 |
| Ipsen S.A. | 4,379 | 450,020 |
| IPSOS | 11,916 | 576,820 |
| JCDecaux SE * | 25,247 | 318,752 |
| Kaufman & Broad S.A. | 9,356 | 227,338 |
| Korian S.A. | 32,462 | 306,728 |
| La Francaise des Jeux SAEM | 9,104 | 296,686 |
| Lagardere S.A. | 26,280 | 459,381 |
| Maisons du Monde S.A. | 22,414 | 219,710 |
| Mercialys S.A. | 28,386 | 245,803 |
| Mersen S.A. | 5,833 | 188,726 |
| Metropole Television S.A. | 29,790 | 308,104 |
| Nexans S.A. | 7,092 | 662,241 |
| Nexity S.A. | 24,478 | 490,301 |
| Orpea S.A. *(b) | 24,281 | 196,916 |
| Quadient S.A. | 26,306 | 370,106 |
| Remy Cointreau S.A. | 1,681 | 257,089 |
| Rothschild & Co. | 5,546 | 196,682 |
| Sartorius Stedim Biotech | 552 | 175,171 |
| SMCP S.A. * | 19,994 | 125,681 |
| Societe BIC S.A. | 12,661 | 726,819 |
| SOITEC * | 607 | 77,723 |
| Sopra Steria Group S.A. | 4,109 | 543,877 |
| SPIE S.A. | 34,811 | 814,353 |
| Technicolor Creative Studios S.A. * | 71,592 | 111,574 |
| Technicolor S.A. * | 71,592 | 53,280 |
| Television Francaise 1 | 63,834 | 405,222 |
| SECURITY | NUMBER OF SHARES | VALUE ($) |
| Trigano S.A. | 2,213 | 226,517 |
| UbiSoft Entertainment S.A. * | 17,374 | 476,671 |
| Verallia S.A. | 15,516 | 439,644 |
| Vicat S.A. | 11,893 | 272,626 |
| Virbac S.A. | 443 | 108,556 |
| Worldline S.A. * | 14,785 | 645,313 |
| 21,797,871 | ||
| Germany 3.8% | ||
| 1&1 AG | 20,268 | 267,007 |
| Aareal Bank AG, Tender Shares * | 22,018 | 696,297 |
| ADLER Group S.A. * | 36,475 | 54,083 |
| ADVA Optical Networking SE * | 6,450 | 132,029 |
| Aroundtown S.A. | 147,890 | 293,154 |
| Bechtle AG | 14,772 | 510,322 |
| Befesa S.A. | 4,618 | 160,394 |
| Bilfinger SE | 15,131 | 420,927 |
| Borussia Dortmund GmbH & Co. KGaA * | 33,259 | 122,955 |
| CANCOM SE | 9,011 | 222,679 |
| Carl Zeiss Meditec AG, Class B | 2,021 | 244,628 |
| CECONOMY AG | 232,363 | 378,149 |
| Cewe Stiftung & Co. KGaA | 1,936 | 151,650 |
| CompuGroup Medical SE & Co. KgaA | 2,205 | 69,665 |
| CTS Eventim AG & Co., KGaA * | 4,337 | 207,033 |
| Deutsche Euroshop AG | 3,798 | 81,392 |
| Deutsche Pfandbriefbank AG | 54,295 | 404,396 |
| Deutsche Wohnen SE | 11,236 | 226,632 |
| Deutz AG | 91,783 | 346,518 |
| DIC Asset AG | 7,006 | 48,297 |
| Duerr AG | 19,650 | 519,403 |
| DWS Group GmbH & Co. KGaA | 9,676 | 261,604 |
| ElringKlinger AG | 24,432 | 174,878 |
| Encavis AG | 5,362 | 99,828 |
| Evotec SE * | 3,889 | 74,175 |
| Fielmann AG | 5,115 | 162,946 |
| Fraport AG Frankfurt Airport Services Worldwide * | 10,209 | 393,313 |
| Gerresheimer AG | 8,370 | 479,506 |
| Global Fashion Group S.A. * | 45,177 | 76,084 |
| Grand City Properties S.A. | 18,704 | 181,945 |
| GRENKE AG | 6,633 | 135,279 |
| Hamburger Hafen und Logistik AG | 10,474 | 122,676 |
| Heidelberger Druckmaschinen AG * | 65,465 | 90,360 |
| Hella GmbH & Co. KGaA | 6,734 | 525,714 |
| HelloFresh SE * | 7,197 | 143,862 |
| HOCHTIEF AG | 11,238 | 597,007 |
| Hornbach Holding AG & Co. KGaA | 5,360 | 365,367 |
| Hugo Boss AG | 14,736 | 678,701 |
| Jenoptik AG | 10,203 | 223,681 |
| JOST Werke AG | 4,494 | 191,781 |
| Kloeckner & Co. SE | 80,279 | 629,160 |
| Kontron AG | 9,569 | 138,496 |
| Krones AG | 4,930 | 456,584 |
| LEG Immobilien SE | 7,050 | 460,260 |
| Leoni AG * | 41,733 | 293,729 |
| Nemetschek SE | 1,324 | 63,124 |
| Nordex SE * | 22,790 | 212,452 |
| Norma Group SE | 16,164 | 256,242 |
| PATRIZIA SE | 7,227 | 53,043 |
| Puma SE | 10,887 | 481,323 |
| QIAGEN N.V. * | 12,414 | 536,076 |
| Rational AG | 266 | 149,944 |
| RTL Group S.A. * | 18,279 | 620,498 |
| SAF-Holland SE | 27,071 | 200,404 |
| Sartorius AG | 59 | 17,392 |
| Scout24 SE | 7,727 | 395,970 |
| Siltronic AG | 5,297 | 329,410 |
| SECURITY | NUMBER OF SHARES | VALUE ($) |
| Sixt SE | 3,053 | 286,352 |
| Software AG | 12,111 | 264,952 |
| Stabilus SE | 6,354 | 348,579 |
| Stroeer SE & Co. KGaA | 5,018 | 204,578 |
| Suedzucker AG | 39,213 | 499,727 |
| Synlab AG | 6,821 | 87,827 |
| TAG Immobilien AG | 28,271 | 177,056 |
| Takkt AG | 17,666 | 228,793 |
| Talanx AG * | 18,699 | 702,229 |
| Vantage Towers AG | 4,443 | 124,957 |
| Vitesco Technologies Group AG, Class A * | 16,629 | 889,794 |
| Wacker Chemie AG | 2,990 | 348,112 |
| Wacker Neuson SE | 10,453 | 164,797 |
| 20,158,177 | ||
| Greece 0.0% | ||
| TT Hellenic Postbank S.A. *(a) | 24,275 | 0 |
| Hong Kong 2.6% | ||
| Asia Cement China Holdings Corp. | 413,000 | 144,162 |
| ASMPT Ltd. | 78,700 | 432,889 |
| BOC Aviation Ltd. | 40,500 | 271,023 |
| Brightoil Petroleum Holdings Ltd. *(a) | 1,150,000 | 0 |
| Budweiser Brewing Co. APAC Ltd. | 178,500 | 375,693 |
| Cathay Pacific Airways Ltd. * | 414,363 | 375,756 |
| Chow Sang Sang Holdings International Ltd. | 213,000 | 196,440 |
| Chow Tai Fook Jewellery Group Ltd. | 300,200 | 513,965 |
| CITIC Telecom International Holdings Ltd. | 688,000 | 203,342 |
| CK Infrastructure Holdings Ltd. | 36,000 | 171,026 |
| Cowell e Holdings, Inc. * | 206,000 | 252,051 |
| DFI Retail Group Holdings Ltd. | 161,820 | 362,784 |
| FIT Hon Teng Ltd. * | 1,034,000 | 121,022 |
| Fortune Real Estate Investment Trust | 229,000 | 146,174 |
| Haitong International Securities Group Ltd. * | 1,629,929 | 118,293 |
| Hang Lung Properties Ltd. | 377,000 | 474,252 |
| HKBN Ltd. | 172,500 | 116,506 |
| Huabao International Holdings Ltd. | 248,735 | 114,623 |
| Hysan Development Co., Ltd. | 117,000 | 255,013 |
| IGG, Inc. * | 802,900 | 208,737 |
| Jinchuan Group International Resources Co., Ltd. | 1,757,000 | 116,372 |
| JS Global Lifestyle Co., Ltd. | 146,500 | 118,008 |
| Kerry Logistics Network Ltd. | 112,500 | 178,577 |
| Kerry Properties Ltd. | 322,000 | 509,367 |
| L'Occitane International S.A. | 47,500 | 116,623 |
| Luk Fook Holdings International Ltd. | 181,000 | 393,203 |
| Man Wah Holdings Ltd. | 263,200 | 146,861 |
| Melco International Development Ltd. * | 754,000 | 394,242 |
| MGM China Holdings Ltd. * | 232,000 | 93,408 |
| MMG Ltd. * | 1,172,000 | 231,103 |
| NagaCorp Ltd. | 394,149 | 179,745 |
| Nexteer Automotive Group Ltd. | 519,000 | 280,905 |
| NWS Holdings Ltd. | 710,000 | 503,498 |
| Orient Overseas International Ltd. | 13,000 | 189,971 |
| Pacific Basin Shipping Ltd. | 875,000 | 211,840 |
| Power Assets Holdings Ltd. | 23,643 | 113,050 |
| Powerlong Real Estate Holdings Ltd. | 2,081,000 | 169,826 |
| Prada S.p.A. | 56,000 | 255,127 |
| Samsonite International S.A. * | 296,057 | 636,063 |
| Singamas Container Holdings Ltd. | 1,304,989 | 99,719 |
| Sino Land Co., Ltd. | 644,746 | 688,470 |
| SITC International Holdings Co., Ltd. | 114,000 | 186,709 |
| SJM Holdings Ltd. * | 923,500 | 288,178 |
| Sun Hung Kai & Co., Ltd. | 258,000 | 90,093 |
| SECURITY | NUMBER OF SHARES | VALUE ($) |
| Swire Properties Ltd. | 185,000 | 355,554 |
| Texhong Textile Group Ltd. | 161,500 | 104,016 |
| The Bank of East Asia Ltd. | 513,990 | 492,601 |
| Truly International Holdings Ltd. | 1,050,000 | 128,327 |
| United Energy Group Ltd. | 1,060,000 | 102,549 |
| Value Partners Group Ltd. | 425,000 | 101,228 |
| Vitasoy International Holdings Ltd. * | 152,000 | 259,559 |
| VSTECS Holdings Ltd. | 422,000 | 202,908 |
| VTech Holdings Ltd. | 82,000 | 436,503 |
| Wynn Macau Ltd. * | 603,200 | 240,469 |
| Xinyi Glass Holdings Ltd. | 318,000 | 408,679 |
| 13,877,102 | ||
| Ireland 0.3% | ||
| AIB Group plc | 230,385 | 666,484 |
| Dalata Hotel Group plc * | 43,542 | 139,690 |
| Glanbia plc | 57,444 | 663,436 |
| Irish Continental Group plc | 37,869 | 153,101 |
| 1,622,711 | ||
| Israel 1.5% | ||
| Alony Hetz Properties & Investments Ltd. | 6,475 | 75,947 |
| Azrieli Group Ltd. | 2,209 | 163,655 |
| Bezeq The Israeli Telecommunication Corp., Ltd. | 513,092 | 908,294 |
| Cellcom Israel Ltd. * | 31,208 | 156,235 |
| Clal Insurance Enterprises Holdings Ltd. * | 6,494 | 112,063 |
| Delek Automotive Systems Ltd. | 9,483 | 122,104 |
| Delek Group Ltd. * | 2,955 | 449,891 |
| Elbit Systems Ltd. | 2,828 | 572,204 |
| FIBI Holdings Ltd. | 3,687 | 173,852 |
| Formula Systems 1985 Ltd. | 1,088 | 88,310 |
| G City Ltd. * | 29,655 | 95,749 |
| Harel Insurance Investments & Financial Services Ltd. | 23,322 | 224,497 |
| Isracard Ltd. | 42,191 | 124,753 |
| Israel Corp., Ltd. | 1,306 | 565,305 |
| Mivne Real Estate KD Ltd. | 28,979 | 90,098 |
| Mizrahi Tefahot Bank Ltd. | 13,513 | 510,812 |
| Nice Ltd. * | 3,015 | 568,235 |
| Oil Refineries Ltd. | 1,493,980 | 556,380 |
| Partner Communications Co., Ltd. * | 22,341 | 168,411 |
| Paz Oil Co., Ltd. * | 4,824 | 576,289 |
| Shikun & Binui Ltd. * | 34,288 | 136,111 |
| Shufersal Ltd. | 32,594 | 222,504 |
| Strauss Group Ltd. | 6,489 | 162,339 |
| The First International Bank of Israel Ltd. | 6,406 | 276,620 |
| The Phoenix Holdings Ltd. | 18,107 | 196,137 |
| Tower Semiconductor Ltd. * | 15,608 | 667,021 |
| 7,963,816 | ||
| Italy 2.6% | ||
| ACEA S.p.A. | 12,137 | 152,932 |
| Alitalia - Linee Aeree Italiane S.p.A. *(a) | 14,782 | 0 |
| Amplifon S.p.A. | 7,694 | 191,149 |
| Anima Holding S.p.A. | 105,108 | 325,537 |
| Autogrill S.p.A. * | 58,473 | 365,500 |
| Azimut Holding S.p.A. | 25,821 | 415,771 |
| Banca Generali S.p.A. | 9,821 | 293,586 |
| Banca IFIS S.p.A. | 13,150 | 155,274 |
| Banca Mediolanum S.p.A. | 52,847 | 395,396 |
| Banca Monte dei Paschi di Siena S.p.A. * | 3,568 | 6,733 |
| Banca Popolare di Sondrio S.p.A. | 127,720 | 458,139 |
| BFF Bank S.p.A. | 35,880 | 253,118 |
| BPER Banca | 434,495 | 803,945 |
| SECURITY | NUMBER OF SHARES | VALUE ($) |
| Brembo S.p.A. | 42,436 | 443,642 |
| Buzzi Unicem S.p.A. | 34,253 | 568,489 |
| Cementir Holding N.V. | 15,642 | 91,043 |
| Credito Emiliano S.p.A. | 15,441 | 91,550 |
| Danieli & C Officine Meccaniche S.p.A. | 2,500 | 51,026 |
| Davide Campari-Milano N.V. | 33,625 | 301,963 |
| De'Longhi S.p.A. | 16,289 | 281,047 |
| DiaSorin S.p.A. | 1,830 | 239,246 |
| Enav S.p.A. | 67,090 | 259,439 |
| ERG S.p.A. | 11,765 | 369,031 |
| Esprinet S.p.A. | 28,576 | 190,354 |
| Fincantieri S.p.A. * | 240,780 | 122,417 |
| FinecoBank Banca Fineco S.p.A. | 43,622 | 587,832 |
| Infrastrutture Wireless Italiane S.p.A. | 18,257 | 161,139 |
| Interpump Group S.p.A. | 10,354 | 400,860 |
| Iren S.p.A. | 296,660 | 440,861 |
| Italgas S.p.A. | 128,958 | 664,424 |
| Maire Tecnimont S.p.A. | 56,158 | 174,247 |
| MARR S.p.A. | 10,891 | 114,759 |
| MFE-MediaForEurope N.V., Class A | 540,350 | 189,557 |
| MFE-MediaForEurope N.V., Class B | 247,811 | 123,768 |
| Moncler S.p.A. | 14,726 | 635,342 |
| Nexi S.p.A. * | 16,044 | 138,708 |
| OVS S.p.A. | 135,423 | 252,816 |
| Piaggio & C S.p.A. | 63,754 | 163,793 |
| Recordati Industria Chimica e Farmaceutica S.p.A. | 10,775 | 404,833 |
| Reply S.p.A. | 1,574 | 171,210 |
| Salvatore Ferragamo S.p.A. | 13,390 | 196,820 |
| Saras S.p.A. * | 1,067,840 | 1,290,592 |
| SOL S.p.A. | 6,275 | 112,876 |
| Technogym S.p.A. | 21,082 | 144,939 |
| Unieuro S.p.A. | 12,701 | 137,077 |
| UnipolSai Assicurazioni S.p.A. | 141,004 | 317,932 |
| Webuild S.p.A. | 137,137 | 186,615 |
| 13,837,327 | ||
| Japan 35.3% | ||
| ABC-Mart, Inc. | 9,300 | 414,526 |
| Acom Co., Ltd. | 117,300 | 256,260 |
| Activia Properties, Inc. | 61 | 180,685 |
| Adastria Co., Ltd. | 21,380 | 290,343 |
| ADEKA Corp. | 41,200 | 615,957 |
| Advance Residence Investment Corp. | 102 | 237,473 |
| Aeon Delight Co., Ltd. | 11,400 | 227,861 |
| AEON Financial Service Co., Ltd. | 55,300 | 541,199 |
| Aeon Hokkaido Corp. | 13,500 | 106,666 |
| Aeon Mall Co., Ltd. | 46,930 | 510,530 |
| AEON REIT Investment Corp. | 172 | 185,180 |
| Ahresty Corp. | 62,600 | 155,111 |
| Ai Holdings Corp. | 7,600 | 112,499 |
| Aica Kogyo Co., Ltd. | 22,200 | 477,135 |
| Aichi Steel Corp. | 21,300 | 297,877 |
| Aida Engineering Ltd. | 27,600 | 160,354 |
| Aiful Corp. | 62,600 | 170,495 |
| Ain Holdings, Inc. | 11,200 | 470,511 |
| Aisan Industry Co., Ltd. | 31,300 | 148,357 |
| Akebono Brake Industry Co., Ltd. * | 88,400 | 103,401 |
| Alconix Corp. | 15,900 | 146,253 |
| Alpen Co., Ltd. | 11,300 | 153,574 |
| Amano Corp. | 25,700 | 439,788 |
| Anritsu Corp. | 31,700 | 319,056 |
| AOKI Holdings, Inc. | 48,900 | 236,355 |
| Aoyama Trading Co., Ltd. | 91,400 | 637,601 |
| Aozora Bank Ltd. | 35,800 | 615,823 |
| Arata Corp. | 21,600 | 596,394 |
| Arcland Sakamoto Co., Ltd. | 14,200 | 140,839 |
| SECURITY | NUMBER OF SHARES | VALUE ($) |
| Arcs Co., Ltd. | 48,400 | 645,136 |
| Ariake Japan Co., Ltd. | 4,000 | 138,577 |
| As One Corp. | 2,880 | 122,810 |
| Asahi Diamond Industrial Co., Ltd. | 21,100 | 105,395 |
| Asahi Holdings, Inc. | 19,600 | 249,965 |
| Asahi Intecc Co., Ltd. | 11,100 | 189,090 |
| Asanuma Corp. | 9,600 | 176,614 |
| Asics Corp. | 39,600 | 606,820 |
| ASKUL Corp. | 15,900 | 166,055 |
| Autobacs Seven Co., Ltd. | 42,200 | 401,390 |
| Avex, Inc. | 20,600 | 230,916 |
| Axial Retailing, Inc. | 14,500 | 330,197 |
| Azbil Corp. | 25,500 | 692,980 |
| BayCurrent Consulting, Inc. | 3,000 | 84,172 |
| Belc Co., Ltd. | 5,600 | 214,216 |
| Bell System24 Holdings, Inc. | 9,400 | 87,318 |
| Belluna Co., Ltd. | 37,300 | 179,756 |
| Benesse Holdings, Inc. | 33,600 | 495,683 |
| BIPROGY, Inc. | 22,100 | 477,390 |
| BML, Inc. | 7,300 | 165,020 |
| Bunka Shutter Co., Ltd. | 36,300 | 261,003 |
| Calbee, Inc. | 27,900 | 560,428 |
| Canon Electronics, Inc. | 12,500 | 131,986 |
| Canon Marketing Japan, Inc. | 28,900 | 609,848 |
| Capcom Co., Ltd. | 13,000 | 361,594 |
| Cawachi Ltd. | 15,700 | 217,287 |
| Central Glass Co., Ltd. | 29,300 | 691,850 |
| Chudenko Corp. | 16,500 | 227,740 |
| Chugin Financial Group, Inc. | 47,000 | 283,315 |
| Chugoku Marine Paints Ltd. | 25,800 | 158,443 |
| Citizen Watch Co., Ltd. | 178,500 | 749,648 |
| CKD Corp. | 20,900 | 256,325 |
| CMK Corp. | 27,700 | 99,702 |
| Colowide Co., Ltd. | 11,300 | 138,663 |
| Comforia Residential REIT, Inc. | 39 | 82,795 |
| Cosmos Pharmaceutical Corp. | 5,070 | 490,344 |
| Create SD Holdings Co., Ltd. | 10,100 | 215,162 |
| Credit Saison Co., Ltd. | 72,700 | 777,044 |
| CyberAgent, Inc. | 53,500 | 439,512 |
| Daihen Corp. | 8,700 | 224,345 |
| Daiho Corp. | 8,700 | 246,716 |
| Daiichikosho Co., Ltd. | 16,700 | 478,834 |
| Daiken Corp. | 9,800 | 131,215 |
| Daiki Aluminium Industry Co., Ltd. | 14,400 | 123,992 |
| Daikokutenbussan Co., Ltd. | 2,800 | 85,404 |
| Daio Paper Corp. | 40,000 | 295,119 |
| Daiseki Co., Ltd. | 6,460 | 199,610 |
| Daishi Hokuetsu Financial Group, Inc. | 12,300 | 217,232 |
| Daito Pharmaceutical Co., Ltd. | 5,000 | 85,998 |
| Daiwa House REIT Investment Corp. | 132 | 266,415 |
| Daiwa Office Investment Corp. | 21 | 99,210 |
| Daiwa Securities Living Investments Corp. | 131 | 101,685 |
| DCM Holdings Co., Ltd. | 73,900 | 575,807 |
| Dena Co., Ltd. | 26,086 | 340,226 |
| Descente Ltd. | 7,852 | 188,456 |
| Dexerials Corp. | 6,600 | 153,719 |
| Disco Corp. | 2,975 | 711,562 |
| DMG Mori Co., Ltd. | 36,100 | 417,772 |
| Doshisha Co., Ltd. | 18,000 | 182,962 |
| Doutor Nichires Holdings Co., Ltd. | 22,600 | 252,129 |
| DTS Corp. | 11,400 | 271,031 |
| Duskin Co., Ltd. | 20,900 | 400,768 |
| DyDo Group Holdings, Inc. | 5,500 | 167,828 |
| Eagle Industry Co., Ltd. | 26,300 | 195,060 |
| Earth Corp. | 5,500 | 190,375 |
| Eizo Corp. | 8,850 | 215,290 |
| Elecom Co., Ltd. | 14,527 | 134,576 |
| en-japan, Inc. | 6,000 | 104,226 |
| SECURITY | NUMBER OF SHARES | VALUE ($) |
| ESPEC Corp. | 6,600 | 84,636 |
| Exedy Corp. | 42,800 | 501,762 |
| Ezaki Glico Co., Ltd. | 25,700 | 578,198 |
| Fancl Corp. | 11,100 | 210,291 |
| FCC Co., Ltd. | 36,400 | 353,915 |
| Food & Life Cos., Ltd. | 13,800 | 232,130 |
| Foster Electric Co., Ltd. | 52,998 | 276,960 |
| FP Corp. | 12,460 | 296,430 |
| Frontier Real Estate Investment Corp. | 36 | 127,097 |
| Fudo Tetra Corp. | 8,577 | 85,181 |
| Fuji Co., Ltd. | 19,100 | 236,213 |
| Fuji Corp. | 29,838 | 393,986 |
| Fuji Media Holdings, Inc. | 37,100 | 258,034 |
| Fuji Oil Co., Ltd. | 61,000 | 124,399 |
| Fuji Oil Holdings, Inc. | 25,500 | 401,464 |
| Fuji Seal International, Inc. | 25,900 | 303,415 |
| Fuji Soft, Inc. | 6,200 | 337,294 |
| Fujibo Holdings, Inc. | 5,100 | 115,481 |
| Fujimi, Inc. | 2,000 | 83,502 |
| Fujimori Kogyo Co., Ltd. | 9,300 | 194,264 |
| Fujitec Co., Ltd. | 21,600 | 429,049 |
| Fujitsu General Ltd. | 17,510 | 399,613 |
| Fukuoka Financial Group, Inc. | 41,500 | 706,148 |
| Fukuoka REIT Corp. | 93 | 108,557 |
| Fukuyama Transporting Co., Ltd. | 15,699 | 342,530 |
| Furukawa Co., Ltd. | 28,300 | 248,143 |
| Furuno Electric Co., Ltd. | 18,400 | 132,697 |
| Fuso Chemical Co., Ltd. | 3,300 | 74,540 |
| Futaba Corp. | 26,000 | 105,205 |
| Futaba Industrial Co., Ltd. | 144,700 | 363,196 |
| Fuyo General Lease Co., Ltd. | 4,045 | 224,806 |
| Gakken Holdings Co., Ltd. | 13,500 | 89,020 |
| Geo Holdings Corp. | 40,700 | 532,506 |
| GLOBERIDE, Inc. | 5,500 | 85,965 |
| Glory Ltd. | 40,400 | 622,913 |
| GLP J-REIT | 216 | 224,010 |
| GMO internet group, Inc. | 8,900 | 153,444 |
| Godo Steel Ltd. | 13,800 | 158,527 |
| Goldwin, Inc. | 3,800 | 198,449 |
| Gree, Inc. | 18,200 | 102,303 |
| GungHo Online Entertainment, Inc. | 14,350 | 212,109 |
| Gunze Ltd. | 12,800 | 328,792 |
| H.I.S. Co., Ltd. * | 16,300 | 225,838 |
| H.U. Group Holdings, Inc. | 27,500 | 511,907 |
| Hakuto Co., Ltd. | 4,600 | 118,498 |
| Hamakyorex Co., Ltd. | 10,800 | 241,243 |
| Hamamatsu Photonics K.K. | 11,900 | 538,371 |
| Hazama Ando Corp. | 123,300 | 714,601 |
| Heiwa Corp. | 22,600 | 364,609 |
| Heiwa Real Estate Co., Ltd. | 6,000 | 166,372 |
| Heiwado Co., Ltd. | 32,500 | 411,280 |
| Hikari Tsushin, Inc. | 5,050 | 610,012 |
| Hirata Corp. | 4,300 | 125,790 |
| Hirose Electric Co., Ltd. | 5,039 | 653,666 |
| Hisamitsu Pharmaceutical Co., Inc. | 21,300 | 525,507 |
| Hitachi Transport System Ltd. * | 9,300 | 556,568 |
| Hitachi Zosen Corp. | 87,100 | 502,132 |
| Hogy Medical Co., Ltd. | 5,800 | 128,638 |
| Hokuetsu Corp. | 93,000 | 482,434 |
| Hokuhoku Financial Group, Inc. | 70,800 | 425,349 |
| Hokuto Corp. | 7,100 | 91,644 |
| Horiba Ltd. | 12,100 | 496,433 |
| Hoshizaki Corp. | 22,900 | 656,084 |
| Hosiden Corp. | 50,400 | 531,612 |
| Hosokawa Micron Corp. | 5,200 | 94,355 |
| House Foods Group, Inc. | 29,700 | 555,460 |
| Hulic Co., Ltd. | 78,500 | 570,251 |
| Hulic REIT, Inc. | 93 | 108,944 |
| SECURITY | NUMBER OF SHARES | VALUE ($) |
| Ibiden Co., Ltd. | 18,700 | 630,327 |
| Ichikoh Industries Ltd. | 48,100 | 137,331 |
| Idec Corp. | 4,900 | 104,952 |
| IDOM, Inc. | 28,800 | 144,176 |
| Iino Kaiun Kaisha Ltd. | 35,500 | 176,673 |
| Inaba Denki Sangyo Co., Ltd. | 34,200 | 638,405 |
| Inabata & Co., Ltd. | 43,400 | 717,028 |
| Industrial & Infrastructure Fund Investment Corp. | 94 | 99,277 |
| Ines Corp. | 7,800 | 79,351 |
| INFRONEER Holdings, Inc. | 88,586 | 614,106 |
| Intage Holdings, Inc. | 7,700 | 84,718 |
| Internet Initiative Japan, Inc. | 17,200 | 269,979 |
| Invincible Investment Corp. | 415 | 130,274 |
| Iriso Electronics Co., Ltd. | 5,500 | 159,346 |
| Iseki & Co., Ltd. | 12,865 | 106,292 |
| Ishihara Sangyo Kaisha Ltd. | 27,700 | 190,779 |
| Ito En Ltd. | 11,700 | 412,078 |
| Itochu Enex Co., Ltd. | 60,700 | 417,716 |
| Itochu Techno-Solutions Corp. | 22,100 | 512,361 |
| Iyogin Holdings, Inc. | 73,300 | 343,909 |
| Izumi Co., Ltd. | 34,700 | 700,005 |
| Jaccs Co., Ltd. | 11,900 | 288,565 |
| JAFCO Group Co., Ltd. | 18,000 | 276,179 |
| Japan Airport Terminal Co., Ltd. * | 6,100 | 261,085 |
| Japan Aviation Electronics Industry Ltd. | 26,000 | 404,661 |
| Japan Display, Inc. * | 465,500 | 155,866 |
| Japan Excellent, Inc. | 163 | 150,734 |
| Japan Hotel REIT Investment Corp. | 344 | 181,239 |
| Japan Lifeline Co., Ltd. | 21,800 | 147,004 |
| Japan Logistics Fund, Inc. | 52 | 111,409 |
| Japan Metropolitan Fund Invest | 661 | 486,978 |
| Japan Petroleum Exploration Co., Ltd. | 19,200 | 498,872 |
| Japan Post Bank Co., Ltd. | 91,200 | 607,677 |
| Japan Prime Realty Investment Corp. | 83 | 225,415 |
| Japan Real Estate Investment Corp. | 113 | 473,502 |
| JEOL Ltd. | 3,400 | 124,417 |
| JM Holdings Co., Ltd. | 7,960 | 90,712 |
| Joshin Denki Co., Ltd. | 33,200 | 427,354 |
| Joyful Honda Co., Ltd. | 37,800 | 460,755 |
| Juki Corp. | 29,900 | 146,743 |
| JVCKenwood Corp. | 279,500 | 405,777 |
| Kadokawa Corp. | 11,800 | 211,272 |
| Kaga Electronics Co., Ltd. | 12,000 | 355,642 |
| Kagome Co., Ltd. | 19,200 | 383,747 |
| Kakaku.com, Inc. | 13,900 | 235,091 |
| Kaken Pharmaceutical Co., Ltd. | 13,782 | 352,754 |
| Kamigumi Co., Ltd. | 45,600 | 867,161 |
| Kanamoto Co., Ltd. | 26,800 | 386,885 |
| Kandenko Co., Ltd. | 101,600 | 571,088 |
| Kansai Paint Co., Ltd. | 51,160 | 667,597 |
| Kanto Denka Kogyo Co., Ltd. | 19,600 | 125,027 |
| Katitas Co., Ltd. | 4,261 | 95,351 |
| Kato Sangyo Co., Ltd. | 26,700 | 624,043 |
| Kawasaki Kisen Kaisha Ltd. | 31,800 | 482,190 |
| Keihan Holdings Co., Ltd. | 28,800 | 740,931 |
| Keikyu Corp. | 71,000 | 728,824 |
| Keisei Electric Railway Co., Ltd. | 23,700 | 629,047 |
| Keiyo Co., Ltd. | 21,800 | 132,819 |
| Kenedix Office Investment Corp. | 78 | 177,684 |
| Kenedix Residential Next Investment Corp. | 60 | 87,964 |
| Kenedix Retail REIT Corp. | 48 | 86,288 |
| KFC Holdings Japan Ltd. | 4,600 | 86,093 |
| KH Neochem Co., Ltd. | 11,300 | 192,873 |
| Kissei Pharmaceutical Co., Ltd. | 9,600 | 169,578 |
| Kitz Corp. | 59,100 | 350,365 |
| Koa Corp. | 7,500 | 108,018 |
| SECURITY | NUMBER OF SHARES | VALUE ($) |
| Kobayashi Pharmaceutical Co., Ltd. | 7,400 | 392,694 |
| Koei Tecmo Holdings Co., Ltd. | 9,160 | 138,215 |
| Kohnan Shoji Co., Ltd. | 16,500 | 345,478 |
| Kojima Co., Ltd. | 19,100 | 79,077 |
| Kokusai Pulp & Paper Co., Ltd. | 39,700 | 216,729 |
| Kokuyo Co., Ltd. | 45,800 | 568,080 |
| Komeri Co., Ltd. | 21,900 | 382,066 |
| Konami Group Corp. | 13,400 | 587,339 |
| Kose Corp. | 5,800 | 578,959 |
| Kumagai Gumi Co., Ltd. | 28,800 | 486,872 |
| Kumiai Chemical Industry Co., Ltd. | 27,500 | 180,733 |
| Kura Sushi, Inc. | 6,000 | 140,352 |
| Kureha Corp. | 6,900 | 443,046 |
| Kusuri no Aoki Holdings Co., Ltd. | 4,900 | 236,194 |
| KYB Corp. | 13,900 | 304,075 |
| Kyoei Steel Ltd. | 24,900 | 219,865 |
| Kyokuto Kaihatsu Kogyo Co., Ltd. | 18,100 | 168,193 |
| KYORIN Holdings, Inc. | 19,700 | 243,766 |
| Kyoritsu Maintenance Co., Ltd. | 5,100 | 210,099 |
| Kyowa Kirin Co., Ltd. | 34,900 | 821,954 |
| Kyudenko Corp. | 26,400 | 559,955 |
| Kyushu Financial Group, Inc. | 115,500 | 292,057 |
| Lawson, Inc. | 19,383 | 619,229 |
| Life Corp. | 16,900 | 251,894 |
| Lintec Corp. | 28,900 | 433,604 |
| M3, Inc. | 11,300 | 336,742 |
| Mabuchi Motor Co., Ltd. | 19,800 | 537,261 |
| Macnica Holdings, Inc. | 34,800 | 696,037 |
| Makino Milling Machine Co., Ltd. | 12,650 | 390,867 |
| Mandom Corp. | 20,000 | 202,338 |
| Maruha Nichiro Corp. | 39,200 | 604,455 |
| Marui Group Co., Ltd. | 38,900 | 636,419 |
| Maruichi Steel Tube Ltd. | 21,800 | 411,490 |
| Maruwa Co., Ltd. | 900 | 105,743 |
| Matsuda Sangyo Co., Ltd. | 8,800 | 131,281 |
| Max Co., Ltd. | 15,500 | 220,902 |
| Maxell Holdings Ltd. | 29,400 | 243,901 |
| MCJ Co., Ltd. | 32,100 | 202,723 |
| Mebuki Financial Group, Inc. | 318,276 | 618,946 |
| Megachips Corp. | 4,300 | 73,605 |
| Megmilk Snow Brand Co., Ltd. | 53,000 | 577,187 |
| Meidensha Corp. | 22,800 | 303,338 |
| Meiko Electronics Co., Ltd. | 4,200 | 74,456 |
| Meitec Corp. | 16,800 | 282,976 |
| Menicon Co., Ltd. | 6,400 | 109,273 |
| METAWATER Co., Ltd. | 6,500 | 83,184 |
| Mimasu Semiconductor Industry Co., Ltd. | 5,700 | 88,146 |
| MIRAIT ONE Corp. | 56,800 | 545,827 |
| Mitsuba Corp. | 66,500 | 175,566 |
| Mitsubishi HC Capital, Inc. | 112,300 | 481,886 |
| Mitsubishi Logisnext Co., Ltd. | 40,200 | 207,174 |
| Mitsubishi Logistics Corp. | 22,300 | 489,337 |
| Mitsui E&S Holdings Co., Ltd. * | 70,900 | 198,918 |
| Mitsui High-Tec, Inc. | 1,270 | 65,649 |
| Mitsui Matsushima Holdings Co., Ltd. | 5,600 | 90,261 |
| Mitsui-Soko Holdings Co., Ltd. | 14,400 | 300,186 |
| Miura Co., Ltd. | 16,400 | 333,993 |
| Mixi, Inc. | 31,100 | 487,555 |
| Mizuho Leasing Co., Ltd. | 8,700 | 189,559 |
| Mizuno Corp. | 18,200 | 311,582 |
| Mochida Pharmaceutical Co., Ltd. | 7,400 | 170,404 |
| Monex Group, Inc. | 23,700 | 82,329 |
| MonotaRO Co., Ltd. | 10,400 | 157,870 |
| Mori Hills Reit Investment Corp. | 98 | 107,347 |
| Mori Trust Sogo REIT, Inc. | 103 | 102,785 |
| Morinaga & Co., Ltd. | 16,000 | 400,195 |
| MOS Food Services, Inc. | 6,900 | 146,382 |
| Musashi Seimitsu Industry Co., Ltd. | 27,500 | 317,384 |
| SECURITY | NUMBER OF SHARES | VALUE ($) |
| Nabtesco Corp. | 34,300 | 728,546 |
| Nachi-Fujikoshi Corp. | 14,000 | 366,753 |
| Namura Shipbuilding Co., Ltd. * | 33,100 | 121,472 |
| Nankai Electric Railway Co., Ltd. | 34,800 | 703,981 |
| NEC Networks & System Integration Corp. | 20,500 | 219,679 |
| NET One Systems Co., Ltd. | 18,548 | 380,951 |
| Nexon Co., Ltd. | 34,422 | 576,025 |
| Nichias Corp. | 30,000 | 462,842 |
| Nichicon Corp. | 23,700 | 223,108 |
| Nichiha Corp. | 16,500 | 312,452 |
| Nichi-iko Pharmaceutical Co., Ltd. * | 69,772 | 218,661 |
| Nichireki Co., Ltd. | 16,000 | 140,429 |
| Nifco, Inc. | 29,700 | 689,766 |
| Nihon Chouzai Co., Ltd. | 10,572 | 93,877 |
| Nihon Kohden Corp. | 22,700 | 508,301 |
| Nihon M&A Center Holdings, Inc. | 13,300 | 150,075 |
| Nihon Parkerizing Co., Ltd. | 47,300 | 307,483 |
| Nikkiso Co., Ltd. | 39,700 | 264,557 |
| Nikkon Holdings Co., Ltd. | 32,900 | 513,955 |
| Nippn Corp. | 39,600 | 416,829 |
| Nippon Accommodations Fund, Inc. | 31 | 132,008 |
| Nippon Building Fund, Inc. | 113 | 502,312 |
| Nippon Carbon Co., Ltd. | 3,200 | 90,584 |
| Nippon Chemi-Con Corp. * | 13,900 | 174,820 |
| Nippon Coke & Engineering Co., Ltd. | 99,716 | 54,261 |
| Nippon Denko Co., Ltd. | 55,700 | 127,085 |
| Nippon Densetsu Kogyo Co., Ltd. | 25,100 | 280,822 |
| Nippon Gas Co., Ltd. | 27,200 | 395,134 |
| Nippon Kanzai Co., Ltd. | 4,600 | 78,197 |
| Nippon Kayaku Co., Ltd. | 77,400 | 614,796 |
| Nippon Paint Holdings Co., Ltd. | 71,101 | 453,128 |
| Nippon Prologis REIT, Inc. | 101 | 211,928 |
| NIPPON REIT Investment Corp. | 42 | 103,683 |
| Nippon Sanso Holdings Corp. | 30,900 | 491,972 |
| Nippon Sheet Glass Co., Ltd. * | 136,300 | 508,345 |
| Nippon Shinyaku Co., Ltd. | 6,800 | 376,490 |
| Nippon Shokubai Co., Ltd. | 21,146 | 758,523 |
| Nippon Signal Co., Ltd. | 34,400 | 233,170 |
| Nippon Soda Co., Ltd. | 14,300 | 426,609 |
| Nippon Television Holdings, Inc. | 12,700 | 94,708 |
| Nippon Thompson Co., Ltd. | 30,200 | 107,711 |
| Nippon Yakin Kogyo Co., Ltd. | 11,110 | 211,201 |
| Nipro Corp. | 69,200 | 521,649 |
| Nishimatsu Construction Co., Ltd. | 15,200 | 370,073 |
| Nishimatsuya Chain Co., Ltd. | 19,900 | 182,432 |
| Nishi-Nippon Financial Holdings, Inc. | 64,200 | 327,433 |
| Nishi-Nippon Railroad Co., Ltd. | 28,900 | 566,837 |
| Nishio Rent All Co., Ltd. | 13,000 | 261,382 |
| Nissha Co., Ltd. | 22,300 | 262,546 |
| Nisshinbo Holdings, Inc. | 100,600 | 697,337 |
| Nissin Electric Co., Ltd. | 17,000 | 157,796 |
| Nitta Corp. | 8,100 | 157,170 |
| Nittetsu Mining Co., Ltd. | 10,400 | 206,909 |
| Nitto Boseki Co., Ltd. | 9,600 | 142,291 |
| Nitto Kogyo Corp. | 17,400 | 287,975 |
| Noevir Holdings Co., Ltd. | 3,200 | 118,291 |
| NOF Corp. | 16,400 | 564,102 |
| Nohmi Bosai Ltd. | 8,600 | 92,770 |
| Nojima Corp. | 56,200 | 468,053 |
| Nomura Co., Ltd. | 28,500 | 208,175 |
| Nomura Real Estate Master Fund, Inc. | 465 | 530,487 |
| Nomura Research Institute Ltd. | 27,580 | 610,351 |
| Noritake Co., Ltd. | 7,300 | 202,652 |
| Noritz Corp. | 21,000 | 215,555 |
| North Pacific Bank Ltd. | 103,600 | 164,564 |
| NS Solutions Corp. | 9,700 | 222,946 |
| NS United Kaiun Kaisha Ltd. | 3,400 | 84,620 |
| NSD Co., Ltd. | 12,500 | 213,607 |
| SECURITY | NUMBER OF SHARES | VALUE ($) |
| NTN Corp. | 439,803 | 782,905 |
| NTT UD REIT Investment Corp. | 121 | 118,539 |
| Obic Co., Ltd. | 2,900 | 435,182 |
| Ohsho Food Service Corp. | 2,700 | 115,123 |
| Okamura Corp. | 50,300 | 463,021 |
| Okasan Securities Group, Inc. | 60,300 | 143,430 |
| Oki Electric Industry Co., Ltd. | 100,900 | 500,201 |
| OKUMA Corp. | 14,800 | 495,426 |
| Okumura Corp. | 23,500 | 444,381 |
| Okuwa Co., Ltd. | 47,800 | 295,555 |
| Onoken Co., Ltd. | 21,000 | 203,095 |
| Onward Holdings Co., Ltd. | 125,700 | 261,940 |
| Open House Group Co., Ltd. | 12,500 | 444,617 |
| Optex Group Co., Ltd. | 6,800 | 93,614 |
| Oracle Corp. Japan | 5,600 | 298,320 |
| Organo Corp. | 6,800 | 117,324 |
| Orient Corp. | 27,260 | 220,802 |
| Orix JREIT, Inc. | 253 | 339,429 |
| Osaka Soda Co., Ltd. | 10,100 | 245,469 |
| OSG Corp. | 30,200 | 383,941 |
| Outsourcing, Inc. | 29,800 | 232,145 |
| Oyo Corp. | 7,100 | 107,790 |
| Pacific Industrial Co., Ltd. | 36,800 | 259,200 |
| PAL GROUP Holdings Co., Ltd. | 7,300 | 104,239 |
| Paramount Bed Holdings Co., Ltd. | 14,300 | 254,566 |
| Park24 Co., Ltd. * | 33,100 | 441,155 |
| Pasona Group, Inc. | 8,500 | 116,922 |
| Pigeon Corp. | 27,000 | 353,675 |
| Pilot Corp. | 10,900 | 423,784 |
| Plenus Co., Ltd. | 14,100 | 249,774 |
| Pola Orbis Holdings, Inc. | 29,200 | 322,519 |
| Press Kogyo Co., Ltd. | 133,400 | 373,065 |
| Pressance Corp. | 7,800 | 80,015 |
| Prima Meat Packers Ltd. | 27,600 | 365,234 |
| Qol Holdings Co., Ltd. | 18,300 | 150,970 |
| Raito Kogyo Co., Ltd. | 19,000 | 259,189 |
| Rakuten Group, Inc. | 130,583 | 582,970 |
| Relia, Inc. | 26,000 | 174,476 |
| Relo Group, Inc. | 17,300 | 243,832 |
| Resorttrust, Inc. | 16,888 | 259,931 |
| Restar Holdings Corp. | 21,900 | 310,596 |
| Retail Partners Co., Ltd. | 39,800 | 327,896 |
| Riken Corp. | 10,300 | 156,978 |
| Riso Kagaku Corp. | 6,300 | 100,071 |
| Rock Field Co., Ltd. | 7,800 | 75,722 |
| Rohto Pharmaceutical Co., Ltd. | 18,900 | 587,942 |
| Roland DG Corp. | 3,900 | 83,596 |
| Round One Corp. | 51,100 | 217,426 |
| Royal Holdings Co., Ltd. * | 10,100 | 161,514 |
| Ryobi Ltd. | 51,400 | 455,697 |
| Ryoyo Electro Corp. | 10,600 | 163,462 |
| S Foods, Inc. | 15,400 | 281,884 |
| Saizeriya Co., Ltd. | 10,900 | 203,362 |
| Sakai Chemical Industry Co., Ltd. | 10,800 | 142,707 |
| Sakai Moving Service Co., Ltd. | 3,200 | 101,148 |
| Sakata INX Corp. | 35,200 | 251,898 |
| Sakata Seed Corp. | 5,900 | 194,463 |
| SAMTY Co., Ltd. | 7,800 | 123,274 |
| San-A Co., Ltd. | 10,700 | 312,080 |
| Sangetsu Corp. | 32,000 | 338,835 |
| Sanken Electric Co., Ltd. | 6,600 | 226,078 |
| Sanki Engineering Co., Ltd. | 32,900 | 356,140 |
| Sankyo Co., Ltd. | 12,100 | 399,564 |
| Sanoh Industrial Co., Ltd. | 24,052 | 109,691 |
| Sanrio Co., Ltd. | 6,068 | 161,804 |
| Sanyo Chemical Industries Ltd. | 6,850 | 194,007 |
| Sanyo Denki Co., Ltd. | 4,200 | 153,738 |
| Sanyo Special Steel Co., Ltd. | 13,100 | 168,086 |
| SECURITY | NUMBER OF SHARES | VALUE ($) |
| Sapporo Holdings Ltd. | 30,800 | 679,349 |
| Sato Holdings Corp. | 13,400 | 165,306 |
| SBS Holdings, Inc. | 3,900 | 75,936 |
| SCREEN Holdings Co., Ltd. | 8,300 | 455,561 |
| SCSK Corp. | 30,728 | 453,344 |
| Seibu Holdings, Inc. | 79,355 | 710,324 |
| Seiko Holdings Corp. | 15,900 | 336,780 |
| Seiren Co., Ltd. | 15,600 | 244,344 |
| Sekisui House REIT, Inc. | 260 | 140,100 |
| Sekisui Jushi Corp. | 14,400 | 164,886 |
| Senko Group Holdings Co., Ltd. | 82,800 | 553,096 |
| Senshu Ikeda Holdings, Inc. | 117,600 | 168,539 |
| Seven Bank Ltd. | 209,400 | 377,715 |
| Sharp Corp. | 86,503 | 518,852 |
| Shibaura Machine Co., Ltd. | 9,700 | 188,300 |
| Shima Seiki Manufacturing Ltd. | 11,600 | 161,840 |
| Shindengen Electric Manufacturing Co., Ltd. | 5,800 | 143,240 |
| Shin-Etsu Polymer Co., Ltd. | 11,400 | 95,020 |
| Shinko Electric Industries Co., Ltd. | 8,000 | 192,250 |
| Shinmaywa Industries Ltd. | 50,100 | 341,665 |
| Shinsei Bank Ltd. | 16,131 | 240,040 |
| Ship Healthcare Holdings, Inc. | 30,800 | 590,709 |
| Shizuoka Financial Group, Inc. | 109,300 | 690,210 |
| Shizuoka Gas Co., Ltd. | 36,900 | 270,290 |
| SHO-BOND Holdings Co., Ltd. | 5,600 | 242,256 |
| Shochiku Co., Ltd. | 1,550 | 123,037 |
| Shoei Foods Corp. | 5,800 | 160,067 |
| Showa Sangyo Co., Ltd. | 20,700 | 351,833 |
| Siix Corp. | 31,900 | 245,945 |
| Sinfonia Technology Co., Ltd. | 12,100 | 110,084 |
| SKY Perfect JSAT Holdings, Inc. | 83,900 | 293,862 |
| Skylark Holdings Co., Ltd. * | 64,500 | 688,051 |
| Sodick Co., Ltd. | 25,500 | 132,533 |
| Sotetsu Holdings, Inc. | 28,600 | 433,123 |
| Square Enix Holdings Co., Ltd. | 15,000 | 669,330 |
| St Marc Holdings Co., Ltd. | 12,900 | 140,777 |
| Star Micronics Co., Ltd. | 16,000 | 183,280 |
| Starts Corp., Inc. | 14,100 | 249,055 |
| Sugi Holdings Co., Ltd. | 15,500 | 621,629 |
| Sumida Corp. | 14,226 | 94,098 |
| Sumitomo Bakelite Co., Ltd. | 12,000 | 324,795 |
| Sumitomo Mitsui Construction Co., Ltd. | 181,680 | 533,721 |
| Sumitomo Osaka Cement Co., Ltd. | 29,600 | 630,208 |
| Sumitomo Pharma Co., Ltd. | 68,031 | 473,898 |
| Sumitomo Riko Co., Ltd. | 52,455 | 206,840 |
| Sun Frontier Fudousan Co., Ltd. | 10,800 | 83,387 |
| Suruga Bank Ltd. | 116,900 | 309,660 |
| SWCC Showa Holdings Co., Ltd. | 13,400 | 160,972 |
| Systena Corp. | 27,400 | 76,799 |
| T RAD Co., Ltd. | 6,800 | 124,186 |
| Tachi-S Co., Ltd. | 34,900 | 258,789 |
| Tadano Ltd. | 58,700 | 358,815 |
| Taiho Kogyo Co., Ltd. | 20,300 | 94,357 |
| Taikisha Ltd. | 18,200 | 429,409 |
| Taisho Pharmaceutical Holdings Co., Ltd. | 16,400 | 591,516 |
| Taiyo Holdings Co., Ltd. | 6,600 | 116,400 |
| Takamatsu Construction Group Co., Ltd. | 10,800 | 140,833 |
| Takaoka Toko Co., Ltd. | 7,700 | 95,035 |
| Takara Holdings, Inc. | 70,963 | 493,612 |
| Takara Leben Co., Ltd. | 69,100 | 185,762 |
| Takara Standard Co., Ltd. | 37,300 | 320,290 |
| Takasago Thermal Engineering Co., Ltd. | 41,400 | 503,633 |
| Takeuchi Manufacturing Co., Ltd. | 15,000 | 302,505 |
| Takuma Co., Ltd. | 26,600 | 220,840 |
| Tamura Corp. | 37,500 | 186,536 |
| Tanseisha Co., Ltd. | 23,800 | 128,278 |
| TBS Holdings, Inc. | 17,300 | 179,209 |
| SECURITY | NUMBER OF SHARES | VALUE ($) |
| TechnoPro Holdings, Inc. | 13,300 | 319,072 |
| T-Gaia Corp. | 18,500 | 205,924 |
| The 77 Bank Ltd. | 22,600 | 273,869 |
| The Awa Bank Ltd. | 10,900 | 137,022 |
| The Bank of Kyoto Ltd. | 9,300 | 335,133 |
| The Chiba Bank Ltd. | 128,700 | 705,163 |
| The Gunma Bank Ltd. | 162,400 | 442,940 |
| The Hachijuni Bank Ltd. | 133,800 | 426,709 |
| The Hyakugo Bank Ltd. | 60,600 | 134,143 |
| The Hyakujushi Bank Ltd. | 8,600 | 96,416 |
| The Japan Steel Works Ltd. | 18,300 | 377,867 |
| The Japan Wool Textile Co., Ltd. | 35,100 | 235,307 |
| The Keiyo Bank Ltd. | 41,100 | 144,365 |
| The Kiyo Bank Ltd. | 17,900 | 172,377 |
| The Musashino Bank Ltd. | 13,000 | 150,124 |
| The Nanto Bank Ltd. | 11,600 | 166,221 |
| The Nisshin Oillio Group Ltd. | 21,700 | 465,265 |
| The Ogaki Kyoritsu Bank Ltd. | 13,200 | 155,830 |
| The Okinawa Electric Power Co., Inc. | 45,482 | 315,640 |
| The San-in Godo Bank Ltd. | 49,500 | 235,733 |
| The Shiga Bank Ltd. | 12,300 | 208,221 |
| The Sumitomo Warehouse Co., Ltd. | 20,400 | 276,883 |
| THK Co., Ltd. | 38,500 | 671,435 |
| TKC Corp. | 5,900 | 150,609 |
| Toa Corp. | 10,300 | 168,399 |
| Toagosei Co., Ltd. | 70,700 | 543,205 |
| Tocalo Co., Ltd. | 14,100 | 112,653 |
| Toda Corp. | 131,200 | 655,772 |
| Toei Co., Ltd. | 1,400 | 171,964 |
| Toho Co., Ltd. | 18,500 | 657,831 |
| Toho Zinc Co., Ltd. | 10,700 | 153,058 |
| Tokai Carbon Co., Ltd. | 72,100 | 470,518 |
| TOKAI Holdings Corp. | 64,400 | 384,615 |
| Tokai Rika Co., Ltd. | 65,469 | 683,201 |
| Tokai Tokyo Financial Holdings, Inc. | 58,200 | 133,414 |
| Token Corp. | 5,650 | 297,837 |
| Tokyo Century Corp. | 14,200 | 484,325 |
| Tokyo Ohka Kogyo Co., Ltd. | 6,800 | 293,159 |
| Tokyo Seimitsu Co., Ltd. | 10,600 | 318,791 |
| Tokyo Steel Manufacturing Co., Ltd. | 30,200 | 259,288 |
| Tokyo Tatemono Co., Ltd. | 56,700 | 779,757 |
| Tokyo Tekko Co., Ltd. | 12,900 | 116,268 |
| Tokyu Construction Co., Ltd. | 76,600 | 321,466 |
| Tokyu REIT, Inc. | 76 | 108,250 |
| Tomy Co., Ltd. | 44,700 | 392,504 |
| Topcon Corp. | 26,400 | 288,772 |
| Topre Corp. | 58,700 | 464,149 |
| Toshiba TEC Corp. | 10,200 | 264,071 |
| Totetsu Kogyo Co., Ltd. | 19,600 | 325,386 |
| Towa Pharmaceutical Co., Ltd. | 9,500 | 142,993 |
| Toyo Construction Co., Ltd. | 46,900 | 283,386 |
| Toyo Ink SC Holdings Co., Ltd. | 33,400 | 430,053 |
| Toyo Tire Corp. | 60,500 | 709,754 |
| Toyobo Co., Ltd. | 87,300 | 609,810 |
| Toyota Boshoku Corp. | 52,900 | 673,130 |
| TPR Co., Ltd. | 39,600 | 332,413 |
| Trancom Co., Ltd. | 4,100 | 210,073 |
| Transcosmos, Inc. | 12,600 | 289,665 |
| Trend Micro, Inc. | 14,900 | 751,310 |
| Trusco Nakayama Corp. | 21,200 | 283,965 |
| TSI Holdings Co., Ltd. | 115,400 | 349,247 |
| Tsubaki Nakashima Co., Ltd. | 21,200 | 175,621 |
| Tsubakimoto Chain Co. | 26,900 | 575,922 |
| Tsugami Corp. | 11,900 | 89,121 |
| Tsumura & Co. | 18,690 | 390,366 |
| TV Asahi Holdings Corp. | 16,490 | 154,460 |
| UACJ Corp. | 28,330 | 402,817 |
| Uchida Yoko Co., Ltd. | 5,300 | 161,691 |
| SECURITY | NUMBER OF SHARES | VALUE ($) |
| Ulvac, Inc. | 14,700 | 579,489 |
| Unipres Corp. | 88,800 | 518,994 |
| United Arrows Ltd. | 22,700 | 308,443 |
| United Super Markets Holdings, Inc. | 76,100 | 535,826 |
| United Urban Investment Corp. | 365 | 386,180 |
| Unitika Ltd. * | 63,386 | 116,656 |
| Ushio, Inc. | 34,200 | 355,146 |
| USS Co., Ltd. | 28,973 | 437,166 |
| UT Group Co., Ltd. | 4,400 | 71,725 |
| V Technology Co., Ltd. | 6,000 | 112,855 |
| Valor Holdings Co., Ltd. | 45,100 | 521,511 |
| Valqua Ltd. | 7,000 | 123,819 |
| VT Holdings Co., Ltd. | 61,400 | 198,923 |
| Wacoal Holdings Corp. | 32,300 | 520,098 |
| Wacom Co., Ltd. | 29,700 | 128,877 |
| Wakita & Co., Ltd. | 27,300 | 215,517 |
| Warabeya Nichiyo Holdings Co., Ltd. | 22,100 | 261,318 |
| Welcia Holdings Co., Ltd. | 29,200 | 610,321 |
| World Co., Ltd. | 20,400 | 191,443 |
| Xebio Holdings Co., Ltd. | 34,909 | 236,761 |
| Yamaguchi Financial Group, Inc. | 78,700 | 414,455 |
| Yamato Kogyo Co., Ltd. | 10,900 | 316,534 |
| Yamazen Corp. | 71,300 | 443,278 |
| Yaoko Co., Ltd. | 8,792 | 382,479 |
| Yellow Hat Ltd. | 20,700 | 248,181 |
| Yodogawa Steel Works Ltd. | 16,600 | 269,849 |
| Yokogawa Bridge Holdings Corp. | 16,900 | 224,594 |
| Yokohama Reito Co., Ltd. | 31,800 | 192,882 |
| Yokowo Co., Ltd. | 6,300 | 85,870 |
| Yondoshi Holdings, Inc. | 11,800 | 135,001 |
| Yoshinoya Holdings Co., Ltd. | 16,700 | 262,472 |
| Yuasa Trading Co., Ltd. | 20,400 | 507,763 |
| Zenkoku Hosho Co., Ltd. | 6,300 | 207,880 |
| Zenrin Co., Ltd. | 16,900 | 99,474 |
| Zensho Holdings Co., Ltd. | 22,100 | 551,557 |
| Zeon Corp. | 67,500 | 568,975 |
| ZERIA Pharmaceutical Co., Ltd. | 10,500 | 156,414 |
| Zojirushi Corp. | 15,400 | 155,280 |
| ZOZO, Inc. | 8,300 | 176,111 |
| 187,105,401 | ||
| Luxembourg 0.0% | ||
| Espirito Santo Financial Group S.A. *(a) | 69,773 | 0 |
| Netherlands 1.4% | ||
| Adyen N.V. * | 237 | 338,341 |
| AMG Advanced Metallurgical Group N.V. | 4,908 | 153,340 |
| Arcadis N.V. | 15,574 | 528,536 |
| ASM International N.V. | 2,196 | 485,798 |
| Basic-Fit N.V. *(b) | 2,622 | 66,038 |
| BE Semiconductor Industries N.V. | 6,970 | 355,224 |
| Corbion N.V. | 12,031 | 320,375 |
| Eurocommercial Properties N.V. CVA | 11,511 | 253,125 |
| Flow Traders | 7,784 | 187,390 |
| ForFarmers N.V. | 49,937 | 135,366 |
| Fugro N.V. * | 28,757 | 373,530 |
| Heijmans N.V. CVA | 13,776 | 139,595 |
| IMCD N.V. | 4,341 | 563,003 |
| Intertrust N.V. * | 17,078 | 336,872 |
| JDE Peet's N.V. | 13,222 | 378,481 |
| Koninklijke BAM Groep N.V. * | 166,001 | 362,284 |
| Koninklijke Vopak N.V. | 21,661 | 442,577 |
| OCI N.V. | 10,874 | 415,908 |
| PostNL N.V. | 175,221 | 274,342 |
| Prosus N.V. * | 4,684 | 202,544 |
| Sligro Food Group N.V. | 20,434 | 296,446 |
| SECURITY | NUMBER OF SHARES | VALUE ($) |
| TKH Group N.V. | 11,542 | 408,151 |
| TomTom N.V. * | 15,303 | 119,624 |
| Van Lanschot Kempen N.V. | 7,218 | 155,778 |
| Wereldhave N.V. | 16,510 | 202,192 |
| 7,494,860 | ||
| New Zealand 1.0% | ||
| Auckland International Airport Ltd. * | 92,781 | 414,770 |
| Chorus Ltd. | 95,460 | 460,853 |
| Contact Energy Ltd. | 179,322 | 786,579 |
| EBOS Group Ltd. | 23,071 | 502,972 |
| Fisher & Paykel Healthcare Corp., Ltd. | 40,881 | 464,613 |
| Freightways Ltd. | 24,166 | 145,207 |
| Genesis Energy Ltd. | 186,903 | 307,352 |
| Infratil Ltd. | 43,067 | 218,684 |
| KMD Brands Ltd. | 142,254 | 89,307 |
| Mainfreight Ltd. | 6,754 | 298,486 |
| Mercury NZ Ltd. | 111,529 | 377,112 |
| Meridian Energy Ltd. | 217,444 | 616,366 |
| Ryman Healthcare Ltd. | 27,584 | 134,342 |
| The a2 Milk Co., Ltd. * | 93,212 | 314,019 |
| 5,130,662 | ||
| Norway 1.9% | ||
| Aker A.S.A., A Shares | 4,081 | 287,970 |
| Aker BP A.S.A. | 45,644 | 1,449,943 |
| Aker Solutions A.S.A. | 69,741 | 266,275 |
| Atea A.S.A. * | 24,671 | 274,527 |
| Austevoll Seafood A.S.A. | 28,643 | 212,245 |
| Bakkafrost P/F | 5,523 | 276,249 |
| Borregaard A.S.A. | 13,331 | 179,239 |
| BW LPG Ltd. | 40,577 | 328,298 |
| BW Offshore Ltd. | 61,647 | 156,638 |
| DNO A.S.A. | 182,652 | 237,581 |
| Elkem A.S.A. * | 92,640 | 307,774 |
| Elmera Group A.S.A. | 54,910 | 89,810 |
| Europris A.S.A. | 40,175 | 239,209 |
| Frontline Ltd. | 37,083 | 463,435 |
| Gjensidige Forsikring A.S.A. | 26,853 | 490,839 |
| Grieg Seafood A.S.A. | 12,350 | 85,524 |
| Kongsberg Automotive A.S.A. * | 652,137 | 171,268 |
| Kongsberg Gruppen A.S.A. | 8,212 | 294,486 |
| Leroy Seafood Group A.S.A. | 56,550 | 260,394 |
| Norske Skog A.S.A. * | 20,507 | 126,411 |
| Odfjell Drilling Ltd. * | 45,628 | 119,241 |
| Odfjell Technology Ltd. * | 6,340 | 13,868 |
| PGS A.S.A. * | 962,189 | 620,072 |
| Salmar A.S.A. | 5,995 | 203,240 |
| Schibsted A.S.A., A Shares | 5,759 | 88,884 |
| Schibsted A.S.A., B Shares | 8,517 | 126,623 |
| SpareBank 1 Nord Norge | 26,855 | 222,833 |
| SpareBank 1 SMN | 27,638 | 298,331 |
| SpareBank 1 SR-Bank A.S.A. | 39,022 | 397,368 |
| Storebrand A.S.A. | 70,262 | 546,593 |
| TGS A.S.A. | 41,880 | 570,189 |
| Tomra Systems A.S.A. | 14,019 | 226,429 |
| Veidekke A.S.A. | 32,772 | 272,582 |
| Wallenius Wilhelmsen A.S.A. | 27,282 | 193,963 |
| XXL A.S.A. | 175,633 | 76,397 |
| 10,174,728 | ||
| Poland 0.9% | ||
| Alior Bank S.A. * | 43,508 | 267,486 |
| Allegro.eu S.A. * | 18,877 | 91,556 |
| Asseco Poland S.A. | 28,728 | 413,337 |
| SECURITY | NUMBER OF SHARES | VALUE ($) |
| Bank Millennium S.A. * | 152,636 | 139,039 |
| CD Projekt S.A. | 3,743 | 99,454 |
| Ciech S.A. * | 14,765 | 103,454 |
| Cyfrowy Polsat S.A. | 112,064 | 419,577 |
| Dino Polska S.A. * | 2,091 | 136,485 |
| Enea S.A. * | 284,291 | 310,296 |
| Eurocash S.A. * | 90,260 | 215,461 |
| Grupa Azoty S.A. * | 29,734 | 203,718 |
| Jastrzebska Spolka Weglowa S.A. * | 34,632 | 300,349 |
| Kernel Holding S.A. | 61,887 | 214,539 |
| KRUK S.A. | 2,073 | 120,716 |
| LPP S.A. | 109 | 188,870 |
| mBank S.A. * | 2,761 | 154,557 |
| Orange Polska S.A. | 357,666 | 450,952 |
| Pepco Group N.V. * | 12,759 | 89,643 |
| Santander Bank Polska S.A. | 6,644 | 352,782 |
| Tauron Polska Energia S.A. * | 1,169,830 | 474,644 |
| 4,746,915 | ||
| Portugal 0.4% | ||
| CTT-Correios de Portugal S.A. | 46,793 | 144,436 |
| EDP Renovaveis S.A. | 12,893 | 271,301 |
| NOS, SGPS S.A. | 115,536 | 452,528 |
| REN - Redes Energeticas Nacionais, SGPS, S.A. | 120,773 | 312,587 |
| Sonae, SGPS, S.A. | 528,286 | 507,363 |
| The Navigator Co., S.A. | 93,886 | 357,692 |
| 2,045,907 | ||
| Republic of Korea 7.4% | ||
| AK Holdings, Inc. | 11,043 | 87,352 |
| AMOREPACIFIC Group | 17,262 | 298,876 |
| Asiana Airlines, Inc. * | 21,196 | 153,726 |
| BGF retail Co., Ltd. | 2,707 | 354,000 |
| BH Co., Ltd. | 5,061 | 85,405 |
| Binggrae Co., Ltd. | 3,739 | 97,866 |
| Celltrion Healthcare Co., Ltd. | 2,004 | 97,502 |
| Celltrion, Inc. | 3,736 | 502,188 |
| Cheil Worldwide, Inc. | 23,855 | 408,762 |
| Chong Kun Dang Pharmaceutical Corp. | 2,390 | 140,779 |
| CJ ENM Co., Ltd. | 5,040 | 259,149 |
| CJ Logistics Corp. * | 4,839 | 298,008 |
| Com2uS Corp. | 2,889 | 143,749 |
| Daehan Flour Mill Co., Ltd. | 1,275 | 115,340 |
| Daesang Corp. | 18,139 | 266,488 |
| Daesang Holdings Co., Ltd. | 15,284 | 75,879 |
| Daewoo Engineering & Construction Co., Ltd. * | 117,340 | 345,558 |
| Daewoo Shipbuilding & Marine Engineering Co., Ltd. * | 33,677 | 431,921 |
| Daou Data Corp. | 12,824 | 139,768 |
| Daou Technology, Inc. | 15,145 | 192,200 |
| DB HiTek Co., Ltd. | 5,831 | 180,493 |
| DGB Financial Group, Inc. | 90,966 | 433,162 |
| DL Holdings Co., Ltd. | 7,093 | 305,658 |
| Dongjin Semichem Co., Ltd. | 3,330 | 70,074 |
| Dongkuk Steel Mill Co., Ltd. | 49,760 | 398,713 |
| Dongwon F&B Co., Ltd. | 901 | 81,553 |
| Dongwon Industries Co., Ltd. | 1,095 | 176,705 |
| Doosan Bobcat, Inc. | 10,128 | 237,694 |
| Doosan Co., Ltd. | 6,262 | 339,267 |
| E1 Corp. | 4,377 | 131,181 |
| Easy Holdings Co., Ltd. | 44,863 | 90,433 |
| Fila Holdings Corp. | 18,392 | 421,228 |
| Gradiant Corp. | 9,417 | 90,092 |
| Green Cross Corp. | 1,046 | 93,428 |
| SECURITY | NUMBER OF SHARES | VALUE ($) |
| Green Cross Holdings Corp. | 8,640 | 105,007 |
| GS Global Corp. * | 77,360 | 146,192 |
| GS Retail Co., Ltd. | 26,933 | 479,582 |
| Halla Holdings Corp. | 5,072 | 112,028 |
| Handsome Co., Ltd. | 7,655 | 134,634 |
| Hanjin Transportation Co., Ltd. | 12,732 | 172,345 |
| Hankook & Co. Co., Ltd. | 8,729 | 78,641 |
| Hanmi Pharm Co., Ltd. | 628 | 111,417 |
| Hanon Systems | 45,233 | 247,167 |
| Hansae Co., Ltd. | 5,993 | 61,897 |
| Hanshin Construction Co., Ltd. | 10,559 | 65,228 |
| Hansol Chemical Co., Ltd. | 789 | 102,477 |
| Hansol Holdings Co., Ltd. | 42,536 | 94,287 |
| Hansol Paper Co., Ltd. | 22,883 | 218,892 |
| Hansol Technics Co., Ltd. * | 24,876 | 90,661 |
| Hanssem Co., Ltd. | 3,543 | 93,009 |
| Hanwha Aerospace Co., Ltd. | 10,807 | 503,298 |
| Hanwha General Insurance Co., Ltd. * | 131,421 | 339,157 |
| Hanwha Life Insurance Co., Ltd. * | 347,570 | 532,127 |
| Harim Holdings Co., Ltd. | 37,557 | 185,315 |
| HDC Holdings Co., Ltd. | 40,784 | 156,225 |
| HDC Hyundai Development Co-Engineering & Construction | 55,676 | 390,222 |
| Heungkuk Fire & Marine Insurance Co., Ltd. * | 77,319 | 159,992 |
| Hite Jinro Co., Ltd. | 7,618 | 136,976 |
| HJ Shipbuilding & Construction Co., Ltd. * | 16,526 | 40,664 |
| HL Mando Co., Ltd. | 16,394 | 567,621 |
| HMM Co., Ltd. | 12,302 | 164,563 |
| Hotel Shilla Co., Ltd. | 7,971 | 362,977 |
| HS Industries Co., Ltd. | 38,215 | 100,718 |
| Hyosung Advanced Materials Corp. | 445 | 99,405 |
| Hyosung Chemical Corp. * | 1,027 | 72,940 |
| Hyosung Corp. | 4,380 | 210,427 |
| Hyosung Heavy Industries Corp. * | 4,940 | 198,609 |
| Hyosung TNC Corp. | 1,237 | 226,655 |
| Hyundai Construction Equipment Co., Ltd. | 12,310 | 370,705 |
| Hyundai Corp. | 15,302 | 173,780 |
| Hyundai Department Store Co., Ltd. | 8,652 | 328,150 |
| Hyundai Doosan Infracore Co., Ltd. * | 67,614 | 262,859 |
| Hyundai Elevator Co., Ltd. | 8,605 | 152,044 |
| Hyundai Greenfood Co., Ltd. | 51,673 | 235,893 |
| Hyundai Heavy Industries Co., Ltd. * | 1,765 | 134,830 |
| Hyundai Home Shopping Network Corp. | 5,118 | 160,787 |
| Hyundai Mipo Dockyard Co., Ltd. * | 5,991 | 385,562 |
| Hyundai Rotem Co., Ltd. * | 7,924 | 135,212 |
| Hyundai Wia Corp. | 14,480 | 619,445 |
| iMarketKorea, Inc. | 23,731 | 171,469 |
| Innocean Worldwide, Inc. | 4,154 | 117,005 |
| INTOPS Co., Ltd. | 6,046 | 117,935 |
| IS Dongseo Co., Ltd. | 5,724 | 126,493 |
| JB Financial Group Co., Ltd. | 70,543 | 355,221 |
| Kakao Corp. | 6,502 | 230,657 |
| Kangwon Land, Inc. * | 24,653 | 397,489 |
| KCC Corp. | 1,608 | 274,631 |
| KCC Glass Corp. | 2,833 | 76,843 |
| KEPCO Plant Service & Engineering Co., Ltd. | 8,478 | 189,598 |
| KISWIRE Ltd. | 8,141 | 102,411 |
| KIWOOM Securities Co., Ltd. | 2,977 | 168,442 |
| Kolmar Korea Co., Ltd. | 2,882 | 69,154 |
| Kolon Corp. | 9,455 | 149,693 |
| Kolon Industries, Inc. | 12,791 | 389,505 |
| Korea Aerospace Industries Ltd. | 9,762 | 324,201 |
| Korea Electric Terminal Co., Ltd. | 4,080 | 148,212 |
| Korea Investment Holdings Co., Ltd. | 9,665 | 335,509 |
| Korea Petrochemical Ind Co., Ltd. | 3,279 | 271,908 |
| Korean Reinsurance Co. | 56,523 | 291,434 |
| SECURITY | NUMBER OF SHARES | VALUE ($) |
| Krafton, Inc. * | 1,459 | 181,230 |
| Kukdo Chemical Co., Ltd. | 2,332 | 70,760 |
| Kumho Petrochemical Co., Ltd. | 6,981 | 639,979 |
| Kumho Tire Co., Inc. * | 64,214 | 138,817 |
| KUMHOE&C Co., Ltd. | 19,538 | 82,886 |
| Kwang Dong Pharmaceutical Co., Ltd. | 27,275 | 113,054 |
| LF Corp. | 18,000 | 187,352 |
| LG Hausys Ltd. | 8,472 | 191,123 |
| LG HelloVision Co., Ltd. | 34,380 | 109,461 |
| Lotte Chilsung Beverage Co., Ltd. | 1,293 | 127,327 |
| Lotte Corp. | 10,435 | 238,472 |
| LOTTE Fine Chemical Co., Ltd. | 6,444 | 253,400 |
| LOTTE Himart Co., Ltd. | 31,108 | 287,837 |
| LS Corp. | 17,644 | 822,114 |
| LS Electric Co., Ltd. | 8,821 | 339,970 |
| LX International Corp. | 27,386 | 780,044 |
| LX Semicon Co., Ltd. | 1,215 | 70,494 |
| Maeil Dairies Co., Ltd. | 1,990 | 65,710 |
| Mcnex Co., Ltd. | 4,205 | 80,819 |
| Meritz Financial Group, Inc. | 10,036 | 152,536 |
| Meritz Fire & Marine Insurance Co., Ltd. | 25,875 | 570,238 |
| Meritz Securities Co., Ltd. | 71,017 | 184,152 |
| Mirae Asset Securities Co., Ltd. | 64,792 | 288,423 |
| Namhae Chemical Corp. | 10,883 | 69,627 |
| Namyang Dairy Products Co., Ltd. | 473 | 120,615 |
| Netmarble Corp. | 2,366 | 73,940 |
| Nexen Tire Corp. | 38,867 | 210,320 |
| NH Investment & Securities Co., Ltd. | 39,829 | 250,431 |
| NHN Corp. * | 6,418 | 103,206 |
| NICE Holdings Co., Ltd. | 14,842 | 128,624 |
| NongShim Co., Ltd. | 1,624 | 343,998 |
| OCI Co., Ltd. | 6,924 | 494,547 |
| Orion Corp. | 5,746 | 408,896 |
| Orion Holdings Corp. | 11,187 | 112,185 |
| Ottogi Corp. | 599 | 185,542 |
| Pan Ocean Co., Ltd. | 55,594 | 167,411 |
| Partron Co., Ltd. | 22,592 | 129,850 |
| PHA Co., Ltd. | 16,604 | 71,019 |
| Poongsan Corp. | 19,090 | 349,334 |
| POSCO Chemical Co., Ltd. | 940 | 131,251 |
| Power Logics Co., Ltd. * | 17,762 | 66,795 |
| S-1 Corp. | 8,037 | 351,749 |
| Samchully Co., Ltd. | 1,881 | 368,422 |
| Samsung Card Co., Ltd. | 15,631 | 338,863 |
| Samsung Engineering Co., Ltd. * | 33,886 | 566,076 |
| Samsung Heavy Industries Co., Ltd. * | 141,197 | 509,737 |
| Samsung Securities Co., Ltd. | 12,966 | 288,478 |
| SAMT Co., Ltd. | 48,399 | 87,538 |
| Samyang Corp. | 3,909 | 101,713 |
| Samyang Holdings Corp. | 5,367 | 232,928 |
| Seah Besteel Holdings Corp. | 15,658 | 183,865 |
| Sebang Global Battery Co., Ltd. | 4,291 | 117,162 |
| Seohan Co., Ltd. | 131,055 | 93,673 |
| Seohee Construction Co., Ltd. | 105,438 | 84,243 |
| Seoul Semiconductor Co., Ltd. | 20,669 | 151,278 |
| Seoyon Co., Ltd. | 16,910 | 61,829 |
| Seoyon E-Hwa Co., Ltd. | 23,574 | 117,777 |
| SFA Engineering Corp. | 8,364 | 223,620 |
| Shinsegae, Inc. | 3,737 | 556,419 |
| SK Chemicals Co., Ltd. | 2,311 | 143,173 |
| SK Discovery Co., Ltd. | 9,297 | 193,601 |
| SK Gas Ltd. | 2,881 | 230,362 |
| SK Networks Co., Ltd. | 219,224 | 619,193 |
| SKC Co., Ltd. | 2,712 | 196,433 |
| SL Corp. | 6,982 | 150,247 |
| SNT Motiv Co., Ltd. | 4,833 | 149,572 |
| Songwon Industrial Co., Ltd. | 5,886 | 71,085 |
| SSANGYONG C&E Co., Ltd. | 25,986 | 103,551 |
| SECURITY | NUMBER OF SHARES | VALUE ($) |
| Sungwoo Hitech Co., Ltd. | 83,049 | 301,214 |
| Taekwang Industrial Co., Ltd. | 653 | 322,050 |
| TKG Huchems Co., Ltd. | 9,440 | 137,825 |
| Tongyang Life Insurance Co., Ltd. | 20,485 | 73,537 |
| Tongyang, Inc. | 146,006 | 101,472 |
| WONIK IPS Co., Ltd. | 6,477 | 124,695 |
| Young Poong Corp. | 448 | 197,965 |
| Youngone Corp. | 12,902 | 427,642 |
| Yuhan Corp. | 7,151 | 299,833 |
| 39,245,238 | ||
| Singapore 1.5% | ||
| CapitaLand Ascendas REIT | 293,721 | 543,440 |
| CapitaLand Ascott Trust | 270,100 | 182,105 |
| CapitaLand China Trust | 114,200 | 78,251 |
| CapitaLand Integrated Commercial Trust | 290,101 | 385,009 |
| Capitaland Investment Ltd. | 231,598 | 492,527 |
| City Developments Ltd. | 105,700 | 569,893 |
| Cromwell European Real Estate Investment Trust | 44,800 | 69,510 |
| First Resources Ltd. | 125,000 | 131,329 |
| Frasers Logistics & Commercial Trust | 110,300 | 85,723 |
| Genting Singapore Ltd. | 1,337,100 | 760,371 |
| Hutchison Port Holdings Trust, Class U | 2,232,800 | 364,670 |
| Keppel Infrastructure Trust | 819,600 | 306,693 |
| Manulife US Real Estate Investment Trust | 157,800 | 57,621 |
| Mapletree Industrial Trust | 127,966 | 198,978 |
| Mapletree Logistics Trust | 184,832 | 198,374 |
| Mapletree Pan Asia Commercial Trust | 189,892 | 213,098 |
| NetLink NBN Trust | 293,700 | 177,408 |
| Olam Group Ltd. | 372,100 | 352,286 |
| SATS Ltd. * | 116,349 | 224,585 |
| Sembcorp Industries Ltd. | 240,000 | 493,357 |
| Sembcorp Marine Ltd. * | 3,303,560 | 296,044 |
| Singapore Exchange Ltd. | 80,500 | 478,704 |
| Singapore Post Ltd. | 441,100 | 168,437 |
| Singapore Technologies Engineering Ltd. | 279,600 | 651,841 |
| Suntec Real Estate Investment Trust | 195,200 | 178,022 |
| UOL Group Ltd. | 88,501 | 386,554 |
| 8,044,830 | ||
| Spain 1.5% | ||
| Abengoa S.A., B Shares *(a) | 66,135,341 | 0 |
| Almirall S.A. | 14,253 | 132,803 |
| Applus Services S.A. | 57,062 | 336,953 |
| Atresmedia Corp de Medios de Comunicaion S.A. | 39,930 | 115,233 |
| Bankinter S.A. | 127,929 | 773,837 |
| Caja de Ahorros del Mediterraneo *(a) | 5,382 | 0 |
| Cellnex Telecom S.A. | 12,601 | 412,434 |
| Cia de Distribucion Integral Logista Holdings S.A. | 17,292 | 357,624 |
| Cie Automotive S.A. | 12,729 | 324,248 |
| Construcciones y Auxiliar de Ferrocarriles S.A. | 5,819 | 151,926 |
| Ebro Foods S.A. | 31,581 | 492,447 |
| Ence Energia y Celulosa S.A. | 60,917 | 208,632 |
| Faes Farma S.A. | 55,308 | 208,759 |
| Fluidra S.A. | 7,939 | 107,818 |
| Gestamp Automocion S.A. | 113,236 | 398,737 |
| Grupo Catalana Occidente S.A. | 14,072 | 382,184 |
| Indra Sistemas S.A. | 31,096 | 278,112 |
| Inmobiliaria Colonial Socimi S.A. | 30,892 | 162,919 |
| Linea Directa Aseguradora S.A. Cia de Seguros y Reaseguros | 145,837 | 136,683 |
| SECURITY | NUMBER OF SHARES | VALUE ($) |
| Mediaset Espana Comunicacion S.A. * | 67,526 | 210,016 |
| Melia Hotels International S.A. * | 34,003 | 158,089 |
| Merlin Properties Socimi S.A. | 41,666 | 353,185 |
| Obrascon Huarte Lain S.A. * | 245,919 | 104,504 |
| Prosegur Cia de Seguridad S.A. | 208,121 | 387,572 |
| Sacyr S.A. | 161,753 | 396,800 |
| Siemens Gamesa Renewable Energy S.A. * | 32,390 | 574,231 |
| Tecnicas Reunidas S.A. *(b) | 22,975 | 163,983 |
| Unicaja Banco S.A. | 302,524 | 268,184 |
| Viscofan S.A. | 8,557 | 509,544 |
| 8,107,457 | ||
| Sweden 3.3% | ||
| AAK AB | 31,816 | 463,796 |
| AddTech AB, B Shares | 12,263 | 148,178 |
| AFRY AB | 26,657 | 357,971 |
| Ambea AB | 22,911 | 81,041 |
| Arjo AB, B Shares | 35,350 | 141,011 |
| Attendo AB * | 65,706 | 135,641 |
| Axfood AB | 20,641 | 511,042 |
| Beijer Alma AB | 5,897 | 82,449 |
| Beijer Ref AB | 14,679 | 227,560 |
| Betsson AB, Class B * | 54,806 | 398,562 |
| Bilia AB, A Shares | 29,131 | 308,562 |
| BillerudKorsnas AB | 61,523 | 794,243 |
| Bonava AB, B Shares | 69,552 | 203,436 |
| Bravida Holding AB | 43,837 | 410,705 |
| Byggmax Group AB | 21,168 | 88,589 |
| Castellum AB | 29,966 | 342,634 |
| Clas Ohlson AB, B Shares | 16,130 | 107,718 |
| Cloetta AB, B Shares | 93,785 | 171,433 |
| Concentric AB | 6,153 | 101,923 |
| Coor Service Management Holding AB | 29,178 | 155,022 |
| Dometic Group AB | 80,085 | 458,525 |
| Dustin Group AB | 20,652 | 85,930 |
| Electrolux Professional AB, B Shares | 29,545 | 111,542 |
| Elekta AB, B Shares * | 65,264 | 331,722 |
| EQT AB | 4,439 | 87,359 |
| Evolution AB | 2,473 | 230,688 |
| Fabege AB | 20,066 | 145,679 |
| Fastighets AB Balder, B Shares * | 30,222 | 113,443 |
| Fingerprint Cards AB, B Shares *(b) | 126,830 | 59,990 |
| Getinge AB, B Shares | 27,217 | 552,314 |
| Granges AB | 37,441 | 253,015 |
| Hexpol AB | 54,826 | 541,140 |
| Holmen AB, B Shares | 15,644 | 567,727 |
| Hufvudstaden AB, A Shares | 7,333 | 87,386 |
| Indutrade AB | 22,371 | 391,670 |
| Intrum AB | 21,575 | 271,461 |
| Investment AB Latour, B Shares | 5,497 | 92,857 |
| Inwido AB | 14,552 | 130,721 |
| JM AB | 25,369 | 381,979 |
| Kinnevik AB, B Shares * | 35,273 | 435,743 |
| L E Lundbergfortagen AB, B Shares | 10,173 | 401,504 |
| Lifco AB, B Shares | 12,697 | 183,470 |
| Lindab International AB | 13,605 | 144,718 |
| Loomis AB | 28,046 | 785,247 |
| MEKO AB | 14,567 | 137,656 |
| Modern Times Group MTG AB, B Shares * | 12,684 | 95,090 |
| Mycronic AB | 9,943 | 156,046 |
| NCC AB, B Shares | 43,969 | 366,369 |
| New Wave Group AB, B Shares | 7,071 | 98,275 |
| Nibe Industrier AB, B Shares | 54,011 | 430,833 |
| Nobia AB | 93,659 | 155,967 |
| Nolato AB, B Shares | 26,371 | 111,229 |
| Pandox AB * | 14,077 | 172,389 |
| Peab AB, B Shares | 91,254 | 473,484 |
| SECURITY | NUMBER OF SHARES | VALUE ($) |
| Ratos AB, B Shares | 78,625 | 294,300 |
| Resurs Holding AB | 78,795 | 171,219 |
| Saab AB, B Shares | 22,124 | 781,730 |
| Samhallsbyggnadsbolaget i Norden AB | 51,579 | 70,864 |
| Scandi Standard AB * | 32,968 | 151,333 |
| Scandic Hotels Group AB * | 56,214 | 178,267 |
| Sweco AB, B Shares | 31,311 | 235,259 |
| Swedish Orphan Biovitrum AB * | 15,103 | 278,188 |
| Tethys Oil AB | 22,428 | 138,434 |
| Thule Group AB | 12,040 | 237,195 |
| Viaplay Group AB, B Shares * | 7,709 | 140,738 |
| VNV Global AB * | 29,521 | 63,344 |
| Wallenstam AB, B Shares | 23,723 | 83,697 |
| Wihlborgs Fastigheter AB | 28,059 | 183,821 |
| 17,283,073 | ||
| Switzerland 2.7% | ||
| Allreal Holding AG | 2,478 | 354,965 |
| ALSO Holding AG * | 1,258 | 197,716 |
| ams-OSRAM AG * | 49,035 | 277,555 |
| Arbonia AG | 13,395 | 162,808 |
| Aryzta AG * | 445,323 | 456,500 |
| Autoneum Holding AG | 1,762 | 168,524 |
| Banque Cantonale Vaudoise | 3,842 | 341,921 |
| Belimo Holding AG | 697 | 283,893 |
| BKW AG | 3,175 | 370,404 |
| Bobst Group S.A. | 689 | 42,340 |
| Bucher Industries AG | 1,602 | 540,139 |
| Burckhardt Compression Holding AG | 351 | 151,842 |
| Bystronic AG | 433 | 248,714 |
| Cembra Money Bank AG | 6,222 | 451,214 |
| Comet Holding AG | 460 | 73,231 |
| Daetwyler Holding AG | 714 | 126,717 |
| dormakaba Holding AG | 803 | 254,885 |
| Emmi AG | 383 | 305,617 |
| EMS-Chemie Holding AG | 683 | 429,464 |
| Flughafen Zuerich AG * | 3,155 | 489,455 |
| Forbo Holding AG | 227 | 274,788 |
| Galenica AG | 12,414 | 891,921 |
| Helvetia Holding AG | 7,537 | 748,442 |
| Huber & Suhner AG | 3,924 | 349,517 |
| Implenia AG * | 10,880 | 408,448 |
| Inficon Holding AG | 209 | 166,179 |
| Interroll Holding AG | 51 | 107,441 |
| Kardex Holding AG | 507 | 77,531 |
| Komax Holding AG | 552 | 129,553 |
| Landis & Gyr Group AG * | 7,408 | 426,900 |
| Mobimo Holding AG | 948 | 221,129 |
| OC Oerlikon Corp. AG | 65,153 | 420,831 |
| PSP Swiss Property AG | 3,164 | 338,009 |
| Rieter Holding AG | 1,081 | 90,103 |
| Schweiter Technologies AG | 283 | 189,595 |
| SFS Group AG | 3,275 | 296,153 |
| Siegfried Holding AG * | 325 | 193,465 |
| Softwareone Holding AG * | 24,078 | 270,979 |
| St. Galler Kantonalbank AG | 339 | 159,593 |
| Stadler Rail AG (b) | 9,097 | 267,685 |
| Straumann Holding AG | 3,257 | 309,973 |
| Sulzer AG | 3,850 | 256,775 |
| Tecan Group AG | 757 | 277,693 |
| Temenos AG | 4,241 | 252,589 |
| u-blox Holding AG * | 1,811 | 185,418 |
| Valiant Holding AG | 2,761 | 270,433 |
| VAT Group AG | 1,307 | 298,390 |
| Vontobel Holding AG | 3,814 | 214,616 |
| Zehnder Group AG | 2,468 | 132,910 |
| SECURITY | NUMBER OF SHARES | VALUE ($) |
| Zur Rose Group AG * | 1,429 | 38,605 |
| 13,993,568 | ||
| United Kingdom 8.6% | ||
| 4imprint Group plc | 4,580 | 182,624 |
| 888 Holdings plc * | 62,984 | 67,039 |
| Airtel Africa plc | 151,045 | 195,513 |
| Ascential plc * | 39,617 | 87,258 |
| Ashmore Group plc | 100,868 | 238,866 |
| Assura plc | 120,263 | 77,054 |
| Aston Martin Lagonda Global Holdings plc * | 29,660 | 35,843 |
| Auto Trader Group plc | 45,315 | 271,245 |
| AVEVA Group plc | 6,948 | 248,656 |
| Babcock International Group plc * | 123,956 | 391,535 |
| Bank of Georgia Group plc | 9,837 | 239,723 |
| Beazley plc | 84,639 | 607,015 |
| Biffa plc | 56,039 | 264,388 |
| Big Yellow Group plc | 10,774 | 138,635 |
| Bodycote plc | 60,810 | 345,616 |
| Britvic plc | 53,798 | 448,835 |
| C&C Group plc * | 102,438 | 192,202 |
| Capita plc * | 874,585 | 243,349 |
| Capricorn Energy plc * | 37,734 | 107,145 |
| Card Factory plc * | 441,661 | 240,859 |
| Carnival plc * | 66,269 | 526,529 |
| Centamin plc | 588,796 | 598,567 |
| Chemring Group plc | 52,603 | 182,355 |
| Clarkson plc | 3,516 | 111,286 |
| Close Brothers Group plc | 41,474 | 467,250 |
| Coats Group plc | 395,232 | 274,197 |
| Computacenter plc | 15,709 | 325,940 |
| ConvaTec Group plc | 239,268 | 598,702 |
| Countryside Properties plc * | 141,942 | 345,806 |
| Cranswick plc | 16,196 | 552,962 |
| Crest Nicholson Holdings plc | 157,996 | 366,229 |
| De La Rue plc * | 125,505 | 135,293 |
| Dechra Pharmaceuticals plc | 4,075 | 122,504 |
| Derwent London plc | 9,253 | 229,005 |
| Diploma plc | 8,696 | 247,339 |
| DiscoverIE Group plc | 11,297 | 96,506 |
| Diversified Energy Co., plc | 72,072 | 103,976 |
| Domino's Pizza Group plc | 54,126 | 139,985 |
| Dr. Martens plc | 57,671 | 164,010 |
| Dunelm Group plc | 22,354 | 222,260 |
| easyJet plc * | 147,654 | 587,912 |
| Elementis plc * | 204,606 | 216,301 |
| Endeavour Mining plc | 11,775 | 204,806 |
| EnQuest plc * | 641,311 | 198,882 |
| Essentra plc | 115,229 | 296,653 |
| Euromoney Institutional Investor plc | 19,440 | 322,836 |
| FDM Group Holdings plc | 10,416 | 75,153 |
| Ferrexpo plc | 202,683 | 237,721 |
| Forterra plc | 62,584 | 156,820 |
| Frasers Group plc * | 40,746 | 302,342 |
| Fresnillo plc | 43,217 | 361,317 |
| Games Workshop Group plc | 2,960 | 217,275 |
| Genuit Group plc | 40,265 | 117,672 |
| Genus plc | 5,977 | 174,681 |
| Grafton Group plc | 74,248 | 587,840 |
| Grainger plc | 67,604 | 175,989 |
| Great Portland Estates plc | 29,034 | 171,149 |
| Greencore Group plc * | 237,208 | 182,260 |
| Greggs plc | 15,922 | 369,095 |
| Halfords Group plc | 137,835 | 278,676 |
| Halma plc | 26,642 | 646,049 |
| Hammerson plc | 758,497 | 166,285 |
| SECURITY | NUMBER OF SHARES | VALUE ($) |
| Harbour Energy plc | 75,321 | 326,880 |
| Hargreaves Lansdown plc | 39,688 | 346,857 |
| Hikma Pharmaceuticals plc | 37,428 | 537,287 |
| Hill & Smith Holdings plc | 17,175 | 194,145 |
| Hilton Food Group plc | 16,751 | 117,397 |
| Hiscox Ltd. | 45,305 | 466,719 |
| Hochschild Mining plc | 195,003 | 119,150 |
| HomeServe plc | 37,736 | 513,607 |
| Howden Joinery Group plc | 94,500 | 556,661 |
| Ibstock plc | 124,222 | 221,466 |
| IG Group Holdings plc | 80,050 | 730,157 |
| Indivior plc * | 12,716 | 240,867 |
| Intermediate Capital Group plc | 28,568 | 347,866 |
| Intu Properties plc *(a) | 204,586 | 0 |
| Investec plc | 105,954 | 531,009 |
| IWG plc * | 255,598 | 386,348 |
| J.D. Sports Fashion plc | 324,541 | 362,652 |
| J.D. Wetherspoon plc * | 33,676 | 174,799 |
| Jupiter Fund Management plc | 239,143 | 284,522 |
| Just Group plc | 590,778 | 392,414 |
| Kier Group plc * | 409,704 | 280,969 |
| Lancashire Holdings Ltd. | 45,456 | 257,969 |
| LondonMetric Property plc | 32,444 | 69,539 |
| LSL Property Services plc | 27,593 | 72,464 |
| Man Group plc | 305,995 | 761,195 |
| Mapeley Ltd. *(a) | 2,199 | 0 |
| Marshalls plc | 34,769 | 100,640 |
| Marston's plc * | 426,975 | 171,673 |
| Mediclinic International plc | 110,055 | 626,072 |
| Mitchells & Butlers plc * | 138,200 | 184,234 |
| Mitie Group plc | 247,362 | 203,084 |
| Moneysupermarket.com Group plc | 151,991 | 319,713 |
| Morgan Advanced Materials plc | 90,020 | 253,958 |
| Morgan Sindall Group plc | 18,734 | 330,563 |
| National Express Group plc * | 265,489 | 514,653 |
| NewRiver REIT plc | 154,639 | 124,138 |
| Ocado Group plc * | 23,649 | 128,208 |
| OSB Group plc | 48,476 | 231,016 |
| Oxford Instruments plc | 5,891 | 129,306 |
| Pagegroup plc | 94,429 | 455,466 |
| Paragon Banking Group plc | 47,360 | 231,710 |
| PayPoint plc | 22,943 | 152,410 |
| Petrofac Ltd. * | 296,231 | 365,876 |
| Pets at Home Group plc | 116,998 | 386,845 |
| Playtech plc * | 90,098 | 535,376 |
| Plus500 Ltd. | 33,003 | 683,153 |
| Premier Foods plc | 217,725 | 258,676 |
| Primary Health Properties plc | 59,107 | 75,308 |
| Provident Financial plc | 146,313 | 274,004 |
| PZ Cussons plc | 62,849 | 144,107 |
| QinetiQ Group plc | 142,821 | 588,689 |
| Quilter plc | 119,424 | 132,381 |
| Rathbone Brothers plc | 7,725 | 166,018 |
| Reach plc | 131,235 | 138,234 |
| Redde Northgate plc | 118,114 | 451,059 |
| Redrow plc | 96,337 | 463,575 |
| Renewi plc * | 12,767 | 77,347 |
| Renishaw plc | 3,659 | 146,824 |
| Rhi Magnesita N.V. | 11,984 | 254,731 |
| Rightmove plc | 40,067 | 225,625 |
| Rolls-Royce Holdings plc * | 757,938 | 679,766 |
| Rotork plc | 146,275 | 428,743 |
| RS Group plc | 56,965 | 626,810 |
| Sabre Insurance Group plc | 94,759 | 97,585 |
| Safestore Holdings plc | 12,798 | 132,592 |
| Saga plc * | 133,082 | 131,099 |
| Savills plc | 32,437 | 306,465 |
| Schroders plc | 112,845 | 506,675 |
| SECURITY | NUMBER OF SHARES | VALUE ($) |
| Segro plc | 41,554 | 373,986 |
| Senior plc * | 241,196 | 359,585 |
| Serco Group plc | 298,238 | 557,788 |
| SIG plc * | 454,894 | 162,762 |
| Sirius Real Estate Ltd. | 76,123 | 61,545 |
| Softcat plc | 10,432 | 134,035 |
| Speedy Hire plc | 237,737 | 105,510 |
| Spirax-Sarco Engineering plc | 5,032 | 620,111 |
| Spire Healthcare Group plc * | 63,813 | 158,521 |
| Spirent Communications plc | 77,242 | 229,285 |
| SSP Group plc * | 199,069 | 462,884 |
| SThree plc | 57,847 | 246,781 |
| Synthomer plc | 121,200 | 156,797 |
| TBC Bank Group plc | 9,516 | 205,600 |
| Telecom Plus plc | 14,036 | 341,217 |
| The British Land Co., plc | 134,904 | 565,907 |
| The Restaurant Group plc * | 239,531 | 87,331 |
| The Unite Group plc | 12,005 | 122,630 |
| THG plc * | 120,233 | 73,304 |
| TI Fluid Systems plc | 185,024 | 293,792 |
| TP ICAP Group plc | 270,981 | 571,800 |
| Tritax Big Box REIT plc | 73,518 | 118,213 |
| TT Electronics plc | 53,200 | 82,302 |
| Tyman plc | 73,267 | 161,217 |
| Vesuvius plc | 113,641 | 442,057 |
| Victrex plc | 16,399 | 311,463 |
| Virgin Money UK plc | 133,796 | 208,532 |
| Vistry Group plc | 61,060 | 422,242 |
| Watches of Switzerland Group plc * | 11,078 | 98,779 |
| WH Smith plc * | 22,362 | 302,320 |
| Wickes Group plc | 140,310 | 204,031 |
| Wizz Air Holdings plc * | 5,348 | 104,837 |
| Workspace Group plc | 18,227 | 85,461 |
| 45,641,786 | ||
| Total Common Stocks (Cost $542,461,324) | 525,205,589 | |
| PREFERRED STOCKS 0.2% OF NET ASSETS | ||
| Germany 0.1% | ||
| Draegerwerk AG & Co. KGaA | 7,803 | 313,971 |
| Sartorius AG | 506 | 178,411 |
| Sixt SE | 3,683 | 214,518 |
| 706,900 | ||
| Italy 0.1% | ||
| Danieli & C Officine Meccaniche S.p.A. - RSP | 14,923 | 204,975 |
| Total Preferred Stocks (Cost $888,311) | 911,875 | |
| SECURITY | NUMBER OF SHARES | VALUE ($) |
| WARRANTS 0.0% OF NET ASSETS | ||
| Italy 0.0% | ||
| Webuild S.p.A. | ||
| expires 08/02/30 *(a) | 9,173 | 12,482 |
| Total Warrants (Cost $0) | 12,482 | |
| SHORT-TERM INVESTMENTS 0.2% OF NET ASSETS | ||
| Money Market Funds 0.2% | ||
| State Street Institutional U.S. Government Money Market Fund, Premier Class 3.01% (c)(d) | 1,171,878 | 1,171,878 |
| Total Short-Term Investments (Cost $1,171,878) | 1,171,878 | |
| Total Investments in Securities (Cost $544,521,513) | 527,301,824 | |
| NUMBER OF CONTRACTS | NOTIONAL AMOUNT ($) | CURRENT VALUE/ UNREALIZED APPRECIATION ($) | |
| FUTURES CONTRACTS | |||
| Long | |||
| MSCI EAFE Index, expires 12/16/22 | 45 | 3,950,775 | 91,417 |
| * | Non-income producing security. |
| (a) | Fair-valued using significant unobservable inputs (see financial note 2(a), Securities for which no quoted value is available, for additional information). |
| (b) | All or a portion of this security is on loan. Securities on loan were valued at $1,030,805. |
| (c) | The rate shown is the annualized 7-day yield. |
| (d) | Security purchased with cash collateral received for securities on loan. |
| CVA — | Dutch Certificate |
| REIT — | Real Estate Investment Trust |
| RSP — | Risparmio (Savings Shares) |
| DESCRIPTION | QUOTED PRICES IN ACTIVE MARKETS FOR IDENTICAL ASSETS (LEVEL 1) | OTHER SIGNIFICANT OBSERVABLE INPUTS (LEVEL 2) | SIGNIFICANT UNOBSERVABLE INPUTS (LEVEL 3) | TOTAL |
| Assets | ||||
| Common Stocks1 | $— | $65,245,751 | $— | $65,245,751 |
| Australia | — | 28,578,943 | 0* | 28,578,943 |
| Austria | 325,116 | 3,257,597 | — | 3,582,713 |
| Canada | 43,547,766 | — | — | 43,547,766 |
| Denmark | 343,748 | 7,866,279 | — | 8,210,027 |
| Finland | 141,273 | 5,842,152 | — | 5,983,425 |
| France | 111,574 | 21,686,297 | — | 21,797,871 |
| Germany | 696,297 | 19,461,880 | — | 20,158,177 |
| Greece | — | — | 0* | 0 |
| Hong Kong | 144,162 | 13,732,940 | 0* | 13,877,102 |
| Italy | — | 13,837,327 | 0* | 13,837,327 |
| Japan | 218,661 | 186,886,740 | — | 187,105,401 |
| Luxembourg | — | — | 0* | 0 |
| Netherlands | 820,708 | 6,674,152 | — | 7,494,860 |
| Poland | 214,539 | 4,532,376 | — | 4,746,915 |
| Republic of Korea | 409,086 | 38,836,152 | — | 39,245,238 |
| Singapore | 69,510 | 7,975,320 | — | 8,044,830 |
| Spain | — | 8,107,457 | 0* | 8,107,457 |
| United Kingdom | 9,180,904 | 36,460,882 | 0* | 45,641,786 |
| Preferred Stocks1 | — | 911,875 | — | 911,875 |
| Warrants 1 | ||||
| Italy | — | — | 12,482 | 12,482 |
| Short-Term Investments1 | 1,171,878 | — | — | 1,171,878 |
| Futures Contracts2 | 91,417 | — | — | 91,417 |
| Total | $57,486,639 | $469,894,120 | $12,482 | $527,393,241 |
| * | Level 3 amount shown includes securities determined to have no value at October 31, 2022. |
| 1 | As categorized in the Portfolio Holdings. |
| 2 | Futures contracts are reported at cumulative unrealized appreciation or depreciation. |
| Assets | ||
| Investments in securities, at value - unaffiliated (cost $544,521,513) including securities on loan of $1,030,805 | $527,301,824 | |
| Cash | 35,339 | |
| Foreign currency, at value (cost $76,428) | 76,210 | |
| Deposit with broker for futures contracts | 402,632 | |
| Receivables: | ||
| Dividends | 1,852,397 | |
| Fund shares sold | 1,591,369 | |
| Foreign tax reclaims | 843,383 | |
| Investments sold | 89,154 | |
| Income from securities on loan | 5,825 | |
| Interest | + | 2,001 |
| Total assets | 532,200,134 | |
| Liabilities | ||
| Collateral held for securities on loan | 1,171,878 | |
| Payables: | ||
| Fund shares redeemed | 644,148 | |
| Investment adviser fees | 161,402 | |
| Variation margin on futures contracts | 28,018 | |
| Investments bought | + | 11,034 |
| Total liabilities | 2,016,480 | |
| Net assets | $530,183,654 | |
| Net Assets by Source | ||
| Capital received from investors | $568,864,369 | |
| Total distributable loss | + | (38,680,715) |
| Net assets | $530,183,654 | |
| Net Asset Value (NAV) | ||||
| Net Assets | ÷ | Shares Outstanding | = | NAV |
| $530,183,654 | 49,752,524 | $10.66 | ||
| For the period November 1, 2021 through October 31, 2022 | ||
| Investment Income | ||
| Dividends received from securities - unaffiliated (net of foreign withholding tax of $2,509,767) | $16,732,754 | |
| Securities on loan, net | + | 171,313 |
| Total investment income | 16,904,067 | |
| Expenses | ||
| Investment adviser fees | 2,382,862 | |
| Proxy fees1 | 28,433 | |
| Professional fees | + | 1,018 2 |
| Total expenses | 2,412,313 | |
| Expense reduction | – | 1,018 2 |
| Net expenses | – | 2,411,295 |
| Net investment income | 14,492,772 | |
| REALIZED AND UNREALIZED GAINS (LOSSES) | ||
| Net realized gains on sales of securities - unaffiliated | 20,927,405 | |
| Net realized losses on futures contracts | (1,575,249) | |
| Net realized losses on foreign currency transactions | + | (576,940) |
| Net realized gains | 18,775,216 | |
| Net change in unrealized appreciation (depreciation) on securities - unaffiliated | (218,874,003) | |
| Net change in unrealized appreciation (depreciation) on futures contracts | 1,559 | |
| Net change in unrealized appreciation (depreciation) on foreign currency translations | + | (135,186) |
| Net change in unrealized appreciation (depreciation) | + | (219,007,630) |
| Net realized and unrealized losses | (200,232,414) | |
| Decrease in net assets resulting from operations | ($185,739,642) | |
| 1 | Proxy fees are non-routine expenses (see financial note 2(e) for additional information). |
| 2 | Professional fees associated with the filing of tax claims in the European Union deemed to be non-contingent and non-routine expenses of the fund. (see financial notes 2(d) and 4 for additional information). |
| OPERATIONS | |||
| 11/1/21-10/31/22 | 11/1/20-10/31/21 | ||
| Net investment income | $14,492,772 | $13,283,276 | |
| Net realized gains | 18,775,216 | 51,867,574 | |
| Net change in unrealized appreciation (depreciation) | + | (219,007,630) | 149,333,425 |
| Increase (decrease) in net assets resulting from operations | ($185,739,642) | $214,484,275 | |
| DISTRIBUTIONS TO SHAREHOLDERS | |||
| Total distributions | ($39,276,717) | ($13,332,524) | |
| TRANSACTIONS IN FUND SHARES | |||||
| 11/1/21-10/31/22 | 11/1/20-10/31/21 | ||||
| SHARES | VALUE | SHARES | VALUE | ||
| Shares sold | 12,218,154 | $151,544,356 | 11,598,667 | $168,880,238 | |
| Shares reinvested | 2,187,522 | 30,100,308 | 772,628 | 10,453,657 | |
| Shares redeemed | + | (10,584,869) | (134,793,600) | (16,773,053) | (249,085,119) |
| Net transactions in fund shares | 3,820,807 | $46,851,064 | (4,401,758) | ($69,751,224) | |
| SHARES OUTSTANDING AND NET ASSETS | |||||
| 11/1/21-10/31/22 | 11/1/20-10/31/21 | ||||
| SHARES | NET ASSETS | SHARES | NET ASSETS | ||
| Beginning of period | 45,931,717 | $708,348,949 | 50,333,475 | $576,948,422 | |
| Total increase (decrease) | + | 3,820,807 | (178,165,295) | (4,401,758) | 131,400,527 |
| End of period | 49,752,524 | $530,183,654 | 45,931,717 | $708,348,949 | |
| 11/1/21– 10/31/22 | 11/1/20– 10/31/21 | 11/1/19– 10/31/20 | 11/1/18– 10/31/19 | 11/1/17– 10/31/18 | ||
| Per-Share Data | ||||||
| Net asset value at beginning of period | $10.24 | $7.51 | $9.25 | $8.60 | $9.38 | |
| Income (loss) from investment operations: | ||||||
| Net investment income (loss)1 | 0.52 | 0.36 | 0.27 | 0.35 | 0.27 | |
| Net realized and unrealized gains (losses) | (2.96) | 2.63 | (1.65) | 0.54 | (0.83) | |
| Total from investment operations | (2.44) | 2.99 | (1.38) | 0.89 | (0.56) | |
| Less distributions: | ||||||
| Distributions from net investment income | (0.45) | (0.26) | (0.36) | (0.24) | (0.22) | |
| Net asset value at end of period | $7.35 | $10.24 | $7.51 | $9.25 | $8.60 | |
| Total return | (24.86%) | 40.39% | (15.68%) | 10.73% | (6.09%) | |
| Ratios/Supplemental Data | ||||||
| Ratios to average net assets: | ||||||
| Total expenses | 0.39% 2 | 0.39% | 0.39% | 0.39% | 0.39% | |
| Net investment income (loss) | 5.83% | 3.75% | 3.32% | 3.93% | 2.92% | |
| Portfolio turnover rate | 24% | 32% | 32% | 38% | 19% | |
| Net assets, end of period (x 1,000) | $604,159 | $707,652 | $550,134 | $670,910 | $547,985 | |
| 1 | Calculated based on the average shares outstanding during the period. |
| 2 | Ratio includes less than 0.005% of non-routine proxy expenses. |
| SECURITY | NUMBER OF SHARES | VALUE ($) |
| COMMON STOCKS 93.6% OF NET ASSETS | ||
| Brazil 7.7% | ||
| Ambev S.A. | 891,750 | 2,762,172 |
| B3 S.A. - Brasil Bolsa Balcao | 504,299 | 1,468,330 |
| Banco Bradesco S.A. | 500,805 | 1,613,280 |
| Banco do Brasil S.A. | 500,215 | 3,584,931 |
| BRF S.A. * | 364,218 | 885,602 |
| CCR S.A. | 366,000 | 918,277 |
| Centrais Eletricas Brasileiras S.A. | 184,516 | 1,779,612 |
| Cia de Saneamento Basico do Estado de Sao Paulo | 132,810 | 1,545,229 |
| Cia Paranaense de Energia | 116,100 | 157,557 |
| Equatorial Energia S.A. | 180,300 | 1,048,187 |
| Itau Unibanco Holding S.A. | 157,800 | 776,551 |
| JBS S.A. | 406,300 | 1,963,266 |
| Petroleo Brasileiro S.A. | 1,340,365 | 8,630,440 |
| Suzano S.A. | 93,300 | 960,906 |
| Telefonica Brasil S.A. | 169,172 | 1,352,917 |
| TIM S.A. | 318,647 | 814,276 |
| Ultrapar Participacoes S.A. | 841,628 | 2,184,925 |
| Vale S.A. | 872,297 | 11,336,230 |
| Vibra Energia S.A. | 804,300 | 2,841,637 |
| 46,624,325 | ||
| Chile 0.8% | ||
| Banco de Chile | 9,020,560 | 824,996 |
| Cencosud S.A. | 895,786 | 1,205,775 |
| Empresas CMPC S.A. | 480,227 | 761,950 |
| Empresas Copec S.A. | 208,623 | 1,437,697 |
| Falabella S.A. | 294,740 | 575,656 |
| 4,806,074 | ||
| China 28.8% | ||
| Agile Group Holdings Ltd. * | 2,272,000 | 432,137 |
| Agricultural Bank of China Ltd., A Shares | 3,746,000 | 1,410,019 |
| Agricultural Bank of China Ltd., H Shares | 12,141,600 | 3,465,616 |
| Alibaba Group Holding Ltd. * | 1,090,892 | 8,481,583 |
| Aluminum Corp. of China Ltd., A Shares | 292,300 | 154,157 |
| Aluminum Corp. of China Ltd., H Shares | 1,282,000 | 365,475 |
| Anhui Conch Cement Co., Ltd., A Shares | 96,900 | 321,334 |
| Anhui Conch Cement Co., Ltd., H Shares | 398,000 | 1,024,425 |
| BAIC Motor Corp., Ltd., H Shares | 4,222,000 | 935,362 |
| Baidu, Inc., A Shares * | 239,550 | 2,296,565 |
| Bank of China Ltd., A Shares | 2,205,100 | 905,055 |
| Bank of China Ltd., H Shares | 31,801,234 | 10,242,451 |
| Bank of Communications Co., Ltd., A Shares | 1,235,200 | 749,764 |
| Bank of Communications Co., Ltd., H Shares | 3,132,000 | 1,528,162 |
| Beijing Enterprises Holdings Ltd. | 249,000 | 631,688 |
| BYD Co., Ltd., A Shares | 3,800 | 127,991 |
| BYD Co., Ltd., H Shares | 25,000 | 560,078 |
| China Cinda Asset Management Co., Ltd., H Shares | 6,021,000 | 559,298 |
| SECURITY | NUMBER OF SHARES | VALUE ($) |
| China CITIC Bank Corp., Ltd., A Shares | 395,100 | 233,296 |
| China CITIC Bank Corp., Ltd., H Shares | 5,055,000 | 1,905,520 |
| China Communications Services Corp., Ltd., H Shares | 1,894,000 | 528,491 |
| China Construction Bank Corp., A Shares | 274,800 | 200,121 |
| China Construction Bank Corp., H Shares | 40,745,960 | 21,623,402 |
| China Everbright Bank Co., Ltd., A Shares | 1,426,900 | 529,524 |
| China Everbright Bank Co., Ltd., H Shares | 1,530,000 | 395,588 |
| China Everbright Environment Group Ltd. | 1,358,000 | 451,739 |
| China Evergrande Group *(a) | 7,014,000 | 737,173 |
| China Gas Holdings Ltd. | 764,000 | 678,034 |
| China Hongqiao Group Ltd. | 924,500 | 654,314 |
| China Jinmao Holdings Group Ltd. | 3,274,000 | 433,782 |
| China Life Insurance Co., Ltd., H Shares | 815,000 | 888,722 |
| China Mengniu Dairy Co., Ltd. | 274,000 | 877,115 |
| China Merchants Bank Co., Ltd., A Shares | 222,500 | 816,596 |
| China Merchants Bank Co., Ltd., H Shares | 610,650 | 1,999,207 |
| China Minsheng Banking Corp., Ltd., A Shares | 1,817,300 | 817,765 |
| China Minsheng Banking Corp., Ltd., H Shares | 4,599,910 | 1,335,926 |
| China National Building Material Co., Ltd., H Shares | 2,588,000 | 1,502,764 |
| China Oriental Group Co., Ltd. | 4,198,000 | 582,755 |
| China Overseas Land & Investment Ltd. | 1,373,000 | 2,623,691 |
| China Pacific Insurance Group Co., Ltd., A Shares | 99,000 | 257,101 |
| China Pacific Insurance Group Co., Ltd., H Shares | 579,000 | 933,344 |
| China Petroleum & Chemical Corp., A Shares | 2,459,700 | 1,367,034 |
| China Petroleum & Chemical Corp., H Shares | 27,844,400 | 11,035,469 |
| China Railway Group Ltd., A Shares | 780,000 | 531,069 |
| China Railway Group Ltd., H Shares | 1,947,000 | 846,584 |
| China Resources Cement Holdings Ltd. | 998,000 | 360,743 |
| China Resources Land Ltd. | 697,000 | 2,180,762 |
| China Resources Pharmaceutical Group Ltd. | 1,455,500 | 981,852 |
| China Resources Power Holdings Co., Ltd. | 820,000 | 1,191,520 |
| China Shenhua Energy Co., Ltd., A Shares | 148,900 | 568,238 |
| China Shenhua Energy Co., Ltd., H Shares | 1,061,000 | 2,787,096 |
| China State Construction Engineering Corp., Ltd., A Shares | 1,642,400 | 1,062,396 |
| China Taiping Insurance Holdings Co., Ltd. | 822,600 | 569,685 |
| China Tower Corp., Ltd., H Shares | 12,886,000 | 1,165,859 |
| China United Network Communications Ltd., A Shares * | 1,124,550 | 515,618 |
| China Vanke Co., Ltd., A Shares | 289,100 | 533,053 |
| China Vanke Co., Ltd., H Shares | 806,100 | 1,034,490 |
| CITIC Ltd. | 3,119,000 | 2,791,019 |
| Country Garden Holdings Co., Ltd. | 5,985,289 | 771,453 |
| CRRC Corp., Ltd., A Shares | 454,930 | 294,753 |
| CRRC Corp., Ltd., H Shares | 1,056,000 | 320,182 |
| CSPC Pharmaceutical Group Ltd. | 828,000 | 850,490 |
| Dongfeng Motor Group Co., Ltd., H Shares | 1,359,000 | 614,817 |
| SECURITY | NUMBER OF SHARES | VALUE ($) |
| ENN Energy Holdings Ltd. | 89,300 | 887,825 |
| Fosun International Ltd. | 1,218,000 | 744,322 |
| Geely Automobile Holdings Ltd. | 937,000 | 1,008,382 |
| Guangzhou R&F Properties Co., Ltd., H Shares * | 5,000,946 | 682,328 |
| Haier Smart Home Co., Ltd., A Shares | 50,900 | 144,512 |
| Haier Smart Home Co., Ltd., H Shares | 272,200 | 681,313 |
| Hengan International Group Co., Ltd. | 204,000 | 790,959 |
| Huaneng Power International, Inc., A Shares * | 232,200 | 212,286 |
| Huaneng Power International, Inc., H Shares * | 2,020,000 | 722,803 |
| Industrial & Commercial Bank of China Ltd., A Shares | 1,929,000 | 1,092,284 |
| Industrial & Commercial Bank of China Ltd., H Shares | 29,441,172 | 12,782,337 |
| Industrial Bank Co., Ltd., A Shares | 413,500 | 848,490 |
| JD.com, Inc., A Shares | 121,421 | 2,211,138 |
| Jiangxi Copper Co., Ltd., A Shares | 92,900 | 195,303 |
| Jiangxi Copper Co., Ltd., H Shares | 725,000 | 792,252 |
| Kingboard Holdings Ltd. | 359,000 | 886,248 |
| Kunlun Energy Co., Ltd. | 1,922,000 | 1,148,721 |
| Legend Holdings Corp., H Shares | 675,300 | 567,632 |
| Longfor Group Holdings Ltd. | 381,500 | 486,101 |
| Meituan, B Shares * | 48,300 | 773,309 |
| NetEase, Inc. | 102,443 | 1,136,630 |
| Nine Dragons Paper Holdings Ltd. | 807,000 | 478,282 |
| PetroChina Co., Ltd., H Shares | 13,040,000 | 4,988,152 |
| PICC Property & Casualty Co., Ltd., H Shares | 2,744,000 | 2,530,821 |
| Ping An Insurance Group Co. of China Ltd., A Shares | 206,300 | 1,018,925 |
| Ping An Insurance Group Co. of China Ltd., H Shares | 1,647,500 | 6,595,586 |
| Postal Savings Bank of China Co., Ltd., A Shares | 241,300 | 127,713 |
| Postal Savings Bank of China Co., Ltd., H Shares | 1,989,000 | 922,419 |
| SAIC Motor Corp., Ltd., A Shares | 374,000 | 702,311 |
| Shanghai Pharmaceuticals Holding Co., Ltd., A Shares | 63,700 | 152,877 |
| Shanghai Pharmaceuticals Holding Co., Ltd., H Shares | 426,800 | 578,425 |
| Shanghai Pudong Development Bank Co., Ltd., A Shares | 1,055,400 | 956,914 |
| Shenzhou International Group Holdings Ltd. | 60,900 | 422,828 |
| Sinopharm Group Co., Ltd., H Shares | 874,800 | 1,659,593 |
| Sunac China Holdings Ltd. *(a) | 226,816 | 66,170 |
| Tencent Holdings Ltd. | 297,100 | 7,806,829 |
| Tingyi Cayman Islands Holding Corp. | 415,768 | 649,886 |
| Trip.com Group Ltd., ADR * | 29,716 | 672,473 |
| Vipshop Holdings Ltd., ADR * | 143,437 | 999,756 |
| Weichai Power Co., Ltd., A Shares | 117,400 | 145,764 |
| Weichai Power Co., Ltd., H Shares | 454,000 | 434,860 |
| Xiaomi Corp., B Shares * | 1,200,200 | 1,347,912 |
| Yankuang Energy Group Co., Ltd., A Shares | 15,100 | 83,542 |
| Yankuang Energy Group Co., Ltd., H Shares | 382,000 | 1,073,999 |
| Yum China Holdings, Inc. | 49,800 | 2,015,846 |
| Zhongsheng Group Holdings Ltd. | 114,500 | 434,563 |
| Zijin Mining Group Co., Ltd., A Shares | 140,300 | 151,832 |
| Zijin Mining Group Co., Ltd., H Shares | 504,000 | 480,734 |
| 173,865,499 | ||
| SECURITY | NUMBER OF SHARES | VALUE ($) |
| Colombia 0.3% | ||
| Bancolombia S.A. | 91,254 | 655,939 |
| Ecopetrol S.A. | 1,847,904 | 916,702 |
| 1,572,641 | ||
| Czech Republic 0.2% | ||
| CEZ A/S | 30,043 | 982,511 |
| Egypt 0.1% | ||
| Commercial International Bank Egypt S.A.E., GDR | 570,293 | 723,737 |
| Greece 0.4% | ||
| Alpha Services and Holdings S.A. * | 1,169,805 | 1,083,350 |
| Eurobank Ergasias Services & Holdings S.A., A Shares * | 711,296 | 702,193 |
| Galaxy Cosmos Mezz plc * | 43,326 | 6,997 |
| Hellenic Telecommunications Organization S.A. | 54,620 | 857,782 |
| 2,650,322 | ||
| Hungary 0.4% | ||
| MOL Hungarian Oil & Gas plc | 243,743 | 1,463,455 |
| OTP Bank Nyrt | 44,931 | 980,207 |
| 2,443,662 | ||
| India 11.9% | ||
| Axis Bank Ltd. | 189,476 | 2,077,884 |
| Bharat Petroleum Corp., Ltd. | 575,206 | 2,111,735 |
| Bharti Airtel Ltd. | 206,727 | 2,079,010 |
| Coal India Ltd. | 670,445 | 1,990,261 |
| GAIL India Ltd. | 1,037,001 | 1,143,095 |
| Grasim Industries Ltd. | 64,146 | 1,337,108 |
| HCL Technologies Ltd. | 114,995 | 1,447,629 |
| Hero MotoCorp Ltd. | 34,430 | 1,114,439 |
| Hindalco Industries Ltd. | 376,163 | 1,842,851 |
| Hindustan Petroleum Corp., Ltd. | 656,932 | 1,698,702 |
| Hindustan Unilever Ltd. | 36,306 | 1,120,171 |
| Housing Development Finance Corp., Ltd. | 102,350 | 3,060,138 |
| ICICI Bank Ltd. | 93,522 | 1,028,307 |
| Indian Oil Corp., Ltd. | 3,329,384 | 2,745,882 |
| Infosys Ltd. | 310,866 | 5,793,939 |
| ITC Ltd. | 385,962 | 1,627,343 |
| JSW Steel Ltd. | 148,995 | 1,213,961 |
| Larsen & Toubro Ltd. | 71,453 | 1,749,392 |
| Mahindra & Mahindra Ltd. | 135,996 | 2,219,595 |
| Maruti Suzuki India Ltd. | 16,445 | 1,895,949 |
| NTPC Ltd. | 1,238,694 | 2,592,989 |
| Oil & Natural Gas Corp., Ltd. | 1,904,269 | 3,076,119 |
| Power Finance Corp., Ltd. | 657,234 | 915,634 |
| Power Grid Corp. of India Ltd. | 468,653 | 1,293,049 |
| Rajesh Exports Ltd. | 172,086 | 1,437,904 |
| Reliance Industries Ltd. | 292,005 | 9,010,328 |
| State Bank of India | 256,777 | 1,783,197 |
| Sun Pharmaceutical Industries Ltd. | 88,030 | 1,081,603 |
| Tata Consultancy Services Ltd. | 86,556 | 3,340,375 |
| Tata Motors Ltd. * | 462,131 | 2,313,817 |
| Tata Motors Ltd., A Shares, DVR * | 96,091 | 273,435 |
| Tata Steel Ltd. | 2,068,286 | 2,536,779 |
| Tech Mahindra Ltd. | 69,329 | 891,632 |
| Vedanta Ltd. | 445,892 | 1,510,933 |
| SECURITY | NUMBER OF SHARES | VALUE ($) |
| Wipro Ltd. | 161,133 | 754,014 |
| 72,109,199 | ||
| Indonesia 2.1% | ||
| PT Astra International Tbk | 5,268,100 | 2,251,220 |
| PT Bank Central Asia Tbk | 2,483,500 | 1,403,866 |
| PT Bank Mandiri (Persero) Tbk | 2,880,200 | 1,945,728 |
| PT Bank Negara Indonesia (Persero) Tbk | 1,454,800 | 877,147 |
| PT Bank Rakyat Indonesia (Persero) Tbk | 7,022,396 | 2,095,013 |
| PT Telkom Indonesia (Persero) Tbk | 10,616,500 | 2,981,653 |
| PT United Tractors Tbk | 479,600 | 992,070 |
| 12,546,697 | ||
| Kuwait 0.9% | ||
| Kuwait Finance House KSCP | 629,485 | 1,646,303 |
| Mobile Telecommunications Co. KSCP | 608,936 | 1,176,995 |
| National Bank of Kuwait SAKP | 723,615 | 2,518,264 |
| 5,341,562 | ||
| Malaysia 1.9% | ||
| Axiata Group Berhad | 1,487,313 | 895,078 |
| CIMB Group Holdings Berhad | 1,517,453 | 1,772,572 |
| Genting Berhad | 1,014,800 | 953,630 |
| Malayan Banking Berhad | 1,271,940 | 2,310,548 |
| Petronas Chemicals Group Berhad | 449,100 | 827,972 |
| Public Bank Berhad | 1,828,625 | 1,729,329 |
| Tenaga Nasional Berhad | 1,796,700 | 3,199,601 |
| 11,688,730 | ||
| Mexico 4.6% | ||
| Alfa S.A.B. de C.V., A Shares | 2,082,400 | 1,382,101 |
| America Movil S.A.B. de C.V., Series L | 7,814,719 | 7,395,446 |
| Cemex S.A.B. de C.V., Series CPO * | 6,133,756 | 2,383,784 |
| Fomento Economico Mexicano S.A.B. de C.V. | 475,415 | 3,412,824 |
| Grupo Bimbo S.A.B. de C.V., Series A | 423,200 | 1,638,504 |
| Grupo Financiero Banorte S.A.B. de C.V., O Shares | 531,100 | 4,317,047 |
| Grupo Mexico S.A.B. de C.V., Series B | 570,636 | 2,068,782 |
| Grupo Televisa S.A.B., Series CPO | 657,817 | 697,891 |
| Nemak S.A.B. de C.V. * | 2,479,000 | 680,652 |
| Orbia Advance Corp. S.A.B. de C.V. | 344,500 | 581,614 |
| Sitios Latinoamerica S.A.B. de C.V. * | 381,965 | 111,430 |
| Wal-Mart de Mexico S.A.B. de C.V. | 825,537 | 3,188,732 |
| 27,858,807 | ||
| Qatar 0.8% | ||
| Ooredoo QPSC | 459,856 | 1,232,870 |
| Qatar Fuel QSC | 150,952 | 790,847 |
| Qatar National Bank QPSC | 500,793 | 2,742,166 |
| 4,765,883 | ||
| Saudi Arabia 2.7% | ||
| Al Rajhi Bank * | 85,531 | 1,939,490 |
| Banque Saudi Fransi | 62,630 | 719,931 |
| Riyad Bank | 109,299 | 1,044,614 |
| Saudi Arabian Oil Co. | 242,986 | 2,255,036 |
| Saudi Basic Industries Corp. | 157,084 | 3,688,413 |
| Saudi Electricity Co. | 213,596 | 1,533,722 |
| Saudi Telecom Co. | 256,312 | 2,753,763 |
| SECURITY | NUMBER OF SHARES | VALUE ($) |
| The Saudi National Bank | 132,124 | 2,088,251 |
| 16,023,220 | ||
| South Africa 5.5% | ||
| Absa Group Ltd. | 232,854 | 2,528,614 |
| AngloGold Ashanti Ltd. | 89,365 | 1,167,082 |
| Aspen Pharmacare Holdings Ltd. | 73,657 | 605,897 |
| Barloworld Ltd. | 141,746 | 794,434 |
| Bid Corp., Ltd. | 83,559 | 1,344,495 |
| Exxaro Resources Ltd. | 69,132 | 770,353 |
| FirstRand Ltd. | 930,081 | 3,251,545 |
| Gold Fields Ltd. | 149,432 | 1,197,070 |
| Impala Platinum Holdings Ltd. | 62,936 | 644,380 |
| MTN Group Ltd. | 485,597 | 3,431,934 |
| MultiChoice Group | 127,383 | 832,380 |
| Naspers Ltd., N Shares | 11,979 | 1,234,817 |
| Nedbank Group Ltd. | 132,171 | 1,565,437 |
| Old Mutual Ltd. | 1,494,735 | 848,459 |
| Sanlam Ltd. | 326,872 | 952,813 |
| Sappi Ltd. * | 380,688 | 1,172,825 |
| Sasol Ltd. | 173,885 | 2,923,014 |
| Shoprite Holdings Ltd. | 106,347 | 1,353,643 |
| Standard Bank Group Ltd. | 394,296 | 3,680,847 |
| The Bidvest Group Ltd. | 87,039 | 1,006,821 |
| Vodacom Group Ltd. | 157,684 | 1,074,066 |
| Woolworths Holdings Ltd. | 269,748 | 925,017 |
| 33,305,943 | ||
| Taiwan 17.4% | ||
| Acer, Inc. | 1,159,496 | 793,374 |
| ASE Technology Holding Co., Ltd. | 864,000 | 2,133,345 |
| Asia Cement Corp. | 526,000 | 608,206 |
| Asustek Computer, Inc. | 269,041 | 1,967,030 |
| AUO Corp. | 3,245,440 | 1,693,749 |
| Catcher Technology Co., Ltd. | 322,000 | 1,691,486 |
| Cathay Financial Holding Co., Ltd. | 1,224,599 | 1,433,157 |
| Chailease Holding Co., Ltd. | 98,150 | 452,735 |
| Cheng Shin Rubber Industry Co., Ltd. | 653,000 | 653,318 |
| China Development Financial Holding Corp. | 1,587,000 | 577,471 |
| China Steel Corp. | 2,477,198 | 2,062,070 |
| Chunghwa Telecom Co., Ltd. | 638,906 | 2,202,894 |
| Compal Electronics, Inc. | 3,526,305 | 2,306,444 |
| CTBC Financial Holding Co., Ltd. | 2,614,201 | 1,651,487 |
| Delta Electronics, Inc. | 247,590 | 1,970,027 |
| E.Sun Financial Holding Co., Ltd. | 997,347 | 716,757 |
| Far Eastern New Century Corp. | 1,436,817 | 1,432,086 |
| Far EasTone Telecommunications Co., Ltd. | 328,491 | 720,250 |
| First Financial Holding Co., Ltd. | 1,188,998 | 912,084 |
| Formosa Chemicals & Fibre Corp. | 1,046,442 | 2,255,581 |
| Formosa Petrochemical Corp. | 401,330 | 1,032,585 |
| Formosa Plastics Corp. | 820,732 | 2,114,543 |
| Foxconn Technology Co., Ltd. | 486,317 | 680,754 |
| Fubon Financial Holding Co., Ltd. | 1,239,986 | 1,958,599 |
| Hon Hai Precision Industry Co., Ltd. | 6,080,572 | 19,312,362 |
| Hotai Motor Co., Ltd. | 38,000 | 687,512 |
| Innolux Corp. | 4,744,163 | 1,739,834 |
| Inventec Corp. | 1,853,639 | 1,401,817 |
| Largan Precision Co., Ltd. | 19,050 | 1,089,888 |
| Lite-On Technology Corp. | 602,167 | 1,192,429 |
| MediaTek, Inc. | 111,838 | 2,038,605 |
| Mega Financial Holding Co., Ltd. | 1,260,698 | 1,167,971 |
| Micro-Star International Co., Ltd. | 161,000 | 545,339 |
| Nan Ya Plastics Corp. | 1,091,622 | 2,312,972 |
| Novatek Microelectronics Corp. | 65,000 | 484,298 |
| Pegatron Corp. | 1,618,264 | 2,958,313 |
| SECURITY | NUMBER OF SHARES | VALUE ($) |
| Pou Chen Corp. | 1,519,267 | 1,282,579 |
| Powertech Technology, Inc. | 265,000 | 612,023 |
| President Chain Store Corp. | 92,237 | 766,950 |
| Quanta Computer, Inc. | 879,500 | 1,862,874 |
| Shin Kong Financial Holding Co., Ltd. | 2,364,000 | 586,087 |
| Synnex Technology International Corp. | 570,850 | 929,407 |
| Taiwan Cement Corp. | 1,195,926 | 1,121,400 |
| Taiwan Cooperative Financial Holding Co., Ltd. | 904,910 | 701,136 |
| Taiwan Mobile Co., Ltd. | 266,196 | 784,902 |
| Taiwan Semiconductor Manufacturing Co., Ltd. | 1,478,803 | 17,778,470 |
| Uni-President Enterprises Corp. | 1,135,678 | 2,306,288 |
| United Microelectronics Corp. * | 1,554,965 | 1,869,785 |
| Walsin Lihwa Corp. | 1,029,420 | 1,138,715 |
| Wistron Corp. | 2,219,682 | 1,792,112 |
| WPG Holdings Ltd. | 947,880 | 1,290,592 |
| Yageo Corp. | 55,715 | 631,638 |
| Yuanta Financial Holding Co., Ltd. | 1,462,725 | 893,151 |
| 105,299,481 | ||
| Thailand 3.3% | ||
| Advanced Info Service PCL NVDR | 191,775 | 963,673 |
| Bangkok Bank PCL NVDR | 265,300 | 1,015,937 |
| Charoen Pokphand Foods PCL NVDR | 1,627,700 | 1,082,200 |
| CP ALL PCL NVDR | 760,900 | 1,200,184 |
| Krung Thai Bank PCL NVDR | 2,420,100 | 1,115,161 |
| PTT Exploration & Production PCL NVDR | 309,500 | 1,479,800 |
| PTT Global Chemical PCL NVDR | 1,204,900 | 1,380,464 |
| PTT PCL NVDR | 7,325,870 | 6,932,960 |
| SCB X PCL NVDR | 640,800 | 1,790,363 |
| Thai Oil PCL NVDR | 635,585 | 913,912 |
| The Siam Cement PCL NVDR | 278,800 | 2,374,341 |
| 20,248,995 | ||
| Turkey 2.4% | ||
| Akbank T.A.S. | 2,352,092 | 1,849,011 |
| BIM Birlesik Magazalar A/S | 163,209 | 1,175,084 |
| Eregli Demir ve Celik Fabrikalari T.A.S. | 582,885 | 928,914 |
| Haci Omer Sabanci Holding A/S | 723,601 | 1,303,139 |
| KOC Holding A/S | 452,854 | 1,350,913 |
| Turk Hava Yollari AO * | 427,280 | 2,325,589 |
| Turkcell Iletisim Hizmetleri A/S | 1,023,921 | 1,413,252 |
| Turkiye Garanti Bankasi A/S | 1,016,067 | 1,283,908 |
| Turkiye Is Bankasi A/S, Class C | 2,924,411 | 1,464,978 |
| Turkiye Petrol Rafinerileri A/S * | 82,938 | 1,680,146 |
| 14,774,934 | ||
| United Arab Emirates 1.4% | ||
| Abu Dhabi Commercial Bank PJSC | 432,159 | 1,112,449 |
| Dubai Islamic Bank PJSC | 489,298 | 775,183 |
| SECURITY | NUMBER OF SHARES | VALUE ($) |
| Emaar Properties PJSC | 953,206 | 1,573,509 |
| Emirates Telecommunications Group Co. PJSC | 385,319 | 2,708,044 |
| First Abu Dhabi Bank PJSC | 410,769 | 2,003,221 |
| 8,172,406 | ||
| Total Common Stocks (Cost $569,841,719) | 565,804,628 | |
| PREFERRED STOCKS 5.7% OF NET ASSETS | ||
| Brazil 5.5% | ||
| Banco Bradesco S.A. | 1,711,996 | 6,582,180 |
| Centrais Eletricas Brasileiras S.A., B Shares | 91,320 | 942,635 |
| Cia Energetica de Minas Gerais | 537,023 | 1,182,064 |
| Cia Paranaense de Energia, B Shares | 472,400 | 676,752 |
| Gerdau S.A. | 367,106 | 1,830,022 |
| Itau Unibanco Holding S.A. | 1,711,179 | 10,070,630 |
| Metalurgica Gerdau S.A. | 485,100 | 1,056,505 |
| Petroleo Brasileiro S.A. | 1,930,054 | 11,138,304 |
| 33,479,092 | ||
| Colombia 0.2% | ||
| Bancolombia S.A. | 148,245 | 938,022 |
| Total Preferred Stocks (Cost $25,074,153) | 34,417,114 | |
| Total Investments in Securities (Cost $594,915,872) | 600,221,742 | |
| NUMBER OF CONTRACTS | NOTIONAL AMOUNT ($) | CURRENT VALUE/ UNREALIZED DEPRECIATION ($) | |
| FUTURES CONTRACTS | |||
| Long | |||
| MSCI Emerging Markets Index, expires 12/16/22 | 85 | 3,627,800 | (28,410) |
| * | Non-income producing security. |
| (a) | Fair-valued using significant unobservable inputs (see financial note 2(a), Securities for which no quoted value is available, for additional information). |
| ADR — | American Depositary Receipt |
| DVR — | Differential Voting Rights |
| GDR — | Global Depositary Receipt |
| NVDR — | Non-Voting Depositary Receipt |
| DESCRIPTION | QUOTED PRICES IN ACTIVE MARKETS FOR IDENTICAL ASSETS (LEVEL 1) | OTHER SIGNIFICANT OBSERVABLE INPUTS (LEVEL 2) | SIGNIFICANT UNOBSERVABLE INPUTS (LEVEL 3) | TOTAL |
| Assets | ||||
| Common Stocks1 | $— | $274,138,506 | $— | $274,138,506 |
| Brazil | 46,624,325 | — | — | 46,624,325 |
| Chile | 4,230,418 | 575,656 | — | 4,806,074 |
| China | 1,672,229 | 171,389,927 | 803,343 | 173,865,499 |
| Colombia | 1,572,641 | — | — | 1,572,641 |
| Czech Republic | 982,511 | — | — | 982,511 |
| Greece | 6,997 | 2,643,325 | — | 2,650,322 |
| Mexico | 27,858,807 | — | — | 27,858,807 |
| South Africa | 5,543,567 | 27,762,376 | — | 33,305,943 |
| Preferred Stocks1 | 34,417,114 | — | — | 34,417,114 |
| Liabilities | ||||
| Futures Contracts2 | (28,410) | — | — | (28,410) |
| Total | $122,880,199 | $476,509,790 | $803,343 | $600,193,332 |
| 1 | As categorized in the Portfolio Holdings. |
| 2 | Futures contracts are reported at cumulative unrealized appreciation or depreciation. |
| Assets | ||
| Investments in securities, at value - unaffiliated (cost $594,915,872) | $600,221,742 | |
| Cash | 2,638,938 | |
| Foreign currency, at value (cost $887,269) | 887,333 | |
| Deposit with broker for futures contracts | 100,282 | |
| Receivables: | ||
| Fund shares sold | 4,283,100 | |
| Dividends | 466,838 | |
| Foreign tax reclaims | 12,248 | |
| Interest | 4,782 | |
| Income from securities on loan | 1,932 | |
| Investments sold | + | 73 |
| Total assets | 608,617,268 | |
| Liabilities | ||
| Payables: | ||
| Foreign capital gains tax | 2,143,709 | |
| Fund shares redeemed | 2,118,881 | |
| Investment adviser fees | 188,848 | |
| Variation margin on futures contracts | 6,103 | |
| Accrued expenses | + | 1,016 |
| Total liabilities | 4,458,557 | |
| Net assets | $604,158,711 | |
| Net Assets by Source | ||
| Capital received from investors | $730,873,956 | |
| Total distributable loss | + | (126,715,245) |
| Net assets | $604,158,711 | |
| Net Asset Value (NAV) | ||||
| Net Assets | ÷ | Shares Outstanding | = | NAV |
| $604,158,711 | 82,145,910 | $7.35 | ||
| For the period November 1, 2021 through October 31, 2022 | ||
| Investment Income | ||
| Dividends received from securities - unaffiliated (net of foreign withholding tax of $4,322,788) | $41,811,129 | |
| Interest received from securities - unaffiliated | 2,705 | |
| Securities on loan, net | + | 34,238 |
| Total investment income | 41,848,072 | |
| Expenses | ||
| Investment adviser fees | 2,620,279 | |
| Proxy fees1 | + | 30,758 |
| Total expenses | – | 2,651,037 |
| Net investment income | 39,197,035 | |
| REALIZED AND UNREALIZED GAINS (LOSSES) | ||
| Net realized losses on sales of securities - unaffiliated (net of foreign capital gains tax paid of $902,432) | (50,891,721) | |
| Net realized losses on futures contracts | (2,191,883) | |
| Net realized losses on foreign currency transactions | + | (718,818) |
| Net realized losses | (53,802,422) | |
| Net change in unrealized appreciation (depreciation) on securities - unaffiliated (net of change in foreign capital gains tax of $1,329,850) | (172,204,961) | |
| Net change in unrealized appreciation (depreciation) on futures contracts | (12,712) | |
| Net change in unrealized appreciation (depreciation) on foreign currency translations | + | 2,280 |
| Net change in unrealized appreciation (depreciation) | + | (172,215,393) |
| Net realized and unrealized losses | (226,017,815) | |
| Decrease in net assets resulting from operations | ($186,820,780) | |
| 1 | Proxy fees are non-routine expenses (see financial note 2(e) for additional information). |
| OPERATIONS | |||
| 11/1/21-10/31/22 | 11/1/20-10/31/21 | ||
| Net investment income | $39,197,035 | $26,482,022 | |
| Net realized gains (losses) | (53,802,422) | 10,993,707 | |
| Net change in unrealized appreciation (depreciation) | + | (172,215,393) | 184,471,344 |
| Increase (decrease) in net assets resulting from operations | ($186,820,780) | $221,947,073 | |
| DISTRIBUTIONS TO SHAREHOLDERS | |||
| Total distributions | ($30,189,359) | ($18,875,238) | |
| TRANSACTIONS IN FUND SHARES | |||||
| 11/1/21-10/31/22 | 11/1/20-10/31/21 | ||||
| SHARES | VALUE | SHARES | VALUE | ||
| Shares sold | 31,322,904 | $273,449,095 | 19,964,352 | $189,960,789 | |
| Shares reinvested | 2,271,110 | 21,734,518 | 1,622,720 | 14,425,984 | |
| Shares redeemed | + | (20,544,222) | (181,666,566) | (25,791,975) | (249,940,985) |
| Net transactions in fund shares | 13,049,792 | $113,517,047 | (4,204,903) | ($45,554,212) | |
| SHARES OUTSTANDING AND NET ASSETS | |||||
| 11/1/21-10/31/22 | 11/1/20-10/31/21 | ||||
| SHARES | NET ASSETS | SHARES | NET ASSETS | ||
| Beginning of period | 69,096,118 | $707,651,803 | 73,301,021 | $550,134,180 | |
| Total increase (decrease) | + | 13,049,792 | (103,493,092) | (4,204,903) | 157,517,623 |
| End of period | 82,145,910 | $604,158,711 | 69,096,118 | $707,651,803 | |
| SCHWAB CAPITAL TRUST (ORGANIZED MAY 7, 1993) | |
| Schwab Fundamental US Large Company Index Fund | Schwab Target 2015 Fund |
| Schwab Fundamental US Small Company Index Fund | Schwab Target 2020 Fund |
| Schwab Fundamental International Large Company Index Fund | Schwab Target 2025 Fund |
| Schwab Fundamental International Small Company Index Fund | Schwab Target 2030 Fund |
| Schwab Fundamental Emerging Markets Large Company Index Fund | Schwab Target 2035 Fund |
| Schwab Fundamental Global Real Estate Index Fund | Schwab Target 2040 Fund |
| Schwab S&P 500 Index Fund | Schwab Target 2045 Fund |
| Schwab Small-Cap Index Fund® | Schwab Target 2050 Fund |
| Schwab U.S. Large-Cap Growth Index Fund | Schwab Target 2055 Fund |
| Schwab U.S. Large-Cap Value Index Fund | Schwab Target 2060 Fund |
| Schwab U.S. Mid-Cap Index Fund | Schwab Target 2065 Fund |
| Schwab Total Stock Market Index Fund® | Schwab Target 2010 Index Fund |
| Schwab International Index Fund® | Schwab Target 2015 Index Fund |
| Schwab MarketTrack All Equity Portfolio™ | Schwab Target 2020 Index Fund |
| Schwab MarketTrack Growth Portfolio™ | Schwab Target 2025 Index Fund |
| Schwab MarketTrack Balanced Portfolio™ | Schwab Target 2030 Index Fund |
| Schwab MarketTrack Conservative Portfolio™ | Schwab Target 2035 Index Fund |
| Schwab International Opportunities Fund | Schwab Target 2040 Index Fund |
| Schwab Balanced Fund | Schwab Target 2045 Index Fund |
| Schwab Core Equity Fund | Schwab Target 2050 Index Fund |
| Schwab Dividend Equity Fund | Schwab Target 2055 Index Fund |
| Schwab Large-Cap Growth Fund | Schwab Target 2060 Index Fund |
| Schwab Small-Cap Equity Fund | Schwab Target 2065 Index Fund |
| Schwab Health Care Fund | Schwab Monthly Income Fund - Target Payout |
| Schwab International Core Equity Fund | Schwab Monthly Income Fund - Flexible Payout |
| Schwab Target 2010 Fund | Schwab Monthly Income Fund - Income Payout |
| SCHWAB FUNDAMENTAL US LARGE COMPANY INDEX FUND | SCHWAB FUNDAMENTAL US SMALL COMPANY INDEX FUND | SCHWAB FUNDAMENTAL INTERNATIONAL LARGE COMPANY INDEX FUND | SCHWAB FUNDAMENTAL INTERNATIONAL SMALL COMPANY INDEX FUND | SCHWAB FUNDAMENTAL EMERGING MARKETS LARGE COMPANY INDEX FUND |
| 0.25% | 0.25% | 0.25% | 0.39% | 0.39% |
| UNDERLYING FUNDS | |||||
| SCHWAB FUNDAMENTAL US LARGE COMPANY INDEX FUND | SCHWAB FUNDAMENTAL US SMALL COMPANY INDEX FUND | SCHWAB FUNDAMENTAL INTERNATIONAL LARGE COMPANY INDEX FUND | SCHWAB FUNDAMENTAL INTERNATIONAL SMALL COMPANY INDEX FUND | SCHWAB FUNDAMENTAL EMERGING MARKETS LARGE COMPANY INDEX FUND | |
| Schwab MarketTrack All Equity Portfolio | 1.5% | 2.0% | 2.7% | 6.5% | 5.7% |
| Schwab MarketTrack Balanced Portfolio | 0.7% | 0.9% | 0.6% | 3.8% | 2.0% |
| Schwab MarketTrack Conservative Portfolio | 0.2% | 0.3% | 0.3% | 0.7% | 0.6% |
| Schwab MarketTrack Growth Portfolio | 1.5% | 1.9% | 2.1% | 4.9% | 4.3% |
| Schwab Target 2010 Fund | 0.0%* | —% | —% | —% | —% |
| Schwab Target 2015 Fund | 0.0%* | —% | —% | —% | —% |
| Schwab Target 2020 Fund | 0.1% | —% | —% | —% | —% |
| Schwab Target 2025 Fund | 0.1% | —% | —% | —% | —% |
| Schwab Target 2030 Fund | 0.3% | —% | —% | —% | —% |
| Schwab Target 2035 Fund | 0.3% | —% | —% | —% | —% |
| Schwab Target 2040 Fund | 0.6% | —% | —% | —% | —% |
| Schwab Target 2045 Fund | 0.2% | —% | —% | —% | —% |
| Schwab Target 2050 Fund | 0.2% | —% | —% | —% | —% |
| Schwab Target 2055 Fund | 0.1% | —% | —% | —% | —% |
| Schwab Target 2060 Fund | 0.0%* | —% | —% | —% | —% |
| Schwab Target 2065 Fund | 0.0%* | —% | —% | —% | —% |
| * | Less than 0.05% |
| PURCHASE COST | SALE PROCEEDS | REALIZED GAINS (LOSSES) | |
| Schwab Fundamental US Large Company Index Fund | $275,195,702 | $130,460,842 | ($9,190,029) |
| Schwab Fundamental US Small Company Index Fund | 100,479,176 | 91,693,074 | 29,224,586 |
| Schwab Fundamental International Large Company Index Fund | 39,628,775 | 22,615,505 | (909,261) |
| Schwab Fundamental International Small Company Index Fund | 25,663,729 | 30,997,271 | 8,483,238 |
| Schwab Fundamental Emerging Markets Large Company Index Fund | 41,242,313 | 4,508,008 | (679,109) |
| 7. Derivatives: |
| NOTIONAL AMOUNTS | NUMBER OF CONTRACTS | |
| Schwab Fundamental US Large Company Index Fund | $33,366,107 | 159 |
| Schwab Fundamental US Small Company Index Fund | 8,993,698 | 92 |
| Schwab Fundamental International Large Company Index Fund | 12,604,194 | 126 |
| Schwab Fundamental International Small Company Index Fund | 5,132,829 | 51 |
| Schwab Fundamental Emerging Markets Large Company Index Fund | 5,441,338 | 105 |
| PURCHASES OF SECURITIES | SALES OF SECURITIES | |
| Schwab Fundamental US Large Company Index Fund | $1,521,761,726 | $854,218,920 |
| Schwab Fundamental US Small Company Index Fund | 811,573,101 | 602,501,681 |
| Schwab Fundamental International Large Company Index Fund | 689,418,342 | 199,204,950 |
| Schwab Fundamental International Small Company Index Fund | 239,120,983 | 215,965,072 |
| Schwab Fundamental Emerging Markets Large Company Index Fund | 276,638,354 | 158,477,990 |
| IN-KIND PURCHASES OF SECURITIES | IN-KIND SALES OF SECURITIES | |
| Schwab Fundamental US Large Company Index Fund | $— | $564,130,721 |
| Schwab Fundamental US Small Company Index Fund | — | 194,547,537 |
| TAX COST | GROSS UNREALIZED APPRECIATION | GROSS UNREALIZED DEPRECIATION | NET UNREALIZED APPRECIATION (DEPRECIATION) | |
| Schwab Fundamental US Large Company Index Fund | $4,070,929,427 | $2,686,277,042 | ($297,398,906) | $2,388,878,136 |
| Schwab Fundamental US Small Company Index Fund | 1,390,862,774 | 457,487,358 | (195,863,175) | 261,624,183 |
| Schwab Fundamental International Large Company Index Fund | 1,696,739,994 | 171,651,471 | (305,347,141) | (133,695,670) |
| Schwab Fundamental International Small Company Index Fund | 591,337,899 | 77,195,447 | (141,140,105) | (63,944,658) |
| Schwab Fundamental Emerging Markets Large Company Index Fund | 651,559,734 | 103,056,162 | (154,422,564) | (51,366,402) |
| UNDISTRIBUTED ORDINARY INCOME | UNDISTRIBUTED LONG-TERM CAPITAL GAINS | NET UNREALIZED APPRECIATION (DEPRECIATION) ON INVESTMENTS | NET OTHER UNREALIZED APPRECIATION (DEPRECIATION) | CAPITAL LOSS CARRYFORWARDS AND OTHER LOSSES | TOTAL | |
| Schwab Fundamental US Large Company Index Fund | $106,067,022 | $— | $2,388,878,136 | $— | ($16,395,504) | $2,478,549,654 |
| Schwab Fundamental US Small Company Index Fund | 11,020,325 | 87,539,598 | 261,624,183 | (11) | — | 360,184,095 |
| Schwab Fundamental International Large Company Index Fund | 41,820,210 | — | (133,695,670) | (344,596) | (36,746,541) | (128,966,597) |
| Schwab Fundamental International Small Company Index Fund | 9,459,557 | 15,959,445 | (63,944,658) | (155,059) | — | (38,680,715) |
| Schwab Fundamental Emerging Markets Large Company Index Fund | 31,083,814 | — | (51,366,402) | (2,064,531) | (104,368,126) | (126,715,245) |
| Schwab Fundamental US Large Company Index Fund | $16,395,504 |
| Schwab Fundamental US Small Company Index Fund | — |
| Schwab Fundamental International Large Company Index Fund | 36,746,541 |
| Schwab Fundamental International Small Company Index Fund | — |
| Schwab Fundamental Emerging Markets Large Company Index Fund | 104,368,126 |
| CURRENT FISCAL YEAR END DISTRIBUTIONS | PRIOR FISCAL YEAR END DISTRIBUTIONS | |||
| ORDINARY INCOME | LONG-TERM CAPITAL GAINS | ORDINARY INCOME | LONG-TERM CAPITAL GAINS | |
| Schwab Fundamental US Large Company Index Fund | $136,690,830 | $187,778,508 | $121,671,839 | $186,884,443 |
| Schwab Fundamental US Small Company Index Fund | 53,750,563 | 155,441,604 | 24,462,415 | — |
| Schwab Fundamental International Large Company Index Fund | 52,079,126 | — | 28,299,152 | — |
| Schwab Fundamental International Small Company Index Fund | 19,730,992 | 19,545,725 | 13,332,524 | — |
| Schwab Fundamental Emerging Markets Large Company Index Fund | 30,189,359 | — | 18,875,238 | — |
Denver, Colorado
December 16, 2022
| FOREIGN TAX CREDIT | FOREIGN SOURCE INCOME | |
| Schwab Fundamental US Large Company Index Fund | $— | $— |
| Schwab Fundamental US Small Company Index Fund | — | — |
| Schwab Fundamental International Large Company Index Fund | 5,298,716 | 63,114,602 |
| Schwab Fundamental International Small Company Index Fund | 2,254,394 | 19,143,325 |
| Schwab Fundamental Emerging Markets Large Company Index Fund | 5,158,974 | 46,133,917 |
| Schwab Fundamental US Large Company Index Fund | 94.01% |
| Schwab Fundamental US Small Company Index Fund | 51.50% |
| Schwab Fundamental International Large Company Index Fund | —% |
| Schwab Fundamental International Small Company Index Fund | —% |
| Schwab Fundamental Emerging Markets Large Company Index Fund | —% |
| Schwab Fundamental US Large Company Index Fund | $130,837,168 |
| Schwab Fundamental US Small Company Index Fund | 28,023,659 |
| Schwab Fundamental International Large Company Index Fund | 48,797,132 |
| Schwab Fundamental International Small Company Index Fund | 15,613,869 |
| Schwab Fundamental Emerging Markets Large Company Index Fund | 22,890,279 |
| Schwab Fundamental US Large Company Index Fund | $187,778,508 |
| Schwab Fundamental US Small Company Index Fund | 155,441,604 |
| Schwab Fundamental International Large Company Index Fund | — |
| Schwab Fundamental International Small Company Index Fund | 19,545,725 |
| Schwab Fundamental Emerging Markets Large Company Index Fund | — |
| Schwab Fundamental US Large Company Index Fund | $2,035,750 |
| Schwab Fundamental US Small Company Index Fund | 5,218,529 |
| Schwab Fundamental International Large Company Index Fund | — |
| Schwab Fundamental International Small Company Index Fund | — |
| Schwab Fundamental Emerging Markets Large Company Index Fund | — |
| Proposal – To elect each of the following individuals as trustees of the Trust: | For | Withheld |
| Walter W. Bettinger II | 1,095,577,106.505 | 115,838,980.968 |
| Richard A. Wurster | 1,117,598,789.555 | 93,817,297.918 |
| Michael J. Beer | 1,116,890,447.505 | 94,525,639.968 |
| Robert W. Burns | 1,117,915,860.110 | 93,500,227.363 |
| Nancy F. Heller | 1,119,878,732.134 | 91,537,355.339 |
| David L. Mahoney | 1,069,125,022.434 | 142,291,065.039 |
| Jane P. Moncreiff | 1,120,187,927.838 | 91,228,159.635 |
| Kiran M. Patel | 1,116,689,111.571 | 94,726,975.902 |
| Kimberly S. Patmore | 1,119,941,056.059 | 91,475,031.414 |
| J. Derek Penn | 1,117,666,014.121 | 93,750,073.352 |
| 1. | the nature, extent and quality of the services provided to each Fund under the Agreement, including the resources of the investment adviser and its affiliates dedicated to the Funds; |
| 2. | each Fund’s investment performance and how it compared to that of certain other comparable mutual funds and benchmark data; |
| 3. | each Fund’s expenses and how those expenses compared to those of certain other similar mutual funds; |
| 4. | the profitability of the investment adviser and its affiliates, including Charles Schwab & Co., Inc. (Schwab), with respect to each Fund, including both direct and indirect benefits accruing to the investment adviser and its affiliates; and |
| 5. | the extent to which economies of scale would be realized as each Fund grows and whether fee levels in the Agreement reflect those economies of scale for the benefit of Fund investors. |
| Independent Trustees | |||
| Name, Year of Birth, and Position(s) with the trust (Terms of office, and length of Time Served1) | Principal Occupations During the Past Five Years | Number of Portfolios in Fund Complex Overseen by the Trustee | Other Directorships |
Michael J. Beer 1961 Trustee (Trustee of The Charles Schwab Family of Funds, Schwab Investments, Schwab Capital Trust, Schwab Annuity Portfolios, Schwab Strategic Trust and Laudus Trust since 2022) | Retired. Director, President and Chief Executive Officer (Dec. 2016 – Sept. 2019), Principal Funds (investment management). | 105 | Director (2016 – 2019), Principal Funds, Inc. |
| Robert W. Burns 1959 Trustee (Trustee of Schwab Strategic Trust since 2009; The Charles Schwab Family of Funds, Schwab Investments, Schwab Capital Trust, Schwab Annuity Portfolios and Laudus Trust since 2016) | Retired/Private Investor. | 105 | None |
| Nancy F. Heller 1956 Trustee (Trustee of The Charles Schwab Family of Funds, Schwab Investments, Schwab Capital Trust, Schwab Annuity Portfolios, Schwab Strategic Trust and Laudus Trust since 2018) | Retired. | 105 | None |
| David L. Mahoney 1954 Trustee (Trustee of The Charles Schwab Family of Funds, Schwab Investments, Schwab Capital Trust, Schwab Annuity Portfolios and Laudus Trust since 2011; Schwab Strategic Trust since 2016) | Private Investor. | 105 | Director (2004 – present), Corcept Therapeutics Incorporated Director (2009 – 2021), Adamas Pharmaceuticals, Inc. Director (2003 – 2019), Symantec Corporation |
| Jane P. Moncreiff 1961 Trustee (Trustee of The Charles Schwab Family of Funds, Schwab Investments, Schwab Capital Trust, Schwab Annuity Portfolios, Schwab Strategic Trust and Laudus Trust since 2019) | Consultant (2018 – present), Fulham Advisers LLC (management consulting); Chief Investment Officer (2009 – 2017), CareGroup Healthcare System, Inc. (healthcare). | 105 | None |
| Independent Trustees (continued) | |||
| Name, Year of Birth, and Position(s) with the trust (Terms of office, and length of Time Served1) | Principal Occupations During the Past Five Years | Number of Portfolios in Fund Complex Overseen by the Trustee | Other Directorships |
| Kiran M. Patel 1948 Trustee (Trustee of The Charles Schwab Family of Funds, Schwab Investments, Schwab Capital Trust, Schwab Annuity Portfolios and Laudus Trust since 2011; Schwab Strategic Trust since 2016) | Retired. | 105 | Director (2008 – present), KLA-Tencor Corporation |
| Kimberly S. Patmore 1956 Trustee (Trustee of The Charles Schwab Family of Funds, Schwab Investments, Schwab Capital Trust, Schwab Annuity Portfolios, Schwab Strategic Trust and Laudus Trust since 2016) | Consultant (2008 – present), Patmore Management Consulting (management consulting). | 105 | None |
J. Derek Penn 1957 Trustee (Trustee of The Charles Schwab Family of Funds, Schwab Investments, Schwab Capital Trust, Schwab Annuity Portfolios, Schwab Strategic Trust and Laudus Trust since 2021) | Head of Equity Sales and Trading (2006 – 2018), BNY Mellon (financial services). | 105 | None |
| Interested Trustees | |||
| Name, Year of Birth, and Position(s) with the trust (Terms of office, and length of Time Served1) | Principal Occupations During the Past Five Years | Number of Portfolios in Fund Complex Overseen by the Trustee | Other Directorships |
| Walter W. Bettinger II2 1960 Chairman and Trustee (Trustee of The Charles Schwab Family of Funds, Schwab Investments, Schwab Capital Trust and Schwab Annuity Portfolios since 2008; Schwab Strategic Trust since 2009; Laudus Trust since 2010) | Co-Chairman of the Board (July 2022 – present), Director and Chief Executive Officer (Oct. 2008 – present) and President (Feb. 2007 – Oct. 2021), The Charles Schwab Corporation; President and Chief Executive Officer (Oct. 2008 – Oct. 2021) and Director (May 2008 – Oct. 2021), Charles Schwab & Co., Inc.; Director (Apr. 2006 – present), Charles Schwab Bank, SSB; Director (Nov. 2017 – present), Charles Schwab Premier Bank, SSB; Director (July 2019 – present), Charles Schwab Trust Bank; Director (May 2008 – present), Chief Executive Officer (Aug. 2017 – present) and President (Aug. 2017 – Nov. 2021), Schwab Holdings, Inc.; Director (Oct. 2020 – present), TD Ameritrade Holding Corporation; Director (July 2016 – Oct. 2021), Charles Schwab Investment Management, Inc. | 105 | Director (2008 – present), The Charles Schwab Corporation |
| Interested Trustees (continued) | |||
| Name, Year of Birth, and Position(s) with the trust (Terms of office, and length of Time Served1) | Principal Occupations During the Past Five Years | Number of Portfolios in Fund Complex Overseen by the Trustee | Other Directorships |
| Richard A. Wurster2 1973 Trustee (Trustee of The Charles Schwab Family of Funds, Schwab Investments, Schwab Capital Trust, Schwab Annuity Portfolios, Schwab Strategic Trust and Laudus Trust since 2022) | President (Oct. 2021 – present) and Executive Vice President – Schwab Asset Management Solutions (Apr. 2019 – Oct. 2021), The Charles Schwab Corporation; President, Director (Oct. 2021 – present), Executive Vice President – Schwab Asset Management Solutions (July 2019 – Oct. 2021) and Senior Vice President – Advisory (May 2016 – July 2019), Charles Schwab & Co., Inc.; President (Nov. 2021 – present), Schwab Holdings, Inc.; Director (Oct. 2021 – present) and Chief Executive Officer (Nov. 2019 – Jan. 2022), Charles Schwab Investment Management, Inc.; Director, Chief Executive Officer and President (Mar. 2018 – Oct. 2022), Charles Schwab Investment Advisory, Inc.; Chief Executive Officer (July 2016 – Apr. 2018) and President (Mar. 2017 – Apr. 2018), ThomasPartners, Inc.; Chief Executive Officer (July 2016 – Apr. 2018), Windhaven Investment Management, Inc. | 105 | None |
| Officers of the Trust | |
| Name, Year of Birth, and Position(s) with the trust (Terms of office, and length of Time Served3) | Principal Occupations During the Past Five Years |
| Jonathan de St. Paer 1973 President and Chief Executive Officer (Officer of The Charles Schwab Family of Funds, Schwab Investments, Schwab Capital Trust, Schwab Annuity Portfolios, Schwab Strategic Trust and Laudus Trust since 2018) | Director (Apr. 2019 – present), President (Oct. 2018 – present), Chief Operating Officer (Jan. 2021 – present), and Chief Executive Officer (Apr. 2019 – Nov. 2019), Charles Schwab Investment Management, Inc.; Senior Vice President (June 2020 – Mar. 2022) and Chief Operating Officer (Jan. 2021 – Mar. 2022), Charles Schwab Investment Advisory, Inc.; Chief Executive Officer (Apr. 2019 – present), President (Nov. 2018 – present) and Trustee (Apr. 2019 – Dec. 2020), Schwab Funds, Laudus Trust and Schwab ETFs; Managing Director (May 2022 – present), Senior Vice President (Apr. 2019 – May 2022) and Senior Vice President – Strategy and Product Development (CSIM) (Jan. 2014 – Mar. 2019), Charles Schwab & Co., Inc. |
| Mark Fischer 1970 Treasurer, Chief Financial Officer and Chief Operating Officer (Officer of The Charles Schwab Family of Funds, Schwab Investments, Schwab Capital Trust, Schwab Annuity Portfolios, Schwab Strategic Trust and Laudus Trust since 2013) | Treasurer and Chief Financial Officer (Jan. 2016 – present) and Chief Operating Officer (Dec. 2020 – present), Schwab Funds, Laudus Trust and Schwab ETFs; Chief Financial Officer (Mar. 2020 – present) and Vice President (Oct. 2013 – present), Charles Schwab Investment Management, Inc. |
| Omar Aguilar 1970 Vice President and Chief Investment Officer (Officer of The Charles Schwab Family of Funds, Schwab Investments, Schwab Capital Trust, Schwab Annuity Portfolios, Schwab Strategic Trust and Laudus Trust since 2011) | Chief Executive Officer (Jan. 2022 – present), Chief Investment Officer (Apr. 2011 – present) and Senior Vice President (Apr. 2011 – Dec. 2021), Charles Schwab Investment Management, Inc.; Director, Chief Executive Officer and President (Oct. 2022 – present), Charles Schwab Investment Advisory, Inc.; Vice President and Chief Investment Officer (June 2011 – present), Schwab Funds, Laudus Trust and Schwab ETFs. |
| Brett Wander 1961 Vice President and Chief Investment Officer (Officer of The Charles Schwab Family of Funds, Schwab Investments, Schwab Capital Trust, Schwab Annuity Portfolios, Schwab Strategic Trust and Laudus Trust since 2011) | Senior Vice President and Chief Investment Officer (Apr. 2011 – present), Charles Schwab Investment Management, Inc.; Vice President and Chief Investment Officer (June 2011 – present), Schwab Funds, Laudus Trust and Schwab ETFs. |
| William P. McMahon, Jr. 1972 Vice President and Chief Investment Officer (Officer of The Charles Schwab Family of Funds, Schwab Investments, Schwab Capital Trust, Schwab Annuity Portfolios, Schwab Strategic Trust and Laudus Trust since 2021) | Senior Vice President and Chief Investment Officer (Jan. 2020 – present), Charles Schwab Investment Management, Inc.; Vice President and Chief Investment Officer (June 2021 – present), Schwab Funds, Laudus Trust and Schwab ETFs; Senior Vice President and Chief Investment Officer – ThomasPartners Strategies (Apr. 2018 – Dec. 2019), Charles Schwab Investment Advisory, Inc.; Senior Vice President and Chief Investment Officer (May 2001 – Apr. 2018), ThomasPartners, Inc. |
| Officers of the Trust (continued) | |
| Name, Year of Birth, and Position(s) with the trust (Terms of office, and length of Time Served3) | Principal Occupations During the Past Five Years |
| Catherine MacGregor 1964 Chief Legal Officer and Secretary, Schwab Funds and Schwab ETFs Chief Legal Officer, Vice President and Clerk, Laudus Trust (Officer of The Charles Schwab Family of Funds, Schwab Investments, Schwab Capital Trust, Schwab Annuity Portfolios and Laudus Trust since 2005; Schwab Strategic Trust since 2009) | Chief Legal Officer (Mar. 2022 – present) and Vice President (Sept. 2005 – present), Charles Schwab Investment Management, Inc.; Managing Director (May 2022 – present) and Vice President (July 2005 – May 2022), Charles Schwab & Co., Inc.; Vice President (Dec. 2005 – present) and Chief Legal Officer and Clerk (Mar. 2007 – present), Laudus Trust; Chief Legal Officer and Secretary (Oct. 2021 – present), Vice President (Nov. 2005 – Oct. 2021) and Assistant Secretary (June 2007 – Oct. 2021), Schwab Funds; Chief Legal Officer and Secretary (Oct. 2021 – present), Vice President and Assistant Secretary (Oct. 2009 – Oct. 2021), Schwab ETFs. |
| 1 | Each Trustee shall hold office until the election and qualification of his or her successor, or until he or she dies, resigns or is removed. The retirement policy requires that each independent trustee retire by December 31 of the year in which the Trustee turns 74 or the Trustee’s twentieth year of service as an independent trustee on any trust in the Fund Complex, whichever occurs first. |
| 2 | Mr. Bettinger and Mr. Wurster are Interested Trustees. Mr. Bettinger and Mr. Wurster are Interested Trustees because each owns stock of The Charles Schwab Corporation (CSC), the parent company of Charles Schwab Investment Management, Inc., the investment adviser for the trusts in the Fund Complex, and is an employee of Charles Schwab & Co., Inc. (Schwab), the principal underwriter for The Charles Schwab Family of Funds, Schwab Investments, Schwab Capital Trust, Schwab Annuity Portfolios and Laudus Trust. |
| 3 | The President, Treasurer and Secretary/Clerk hold office until their respective successors are chosen and qualified or until he or she sooner dies, resigns, is removed or becomes disqualified. Each of the other officers serves at the pleasure of the Board. |
Schwab Funds
Member SIPC®
Printed on recycled paper.
| ¹ | State, local, and the Federal Alternative Minimum Tax may apply. Capital gains are not exempt from Federal Taxation. |
| ² | You could lose money by investing in the Schwab Money Funds. All Schwab Money Funds with the exception of Schwab Variable Share Price Money Fund seek to preserve the value of your investment at $1.00 per share, but cannot guarantee they will do so. Because the share price of Schwab Variable Share Price Money Fund will fluctuate, when you sell your shares they may be worth more or less than what you originally paid for them. All Schwab Money Funds with the exception of Schwab Government Money Fund, Schwab Retirement Government Money Fund, Schwab U.S. Treasury Money Fund, Schwab Treasury Obligations Money Fund and Schwab Government Money Market Portfolio may impose a fee upon the sale of your shares or may temporarily suspend your ability to sell shares if the Fund’s liquidity falls below required minimums because of market conditions or other factors. An investment in the Schwab Money Funds is not insured or guaranteed by the Federal Deposit Insurance Corporation or any other government agency. The Schwab Money Funds’ sponsor has no legal obligation to provide financial support to the Funds, and you should not expect that the sponsor will provide financial support to the Funds at any time. |

All Equity Portfolio™
Growth Portfolio™
Balanced Portfolio™
Conservative Portfolio™
| Total Return for the 12 Months Ended October 31, 2022 | |
| Schwab MarketTrack All Equity Portfolio (Ticker Symbol: SWEGX) | -16.89% |
| All Equity Composite Index | -16.51% |
| Fund Category: Morningstar Allocation—85%+ Equity1 | -19.47% |
| Performance Details | pages 7-9 |
| Schwab MarketTrack Growth Portfolio (Ticker Symbol: SWHGX) | -15.52% |
| Growth Composite Index | -15.10% |
| Fund Category: Morningstar Allocation—70% to 85% Equity1 | -15.46% |
| Performance Details | pages 10-12 |
| Schwab MarketTrack Balanced Portfolio (Ticker Symbol: SWBGX) | -15.32% |
| Balanced Composite Index | -14.91% |
| Fund Category: Morningstar Allocation—50% to 70% Equity1 | -14.00% |
| Performance Details | pages 13-15 |
| Schwab MarketTrack Conservative Portfolio (Ticker Symbol: SWCGX) | -15.23% |
| Conservative Composite Index | -14.84% |
| Fund Category: Morningstar Allocation—30% to 50% Equity1 | -14.73% |
| Performance Details | pages 16-18 |
| 1 | Source for category information: Morningstar, Inc. The Morningstar Category return represents all active and index mutual funds and ETFs within the category as of the report date. |

President of Schwab Asset
Management and the funds
covered in this report.

| * | The net version of the index reflects reinvested dividends net of withholding taxes but reflects no deductions for expenses or other taxes. |

| * | The net version of the index reflects reinvested dividends net of withholding taxes but reflects no deductions for expenses or other taxes. |
 | Zifan Tang, Ph.D., CFA, Senior Portfolio Manager, is responsible for the co-management of the funds. Prior to joining Schwab in 2012, Ms. Tang was a product manager at Thomson Reuters and from 1997 to 2009 worked as a portfolio manager at Barclays Global Investors (now known as BlackRock). |
 | Patrick Kwok, CFA, Portfolio Manager, is responsible for the co-management of the funds. Previously, Mr. Kwok served as an associate portfolio manager from 2012 to 2016. Prior to that, he worked as a fund administration manager, where he was responsible for oversight of sub-advisers, trading, cash management, and fund administration supporting the Charles Schwab Trust Bank Collective Investment Trusts and multi-asset Schwab Funds. Prior to joining Schwab Asset Management in 2008, Mr. Kwok spent two years as an asset operations specialist at Charles Schwab Trust Company. He also worked for one year at State Street Bank & Trust as a portfolio accountant and pricing specialist. |
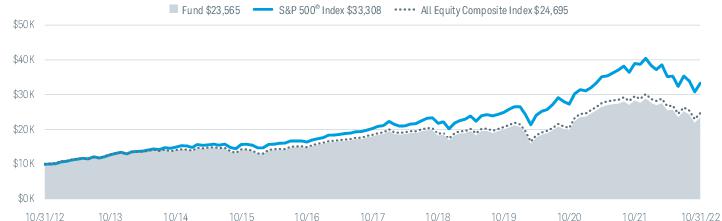
| Fund and Inception Date | 1 Year | 5 Years | 10 Years |
| Fund: Schwab MarketTrack All Equity Portfolio (5/19/98) | -16.89% | 5.50% | 8.95% |
| S&P 500® Index | -14.61% | 10.44% | 12.79% |
| All Equity Composite Index | -16.51% | 5.99% | 9.46% |
| Fund Category: Morningstar Allocation—85%+ Equity2 | -19.47% | 5.12% | 8.32% |
| Fund Expense Ratio3: 0.50% | |||
| 1 | Fund expenses may have been partially absorbed by the investment adviser and its affiliates. Without these reductions, the fund’s returns would have been lower. These returns do not reflect the deduction of taxes that a shareholder would pay on fund distributions or the redemption of fund shares. |
| 2 | Source for category information: Morningstar, Inc. The Morningstar Category return represents all active and index mutual funds and ETFs within the category as of the report date. |
| 3 | As stated in the prospectus. Includes 0.12% of acquired fund fees and expenses (AFFE), which are indirect expenses incurred by the fund through its investments in the underlying funds. Reflects the total annual fund operating expenses without contractual fee waivers. For actual expense ratios during the period, not including AFFE, refer to the financial highlights section of the financial statements. |
| Number of Holdings | 10 |
| Portfolio Turnover Rate | 7% |
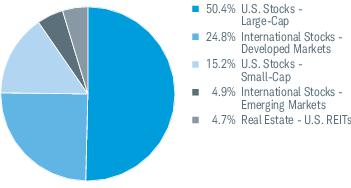
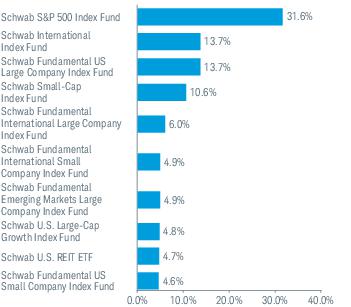
| 1 | The percentage may differ from the Portfolio Holdings because the above calculation is based on a percentage of total investments, whereas the calculation in the Portfolio Holdings is based on a percentage of net assets. |
| 2 | This list is not a recommendation of any security by the investment adviser. |
| 3 | The holdings listed exclude any temporary liquidity investments. |
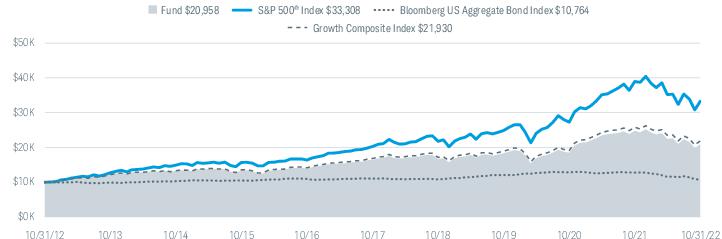
| Fund and Inception Date | 1 Year | 5 Years | 10 Years |
| Fund: Schwab MarketTrack Growth Portfolio (11/20/95) | -15.52% | 4.93% | 7.68% |
| S&P 500® Index | -14.61% | 10.44% | 12.79% |
| Bloomberg US Aggregate Bond Index | -15.68% | -0.54% | 0.74% |
| Growth Composite Index | -15.10% | 5.41% | 8.17% |
| Fund Category: Morningstar Allocation—70% to 85% Equity2 | -15.46% | 4.43% | 6.96% |
| Fund Expense Ratio3: 0.50% | |||
| 1 | Fund expenses may have been partially absorbed by the investment adviser and its affiliates. Without these reductions, the fund’s returns would have been lower. These returns do not reflect the deduction of taxes that a shareholder would pay on fund distributions or the redemption of fund shares. |
| 2 | Source for category information: Morningstar, Inc. The Morningstar Category return represents all active and index mutual funds and ETFs within the category as of the report date. |
| 3 | As stated in the prospectus. Includes 0.11% of acquired fund fees and expenses (AFFE), which are indirect expenses incurred by the fund through its investments in the underlying funds. Reflects the total annual fund operating expenses without contractual fee waivers. For actual expense ratios during the period, not including AFFE, refer to the financial highlights section of the financial statements. |
| Number of Holdings | 12 |
| Portfolio Turnover Rate | 8% |
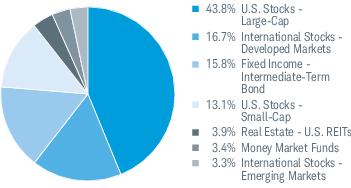
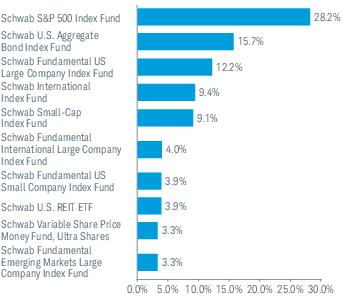
| 1 | The percentage may differ from the Portfolio Holdings because the above calculation is based on a percentage of total investments, whereas the calculation in the Portfolio Holdings is based on a percentage of net assets. |
| 2 | This list is not a recommendation of any security by the investment adviser. |
| 3 | The holdings listed exclude any temporary liquidity investments. |
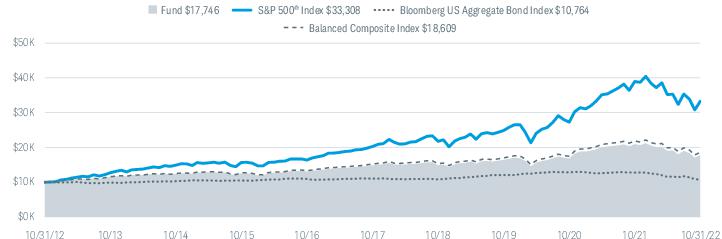
| Fund and Inception Date | 1 Year | 5 Years | 10 Years |
| Fund: Schwab MarketTrack Balanced Portfolio (11/20/95) | -15.32% | 3.64% | 5.90% |
| S&P 500® Index | -14.61% | 10.44% | 12.79% |
| Bloomberg US Aggregate Bond Index | -15.68% | -0.54% | 0.74% |
| Balanced Composite Index | -14.91% | 4.13% | 6.41% |
| Fund Category: Morningstar Allocation—50% to 70% Equity2 | -14.00% | 4.25% | 6.15% |
| Fund Expense Ratio3: 0.48% | |||
| 1 | Fund expenses may have been partially absorbed by the investment adviser and its affiliates. Without these reductions, the fund’s returns would have been lower. These returns do not reflect the deduction of taxes that a shareholder would pay on fund distributions or the redemption of fund shares. |
| 2 | Source for category information: Morningstar, Inc. The Morningstar Category return represents all active and index mutual funds and ETFs within the category as of the report date. |
| 3 | As stated in the prospectus. Includes 0.09% of acquired fund fees and expenses (AFFE), which are indirect expenses incurred by the fund through its investments in the underlying funds. Reflects the total annual fund operating expenses without contractual fee waivers. For actual expense ratios during the period, not including AFFE, refer to the financial highlights section of the financial statements. |
| Number of Holdings | 13 |
| Portfolio Turnover Rate | 11% |
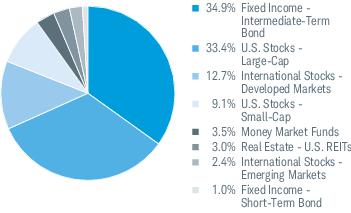
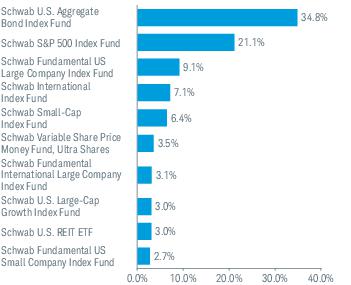
| 1 | The percentage may differ from the Portfolio Holdings because the above calculation is based on a percentage of total investments, whereas the calculation in the Portfolio Holdings is based on a percentage of net assets. |
| 2 | This list is not a recommendation of any security by the investment adviser. |
| 3 | The holdings listed exclude any temporary liquidity investments. |
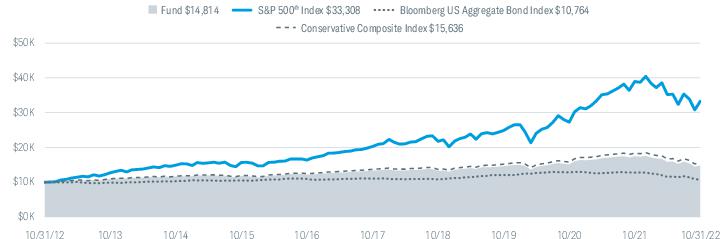
| Fund and Inception Date | 1 Year | 5 Years | 10 Years |
| Fund: Schwab MarketTrack Conservative Portfolio (11/20/95) | -15.23% | 2.17% | 4.01% |
| S&P 500® Index | -14.61% | 10.44% | 12.79% |
| Bloomberg US Aggregate Bond Index | -15.68% | -0.54% | 0.74% |
| Conservative Composite Index | -14.84% | 2.70% | 4.57% |
| Fund Category: Morningstar Allocation—30% to 50% Equity2 | -14.73% | 2.08% | 3.92% |
| Fund Expense Ratio3: 0.48% | |||
| 1 | Fund expenses may have been partially absorbed by the investment adviser and its affiliates. Without these reductions, the fund’s returns would have been lower. These returns do not reflect the deduction of taxes that a shareholder would pay on fund distributions or the redemption of fund shares. |
| 2 | Source for category information: Morningstar, Inc. The Morningstar Category return represents all active and index mutual funds and ETFs within the category as of the report date. |
| 3 | As stated in the prospectus. Includes 0.07% of acquired fund fees and expenses (AFFE), which are indirect expenses incurred by the fund through its investments in the underlying funds. Reflects the total annual fund operating expenses without contractual fee waivers. For actual expense ratios during the period, not including AFFE, refer to the financial highlights section of the financial statements. |
| Number of Holdings | 13 |
| Portfolio Turnover Rate | 11% |
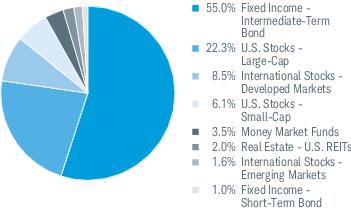
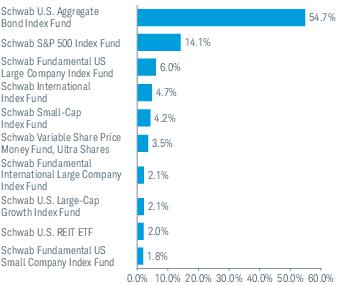
| 1 | The percentage may differ from the Portfolio Holdings because the above calculation is based on a percentage of total investments, whereas the calculation in the Portfolio Holdings is based on a percentage of net assets. |
| 2 | This list is not a recommendation of any security by the investment adviser. |
| 3 | The holdings listed exclude any temporary liquidity investments. |
| EXPENSE RATIO (ANNUALIZED)1,2 | EFFECTIVE EXPENSE RATIO (ANNUALIZED)3,4 | BEGINNING ACCOUNT VALUE AT 5/1/22 | ENDING ACCOUNT VALUE (NET OF EXPENSES) AT 10/31/22 | EXPENSES PAID DURING PERIOD 5/1/22-10/31/222,5 | EFFECTIVE EXPENSES PAID DURING PERIOD 5/1/22-10/31/224,5 | |
| Schwab MarketTrack All Equity Portfolio | ||||||
| Actual Return | 0.39% | 0.51% | $1,000.00 | $ 924.50 | $1.89 | $2.47 |
| Hypothetical 5% Return | 0.39% | 0.51% | $1,000.00 | $1,023.24 | $1.99 | $2.60 |
| Schwab MarketTrack Growth Portfolio | ||||||
| Actual Return | 0.39% | 0.50% | $1,000.00 | $ 932.90 | $1.90 | $2.44 |
| Hypothetical 5% Return | 0.39% | 0.50% | $1,000.00 | $1,023.24 | $1.99 | $2.55 |
| Schwab MarketTrack Balanced Portfolio | ||||||
| Actual Return | 0.40% | 0.49% | $1,000.00 | $ 934.30 | $1.95 | $2.39 |
| Hypothetical 5% Return | 0.40% | 0.49% | $1,000.00 | $1,023.19 | $2.04 | $2.50 |
| Schwab MarketTrack Conservative Portfolio | ||||||
| Actual Return | 0.42% | 0.50% | $1,000.00 | $ 934.60 | $2.05 | $2.44 |
| Hypothetical 5% Return | 0.42% | 0.50% | $1,000.00 | $1,023.09 | $2.14 | $2.55 |
| 1 | Based on the most recent six-month expense ratio. |
| 2 | Excludes acquired fund fees and expenses, which are indirect expenses incurred by the fund through its investments in underlying funds. |
| 3 | Based on the most recent six-month acquired fund fees and expenses and the expense ratio; may differ from the acquired fund fees and expenses and the expense ratio in the prospectus. |
| 4 | Includes acquired fund fees and expenses, which are indirect expenses incurred by the fund through its investments in underlying funds. |
| 5 | Expenses for each fund are equal to its annualized expense ratio, multiplied by the average account value over the period, multiplied by the 184 days of the period, and divided by the 365 days of the fiscal year. |
| 11/1/21– 10/31/22 | 11/1/20– 10/31/21 | 11/1/19– 10/31/20 | 11/1/18– 10/31/19 | 11/1/17– 10/31/18 | ||
| Per-Share Data | ||||||
| Net asset value at beginning of period | $23.89 | $17.73 | $19.15 | $18.33 | $18.76 | |
| Income (loss) from investment operations: | ||||||
| Net investment income (loss)1 | 0.37 | 0.29 | 0.37 | 0.31 | 0.28 | |
| Net realized and unrealized gains (losses) | (4.23) | 7.21 | (0.54) | 1.30 | (0.05) | |
| Total from investment operations | (3.86) | 7.50 | (0.17) | 1.61 | 0.23 | |
| Less distributions: | ||||||
| Distributions from net investment income | (0.45) | (0.21) | (0.53) | (0.36) | (0.33) | |
| Distributions from net realized gains | (0.47) | (1.13) | (0.72) | (0.43) | (0.33) | |
| Total distributions | (0.92) | (1.34) | (1.25) | (0.79) | (0.66) | |
| Net asset value at end of period | $19.11 | $23.89 | $17.73 | $19.15 | $18.33 | |
| Total return | (16.89%) | 43.90% | (1.35%) | 9.58% | 1.10% | |
| Ratios/Supplemental Data | ||||||
| Ratios to average net assets: | ||||||
| Net operating expenses2 | 0.39% 3 | 0.38% | 0.40% | 0.40% | 0.39% | |
| Gross operating expenses2 | 0.39% 3 | 0.38% | 0.40% | 0.40% | 0.39% | |
| Net investment income (loss) | 1.75% | 1.33% | 2.08% | 1.72% | 1.46% | |
| Portfolio turnover rate | 7% | 6% | 18% | 6% | 5% | |
| Net assets, end of period (x 1,000) | $698,899 | $861,267 | $623,095 | $690,801 | $659,883 | |
| 1 | Calculated based on the average shares outstanding during the period. |
| 2 | Ratio excludes acquired fund fees and expenses, which are indirect expenses incurred by the fund through its investments in underlying funds. |
| 3 | Ratio includes less than 0.005% of non-routine proxy expenses. |
| SECURITY | VALUE AT 10/31/21 | PURCHASES | SALES | REALIZED GAINS (LOSSES) | NET CHANGE IN UNREALIZED APPRECIATION (DEPRECIATION) | VALUE AT 10/31/22 | BALANCE OF SHARES HELD AT 10/31/22 | DISTRIBUTIONS RECEIVED(a) |
| AFFILIATED UNDERLYING FUNDS 99.5% OF NET ASSETS | ||||||||
| U.S. Stocks 65.3% | ||||||||
| Large-Cap 50.1% | ||||||||
| Schwab Fundamental US Large Company Index Fund | $116,756,387 | $5,526,670 | ($16,845,411) | $3,535,068 | ($13,347,981) | $95,624,733 | 4,512,729 | $5,526,670 |
| Schwab S&P 500 Index Fund | 272,314,653 | 4,232,483 | (13,784,846) | 6,856,908 | (48,666,778) | 220,952,420 | 3,681,313 | 3,432,484 |
| Schwab U.S. Large-Cap Growth Index Fund | 43,676,384 | 2,456,734 | (1,000,000) | 444,296 | (11,825,954) | 33,751,460 | 510,689 | 756,734 |
| 350,328,613 | ||||||||
| Small-Cap 15.2% | ||||||||
| Schwab Fundamental US Small Company Index Fund | 38,611,103 | 4,295,785 | (2,162,106) | (248,210) | (8,408,974) | 32,087,598 | 2,108,252 | 4,295,785 |
| Schwab Small-Cap Index Fund | 88,250,003 | 14,883,912 | (5,114,837) | (1,236,733) | (22,949,700) | 73,832,645 | 2,471,799 | 7,183,912 |
| 105,920,243 | ||||||||
| 456,248,856 | ||||||||
| International Stocks 29.5% | ||||||||
| Developed Markets 24.6% | ||||||||
| Schwab Fundamental International Large Company Index Fund | 51,138,365 | 5,920,159 | (5,000,000) | (133,491) | (10,133,268) | 41,791,765 | 4,969,294 | 1,924,957 |
| Schwab Fundamental International Small Company Index Fund | 42,258,117 | 6,794,587 | (518,000) | (158,912) | (13,958,727) | 34,417,065 | 3,228,618 | 2,441,864 |
| Schwab International Index Fund | 118,493,690 | 13,543,774 | (4,000,000) | (521,599) | (31,387,560) | 96,128,305 | 5,290,496 | 3,924,893 |
| 172,337,135 | ||||||||
| Emerging Markets 4.9% | ||||||||
| Schwab Fundamental Emerging Markets Large Company Index Fund | 42,507,983 | 8,761,915 | (4,640,000) | (60,723) | (12,288,404) | 34,280,771 | 4,664,050 | 1,909,360 |
| 206,617,906 | ||||||||
| Real Estate 4.7% | ||||||||
| U.S. REITs 4.7% | ||||||||
| Schwab U.S. REIT ETF | 43,312,349 | 1,033,679 | (3,048,106) | 426,413 | (8,825,193) | 32,899,142 | 1,703,736 | 832,760 |
| Total Affiliated Underlying Funds (Cost $444,195,927) | $857,319,034 | $67,449,698 | ($56,113,306) | $8,903,017 | ($181,792,539) | $695,765,904 | $32,229,419 | |
| Total Investments in Securities (Cost $444,195,927) | $695,765,904 | |||||||
| (a) | Distributions received include distributions from net investment income and capital gains, if any, from the underlying funds. Amounts shown are only presented for affiliated underlying funds, which are presented in the corresponding line-item in the Statement of Operations, if applicable (See financial note 2(d) for additional information). |
| ETF — | Exchange traded fund |
| REIT — | Real Estate Investment Trust |
| Assets | ||
| Investments in securities, at value - affiliated (cost $444,195,927) | $695,765,904 | |
| Cash | 3,322,645 | |
| Receivables: | ||
| Investments sold | 5,450,087 | |
| Fund shares sold | 357,650 | |
| Interest | 4,419 | |
| Prepaid expenses | + | 15,494 |
| Total assets | 704,916,199 | |
| Liabilities | ||
| Payables: | ||
| Investments bought | 5,115,184 | |
| Fund shares redeemed | 606,970 | |
| Shareholder service fees | 127,794 | |
| Investment adviser and administrator fees | 69,475 | |
| Independent trustees’ fees | 42 | |
| Accrued expenses | + | 97,893 |
| Total liabilities | 6,017,358 | |
| Net assets | $698,898,841 | |
| Net Assets by Source | ||
| Capital received from investors | $435,746,602 | |
| Total distributable earnings | + | 263,152,239 |
| Net assets | $698,898,841 | |
| Net Asset Value (NAV) | ||||
| Net Assets | ÷ | Shares Outstanding | = | NAV |
| $698,898,841 | 36,581,612 | $19.11 | ||
| For the period November 1, 2021 through October 31, 2022 | ||
| Investment Income | ||
| Dividends received from securities - affiliated | $16,612,616 | |
| Interest received from securities - unaffiliated | + | 16,771 |
| Total investment income | 16,629,387 | |
| Expenses | ||
| Shareholder service fees | 1,840,860 | |
| Investment adviser and administrator fees | 1,011,089 | |
| Proxy fees1 | 34,999 | |
| Shareholder reports | 34,211 | |
| Registration fees | 34,055 | |
| Portfolio accounting fees | 29,851 | |
| Professional fees | 21,540 | |
| Independent trustees’ fees | 8,907 | |
| Transfer agent fees | 5,546 | |
| Custodian fees | 1,860 | |
| Other expenses | + | 11,679 |
| Total expenses | 3,034,597 | |
| Expense reduction | – | 5,546 |
| Net expenses | – | 3,029,051 |
| Net investment income | 13,600,336 | |
| REALIZED AND UNREALIZED GAINS (LOSSES) | ||
| Realized capital gain distributions received from underlying funds - affiliated | 15,616,803 | |
| Net realized gains on sales of securities - affiliated | + | 8,903,017 |
| Net realized gains | 24,519,820 | |
| Net change in unrealized appreciation (depreciation) on securities - affiliated | + | (181,792,539) |
| Net realized and unrealized losses | (157,272,719) | |
| Decrease in net assets resulting from operations | ($143,672,383) | |
| 1 | Proxy fees are non-routine expenses (see financial note 2(e) for additional information). |
| OPERATIONS | |||
| 11/1/21-10/31/22 | 11/1/20-10/31/21 | ||
| Net investment income | $13,600,336 | $10,545,614 | |
| Net realized gains | 24,519,820 | 16,951,292 | |
| Net change in unrealized appreciation (depreciation) | + | (181,792,539) | 241,141,234 |
| Increase (decrease) in net assets resulting from operations | ($143,672,383) | $268,638,140 | |
| DISTRIBUTIONS TO SHAREHOLDERS | |||
| Total distributions | ($32,780,380) | ($46,815,289) | |
| TRANSACTIONS IN FUND SHARES | |||||
| 11/1/21-10/31/22 | 11/1/20-10/31/21 | ||||
| SHARES | VALUE | SHARES | VALUE | ||
| Shares sold | 3,208,269 | $68,237,077 | 3,230,265 | $70,646,900 | |
| Shares reinvested | 1,243,501 | 29,160,110 | 2,118,421 | 41,923,540 | |
| Shares redeemed | + | (3,924,534) | (83,312,796) | (4,430,219) | (96,220,989) |
| Net transactions in fund shares | 527,236 | $14,084,391 | 918,467 | $16,349,451 | |
| SHARES OUTSTANDING AND NET ASSETS | |||||
| 11/1/21-10/31/22 | 11/1/20-10/31/21 | ||||
| SHARES | NET ASSETS | SHARES | NET ASSETS | ||
| Beginning of period | 36,054,376 | $861,267,213 | 35,135,909 | $623,094,911 | |
| Total increase (decrease) | + | 527,236 | (162,368,372) | 918,467 | 238,172,302 |
| End of period | 36,581,612 | $698,898,841 | 36,054,376 | $861,267,213 | |
| 11/1/21– 10/31/22 | 11/1/20– 10/31/21 | 11/1/19– 10/31/20 | 11/1/18– 10/31/19 | 11/1/17– 10/31/18 | ||
| Per-Share Data | ||||||
| Net asset value at beginning of period | $27.84 | $22.42 | $23.54 | $22.67 | $23.47 | |
| Income (loss) from investment operations: | ||||||
| Net investment income (loss)1 | 0.40 | 0.35 | 0.43 | 0.41 | 0.37 | |
| Net realized and unrealized gains (losses) | (4.49) | 7.03 | (0.20) | 1.62 | (0.04) | |
| Total from investment operations | (4.09) | 7.38 | 0.23 | 2.03 | 0.33 | |
| Less distributions: | ||||||
| Distributions from net investment income | (0.44) | (0.39) | (0.47) | (0.45) | (0.40) | |
| Distributions from net realized gains | (0.92) | (1.57) | (0.88) | (0.71) | (0.73) | |
| Total distributions | (1.36) | (1.96) | (1.35) | (1.16) | (1.13) | |
| Net asset value at end of period | $22.39 | $27.84 | $22.42 | $23.54 | $22.67 | |
| Total return | (15.52%) | 34.32% | 0.74% | 9.86% | 1.28% | |
| Ratios/Supplemental Data | ||||||
| Ratios to average net assets: | ||||||
| Net operating expenses2 | 0.39% 3 | 0.39% | 0.39% | 0.40% | 0.39% | |
| Gross operating expenses2 | 0.39% 3 | 0.39% | 0.40% | 0.40% | 0.39% | |
| Net investment income (loss) | 1.63% | 1.33% | 1.92% | 1.82% | 1.59% | |
| Portfolio turnover rate | 8% | 8% | 19% | 7% | 7% | |
| Net assets, end of period (x 1,000) | $801,906 | $982,246 | $748,492 | $816,532 | $782,843 | |
| 1 | Calculated based on the average shares outstanding during the period. |
| 2 | Ratio excludes acquired fund fees and expenses, which are indirect expenses incurred by the fund through its investments in underlying funds. |
| 3 | Ratio includes less than 0.005% of non-routine proxy expenses. |
| SECURITY | VALUE AT 10/31/21 | PURCHASES | SALES | REALIZED GAINS (LOSSES) | NET CHANGE IN UNREALIZED APPRECIATION (DEPRECIATION) | VALUE AT 10/31/22 | BALANCE OF SHARES HELD AT 10/31/22 | DISTRIBUTIONS RECEIVED(a) |
| AFFILIATED UNDERLYING FUNDS 99.4% OF NET ASSETS | ||||||||
| U.S. Stocks 56.6% | ||||||||
| Large-Cap 43.6% | ||||||||
| Schwab Fundamental US Large Company Index Fund | $118,042,501 | $5,587,548 | ($16,077,159) | $3,320,583 | ($13,116,896) | $97,756,577 | 4,613,335 | $5,587,548 |
| Schwab S&P 500 Index Fund | 277,499,962 | 8,842,886 | (18,255,663) | 8,024,693 | (50,032,799) | 226,079,079 | 3,766,729 | 3,528,504 |
| Schwab U.S. Large-Cap Growth Index Fund | 33,120,533 | 1,851,920 | (663,202) | 36,507 | (8,576,200) | 25,769,558 | 389,916 | 587,210 |
| 349,605,214 | ||||||||
| Small-Cap 13.0% | ||||||||
| Schwab Fundamental US Small Company Index Fund | 37,581,408 | 4,181,223 | (2,005,047) | (145,867) | (8,206,981) | 31,404,736 | 2,063,386 | 4,181,223 |
| Schwab Small-Cap Index Fund | 87,328,739 | 13,884,881 | (4,668,555) | (1,088,108) | (22,431,174) | 73,025,783 | 2,444,787 | 7,052,100 |
| 104,430,519 | ||||||||
| 454,035,733 | ||||||||
| International Stocks 19.9% | ||||||||
| Developed Markets 16.6% | ||||||||
| Schwab Fundamental International Large Company Index Fund | 39,004,287 | 4,913,207 | (3,811,820) | (41,901) | (7,810,017) | 32,253,756 | 3,835,167 | 1,470,371 |
| Schwab Fundamental International Small Company Index Fund | 32,131,665 | 4,441,824 | — | — | (10,685,726) | 25,887,763 | 2,428,496 | 1,855,489 |
| Schwab International Index Fund | 89,825,363 | 11,344,868 | (1,820,000) | (211,612) | (24,066,720) | 75,071,899 | 4,131,640 | 3,021,946 |
| 133,213,418 | ||||||||
| Emerging Markets 3.3% | ||||||||
| Schwab Fundamental Emerging Markets Large Company Index Fund | 33,053,688 | 4,479,321 | (1,900,000) | 66,722 | (9,516,552) | 26,183,179 | 3,562,337 | 1,449,004 |
| 159,396,597 | ||||||||
| Real Estate 3.9% | ||||||||
| U.S. REITs 3.9% | ||||||||
| Schwab U.S. REIT ETF | 40,246,572 | 1,171,868 | (2,550,003) | 447,972 | (8,215,530) | 31,100,879 | 1,610,610 | 777,528 |
| Fixed Income 15.7% | ||||||||
| Intermediate-Term Bond 15.7% | ||||||||
| Schwab U.S. Aggregate Bond Index Fund | 155,413,117 | 16,696,054 | (18,696,573) | (2,551,485) | (24,772,473) | 126,088,640 | 14,661,470 | 3,244,324 |
| Money Market Funds 3.3% | ||||||||
| Schwab Variable Share Price Money Fund, Ultra Shares, 3.10% (b) | 24,572,691 | 2,228,017 | (586) | — | (7,388) | 26,792,734 | 26,792,734 | 261,030 |
| Total Affiliated Underlying Funds (Cost $534,842,009) | $967,820,526 | $79,623,617 | ($70,448,608) | $7,857,504 | ($187,438,456) | $797,414,583 | $33,016,277 | |
| Total Investments in Securities (Cost $534,842,009) | $797,414,583 | |||||||
| (a) | Distributions received include distributions from net investment income and capital gains, if any, from the underlying funds. Amounts shown are only presented for affiliated underlying funds, which are presented in the corresponding line-item in the Statement of Operations, if applicable (See financial note 2(d) for additional information). |
| (b) | The rate shown is the annualized 7-day yield. |
| ETF — | Exchange traded fund |
| REIT — | Real Estate Investment Trust |
| Assets | ||
| Investments in securities, at value - affiliated (cost $534,842,009) | $797,414,583 | |
| Cash | 2,058,390 | |
| Receivables: | ||
| Investments sold | 9,177,501 | |
| Fund shares sold | 645,022 | |
| Dividends | 299,290 | |
| Interest | 4,266 | |
| Prepaid expenses | + | 18,407 |
| Total assets | 809,617,459 | |
| Liabilities | ||
| Payables: | ||
| Investments bought | 6,102,959 | |
| Fund shares redeemed | 1,312,903 | |
| Shareholder service fees | 150,440 | |
| Investment adviser and administrator fees | 80,386 | |
| Independent trustees’ fees | 43 | |
| Accrued expenses | + | 64,256 |
| Total liabilities | 7,710,987 | |
| Net assets | $801,906,472 | |
| Net Assets by Source | ||
| Capital received from investors | $519,086,131 | |
| Total distributable earnings | + | 282,820,341 |
| Net assets | $801,906,472 | |
| Net Asset Value (NAV) | ||||
| Net Assets | ÷ | Shares Outstanding | = | NAV |
| $801,906,472 | 35,810,255 | $22.39 | ||
| For the period November 1, 2021 through October 31, 2022 | ||
| Investment Income | ||
| Dividends received from securities - affiliated | $17,990,980 | |
| Interest received from securities - unaffiliated | + | 31,542 |
| Total investment income | 18,022,522 | |
| Expenses | ||
| Shareholder service fees | 2,140,490 | |
| Investment adviser and administrator fees | 1,156,133 | |
| Proxy fees1 | 41,087 | |
| Registration fees | 38,468 | |
| Shareholder reports | 32,738 | |
| Portfolio accounting fees | 31,131 | |
| Professional fees | 21,635 | |
| Independent trustees’ fees | 9,210 | |
| Transfer agent fees | 4,516 | |
| Custodian fees | 2,077 | |
| Other expenses | + | 12,582 |
| Total expenses | 3,490,067 | |
| Expense reduction | – | 4,516 |
| Net expenses | – | 3,485,551 |
| Net investment income | 14,536,971 | |
| REALIZED AND UNREALIZED GAINS (LOSSES) | ||
| Realized capital gain distributions received from underlying funds - affiliated | 15,025,297 | |
| Net realized gains on sales of securities - affiliated | + | 7,857,504 |
| Net realized gains | 22,882,801 | |
| Net change in unrealized appreciation (depreciation) on securities - affiliated | + | (187,438,456) |
| Net realized and unrealized losses | (164,555,655) | |
| Decrease in net assets resulting from operations | ($150,018,684) | |
| 1 | Proxy fees are non-routine expenses (see financial note 2(e) for additional information). |
| OPERATIONS | |||
| 11/1/21-10/31/22 | 11/1/20-10/31/21 | ||
| Net investment income | $14,536,971 | $12,181,853 | |
| Net realized gains | 22,882,801 | 32,571,642 | |
| Net change in unrealized appreciation (depreciation) | + | (187,438,456) | 209,004,001 |
| Increase (decrease) in net assets resulting from operations | ($150,018,684) | $253,757,496 | |
| DISTRIBUTIONS TO SHAREHOLDERS | |||
| Total distributions | ($47,953,508) | ($64,608,050) | |
| TRANSACTIONS IN FUND SHARES | |||||
| 11/1/21-10/31/22 | 11/1/20-10/31/21 | ||||
| SHARES | VALUE | SHARES | VALUE | ||
| Shares sold | 3,110,088 | $77,344,476 | 3,644,847 | $94,749,475 | |
| Shares reinvested | 1,629,745 | 43,937,930 | 2,487,105 | 59,466,671 | |
| Shares redeemed | + | (4,205,157) | (103,649,624) | (4,239,705) | (109,611,696) |
| Net transactions in fund shares | 534,676 | $17,632,782 | 1,892,247 | $44,604,450 | |
| SHARES OUTSTANDING AND NET ASSETS | |||||
| 11/1/21-10/31/22 | 11/1/20-10/31/21 | ||||
| SHARES | NET ASSETS | SHARES | NET ASSETS | ||
| Beginning of period | 35,275,579 | $982,245,882 | 33,383,332 | $748,491,986 | |
| Total increase (decrease) | + | 534,676 | (180,339,410) | 1,892,247 | 233,753,896 |
| End of period | 35,810,255 | $801,906,472 | 35,275,579 | $982,245,882 | |
| 11/1/21– 10/31/22 | 11/1/20– 10/31/21 | 11/1/19– 10/31/20 | 11/1/18– 10/31/19 | 11/1/17– 10/31/18 | ||
| Per-Share Data | ||||||
| Net asset value at beginning of period | $21.53 | $18.38 | $18.75 | $18.24 | $19.12 | |
| Income (loss) from investment operations: | ||||||
| Net investment income (loss)1 | 0.32 | 0.28 | 0.35 | 0.36 | 0.34 | |
| Net realized and unrealized gains (losses) | (3.45) | 4.11 | 0.10 | 1.32 | (0.24) | |
| Total from investment operations | (3.13) | 4.39 | 0.45 | 1.68 | 0.10 | |
| Less distributions: | ||||||
| Distributions from net investment income | (0.33) | (0.32) | (0.39) | (0.39) | (0.33) | |
| Distributions from net realized gains | (0.71) | (0.92) | (0.43) | (0.78) | (0.65) | |
| Total distributions | (1.04) | (1.24) | (0.82) | (1.17) | (0.98) | |
| Net asset value at end of period | $17.36 | $21.53 | $18.38 | $18.75 | $18.24 | |
| Total return | (15.32%) | 24.66% | 2.37% | 10.14% | 0.44% | |
| Ratios/Supplemental Data | ||||||
| Ratios to average net assets: | ||||||
| Net operating expenses2 | 0.40% 3 | 0.39% | 0.40% | 0.40% | 0.40% | |
| Gross operating expenses2 | 0.40% 3 | 0.39% | 0.40% | 0.40% | 0.40% | |
| Net investment income (loss) | 1.67% | 1.39% | 1.91% | 1.99% | 1.79% | |
| Portfolio turnover rate | 11% | 10% | 22% | 11% | 8% | |
| Net assets, end of period (x 1,000) | $519,474 | $654,876 | $517,619 | $544,554 | $514,701 | |
| 1 | Calculated based on the average shares outstanding during the period. |
| 2 | Ratio excludes acquired fund fees and expenses, which are indirect expenses incurred by the fund through its investments in underlying funds. |
| 3 | Ratio includes less than 0.005% of non-routine proxy expenses. |
| SECURITY | VALUE AT 10/31/21 | PURCHASES | SALES | REALIZED GAINS (LOSSES) | NET CHANGE IN UNREALIZED APPRECIATION (DEPRECIATION) | VALUE AT 10/31/22 | BALANCE OF SHARES HELD AT 10/31/22 | DISTRIBUTIONS RECEIVED(a) |
| AFFILIATED UNDERLYING FUNDS 99.5% OF NET ASSETS | ||||||||
| U.S. Stocks 42.3% | ||||||||
| Large-Cap 33.2% | ||||||||
| Schwab Fundamental US Large Company Index Fund | $59,085,860 | $2,796,831 | ($9,859,596) | $2,281,540 | ($7,109,625) | $47,195,010 | 2,227,230 | $2,796,831 |
| Schwab S&P 500 Index Fund | 139,218,494 | 9,740,355 | (18,708,148) | 7,604,689 | (28,187,483) | 109,667,907 | 1,827,189 | 1,776,532 |
| Schwab U.S. Large-Cap Growth Index Fund | 19,858,952 | 2,053,898 | (1,128,480) | 39,028 | (5,130,363) | 15,693,035 | 237,449 | 352,089 |
| 172,555,952 | ||||||||
| Small-Cap 9.1% | ||||||||
| Schwab Fundamental US Small Company Index Fund | 18,219,135 | 2,027,021 | (2,030,898) | (143,457) | (3,895,272) | 14,176,529 | 931,441 | 2,027,021 |
| Schwab Small-Cap Index Fund | 40,657,077 | 8,157,434 | (4,749,056) | (951,792) | (9,949,550) | 33,164,113 | 1,110,282 | 3,244,429 |
| 47,340,642 | ||||||||
| 219,896,594 | ||||||||
| International Stocks 15.0% | ||||||||
| Developed Markets 12.6% | ||||||||
| Schwab Fundamental International Large Company Index Fund | 20,061,722 | 2,261,477 | (2,333,924) | (98,466) | (3,868,271) | 16,022,538 | 1,905,177 | 749,176 |
| Schwab Fundamental International Small Company Index Fund | 15,945,045 | 2,585,704 | (319,999) | (96,920) | (5,244,378) | 12,869,452 | 1,207,266 | 935,845 |
| Schwab International Index Fund | 45,041,593 | 5,275,465 | (1,317,686) | (80,356) | (12,050,037) | 36,868,979 | 2,029,113 | 1,530,377 |
| 65,760,969 | ||||||||
| Emerging Markets 2.4% | ||||||||
| Schwab Fundamental Emerging Markets Large Company Index Fund | 15,913,718 | 1,664,556 | (637,444) | 8,320 | (4,635,569) | 12,313,581 | 1,675,317 | 720,574 |
| 78,074,550 | ||||||||
| Real Estate 3.0% | ||||||||
| U.S. REITs 3.0% | ||||||||
| Schwab U.S. REIT ETF | 20,281,510 | 1,278,883 | (2,448,578) | 363,204 | (4,062,163) | 15,412,856 | 798,180 | 384,512 |
| Fixed Income 35.7% | ||||||||
| Intermediate-Term Bond 34.8% | ||||||||
| Schwab U.S. Aggregate Bond Index Fund | 228,337,823 | 26,913,317 | (34,714,378) | (4,863,789) | (35,083,221) | 180,589,752 | 20,998,808 | 4,733,666 |
| Short-Term Bond 0.9% | ||||||||
| Schwab Short-Term Bond Index Fund | 6,193,020 | 90,006 | (782,279) | (79,017) | (446,069) | 4,975,661 | 533,869 | 89,977 |
| 185,565,413 | ||||||||
| SECURITY | VALUE AT 10/31/21 | PURCHASES | SALES | REALIZED GAINS (LOSSES) | NET CHANGE IN UNREALIZED APPRECIATION (DEPRECIATION) | VALUE AT 10/31/22 | BALANCE OF SHARES HELD AT 10/31/22 | DISTRIBUTIONS RECEIVED(a) |
| Money Market Funds 3.5% | ||||||||
| Schwab Variable Share Price Money Fund, Ultra Shares, 3.10% (b) | $16,771,034 | $1,152,635 | ($400) | $— | ($5,043) | $17,918,226 | 17,918,226 | $174,699 |
| Total Affiliated Underlying Funds (Cost $403,665,947) | $645,584,983 | $65,997,582 | ($79,030,866) | $3,982,984 | ($119,667,044) | $516,867,639 | $19,515,728 | |
| Total Investments in Securities (Cost $403,665,947) | $516,867,639 | |||||||
| (a) | Distributions received include distributions from net investment income and capital gains, if any, from the underlying funds. Amounts shown are only presented for affiliated underlying funds, which are presented in the corresponding line-item in the Statement of Operations, if applicable (See financial note 2(d) for additional information). |
| (b) | The rate shown is the annualized 7-day yield. |
| ETF — | Exchange traded fund |
| REIT — | Real Estate Investment Trust |
| Assets | ||
| Investments in securities, at value - affiliated (cost $403,665,947) | $516,867,639 | |
| Cash | 1,771,520 | |
| Receivables: | ||
| Investments sold | 9,272,005 | |
| Dividends | 405,611 | |
| Fund shares sold | 374,568 | |
| Interest | 2,659 | |
| Prepaid expenses | + | 17,775 |
| Total assets | 528,711,777 | |
| Liabilities | ||
| Payables: | ||
| Investments bought | 8,506,572 | |
| Fund shares redeemed | 502,815 | |
| Shareholder service fees | 98,875 | |
| Investment adviser and administrator fees | 52,550 | |
| Independent trustees’ fees | 39 | |
| Accrued expenses | + | 77,012 |
| Total liabilities | 9,237,863 | |
| Net assets | $519,473,914 | |
| Net Assets by Source | ||
| Capital received from investors | $397,618,701 | |
| Total distributable earnings | + | 121,855,213 |
| Net assets | $519,473,914 | |
| Net Asset Value (NAV) | ||||
| Net Assets | ÷ | Shares Outstanding | = | NAV |
| $519,473,914 | 29,923,064 | $17.36 | ||
| For the period November 1, 2021 through October 31, 2022 | ||
| Investment Income | ||
| Dividends received from securities - affiliated | $12,239,079 | |
| Interest received from securities - unaffiliated | + | 18,350 |
| Total investment income | 12,257,429 | |
| Expenses | ||
| Shareholder service fees | 1,438,179 | |
| Investment adviser and administrator fees | 770,324 | |
| Registration fees | 35,255 | |
| Portfolio accounting fees | 27,586 | |
| Proxy fees1 | 26,665 | |
| Shareholder reports | 21,694 | |
| Professional fees | 20,813 | |
| Independent trustees’ fees | 8,388 | |
| Transfer agent fees | 3,096 | |
| Custodian fees | 1,960 | |
| Other expenses | + | 9,900 |
| Total expenses | 2,363,860 | |
| Expense reduction | – | 3,097 |
| Net expenses | – | 2,360,763 |
| Net investment income | 9,896,666 | |
| REALIZED AND UNREALIZED GAINS (LOSSES) | ||
| Realized capital gain distributions received from underlying funds - affiliated | 7,276,649 | |
| Net realized gains on sales of securities - affiliated | + | 3,982,984 |
| Net realized gains | 11,259,633 | |
| Net change in unrealized appreciation (depreciation) on securities - affiliated | + | (119,667,044) |
| Net realized and unrealized losses | (108,407,411) | |
| Decrease in net assets resulting from operations | ($98,510,745) | |
| 1 | Proxy fees are non-routine expenses (see financial note 2(e) for additional information). |
| OPERATIONS | |||
| 11/1/21-10/31/22 | 11/1/20-10/31/21 | ||
| Net investment income | $9,896,666 | $8,512,714 | |
| Net realized gains | 11,259,633 | 21,530,054 | |
| Net change in unrealized appreciation (depreciation) | + | (119,667,044) | 97,820,924 |
| Increase (decrease) in net assets resulting from operations | ($98,510,745) | $127,863,692 | |
| DISTRIBUTIONS TO SHAREHOLDERS | |||
| Total distributions | ($31,823,550) | ($34,781,810) | |
| TRANSACTIONS IN FUND SHARES | |||||
| 11/1/21-10/31/22 | 11/1/20-10/31/21 | ||||
| SHARES | VALUE | SHARES | VALUE | ||
| Shares sold | 3,053,833 | $59,625,179 | 4,679,194 | $95,523,630 | |
| Shares reinvested | 1,384,745 | 28,747,318 | 1,640,068 | 31,604,119 | |
| Shares redeemed | + | (4,931,534) | (93,440,331) | (4,058,104) | (82,952,722) |
| Net transactions in fund shares | (492,956) | ($5,067,834) | 2,261,158 | $44,175,027 | |
| SHARES OUTSTANDING AND NET ASSETS | |||||
| 11/1/21-10/31/22 | 11/1/20-10/31/21 | ||||
| SHARES | NET ASSETS | SHARES | NET ASSETS | ||
| Beginning of period | 30,416,020 | $654,876,043 | 28,154,862 | $517,619,134 | |
| Total increase (decrease) | + | (492,956) | (135,402,129) | 2,261,158 | 137,256,909 |
| End of period | 29,923,064 | $519,473,914 | 30,416,020 | $654,876,043 | |
| 11/1/21– 10/31/22 | 11/1/20– 10/31/21 | 11/1/19– 10/31/20 | 11/1/18– 10/31/19 | 11/1/17– 10/31/18 | ||
| Per-Share Data | ||||||
| Net asset value at beginning of period | $18.47 | $16.50 | $16.43 | $15.63 | $16.27 | |
| Income (loss) from investment operations: | ||||||
| Net investment income (loss)1 | 0.29 | 0.26 | 0.30 | 0.35 | 0.31 | |
| Net realized and unrealized gains (losses) | (2.97) | 2.27 | 0.27 | 1.18 | (0.38) | |
| Total from investment operations | (2.68) | 2.53 | 0.57 | 1.53 | (0.07) | |
| Less distributions: | ||||||
| Distributions from net investment income | (0.30) | (0.27) | (0.31) | (0.36) | (0.32) | |
| Distributions from net realized gains | (0.59) | (0.29) | (0.19) | (0.37) | (0.25) | |
| Total distributions | (0.89) | (0.56) | (0.50) | (0.73) | (0.57) | |
| Net asset value at end of period | $14.90 | $18.47 | $16.50 | $16.43 | $15.63 | |
| Total return | (15.23%) | 15.50% | 3.57% | 10.31% | (0.49%) | |
| Ratios/Supplemental Data | ||||||
| Ratios to average net assets: | ||||||
| Net operating expenses2 | 0.42% 3 | 0.41% | 0.42% | 0.43% | 0.41% | |
| Gross operating expenses2 | 0.42% 3 | 0.41% | 0.42% | 0.43% | 0.41% | |
| Net investment income (loss) | 1.73% | 1.45% | 1.84% | 2.19% | 1.93% | |
| Portfolio turnover rate | 11% | 13% | 35% | 26% | 9% | |
| Net assets, end of period (x 1,000) | $227,991 | $335,110 | $278,883 | $263,373 | $239,068 | |
| 1 | Calculated based on the average shares outstanding during the period. |
| 2 | Ratio excludes acquired fund fees and expenses, which are indirect expenses incurred by the fund through its investments in underlying funds. |
| 3 | Ratio includes less than 0.005% of non-routine proxy expenses. |
| SECURITY | VALUE AT 10/31/21 | PURCHASES | SALES | REALIZED GAINS (LOSSES) | NET CHANGE IN UNREALIZED APPRECIATION (DEPRECIATION) | VALUE AT 10/31/22 | BALANCE OF SHARES HELD AT 10/31/22 | DISTRIBUTIONS RECEIVED(a) |
| AFFILIATED UNDERLYING FUNDS 99.5% OF NET ASSETS | ||||||||
| U.S. Stocks 28.2% | ||||||||
| Large-Cap 22.2% | ||||||||
| Schwab Fundamental US Large Company Index Fund | $20,049,297 | $1,837,826 | ($6,572,518) | $1,396,688 | ($2,999,932) | $13,711,361 | 647,068 | $949,036 |
| Schwab S&P 500 Index Fund | 47,404,594 | 4,649,146 | (13,115,370) | 6,425,594 | (13,212,743) | 32,151,221 | 535,675 | 605,949 |
| Schwab U.S. Large-Cap Growth Index Fund | 6,958,268 | 1,187,278 | (1,813,636) | 260,261 | (1,923,461) | 4,668,710 | 70,642 | 123,367 |
| 50,531,292 | ||||||||
| Small-Cap 6.0% | ||||||||
| Schwab Fundamental US Small Company Index Fund | 5,916,724 | 791,966 | (1,244,377) | (8,203) | (1,299,650) | 4,156,460 | 273,092 | 658,281 |
| Schwab Small-Cap Index Fund | 14,217,551 | 3,392,638 | (4,206,181) | (306,651) | (3,458,726) | 9,638,631 | 322,686 | 1,134,557 |
| 13,795,091 | ||||||||
| 64,326,383 | ||||||||
| International Stocks 10.1% | ||||||||
| Developed Markets 8.5% | ||||||||
| Schwab Fundamental International Large Company Index Fund | 6,690,648 | 1,034,823 | (1,779,129) | (10,908) | (1,258,137) | 4,677,297 | 556,159 | 252,770 |
| Schwab Fundamental International Small Company Index Fund | 5,744,117 | 315,889 | (525,000) | (103,586) | (1,662,185) | 3,769,235 | 353,587 | 315,889 |
| Schwab International Index Fund | 15,566,944 | 1,834,556 | (2,633,552) | (176,021) | (3,828,479) | 10,763,448 | 592,375 | 516,716 |
| 19,209,980 | ||||||||
| Emerging Markets 1.6% | ||||||||
| Schwab Fundamental Emerging Markets Large Company Index Fund | 5,328,747 | 666,016 | (820,527) | (14,423) | (1,488,324) | 3,671,489 | 499,522 | 245,076 |
| 22,881,469 | ||||||||
| Real Estate 2.0% | ||||||||
| U.S. REITs 2.0% | ||||||||
| Schwab U.S. REIT ETF | 6,912,401 | 234,542 | (1,349,523) | 132,524 | (1,313,116) | 4,616,828 | 239,090 | 124,390 |
| Fixed Income 55.7% | ||||||||
| Intermediate-Term Bond 54.7% | ||||||||
| Schwab U.S. Aggregate Bond Index Fund | 183,900,598 | 13,965,471 | (43,035,923) | (5,742,878) | (24,358,395) | 124,728,873 | 14,503,357 | 3,592,868 |
| Short-Term Bond 1.0% | ||||||||
| Schwab Short-Term Bond Index Fund | 3,181,909 | 43,731 | (671,387) | (52,368) | (203,977) | 2,297,908 | 246,557 | 43,717 |
| 127,026,781 | ||||||||
| SECURITY | VALUE AT 10/31/21 | PURCHASES | SALES | REALIZED GAINS (LOSSES) | NET CHANGE IN UNREALIZED APPRECIATION (DEPRECIATION) | VALUE AT 10/31/22 | BALANCE OF SHARES HELD AT 10/31/22 | DISTRIBUTIONS RECEIVED(a) |
| Money Market Funds 3.5% | ||||||||
| Schwab Variable Share Price Money Fund, Ultra Shares, 3.10% (b) | $9,220,832 | $75,242 | ($1,250,220) | ($630) | ($2,021) | $8,043,203 | 8,043,203 | $85,083 |
| Total Affiliated Underlying Funds (Cost $202,271,486) | $331,092,630 | $30,029,124 | ($79,017,343) | $1,799,399 | ($57,009,146) | $226,894,664 | $8,647,699 | |
| Total Investments in Securities (Cost $202,271,486) | $226,894,664 | |||||||
| (a) | Distributions received include distributions from net investment income and capital gains, if any, from the underlying funds. Amounts shown are only presented for affiliated underlying funds, which are presented in the corresponding line-item in the Statement of Operations, if applicable (See financial note 2(d) for additional information). |
| (b) | The rate shown is the annualized 7-day yield. |
| ETF — | Exchange traded fund |
| REIT — | Real Estate Investment Trust |
| Assets | ||
| Investments in securities, at value - affiliated (cost $202,271,486) | $226,894,664 | |
| Cash | 282,848 | |
| Receivables: | ||
| Investments sold | 4,119,420 | |
| Dividends | 278,707 | |
| Fund shares sold | 248,358 | |
| Interest | 904 | |
| Prepaid expenses | + | 15,863 |
| Total assets | 231,840,764 | |
| Liabilities | ||
| Payables: | ||
| Investments bought | 3,592,140 | |
| Fund shares redeemed | 130,497 | |
| Shareholder service fees | 44,428 | |
| Investment adviser and administrator fees | 23,384 | |
| Independent trustees’ fees | 35 | |
| Accrued expenses | + | 59,747 |
| Total liabilities | 3,850,231 | |
| Net assets | $227,990,533 | |
| Net Assets by Source | ||
| Capital received from investors | $202,174,552 | |
| Total distributable earnings | + | 25,815,981 |
| Net assets | $227,990,533 | |
| Net Asset Value (NAV) | ||||
| Net Assets | ÷ | Shares Outstanding | = | NAV |
| $227,990,533 | 15,304,913 | $14.90 | ||
| For the period November 1, 2021 through October 31, 2022 | ||
| Investment Income | ||
| Dividends received from securities - affiliated | $6,170,406 | |
| Interest received from securities - unaffiliated | + | 5,469 |
| Total investment income | 6,175,875 | |
| Expenses | ||
| Shareholder service fees | 702,592 | |
| Investment adviser and administrator fees | 373,899 | |
| Registration fees | 42,715 | |
| Portfolio accounting fees | 24,115 | |
| Professional fees | 20,163 | |
| Proxy fees1 | 12,943 | |
| Shareholder reports | 12,357 | |
| Independent trustees’ fees | 7,548 | |
| Transfer agent fees | 1,709 | |
| Custodian fees | 1,496 | |
| Interest expense | 380 | |
| Other expenses | + | 7,063 |
| Total expenses | 1,206,980 | |
| Expense reduction | – | 1,709 |
| Net expenses | – | 1,205,271 |
| Net investment income | 4,970,604 | |
| REALIZED AND UNREALIZED GAINS (LOSSES) | ||
| Realized capital gain distributions received from underlying funds - affiliated | 2,477,293 | |
| Net realized gains on sales of securities - affiliated | + | 1,799,399 |
| Net realized gains | 4,276,692 | |
| Net change in unrealized appreciation (depreciation) on securities - affiliated | + | (57,009,146) |
| Net realized and unrealized losses | (52,732,454) | |
| Decrease in net assets resulting from operations | ($47,761,850) | |
| 1 | Proxy fees are non-routine expenses (see financial note 2(e) for additional information). |
| OPERATIONS | |||
| 11/1/21-10/31/22 | 11/1/20-10/31/21 | ||
| Net investment income | $4,970,604 | $4,473,107 | |
| Net realized gains | 4,276,692 | 10,926,449 | |
| Net change in unrealized appreciation (depreciation) | + | (57,009,146) | 27,412,068 |
| Increase (decrease) in net assets resulting from operations | ($47,761,850) | $42,811,624 | |
| DISTRIBUTIONS TO SHAREHOLDERS | |||
| Total distributions | ($15,825,504) | ($9,242,129) | |
| TRANSACTIONS IN FUND SHARES | |||||
| 11/1/21-10/31/22 | 11/1/20-10/31/21 | ||||
| SHARES | VALUE | SHARES | VALUE | ||
| Shares sold | 2,222,481 | $37,874,315 | 4,868,387 | $87,446,661 | |
| Shares reinvested | 773,587 | 13,558,318 | 450,769 | 7,876,623 | |
| Shares redeemed | + | (5,830,067) | (94,964,552) | (4,084,996) | (72,665,622) |
| Net transactions in fund shares | (2,833,999) | ($43,531,919) | 1,234,160 | $22,657,662 | |
| SHARES OUTSTANDING AND NET ASSETS | |||||
| 11/1/21-10/31/22 | 11/1/20-10/31/21 | ||||
| SHARES | NET ASSETS | SHARES | NET ASSETS | ||
| Beginning of period | 18,138,912 | $335,109,806 | 16,904,752 | $278,882,649 | |
| Total increase (decrease) | + | (2,833,999) | (107,119,273) | 1,234,160 | 56,227,157 |
| End of period | 15,304,913 | $227,990,533 | 18,138,912 | $335,109,806 | |
| SCHWAB CAPITAL TRUST (ORGANIZED MAY 7, 1993) | |
| Schwab MarketTrack All Equity Portfolio | Schwab Target 2045 Fund |
| Schwab MarketTrack Growth Portfolio | Schwab Target 2050 Fund |
| Schwab MarketTrack Balanced Portfolio | Schwab Target 2055 Fund |
| Schwab MarketTrack Conservative Portfolio | Schwab Target 2060 Fund |
| Schwab S&P 500 Index Fund | Schwab Target 2065 Fund |
| Schwab Small-Cap Index Fund® | Schwab Fundamental US Large Company Index Fund |
| Schwab Total Stock Market Index Fund® | Schwab Fundamental US Small Company Index Fund |
| Schwab U.S. Large-Cap Growth Index Fund | Schwab Fundamental International Large Company Index Fund |
| Schwab U.S. Large-Cap Value Index Fund | Schwab Fundamental International Small Company Index Fund |
| Schwab U.S. Mid-Cap Index Fund | Schwab Fundamental Emerging Markets Large Company Index Fund |
| Schwab International Index Fund® | Schwab Fundamental Global Real Estate Index Fund |
| Schwab International Opportunities Fund | Schwab Target 2010 Index Fund |
| Schwab Balanced Fund | Schwab Target 2015 Index Fund |
| Schwab Core Equity Fund | Schwab Target 2020 Index Fund |
| Schwab Dividend Equity Fund | Schwab Target 2025 Index Fund |
| Schwab Large-Cap Growth Fund | Schwab Target 2030 Index Fund |
| Schwab Small-Cap Equity Fund | Schwab Target 2035 Index Fund |
| Schwab Health Care Fund | Schwab Target 2040 Index Fund |
| Schwab International Core Equity Fund | Schwab Target 2045 Index Fund |
| Schwab Target 2010 Fund | Schwab Target 2050 Index Fund |
| Schwab Target 2015 Fund | Schwab Target 2055 Index Fund |
| Schwab Target 2020 Fund | Schwab Target 2060 Index Fund |
| Schwab Target 2025 Fund | Schwab Target 2065 Index Fund |
| Schwab Target 2030 Fund | Schwab Monthly Income Fund - Target Payout |
| Schwab Target 2035 Fund | Schwab Monthly Income Fund - Flexible Payout |
| Schwab Target 2040 Fund | Schwab Monthly Income Fund - Income Payout |
| 4. Affiliates and Affiliated Transactions: |
| SCHWAB MARKETTRACK ALL EQUITY PORTFOLIO | SCHWAB MARKETTRACK GROWTH PORTFOLIO | SCHWAB MARKETTRACK BALANCED PORTFOLIO | SCHWAB MARKETTRACK CONSERVATIVE PORTFOLIO |
| 0.50% | 0.50% | 0.50% | 0.50% |
| UNDERLYING FUNDS | SCHWAB MARKETTRACK ALL EQUITY PORTFOLIO | SCHWAB MARKETTRACK GROWTH PORTFOLIO | SCHWAB MARKETTRACK BALANCED PORTFOLIO | SCHWAB MARKETTRACK CONSERVATIVE PORTFOLIO |
| Schwab Fundamental Emerging Markets Large Company Index Fund | 5.7% | 4.3% | 2.0% | 0.6% |
| Schwab Fundamental International Large Company Index Fund | 2.7% | 2.1% | 0.6% | 0.3% |
| Schwab Fundamental International Small Company Index Fund | 6.5% | 4.9% | 3.8% | 0.7% |
| Schwab Fundamental US Large Company Index Fund | 1.5% | 1.5% | 0.7% | 0.2% |
| Schwab Fundamental US Small Company Index Fund | 2.0% | 1.9% | 0.9% | 0.3% |
| Schwab International Index Fund | 1.3% | 1.1% | 0.5% | 0.2% |
| Schwab S&P 500 Index Fund | 0.4% | 0.4% | 0.2% | 0.1% |
| Schwab Short-Term Bond Index Fund | —% | —% | 0.3% | 0.1% |
| Schwab Small-Cap Index Fund | 1.4% | 1.4% | 0.6% | 0.2% |
| Schwab U.S. Aggregate Bond Index Fund | —% | 3.1% | 4.4% | 3.1% |
| Schwab U.S. Large-Cap Growth Index Fund | 3.6% | 2.8% | 1.7% | 0.5% |
| Schwab U.S. REIT ETF | 0.6% | 0.6% | 0.3% | 0.1% |
| Schwab Variable Share Price Money Fund, Ultra Shares | —% | 0.6% | 0.4% | 0.2% |
| PURCHASE COST | SALE PROCEEDS | REALIZED GAINS (LOSSES) | |
| Schwab MarketTrack All Equity Portfolio | $— | $— | $— |
| Schwab MarketTrack Growth Portfolio | — | — | — |
| Schwab MarketTrack Balanced Portfolio | — | — | — |
| Schwab MarketTrack Conservative Portfolio | — | 186,983 | 11,499 |
| 6. Borrowing from Banks: |
| PURCHASES OF SECURITIES | SALES OF SECURITIES | |
| Schwab MarketTrack All Equity Portfolio | $67,449,698 | $56,113,306 |
| Schwab MarketTrack Growth Portfolio | 79,623,617 | 70,448,608 |
| Schwab MarketTrack Balanced Portfolio | 65,997,582 | 79,030,866 |
| Schwab MarketTrack Conservative Portfolio | 30,029,124 | 79,017,343 |
| TAX COST | GROSS UNREALIZED APPRECIATION | GROSS UNREALIZED DEPRECIATION | NET UNREALIZED APPRECIATION (DEPRECIATION) | |
| Schwab MarketTrack All Equity Portfolio | $456,086,011 | $255,851,821 | ($16,171,928) | $239,679,893 |
| Schwab MarketTrack Growth Portfolio | 537,383,167 | 286,978,148 | (26,946,732) | 260,031,416 |
| Schwab MarketTrack Balanced Portfolio | 409,273,295 | 144,494,892 | (36,900,548) | 107,594,344 |
| Schwab MarketTrack Conservative Portfolio | 206,049,797 | 44,369,704 | (23,524,837) | 20,844,867 |
| UNDISTRIBUTED ORDINARY INCOME | UNDISTRIBUTED LONG-TERM CAPITAL GAINS | NET UNREALIZED APPRECIATION (DEPRECIATION) ON INVESTMENTS | TOTAL | |
| Schwab MarketTrack All Equity Portfolio | $898,023 | $22,574,323 | $239,679,893 | $263,152,239 |
| Schwab MarketTrack Growth Portfolio | 917,601 | 21,871,324 | 260,031,416 | 282,820,341 |
| Schwab MarketTrack Balanced Portfolio | 2,533,286 | 11,727,583 | 107,594,344 | 121,855,213 |
| Schwab MarketTrack Conservative Portfolio | 251,980 | 4,719,134 | 20,844,867 | 25,815,981 |
| CURRENT FISCAL YEAR END DISTRIBUTIONS | PRIOR FISCAL YEAR END DISTRIBUTIONS | |||
| ORDINARY INCOME | LONG-TERM CAPITAL GAINS | ORDINARY INCOME | LONG-TERM CAPITAL GAINS | |
| Schwab MarketTrack All Equity Portfolio | $19,017,789 | $13,762,591 | $7,460,784 | $39,354,505 |
| Schwab MarketTrack Growth Portfolio | 16,666,445 | 31,287,063 | 12,895,152 | 51,712,898 |
| Schwab MarketTrack Balanced Portfolio | 11,374,707 | 20,448,843 | 9,583,547 | 25,198,263 |
| Schwab MarketTrack Conservative Portfolio | 5,450,344 | 10,375,160 | 5,222,343 | 4,019,786 |
Denver, Colorado
December 16, 2022
| FOREIGN TAX CREDIT | FOREIGN SOURCE INCOME | |
| Schwab MarketTrack All Equity Portfolio | $753,447 | $7,978,881 |
| Schwab MarketTrack Growth Portfolio | 575,051 | 6,101,724 |
| Schwab MarketTrack Balanced Portfolio | 289,455 | 3,079,227 |
| Schwab MarketTrack Conservative Portfolio | 97,972 | 1,041,215 |
| Schwab MarketTrack All Equity Portfolio | 44.10% |
| Schwab MarketTrack Growth Portfolio | 40.48% |
| Schwab MarketTrack Balanced Portfolio | 31.72% |
| Schwab MarketTrack Conservative Portfolio | 21.65% |
| Schwab MarketTrack All Equity Portfolio | $19,616,954 |
| Schwab MarketTrack Growth Portfolio | 16,779,760 |
| Schwab MarketTrack Balanced Portfolio | 8,249,706 |
| Schwab MarketTrack Conservative Portfolio | 2,882,608 |
| Schwab MarketTrack All Equity Portfolio | $13,762,591 |
| Schwab MarketTrack Growth Portfolio | 31,287,063 |
| Schwab MarketTrack Balanced Portfolio | 20,448,843 |
| Schwab MarketTrack Conservative Portfolio | 10,375,160 |
| Schwab MarketTrack All Equity Portfolio | $721,178 |
| Schwab MarketTrack Growth Portfolio | 512,118 |
| Schwab MarketTrack Balanced Portfolio | 276,221 |
| Schwab MarketTrack Conservative Portfolio | 85,132 |
| Schwab MarketTrack All Equity Portfolio | —% |
| Schwab MarketTrack Growth Portfolio | 0.53% |
| Schwab MarketTrack Balanced Portfolio | 0.91% |
| Schwab MarketTrack Conservative Portfolio | 1.74% |
| Proposal – To elect each of the following individuals as trustees of the Trust: | For | Withheld |
| Walter W. Bettinger II | 1,095,577,106.505 | 115,838,980.968 |
| Richard A. Wurster | 1,117,598,789.555 | 93,817,297.918 |
| Michael J. Beer | 1,116,890,447.505 | 94,525,639.968 |
| Robert W. Burns | 1,117,915,860.110 | 93,500,227.363 |
| Nancy F. Heller | 1,119,878,732.134 | 91,537,355.339 |
| David L. Mahoney | 1,069,125,022.434 | 142,291,065.039 |
| Jane P. Moncreiff | 1,120,187,927.838 | 91,228,159.635 |
| Kiran M. Patel | 1,116,689,111.571 | 94,726,975.902 |
| Kimberly S. Patmore | 1,119,941,056.059 | 91,475,031.414 |
| J. Derek Penn | 1,117,666,014.121 | 93,750,073.352 |
| 1. | the nature, extent and quality of the services provided to each Fund under the Agreement, including the resources of the investment adviser and its affiliates dedicated to the Funds; |
| 2. | each Fund’s investment performance and how it compared to that of certain other comparable mutual funds and benchmark data; |
| 3. | each Fund’s expenses and how those expenses compared to those of certain other similar mutual funds; |
| 4. | the profitability of the investment adviser and its affiliates, including Charles Schwab & Co., Inc. (Schwab), with respect to each Fund, including both direct and indirect benefits accruing to the investment adviser and its affiliates; and |
| 5. | the extent to which economies of scale would be realized as each Fund grows and whether fee levels in the Agreement reflect those economies of scale for the benefit of Fund investors. |
| Independent Trustees | |||
| Name, Year of Birth, and Position(s) with the trust (Terms of office, and length of Time Served1) | Principal Occupations During the Past Five Years | Number of Portfolios in Fund Complex Overseen by the Trustee | Other Directorships |
Michael J. Beer 1961 Trustee (Trustee of The Charles Schwab Family of Funds, Schwab Investments, Schwab Capital Trust, Schwab Annuity Portfolios, Schwab Strategic Trust and Laudus Trust since 2022) | Retired. Director, President and Chief Executive Officer (Dec. 2016 – Sept. 2019), Principal Funds (investment management). | 105 | Director (2016 – 2019), Principal Funds, Inc. |
| Robert W. Burns 1959 Trustee (Trustee of Schwab Strategic Trust since 2009; The Charles Schwab Family of Funds, Schwab Investments, Schwab Capital Trust, Schwab Annuity Portfolios and Laudus Trust since 2016) | Retired/Private Investor. | 105 | None |
| Nancy F. Heller 1956 Trustee (Trustee of The Charles Schwab Family of Funds, Schwab Investments, Schwab Capital Trust, Schwab Annuity Portfolios, Schwab Strategic Trust and Laudus Trust since 2018) | Retired. | 105 | None |
| David L. Mahoney 1954 Trustee (Trustee of The Charles Schwab Family of Funds, Schwab Investments, Schwab Capital Trust, Schwab Annuity Portfolios and Laudus Trust since 2011; Schwab Strategic Trust since 2016) | Private Investor. | 105 | Director (2004 – present), Corcept Therapeutics Incorporated Director (2009 – 2021), Adamas Pharmaceuticals, Inc. Director (2003 – 2019), Symantec Corporation |
| Jane P. Moncreiff 1961 Trustee (Trustee of The Charles Schwab Family of Funds, Schwab Investments, Schwab Capital Trust, Schwab Annuity Portfolios, Schwab Strategic Trust and Laudus Trust since 2019) | Consultant (2018 – present), Fulham Advisers LLC (management consulting); Chief Investment Officer (2009 – 2017), CareGroup Healthcare System, Inc. (healthcare). | 105 | None |
| Independent Trustees (continued) | |||
| Name, Year of Birth, and Position(s) with the trust (Terms of office, and length of Time Served1) | Principal Occupations During the Past Five Years | Number of Portfolios in Fund Complex Overseen by the Trustee | Other Directorships |
| Kiran M. Patel 1948 Trustee (Trustee of The Charles Schwab Family of Funds, Schwab Investments, Schwab Capital Trust, Schwab Annuity Portfolios and Laudus Trust since 2011; Schwab Strategic Trust since 2016) | Retired. | 105 | Director (2008 – present), KLA-Tencor Corporation |
| Kimberly S. Patmore 1956 Trustee (Trustee of The Charles Schwab Family of Funds, Schwab Investments, Schwab Capital Trust, Schwab Annuity Portfolios, Schwab Strategic Trust and Laudus Trust since 2016) | Consultant (2008 – present), Patmore Management Consulting (management consulting). | 105 | None |
J. Derek Penn 1957 Trustee (Trustee of The Charles Schwab Family of Funds, Schwab Investments, Schwab Capital Trust, Schwab Annuity Portfolios, Schwab Strategic Trust and Laudus Trust since 2021) | Head of Equity Sales and Trading (2006 – 2018), BNY Mellon (financial services). | 105 | None |
| Interested Trustees | |||
| Name, Year of Birth, and Position(s) with the trust (Terms of office, and length of Time Served1) | Principal Occupations During the Past Five Years | Number of Portfolios in Fund Complex Overseen by the Trustee | Other Directorships |
| Walter W. Bettinger II2 1960 Chairman and Trustee (Trustee of The Charles Schwab Family of Funds, Schwab Investments, Schwab Capital Trust and Schwab Annuity Portfolios since 2008; Schwab Strategic Trust since 2009; Laudus Trust since 2010) | Co-Chairman of the Board (July 2022 – present), Director and Chief Executive Officer (Oct. 2008 – present) and President (Feb. 2007 – Oct. 2021), The Charles Schwab Corporation; President and Chief Executive Officer (Oct. 2008 – Oct. 2021) and Director (May 2008 – Oct. 2021), Charles Schwab & Co., Inc.; Director (Apr. 2006 – present), Charles Schwab Bank, SSB; Director (Nov. 2017 – present), Charles Schwab Premier Bank, SSB; Director (July 2019 – present), Charles Schwab Trust Bank; Director (May 2008 – present), Chief Executive Officer (Aug. 2017 – present) and President (Aug. 2017 – Nov. 2021), Schwab Holdings, Inc.; Director (Oct. 2020 – present), TD Ameritrade Holding Corporation; Director (July 2016 – Oct. 2021), Charles Schwab Investment Management, Inc. | 105 | Director (2008 – present), The Charles Schwab Corporation |
| Interested Trustees (continued) | |||
| Name, Year of Birth, and Position(s) with the trust (Terms of office, and length of Time Served1) | Principal Occupations During the Past Five Years | Number of Portfolios in Fund Complex Overseen by the Trustee | Other Directorships |
| Richard A. Wurster2 1973 Trustee (Trustee of The Charles Schwab Family of Funds, Schwab Investments, Schwab Capital Trust, Schwab Annuity Portfolios, Schwab Strategic Trust and Laudus Trust since 2022) | President (Oct. 2021 – present) and Executive Vice President – Schwab Asset Management Solutions (Apr. 2019 – Oct. 2021), The Charles Schwab Corporation; President, Director (Oct. 2021 – present), Executive Vice President – Schwab Asset Management Solutions (July 2019 – Oct. 2021) and Senior Vice President – Advisory (May 2016 – July 2019), Charles Schwab & Co., Inc.; President (Nov. 2021 – present), Schwab Holdings, Inc.; Director (Oct. 2021 – present) and Chief Executive Officer (Nov. 2019 – Jan. 2022), Charles Schwab Investment Management, Inc.; Director, Chief Executive Officer and President (Mar. 2018 – Oct. 2022), Charles Schwab Investment Advisory, Inc.; Chief Executive Officer (July 2016 – Apr. 2018) and President (Mar. 2017 – Apr. 2018), ThomasPartners, Inc.; Chief Executive Officer (July 2016 – Apr. 2018), Windhaven Investment Management, Inc. | 105 | None |
| Officers of the Trust | |
| Name, Year of Birth, and Position(s) with the trust (Terms of office, and length of Time Served3) | Principal Occupations During the Past Five Years |
| Jonathan de St. Paer 1973 President and Chief Executive Officer (Officer of The Charles Schwab Family of Funds, Schwab Investments, Schwab Capital Trust, Schwab Annuity Portfolios, Schwab Strategic Trust and Laudus Trust since 2018) | Director (Apr. 2019 – present), President (Oct. 2018 – present), Chief Operating Officer (Jan. 2021 – present), and Chief Executive Officer (Apr. 2019 – Nov. 2019), Charles Schwab Investment Management, Inc.; Senior Vice President (June 2020 – Mar. 2022) and Chief Operating Officer (Jan. 2021 – Mar. 2022), Charles Schwab Investment Advisory, Inc.; Chief Executive Officer (Apr. 2019 – present), President (Nov. 2018 – present) and Trustee (Apr. 2019 – Dec. 2020), Schwab Funds, Laudus Trust and Schwab ETFs; Managing Director (May 2022 – present), Senior Vice President (Apr. 2019 – May 2022) and Senior Vice President – Strategy and Product Development (CSIM) (Jan. 2014 – Mar. 2019), Charles Schwab & Co., Inc. |
| Mark Fischer 1970 Treasurer, Chief Financial Officer and Chief Operating Officer (Officer of The Charles Schwab Family of Funds, Schwab Investments, Schwab Capital Trust, Schwab Annuity Portfolios, Schwab Strategic Trust and Laudus Trust since 2013) | Treasurer and Chief Financial Officer (Jan. 2016 – present) and Chief Operating Officer (Dec. 2020 – present), Schwab Funds, Laudus Trust and Schwab ETFs; Chief Financial Officer (Mar. 2020 – present) and Vice President (Oct. 2013 – present), Charles Schwab Investment Management, Inc. |
| Omar Aguilar 1970 Vice President and Chief Investment Officer (Officer of The Charles Schwab Family of Funds, Schwab Investments, Schwab Capital Trust, Schwab Annuity Portfolios, Schwab Strategic Trust and Laudus Trust since 2011) | Chief Executive Officer (Jan. 2022 – present), Chief Investment Officer (Apr. 2011 – present) and Senior Vice President (Apr. 2011 – Dec. 2021), Charles Schwab Investment Management, Inc.; Director, Chief Executive Officer and President (Oct. 2022 – present), Charles Schwab Investment Advisory, Inc.; Vice President and Chief Investment Officer (June 2011 – present), Schwab Funds, Laudus Trust and Schwab ETFs. |
| Brett Wander 1961 Vice President and Chief Investment Officer (Officer of The Charles Schwab Family of Funds, Schwab Investments, Schwab Capital Trust, Schwab Annuity Portfolios, Schwab Strategic Trust and Laudus Trust since 2011) | Senior Vice President and Chief Investment Officer (Apr. 2011 – present), Charles Schwab Investment Management, Inc.; Vice President and Chief Investment Officer (June 2011 – present), Schwab Funds, Laudus Trust and Schwab ETFs. |
| William P. McMahon, Jr. 1972 Vice President and Chief Investment Officer (Officer of The Charles Schwab Family of Funds, Schwab Investments, Schwab Capital Trust, Schwab Annuity Portfolios, Schwab Strategic Trust and Laudus Trust since 2021) | Senior Vice President and Chief Investment Officer (Jan. 2020 – present), Charles Schwab Investment Management, Inc.; Vice President and Chief Investment Officer (June 2021 – present), Schwab Funds, Laudus Trust and Schwab ETFs; Senior Vice President and Chief Investment Officer – ThomasPartners Strategies (Apr. 2018 – Dec. 2019), Charles Schwab Investment Advisory, Inc.; Senior Vice President and Chief Investment Officer (May 2001 – Apr. 2018), ThomasPartners, Inc. |
| Officers of the Trust (continued) | |
| Name, Year of Birth, and Position(s) with the trust (Terms of office, and length of Time Served3) | Principal Occupations During the Past Five Years |
| Catherine MacGregor 1964 Chief Legal Officer and Secretary, Schwab Funds and Schwab ETFs Chief Legal Officer, Vice President and Clerk, Laudus Trust (Officer of The Charles Schwab Family of Funds, Schwab Investments, Schwab Capital Trust, Schwab Annuity Portfolios and Laudus Trust since 2005; Schwab Strategic Trust since 2009) | Chief Legal Officer (Mar. 2022 – present) and Vice President (Sept. 2005 – present), Charles Schwab Investment Management, Inc.; Managing Director (May 2022 – present) and Vice President (July 2005 – May 2022), Charles Schwab & Co., Inc.; Vice President (Dec. 2005 – present) and Chief Legal Officer and Clerk (Mar. 2007 – present), Laudus Trust; Chief Legal Officer and Secretary (Oct. 2021 – present), Vice President (Nov. 2005 – Oct. 2021) and Assistant Secretary (June 2007 – Oct. 2021), Schwab Funds; Chief Legal Officer and Secretary (Oct. 2021 – present), Vice President and Assistant Secretary (Oct. 2009 – Oct. 2021), Schwab ETFs. |
| 1 | Each Trustee shall hold office until the election and qualification of his or her successor, or until he or she dies, resigns or is removed. The retirement policy requires that each independent trustee retire by December 31 of the year in which the Trustee turns 74 or the Trustee’s twentieth year of service as an independent trustee on any trust in the Fund Complex, whichever occurs first. |
| 2 | Mr. Bettinger and Mr. Wurster are Interested Trustees. Mr. Bettinger and Mr. Wurster are Interested Trustees because each owns stock of The Charles Schwab Corporation (CSC), the parent company of Charles Schwab Investment Management, Inc., the investment adviser for the trusts in the Fund Complex, and is an employee of Charles Schwab & Co., Inc. (Schwab), the principal underwriter for The Charles Schwab Family of Funds, Schwab Investments, Schwab Capital Trust, Schwab Annuity Portfolios and Laudus Trust. |
| 3 | The President, Treasurer and Secretary/Clerk hold office until their respective successors are chosen and qualified or until he or she sooner dies, resigns, is removed or becomes disqualified. Each of the other officers serves at the pleasure of the Board. |
Schwab Funds
Member SIPC®
Printed on recycled paper.
| ¹ | State, local, and the Federal Alternative Minimum Tax may apply. Capital gains are not exempt from Federal Taxation. |
| ² | You could lose money by investing in the Schwab Money Funds. All Schwab Money Funds with the exception of Schwab Variable Share Price Money Fund seek to preserve the value of your investment at $1.00 per share, but cannot guarantee they will do so. Because the share price of Schwab Variable Share Price Money Fund will fluctuate, when you sell your shares they may be worth more or less than what you originally paid for them. All Schwab Money Funds with the exception of Schwab Government Money Fund, Schwab Retirement Government Money Fund, Schwab U.S. Treasury Money Fund, Schwab Treasury Obligations Money Fund and Schwab Government Money Market Portfolio may impose a fee upon the sale of your shares or may temporarily suspend your ability to sell shares if the Fund’s liquidity falls below required minimums because of market conditions or other factors. An investment in the Schwab Money Funds is not insured or guaranteed by the Federal Deposit Insurance Corporation or any other government agency. The Schwab Money Funds’ sponsor has no legal obligation to provide financial support to the Funds, and you should not expect that the sponsor will provide financial support to the Funds at any time. |

| Total Return for the 12 Months Ended October 31, 2022 | |
| Schwab Target 2010 Fund (Ticker Symbol: SWBRX) | -15.69% |
| Target 2010 Composite Index | -14.26% |
| Fund Category: Morningstar Target-Date 2000-20101 | -14.76% |
| Performance Details | pages 8-10 |
| Schwab Target 2015 Fund (Ticker Symbol: SWGRX) | -16.15% |
| Target 2015 Composite Index | -14.50% |
| Fund Category: Morningstar Target-Date 20151 | -15.43% |
| Performance Details | pages 11-13 |
| Schwab Target 2020 Fund (Ticker Symbol: SWCRX) | -16.35% |
| Target 2020 Composite Index | -14.67% |
| Fund Category: Morningstar Target-Date 20201 | -16.13% |
| Performance Details | pages 14-16 |
| Schwab Target 2025 Fund (Ticker Symbol: SWHRX) | -17.39% |
| Target 2025 Composite Index | -15.34% |
| Fund Category: Morningstar Target-Date 20251 | -16.85% |
| Performance Details | pages 17-19 |
| Schwab Target 2030 Fund (Ticker Symbol: SWDRX) | -18.51% |
| Target 2030 Composite Index | -16.15% |
| Fund Category: Morningstar Target-Date 20301 | -17.69% |
| Performance Details | pages 20-22 |
| Schwab Target 2035 Fund (Ticker Symbol: SWIRX) | -19.41% |
| Target 2035 Composite Index | -16.84% |
| Fund Category: Morningstar Target-Date 20351 | -18.49% |
| Performance Details | pages 23-25 |
| 1 | Source for category information: Morningstar, Inc. The Morningstar Category return represents all active and index mutual funds and ETFs within the category as of the report date. |
| Total Return for the 12 Months Ended October 31, 2022 | |
| Schwab Target 2040 Fund (Ticker Symbol: SWERX) | -20.10% |
| Target 2040 Composite Index | -17.44% |
| Fund Category: Morningstar Target-Date 20401 | -18.96% |
| Performance Details | pages 26-28 |
| Schwab Target 2045 Fund (Ticker Symbol: SWMRX) | -20.76% |
| Target 2045 Composite Index | -17.98% |
| Fund Category: Morningstar Target-Date 20451 | -19.30% |
| Performance Details | pages 29-31 |
| Schwab Target 2050 Fund (Ticker Symbol: SWNRX) | -21.22% |
| Target 2050 Composite Index | -18.32% |
| Fund Category: Morningstar Target-Date 20501 | -19.52% |
| Performance Details | pages 32-34 |
| Schwab Target 2055 Fund (Ticker Symbol: SWORX) | -21.54% |
| Target 2055 Composite Index | -18.53% |
| Fund Category: Morningstar Target-Date 20551 | -19.63% |
| Performance Details | pages 35-37 |
| Schwab Target 2060 Fund (Ticker Symbol: SWPRX) | -21.88% |
| Target 2060 Composite Index | -18.71% |
| Fund Category: Morningstar Target-Date 20601 | -19.63% |
| Performance Details | pages 38-40 |
| Schwab Target 2065 Fund (Ticker Symbol: SWQRX) | -21.78% |
| Target 2065 Composite Index | -18.76% |
| Fund Category: Morningstar Target-Date 2065+1 | -19.88% |
| Performance Details | pages 41-43 |
| 1 | Source for category information: Morningstar, Inc. The Morningstar Category return represents all active and index mutual funds and ETFs within the category as of the report date. |

President of Schwab Asset
Management and the funds
covered in this report.

| * | The net version of the index reflects reinvested dividends net of withholding taxes but reflects no deductions for expenses or other taxes. |

| * | The net version of the index reflects reinvested dividends net of withholding taxes but reflects no deductions for expenses or other taxes. |
 | Zifan Tang, Ph.D., CFA, Senior Portfolio Manager, is responsible for the co-management of the funds. Prior to joining Schwab in 2012, Ms. Tang was a product manager at Thomson Reuters and from 1997 to 2009 worked as a portfolio manager at Barclays Global Investors (now known as BlackRock). |
 | Patrick Kwok, CFA, Portfolio Manager, is responsible for the co-management of the funds. Previously, Mr. Kwok served as an associate portfolio manager from 2012 to 2016. Prior to that, he worked as a fund administration manager, where he was responsible for oversight of sub-advisers, trading, cash management, and fund administration supporting the Charles Schwab Trust Bank Collective Investment Trusts and multi-asset Schwab Funds. Prior to joining Schwab Asset Management in 2008, Mr. Kwok spent two years as an asset operations specialist at Charles Schwab Trust Company. He also worked for one year at State Street Bank & Trust as a portfolio accountant and pricing specialist. |
| 1 | The total return cited for the index reflects reinvested dividends net of withholding taxes but reflects no deductions for expenses or other taxes. |
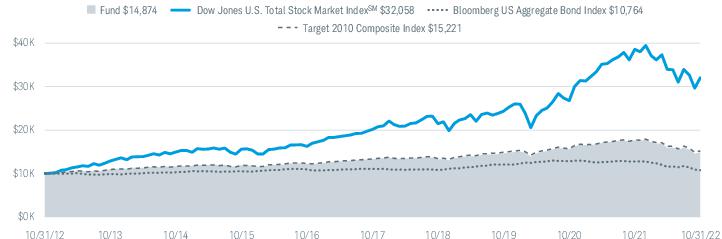
| Fund and Inception Date | 1 Year | 5 Years | 10 Years |
| Fund: Schwab Target 2010 Fund (7/1/05) | -15.69% | 2.25% | 4.05% |
| Dow Jones U.S. Total Stock Market IndexSM | -16.94% | 9.72% | 12.36% |
| Bloomberg US Aggregate Bond Index | -15.68% | -0.54% | 0.74% |
| Target 2010 Composite Index | -14.26% | 2.64% | 4.29% |
| Fund Category: Morningstar Target-Date 2000-20102 | -14.76% | 2.33% | 4.15% |
| Fund Expense Ratios3: Net 0.31%; Gross 0.43% | |||
| 1 | Fund expenses may have been partially absorbed by the investment adviser and its affiliates. Without these reductions, the fund’s returns would have been lower. These returns do not reflect the deduction of taxes that a shareholder would pay on fund distributions or the redemption of fund shares. |
| 2 | Source for category information: Morningstar, Inc. The Morningstar Category return represents all active and index mutual funds and ETFs within the category as of the report date. |
| 3 | As stated in the prospectus. Includes 0.31% of acquired fund fees and expenses (AFFE), which are indirect expenses incurred by the fund through its investments in the underlying funds. Net Expense: Expenses reduced by a contractual fee waiver in effect for so long as Schwab Asset Management serves as the investment adviser to the fund. Gross Expense: Does not reflect the effect of contractual fee waivers. For actual expense ratios during the period, not including AFFE, refer to the financial highlights section of the financial statements. |
| Number of Holdings | 20 |
| Portfolio Turnover Rate | 24% |
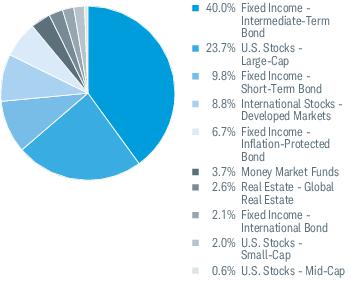
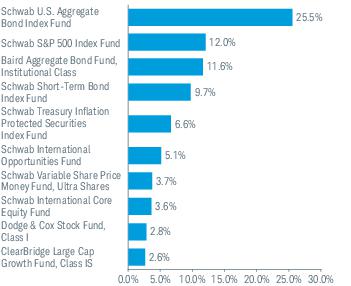
| 1 | The fund intends to invest in a combination of the underlying funds; however, the fund may also invest directly in equity and fixed-income securities, exchange-traded funds, and cash equivalents, including money market securities. |
| 2 | The percentage may differ from the Portfolio Holdings because the above calculation is based on a percentage of total investments, whereas the calculation in the Portfolio Holdings is based on a percentage of net assets. |
| 3 | This list is not a recommendation of any security by the investment adviser. |
| 4 | The holdings listed exclude any temporary liquidity investments. |
| 1 | The total return cited for the index reflects reinvested dividends net of withholding taxes but reflects no deductions for expenses or other taxes. |
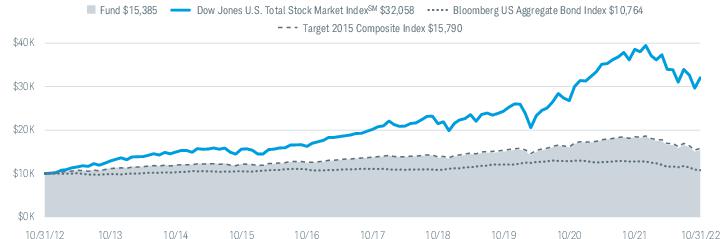
| Fund and Inception Date | 1 Year | 5 Years | 10 Years |
| Fund: Schwab Target 2015 Fund (3/12/08) | -16.15% | 2.34% | 4.40% |
| Dow Jones U.S. Total Stock Market IndexSM | -16.94% | 9.72% | 12.36% |
| Bloomberg US Aggregate Bond Index | -15.68% | -0.54% | 0.74% |
| Target 2015 Composite Index | -14.50% | 2.79% | 4.67% |
| Fund Category: Morningstar Target-Date 20152 | -15.43% | 2.62% | 4.85% |
| Fund Expense Ratios3: Net 0.33%; Gross 0.41% | |||
| 1 | Fund expenses may have been partially absorbed by the investment adviser and its affiliates. Without these reductions, the fund’s returns would have been lower. These returns do not reflect the deduction of taxes that a shareholder would pay on fund distributions or the redemption of fund shares. |
| 2 | Source for category information: Morningstar, Inc. The Morningstar Category return represents all active and index mutual funds and ETFs within the category as of the report date. |
| 3 | As stated in the prospectus. Includes 0.33% of acquired fund fees and expenses (AFFE), which are indirect expenses incurred by the fund through its investments in the underlying funds. Net Expense: Expenses reduced by a contractual fee waiver in effect for so long as Schwab Asset Management serves as the investment adviser to the fund. Gross Expense: Does not reflect the effect of contractual fee waivers. For actual expense ratios during the period, not including AFFE, refer to the financial highlights section of the financial statements. |
| Number of Holdings | 20 |
| Portfolio Turnover Rate | 19% |

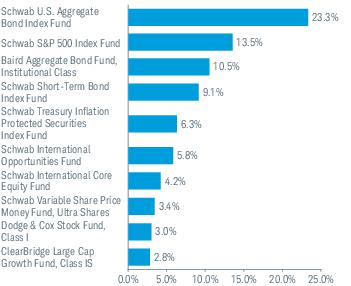
| 1 | The fund intends to invest in a combination of the underlying funds; however, the fund may also invest directly in equity and fixed-income securities, exchange-traded funds, and cash equivalents, including money market securities. |
| 2 | The percentage may differ from the Portfolio Holdings because the above calculation is based on a percentage of total investments, whereas the calculation in the Portfolio Holdings is based on a percentage of net assets. |
| 3 | This list is not a recommendation of any security by the investment adviser. |
| 4 | The holdings listed exclude any temporary liquidity investments. |
| 1 | The total return cited for the index reflects reinvested dividends net of withholding taxes but reflects no deductions for expenses or other taxes. |
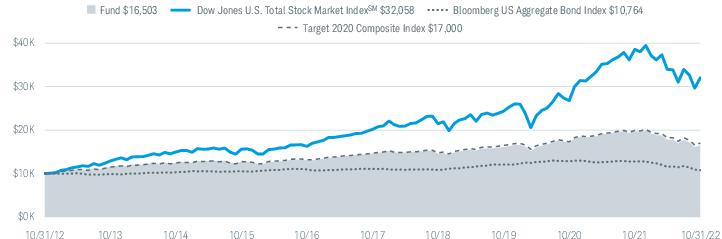
| Fund and Inception Date | 1 Year | 5 Years | 10 Years |
| Fund: Schwab Target 2020 Fund (7/1/05) | -16.35% | 2.48% | 5.14% |
| Dow Jones U.S. Total Stock Market IndexSM | -16.94% | 9.72% | 12.36% |
| Bloomberg US Aggregate Bond Index | -15.68% | -0.54% | 0.74% |
| Target 2020 Composite Index | -14.67% | 3.00% | 5.45% |
| Fund Category: Morningstar Target-Date 20202 | -16.13% | 2.79% | 5.30% |
| Fund Expense Ratios3: Net 0.34%; Gross 0.36% | |||
| 1 | Fund expenses may have been partially absorbed by the investment adviser and its affiliates. Without these reductions, the fund’s returns would have been lower. These returns do not reflect the deduction of taxes that a shareholder would pay on fund distributions or the redemption of fund shares. |
| 2 | Source for category information: Morningstar, Inc. The Morningstar Category return represents all active and index mutual funds and ETFs within the category as of the report date. |
| 3 | As stated in the prospectus. Includes 0.34% of acquired fund fees and expenses (AFFE), which are indirect expenses incurred by the fund through its investments in the underlying funds. Net Expense: Expenses reduced by a contractual fee waiver in effect for so long as Schwab Asset Management serves as the investment adviser to the fund. Gross Expense: Does not reflect the effect of contractual fee waivers. For actual expense ratios during the period, not including AFFE, refer to the financial highlights section of the financial statements. |
| Number of Holdings | 20 |
| Portfolio Turnover Rate | 17% |
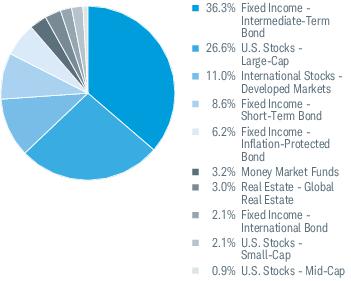
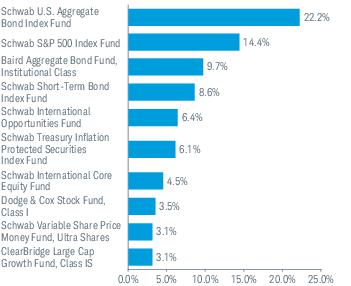
| 1 | The fund intends to invest in a combination of the underlying funds; however, the fund may also invest directly in equity and fixed-income securities, exchange-traded funds, and cash equivalents, including money market securities. |
| 2 | The percentage may differ from the Portfolio Holdings because the above calculation is based on a percentage of total investments, whereas the calculation in the Portfolio Holdings is based on a percentage of net assets. |
| 3 | This list is not a recommendation of any security by the investment adviser. |
| 4 | The holdings listed exclude any temporary liquidity investments. |
| 1 | The total return cited for the index reflects reinvested dividends net of withholding taxes but reflects no deductions for expenses or other taxes. |
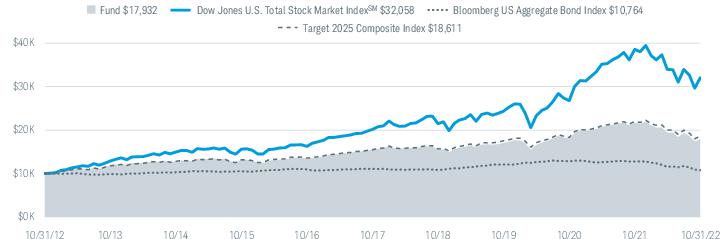
| Fund and Inception Date | 1 Year | 5 Years | 10 Years |
| Fund: Schwab Target 2025 Fund (3/12/08) | -17.39% | 3.01% | 6.01% |
| Dow Jones U.S. Total Stock Market IndexSM | -16.94% | 9.72% | 12.36% |
| Bloomberg US Aggregate Bond Index | -15.68% | -0.54% | 0.74% |
| Target 2025 Composite Index | -15.34% | 3.73% | 6.41% |
| Fund Category: Morningstar Target-Date 20252 | -16.85% | 3.08% | 5.69% |
| Fund Expense Ratios3: Net 0.43%; Gross 0.45% | |||
| 1 | Fund expenses may have been partially absorbed by the investment adviser and its affiliates. Without these reductions, the fund’s returns would have been lower. These returns do not reflect the deduction of taxes that a shareholder would pay on fund distributions or the redemption of fund shares. |
| 2 | Source for category information: Morningstar, Inc. The Morningstar Category return represents all active and index mutual funds and ETFs within the category as of the report date. |
| 3 | As stated in the prospectus. Includes 0.43% of acquired fund fees and expenses (AFFE), which are indirect expenses incurred by the fund through its investments in the underlying funds. Net Expense: Expenses reduced by a contractual fee waiver in effect for so long as Schwab Asset Management serves as the investment adviser to the fund. Gross Expense: Does not reflect the effect of contractual fee waivers. For actual expense ratios during the period, not including AFFE, refer to the financial highlights section of the financial statements. |
| Number of Holdings | 21 |
| Portfolio Turnover Rate | 19% |
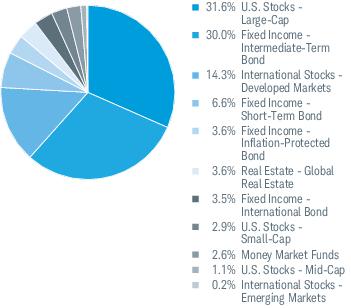
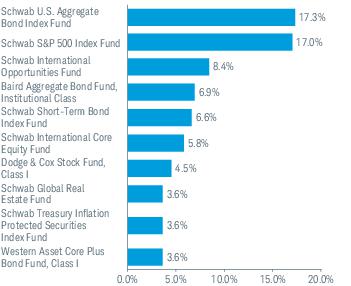
| 1 | The fund intends to invest in a combination of the underlying funds; however, the fund may also invest directly in equity and fixed-income securities, exchange-traded funds, and cash equivalents, including money market securities. |
| 2 | The percentage may differ from the Portfolio Holdings because the above calculation is based on a percentage of total investments, whereas the calculation in the Portfolio Holdings is based on a percentage of net assets. |
| 3 | This list is not a recommendation of any security by the investment adviser. |
| 4 | The holdings listed exclude any temporary liquidity investments. |
| 1 | The total return cited for the index reflects reinvested dividends net of withholding taxes but reflects no deductions for expenses or other taxes. |
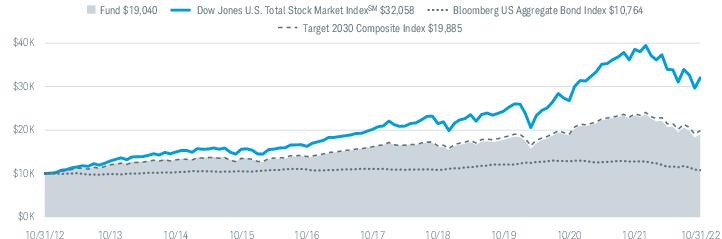
| Fund and Inception Date | 1 Year | 5 Years | 10 Years |
| Fund: Schwab Target 2030 Fund (7/1/05) | -18.51% | 3.38% | 6.65% |
| Dow Jones U.S. Total Stock Market IndexSM | -16.94% | 9.72% | 12.36% |
| Bloomberg US Aggregate Bond Index | -15.68% | -0.54% | 0.74% |
| Target 2030 Composite Index | -16.15% | 4.23% | 7.12% |
| Fund Category: Morningstar Target-Date 20302 | -17.69% | 3.67% | 6.38% |
| Fund Expense Ratios3: Net 0.50%; Gross 0.51% | |||
| 1 | Fund expenses may have been partially absorbed by the investment adviser and its affiliates. Without these reductions, the fund’s returns would have been lower. These returns do not reflect the deduction of taxes that a shareholder would pay on fund distributions or the redemption of fund shares. |
| 2 | Source for category information: Morningstar, Inc. The Morningstar Category return represents all active and index mutual funds and ETFs within the category as of the report date. |
| 3 | As stated in the prospectus. Includes 0.50% of acquired fund fees and expenses (AFFE), which are indirect expenses incurred by the fund through its investments in the underlying funds. Net Expense: Expenses reduced by a contractual fee waiver in effect for so long as Schwab Asset Management serves as the investment adviser to the fund. Gross Expense: Does not reflect the effect of contractual fee waivers. For actual expense ratios during the period, not including AFFE, refer to the financial highlights section of the financial statements. |
| Number of Holdings | 21 |
| Portfolio Turnover Rate | 16% |

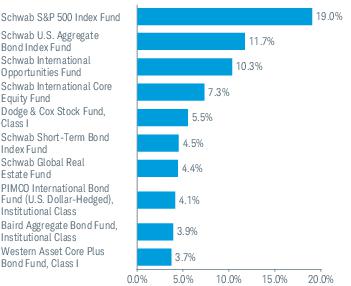
| 1 | The fund intends to invest in a combination of the underlying funds; however, the fund may also invest directly in equity and fixed-income securities, exchange-traded funds, and cash equivalents, including money market securities. |
| 2 | The percentage may differ from the Portfolio Holdings because the above calculation is based on a percentage of total investments, whereas the calculation in the Portfolio Holdings is based on a percentage of net assets. |
| 3 | This list is not a recommendation of any security by the investment adviser. |
| 4 | The holdings listed exclude any temporary liquidity investments. |
| 1 | The total return cited for the index reflects reinvested dividends net of withholding taxes but reflects no deductions for expenses or other taxes. |
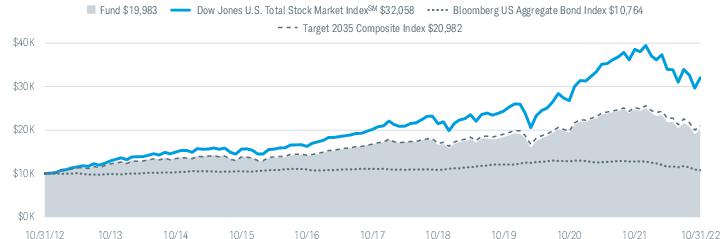
| Fund and Inception Date | 1 Year | 5 Years | 10 Years |
| Fund: Schwab Target 2035 Fund (3/12/08) | -19.41% | 3.61% | 7.17% |
| Dow Jones U.S. Total Stock Market IndexSM | -16.94% | 9.72% | 12.36% |
| Bloomberg US Aggregate Bond Index | -15.68% | -0.54% | 0.74% |
| Target 2035 Composite Index | -16.84% | 4.59% | 7.69% |
| Fund Category: Morningstar Target-Date 20352 | -18.49% | 4.18% | 7.03% |
| Fund Expense Ratios3: Net 0.56%; Gross 0.58% | |||
| 1 | Fund expenses may have been partially absorbed by the investment adviser and its affiliates. Without these reductions, the fund’s returns would have been lower. These returns do not reflect the deduction of taxes that a shareholder would pay on fund distributions or the redemption of fund shares. |
| 2 | Source for category information: Morningstar, Inc. The Morningstar Category return represents all active and index mutual funds and ETFs within the category as of the report date. |
| 3 | As stated in the prospectus. Includes 0.56% of acquired fund fees and expenses (AFFE), which are indirect expenses incurred by the fund through its investments in the underlying funds. Net Expense: Expenses reduced by a contractual fee waiver in effect for so long as Schwab Asset Management serves as the investment adviser to the fund. Gross Expense: Does not reflect the effect of contractual fee waivers. For actual expense ratios during the period, not including AFFE, refer to the financial highlights section of the financial statements. |
| Number of Holdings | 20 |
| Portfolio Turnover Rate | 13% |
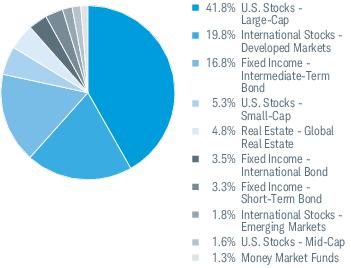
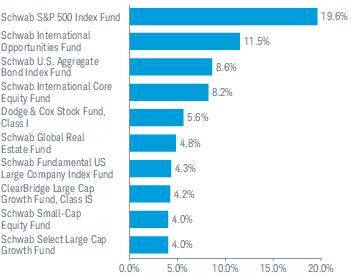
| 1 | The fund intends to invest in a combination of the underlying funds; however, the fund may also invest directly in equity and fixed-income securities, exchange-traded funds, and cash equivalents, including money market securities. |
| 2 | The percentage may differ from the Portfolio Holdings because the above calculation is based on a percentage of total investments, whereas the calculation in the Portfolio Holdings is based on a percentage of net assets. |
| 3 | This list is not a recommendation of any security by the investment adviser. |
| 4 | The holdings listed exclude any temporary liquidity investments. |
| 1 | The total return cited for the index reflects reinvested dividends net of withholding taxes but reflects no deductions for expenses or other taxes. |
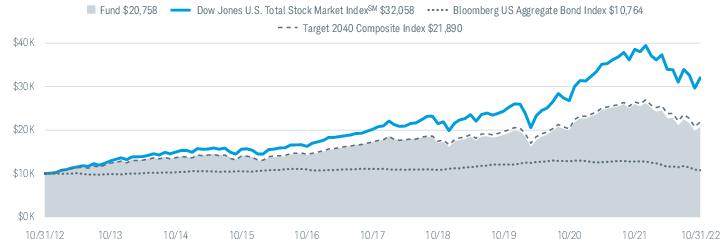
| Fund and Inception Date | 1 Year | 5 Years | 10 Years |
| Fund: Schwab Target 2040 Fund (7/1/05) | -20.10% | 3.79% | 7.58% |
| Dow Jones U.S. Total Stock Market IndexSM | -16.94% | 9.72% | 12.36% |
| Bloomberg US Aggregate Bond Index | -15.68% | -0.54% | 0.74% |
| Target 2040 Composite Index | -17.44% | 4.87% | 8.15% |
| Fund Category: Morningstar Target-Date 20402 | -18.96% | 4.57% | 7.48% |
| Fund Expense Ratios3: Net 0.60%; Gross 0.61% | |||
| 1 | Fund expenses may have been partially absorbed by the investment adviser and its affiliates. Without these reductions, the fund’s returns would have been lower. These returns do not reflect the deduction of taxes that a shareholder would pay on fund distributions or the redemption of fund shares. |
| 2 | Source for category information: Morningstar, Inc. The Morningstar Category return represents all active and index mutual funds and ETFs within the category as of the report date. |
| 3 | As stated in the prospectus. Includes 0.60% of acquired fund fees and expenses (AFFE), which are indirect expenses incurred by the fund through its investments in the underlying funds. Net Expense: Expenses reduced by a contractual fee waiver in effect for so long as Schwab Asset Management serves as the investment adviser to the fund. Gross Expense: Does not reflect the effect of contractual fee waivers. For actual expense ratios during the period, not including AFFE, refer to the financial highlights section of the financial statements. |
| Number of Holdings | 20 |
| Portfolio Turnover Rate | 10% |
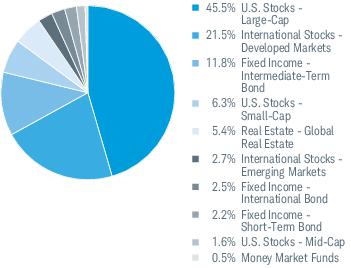
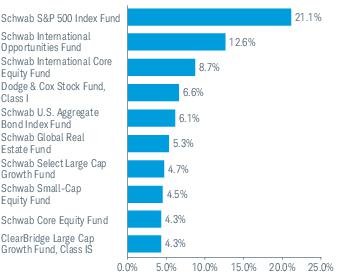
| 1 | The fund intends to invest in a combination of the underlying funds; however, the fund may also invest directly in equity and fixed-income securities, exchange-traded funds, and cash equivalents, including money market securities. |
| 2 | The percentage may differ from the Portfolio Holdings because the above calculation is based on a percentage of total investments, whereas the calculation in the Portfolio Holdings is based on a percentage of net assets. |
| 3 | This list is not a recommendation of any security by the investment adviser. |
| 4 | The holdings listed exclude any temporary liquidity investments. |
| 1 | The total return cited for the index reflects reinvested dividends net of withholding taxes but reflects no deductions for expenses or other taxes. |
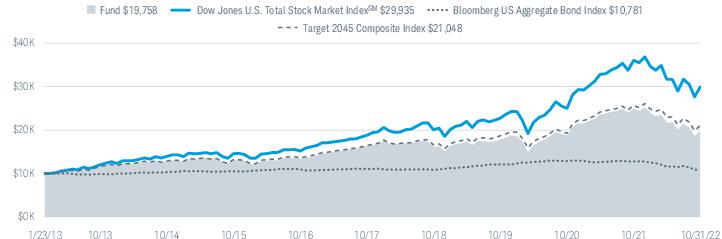
| Fund and Inception Date | 1 Year | 5 Years | Since Inception |
| Fund: Schwab Target 2045 Fund (1/23/13) | -20.76% | 3.92% | 7.22% |
| Dow Jones U.S. Total Stock Market IndexSM | -16.94% | 9.72% | 11.87% |
| Bloomberg US Aggregate Bond Index | -15.68% | -0.54% | 0.77% |
| Target 2045 Composite Index | -17.98% | 5.10% | 7.91% |
| Fund Category: Morningstar Target-Date 20452 | -19.30% | 4.85% | N/A |
| Fund Expense Ratios3: Net 0.64%; Gross 0.68% | |||
| 1 | Fund expenses may have been partially absorbed by the investment adviser and its affiliates. Without these reductions, the fund’s returns would have been lower. These returns do not reflect the deduction of taxes that a shareholder would pay on fund distributions or the redemption of fund shares. |
| 2 | Source for category information: Morningstar, Inc. The Morningstar Category return represents all active and index mutual funds and ETFs within the category as of the report date. |
| 3 | As stated in the prospectus. Includes 0.64% of acquired fund fees and expenses (AFFE), which are indirect expenses incurred by the fund through its investments in the underlying funds. Net Expense: Expenses reduced by a contractual fee waiver in effect for so long as Schwab Asset Management serves as the investment adviser to the fund. Gross Expense: Does not reflect the effect of contractual fee waivers. For actual expense ratios during the period, not including AFFE, refer to the financial highlights section of the financial statements. |
| Number of Holdings | 20 |
| Portfolio Turnover Rate | 7% |
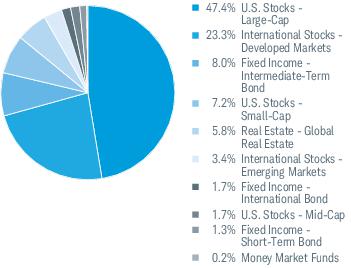
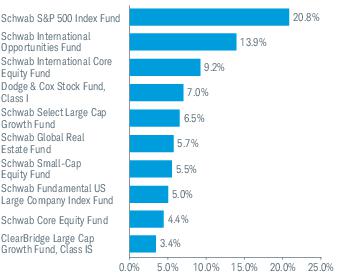
| 1 | The fund intends to invest in a combination of the underlying funds; however, the fund may also invest directly in equity and fixed-income securities, exchange-traded funds, and cash equivalents, including money market securities. |
| 2 | The percentage may differ from the Portfolio Holdings because the above calculation is based on a percentage of total investments, whereas the calculation in the Portfolio Holdings is based on a percentage of net assets. |
| 3 | This list is not a recommendation of any security by the investment adviser. |
| 4 | The holdings listed exclude any temporary liquidity investments. |
| 1 | Percentages may not add up to 100% due to rounding. |
| 2 | The total return cited for the index reflects reinvested dividends net of withholding taxes but reflects no deductions for expenses or other taxes. |
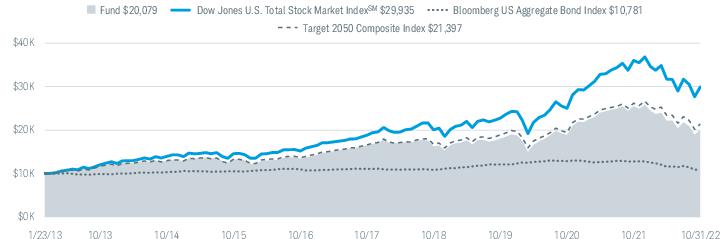
| Fund and Inception Date | 1 Year | 5 Years | Since Inception |
| Fund: Schwab Target 2050 Fund (1/23/13) | -21.22% | 4.02% | 7.39% |
| Dow Jones U.S. Total Stock Market IndexSM | -16.94% | 9.72% | 11.87% |
| Bloomberg US Aggregate Bond Index | -15.68% | -0.54% | 0.77% |
| Target 2050 Composite Index | -18.32% | 5.22% | 8.10% |
| Fund Category: Morningstar Target-Date 20502 | -19.52% | 4.91% | N/A |
| Fund Expense Ratios3: Net 0.67%; Gross 0.71% | |||
| 1 | Fund expenses may have been partially absorbed by the investment adviser and its affiliates. Without these reductions, the fund’s returns would have been lower. These returns do not reflect the deduction of taxes that a shareholder would pay on fund distributions or the redemption of fund shares. |
| 2 | Source for category information: Morningstar, Inc. The Morningstar Category return represents all active and index mutual funds and ETFs within the category as of the report date. |
| 3 | As stated in the prospectus. Includes 0.67% of acquired fund fees and expenses (AFFE), which are indirect expenses incurred by the fund through its investments in the underlying funds. Net Expense: Expenses reduced by a contractual fee waiver in effect for so long as Schwab Asset Management serves as the investment adviser to the fund. Gross Expense: Does not reflect the effect of contractual fee waivers. For actual expense ratios during the period, not including AFFE, refer to the financial highlights section of the financial statements. |
| Number of Holdings | 19 |
| Portfolio Turnover Rate | 6% |

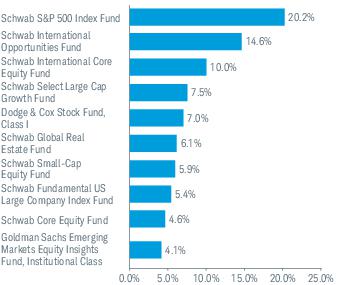
| 1 | The fund intends to invest in a combination of the underlying funds; however, the fund may also invest directly in equity and fixed-income securities, exchange-traded funds, and cash equivalents, including money market securities. |
| 2 | The percentage may differ from the Portfolio Holdings because the above calculation is based on a percentage of total investments, whereas the calculation in the Portfolio Holdings is based on a percentage of net assets. |
| 3 | Less than 0.05%. |
| 4 | This list is not a recommendation of any security by the investment adviser. |
| 5 | The holdings listed exclude any temporary liquidity investments. |
| 1 | The total return cited for the index reflects reinvested dividends net of withholding taxes but reflects no deductions for expenses or other taxes. |
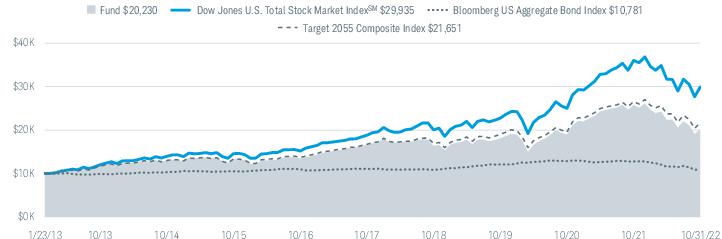
| Fund and Inception Date | 1 Year | 5 Years | Since Inception |
| Fund: Schwab Target 2055 Fund (1/23/13) | -21.54% | 4.03% | 7.48% |
| Dow Jones U.S. Total Stock Market IndexSM | -16.94% | 9.72% | 11.87% |
| Bloomberg US Aggregate Bond Index | -15.68% | -0.54% | 0.77% |
| Target 2055 Composite Index | -18.53% | 5.30% | 8.23% |
| Fund Category: Morningstar Target-Date 20552 | -19.63% | 4.95% | N/A |
| Fund Expense Ratios3: Net 0.68%; Gross 0.74% | |||
| 1 | Fund expenses may have been partially absorbed by the investment adviser and its affiliates. Without these reductions, the fund’s returns would have been lower. These returns do not reflect the deduction of taxes that a shareholder would pay on fund distributions or the redemption of fund shares. |
| 2 | Source for category information: Morningstar, Inc. The Morningstar Category return represents all active and index mutual funds and ETFs within the category as of the report date. |
| 3 | As stated in the prospectus. Includes 0.68% of acquired fund fees and expenses (AFFE), which are indirect expenses incurred by the fund through its investments in the underlying funds. Net Expense: Expenses reduced by a contractual fee waiver in effect for so long as Schwab Asset Management serves as the investment adviser to the fund. Gross Expense: Does not reflect the effect of contractual fee waivers. For actual expense ratios during the period, not including AFFE, refer to the financial highlights section of the financial statements. |
| Number of Holdings | 18 |
| Portfolio Turnover Rate | 4% |
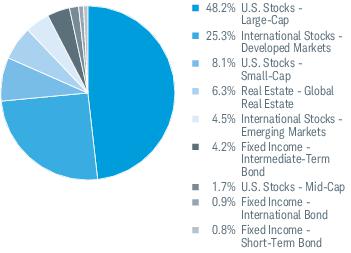
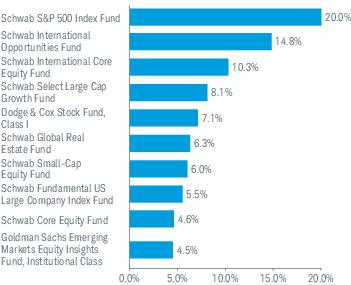
| 1 | The fund intends to invest in a combination of the underlying funds; however, the fund may also invest directly in equity and fixed-income securities, exchange-traded funds, and cash equivalents, including money market securities. |
| 2 | The percentage may differ from the Portfolio Holdings because the above calculation is based on a percentage of total investments, whereas the calculation in the Portfolio Holdings is based on a percentage of net assets. |
| 3 | This list is not a recommendation of any security by the investment adviser. |
| 4 | The holdings listed exclude any temporary liquidity investments. |
| 1 | The total return cited for the index reflects reinvested dividends net of withholding taxes but reflects no deductions for expenses or other taxes. |
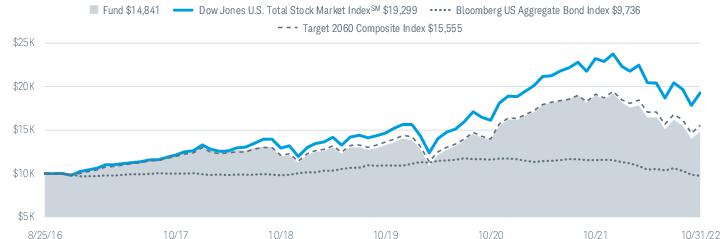
| Fund and Inception Date | 1 Year | 5 Years | Since Inception |
| Fund: Schwab Target 2060 Fund (8/25/16) | -21.88% | 4.08% | 6.59% |
| Dow Jones U.S. Total Stock Market IndexSM | -16.94% | 9.72% | 11.23% |
| Bloomberg US Aggregate Bond Index | -15.68% | -0.54% | -0.42% |
| Target 2060 Composite Index | -18.71% | 5.38% | 7.41% |
| Fund Category: Morningstar Target-Date 20602 | -19.63% | 5.00% | N/A |
| Fund Expense Ratios3: Net 0.69%; Gross 0.91% | |||
| 1 | Fund expenses may have been partially absorbed by the investment adviser and its affiliates. Without these reductions, the fund’s returns would have been lower. These returns do not reflect the deduction of taxes that a shareholder would pay on fund distributions or the redemption of fund shares. |
| 2 | Source for category information: Morningstar, Inc. The Morningstar Category return represents all active and index mutual funds and ETFs within the category as of the report date. |
| 3 | As stated in the prospectus. Includes 0.69% of acquired fund fees and expenses (AFFE), which are indirect expenses incurred by the fund through its investments in the underlying funds. Net Expense: Expenses reduced by a contractual fee waiver in effect for so long as Schwab Asset Management serves as the investment adviser to the fund. Gross Expense: Does not reflect the effect of contractual fee waivers. For actual expense ratios during the period, not including AFFE, refer to the financial highlights section of the financial statements. |
| Number of Holdings | 17 |
| Portfolio Turnover Rate | 15% |
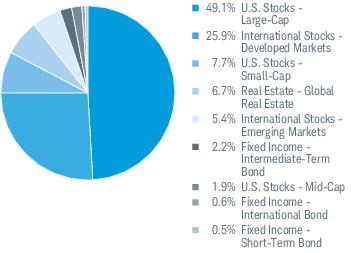
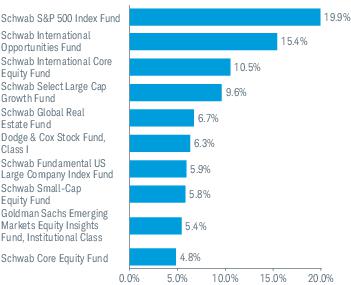
| 1 | The fund intends to invest in a combination of the underlying funds; however, the fund may also invest directly in equity and fixed-income securities, exchange-traded funds, and cash equivalents, including money market securities. |
| 2 | The percentage may differ from the Portfolio Holdings because the above calculation is based on a percentage of total investments, whereas the calculation in the Portfolio Holdings is based on a percentage of net assets. |
| 3 | This list is not a recommendation of any security by the investment adviser. |
| 4 | The holdings listed exclude any temporary liquidity investments. |
| 1 | The total return cited for the index reflects reinvested dividends net of withholding taxes but reflects no deductions for expenses or other taxes. |
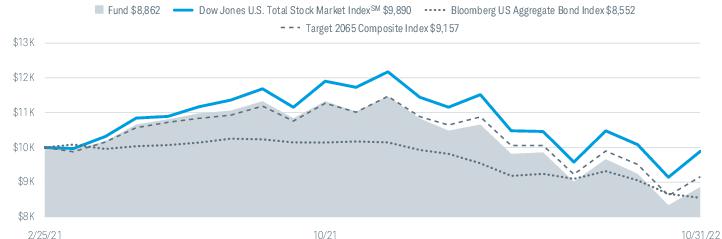
| Fund and Inception Date | 1 Year | Since Inception |
| Fund: Schwab Target 2065 Fund (2/25/21) | -21.78% | -6.94% |
| Dow Jones U.S. Total Stock Market IndexSM | -16.94% | -0.66% |
| Bloomberg US Aggregate Bond Index | -15.68% | -8.90% |
| Target 2065 Composite Index | -18.76% | -5.11% |
| Fund Category: Morningstar Target-Date 2065+2 | -19.88% | N/A |
| Fund Expense Ratios3: Net 0.68%; Gross 2.58% | ||
| 1 | Fund expenses may have been partially absorbed by the investment adviser and its affiliates. Without these reductions, the fund’s returns would have been lower. These returns do not reflect the deduction of taxes that a shareholder would pay on fund distributions or the redemption of fund shares. |
| 2 | Source for category information: Morningstar, Inc. The Morningstar Category return represents all active and index mutual funds and ETFs within the category as of the report date. |
| 3 | As stated in the prospectus. Includes 0.68% of acquired fund fees and expenses (AFFE), which are indirect expenses incurred by the fund through its investments in the underlying funds. Net Expense: Expenses reduced by a contractual fee waiver in effect for so long as Schwab Asset Management serves as the investment adviser to the fund. Gross Expense: Does not reflect the effect of contractual fee waivers. For actual expense ratios during the period, not including AFFE, refer to the financial highlights section of the financial statements. |
| Number of Holdings | 17 |
| Portfolio Turnover Rate | 26% |
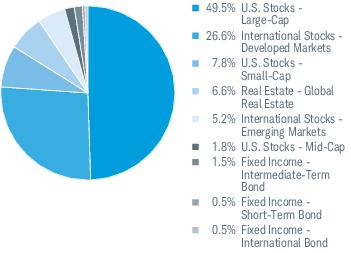
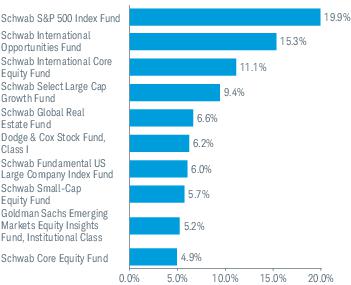
| 1 | The fund intends to invest in a combination of the underlying funds; however, the fund may also invest directly in equity and fixed-income securities, exchange-traded funds, and cash equivalents, including money market securities. |
| 2 | The percentage may differ from the Portfolio Holdings because the above calculation is based on a percentage of total investments, whereas the calculation in the Portfolio Holdings is based on a percentage of net assets. |
| 3 | This list is not a recommendation of any security by the investment adviser. |
| 4 | The holdings listed exclude any temporary liquidity investments. |
| EXPENSE RATIO (ANNUALIZED)1,2 | EFFECTIVE EXPENSE RATIO (ANNUALIZED)3,4 | BEGINNING ACCOUNT VALUE AT 5/1/22 | ENDING ACCOUNT VALUE (NET OF EXPENSES) AT 10/31/222 | EXPENSES PAID DURING PERIOD 5/1/22-10/31/222,5 | EFFECTIVE EXPENSES PAID DURING PERIOD 5/1/22-10/31/224,5 | |
| Schwab Target 2010 Fund | ||||||
| Actual Return | 0.00% | 0.26% | $1,000.00 | $ 931.50 | $0.00 | $1.27 |
| Hypothetical 5% Return | 0.00% | 0.26% | $1,000.00 | $1,025.21 | $0.00 | $1.33 |
| Schwab Target 2015 Fund | ||||||
| Actual Return | 0.00% | 0.28% | $1,000.00 | $ 930.70 | $0.00 | $1.36 |
| Hypothetical 5% Return | 0.00% | 0.28% | $1,000.00 | $1,025.21 | $0.00 | $1.43 |
| Schwab Target 2020 Fund | ||||||
| Actual Return | 0.00% | 0.30% | $1,000.00 | $ 929.60 | $0.00 | $1.46 |
| Hypothetical 5% Return | 0.00% | 0.30% | $1,000.00 | $1,025.21 | $0.00 | $1.53 |
| Schwab Target 2025 Fund | ||||||
| Actual Return | 0.00% | 0.36% | $1,000.00 | $ 925.60 | $0.00 | $1.75 |
| Hypothetical 5% Return | 0.00% | 0.36% | $1,000.00 | $1,025.21 | $0.00 | $1.84 |
| Schwab Target 2030 Fund | ||||||
| Actual Return | 0.00% | 0.43% | $1,000.00 | $ 920.70 | $0.00 | $2.08 |
| Hypothetical 5% Return | 0.00% | 0.43% | $1,000.00 | $1,025.21 | $0.00 | $2.19 |
| Schwab Target 2035 Fund | ||||||
| Actual Return | 0.00% | 0.48% | $1,000.00 | $ 917.20 | $0.00 | $2.32 |
| Hypothetical 5% Return | 0.00% | 0.48% | $1,000.00 | $1,025.21 | $0.00 | $2.45 |
| Schwab Target 2040 Fund | ||||||
| Actual Return | 0.00% | 0.51% | $1,000.00 | $ 914.10 | $0.00 | $2.46 |
| Hypothetical 5% Return | 0.00% | 0.51% | $1,000.00 | $1,025.21 | $0.00 | $2.60 |
| Schwab Target 2045 Fund | ||||||
| Actual Return | 0.00% | 0.55% | $1,000.00 | $ 909.90 | $0.00 | $2.65 |
| Hypothetical 5% Return | 0.00% | 0.55% | $1,000.00 | $1,025.21 | $0.00 | $2.80 |
| Schwab Target 2050 Fund | ||||||
| Actual Return | 0.00% | 0.57% | $1,000.00 | $ 906.90 | $0.00 | $2.74 |
| Hypothetical 5% Return | 0.00% | 0.57% | $1,000.00 | $1,025.21 | $0.00 | $2.91 |
| Schwab Target 2055 Fund | ||||||
| Actual Return | 0.00% | 0.59% | $1,000.00 | $ 905.40 | $0.00 | $2.83 |
| Hypothetical 5% Return | 0.00% | 0.59% | $1,000.00 | $1,025.21 | $0.00 | $3.01 |
| EXPENSE RATIO (ANNUALIZED)1,2 | EFFECTIVE EXPENSE RATIO (ANNUALIZED)3,4 | BEGINNING ACCOUNT VALUE AT 5/1/22 | ENDING ACCOUNT VALUE (NET OF EXPENSES) AT 10/31/222 | EXPENSES PAID DURING PERIOD 5/1/22-10/31/222,5 | EFFECTIVE EXPENSES PAID DURING PERIOD 5/1/22-10/31/224,5 | |
| Schwab Target 2060 Fund | ||||||
| Actual Return | 0.00% | 0.60% | $1,000.00 | $ 904.10 | $0.00 | $2.88 |
| Hypothetical 5% Return | 0.00% | 0.60% | $1,000.00 | $1,025.21 | $0.00 | $3.06 |
| Schwab Target 2065 Fund | ||||||
| Actual Return | 0.00% | 0.61% | $1,000.00 | $ 902.70 | $0.00 | $2.93 |
| Hypothetical 5% Return | 0.00% | 0.61% | $1,000.00 | $1,025.21 | $0.00 | $3.11 |
| 1 | Based on the most recent six-month expense ratio. |
| 2 | Excludes acquired fund fees and expenses, which are indirect expenses incurred by the fund through its investments in underlying funds. |
| 3 | Based on the most recent six-month acquired fund fees and expenses and the expense ratio; may differ from the acquired fund fees and expenses and the expense ratio in the prospectus. |
| 4 | Includes acquired fund fees and expenses, which are indirect expenses incurred by the fund through its investments in underlying funds. |
| 5 | Expenses for each fund are equal to its annualized expense ratio, multiplied by the average account value over the period, multiplied by the 184 days of the period, and divided by the 365 days of the fiscal year. |
| 11/1/21– 10/31/22 | 11/1/20– 10/31/21 | 11/1/19– 10/31/20 | 11/1/18– 10/31/19 | 11/1/17– 10/31/18 | ||
| Per-Share Data | ||||||
| Net asset value at beginning of period | $15.21 | $13.76 | $13.57 | $13.06 | $13.42 | |
| Income (loss) from investment operations: | ||||||
| Net investment income (loss)1 | 0.28 | 0.22 | 0.27 | 0.30 | 0.29 | |
| Net realized and unrealized gains (losses) | (2.55) | 1.61 | 0.57 | 0.97 | (0.35) | |
| Total from investment operations | (2.27) | 1.83 | 0.84 | 1.27 | (0.06) | |
| Less distributions: | ||||||
| Distributions from net investment income | (0.30) | (0.27) | (0.34) | (0.34) | (0.30) | |
| Distributions from net realized gains | (0.41) | (0.11) | (0.31) | (0.42) | — | |
| Total distributions | (0.71) | (0.38) | (0.65) | (0.76) | (0.30) | |
| Net asset value at end of period | $12.23 | $15.21 | $13.76 | $13.57 | $13.06 | |
| Total return | (15.69%) | 13.46% | 6.38% | 10.42% | (0.52%) | |
| Ratios/Supplemental Data | ||||||
| Ratios to average net assets: | ||||||
| Net operating expenses2 | 0.00% 3 | 0.00% | 0.00% | 0.00% | 0.00% 4 | |
| Gross operating expenses2 | 0.14% 3 | 0.12% | 0.14% | 0.17% | 0.12% | |
| Net investment income (loss) | 2.04% | 1.50% | 2.03% | 2.33% | 2.15% | |
| Portfolio turnover rate | 24% | 21% | 27% | 13% | 16% | |
| Net assets, end of period (x 1,000) | $46,359 | $65,477 | $55,507 | $51,106 | $51,996 | |
| 1 | Calculated based on the average shares outstanding during the period. |
| 2 | Ratio excludes acquired fund fees and expenses, which are indirect expenses incurred by the fund through its investments in underlying funds. |
| 3 | Ratio includes less than 0.005% of non-routine proxy expenses. |
| 4 | Less than 0.005%; the ratio of net operating expenses would have been 0.00%, if certain non-routine expenses had not been incurred. |
| SECURITY | VALUE AT 10/31/21 | PURCHASES | SALES | REALIZED GAINS (LOSSES) | NET CHANGE IN UNREALIZED APPRECIATION (DEPRECIATION) | VALUE AT 10/31/22 | BALANCE OF SHARES HELD AT 10/31/22 | DISTRIBUTIONS RECEIVED(a) |
| AFFILIATED UNDERLYING FUNDS 77.0% OF NET ASSETS | ||||||||
| U.S. Stocks 20.3% | ||||||||
| Large-Cap 18.1% | ||||||||
| Schwab Core Equity Fund | $1,568,956 | $— | ($295,388) | $95,241 | ($542,645) | $826,164 | 42,454 | $325,091 |
| Schwab Fundamental US Large Company Index Fund | 137,540 | 1,083,654 | (167,709) | (7,474) | (67,359) | 978,652 | 46,185 | 23,067 |
| Schwab S&P 500 Index Fund | 8,383,553 | 605,099 | (2,375,887) | 505,149 | (1,549,821) | 5,568,093 | 92,771 | 108,464 |
| Schwab Select Large Cap Growth Fund (formerly Laudus U.S. Large Cap Growth Fund) * | — | 1,421,398 | (50,924) | (1,395) | (353,542) | 1,015,537 | 51,524 | — |
| 8,388,446 | ||||||||
| Mid-Cap 0.7% | ||||||||
| Schwab U.S. Mid-Cap Index Fund | 464,029 | 13,281 | (84,083) | 18,025 | (100,307) | 310,945 | 5,998 | 13,281 |
| Small-Cap 1.5% | ||||||||
| Schwab Small-Cap Equity Fund | 781,673 | 179,736 | (70,000) | (20,388) | (165,593) | 705,428 | 37,245 | 94,736 |
| 9,404,819 | ||||||||
| International Stocks 8.7% | ||||||||
| Developed Markets 8.7% | ||||||||
| Schwab International Core Equity Fund | 1,983,253 | 717,937 | (513,307) | (41,170) | (468,165) | 1,678,548 | 192,715 | 64,381 |
| Schwab International Opportunities Fund (formerly Laudus International MarketMasters Fund) | 3,840,054 | 819,150 | (444,296) | (144,554) | (1,722,210) | 2,348,144 | 139,026 | 549,467 |
| 4,026,692 | ||||||||
| Real Estate 2.5% | ||||||||
| Global Real Estate 2.5% | ||||||||
| Schwab Global Real Estate Fund | 1,350,166 | 379,071 | (147,718) | (12,971) | (387,865) | 1,180,683 | 200,116 | 40,937 |
| Fixed Income 41.8% | ||||||||
| Inflation-Protected Bond 6.6% | ||||||||
| Schwab Treasury Inflation Protected Securities Index Fund | 4,365,856 | 336,678 | (970,430) | (49,449) | (620,100) | 3,062,555 | 293,629 | 236,678 |
| Intermediate-Term Bond 25.5% | ||||||||
| Schwab U.S. Aggregate Bond Index Fund | 16,943,429 | 1,784,694 | (4,260,569) | (446,917) | (2,212,779) | 11,807,858 | 1,373,007 | 319,585 |
| Short-Term Bond 9.7% | ||||||||
| Schwab Short-Term Bond Index Fund | 6,499,915 | 284,521 | (1,780,441) | (98,027) | (387,752) | 4,518,216 | 484,787 | 84,492 |
| 19,388,629 | ||||||||
| SECURITY | VALUE AT 10/31/21 | PURCHASES | SALES | REALIZED GAINS (LOSSES) | NET CHANGE IN UNREALIZED APPRECIATION (DEPRECIATION) | VALUE AT 10/31/22 | BALANCE OF SHARES HELD AT 10/31/22 | DISTRIBUTIONS RECEIVED(a) |
| Money Market Funds 3.7% | ||||||||
| Schwab Variable Share Price Money Fund, Ultra Shares, 3.10% (b) | $2,041,093 | $17,258 | ($350,049) | ($70) | ($474) | $1,707,758 | 1,707,758 | $19,343 |
| Total Affiliated Underlying Funds (Cost $34,514,238) | $48,359,517 | $7,642,477 | ($11,510,801) | ($204,000) | ($8,578,612) | $35,708,581 | $1,879,522 | |
| UNAFFILIATED UNDERLYING FUNDS 22.2% OF NET ASSETS | ||||||||
| U.S. Stocks 5.9% | ||||||||
| Large-Cap 5.4% | ||||||||
| ClearBridge Large Cap Growth Fund, Class IS * | $1,214,671 | 23,812 | ||||||
| Dodge & Cox Stock Fund, Class I | 1,286,121 | 5,828 | ||||||
| 2,500,792 | ||||||||
| Small-Cap 0.5% | ||||||||
| ClearBridge Small Cap Growth Fund, Class IS * | 204,014 | 5,335 | ||||||
| 2,704,806 | ||||||||
| Fixed Income 16.3% | ||||||||
| Intermediate-Term Bond 14.2% | ||||||||
| Baird Aggregate Bond Fund, Institutional Class | 5,392,982 | 578,646 | ||||||
| Loomis Sayles Investment Grade Bond Fund, Class Y | 418,535 | 44,478 | ||||||
| Western Asset Core Plus Bond Fund, Class I | 786,065 | 87,147 | ||||||
| 6,597,582 | ||||||||
| International Bond 2.1% | ||||||||
| PIMCO International Bond Fund (U.S. Dollar-Hedged), Institutional Class | 955,308 | 100,453 | ||||||
| 7,552,890 | ||||||||
| Total Unaffiliated Underlying Funds (Cost $11,077,575) | $10,257,696 | |||||||
| Total Investments in Securities (Cost $45,591,813) | $45,966,277 | |||||||
| * | Non-income producing security. |
| (a) | Distributions received include distributions from net investment income and capital gains, if any, from the underlying funds. Amounts shown are only presented for affiliated underlying funds, which are presented in the corresponding line-item in the Statement of Operations, if applicable (See financial note 2(d) for additional information). |
| (b) | The rate shown is the annualized 7-day yield. |
| Assets | ||
| Investments in securities, at value - affiliated (cost $34,514,238) | $35,708,581 | |
| Investments in securities, at value - unaffiliated (cost $11,077,575) | 10,257,696 | |
| Cash | 469,156 | |
| Receivables: | ||
| Fund shares sold | 1,104,582 | |
| Investments sold | 430,698 | |
| Dividends | 37,510 | |
| Due from investment adviser | 6,133 | |
| Interest | 332 | |
| Prepaid expenses | + | 9,890 |
| Total assets | 48,024,578 | |
| Liabilities | ||
| Payables: | ||
| Fund shares redeemed | 1,593,870 | |
| Investments bought | 35,409 | |
| Independent trustees’ fees | 33 | |
| Accrued expenses | + | 36,323 |
| Total liabilities | 1,665,635 | |
| Net assets | $46,358,943 | |
| Net Assets by Source | ||
| Capital received from investors | $45,125,322 | |
| Total distributable earnings | + | 1,233,621 |
| Net assets | $46,358,943 | |
| Net Asset Value (NAV) | ||||
| Net Assets | ÷ | Shares Outstanding | = | NAV |
| $46,358,943 | 3,789,888 | $12.23 | ||
| For the period November 1, 2021 through October 31, 2022 | ||
| Investment Income | ||
| Dividends received from securities - affiliated | $902,279 | |
| Dividends received from securities - unaffiliated | 226,917 | |
| Interest received from securities - unaffiliated | + | 1,156 |
| Total investment income | 1,130,352 | |
| Expenses | ||
| Professional fees | 21,609 | |
| Registration fees | 21,363 | |
| Portfolio accounting fees | 12,298 | |
| Independent trustees’ fees | 6,901 | |
| Shareholder reports | 4,244 | |
| Proxy fees1 | 2,586 | |
| Custodian fees | 2,262 | |
| Transfer agent fees | 1,118 | |
| Other expenses | + | 5,103 |
| Total expenses | 77,484 | |
| Expense reduction | – | 74,898 |
| Net expenses | – | 2,586 |
| Net investment income | 1,127,766 | |
| REALIZED AND UNREALIZED GAINS (LOSSES) | ||
| Realized capital gain distributions received from underlying funds - affiliated | 977,243 | |
| Realized capital gain distributions received from underlying funds - unaffiliated | 328,219 | |
| Net realized losses on sales of securities - affiliated | (204,000) | |
| Net realized losses on sales of securities - unaffiliated | + | (316,571) |
| Net realized gains | 784,891 | |
| Net change in unrealized appreciation (depreciation) on securities - affiliated | (8,578,612) | |
| Net change in unrealized appreciation (depreciation) on securities - unaffiliated | + | (2,615,892) |
| Net change in unrealized appreciation (depreciation) | + | (11,194,504) |
| Net realized and unrealized losses | (10,409,613) | |
| Decrease in net assets resulting from operations | ($9,281,847) | |
| 1 | Proxy fees are non-routine expenses (see financial note 4 for additional information). |
| OPERATIONS | |||
| 11/1/21-10/31/22 | 11/1/20-10/31/21 | ||
| Net investment income | $1,127,766 | $898,910 | |
| Net realized gains | 784,891 | 1,965,368 | |
| Net change in unrealized appreciation (depreciation) | + | (11,194,504) | 4,477,633 |
| Increase (decrease) in net assets resulting from operations | ($9,281,847) | $7,341,911 | |
| DISTRIBUTIONS TO SHAREHOLDERS | |||
| Total distributions | ($3,070,834) | ($1,544,083) | |
| TRANSACTIONS IN FUND SHARES | |||||
| 11/1/21-10/31/22 | 11/1/20-10/31/21 | ||||
| SHARES | VALUE | SHARES | VALUE | ||
| Shares sold | 570,204 | $7,624,804 | 1,210,571 | $17,923,236 | |
| Shares reinvested | 188,385 | 2,752,308 | 94,692 | 1,353,144 | |
| Shares redeemed | + | (1,273,388) | (17,142,875) | (1,035,698) | (15,103,593) |
| Net transactions in fund shares | (514,799) | ($6,765,763) | 269,565 | $4,172,787 | |
| SHARES OUTSTANDING AND NET ASSETS | |||||
| 11/1/21-10/31/22 | 11/1/20-10/31/21 | ||||
| SHARES | NET ASSETS | SHARES | NET ASSETS | ||
| Beginning of period | 4,304,687 | $65,477,387 | 4,035,122 | $55,506,772 | |
| Total increase (decrease) | + | (514,799) | (19,118,444) | 269,565 | 9,970,615 |
| End of period | 3,789,888 | $46,358,943 | 4,304,687 | $65,477,387 | |
| 11/1/21– 10/31/22 | 11/1/20– 10/31/21 | 11/1/19– 10/31/20 | 11/1/18– 10/31/19 | 11/1/17– 10/31/18 | ||
| Per-Share Data | ||||||
| Net asset value at beginning of period | $13.36 | $12.18 | $12.07 | $11.49 | $12.21 | |
| Income (loss) from investment operations: | ||||||
| Net investment income (loss)1 | 0.23 | 0.19 | 0.25 | 0.27 | 0.25 | |
| Net realized and unrealized gains (losses) | (2.24) | 1.54 | 0.50 | 0.86 | (0.30) | |
| Total from investment operations | (2.01) | 1.73 | 0.75 | 1.13 | (0.05) | |
| Less distributions: | ||||||
| Distributions from net investment income | (0.28) | (0.24) | (0.31) | (0.30) | (0.27) | |
| Distributions from net realized gains | (0.59) | (0.31) | (0.33) | (0.25) | (0.40) | |
| Total distributions | (0.87) | (0.55) | (0.64) | (0.55) | (0.67) | |
| Net asset value at end of period | $10.48 | $13.36 | $12.18 | $12.07 | $11.49 | |
| Total return | (16.15%) | 14.54% | 6.41% | 10.48% | (0.57%) | |
| Ratios/Supplemental Data | ||||||
| Ratios to average net assets: | ||||||
| Net operating expenses2 | 0.00% 3 | 0.00% | 0.00% | 0.00% | 0.00% 4 | |
| Gross operating expenses2 | 0.11% 3 | 0.08% | 0.10% | 0.11% | 0.07% | |
| Net investment income (loss) | 1.97% | 1.47% | 2.07% | 2.35% | 2.12% | |
| Portfolio turnover rate | 19% | 14% | 15% | 10% | 14% | |
| Net assets, end of period (x 1,000) | $57,879 | $81,399 | $77,274 | $81,139 | $90,292 | |
| 1 | Calculated based on the average shares outstanding during the period. |
| 2 | Ratio excludes acquired fund fees and expenses, which are indirect expenses incurred by the fund through its investments in underlying funds. |
| 3 | Ratio includes less than 0.005% of non-routine proxy expenses. |
| 4 | Less than 0.005%; the ratio of net operating expenses would have been 0.00%, if certain non-routine expenses had not been incurred. |
| SECURITY | VALUE AT 10/31/21 | PURCHASES | SALES | REALIZED GAINS (LOSSES) | NET CHANGE IN UNREALIZED APPRECIATION (DEPRECIATION) | VALUE AT 10/31/22 | BALANCE OF SHARES HELD AT 10/31/22 | DISTRIBUTIONS RECEIVED(a) |
| AFFILIATED UNDERLYING FUNDS 76.7% OF NET ASSETS | ||||||||
| U.S. Stocks 21.8% | ||||||||
| Large-Cap 19.5% | ||||||||
| Schwab Core Equity Fund | $2,277,077 | $— | ($518,354) | $231,402 | ($879,274) | $1,110,851 | 57,084 | $477,407 |
| Schwab Fundamental US Large Company Index Fund | 84,013 | 1,254,375 | — | — | (32,146) | 1,306,242 | 61,644 | 3,977 |
| Schwab S&P 500 Index Fund | 11,092,729 | 173,692 | (1,910,465) | 1,274,290 | (2,840,412) | 7,789,834 | 129,787 | 142,213 |
| Schwab Select Large Cap Growth Fund (formerly Laudus U.S. Large Cap Growth Fund) * | — | 1,409,891 | — | — | (345,163) | 1,064,728 | 54,020 | — |
| 11,271,655 | ||||||||
| Mid-Cap 0.7% | ||||||||
| Schwab U.S. Mid-Cap Index Fund | 693,518 | 18,018 | (150,567) | 43,248 | (157,398) | 446,819 | 8,619 | 18,018 |
| Small-Cap 1.6% | ||||||||
| Schwab Small-Cap Equity Fund | 1,092,075 | 200,431 | (120,000) | (22,138) | (224,802) | 925,566 | 48,868 | 118,989 |
| 12,644,040 | ||||||||
| International Stocks 10.0% | ||||||||
| Developed Markets 10.0% | ||||||||
| Schwab International Core Equity Fund | 2,177,755 | 1,262,173 | (384,340) | (46,376) | (610,761) | 2,398,451 | 275,367 | 59,309 |
| Schwab International Opportunities Fund (formerly Laudus International MarketMasters Fund) | 6,019,167 | 942,644 | (715,072) | (209,630) | (2,677,063) | 3,360,046 | 198,937 | 861,272 |
| 5,758,497 | ||||||||
| Real Estate 2.8% | ||||||||
| Global Real Estate 2.8% | ||||||||
| Schwab Global Real Estate Fund | 1,748,366 | 603,411 | (175,000) | (45,143) | (517,885) | 1,613,749 | 273,517 | 55,698 |
| Fixed Income 38.7% | ||||||||
| Inflation-Protected Bond 6.3% | ||||||||
| Schwab Treasury Inflation Protected Securities Index Fund | 5,118,855 | 285,090 | (930,185) | (12,272) | (802,074) | 3,659,414 | 350,855 | 285,090 |
| Intermediate-Term Bond 23.3% | ||||||||
| Schwab U.S. Aggregate Bond Index Fund | 19,995,824 | 647,328 | (3,991,838) | (332,662) | (2,854,404) | 13,464,248 | 1,565,610 | 381,206 |
| Short-Term Bond 9.1% | ||||||||
| Schwab Short-Term Bond Index Fund | 7,560,669 | 99,084 | (1,805,524) | (80,104) | (494,299) | 5,279,826 | 566,505 | 99,052 |
| 22,403,488 | ||||||||
| SECURITY | VALUE AT 10/31/21 | PURCHASES | SALES | REALIZED GAINS (LOSSES) | NET CHANGE IN UNREALIZED APPRECIATION (DEPRECIATION) | VALUE AT 10/31/22 | BALANCE OF SHARES HELD AT 10/31/22 | DISTRIBUTIONS RECEIVED(a) |
| Money Market Funds 3.4% | ||||||||
| Schwab Variable Share Price Money Fund, Ultra Shares, 3.10% (b) | $2,590,441 | $18,079 | ($650,061) | ($94) | ($654) | $1,957,711 | 1,957,711 | $20,460 |
| Total Affiliated Underlying Funds (Cost $41,343,822) | $60,450,489 | $6,914,216 | ($11,351,406) | $800,521 | ($12,436,335) | $44,377,485 | $2,522,691 | |
| UNAFFILIATED UNDERLYING FUNDS 22.6% OF NET ASSETS | ||||||||
| U.S. Stocks 6.3% | ||||||||
| Large-Cap 5.8% | ||||||||
| ClearBridge Large Cap Growth Fund, Class IS * | $1,644,845 | 32,246 | ||||||
| Dodge & Cox Stock Fund, Class I | 1,703,338 | 7,719 | ||||||
| 3,348,183 | ||||||||
| Small-Cap 0.5% | ||||||||
| ClearBridge Small Cap Growth Fund, Class IS * | 285,177 | 7,458 | ||||||
| 3,633,360 | ||||||||
| Fixed Income 16.3% | ||||||||
| Intermediate-Term Bond 14.1% | ||||||||
| Baird Aggregate Bond Fund, Institutional Class | 6,081,927 | 652,567 | ||||||
| Loomis Sayles Investment Grade Bond Fund, Class Y | 659,693 | 70,106 | ||||||
| Western Asset Core Plus Bond Fund, Class I | 1,442,547 | 159,928 | ||||||
| 8,184,167 | ||||||||
| International Bond 2.2% | ||||||||
| PIMCO International Bond Fund (U.S. Dollar-Hedged), Institutional Class | 1,255,534 | 132,023 | ||||||
| 9,439,701 | ||||||||
| Total Unaffiliated Underlying Funds (Cost $14,059,465) | $13,073,061 | |||||||
| Total Investments in Securities (Cost $55,403,287) | $57,450,546 | |||||||
| * | Non-income producing security. |
| (a) | Distributions received include distributions from net investment income and capital gains, if any, from the underlying funds. Amounts shown are only presented for affiliated underlying funds, which are presented in the corresponding line-item in the Statement of Operations, if applicable (See financial note 2(d) for additional information). |
| (b) | The rate shown is the annualized 7-day yield. |
| Assets | ||
| Investments in securities, at value - affiliated (cost $41,343,822) | $44,377,485 | |
| Investments in securities, at value - unaffiliated (cost $14,059,465) | 13,073,061 | |
| Cash | 65,979 | |
| Receivables: | ||
| Investments sold | 640,559 | |
| Fund shares sold | 234,507 | |
| Dividends | 46,429 | |
| Due from investment adviser | 6,141 | |
| Interest | 480 | |
| Prepaid expenses | + | 3,968 |
| Total assets | 58,448,609 | |
| Liabilities | ||
| Payables: | ||
| Investments bought | 310,026 | |
| Fund shares redeemed | 222,389 | |
| Independent trustees’ fees | 33 | |
| Accrued expenses | + | 36,771 |
| Total liabilities | 569,219 | |
| Net assets | $57,879,390 | |
| Net Assets by Source | ||
| Capital received from investors | $53,424,857 | |
| Total distributable earnings | + | 4,454,533 |
| Net assets | $57,879,390 | |
| Net Asset Value (NAV) | ||||
| Net Assets | ÷ | Shares Outstanding | = | NAV |
| $57,879,390 | 5,522,473 | $10.48 | ||
| For the period November 1, 2021 through October 31, 2022 | ||
| Investment Income | ||
| Dividends received from securities - affiliated | $1,085,856 | |
| Dividends received from securities - unaffiliated | 288,785 | |
| Interest received from securities - unaffiliated | + | 2,223 |
| Total investment income | 1,376,864 | |
| Expenses | ||
| Professional fees | 21,643 | |
| Registration fees | 18,839 | |
| Portfolio accounting fees | 12,443 | |
| Independent trustees’ fees | 6,942 | |
| Shareholder reports | 4,143 | |
| Proxy fees1 | 3,252 | |
| Custodian fees | 1,785 | |
| Transfer agent fees | 1,601 | |
| Other expenses | + | 5,249 |
| Total expenses | 75,897 | |
| Expense reduction | – | 72,645 |
| Net expenses | – | 3,252 |
| Net investment income | 1,373,612 | |
| REALIZED AND UNREALIZED GAINS (LOSSES) | ||
| Realized capital gain distributions received from underlying funds - affiliated | 1,436,835 | |
| Realized capital gain distributions received from underlying funds - unaffiliated | 414,993 | |
| Net realized gains on sales of securities - affiliated | 800,521 | |
| Net realized losses on sales of securities - unaffiliated | + | (177,215) |
| Net realized gains | 2,475,134 | |
| Net change in unrealized appreciation (depreciation) on securities - affiliated | (12,436,335) | |
| Net change in unrealized appreciation (depreciation) on securities - unaffiliated | + | (3,640,272) |
| Net change in unrealized appreciation (depreciation) | + | (16,076,607) |
| Net realized and unrealized losses | (13,601,473) | |
| Decrease in net assets resulting from operations | ($12,227,861) | |
| 1 | Proxy fees are non-routine expenses (see financial note 4 for additional information). |
| OPERATIONS | |||
| 11/1/21-10/31/22 | 11/1/20-10/31/21 | ||
| Net investment income | $1,373,612 | $1,200,315 | |
| Net realized gains | 2,475,134 | 3,802,441 | |
| Net change in unrealized appreciation (depreciation) | + | (16,076,607) | 6,018,277 |
| Increase (decrease) in net assets resulting from operations | ($12,227,861) | $11,021,033 | |
| DISTRIBUTIONS TO SHAREHOLDERS | |||
| Total distributions | ($5,182,871) | ($3,467,726) | |
| TRANSACTIONS IN FUND SHARES | |||||
| 11/1/21-10/31/22 | 11/1/20-10/31/21 | ||||
| SHARES | VALUE | SHARES | VALUE | ||
| Shares sold | 297,978 | $3,496,419 | 645,653 | $8,261,663 | |
| Shares reinvested | 380,762 | 4,793,794 | 263,836 | 3,295,303 | |
| Shares redeemed | + | (1,248,825) | (14,398,775) | (1,161,720) | (14,985,882) |
| Net transactions in fund shares | (570,085) | ($6,108,562) | (252,231) | ($3,428,916) | |
| SHARES OUTSTANDING AND NET ASSETS | |||||
| 11/1/21-10/31/22 | 11/1/20-10/31/21 | ||||
| SHARES | NET ASSETS | SHARES | NET ASSETS | ||
| Beginning of period | 6,092,558 | $81,398,684 | 6,344,789 | $77,274,293 | |
| Total increase (decrease) | + | (570,085) | (23,519,294) | (252,231) | 4,124,391 |
| End of period | 5,522,473 | $57,879,390 | 6,092,558 | $81,398,684 | |
| 11/1/21– 10/31/22 | 11/1/20– 10/31/21 | 11/1/19– 10/31/20 | 11/1/18– 10/31/19 | 11/1/17– 10/31/18 | ||
| Per-Share Data | ||||||
| Net asset value at beginning of period | $16.14 | $14.55 | $14.46 | $13.87 | $14.71 | |
| Income (loss) from investment operations: | ||||||
| Net investment income (loss)1 | 0.28 | 0.23 | 0.30 | 0.32 | 0.30 | |
| Net realized and unrealized gains (losses) | (2.72) | 1.94 | 0.58 | 1.04 | (0.33) | |
| Total from investment operations | (2.44) | 2.17 | 0.88 | 1.36 | (0.03) | |
| Less distributions: | ||||||
| Distributions from net investment income | (0.35) | (0.29) | (0.36) | (0.35) | (0.33) | |
| Distributions from net realized gains | (0.80) | (0.29) | (0.43) | (0.42) | (0.48) | |
| Total distributions | (1.15) | (0.58) | (0.79) | (0.77) | (0.81) | |
| Net asset value at end of period | $12.55 | $16.14 | $14.55 | $14.46 | $13.87 | |
| Total return | (16.35%) | 15.27% | 6.33% | 10.58% | (0.32%) | |
| Ratios/Supplemental Data | ||||||
| Ratios to average net assets: | ||||||
| Net operating expenses2 | 0.00% 3 | 0.00% | 0.00% | 0.00% | 0.00% | |
| Gross operating expenses2 | 0.03% 3 | 0.02% | 0.02% | 0.03% | 0.02% | |
| Net investment income (loss) | 1.97% | 1.47% | 2.13% | 2.28% | 2.07% | |
| Portfolio turnover rate | 17% | 10% | 17% | 14% | 18% | |
| Net assets, end of period (x 1,000) | $383,963 | $531,012 | $525,444 | $548,690 | $541,856 | |
| 1 | Calculated based on the average shares outstanding during the period. |
| 2 | Ratio excludes acquired fund fees and expenses, which are indirect expenses incurred by the fund through its investments in underlying funds. |
| 3 | Ratio includes less than 0.005% of non-routine proxy expenses. |
| SECURITY | VALUE AT 10/31/21 | PURCHASES | SALES | REALIZED GAINS (LOSSES) | NET CHANGE IN UNREALIZED APPRECIATION (DEPRECIATION) | VALUE AT 10/31/22 | BALANCE OF SHARES HELD AT 10/31/22 | DISTRIBUTIONS RECEIVED(a) |
| AFFILIATED UNDERLYING FUNDS 76.2% OF NET ASSETS | ||||||||
| U.S. Stocks 22.3% | ||||||||
| Large-Cap 19.8% | ||||||||
| Schwab Core Equity Fund | $15,100,292 | $— | ($2,084,672) | $736,346 | ($5,459,059) | $8,292,907 | 426,151 | $3,544,693 |
| Schwab Fundamental US Large Company Index Fund | 630,096 | 5,899,652 | — | — | (390,791) | 6,138,957 | 289,710 | 29,826 |
| Schwab S&P 500 Index Fund | 75,059,726 | 1,181,557 | (10,325,834) | 6,944,063 | (17,664,164) | 55,195,348 | 919,616 | 973,848 |
| Schwab Select Large Cap Growth Fund (formerly Laudus U.S. Large Cap Growth Fund) * | — | 8,482,778 | — | — | (2,047,836) | 6,434,942 | 326,481 | — |
| 76,062,154 | ||||||||
| Mid-Cap 0.9% | ||||||||
| Schwab U.S. Mid-Cap Index Fund | 4,461,137 | 127,673 | (399,999) | 48,967 | (926,803) | 3,310,975 | 63,869 | 127,673 |
| Small-Cap 1.6% | ||||||||
| Schwab Small-Cap Equity Fund | 8,228,779 | 896,580 | (1,284,522) | (2,730) | (1,751,491) | 6,086,616 | 321,363 | 896,580 |
| 85,459,745 | ||||||||
| International Stocks 10.9% | ||||||||
| Developed Markets 10.9% | ||||||||
| Schwab International Core Equity Fund | 17,711,654 | 7,128,958 | (2,374,019) | (222,533) | (4,813,523) | 17,430,537 | 2,001,210 | 484,294 |
| Schwab International Opportunities Fund (formerly Laudus International MarketMasters Fund) | 40,801,835 | 6,734,304 | (3,251,786) | (1,005,482) | (18,713,576) | 24,565,295 | 1,454,428 | 5,838,263 |
| 41,995,832 | ||||||||
| Real Estate 3.0% | ||||||||
| Global Real Estate 3.0% | ||||||||
| Schwab Global Real Estate Fund | 12,191,759 | 3,422,008 | (300,000) | 19,874 | (3,905,583) | 11,428,058 | 1,936,959 | 378,467 |
| Fixed Income 36.9% | ||||||||
| Inflation-Protected Bond 6.1% | ||||||||
| Schwab Treasury Inflation Protected Securities Index Fund | 32,789,992 | 1,807,648 | (5,863,252) | (42,790) | (5,157,485) | 23,534,113 | 2,256,387 | 1,807,648 |
| Intermediate-Term Bond 22.2% | ||||||||
| Schwab U.S. Aggregate Bond Index Fund | 125,307,510 | 3,646,314 | (23,755,451) | (1,925,917) | (18,088,025) | 85,184,431 | 9,905,166 | 2,393,864 |
| Short-Term Bond 8.6% | ||||||||
| Schwab Short-Term Bond Index Fund | 46,734,024 | 616,352 | (10,792,260) | (416,171) | (3,143,528) | 32,998,417 | 3,540,603 | 616,146 |
| 141,716,961 | ||||||||
| SECURITY | VALUE AT 10/31/21 | PURCHASES | SALES | REALIZED GAINS (LOSSES) | NET CHANGE IN UNREALIZED APPRECIATION (DEPRECIATION) | VALUE AT 10/31/22 | BALANCE OF SHARES HELD AT 10/31/22 | DISTRIBUTIONS RECEIVED(a) |
| Money Market Funds 3.1% | ||||||||
| Schwab Variable Share Price Money Fund, Ultra Shares, 3.10% (b) | $15,951,603 | $115,537 | ($4,000,381) | ($750) | ($3,743) | $12,062,266 | 12,062,266 | $130,213 |
| Total Affiliated Underlying Funds (Cost $267,295,382) | $394,968,407 | $40,059,361 | ($64,432,176) | $4,132,877 | ($82,065,607) | $292,662,862 | $17,221,515 | |
| UNAFFILIATED UNDERLYING FUNDS 23.2% OF NET ASSETS | ||||||||
| U.S. Stocks 7.2% | ||||||||
| Large-Cap 6.6% | ||||||||
| ClearBridge Large Cap Growth Fund, Class IS * | $12,044,200 | 236,114 | ||||||
| Dodge & Cox Stock Fund, Class I | 13,203,535 | 59,831 | ||||||
| 25,247,735 | ||||||||
| Small-Cap 0.6% | ||||||||
| ClearBridge Small Cap Growth Fund, Class IS * | 2,122,068 | 55,493 | ||||||
| 27,369,803 | ||||||||
| Fixed Income 16.0% | ||||||||
| Intermediate-Term Bond 13.9% | ||||||||
| Baird Aggregate Bond Fund, Institutional Class | 37,281,857 | 4,000,199 | ||||||
| Loomis Sayles Investment Grade Bond Fund, Class Y | 5,072,986 | 539,106 | ||||||
| Western Asset Core Plus Bond Fund, Class I | 10,867,217 | 1,204,791 | ||||||
| 53,222,060 | ||||||||
| International Bond 2.1% | ||||||||
| PIMCO International Bond Fund (U.S. Dollar-Hedged), Institutional Class | 8,252,800 | 867,802 | ||||||
| 61,474,860 | ||||||||
| Total Unaffiliated Underlying Funds (Cost $95,056,039) | $88,844,663 | |||||||
| Total Investments in Securities (Cost $362,351,421) | $381,507,525 | |||||||
| * | Non-income producing security. |
| (a) | Distributions received include distributions from net investment income and capital gains, if any, from the underlying funds. Amounts shown are only presented for affiliated underlying funds, which are presented in the corresponding line-item in the Statement of Operations, if applicable (See financial note 2(d) for additional information). |
| (b) | The rate shown is the annualized 7-day yield. |
| Assets | ||
| Investments in securities, at value - affiliated (cost $267,295,382) | $292,662,862 | |
| Investments in securities, at value - unaffiliated (cost $95,056,039) | 88,844,663 | |
| Cash | 1,239,731 | |
| Receivables: | ||
| Investments sold | 3,350,368 | |
| Dividends | 296,645 | |
| Fund shares sold | 255,839 | |
| Due from investment adviser | 8,788 | |
| Interest | 2,025 | |
| Prepaid expenses | + | 12,512 |
| Total assets | 386,673,433 | |
| Liabilities | ||
| Payables: | ||
| Investments bought | 2,209,409 | |
| Fund shares redeemed | 447,127 | |
| Independent trustees’ fees | 38 | |
| Accrued expenses | + | 53,646 |
| Total liabilities | 2,710,220 | |
| Net assets | $383,963,213 | |
| Net Assets by Source | ||
| Capital received from investors | $348,674,003 | |
| Total distributable earnings | + | 35,289,210 |
| Net assets | $383,963,213 | |
| Net Asset Value (NAV) | ||||
| Net Assets | ÷ | Shares Outstanding | = | NAV |
| $383,963,213 | 30,585,071 | $12.55 | ||
| For the period November 1, 2021 through October 31, 2022 | ||
| Investment Income | ||
| Dividends received from securities - affiliated | $7,103,413 | |
| Dividends received from securities - unaffiliated | 1,898,257 | |
| Interest received from securities - unaffiliated | + | 9,201 |
| Total investment income | 9,010,871 | |
| Expenses | ||
| Registration fees | 28,350 | |
| Portfolio accounting fees | 25,918 | |
| Professional fees | 22,433 | |
| Proxy fees1 | 21,385 | |
| Shareholder reports | 13,182 | |
| Independent trustees’ fees | 8,019 | |
| Transfer agent fees | 2,481 | |
| Custodian fees | 1,799 | |
| Other expenses | + | 8,847 |
| Total expenses | 132,414 | |
| Expense reduction | – | 111,029 |
| Net expenses | – | 21,385 |
| Net investment income | 8,989,486 | |
| REALIZED AND UNREALIZED GAINS (LOSSES) | ||
| Realized capital gain distributions received from underlying funds - affiliated | 10,118,102 | |
| Realized capital gain distributions received from underlying funds - unaffiliated | 2,724,057 | |
| Net realized gains on sales of securities - affiliated | 4,132,877 | |
| Net realized losses on sales of securities - unaffiliated | + | (1,196,173) |
| Net realized gains | 15,778,863 | |
| Net change in unrealized appreciation (depreciation) on securities - affiliated | (82,065,607) | |
| Net change in unrealized appreciation (depreciation) on securities - unaffiliated | + | (23,848,080) |
| Net change in unrealized appreciation (depreciation) | + | (105,913,687) |
| Net realized and unrealized losses | (90,134,824) | |
| Decrease in net assets resulting from operations | ($81,145,338) | |
| 1 | Proxy fees are non-routine expenses (see financial note 4 for additional information). |
| OPERATIONS | |||
| 11/1/21-10/31/22 | 11/1/20-10/31/21 | ||
| Net investment income | $8,989,486 | $7,899,808 | |
| Net realized gains | 15,778,863 | 27,827,003 | |
| Net change in unrealized appreciation (depreciation) | + | (105,913,687) | 40,880,954 |
| Increase (decrease) in net assets resulting from operations | ($81,145,338) | $76,607,765 | |
| DISTRIBUTIONS TO SHAREHOLDERS | |||
| Total distributions | ($37,368,972) | ($20,699,693) | |
| TRANSACTIONS IN FUND SHARES | |||||
| 11/1/21-10/31/22 | 11/1/20-10/31/21 | ||||
| SHARES | VALUE | SHARES | VALUE | ||
| Shares sold | 1,284,284 | $18,669,459 | 3,640,033 | $56,415,138 | |
| Shares reinvested | 2,320,540 | 35,086,570 | 1,291,646 | 19,426,353 | |
| Shares redeemed | + | (5,910,068) | (82,290,268) | (8,142,847) | (126,181,394) |
| Net transactions in fund shares | (2,305,244) | ($28,534,239) | (3,211,168) | ($50,339,903) | |
| SHARES OUTSTANDING AND NET ASSETS | |||||
| 11/1/21-10/31/22 | 11/1/20-10/31/21 | ||||
| SHARES | NET ASSETS | SHARES | NET ASSETS | ||
| Beginning of period | 32,890,315 | $531,011,762 | 36,101,483 | $525,443,593 | |
| Total increase (decrease) | + | (2,305,244) | (147,048,549) | (3,211,168) | 5,568,169 |
| End of period | 30,585,071 | $383,963,213 | 32,890,315 | $531,011,762 | |
| 11/1/21– 10/31/22 | 11/1/20– 10/31/21 | 11/1/19– 10/31/20 | 11/1/18– 10/31/19 | 11/1/17– 10/31/18 | ||
| Per-Share Data | ||||||
| Net asset value at beginning of period | $17.30 | $14.81 | $14.74 | $14.10 | $14.71 | |
| Income (loss) from investment operations: | ||||||
| Net investment income (loss)1 | 0.27 | 0.22 | 0.31 | 0.30 | 0.28 | |
| Net realized and unrealized gains (losses) | (3.09) | 2.74 | 0.55 | 1.10 | (0.34) | |
| Total from investment operations | (2.82) | 2.96 | 0.86 | 1.40 | (0.06) | |
| Less distributions: | ||||||
| Distributions from net investment income | (0.39) | (0.28) | (0.35) | (0.34) | (0.34) | |
| Distributions from net realized gains | (0.66) | (0.19) | (0.44) | (0.42) | (0.21) | |
| Total distributions | (1.05) | (0.47) | (0.79) | (0.76) | (0.55) | |
| Net asset value at end of period | $13.43 | $17.30 | $14.81 | $14.74 | $14.10 | |
| Total return | (17.39%) | 20.25% | 5.98% | 10.79% | (0.53%) | |
| Ratios/Supplemental Data | ||||||
| Ratios to average net assets: | ||||||
| Net operating expenses2 | 0.00% 3 | 0.00% | 0.00% | 0.00% | 0.00% | |
| Gross operating expenses2 | 0.03% 3 | 0.02% | 0.02% | 0.03% | 0.02% | |
| Net investment income (loss) | 1.82% | 1.33% | 2.14% | 2.10% | 1.88% | |
| Portfolio turnover rate | 19% | 16% | 16% | 15% | 13% | |
| Net assets, end of period (x 1,000) | $494,852 | $662,236 | $571,738 | $577,095 | $530,596 | |
| 1 | Calculated based on the average shares outstanding during the period. |
| 2 | Ratio excludes acquired fund fees and expenses, which are indirect expenses incurred by the fund through its investments in underlying funds. |
| 3 | Ratio includes less than 0.005% of non-routine proxy expenses. |
| SECURITY | VALUE AT 10/31/21 | PURCHASES | SALES | REALIZED GAINS (LOSSES) | NET CHANGE IN UNREALIZED APPRECIATION (DEPRECIATION) | VALUE AT 10/31/22 | BALANCE OF SHARES HELD AT 10/31/22 | DISTRIBUTIONS RECEIVED(a) |
| AFFILIATED UNDERLYING FUNDS 74.8% OF NET ASSETS | ||||||||
| U.S. Stocks 26.9% | ||||||||
| Large-Cap 23.7% | ||||||||
| Schwab Core Equity Fund | $30,810,897 | $— | ($7,337,903) | $1,496,834 | ($10,640,362) | $14,329,466 | 736,355 | $7,232,652 |
| Schwab Fundamental US Large Company Index Fund | 1,143,426 | 7,591,725 | — | — | (389,889) | 8,345,262 | 393,830 | 54,124 |
| Schwab S&P 500 Index Fund | 112,235,211 | 1,735,285 | (13,533,971) | 3,671,638 | (20,203,251) | 83,904,912 | 1,397,949 | 1,456,173 |
| Schwab Select Large Cap Growth Fund (formerly Laudus U.S. Large Cap Growth Fund) * | 5,443,022 | 10,934,857 | — | — | (5,739,586) | 10,638,293 | 539,741 | 646,054 |
| 117,217,933 | ||||||||
| Mid-Cap 1.1% | ||||||||
| Schwab U.S. Mid-Cap Index Fund | 7,075,174 | 202,483 | (600,000) | 54,102 | (1,467,228) | 5,264,531 | 101,553 | 202,483 |
| Small-Cap 2.1% | ||||||||
| Schwab Small-Cap Equity Fund | 15,175,891 | 1,653,515 | (3,010,599) | 92,588 | (3,318,457) | 10,592,938 | 559,289 | 1,653,515 |
| 133,075,402 | ||||||||
| International Stocks 14.2% | ||||||||
| Developed Markets 14.2% | ||||||||
| Schwab International Core Equity Fund | 30,940,500 | 6,970,703 | (632,397) | (180,062) | (8,301,032) | 28,797,712 | 3,306,282 | 870,352 |
| Schwab International Opportunities Fund (formerly Laudus International MarketMasters Fund) | 65,698,592 | 10,428,183 | (2,610,000) | (1,001,078) | (30,974,438) | 41,541,259 | 2,459,518 | 9,400,696 |
| 70,338,971 | ||||||||
| Real Estate 3.6% | ||||||||
| Global Real Estate 3.6% | ||||||||
| Schwab Global Real Estate Fund | 19,340,678 | 4,611,799 | — | — | (6,190,981) | 17,761,496 | 3,010,423 | 605,625 |
| Fixed Income 27.5% | ||||||||
| Inflation-Protected Bond 3.6% | ||||||||
| Schwab Treasury Inflation Protected Securities Index Fund | 19,066,823 | 4,480,921 | (2,317,741) | (232,753) | (3,459,570) | 17,537,680 | 1,681,465 | 1,246,654 |
| Intermediate-Term Bond 17.3% | ||||||||
| Schwab U.S. Aggregate Bond Index Fund | 116,519,168 | 6,257,405 | (17,406,269) | (2,559,808) | (17,061,739) | 85,748,757 | 9,970,786 | 2,335,249 |
| Short-Term Bond 6.6% | ||||||||
| Schwab Short-Term Bond Index Fund | 42,631,137 | 589,127 | (7,020,166) | (488,084) | (2,951,479) | 32,760,535 | 3,515,079 | 588,938 |
| 136,046,972 | ||||||||
| SECURITY | VALUE AT 10/31/21 | PURCHASES | SALES | REALIZED GAINS (LOSSES) | NET CHANGE IN UNREALIZED APPRECIATION (DEPRECIATION) | VALUE AT 10/31/22 | BALANCE OF SHARES HELD AT 10/31/22 | DISTRIBUTIONS RECEIVED(a) |
| Money Market Funds 2.6% | ||||||||
| Schwab Variable Share Price Money Fund, Ultra Shares, 3.10% (b) | $12,653,373 | $108,982 | ($302) | $— | ($3,804) | $12,758,249 | 12,758,249 | $124,666 |
| Total Affiliated Underlying Funds (Cost $347,686,400) | $478,733,892 | $55,564,985 | ($54,469,348) | $853,377 | ($110,701,816) | $369,981,090 | $26,417,181 | |
| UNAFFILIATED UNDERLYING FUNDS 24.7% OF NET ASSETS | ||||||||
| U.S. Stocks 8.5% | ||||||||
| Large-Cap 7.8% | ||||||||
| ClearBridge Large Cap Growth Fund, Class IS * | $16,023,054 | 314,116 | ||||||
| Dodge & Cox Stock Fund, Class I | 22,386,393 | 101,443 | ||||||
| 38,409,447 | ||||||||
| Small-Cap 0.7% | ||||||||
| ClearBridge Small Cap Growth Fund, Class IS * | 3,672,789 | 96,046 | ||||||
| 42,082,236 | ||||||||
| International Stocks 0.2% | ||||||||
| Emerging Markets 0.2% | ||||||||
| Goldman Sachs Emerging Markets Equity Insights Fund, Institutional Class | 1,150,275 | 167,923 | ||||||
| Fixed Income 16.0% | ||||||||
| Intermediate-Term Bond 12.5% | ||||||||
| Baird Aggregate Bond Fund, Institutional Class | 33,988,775 | 3,646,864 | ||||||
| Loomis Sayles Investment Grade Bond Fund, Class Y | 9,952,522 | 1,057,654 | ||||||
| Western Asset Core Plus Bond Fund, Class I | 18,054,982 | 2,001,661 | ||||||
| 61,996,279 | ||||||||
| International Bond 3.5% | ||||||||
| PIMCO International Bond Fund (U.S. Dollar-Hedged), Institutional Class | 17,073,633 | 1,795,335 | ||||||
| 79,069,912 | ||||||||
| Total Unaffiliated Underlying Funds (Cost $130,814,564) | $122,302,423 | |||||||
| Total Investments in Securities (Cost $478,500,964) | $492,283,513 | |||||||
| * | Non-income producing security. |
| (a) | Distributions received include distributions from net investment income and capital gains, if any, from the underlying funds. Amounts shown are only presented for affiliated underlying funds, which are presented in the corresponding line-item in the Statement of Operations, if applicable (See financial note 2(d) for additional information). |
| (b) | The rate shown is the annualized 7-day yield. |
| Assets | ||
| Investments in securities, at value - affiliated (cost $347,686,400) | $369,981,090 | |
| Investments in securities, at value - unaffiliated (cost $130,814,564) | 122,302,423 | |
| Cash | 1,787,330 | |
| Receivables: | ||
| Investments sold | 4,614,981 | |
| Dividends | 333,188 | |
| Fund shares sold | 205,139 | |
| Due from investment adviser | 10,440 | |
| Interest | 2,559 | |
| Prepaid expenses | + | 8,598 |
| Total assets | 499,245,748 | |
| Liabilities | ||
| Payables: | ||
| Investments bought | 3,951,842 | |
| Fund shares redeemed | 385,730 | |
| Independent trustees’ fees | 39 | |
| Accrued expenses | + | 56,479 |
| Total liabilities | 4,394,090 | |
| Net assets | $494,851,658 | |
| Net Assets by Source | ||
| Capital received from investors | $462,882,749 | |
| Total distributable earnings | + | 31,968,909 |
| Net assets | $494,851,658 | |
| Net Asset Value (NAV) | ||||
| Net Assets | ÷ | Shares Outstanding | = | NAV |
| $494,851,658 | 36,845,846 | $13.43 | ||
| For the period November 1, 2021 through October 31, 2022 | ||
| Investment Income | ||
| Dividends received from securities - affiliated | $7,952,874 | |
| Dividends received from securities - unaffiliated | 2,614,670 | |
| Interest received from securities - unaffiliated | + | 15,243 |
| Total investment income | 10,582,787 | |
| Expenses | ||
| Registration fees | 37,100 | |
| Portfolio accounting fees | 27,493 | |
| Proxy fees1 | 27,157 | |
| Professional fees | 22,633 | |
| Shareholder reports | 14,852 | |
| Independent trustees’ fees | 8,362 | |
| Transfer agent fees | 6,067 | |
| Custodian fees | 1,595 | |
| Other expenses | + | 9,948 |
| Total expenses | 155,207 | |
| Expense reduction | – | 128,050 |
| Net expenses | – | 27,157 |
| Net investment income | 10,555,630 | |
| REALIZED AND UNREALIZED GAINS (LOSSES) | ||
| Realized capital gain distributions received from underlying funds - affiliated | 18,464,307 | |
| Realized capital gain distributions received from underlying funds - unaffiliated | 4,204,343 | |
| Net realized gains on sales of securities - affiliated | 853,377 | |
| Net realized losses on sales of securities - unaffiliated | + | (2,445,598) |
| Net realized gains | 21,076,429 | |
| Net change in unrealized appreciation (depreciation) on securities - affiliated | (110,701,816) | |
| Net change in unrealized appreciation (depreciation) on securities - unaffiliated | + | (31,989,045) |
| Net change in unrealized appreciation (depreciation) | + | (142,690,861) |
| Net realized and unrealized losses | (121,614,432) | |
| Decrease in net assets resulting from operations | ($111,058,802) | |
| 1 | Proxy fees are non-routine expenses (see financial note 4 for additional information). |
| OPERATIONS | |||
| 11/1/21-10/31/22 | 11/1/20-10/31/21 | ||
| Net investment income | $10,555,630 | $8,465,976 | |
| Net realized gains | 21,076,429 | 27,687,865 | |
| Net change in unrealized appreciation (depreciation) | + | (142,690,861) | 77,630,122 |
| Increase (decrease) in net assets resulting from operations | ($111,058,802) | $113,783,963 | |
| DISTRIBUTIONS TO SHAREHOLDERS | |||
| Total distributions | ($40,238,108) | ($17,910,599) | |
| TRANSACTIONS IN FUND SHARES | |||||
| 11/1/21-10/31/22 | 11/1/20-10/31/21 | ||||
| SHARES | VALUE | SHARES | VALUE | ||
| Shares sold | 3,386,870 | $52,261,525 | 6,926,067 | $114,143,701 | |
| Shares reinvested | 2,343,986 | 38,464,811 | 1,088,638 | 17,189,589 | |
| Shares redeemed | + | (7,174,723) | (106,813,544) | (8,322,542) | (136,708,712) |
| Net transactions in fund shares | (1,443,867) | ($16,087,208) | (307,837) | ($5,375,422) | |
| SHARES OUTSTANDING AND NET ASSETS | |||||
| 11/1/21-10/31/22 | 11/1/20-10/31/21 | ||||
| SHARES | NET ASSETS | SHARES | NET ASSETS | ||
| Beginning of period | 38,289,713 | $662,235,776 | 38,597,550 | $571,737,834 | |
| Total increase (decrease) | + | (1,443,867) | (167,384,118) | (307,837) | 90,497,942 |
| End of period | 36,845,846 | $494,851,658 | 38,289,713 | $662,235,776 | |
| 11/1/21– 10/31/22 | 11/1/20– 10/31/21 | 11/1/19– 10/31/20 | 11/1/18– 10/31/19 | 11/1/17– 10/31/18 | ||
| Per-Share Data | ||||||
| Net asset value at beginning of period | $18.88 | $15.67 | $15.79 | $15.24 | $16.10 | |
| Income (loss) from investment operations: | ||||||
| Net investment income (loss)1 | 0.27 | 0.22 | 0.33 | 0.30 | 0.29 | |
| Net realized and unrealized gains (losses) | (3.53) | 3.54 | 0.57 | 1.21 | (0.38) | |
| Total from investment operations | (3.26) | 3.76 | 0.90 | 1.51 | (0.09) | |
| Less distributions: | ||||||
| Distributions from net investment income | (0.45) | (0.27) | (0.37) | (0.37) | (0.39) | |
| Distributions from net realized gains | (0.78) | (0.28) | (0.65) | (0.59) | (0.38) | |
| Total distributions | (1.23) | (0.55) | (1.02) | (0.96) | (0.77) | |
| Net asset value at end of period | $14.39 | $18.88 | $15.67 | $15.79 | $15.24 | |
| Total return | (18.51%) | 24.38% | 5.81% | 10.94% | (0.75%) | |
| Ratios/Supplemental Data | ||||||
| Ratios to average net assets: | ||||||
| Net operating expenses2 | 0.00% 3 | 0.00% | 0.00% | 0.00% | 0.00% | |
| Gross operating expenses2 | 0.02% 3 | 0.01% | 0.02% | 0.02% | 0.02% | |
| Net investment income (loss) | 1.65% | 1.21% | 2.15% | 2.00% | 1.79% | |
| Portfolio turnover rate | 16% | 14% | 13% | 17% | 14% | |
| Net assets, end of period (x 1,000) | $901,007 | $1,166,390 | $965,288 | $998,681 | $957,756 | |
| 1 | Calculated based on the average shares outstanding during the period. |
| 2 | Ratio excludes acquired fund fees and expenses, which are indirect expenses incurred by the fund through its investments in underlying funds. |
| 3 | Ratio includes less than 0.005% of non-routine proxy expenses. |
| SECURITY | VALUE AT 10/31/21 | PURCHASES | SALES | REALIZED GAINS (LOSSES) | NET CHANGE IN UNREALIZED APPRECIATION (DEPRECIATION) | VALUE AT 10/31/22 | BALANCE OF SHARES HELD AT 10/31/22 | DISTRIBUTIONS RECEIVED(a) |
| AFFILIATED UNDERLYING FUNDS 73.5% OF NET ASSETS | ||||||||
| U.S. Stocks 32.5% | ||||||||
| Large-Cap 28.2% | ||||||||
| Schwab Core Equity Fund | $70,910,149 | $— | ($17,497,159) | $5,603,493 | ($26,571,225) | $32,445,258 | 1,667,279 | $16,645,684 |
| Schwab Fundamental US Large Company Index Fund | 5,893,250 | 17,463,390 | — | — | (1,525,648) | 21,830,992 | 1,030,250 | 278,957 |
| Schwab S&P 500 Index Fund | 217,688,882 | 3,294,756 | (17,014,706) | 2,059,431 | (34,848,464) | 171,179,899 | 2,852,048 | 2,824,361 |
| Schwab Select Large Cap Growth Fund (formerly Laudus U.S. Large Cap Growth Fund) * | 23,583,922 | 22,721,646 | — | — | (17,302,576) | 29,002,992 | 1,471,486 | 2,799,271 |
| 254,459,141 | ||||||||
| Mid-Cap 1.3% | ||||||||
| Schwab U.S. Mid-Cap Index Fund | 14,994,937 | 429,138 | (800,000) | 74,283 | (3,004,354) | 11,694,004 | 225,579 | 429,138 |
| Small-Cap 3.0% | ||||||||
| Schwab Small-Cap Equity Fund | 36,286,126 | 3,953,615 | (5,477,495) | (80,593) | (7,695,771) | 26,985,882 | 1,424,809 | 3,953,615 |
| 293,139,027 | ||||||||
| International Stocks 17.6% | ||||||||
| Developed Markets 17.6% | ||||||||
| Schwab International Core Equity Fund | 72,385,637 | 12,608,044 | — | — | (19,620,844) | 65,372,837 | 7,505,492 | 2,036,199 |
| Schwab International Opportunities Fund (formerly Laudus International MarketMasters Fund) | 133,184,630 | 28,875,176 | (2,400,000) | (680,181) | (65,919,741) | 93,059,884 | 5,509,762 | 19,057,154 |
| 158,432,721 | ||||||||
| Real Estate 4.4% | ||||||||
| Global Real Estate 4.4% | ||||||||
| Schwab Global Real Estate Fund | 38,745,994 | 14,122,196 | — | — | (13,518,688) | 39,349,502 | 6,669,407 | 1,289,064 |
| Fixed Income 17.4% | ||||||||
| Inflation-Protected Bond 1.2% | ||||||||
| Schwab Treasury Inflation Protected Securities Index Fund | 8,963,030 | 3,986,015 | — | — | (2,070,471) | 10,878,574 | 1,043,008 | 679,621 |
| Intermediate-Term Bond 11.7% | ||||||||
| Schwab U.S. Aggregate Bond Index Fund | 145,012,045 | 2,925,545 | (17,678,679) | (2,643,670) | (21,897,672) | 105,717,569 | 12,292,741 | 2,924,613 |
| Short-Term Bond 4.5% | ||||||||
| Schwab Short-Term Bond Index Fund | 52,149,714 | 727,497 | (8,174,887) | (607,381) | (3,634,791) | 40,460,152 | 4,341,218 | 727,263 |
| 157,056,295 | ||||||||
| SECURITY | VALUE AT 10/31/21 | PURCHASES | SALES | REALIZED GAINS (LOSSES) | NET CHANGE IN UNREALIZED APPRECIATION (DEPRECIATION) | VALUE AT 10/31/22 | BALANCE OF SHARES HELD AT 10/31/22 | DISTRIBUTIONS RECEIVED(a) |
| Money Market Funds 1.6% | ||||||||
| Schwab Variable Share Price Money Fund, Ultra Shares, 3.10% (b) | $14,659,600 | $126,262 | ($350) | $— | ($4,407) | $14,781,105 | 14,781,105 | $144,432 |
| Total Affiliated Underlying Funds (Cost $581,454,997) | $834,457,916 | $111,233,280 | ($69,043,276) | $3,725,382 | ($217,614,652) | $662,758,650 | $53,789,372 | |
| UNAFFILIATED UNDERLYING FUNDS 25.8% OF NET ASSETS | ||||||||
| U.S. Stocks 10.1% | ||||||||
| Large-Cap 9.0% | ||||||||
| ClearBridge Large Cap Growth Fund, Class IS * | $31,964,432 | 626,631 | ||||||
| Dodge & Cox Stock Fund, Class I | 49,191,048 | 222,907 | ||||||
| 81,155,480 | ||||||||
| Small-Cap 1.1% | ||||||||
| ClearBridge Small Cap Growth Fund, Class IS * | 9,990,306 | 261,253 | ||||||
| 91,145,786 | ||||||||
| International Stocks 1.1% | ||||||||
| Emerging Markets 1.1% | ||||||||
| Goldman Sachs Emerging Markets Equity Insights Fund, Institutional Class | 9,774,218 | 1,426,893 | ||||||
| Fixed Income 14.6% | ||||||||
| Intermediate-Term Bond 10.5% | ||||||||
| Baird Aggregate Bond Fund, Institutional Class | 35,305,494 | 3,788,143 | ||||||
| Loomis Sayles Investment Grade Bond Fund, Class Y | 26,121,867 | 2,775,969 | ||||||
| Western Asset Core Plus Bond Fund, Class I | 33,383,102 | 3,701,009 | ||||||
| 94,810,463 | ||||||||
| International Bond 4.1% | ||||||||
| PIMCO International Bond Fund (U.S. Dollar-Hedged), Institutional Class | 36,412,018 | 3,828,814 | ||||||
| 131,222,481 | ||||||||
| Total Unaffiliated Underlying Funds (Cost $247,994,990) | $232,142,485 | |||||||
| Total Investments in Securities (Cost $829,449,987) | $894,901,135 | |||||||
| * | Non-income producing security. |
| (a) | Distributions received include distributions from net investment income and capital gains, if any, from the underlying funds. Amounts shown are only presented for affiliated underlying funds, which are presented in the corresponding line-item in the Statement of Operations, if applicable (See financial note 2(d) for additional information). |
| (b) | The rate shown is the annualized 7-day yield. |
| Assets | ||
| Investments in securities, at value - affiliated (cost $581,454,997) | $662,758,650 | |
| Investments in securities, at value - unaffiliated (cost $247,994,990) | 232,142,485 | |
| Cash | 3,716,356 | |
| Receivables: | ||
| Investments sold | 8,192,469 | |
| Dividends | 485,280 | |
| Fund shares sold | 441,032 | |
| Due from investment adviser | 10,975 | |
| Interest | 5,908 | |
| Prepaid expenses | + | 17,481 |
| Total assets | 907,770,636 | |
| Liabilities | ||
| Payables: | ||
| Investments bought | 6,119,831 | |
| Fund shares redeemed | 576,383 | |
| Independent trustees’ fees | 45 | |
| Accrued expenses | + | 67,540 |
| Total liabilities | 6,763,799 | |
| Net assets | $901,006,837 | |
| Net Assets by Source | ||
| Capital received from investors | $794,195,411 | |
| Total distributable earnings | + | 106,811,426 |
| Net assets | $901,006,837 | |
| Net Asset Value (NAV) | ||||
| Net Assets | ÷ | Shares Outstanding | = | NAV |
| $901,006,837 | 62,603,231 | $14.39 | ||
| For the period November 1, 2021 through October 31, 2022 | ||
| Investment Income | ||
| Dividends received from securities - affiliated | $12,398,635 | |
| Dividends received from securities - unaffiliated | 4,636,340 | |
| Interest received from securities - unaffiliated | + | 31,262 |
| Total investment income | 17,066,237 | |
| Expenses | ||
| Proxy fees1 | 48,078 | |
| Registration fees | 38,435 | |
| Portfolio accounting fees | 32,845 | |
| Shareholder reports | 24,081 | |
| Professional fees | 23,489 | |
| Independent trustees’ fees | 9,617 | |
| Transfer agent fees | 3,117 | |
| Custodian fees | 1,556 | |
| Other expenses | + | 13,972 |
| Total expenses | 195,190 | |
| Expense reduction | – | 147,112 |
| Net expenses | – | 48,078 |
| Net investment income | 17,018,159 | |
| REALIZED AND UNREALIZED GAINS (LOSSES) | ||
| Realized capital gain distributions received from underlying funds - affiliated | 41,390,737 | |
| Realized capital gain distributions received from underlying funds - unaffiliated | 9,770,261 | |
| Net realized gains on sales of securities - affiliated | 3,725,382 | |
| Net realized losses on sales of securities - unaffiliated | + | (3,082,106) |
| Net realized gains | 51,804,274 | |
| Net change in unrealized appreciation (depreciation) on securities - affiliated | (217,614,652) | |
| Net change in unrealized appreciation (depreciation) on securities - unaffiliated | + | (62,742,341) |
| Net change in unrealized appreciation (depreciation) | + | (280,356,993) |
| Net realized and unrealized losses | (228,552,719) | |
| Decrease in net assets resulting from operations | ($211,534,560) | |
| 1 | Proxy fees are non-routine expenses (see financial note 4 for additional information). |
| OPERATIONS | |||
| 11/1/21-10/31/22 | 11/1/20-10/31/21 | ||
| Net investment income | $17,018,159 | $13,372,126 | |
| Net realized gains | 51,804,274 | 51,402,654 | |
| Net change in unrealized appreciation (depreciation) | + | (280,356,993) | 168,319,075 |
| Increase (decrease) in net assets resulting from operations | ($211,534,560) | $233,093,855 | |
| DISTRIBUTIONS TO SHAREHOLDERS | |||
| Total distributions | ($76,077,422) | ($33,685,506) | |
| TRANSACTIONS IN FUND SHARES | |||||
| 11/1/21-10/31/22 | 11/1/20-10/31/21 | ||||
| SHARES | VALUE | SHARES | VALUE | ||
| Shares sold | 4,812,363 | $80,128,583 | 8,679,574 | $154,456,722 | |
| Shares reinvested | 4,101,491 | 73,252,632 | 1,918,145 | 32,455,024 | |
| Shares redeemed | + | (8,083,930) | (131,152,076) | (10,436,498) | (185,218,592) |
| Net transactions in fund shares | 829,924 | $22,229,139 | 161,221 | $1,693,154 | |
| SHARES OUTSTANDING AND NET ASSETS | |||||
| 11/1/21-10/31/22 | 11/1/20-10/31/21 | ||||
| SHARES | NET ASSETS | SHARES | NET ASSETS | ||
| Beginning of period | 61,773,307 | $1,166,389,680 | 61,612,086 | $965,288,177 | |
| Total increase (decrease) | + | 829,924 | (265,382,843) | 161,221 | 201,101,503 |
| End of period | 62,603,231 | $901,006,837 | 61,773,307 | $1,166,389,680 | |
| 11/1/21– 10/31/22 | 11/1/20– 10/31/21 | 11/1/19– 10/31/20 | 11/1/18– 10/31/19 | 11/1/17– 10/31/18 | ||
| Per-Share Data | ||||||
| Net asset value at beginning of period | $19.05 | $15.34 | $15.46 | $14.94 | $15.58 | |
| Income (loss) from investment operations: | ||||||
| Net investment income (loss)1 | 0.25 | 0.20 | 0.31 | 0.28 | 0.27 | |
| Net realized and unrealized gains (losses) | (3.73) | 3.99 | 0.53 | 1.19 | (0.38) | |
| Total from investment operations | (3.48) | 4.19 | 0.84 | 1.47 | (0.11) | |
| Less distributions: | ||||||
| Distributions from net investment income | (0.48) | (0.24) | (0.34) | (0.36) | (0.39) | |
| Distributions from net realized gains | (0.58) | (0.24) | (0.62) | (0.59) | (0.14) | |
| Total distributions | (1.06) | (0.48) | (0.96) | (0.95) | (0.53) | |
| Net asset value at end of period | $14.51 | $19.05 | $15.34 | $15.46 | $14.94 | |
| Total return | (19.41%) | 27.76% | 5.51% | 10.90% | (0.88%) | |
| Ratios/Supplemental Data | ||||||
| Ratios to average net assets: | ||||||
| Net operating expenses2 | 0.00% 3 | 0.00% | 0.00% | 0.00% | 0.00% 4 | |
| Gross operating expenses2 | 0.03% 3 | 0.02% | 0.03% | 0.03% | 0.03% | |
| Net investment income (loss) | 1.55% | 1.11% | 2.06% | 1.87% | 1.70% | |
| Portfolio turnover rate | 13% | 14% | 12% | 15% | 14% | |
| Net assets, end of period (x 1,000) | $482,594 | $612,195 | $476,911 | $483,191 | $446,711 | |
| 1 | Calculated based on the average shares outstanding during the period. |
| 2 | Ratio excludes acquired fund fees and expenses, which are indirect expenses incurred by the fund through its investments in underlying funds. |
| 3 | Ratio includes less than 0.005% of non-routine proxy expenses. |
| 4 | Less than 0.005%; the ratio of net operating expenses would have been 0.00%, if certain non-routine expenses had not been incurred. |
| SECURITY | VALUE AT 10/31/21 | PURCHASES | SALES | REALIZED GAINS (LOSSES) | NET CHANGE IN UNREALIZED APPRECIATION (DEPRECIATION) | VALUE AT 10/31/22 | BALANCE OF SHARES HELD AT 10/31/22 | DISTRIBUTIONS RECEIVED(a) |
| AFFILIATED UNDERLYING FUNDS 75.1% OF NET ASSETS | ||||||||
| U.S. Stocks 37.5% | ||||||||
| Large-Cap 31.9% | ||||||||
| Schwab Core Equity Fund | $41,894,424 | $— | ($10,323,893) | $1,817,068 | ($14,169,209) | $19,218,390 | 987,584 | $9,834,436 |
| Schwab Fundamental US Large Company Index Fund | 7,215,216 | 14,944,082 | — | — | (1,284,007) | 20,875,291 | 985,148 | 341,533 |
| Schwab S&P 500 Index Fund | 118,696,941 | 1,540,010 | (7,484,015) | 870,008 | (18,936,696) | 94,686,248 | 1,577,578 | 1,540,010 |
| Schwab Select Large Cap Growth Fund (formerly Laudus U.S. Large Cap Growth Fund) * | 20,266,768 | 11,594,267 | — | — | (12,575,375) | 19,285,660 | 978,471 | 2,405,545 |
| 154,065,589 | ||||||||
| Mid-Cap 1.6% | ||||||||
| Schwab U.S. Mid-Cap Index Fund | 9,050,934 | 259,028 | — | — | (1,810,989) | 7,498,973 | 144,656 | 259,028 |
| Small-Cap 4.0% | ||||||||
| Schwab Small-Cap Equity Fund | 22,651,391 | 3,239,228 | (1,500,000) | (127,876) | (4,704,565) | 19,558,178 | 1,032,639 | 2,468,020 |
| 181,122,740 | ||||||||
| International Stocks 19.7% | ||||||||
| Developed Markets 19.7% | ||||||||
| Schwab International Core Equity Fund | 41,509,544 | 10,284,573 | — | — | (12,250,664) | 39,543,453 | 4,540,006 | 1,299,415 |
| Schwab International Opportunities Fund (formerly Laudus International MarketMasters Fund) | 80,171,247 | 15,442,256 | — | — | (40,053,990) | 55,559,513 | 3,289,492 | 11,471,562 |
| 95,102,966 | ||||||||
| Real Estate 4.8% | ||||||||
| Global Real Estate 4.8% | ||||||||
| Schwab Global Real Estate Fund | 23,203,409 | 8,280,808 | — | — | (8,198,352) | 23,285,865 | 3,946,757 | 782,792 |
| Fixed Income 11.8% | ||||||||
| Intermediate-Term Bond 8.6% | ||||||||
| Schwab U.S. Aggregate Bond Index Fund | 55,188,599 | 1,116,474 | (5,527,853) | (722,563) | (8,650,829) | 41,403,828 | 4,814,399 | 1,116,122 |
| Short-Term Bond 3.2% | ||||||||
| Schwab Short-Term Bond Index Fund | 19,015,497 | 265,570 | (1,988,311) | (102,702) | (1,440,230) | 15,749,824 | 1,689,895 | 265,483 |
| 57,153,652 | ||||||||
| Money Market Funds 1.3% | ||||||||
| Schwab Variable Share Price Money Fund, Ultra Shares, 3.10% (b) | 6,016,506 | 51,819 | (143) | — | (1,809) | 6,066,373 | 6,066,373 | 59,276 |
| Total Affiliated Underlying Funds (Cost $336,957,725) | $444,880,476 | $67,018,115 | ($26,824,215) | $1,733,935 | ($124,076,715) | $362,731,596 | $31,843,222 | |
| SECURITY | VALUE AT 10/31/21 | PURCHASES | SALES | REALIZED GAINS (LOSSES) | NET CHANGE IN UNREALIZED APPRECIATION (DEPRECIATION) | VALUE AT 10/31/22 | BALANCE OF SHARES HELD AT 10/31/22 | DISTRIBUTIONS RECEIVED(a) |
| UNAFFILIATED UNDERLYING FUNDS 24.4% OF NET ASSETS | ||||||||
| U.S. Stocks 11.0% | ||||||||
| Large-Cap 9.8% | ||||||||
| ClearBridge Large Cap Growth Fund, Class IS * | $19,979,005 | 391,668 | ||||||
| Dodge & Cox Stock Fund, Class I | 27,007,538 | 122,383 | ||||||
| 46,986,543 | ||||||||
| Small-Cap 1.2% | ||||||||
| ClearBridge Small Cap Growth Fund, Class IS * | 5,889,946 | 154,026 | ||||||
| 52,876,489 | ||||||||
| International Stocks 1.8% | ||||||||
| Emerging Markets 1.8% | ||||||||
| Goldman Sachs Emerging Markets Equity Insights Fund, Institutional Class | 8,595,503 | 1,254,818 | ||||||
| Fixed Income 11.6% | ||||||||
| Intermediate-Term Bond 8.1% | ||||||||
| Baird Aggregate Bond Fund, Institutional Class | 10,387,732 | 1,114,564 | ||||||
| Loomis Sayles Investment Grade Bond Fund, Class Y | 15,197,342 | 1,615,020 | ||||||
| Western Asset Core Plus Bond Fund, Class I | 13,645,902 | 1,512,849 | ||||||
| 39,230,976 | ||||||||
| International Bond 3.5% | ||||||||
| PIMCO International Bond Fund (U.S. Dollar-Hedged), Institutional Class | 16,909,466 | 1,778,072 | ||||||
| 56,140,442 | ||||||||
| Total Unaffiliated Underlying Funds (Cost $126,795,860) | $117,612,434 | |||||||
| Total Investments in Securities (Cost $463,753,585) | $480,344,030 | |||||||
| * | Non-income producing security. |
| (a) | Distributions received include distributions from net investment income and capital gains, if any, from the underlying funds. Amounts shown are only presented for affiliated underlying funds, which are presented in the corresponding line-item in the Statement of Operations, if applicable (See financial note 2(d) for additional information). |
| (b) | The rate shown is the annualized 7-day yield. |
| Assets | ||
| Investments in securities, at value - affiliated (cost $336,957,725) | $362,731,596 | |
| Investments in securities, at value - unaffiliated (cost $126,795,860) | 117,612,434 | |
| Cash | 1,379,946 | |
| Receivables: | ||
| Investments sold | 5,204,066 | |
| Fund shares sold | 422,229 | |
| Dividends | 198,038 | |
| Due from investment adviser | 10,654 | |
| Interest | 2,114 | |
| Prepaid expenses | + | 9,517 |
| Total assets | 487,570,594 | |
| Liabilities | ||
| Payables: | ||
| Investments bought | 4,345,448 | |
| Fund shares redeemed | 574,615 | |
| Independent trustees’ fees | 39 | |
| Accrued expenses | + | 56,748 |
| Total liabilities | 4,976,850 | |
| Net assets | $482,593,744 | |
| Net Assets by Source | ||
| Capital received from investors | $440,113,716 | |
| Total distributable earnings | + | 42,480,028 |
| Net assets | $482,593,744 | |
| Net Asset Value (NAV) | ||||
| Net Assets | ÷ | Shares Outstanding | = | NAV |
| $482,593,744 | 33,250,024 | $14.51 | ||
| For the period November 1, 2021 through October 31, 2022 | ||
| Investment Income | ||
| Dividends received from securities - affiliated | $6,243,748 | |
| Dividends received from securities - unaffiliated | 2,288,055 | |
| Interest received from securities - unaffiliated | + | 11,825 |
| Total investment income | 8,543,628 | |
| Expenses | ||
| Registration fees | 31,784 | |
| Portfolio accounting fees | 27,202 | |
| Proxy fees1 | 25,464 | |
| Professional fees | 22,543 | |
| Shareholder reports | 15,399 | |
| Independent trustees’ fees | 8,268 | |
| Transfer agent fees | 6,399 | |
| Custodian fees | 1,438 | |
| Other expenses | + | 9,571 |
| Total expenses | 148,068 | |
| Expense reduction | – | 122,604 |
| Net expenses | – | 25,464 |
| Net investment income | 8,518,164 | |
| REALIZED AND UNREALIZED GAINS (LOSSES) | ||
| Realized capital gain distributions received from underlying funds - affiliated | 25,599,474 | |
| Realized capital gain distributions received from underlying funds - unaffiliated | 6,283,526 | |
| Net realized gains on sales of securities - affiliated | 1,733,935 | |
| Net realized losses on sales of securities - unaffiliated | + | (1,292,213) |
| Net realized gains | 32,324,722 | |
| Net change in unrealized appreciation (depreciation) on securities - affiliated | (124,076,715) | |
| Net change in unrealized appreciation (depreciation) on securities - unaffiliated | + | (35,211,916) |
| Net change in unrealized appreciation (depreciation) | + | (159,288,631) |
| Net realized and unrealized losses | (126,963,909) | |
| Decrease in net assets resulting from operations | ($118,445,745) | |
| 1 | Proxy fees are non-routine expenses (see financial note 4 for additional information). |
| OPERATIONS | |||
| 11/1/21-10/31/22 | 11/1/20-10/31/21 | ||
| Net investment income | $8,518,164 | $6,365,426 | |
| Net realized gains | 32,324,722 | 20,324,363 | |
| Net change in unrealized appreciation (depreciation) | + | (159,288,631) | 106,391,162 |
| Increase (decrease) in net assets resulting from operations | ($118,445,745) | $133,080,951 | |
| DISTRIBUTIONS TO SHAREHOLDERS | |||
| Total distributions | ($34,334,971) | ($15,121,800) | |
| TRANSACTIONS IN FUND SHARES | |||||
| 11/1/21-10/31/22 | 11/1/20-10/31/21 | ||||
| SHARES | VALUE | SHARES | VALUE | ||
| Shares sold | 3,692,487 | $62,406,093 | 5,580,980 | $98,912,959 | |
| Shares reinvested | 1,828,575 | 33,316,650 | 875,675 | 14,737,609 | |
| Shares redeemed | + | (4,400,937) | (72,542,793) | (5,406,863) | (96,325,760) |
| Net transactions in fund shares | 1,120,125 | $23,179,950 | 1,049,792 | $17,324,808 | |
| SHARES OUTSTANDING AND NET ASSETS | |||||
| 11/1/21-10/31/22 | 11/1/20-10/31/21 | ||||
| SHARES | NET ASSETS | SHARES | NET ASSETS | ||
| Beginning of period | 32,129,899 | $612,194,510 | 31,080,107 | $476,910,551 | |
| Total increase (decrease) | + | 1,120,125 | (129,600,766) | 1,049,792 | 135,283,959 |
| End of period | 33,250,024 | $482,593,744 | 32,129,899 | $612,194,510 | |
| 11/1/21– 10/31/22 | 11/1/20– 10/31/21 | 11/1/19– 10/31/20 | 11/1/18– 10/31/19 | 11/1/17– 10/31/18 | ||
| Per-Share Data | ||||||
| Net asset value at beginning of period | $20.52 | $16.24 | $16.61 | $16.27 | $17.14 | |
| Income (loss) from investment operations: | ||||||
| Net investment income (loss)1 | 0.26 | 0.20 | 0.32 | 0.28 | 0.28 | |
| Net realized and unrealized gains (losses) | (4.10) | 4.68 | 0.56 | 1.28 | (0.45) | |
| Total from investment operations | (3.84) | 4.88 | 0.88 | 1.56 | (0.17) | |
| Less distributions: | ||||||
| Distributions from net investment income | (0.54) | (0.24) | (0.35) | (0.39) | (0.44) | |
| Distributions from net realized gains | (0.81) | (0.36) | (0.90) | (0.83) | (0.26) | |
| Total distributions | (1.35) | (0.60) | (1.25) | (1.22) | (0.70) | |
| Net asset value at end of period | $15.33 | $20.52 | $16.24 | $16.61 | $16.27 | |
| Total return | (20.10%) | 30.57% | 5.31% | 10.90% | (1.17%) | |
| Ratios/Supplemental Data | ||||||
| Ratios to average net assets: | ||||||
| Net operating expenses2 | 0.00% 3 | 0.00% | 0.00% | 0.00% | 0.00% 4 | |
| Gross operating expenses2 | 0.02% 3 | 0.01% | 0.02% | 0.02% | 0.02% | |
| Net investment income (loss) | 1.49% | 1.05% | 2.01% | 1.78% | 1.65% | |
| Portfolio turnover rate | 10% | 14% | 10% | 15% | 17% | |
| Net assets, end of period (x 1,000) | $959,722 | $1,235,538 | $985,325 | $1,011,558 | $961,899 | |
| 1 | Calculated based on the average shares outstanding during the period. |
| 2 | Ratio excludes acquired fund fees and expenses, which are indirect expenses incurred by the fund through its investments in underlying funds. |
| 3 | Ratio includes less than 0.005% of non-routine proxy expenses. |
| 4 | Less than 0.005%; the ratio of net operating expenses would have been 0.00%, if certain non-routine expenses had not been incurred. |
| SECURITY | VALUE AT 10/31/21 | PURCHASES | SALES | REALIZED GAINS (LOSSES) | NET CHANGE IN UNREALIZED APPRECIATION (DEPRECIATION) | VALUE AT 10/31/22 | BALANCE OF SHARES HELD AT 10/31/22 | DISTRIBUTIONS RECEIVED(a) |
| AFFILIATED UNDERLYING FUNDS 75.9% OF NET ASSETS | ||||||||
| U.S. Stocks 40.5% | ||||||||
| Large-Cap 34.3% | ||||||||
| Schwab Core Equity Fund | $91,261,565 | $— | ($22,738,550) | $5,908,447 | ($32,932,221) | $41,499,241 | 2,132,541 | $21,423,043 |
| Schwab Fundamental US Large Company Index Fund | 21,802,800 | 22,053,362 | — | — | (3,204,138) | 40,652,024 | 1,918,453 | 1,032,037 |
| Schwab S&P 500 Index Fund | 246,182,829 | 3,194,050 | (8,700,000) | 432,627 | (38,969,214) | 202,140,292 | 3,367,882 | 3,194,050 |
| Schwab Select Large Cap Growth Fund (formerly Laudus U.S. Large Cap Growth Fund) * | 58,761,596 | 18,186,555 | — | — | (31,772,368) | 45,175,783 | 2,292,023 | 6,974,652 |
| 329,467,340 | ||||||||
| Mid-Cap 1.7% | ||||||||
| Schwab U.S. Mid-Cap Index Fund | 18,965,177 | 542,762 | — | — | (3,794,715) | 15,713,224 | 303,110 | 542,762 |
| Small-Cap 4.5% | ||||||||
| Schwab Small-Cap Equity Fund | 53,945,780 | 5,877,752 | (4,750,000) | (650,588) | (10,997,733) | 43,425,211 | 2,292,778 | 5,877,752 |
| 388,605,775 | ||||||||
| International Stocks 21.3% | ||||||||
| Developed Markets 21.3% | ||||||||
| Schwab International Core Equity Fund | 95,031,438 | 14,047,576 | — | — | (26,040,322) | 83,038,692 | 9,533,719 | 2,673,222 |
| Schwab International Opportunities Fund (formerly Laudus International MarketMasters Fund) | 174,075,204 | 34,671,003 | — | — | (87,319,701) | 121,426,506 | 7,189,254 | 24,908,114 |
| 204,465,198 | ||||||||
| Real Estate 5.3% | ||||||||
| Global Real Estate 5.3% | ||||||||
| Schwab Global Real Estate Fund | 51,681,449 | 17,580,113 | — | — | (18,046,496) | 51,215,066 | 8,680,520 | 1,720,968 |
| Fixed Income 8.3% | ||||||||
| Intermediate-Term Bond 6.1% | ||||||||
| Schwab U.S. Aggregate Bond Index Fund | 75,697,757 | 1,562,542 | (5,779,804) | (792,854) | (12,261,313) | 58,426,328 | 6,793,759 | 1,562,051 |
| Short-Term Bond 2.2% | ||||||||
| Schwab Short-Term Bond Index Fund | 26,529,002 | 360,353 | (3,757,024) | (151,023) | (1,922,130) | 21,059,178 | 2,259,568 | 360,238 |
| 79,485,506 | ||||||||
| Money Market Funds 0.5% | ||||||||
| Schwab Variable Share Price Money Fund, Ultra Shares, 3.10% (b) | 4,878,097 | 42,014 | (116) | — | (1,466) | 4,918,529 | 4,918,529 | 48,061 |
| Total Affiliated Underlying Funds (Cost $624,999,475) | $918,812,694 | $118,118,082 | ($45,725,494) | $4,746,609 | ($267,261,817) | $728,690,074 | $70,316,950 | |
| SECURITY | VALUE AT 10/31/21 | PURCHASES | SALES | REALIZED GAINS (LOSSES) | NET CHANGE IN UNREALIZED APPRECIATION (DEPRECIATION) | VALUE AT 10/31/22 | BALANCE OF SHARES HELD AT 10/31/22 | DISTRIBUTIONS RECEIVED(a) |
| UNAFFILIATED UNDERLYING FUNDS 23.4% OF NET ASSETS | ||||||||
| U.S. Stocks 12.6% | ||||||||
| Large-Cap 10.9% | ||||||||
| ClearBridge Large Cap Growth Fund, Class IS * | $40,924,172 | 802,277 | ||||||
| Dodge & Cox Stock Fund, Class I | 62,943,069 | 285,223 | ||||||
| 103,867,241 | ||||||||
| Small-Cap 1.7% | ||||||||
| ClearBridge Small Cap Growth Fund, Class IS * | 16,447,673 | 430,117 | ||||||
| 120,314,914 | ||||||||
| International Stocks 2.7% | ||||||||
| Emerging Markets 2.7% | ||||||||
| Goldman Sachs Emerging Markets Equity Insights Fund, Institutional Class | 26,056,843 | 3,803,919 | ||||||
| Fixed Income 8.1% | ||||||||
| Intermediate-Term Bond 5.6% | ||||||||
| Baird Aggregate Bond Fund, Institutional Class | 9,014,164 | 967,185 | ||||||
| Loomis Sayles Investment Grade Bond Fund, Class Y | 28,461,003 | 3,024,549 | ||||||
| Western Asset Core Plus Bond Fund, Class I | 16,560,801 | 1,836,009 | ||||||
| 54,035,968 | ||||||||
| International Bond 2.5% | ||||||||
| PIMCO International Bond Fund (U.S. Dollar-Hedged), Institutional Class | 23,904,493 | 2,513,617 | ||||||
| 77,940,461 | ||||||||
| Total Unaffiliated Underlying Funds (Cost $240,004,289) | $224,312,218 | |||||||
| Total Investments in Securities (Cost $865,003,764) | $953,002,292 | |||||||
| * | Non-income producing security. |
| (a) | Distributions received include distributions from net investment income and capital gains, if any, from the underlying funds. Amounts shown are only presented for affiliated underlying funds, which are presented in the corresponding line-item in the Statement of Operations, if applicable (See financial note 2(d) for additional information). |
| (b) | The rate shown is the annualized 7-day yield. |
| Assets | ||
| Investments in securities, at value - affiliated (cost $624,999,475) | $728,690,074 | |
| Investments in securities, at value - unaffiliated (cost $240,004,289) | 224,312,218 | |
| Cash | 5,706,746 | |
| Receivables: | ||
| Investments sold | 1,700,000 | |
| Fund shares sold | 328,922 | |
| Dividends | 267,674 | |
| Due from investment adviser | 10,664 | |
| Interest | 7,836 | |
| Prepaid expenses | + | 15,921 |
| Total assets | 961,040,055 | |
| Liabilities | ||
| Payables: | ||
| Fund shares redeemed | 981,142 | |
| Investments bought | 262,653 | |
| Independent trustees’ fees | 46 | |
| Accrued expenses | + | 74,385 |
| Total liabilities | 1,318,226 | |
| Net assets | $959,721,829 | |
| Net Assets by Source | ||
| Capital received from investors | $816,097,710 | |
| Total distributable earnings | + | 143,624,119 |
| Net assets | $959,721,829 | |
| Net Asset Value (NAV) | ||||
| Net Assets | ÷ | Shares Outstanding | = | NAV |
| $959,721,829 | 62,613,531 | $15.33 | ||
| For the period November 1, 2021 through October 31, 2022 | ||
| Investment Income | ||
| Dividends received from securities - affiliated | $12,284,603 | |
| Dividends received from securities - unaffiliated | 4,057,653 | |
| Interest received from securities - unaffiliated | + | 34,375 |
| Total investment income | 16,376,631 | |
| Expenses | ||
| Proxy fees1 | 50,877 | |
| Registration fees | 34,967 | |
| Portfolio accounting fees | 33,570 | |
| Shareholder reports | 29,264 | |
| Professional fees | 23,603 | |
| Independent trustees’ fees | 9,787 | |
| Transfer agent fees | 4,031 | |
| Custodian fees | 1,278 | |
| Other expenses | + | 14,596 |
| Total expenses | 201,973 | |
| Expense reduction | – | 151,096 |
| Net expenses | – | 50,877 |
| Net investment income | 16,325,754 | |
| REALIZED AND UNREALIZED GAINS (LOSSES) | ||
| Realized capital gain distributions received from underlying funds - affiliated | 58,032,347 | |
| Realized capital gain distributions received from underlying funds - unaffiliated | 13,733,859 | |
| Net realized gains on sales of securities - affiliated | 4,746,609 | |
| Net realized losses on sales of securities - unaffiliated | + | (1,831,953) |
| Net realized gains | 74,680,862 | |
| Net change in unrealized appreciation (depreciation) on securities - affiliated | (267,261,817) | |
| Net change in unrealized appreciation (depreciation) on securities - unaffiliated | + | (70,063,178) |
| Net change in unrealized appreciation (depreciation) | + | (337,324,995) |
| Net realized and unrealized losses | (262,644,133) | |
| Decrease in net assets resulting from operations | ($246,318,379) | |
| 1 | Proxy fees are non-routine expenses (see financial note 4 for additional information). |
| OPERATIONS | |||
| 11/1/21-10/31/22 | 11/1/20-10/31/21 | ||
| Net investment income | $16,325,754 | $12,284,342 | |
| Net realized gains | 74,680,862 | 51,396,989 | |
| Net change in unrealized appreciation (depreciation) | + | (337,324,995) | 234,058,424 |
| Increase (decrease) in net assets resulting from operations | ($246,318,379) | $297,739,755 | |
| DISTRIBUTIONS TO SHAREHOLDERS | |||
| Total distributions | ($81,174,869) | ($36,450,563) | |
| TRANSACTIONS IN FUND SHARES | |||||
| 11/1/21-10/31/22 | 11/1/20-10/31/21 | ||||
| SHARES | VALUE | SHARES | VALUE | ||
| Shares sold | 4,935,695 | $87,389,811 | 7,151,395 | $135,282,209 | |
| Shares reinvested | 4,103,345 | 79,686,963 | 1,997,627 | 35,757,521 | |
| Shares redeemed | + | (6,646,804) | (115,399,889) | (9,615,839) | (182,116,086) |
| Net transactions in fund shares | 2,392,236 | $51,676,885 | (466,817) | ($11,076,356) | |
| SHARES OUTSTANDING AND NET ASSETS | |||||
| 11/1/21-10/31/22 | 11/1/20-10/31/21 | ||||
| SHARES | NET ASSETS | SHARES | NET ASSETS | ||
| Beginning of period | 60,221,295 | $1,235,538,192 | 60,688,112 | $985,325,356 | |
| Total increase (decrease) | + | 2,392,236 | (275,816,363) | (466,817) | 250,212,836 |
| End of period | 62,613,531 | $959,721,829 | 60,221,295 | $1,235,538,192 | |
| 11/1/21– 10/31/22 | 11/1/20– 10/31/21 | 11/1/19– 10/31/20 | 11/1/18– 10/31/19 | 11/1/17– 10/31/18 | ||
| Per-Share Data | ||||||
| Net asset value at beginning of period | $17.97 | $13.83 | $13.88 | $13.35 | $13.92 | |
| Income (loss) from investment operations: | ||||||
| Net investment income (loss)1 | 0.22 | 0.16 | 0.25 | 0.22 | 0.21 | |
| Net realized and unrealized gains (losses) | (3.76) | 4.36 | 0.46 | 1.09 | (0.39) | |
| Total from investment operations | (3.54) | 4.52 | 0.71 | 1.31 | (0.18) | |
| Less distributions: | ||||||
| Distributions from net investment income | (0.49) | (0.18) | (0.28) | (0.31) | (0.36) | |
| Distributions from net realized gains | (0.40) | (0.20) | (0.48) | (0.47) | (0.03) | |
| Total distributions | (0.89) | (0.38) | (0.76) | (0.78) | (0.39) | |
| Net asset value at end of period | $13.54 | $17.97 | $13.83 | $13.88 | $13.35 | |
| Total return | (20.76%) | 33.13% | 5.10% | 10.91% | (1.43%) | |
| Ratios/Supplemental Data | ||||||
| Ratios to average net assets: | ||||||
| Net operating expenses2 | 0.00% 3 | 0.00% | 0.00% | 0.00% | 0.00% 4 | |
| Gross operating expenses2 | 0.05% 3 | 0.04% | 0.05% | 0.08% | 0.06% | |
| Net investment income (loss) | 1.46% | 0.96% | 1.87% | 1.65% | 1.52% | |
| Portfolio turnover rate | 7% | 12% | 6% | 8% | 12% | |
| Net assets, end of period (x 1,000) | $206,203 | $252,294 | $177,992 | $162,017 | $138,813 | |
| 1 | Calculated based on the average shares outstanding during the period. |
| 2 | Ratio excludes acquired fund fees and expenses, which are indirect expenses incurred by the fund through its investments in underlying funds. |
| 3 | Ratio includes less than 0.005% of non-routine proxy expenses. |
| 4 | Less than 0.005%; the ratio of net operating expenses would have been 0.00%, if certain non-routine expenses had not been incurred. |
| SECURITY | VALUE AT 10/31/21 | PURCHASES | SALES | REALIZED GAINS (LOSSES) | NET CHANGE IN UNREALIZED APPRECIATION (DEPRECIATION) | VALUE AT 10/31/22 | BALANCE OF SHARES HELD AT 10/31/22 | DISTRIBUTIONS RECEIVED(a) |
| AFFILIATED UNDERLYING FUNDS 77.6% OF NET ASSETS | ||||||||
| U.S. Stocks 43.9% | ||||||||
| Large-Cap 36.7% | ||||||||
| Schwab Core Equity Fund | $19,914,426 | $— | ($4,845,615) | $137,455 | ($6,057,734) | $9,148,532 | 470,120 | $4,674,778 |
| Schwab Fundamental US Large Company Index Fund | 6,691,733 | 4,440,638 | — | — | (810,815) | 10,321,556 | 487,096 | 316,754 |
| Schwab S&P 500 Index Fund | 50,570,503 | 656,117 | (400,000) | (49,384) | (7,981,258) | 42,795,978 | 713,029 | 656,117 |
| Schwab Select Large Cap Growth Fund (formerly Laudus U.S. Large Cap Growth Fund) * | 15,029,286 | 7,027,605 | — | — | (8,599,145) | 13,457,746 | 682,788 | 1,783,887 |
| 75,723,812 | ||||||||
| Mid-Cap 1.7% | ||||||||
| Schwab U.S. Mid-Cap Index Fund | 4,191,025 | 119,942 | — | — | (838,576) | 3,472,391 | 66,983 | 119,942 |
| Small-Cap 5.5% | ||||||||
| Schwab Small-Cap Equity Fund | 12,082,130 | 1,844,224 | — | — | (2,580,857) | 11,345,497 | 599,023 | 1,316,429 |
| 90,541,700 | ||||||||
| International Stocks 23.1% | ||||||||
| Developed Markets 23.1% | ||||||||
| Schwab International Core Equity Fund | 22,705,478 | 2,323,952 | — | — | (6,078,324) | 18,951,106 | 2,175,787 | 643,952 |
| Schwab International Opportunities Fund (formerly Laudus International MarketMasters Fund) | 37,401,355 | 10,789,802 | — | — | (19,426,876) | 28,764,281 | 1,703,036 | 5,478,467 |
| 47,715,387 | ||||||||
| Real Estate 5.7% | ||||||||
| Global Real Estate 5.7% | ||||||||
| Schwab Global Real Estate Fund | 11,378,442 | 4,659,841 | — | — | (4,219,649) | 11,818,634 | 2,003,158 | 396,915 |
| Fixed Income 4.7% | ||||||||
| Intermediate-Term Bond 3.4% | ||||||||
| Schwab U.S. Aggregate Bond Index Fund | 9,548,183 | 183,657 | (1,270,000) | (83,922) | (1,451,172) | 6,926,746 | 805,436 | 183,595 |
| Short-Term Bond 1.3% | ||||||||
| Schwab Short-Term Bond Index Fund | 3,248,739 | 47,876 | (329,999) | (36,462) | (243,099) | 2,687,055 | 288,311 | 47,863 |
| 9,613,801 | ||||||||
| Money Market Funds 0.2% | ||||||||
| Schwab Variable Share Price Money Fund, Ultra Shares, 3.10% (b) | 425,417 | 3,664 | (10) | — | (128) | 428,943 | 428,943 | 4,191 |
| Total Affiliated Underlying Funds (Cost $162,776,180) | $193,186,717 | $32,097,318 | ($6,845,624) | ($32,313) | ($58,287,633) | $160,118,465 | $15,622,890 | |
| SECURITY | VALUE AT 10/31/21 | PURCHASES | SALES | REALIZED GAINS (LOSSES) | NET CHANGE IN UNREALIZED APPRECIATION (DEPRECIATION) | VALUE AT 10/31/22 | BALANCE OF SHARES HELD AT 10/31/22 | DISTRIBUTIONS RECEIVED(a) |
| UNAFFILIATED UNDERLYING FUNDS 21.7% OF NET ASSETS | ||||||||
| U.S. Stocks 12.1% | ||||||||
| Large-Cap 10.4% | ||||||||
| ClearBridge Large Cap Growth Fund, Class IS * | $7,049,467 | 138,198 | ||||||
| Dodge & Cox Stock Fund, Class I | 14,361,388 | 65,078 | ||||||
| 21,410,855 | ||||||||
| Small-Cap 1.7% | ||||||||
| ClearBridge Small Cap Growth Fund, Class IS * | 3,453,020 | 90,299 | ||||||
| 24,863,875 | ||||||||
| International Stocks 3.4% | ||||||||
| Emerging Markets 3.4% | ||||||||
| Goldman Sachs Emerging Markets Equity Insights Fund, Institutional Class | 6,952,100 | 1,014,905 | ||||||
| Fixed Income 6.2% | ||||||||
| Intermediate-Term Bond 4.5% | ||||||||
| Baird Aggregate Bond Fund, Institutional Class | 1,892,739 | 203,084 | ||||||
| Loomis Sayles Investment Grade Bond Fund, Class Y | 5,319,276 | 565,279 | ||||||
| Western Asset Core Plus Bond Fund, Class I | 2,161,547 | 239,639 | ||||||
| 9,373,562 | ||||||||
| International Bond 1.7% | ||||||||
| PIMCO International Bond Fund (U.S. Dollar-Hedged), Institutional Class | 3,505,098 | 368,570 | ||||||
| 12,878,660 | ||||||||
| Total Unaffiliated Underlying Funds (Cost $48,251,531) | $44,694,635 | |||||||
| Total Investments in Securities (Cost $211,027,711) | $204,813,100 | |||||||
| * | Non-income producing security. |
| (a) | Distributions received include distributions from net investment income and capital gains, if any, from the underlying funds. Amounts shown are only presented for affiliated underlying funds, which are presented in the corresponding line-item in the Statement of Operations, if applicable (See financial note 2(d) for additional information). |
| (b) | The rate shown is the annualized 7-day yield. |
| Assets | ||
| Investments in securities, at value - affiliated (cost $162,776,180) | $160,118,465 | |
| Investments in securities, at value - unaffiliated (cost $48,251,531) | 44,694,635 | |
| Cash | 974,743 | |
| Receivables: | ||
| Investments sold | 330,000 | |
| Fund shares sold | 294,659 | |
| Dividends | 33,986 | |
| Due from investment adviser | 9,294 | |
| Interest | 1,594 | |
| Prepaid expenses | + | 5,936 |
| Total assets | 206,463,312 | |
| Liabilities | ||
| Payables: | ||
| Fund shares redeemed | 175,989 | |
| Investments bought | 33,619 | |
| Independent trustees’ fees | 35 | |
| Accrued expenses | + | 50,470 |
| Total liabilities | 260,113 | |
| Net assets | $206,203,199 | |
| Net Assets by Source | ||
| Capital received from investors | $199,945,725 | |
| Total distributable earnings | + | 6,257,474 |
| Net assets | $206,203,199 | |
| Net Asset Value (NAV) | ||||
| Net Assets | ÷ | Shares Outstanding | = | NAV |
| $206,203,199 | 15,231,148 | $13.54 | ||
| For the period November 1, 2021 through October 31, 2022 | ||
| Investment Income | ||
| Dividends received from securities - affiliated | $2,575,016 | |
| Dividends received from securities - unaffiliated | 781,488 | |
| Interest received from securities - unaffiliated | + | 7,421 |
| Total investment income | 3,363,925 | |
| Expenses | ||
| Registration fees | 26,605 | |
| Portfolio accounting fees | 23,382 | |
| Professional fees | 21,919 | |
| Shareholder reports | 11,421 | |
| Proxy fees1 | 10,587 | |
| Independent trustees’ fees | 7,383 | |
| Transfer agent fees | 3,309 | |
| Custodian fees | 1,649 | |
| Other expenses | + | 6,552 |
| Total expenses | 112,807 | |
| Expense reduction | – | 102,220 |
| Net expenses | – | 10,587 |
| Net investment income | 3,353,338 | |
| REALIZED AND UNREALIZED GAINS (LOSSES) | ||
| Realized capital gain distributions received from underlying funds - affiliated | 13,047,874 | |
| Realized capital gain distributions received from underlying funds - unaffiliated | 3,152,671 | |
| Net realized losses on sales of securities - affiliated | (32,313) | |
| Net realized losses on sales of securities - unaffiliated | + | (360,904) |
| Net realized gains | 15,807,328 | |
| Net change in unrealized appreciation (depreciation) on securities - affiliated | (58,287,633) | |
| Net change in unrealized appreciation (depreciation) on securities - unaffiliated | + | (14,314,504) |
| Net change in unrealized appreciation (depreciation) | + | (72,602,137) |
| Net realized and unrealized losses | (56,794,809) | |
| Decrease in net assets resulting from operations | ($53,441,471) | |
| 1 | Proxy fees are non-routine expenses (see financial note 4 for additional information). |
| OPERATIONS | |||
| 11/1/21-10/31/22 | 11/1/20-10/31/21 | ||
| Net investment income | $3,353,338 | $2,164,292 | |
| Net realized gains | 15,807,328 | 5,977,920 | |
| Net change in unrealized appreciation (depreciation) | + | (72,602,137) | 51,929,106 |
| Increase (decrease) in net assets resulting from operations | ($53,441,471) | $60,071,318 | |
| DISTRIBUTIONS TO SHAREHOLDERS | |||
| Total distributions | ($12,672,803) | ($4,963,016) | |
| TRANSACTIONS IN FUND SHARES | |||||
| 11/1/21-10/31/22 | 11/1/20-10/31/21 | ||||
| SHARES | VALUE | SHARES | VALUE | ||
| Shares sold | 2,459,577 | $38,547,342 | 3,403,163 | $56,732,083 | |
| Shares reinvested | 714,175 | 12,369,502 | 312,568 | 4,851,051 | |
| Shares redeemed | + | (1,981,375) | (30,893,311) | (2,547,667) | (42,389,208) |
| Net transactions in fund shares | 1,192,377 | $20,023,533 | 1,168,064 | $19,193,926 | |
| SHARES OUTSTANDING AND NET ASSETS | |||||
| 11/1/21-10/31/22 | 11/1/20-10/31/21 | ||||
| SHARES | NET ASSETS | SHARES | NET ASSETS | ||
| Beginning of period | 14,038,771 | $252,293,940 | 12,870,707 | $177,991,712 | |
| Total increase (decrease) | + | 1,192,377 | (46,090,741) | 1,168,064 | 74,302,228 |
| End of period | 15,231,148 | $206,203,199 | 14,038,771 | $252,293,940 | |
| 11/1/21– 10/31/22 | 11/1/20– 10/31/21 | 11/1/19– 10/31/20 | 11/1/18– 10/31/19 | 11/1/17– 10/31/18 | ||
| Per-Share Data | ||||||
| Net asset value at beginning of period | $18.48 | $14.03 | $14.03 | $13.49 | $14.07 | |
| Income (loss) from investment operations: | ||||||
| Net investment income (loss)1 | 0.22 | 0.16 | 0.25 | 0.21 | 0.21 | |
| Net realized and unrealized gains (losses) | (3.90) | 4.66 | 0.45 | 1.11 | (0.41) | |
| Total from investment operations | (3.68) | 4.82 | 0.70 | 1.32 | (0.20) | |
| Less distributions: | ||||||
| Distributions from net investment income | (0.53) | (0.17) | (0.27) | (0.31) | (0.36) | |
| Distributions from net realized gains | (0.53) | (0.20) | (0.43) | (0.47) | (0.02) | |
| Total distributions | (1.06) | (0.37) | (0.70) | (0.78) | (0.38) | |
| Net asset value at end of period | $13.74 | $18.48 | $14.03 | $14.03 | $13.49 | |
| Total return | (21.22%) | 34.83% | 4.96% | 10.87% | (1.50%) | |
| Ratios/Supplemental Data | ||||||
| Ratios to average net assets: | ||||||
| Net operating expenses2 | 0.00% 3 | 0.00% | 0.00% | 0.00% | 0.00% 4 | |
| Gross operating expenses2 | 0.05% 3 | 0.04% | 0.06% | 0.08% | 0.07% | |
| Net investment income (loss) | 1.44% | 0.93% | 1.83% | 1.54% | 1.45% | |
| Portfolio turnover rate | 6% | 19% | 5% | 7% | 10% | |
| Net assets, end of period (x 1,000) | $203,896 | $245,059 | $181,391 | $161,003 | $122,459 | |
| 1 | Calculated based on the average shares outstanding during the period. |
| 2 | Ratio excludes acquired fund fees and expenses, which are indirect expenses incurred by the fund through its investments in underlying funds. |
| 3 | Ratio includes less than 0.005% of non-routine proxy expenses. |
| 4 | Less than 0.005%; the ratio of net operating expenses would have been 0.00%, if certain non-routine expenses had not been incurred. |
| SECURITY | VALUE AT 10/31/21 | PURCHASES | SALES | REALIZED GAINS (LOSSES) | NET CHANGE IN UNREALIZED APPRECIATION (DEPRECIATION) | VALUE AT 10/31/22 | BALANCE OF SHARES HELD AT 10/31/22 | DISTRIBUTIONS RECEIVED(a) |
| AFFILIATED UNDERLYING FUNDS 79.5% OF NET ASSETS | ||||||||
| U.S. Stocks 45.3% | ||||||||
| Large-Cap 37.7% | ||||||||
| Schwab Core Equity Fund | $20,714,110 | $— | ($5,228,355) | $157,179 | ($6,286,788) | $9,356,146 | 480,789 | $4,862,499 |
| Schwab Fundamental US Large Company Index Fund | 7,501,204 | 4,338,486 | — | — | (901,805) | 10,937,885 | 516,181 | 355,069 |
| Schwab S&P 500 Index Fund | 49,586,015 | 643,345 | (1,190,000) | (124,119) | (7,703,572) | 41,211,669 | 686,632 | 643,345 |
| Schwab Select Large Cap Growth Fund (formerly Laudus U.S. Large Cap Growth Fund) * | 16,862,105 | 8,078,331 | — | — | (9,633,666) | 15,306,770 | 776,599 | 2,001,431 |
| 76,812,470 | ||||||||
| Mid-Cap 1.7% | ||||||||
| Schwab U.S. Mid-Cap Index Fund | 3,962,121 | 392,226 | — | — | (823,331) | 3,531,016 | 68,114 | 113,391 |
| Small-Cap 5.9% | ||||||||
| Schwab Small-Cap Equity Fund | 12,824,393 | 1,877,303 | — | — | (2,724,169) | 11,977,527 | 632,393 | 1,397,303 |
| 92,321,013 | ||||||||
| International Stocks 24.6% | ||||||||
| Developed Markets 24.6% | ||||||||
| Schwab International Core Equity Fund | 22,597,338 | 4,180,268 | — | — | (6,353,624) | 20,423,982 | 2,344,889 | 655,269 |
| Schwab International Opportunities Fund (formerly Laudus International MarketMasters Fund) | 38,092,718 | 11,440,451 | — | — | (19,896,601) | 29,636,568 | 1,754,681 | 5,549,543 |
| 50,060,550 | ||||||||
| Real Estate 6.1% | ||||||||
| Global Real Estate 6.1% | ||||||||
| Schwab Global Real Estate Fund | 11,579,737 | 5,344,429 | (200,000) | (31,841) | (4,270,425) | 12,421,900 | 2,105,407 | 406,604 |
| Fixed Income 3.5% | ||||||||
| Intermediate-Term Bond 2.7% | ||||||||
| Schwab U.S. Aggregate Bond Index Fund | 6,018,149 | 1,090,265 | (440,000) | (36,924) | (1,042,988) | 5,588,502 | 649,826 | 130,225 |
| Short-Term Bond 0.8% | ||||||||
| Schwab Short-Term Bond Index Fund | 1,920,368 | 530,597 | (620,000) | (60,357) | (119,507) | 1,651,101 | 177,157 | 30,587 |
| 7,239,603 | ||||||||
| Money Market Funds 0.0% | ||||||||
| Schwab Variable Share Price Money Fund, Ultra Shares, 3.10% (b) | 28,055 | 240 | — | — | (8) | 28,287 | 28,287 | 276 |
| Total Affiliated Underlying Funds (Cost $165,737,191) | $191,686,313 | $37,915,941 | ($7,678,355) | ($96,062) | ($59,756,484) | $162,071,353 | $16,145,542 | |
| SECURITY | VALUE AT 10/31/21 | PURCHASES | SALES | REALIZED GAINS (LOSSES) | NET CHANGE IN UNREALIZED APPRECIATION (DEPRECIATION) | VALUE AT 10/31/22 | BALANCE OF SHARES HELD AT 10/31/22 | DISTRIBUTIONS RECEIVED(a) |
| UNAFFILIATED UNDERLYING FUNDS 19.9% OF NET ASSETS | ||||||||
| U.S. Stocks 11.8% | ||||||||
| Large-Cap 9.9% | ||||||||
| ClearBridge Large Cap Growth Fund, Class IS * | $5,945,323 | 116,552 | ||||||
| Dodge & Cox Stock Fund, Class I | 14,145,799 | 64,101 | ||||||
| 20,091,122 | ||||||||
| Small-Cap 1.9% | ||||||||
| ClearBridge Small Cap Growth Fund, Class IS * | 3,895,006 | 101,857 | ||||||
| 23,986,128 | ||||||||
| International Stocks 4.1% | ||||||||
| Emerging Markets 4.1% | ||||||||
| Goldman Sachs Emerging Markets Equity Insights Fund, Institutional Class | 8,422,505 | 1,229,563 | ||||||
| Fixed Income 4.0% | ||||||||
| Intermediate-Term Bond 2.7% | ||||||||
| Loomis Sayles Investment Grade Bond Fund, Class Y | 3,806,184 | 404,483 | ||||||
| Western Asset Core Plus Bond Fund, Class I | 1,773,376 | 196,605 | ||||||
| 5,579,560 | ||||||||
| International Bond 1.3% | ||||||||
| PIMCO International Bond Fund (U.S. Dollar-Hedged), Institutional Class | 2,556,387 | 268,810 | ||||||
| 8,135,947 | ||||||||
| Total Unaffiliated Underlying Funds (Cost $43,884,031) | $40,544,580 | |||||||
| Total Investments in Securities (Cost $209,621,222) | $202,615,933 | |||||||
| * | Non-income producing security. |
| (a) | Distributions received include distributions from net investment income and capital gains, if any, from the underlying funds. Amounts shown are only presented for affiliated underlying funds, which are presented in the corresponding line-item in the Statement of Operations, if applicable (See financial note 2(d) for additional information). |
| (b) | The rate shown is the annualized 7-day yield. |
| Assets | ||
| Investments in securities, at value - affiliated (cost $165,737,191) | $162,071,353 | |
| Investments in securities, at value - unaffiliated (cost $43,884,031) | 40,544,580 | |
| Cash | 705,937 | |
| Receivables: | ||
| Investments sold | 620,000 | |
| Fund shares sold | 160,267 | |
| Dividends | 26,302 | |
| Due from investment adviser | 9,502 | |
| Interest | 1,977 | |
| Prepaid expenses | + | 5,093 |
| Total assets | 204,145,011 | |
| Liabilities | ||
| Payables: | ||
| Fund shares redeemed | 170,706 | |
| Investments bought | 26,395 | |
| Independent trustees’ fees | 35 | |
| Accrued expenses | + | 51,990 |
| Total liabilities | 249,126 | |
| Net assets | $203,895,885 | |
| Net Assets by Source | ||
| Capital received from investors | $198,097,778 | |
| Total distributable earnings | + | 5,798,107 |
| Net assets | $203,895,885 | |
| Net Asset Value (NAV) | ||||
| Net Assets | ÷ | Shares Outstanding | = | NAV |
| $203,895,885 | 14,840,935 | $13.74 | ||
| For the period November 1, 2021 through October 31, 2022 | ||
| Investment Income | ||
| Dividends received from securities - affiliated | $2,537,933 | |
| Dividends received from securities - unaffiliated | 702,383 | |
| Interest received from securities - unaffiliated | + | 7,382 |
| Total investment income | 3,247,698 | |
| Expenses | ||
| Registration fees | 25,382 | |
| Portfolio accounting fees | 23,207 | |
| Professional fees | 21,909 | |
| Shareholder reports | 13,318 | |
| Proxy fees1 | 10,387 | |
| Independent trustees’ fees | 7,371 | |
| Transfer agent fees | 3,519 | |
| Custodian fees | 1,030 | |
| Other expenses | + | 6,492 |
| Total expenses | 112,615 | |
| Expense reduction | – | 102,228 |
| Net expenses | – | 10,387 |
| Net investment income | 3,237,311 | |
| REALIZED AND UNREALIZED GAINS (LOSSES) | ||
| Realized capital gain distributions received from underlying funds - affiliated | 13,607,609 | |
| Realized capital gain distributions received from underlying funds - unaffiliated | 3,331,104 | |
| Net realized losses on sales of securities - affiliated | (96,062) | |
| Net realized losses on sales of securities - unaffiliated | + | (263,349) |
| Net realized gains | 16,579,302 | |
| Net change in unrealized appreciation (depreciation) on securities - affiliated | (59,756,484) | |
| Net change in unrealized appreciation (depreciation) on securities - unaffiliated | + | (13,896,515) |
| Net change in unrealized appreciation (depreciation) | + | (73,652,999) |
| Net realized and unrealized losses | (57,073,697) | |
| Decrease in net assets resulting from operations | ($53,836,386) | |
| 1 | Proxy fees are non-routine expenses (see financial note 4 for additional information). |
| OPERATIONS | |||
| 11/1/21-10/31/22 | 11/1/20-10/31/21 | ||
| Net investment income | $3,237,311 | $2,054,026 | |
| Net realized gains | 16,579,302 | 7,389,566 | |
| Net change in unrealized appreciation (depreciation) | + | (73,652,999) | 53,519,263 |
| Increase (decrease) in net assets resulting from operations | ($53,836,386) | $62,962,855 | |
| DISTRIBUTIONS TO SHAREHOLDERS | |||
| Total distributions | ($14,164,921) | ($4,905,042) | |
| TRANSACTIONS IN FUND SHARES | |||||
| 11/1/21-10/31/22 | 11/1/20-10/31/21 | ||||
| SHARES | VALUE | SHARES | VALUE | ||
| Shares sold | 2,707,954 | $42,898,468 | 3,400,099 | $58,030,659 | |
| Shares reinvested | 779,861 | 13,787,936 | 302,276 | 4,791,072 | |
| Shares redeemed | + | (1,908,268) | (29,847,949) | (3,366,800) | (57,211,988) |
| Net transactions in fund shares | 1,579,547 | $26,838,455 | 335,575 | $5,609,743 | |
| SHARES OUTSTANDING AND NET ASSETS | |||||
| 11/1/21-10/31/22 | 11/1/20-10/31/21 | ||||
| SHARES | NET ASSETS | SHARES | NET ASSETS | ||
| Beginning of period | 13,261,388 | $245,058,737 | 12,925,813 | $181,391,181 | |
| Total increase (decrease) | + | 1,579,547 | (41,162,852) | 335,575 | 63,667,556 |
| End of period | 14,840,935 | $203,895,885 | 13,261,388 | $245,058,737 | |
| 11/1/21– 10/31/22 | 11/1/20– 10/31/21 | 11/1/19– 10/31/20 | 11/1/18– 10/31/19 | 11/1/17– 10/31/18 | ||
| Per-Share Data | ||||||
| Net asset value at beginning of period | $18.74 | $14.11 | $14.15 | $13.60 | $14.18 | |
| Income (loss) from investment operations: | ||||||
| Net investment income (loss)1 | 0.23 | 0.15 | 0.24 | 0.21 | 0.20 | |
| Net realized and unrealized gains (losses) | (4.05) | 4.83 | 0.45 | 1.10 | (0.39) | |
| Total from investment operations | (3.82) | 4.98 | 0.69 | 1.31 | (0.19) | |
| Less distributions: | ||||||
| Distributions from net investment income | (0.54) | (0.16) | (0.27) | (0.31) | (0.37) | |
| Distributions from net realized gains | (0.41) | (0.19) | (0.46) | (0.45) | (0.02) | |
| Total distributions | (0.95) | (0.35) | (0.73) | (0.76) | (0.39) | |
| Net asset value at end of period | $13.97 | $18.74 | $14.11 | $14.15 | $13.60 | |
| Total return | (21.54%) | 35.79% | 4.86% | 10.73% | (1.49%) | |
| Ratios/Supplemental Data | ||||||
| Ratios to average net assets: | ||||||
| Net operating expenses2 | 0.00% 3 | 0.00% | 0.00% | 0.00% | 0.00% 4 | |
| Gross operating expenses2 | 0.07% 3 | 0.06% | 0.09% | 0.13% | 0.11% | |
| Net investment income (loss) | 1.43% | 0.88% | 1.78% | 1.53% | 1.41% | |
| Portfolio turnover rate | 4% | 11% | 6% | 6% | 10% | |
| Net assets, end of period (x 1,000) | $135,741 | $158,223 | $107,401 | $93,743 | $73,259 | |
| 1 | Calculated based on the average shares outstanding during the period. |
| 2 | Ratio excludes acquired fund fees and expenses, which are indirect expenses incurred by the fund through its investments in underlying funds. |
| 3 | Ratio includes less than 0.005% of non-routine proxy expenses. |
| 4 | Less than 0.005%; the ratio of net operating expenses would have been 0.00%, if certain non-routine expenses had not been incurred. |
| SECURITY | VALUE AT 10/31/21 | PURCHASES | SALES | REALIZED GAINS (LOSSES) | NET CHANGE IN UNREALIZED APPRECIATION (DEPRECIATION) | VALUE AT 10/31/22 | BALANCE OF SHARES HELD AT 10/31/22 | DISTRIBUTIONS RECEIVED(a) |
| AFFILIATED UNDERLYING FUNDS 79.8% OF NET ASSETS | ||||||||
| U.S. Stocks 45.9% | ||||||||
| Large-Cap 38.2% | ||||||||
| Schwab Core Equity Fund | $13,228,444 | $— | ($3,026,432) | $63,899 | ($4,025,565) | $6,240,346 | 320,676 | $3,105,288 |
| Schwab Fundamental US Large Company Index Fund | 5,397,376 | 2,747,029 | — | — | (636,071) | 7,508,334 | 354,334 | 255,485 |
| Schwab S&P 500 Index Fund | 31,762,806 | 412,099 | — | — | (5,060,136) | 27,114,769 | 451,762 | 412,099 |
| Schwab Select Large Cap Growth Fund (formerly Laudus U.S. Large Cap Growth Fund) * | 12,058,925 | 5,944,008 | — | — | (6,994,178) | 11,008,755 | 558,537 | 1,431,322 |
| 51,872,204 | ||||||||
| Mid-Cap 1.7% | ||||||||
| Schwab U.S. Mid-Cap Index Fund | 2,744,354 | 78,541 | — | — | (549,114) | 2,273,781 | 43,862 | 78,541 |
| Small-Cap 6.0% | ||||||||
| Schwab Small-Cap Equity Fund | 8,858,802 | 1,265,226 | — | — | (1,904,195) | 8,219,833 | 433,993 | 965,225 |
| 62,365,818 | ||||||||
| International Stocks 25.1% | ||||||||
| Developed Markets 25.1% | ||||||||
| Schwab International Core Equity Fund | 14,639,313 | 3,681,667 | — | — | (4,251,647) | 14,069,333 | 1,615,308 | 461,667 |
| Schwab International Opportunities Fund (formerly Laudus International MarketMasters Fund) | 25,342,418 | 7,982,091 | — | — | (13,268,731) | 20,055,778 | 1,187,435 | 3,692,079 |
| 34,125,111 | ||||||||
| Real Estate 6.3% | ||||||||
| Global Real Estate 6.3% | ||||||||
| Schwab Global Real Estate Fund | 7,795,440 | 3,618,201 | — | — | (2,893,226) | 8,520,415 | 1,444,138 | 271,651 |
| Fixed Income 2.5% | ||||||||
| Intermediate-Term Bond 1.6% | ||||||||
| Schwab U.S. Aggregate Bond Index Fund | 2,564,999 | 451,527 | (399,999) | (19,506) | (398,196) | 2,198,825 | 255,677 | 51,511 |
| Short-Term Bond 0.9% | ||||||||
| Schwab Short-Term Bond Index Fund | 875,475 | 364,664 | — | — | (87,331) | 1,152,808 | 123,692 | 14,662 |
| 3,351,633 | ||||||||
| Total Affiliated Underlying Funds (Cost $112,444,230) | $125,268,352 | $26,545,053 | ($3,426,431) | $44,393 | ($40,068,390) | $108,362,977 | $10,739,530 | |
| SECURITY | VALUE AT 10/31/21 | PURCHASES | SALES | REALIZED GAINS (LOSSES) | NET CHANGE IN UNREALIZED APPRECIATION (DEPRECIATION) | VALUE AT 10/31/22 | BALANCE OF SHARES HELD AT 10/31/22 | DISTRIBUTIONS RECEIVED(a) |
| UNAFFILIATED UNDERLYING FUNDS 19.7% OF NET ASSETS | ||||||||
| U.S. Stocks 11.8% | ||||||||
| Large-Cap 9.7% | ||||||||
| ClearBridge Large Cap Growth Fund, Class IS * | $3,593,334 | 70,444 | ||||||
| Dodge & Cox Stock Fund, Class I | 9,594,637 | 43,478 | ||||||
| 13,187,971 | ||||||||
| Small-Cap 2.1% | ||||||||
| ClearBridge Small Cap Growth Fund, Class IS * | 2,783,720 | 72,796 | ||||||
| 15,971,691 | ||||||||
| International Stocks 4.5% | ||||||||
| Emerging Markets 4.5% | ||||||||
| Goldman Sachs Emerging Markets Equity Insights Fund, Institutional Class | 6,087,651 | 888,708 | ||||||
| Fixed Income 3.4% | ||||||||
| Intermediate-Term Bond 2.5% | ||||||||
| Loomis Sayles Investment Grade Bond Fund, Class Y | 2,525,987 | 268,436 | ||||||
| Western Asset Core Plus Bond Fund, Class I | 885,627 | 98,185 | ||||||
| 3,411,614 | ||||||||
| International Bond 0.9% | ||||||||
| PIMCO International Bond Fund (U.S. Dollar-Hedged), Institutional Class | 1,223,518 | 128,656 | ||||||
| 4,635,132 | ||||||||
| Total Unaffiliated Underlying Funds (Cost $28,935,461) | $26,694,474 | |||||||
| Total Investments in Securities (Cost $141,379,691) | $135,057,451 | |||||||
| * | Non-income producing security. |
| (a) | Distributions received include distributions from net investment income and capital gains, if any, from the underlying funds. Amounts shown are only presented for affiliated underlying funds, which are presented in the corresponding line-item in the Statement of Operations, if applicable (See financial note 2(d) for additional information). |
| Assets | ||
| Investments in securities, at value - affiliated (cost $112,444,230) | $108,362,977 | |
| Investments in securities, at value - unaffiliated (cost $28,935,461) | 26,694,474 | |
| Cash | 701,282 | |
| Receivables: | ||
| Fund shares sold | 63,280 | |
| Dividends | 11,745 | |
| Due from investment adviser | 9,341 | |
| Interest | 1,169 | |
| Prepaid expenses | + | 4,540 |
| Total assets | 135,848,808 | |
| Liabilities | ||
| Payables: | ||
| Fund shares redeemed | 54,002 | |
| Investments bought | 11,807 | |
| Independent trustees’ fees | 34 | |
| Accrued expenses | + | 42,201 |
| Total liabilities | 108,044 | |
| Net assets | $135,740,764 | |
| Net Assets by Source | ||
| Capital received from investors | $133,571,725 | |
| Total distributable earnings | + | 2,169,039 |
| Net assets | $135,740,764 | |
| Net Asset Value (NAV) | ||||
| Net Assets | ÷ | Shares Outstanding | = | NAV |
| $135,740,764 | 9,713,327 | $13.97 | ||
| For the period November 1, 2021 through October 31, 2022 | ||
| Investment Income | ||
| Dividends received from securities - affiliated | $1,664,281 | |
| Dividends received from securities - unaffiliated | 451,075 | |
| Interest received from securities - unaffiliated | + | 4,139 |
| Total investment income | 2,119,495 | |
| Expenses | ||
| Registration fees | 23,652 | |
| Professional fees | 21,768 | |
| Shareholder reports | 13,953 | |
| Portfolio accounting fees | 13,385 | |
| Independent trustees’ fees | 7,156 | |
| Proxy fees1 | 6,775 | |
| Transfer agent fees | 2,645 | |
| Custodian fees | 1,518 | |
| Other expenses | + | 5,867 |
| Total expenses | 96,719 | |
| Expense reduction | – | 89,944 |
| Net expenses | – | 6,775 |
| Net investment income | 2,112,720 | |
| REALIZED AND UNREALIZED GAINS (LOSSES) | ||
| Realized capital gain distributions received from underlying funds - affiliated | 9,075,249 | |
| Realized capital gain distributions received from underlying funds - unaffiliated | 2,229,685 | |
| Net realized gains on sales of securities - affiliated | 44,393 | |
| Net realized losses on sales of securities - unaffiliated | + | (57,984) |
| Net realized gains | 11,291,343 | |
| Net change in unrealized appreciation (depreciation) on securities - affiliated | (40,068,390) | |
| Net change in unrealized appreciation (depreciation) on securities - unaffiliated | + | (9,117,630) |
| Net change in unrealized appreciation (depreciation) | + | (49,186,020) |
| Net realized and unrealized losses | (37,894,677) | |
| Decrease in net assets resulting from operations | ($35,781,957) | |
| 1 | Proxy fees are non-routine expenses (see financial note 4 for additional information). |
| OPERATIONS | |||
| 11/1/21-10/31/22 | 11/1/20-10/31/21 | ||
| Net investment income | $2,112,720 | $1,237,409 | |
| Net realized gains | 11,291,343 | 3,679,483 | |
| Net change in unrealized appreciation (depreciation) | + | (49,186,020) | 34,739,616 |
| Increase (decrease) in net assets resulting from operations | ($35,781,957) | $39,656,508 | |
| DISTRIBUTIONS TO SHAREHOLDERS | |||
| Total distributions | ($8,207,354) | ($2,778,154) | |
| TRANSACTIONS IN FUND SHARES | |||||
| 11/1/21-10/31/22 | 11/1/20-10/31/21 | ||||
| SHARES | VALUE | SHARES | VALUE | ||
| Shares sold | 2,031,561 | $32,815,671 | 2,415,853 | $41,626,853 | |
| Shares reinvested | 442,294 | 7,983,406 | 169,303 | 2,710,532 | |
| Shares redeemed | + | (1,204,703) | (19,292,293) | (1,750,620) | (30,393,721) |
| Net transactions in fund shares | 1,269,152 | $21,506,784 | 834,536 | $13,943,664 | |
| SHARES OUTSTANDING AND NET ASSETS | |||||
| 11/1/21-10/31/22 | 11/1/20-10/31/21 | ||||
| SHARES | NET ASSETS | SHARES | NET ASSETS | ||
| Beginning of period | 8,444,175 | $158,223,291 | 7,609,639 | $107,401,273 | |
| Total increase (decrease) | + | 1,269,152 | (22,482,527) | 834,536 | 50,822,018 |
| End of period | 9,713,327 | $135,740,764 | 8,444,175 | $158,223,291 | |
| 11/1/21– 10/31/22 | 11/1/20– 10/31/21 | 11/1/19– 10/31/20 | 11/1/18– 10/31/19 | 11/1/17– 10/31/18 | ||
| Per-Share Data | ||||||
| Net asset value at beginning of period | $16.42 | $12.21 | $12.16 | $11.53 | $12.02 | |
| Income (loss) from investment operations: | ||||||
| Net investment income (loss)1 | 0.19 | 0.12 | 0.20 | 0.16 | 0.14 | |
| Net realized and unrealized gains (losses) | (3.61) | 4.34 | 0.38 | 0.99 | (0.32) | |
| Total from investment operations | (3.42) | 4.46 | 0.58 | 1.15 | (0.18) | |
| Less distributions: | ||||||
| Distributions from net investment income | (0.47) | (0.13) | (0.22) | (0.26) | (0.29) | |
| Distributions from net realized gains | (0.27) | (0.12) | (0.31) | (0.26) | (0.02) | |
| Total distributions | (0.74) | (0.25) | (0.53) | (0.52) | (0.31) | |
| Net asset value at end of period | $12.26 | $16.42 | $12.21 | $12.16 | $11.53 | |
| Total return | (21.88%) | 36.89% | 4.73% | 10.85% | (1.64%) | |
| Ratios/Supplemental Data | ||||||
| Ratios to average net assets: | ||||||
| Net operating expenses2 | 0.00% 3 | 0.00% | 0.00% | 0.00% | 0.00% | |
| Gross operating expenses2 | 0.20% 3 | 0.22% | 0.41% | 0.67% | 0.73% | |
| Net investment income (loss) | 1.35% | 0.80% | 1.67% | 1.42% | 1.18% | |
| Portfolio turnover rate | 15% | 11% | 8% | 13% | 22% | |
| Net assets, end of period (x 1,000) | $39,741 | $40,077 | $21,509 | $15,765 | $10,479 | |
| 1 | Calculated based on the average shares outstanding during the period. |
| 2 | Ratio excludes acquired fund fees and expenses, which are indirect expenses incurred by the fund through its investments in underlying funds. |
| 3 | Ratio includes less than 0.005% of non-routine proxy expenses. |
| SECURITY | VALUE AT 10/31/21 | PURCHASES | SALES | REALIZED GAINS (LOSSES) | NET CHANGE IN UNREALIZED APPRECIATION (DEPRECIATION) | VALUE AT 10/31/22 | BALANCE OF SHARES HELD AT 10/31/22 | DISTRIBUTIONS RECEIVED(a) |
| AFFILIATED UNDERLYING FUNDS 82.1% OF NET ASSETS | ||||||||
| U.S. Stocks 47.9% | ||||||||
| Large-Cap 40.2% | ||||||||
| Schwab Core Equity Fund | $3,258,883 | $379,376 | ($733,176) | ($22,401) | ($976,659) | $1,906,023 | 97,946 | $765,001 |
| Schwab Fundamental US Large Company Index Fund | 1,474,879 | 1,552,075 | (488,313) | (33,561) | (125,252) | 2,379,828 | 112,309 | 69,814 |
| Schwab S&P 500 Index Fund | 8,131,219 | 2,020,456 | (978,762) | (130,431) | (1,133,407) | 7,909,075 | 131,774 | 105,497 |
| Schwab Select Large Cap Growth Fund (formerly Laudus U.S. Large Cap Growth Fund) * | 3,322,582 | 2,888,892 | (307,395) | (157,179) | (1,933,278) | 3,813,622 | 193,487 | 426,011 |
| 16,008,548 | ||||||||
| Mid-Cap 1.9% | ||||||||
| Schwab U.S. Mid-Cap Index Fund | 683,890 | 220,728 | — | — | (152,446) | 752,172 | 14,509 | 20,728 |
| Small-Cap 5.8% | ||||||||
| Schwab Small-Cap Equity Fund | 2,241,296 | 846,384 | (318,580) | (69,864) | (398,231) | 2,301,005 | 121,489 | 254,121 |
| 19,061,725 | ||||||||
| International Stocks 25.9% | ||||||||
| Developed Markets 25.9% | ||||||||
| Schwab International Core Equity Fund | 4,222,062 | 1,869,805 | (747,137) | (210,049) | (973,409) | 4,161,272 | 477,758 | 125,667 |
| Schwab International Opportunities Fund (formerly Laudus International MarketMasters Fund) | 6,269,552 | 3,794,643 | (302,708) | (227,877) | (3,390,737) | 6,142,873 | 363,699 | 975,468 |
| 10,304,145 | ||||||||
| Real Estate 6.7% | ||||||||
| Global Real Estate 6.7% | ||||||||
| Schwab Global Real Estate Fund | 2,031,876 | 1,651,199 | (205,977) | (66,022) | (760,429) | 2,650,647 | 449,262 | 77,870 |
| Fixed Income 1.6% | ||||||||
| Intermediate-Term Bond 1.1% | ||||||||
| Schwab U.S. Aggregate Bond Index Fund | 371,694 | 535,797 | (385,826) | (34,900) | (50,508) | 436,257 | 50,728 | 10,794 |
| Short-Term Bond 0.5% | ||||||||
| Schwab Short-Term Bond Index Fund | 107,781 | 238,183 | (128,696) | (10,549) | (5,730) | 200,989 | 21,565 | 2,687 |
| 637,246 | ||||||||
| Total Affiliated Underlying Funds (Cost $35,274,190) | $32,115,714 | $15,997,538 | ($4,596,570) | ($962,833) | ($9,900,086) | $32,653,763 | $2,833,658 | |
| SECURITY | VALUE AT 10/31/21 | PURCHASES | SALES | REALIZED GAINS (LOSSES) | NET CHANGE IN UNREALIZED APPRECIATION (DEPRECIATION) | VALUE AT 10/31/22 | BALANCE OF SHARES HELD AT 10/31/22 | DISTRIBUTIONS RECEIVED(a) |
| UNAFFILIATED UNDERLYING FUNDS 17.9% OF NET ASSETS | ||||||||
| U.S. Stocks 10.8% | ||||||||
| Large-Cap 8.9% | ||||||||
| ClearBridge Large Cap Growth Fund, Class IS * | $1,043,647 | 20,460 | ||||||
| Dodge & Cox Stock Fund, Class I | 2,476,702 | 11,223 | ||||||
| 3,520,349 | ||||||||
| Small-Cap 1.9% | ||||||||
| ClearBridge Small Cap Growth Fund, Class IS * | 763,152 | 19,957 | ||||||
| 4,283,501 | ||||||||
| International Stocks 5.4% | ||||||||
| Emerging Markets 5.4% | ||||||||
| Goldman Sachs Emerging Markets Equity Insights Fund, Institutional Class | 2,142,710 | 312,804 | ||||||
| Fixed Income 1.7% | ||||||||
| Intermediate-Term Bond 1.2% | ||||||||
| Loomis Sayles Investment Grade Bond Fund, Class Y | 456,924 | 48,557 | ||||||
| International Bond 0.5% | ||||||||
| PIMCO International Bond Fund (U.S. Dollar-Hedged), Institutional Class | 217,853 | 22,908 | ||||||
| 674,777 | ||||||||
| Total Unaffiliated Underlying Funds (Cost $7,865,071) | $7,100,988 | |||||||
| Total Investments in Securities (Cost $43,139,261) | $39,754,751 | |||||||
| * | Non-income producing security. |
| (a) | Distributions received include distributions from net investment income and capital gains, if any, from the underlying funds. Amounts shown are only presented for affiliated underlying funds, which are presented in the corresponding line-item in the Statement of Operations, if applicable (See financial note 2(d) for additional information). |
| Assets | ||
| Investments in securities, at value - affiliated (cost $35,274,190) | $32,653,763 | |
| Investments in securities, at value - unaffiliated (cost $7,865,071) | 7,100,988 | |
| Cash | 242,905 | |
| Receivables: | ||
| Investments sold | 3,708,521 | |
| Fund shares sold | 26,493 | |
| Due from investment adviser | 7,163 | |
| Dividends | 2,229 | |
| Interest | 446 | |
| Prepaid expenses | + | 11,635 |
| Total assets | 43,754,143 | |
| Liabilities | ||
| Payables: | ||
| Fund shares redeemed | 3,972,119 | |
| Investments bought | 2,241 | |
| Independent trustees’ fees | 33 | |
| Accrued expenses | + | 38,987 |
| Total liabilities | 4,013,380 | |
| Net assets | $39,740,763 | |
| Net Assets by Source | ||
| Capital received from investors | $42,069,542 | |
| Total distributable loss | + | (2,328,779) |
| Net assets | $39,740,763 | |
| Net Asset Value (NAV) | ||||
| Net Assets | ÷ | Shares Outstanding | = | NAV |
| $39,740,763 | 3,241,892 | $12.26 | ||
| For the period November 1, 2021 through October 31, 2022 | ||
| Investment Income | ||
| Dividends received from securities - affiliated | $441,435 | |
| Dividends received from securities - unaffiliated | 107,652 | |
| Interest received from securities - unaffiliated | + | 1,317 |
| Total investment income | 550,404 | |
| Expenses | ||
| Professional fees | 21,578 | |
| Registration fees | 20,411 | |
| Portfolio accounting fees | 12,097 | |
| Shareholder reports | 8,455 | |
| Independent trustees’ fees | 6,859 | |
| Custodian fees | 2,554 | |
| Proxy fees1 | 1,824 | |
| Transfer agent fees | 958 | |
| Other expenses | + | 4,962 |
| Total expenses | 79,698 | |
| Expense reduction | – | 77,874 |
| Net expenses | – | 1,824 |
| Net investment income | 548,580 | |
| REALIZED AND UNREALIZED GAINS (LOSSES) | ||
| Realized capital gain distributions received from underlying funds - affiliated | 2,392,223 | |
| Realized capital gain distributions received from underlying funds - unaffiliated | 609,550 | |
| Net realized losses on sales of securities - affiliated | (962,833) | |
| Net realized losses on sales of securities - unaffiliated | + | (176,682) |
| Net realized gains | 1,862,258 | |
| Net change in unrealized appreciation (depreciation) on securities - affiliated | (9,900,086) | |
| Net change in unrealized appreciation (depreciation) on securities - unaffiliated | + | (2,229,203) |
| Net change in unrealized appreciation (depreciation) | + | (12,129,289) |
| Net realized and unrealized losses | (10,267,031) | |
| Decrease in net assets resulting from operations | ($9,718,451) | |
| 1 | Proxy fees are non-routine expenses (see financial note 4 for additional information). |
| OPERATIONS | |||
| 11/1/21-10/31/22 | 11/1/20-10/31/21 | ||
| Net investment income | $548,580 | $254,444 | |
| Net realized gains | 1,862,258 | 732,256 | |
| Net change in unrealized appreciation (depreciation) | + | (12,129,289) | 7,778,541 |
| Increase (decrease) in net assets resulting from operations | ($9,718,451) | $8,765,241 | |
| DISTRIBUTIONS TO SHAREHOLDERS | |||
| Total distributions | ($1,894,146) | ($458,337) | |
| TRANSACTIONS IN FUND SHARES | |||||
| 11/1/21-10/31/22 | 11/1/20-10/31/21 | ||||
| SHARES | VALUE | SHARES | VALUE | ||
| Shares sold | 1,472,977 | $20,023,654 | 1,163,081 | $17,567,794 | |
| Shares reinvested | 115,712 | 1,840,977 | 31,814 | 444,437 | |
| Shares redeemed | + | (787,575) | (10,587,897) | (515,554) | (7,751,420) |
| Net transactions in fund shares | 801,114 | $11,276,734 | 679,341 | $10,260,811 | |
| SHARES OUTSTANDING AND NET ASSETS | |||||
| 11/1/21-10/31/22 | 11/1/20-10/31/21 | ||||
| SHARES | NET ASSETS | SHARES | NET ASSETS | ||
| Beginning of period | 2,440,778 | $40,076,626 | 1,761,437 | $21,508,911 | |
| Total increase (decrease) | + | 801,114 | (335,863) | 679,341 | 18,567,715 |
| End of period | 3,241,892 | $39,740,763 | 2,440,778 | $40,076,626 | |
| 11/1/21– 10/31/22 | 2/26/21 1– 10/31/21 | |||||
| Per-Share Data | ||||||
| Net asset value at beginning of period | $11.33 | $10.00 | ||||
| Income (loss) from investment operations: | ||||||
| Net investment income (loss)2 | 0.11 | 0.03 | ||||
| Net realized and unrealized gains (losses) | (2.51) | 1.30 | ||||
| Total from investment operations | (2.40) | 1.33 | ||||
| Less distributions: | ||||||
| Distributions from net investment income | (0.30) | — | ||||
| Net asset value at end of period | $8.63 | $11.33 | ||||
| Total return | (21.78%) | 13.30% 3 | ||||
| Ratios/Supplemental Data | ||||||
| Ratios to average net assets: | ||||||
| Net operating expenses4 | 0.00% 5 | 0.00% 6 | ||||
| Gross operating expenses4 | 1.10% 5 | 1.90% 6 | ||||
| Net investment income (loss)4 | 1.17% | 0.35% 6 | ||||
| Portfolio turnover rate | 26% | 34% 3 | ||||
| Net assets, end of period (x 1,000) | $6,611 | $4,489 | ||||
| 1 | Commencement of operations. |
| 2 | Calculated based on the average shares outstanding during the period. |
| 3 | Not annualized. |
| 4 | Ratio excludes acquired fund fees and expenses, which are indirect expenses incurred by the fund through its investments in underlying funds. |
| 5 | Ratio includes less than 0.005% of non-routine proxy expenses. |
| 6 | Annualized. |
| SECURITY | VALUE AT 10/31/21 | PURCHASES | SALES | REALIZED GAINS (LOSSES) | NET CHANGE IN UNREALIZED APPRECIATION (DEPRECIATION) | VALUE AT 10/31/22 | BALANCE OF SHARES HELD AT 10/31/22 | DISTRIBUTIONS RECEIVED(a) |
| AFFILIATED UNDERLYING FUNDS 81.6% OF NET ASSETS | ||||||||
| U.S. Stocks 47.7% | ||||||||
| Large-Cap 40.2% | ||||||||
| Schwab Core Equity Fund | $362,105 | $108,000 | ($25,000) | ($7,001) | ($117,597) | $320,507 | 16,470 | $85,002 |
| Schwab Fundamental US Large Company Index Fund | 166,209 | 311,654 | (53,942) | (4,106) | (24,367) | 395,448 | 18,662 | 9,454 |
| Schwab S&P 500 Index Fund | 924,860 | 888,779 | (300,536) | (15,845) | (178,610) | 1,318,648 | 21,970 | 11,779 |
| Schwab Select Large Cap Growth Fund (formerly Laudus U.S. Large Cap Growth Fund) * | 375,362 | 622,902 | (77,001) | (26,522) | (271,116) | 623,625 | 31,640 | 50,589 |
| Schwab U.S. Large-Cap ETF | — | 165,387 | (165,694) | 307 | — | — | — | — |
| 2,658,228 | ||||||||
| Mid-Cap 1.8% | ||||||||
| Schwab U.S. Mid-Cap Index Fund | 77,292 | 60,297 | — | — | (20,245) | 117,344 | 2,264 | 2,296 |
| Small-Cap 5.7% | ||||||||
| Schwab Small-Cap Equity Fund | 250,158 | 238,485 | (46,000) | (9,998) | (57,394) | 375,251 | 19,813 | 29,486 |
| Schwab U.S. Small-Cap ETF | — | 41,930 | (42,046) | 116 | — | — | — | — |
| 375,251 | ||||||||
| 3,150,823 | ||||||||
| International Stocks 26.4% | ||||||||
| Developed Markets 26.4% | ||||||||
| Schwab International Core Equity Fund | 531,592 | 588,437 | (209,098) | (24,218) | (149,569) | 737,144 | 84,632 | 15,437 |
| Schwab International Equity ETF | — | 113,307 | (113,259) | (48) | — | — | — | — |
| Schwab International Opportunities Fund (formerly Laudus International MarketMasters Fund) | 645,158 | 958,158 | (100,012) | (46,305) | (445,786) | 1,011,213 | 59,870 | 111,727 |
| 1,748,357 | ||||||||
| Real Estate 6.6% | ||||||||
| Global Real Estate 6.6% | ||||||||
| Schwab Global Real Estate Fund | 223,516 | 351,090 | (10,000) | (856) | (129,664) | 434,086 | 73,574 | 10,810 |
| Fixed Income 0.9% | ||||||||
| Intermediate-Term Bond 0.4% | ||||||||
| Schwab U.S. Aggregate Bond Index Fund | 30,682 | 68,739 | (63,324) | (5,915) | (1,853) | 28,329 | 3,294 | 946 |
| Short-Term Bond 0.5% | ||||||||
| Schwab Short-Term Bond Index Fund | 15,020 | 37,441 | (18,001) | (1,556) | (1,027) | 31,877 | 3,420 | 440 |
| 60,206 | ||||||||
| Total Affiliated Underlying Funds (Cost $6,568,386) | $3,601,954 | $4,554,606 | ($1,223,913) | ($141,947) | ($1,397,228) | $5,393,472 | $327,966 | |
| SECURITY | VALUE AT 10/31/21 | PURCHASES | SALES | REALIZED GAINS (LOSSES) | NET CHANGE IN UNREALIZED APPRECIATION (DEPRECIATION) | VALUE AT 10/31/22 | BALANCE OF SHARES HELD AT 10/31/22 | DISTRIBUTIONS RECEIVED(a) |
| UNAFFILIATED UNDERLYING FUNDS 17.9% OF NET ASSETS | ||||||||
| U.S. Stocks 11.1% | ||||||||
| Large-Cap 9.0% | ||||||||
| ClearBridge Large Cap Growth Fund, Class IS * | $183,786 | 3,603 | ||||||
| Dodge & Cox Stock Fund, Class I | 410,982 | 1,862 | ||||||
| 594,768 | ||||||||
| Small-Cap 2.1% | ||||||||
| ClearBridge Small Cap Growth Fund, Class IS * | 140,979 | 3,687 | ||||||
| 735,747 | ||||||||
| International Stocks 5.2% | ||||||||
| Emerging Markets 5.2% | ||||||||
| Goldman Sachs Emerging Markets Equity Insights Fund, Institutional Class | 341,062 | 49,790 | ||||||
| Fixed Income 1.6% | ||||||||
| Intermediate-Term Bond 1.1% | ||||||||
| Loomis Sayles Investment Grade Bond Fund, Class Y | 69,875 | 7,426 | ||||||
| International Bond 0.5% | ||||||||
| PIMCO International Bond Fund (U.S. Dollar-Hedged), Institutional Class | 36,104 | 3,796 | ||||||
| 105,979 | ||||||||
| Total Unaffiliated Underlying Funds (Cost $1,452,402) | $1,182,788 | |||||||
| Total Investments in Securities (Cost $8,020,788) | $6,576,260 | |||||||
| * | Non-income producing security. |
| (a) | Distributions received include distributions from net investment income and capital gains, if any, from the underlying funds. Amounts shown are only presented for affiliated underlying funds, which are presented in the corresponding line-item in the Statement of Operations, if applicable (See financial note 2(d) for additional information). |
| ETF — | Exchange traded fund |
| Assets | ||
| Investments in securities, at value - affiliated (cost $6,568,386) | $5,393,472 | |
| Investments in securities, at value - unaffiliated (cost $1,452,402) | 1,182,788 | |
| Receivables: | ||
| Fund shares sold | 204,853 | |
| Investments sold | 182,000 | |
| Due from investment adviser | 6,995 | |
| Dividends | 355 | |
| Prepaid expenses | + | 3,375 |
| Total assets | 6,973,838 | |
| Liabilities | ||
| Payables: | ||
| Fund shares redeemed | 196,601 | |
| Due to custodian | 134,764 | |
| Investments bought | 283 | |
| Independent trustees’ fees | 32 | |
| Accrued expenses | + | 31,633 |
| Total liabilities | 363,313 | |
| Net assets | $6,610,525 | |
| Net Assets by Source | ||
| Capital received from investors | $7,954,641 | |
| Total distributable loss | + | (1,344,116) |
| Net assets | $6,610,525 | |
| Net Asset Value (NAV) | ||||
| Net Assets | ÷ | Shares Outstanding | = | NAV |
| $6,610,525 | 766,235 | $8.63 | ||
| For the period November 1, 2021 through October 31, 2022 | ||
| Investment Income | ||
| Dividends received from securities - affiliated | $53,455 | |
| Dividends received from securities - unaffiliated | + | 13,793 |
| Total investment income | 67,248 | |
| Expenses | ||
| Professional fees | 18,390 | |
| Registration fees | 14,880 | |
| Portfolio accounting fees | 11,512 | |
| Independent trustees’ fees | 6,764 | |
| Custodian fees | 3,261 | |
| Shareholder reports | 2,643 | |
| Transfer agent fees | 679 | |
| Proxy fees1 | 245 | |
| Other expenses | + | 4,579 |
| Total expenses | 62,953 | |
| Expense reduction | – | 62,708 |
| Net expenses | – | 245 |
| Net investment income | 67,003 | |
| REALIZED AND UNREALIZED GAINS (LOSSES) | ||
| Realized capital gain distributions received from underlying funds - affiliated | 274,511 | |
| Realized capital gain distributions received from underlying funds - unaffiliated | 71,093 | |
| Net realized losses on sales of securities - affiliated | (141,947) | |
| Net realized losses on sales of securities - unaffiliated | + | (40,786) |
| Net realized gains | 162,871 | |
| Net change in unrealized appreciation (depreciation) on securities - affiliated | (1,397,228) | |
| Net change in unrealized appreciation (depreciation) on securities - unaffiliated | + | (290,186) |
| Net change in unrealized appreciation (depreciation) | + | (1,687,414) |
| Net realized and unrealized losses | (1,524,543) | |
| Decrease in net assets resulting from operations | ($1,457,540) | |
| 1 | Proxy fees are non-routine expenses (see financial note 4 for additional information). |
| OPERATIONS | |||
| 11/1/21-10/31/22 | 2/26/21 1-10/31/21 | ||
| Net investment income | $67,003 | $5,881 | |
| Net realized gains (losses) | 162,871 | (2,415) | |
| Net change in unrealized appreciation (depreciation) | + | (1,687,414) | 242,886 |
| Increase (decrease) in net assets resulting from operations | ($1,457,540) | $246,352 | |
| DISTRIBUTIONS TO SHAREHOLDERS | |||
| Total distributions | ($132,928) | $— | |
| TRANSACTIONS IN FUND SHARES | |||||
| 11/1/21-10/31/22 | 2/26/21 1-10/31/21 | ||||
| SHARES | VALUE | SHARES | VALUE | ||
| Shares sold | 558,480 | $5,553,563 | 438,998 | $4,713,650 | |
| Shares reinvested | 10,020 | 112,123 | — | — | |
| Shares redeemed | + | (198,386) | (1,953,828) | (42,877) | (470,867) |
| Net transactions in fund shares | 370,114 | $3,711,858 | 396,121 | $4,242,783 | |
| SHARES OUTSTANDING AND NET ASSETS | |||||
| 11/1/21-10/31/22 | 2/26/21 1-10/31/21 | ||||
| SHARES | NET ASSETS | SHARES | NET ASSETS | ||
| Beginning of period | 396,121 | $4,489,135 | — | $— | |
| Total increase | + | 370,114 | 2,121,390 | 396,121 | 4,489,135 |
| End of period | 766,235 | $6,610,525 | 396,121 | $4,489,135 | |
| 1 | Commencement of operations. |
| SCHWAB CAPITAL TRUST (ORGANIZED MAY 7, 1993) | |
| Schwab Target 2010 Fund | Schwab Dividend Equity Fund |
| Schwab Target 2015 Fund | Schwab Large-Cap Growth Fund |
| Schwab Target 2020 Fund | Schwab Small-Cap Equity Fund |
| Schwab Target 2025 Fund | Schwab Health Care Fund |
| Schwab Target 2030 Fund | Schwab International Core Equity Fund |
| Schwab Target 2035 Fund | Schwab Fundamental US Large Company Index Fund |
| Schwab Target 2040 Fund | Schwab Fundamental US Small Company Index Fund |
| Schwab Target 2045 Fund | Schwab Fundamental International Large Company Index Fund |
| Schwab Target 2050 Fund | Schwab Fundamental International Small Company Index Fund |
| Schwab Target 2055 Fund | Schwab Fundamental Emerging Markets Large Company Index Fund |
| Schwab Target 2060 Fund | Schwab Fundamental Global Real Estate Index Fund |
| Schwab Target 2065 Fund | Schwab Target 2010 Index Fund |
| Schwab S&P 500 Index Fund | Schwab Target 2015 Index Fund |
| Schwab Small-Cap Index Fund® | Schwab Target 2020 Index Fund |
| Schwab Total Stock Market Index Fund® | Schwab Target 2025 Index Fund |
| Schwab U.S. Large-Cap Growth Index Fund | Schwab Target 2030 Index Fund |
| Schwab U.S. Large-Cap Value Index Fund | Schwab Target 2035 Index Fund |
| Schwab U.S. Mid-Cap Index Fund | Schwab Target 2040 Index Fund |
| Schwab International Index Fund® | Schwab Target 2045 Index Fund |
| Schwab MarketTrack All Equity Portfolio™ | Schwab Target 2050 Index Fund |
| Schwab MarketTrack Growth Portfolio™ | Schwab Target 2055 Index Fund |
| Schwab MarketTrack Balanced Portfolio™ | Schwab Target 2060 Index Fund |
| Schwab MarketTrack Conservative Portfolio™ | Schwab Target 2065 Index Fund |
| Schwab International Opportunities Fund | Schwab Monthly Income Fund - Target Payout |
| Schwab Balanced Fund | Schwab Monthly Income Fund - Flexible Payout |
| Schwab Core Equity Fund | Schwab Monthly Income Fund - Income Payout |
| UNDERLYING FUNDS | SCHWAB TARGET 2010 FUND | SCHWAB TARGET 2015 FUND | SCHWAB TARGET 2020 FUND | SCHWAB TARGET 2025 FUND | SCHWAB TARGET 2030 FUND | SCHWAB TARGET 2035 FUND | SCHWAB TARGET 2040 FUND | SCHWAB TARGET 2045 FUND | SCHWAB TARGET 2050 FUND | SCHWAB TARGET 2055 FUND | SCHWAB TARGET 2060 FUND | SCHWAB TARGET 2065 FUND |
| Schwab Core Equity Fund | 0.1% | 0.1% | 0.7% | 1.1% | 2.6% | 1.5% | 3.3% | 0.7% | 0.7% | 0.5% | 0.2% | 0.0%* |
| Schwab Fundamental US Large Company Index Fund | 0.0%* | 0.0%* | 0.1% | 0.1% | 0.3% | 0.3% | 0.6% | 0.2% | 0.2% | 0.1% | 0.0%* | 0.0%* |
| Schwab Global Real Estate Fund | 0.4% | 0.6% | 4.1% | 6.3% | 14.0% | 8.3% | 18.2% | 4.2% | 4.4% | 3.0% | 0.9% | 0.2% |
| Schwab International Core Equity Fund | 0.3% | 0.5% | 3.4% | 5.7% | 12.9% | 7.8% | 16.4% | 3.7% | 4.0% | 2.8% | 0.8% | 0.1% |
| Schwab International Opportunities Fund | 0.2% | 0.3% | 2.5% | 4.2% | 9.5% | 5.7% | 12.4% | 2.9% | 3.0% | 2.0% | 0.6% | 0.1% |
| Schwab S&P 500 Index Fund | 0.0%* | 0.0%* | 0.1% | 0.1% | 0.3% | 0.2% | 0.3% | 0.1% | 0.1% | 0.0%* | 0.0%* | 0.0%* |
| Schwab Select Large Cap Growth Fund | 0.1% | 0.1% | 0.3% | 0.5% | 1.5% | 1.0% | 2.3% | 0.7% | 0.8% | 0.6% | 0.2% | 0.0% |
| Schwab Short-Term Bond Index Fund | 0.3% | 0.3% | 1.9% | 1.9% | 2.4% | 0.9% | 1.2% | 0.2% | 0.1% | 0.1% | 0.0%* | 0.0%* |
| Schwab Small-Cap Equity Fund | 0.1% | 0.2% | 1.1% | 2.0% | 5.0% | 3.6% | 8.0% | 2.1% | 2.2% | 1.5% | 0.4% | 0.1% |
| Schwab Treasury Inflation Protected Securities Index Fund | 0.1% | 0.1% | 0.9% | 0.7% | 0.4% | —% | —% | —% | —% | —% | —% | —% |
| Schwab U.S. Aggregate Bond Index Fund | 0.3% | 0.3% | 2.1% | 2.1% | 2.6% | 1.0% | 1.4% | 0.2% | 0.1% | 0.1% | 0.0%* | 0.0%* |
| Schwab U.S. Mid Cap Index Fund | 0.0%* | 0.0%* | 0.4% | 0.6% | 1.3% | 0.8% | 1.7% | 0.4% | 0.4% | 0.3% | 0.1% | 0.0%* |
| Schwab Variable Share Price Money Fund, Ultra Shares | 0.0%* | 0.0%* | 0.3% | 0.3% | 0.3% | 0.1% | 0.1% | 0.0%* | 0.0%* | —% | —% | —% |
| * | Less than 0.05% |
| PURCHASE COST | SALE PROCEEDS | REALIZED GAINS (LOSSES) | |
| Schwab Target 2010 Fund | $— | $— | $— |
| Schwab Target 2015 Fund | — | — | — |
| Schwab Target 2020 Fund | — | — | — |
| Schwab Target 2025 Fund | — | — | — |
| Schwab Target 2030 Fund | — | — | — |
| Schwab Target 2035 Fund | — | — | — |
| Schwab Target 2040 Fund | — | — | — |
| Schwab Target 2045 Fund | — | — | — |
| Schwab Target 2050 Fund | — | — | — |
| Schwab Target 2055 Fund | — | — | — |
| Schwab Target 2060 Fund | — | — | — |
| Schwab Target 2065 Fund | — | 278,953 | 259 |
| 7. Purchases and Sales of Investment Securities: |
| PURCHASES OF SECURITIES | SALES OF SECURITIES | |
| Schwab Target 2010 Fund | $13,204,160 | $19,944,840 |
| Schwab Target 2015 Fund | 13,107,915 | 20,674,483 |
| Schwab Target 2020 Fund | 79,122,258 | 119,912,226 |
| Schwab Target 2025 Fund | 109,134,993 | 125,910,903 |
| Schwab Target 2030 Fund | 191,985,372 | 168,769,300 |
| Schwab Target 2035 Fund | 103,663,076 | 70,472,734 |
| Schwab Target 2040 Fund | 175,616,897 | 109,697,049 |
| Schwab Target 2045 Fund | 42,988,038 | 14,913,023 |
| Schwab Target 2050 Fund | 48,037,506 | 14,449,509 |
| Schwab Target 2055 Fund | 33,481,575 | 6,362,330 |
| Schwab Target 2060 Fund | 19,076,539 | 5,931,913 |
| Schwab Target 2065 Fund | 5,470,880 | 1,483,824 |
| TAX COST | GROSS UNREALIZED APPRECIATION | GROSS UNREALIZED DEPRECIATION | NET UNREALIZED APPRECIATION (DEPRECIATION) | |
| Schwab Target 2010 Fund | $46,397,393 | $4,932,984 | ($5,364,100) | ($431,116) |
| Schwab Target 2015 Fund | 55,973,126 | 7,263,833 | (5,786,413) | 1,477,420 |
| Schwab Target 2020 Fund | 364,605,448 | 53,586,280 | (36,684,203) | 16,902,077 |
| Schwab Target 2025 Fund | 482,329,687 | 63,620,654 | (53,666,828) | 9,953,826 |
| Schwab Target 2030 Fund | 836,295,115 | 146,165,669 | (87,559,649) | 58,606,020 |
| Schwab Target 2035 Fund | 466,276,130 | 64,250,381 | (50,182,481) | 14,067,900 |
| Schwab Target 2040 Fund | 872,936,729 | 172,309,097 | (92,243,534) | 80,065,563 |
| Schwab Target 2045 Fund | 211,558,457 | 18,236,969 | (24,982,326) | (6,745,357) |
| Schwab Target 2050 Fund | 210,295,813 | 17,829,836 | (25,509,716) | (7,679,880) |
| Schwab Target 2055 Fund | 142,039,127 | 11,013,808 | (17,995,484) | (6,981,676) |
| Schwab Target 2060 Fund | 43,968,607 | 2,031,557 | (6,245,413) | (4,213,856) |
| Schwab Target 2065 Fund | 8,183,770 | - | (1,607,510) | (1,607,510) |
| UNDISTRIBUTED ORDINARY INCOME | UNDISTRIBUTED LONG-TERM CAPITAL GAINS | NET UNREALIZED APPRECIATION (DEPRECIATION) ON INVESTMENTS | TOTAL | |
| Schwab Target 2010 Fund | $697,873 | $966,864 | ($431,116) | $1,233,621 |
| Schwab Target 2015 Fund | 857,354 | 2,119,759 | 1,477,420 | 4,454,533 |
| Schwab Target 2020 Fund | 5,470,109 | 12,917,024 | 16,902,077 | 35,289,210 |
| Schwab Target 2025 Fund | 5,830,323 | 16,184,760 | 9,953,826 | 31,968,909 |
| Schwab Target 2030 Fund | 8,009,739 | 40,195,667 | 58,606,020 | 106,811,426 |
| Schwab Target 2035 Fund | 3,337,303 | 25,074,825 | 14,067,900 | 42,480,028 |
| Schwab Target 2040 Fund | 5,368,418 | 58,190,138 | 80,065,563 | 143,624,119 |
| Schwab Target 2045 Fund | 917,250 | 12,085,581 | (6,745,357) | 6,257,474 |
| Schwab Target 2050 Fund | 767,606 | 12,710,381 | (7,679,880) | 5,798,107 |
| Schwab Target 2055 Fund | 454,525 | 8,696,190 | (6,981,676) | 2,169,039 |
| Schwab Target 2060 Fund | 111,063 | 1,774,014 | (4,213,856) | (2,328,779) |
| Schwab Target 2065 Fund | 27,371 | 236,023 | (1,607,510) | (1,344,116) |
| CURRENT FISCAL YEAR END DISTRIBUTIONS | PRIOR FISCAL YEAR END DISTRIBUTIONS | |||
| ORDINARY INCOME | LONG-TERM CAPITAL GAINS | ORDINARY INCOME | LONG-TERM CAPITAL GAINS | |
| Schwab Target 2010 Fund | $1,331,099 | $1,739,735 | $1,158,878 | $385,205 |
| Schwab Target 2015 Fund | 1,744,930 | 3,437,941 | 1,603,533 | 1,864,193 |
| Schwab Target 2020 Fund | 11,812,575 | 25,556,397 | 10,442,930 | 10,256,763 |
| Schwab Target 2025 Fund | 15,900,882 | 24,337,226 | 10,641,524 | 7,269,075 |
| Schwab Target 2030 Fund | 29,568,203 | 46,509,219 | 16,741,235 | 16,944,271 |
| Schwab Target 2035 Fund | 16,504,016 | 17,830,955 | 7,639,008 | 7,482,792 |
| Schwab Target 2040 Fund | 34,399,189 | 46,775,680 | 14,499,604 | 21,950,959 |
| Schwab Target 2045 Fund | 7,204,576 | 5,468,227 | 2,368,978 | 2,594,038 |
| Schwab Target 2050 Fund | 7,536,621 | 6,628,300 | 2,230,995 | 2,674,047 |
| Schwab Target 2055 Fund | 4,779,602 | 3,427,752 | 1,270,190 | 1,507,964 |
| Schwab Target 2060 Fund | 1,250,419 | 643,727 | 239,872 | 218,465 |
| Schwab Target 2065 Fund | 132,928 | — | — | — |
Denver, Colorado
December 16, 2022
| FOREIGN TAX CREDIT | FOREIGN SOURCE INCOME | |
| Schwab Target 2010 Fund | $8,955 | $112,291 |
| Schwab Target 2015 Fund | 10,862 | 140,166 |
| Schwab Target 2020 Fund | 79,907 | 1,021,007 |
| Schwab Target 2025 Fund | 165,695 | 1,807,469 |
| Schwab Target 2030 Fund | 444,173 | 4,146,613 |
| Schwab Target 2035 Fund | 311,128 | 2,667,754 |
| Schwab Target 2040 Fund | 754,786 | 5,900,946 |
| Schwab Target 2045 Fund | 187,507 | 1,399,535 |
| Schwab Target 2050 Fund | 206,021 | 1,465,218 |
| Schwab Target 2055 Fund | 144,331 | 1,012,008 |
| Schwab Target 2060 Fund | 40,134 | 275,435 |
| Schwab Target 2065 Fund | 4,775 | 32,479 |
| Schwab Target 2010 Fund | 12.28% |
| Schwab Target 2015 Fund | 12.86% |
| Schwab Target 2020 Fund | 13.45% |
| Schwab Target 2025 Fund | 16.51% |
| Schwab Target 2030 Fund | 18.87% |
| Schwab Target 2035 Fund | 19.96% |
| Schwab Target 2040 Fund | 20.85% |
| Schwab Target 2045 Fund | 20.94% |
| Schwab Target 2050 Fund | 20.90% |
| Schwab Target 2055 Fund | 20.73% |
| Schwab Target 2060 Fund | 20.27% |
| Schwab Target 2065 Fund | 17.45% |
| Schwab Target 2010 Fund | $298,309 |
| Schwab Target 2015 Fund | 404,374 |
| Schwab Target 2020 Fund | 2,908,859 |
| Schwab Target 2025 Fund | 5,113,024 |
| Schwab Target 2030 Fund | 11,494,428 |
| Schwab Target 2035 Fund | 7,195,826 |
| Schwab Target 2040 Fund | 16,000,106 |
| Schwab Target 2045 Fund | 3,557,701 |
| Schwab Target 2050 Fund | 3,748,741 |
| Schwab Target 2055 Fund | 2,450,357 |
| Schwab Target 2060 Fund | 641,044 |
| Schwab Target 2065 Fund | 61,894 |
| Schwab Target 2010 Fund | $1,739,735 |
| Schwab Target 2015 Fund | 3,437,941 |
| Schwab Target 2020 Fund | 25,556,397 |
| Schwab Target 2025 Fund | 24,337,226 |
| Schwab Target 2030 Fund | 46,509,219 |
| Schwab Target 2035 Fund | 17,830,955 |
| Schwab Target 2040 Fund | 46,775,680 |
| Schwab Target 2045 Fund | 5,468,227 |
| Schwab Target 2050 Fund | 6,628,300 |
| Schwab Target 2055 Fund | 3,427,752 |
| Schwab Target 2060 Fund | 643,727 |
| Schwab Target 2065 Fund | — |
| Schwab Target 2010 Fund | $16,168 |
| Schwab Target 2015 Fund | 22,919 |
| Schwab Target 2020 Fund | 160,864 |
| Schwab Target 2025 Fund | 250,417 |
| Schwab Target 2030 Fund | 508,554 |
| Schwab Target 2035 Fund | 301,909 |
| Schwab Target 2040 Fund | 649,167 |
| Schwab Target 2045 Fund | 131,341 |
| Schwab Target 2050 Fund | 50,892 |
| Schwab Target 2055 Fund | 86,801 |
| Schwab Target 2060 Fund | 8,641 |
| Schwab Target 2065 Fund | 2,505 |
| Schwab Target 2010 Fund | 9.21% |
| Schwab Target 2015 Fund | 8.73% |
| Schwab Target 2020 Fund | 8.51% |
| Schwab Target 2025 Fund | 5.29% |
| Schwab Target 2030 Fund | 1.99% |
| Schwab Target 2035 Fund | 0.27% |
| Schwab Target 2040 Fund | 0.18% |
| Schwab Target 2045 Fund | 0.11% |
| Schwab Target 2050 Fund | 0.08% |
| Schwab Target 2055 Fund | 0.05% |
| Schwab Target 2060 Fund | 0.03% |
| Schwab Target 2065 Fund | 0.03% |
| Proposal – To elect each of the following individuals as trustees of the Trust: | For | Withheld |
| Walter W. Bettinger II | 1,095,577,106.505 | 115,838,980.968 |
| Richard A. Wurster | 1,117,598,789.555 | 93,817,297.918 |
| Michael J. Beer | 1,116,890,447.505 | 94,525,639.968 |
| Robert W. Burns | 1,117,915,860.110 | 93,500,227.363 |
| Nancy F. Heller | 1,119,878,732.134 | 91,537,355.339 |
| David L. Mahoney | 1,069,125,022.434 | 142,291,065.039 |
| Jane P. Moncreiff | 1,120,187,927.838 | 91,228,159.635 |
| Kiran M. Patel | 1,116,689,111.571 | 94,726,975.902 |
| Kimberly S. Patmore | 1,119,941,056.059 | 91,475,031.414 |
| J. Derek Penn | 1,117,666,014.121 | 93,750,073.352 |
| 1. | the nature, extent and quality of the services provided to each Fund under the Agreement, including the resources of the investment adviser and its affiliates dedicated to the Funds; |
| 2. | each Fund’s investment performance and how it compared to that of certain other comparable mutual funds and benchmark data; |
| 3. | each Fund’s expenses and how those expenses compared to those of certain other similar mutual funds; |
| 4. | the profitability of the investment adviser and its affiliates, including Charles Schwab & Co., Inc. (Schwab), with respect to each Fund, including both direct and indirect benefits accruing to the investment adviser and its affiliates; and |
| 5. | the extent to which economies of scale would be realized as each Fund grows and whether fee levels in the Agreement reflect those economies of scale for the benefit of Fund investors. |
| Independent Trustees | |||
| Name, Year of Birth, and Position(s) with the trust (Terms of office, and length of Time Served1) | Principal Occupations During the Past Five Years | Number of Portfolios in Fund Complex Overseen by the Trustee | Other Directorships |
Michael J. Beer 1961 Trustee (Trustee of The Charles Schwab Family of Funds, Schwab Investments, Schwab Capital Trust, Schwab Annuity Portfolios, Schwab Strategic Trust and Laudus Trust since 2022) | Retired. Director, President and Chief Executive Officer (Dec. 2016 – Sept. 2019), Principal Funds (investment management). | 105 | Director (2016 – 2019), Principal Funds, Inc. |
| Robert W. Burns 1959 Trustee (Trustee of Schwab Strategic Trust since 2009; The Charles Schwab Family of Funds, Schwab Investments, Schwab Capital Trust, Schwab Annuity Portfolios and Laudus Trust since 2016) | Retired/Private Investor. | 105 | None |
| Nancy F. Heller 1956 Trustee (Trustee of The Charles Schwab Family of Funds, Schwab Investments, Schwab Capital Trust, Schwab Annuity Portfolios, Schwab Strategic Trust and Laudus Trust since 2018) | Retired. | 105 | None |
| David L. Mahoney 1954 Trustee (Trustee of The Charles Schwab Family of Funds, Schwab Investments, Schwab Capital Trust, Schwab Annuity Portfolios and Laudus Trust since 2011; Schwab Strategic Trust since 2016) | Private Investor. | 105 | Director (2004 – present), Corcept Therapeutics Incorporated Director (2009 – 2021), Adamas Pharmaceuticals, Inc. Director (2003 – 2019), Symantec Corporation |
| Jane P. Moncreiff 1961 Trustee (Trustee of The Charles Schwab Family of Funds, Schwab Investments, Schwab Capital Trust, Schwab Annuity Portfolios, Schwab Strategic Trust and Laudus Trust since 2019) | Consultant (2018 – present), Fulham Advisers LLC (management consulting); Chief Investment Officer (2009 – 2017), CareGroup Healthcare System, Inc. (healthcare). | 105 | None |
| Independent Trustees (continued) | |||
| Name, Year of Birth, and Position(s) with the trust (Terms of office, and length of Time Served1) | Principal Occupations During the Past Five Years | Number of Portfolios in Fund Complex Overseen by the Trustee | Other Directorships |
| Kiran M. Patel 1948 Trustee (Trustee of The Charles Schwab Family of Funds, Schwab Investments, Schwab Capital Trust, Schwab Annuity Portfolios and Laudus Trust since 2011; Schwab Strategic Trust since 2016) | Retired. | 105 | Director (2008 – present), KLA-Tencor Corporation |
| Kimberly S. Patmore 1956 Trustee (Trustee of The Charles Schwab Family of Funds, Schwab Investments, Schwab Capital Trust, Schwab Annuity Portfolios, Schwab Strategic Trust and Laudus Trust since 2016) | Consultant (2008 – present), Patmore Management Consulting (management consulting). | 105 | None |
J. Derek Penn 1957 Trustee (Trustee of The Charles Schwab Family of Funds, Schwab Investments, Schwab Capital Trust, Schwab Annuity Portfolios, Schwab Strategic Trust and Laudus Trust since 2021) | Head of Equity Sales and Trading (2006 – 2018), BNY Mellon (financial services). | 105 | None |
| Interested Trustees | |||
| Name, Year of Birth, and Position(s) with the trust (Terms of office, and length of Time Served1) | Principal Occupations During the Past Five Years | Number of Portfolios in Fund Complex Overseen by the Trustee | Other Directorships |
| Walter W. Bettinger II2 1960 Chairman and Trustee (Trustee of The Charles Schwab Family of Funds, Schwab Investments, Schwab Capital Trust and Schwab Annuity Portfolios since 2008; Schwab Strategic Trust since 2009; Laudus Trust since 2010) | Co-Chairman of the Board (July 2022 – present), Director and Chief Executive Officer (Oct. 2008 – present) and President (Feb. 2007 – Oct. 2021), The Charles Schwab Corporation; President and Chief Executive Officer (Oct. 2008 – Oct. 2021) and Director (May 2008 – Oct. 2021), Charles Schwab & Co., Inc.; Director (Apr. 2006 – present), Charles Schwab Bank, SSB; Director (Nov. 2017 – present), Charles Schwab Premier Bank, SSB; Director (July 2019 – present), Charles Schwab Trust Bank; Director (May 2008 – present), Chief Executive Officer (Aug. 2017 – present) and President (Aug. 2017 – Nov. 2021), Schwab Holdings, Inc.; Director (Oct. 2020 – present), TD Ameritrade Holding Corporation; Director (July 2016 – Oct. 2021), Charles Schwab Investment Management, Inc. | 105 | Director (2008 – present), The Charles Schwab Corporation |
| Interested Trustees (continued) | |||
| Name, Year of Birth, and Position(s) with the trust (Terms of office, and length of Time Served1) | Principal Occupations During the Past Five Years | Number of Portfolios in Fund Complex Overseen by the Trustee | Other Directorships |
| Richard A. Wurster2 1973 Trustee (Trustee of The Charles Schwab Family of Funds, Schwab Investments, Schwab Capital Trust, Schwab Annuity Portfolios, Schwab Strategic Trust and Laudus Trust since 2022) | President (Oct. 2021 – present) and Executive Vice President – Schwab Asset Management Solutions (Apr. 2019 – Oct. 2021), The Charles Schwab Corporation; President, Director (Oct. 2021 – present), Executive Vice President – Schwab Asset Management Solutions (July 2019 – Oct. 2021) and Senior Vice President – Advisory (May 2016 – July 2019), Charles Schwab & Co., Inc.; President (Nov. 2021 – present), Schwab Holdings, Inc.; Director (Oct. 2021 – present) and Chief Executive Officer (Nov. 2019 – Jan. 2022), Charles Schwab Investment Management, Inc.; Director, Chief Executive Officer and President (Mar. 2018 – Oct. 2022), Charles Schwab Investment Advisory, Inc.; Chief Executive Officer (July 2016 – Apr. 2018) and President (Mar. 2017 – Apr. 2018), ThomasPartners, Inc.; Chief Executive Officer (July 2016 – Apr. 2018), Windhaven Investment Management, Inc. | 105 | None |
| Officers of the Trust | |
| Name, Year of Birth, and Position(s) with the trust (Terms of office, and length of Time Served3) | Principal Occupations During the Past Five Years |
| Jonathan de St. Paer 1973 President and Chief Executive Officer (Officer of The Charles Schwab Family of Funds, Schwab Investments, Schwab Capital Trust, Schwab Annuity Portfolios, Schwab Strategic Trust and Laudus Trust since 2018) | Director (Apr. 2019 – present), President (Oct. 2018 – present), Chief Operating Officer (Jan. 2021 – present), and Chief Executive Officer (Apr. 2019 – Nov. 2019), Charles Schwab Investment Management, Inc.; Senior Vice President (June 2020 – Mar. 2022) and Chief Operating Officer (Jan. 2021 – Mar. 2022), Charles Schwab Investment Advisory, Inc.; Chief Executive Officer (Apr. 2019 – present), President (Nov. 2018 – present) and Trustee (Apr. 2019 – Dec. 2020), Schwab Funds, Laudus Trust and Schwab ETFs; Managing Director (May 2022 – present), Senior Vice President (Apr. 2019 – May 2022) and Senior Vice President – Strategy and Product Development (CSIM) (Jan. 2014 – Mar. 2019), Charles Schwab & Co., Inc. |
| Mark Fischer 1970 Treasurer, Chief Financial Officer and Chief Operating Officer (Officer of The Charles Schwab Family of Funds, Schwab Investments, Schwab Capital Trust, Schwab Annuity Portfolios, Schwab Strategic Trust and Laudus Trust since 2013) | Treasurer and Chief Financial Officer (Jan. 2016 – present) and Chief Operating Officer (Dec. 2020 – present), Schwab Funds, Laudus Trust and Schwab ETFs; Chief Financial Officer (Mar. 2020 – present) and Vice President (Oct. 2013 – present), Charles Schwab Investment Management, Inc. |
| Omar Aguilar 1970 Vice President and Chief Investment Officer (Officer of The Charles Schwab Family of Funds, Schwab Investments, Schwab Capital Trust, Schwab Annuity Portfolios, Schwab Strategic Trust and Laudus Trust since 2011) | Chief Executive Officer (Jan. 2022 – present), Chief Investment Officer (Apr. 2011 – present) and Senior Vice President (Apr. 2011 – Dec. 2021), Charles Schwab Investment Management, Inc.; Director, Chief Executive Officer and President (Oct. 2022 – present), Charles Schwab Investment Advisory, Inc.; Vice President and Chief Investment Officer (June 2011 – present), Schwab Funds, Laudus Trust and Schwab ETFs. |
| Brett Wander 1961 Vice President and Chief Investment Officer (Officer of The Charles Schwab Family of Funds, Schwab Investments, Schwab Capital Trust, Schwab Annuity Portfolios, Schwab Strategic Trust and Laudus Trust since 2011) | Senior Vice President and Chief Investment Officer (Apr. 2011 – present), Charles Schwab Investment Management, Inc.; Vice President and Chief Investment Officer (June 2011 – present), Schwab Funds, Laudus Trust and Schwab ETFs. |
| William P. McMahon, Jr. 1972 Vice President and Chief Investment Officer (Officer of The Charles Schwab Family of Funds, Schwab Investments, Schwab Capital Trust, Schwab Annuity Portfolios, Schwab Strategic Trust and Laudus Trust since 2021) | Senior Vice President and Chief Investment Officer (Jan. 2020 – present), Charles Schwab Investment Management, Inc.; Vice President and Chief Investment Officer (June 2021 – present), Schwab Funds, Laudus Trust and Schwab ETFs; Senior Vice President and Chief Investment Officer – ThomasPartners Strategies (Apr. 2018 – Dec. 2019), Charles Schwab Investment Advisory, Inc.; Senior Vice President and Chief Investment Officer (May 2001 – Apr. 2018), ThomasPartners, Inc. |
| Officers of the Trust (continued) | |
| Name, Year of Birth, and Position(s) with the trust (Terms of office, and length of Time Served3) | Principal Occupations During the Past Five Years |
| Catherine MacGregor 1964 Chief Legal Officer and Secretary, Schwab Funds and Schwab ETFs Chief Legal Officer, Vice President and Clerk, Laudus Trust (Officer of The Charles Schwab Family of Funds, Schwab Investments, Schwab Capital Trust, Schwab Annuity Portfolios and Laudus Trust since 2005; Schwab Strategic Trust since 2009) | Chief Legal Officer (Mar. 2022 – present) and Vice President (Sept. 2005 – present), Charles Schwab Investment Management, Inc.; Managing Director (May 2022 – present) and Vice President (July 2005 – May 2022), Charles Schwab & Co., Inc.; Vice President (Dec. 2005 – present) and Chief Legal Officer and Clerk (Mar. 2007 – present), Laudus Trust; Chief Legal Officer and Secretary (Oct. 2021 – present), Vice President (Nov. 2005 – Oct. 2021) and Assistant Secretary (June 2007 – Oct. 2021), Schwab Funds; Chief Legal Officer and Secretary (Oct. 2021 – present), Vice President and Assistant Secretary (Oct. 2009 – Oct. 2021), Schwab ETFs. |
| 1 | Each Trustee shall hold office until the election and qualification of his or her successor, or until he or she dies, resigns or is removed. The retirement policy requires that each independent trustee retire by December 31 of the year in which the Trustee turns 74 or the Trustee’s twentieth year of service as an independent trustee on any trust in the Fund Complex, whichever occurs first. |
| 2 | Mr. Bettinger and Mr. Wurster are Interested Trustees. Mr. Bettinger and Mr. Wurster are Interested Trustees because each owns stock of The Charles Schwab Corporation (CSC), the parent company of Charles Schwab Investment Management, Inc., the investment adviser for the trusts in the Fund Complex, and is an employee of Charles Schwab & Co., Inc. (Schwab), the principal underwriter for The Charles Schwab Family of Funds, Schwab Investments, Schwab Capital Trust, Schwab Annuity Portfolios and Laudus Trust. |
| 3 | The President, Treasurer and Secretary/Clerk hold office until their respective successors are chosen and qualified or until he or she sooner dies, resigns, is removed or becomes disqualified. Each of the other officers serves at the pleasure of the Board. |
Schwab Funds
Member SIPC®
Printed on recycled paper.
| ¹ | State, local, and the Federal Alternative Minimum Tax may apply. Capital gains are not exempt from Federal Taxation. |
| ² | You could lose money by investing in the Schwab Money Funds. All Schwab Money Funds with the exception of Schwab Variable Share Price Money Fund seek to preserve the value of your investment at $1.00 per share, but cannot guarantee they will do so. Because the share price of Schwab Variable Share Price Money Fund will fluctuate, when you sell your shares they may be worth more or less than what you originally paid for them. All Schwab Money Funds with the exception of Schwab Government Money Fund, Schwab Retirement Government Money Fund, Schwab U.S. Treasury Money Fund, Schwab Treasury Obligations Money Fund and Schwab Government Money Market Portfolio may impose a fee upon the sale of your shares or may temporarily suspend your ability to sell shares if the Fund’s liquidity falls below required minimums because of market conditions or other factors. An investment in the Schwab Money Funds is not insured or guaranteed by the Federal Deposit Insurance Corporation or any other government agency. The Schwab Money Funds’ sponsor has no legal obligation to provide financial support to the Funds, and you should not expect that the sponsor will provide financial support to the Funds at any time. |
Item 2: Code of Ethics.
| (a) | Registrant has adopted a code of ethics that applies to its principal executive officer, principal financial officer, and any other persons who perform a similar function, regardless of whether these individuals are employed by Registrant or a third party. |
| (c) | During the period covered by the report, no amendments were made to the provisions of this code of ethics. |
| (d) | During the period covered by the report, Registrant did not grant any waivers, including implicit waivers, from the provisions of this code of ethics. |
| (e) | Not applicable. |
| (f)(1) | Registrant has filed this code of ethics as an exhibit pursuant to Item 13(a)(1) of Form N-CSR. |
Item 3: Audit Committee Financial Expert.
Registrant’s Board of Trustees has determined that Kiran M. Patel, Kimberly S. Patmore and J. Derek Penn, each currently serving on its audit, compliance and valuation committee, are each an “audit committee financial expert,” as such term is defined in Item 3 of Form N-CSR. Each member of Registrant’s audit, compliance and valuation committee is “independent” under the standards set forth in Item 3 of Form N-CSR.
The designation of each of Mr. Patel, Ms. Patmore and Mr. Penn as an “audit committee financial expert” pursuant to Item 3 of Form N-CSR does not (i) impose upon such individual any duties, obligations, or liability that are greater than the duties, obligations and liability imposed upon such individual as a member of Registrant’s audit, compliance and valuation committee or Board of Trustees in the absence of such designation; and (ii) affect the duties, obligations or liability of any other member of Registrant’s audit, compliance and valuation committee or Board of Trustees.
Item 4: Principal Accountant Fees and Services.
Registrant is composed of fifty-two operational series. Thirty-six series have a fiscal year-end of October 31, whose annual financial statements are reported in Item 1, three series have a fiscal year-end of December 31, twelve series have a fiscal year-end of March 31, and one series has a fiscal year-end of the last day of February. Principal accountant fees disclosed in Items 4(a)-(d) and 4(g) include fees billed for services rendered to the fifty-two operational series during 2022/2023 and the fifty-two operational series during 2021/2022, based on their respective 2022/2023 and 2021/2022 fiscal years, as applicable.
The following table presents fees billed by the principal accountant in each of the last two fiscal years for the services rendered to the Funds:
| (a) Audit Fees1 | (b) Audit-Related Fees2 | (c) Tax Fees3 | (d) All Other Fees | |||||||||||||||||||||||||||
| Fiscal Year 2022/2023 | Fiscal Year 2021/2022 | Fiscal Year 2022/2023 | Fiscal Year 2021/2022 | Fiscal Year 2022/2023 | Fiscal Year 2021/2022 | Fiscal Year 2022/2022 | Fiscal Year 2021/2022 | |||||||||||||||||||||||
| $ | 1,195,825 | $ | 1,187,075 | $ | 90,000 | $ | 90,000 | $ | 161,200 | $ | 161,200 | $ | 0 | $ | 0 | |||||||||||||||
| 1 | The nature of the services includes audit of the registrant’s annual financial statements and normally provided services in connection with regulatory filings for those fiscal years. |
| 2 | The nature of the services includes assurance and related services reasonably related to the performance of the audit of financial statements not included in Audit Fees. |
| 3 | The nature of the services includes tax compliance, tax advice and tax planning. |
| (e) (1) | Registrant’s audit, compliance and valuation committee does not have pre-approval policies and procedures as described in paragraph (c)(7) of Rule 2-01 of Regulation S-X. |
| (2) | There were no services described in each of paragraphs (b) through (d) above that were approved by Registrant’s audit, compliance and valuation committee pursuant to paragraph (c)(7)(i)(C) of Rule 2-01 of Regulation S-X. |
| (f) | Not applicable. |
| (g) | Below are the aggregate non-audit fees billed in each of the last two fiscal years by Registrant’s principal accountant for services rendered to Registrant, to Registrant’s investment adviser, and to any entity controlling, controlled by, or under common control with Registrant’s investment adviser that provides ongoing services to Registrant. |
| 2021/2022: $8,528,894 | 2020/2021: $3,309,631 |
| (h) | During the past fiscal year, all non-audit services provided by Registrant’s principal accountant to either Registrant’s investment adviser or to any entity controlling, controlled by, or under common control with Registrant’s investment adviser that provides ongoing services to Registrant were pre-approved. Included in the audit, compliance and valuation committee’s pre-approval was the review and consideration as to whether the provision of these non-audit services is compatible with maintaining the principal accountant’s independence. |
| (i) | Not applicable. |
| (j) | Not applicable. |
Item 5: Audit Committee of Listed Registrants.
Not applicable.
Item 6: Schedule of Investments.
The schedules of investments are included as part of the report to shareholders filed under Item 1 of this Form.
Item 7: Disclosure of Proxy Voting Policies and Procedures for Closed-End Management Investment Companies.
Not applicable.
Item 8: Portfolio Managers of Closed-End Management Investment Companies.
Not applicable.
Item 9: Purchases of Equity Securities by Closed-End Management Investment Company and Affiliated Purchasers.
Not applicable.
Item 10: Submission of Matters to a Vote of Security Holders.
Not applicable.
Item 11: Controls and Procedures.
| (a) | Based on their evaluation of Registrant’s disclosure controls and procedures, as of a date within 90 days of the filing date, Registrant’s Chief Executive Officer, Jonathan de St. Paer and Registrant’s Chief Financial Officer, Mark Fischer, have concluded that Registrant’s disclosure controls and procedures are: (i) reasonably designed to ensure that information required to be disclosed in this report is appropriately communicated to Registrant’s officers to allow timely decisions regarding disclosures required in this report; (ii) reasonably designed to ensure that information required to be disclosed in this report is recorded, processed, summarized and reported in a timely manner; and (iii) are effective in achieving the goals described in (i) and (ii) above. |
| (b) | During the period covered by this report, there have been no changes in Registrant’s internal control over financial reporting that the above officers believe to have materially affected, or to be reasonably likely to materially affect, Registrant’s internal control over financial reporting. |
Item 12: Disclosure of Securities Lending Activities for Closed-End Management Investment Companies.
Not applicable.
Item 13: Exhibits.
| (a) (1) |
| (2) |
| (b) |
Pursuant to the requirements of the Securities Exchange Act of 1934 and the Investment Company Act of 1940, the registrant has duly caused this report to be signed on its behalf by the undersigned, thereunto duly authorized.
(Registrant) Schwab Capital Trust
| By: | /s/ Jonathan de St. Paer | |
Jonathan de St. Paer Chief Executive Officer | ||
| Date: | December 16, 2022 | |
Pursuant to the requirements of the Securities Exchange Act of 1934 and the Investment Company Act of 1940, this report has been signed below by the following persons on behalf of the registrant and in the capacities and on the dates indicated.
| By: | /s/ Jonathan de St. Paer | |
Jonathan de St. Paer Chief Executive Officer | ||
| Date: | December 16, 2022 | |
| By: | /s/ Mark Fischer | |
Mark Fischer Chief Financial Officer | ||
| Date: | December 16, 2022 | |