Exhibit 99.2
NASDAQ: SFNC 1 st Quarter 2020 Investor Presentation
2 Forward - Looking Statements and Non - GAAP Financial Measures Forward - Looking Statements Certain statements contained in this presentation may not be based on historical facts and should be considered "forward - looking statements" within the meaning of the Private Securities Litigation Reform Act of 1995 . These forward - looking statements may be identified by reference to a future period(s) or by the use of forward - looking terminology, such as "anticipate," "estimate," "expect," "foresee," "may," "might," "will," "would," "could" or "intend," future or conditional verb tenses, and variations or negatives of such terms . These forward - looking statements include, without limitation, those relating to Simmons First National Corporation’s (“Company”) future growth, revenue, expenses, assets, asset quality, profitability and earnings, critical accounting policies, accretion, net interest margin, non - interest revenue, market conditions related to and impact of the Company's common stock repurchase program, adequacy of the allowance for loan losses, income tax deductions, credit quality, the level of credit losses from lending commitments, net interest revenue, interest rate sensitivity, loan loss experience, liquidity, capital resources, market risk, earnings, and the expected benefits, milestones or costs associated with the Company’s acquisition strategy and Next Generation Bank Program, the Company’s ability to recruit and retain key employees, the ability of the Company to manage the impact of the COVID - 19 pandemic, legal and regulatory limitations and compliance and competition, anticipated loan payoffs, future status of the Paycheck Protection Program and loan applications thereunder, statements under the caption “Management’s Outlook” on slides 18 and 20 , timing of branch closures, and projected dividends . Readers are cautioned not to place undue reliance on the forward - looking statements contained in this presentation in that actual results could differ materially from those indicated in such forward - looking statements, due to a variety of factors . These factors include, but are not limited to, changes in the Company's operating or expansion strategy ; the availability of and costs associated with obtaining adequate and timely sources of liquidity ; the ability to maintain credit quality ; the effects of the COVID - 19 pandemic on, among other things, the Company’s operations, liquidity, and credit quality ; general market and economic conditions ; unemployment ; possible adverse rulings, judgments, settlements and other outcomes of pending or future litigation (including litigation arising from the Company’s participation in and administration of programs related to the COVID - 19 pandemic (including the CARES Act)) ; the ability of the Company to collect amounts due under loan agreements ; changes in consumer preferences and loan demand ; effectiveness of the Company's interest rate risk management strategies ; laws and regulations affecting financial institutions in general or relating to taxes ; the effect of pending or future legislation ; the ability of the Company to repurchase its common stock on favorable terms ; the ability of the Company to successfully implement its acquisition strategy ; changes in interest rates, deposit flows, real estate values, and capital markets ; inflation ; customer acceptance of the Company's products and services ; changes or disruptions in technology and IT systems (including cyber threats, attacks and events) ; changes in accounting principles relating to loan loss recognition (CECL) ; and other risk factors . Other relevant risk factors may be detailed from time to time in the Company's press releases and filings with the U . S . Securities and Exchange Commission, including, without limitation, the Company’s Form 10 - K for the year ended December 31 , 2019 . Any forward - looking statement speaks only as of the date of this Report, and the Company undertakes no obligation to update these forward - looking statements to reflect events or circumstances that occur after the date of this Report . Annualized, pro forma, projected and estimated numbers are used for illustrative purpose only, are not forecasts and may not reflect actual results . Non - GAAP Financial Measures This document contains financial information determined by methods other than in accordance with generally accepted accounting principles (GAAP) . The Company's management uses these non - GAAP financial measures in their analysis of the company's performance . These measures adjust GAAP performance measures to, among other things, include the tax benefit associated with revenue items that are tax - exempt, as well as exclude from income available to common shareholders certain expenses related to significant non - core activities, such as merger - related expenses, expenses related to the Company’s early retirement program, gain on sale of branches, and branch right - sizing expenses . In addition, the Company also presents certain figures based on tangible common stockholders’ equity and tangible book value, which exclude goodwill and other intangible assets . The Company’s management believes that these non - GAAP financial measure are useful to investors because they, among other things, present the results of the Company’s ongoing operations without the effect of mergers or other items not central to the Company’s ongoing business, as well as normalizing for tax effects . Management, therefore, believes presentations of these non - GAAP financial measures provide useful supplemental information that is essential to a proper understanding of the operating results of the Company's core businesses . These non - GAAP disclosures should not be viewed as a substitute for operating results determined in accordance with GAAP, nor are they necessarily comparable to non - GAAP performance measures that may be presented by other companies . Where non - GAAP financial measures are used, the comparable GAAP financial measure, as well as the reconciliation to the comparable GAAP financial measure, can be found in the appendix to this presentation .

NASDAQ: SFNC COVID - 19 Update
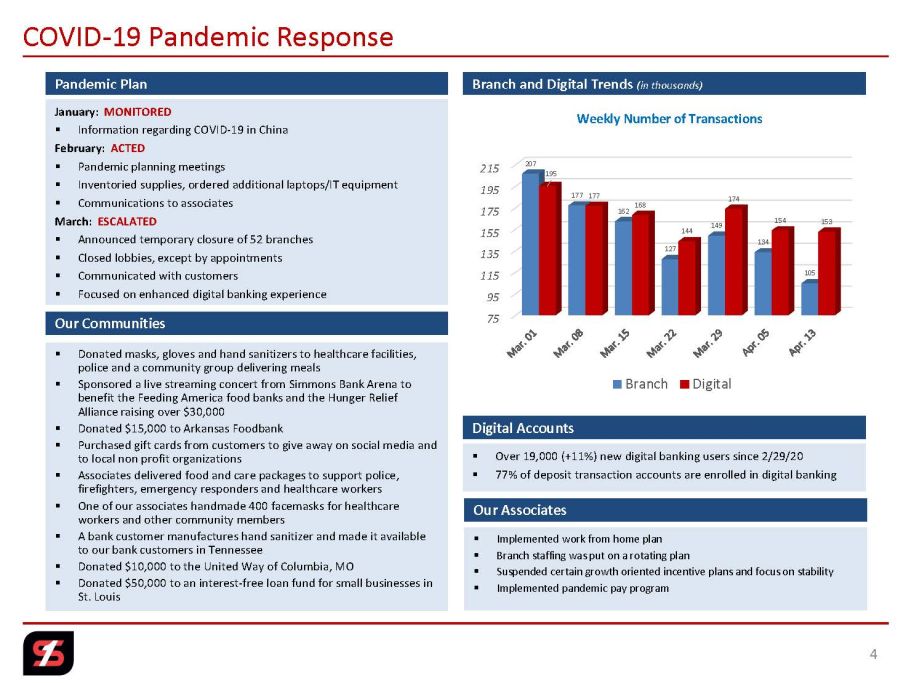
January: MONITORED ▪ Information regarding COVID - 19 in China February: ACTED ▪ Pandemic planning meetings ▪ Inventoried supplies, ordered additional laptops/IT equipment ▪ Communications to associates March: ESCALATED ▪ Announced temporary closure of 52 branches ▪ Closed lobbies, except by appointments ▪ Communicated with customers ▪ Focused on enhanced digital banking experience Pandemic Plan Our Associates ▪ Implemented work from home plan ▪ Branch staffing was put on a rotating plan ▪ Suspended certain growth oriented incentive plans and focus on stability ▪ Implemented pandemic pay program Branch and Digital Trends (in thousands ) COVID - 19 Pandemic Response Our Communities ▪ Donated masks, gloves and hand sanitizers to healthcare facilities, police and a community group delivering meals ▪ Sponsored a live streaming concert from Simmons Bank Arena to benefit the Feeding America food banks and the Hunger Relief Alliance raising over $30,000 ▪ Donated $15,000 to Arkansas Foodbank ▪ Purchased gift cards from customers to give away on social media and to local non profit organizations ▪ Associates delivered food and care packages to support police, firefighters, emergency responders and healthcare workers ▪ One of our associates handmade 400 facemasks for healthcare workers and other community members ▪ A bank customer manufactures hand sanitizer and made it available to our bank customers in Tennessee ▪ Donated $10,000 to the United Way of Columbia, MO ▪ Donated $50,000 to an interest - free loan fund for small businesses in St. Louis 75 95 115 135 155 175 195 215 207 177 162 127 149 134 105 195 177 168 144 174 154 153 Weekly Number of Transactions Branch Digital 4 Digital Accounts ▪ Over 19,000 (+11%) new digital banking users since 2/29/20 ▪ 77% of deposit transaction accounts are enrolled in digital banking
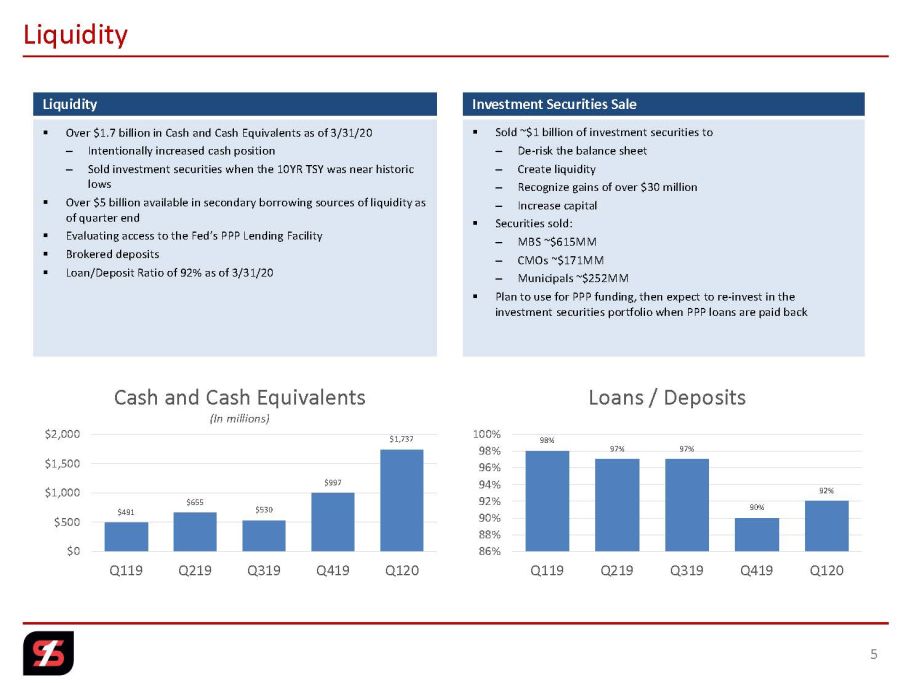
▪ Over $1.7 billion in Cash and Cash Equivalents as of 3/31/20 – Intentionally increased cash position – Sold investment securities when the 10YR TSY was near historic lows ▪ Over $5 billion available in secondary borrowing sources of liquidity as of quarter end ▪ Evaluating access to the Fed’s PPP Lending Facility ▪ Brokered deposits ▪ Loan/Deposit Ratio of 92% as of 3/31/20 Liquidity Liquidity $491 $655 $530 $997 $1,737 $0 $500 $1,000 $1,500 $2,000 Q119 Q219 Q319 Q419 Q120 Cash and Cash Equivalents (In millions ) 98% 97% 97% 90% 92% 86% 88% 90% 92% 94% 96% 98% 100% Q119 Q219 Q319 Q419 Q120 Loans / Deposits ▪ Sold ~$1 billion of investment securities to – De - risk the balance sheet – Create liquidity – Recognize gains of over $30 million – Increase capital ▪ Securities sold: – MBS ~$615MM – CMOs ~$171MM – Municipals ~$252MM ▪ Plan to use for PPP funding, then expect to re - invest in the investment securities portfolio when PPP loans are paid back Investment Securities Sale 5
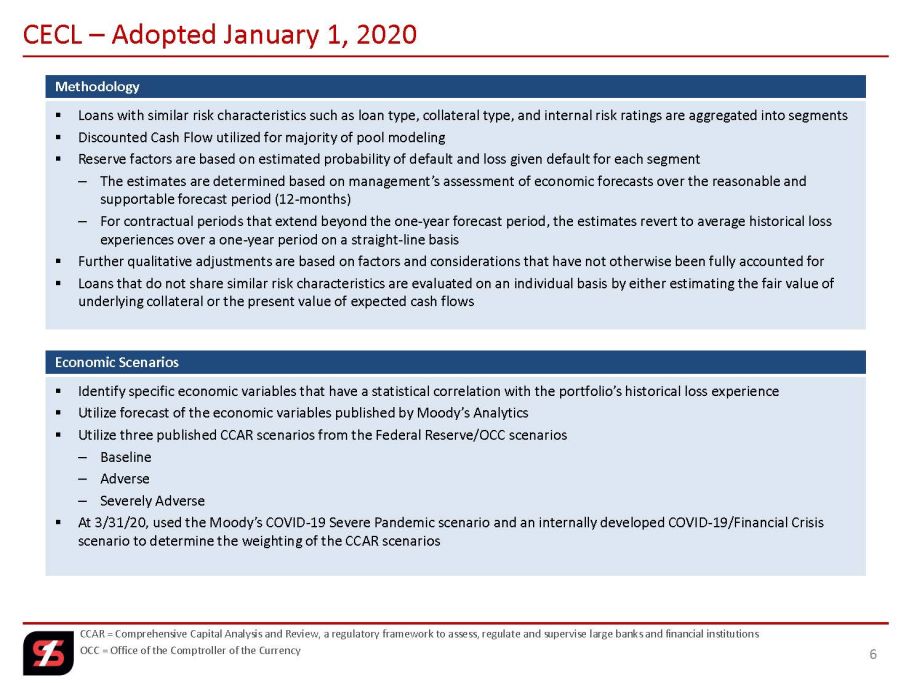
Methodology CECL – Adopted January 1, 2020 ▪ Loans with similar risk characteristics such as loan type, collateral type, and internal risk ratings are aggregated into seg men ts ▪ Discounted Cash Flow utilized for majority of pool modeling ▪ Reserve factors are based on estimated probability of default and loss given default for each segment – The estimates are determined based on management’s assessment of economic forecasts over the reasonable and supportable forecast period (12 - months) – For contractual periods that extend beyond the one - year forecast period, the estimates revert to average historical loss experiences over a one - year period on a straight - line basis ▪ Further qualitative adjustments are based on factors and considerations that have not otherwise been fully accounted for ▪ Loans that do not share similar risk characteristics are evaluated on an individual basis by either estimating the fair value of underlying collateral or the present value of expected cash flows CCAR = Comprehensive Capital Analysis and Review, a regulatory framework to assess, regulate and supervise large banks and fi nan cial institutions OCC = Office of the Comptroller of the Currency Economic Scenarios ▪ Identify specific economic variables that have a statistical correlation with the portfolio’s historical loss experience ▪ Utilize forecast of the economic variables published by Moody’s Analytics ▪ Utilize three published CCAR scenarios from the Federal Reserve/OCC scenarios – Baseline – Adverse – Severely Adverse ▪ At 3/31/20, used the Moody’s COVID - 19 Severe Pandemic scenario and an internally developed COVID - 19/Financial Crisis scenario to determine the weighting of the CCAR scenarios 6
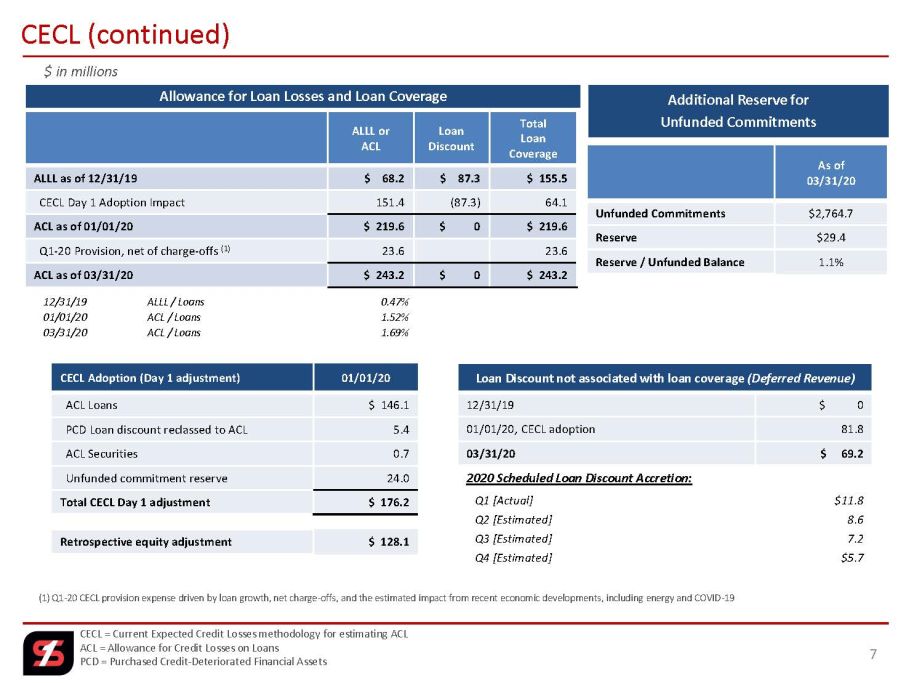
ALLL or ACL Loan Discount Total Loan Coverage ALLL as of 12/31/19 $ 68.2 $ 87.3 $ 155.5 CECL Day 1 Adoption Impact 151.4 (87.3) 64.1 ACL as of 01/01/20 $ 219.6 $ 0 $ 219.6 Q1 - 20 Provision, net of charge - offs ( 1) 23.6 23.6 ACL as of 03/31/20 $ 243.2 $ 0 $ 243.2 Allowance for Loan Losses and Loan Coverage 7 CECL (continued) CECL = Current Expected Credit Losses methodology for estimating ACL ACL = Allowance for Credit Losses on Loans PCD = Purchased Credit - Deteriorated Financial Assets CECL Adoption (Day 1 adjustment ) 01/01/20 ACL Loans $ 146.1 PCD Loan discount reclassed to ACL 5.4 ACL Securities 0.7 Unfunded commitment reserve 24.0 Total CECL Day 1 adjustment $ 176.2 Retrospective equity adjustment $ 128.1 Loan Discount not associated with loan coverage (Deferred Revenue) 12/31/19 $ 0 01/01/20, CECL adoption 81.8 03/31/20 $ 69.2 2020 Scheduled Loan Discount Accretion: Q1 [Actual] $11.8 Q2 [ Estimated] 8.6 Q3 [ Estimated] 7.2 Q4 [Estimated] $5.7 12/31/19 ALLL / Loans 0.47% 01/01/20 ACL / Loans 1.52% 03/31/20 ACL / Loans 1.69% $ in millions (1) Q1 - 20 CECL provision expense driven by loan growth, net charge - offs, and the estimated impact from recent economic developme nts, including energy and COVID - 19 As of 03/31/20 Unfunded Commitments $2,764.7 Reserve $29.4 Reserve / Unfunded Balance 1.1% Additional Reserve for Unfunded Commitments
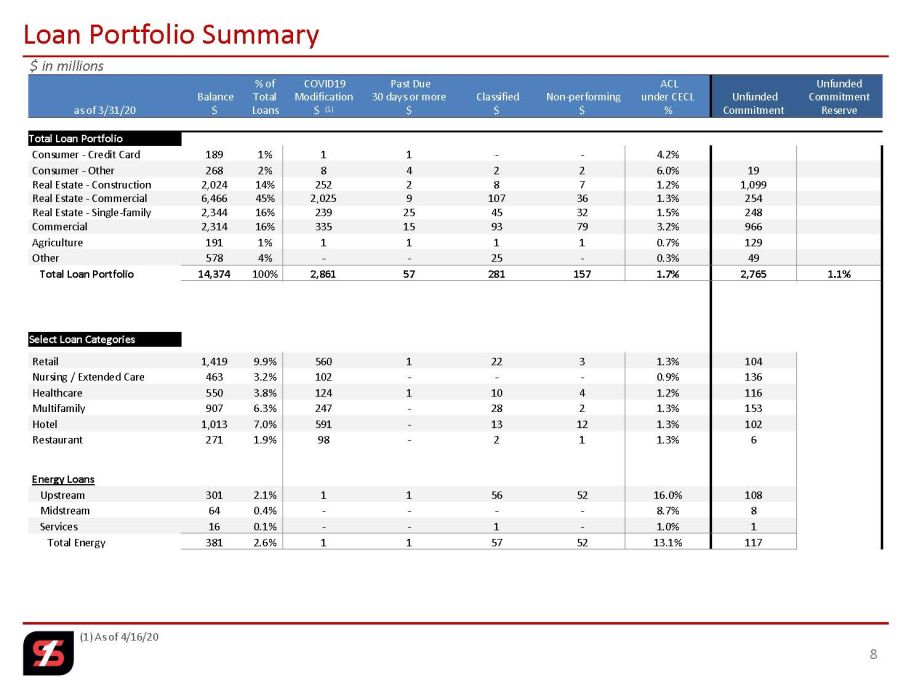
(1) As of 4/16/20 Loan Portfolio Summary as of 3/31/20 Balance $ % of Total Loans COVID19 Modification $ (1) Past Due 30 days or more $ Classified $ Non - performing $ ACL under CECL % Unfunded Commitment Unfunded Commitment Reserve Total Loan Portfolio Consumer - Credit Card 189 1% 1 1 - - 4.2% Consumer - Other 268 2% 8 4 2 2 6.0% 19 Real Estate - Construction 2,024 14% 252 2 8 7 1.2% 1,099 Real Estate - Commercial 6,466 45% 2,025 9 107 36 1.3% 254 Real Estate - Single - family 2,344 16% 239 25 45 32 1.5% 248 Commercial 2,314 16% 335 15 93 79 3.2% 966 Agriculture 191 1% 1 1 1 1 0.7% 129 Other 578 4% - - 25 - 0.3% 49 Total Loan Portfolio 14,374 100% 2,861 57 281 157 1.7% 2,765 1.1% Select Loan Categories Retail 1,419 9.9% 560 1 22 3 1.3% 104 Nursing / Extended Care 463 3.2% 102 - - - 0.9% 136 Healthcare 550 3.8% 124 1 10 4 1.2% 116 Multifamily 907 6.3% 247 - 28 2 1.3% 153 Hotel 1,013 7.0% 591 - 13 12 1.3% 102 Restaurant 271 1.9% 98 - 2 1 1.3% 6 Energy Loans Upstream 301 2.1% 1 1 56 52 16.0% 108 Midstream 64 0.4% - - - - 8.7% 8 Services 16 0.1% - - 1 - 1.0% 1 Total Energy 381 2.6% 1 1 57 52 13.1% 117 8 $ in millions

Outstanding Balance as of March 31, 2020 Construction Loans Commercial CRE Total Loans Loan Portfolio – Geographic Diversification 12.2% 9.1% 7.0% 5.0% 4.0% 3.3% 3.0% 56.4% Dallas Fort Worth St. Louis Little Rock Oklahoma City Nashville Columbia, MO All other markets $14.4 billion 9 24.8% 13.5% 5.7% 3.5% 2.8% 2.5% 2.2% 45.0% Dallas Fort Worth Nashville Little Rock St. Louis Columbia, MO Houston All other markets 12.8% 12.0% 11.0% 4.8% 4.7% 3.2% 2.2% 49.3% Dallas St. Louis Fort Worth Oklahoma City Little Rock Nashville Columbia, MO All other markets $6.5 billion $2.0 billion 12.4% 8.3% 7.9% 7.1% 4.5% 3.7% 3.4% 52.7% Dallas Fort Worth Little Rock Oklahoma City Houston Denver St. Louis All other markets $2.3 billion
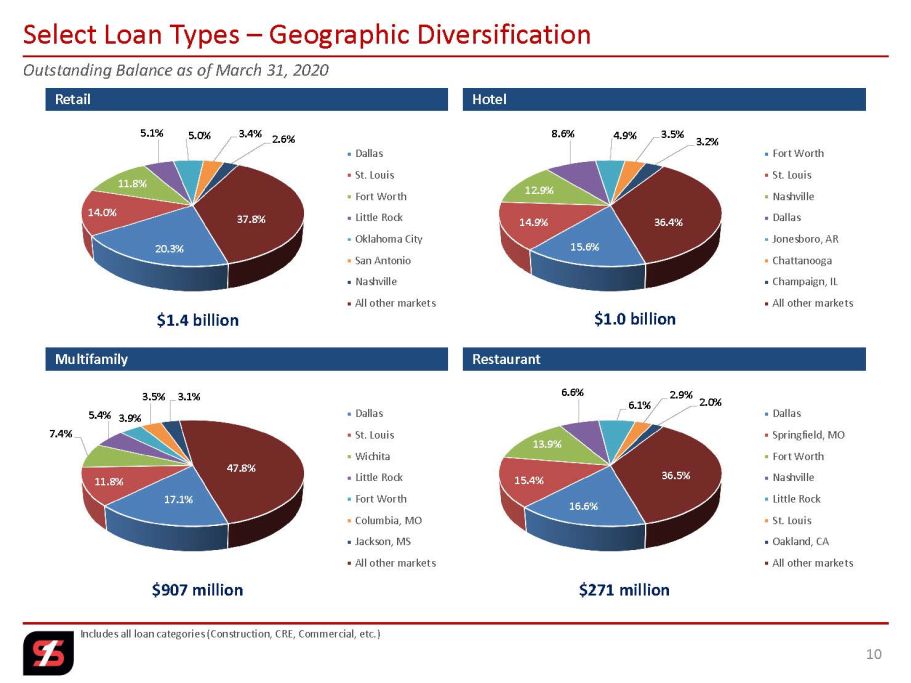
16.6% 15.4% 13.9% 6.6% 6.1% 2.9% 2.0% 36.5% Dallas Springfield, MO Fort Worth Nashville Little Rock St. Louis Oakland, CA All other markets 17.1% 11.8% 7.4% 5.4% 3.9% 3.5% 3.1% 47.8% Dallas St. Louis Wichita Little Rock Fort Worth Columbia, MO Jackson, MS All other markets 15.6% 14.9% 12.9% 8.6% 4.9% 3.5% 3.2% 36.4% Fort Worth St. Louis Nashville Dallas Jonesboro, AR Chattanooga Champaign, IL All other markets Outstanding Balance as of March 31, 2020 Retail Multifamily Hotel Restaurant Select Loan Types – Geographic Diversification Includes all loan categories (Construction, CRE, Commercial, etc.) $1.4 billion $1.0 billion $907 million $271 million 10 20.3% 14.0% 11.8% 5.1% 5.0% 3.4% 2.6% 37.8% Dallas St. Louis Fort Worth Little Rock Oklahoma City San Antonio Nashville All other markets
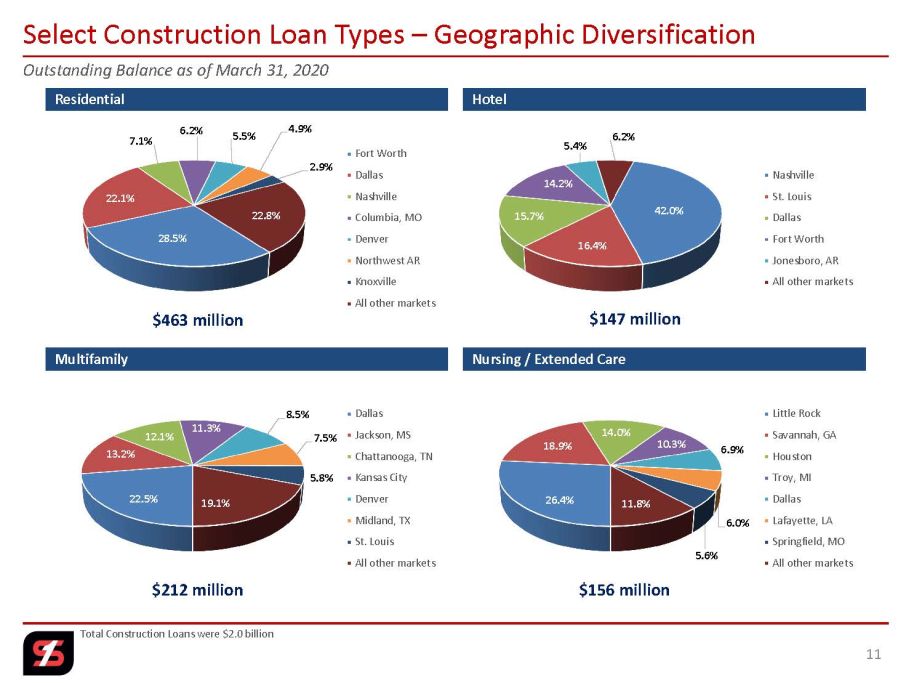
22.5% 13.2% 12.1% 11.3% 8.5% 7.5% 5.8% 19.1% Dallas Jackson, MS Chattanooga, TN Kansas City Denver Midland, TX St. Louis All other markets 26.4% 18.9% 14.0% 10.3% 6.9% 6.0% 5.6% 11.8% Little Rock Savannah, GA Houston Troy, MI Dallas Lafayette, LA Springfield, MO All other markets 42.0% 16.4% 15.7% 14.2% 5.4% 6.2% Nashville St. Louis Dallas Fort Worth Jonesboro, AR All other markets 28.5% 22.1% 7.1% 6.2% 5.5% 4.9% 2.9% 22.8% Fort Worth Dallas Nashville Columbia, MO Denver Northwest AR Knoxville All other markets Outstanding Balance as of March 31, 2020 Residential Multifamily Hotel Nursing / Extended Care Select Construction Loan Types – Geographic Diversification Total Construction Loans were $2.0 billion $463 million $147 million $212 million $156 million 11
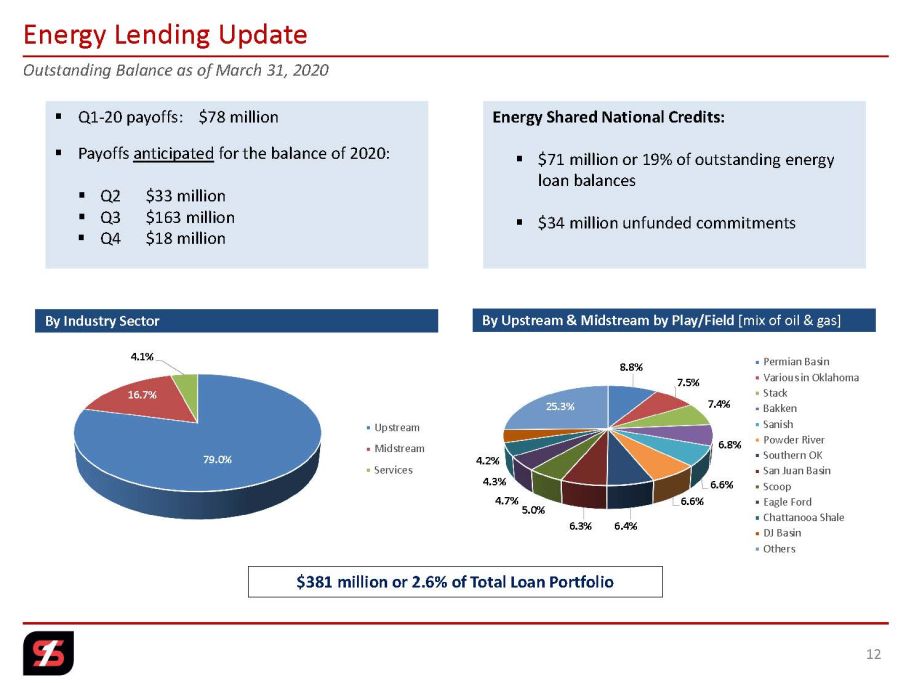
▪ Q1 - 20 payoffs: $78 million ▪ Payoffs anticipated for the balance of 2020: ▪ Q2 $33 million ▪ Q3 $163 million ▪ Q4 $18 million Outstanding Balance as of March 31, 2020 Energy Lending Update 12 79.0% 16.7% 4.1% Upstream Midstream Services By Industry Sector 8.8% 7.5% 7.4% 6.8% 6.6% 6.6% 6.4% 6.3% 5.0% 4.7% 4.3% 4.2% 25.3% Permian Basin Various in Oklahoma Stack Bakken Sanish Powder River Southern OK San Juan Basin Scoop Eagle Ford Chattanooa Shale DJ Basin Others $381 million or 2.6% of Total Loan Portfolio By Upstream & Midstream by Play/Field [mix of oil & gas] Energy Shared National Credits: ▪ $71 million or 19% of outstanding energy loan balances ▪ $34 million unfunded commitments
▪ Commodity prices are lower than 2019 and have been volatile ▪ COVID - 19 resulted in lower exports and oversupply, putting more pressure on commodity pricing ▪ Energy input cost is down considerably ▪ There has been a considerable amount of rainfall this year, resulting in delayed planting ▪ Many farmers are participating in the SBA PPP loan program ▪ On April 17, 2020, President Trump announced a $19 billion Coronavirus Relief Program for farmers and food producers Agriculture Seasonal Loan Production – 3/31/20 vs. 3/31/19 $ in millions 3/31/20 3/31/19 Change $ Change % Total $187.8 $148.1 $39.7 26.8% Agricultural Lending Update 13
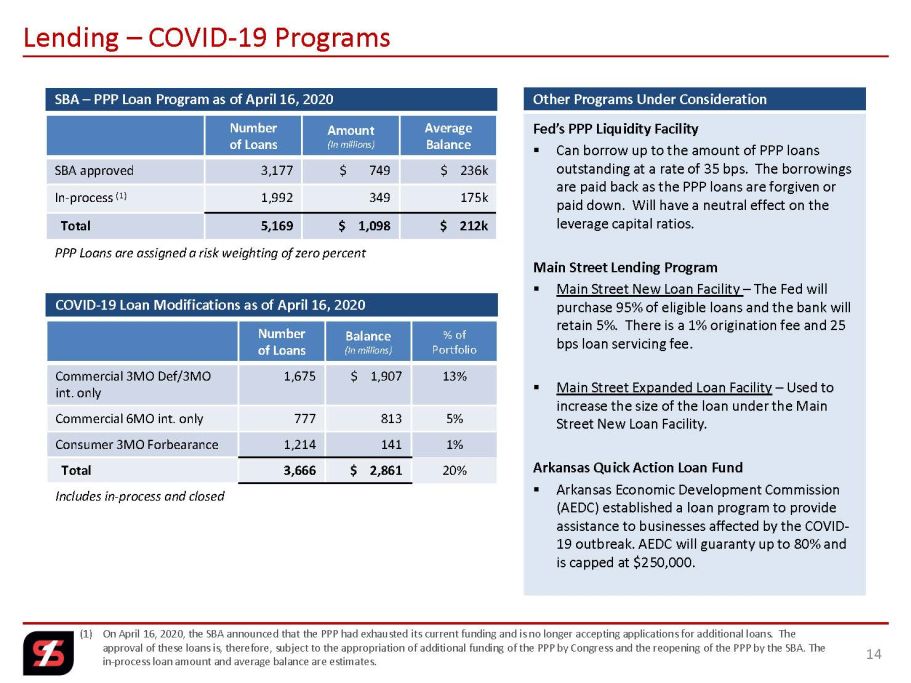
Number of Loans Amount (In millions) Average Balance SBA approved 3,177 $ 749 $ 236k In - process (1) 1,992 349 175k Total 5,169 $ 1,098 $ 212k PPP Loans are assigned a risk weighting of zero percent SBA – PPP Loan Program as of April 16, 2020 COVID - 19 Loan Modifications as of April 16, 2020 Lending – COVID - 19 Programs (1) On April 16, 2020, the SBA announced that the PPP had exhausted its current funding and is no longer accepting applications f or additional loans. The approval of these loans is, therefore, subject to the appropriation of additional funding of the PPP by Congress and the reop eni ng of the PPP by the SBA. The in - process loan amount and average balance are estimates. Other Programs Under Consideration Number of Loans Balance (In millions) % of Portfolio Commercial 3MO Def/3MO int. only 1,675 $ 1,907 13% Commercial 6MO int. only 777 813 5% Consumer 3MO Forbearance 1,214 141 1% Total 3,666 $ 2,861 20% Includes in - process and closed Fed’s PPP Liquidity Facility ▪ Can borrow up to the amount of PPP loans outstanding at a rate of 35 bps. The borrowings are paid back as the PPP loans are forgiven or paid down. Will have a neutral effect on the leverage capital ratios. Main Street Lending Program ▪ Main Street New Loan Facility – The Fed will purchase 95% of eligible loans and the bank will retain 5%. There is a 1% origination fee and 25 bps loan servicing fee. ▪ Main Street Expanded Loan Facility – Used to increase the size of the loan under the Main Street New Loan Facility. Arkansas Quick Action Loan Fund ▪ Arkansas Economic Development Commission (AEDC) established a loan program to provide assistance to businesses affected by the COVID - 19 outbreak. AEDC will guaranty up to 80% and is capped at $250,000. 14
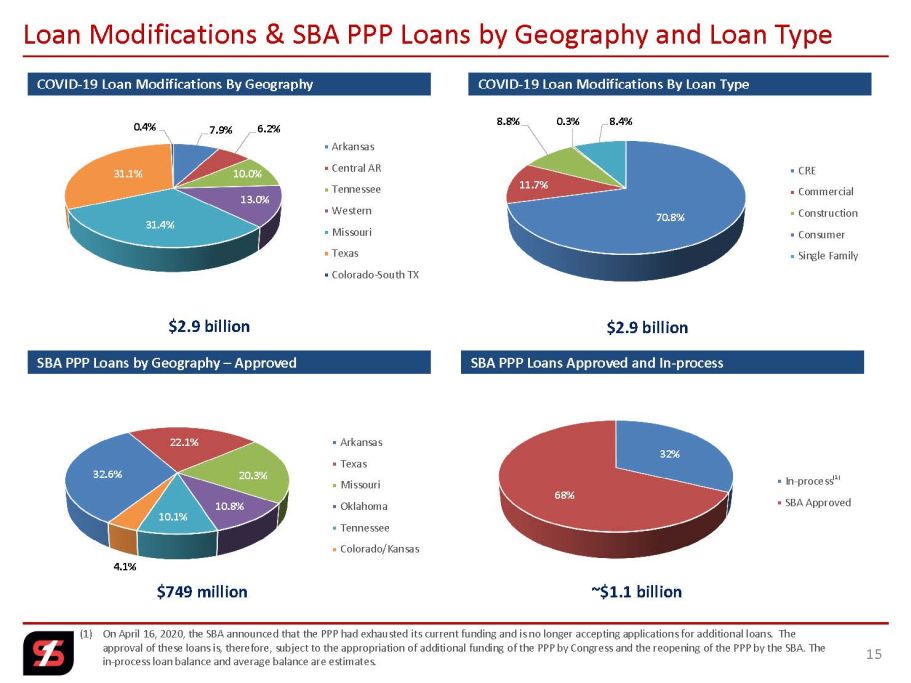
32.6% 22.1% 20.3% 10.8% 10.1% 4.1% Arkansas Texas Missouri Oklahoma Tennessee Colorado/Kansas 7.9% 6.2% 10.0% 13.0% 31.4% 31.1% 0.4% Arkansas Central AR Tennessee Western Missouri Texas Colorado-South TX COVID - 19 Loan Modifications By Geography COVID - 19 Loan Modifications By Loan Type Loan Modifications & SBA PPP Loans by Geography and Loan Type 70.8% 11.7% 8.8% 0.3% 8.4% CRE Commercial Construction Consumer Single Family $2.9 billion $2.9 billion 15 SBA PPP Loans by Geography – Approved SBA PPP Loans Approved and In - process 32% 68% In-process SBA Approved $749 million ~$1.1 billion (1) (1) On April 16, 2020, the SBA announced that the PPP had exhausted its current funding and is no longer accepting applications f or additional loans. The approval of these loans is, therefore, subject to the appropriation of additional funding of the PPP by Congress and the reop eni ng of the PPP by the SBA. The in - process loan balance and average balance are estimates.

Total Common Equity Common Equity to Assets Tangible Common Equity (1) Tangible Common Equity to Tangible Assets (1) As of 12/31/19 $ 2,988 14.06% $ 1,805 8.99% As of 01/01/20, with CECL Day 1 adjustment 2,861 13.46% $ 1,678 8.36% As of 03/31/20 $ 2,845 13.65% $ 1,658 8.44% Regulatory Capital Ratios 16 Capital, Including Impact of CECL (1) Tangible common equity (which excludes goodwill and other intangible assets), as well as figures based on tangible common equ ity , are non - GAAP measurements. See Appendix for non - GAAP reconciliations. $ in millions Tier 1 Capital Tier 2 Capital Common Equity Tier 1 (CET1) Tier 1 Leverage Tier 1 Risk - based Capital Total Risk - based Capital As of 12/31/19 $ 1,808 $ 2,273 10.92% 9.59% 10.92% 13.73% As of 01/01/20, with CECL Day 1 adjustment $ 1,813 $ 2,273 10.92% 9.59% 10.92% 13.73% As of 03/31/20 $ 1,778 $ 2,262 11.10% 8.96% 11.10% 14.13% Regulatory “Well Capitalized” 6.50% 5.00% 8.00% 10.00% Note: The Company plans to elect the 5 year phase - in of the CECL Day 1 impact to Regulatory Capital Capital Ratios As of 3/31/20 % of Total Capital C&D 89% CRE 291% Loan Concentration Capital Impact from Participation in SBA PPP Loan Program ▪ PPP loans will be assigned a risk weight of zero percent Impact of Participation in the Fed’s PPPLF Program ▪ Neutralize the effect of PPP loans financed under the PPPLF program on leverage capital ratios
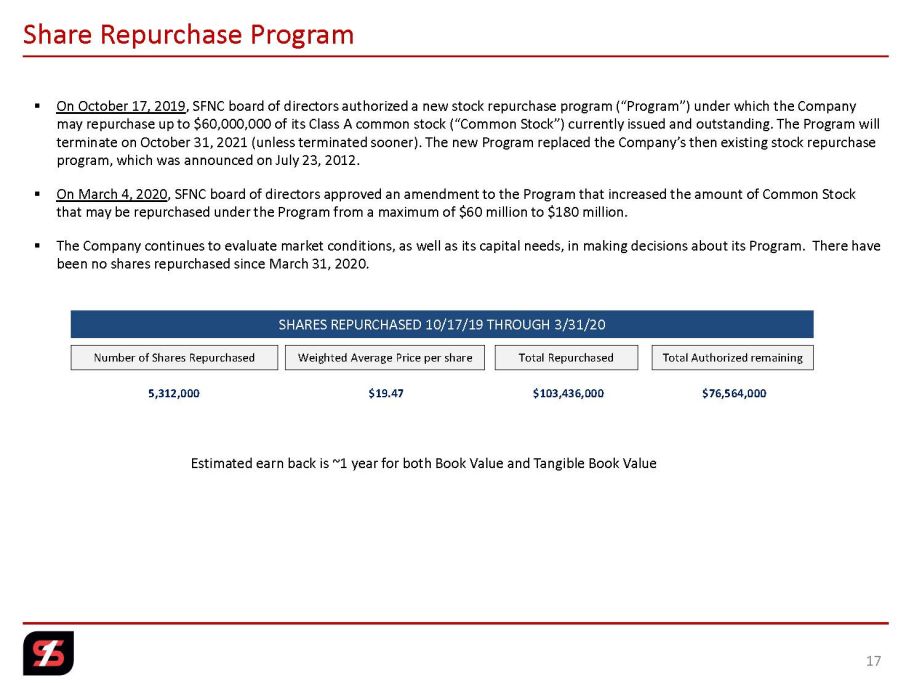
Share Repurchase Program 17 Number of Shares Repurchased Total Authorized remaining Weighted Average Price per share 5,312,000 $19.47 $76,564,000 ▪ On October 17, 2019 , SFNC board of directors authorized a new stock repurchase program (“Program”) under which the Company may repurchase up to $60,000,000 of its Class A common stock (“Common Stock”) currently issued and outstanding. The Program w ill terminate on October 31, 2021 (unless terminated sooner). The new Program replaced the Company’s then existing stock repurcha se program, which was announced on July 23, 2012. ▪ On March 4, 2020 , SFNC board of directors approved an amendment to the Program that increased the amount of Common Stock that may be repurchased under the Program from a maximum of $60 million to $180 million. ▪ The Company continues to evaluate market conditions, as well as its capital needs, in making decisions about its Program. Th ere have been no shares repurchased since March 31, 2020. SHARES REPURCHASED 10/17/19 THROUGH 3/31/20 Total Repurchased $103,436,000 Estimated earn back is ~1 year for both Book Value and Tangible Book Value
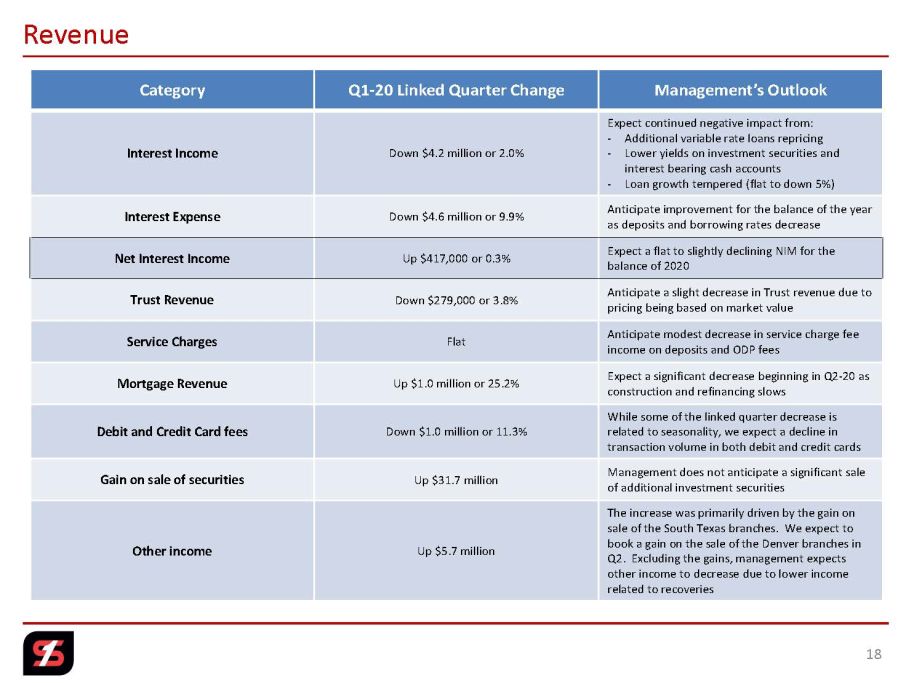
Category Q1 - 20 Linked Quarter Change Management’s Outlook Interest Income Down $4.2 million or 2.0% Expect continued negative impact from: - Additional variable rate loans repricing - Lower yields on investment securities and interest bearing cash accounts - Loan growth tempered (flat to down 5%) Interest Expense Down $4.6 million or 9.9% Anticipate improvement for the balance of the year as deposits and borrowing rates decrease Net Interest Income Up $417,000 or 0.3% Expect a flat to slightly declining NIM for the balance of 2020 Trust Revenue Down $279,000 or 3.8% Anticipate a slight decrease in Trust revenue due to pricing being based on market value Service Charges Flat Anticipate modest decrease in service charge fee income on deposits and ODP fees Mortgage Revenue Up $1.0 million or 25.2% Expect a significant decrease beginning in Q2 - 20 as construction and refinancing slows Debit and Credit Card fees Down $1.0 million or 11.3% While some of the linked quarter decrease is related to seasonality, we expect a decline in transaction volume in both debit and credit cards Gain on sale of securities Up $31.7 million Management does not anticipate a significant sale of additional investment securities Other income Up $5.7 million The increase was primarily driven by the gain on sale of the South Texas branches. We expect to book a gain on the sale of the Denver branches in Q2. Excluding the gains, management expects other income to decrease due to lower income related to recoveries Revenue 18
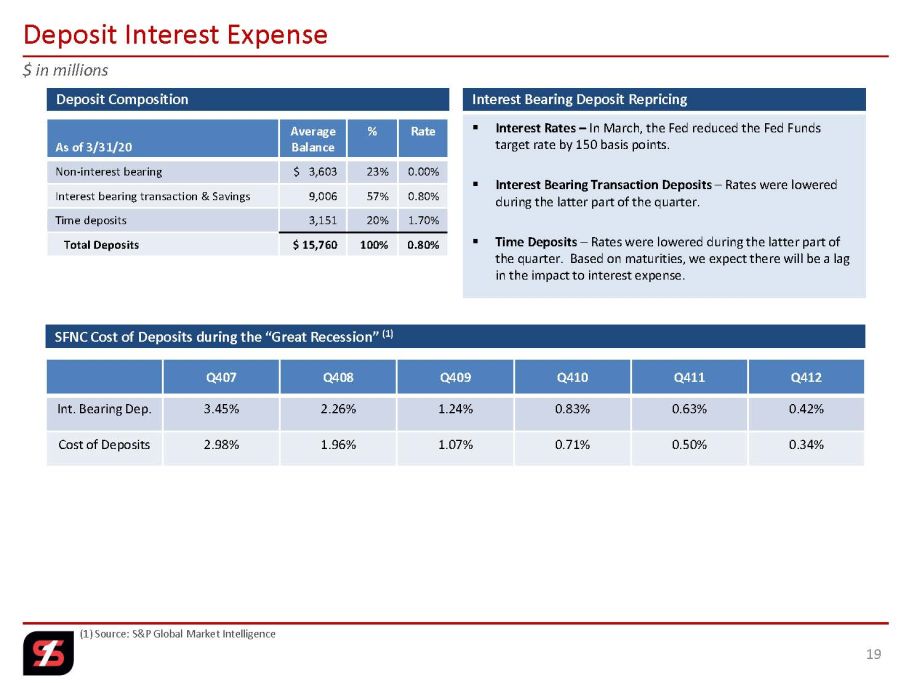
▪ Interest Rates – In March, the Fed reduced the Fed Funds target rate by 150 basis points. ▪ Interest Bearing Transaction Deposits – Rates were lowered during the latter part of the quarter. ▪ Time Deposits – Rates were lowered during the latter part of the quarter. Based on maturities, we expect there will be a lag in the impact to interest expense. $ in millions Interest Bearing Deposit Repricing Deposit Composition Deposit Interest Expense (1) Source: S&P Global Market Intelligence Q407 Q408 Q409 Q410 Q411 Q412 Int . Bearing Dep . 3.45% 2.26% 1.24% 0.83% 0.63% 0.42% Cost of Deposits 2.98% 1.96% 1.07% 0.71% 0.50% 0.34% SFNC Cost of Deposits during the “Great Recession” (1) As of 3/31/20 Average Balance % Rate Non - interest bearing $ 3,603 23% 0.00% Interest bearing transaction & Savings 9,006 57% 0.80% Time deposits 3,151 20% 1.70% Total Deposits $ 15,760 100% 0.80% 19
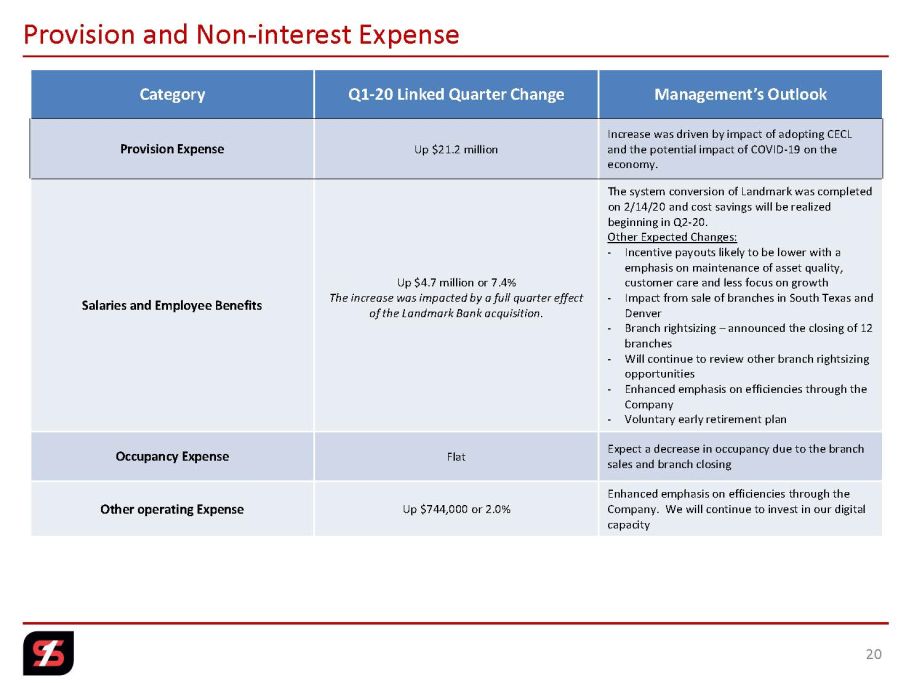
Category Q1 - 20 Linked Quarter Change Management’s Outlook Provision Expense Up $21.2 million Increase was driven by impact of adopting CECL and the potential impact of COVID - 19 on the economy. Salaries and Employee Benefits Up $4.7 million or 7.4% The increase was impacted by a full quarter effect of the Landmark Bank acquisition. The system conversion of Landmark was completed on 2/14/20 and cost savings will be realized beginning in Q2 - 20. Other Expected Changes: - Incentive payouts likely to be lower with a emphasis on maintenance of asset quality, customer care and less focus on growth - Impact from sale of branches in South Texas and Denver - Branch rightsizing – announced the closing of 12 branches - Will continue to review other branch rightsizing opportunities - Enhanced emphasis on efficiencies through the Company - Voluntary early retirement plan Occupancy Expense Flat Expect a decrease in occupancy due to the branch sales and branch closing Other operating Expense Up $744,000 or 2.0% Enhanced emphasis on efficiencies through the Company. We will continue to invest in our digital capacity Provision and Non - interest Expense 20
NASDAQ: SFNC Quarterly Review
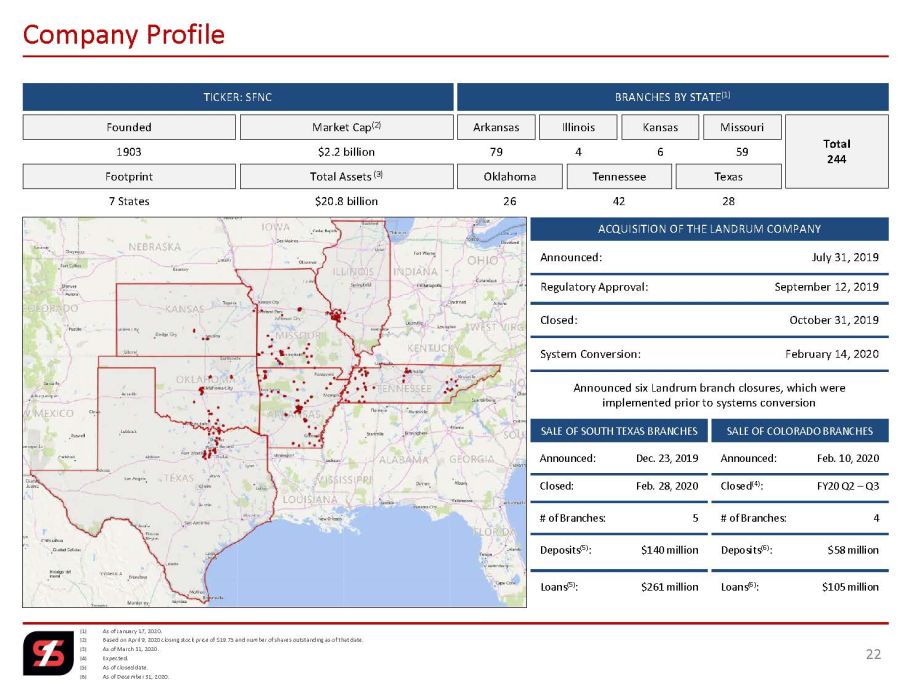
(1) As of January 17, 2020. (2) Based on April 9, 2020 closing stock price of $19.75 and number of shares outstanding as of that date. (3) As of March 31, 2020. (4) Expected. (5) As of closed date. (6) As of December 31, 2020. Company Profile BRANCHES BY STATE (1) TICKER: SFNC Founded Footprint Total Assets (3) Market Cap (2) 1903 $2.2 billion $20.8 billion 7 States Texas Oklahoma Tennessee Arkansas Missouri Kansas 79 28 6 59 26 42 Total 244 Illinois 4 ACQUISITION OF THE LANDRUM COMPANY Announced: Regulatory Approval: Closed: System Conversion: Announced six Landrum branch closures, which were implemented prior to systems conversion July 31, 2019 September 12, 2019 February 14, 2020 October 31, 2019 22 SALE OF SOUTH TEXAS BRANCHES Announced: Dec. 23, 2019 Closed: Feb. 28, 2020 # of Branches: 5 Deposits (5) : $140 million SALE OF COLORADO BRANCHES Announced: Feb. 10, 2020 Closed (4) : FY20 Q2 – Q3 # of Branches: 4 Deposits (6) : $58 million Loans (5) : $261 million Loans (6) : $105 million
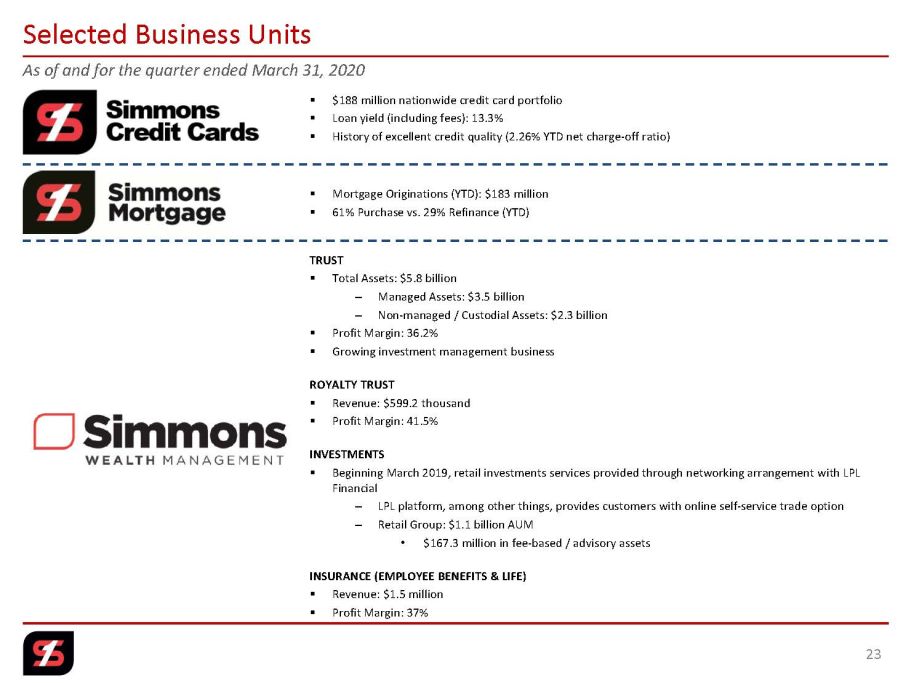
As of and for the quarter ended March 31, 2020 23 Selected Business Units ▪ $188 million nationwide credit card portfolio ▪ Loan yield (including fees): 13.3% ▪ History of excellent credit quality (2.26% YTD net charge - off ratio) TRUST ▪ Total Assets: $5.8 billion – Managed Assets: $3.5 billion – Non - managed / Custodial Assets: $2.3 billion ▪ Profit Margin: 36.2% ▪ Growing investment management business ROYALTY TRUST ▪ Revenue: $599.2 thousand ▪ Profit Margin: 41.5% INVESTMENTS ▪ Beginning March 2019, retail investments services provided through networking arrangement with LPL Financial – LPL platform, among other things, provides customers with online self - service trade option – Retail Group: $1.1 billion AUM • $167.3 million in fee - based / advisory assets INSURANCE (EMPLOYEE BENEFITS & LIFE) ▪ Revenue: $1.5 million ▪ Profit Margin: 37% ▪ Mortgage Originations (YTD): $183 million ▪ 61% Purchase vs. 29% Refinance (YTD)
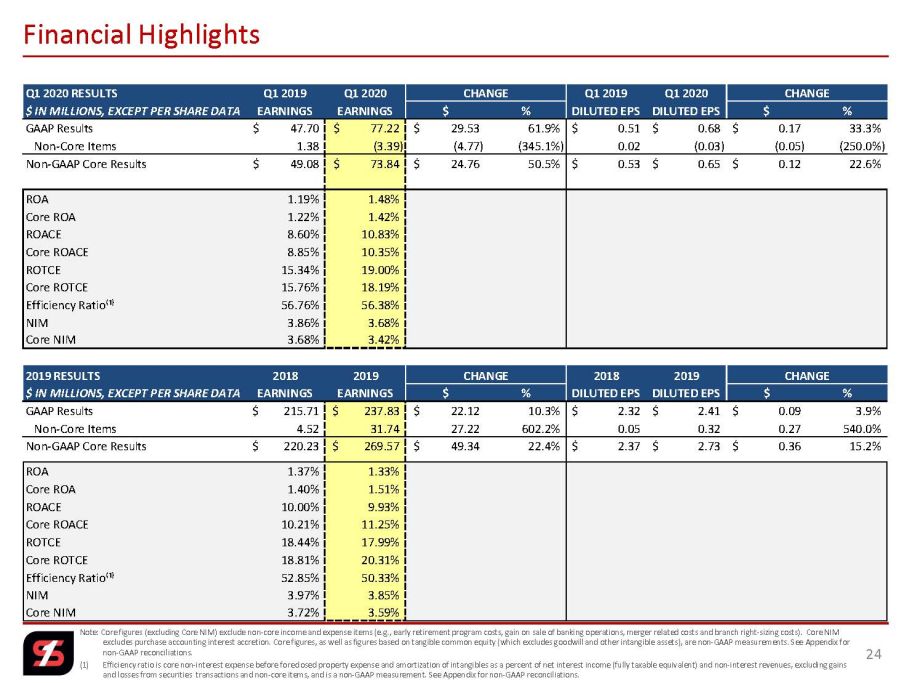
Note: Core figures (excluding Core NIM) exclude non - core income and expense items (e.g., early retirement program costs, gain on sale of banking operations, merger related costs and branch right - sizing costs). Core NIM excludes purchase accounting interest accretion. Core figures, as well as figures based on tangible common equity (which excl ude s goodwill and other intangible assets), are non - GAAP measurements. See Appendix for non - GAAP reconciliations. (1) Efficiency ratio is core non - interest expense before foreclosed property expense and amortization of intangibles as a percent of net interest income (fully taxable equivalent) and non - interest revenues, excluding gains and losses from securities transactions and non - core items, and is a non - GAAP measurement. See Appendix for non - GAAP reconcilia tions. 24 Financial Highlights Q1 2020 RESULTS Q1 2019 Q1 2020 CHANGE Q1 2019 Q1 2020 CHANGE $ IN MILLIONS, EXCEPT PER SHARE DATA EARNINGS EARNINGS $ % DILUTED EPS DILUTED EPS $ % GAAP Results 47.70$ 77.22$ 29.53$ 61.9% 0.51$ 0.68$ 0.17$ 33.3% Non-Core Items 1.38 (3.39) (4.77) (345.1%) 0.02 (0.03) (0.05) (250.0%) Non-GAAP Core Results 49.08$ 73.84$ 24.76$ 50.5% 0.53$ 0.65$ 0.12$ 22.6% ROA 1.19% 1.48% Core ROA 1.22% 1.42% ROACE 8.60% 10.83% Core ROACE 8.85% 10.35% ROTCE 15.34% 19.00% Core ROTCE 15.76% 18.19% Efficiency Ratio⁽¹⁾ 56.76% 56.38% NIM 3.86% 3.68% Core NIM 3.68% 3.42% 2019 RESULTS 2018 2019 CHANGE 2018 2019 CHANGE $ IN MILLIONS, EXCEPT PER SHARE DATA EARNINGS EARNINGS $ % DILUTED EPS DILUTED EPS $ % GAAP Results 215.71$ 237.83$ 22.12$ 10.3% 2.32$ 2.41$ 0.09$ 3.9% Non-Core Items 4.52 31.74 27.22 602.2% 0.05 0.32 0.27 540.0% Non-GAAP Core Results 220.23$ 269.57$ 49.34$ 22.4% 2.37$ 2.73$ 0.36$ 15.2% ROA 1.37% 1.33% Core ROA 1.40% 1.51% ROACE 10.00% 9.93% Core ROACE 10.21% 11.25% ROTCE 18.44% 17.99% Core ROTCE 18.81% 20.31% Efficiency Ratio⁽¹⁾ 52.85% 50.33% NIM 3.97% 3.85% Core NIM 3.72% 3.59%
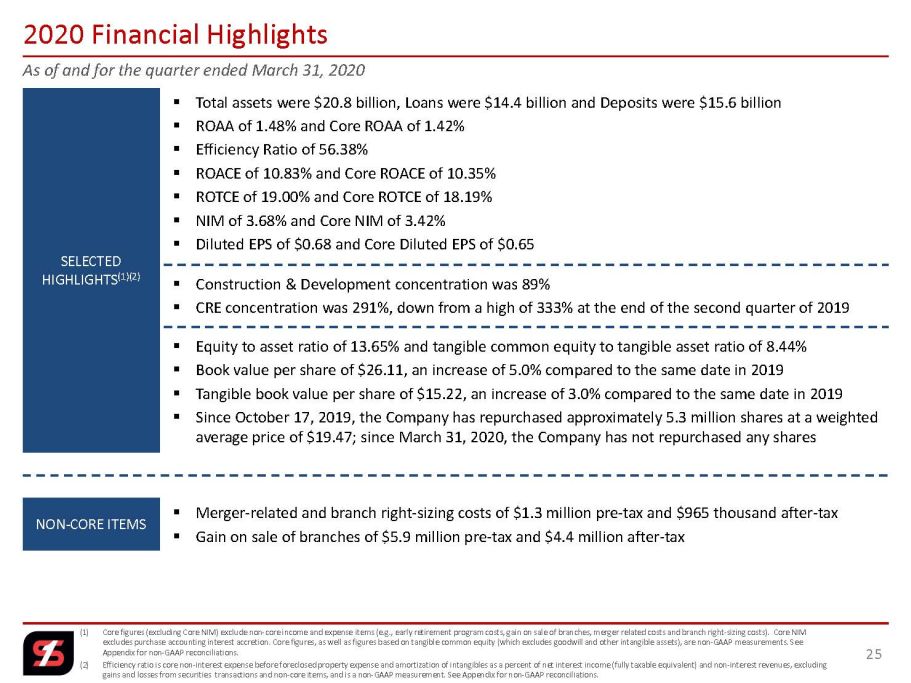
As of and for the quarter ended March 31, 2020 (1) Core figures (excluding Core NIM) exclude non - core income and expense items (e.g., early retirement program costs, gain on sale of branches, merger related costs and branch right - sizing costs). Core NIM excludes purchase accounting interest accretion. Core figures, as well as figures based on tangible common equity (which excl ude s goodwill and other intangible assets), are non - GAAP measurements. See Appendix for non - GAAP reconciliations. (2) Efficiency ratio is core non - interest expense before foreclosed property expense and amortization of intangibles as a percent of net interest income (fully taxable equivalent) and non - interest revenues, excluding gains and losses from securities transactions and non - core items, and is a non - GAAP measurement. See Appendix for non - GAAP reco nciliations. 25 2020 Financial Highlights NON - CORE ITEMS SELECTED HIGHLIGHTS (1)(2) ▪ Merger - related and branch right - sizing costs of $1.3 million pre - tax and $965 thousand after - tax ▪ Gain on sale of branches of $5.9 million pre - tax and $4.4 million after - tax ▪ Total assets were $20.8 billion, Loans were $14.4 billion and Deposits were $15.6 billion ▪ ROAA of 1.48% and Core ROAA of 1.42% ▪ Efficiency Ratio of 56.38% ▪ ROACE of 10.83% and Core ROACE of 10.35% ▪ ROTCE of 19.00% and Core ROTCE of 18.19% ▪ NIM of 3.68% and Core NIM of 3.42% ▪ Diluted EPS of $0.68 and Core Diluted EPS of $0.65 ▪ Equity to asset ratio of 13.65% and tangible common equity to tangible asset ratio of 8.44% ▪ Book value per share of $26.11, an increase of 5.0% compared to the same date in 2019 ▪ Tangible book value per share of $15.22, an increase of 3.0% compared to the same date in 2019 ▪ Since October 17, 2019, the Company has repurchased approximately 5.3 million shares at a weighted average price of $19.47; since March 31, 2020, the Company has not repurchased any shares ▪ Construction & Development concentration was 89% ▪ CRE concentration was 291%, down from a high of 333% at the end of the second quarter of 2019
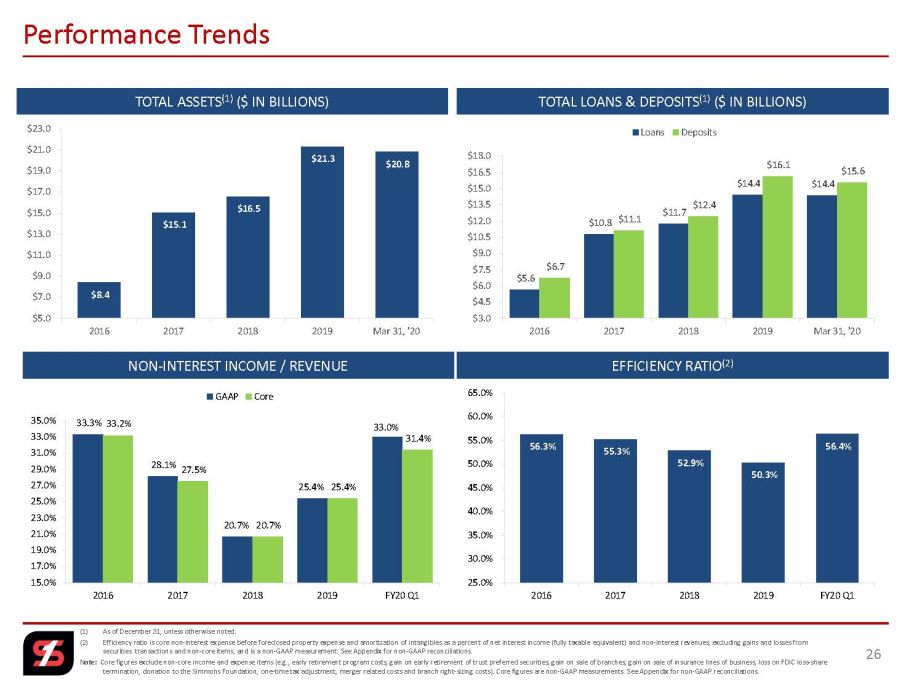
(1) As of December 31, unless otherwise noted. (2) Efficiency ratio is core non - interest expense before foreclosed property expense and amortization of intangibles as a percent of net interest income (fully taxable equivalent) and non - interest revenues, excluding gains and losses from securities transactions and non - core items, and is a non - GAAP measurement. See Appendix for non - GAAP reconciliations. Note: Core figures exclude non - core income and expense items (e.g., early retirement program costs, gain on early retirement of trus t preferred securities, gain on sale of branches, gain on sale of insurance lines of business, loss on FDIC loss - share termination, donation to the Simmons Foundation, one - time tax adjustment, merger related costs and branch right - sizing costs). C ore figures are non - GAAP measurements. See Appendix for non - GAAP reconciliations. 26 Performance Trends TOTAL ASSETS (1) ($ IN BILLIONS) EFFICIENCY RATIO (2) NON - INTEREST INCOME / REVENUE TOTAL LOANS & DEPOSITS (1) ($ IN BILLIONS) 56.3% 55.3% 52.9% 50.3% 56.4% 25.0% 30.0% 35.0% 40.0% 45.0% 50.0% 55.0% 60.0% 65.0% 2016 2017 2018 2019 FY20 Q1 33.3% 28.1% 20.7% 25.4% 33.0% 33.2% 27.5% 20.7% 25.4% 31.4% 15.0% 17.0% 19.0% 21.0% 23.0% 25.0% 27.0% 29.0% 31.0% 33.0% 35.0% 2016 2017 2018 2019 FY20 Q1 GAAP Core $8.4 $15.1 $16.5 $21.3 $20.8 $5.0 $7.0 $9.0 $11.0 $13.0 $15.0 $17.0 $19.0 $21.0 $23.0 2016 2017 2018 2019 Mar 31, '20 $5.6 $10.8 $11.7 $14.4 $14.4 $6.7 $11.1 $12.4 $16.1 $15.6 $3.0 $4.5 $6.0 $7.5 $9.0 $10.5 $12.0 $13.5 $15.0 $16.5 $18.0 2016 2017 2018 2019 Mar 31, '20 Loans Deposits
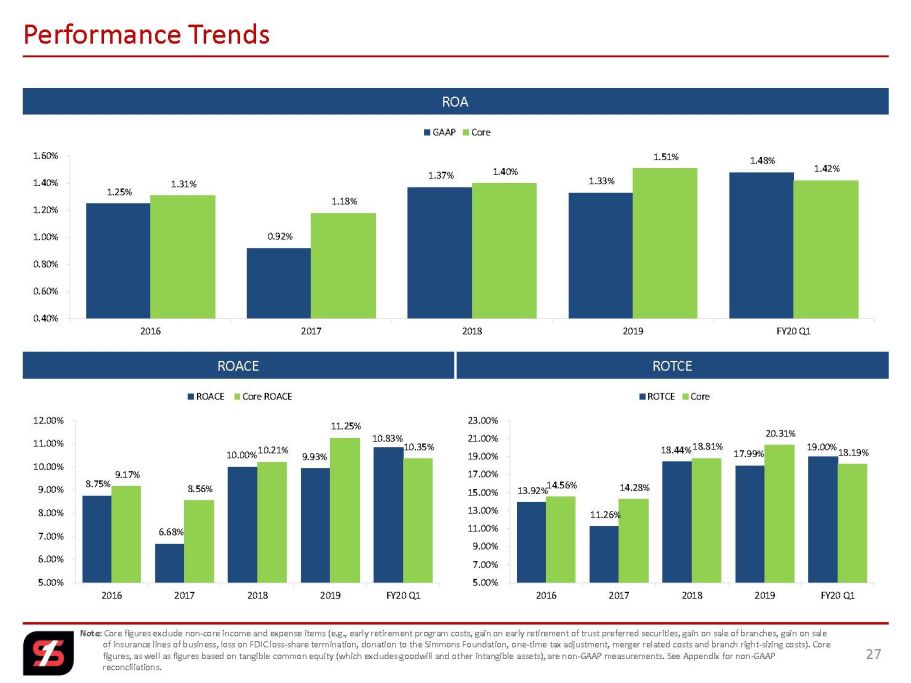
Note: Core figures exclude non - core income and expense items (e.g., early retirement program costs, gain on early retirement of trust preferred securities, gain on sale of branches, gain on sale of insurance lines of business, loss on FDIC loss - share termination, donation to the Simmons Foundation, one - time tax adjustment , merger related costs and branch right - sizing costs). Core figures, as well as figures based on tangible common equity (which excludes goodwill and other intangible assets), are non - GAAP measurements. See Appendix for non - GAAP reconciliations. 27 Performance Trends ROA ROTCE 1.25% 0.92% 1.37% 1.33% 1.48% 1.31% 1.18% 1.40% 1.51% 1.42% 0.40% 0.60% 0.80% 1.00% 1.20% 1.40% 1.60% 2016 2017 2018 2019 FY20 Q1 GAAP Core 13.92% 11.26% 18.44% 17.99% 19.00% 14.56% 14.28% 18.81% 20.31% 18.19% 5.00% 7.00% 9.00% 11.00% 13.00% 15.00% 17.00% 19.00% 21.00% 23.00% 2016 2017 2018 2019 FY20 Q1 ROTCE Core ROACE 8.75% 6.68% 10.00% 9.93% 10.83% 9.17% 8.56% 10.21% 11.25% 10.35% 5.00% 6.00% 7.00% 8.00% 9.00% 10.00% 11.00% 12.00% 2016 2017 2018 2019 FY20 Q1 ROACE Core ROACE
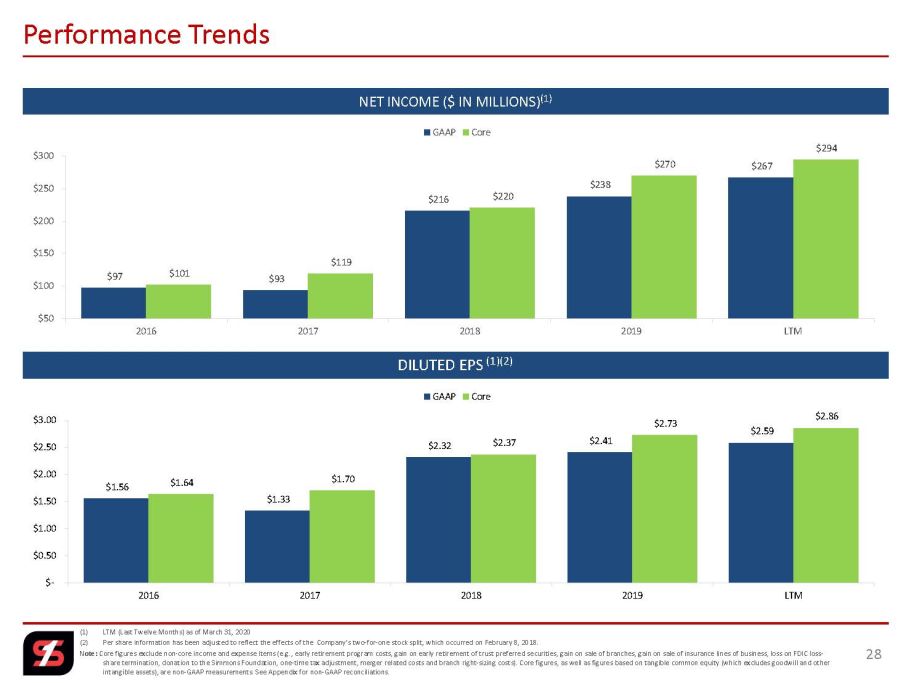
(1) LTM (Last Twelve Months) as of March 31, 2020 (2) Per share information has been adjusted to reflect the effects of the Company’s two - for - one stock split, which occurred on Febr uary 8, 2018. Note: Core figures exclude non - core income and expense items (e.g., early retirement program costs, gain on early retirement of trust preferred securities, gain on sale of branches, gain on sale of insurance lines of business, loss on FDIC loss - share termination, donation to the Simmons Foundation, one - time tax adjustment, merger related costs and branch right - sizing cos ts). Core figures, as well as figures based on tangible common equity (which excludes goodwill and other intangible assets), are non - GAAP measurements. See Appendix for non - GAAP reconciliations. 28 Performance Trends DILUTED EPS (1)(2) NET INCOME ($ IN MILLIONS) (1) $97 $93 $216 $238 $267 $101 $119 $220 $270 $294 $50 $100 $150 $200 $250 $300 2016 2017 2018 2019 LTM GAAP Core $1.56 $1.33 $2.32 $2.41 $2.59 $1.64 $1.70 $2.37 $2.73 $2.86 $- $0.50 $1.00 $1.50 $2.00 $2.50 $3.00 2016 2017 2018 2019 LTM GAAP Core
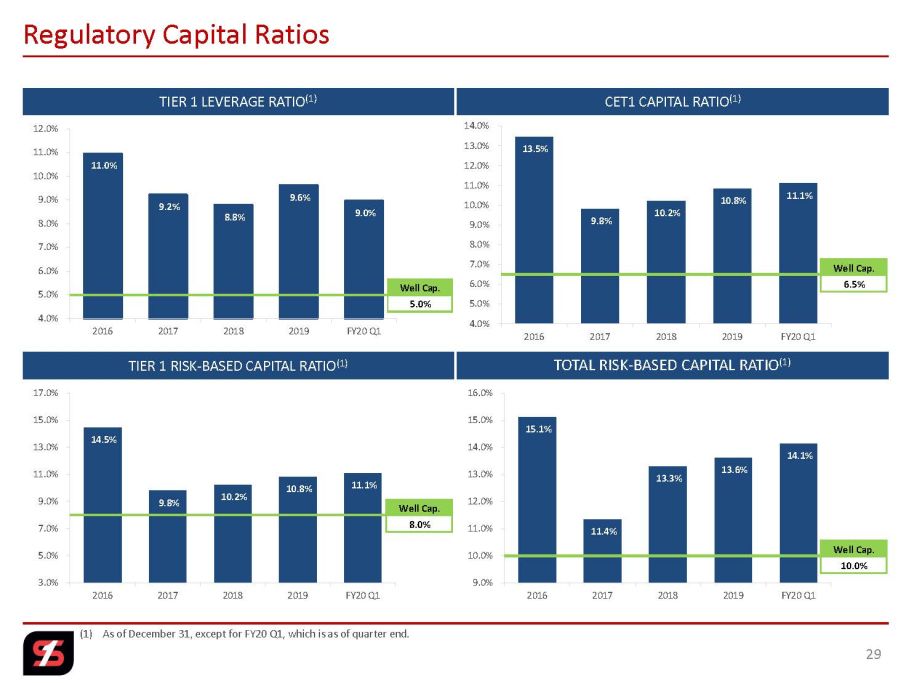
15.1% 11.4% 13.3% 13.6% 14.1% 9.0% 10.0% 11.0% 12.0% 13.0% 14.0% 15.0% 16.0% 2016 2017 2018 2019 FY20 Q1 14.5% 9.8% 10.2% 10.8% 11.1% 3.0% 5.0% 7.0% 9.0% 11.0% 13.0% 15.0% 17.0% 2016 2017 2018 2019 FY20 Q1 13.5% 9.8% 10.2% 10.8% 11.1% 4.0% 5.0% 6.0% 7.0% 8.0% 9.0% 10.0% 11.0% 12.0% 13.0% 14.0% 2016 2017 2018 2019 FY20 Q1 11.0% 9.2% 8.8% 9.6% 9.0% 4.0% 5.0% 6.0% 7.0% 8.0% 9.0% 10.0% 11.0% 12.0% 2016 2017 2018 2019 FY20 Q1 (1) As of December 31, except for FY20 Q1, which is as of quarter end. 29 Regulatory Capital Ratios TIER 1 LEVERAGE RATIO (1) TOTAL RISK - BASED CAPITAL RATIO (1) TIER 1 RISK - BASED CAPITAL RATIO (1) CET1 CAPITAL RATIO (1) Well Cap. 5.0% Well Cap. 8.0% Well Cap. 6.5% Well Cap. 10.0%
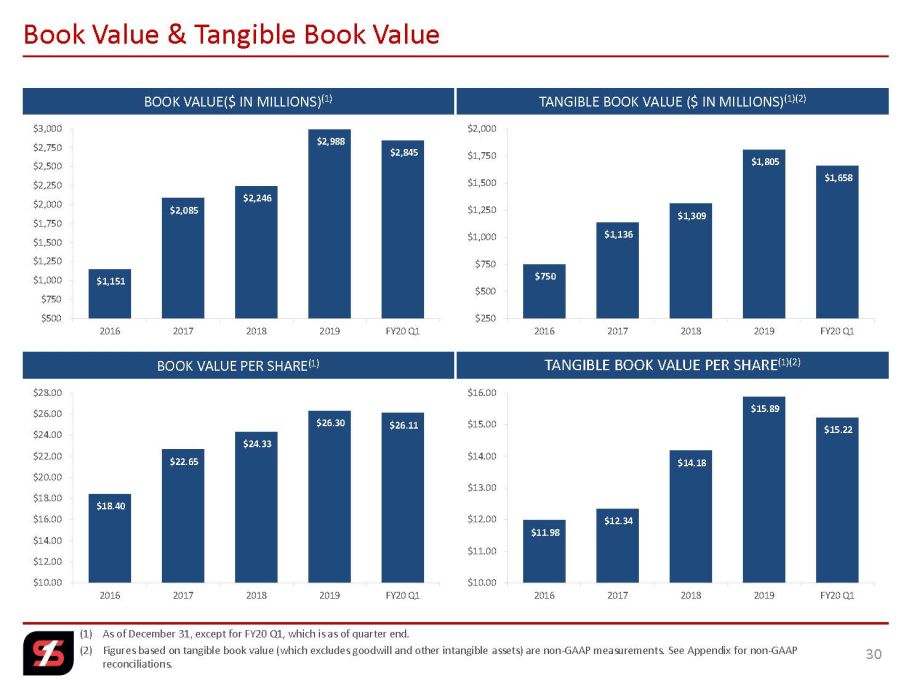
(1) As of December 31, except for FY20 Q1, which is as of quarter end. (2) Figures based on tangible book value (which excludes goodwill and other intangible assets) are non - GAAP measurements. See Append ix for non - GAAP reconciliations. 30 Book Value & Tangible Book Value BOOK VALUE($ IN MILLIONS) (1) TANGIBLE BOOK VALUE PER SHARE (1)(2) BOOK VALUE PER SHARE (1) TANGIBLE BOOK VALUE ($ IN MILLIONS) (1)(2) $1,151 $2,085 $2,246 $2,988 $2,845 $500 $750 $1,000 $1,250 $1,500 $1,750 $2,000 $2,250 $2,500 $2,750 $3,000 2016 2017 2018 2019 FY20 Q1 $18.40 $22.65 $24.33 $26.30 $26.11 $10.00 $12.00 $14.00 $16.00 $18.00 $20.00 $22.00 $24.00 $26.00 $28.00 2016 2017 2018 2019 FY20 Q1 $750 $1,136 $1,309 $1,805 $1,658 $250 $500 $750 $1,000 $1,250 $1,500 $1,750 $2,000 2016 2017 2018 2019 FY20 Q1 $11.98 $12.34 $14.18 $15.89 $15.22 $10.00 $11.00 $12.00 $13.00 $14.00 $15.00 $16.00 2016 2017 2018 2019 FY20 Q1
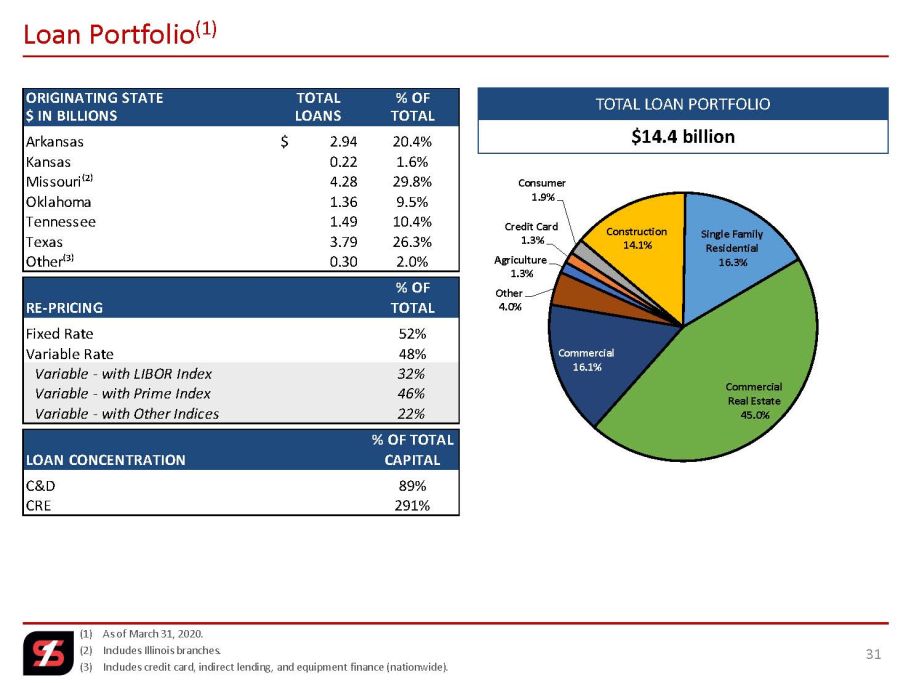
(1) As of March 31, 2020. (2) Includes Illinois branches. (3) Includes credit card, indirect lending, and equipment finance (nationwide). 31 Loan Portfolio (1) TOTAL LOAN PORTFOLIO $14.4 billion Agriculture 1.3% Credit Card 1.3% Consumer 1.9% Construction 14.1% Single Family Residential 16.3% Commercial Real Estate 45.0% Commercial 16.1% Other 4.0% ORIGINATING STATE TOTAL % OF $ IN BILLIONS LOANS TOTAL Arkansas 2.94$ 20.4% Kansas 0.22 1.6% Missouri⁽²⁾ 4.28 29.8% Oklahoma 1.36 9.5% Tennessee 1.49 10.4% Texas 3.79 26.3% Other⁽³⁾ 0.30 2.0% % OF RE-PRICING TOTAL Fixed Rate 52% Variable Rate 48% Variable - with LIBOR Index 32% Variable - with Prime Index 46% Variable - with Other Indices 22% % OF TOTAL LOAN CONCENTRATION CAPITAL C&D 89% CRE 291%
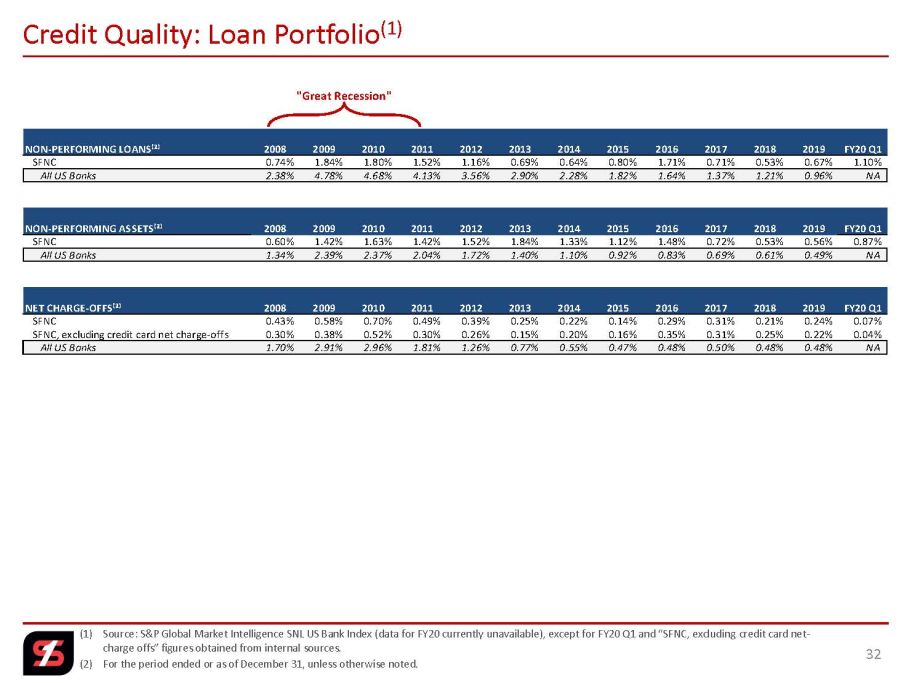
(1) Source: S&P Global Market Intelligence SNL US Bank Index (data for FY20 currently unavailable), except for FY20 Q1 and “SFNC, ex cluding credit card net - charge offs” figures obtained from internal sources. (2) For the period ended or as of December 31, unless otherwise noted. 32 Credit Quality: Loan Portfolio (1) "Great Recession" NON-PERFORMING LOANS⁽²⁾ 2008 2009 2010 2011 2012 2013 2014 2015 2016 2017 2018 2019 FY20 Q1 SFNC 0.74% 1.84% 1.80% 1.52% 1.16% 0.69% 0.64% 0.80% 1.71% 0.71% 0.53% 0.67% 1.10% All US Banks 2.38% 4.78% 4.68% 4.13% 3.56% 2.90% 2.28% 1.82% 1.64% 1.37% 1.21% 0.96% NA NON-PERFORMING ASSETS⁽²⁾ 2008 2009 2010 2011 2012 2013 2014 2015 2016 2017 2018 2019 FY20 Q1 SFNC 0.60% 1.42% 1.63% 1.42% 1.52% 1.84% 1.33% 1.12% 1.48% 0.72% 0.53% 0.56% 0.87% All US Banks 1.34% 2.39% 2.37% 2.04% 1.72% 1.40% 1.10% 0.92% 0.83% 0.69% 0.61% 0.49% NA NET CHARGE-OFFS⁽²⁾ 2008 2009 2010 2011 2012 2013 2014 2015 2016 2017 2018 2019 FY20 Q1 SFNC 0.43% 0.58% 0.70% 0.49% 0.39% 0.25% 0.22% 0.14% 0.29% 0.31% 0.21% 0.24% 0.07% SFNC, excluding credit card net charge-offs 0.30% 0.38% 0.52% 0.30% 0.26% 0.15% 0.20% 0.16% 0.35% 0.31% 0.25% 0.22% 0.04% All US Banks 1.70% 2.91% 2.96% 1.81% 1.26% 0.77% 0.55% 0.47% 0.48% 0.50% 0.48% 0.48% NA
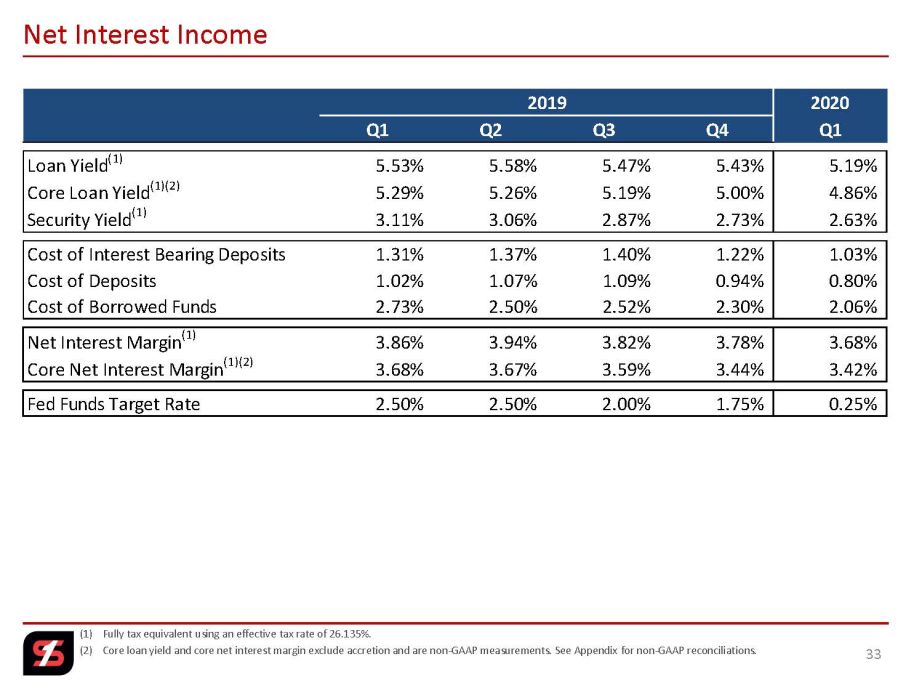
(1) Fully tax equivalent using an effective tax rate of 26.135%. (2) Core loan yield and core net interest margin exclude accretion and are non - GAAP measurements. See Appendix for non - GAAP reconcil iations. 33 Net Interest Income 2019 2020 Q1 Q2 Q3 Q4 Q1 Loan Yield (1) 5.53% 5.58% 5.47% 5.43% 5.19% Core Loan Yield (1)(2) 5.29% 5.26% 5.19% 5.00% 4.86% Security Yield (1) 3.11% 3.06% 2.87% 2.73% 2.63% Cost of Interest Bearing Deposits 1.31% 1.37% 1.40% 1.22% 1.03% Cost of Deposits 1.02% 1.07% 1.09% 0.94% 0.80% Cost of Borrowed Funds 2.73% 2.50% 2.52% 2.30% 2.06% Net Interest Margin (1) 3.86% 3.94% 3.82% 3.78% 3.68% Core Net Interest Margin (1)(2) 3.68% 3.67% 3.59% 3.44% 3.42% Fed Funds Target Rate 2.50% 2.50% 2.00% 1.75% 0.25%
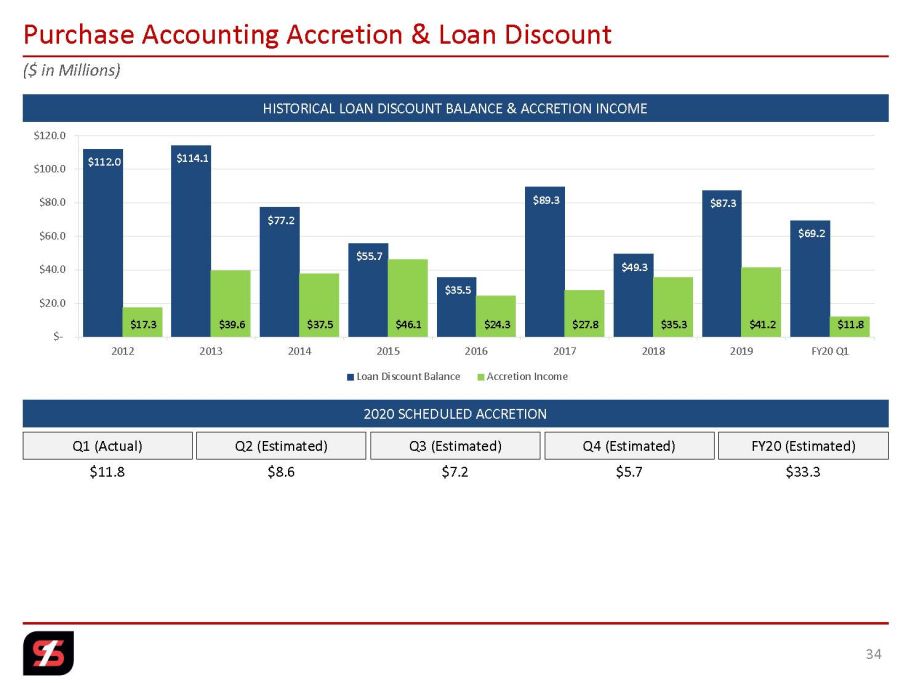
($ in Millions) 34 Purchase Accounting Accretion & Loan Discount HISTORICAL LOAN DISCOUNT BALANCE & ACCRETION INCOME 2020 SCHEDULED ACCRETION $7.2 $11.8 $5.7 $8.6 Q1 (Actual) Q2 (Estimated) Q4 (Estimated) Q3 (Estimated) FY20 (Estimated) $33.3 $112.0 $114.1 $77.2 $55.7 $35.5 $89.3 $49.3 $87.3 $69.2 $17.3 $39.6 $37.5 $46.1 $24.3 $27.8 $35.3 $41.2 $11.8 $- $20.0 $40.0 $60.0 $80.0 $100.0 $120.0 2012 2013 2014 2015 2016 2017 2018 2019 FY20 Q1 Loan Discount Balance Accretion Income
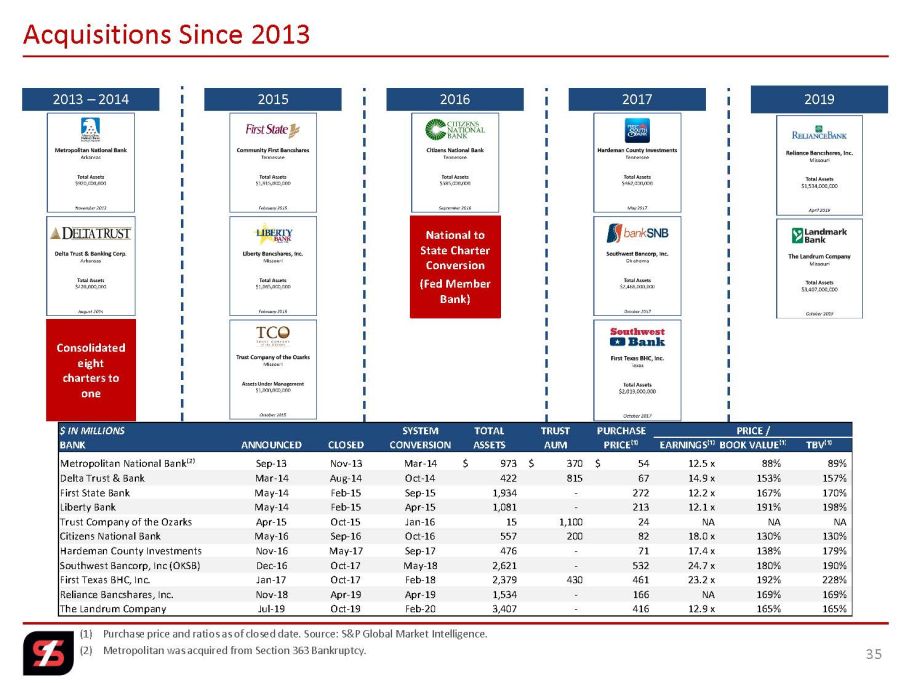
(1) Purchase price and ratios as of closed date. Source: S&P Global Market Intelligence. (2) Metropolitan was acquired from Section 363 Bankruptcy. 35 Acquisitions Since 2013 2013 – 2014 Consolidated eight charters to one National to State Charter Conversion (Fed Member Bank) 2015 2016 2017 2019 $ IN MILLIONS SYSTEM TOTAL TRUST PURCHASE PRICE / BANK ANNOUNCED CLOSED CONVERSION ASSETS AUM PRICE⁽¹⁾ EARNINGS⁽¹⁾BOOK VALUE⁽¹⁾ TBV⁽¹⁾ Metropolitan National Bank⁽²⁾ Sep-13 Nov-13 Mar-14 973$ 370$ 54$ 12.5 x 88% 89% Delta Trust & Bank Mar-14 Aug-14 Oct-14 422 815 67 14.9 x 153% 157% First State Bank May-14 Feb-15 Sep-15 1,934 - 272 12.2 x 167% 170% Liberty Bank May-14 Feb-15 Apr-15 1,081 - 213 12.1 x 191% 198% Trust Company of the Ozarks Apr-15 Oct-15 Jan-16 15 1,100 24 NA NA NA Citizens National Bank May-16 Sep-16 Oct-16 557 200 82 18.0 x 130% 130% Hardeman County Investments Nov-16 May-17 Sep-17 476 - 71 17.4 x 138% 179% Southwest Bancorp, Inc (OKSB) Dec-16 Oct-17 May-18 2,621 - 532 24.7 x 180% 190% First Texas BHC, Inc. Jan-17 Oct-17 Feb-18 2,379 430 461 23.2 x 192% 228% Reliance Bancshares, Inc. Nov-18 Apr-19 Apr-19 1,534 - 166 NA 169% 169% The Landrum Company Jul-19 Oct-19 Feb-20 3,407 - 416 12.9 x 165% 165%
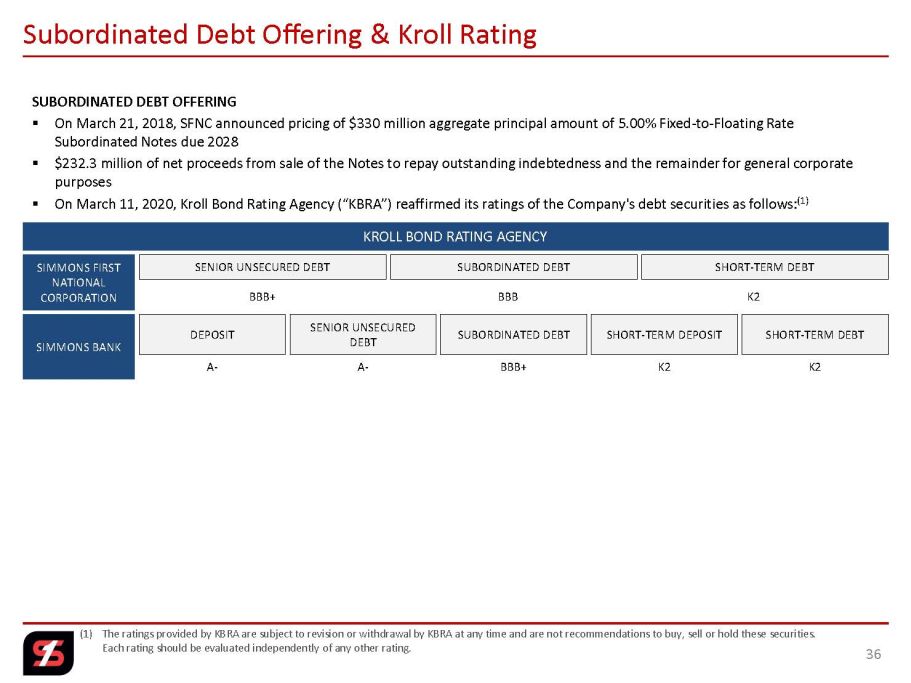
(1) The ratings provided by KBRA are subject to revision or withdrawal by KBRA at any time and are not recommendations to buy, se ll or hold these securities. Each rating should be evaluated independently of any other rating. 36 Subordinated Debt Offering & Kroll Rating SENIOR UNSECURED DEBT SHORT - TERM DEBT SUBORDINATED DEBT SENIOR UNSECURED DEBT SHORT - TERM DEBT SUBORDINATED DEBT SHORT - TERM DEPOSIT DEPOSIT BBB+ BBB K2 SIMMONS FIRST NATIONAL CORPORATION SIMMONS BANK A - A - BBB+ K2 K2 SUBORDINATED DEBT OFFERING ▪ On March 21, 2018, SFNC announced pricing of $330 million aggregate principal amount of 5.00% Fixed - to - Floating Rate Subordinated Notes due 2028 ▪ $232.3 million of net proceeds from sale of the Notes to repay outstanding indebtedness and the remainder for general corpora te purposes ▪ On March 11, 2020, Kroll Bond Rating Agency (“KBRA”) reaffirmed its ratings of the Company's debt securities as follows: (1) KROLL BOND RATING AGENCY

$0.14 $0.16 $0.18 $0.20 $0.22 $0.24 $0.27 $0.29 $0.31 $0.34 $0.37 $0.38 $0.38 $0.38 $0.38 $0.40 $0.42 $0.44 $0.46 $0.48 $0.50 $0.60 $0.64 $0.68 $- $0.10 $0.20 $0.30 $0.40 $0.50 $0.60 $0.70 (1) Based on April 9, 2020 closing stock price of $19.75. (2) FY20 Q1 EPS of $0.68. (3) FY20 Q1 Core EPS of $0.65, excludes non - core income and expense items and is a non - GAAP measurement. See Appendix for non - GAAP r econciliations. Note: The future payment of dividends is not guaranteed and is subject to various factors, including approval by the Company’s boar d of directors. 37 111 Years of Consistent Dividend History PROJECTED 2020 CURRENT DIVIDEND YIELD⁽¹⁾ 3.4% FY20 Q1 DIVIDEND PAYOUT RATIO GAAP Earnings⁽²⁾ 25.0% Core Earnings⁽³⁾ 26.2%
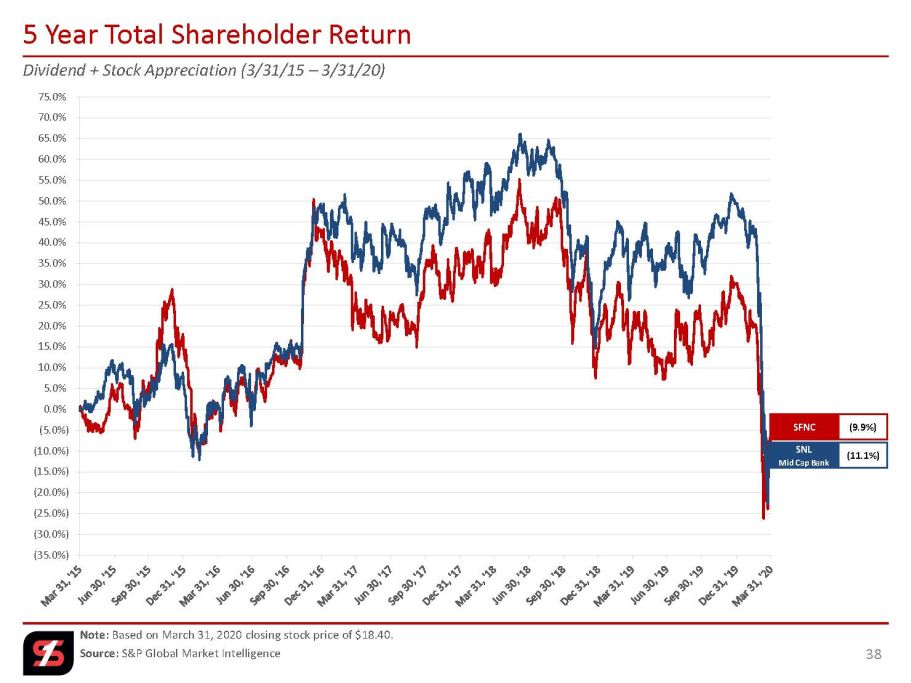
(35.0%) (30.0%) (25.0%) (20.0%) (15.0%) (10.0%) (5.0%) 0.0% 5.0% 10.0% 15.0% 20.0% 25.0% 30.0% 35.0% 40.0% 45.0% 50.0% 55.0% 60.0% 65.0% 70.0% 75.0% Dividend + Stock Appreciation (3/31/15 – 3/31/20) Note: Based on March 31, 2020 closing stock price of $18.40. Source: S&P Global Market Intelligence 38 5 Year Total Shareholder Return SFNC (9.9%) SNL Mid Cap Bank (11.1%)

(95.0%) (75.0%) (55.0%) (35.0%) (15.0%) 5.0% 25.0% 45.0% 65.0% 85.0% 105.0% 125.0% 145.0% 165.0% 185.0% 205.0% 225.0% 245.0% Dividend + Stock Appreciation (12/31/07 – 3/31/20) Note: Based on March 31, 2020 closing stock price of $18.40. Source: S&P Global Market Intelligence 39 Long - term Shareholder Return SNL Mid Cap Bank (30.7%) SFNC 89.4%
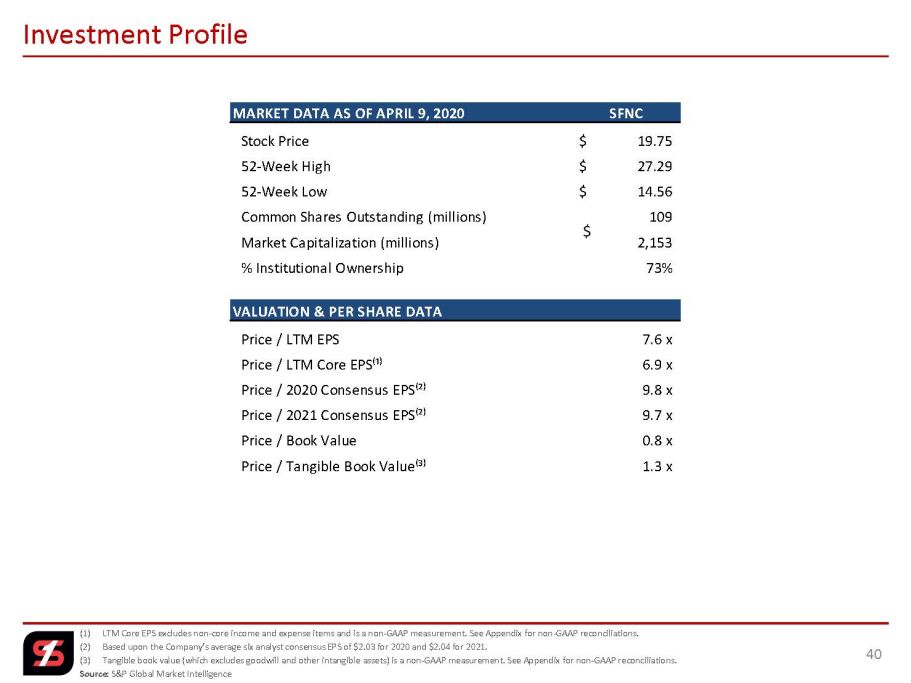
(1) LTM Core EPS excludes non - core income and expense items and is a non - GAAP measurement. See Appendix for non - GAAP reconciliations . (2) Based upon the Company’s average six analyst consensus EPS of $2.03 for 2020 and $2.04 for 2021. (3) Tangible book value (which excludes goodwill and other intangible assets) is a non - GAAP measurement. See Appendix for non - GAAP reconciliations. Source: S&P Global Market Intelligence 40 Investment Profile MARKET DATA AS OF APRIL 9, 2020 SFNC Stock Price 19.75$ 52-Week High 27.29$ 52-Week Low 14.56$ Common Shares Outstanding (millions) 109 Market Capitalization (millions) 2,153 % Institutional Ownership 73% VALUATION & PER SHARE DATA Price / LTM EPS 7.6 x Price / LTM Core EPS⁽¹⁾ 6.9 x Price / 2020 Consensus EPS⁽²⁾ 9.8 x Price / 2021 Consensus EPS⁽²⁾ 9.7 x Price / Book Value 0.8 x Price / Tangible Book Value⁽³⁾ 1.3 x
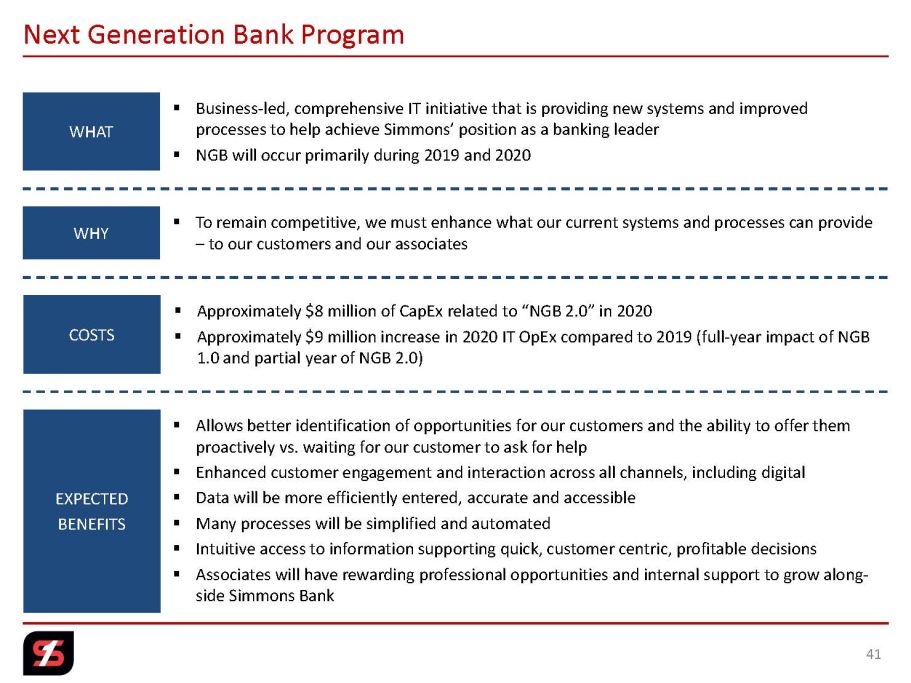
41 Next Generation Bank Program WHY WHAT ▪ Allows better identification of opportunities for our customers and the ability to offer them proactively vs. waiting for our customer to ask for help ▪ Enhanced customer engagement and interaction across all channels, including digital ▪ Data will be more efficiently entered, accurate and accessible ▪ Many processes will be simplified and automated ▪ Intuitive access to information supporting quick, customer centric, profitable decisions ▪ Associates will have rewarding professional opportunities and internal support to grow along - side Simmons Bank ▪ Business - led, comprehensive IT initiative that is providing new systems and improved processes to help achieve Simmons’ position as a banking leader ▪ NGB will occur primarily during 2019 and 2020 EXPECTED BENEFITS ▪ To remain competitive, we must enhance what our current systems and processes can provide – to our customers and our associates COSTS ▪ Approximately $8 million of CapEx related to “NGB 2.0” in 2020 ▪ Approximately $9 million increase in 2020 IT OpEx compared to 2019 (full - year impact of NGB 1.0 and partial year of NGB 2.0)

BRANDING PARTNERSHIPS 42

Simmons Bank Open, Team Simmons & Additional PGA Activation 43 A marquee showcase event, Simmons Bank Open, in Nashville, Tennessee. Tournament week includes substantial branding, Pro - Am outings and hospitality. Team Simmons Bank is comprised of four Korn Ferry tour golfers. Braden Thornberry of Memphis, Tennessee; Dawson Armstrong of Nashville, Tennessee; Kevin Dougherty of Stillwater, Oklahoma; and Will Zalatoris of Dallas, Texas. Our agreement includes branding and client engagement events. Additional Korn Ferry Tour and PGA TOUR hospitality tournament activations throughout the year.
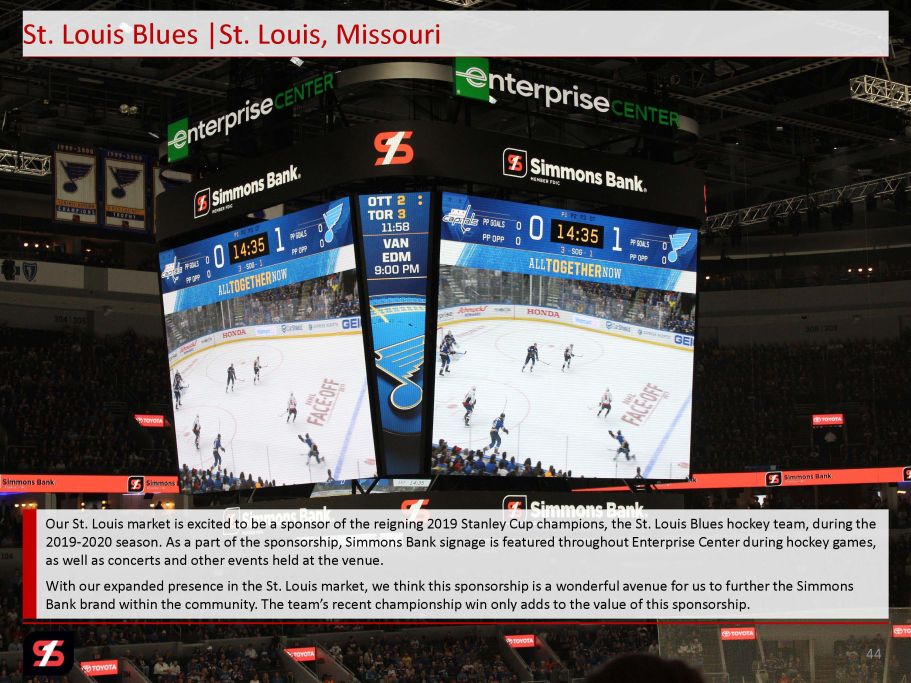
44 St. Louis Blues |St. Louis, Missouri Our St. Louis market is excited to be a sponsor of the reigning 2019 Stanley Cup champions, the St. Louis Blues hockey team, dur ing the 2019 - 2020 season. As a part of the sponsorship, Simmons Bank signage is featured throughout Enterprise Center during hockey game s, as well as concerts and other events held at the venue. With our expanded presence in the St. Louis market, we think this sponsorship is a wonderful avenue for us to further the Sim mon s Bank brand within the community. The team’s recent championship win only adds to the value of this sponsorship.

Dickies Arena: Simmons Bank Plaza & Pavilion | Fort Worth, Texas In October 2019, Simmons Bank became the naming rights holder to the Simmons Bank Plaza and Simmons Bank Pavilion at the newl y constructed Dickies Arena, a 14,000 - seat, multi - purpose venue in Fort Worth, Texas. The Simmons Bank Plaza is an over 200,000 - square - foot outdoor entertainment hub where fan festivals, outdoor concerts, pre - and post - show events, and more are held. The Simmons Bank Pavilion is an indoor facility adjacent to the Plaza that hosts corporate and civic events. Simmons became the official banking partner for Dickies Arena and a major sponsor of the Fort Worth Stock Show & Rodeo, the o lde st continuously running livestock show and rodeo, held annually since 1896. The Stock Show provides millions of dollars in grant s a nd scholarships to support future leaders in agriculture and livestock management. 45

46 Discovery Park: Exhibit & Simmons Bank Ag Center | Union City, Tennessee In December 2019, Simmons Bank was announced as a major sponsor and partner for Discovery Park of America’s permanent exhibit , “ AgriCulture : Innovating for Our Survival.” The exhibit is scheduled to open in fall 2020 in a 8,900 - square - foot building to be named the Simmons Bank Ag Center. Discovery Park of America is a world - class museum and 50 - acre heritage park located in Union City, Tennessee, founded with a vis ion to support farmers and inspire the imaginations of children and adults. With our deep roots in the west Tennessee, Mississippi Delta and a heritage of serving farmers for more than 100 years, Simmo ns Bank is honored to help bring this initiative to life.
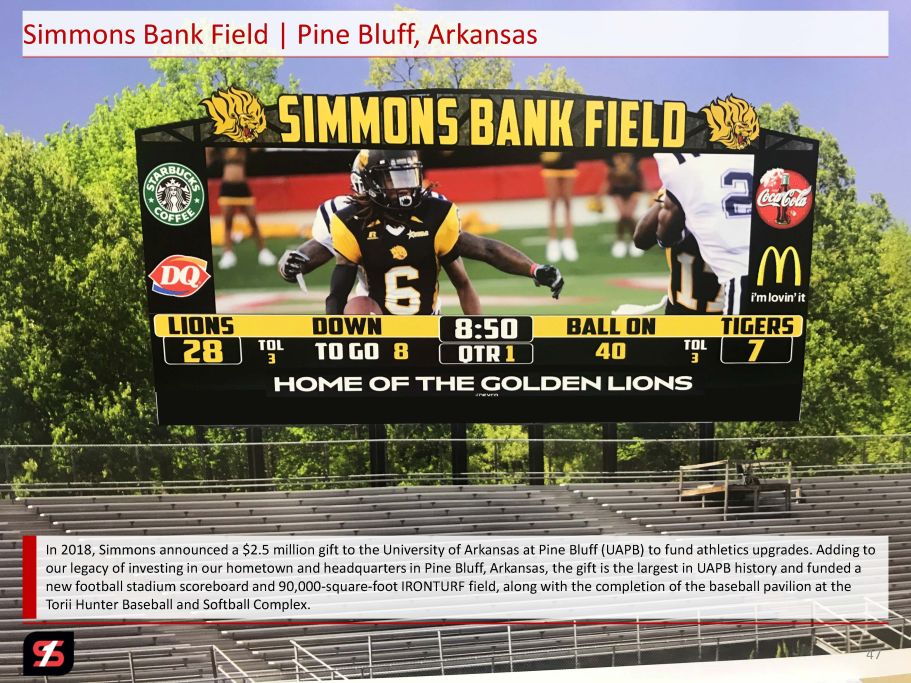
47 Simmons Bank Field | Pine Bluff, Arkansas In 2018, Simmons announced a $2.5 million gift to the University of Arkansas at Pine Bluff (UAPB) to fund athletics upgrades. Ad ding to our legacy of investing in our hometown and headquarters in Pine Bluff, Arkansas, the gift is the largest in UAPB history and fu nded a new football stadium scoreboard and 90,000 - square - foot IRONTURF field, along with the completion of the baseball pavilion at the Torii Hunter Baseball and Softball Complex.

48 Simmons Bank Arena | North Little Rock, Arkansas In October 2019, Simmons acquired naming rights to Simmons Bank Arena in North Little Rock, Arkansas. The arena is a beacon f or economic vitality and culture in our home state, all while being a destination for nearly 500,000 annual visitors. Simmons Ba nk Arena is ranked #39 in the United States in ticket sales according to Pollstar . Additional sponsorship rights include two suites used for business development, early access ticket sales and a Simmons customer entrance.

49 Simmons Tower | Little Rock, Arkansas We have a multi - year arrangement with the building’s owner for the tower signage and we continue to operate a branch bank in the lobby. Coupled with our River Market building and Simmons Bank Arena signage we effectively created a highly visible brand in downtown Little Rock.

50 River Market Building | Little Rock, Arkansas We were pleased to acquire this beautiful building in the heart of the vibrant city of Little Rock and make it a regional hub ju st an hour from our corporate headquarters in Pine Bluff. We continue to increase our banking operations in new areas of the country, and while we’re now i n s even states, many of our centralized services remain in Arkansas, where we were founded. Amenities of a secured parking deck, wellness center, café providing multiple meal options for breakfast and lunch, and our b eau tiful park get the attention of potential associates and help solidify relationships with existing associates. The building’s location is also convenient to ent ertainment and dining venues, nearby hotels and a short commute to the airport. We wrapped the exterior of the building in 3,000 feet of LED lights. With more than 16 - million color combinations and the abilit y to program them every five inches, these lights can create dynamic color - changing effects, and they are environmentally friendly and energy efficient. We h ave used the lights to support causes such as Breast Cancer Awareness and Prostate Cancer Awareness, as well as celebrating various holidays, including the 4 th of July, Christmas, Valentines’ Day and more.
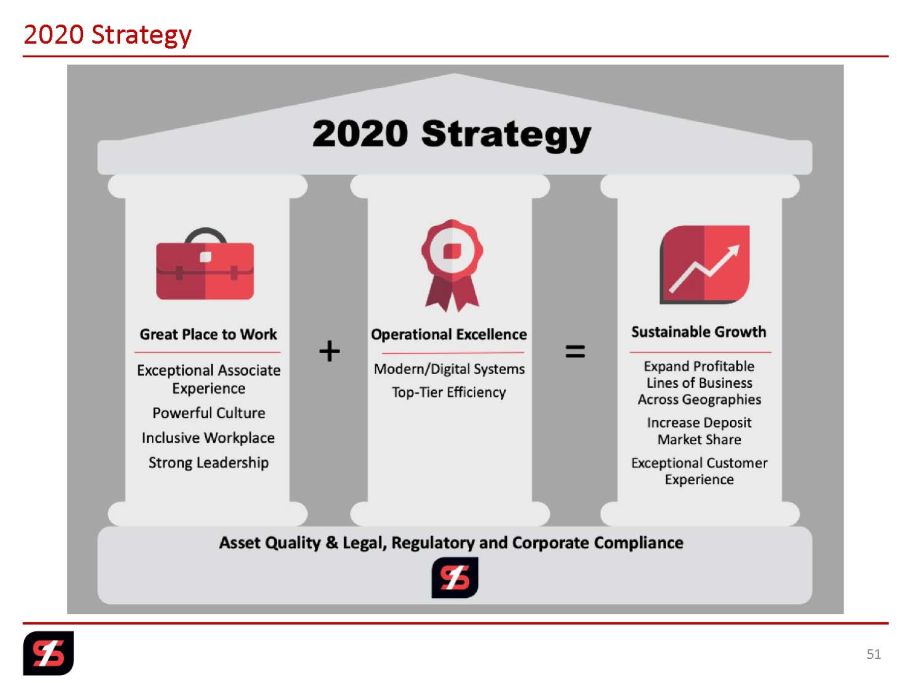
51 2020 Strategy

APPENDIX 52
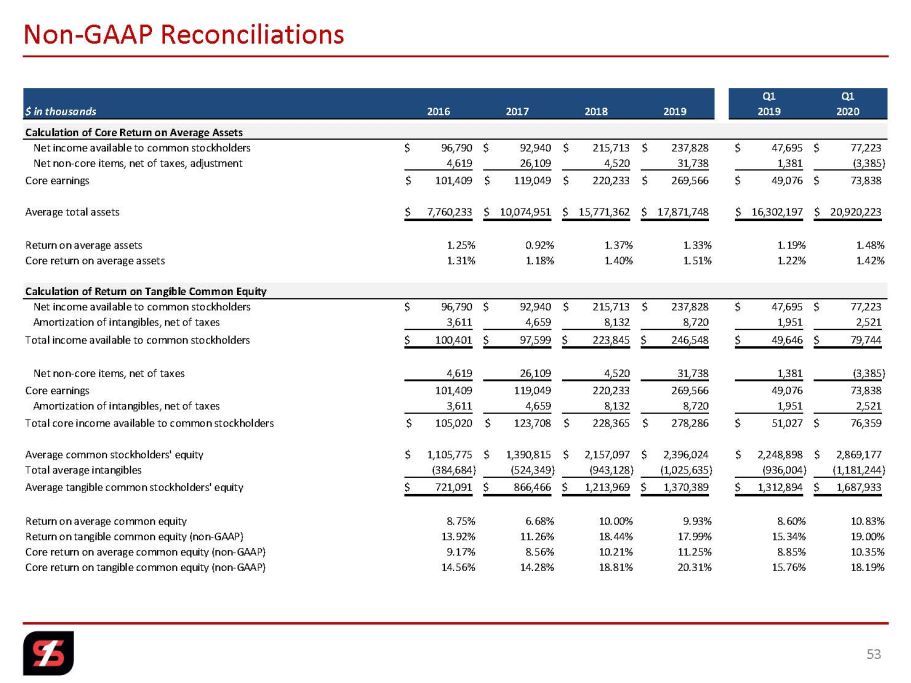
53 Non - GAAP Reconciliations Q1 Q1 $ in thousands 2016 2017 2018 2019 2019 2020 Calculation of Core Return on Average Assets Net income available to common stockholders 96,790$ 92,940$ 215,713$ 237,828$ 47,695$ 77,223$ Net non-core items, net of taxes, adjustment 4,619 26,109 4,520 31,738 1,381 (3,385) Core earnings 101,409$ 119,049$ 220,233$ 269,566$ 49,076$ 73,838$ Average total assets 7,760,233$ 10,074,951$ 15,771,362$ 17,871,748$ 16,302,197$ 20,920,223$ Return on average assets 1.25% 0.92% 1.37% 1.33% 1.19% 1.48% Core return on average assets 1.31% 1.18% 1.40% 1.51% 1.22% 1.42% Calculation of Return on Tangible Common Equity Net income available to common stockholders 96,790$ 92,940$ 215,713$ 237,828$ 47,695$ 77,223$ Amortization of intangibles, net of taxes 3,611 4,659 8,132 8,720 1,951 2,521 Total income available to common stockholders 100,401$ 97,599$ 223,845$ 246,548$ 49,646$ 79,744$ Net non-core items, net of taxes 4,619 26,109 4,520 31,738 1,381 (3,385) Core earnings 101,409 119,049 220,233 269,566 49,076 73,838 Amortization of intangibles, net of taxes 3,611 4,659 8,132 8,720 1,951 2,521 Total core income available to common stockholders 105,020$ 123,708$ 228,365$ 278,286$ 51,027$ 76,359$ Average common stockholders' equity 1,105,775$ 1,390,815$ 2,157,097$ 2,396,024$ 2,248,898$ 2,869,177$ Total average intangibles (384,684) (524,349) (943,128) (1,025,635) (936,004) (1,181,244) Average tangible common stockholders' equity 721,091$ 866,466$ 1,213,969$ 1,370,389$ 1,312,894$ 1,687,933$ Return on average common equity 8.75% 6.68% 10.00% 9.93% 8.60% 10.83% Return on tangible common equity (non-GAAP) 13.92% 11.26% 18.44% 17.99% 15.34% 19.00% Core return on average common equity (non-GAAP) 9.17% 8.56% 10.21% 11.25% 8.85% 10.35% Core return on tangible common equity (non-GAAP) 14.56% 14.28% 18.81% 20.31% 15.76% 18.19%
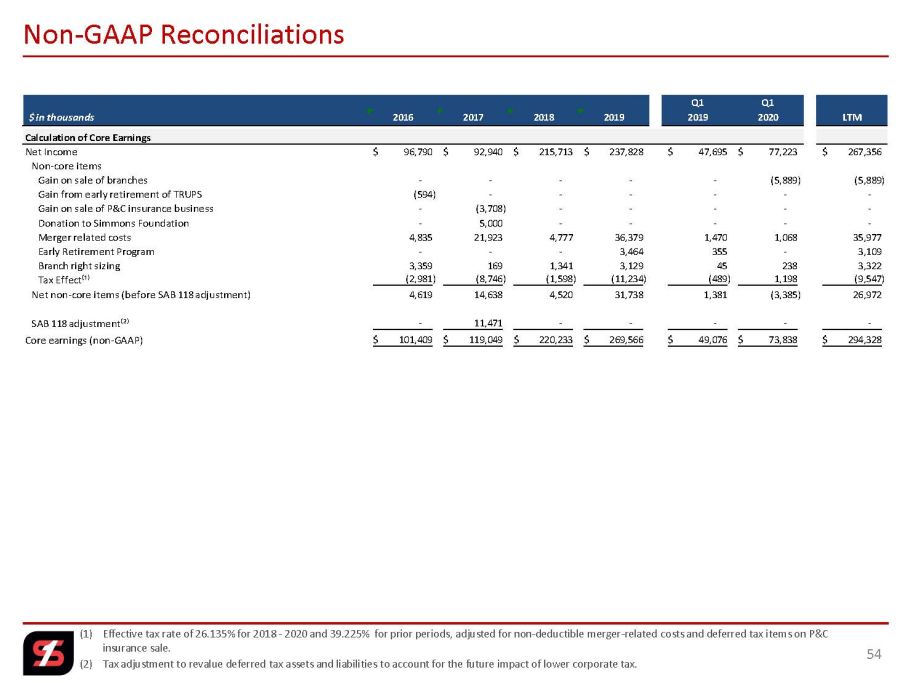
(1) Effective tax rate of 26.135% for 2018 - 2020 and 39.225% for prior periods, adjusted for non - deductible merger - related costs a nd deferred tax items on P&C insurance sale. (2) Tax adjustment to revalue deferred tax assets and liabilities to account for the future impact of lower corporate tax. 54 Non - GAAP Reconciliations Q1 Q1 $ in thousands 2016 2017 2018 2019 2019 2020 LTM Calculation of Core Earnings Net Income 96,790$ 92,940$ 215,713$ 237,828$ 47,695$ 77,223$ 267,356$ Non-core items Gain on sale of branches - - - - - (5,889) (5,889) Gain from early retirement of TRUPS (594) - - - - - - Gain on sale of P&C insurance business - (3,708) - - - - - Donation to Simmons Foundation - 5,000 - - - - - Merger related costs 4,835 21,923 4,777 36,379 1,470 1,068 35,977 Early Retirement Program - - - 3,464 355 - 3,109 Branch right sizing 3,359 169 1,341 3,129 45 238 3,322 Tax Effect⁽¹⁾ (2,981) (8,746) (1,598) (11,234) (489) 1,198 (9,547) Net non-core items (before SAB 118 adjustment) 4,619 14,638 4,520 31,738 1,381 (3,385) 26,972 SAB 118 adjustment⁽²⁾ - 11,471 - - - - - Core earnings (non-GAAP) 101,409$ 119,049$ 220,233$ 269,566$ 49,076$ 73,838$ 294,328$
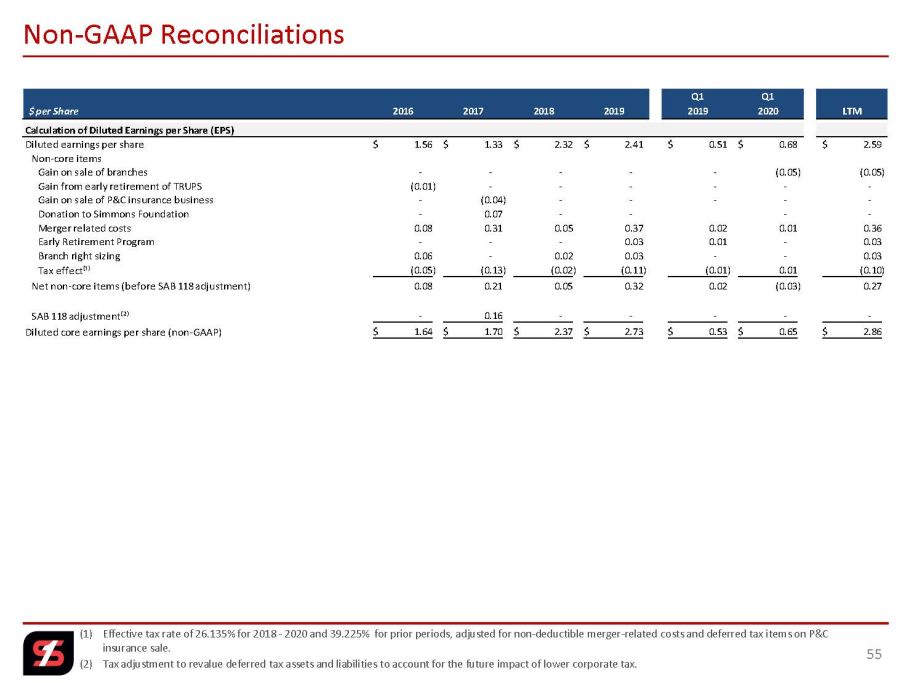
(1) Effective tax rate of 26.135% for 2018 - 2020 and 39.225% for prior periods, adjusted for non - deductible merger - related costs a nd deferred tax items on P&C insurance sale. (2) Tax adjustment to revalue deferred tax assets and liabilities to account for the future impact of lower corporate tax. 55 Non - GAAP Reconciliations Q1 Q1 $ per Share 2016 2017 2018 2019 2019 2020 LTM Calculation of Diluted Earnings per Share (EPS) Diluted earnings per share 1.56$ 1.33$ 2.32$ 2.41$ 0.51$ 0.68$ 2.59$ Non-core items Gain on sale of branches - - - - - (0.05) (0.05) Gain from early retirement of TRUPS (0.01) - - - - - - Gain on sale of P&C insurance business - (0.04) - - - - - Donation to Simmons Foundation - 0.07 - - - - Merger related costs 0.08 0.31 0.05 0.37 0.02 0.01 0.36 Early Retirement Program - - - 0.03 0.01 - 0.03 Branch right sizing 0.06 - 0.02 0.03 - - 0.03 Tax effect⁽¹⁾ (0.05) (0.13) (0.02) (0.11) (0.01) 0.01 (0.10) Net non-core items (before SAB 118 adjustment) 0.08 0.21 0.05 0.32 0.02 (0.03) 0.27 SAB 118 adjustment⁽²⁾ - 0.16 - - - - - Diluted core earnings per share (non-GAAP) 1.64$ 1.70$ 2.37$ 2.73$ 0.53$ 0.65$ 2.86$

(1) Efficiency ratio is core non - interest expense before foreclosed property expense and amortization of intangibles as a percent of net interest income (fully taxable equivalent) and noninterest revenues, excluding gains and losses from securities transactions and non - core items. 56 Non - GAAP Reconciliations Q1 Q1 $ in thousands 2016 2017 2018 2019 2019 2020 Calculation of Efficiency Ratio Non-interest expense 255,085$ 312,379$ 392,229$ 461,112$ 101,409$ 125,813$ Non-core non-interest expense adjustment (8,435) (27,357) (6,118) (42,972) (1,870) (1,306) Other real estate and foreclosure expense adjustment (4,389) (3,042) (4,240) (3,282) (599) (319) Amortization of intangibles adjustment (5,942) (7,666) (11,009) (11,805) (2,641) (3,413) Efficiency ratio numerator 236,319$ 274,314$ 370,862$ 403,053$ 96,299$ 120,775$ Net-interest income 279,206$ 354,930$ 552,552$ 605,275$ 135,995$ 167,483$ Non-interest income 139,382 138,765 143,896 201,509 34,792 82,394 Non-core non-interest income adjustment (835) (3,972) - - - (5,889) Fully tax-equivalent adjustment 7,722 7,723 5,297 7,322 1,601 2,305 (Gain) loss on sale of securities (5,848) (1,059) (61) (13,314) (2,740) (32,095) Efficiency ratio denominator 419,627$ 496,387$ 701,684$ 800,792$ 169,648$ 214,198$ Efficiency ratio⁽¹⁾ 56.32% 55.27% 52.85% 50.33% 56.76% 56.38%
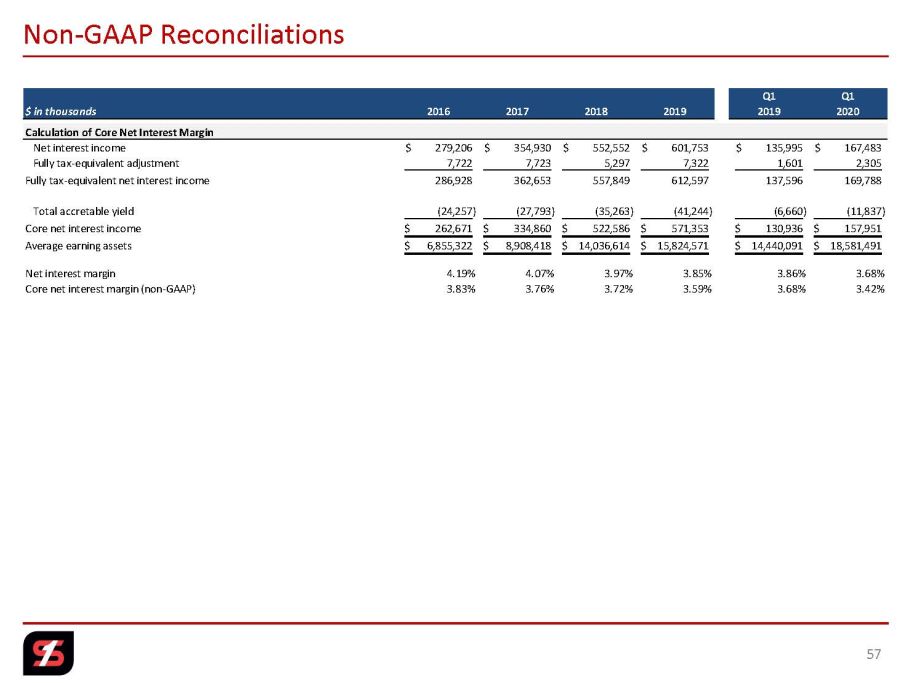
57 Non - GAAP Reconciliations Q1 Q1 $ in thousands 2016 2017 2018 2019 2019 2020 Calculation of Core Net Interest Margin Net interest income 279,206$ 354,930$ 552,552$ 601,753$ 135,995$ 167,483$ Fully tax-equivalent adjustment 7,722 7,723 5,297 7,322 1,601 2,305 Fully tax-equivalent net interest income 286,928 362,653 557,849 612,597 137,596 169,788 Total accretable yield (24,257) (27,793) (35,263) (41,244) (6,660) (11,837) Core net interest income 262,671$ 334,860$ 522,586$ 571,353$ 130,936$ 157,951$ Average earning assets 6,855,322$ 8,908,418$ 14,036,614$ 15,824,571$ 14,440,091$ 18,581,491$ Net interest margin 4.19% 4.07% 3.97% 3.85% 3.86% 3.68% Core net interest margin (non-GAAP) 3.83% 3.76% 3.72% 3.59% 3.68% 3.42%
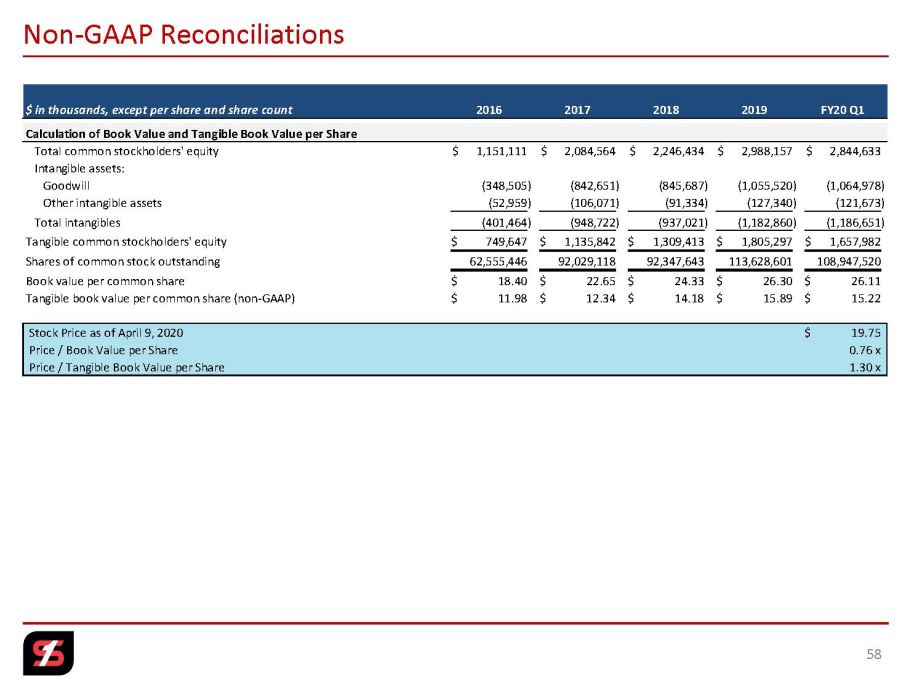
58 Non - GAAP Reconciliations $ in thousands, except per share and share count 2016 2017 2018 2019 FY20 Q1 Calculation of Book Value and Tangible Book Value per Share Total common stockholders' equity 1,151,111$ 2,084,564$ 2,246,434$ 2,988,157$ 2,844,633$ Intangible assets: Goodwill (348,505) (842,651) (845,687) (1,055,520) (1,064,978) Other intangible assets (52,959) (106,071) (91,334) (127,340) (121,673) Total intangibles (401,464) (948,722) (937,021) (1,182,860) (1,186,651) Tangible common stockholders' equity 749,647$ 1,135,842$ 1,309,413$ 1,805,297$ 1,657,982$ Shares of common stock outstanding 62,555,446 92,029,118 92,347,643 113,628,601 108,947,520 Book value per common share 18.40$ 22.65$ 24.33$ 26.30$ 26.11$ Tangible book value per common share (non-GAAP) 11.98$ 12.34$ 14.18$ 15.89$ 15.22$ Stock Price as of April 9, 2020 19.75$ Price / Book Value per Share 0.76 x Price / Tangible Book Value per Share 1.30 x
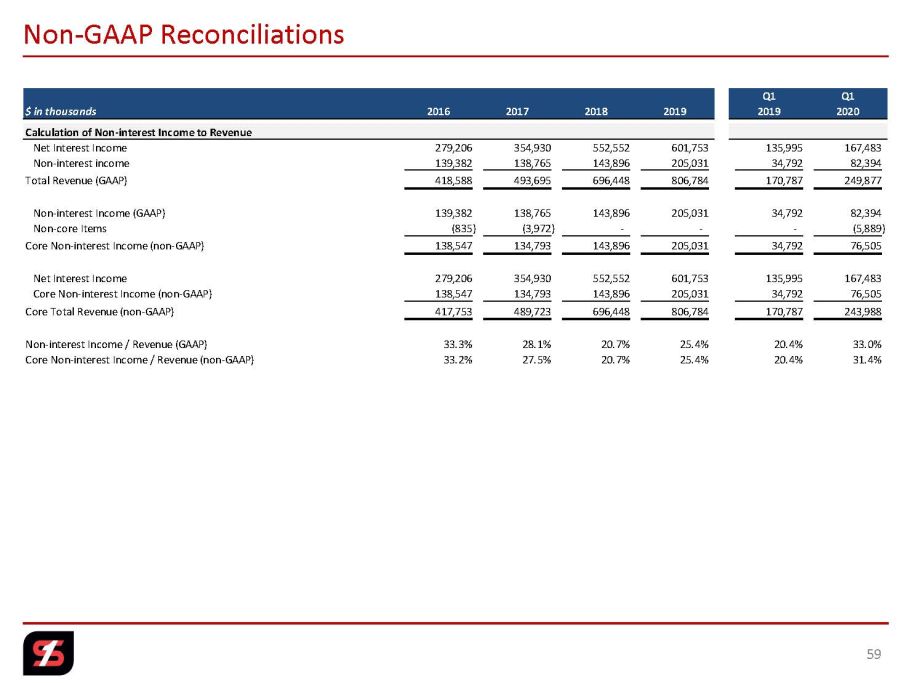
59 Non - GAAP Reconciliations Q1 Q1 $ in thousands 2016 2017 2018 2019 2019 2020 Calculation of Non-interest Income to Revenue Net Interest Income 279,206 354,930 552,552 601,753 135,995 167,483 Non-interest income 139,382 138,765 143,896 205,031 34,792 82,394 Total Revenue (GAAP) 418,588 493,695 696,448 806,784 170,787 249,877 Non-interest Income (GAAP) 139,382 138,765 143,896 205,031 34,792 82,394 Non-core Items (835) (3,972) - - - (5,889) Core Non-interest Income (non-GAAP) 138,547 134,793 143,896 205,031 34,792 76,505 Net Interest Income 279,206 354,930 552,552 601,753 135,995 167,483 Core Non-interest Income (non-GAAP) 138,547 134,793 143,896 205,031 34,792 76,505 Core Total Revenue (non-GAAP) 417,753 489,723 696,448 806,784 170,787 243,988 Non-interest Income / Revenue (GAAP) 33.3% 28.1% 20.7% 25.4% 20.4% 33.0% Core Non-interest Income / Revenue (non-GAAP) 33.2% 27.5% 20.7% 25.4% 20.4% 31.4%
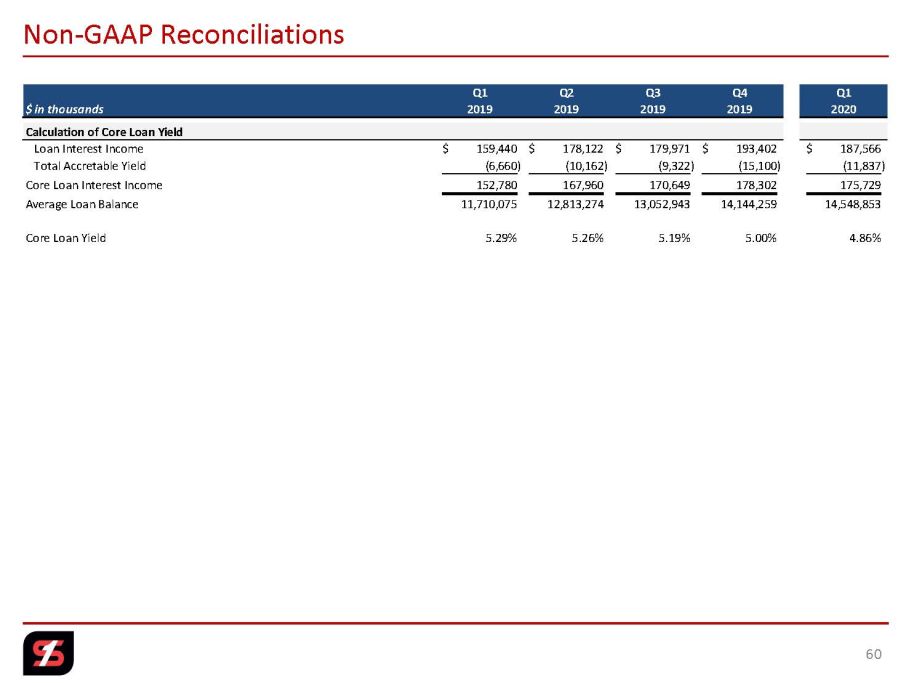
60 Non - GAAP Reconciliations Q1 Q2 Q3 Q4 Q1 $ in thousands 2019 2019 2019 2019 2020 Calculation of Core Loan Yield Loan Interest Income 159,440$ 178,122$ 179,971$ 193,402$ 187,566$ Total Accretable Yield (6,660) (10,162) (9,322) (15,100) (11,837) Core Loan Interest Income 152,780 167,960 170,649 178,302 175,729 Average Loan Balance 11,710,075 12,813,274 13,052,943 14,144,259 14,548,853 Core Loan Yield 5.29% 5.26% 5.19% 5.00% 4.86%
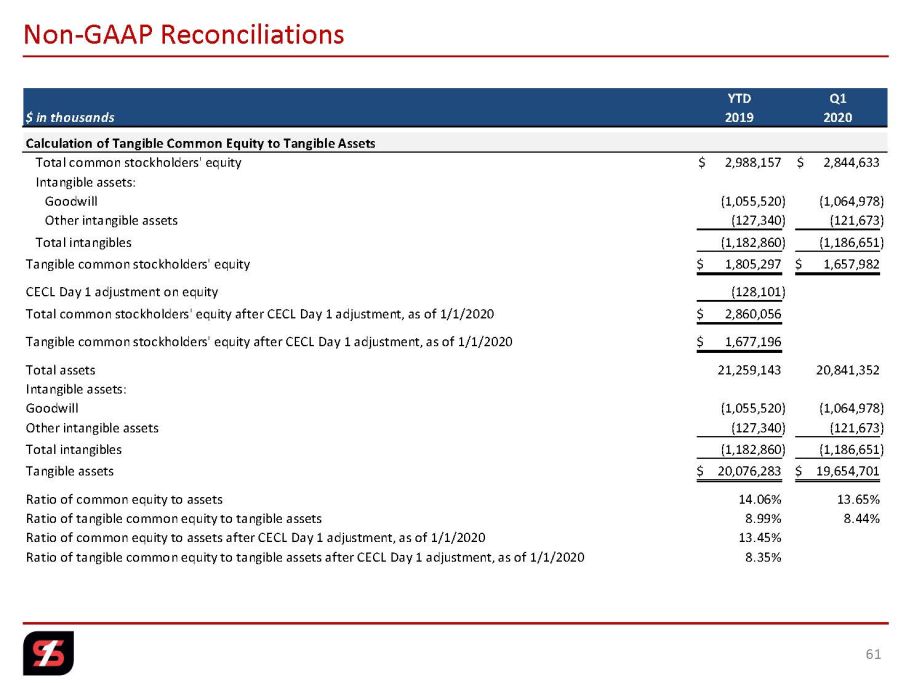
Non - GAAP Reconciliations 61 YTD Q1 $ in thousands 2019 2020 Calculation of Tangible Common Equity to Tangible Assets Total common stockholders' equity 2,988,157$ 2,844,633$ Intangible assets: Goodwill (1,055,520) (1,064,978) Other intangible assets (127,340) (121,673) Total intangibles (1,182,860) (1,186,651) Tangible common stockholders' equity 1,805,297$ 1,657,982$ CECL Day 1 adjustment on equity (128,101) Total common stockholders' equity after CECL Day 1 adjustment, as of 1/1/2020 2,860,056$ Tangible common stockholders' equity after CECL Day 1 adjustment, as of 1/1/2020 1,677,196$ Total assets 21,259,143 20,841,352 Intangible assets: Goodwill (1,055,520) (1,064,978) Other intangible assets (127,340) (121,673) Total intangibles (1,182,860) (1,186,651) Tangible assets 20,076,283$ 19,654,701$ Ratio of common equity to assets 14.06% 13.65% Ratio of tangible common equity to tangible assets 8.99% 8.44% Ratio of common equity to assets after CECL Day 1 adjustment, as of 1/1/2020 13.45% Ratio of tangible common equity to tangible assets after CECL Day 1 adjustment, as of 1/1/2020 8.35%