Exhibit 99.2

Contents 3 Loan Portfolio & Asset Quality 11 Capital, Deposits, Liquidity & Investments 18 4 th Quarter Earnings Highlights 29 Corporate Profile and Company Highlights 42 Appendix 4 th Quarter 2020 Investor Presentation | NASDAQ: SFNC

2 Forward - Looking Statements and Non - GAAP Financial Measures Forward - Looking Statements . Certain statements by Simmons First National Corporation (the “Company”, which where appropriate includes the Company’s wholly - owned banking subsidiary, Simmons Bank) contained in this presentation may not be based on historical facts and should be considered "forward - looking statements" within the meaning of the Private Securities Litigation Reform Act of 1995 . These forward - looking statements may be identified by reference to a future period(s) or by the use of forward - looking terminology, such as "anticipate," "estimate," "expect," "foresee,“ “project,” "may," "might," "will," "would," "could,“ “likely” or "intend," future or conditional verb tenses, and variations or negatives of such terms . These forward - looking statements include, without limitation, those relating to the Company’s future growth ; revenue ; expenses (including interest expense and non - interest expenses) ; assets ; asset quality ; profitability ; earnings ; critical accounting policies ; accretion ; net interest margin ; non - interest revenue ; market conditions related to and impact of the Company's common stock repurchase program ; adequacy of the allowance for loan losses ; income tax deductions ; credit quality ; level of credit losses from lending commitments ; net interest revenue ; interest rate sensitivity ; loan loss experience ; liquidity ; capital resources ; market risk ; the expected benefits, milestones, or costs associated with the Company’s acquisition strategy ; the Company’s ability to recruit and retain key employees ; the ability of the Company to manage the impact of the COVID - 19 pandemic ; the impacts of the Company’s and its customers participation in the Paycheck Protection Program (“PPP”) ; increases in the Company’s security portfolio ; legal and regulatory limitations and compliance and competition ; anticipated loan principal reductions ; fees associated with the PPP ; plans for investments in securities ; statements under the caption “Management’s Outlook” on slides 22 and 23 ; the charges, gains, and savings associated with completed and future branch closures and branch sales ; expectations and projections regarding the Company’s COVID - 19 loan modification program ; and projected dividends . Readers are cautioned not to place undue reliance on the forward - looking statements contained in this presentation in that actual results could differ materially from those indicated in such forward - looking statements, due to a variety of factors . These factors include, but are not limited to, changes in the Company's operating or expansion strategy ; the availability of and costs associated with obtaining adequate and timely sources of liquidity ; the ability to maintain credit quality ; the effect of steps the Company takes in response to the COVID - 19 pandemic ; the severity and duration of the pandemic, including the effectiveness of vaccination efforts ; the pace of recovery when the pandemic subsides and the heightened impact it has on many of the risks described herein ; the effects of the pandemic on, among other things, the Company’s operations, liquidity, and credit quality ; general market and economic conditions ; unemployment ; possible adverse rulings, judgments, settlements and other outcomes of pending or future litigation (including litigation arising from the Company’s participation in and administration of programs related to the COVID - 19 pandemic (including the PPP)) ; the ability of the Company to collect amounts due under loan agreements ; changes in consumer preferences and loan demand ; effectiveness of the Company's interest rate risk management strategies ; laws and regulations affecting financial institutions in general or relating to taxes ; the effect of pending or future legislation ; the ability of the Company to repurchase its common stock on favorable terms ; the ability of the Company to successfully implement its acquisition and branch strategy ; changes in interest rates, deposit flows, real estate values, and capital markets ; inflation ; customer acceptance of the Company's products and services ; changes or disruptions in technology and IT systems (including cyber threats, attacks and events) ; changes in accounting principles relating to loan loss recognition (current expected credit losses, or CECL) ; the benefits associated with the Company’s early retirement program and completed and future branch closures and sales ; and other risk factors . Other relevant risk factors may be detailed from time to time in the Company's press releases and filings with the U . S . Securities and Exchange Commission, including, without limitation, the Company’s Form 10 - K for the year ended December 31 , 2019 , and its Form 10 - Q for the quarter ended June 30 , 2020 . Any forward - looking statement speaks only as of the date of this Report, and the Company undertakes no obligation to update these forward - looking statements to reflect events or circumstances that occur after the date of this Report . Annualized, pro forma, projected and estimated numbers are used for illustrative purpose only, are not forecasts and may not reflect actual results . Non - GAAP Financial Measures . This document contains financial information determined by methods other than in accordance with U . S . generally accepted accounting principles (GAAP) . The Company's management uses these non - GAAP financial measures in their analysis of the company's performance . These measures adjust GAAP performance measures to, among other things, include the tax benefit associated with revenue items that are tax - exempt, as well as exclude from income available to common shareholders, non - interest income, and non - interest expense certain expenses related to significant non - core activities, such as merger - related expenses, expenses related to the Company’s early retirement program, gain on sale of branches, and net branch right - sizing expenses . In addition, the Company also presents certain figures based on tangible common stockholders’ equity, tangible assets, and tangible book value, which exclude goodwill and other intangible assets . The Company further presents certain figures that are exclusive of the impact of PPP loans . The Company’s management believes that these non - GAAP financial measure are useful to investors because they, among other things, present the results of the Company’s ongoing operations without the effect of mergers or other items not central to the Company’s ongoing business, as well as normalize for tax effects . Management, therefore, believes presentations of these non - GAAP financial measures provide useful supplemental information that is essential to a proper understanding of the operating results of the Company's core businesses . These non - GAAP disclosures should not be viewed as a substitute for operating results determined in accordance with GAAP, nor are they necessarily comparable to non - GAAP performance measures that may be presented by other companies . Where non - GAAP financial measures are used, the comparable GAAP financial measure, as well as the reconciliation to the comparable GAAP financial measure, can be found in the appendix to this presentation .

LOAN PORTFOLIO AND ASSET QUALITY 3
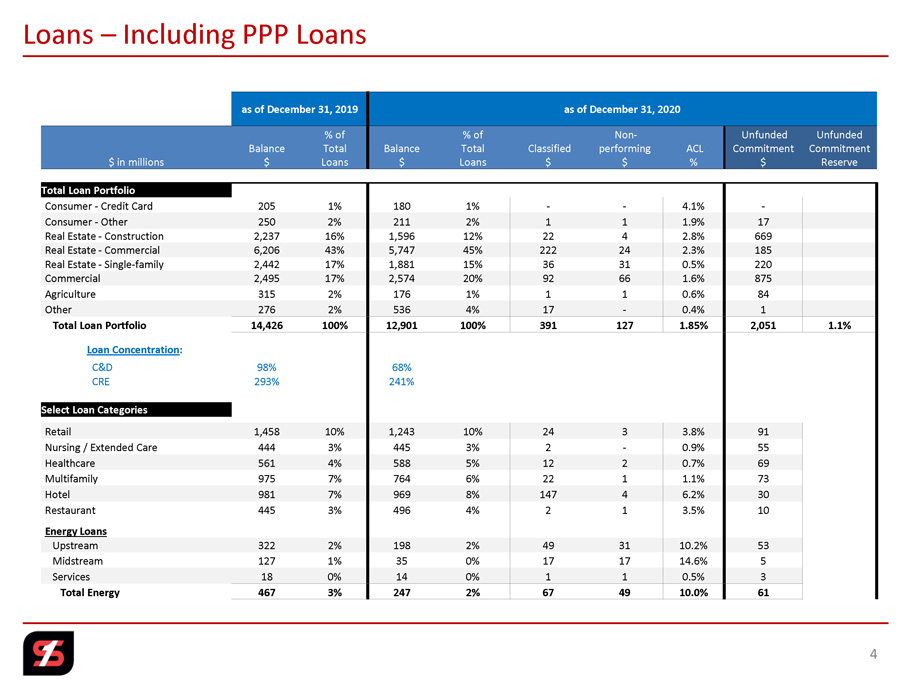
Loans – Including PPP Loans as of December 31, 2019 as of December 31, 2020 $ in millions Balance $ % of Total Loans Balance $ % of Total Loans Classified $ Non - performing $ ACL % Unfunded Commitment $ Unfunded Commitment Reserve Total Loan Portfolio Consumer - Credit Card 205 1% 180 1% - - 4.1% - Consumer - Other 250 2% 211 2% 1 1 1.9% 17 Real Estate - Construction 2,237 16% 1,596 12% 22 4 2.8% 669 Real Estate - Commercial 6,206 43% 5,747 45% 222 24 2.3% 185 Real Estate - Single - family 2,442 17% 1,881 15% 36 31 0.5% 220 Commercial 2,495 17% 2,574 20% 92 66 1.6% 875 Agriculture 315 2% 176 1% 1 1 0.6% 84 Other 276 2% 536 4% 17 - 0.4% 1 Total Loan Portfolio 14,426 100% 12,901 100% 391 127 1.85% 2,051 1.1% Loan Concentration : C&D 98% 68% CRE 293% 241% Select Loan Categories Retail 1,458 10% 1,243 10% 24 3 3.8% 91 Nursing / Extended Care 444 3% 445 3% 2 - 0.9% 55 Healthcare 561 4% 588 5% 12 2 0.7% 69 Multifamily 975 7% 764 6% 22 1 1.1% 73 Hotel 981 7% 969 8% 147 4 6.2% 30 Restaurant 445 3% 496 4% 2 1 3.5% 10 Energy Loans Upstream 322 2% 198 2% 49 31 10.2% 53 Midstream 127 1% 35 0% 17 17 14.6% 5 Services 18 0% 14 0% 1 1 0.5% 3 Total Energy 467 3% 247 2% 67 49 10.0% 61 4

Loans – Excluding PPP Loans as of December 31, 2019 as of December 31, 2020 $ in millions Balance $ % of Total Loans Balance $ % of Total Loans Classified $ Non - performing $ ACL % Unfunded Commitment $ Unfunded Commitment Reserve Total Loan Portfolio Consumer - Credit Card 205 1% 180 2% - - 4.1% - Consumer - Other 250 2% 211 2% 1 1 1.9% 17 Real Estate - Construction 2,237 16% 1,596 13% 22 4 2.8% 669 Real Estate - Commercial 6,206 43% 5,747 48% 222 24 2.3% 185 Real Estate - Single - family 2,442 17% 1,881 16% 36 31 0.5% 220 Commercial 2,495 17% 1,669 14% 92 66 2.4% 875 Agriculture 315 2% 176 1% 1 1 0.6% 84 Other 276 2% 536 4% 17 - 0.4% 1 Total Loan Portfolio 14,426 100% 11,996 100% 391 127 1.98% 2,051 1.1% Loan Concentration : C&D 98% 68% CRE 293% 241% Select Loan Categories Retail 1,458 10% 1,211 10% 24 3 3.8% 91 Nursing / Extended Care 444 3% 427 4% 2 - 1.0% 55 Healthcare 561 4% 470 4% 12 2 0.8% 69 Multifamily 975 7% 762 6% 22 1 1.1% 73 Hotel 981 7% 948 8% 147 4 6.2% 30 Restaurant 445 3% 385 3% 2 1 3.7% 10 Energy Loans Upstream 322 2% 184 2% 49 31 10.5% 53 Midstream 127 1% 35 0% 17 17 14.8% 5 Services 18 0% 11 0% 1 1 0.7% 3 Total Energy 467 3% 230 2% 67 49 10.7% 61 5

Loan Pipeline Trend by Category (1) 6 $ in millions (1) Quarterly amounts adjusted for branches sold in South Texas and Colorado during 2020. $1,009 $641 $219 $192 $247 $341 $220 $90 $112 $250 $347 $291 $72 $70 $177 5.10% 4.70% 4.10% 4.37% 4.12% 0.00% 1.00% 2.00% 3.00% 4.00% 5.00% 6.00% $0 $200 $400 $600 $800 $1,000 $1,200 $1,400 $1,600 $1,800 Q419 Q120 Q220 Q320 Q420 Opportunity Proposal Ready to Close Rate - Ready to Close $1,697 $1,152 $381 $374 $674
COVID - 19 Loan Modifications 7 COVID - 19 Loan Modification Update ▪ The majority of COVID - 19 loan modifications are projected to return to regular payments prior to end of Q3 2021. ▪ All risk ratings reviewed and adjusted as needed on all COVID - 19 modified loans, and any impact is reflected within the Asset Qu ality performance. ▪ Management focus is on loans that received multiple rounds of COVID - 19 loan modifications AND are categorized internally as like ly to need further payment assistance. – 32 loans totaling $89,000,000 • 5 hotel projects totaling $64,000,000 • 1 senior / independent living complex totaling $17,000,000 ▪ Continuous monitoring of COVID - 19 modified loans as well as timely communications with clients are key objectives. as of January 14, 2021
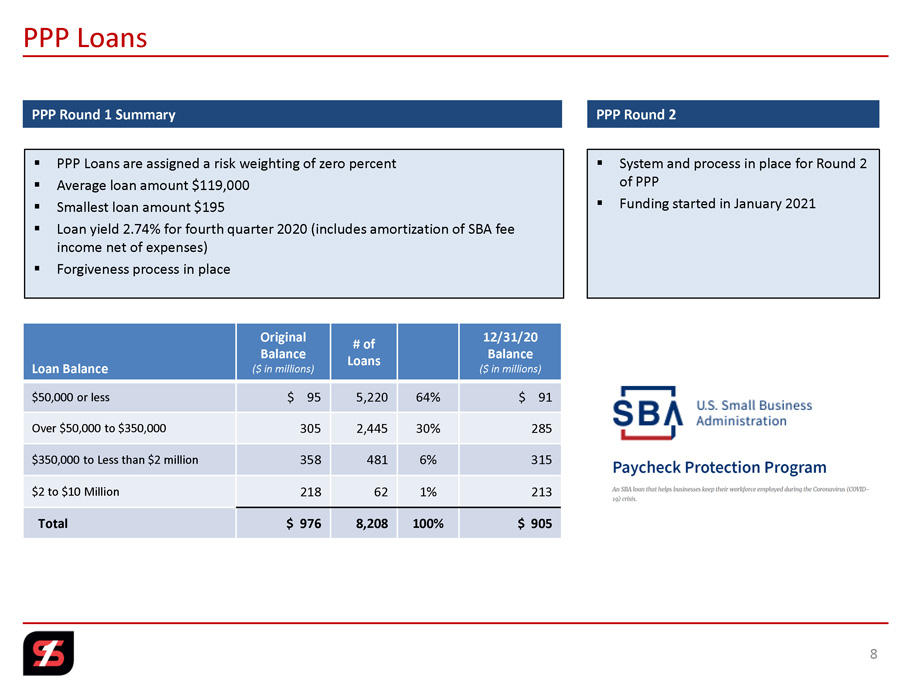
Loan Balance Original Balance ($ in millions) # of Loans 12/31/20 Balance ($ in millions) $50,000 or less $ 95 5,220 64% $ 91 Over $50,000 to $350,000 305 2,445 30% 285 $350,000 to Less than $2 million 358 481 6% 315 $2 to $10 Million 218 62 1% 213 Total $ 976 8,208 100% $ 905 PPP Loans 8 PPP Round 1 Summary ▪ PPP Loans are assigned a risk weighting of zero percent ▪ Average loan amount $119,000 ▪ Smallest loan amount $195 ▪ Loan yield 2.74% for fourth quarter 2020 (includes amortization of SBA fee income net of expenses) ▪ Forgiveness process in place PPP Round 2 ▪ System and process in place for Round 2 of PPP ▪ Funding started in January 2021
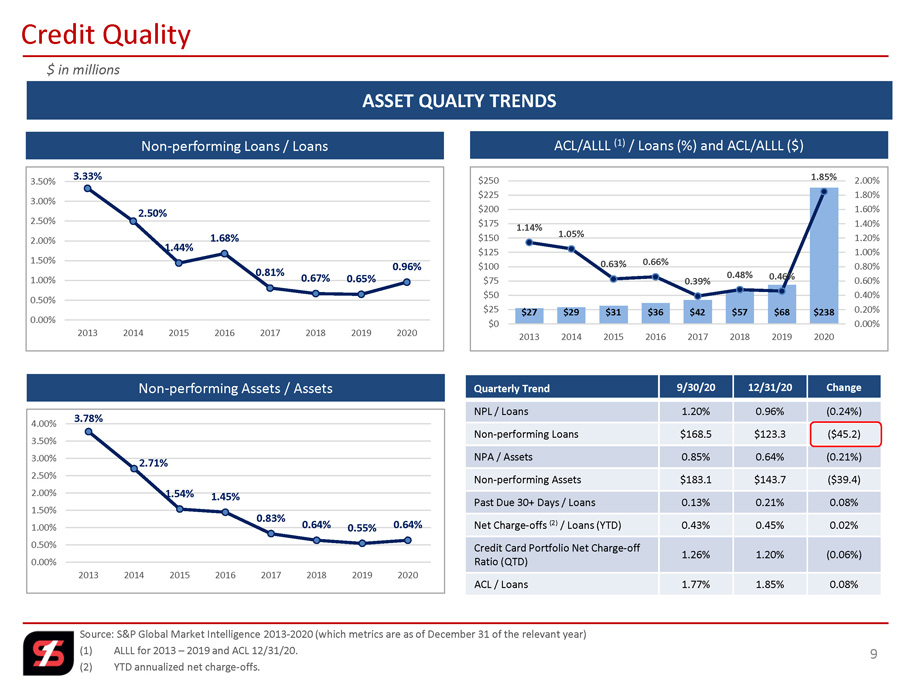
ASSET QUALTY TRENDS Credit Quality $ in millions Source: S&P Global Market Intelligence 2013 - 2020 (which metrics are as of December 31 of the relevant year) (1) ALLL for 2013 – 2019 and ACL 12/31/20. (2) YTD annualized net charge - offs. Non - performing Loans / Loans 3.33% 2.50% 1.44% 1.68% 0.81% 0.67% 0.65% 0.96% 0.00% 0.50% 1.00% 1.50% 2.00% 2.50% 3.00% 3.50% 2013 2014 2015 2016 2017 2018 2019 2020 ACL/ALLL (1) / Loans (%) and ACL/ALLL ($) $27 $29 $31 $36 $42 $57 $68 $238 1.14% 1.05% 0.63% 0.66% 0.39% 0.48% 0.46% 1.85% 0.00% 0.20% 0.40% 0.60% 0.80% 1.00% 1.20% 1.40% 1.60% 1.80% 2.00% $0 $25 $50 $75 $100 $125 $150 $175 $200 $225 $250 2013 2014 2015 2016 2017 2018 2019 2020 Quarterly Trend 9/30/20 12/31/20 Change NPL / Loans 1.20% 0.96% (0.24%) Non - performing Loans $168.5 $123.3 ($45.2) NPA / Assets 0.85% 0.64% (0.21%) Non - performing Assets $183.1 $143.7 ($39.4) Past Due 30+ Days / Loans 0.13% 0.21% 0.08% Net Charge - offs (2) / Loans (YTD) 0.43% 0.45% 0.02% Credit Card Portfolio Net Charge - off Ratio (QTD) 1.26% 1.20% (0.06%) ACL / Loans 1.77% 1.85% 0.08% Non - performing Assets / Assets 3.78% 2.71% 1.54% 1.45% 0.83% 0.64% 0.55% 0.64% 0.00% 0.50% 1.00% 1.50% 2.00% 2.50% 3.00% 3.50% 4.00% 2013 2014 2015 2016 2017 2018 2019 2020 9

ALLL or ACL Loan Discount Total Loan Coverage ACL (ALLL)/ Loans ACL (ALLL)/ Loans excluding PPP (1) ALLL as of 12/31/19 $ 68.2 $ 87.3 $ 155.5 0.47% 0.47% CECL Day 1 Adoption Impact 151.4 (87.3) 64.1 ACL as of 01/01/20 $ 219.6 $ 0 $ 219.6 1.52% 1.52% Q1 - 20 Provision, net of charge - offs 23.6 23.6 ACL as of 03/31/20 $ 243.2 $ 0 $ 243.2 1.69% 1.69% Q2 - 20 Provision 26.7 26.7 Q2 - 20 Net charge - offs (38.2) (38.2) ACL as of 06/30/20 $ 231.6 $ 0 $ 231.6 1.59% 1.70% Q3 - 20 Provision 22.3 22.3 Q3 - 20 Net charge - offs (5.7) (5.7) ACL as of 09/30/20 $ 248.3 $ 0 $ 248.3 1.77% 1.90% Q4 - 20 Provision 7.3 7.3 Q4 - 20 Net charge - offs (17.5) (17.5) ACL as of 12/31/20 $ 238.0 $ 0 $ 238.0 1.85% 1.98% Allowance for Loan Losses and Loan Coverage 10 Allowance for Credit Losses (ACL) CECL = Current Expected Credit Losses methodology for estimating ACL ACL = Allowance for Credit Losses on Loans PCD = Purchased Credit - Deteriorated Financial Assets (1) Figures excluding PPP loans are non - GAAP measurements. See Appendix for non - GAAP reconciliations. $ in millions as of 03/31/20 as of 06/30/20 as of 09/30/20 as of 12/31/20 Unfunded Commitments $2,765 $2,616 $2.344 $2,051 Reserve $29.4 $24.4 $24.4 $22.4 Reserve / Unfunded Balance 1.1% 0.9% 1.0% 1.1% Reserve for Unfunded Commitments ACL Methodology as of 12/31/20: ▪ Quantitative allocation: 0.81% Moody’s December 2020 scenarios with management’s weighting: S1 (17%) / Baseline (68%) / S2 (15%) ▪ Qualitative allocation: 1.04% ▪ $136MM in individually assessed loans with related reserves of $15MM ▪ Total ACL / Loans: 1.85%

CAPITAL, DEPOSITS, LIQUDITY AND INVESTMENTS 11
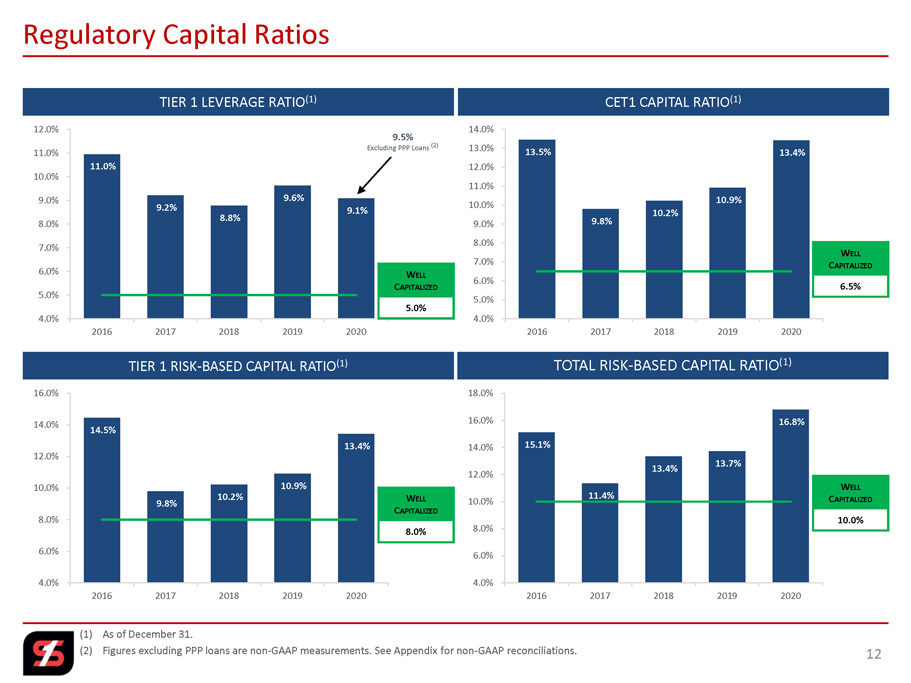
13.5% 9.8% 10.2% 10.9% 13.4% 4.0% 5.0% 6.0% 7.0% 8.0% 9.0% 10.0% 11.0% 12.0% 13.0% 14.0% 2016 2017 2018 2019 2020 W ELL C APITALIZED 8.0% 15.1% 11.4% 13.4% 13.7% 16.8% 4.0% 6.0% 8.0% 10.0% 12.0% 14.0% 16.0% 18.0% 2016 2017 2018 2019 2020 14.5% 9.8% 10.2% 10.9% 13.4% 4.0% 6.0% 8.0% 10.0% 12.0% 14.0% 16.0% 2016 2017 2018 2019 2020 11.0% 9.2% 8.8% 9.6% 9.1% 4.0% 5.0% 6.0% 7.0% 8.0% 9.0% 10.0% 11.0% 12.0% 2016 2017 2018 2019 2020 (1) As of December 31. (2) Figures excluding PPP loans are non - GAAP measurements. See Appendix for non - GAAP reconciliations. 12 Regulatory Capital Ratios TIER 1 LEVERAGE RATIO (1) TOTAL RISK - BASED CAPITAL RATIO (1) TIER 1 RISK - BASED CAPITAL RATIO (1) CET1 CAPITAL RATIO (1) W ELL C APITALIZED 5.0% W ELL C APITALIZED 10.0% W ELL C APITALIZED 6.5% 9.5% Excluding PPP Loans (2)

Stock Repurchase Program 13 $10.1 $93.3 $20.0 $0.0 $10.0 $20.0 $30.0 $40.0 $50.0 $60.0 $70.0 $80.0 $90.0 $100.0 Q419 Q120 Q220 Q320 Q420 REPUCHASE BY QUARTER (1) ▪ Summary of stock repurchases since reinitiating program in Q4 2019: – $123 million – 6.3 million shares or about 5.5% of outstanding – Average price $19.45 ▪ $56.5 million remaining under current plan $0.0 $0.0 Suspended Plan 1) $ in millions

(1) As of December 31. (2) Figures based on tangible book value (which excludes goodwill and other intangible assets) are non - GAAP measurements. See Append ix for non - GAAP reconciliations. 14 Book Value & Tangible Book Value BOOK VALUE ($ IN MILLIONS) (1) TANGIBLE BOOK VALUE PER SHARE (1)(2) BOOK VALUE PER SHARE (1) TANGIBLE BOOK VALUE ($ IN MILLIONS) (1)(2) $1,151 $2,085 $2,246 $2,988 $2,976 $500 $750 $1,000 $1,250 $1,500 $1,750 $2,000 $2,250 $2,500 $2,750 $3,000 2016 2017 2018 2019 2020 $18.40 $22.65 $24.33 $26.30 $27.53 $10.00 $12.00 $14.00 $16.00 $18.00 $20.00 $22.00 $24.00 $26.00 $28.00 2016 2017 2018 2019 2020 $11.98 $12.34 $14.18 $15.89 $16.56 $10.00 $12.00 $14.00 $16.00 $18.00 $20.00 2016 2017 2018 2019 2020 $750 $1,136 $1,309 $1,805 $1,789 $500 $750 $1,000 $1,250 $1,500 $1,750 $2,000 2016 2017 2018 2019 2020

▪ Interest Rates – In March 2020, the Fed reduced the Fed Funds target rate by 150 basis points. ▪ Interest Bearing Transaction Deposits – Rates were lowered during the latter part of the first quarter. ▪ Time Deposits – Rates were lowered during the latter part of the first quarter. Based on maturities, we expect there will be a continued lag in the impact to interest expense. $ in billions Interest Bearing Deposit Repricing Deposit Composition Deposits 15 1.02% 1.07% 1.09% 0.94% 0.80% 0.44% 0.39% 0.34% 0.25% 0.35% 0.45% 0.55% 0.65% 0.75% 0.85% 0.95% 1.05% 1.15% $0.0 $2.5 $5.0 $7.5 $10.0 $12.5 $15.0 $17.5 Q119 Q219 Q319 Q419 Q120 Q220 Q320 Q420 Non-interest Bearing Interest Bearing Transactions Time Deposits Cost of Deposits $12.0 $13.5 $13.5 $16.1 $15.6 $16.6 $16.2 $17.0
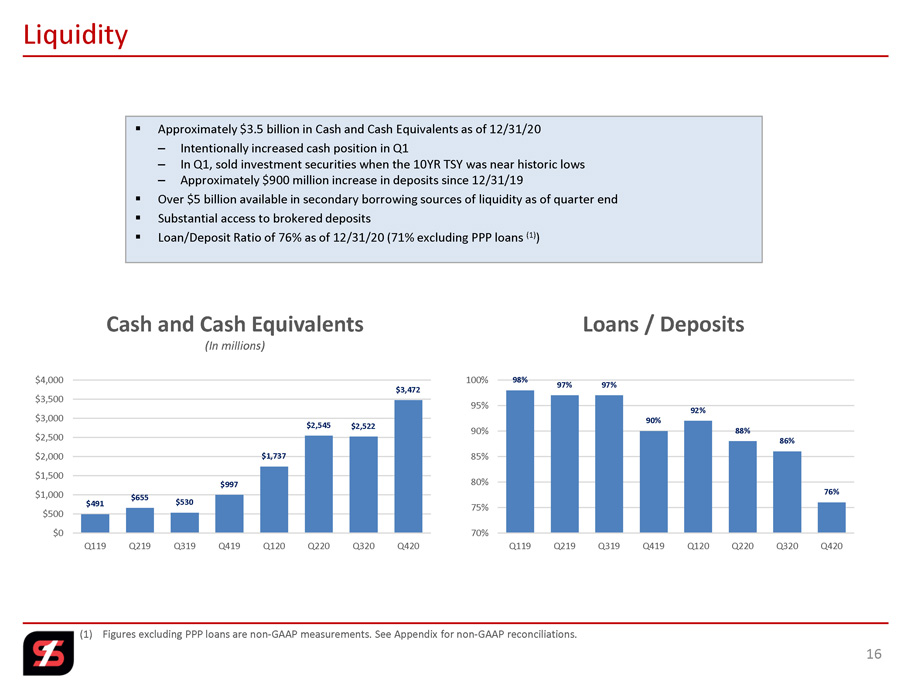
▪ Approximately $3.5 billion in Cash and Cash Equivalents as of 12/31/20 – Intentionally increased cash position in Q1 – In Q1, sold investment securities when the 10YR TSY was near historic lows – Approximately $900 million increase in deposits since 12/31/19 ▪ Over $5 billion available in secondary borrowing sources of liquidity as of quarter end ▪ Substantial access to brokered deposits ▪ Loan/Deposit Ratio of 76% as of 12/31/20 (71% excluding PPP loans (1) ) Liquidity $491 $655 $530 $997 $1,737 $2,545 $2,522 $3,472 $0 $500 $1,000 $1,500 $2,000 $2,500 $3,000 $3,500 $4,000 Q119 Q219 Q319 Q419 Q120 Q220 Q320 Q420 Cash and Cash Equivalents (In millions) 98% 97% 97% 90% 92% 88% 86% 76% 70% 75% 80% 85% 90% 95% 100% Q119 Q219 Q319 Q419 Q120 Q220 Q320 Q420 Loans / Deposits 16 (1) Figures excluding PPP loans are non - GAAP measurements. See Appendix for non - GAAP reconciliations.
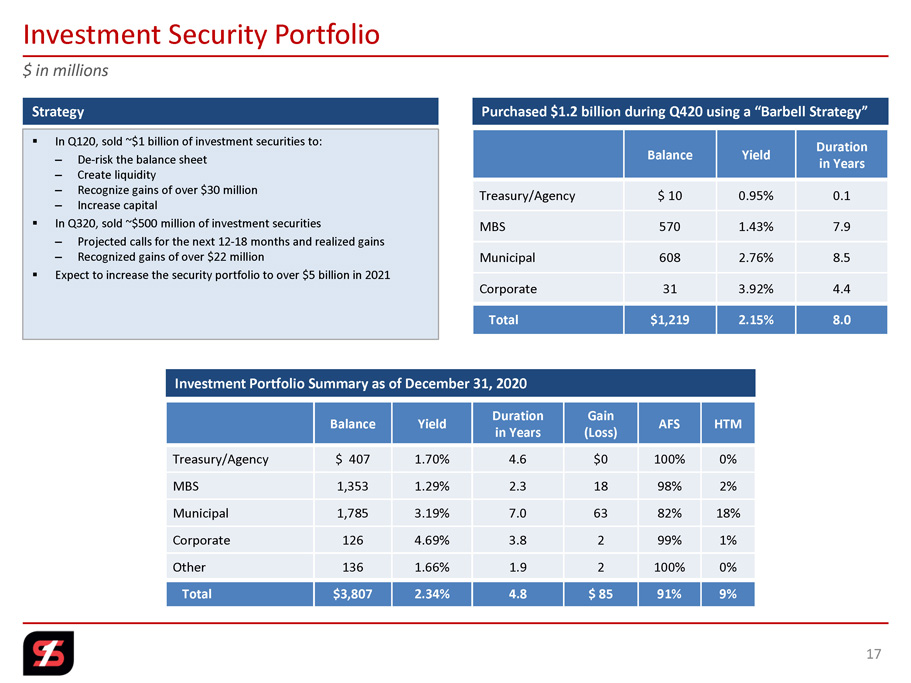
$ in millions Investment Security Portfolio ▪ In Q120, sold ~$1 billion of investment securities to: – De - risk the balance sheet – Create liquidity – Recognize gains of over $30 million – Increase capital ▪ In Q320, sold ~$500 million of investment securities – Projected calls for the next 12 - 18 months and realized gains – Recognized gains of over $22 million ▪ Expect to increase the security portfolio to over $5 billion in 2021 Strategy 17 Investment Portfolio Summary as of December 31, 2020 Balance Yield Duration in Years Gain (Loss) AFS HTM Treasury/Agency $ 407 1.70% 4.6 $0 100% 0% MBS 1,353 1.29% 2.3 18 98% 2% Municipal 1,785 3.19% 7.0 63 82% 18% Corporate 126 4.69% 3.8 2 99% 1% Other 136 1.66% 1.9 2 100% 0% Total $3,807 2.34% 4.8 $ 85 91% 9% Purchased $1.2 billion during Q420 using a “Barbell Strategy” Balance Yield Duration in Years Treasury/Agency $ 10 0.95% 0.1 MBS 570 1.43% 7.9 Municipal 608 2.76% 8.5 Corporate 31 3.92% 4.4 Total $1,219 2.15% 8.0
4 th Quarter 2020 Earnings Highlights 18

Note: Core figures (excluding Core NIM) exclude non - core income and expense items (e.g., early retirement program costs, gain on sale of banking operations, merger related costs and branch right - sizing costs). Core NIM excludes purchase accounting interest accretion. Core figures, as well as figures based on tangible common equity (which excl ude s goodwill and other intangible assets), are non - GAAP measurements. See Appendix for non - GAAP reconciliations. (1) Efficiency ratio is core non - interest expense before foreclosed property expense and amortization of intangibles as a percent of net interest income (fully taxable equivalent) and non - interest revenues, excluding gains and losses from securities transactions and non - core items, and is a non - GAAP measurement. See Appendix for non - GAAP reconcilia tions. 19 Financial Highlights QUARTERLY RESULTS Q3 2020 Q4 2020 CHANGE Q3 2020 Q4 2020 CHANGE $ IN MILLIONS, EXCEPT PER SHARE DATA EARNINGS EARNINGS $ % DILUTED EPS DILUTED EPS $ % GAAP Results $ 65.89 $ 52.96 $ (12.93) (19.6%) $ 0.60 $ 0.49 $ (0.11) (18.3%) Non - Core Items 2.45 9.02 6.57 268.2% 0.03 0.08 0.05 166.7% Non - GAAP Core Results $ 68.34 $ 61.98 $ (6.36) (9.3%) $ 0.63 $ 0.57 $ (0.06) (9.5%) ROA 1.20% 0.96% Core ROA 1.25% 1.13% ROACE 8.91% 7.13% Core ROACE 9.24% 8.34% ROTCE 15.45% 12.48% Core ROTCE 16.00% 14.51% Efficiency Ratio⁽¹⁾ 54.12% 55.27% NIM 3.21% 3.22% Core NIM 3.02% 3.04% YTD RESULTS (as of December 31) 2019 2020 CHANGE 2019 2020 CHANGE $ IN MILLIONS, EXCEPT PER SHARE DATA EARNINGS EARNINGS $ % DILUTED EPS DILUTED EPS $ % GAAP Results $ 237.83 $ 254.85 $ 17.02 7.2% $ 2.41 $ 2.31 $ (0.10) (4.1%) Non - Core Items 31.74 9.45 (22.29) (70.2%) 0.32 0.09 (0.23) (71.9%) Non - GAAP Core Results $ 269.57 $ 264.30 $ (5.27) (2.0%) $ 2.73 $ 2.40 $ (0.33) (12.1%) ROA 1.33% 1.18% Core ROA 1.51% 1.22% ROACE 9.93% 8.72% Core ROACE 11.25% 9.05% ROTCE 17.99% 15.25% Core ROTCE 20.31% 15.79% Efficiency Ratio⁽¹⁾ 50.33% 54.66% NIM 3.85% 3.38% Core NIM 3.59% 3.16%
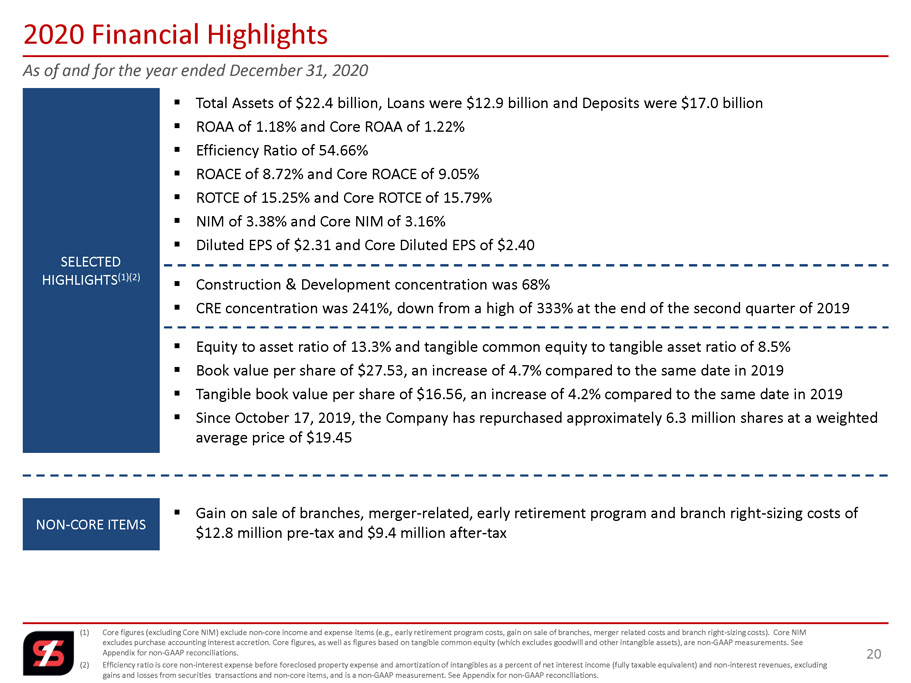
As of and for the year ended December 31, 2020 (1) Core figures (excluding Core NIM) exclude non - core income and expense items (e.g., early retirement program costs, gain on sale of branches, merger related costs and branch right - sizing costs). Core NIM excludes purchase accounting interest accretion. Core figures, as well as figures based on tangible common equity (which excl ude s goodwill and other intangible assets), are non - GAAP measurements. See Appendix for non - GAAP reconciliations. (2) Efficiency ratio is core non - interest expense before foreclosed property expense and amortization of intangibles as a percent of net interest income (fully taxable equivalent) and non - interest revenues, excluding gains and losses from securities transactions and non - core items, and is a non - GAAP measurement. See Appendix for non - GAAP reco nciliations. 20 2020 Financial Highlights NON - CORE ITEMS SELECTED HIGHLIGHTS (1)(2) ▪ Gain on sale of branches, merger - related, early retirement program and branch right - sizing costs of $12.8 million pre - tax and $9.4 million after - tax ▪ Total Assets of $22.4 billion, Loans were $12.9 billion and Deposits were $17.0 billion ▪ ROAA of 1.18% and Core ROAA of 1.22% ▪ Efficiency Ratio of 54.66% ▪ ROACE of 8.72% and Core ROACE of 9.05 % ▪ ROTCE of 15.25% and Core ROTCE of 15.79% ▪ NIM of 3.38% and Core NIM of 3.16% ▪ Diluted EPS of $2.31 and Core Diluted EPS of $2.40 ▪ Equity to asset ratio of 13.3% and tangible common equity to tangible asset ratio of 8.5% ▪ Book value per share of $27.53, an increase of 4.7% compared to the same date in 2019 ▪ Tangible book value per share of $16.56, an increase of 4.2% compared to the same date in 2019 ▪ Since October 17, 2019, the Company has repurchased approximately 6.3 million shares at a weighted average price of $19.45 ▪ Construction & Development concentration was 68% ▪ CRE concentration was 241%, down from a high of 333% at the end of the second quarter of 2019
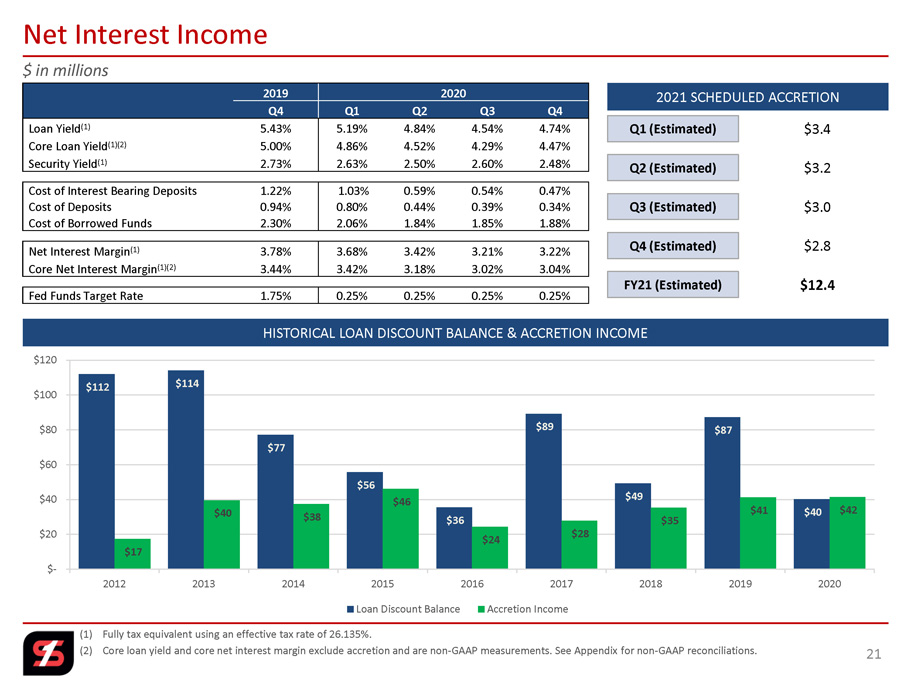
HISTORICAL LOAN DISCOUNT BALANCE & ACCRETION INCOME (1) Fully tax equivalent using an effective tax rate of 26.135%. (2) Core loan yield and core net interest margin exclude accretion and are non - GAAP measurements. See Appendix for non - GAAP reconcil iations. 21 Net Interest Income 2021 SCHEDULED ACCRETION Q1 (Estimated) Q2 (Estimated) Q4 (Estimated) Q3 (Estimated) FY21 (Estimated) $3.0 $3.4 $2.8 $3.2 $12.4 $ in millions 2019 2020 Q4 Q1 Q2 Q3 Q4 Loan Yield (1) 5.43% 5.19% 4.84% 4.54% 4.74% Core Loan Yield (1)(2) 5.00% 4.86% 4.52% 4.29% 4.47% Security Yield (1) 2.73% 2.63% 2.50% 2.60% 2.48% Cost of Interest Bearing Deposits 1.22% 1.03% 0.59% 0.54% 0.47% Cost of Deposits 0.94% 0.80% 0.44% 0.39% 0.34% Cost of Borrowed Funds 2.30% 2.06% 1.84% 1.85% 1.88% Net Interest Margin (1) 3.78% 3.68% 3.42% 3.21% 3.22% Core Net Interest Margin (1)(2) 3.44% 3.42% 3.18% 3.02% 3.04% Fed Funds Target Rate 1.75% 0.25% 0.25% 0.25% 0.25% $112 $114 $77 $56 $36 $89 $49 $87 $40 $17 $40 $38 $46 $24 $28 $35 $41 $42 $- $20 $40 $60 $80 $100 $120 2012 2013 2014 2015 2016 2017 2018 2019 2020 Loan Discount Balance Accretion Income
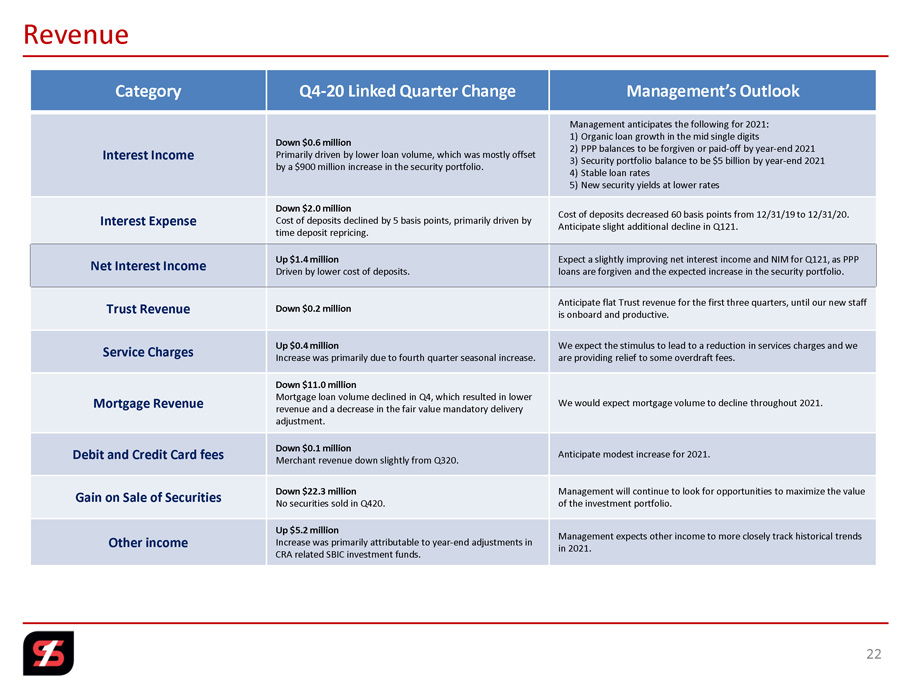
Category Q4 - 20 Linked Quarter Change Management’s Outlook Interest Income Down $0.6 million Primarily driven by lower loan volume, which was mostly offset by a $900 million increase in the security portfolio. Management anticipates the following for 2021: 1) Organic loan growth in the mid single digits 2) PPP balances to be forgiven or paid - off by year - end 2021 3) Security portfolio balance to be $5 billion by year - end 2021 4) Stable loan rates 5) New security yields at lower rates Interest Expense Down $2.0 million Cost of deposits declined by 5 basis points, primarily driven by time deposit repricing. Cost of deposits decreased 60 basis points from 12/31/19 to 12/31/20. Anticipate slight additional decline in Q121. Net Interest Income Up $1.4 million Driven by lower cost of deposits. Expect a slightly improving net interest income and NIM for Q121, as PPP loans are forgiven and the expected increase in the security portfolio. Trust Revenue Down $0.2 million Anticipate flat Trust revenue for the first three quarters, until our new staff is onboard and productive. Service Charges Up $0.4 million Increase was primarily due to fourth quarter seasonal increase. We expect the stimulus to lead to a reduction in services charges and we are providing relief to some overdraft fees. Mortgage Revenue Down $11.0 million Mortgage loan volume declined in Q4, which resulted in lower revenue and a decrease in the fair value mandatory delivery adjustment. We would expect mortgage volume to decline throughout 2021. Debit and Credit Card fees Down $0.1 million Merchant revenue down slightly from Q320. Anticipate modest increase for 2021. Gain on Sale of Securities Down $22.3 million No securities sold in Q420. Management will continue to look for opportunities to maximize the value of the investment portfolio. Other income Up $5.2 million Increase was primarily attributable to year - end adjustments in CRA related SBIC investment funds. Management expects other income to more closely track historical trends in 2021. Revenue 22
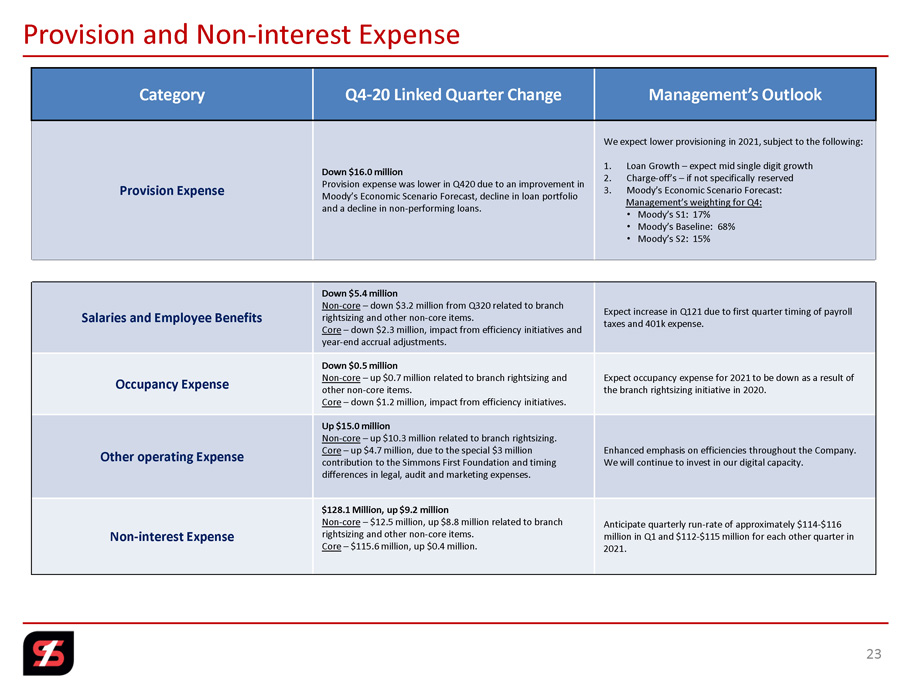
Category Q4 - 20 Linked Quarter Change Management’s Outlook Provision Expense Down $16.0 million Provision expense was lower in Q420 due to an improvement in Moody’s Economic Scenario Forecast, decline in loan portfolio and a decline in non - performing loans. We expect lower provisioning in 2021, subject to the following: 1. Loan Growth – expect mid single digit growth 2. Charge - off’s – if not specifically reserved 3. Moody’s Economic Scenario Forecast: Management’s weighting for Q4: • Moody’s S1: 17% • Moody’s Baseline: 68% • Moody’s S2: 15% Salaries and Employee Benefits Down $5.4 million Non - core – down $3.2 million from Q320 related to branch rightsizing and other non - core items. Core – down $2.3 million, impact from efficiency initiatives and year - end accrual adjustments. Expect increase in Q121 due to first quarter timing of payroll taxes and 401k expense. Occupancy Expense Down $0.5 million Non - core – up $0.7 million related to branch rightsizing and other non - core items. Core – down $1.2 million, impact from efficiency initiatives. Expect occupancy expense for 2021 to be down as a result of the branch rightsizing initiative in 2020. Other operating Expense Up $15.0 million Non - core – up $10.3 million related to branch rightsizing. Core – up $4.7 million, due to the special $3 million contribution to the Simmons First Foundation and timing differences in legal, audit and marketing expenses. Enhanced emphasis on efficiencies throughout the Company. We will continue to invest in our digital capacity. Non - interest Expense $128.1 Million, up $9.2 million Non - core – $12.5 million, up $8.8 million related to branch rightsizing and other non - core items. Core – $115.6 million, up $0.4 million. Anticipate quarterly run - rate of approximately $114 - $116 million in Q1 and $112 - $115 million for each other quarter in 2021. Provision and Non - interest Expense 23
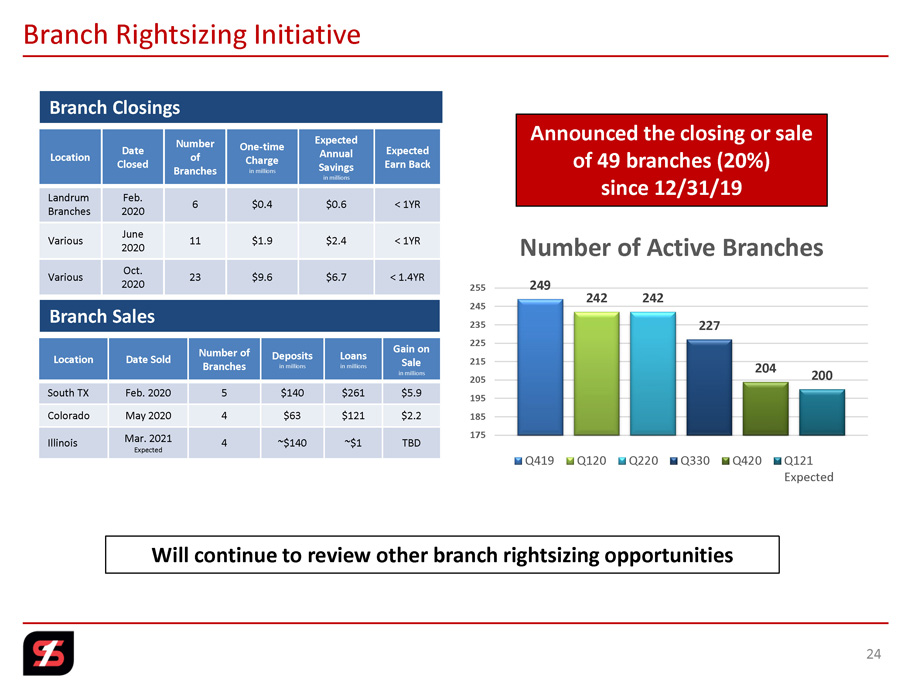
Branch Rightsizing Initiative 24 Branch Sales Branch Closings Will continue to review other branch rightsizing opportunities Location Date Sold Number of Branches Deposits in millions Loans in millions Gain on Sale in millions South TX Feb. 2020 5 $140 $261 $5.9 Colorado May 2020 4 $63 $121 $2.2 Illinois Mar. 2021 Expected 4 ~$140 ~$1 TBD Location Date Closed Number of Branches One - time Charge in millions Expected Annual Savings in millions Expected Earn Back Landrum Branches Feb. 2020 6 $0.4 $0.6 < 1YR Various June 2020 11 $1.9 $2.4 < 1YR Various Oct. 2020 23 $9.6 $6.7 < 1.4YR 249 242 242 227 204 200 175 185 195 205 215 225 235 245 255 Number of Active Branches Q419 Q120 Q220 Q330 Q420 Q121 Expected Announced the closing or sale of 49 branches (20%) since 12/31/19
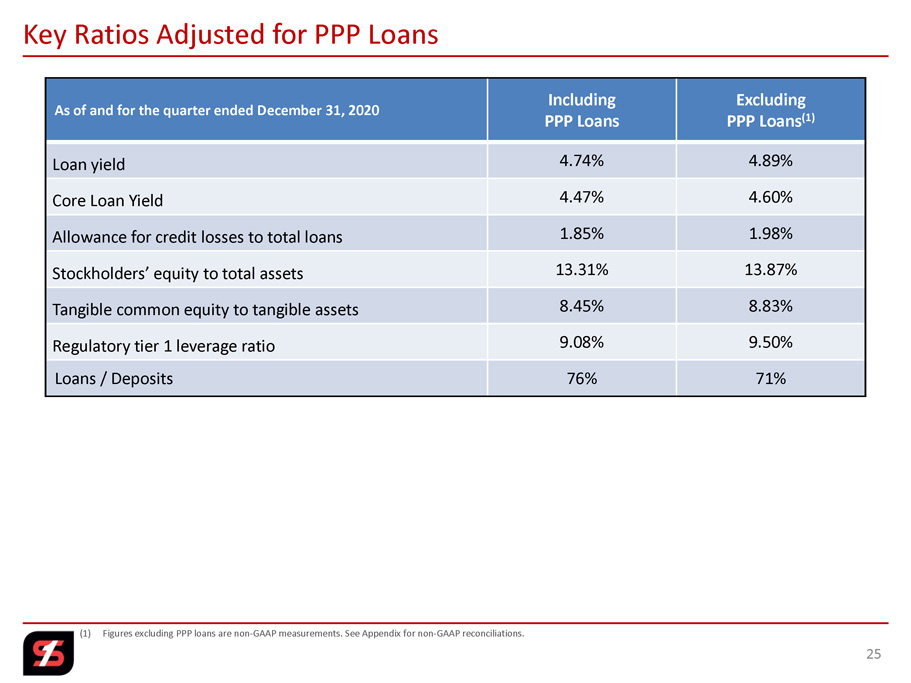
As of and for the quarter ended December 31, 2020 Including PPP Loans Excluding PPP Loans (1) Loan yield 4.74% 4.89% Core Loan Yield 4.47% 4.60% Allowance for credit losses to total loans 1.85% 1.98% Stockholders’ equity to total assets 13.31% 13.87% Tangible common equity to tangible assets 8.45% 8.83% Regulatory tier 1 leverage ratio 9.08% 9.50% Loans / Deposits 76% 71% 25 Key Ratios Adjusted for PPP Loans (1) Figures excluding PPP loans are non - GAAP measurements. See Appendix for non - GAAP reconciliations.
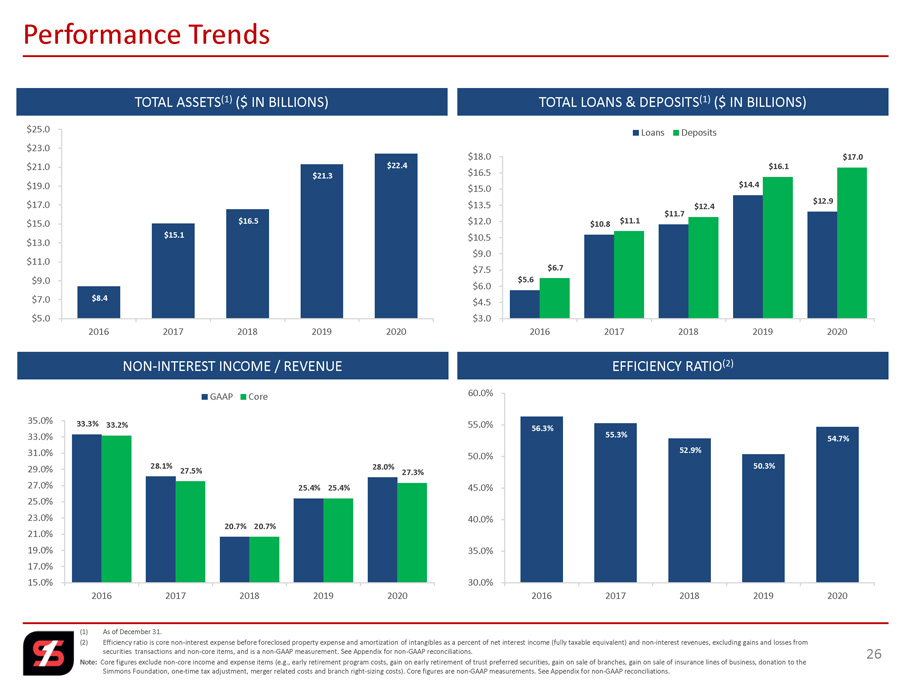
(1) As of December 31. (2) Efficiency ratio is core non - interest expense before foreclosed property expense and amortization of intangibles as a percent of net interest income (fully taxable equivalent) and non - interest revenues, excluding gains and losses from securities transactions and non - core items, and is a non - GAAP measurement. See Appendix for non - GAAP reconciliations. Note: Core figures exclude non - core income and expense items (e.g., early retirement program costs, gain on early retirement of trus t preferred securities, gain on sale of branches, gain on sale of insurance lines of business, donation to the Simmons Foundation, one - time tax adjustment, merger related costs and branch right - sizing costs). Core figures are non - GAAP meas urements. See Appendix for non - GAAP reconciliations. 26 Performance Trends TOTAL ASSETS (1) ($ IN BILLIONS) EFFICIENCY RATIO (2) NON - INTEREST INCOME / REVENUE TOTAL LOANS & DEPOSITS (1) ($ IN BILLIONS) $8.4 $15.1 $16.5 $21.3 $22.4 $5.0 $7.0 $9.0 $11.0 $13.0 $15.0 $17.0 $19.0 $21.0 $23.0 $25.0 2016 2017 2018 2019 2020 56.3% 55.3% 52.9% 50.3% 54.7% 30.0% 35.0% 40.0% 45.0% 50.0% 55.0% 60.0% 2016 2017 2018 2019 2020 $5.6 $10.8 $11.7 $14.4 $12.9 $6.7 $11.1 $12.4 $16.1 $17.0 $3.0 $4.5 $6.0 $7.5 $9.0 $10.5 $12.0 $13.5 $15.0 $16.5 $18.0 2016 2017 2018 2019 2020 Loans Deposits 33.3% 28.1% 20.7% 25.4% 28.0% 33.2% 27.5% 20.7% 25.4% 27.3% 15.0% 17.0% 19.0% 21.0% 23.0% 25.0% 27.0% 29.0% 31.0% 33.0% 35.0% 2016 2017 2018 2019 2020 GAAP Core
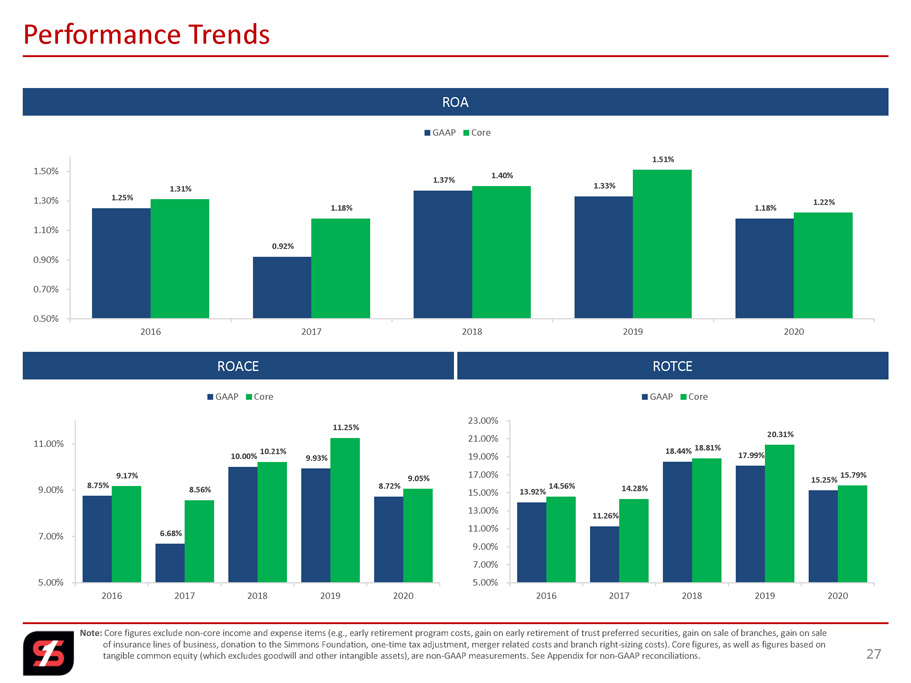
Note: Core figures exclude non - core income and expense items (e.g., early retirement program costs, gain on early retirement of trust preferred securities, gain on sale of branches, gain on sale of insurance lines of business, donation to the Simmons Foundation, one - time tax adjustment, merger related costs and branch rig ht - sizing costs). Core figures, as well as figures based on tangible common equity (which excludes goodwill and other intangible assets), are non - GAAP measurements. See Appendix for non - GA AP reconciliations. 27 Performance Trends ROA ROTCE ROACE 8.75% 6.68% 10.00% 9.93% 8.72% 9.17% 8.56% 10.21% 11.25% 9.05% 5.00% 7.00% 9.00% 11.00% 2016 2017 2018 2019 2020 GAAP Core 13.92% 11.26% 18.44% 17.99% 15.25% 14.56% 14.28% 18.81% 20.31% 15.79% 5.00% 7.00% 9.00% 11.00% 13.00% 15.00% 17.00% 19.00% 21.00% 23.00% 2016 2017 2018 2019 2020 GAAP Core 1.25% 0.92% 1.37% 1.33% 1.18% 1.31% 1.18% 1.40% 1.51% 1.22% 0.50% 0.70% 0.90% 1.10% 1.30% 1.50% 2016 2017 2018 2019 2020 GAAP Core
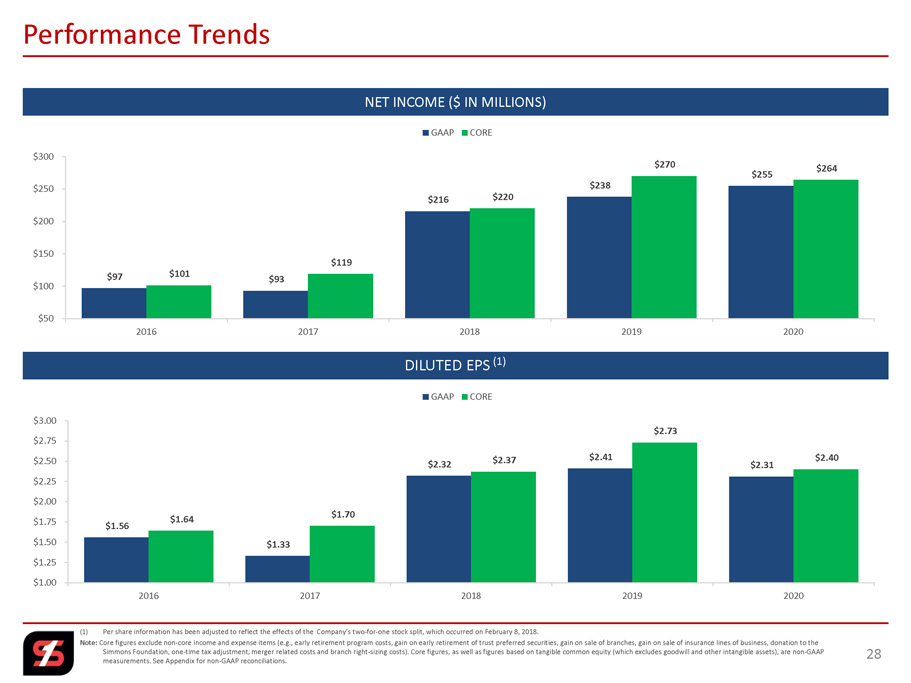
(1) Per share information has been adjusted to reflect the effects of the Company’s two - for - one stock split, which occurred on Febr uary 8, 2018. Note: Core figures exclude non - core income and expense items (e.g., early retirement program costs, gain on early retirement of trust preferred securities, gain on sale of branches, gain on sale of insurance lines of business, donation to the Simmons Foundation, one - time tax adjustment, merger related costs and branch right - sizing costs). Core figures, as well as figur es based on tangible common equity (which excludes goodwill and other intangible assets), are non - GAAP measurements. See Appendix for non - GAAP reconciliations. 28 Performance Trends DILUTED EPS (1) NET INCOME ($ IN MILLIONS) $97 $93 $216 $238 $255 $101 $119 $220 $270 $264 $50 $100 $150 $200 $250 $300 2016 2017 2018 2019 2020 GAAP CORE $1.56 $1.33 $2.32 $2.41 $2.31 $1.64 $1.70 $2.37 $2.73 $2.40 $1.00 $1.25 $1.50 $1.75 $2.00 $2.25 $2.50 $2.75 $3.00 2016 2017 2018 2019 2020 GAAP CORE

CORPORATE PROFILE AND COMPANY HIGHLIGHTS 29
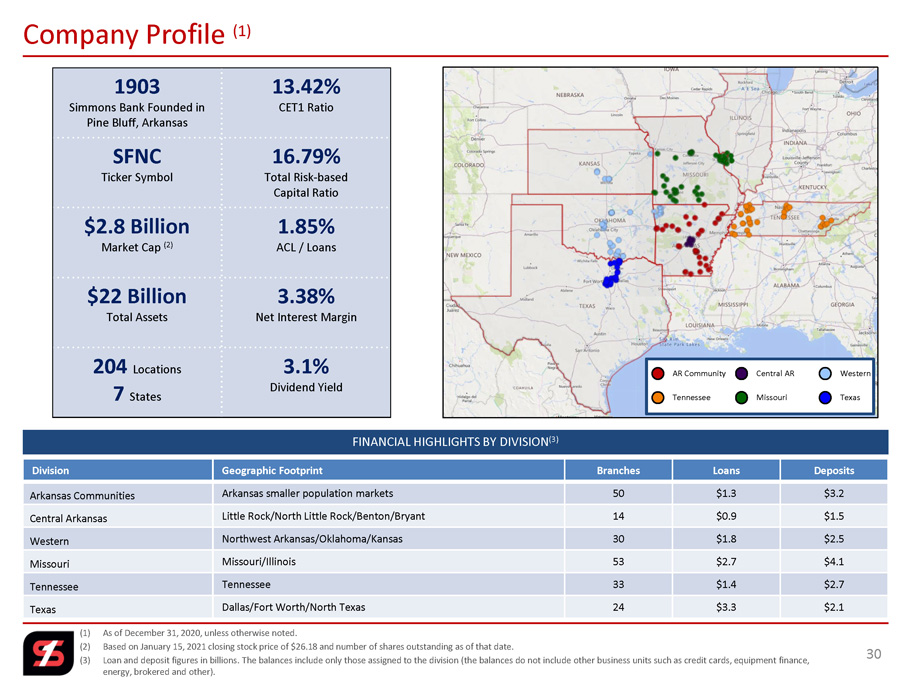
(1) As of December 31, 2020, unless otherwise noted. (2) Based on January 15, 2021 closing stock price of $26.18 and number of shares outstanding as of that date. (3) Loan and deposit figures in billions. The balances include only those assigned to the division (the balances do not include o the r business units such as credit cards, equipment finance, energy, brokered and other). Company Profile (1) FINANCIAL HIGHLIGHTS BY DIVISION (3) 30 Division Geographic Footprint Branches Loans Deposits Arkansas Communities Arkansas smaller population markets 50 $1.3 $3.2 Central Arkansas Little Rock/North Little Rock/Benton/Bryant 14 $0.9 $1.5 Western Northwest Arkansas/Oklahoma/Kansas 30 $1.8 $2.5 Missouri Missouri/Illinois 53 $2.7 $4.1 Tennessee Tennessee 33 $1.4 $2.7 Texas Dallas/Fort Worth/North Texas 24 $3.3 $2.1 AR Community Central AR Western Texas Tennessee Missouri 1903 Simmons Bank Founded in Pine Bluff, Arkansas 13.42% CET1 Ratio SFNC Ticker Symbol 16.79% Total Risk - based Capital Ratio $2.8 Billion Market Cap (2) 1.85% ACL / Loans $22 Billion Total Assets 3.38% Net Interest Margin 204 Locations 7 States 3.1% Dividend Yield
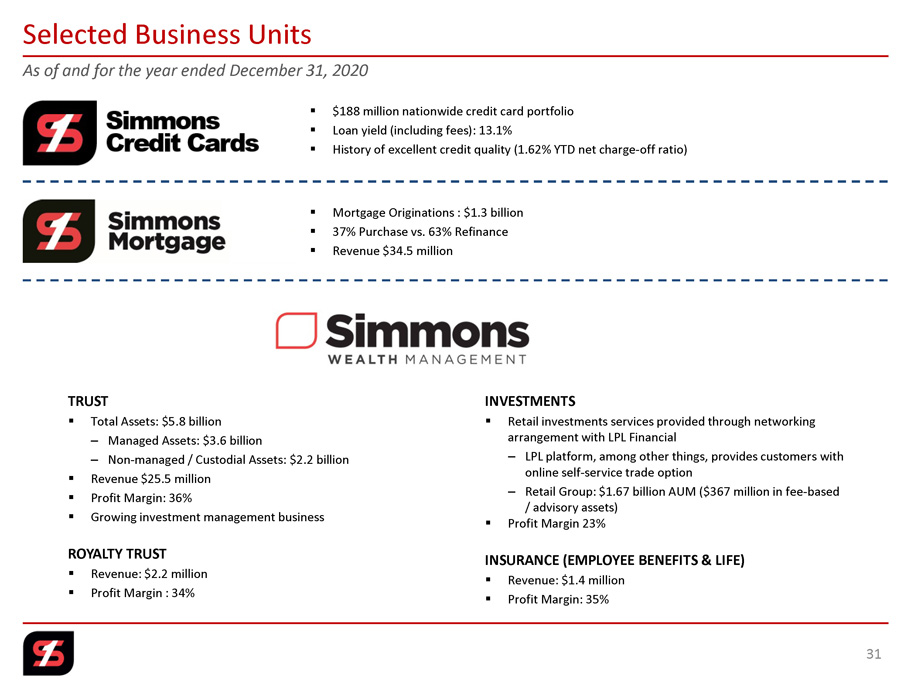
As of and for the year ended December 31, 2020 31 Selected Business Units ▪ $188 million nationwide credit card portfolio ▪ Loan yield (including fees): 13.1% ▪ History of excellent credit quality (1.62% YTD net charge - off ratio) INVESTMENTS ▪ Retail investments services provided through networking arrangement with LPL Financial – LPL platform, among other things, provides customers with online self - service trade option – Retail Group: $1.67 billion AUM ($367 million in fee - based / advisory assets) ▪ Profit Margin 23% INSURANCE (EMPLOYEE BENEFITS & LIFE) ▪ Revenue: $1.4 million ▪ Profit Margin: 35% ▪ Mortgage Originations : $1.3 billion ▪ 37% Purchase vs. 63% Refinance ▪ Revenue $34.5 million TRUST ▪ Total Assets: $5.8 billion – Managed Assets: $3.6 billion – Non - managed / Custodial Assets: $2.2 billion ▪ Revenue $25.5 million ▪ Profit Margin: 36% ▪ Growing investment management business ROYALTY TRUST ▪ Revenue: $2.2 million ▪ Profit Margin : 34%
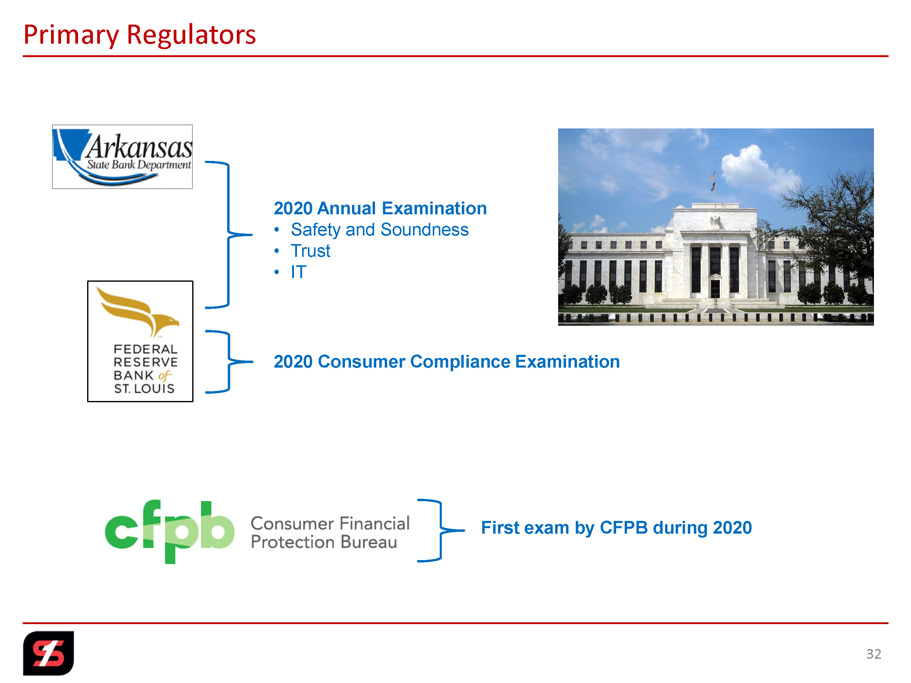
32 Primary Regulators 2020 Annual Examination • Safety and Soundness • Trust • IT 2020 Consumer Compliance Examination First exam by CFPB during 2020

33 Single Digital Platform Consolidated three legacy platforms into a single consistent digital experience for all Simmons Bank consumer customers Customer Experience Center New innovation space for testing our ideas with real users to deliver superior digital experiences for our customers Credit Cards in Digital Banking Added credit card accounts to mobile and online banking for a single view for consumer accounts Mobile Deposit Developed and deployed an enhanced mobile deposit solution allowing automated enrollment, larger deposit limits Digital Account Origination Developing customer focused platform that originates deposit accounts in approximately five minutes with automated ID Scan Digital Banking Accomplishments 2020
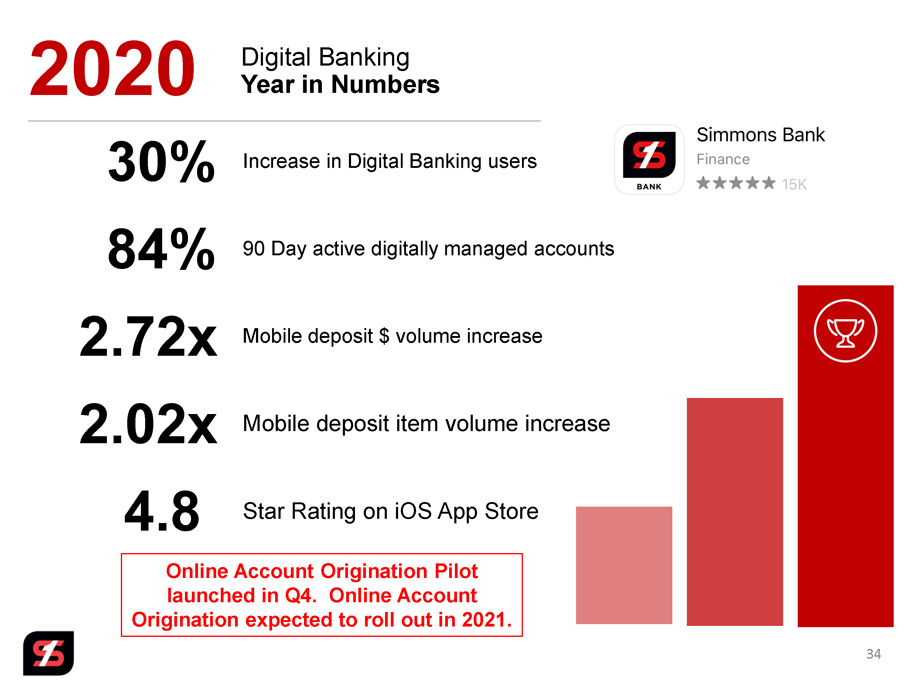
34 Digital Banking Year in Numbers 2020 30% Increase in Digital Banking users Online Account Origination Pilot launched in Q4. Online Account Origination expected to roll out in 2021. 2.72x Mobile deposit $ volume increase 4.8 Star Rating on iOS App Store 2.02x Mobile deposit item volume increase 84% 90 Day active digitally managed accounts
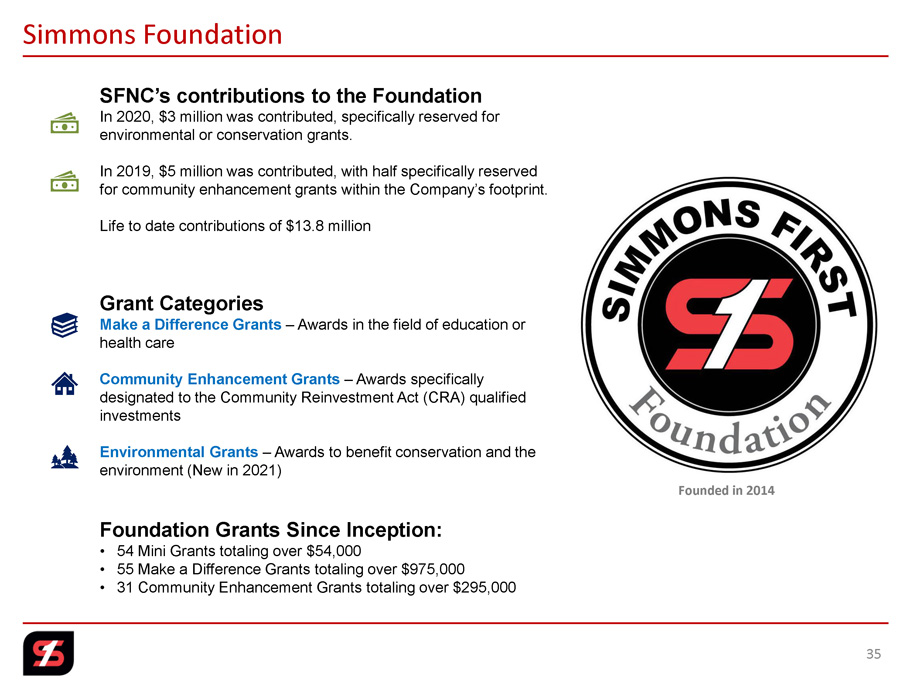
35 Simmons Foundation SFNC’s contributions to the Foundation In 2020, $3 million was contributed, specifically reserved for environmental or conservation grants. In 2019, $5 million was contributed, with half specifically reserved for community enhancement grants within the Company’s footprint. Life to date contributions of $13.8 million Grant Categories Make a Difference Grants – Awards in the field of education or health care Community Enhancement Grants – Awards specifically designated to the Community Reinvestment Act (CRA) qualified investments Environmental Grants – Awards to benefit conservation and the environment (New in 2021) Foundation Grants Since I nception : • 54 Mini Grants totaling over $54,000 • 55 Make a Difference Grants totaling over $975,000 • 31 Community Enhancement Grants totaling over $295,000 Founded in 2014
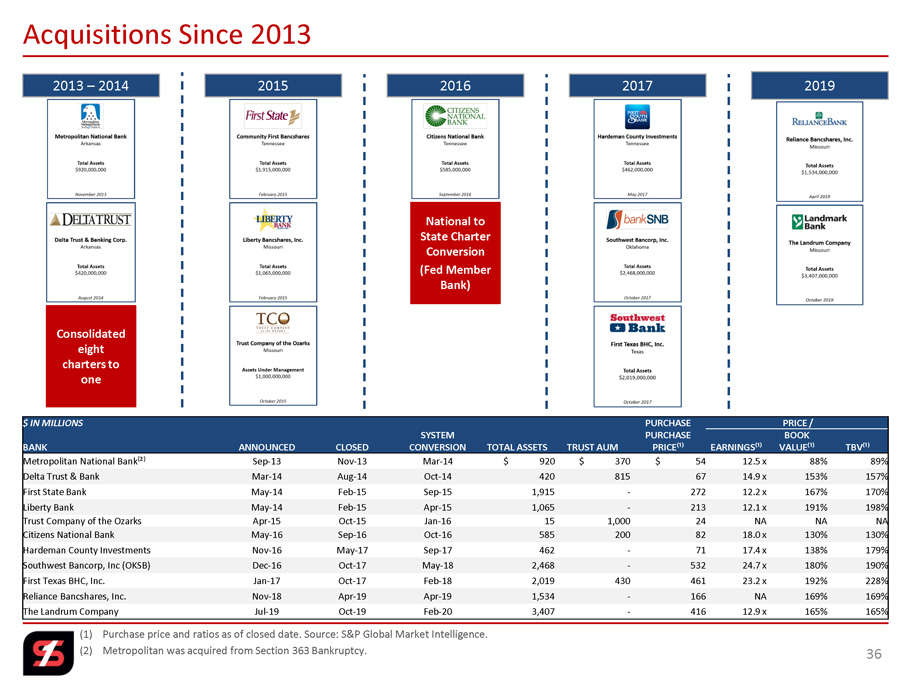
(1) Purchase price and ratios as of closed date. Source: S&P Global Market Intelligence. (2) Metropolitan was acquired from Section 363 Bankruptcy. 36 Acquisitions Since 2013 2013 – 2014 Consolidated eight charters to one National to State Charter Conversion (Fed Member Bank) 2015 2016 2017 2019 $ IN MILLIONS PURCHASE PRICE / BANK ANNOUNCED CLOSED SYSTEM CONVERSION TOTAL ASSETS TRUST AUM PURCHASE PRICE⁽¹⁾ EARNINGS⁽¹⁾ BOOK VALUE⁽¹⁾ TBV⁽¹⁾ Metropolitan National Bank⁽²⁾ Sep - 13 Nov - 13 Mar - 14 $ 920 $ 370 $ 54 12.5 x 88% 89% Delta Trust & Bank Mar - 14 Aug - 14 Oct - 14 420 815 67 14.9 x 153% 157% First State Bank May - 14 Feb - 15 Sep - 15 1,915 - 272 12.2 x 167% 170% Liberty Bank May - 14 Feb - 15 Apr - 15 1,065 - 213 12.1 x 191% 198% Trust Company of the Ozarks Apr - 15 Oct - 15 Jan - 16 15 1,000 24 NA NA NA Citizens National Bank May - 16 Sep - 16 Oct - 16 585 200 82 18.0 x 130% 130% Hardeman County Investments Nov - 16 May - 17 Sep - 17 462 - 71 17.4 x 138% 179% Southwest Bancorp, Inc (OKSB) Dec - 16 Oct - 17 May - 18 2,468 - 532 24.7 x 180% 190% First Texas BHC, Inc. Jan - 17 Oct - 17 Feb - 18 2,019 430 461 23.2 x 192% 228% Reliance Bancshares, Inc. Nov - 18 Apr - 19 Apr - 19 1,534 - 166 NA 169% 169% The Landrum Company Jul - 19 Oct - 19 Feb - 20 3,407 - 416 12.9 x 165% 165%
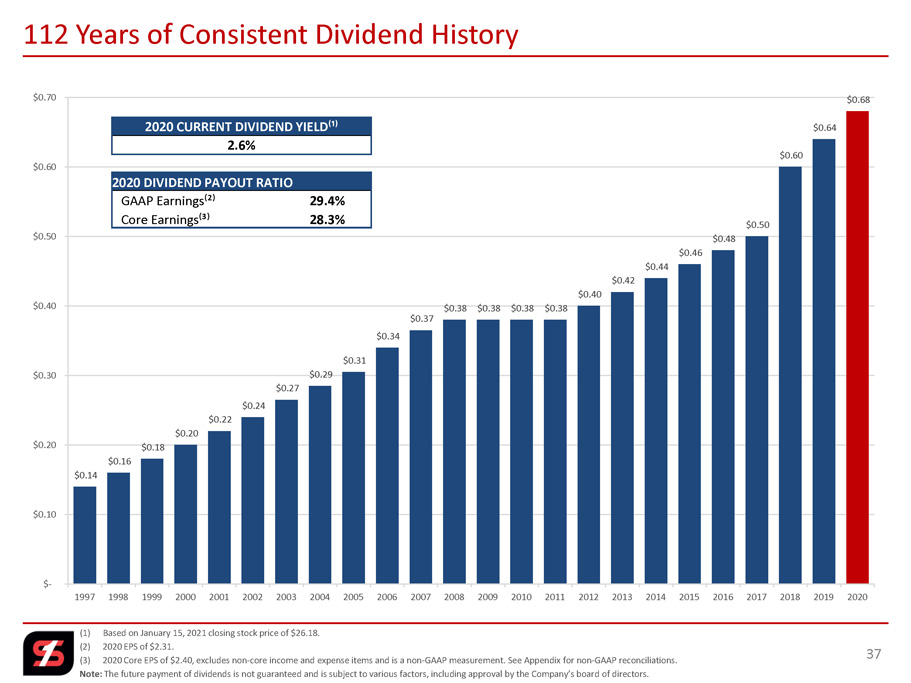
(1) Based on January 15, 2021 closing stock price of $26.18. (2) 2020 EPS of $2.31. (3) 2020 Core EPS of $2.40, excludes non - core income and expense items and is a non - GAAP measurement. See Appendix for non - GAAP reco nciliations. Note: The future payment of dividends is not guaranteed and is subject to various factors, including approval by the Company’s boar d of directors. 37 112 Years of Consistent Dividend History $0.14 $0.16 $0.18 $0.20 $0.22 $0.24 $0.27 $0.29 $0.31 $0.34 $0.37 $0.38 $0.38 $0.38 $0.38 $0.40 $0.42 $0.44 $0.46 $0.48 $0.50 $0.60 $0.64 $0.68 $- $0.10 $0.20 $0.30 $0.40 $0.50 $0.60 $0.70 1997 1998 1999 2000 2001 2002 2003 2004 2005 2006 2007 2008 2009 2010 2011 2012 2013 2014 2015 2016 2017 2018 2019 2020 2020 CURRENT DIVIDEND YIELD⁽¹⁾ 2.6% 2020 DIVIDEND PAYOUT RATIO GAAP Earnings⁽²⁾ 29.4% Core Earnings⁽³⁾ 28.3%
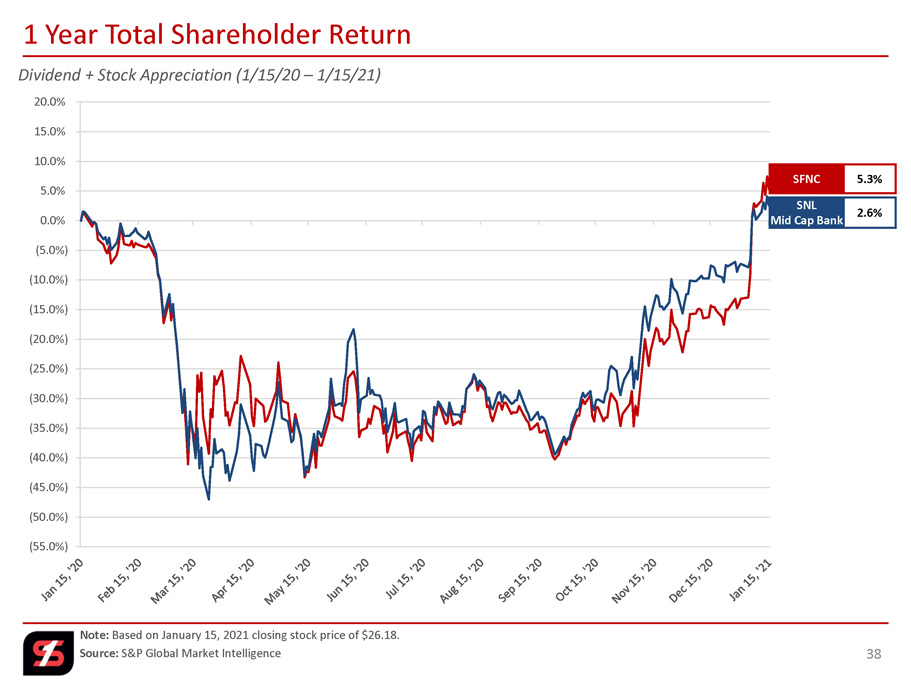
(55.0%) (50.0%) (45.0%) (40.0%) (35.0%) (30.0%) (25.0%) (20.0%) (15.0%) (10.0%) (5.0%) 0.0% 5.0% 10.0% 15.0% 20.0% Dividend + Stock Appreciation (1/15/20 – 1/15/21) Note: Based on January 15, 2021 closing stock price of $26.18. Source: S&P Global Market Intelligence 38 1 Year Total Shareholder Return SFNC 5.3% SNL Mid Cap Bank 2.6%
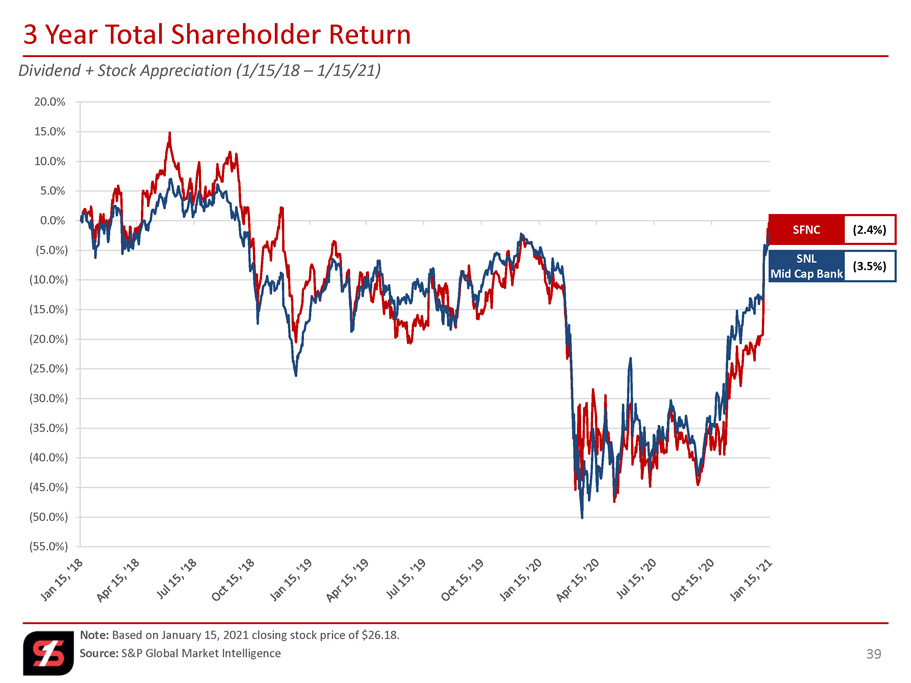
(55.0%) (50.0%) (45.0%) (40.0%) (35.0%) (30.0%) (25.0%) (20.0%) (15.0%) (10.0%) (5.0%) 0.0% 5.0% 10.0% 15.0% 20.0% Dividend + Stock Appreciation (1/15/18 – 1/15/21) Note: Based on January 15, 2021 closing stock price of $26.18. Source: S&P Global Market Intelligence 39 3 Year Total Shareholder Return SFNC (2.4%) SNL Mid Cap Bank (3.5%)

(80.0%) (60.0%) (40.0%) (20.0%) 0.0% 20.0% 40.0% 60.0% 80.0% 100.0% 120.0% 140.0% 160.0% 180.0% 200.0% 220.0% 240.0% Dividend + Stock Appreciation (12/31/07 – 1/15/21) Note: Based on January 15, 2021 closing stock price of $26.18. Source: S&P Global Market Intelligence 40 Long - term Shareholder Return SFNC 177.3% SNL Mid Cap Bank 16.7%
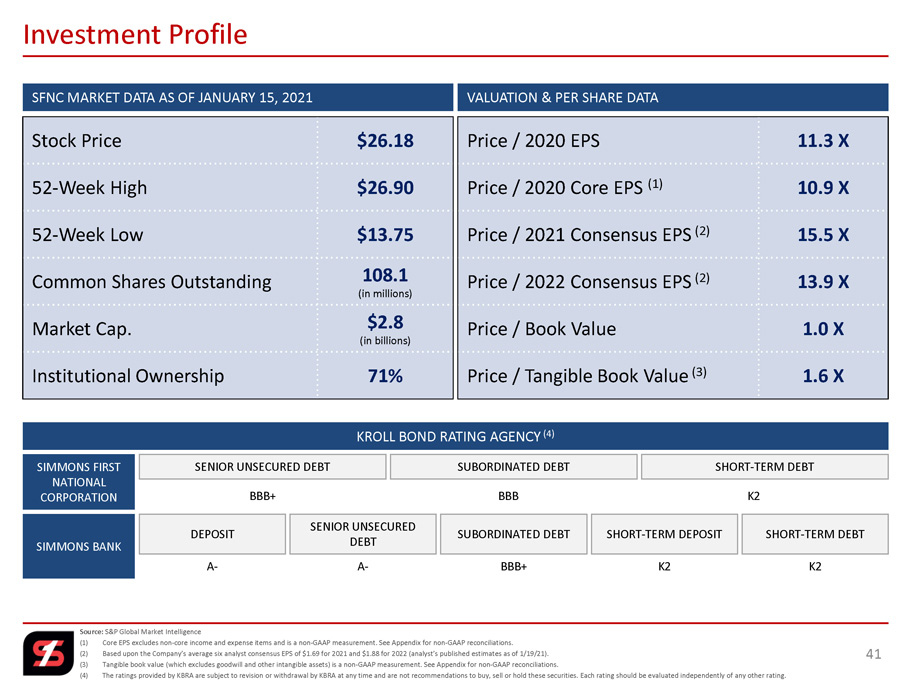
Source: S&P Global Market Intelligence (1) Core EPS excludes non - core income and expense items and is a non - GAAP measurement. See Appendix for non - GAAP reconciliations. (2) Based upon the Company’s average six analyst consensus EPS of $1.69 for 2021 and $1.88 for 2022 (analyst’s published estimate s a s of 1/19/21). (3) Tangible book value (which excludes goodwill and other intangible assets) is a non - GAAP measurement. See Appendix for non - GAAP reconciliations. (4) The ratings provided by KBRA are subject to revision or withdrawal by KBRA at any time and are not recommendations to buy, se ll or hold these securities. Each rating should be evaluated independently of any other rating. 41 Investment Profile SENIOR UNSECURED DEBT SHORT - TERM DEBT SUBORDINATED DEBT SENIOR UNSECURED DEBT SHORT - TERM DEBT SUBORDINATED DEBT SHORT - TERM DEPOSIT DEPOSIT BBB+ BBB K2 SIMMONS FIRST NATIONAL CORPORATION SIMMONS BANK A - A - BBB+ K2 K2 KROLL BOND RATING AGENCY (4) SFNC MARKET DATA AS OF JANUARY 15, 2021 VALUATION & PER SHARE DATA Stock Price $26.18 52 - Week High $26.90 52 - Week Low $13.75 Common Shares Outstanding 108.1 (in millions) Market Cap. $2.8 (in billions) Institutional Ownership 71% Price / 2020 EPS 11.3 X Price / 2020 Core EPS (1) 10.9 X Price / 2021 Consensus EPS (2) 15.5 X Price / 2022 Consensus EPS (2) 13.9 X Price / Book Value 1.0 X Price / Tangible Book Value (3) 1.6 X

APPENDIX 42

(1) Effective tax rate of 26.135% for 2018 - 2020 and 39.225% for prior periods, adjusted for non - deductible merger - related costs a nd deferred tax items on P&C insurance sale. (2) Tax adjustment to revalue deferred tax assets and liabilities to account for the future impact of lower corporate tax. 43 Non - GAAP Reconciliations Q3 Q4 $ in thousands 2016 2017 2018 2019 2020 2020 2020 Calculation of Core Earnings Net Income $ 96,790 $ 92,940 $ 215,713 $ 237,828 $ 254,852 $ 65,885 $ 52,955 Non - core items Gain on sale of banking operations - - - - (8,368) - (275) Gain from early retirement of TRUPS (594) - - - - - - Gain on sale of P&C insurance business - (3,708) - - - - - Donation to Simmons Foundation - 5,000 - - - - - Merger related costs 4,835 21,923 4,777 36,379 4,531 902 731 Early Retirement Program - - - 3,464 2,901 2,346 62 Branch right sizing 3,359 169 1,341 3,129 13,727 72 11,696 Tax Effect⁽¹⁾ (2,981) (8,746) (1,598) (11,234) (3,343) (867) (3,192) Net non - core items (before SAB 118 adjustment) 4,619 14,638 4,520 31,738 9,448 2,453 9,022 SAB 118 adjustment⁽²⁾ - 11,471 - - - - - Core earnings (non - GAAP) $ 101,409 $ 119,049 $ 220,233 $ 269,566 $ 264,300 $ 68,338 $ 61,977

(1) Effective tax rate of 26.135% for 2018 - 2020 and 39.225% for prior periods, adjusted for non - deductible merger - related costs a nd deferred tax items on P&C insurance sale. (2) Tax adjustment to revalue deferred tax assets and liabilities to account for the future impact of lower corporate tax. 44 Non - GAAP Reconciliations Q3 Q4 $ per Share 2016 2017 2018 2019 2020 2020 2020 Calculation of Diluted Earnings per Share (EPS) Diluted earnings per share $ 1.56 $ 1.33 $ 2.32 $ 2.41 $ 2.31 $ 0.60 $ 0.49 Non - core items Gain on sale of banking operations - - - - (0.07) - - Gain from early retirement of TRUPS (0.01) - - - - - - Gain on sale of P&C insurance business - (0.04) - - - - - Donation to Simmons Foundation - 0.07 - - - - Merger related costs 0.08 0.31 0.05 0.37 0.04 0.01 - Early Retirement Program - - - 0.03 0.03 0.02 - Branch right sizing 0.06 - 0.02 0.03 0.12 - 0.11 Tax effect⁽¹⁾ (0.05) (0.13) (0.02) (0.11) (0.03) - (0.03) Net non - core items (before SAB 118 adjustment) 0.08 0.21 0.05 0.32 0.09 0.03 0.08 SAB 118 adjustment⁽²⁾ - 0.16 - - - - - Diluted core earnings per share (non - GAAP) $ 1.64 $ 1.70 $ 2.37 $ 2.73 $ 2.40 $ 0.63 $ 0.57
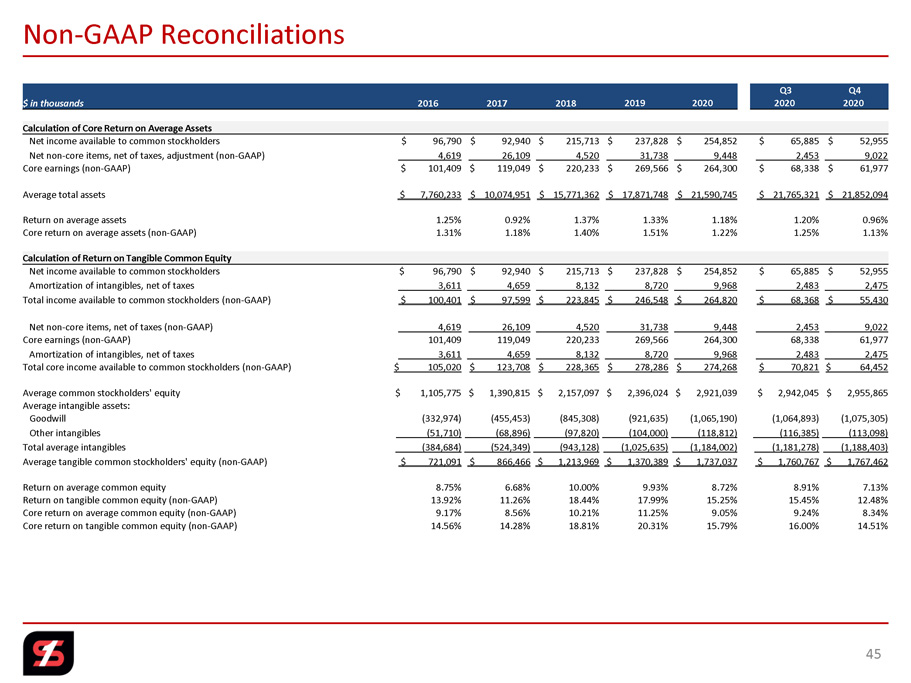
45 Non - GAAP Reconciliations Q3 Q4 $ in thousands 2016 2017 2018 2019 2020 2020 2020 Calculation of Core Return on Average Assets Net income available to common stockholders $ 96,790 $ 92,940 $ 215,713 $ 237,828 $ 254,852 $ 65,885 $ 52,955 Net non - core items, net of taxes, adjustment (non - GAAP) 4,619 26,109 4,520 31,738 9,448 2,453 9,022 Core earnings (non - GAAP) $ 101,409 $ 119,049 $ 220,233 $ 269,566 $ 264,300 $ 68,338 $ 61,977 Average total assets $ 7,760,233 $ 10,074,951 $ 15,771,362 $ 17,871,748 $ 21,590,745 $ 21,765,321 $ 21,852,094 Return on average assets 1.25% 0.92% 1.37% 1.33% 1.18% 1.20% 0.96% Core return on average assets (non - GAAP) 1.31% 1.18% 1.40% 1.51% 1.22% 1.25% 1.13% Calculation of Return on Tangible Common Equity Net income available to common stockholders $ 96,790 $ 92,940 $ 215,713 $ 237,828 $ 254,852 $ 65,885 $ 52,955 Amortization of intangibles, net of taxes 3,611 4,659 8,132 8,720 9,968 2,483 2,475 Total income available to common stockholders (non - GAAP) $ 100,401 $ 97,599 $ 223,845 $ 246,548 $ 264,820 $ 68,368 $ 55,430 Net non - core items, net of taxes (non - GAAP) 4,619 26,109 4,520 31,738 9,448 2,453 9,022 Core earnings (non - GAAP) 101,409 119,049 220,233 269,566 264,300 68,338 61,977 Amortization of intangibles, net of taxes 3,611 4,659 8,132 8,720 9,968 2,483 2,475 Total core income available to common stockholders (non - GAAP) $ 105,020 $ 123,708 $ 228,365 $ 278,286 $ 274,268 $ 70,821 $ 64,452 Average common stockholders' equity $ 1,105,775 $ 1,390,815 $ 2,157,097 $ 2,396,024 $ 2,921,039 $ 2,942,045 $ 2,955,865 Average intangible assets: Goodwill (332,974) (455,453) (845,308) (921,635) (1,065,190) (1,064,893) (1,075,305) Other intangibles (51,710) (68,896) (97,820) (104,000) (118,812) (116,385) (113,098) Total average intangibles (384,684) (524,349) (943,128) (1,025,635) (1,184,002) (1,181,278) (1,188,403) Average tangible common stockholders' equity (non - GAAP) $ 721,091 $ 866,466 $ 1,213,969 $ 1,370,389 $ 1,737,037 $ 1,760,767 $ 1,767,462 Return on average common equity 8.75% 6.68% 10.00% 9.93% 8.72% 8.91% 7.13% Return on tangible common equity (non - GAAP) 13.92% 11.26% 18.44% 17.99% 15.25% 15.45% 12.48% Core return on average common equity (non - GAAP) 9.17% 8.56% 10.21% 11.25% 9.05% 9.24% 8.34% Core return on tangible common equity (non - GAAP) 14.56% 14.28% 18.81% 20.31% 15.79% 16.00% 14.51%
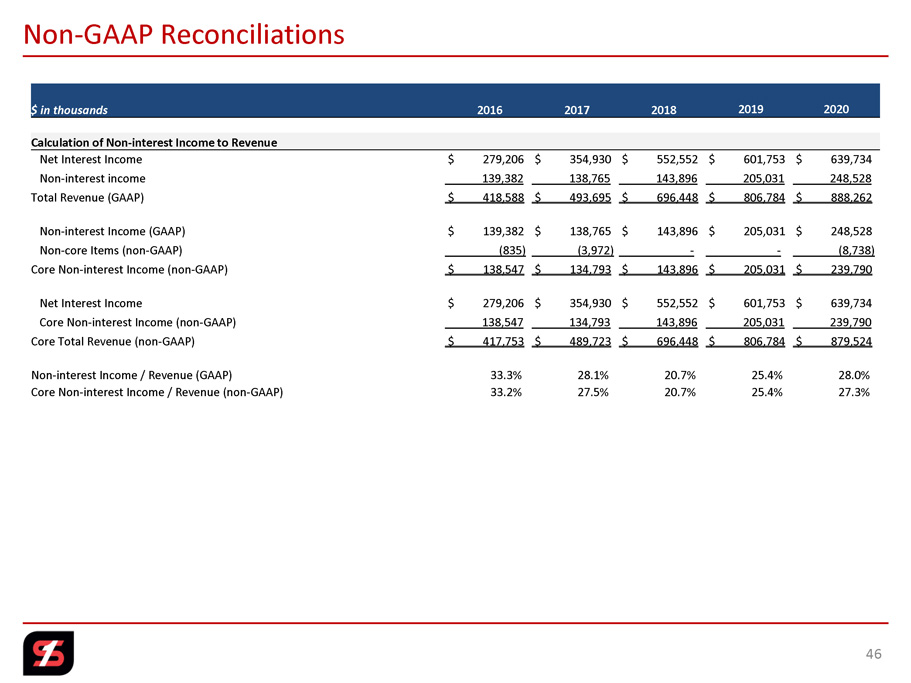
46 Non - GAAP Reconciliations $ in thousands 2016 2017 2018 2019 2020 Calculation of Non - interest Income to Revenue Net Interest Income $ 279,206 $ 354,930 $ 552,552 $ 601,753 $ 639,734 Non - interest income 139,382 138,765 143,896 205,031 248,528 Total Revenue (GAAP) $ 418,588 $ 493,695 $ 696,448 $ 806,784 $ 888,262 Non - interest Income (GAAP) $ 139,382 $ 138,765 $ 143,896 $ 205,031 $ 248,528 Non - core Items (non - GAAP) (835) (3,972) - - (8,738) Core Non - interest Income (non - GAAP) $ 138,547 $ 134,793 $ 143,896 $ 205,031 $ 239,790 Net Interest Income $ 279,206 $ 354,930 $ 552,552 $ 601,753 $ 639,734 Core Non - interest Income (non - GAAP) 138,547 134,793 143,896 205,031 239,790 Core Total Revenue (non - GAAP) $ 417,753 $ 489,723 $ 696,448 $ 806,784 $ 879,524 Non - interest Income / Revenue (GAAP) 33.3% 28.1% 20.7% 25.4% 28.0% Core Non - interest Income / Revenue (non - GAAP) 33.2% 27.5% 20.7% 25.4% 27.3%
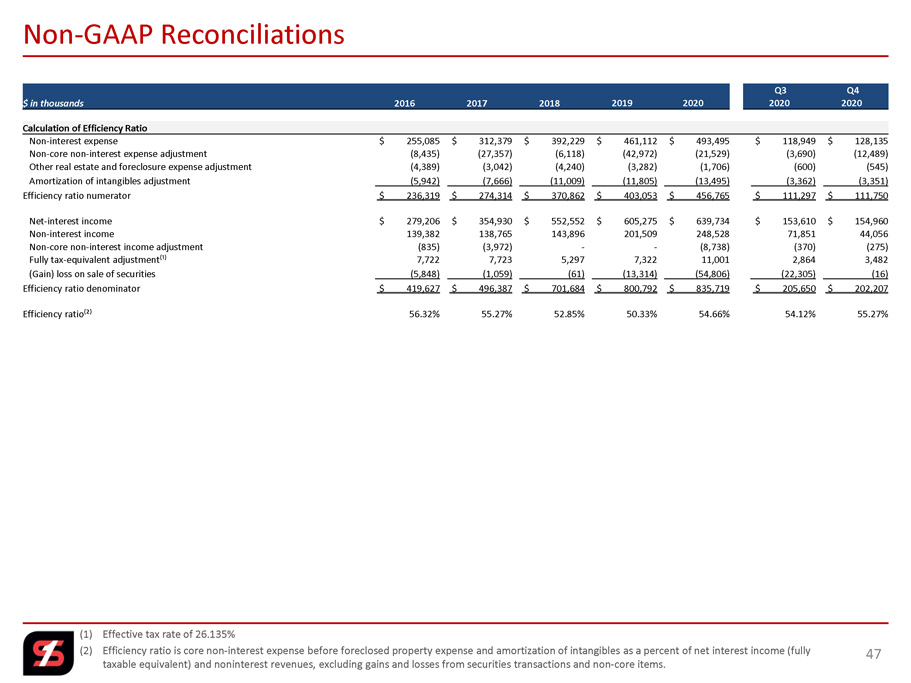
(1) Effective tax rate of 26.135% (2) Efficiency ratio is core non - interest expense before foreclosed property expense and amortization of intangibles as a percent of net interest income (fully taxable equivalent) and noninterest revenues, excluding gains and losses from securities transactions and non - core items. 47 Non - GAAP Reconciliations Q3 Q4 $ in thousands 2016 2017 2018 2019 2020 2020 2020 Calculation of Efficiency Ratio Non - interest expense $ 255,085 $ 312,379 $ 392,229 $ 461,112 $ 493,495 $ 118,949 $ 128,135 Non - core non - interest expense adjustment (8,435) (27,357) (6,118) (42,972) (21,529) (3,690) (12,489) Other real estate and foreclosure expense adjustment (4,389) (3,042) (4,240) (3,282) (1,706) (600) (545) Amortization of intangibles adjustment (5,942) (7,666) (11,009) (11,805) (13,495) (3,362) (3,351) Efficiency ratio numerator $ 236,319 $ 274,314 $ 370,862 $ 403,053 $ 456,765 $ 111,297 $ 111,750 Net - interest income $ 279,206 $ 354,930 $ 552,552 $ 605,275 $ 639,734 $ 153,610 $ 154,960 Non - interest income 139,382 138,765 143,896 201,509 248,528 71,851 44,056 Non - core non - interest income adjustment (835) (3,972) - - (8,738) (370) (275) Fully tax - equivalent adjustment⁽¹⁾ 7,722 7,723 5,297 7,322 11,001 2,864 3,482 (Gain) loss on sale of securities (5,848) (1,059) (61) (13,314) (54,806) (22,305) (16) Efficiency ratio denominator $ 419,627 $ 496,387 $ 701,684 $ 800,792 $ 835,719 $ 205,650 $ 202,207 Efficiency ratio⁽²⁾ 56.32% 55.27% 52.85% 50.33% 54.66% 54.12% 55.27%
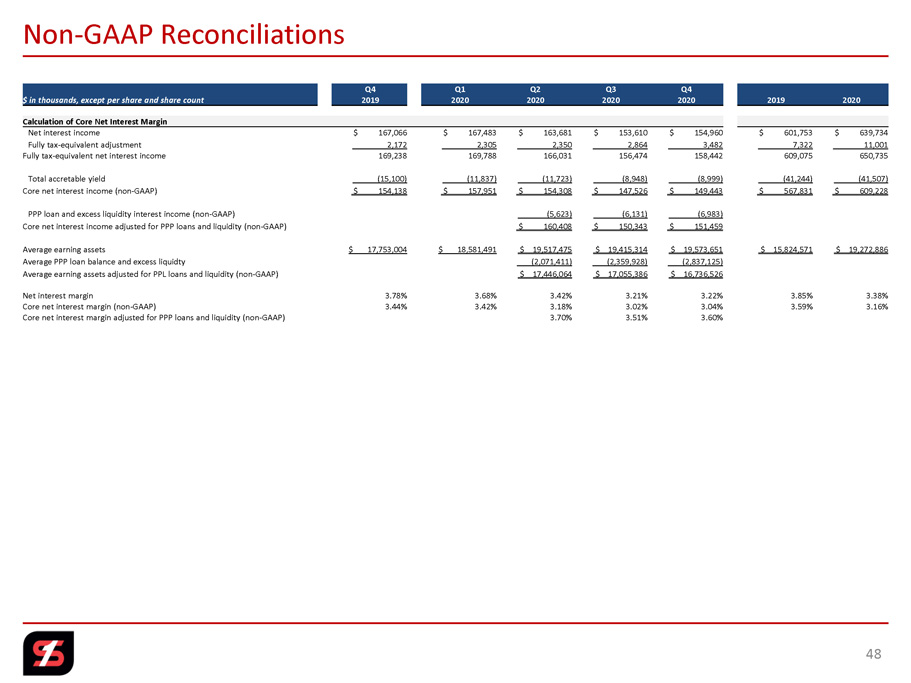
48 Non - GAAP Reconciliations Q4 Q1 Q2 Q3 Q4 $ in thousands, except per share and share count 2019 2020 2020 2020 2020 2019 2020 Calculation of Core Net Interest Margin Net interest income $ 167,066 $ 167,483 $ 163,681 $ 153,610 $ 154,960 $ 601,753 $ 639,734 Fully tax - equivalent adjustment 2,172 2,305 2,350 2,864 3,482 7,322 11,001 Fully tax - equivalent net interest income 169,238 169,788 166,031 156,474 158,442 609,075 650,735 Total accretable yield (15,100) (11,837) (11,723) (8,948) (8,999) (41,244) (41,507) Core net interest income (non - GAAP) $ 154,138 $ 157,951 $ 154,308 $ 147,526 $ 149,443 $ 567,831 $ 609,228 PPP loan and excess liquidity interest income (non - GAAP) (5,623) (6,131) (6,983) Core net interest income adjusted for PPP loans and liquidity (non - GAAP) $ 160,408 $ 150,343 $ 151,459 Average earning assets $ 17,753,004 $ 18,581,491 $ 19,517,475 $ 19,415,314 $ 19,573,651 $ 15,824,571 $ 19,272,886 Average PPP loan balance and excess liquidty (2,071,411) (2,359,928) (2,837,125) Average earning assets adjusted for PPL loans and liquidity (non - GAAP) $ 17,446,064 $ 17,055,386 $ 16,736,526 Net interest margin 3.78% 3.68% 3.42% 3.21% 3.22% 3.85% 3.38% Core net interest margin (non - GAAP) 3.44% 3.42% 3.18% 3.02% 3.04% 3.59% 3.16% Core net interest margin adjusted for PPP loans and liquidity (non - GAAP) 3.70% 3.51% 3.60%
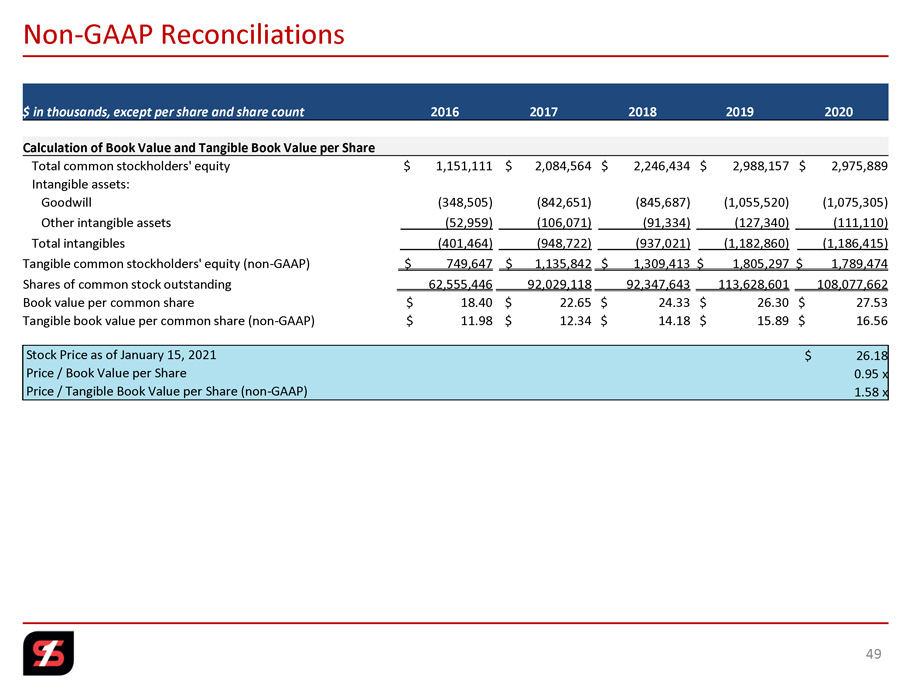
49 Non - GAAP Reconciliations $ in thousands, except per share and share count 2016 2017 2018 2019 2020 Calculation of Book Value and Tangible Book Value per Share Total common stockholders' equity $ 1,151,111 $ 2,084,564 $ 2,246,434 $ 2,988,157 $ 2,975,889 Intangible assets: Goodwill (348,505) (842,651) (845,687) (1,055,520) (1,075,305) Other intangible assets (52,959) (106,071) (91,334) (127,340) (111,110) Total intangibles (401,464) (948,722) (937,021) (1,182,860) (1,186,415) Tangible common stockholders' equity (non - GAAP) $ 749,647 $ 1,135,842 $ 1,309,413 $ 1,805,297 $ 1,789,474 Shares of common stock outstanding 62,555,446 92,029,118 92,347,643 113,628,601 108,077,662 Book value per common share $ 18.40 $ 22.65 $ 24.33 $ 26.30 $ 27.53 Tangible book value per common share (non - GAAP) $ 11.98 $ 12.34 $ 14.18 $ 15.89 $ 16.56 Stock Price as of January 15, 2021 $ 26.18 Price / Book Value per Share 0.95 x Price / Tangible Book Value per Share (non - GAAP) 1.58 x

50 Non - GAAP Reconciliations Q4 Q1 Q2 Q3 Q4 $ in thousands 2019 2020 2020 2020 2020 Calculation of Core Loan Yield Loan interest income (FTE) $ 193,402 $ 187,566 $ 177,168 $ 163,379 $ 160,306 Total accretable yield (15,100) (11,837) (11,723) (8,948) (8,999) Core loan interest income (non - GAAP) 178,302 175,729 165,445 154,431 151,307 PPP loan interest income (3,733) (5,782) (6,457) Core loan interest income without PPP loans (non - GAAP) $ 161,712 $ 148,649 $ 144,850 Average loan balance $ 14,144,703 $ 14,548,853 $ 14,731,306 $ 14,315,014 $ 13,457,077 Average PPP loan balance (non - GAAP) (645,172) (967,152) (937,544) Core loan interest income without PPP loans (non - GAAP) $ 14,086,134 $ 13,347,862 $ 12,519,533 Core loan yield (non - GAAP) 5.00% 4.86% 4.52% 4.29% 4.47% Core loan yield without PPP loans (non - GAAP) 4.62% 4.43% 4.60% Calculation of Loan Yield Adjusted for PPP Loans Loan interest income (FTE) $ 160,306 PPP loan interest income (6,457) Loan interest income without PPP loans $ 153,849 Average loan balance $ 13,457,077 Average PPP loan balance (937,544) Average loan balance without PPP loans $ 12,519,533 Loan yield 4.74% Loan yield without PPP loans 4.89% Calculation of Loans to Deposits without PPP Loans Loans $ 12,900,897 PPP loans (904,673) Loans less PPP Loans $ 11,996,224 Deposits $ 16,987,026 Loans to Deposits 75.95% Loans without PPP Loans to Deposits 70.62%

Non - GAAP Reconciliations 51 Q4 $ in thousands 2020 Calculation of Tangible Common Equity to Tangible Assets Total stockholders' equity $ 2,976,656 Preferred stock (767) Total common stockholders' equity 2,975,889 Intangible assets: Goodwill (1,075,305) Other intangible assets ( 111,110) Total intangibles (1,186,415) Tangible common stockholders' equity (non - GAAP) $ 1,789,474 Total assets 22,359,752 Intangible assets: Goodwill (1,075,305) Other intangible assets ( 111,110) Total intangibles ( 1,186,415) Tangible assets (non - GAAP) $ 21,173,337 Paycheck protection program ("PPP") loans (904,673) Total assets less PPP loans (non - GAAP) $ 21,455,079 Tangible assets less PPP loans (non - GAAP) $ 20,268,664 Ratio of equity to assets 13.31% Ratio of equity to assets less PPP loans (non - GAAP) 13.87% Ratio of tangible common equity to tangible assets (non - GAAP) 8.45% Ratio of tangible common equity to tangible assets less PPP loans (non - GAAP) 8.83%
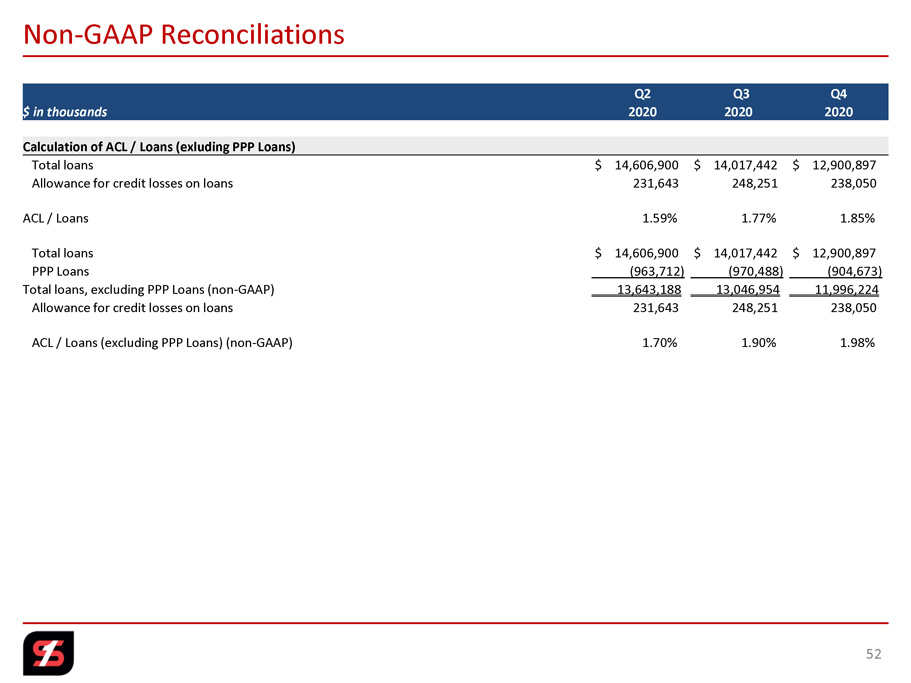
Non - GAAP Reconciliations 52 Q2 Q3 Q4 $ in thousands 2020 2020 2020 Calculation of ACL / Loans (exluding PPP Loans) Total loans $ 14,606,900 $ 14,017,442 $ 12,900,897 Allowance for credit losses on loans 231,643 248,251 238,050 ACL / Loans 1.59% 1.77% 1.85% Total loans $ 14,606,900 $ 14,017,442 $ 12,900,897 PPP Loans (963,712) (970,488) (904,673) Total loans, excluding PPP Loans (non - GAAP) 13,643,188 13,046,954 11,996,224 Allowance for credit losses on loans 231,643 248,251 238,050 ACL / Loans (excluding PPP Loans) (non - GAAP) 1.70% 1.90% 1.98%
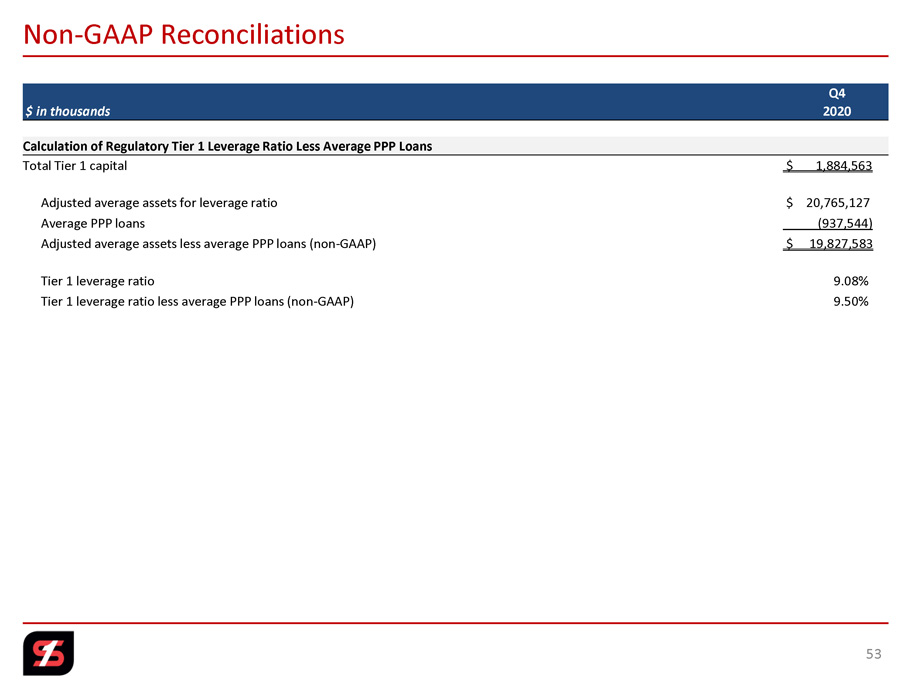
Non - GAAP Reconciliations 53 Q4 $ in thousands 2020 Calculation of Regulatory Tier 1 Leverage Ratio Less Average PPP Loans Total Tier 1 capital $ 1,884,563 Adjusted average assets for leverage ratio $ 20,765,127 Average PPP loans (937,544) Adjusted average assets less average PPP loans (non - GAAP) $ 19,827,583 Tier 1 leverage ratio 9.08% Tier 1 leverage ratio less average PPP loans (non - GAAP) 9.50%

| NASDAQ: SFNC