Exhibit 99.2
Nasdaq: SFNC 2 nd Quarter 2022 Earnings Presentation Contents 3 Q2 Highlights 4 Q2 Results Overview 11 Loans 14 Deposits, Liquidity, Securities, Interest Rate Sensitivity & Capital 20 Credit Quality 23 Key Takeaways 25 Appendix
2 Forward - Looking Statements . Certain statements by Simmons First National Corporation (the “Company”, which where appropriate includes the Company’s wholly - owned banking subsidiary, Simmons Bank) contained in this presentation may not be based on historical facts and should be considered "forward - looking statements" within the meaning of the Private Securities Litigation Reform Act of 1995 . These forward - looking statements may be identified by reference to a future period(s) or by the use of forward - looking terminology, such as "anticipate," “continue,” "estimate," "expect," "foresee,“ “indicate,” “plan,” “potential,” “project,” “target,” "may," "might," "will," "would," "could,“ “should,” “likely” or "intend," future or conditional verb tenses, and variations or negatives of such terms or by similar expressions . These forward - looking statements include, without limitation, those relating to the Company’s future growth ; product development ; revenue ; expenses (including interest expense and non - interest expenses) ; assets ; loan demand (including loan growth and other lending activity) ; asset quality ; profitability ; earnings ; critical accounting policies ; accretion ; net interest margin ; noninterest revenue ; market conditions related to and impact of the Company's common stock repurchase program ; adequacy of the allowance for loan losses ; income tax deductions ; credit quality ; level of credit losses from lending commitments ; net interest revenue ; interest rate sensitivity (including, among other things, the potential impact of rising rates) ; loan loss experience ; liquidity ; capital resources ; economic conditions and market risk ; the expected benefits, milestones, timelines, and costs (and the anticipated realization of expected cost savings) associated with the Company’s merger and acquisition strategy and activity ; the Company’s ability to recruit and retain key employees ; the ability of the Company to manage the impacts of the COVID - 19 pandemic ; the impacts of the Company’s and its customers participation in the Paycheck Protection Program (“PPP”) ; increases in the Company’s security portfolio ; legal and regulatory limitations and compliance and competition ; anticipated loan principal reductions ; fees associated with the PPP ; plans for investments in securities ; projections and estimates associated with the Company’s acquisition of Spirit of Texas Bancshares, Inc . (“Spirit”) noted on slide 5 ; and projected dividends . Readers are cautioned not to place undue reliance on the forward - looking statements contained in this presentation in that actual results could differ materially from those indicated in or implied by such forward - looking statements, due to a variety of factors . These factors include, but are not limited to, changes in the Company's operating or expansion strategy ; the availability of and costs associated with obtaining adequate and timely sources of liquidity ; the ability to maintain credit quality ; the effect of steps the Company takes in response to the COVID - 19 pandemic ; the severity and duration of the pandemic, including the effectiveness of “booster” vaccination efforts and developments with respect to COVID - 19 variants ; the pace of recovery when the pandemic subsides and the heightened impact it has on many of the risks described herein ; the effects of the pandemic on, among other things, the Company’s operations, liquidity, and credit quality ; general market and economic conditions ; unemployment ; possible adverse rulings, judgments, settlements and other outcomes of pending or future litigation ; the ability of the Company to collect amounts due under loan agreements ; changes in consumer preferences and loan demand ; effectiveness of the Company's interest rate risk management strategies ; laws and regulations affecting financial institutions in general or relating to taxes ; the effect of pending or future legislation ; the ability of the Company to repurchase its common stock on favorable terms ; the ability of the Company to successfully manage and implement its acquisition strategy and integrate acquired institutions ; difficulties and delays in integrating an acquired business or fully realizing cost savings and other benefits of mergers and acquisitions (including Spirit) ; changes in interest rates, deposit flows, real estate values, and capital markets ; inflation ; customer acceptance of the Company's products and services ; changes or disruptions in technology and IT systems (including cyber threats, attacks and events) ; changes in accounting principles relating to loan loss recognition (current expected credit losses, or CECL) ; the benefits associated with the Company’s early retirement program ; political crises, war, and other military conflicts (including the ongoing military conflict between Russia and Ukraine) or other major events, or the prospect of these events ; increased competition ; and other risk factors . Other relevant risk factors may be detailed from time to time in the Company's press releases and filings with the U . S . Securities and Exchange Commission, including, without limitation, the Company’s Form 10 - K for the year ended December 31 , 2021 . Any forward - looking statement speaks only as of the date of this presentation, and the Company undertakes no obligation to update these forward - looking statements to reflect events or circumstances that occur after the date of this presentation . Annualized, pro forma, projected and estimated numbers are used for illustrative purpose only, are not forecasts and may not reflect actual results . Non - GAAP Financial Measures . This presentation contains financial information determined by methods other than in accordance with U . S . generally accepted accounting principles (“GAAP”) . The Company’s management uses these non - GAAP financial measures in their analysis of the Company’s performance . These measures adjust GAAP performance measures to, among other things, include the tax benefit associated with revenue items that are tax - exempt, as well as exclude from net income (including on a per share diluted basis), pre - tax, pre - provision earnings, net charge - offs, income available to common shareholders, non - interest income, and non - interest expense certain income and expense items attributable to merger activity (primarily including merger - related expenses), gains and/or losses on sale of branches, early retirement programs and net branch right - sizing initiatives . In addition, the Company also presents certain figures based on tangible common stockholders’ equity, tangible assets and tangible book value, which exclude goodwill and other intangible assets . The Company further presents certain figures that are exclusive of the impact of PPP loans, deposits and/or loans acquired through the Spirit acquisition, mortgage warehouse loans, and/or energy loans . The Company’s management believes that these non - GAAP financial measures are useful to investors because they, among other things, present the results of the Company’s ongoing operations without the effect of mergers or other items not central to the Company’s ongoing business, as well as normalize for tax effects and the effects of the PPP . Management, therefore, believes presentations of these non - GAAP financial measures provide useful supplemental information that is essential to a proper understanding of the operating results of the Company’s ongoing businesses, and management uses these non - GAAP financial measures to assess the performance of the Company’s ongoing businesses as related to prior financial periods . These non - GAAP disclosures should not be viewed as a substitute for operating results determined in accordance with GAAP, nor are they necessarily comparable to non - GAAP performance measures that may be presented by other companies . Where non - GAAP financial measures are used, the comparable GAAP financial measure, as well as the reconciliation to the comparable GAAP financial measure, can be found in the appendix to this presentation . Forward - Looking Statements and Non - GAAP Financial Measures
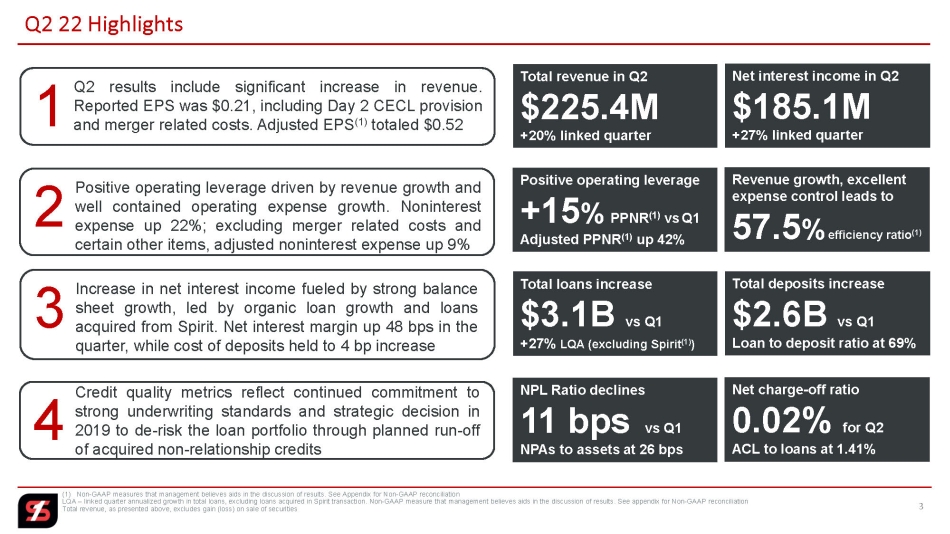
3 Q2 22 Highlights Total revenue in Q 2 $225.4M +20% linked quarter 1 Net interest income in Q 2 $185.1M +27% linked quarter 1 Q 2 results include significant increase in revenue . Reported EPS was $ 0 . 21 , including Day 2 CECL provision and merger related costs . Adjusted EPS ( 1 ) totaled $ 0 . 52 Positive operating leverage +15 % PPNR (1) vs Q1 Adjusted PPNR (1) up 42% 2 Positive operating leverage driven by revenue growth and well contained operating expense growth . Noninterest expense up 22 % ; excluding merger related costs and certain other items, adjusted noninterest expense up 9 % Revenue growth, excellent expense control leads to 57.5 % efficiency ratio (1) Total loans increase $3.1B vs Q1 +27% LQA (excluding Spirit (1) ) 3 Increase in net interest income fueled by strong balance sheet growth, led by organic loan growth and loans acquired from Spirit . Net interest margin up 48 bps in the quarter, while cost of deposits held to 4 bp increase Total deposits increase $2.6B vs Q1 Loan to deposit ratio at 69% NPL Ratio declines 11 bps vs Q1 NPAs to assets at 26 bps 4 Credit quality metrics reflect continued commitment to strong underwriting standards and strategic decision in 2019 to de - risk the loan portfolio through planned run - off of acquired non - relationship credits Net charge - off ratio 0.02% for Q2 ACL to loans at 1.41% (1) Non - GAAP measures that management believes aids in the discussion of results. See Appendix for Non - GAAP reconciliation LQA – linked quarter annualized growth in total loans, excluding loans acquired in Spirit transaction. Non - GAAP measure that man agement believes aids in the discussion of results. See appendix for Non - GAAP reconciliation Total revenue, as presented above, excludes gain (loss) on sale of securities

Q2 22 Results Overview
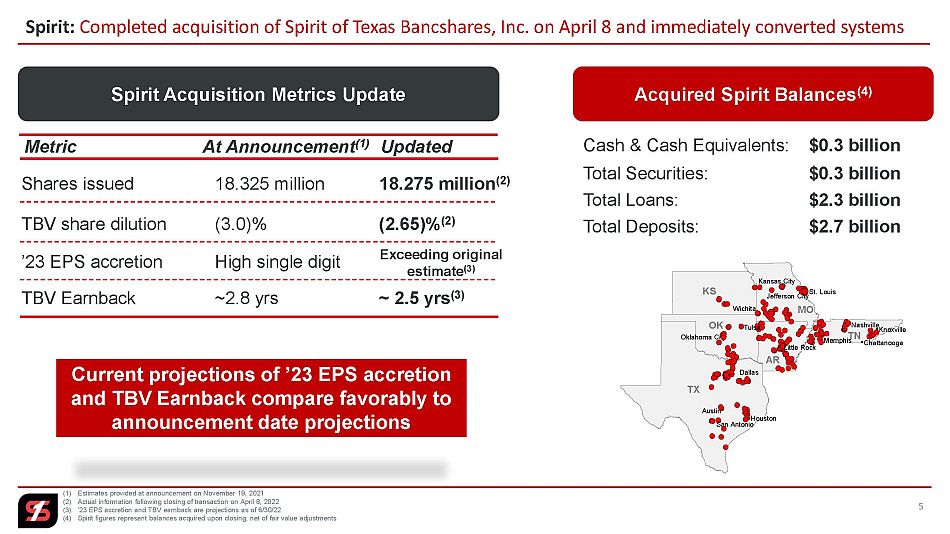
5 Spirit: Completed acquisition of Spirit of Texas Bancshares, Inc. on April 8 and immediately converted systems Acquired Spirit Balances (4) Total Securities: (1) Estimates provided at announcement on November 19, 2021 (2) Actual information following closing of transaction on April 8, 2022 (3) TBV share dilution, ’23 EPS accretion and TBV earnback are projections as of 6/30/22 (4) Spirit figures represent balances acquired upon closing, net of fair value adjustments $0.3 billion Total Loans: $2.3 billion Total Deposits: $2.7 billion Cash & Cash Equivalents: $0.3 billion Spirit Acquisition Metrics Update TBV share dilution (3.0)% ’23 EPS accretion High single digit Shares issued 18.325 million Metric At Announcement (1) Updated 18.275 million (2) (2.65)% (2) Exceeding original estimate (3) TBV Earnback ~2.8 yrs ~ 2.5 yrs (3) Oklahoma City Dallas Austin Wichita Jefferson City Kansas City St. Louis Knoxville Chattanooga OK AR TX TN MO KS Nashville Memphis Tulsa Little Rock San Antonio Houston Current projections of ’23 EPS accretion and TBV Earnback compare favorably to announcement date projections
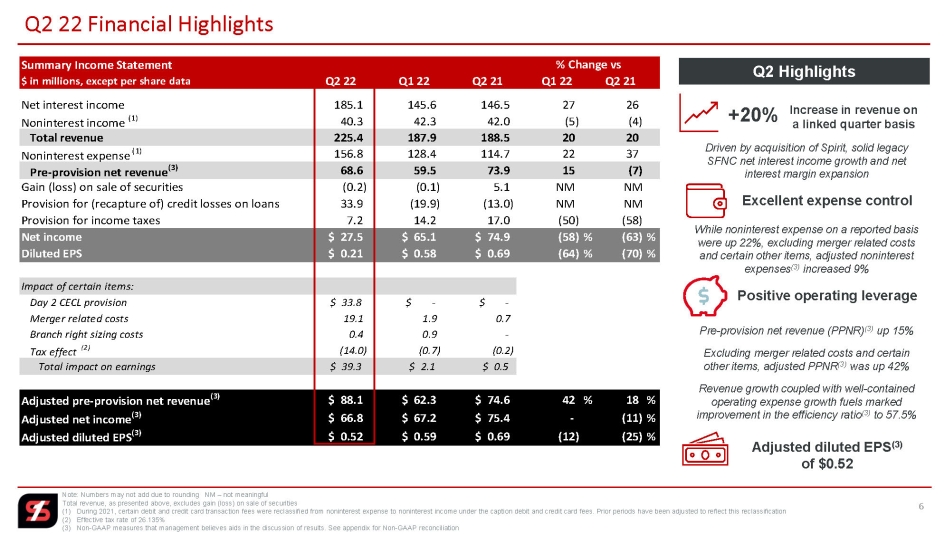
6 Q2 22 Financial Highlights Note: Numbers may not add due to rounding NM – not meaningful Total revenue, as presented above, excludes gain (loss) on sale of securities (1) During 2021, certain debit and credit card transaction fees were reclassified from noninterest expense to noninterest i nco me under the caption debit and credit card fees. Prior periods have been adjusted to reflect this reclassification (2) Effective tax rate of 26.135% (3) Non - GAAP measures that management believes aids in the discussion of results. See appendix for Non - GAAP reconciliation Summary Income Statement $ in millions, except per share data Q2 22 Q1 22 Q2 21 Q1 22 Q2 21 Net interest income 185.1 145.6 146.5 27 26 Noninterest income (1) 40.3 42.3 42.0 (5) (4) Total revenue 225.4 187.9 188.5 20 20 Noninterest expense (1) 156.8 128.4 114.7 22 37 Pre-provision net revenue (3) 68.6 59.5 73.9 15 (7) Gain (loss) on sale of securities (0.2) (0.1) 5.1 NM NM Provision for (recapture of) credit losses on loans 33.9 (19.9) (13.0) NM NM Provision for income taxes 7.2 14.2 17.0 (50) (58) Net income $ 27.5 $ 65.1 $ 74.9 (58) % (63)% Diluted EPS $ 0.21 $ 0.58 $ 0.69 (64) % (70)% Impact of certain items: Day 2 CECL provision $ 33.8 $ - $ - Merger related costs 19.1 1.9 0.7 Branch right sizing costs 0.4 0.9 - Tax effect (2) (14.0) (0.7) (0.2) Total impact on earnings $ 39.3 $ 2.1 $ 0.5 Adjusted pre-provision net revenue (3) $ 88.1 $ 62.3 $ 74.6 42 % 18 % Adjusted net income (3) $ 66.8 $ 67.2 $ 75.4 - (11)% Adjusted diluted EPS (3) $ 0.52 $ 0.59 $ 0.69 (12) (25)% % Change vs Increase in revenue on a linked quarter basis Q2 Highlights +20% Driven by acquisition of Spirit, solid legacy SFNC net interest income growth and net interest margin expansion Excellent expense control While noninterest expense on a reported basis were up 22%, excluding merger related costs and certain other items, adjusted noninterest expenses (3) increased 9% Positive operating leverage Pre - provision net revenue (PPNR) (3) up 15% Excluding merger related costs and certain other items, adjusted PPNR (3) was up 42% Revenue growth coupled with well - contained operating expense growth fuels marked improvement in the efficiency ratio (3) to 57.5% Adjusted diluted EPS (3) of $0.52

7 Net Interest Income and Margin PPP – Paycheck Protection Program FTE – Fully taxable equivalent $151.1 $150.2 $158.7 $151.2 $191.2 Q2 21 Q3 21 Q4 21 Q1 22 Q2 22 Net Interest Income $ in millions; FTE +27% Δ in Interest Income (FTE) ex PPP & Accretion Δ in Interest Expense Δ in Accretion & PPP Contribution Net Interest Income Evolution $ in millions; FTE Net Interest Margin FTE (%) 2.89 2.85 2.86 2.76 3.24 Q2 21 Q3 21 Q4 21 Q1 22 Q2 22 4.73 4.76 4.58 4.34 4.54 1.97 1.77 1.74 1.86 2.08 0.24 0.20 0.17 0.14 0.18 Q2 21 Q3 21 Q4 21 Q1 22 Q2 22 Loan Yield (FTE) Securities (FTE) Cost of Deposits Loan, Securities & Deposits Yield/Rate FTE (%) Q2 Highlights The significant increase in net interest income and net interest margin on a linked quarter basis was primarily due to: • Strong balance sheet growth led by a +26% increase in loans • +48 bps increase in net interest margin, led by increased volume, +20 bps increase in loan yield and +22 bps increase securities yield • Period end loan balance of $15.1 billion vs average balance for the quarter of $14.5 billion provides a platform for interest income growth going forward Offset in part by: • $3.6 million increase in interest expense • +4 bps increase in cost of deposits Q1 22 Q2 22 +26% +48 bps +20 bps +4 bps
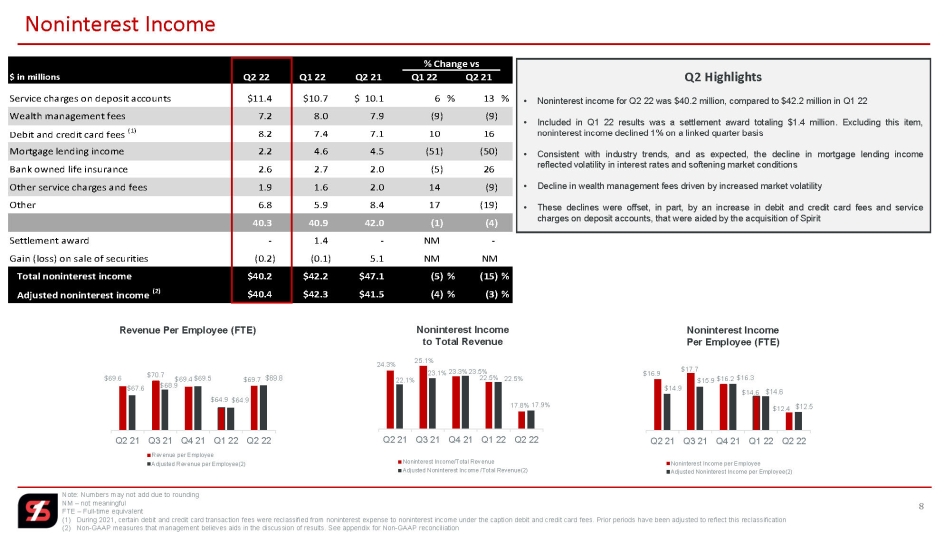
24.3% 25.1% 23.3% 22.5% 17.8% 22.1% 23.1% 23.5% 22.5% 17.9% Q2 21 Q3 21 Q4 21 Q1 22 Q2 22 Noninterest Income/Total Revenue Adjusted Noninterest Income /Total Revenue(2) Noninterest Income to Total Revenue $16.9 $17.7 $16.2 $14.6 $12.4 $14.9 $15.9 $16.3 $14.6 $12.5 Q2 21 Q3 21 Q4 21 Q1 22 Q2 22 Noninterest Income per Employee Adjusted Noninterest Income per Employee(2) Noninterest Income Per Employee (FTE) $69.6 $70.7 $69.4 $64.9 $69.7 $67.6 $68.9 $69.5 $64.9 $69.8 Q2 21 Q3 21 Q4 21 Q1 22 Q2 22 Revenue per Employee Adjusted Revenue per Employee(2) Revenue Per Employee (FTE) 8 Noninterest Income Note: Numbers may not add due to rounding NM – not meaningful FTE – Full - time equivalent (1) During 2021, certain debit and credit card transaction fees were reclassified from noninterest expense to noninterest i nco me under the caption debit and credit card fees. Prior periods have been adjusted to reflect this reclassification (2) Non - GAAP measures that management believes aids in the discussion of results. See appendix for Non - GAAP reconciliation $ in millions Q2 22 Q1 22 Q2 21 Q1 22 Q2 21 Service charges on deposit accounts $11.4 $10.7 $ 10.1 6 % 13 % Wealth management fees 7.2 8.0 7.9 (9) (9) Debit and credit card fees (1) 8.2 7.4 7.1 10 16 Mortgage lending income 2.2 4.6 4.5 (51) (50) Bank owned life insurance 2.6 2.7 2.0 (5) 26 Other service charges and fees 1.9 1.6 2.0 14 (9) Other 6.8 5.9 8.4 17 (19) 40.3 40.9 42.0 (1) (4) Settlement award - 1.4 - NM - Gain (loss) on sale of securities (0.2) (0.1) 5.1 NM NM Total noninterest income $40.2 $42.2 $47.1 (5) % (15)% Adjusted noninterest income (2) $40.4 $42.3 $41.5 (4) % (3)% % Change vs Q2 Highlights • Noninterest income for Q 2 22 was $ 40 . 2 million, compared to $ 42 . 2 million in Q 1 22 • Included in Q 1 22 results was a settlement award totaling $ 1 . 4 million . Excluding this item, noninterest income declined 1 % on a linked quarter basis • Consistent with industry trends, and as expected, the decline in mortgage lending income reflected volatility in interest rates and softening market conditions • Decline in wealth management fees driven by increased market volatility • These declines were offset, in part, by an increase in debit and credit card fees and service charges on deposit accounts, that were aided by the acquisition of Spirit
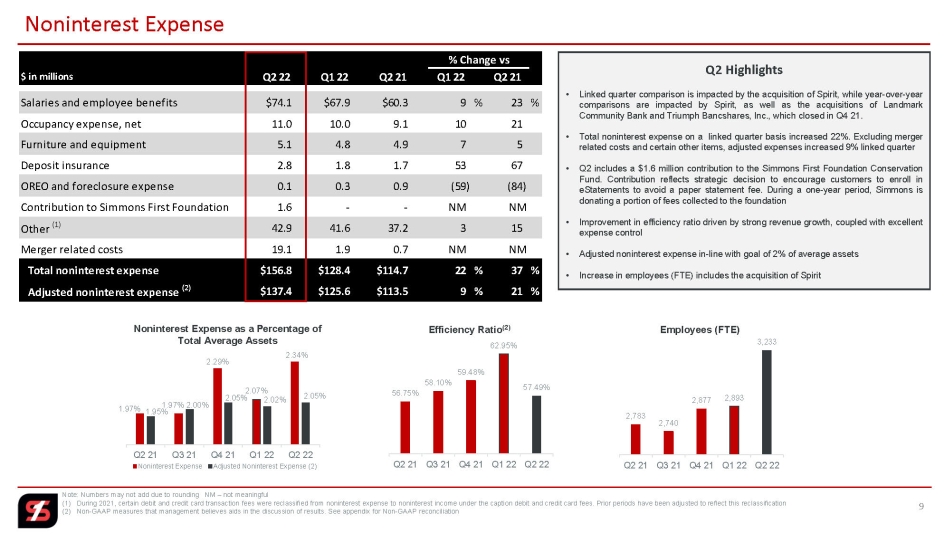
2,783 2,740 2,877 2,893 3,233 Q2 21 Q3 21 Q4 21 Q1 22 Q2 22 Employees (FTE) 56.75% 58.10% 59.48% 62.95% 57.49% Q2 21 Q3 21 Q4 21 Q1 22 Q2 22 Efficiency Ratio (2) 1.97% 1.97% 2.29% 2.07% 2.34% 1.95% 2.00% 2.05% 2.02% 2.05% Q2 21 Q3 21 Q4 21 Q1 22 Q2 22 Noninterest Expense Adjusted Noninterest Expense (2) Noninterest Expense as a Percentage of Total Average Assets $ in millions Q2 22 Q1 22 Q2 21 Q1 22 Q2 21 Salaries and employee benefits $74.1 $67.9 $60.3 9 % 23 % Occupancy expense, net 11.0 10.0 9.1 10 21 Furniture and equipment 5.1 4.8 4.9 7 5 Deposit insurance 2.8 1.8 1.7 53 67 OREO and foreclosure expense 0.1 0.3 0.9 (59) (84) Contribution to Simmons First Foundation 1.6 - - NM NM Other (1) 42.9 41.6 37.2 3 15 Merger related costs 19.1 1.9 0.7 NM NM Total noninterest expense $156.8 $128.4 $114.7 22 % 37 % Adjusted noninterest expense (2) $137.4 $125.6 $113.5 9 % 21 % % Change vs 9 Noninterest Expense Note: Numbers may not add due to rounding NM – not meaningful (1) During 2021, certain debit and credit card transaction fees were reclassified from noninterest expense to noninterest i nco me under the caption debit and credit card fees. Prior periods have been adjusted to reflect this reclassification (2) Non - GAAP measures that management believes aids in the discussion of results. See appendix for Non - GAAP reconciliation Q2 Highlights • Linked quarter comparison is impacted by the acquisition of Spirit, while year - over - year comparisons are impacted by Spirit, as well as the acquisitions of Landmark Community Bank and Triumph Bancshares, Inc . , which closed in Q 4 21 . • Total noninterest expense on a linked quarter basis increased 22 % . Excluding merger related costs and certain other items, adjusted expenses increased 9 % linked quarter • Q 2 includes a $ 1 . 6 million contribution to the Simmons First Foundation Conservation Fund . Contribution reflects strategic decision to encourage customers to enroll in eStatements to avoid a paper statement fee . During a one - year period, Simmons is donating a portion of fees collected to the foundation • Improvement in efficiency ratio driven by strong revenue growth, coupled with excellent expense control • Adjusted noninterest expense in - line with goal of 2 % of average assets • Increase in employees (FTE) includes the acquisition of Spirit
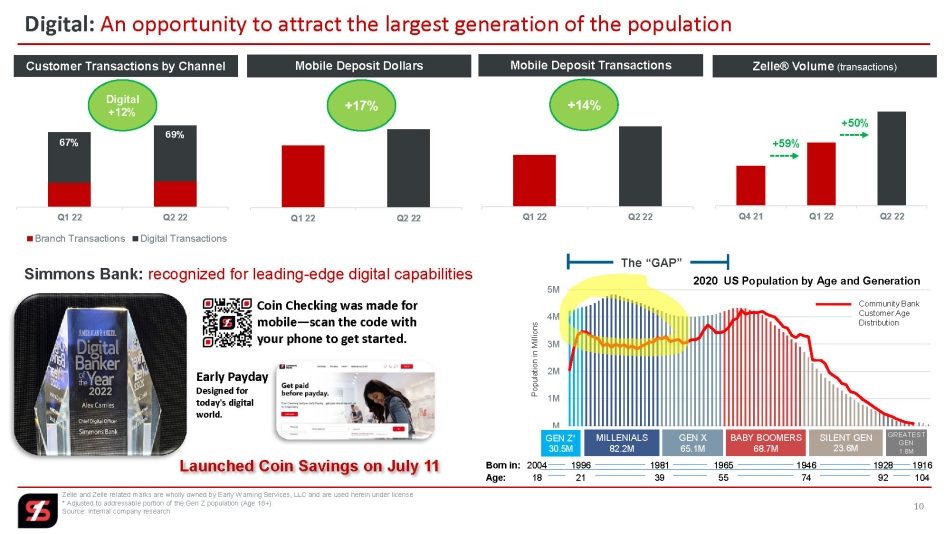
Digital: An opportunity to attract the largest generation of the population Zelle and Zelle related marks are wholly owned by Early Warning Services, LLC and are used herein under license * Adjusted to addressable portion of the Gen Z population (Age 18+) Source: Internal company research Q1 22 Q2 22 Branch Transactions Digital Transactions Customer Transactions by Channel 67% 70% 69% Q1 22 Q2 22 Mobile Deposit Transactions Q1 22 Q2 22 Mobile Deposit Dollars Q4 21 Q1 22 Q2 22 Zelle ® Volume (transactions) 66% 70% Digital +12% +17% +14% +59% +50% M 1M 2M 3M 4M 5M 2020 US Population by Age and Generation 0 1000 2000 3000 4000 5000 6000 7000 M 1M 2M 3M 4M 5M Population in Millions GEN Z* 30.5M MILLENIALS 82.2M GEN X 65.1M BABY BOOMERS 68.7M SILENT GEN 23.6M GREATEST GEN 1.8M Born in: Age: 2004 18 1996 21 1981 39 1965 55 1946 74 1928 92 1916 104 Community Bank Customer Age Distribution The “GAP” Simmons Bank: recognized for leading - edge digital capabilities Launched Coin Savings on July 11 Coin Checking was made for mobile — scan the code with your phone to get started. Early Payday Designed for today's digital world. 10

Loan Portfolio
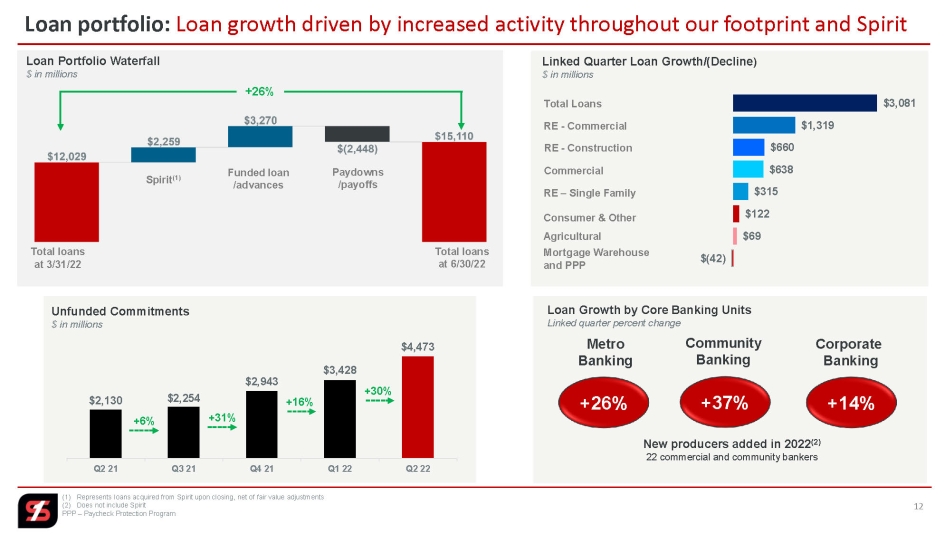
$2,130 $2,254 $2,943 $3,428 $4,473 Q2 21 Q3 21 Q4 21 Q1 22 Q2 22 Unfunded Commitments $ in millions Mortgage Warehouse and PPP Agricultural 12 Loan portfolio: Loan growth driven by increased activity throughout our footprint and Spirit (1) Represents loans acquired from Spirit upon closing, net of fair value adjustments (2) Does not include Spirit PPP – Paycheck Protection Program Total loans at 6/30/22 Total loans at 3/31/22 Spirit (1) $(42) $69 $122 $315 $638 $660 $1,319 $3,081 Linked Quarter Loan Growth/(Decline ) $ in millions Total Loans RE - Commercial RE - Construction Commercial RE – Single Family +31% +16% Loan Growth by Core Banking Units Linked quarter percent change Metro Banking Community Banking Corporate Banking +14% Loan Portfolio Waterfall $ in millions New producers added in 2022 (2) 22 commercial and community bankers Consumer & Other +37% +26% +6% +30% Funded loan /advances Paydowns /payoffs +26%
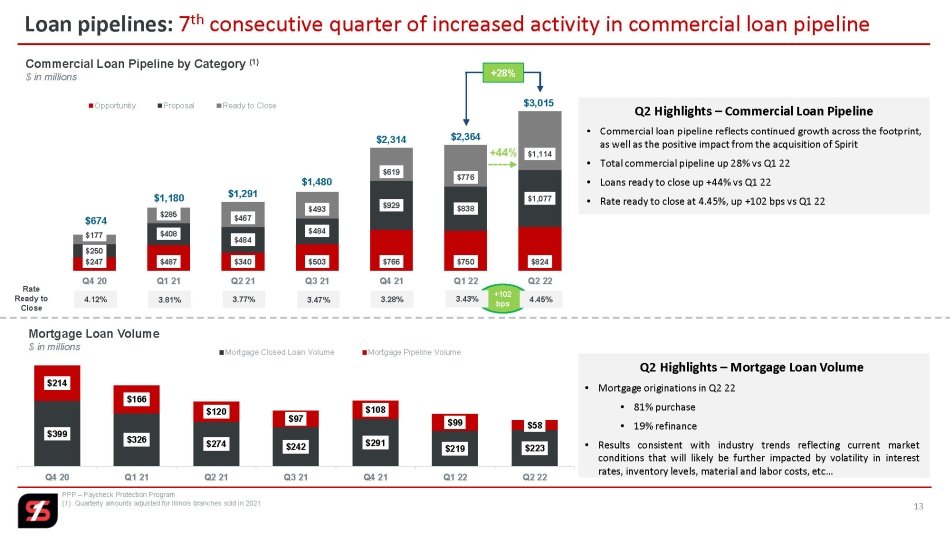
+102 bps Q2 Highlights – Commercial Loan Pipeline • Commercial loan pipeline reflects continued growth across the footprint, as well as the positive impact from the acquisition of Spirit • Total commercial pipeline up 28 % vs Q 1 22 • Loans ready to close up + 44 % vs Q 1 22 • Rate ready to close at 4 . 45 % , up + 102 bps vs Q 1 22 $247 $487 $340 $503 $766 $750 $824 $250 $408 $484 $484 $929 $838 $1,077 $177 $285 $467 $493 $619 $776 $1,114 Q4 20 Q1 21 Q2 21 Q3 21 Q4 21 Q1 22 Q2 22 Opportunity Proposal Ready to Close $1,291 $1,480 $2,314 $2,364 $3,015 13 Loan pipelines: 7 th consecutive quarter of increased activity in commercial loan pipeline PPP – Paycheck Protection Program (1) Quarterly amounts adjusted for Illinois branches sold in 2021 Rate Ready to Close 4.12% 3.81% 3.77% 3.47% 3.28% 3.43% 4.45% Commercial Loan Pipeline by Category (1) $ in millions +44% $399 $326 $274 $242 $291 $219 $223 $214 $166 $120 $97 $108 $99 $58 Q4 20 Q1 21 Q2 21 Q3 21 Q4 21 Q1 22 Q2 22 Mortgage Closed Loan Volume Mortgage Pipeline Volume Mortgage Loan Volume $ in millions $674 $1,180 Q2 Highlights – Mortgage Loan Volume • Mortgage originations in Q 2 22 • 81 % purchase • 19 % refinance • Results consistent with industry trends reflecting current market conditions that will likely be further impacted by volatility in interest rates, inventory levels, material and labor costs, etc … +28%

Deposits, Liquidity, Securities, Interest Rate Sensitivity and Capital

0.44% 0.39% 0.34% 0.30% 0.24% 0.20% 0.17% 0.14% 0.18% 0.00% 0.05% 0.10% 0.15% 0.20% 0.25% 0.30% 0.35% 0.40% 0.45% 0.50% $0.0 $2.5 $5.0 $7.5 $10.0 $12.5 $15.0 $17.5 $20.0 $22.5 Q2 20 Q3 20 Q4 20 Q1 21 Q2 21 Q3 21 Q4 21 Q1 22 Q2 22 Noninterest Bearing Interest Bearing Transactions Time Deposits Cost of Deposits $16.6 $16.2 $17.0 $18.2 $18.3 15 Deposits: 14% increase in total deposits while effectively managing rate environment Note: Numbers may not add due to rounding $ in billions As a % of Total Deposits Q2 20 Q3 20 Q4 20 Q1 21 Q2 21 Q3 21 Q4 21 Q1 22 Q2 22 Noninterest Bearing 27.7% 27.4% 26.4% 26.9% 26.7% 27.2% 27.5% 27.0% 27.5% Interest Bearing Transaction Accounts 54.0% 55.4% 56.9% 56.5% 57.7% 59.2% 59.8% 62.4% 58.2% Time Deposits 18.2% 17.2% 16.7% 16.6% 15.5% 13.6% 12.7% 10.6% 14.4% $18.1 $19.4 $19.4 Deposit Mix ~86% of deposits Q2 Highlights • Total deposits increased $2.6 billion linked quarter, or 14% • The increase in deposits was driven by the acquisition of Spirit. Excluding Spirit, total deposits were flat linked quarter • ~86% of total deposits are low - cost transaction accounts, with noninterest bearing deposits representing almost 28% of total deposits • Effectively managed challenging rising rate environment during the quarter with costs of deposits rising 4 bps $22.0

16 Liquidity: Loan to deposit ratio up to 69% while maintaining solid liquidity position Cash and Cash Equivalents + Variable Rate Securities $ in millions Q4 19 Q1 20 Q2 20 Q3 20 Q4 20 Q1 21 Q2 21 Q3 21 Q4 21 Q1 22 Q2 22 Cash & Cash Equivalents Variable Rate Securities $1,052 $1,792 $2,600 $2,577 $3,527 $4,103 $3,606 $3,286 $3,150 $3,132 $2,321 Loan to Deposit Ratio (1) 90% 76% 67% 62% 60% 62% 62% 69% 2019 2020 Q1 21 Q2 21 Q3 21 Q4 21 Q1 22 Q2 22 At June 30, 2022 Par Value Yield (FTE) (2) Effective Duration AFS HTM Fixed Rate MBS/CMO $3,035 1.97% 4.96 60% 40% Municipal 2,994 3.16 11.99 37 63 Treasury/Agency 581 2.35 9.18 17 83 Corporate 471 3.85 4.68 42 58 Other 188 3.41 4.52 51 49 Variable Rate 1,356 1.35 0.70 100 - Total $ 8 , 625 2.44% 6.65 54% 46% Securities Portfolio Summary $ in millions 55% 34% 3% 6% 3% MBS/CMO Municipal Treasury/Agency Corporate Other AFS Portfolio – Fixed Rate Breakout Q2 Highlights • Solid liquidity as cash position returns to more normalized level, aided by variable rate securities • Securities portfolio reflects addition of Spirit portfolio and reinvestment of cash flows into similar securities • Strategic decision to transfer approximately $ 2 billion of available - for - sale securities to held - to maturity during the quarter . Unrealized loss recorded as adjustment to accumulated other comprehensive income • Nominal change in effective duration - from 6 . 42 at 3 / 31 / 22 to 6 . 65 at 6 / 30 / 22 – while effective yield + 60 bps • Including $ 1 B matched swap on fixed rate securities, effective duration is 6 . 0 at 6 / 30 / 22 (1) As of December 31, for each respective year shown above and at the end of the quarter for each respective quarter shown ab ove (2) Effective yield of securities portfolio at 6/30/22, excludes AOCI impact of HTM transfer during Q2 22 FTE – fully taxable equivalent
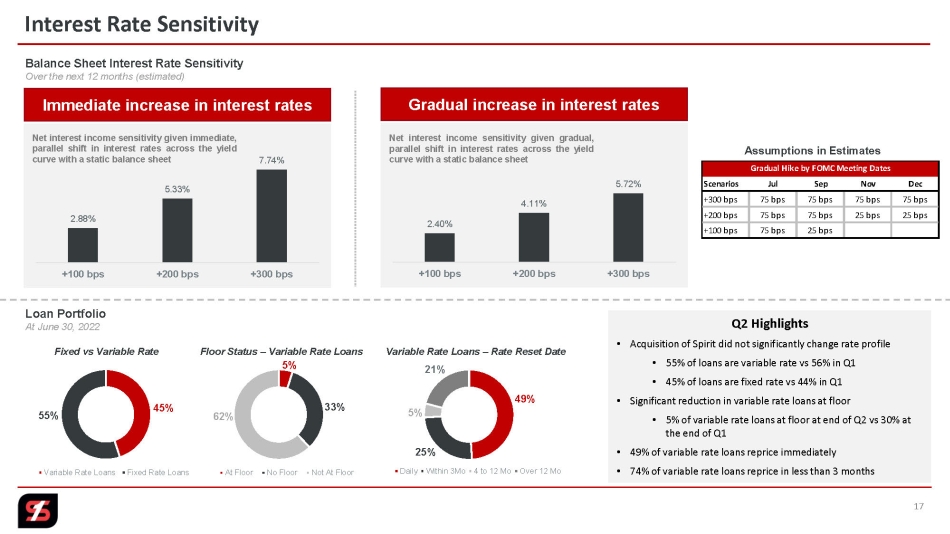
17 Interest Rate Sensitivity Balance Sheet Interest Rate Sensitivity Over the next 12 months (estimated) 2.88% 5.33% 7.74% +100 bps +200 bps +300 bps Net interest income sensitivity given immediate, parallel shift in interest rates across the yield curve with a static balance sheet Immediate increase in interest rates 2.40% 4.11% 5.72% +100 bps +200 bps +300 bps Gradual increase in interest rates Loan Portfolio At June 30, 2022 45% 55% Variable Rate Loans Fixed Rate Loans Fixed vs Variable Rate 5% 33% 62% At Floor No Floor Not At Floor Floor Status – Variable Rate Loans 49% 25% 5% 21% Daily Within 3Mo 4 to 12 Mo Over 12 Mo Variable Rate Loans – Rate Reset Date Net interest income sensitivity given gradual, parallel shift in interest rates across the yield curve with a static balance sheet Q2 Highlights • Acquisition of Spirit did not significantly change rate profile • 55% of loans are variable rate vs 56% in Q1 • 45% of loans are fixed rate vs 44% in Q1 • Significant reduction in variable rate loans at floor • 5% of variable rate loans at floor at end of Q2 vs 30% at the end of Q1 • 49% of variable rate loans reprice immediately • 74% of variable rate loans reprice in less than 3 months Assumptions in Estimates
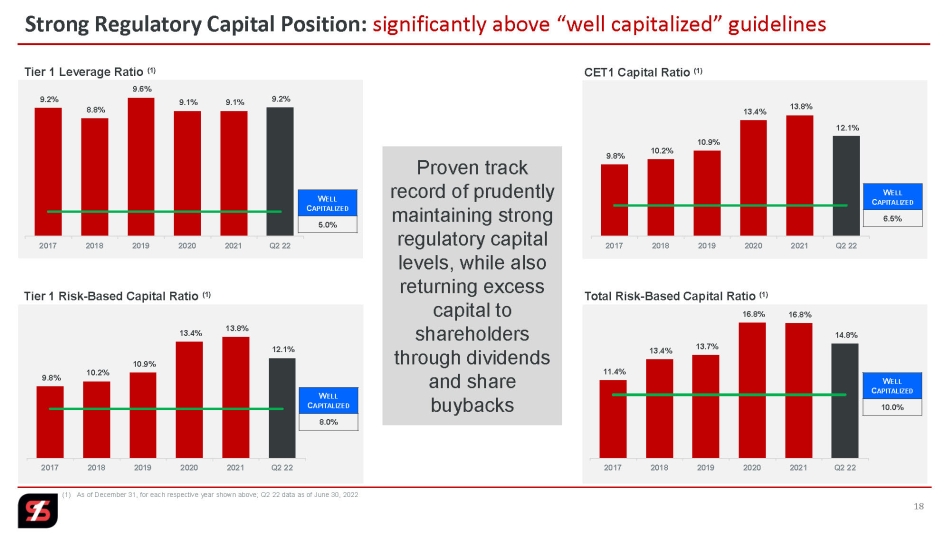
18 Strong Regulatory Capital Position: significantly above “well capitalized” guidelines (1) As of December 31, for each respective year shown above; Q2 22 data as of June 30, 2022 9.8% 10.2% 10.9% 13.4% 13.8% 12.1% 2017 2018 2019 2020 2021 Q2 22 W ELL C APITALIZED 8.0% 9.8% 10.2% 10.9% 13.4% 13.8% 12.1% 2017 2018 2019 2020 2021 Q2 22 11.4% 13.4% 13.7% 16.8% 16.8% 14.8% 2017 2018 2019 2020 2021 Q2 22 9.2% 8.8% 9.6% 9.1% 9.1% 9.2% 2017 2018 2019 2020 2021 Q2 22 W ELL C APITALIZED 5.0% Tier 1 Leverage Ratio (1) CET1 Capital Ratio (1) W ELL C APITALIZED 6.5% Tier 1 Risk - Based Capital Ratio (1) Total Risk - Based Capital Ratio (1) W ELL C APITALIZED 10.0% Proven track record of prudently maintaining strong regulatory capital levels, while also returning excess capital to shareholders through dividends and share buybacks
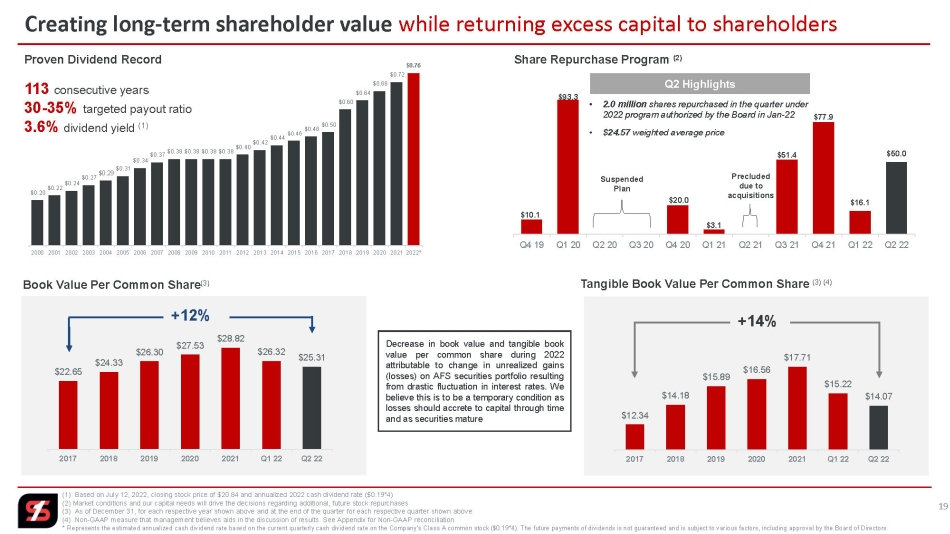
$10.1 $93.3 $0.0 $0.0 $20.0 $3.1 $0.0 $51.4 $77.9 $16.1 $50.0 Q4 19 Q1 20 Q2 20 Q3 20 Q4 20 Q1 21 Q2 21 Q3 21 Q4 21 Q1 22 Q2 22 Suspended Plan Precluded due to acquisitions Creating long - term shareholder value while returning excess capital to shareholders (1) Based on July 12, 2022, closing stock price of $20.84 and annualized 2022 cash dividend rate ($0.19*4) (2) Market conditions and our capital needs will drive the decisions regarding additional, future stock repurchases (3) As of December 31, for each respective year shown above and at the end of the quarter for each respective quarter shown abo ve (4) Non - GAAP measure that management believes aids in the discussion of results. See Appendix for Non - GAAP reconciliation * Represents the estimated annualized cash dividend rate based on the current quarterly cash dividend rate on the Company’s Cla ss A common stock ($0.19*4). The future payments of dividends is not guaranteed and is subject to various factors, including app rov al by the Board of Directors $0.20 $0.22 $0.24 $0.27 $0.29 $0.31 $0.34 $0.37 $0.38 $0.38 $0.38 $0.38 $0.40 $0.42 $0.44 $0.46 $0.48 $0.50 $0.60 $0.64 $0.68 $0.72 $0.76 2000 2001 2002 2003 2004 2005 2006 2007 2008 2009 2010 2011 2012 2013 2014 2015 2016 2017 2018 2019 2020 2021 2022* 113 consecutive years 30 - 35% targeted payout ratio 3.6% dividend yield (1) Proven Dividend Record Share Repurchase Program (2) • 2.0 million shares repurchased in the quarter under 2022 program authorized by the Board in Jan - 22 • $24.57 weighted average price Q2 Highlights $22.65 $24.33 $26.30 $27.53 $28.82 $26.32 $25.31 2017 2018 2019 2020 2021 Q1 22 Q2 22 Book Value Per Common Share (3) +12% $12.34 $14.18 $15.89 $16.56 $17.71 $15.22 $14.07 2017 2018 2019 2020 2021 Q1 22 Q2 22 Tangible Book Value Per Common Share (3) (4) +14% 19 Decrease in book value and tangible book value per common share during 2022 attributable to change in unrealized gains (losses) on AFS securities portfolio resulting from drastic fluctuation in interest rates . We believe this is to be a temporary condition as losses should accrete to capital through time and as securities mature

Credit Quality

21 Credit Quality: Key credit quality metrics show improvement and reflect… Source: S&P Global Market Intelligence 2017 – 2021 (1) As of December 31, for each respective year shown above; Q2 22 data as of June 30, 2022 (2) ALLL for 2017 – 2019 and ACL 2020 - 2022 (3) Net charge - offs to average loans (annualized) for the respective quarter Nonperforming loans / loans (1) Nonperforming assets / total assets (1) 0.81% 0.67% 0.65% 0.96% 0.57% 0.42% 2017 2018 2019 2020 2021 Q2 22 0.83% 0.64% 0.55% 0.64% 0.31% 0.26% 2017 2018 2019 2020 2021 Q2 22 Quarterly Trend 6/30/22 3/31/22 Change NPL / Loans 0.42% 0.53% (11) bps Nonperforming Loans (in millions) $63.6 $64.3 $(0.7) NPA / Assets 0.26% 0.29% (3) bps Nonperforming Assets (in millions) $70.0 $70.9 $(0.2) Past Due 30+ Days / Loans 0.11% 0.19% (8) bps Net Charge - offs / Average Loans (3) 0.02% 0.22% (20) bps NPL Coverage Ratio 334% 278% 56 bps ACL / Loans 1.41% 1.49% (8) bps … our conservative risk profile and strategic decision in 2019 to de - risk acquired loan portfolios ACL/ALLL (2) / Loans (%) and ACL/ALLL ($) (1) $ in millions $42 $57 $68 $220 $238 $205 $213 0.39% 0.48% 0.46% 1.52% 1.85% 1.71% 1.41% 0.00% 0.20% 0.40% 0.60% 0.80% 1.00% 1.20% 1.40% 1.60% 1.80% 2.00% $0 $25 $50 $75 $100 $125 $150 $175 $200 $225 $250 2017 2018 2019 1/1/20 CECL Adoption 2020 2021 Q2 22 Q2 Highlights • NPL ratio drops 11 bps linked quarter • NPAs to total assets ends the quarter at 26 bps • NPL coverage ratio remains strong at 334 % • Net charge - offs total 2 bps of average loans • Improved credit quality metrics reflect economic conditions in the markets we serve and geographic diversification of our loan portfolio • ACL to loans at healthy 1 . 41 %
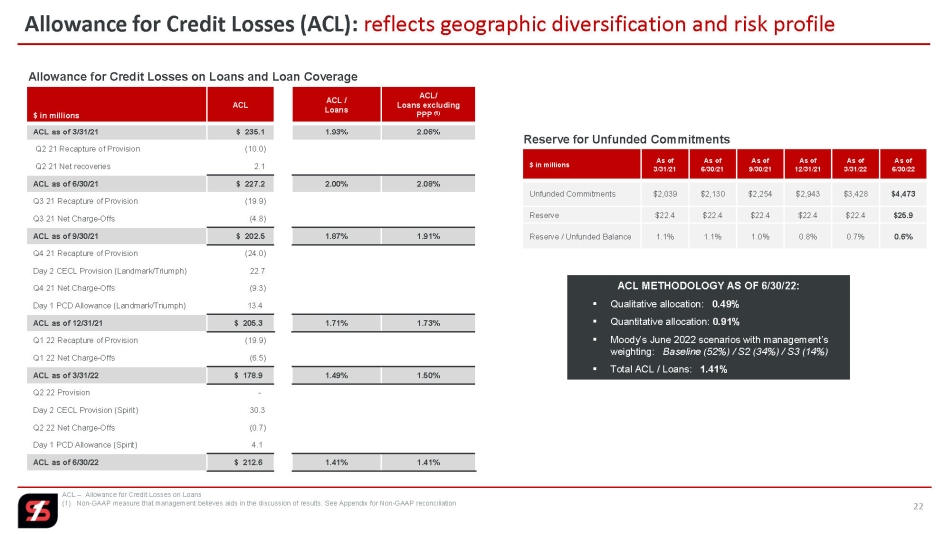
22 Allowance for Credit Losses (ACL): reflects geographic diversification and risk profile ACL – Allowance for Credit Losses on Loans (1) Non - GAAP measure that management believes aids in the discussion of results. See Appendix for Non - GAAP reconciliation $ in millions ACL ACL / Loans ACL/ Loans excluding PPP (1) ACL as of 3/31/21 $ 235.1 1.93% 2.06% Q2 21 Recapture of Provision (10.0) Q2 21 Net recoveries 2.1 ACL as of 6/30/21 $ 227.2 2.00% 2.08% Q3 21 Recapture of Provision (19.9) Q3 21 Net Charge - Offs (4.8) ACL as of 9/30/21 $ 202.5 1.87% 1.91% Q4 21 Recapture of Provision (24.0) Day 2 CECL Provision (Landmark/Triumph) 22.7 Q4 21 Net Charge - Offs (9.3) Day 1 PCD Allowance (Landmark/Triumph) 13.4 ACL as of 12/31/21 $ 205.3 1.71% 1.73% Q1 22 Recapture of Provision (19.9) Q1 22 Net Charge - Offs (6.5) ACL as of 3/31/22 $ 178.9 1.49% 1.50% Q2 22 Provision - Day 2 CECL Provision (Spirit) 30.3 Q2 22 Net Charge - Offs (0.7) Day 1 PCD Allowance (Spirit) 4.1 ACL as of 6/30/22 $ 212.6 1.41% 1.41% Allowance for Credit Losses on Loans and Loan Coverage Reserve for Unfunded Commitments $ in millions As of 3/31/21 As of 6/30/21 As of 9/30/21 As of 12/31/21 As of 3/31/22 As of 6/30/22 Unfunded Commitments $2,039 $2,130 $2,254 $2,943 $3,428 $4,473 Reserve $22.4 $22.4 $22.4 $22.4 $22.4 $25.9 Reserve / Unfunded Balance 1.1% 1.1% 1.0% 0.8% 0.7% 0.6% ACL METHODOLOGY AS OF 6/30/22: ▪ Qualitative allocation: 0.49% ▪ Quantitative allocation: 0.91% ▪ Moody’s June 2022 scenarios with management’s weighting: Baseline (52%) / S2 (34%) / S3 (14%) ▪ Total ACL / Loans: 1.41%

Key Takeaways
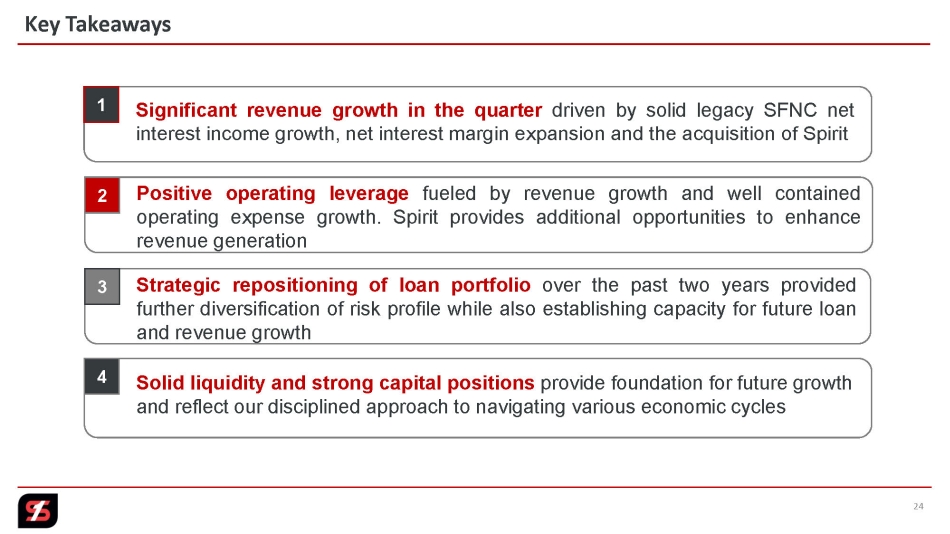
24 Key Takeaways 1 Significant revenue growth in the quarter driven by solid legacy SFNC net interest income growth, net interest margin expansion and the acquisition of Spirit 2 Positive operating leverage fueled by revenue growth and well contained operating expense growth . Spirit provides additional opportunities to enhance revenue generation 3 Strategic repositioning of loan portfolio over the past two years provided further diversification of risk profile while also establishing capacity for future loan and revenue growth 4 Solid liquidity and strong capital positions provide foundation for future growth and reflect our disciplined approach to navigating various economic cycles

Appendix
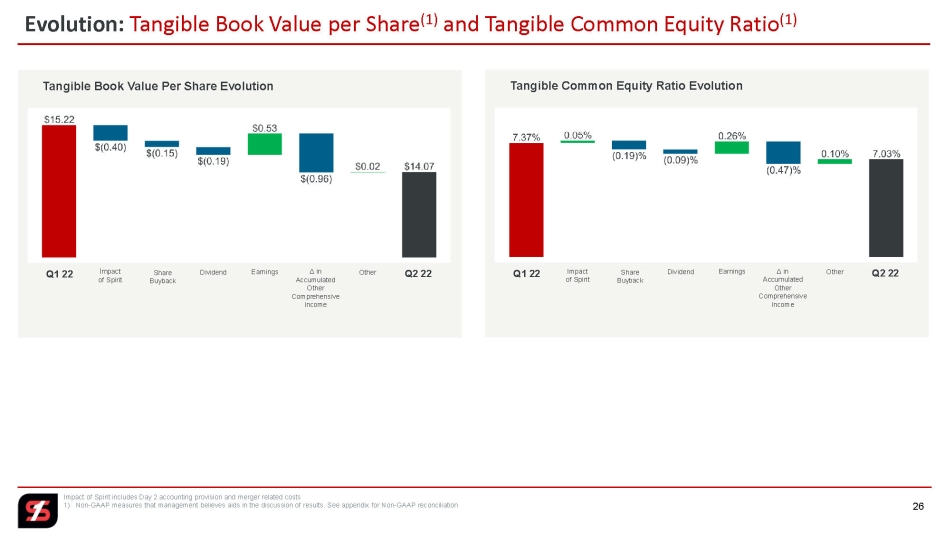
26 Impact of Spirit includes Day 2 accounting provision and merger related costs 1) Non - GAAP measures that management believes aids in the discussion of results. See appendix for Non - GAAP reconciliation Evolution: Tangible Book Value per Share (1) and Tangible Common Equity Ratio (1) Tangible Book Value Per Share Evolution Q1 22 Impact of Spirit Share Buyback Δ in Accumulated Other Comprehensive Income Q2 22 Other Dividend Earnings Tangible Common Equity Ratio Evolution Q1 22 Impact of Spirit Share Buyback Δ in Accumulated Other Comprehensive Income Q2 22 Other Dividend Earnings
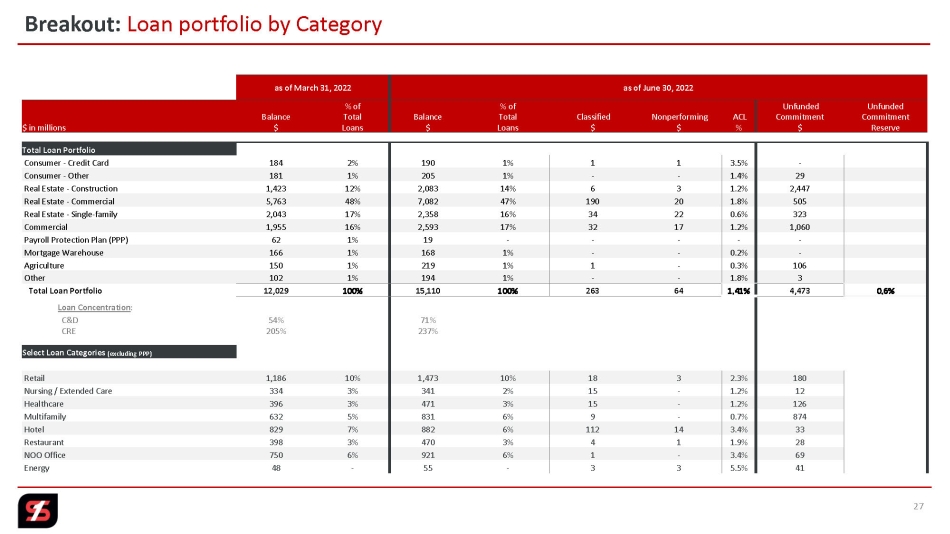
27 Breakout: Loan portfolio by Category as of March 31, 2022 as of June 30, 2022 $ in millions Balance $ % of Total Loans Balance $ % of Total Loans Classified $ Nonperforming $ ACL % Unfunded Commitment $ Unfunded Commitment Reserve Total Loan Portfolio Consumer - Credit Card 184 2% 190 1% 1 1 3.5% - Consumer - Other 181 1% 205 1% - - 1.4% 29 Real Estate - Construction 1,423 12% 2,083 14% 6 3 1.2% 2,447 Real Estate - Commercial 5,763 48% 7,082 47% 190 20 1.8% 505 Real Estate - Single - family 2,043 17% 2,358 16% 34 22 0.6% 323 Commercial 1,955 16% 2,593 17% 32 17 1.2% 1,060 Payroll Protection Plan (PPP) 62 1% 19 - - - - - Mortgage Warehouse 166 1% 168 1% - - 0.2% - Agriculture 150 1% 219 1% 1 - 0.3% 106 Other 102 1% 194 1% - - 1.8% 3 Total Loan Portfolio 12,029 100% 15,110 100% 263 64 1.41% 4,473 0.6% Loan Concentration : C&D 54% 71% CRE 205% 237% Select Loan Categories (excluding PPP) Retail 1,186 10% 1,473 10% 18 3 2.3% 180 Nursing / Extended Care 334 3% 341 2% 15 - 1.2% 12 Healthcare 396 3% 471 3% 15 - 1.2% 126 Multifamily 632 5% 831 6% 9 - 0.7% 874 Hotel 829 7% 882 6% 112 14 3.4% 33 Restaurant 398 3% 470 3% 4 1 1.9% 28 NOO Office 750 6% 921 6% 1 - 3.4% 69 Energy 48 - 55 - 3 3 5.5% 41
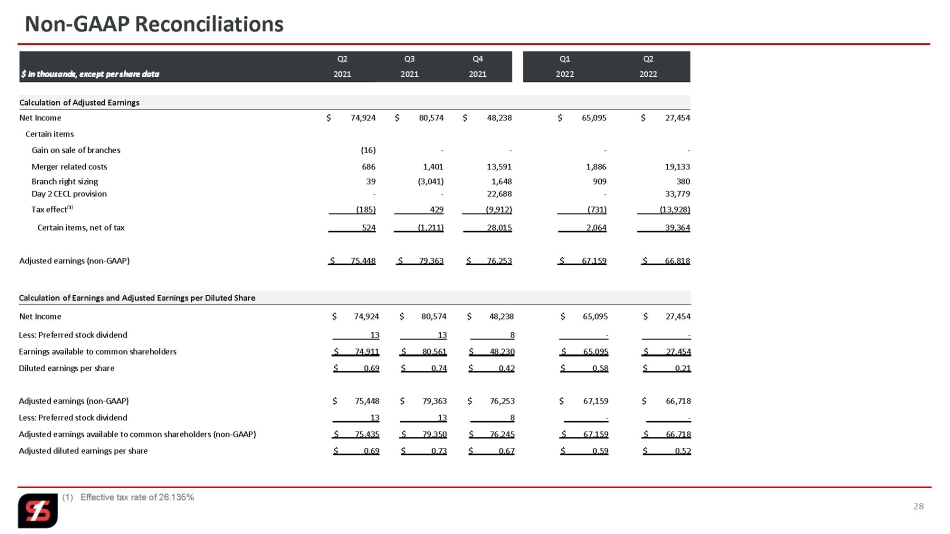
28 Non - GAAP Reconciliations Q2 Q3 Q4 Q1 Q2 $ in thousands, except per share data 2021 2021 2021 2022 2022 Calculation of Adjusted Earnings Net Income $ 74,924 $ 80,574 $ 48,238 $ 65,095 $ 27,454 Certain items Gain on sale of branches (16) - - - - Merger related costs 686 1,401 13,591 1,886 19,133 Branch right sizing 39 (3,041) 1,648 909 380 Day 2 CECL provision - - 22,688 - 33,779 Tax effect⁽¹⁾ (185) 429 _ (9,912) _ (731) _ (13,928) Certain items, net of tax __ __524 (1,211) ____ 28,015 2,064 39,364 Adjusted earnings (non - GAAP) $ _75,448 $ _79,363 $ _76,253 $ 67,159 $ 66,818 Calculation of Earnings and Adjusted Earnings per Diluted Share Net Income $ 74,924 $ 80,574 $ 48,238 $ 65,095 $ 27,454 Less: Preferred stock dividend 13 13 8 _ - _ - Earnings available to common shareholders $ _74,911 $ _80,561 $ _48,230 $ 65,095 $ 27,454 Diluted earnings per share $ 0.69 $ 0.74 $ 0.42 $ 0.58 $ 0.21 Adjusted earnings (non - GAAP) $ 75,448 $ 79,363 $ 76,253 $ 67,159 $ 66,718 Less: Preferred stock dividend 13 13 8 - - Adjusted earnings available to common shareholders (non - GAAP) $ _75,435 $ _79,350 $ _76,245 $ 67,159 $ 66,718 Adjusted diluted earnings per share $ 0.69 $ 0.73 $ 0.67 $ 0.59 $ 0.52 (1) Effective tax rate of 26.135%
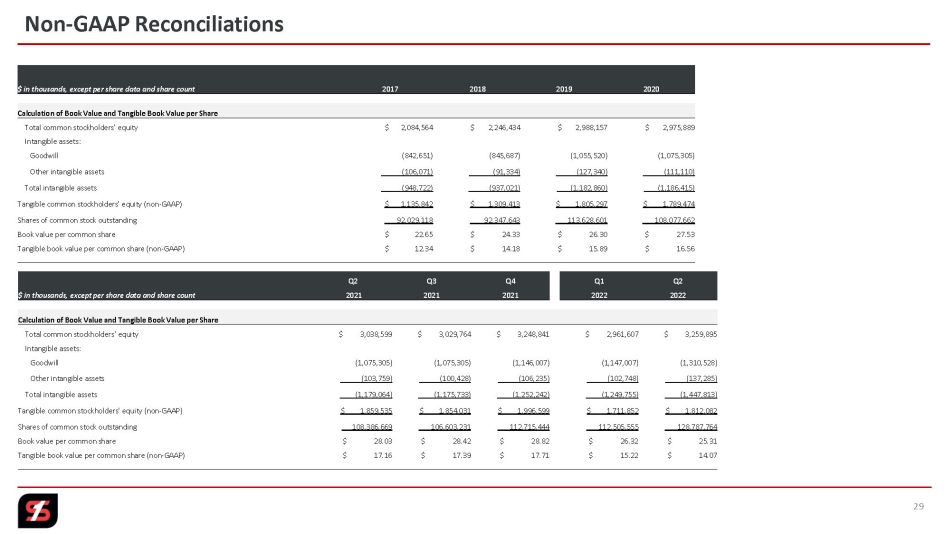
29 Non - GAAP Reconciliations $ in thousands, except per share data and share count 2017 2018 2019 2020 Calculation of Book Value and Tangible Book Value per Share Total common stockholders' equity $ 2,084,564 $ 2,246,434 $ 2,988,157 $ 2,975,889 Intangible assets: Goodwill (842,651) (845,687) (1,055,520) (1,075,305) Other intangible assets (106,071) (91,334) (127,340) (111,110) Total intangible assets (948,722) (937,021) (1,182,860) (1,186,415) Tangible common stockholders' equity (non - GAAP) $ 1,135,842 $ 1,309,413 $ 1,805,297 $ 1,789,474 Shares of common stock outstanding 92,029,118 92,347,643 113,628,601 108,077,662 Book value per common share $ 22.65 $ 24.33 $ 26.30 $ 27.53 Tangible book value per common share (non - GAAP) $ 12.34 $ 14.18 $ 15.89 $ 16.56 Q2 Q3 Q4 Q1 Q2 $ in thousands, except per share data and share count 2021 2021 2021 2022 2022 Calculation of Book Value and Tangible Book Value per Share Total common stockholders' equity $ 3,038,599 $ 3,029,764 $ 3,248,841 $ 2,961,607 $ 3,259,895 Intangible assets: Goodwill (1,075,305) (1,075,305) (1,146,007) (1,147,007) (1,310,528) Other intangible assets (103,759) (100,428) (106,235) (102,748) (137,285) Total intangible assets (1,179,064) (1,175,733) (1,252,242) (1,249,755) (1,447,813) Tangible common stockholders' equity (non - GAAP) $ 1,859,535 $ 1,854,031 $ 1,996,599 $ 1,711,852 $ 1,812,082 Shares of common stock outstanding 108,386,669 106,603,231 112,715,444 112,505,555 128,787,764 Book value per common share $ 28.03 $ 28.42 $ 28.82 $ 26.32 $ 25.31 Tangible book value per common share (non - GAAP) $ 17.16 $ 17.39 $ 17.71 $ 15.22 $ 14.07
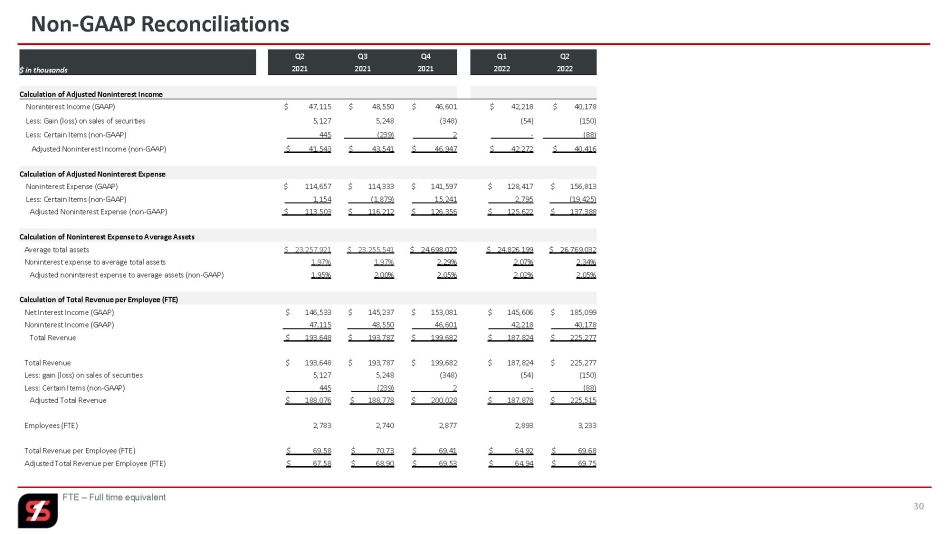
30 Non - GAAP Reconciliations Q2 Q3 Q4 Q1 Q2 $ in thousands 2021 2021 2021 2022 2022 Calculation of Adjusted Noninterest Income Noninterest Income (GAAP) $ 47,115 $ 48,550 $ 46,601 $ 42,218 $ 40,178 Less: Gain (loss) on sales of securities 5,127 5,248 (348) (54) (150) Less: Certain Items (non - GAAP) _ 445 (239) 2 ____ - ____(88) Adjusted Noninterest Income (non - GAAP) $ 41,543 $ 43,541 $ 46,947 $ 42,272 $ 40,416 Calculation of Adjusted Noninterest Expense Noninterest Expense (GAAP) $ 114,657 $ 114,333 $ 141,597 $ 128,417 $ 156,813 Less: Certain Items (non - GAAP) _1,154 (1,879) 15,241 _2,795 _(19,425) Adjusted Noninterest Expense (non - GAAP) $ 113,503 $ 116,212 $ 126,356 $ 125,622 $ 137,388 Calculation of Noninterest Expense to Average Assets Average total assets $ 23,257,921 $ 23,255,541 $ 24,698,022 $ 24,826,199 $ 26,769,032 Noninterest expense to average total assets 1.97% 1.97% 2.29% 2.07% 2.34% Adjusted noninterest expense to average assets (non - GAAP) 1.95% 2.00% 2.05% 2.02% 2.05% Calculation of Total Revenue per Employee (FTE) Net Interest Income (GAAP) $ 146,533 $ 145,237 $ 153,081 $ 145,606 $ 185,099 Noninterest Income (GAAP) 47,115 48,550 46,601 42,218 40,178 Total Revenue $ 193,648 $ 193,787 $ 199,682 $ 187,824 $ 225,277 Total Revenue $ 193,648 $ 193,787 $ 199,682 $ 187,824 $ 225,277 Less: gain (loss) on sales of securities 5,127 5,248 (348) (54) (150) Less: Certain Items (non - GAAP) 445 (239) 2 - (88) Adjusted Total Revenue $ 188,076 $ 188,778 $ 200,028 $ 187,878 $ 225,515 Employees (FTE) 2,783 2,740 2,877 2,893 3,233 Total Revenue per Employee (FTE) $ 69.58 $ 70.73 $ 69.41 $ 64.92 $ 69.68 Adjusted Total Revenue per Employee (FTE) $ 67.58 $ 68.90 $ 69.53 $ 64.94 $ 69.75 FTE – Full time equivalent

31 Non - GAAP Reconciliations FTE – full time equivalent Q2 Q3 Q4 Q1 Q2 $ in thousands 2021 2021 2021 2022 2022 Calculation of Noninterest Income to Total Revenue Total Noninterest Income $ 47,115 $ 48,550 $ 46,601 $ 42,218 $ 40,178 Less: Gain (loss) on sales of securities 5,127 5,248 (348) (54) (150) Less: Certain Items (non - GAAP) 445 (239) 2 - (88) Adjusted Noninterest Income (non - GAAP) $ 41,543 $ 43,541 $ 46,947 $ 42,272 $ 40,416 Noninterest Income to Total Revenue 24.33% 25.05% 23.34% 22.48% 17.83% Adjusted Noninterest Income to Adjusted Total Revenue 22.09% 23.06% 23.47% 22.50% 17.92% Noninterest Income per Employee $ 16.93 $ 17.72 $ 16.20 $ 14.59 $ 12.43 Adjusted Noninterest Income per Employee (FTE) $ 14.93 $ 15.89 $ 16.32 $ 14.61 $ 12.50 Q2 Q3 Q4 Q1 Q2 $ in thousands 2021 2021 2021 2022 2022 Calculation of Efficiency Ratio Noninterest expense $ 114,657 $ 114,333 $ 141,597 $ 128,417 $ 156,813 Certain items (non - GAAP) (1,154) 1,879 (15,241) (2,795) (19,425) Other real estate and foreclosure expense (863) (339) (576) (343) (142) Amortization of intangible assets (3,333) _ (3,331) ___ __(3,486) ____ __(3,486) ___ __(4,096) Efficiency ratio numerator $ 109,307 $ 112,542 $ 122,294 $ 121,793 $ 133,150 Net interest income $ 146,533 $ 145,237 $ 153,081 $ 145,606 $ 185,099 Noninterest income 47,115 48,550 46,601 42,218 40,178 Certain items (non - GAAP) (445) 239 (2) - 88 (Gain) loss on sale of securities (5,127) (5,248) 348 54 150 Fully taxable equivalent adjustment 4,548 _ 4,941 ___ _ _5,579 ____ __ 5,602 ___ _ _6,096 Efficiency ratio denominator $ 192,624 $ 193,719 $ 205,607 $ 193,480 $ 231,611 Efficiency Ratio 56.75% 58.10% 59.48% 62.95% 57.49%

32 Non - GAAP Reconciliations Q2 Q3 Q4 Q1 Q2 $ in thousands 2021 2021 2021 2022 2022 Calculation of Pre - Provision Net Revenue (PPNR) Net interest income $ 146,533 $ 145,237 $ 153,081 $ 145,606 $ 185,099 Noninterest income 47,115 48,550 46,601 42,218 40,178 Less: Gain (loss) on sale of securities 5,127 5,248 (348) (54) (150) Less: Noninterest Expense 114,657 114,333 141,597 128,417 156,813 Pre - Provision Net Revenue $ 73,864 $ 74,206 $ 58,433 $ 59,461 $ 68,614 Calculation of Adjusted Pre - Provision Net Revenue Net interest income $ 146,533 $ 145,237 $ 153,081 $ 145,606 $ 185,099 Noninterest income 47,115 48,550 46,601 42,218 40,178 Less: Gain (loss)on sale of securities 5,127 5,248 (348) (54) (150) Less: Noninterest Expense 114,657 114,333 141,597 128,417 156,813 Plus : Gain on sale of branches (16) - - - - Plus: Merger related costs 686 1,401 13,591 1,886 19,133 Plus: Branch right sizing costs 39 (3,041) 1,648 909 380 Adjusted Pre - Provision Net Revenue $ 74,589 $ 72,566 $ 73,672 $ 62,256 $ 88,127
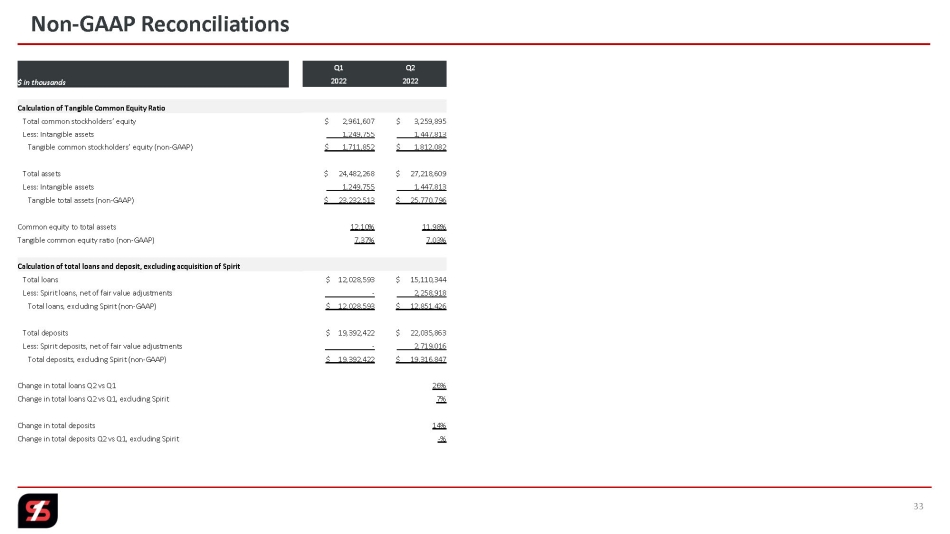
33 Non - GAAP Reconciliations Q1 Q2 $ in thousands 2022 2022 Calculation of Tangible Common Equity Ratio Total common stockholders’ equity $ 2,961,607 $ 3,259,895 Less: Intangible assets 1,249,755 1,447,813 Tangible common stockholders’ equity (non - GAAP) $ 1,711,852 $ 1,812,082 Total assets $ 24,482,268 $ 27,218,609 Less: Intangible assets 1,249,755 1,447,813 Tangible total assets (non - GAAP) $ 23,232,513 $ 25,770,796 Common equity to total assets 12.10% 11.98% Tangible common equity ratio (non - GAAP) 7.37% 7.03% Calculation of total loans and deposit, excluding acquisition of Spirit Total loans $ 12,028,593 $ 15,110,344 Less: Spirit loans, net of fair value adjustments - 2,258,918 Total loans, excluding Spirit (non - GAAP) $ 12,028,593 $ 12,851,426 Total deposits $ 19,392,422 $ 22,035,863 Less: Spirit deposits, net of fair value adjustments - 2,719,016 Total deposits, excluding Spirit (non - GAAP) $ 19,392,422 $ 19,316,847 Change in total loans Q2 vs Q1 26% Change in total loans Q2 vs Q1, excluding Spirit 7% Change in total deposits 14% Change in total deposits Q2 vs Q1, excluding Spirit - %

Nasdaq: SFNC 2 nd Quarter 2022 Earnings Presentation Contents 3 Q2 Highlights 4 Q2 Results Overview 11 Loans 14 Deposits, Liquidity, Securities, Interest Rate Sensitivity & Capital 20 Credit Quality 23 Key Takeaways 25 Appendix