Exhibit 99.2

Nasdaq: SFNC 1 st Quarter 2023 Earnings Presentation Contents 3 Company Profile 4 Q1 Financial Highlights 11 Deposits, Securities, Liquidity, Interest Rate Sensitivity and Capital 19 Loans 23 Credit Quality 26 Key Takeaways 28 Appendix
2 Forward - Looking Statements and Non - GAAP Financial Measures Forward - Looking Statements . Certain statements by Simmons First National Corporation (the “Company”, which where appropriate includes the Company’s wholly - owned banking subsidiary, Simmons Bank) contained in this presentation may not be based on historical facts and should be considered "forward - looking statements" within the meaning of the Private Securities Litigation Reform Act of 1995 . These forward - looking statements may be identified by reference to a future period(s) or by the use of forward - looking terminology, such as "anticipate," “believe,” “continue,” "estimate," "expect," "foresee,“ “indicate,” “plan,” “potential,” “project,” “target,” "may," "might," "will," "would," "could,“ “should,” “likely” or "intend," future or conditional verb tenses, and variations or negatives of such terms or by similar expressions . These forward - looking statements include, without limitation, statements relating to the Company’s future growth ; business strategies ; product development ; revenue ; expenses (including interest expense and non - interest expenses) ; assets ; loan demand (including loan growth, loan capacity, and other lending activity) ; deposit levels ; asset quality ; profitability ; earnings ; critical accounting policies ; accretion ; net interest margin ; noninterest revenue ; the Company's common stock repurchase program ; adequacy of the allowance for credit losses ; income tax deductions ; credit quality ; level of credit losses from lending commitments ; net interest revenue ; interest rate sensitivity (including, among other things, the potential impact of rising rates) ; loan loss experience ; liquidity ; capital resources ; future economic conditions and market risk ; interest rates ; the expected benefits, milestones, timelines, and costs associated with the Company’s merger and acquisition strategy and activity ; the Company’s ability to recruit and retain key employees ; increases in, and cash flows associated with, the Company’s securities portfolio ; legal and regulatory limitations and compliance and competition ; anticipated loan principal reductions ; plans for investments in and cash flows from securities ; projections regarding securities investments and maturities thereof ; the “ 2023 Efficiency Targets” and “Long - Term Objectives” set forth on slide 10 ; the interest rate sensitivity estimates, as well as the estimated interest income effect of the fair value hedges, noted on slide 17 ; digital bank initiatives ; and dividends . Readers are cautioned not to place undue reliance on the forward - looking statements contained in this presentation in that actual results could differ materially from those indicated in or implied by such forward - looking statements due to a variety of factors . These factors include, but are not limited to, changes in the Company's operating or expansion strategy ; the availability of and costs associated with obtaining adequate and timely sources of liquidity ; the ability to maintain credit quality ; the effects of the pandemic on, among other things, the Company’s operations, liquidity, and credit quality ; changes in general market and economic conditions ; increased unemployment ; labor shortages ; possible adverse rulings, judgments, settlements and other outcomes of pending or future litigation ; the ability of the Company to collect amounts due under loan agreements ; changes in consumer preferences and loan demand ; the effectiveness of the Company's interest rate risk management strategies ; laws and regulations affecting financial institutions in general or relating to taxes ; the effect of pending or future legislation ; the ability of the Company to repurchase its common stock on favorable terms ; the ability of the Company to successfully manage and implement its acquisition strategy and integrate acquired institutions ; difficulties and delays in integrating an acquired business or fully realizing cost savings and other benefits of mergers and acquisitions ; changes in interest rates, deposit flows, real estate values, and capital markets ; increased inflation ; customer acceptance of the Company's products and services ; changes or disruptions in technology and IT systems (including cyber threats, attacks and events) ; changes in accounting principles relating to loan loss recognition (current expected credit losses, or CECL) ; the benefits associated with the Company’s early retirement program ; political crises, war, and other military conflicts (including the ongoing military conflict between Russia and Ukraine) or other major events, or the prospect of these events ; increased competition ; changes in governmental policies ; loss of key employees ; the soundness of other financial institutions and indirect exposure related to the closings of Silicon Valley Bank (“SVB”), Signature Bank and Silvergate Bank and their impact on the broader market through other customers, suppliers and partners (or that the conditions which resulted in the liquidity concerns with SVB, Signature Bank and Silvergate Bank may also adversely impact, directly or indirectly, other financial institutions and market participants with which the Company has commercial or deposit relationships) ; and other risk factors . Other relevant risk factors may be detailed from time to time in the Company's press releases and filings with the U . S . Securities and Exchange Commission, including, without limitation, the Company’s Form 10 - K for the year ended December 31 , 2022 . In addition, there can be no guarantee that the board of directors (“Board”) of the Company will approve a quarterly dividend in future quarters, and the timing, payment, and amount of future dividends (if any) is subject to, among other things, the discretion of the Board and may differ significantly from past dividends . Any forward - looking statement speaks only as of the date of this presentation, and the Company undertakes no obligation to update these forward - looking statements to reflect events or circumstances that occur after the date of this presentation . Annualized, pro forma, projected and estimated numbers are used for illustrative purpose only, are not forecasts and may not reflect actual results . Non - GAAP Financial Measures . This presentation contains financial information determined by methods other than in accordance with U . S . generally accepted accounting principles (“GAAP”) . The Company’s management uses these non - GAAP financial measures in their analysis of the Company’s performance and capital adequacy . These measures adjust GAAP performance measures to, among other things, include the tax benefit associated with revenue items that are tax - exempt, as well as exclude from net income (including on a per share diluted basis), pre - tax, pre - provision earnings, net charge - offs, income available to common shareholders, non - interest income, and non - interest expense certain income and expense items attributable to merger activity (primarily including merger - related expenses and Day 2 CECL provisions), gains and/or losses on sale of branches, net branch right - sizing initiatives, loss on redemption of trust preferred securities and gain on sale of intellectual property . In addition, the Company also presents certain figures based on tangible common stockholders’ equity, tangible assets and tangible book value, which exclude goodwill and other intangible assets, and presents certain other figures to include the effect that accumulated other comprehensive income could have on the Company’s capital levels . The Company further presents certain figures that are exclusive of the impact of Paycheck Protection Program (“PPP”) loans, deposits and/or loans acquired through acquisitions, mortgage warehouse loans, and/or energy loans, or gains and/or losses on the sale of securities . The Company’s management believes that these non - GAAP financial measures are useful to investors because they, among other things, present the results of the Company’s ongoing operations without the effect of mergers or other items not central to the Company’s ongoing business, present the Company’s capital inclusive of the potential impact of AOCI (primarily comprised of unrealized losses on securities), as well as normalize for tax effects, the effects of the PPP, and certain other effects . Management, therefore, believes presentations of these non - GAAP financial measures provide useful supplemental information that is essential to a proper understanding of the operating results of the Company’s ongoing businesses, and management uses these non - GAAP financial measures to assess the performance of the Company’s ongoing businesses as related to prior financial periods . These non - GAAP disclosures should not be viewed as a substitute for operating results determined in accordance with GAAP, nor are they necessarily comparable to non - GAAP performance measures that may be presented by other companies . Where non - GAAP financial measures are used, the comparable GAAP financial measure, as well as the reconciliation to the comparable GAAP financial measure, can be found in the appendix to this presentation .
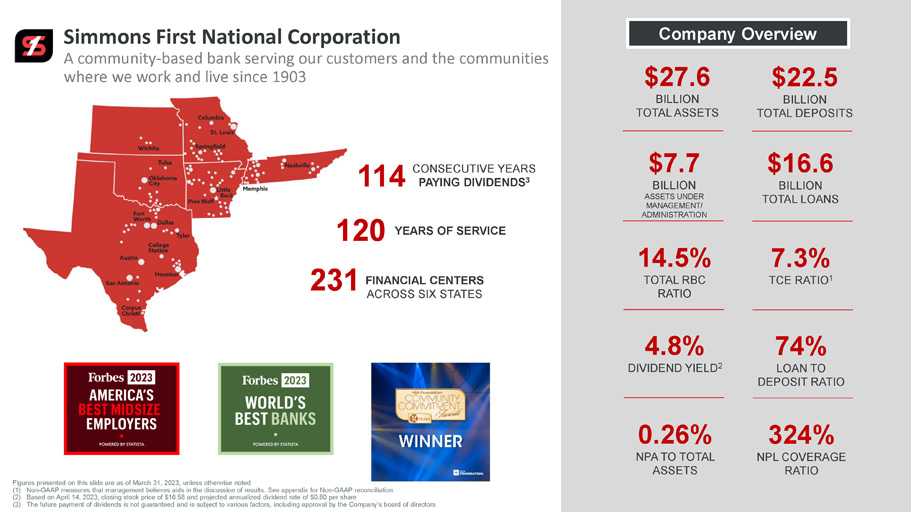
3 Simmons First National Corporation A community - based bank serving our customers and the communities where we work and live since 1903 Company Overview $27.6 BILLION TOTAL ASSETS $22.5 BILLION TOTAL DEPOSITS 114 CONSECUTIVE YEARS PAYING DIVIDENDS 3 $7.7 BILLION ASSETS UNDER MANAGEMENT/ ADMINISTRATION $16.6 BILLION TOTAL LOANS 120 YEARS OF SERVICE 231 FINANCIAL CENTERS ACROSS SIX STATES 14.5% TOTAL RBC RATIO 7.3% TCE RATIO 1 4.8% DIVIDEND YIELD 2 74% LOAN TO DEPOSIT RATIO 0.26% NPA TO TOTAL ASSETS 324% NPL COVERAGE RATIO Figures presented on this slide are as of March 31, 2023, unless otherwise noted (1) Non - GAAP measures that management believes aids in the discussion of results. See appendix for Non - GAAP reconciliation (2) Based on April 14, 2023, closing stock price of $16.58 and projected annualized dividend rate of $0.80 per share (3) The future payment of dividends is not guaranteed and is subject to various factors, including approval by the Company’ s b oard of directors

Q1 23 Financial Highlights
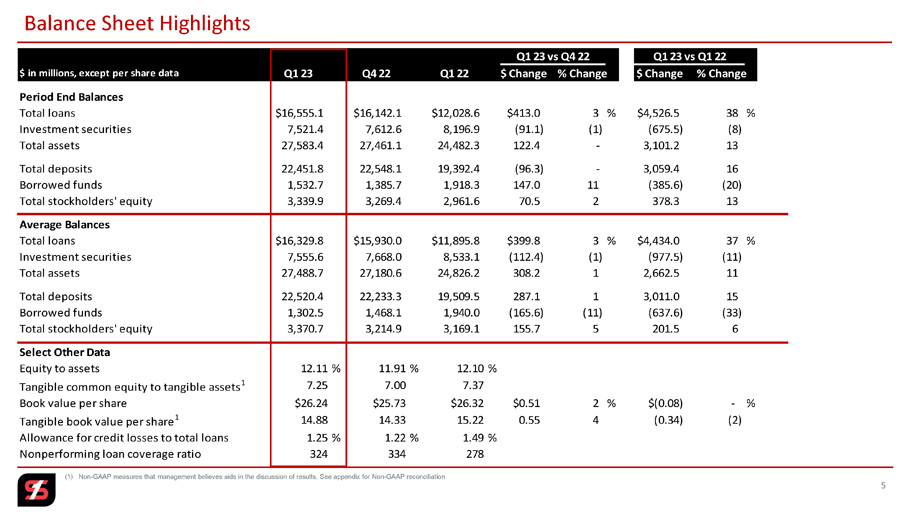
5 Balance Sheet Highlights $ in millions, except per share data Q1 23 Q4 22 Q1 22 $ Change % Change $ Change % Change Period End Balances Total loans $16,555.1 $16,142.1 $12,028.6 $413.0 3 % $4,526.5 38 % Investment securities 7,521.4 7,612.6 8,196.9 (91.1) (1) (675.5) (8) Total assets 27,583.4 27,461.1 24,482.3 122.4 - 3,101.2 13 Total deposits 22,451.8 22,548.1 19,392.4 (96.3) - 3,059.4 16 Borrowed funds 1,532.7 1,385.7 1,918.3 147.0 11 (385.6) (20) Total stockholders' equity 3,339.9 3,269.4 2,961.6 70.5 2 378.3 13 Average Balances Total loans $16,329.8 $15,930.0 $11,895.8 $399.8 3 % $4,434.0 37 % Investment securities 7,555.6 7,668.0 8,533.1 (112.4) (1) (977.5) (11) Total assets 27,488.7 27,180.6 24,826.2 308.2 1 2,662.5 11 Total deposits 22,520.4 22,233.3 19,509.5 287.1 1 3,011.0 15 Borrowed funds 1,302.5 1,468.1 1,940.0 (165.6) (11) (637.6) (33) Total stockholders' equity 3,370.7 3,214.9 3,169.1 155.7 5 201.5 6 Select Other Data Equity to assets 12.11% 11.91% 12.10% Tangible common equity to tangible assets 1 7.25 7.00 7.37 Book value per share $26.24 $25.73 $26.32 $0.51 2 % $(0.08) - % Tangible book value per share 1 14.88 14.33 15.22 0.55 4 (0.34) (2) Allowance for credit losses to total loans 1.25% 1.22% 1.49% Nonperforming loan coverage ratio 324 334 278 Q1 23 vs Q4 22 Q1 23 vs Q1 22 (1) Non - GAAP measures that management believes aids in the discussion of results. See appendix for Non - GAAP reconciliation
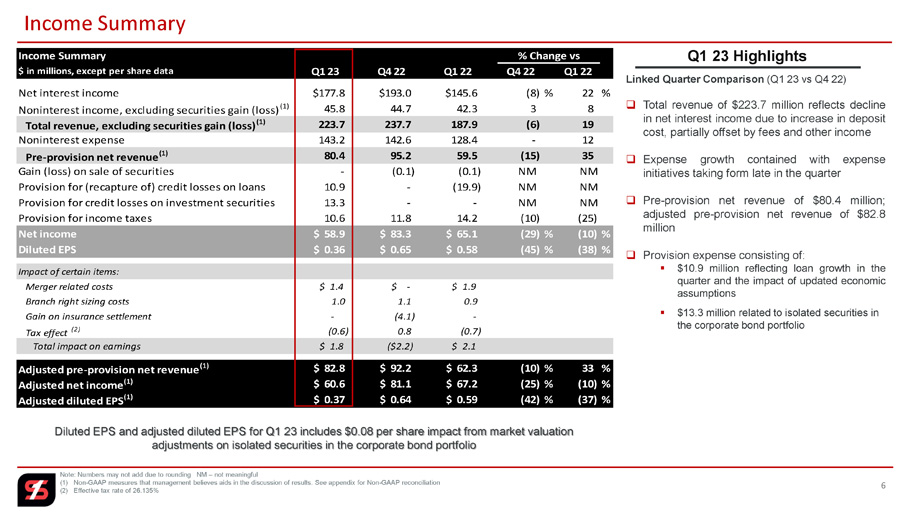
Q1 23 Highlights Income Summary $ in millions, except per share data Q1 23 Q4 22 Q1 22 Q4 22 Q1 22 Net interest income $177.8 $193.0 $145.6 (8) % 22 % Noninterest income, excluding securities gain (loss) (1) 45.8 44.7 42.3 3 8 Total revenue, excluding securities gain (loss) (1) 223.7 237.7 187.9 (6) 19 Noninterest expense 143.2 142.6 128.4 - 12 Pre-provision net revenue (1) 80.4 95.2 59.5 (15) 35 Gain (loss) on sale of securities - (0.1) (0.1) NM NM Provision for (recapture of) credit losses on loans 10.9 - (19.9) NM NM Provision for credit losses on investment securities 13.3 - - NM NM Provision for income taxes 10.6 11.8 14.2 (10) (25) Net income $ 58.9 $ 83.3 $ 65.1 (29) % (10)% Diluted EPS $ 0.36 $ 0.65 $ 0.58 (45) % (38)% Impact of certain items: Merger related costs $ 1.4 $ - $ 1.9 Branch right sizing costs 1.0 1.1 0.9 Gain on insurance settlement - (4.1) - Tax effect (2) (0.6) 0.8 (0.7) Total impact on earnings $ 1.8 ($2.2) $ 2.1 Adjusted pre-provision net revenue (1) $ 82.8 $ 92.2 $ 62.3 (10) % 33 % Adjusted net income (1) $ 60.6 $ 81.1 $ 67.2 (25) % (10)% Adjusted diluted EPS (1) $ 0.37 $ 0.64 $ 0.59 (42) % (37)% % Change vs 6 Income Summary Note: Numbers may not add due to rounding NM – not meaningful (1) Non - GAAP measures that management believes aids in the discussion of results. See appendix for Non - GAAP reconciliation (2) Effective tax rate of 26.135% Linked Quarter Comparison (Q 1 23 vs Q 4 22 ) □ Total revenue of $ 223 . 7 million reflects decline in net interest income due to increase in deposit cost, partially offset by fees and other income □ Expense growth contained with expense initiatives taking form late in the quarter □ Pre - provision net revenue of $ 80 . 4 million ; adjusted pre - provision net revenue of $ 82 . 8 million □ Provision expense consisting of : ▪ $ 10 . 9 million reflecting loan growth in the quarter and the impact of updated economic assumptions ▪ $13.3 million related to isolated securities in the corporate bond portfolio Diluted EPS and adjusted diluted EPS for Q1 23 includes $0.08 per share impact from market valuation adjustments on isolated securities in the corporate bond portfolio
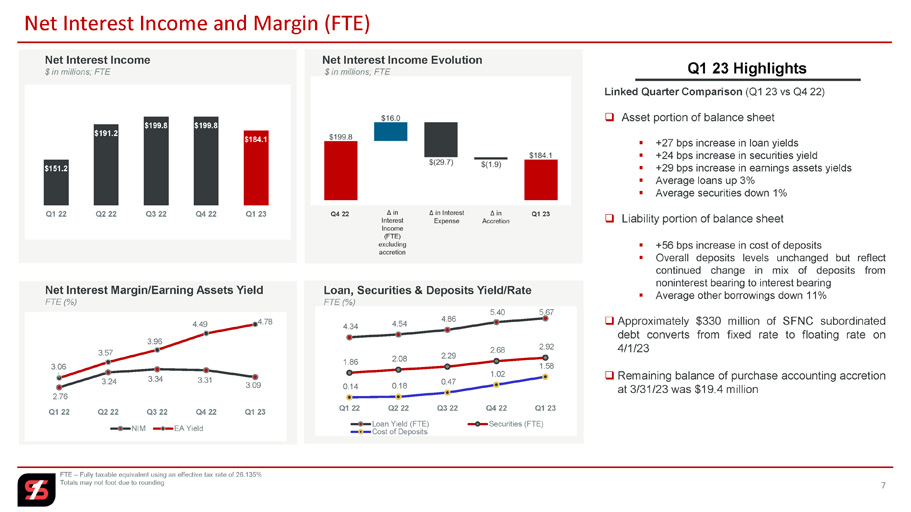
Q1 23 Highlights 7 Net Interest Income and Margin (FTE) FTE – Fully taxable equivalent using an effective tax rate of 26.135% Totals may not foot due to rounding $151.2 $191.2 $199.8 $199.8 $184.1 Q1 22 Q2 22 Q3 22 Q4 22 Q1 23 Net Interest Income $ in millions; FTE Δ in Interest Income (FTE) excluding accretion Δ in Interest Expense Δ in Accretion Net Interest Income Evolution $ in millions; FTE Net Interest Margin/Earning Assets Yield FTE (%) 2.76 3.24 3.34 3.31 3.09 3.06 3.57 3.96 4.49 4.78 Q1 22 Q2 22 Q3 22 Q4 22 Q1 23 NIM EA Yield 4.34 4.54 4.86 5.40 5.67 1.86 2.08 2.29 2.68 2.92 0.14 0.18 0.47 1.02 1.58 Q1 22 Q2 22 Q3 22 Q4 22 Q1 23 Loan Yield (FTE) Securities (FTE) Cost of Deposits Loan, Securities & Deposits Yield/Rate FTE (%) Q4 22 Q1 23 Linked Quarter Comparison (Q 1 23 vs Q 4 22 ) □ Asset portion of balance sheet ▪ + 27 bps increase in loan yields ▪ + 24 bps increase in securities yield ▪ + 29 bps increase in earnings assets yields ▪ Average loans up 3 % ▪ Average securities down 1 % □ Liability portion of balance sheet ▪ + 56 bps increase in cost of deposits ▪ Overall deposits levels unchanged but reflect continued change in mix of deposits from noninterest bearing to interest bearing ▪ Average other borrowings down 11 % □ Approximately $ 330 million of SFNC subordinated debt converts from fixed rate to floating rate on 4 / 1 / 23 □ Remaining balance of purchase accounting accretion at 3 / 31 / 23 was $ 19 . 4 million
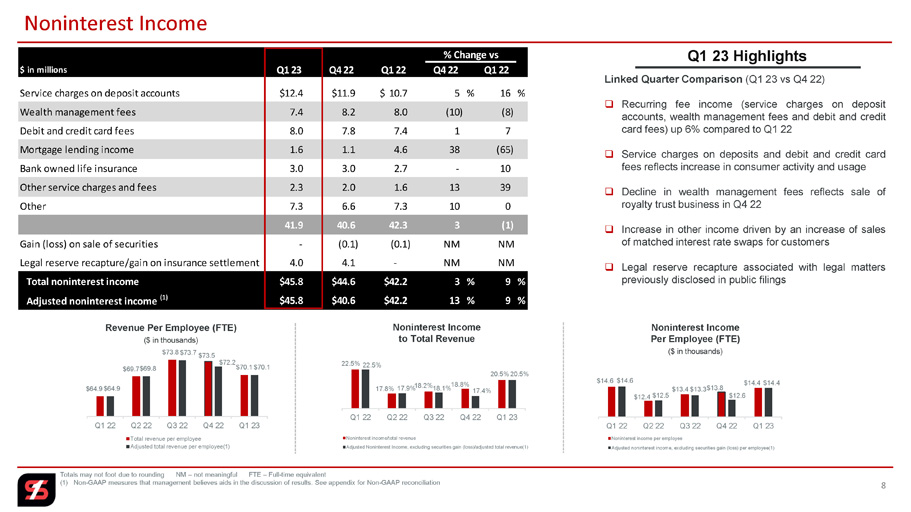
$14.6 $12.4 $13.4 $13.8 $14.4 $14.6 $12.5 $13.3 $12.6 $14.4 Q1 22 Q2 22 Q3 22 Q4 22 Q1 23 Noninterest income per employee Adjusted noninterest income, excluding securities gain (loss) per employee(1) Noninterest Income Per Employee (FTE) ($ in thousands) $ in millions Q1 23 Q4 22 Q1 22 Q4 22 Q1 22 Service charges on deposit accounts $12.4 $11.9 $ 10.7 5 % 16 % Wealth management fees 7.4 8.2 8.0 (10) (8) Debit and credit card fees 8.0 7.8 7.4 1 7 Mortgage lending income 1.6 1.1 4.6 38 (65) Bank owned life insurance 3.0 3.0 2.7 - 10 Other service charges and fees 2.3 2.0 1.6 13 39 Other 7.3 6.6 7.3 10 0 41.9 40.6 42.3 3 (1) Gain (loss) on sale of securities - (0.1) (0.1) NM NM Legal reserve recapture/gain on insurance settlement 4.0 4.1 - NM NM Total noninterest income $45.8 $44.6 $42.2 3 % 9 % Adjusted noninterest income (1) $45.8 $40.6 $42.2 13 % 9 % % Change vs 22.5% 17.8% 18.2% 18.8% 20.5% 22.5% 17.9% 18.1% 17.4% 20.5% Q1 22 Q2 22 Q3 22 Q4 22 Q1 23 Noninterest income/total revenue Adjusted Noninterest Income, excluding securities gain (loss)/adjusted total revenue(1) Noninterest Income to Total Revenue $64.9 $69.7 $73.8 $73.5 $70.1 $64.9 $69.8 $73.7 $72.2 $70.1 Q1 22 Q2 22 Q3 22 Q4 22 Q1 23 Total revenue per employee Adjusted total revenue per employee(1) Revenue Per Employee (FTE) ($ in thousands) 8 Noninterest Income Totals may not foot due to rounding NM – not meaningful FTE – Full - time equivalent (1) Non - GAAP measures that management believes aids in the discussion of results. See appendix for Non - GAAP reconciliation Q1 23 Highlights Linked Quarter Comparison (Q 1 23 vs Q 4 22 ) □ Recurring fee income (service charges on deposit accounts, wealth management fees and debit and credit card fees) up 6 % compared to Q 1 22 □ Service charges on deposits and debit and credit card fees reflects increase in consumer activity and usage □ Decline in wealth management fees reflects sale of royalty trust business in Q 4 22 □ Increase in other income driven by an increase of sales of matched interest rate swaps for customers □ Legal reserve recapture associated with legal matters previously disclosed in public filings
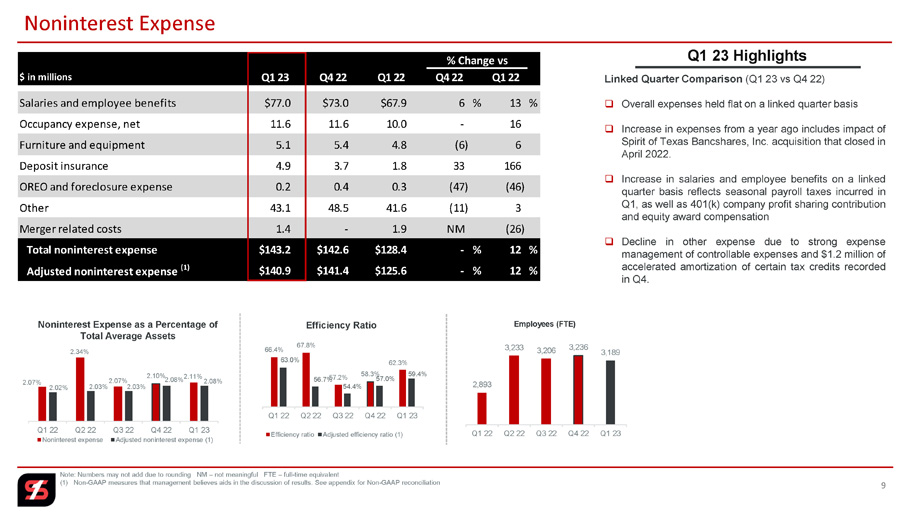
$ in millions Q1 23 Q4 22 Q1 22 Q4 22 Q1 22 Salaries and employee benefits $77.0 $73.0 $67.9 6 % 13 % Occupancy expense, net 11.6 11.6 10.0 - 16 Furniture and equipment 5.1 5.4 4.8 (6) 6 Deposit insurance 4.9 3.7 1.8 33 166 OREO and foreclosure expense 0.2 0.4 0.3 (47) (46) Other 43.1 48.5 41.6 (11) 3 Merger related costs 1.4 - 1.9 NM (26) Total noninterest expense $143.2 $142.6 $128.4 - % 12 % Adjusted noninterest expense (1) $140.9 $141.4 $125.6 - % 12 % % Change vs 2,893 3,233 3,206 3,236 3,189 Q1 22 Q2 22 Q3 22 Q4 22 Q1 23 Employees (FTE) 66.4% 67.8% 57.2% 58.3% 62.3% 63.0% 56.7% 54.4% 57.0% 59.4% Q1 22 Q2 22 Q3 22 Q4 22 Q1 23 Efficiency ratio Adjusted efficiency ratio (1) Efficiency Ratio 2.07% 2.34% 2.07% 2.10% 2.11% 2.02% 2.03% 2.03% 2.08% 2.08% Q1 22 Q2 22 Q3 22 Q4 22 Q1 23 Noninterest expense Adjusted noninterest expense (1) Noninterest Expense as a Percentage of Total Average Assets 9 Noninterest Expense Note: Numbers may not add due to rounding NM – not meaningful FTE – full - time equivalent (1) Non - GAAP measures that management believes aids in the discussion of results. See appendix for Non - GAAP reconciliation Q1 23 Highlights Linked Quarter Comparison (Q 1 23 vs Q 4 22 ) □ Overall expenses held flat on a linked quarter basis □ Increase in expenses from a year ago includes impact of Spirit of Texas Bancshares, Inc . acquisition that closed in April 2022 . □ Increase in salaries and employee benefits on a linked quarter basis reflects seasonal payroll taxes incurred in Q 1 , as well as 401 (k) company profit sharing contribution and equity award compensation □ Decline in other expense due to strong expense management of controllable expenses and $ 1 . 2 million of accelerated amortization of certain tax credits recorded in Q 4 .
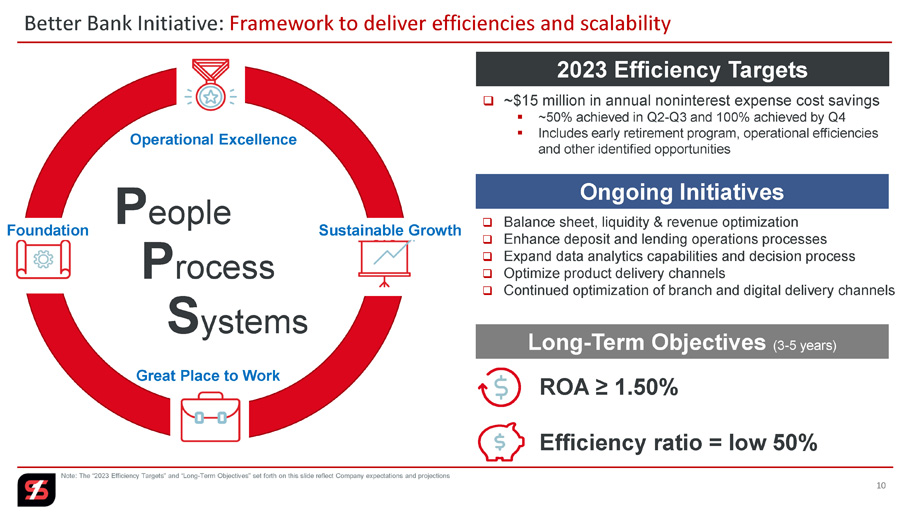
Note: The “2023 Efficiency Targets” and “Long - Term Objectives” set forth on this slide reflect Company expectations and projecti ons Better Bank Initiative: Framework to deliver efficiencies and scalability Operational Excellence Great Place to Work Foundation Sustainable Growth P eople P rocess S ystems Long - Term Objectives (3 - 5 years) ROA ≥ 1.50% Efficiency ratio = low 50% 10 2023 Efficiency Targets □ ~$15 million in annual noninterest expense cost savings ▪ ~50% achieved in Q2 - Q3 and 100% achieved by Q4 ▪ Includes early retirement program, operational efficiencies and other identified opportunities Ongoing Initiatives □ Balance sheet, liquidity & revenue optimization □ Enhance deposit and lending operations processes □ Expand data analytics capabilities and decision process □ Optimize product delivery channels □ Continued optimization of branch and digital delivery channels

Deposits, Securities, Liquidity, Interest Rate Sensitivity and Capital

$5,268 at 3.31.23 12 Deposits: Granular and well - diversified relationship - driven deposit base Peer Group includes: ABCB, AUB, OZK, BOKF, CADE, CBSH, CFR, FBK, HWC, HWC, HOMB, IBTX, ONB, PNFP, PB, RNST, SSB, SNV, TRMK, U MBF and UCBI (1) Data as of 12/31/22 Call Report per S&P Global Market Intelligence. Core deposits defined as total deposits excluding t ime deposits over $250,000 and brokered deposits of $250,000 or less (2) Represents consumer and commercial accounts, excluding public funds and brokered deposits. Accounts from acquisitions u til ize date account opened or, if not available, the closing date of the acquisition (3) Uninsured deposits represent deposit accounts that exceed FDIC insurance limit, excluding public fund accounts and othe r d eposit accounts that are collateralized, accounts that utilize CDARS or repo sweep programs and deposit balances of SFNC subs idi aries $81,459 $130,081 $360,778 Peer 1 Peer 2 SFNC Peer 3 Peer 4 Peer 5 Peer 6 Peer 7 Peer 8 Peer 9 Peer 10 Peer 11 Median Peer 12 Peer 13 Peer 14 Peer 15 Peer 16 Peer 17 Peer 18 Peer 19 Peer 20 Peer 21 $ in thousands Core Deposits per Branch 1 □ More than 628,000 deposit accounts □ Excluding brokered deposits and public funds, average deposit size $25,000 ▪ $16,500 for consumer accounts ▪ $90,000 for business/commercial accounts □ Deposit accounts represent long - term relationships 2 ▪ 12+ years average duration of client relationship for a noninterest bearing checking account ▪ 17+ years average duration of client relationship for an interest bearing checking account ▪ 14+ years average duration of client relationship for a savings/money market account □ Top 20 largest deposit relationships (including public funds) represent only 8% of total deposits Deposit Portfolio Highlights (as of March 31, 2023) Simmons Bank Uninsured Deposits 3 $ in millions $5,897 Intercompany Eliminations $629 □ ~23% of uninsured deposits to total deposits □ 2.0x coverage ratio of uninsured deposits to additional liquidity sources (listed on slide 16)
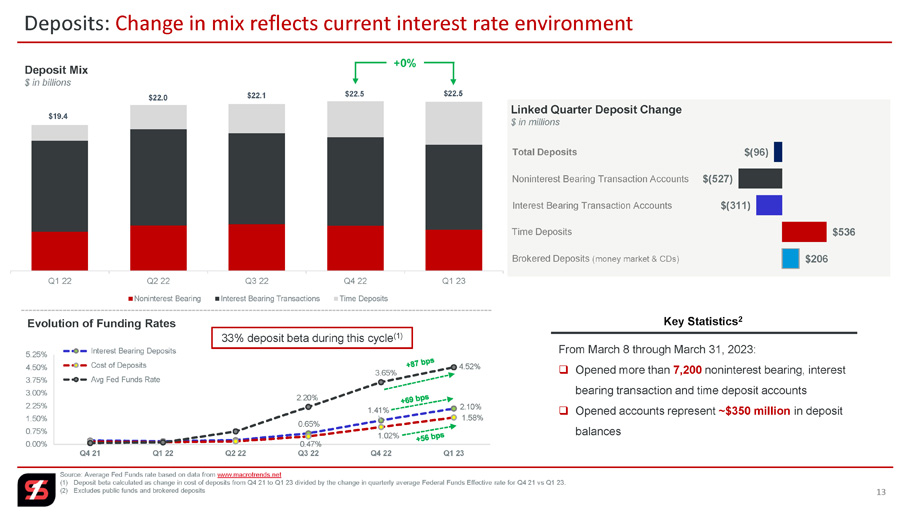
0.65% 1.41% 2.10% 0.47% 1.02% 1.58% 2.20% 3.65% 4.52% 0.00% 0.75% 1.50% 2.25% 3.00% 3.75% 4.50% 5.25% Q4 21 Q1 22 Q2 22 Q3 22 Q4 22 Q1 23 Interest Bearing Deposits Cost of Deposits Avg Fed Funds Rate Q1 22 Q2 22 Q3 22 Q4 22 Q1 23 Noninterest Bearing Interest Bearing Transactions Time Deposits 13 Deposits: Change in mix reflects current interest rate environment Source: Average Fed Funds rate based on data from www.macrotrends.net (1) Deposit beta calculated as change in cost of deposits from Q4 21 to Q1 23 divided by the change in quarterly average Fe der al Funds Effective rate for Q4 21 vs Q1 23. (2) Excludes public funds and brokered deposits $19.4 Evolution of Funding Rates $22.0 $22.1 +0% $206 $536 $(311) $(527) $(96) Linked Quarter Deposit Change $ in millions Total Deposits Noninterest Bearing Transaction Accounts Interest Bearing Transaction Accounts Time Deposits Deposit Mix $ in billions $22.5 Brokered Deposits (money market & CDs) 33% deposit beta during this cycle (1) $22.5 From March 8 through March 31, 2023: □ Opened more than 7,200 noninterest bearing, interest bearing transaction and time deposit accounts □ Opened accounts represent ~$350 million in deposit balances Key Statistics 2
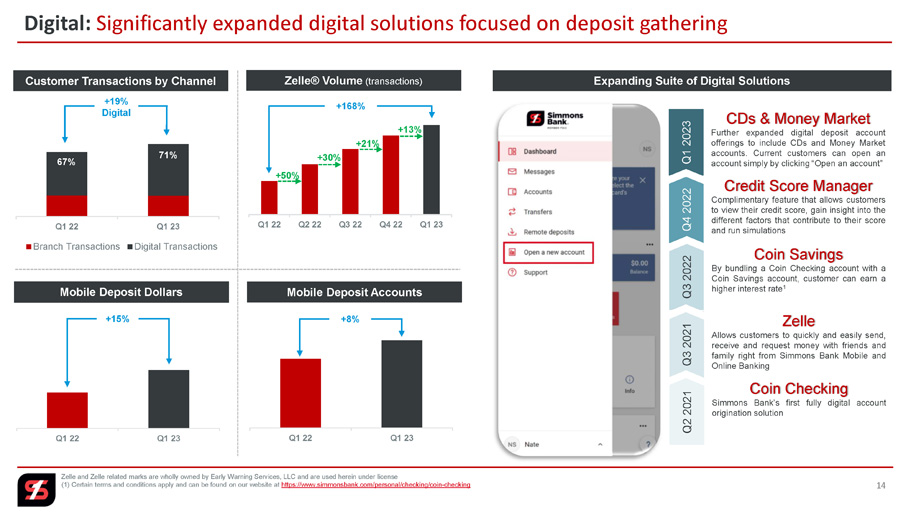
Digital: Significantly expanded digital solutions focused on deposit gathering Zelle and Zelle related marks are wholly owned by Early Warning Services, LLC and are used herein under license (1) Certain terms and conditions apply and can be found on our website at https://www.simmonsbank.com/personal/checking/coin - checking 14 Q1 22 Q2 22 Q3 22 Q4 22 Q1 23 Zelle ® Volume (transactions) +50% +30% +21% +168% Q1 22 Q1 23 Mobile Deposit Accounts +8% Q1 22 Q1 23 Mobile Deposit Dollars +15% Q1 22 Q1 23 Branch Transactions Digital Transactions Customer Transactions by Channel 67% 70% 71% +19% Digital Expanding Suite of Digital Solutions +13% Q2 2021 Coin Checking Simmons Bank’s first fully digital account origination solution Zelle Allows customers to quickly and easily send, receive and request money with friends and family right from Simmons Bank Mobile and Online Banking Q3 2021 Q3 2022 Coin Savings By bundling a Coin Checking account with a Coin Savings account, customer can earn a higher interest rate 1 Q4 2022 Credit Score Manager Complimentary feature that allows customers to view their credit score, gain insight into the different factors that contribute to their score and run simulations Q1 2023 CDs & Money Market Further expanded digital deposit account offerings to include CDs and Money Market accounts . Current customers can open an account simply by clicking “Open an account”
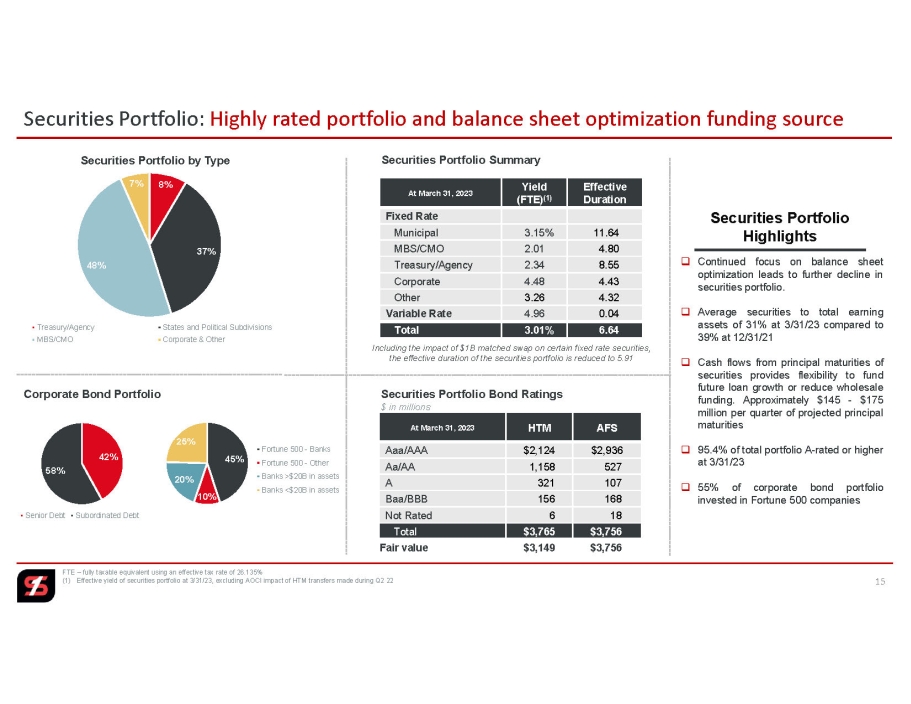
Securities Portfolio: Highly rated portfolio and balance sheet optimization funding source FTE – fully taxable equivalent using an effective tax rate of 26.135% (1) Effective yield of securities portfolio at 3/31/23, excluding AOCI impact of HTM transfers made during Q2 22 15 8% 37% 48% 7% Securities Portfolio by Type Treasury/Agency States and Political Subdivisions MBS/CMO Corporate & Other AFS HTM At March 31, 2023 $2,940 $2,124 Aaa /AAA 527 1,158 Aa/AA 107 321 A 168 156 Baa/BBB 14 6 Not Rated $3,756 $ 3 , 765 Total $3,756 $ 3 , 149 Fair value Securities Portfolio Bond Ratings $ in millions 42% 58% Senior Debt Subordinated Debt Corporate Bond Portfolio Effective Duration Yield (FTE) (1) At March 31, 2023 Fixed Rate 11.64 3.15% Municipal 4.80 2.01 MBS/CMO 8.55 2.34 Treasury/Agency 4.43 4.48 Corporate 4.32 3.26 Other 0.04 4.96 Variable Rate 6.64 3.01% Total Securities Portfolio Summary Including the impact of $1B matched swap on certain fixed rate securities, the effective duration of the securities portfolio is reduced to 5.91 Securities Portfolio Highlights □ Continued focus on balance sheet optimization leads to further decline in securities portfolio . □ Average securities to total earning assets of 31 % at 3 / 31 / 23 compared to 39 % at 12 / 31 / 21 □ Cash flows from principal maturities of securities provides flexibility to fund future loan growth or reduce wholesale funding . Approximately $ 145 - $ 175 million per quarter of projected principal maturities □ 95 . 4 % of total portfolio A - rated or higher at 3 / 31 / 23 □ 55 % of corporate bond portfolio invested in Fortune 500 companies 45% 10% 20% 25% Fortune 500 - Banks Fortune 500 - Other Banks >$20B in assets Banks <$20B in assets
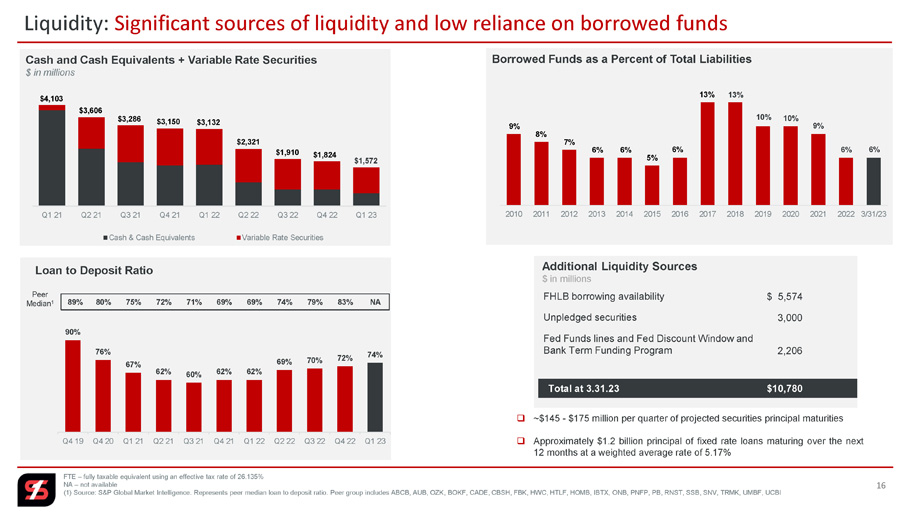
Loan to Deposit Ratio 90% 76% 67% 62% 60% 62% 62% 69% 70% 72% 74% Q4 19 Q4 20 Q1 21 Q2 21 Q3 21 Q4 21 Q1 22 Q2 22 Q3 22 Q4 22 Q1 23 Peer Median 1 89% 80% 75% 72% 71% 69% 69% 74% 79% 83% NA FHLB borrowing availability Unpledged securities Fed Funds lines and Fed Discount Window and Bank Term Funding Program Additional Liquidity Sources $ in millions Total at 3.31.23 $10,780 16 Liquidity: Significant sources of liquidity and low reliance on borrowed funds Cash and Cash Equivalents + Variable Rate Securities $ in millions Q1 21 Q2 21 Q3 21 Q4 21 Q1 22 Q2 22 Q3 22 Q4 22 Q1 23 Cash & Cash Equivalents Variable Rate Securities $4,103 $3,606 $3,286 $3,150 $3,132 $2,321 $1,910 $1,824 FTE – fully taxable equivalent using an effective tax rate of 26.135% NA – not available (1) Source: S&P Global Market Intelligence. Represents peer median loan to deposit ratio. Peer group includes ABCB, AUB, OZK, BO KF, CADE, CBSH, FBK, HWC, HTLF, HOMB, IBTX, ONB, PNFP, PB, RNST, SSB, SNV, TRMK, UMBF, UCBI Borrowed Funds as a Percent of Total Liabilities 2010 2011 2012 2013 2014 2015 2016 2017 2018 2019 2020 2021 2022 3/31/23 9% 8% 7% 6% 6% 5% 6% 13% 13% 10% 10% 9% 6% 6% $1,572 $ 5,574 3,000 2,206 □ ~ $ 145 - $ 175 million per quarter of projected securities principal maturities □ Approximately $ 1 . 2 billion principal of fixed rate loans maturing over the next 12 months at a weighted average rate of 5 . 17 %
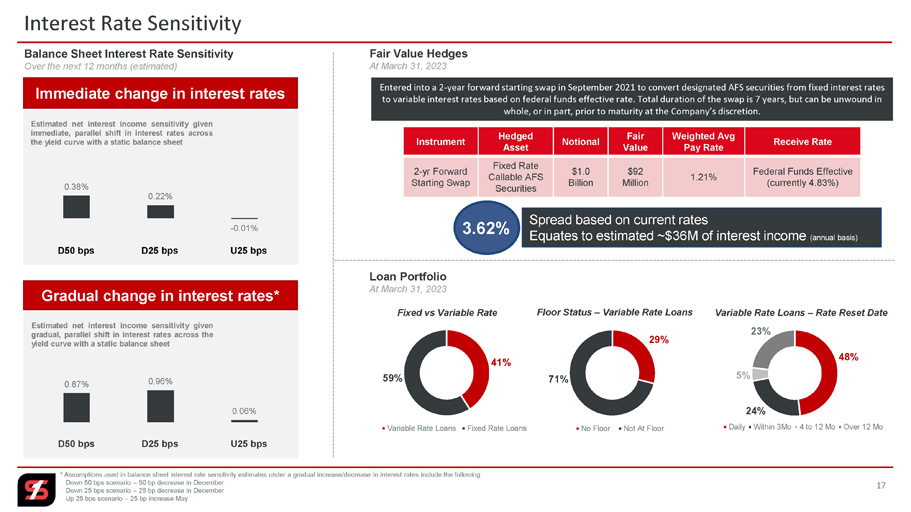
17 Interest Rate Sensitivity Balance Sheet Interest Rate Sensitivity Over the next 12 months (estimated) 0.38% 0.22% - 0.01% D50 bps D25 bps U25 bps Estimated net interest income sensitivity given immediate, parallel shift in interest rates across the yield curve with a static balance sheet Immediate change in interest rates Loan Portfolio At March 31, 2023 41% 59% Variable Rate Loans Fixed Rate Loans Fixed vs Variable Rate 29% 71% No Floor Not At Floor Floor Status – Variable Rate Loans 48% 24% 5% 23% Daily Within 3Mo 4 to 12 Mo Over 12 Mo Variable Rate Loans – Rate Reset Date 0.87% 0.96% 0.06% Gradual change in interest rates* Estimated net interest income sensitivity given gradual, parallel shift in interest rates across the yield curve with a static balance sheet Fair Value Hedges At March 31, 2023 * Assumptions used in balance sheet interest rate sensitivity estimates under a gradual increase/decrease in interest rates i ncl ude the following: Down 50 bps scenario – 50 bp decrease in December Down 25 bps scenario – 25 bp decrease in December Up 25 bps scenario – 25 bp increase May Entered into a 2 - year forward starting swap in September 2021 to convert designated AFS securities from fixed interest rates to variable interest rates based on federal funds effective rate. Total duration of the swap is 7 years, but can be unwound i n whole, or in part, prior to maturity at the Company’s discretion. Receive Rate Weighted Avg Pay Rate Fair Value Notional Hedged Asset Instrument Federal Funds Effective (currently 4.83%) 1.21% $92 Million $1.0 Billion Fixed Rate Callable AFS Securities 2 - yr Forward Starting Swap Spread based on current rates Equates to estimated ~$36M of interest income (annual basis) 3.62% D50 bps D25 bps U25 bps
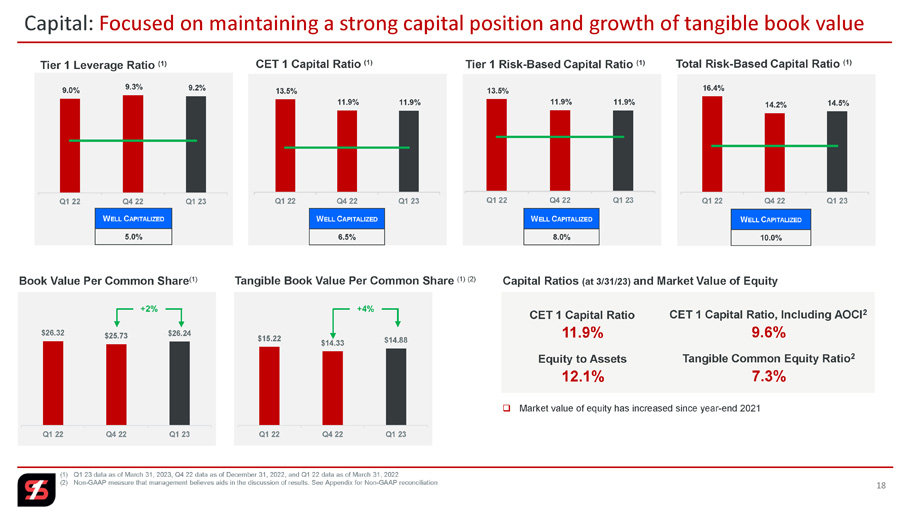
18 Capital: Focused on maintaining a strong capital position and growth of tangible book value (1) Q1 23 data as of March 31, 2023, Q4 22 data as of December 31, 2022, and Q1 22 data as of March 31, 2022 (2) Non - GAAP measure that management believes aids in the discussion of results. See Appendix for Non - GAAP reconciliation 9.0% 9.3% 9.2% Q1 22 Q4 22 Q1 23 W ELL C APITALIZED 5.0% Tier 1 Leverage Ratio (1) 13.5% 11.9% 11.9% Q1 22 Q4 22 Q1 23 CET 1 Capital Ratio (1) W ELL C APITALIZED 6.5% 13.5% 11.9% 11.9% Q1 22 Q4 22 Q1 23 Tier 1 Risk - Based Capital Ratio (1) 16.4% 14.2% 14.5% Q1 22 Q4 22 Q1 23 Total Risk - Based Capital Ratio (1) W ELL C APITALIZED 10.0% W ELL C APITALIZED 8.0% $26.32 $25.73 $26.24 Q1 22 Q4 22 Q1 23 Book Value Per Common Share (1) +2% $15.22 $14.33 $14.88 Q1 22 Q4 22 Q1 23 +4% Tangible Book Value Per Common Share (1) (2) Capital Ratios (at 3/31/23) and Market Value of Equity CET 1 Capital Ratio 11.9% CET 1 Capital Ratio, Including AOCI 2 9.6% Equity to Assets 12.1% Tangible Common Equity Ratio 2 7.3% □ Market value of equity has increased since year - end 2021

Loan Portfolio
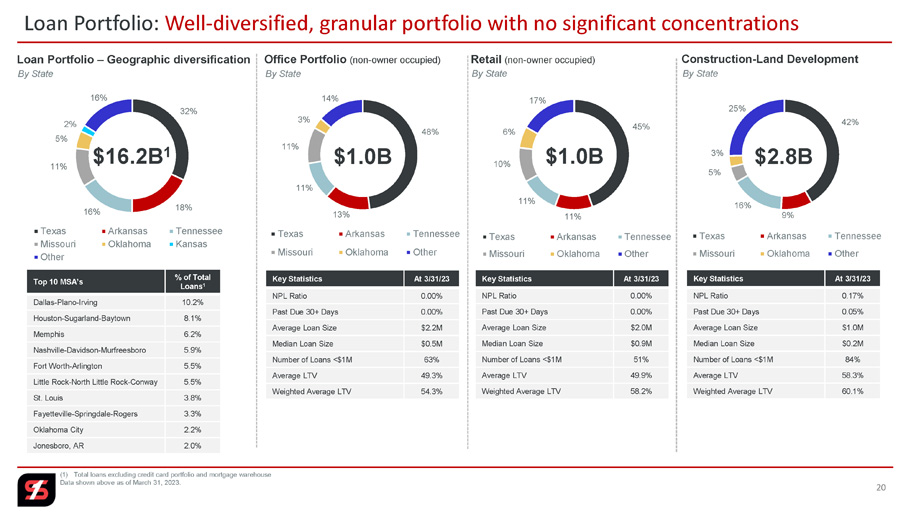
20 Loan Portfolio: Well - diversified, granular portfolio with no significant concentrations (1) Total loans excluding credit card portfolio and mortgage warehouse Data shown above as of March 31, 2023. By State Loan Portfolio – Geographic diversification 32% 18% 16% 11% 5% 2% 16% Texas Arkansas Tennessee Missouri Oklahoma Kansas Other % of Total Loans 1 Top 10 MSA’s 10.2% Dallas - Plano - Irving 8.1% Houston - Sugarland - Baytown 6.2% Memphis 5.9% Nashville - Davidson - Murfreesboro 5.5% Fort Worth - Arlington 5.5% Little Rock - North Little Rock - Conway 3.8% St. Louis 3.3% Fayetteville - Springdale - Rogers 2.2% Oklahoma City 2.0% Jonesboro, AR Office Portfolio (non - owner occupied) 48% 13% 11% 11% 3% 14% Texas Arkansas Tennessee Missouri Oklahoma Other By State At 3/31/23 Key Statistics 0.00% NPL Ratio 0.00% Past Due 30+ Days $2.2M Average Loan Size $0.5M Median Loan Size 63% Number of Loans <$1M 49.3% Average LTV 54.3% Weighted Average LTV Retail (non - owner occupied) 45% 11% 11% 10% 6% 17% Texas Arkansas Tennessee Missouri Oklahoma Other By State At 3/31/23 Key Statistics 0.00% NPL Ratio 0.00% Past Due 30+ Days $2.0M Average Loan Size $0.9M Median Loan Size 51% Number of Loans <$1M 49.9% Average LTV 58.2% Weighted Average LTV Construction - Land Development 42% 9% 16% 5% 3% 25% Texas Arkansas Tennessee Missouri Oklahoma Other By State At 3/31/23 Key Statistics 0.17% NPL Ratio 0.05% Past Due 30+ Days $1.0M Average Loan Size $0.2M Median Loan Size 84% Number of Loans <$1M 58.3% Average LTV 60.1% Weighted Average LTV $1.0B $1.0B $2.8B $16.2B 1
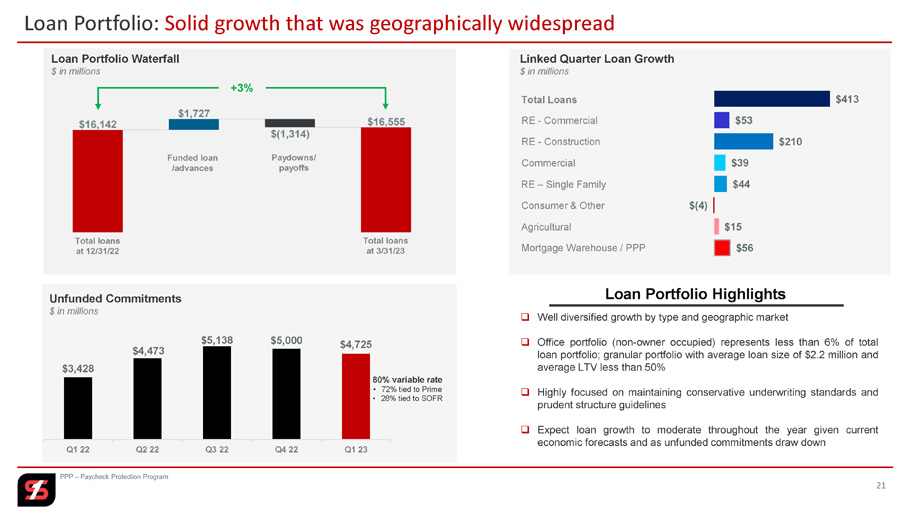
$3,428 $4,473 $5,138 $5,000 $4,725 Q1 22 Q2 22 Q3 22 Q4 22 Q1 23 Unfunded Commitments $ in millions Mortgage Warehouse / PPP Agricultural 21 Loan Portfolio: Solid growth that was geographically widespread PPP – Paycheck Protection Program Total loans at 3/31/23 Total loans at 12/31/22 $56 $15 $(4) $44 $39 $210 $53 $413 Linked Quarter Loan Growth $ in millions Total Loans RE - Commercial RE - Construction Commercial RE – Single Family Loan Portfolio Waterfall $ in millions Consumer & Other Funded loan /advances Paydowns/ payoffs +3% 80% variable rate • 72% tied to Prime • 28% tied to SOFR Loan Portfolio Highlights □ Well diversified growth by type and geographic market □ Office portfolio (non - owner occupied) represents less than 6 % of total loan portfolio ; granular portfolio with average loan size of $ 2 . 2 million and average LTV less than 50 % □ Highly focused on maintaining conservative underwriting standards and prudent structure guidelines □ Expect loan growth to moderate throughout the year given current economic forecasts and as unfunded commitments draw down

+47 bps $503 $766 $750 $824 $455 $392 $292 $484 $929 $838 $1,077 $542 $460 $252 $493 $619 $776 $1,114 $552 $270 $504 Q3 21 Q4 21 Q1 22 Q2 22 Q3 22 Q4 22 Q1 23 Opportunity Proposal Ready to Close $2,314 $2,364 $3,015 $1,480 $1,549 $1,122 22 Loan Pipelines: Reflect conservative credit underwriting standards and economic conditions Rate Ready to Close 3.47% 3.28% 3.43% 4.45% 5.84% 6.85% 7.32% Commercial Loan Pipeline by Category $ in millions $242 $291 $219 $223 $183 $127 $106 $97 $108 $99 $58 $36 $21 $36 Q3 21 Q4 21 Q1 22 Q2 22 Q3 22 Q4 22 Q1 23 Mortgage Closed Loan Volume Mortgage Pipeline Volume Mortgage Loan Volume $ in millions $1,048 Q1 23 Highlights □ Focused on maintaining prudent underwriting standards and pricing discipline given projections surrounding near - term future economic growth □ Increase in ready to close pipeline reflects pull through of previously identified proposal and opportunity pipelines □ Proposal and opportunity pipelines reflects current economic environment and disciplined credit appetite □ Rate ready to close + 47 bps on a linked quarter basis □ Mortgage loan originations in Q 1 23 ▪ 82 % purchase ▪ 18 % refinance

Credit Quality
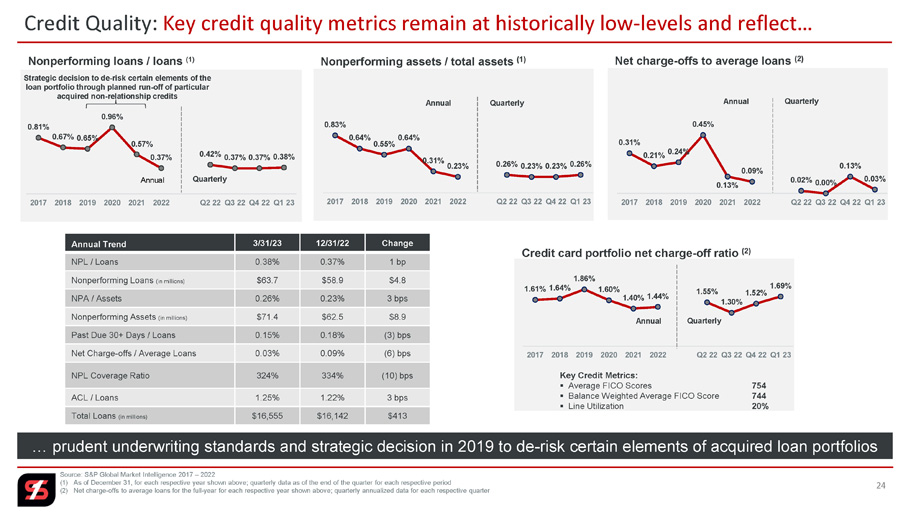
24 Credit Quality: Key credit quality metrics remain at historically low - levels and reflect… Source: S&P Global Market Intelligence 2017 – 2022 (1) As of December 31, for each respective year shown above; quarterly data as of the end of the quarter for each respectiv e p eriod (2) Net charge - offs to average loans for the full - year for each respective year shown above; quarterly annualized data for eac h respective quarter Change 12/31/22 3/31/23 Annual Trend 1 bp 0.37% 0.38% NPL / Loans $4.8 $58.9 $63.7 Nonperforming Loans (in millions) 3 bps 0.23% 0.26% NPA / Assets $8.9 $62.5 $71.4 Nonperforming Assets (in millions) (3) bps 0.18% 0.15% Past Due 30+ Days / Loans (6) bps 0.09% 0.03% Net Charge - offs / Average Loans (10) bps 334% 324% NPL Coverage Ratio 3 bps 1.22% 1.25% ACL / Loans $413 $16,142 $16,555 Total Loans (in millions) … prudent underwriting standards and strategic decision in 2019 to de - risk certain elements of acquired loan portfolios 0.81% 0.67% 0.65% 0.96% 0.57% 0.37% 0.42% 0.37% 0.37% 0.38% 2017 2018 2019 2020 2021 2022 Q2 22 Q3 22 Q4 22 Q1 23 Annual Nonperforming loans / loans (1) Strategic decision to de - risk certain elements of the loan portfolio through planned run - off of particular acquired non - relationship credits Quarterly Nonperforming assets / total assets (1) 0.83% 0.64% 0.55% 0.64% 0.31% 0.23% 0.26% 0.23% 0.23% 0.26% 2017 2018 2019 2020 2021 2022 Q2 22 Q3 22 Q4 22 Q1 23 Annual Quarterly Net charge - offs to average loans (2) 0.31% 0.21% 0.24% 0.45% 0.13% 0.09% 0.02% 0.00% 0.13% 0.03% 2017 2018 2019 2020 2021 2022 Q2 22 Q3 22 Q4 22 Q1 23 Annual Quarterly K ey Credit Metrics : ▪ Average FICO Scores 754 ▪ Balance Weighted Average FICO Score 744 ▪ Line Utilization 20% 1.61% 1.64% 1.86% 1.60% 1.40% 1.44% 1.55% 1.30% 1.52% 1.69% 2017 2018 2019 2020 2021 2022 Q2 22 Q3 22 Q4 22 Q1 23 Credit card portfolio net charge - off ratio (2) Annual Quarterly
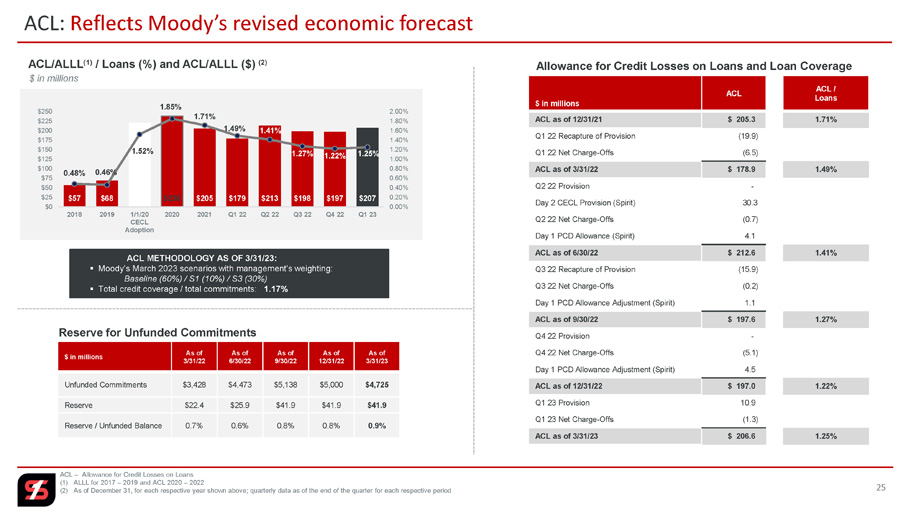
25 ACL: Reflects Moody’s revised economic forecast ACL – Allowance for Credit Losses on Loans (1) ALLL for 2017 – 2019 and ACL 2020 – 2022 (2) As of December 31, for each respective year shown above; quarterly data as of the end of the quarter for each respectiv e p eriod ACL / Loans ACL $ in millions 1.71% $ 205.3 ACL as of 12/31/21 (19.9) Q1 22 Recapture of Provision (6.5) Q1 22 Net Charge - Offs 1.49% $ 178.9 ACL as of 3/31/22 - Q2 22 Provision 30.3 Day 2 CECL Provision (Spirit) (0.7) Q2 22 Net Charge - Offs 4.1 Day 1 PCD Allowance (Spirit) 1.41% $ 212.6 ACL as of 6/30/22 (15.9) Q3 22 Recapture of Provision (0.2) Q3 22 Net Charge - Offs 1.1 Day 1 PCD Allowance Adjustment (Spirit) 1.27% $ 197.6 ACL as of 9/30/22 - Q4 22 Provision (5.1) Q4 22 Net Charge - Offs 4.5 Day 1 PCD Allowance Adjustment (Spirit) 1.22% $ 197.0 ACL as of 12/31/22 10.9 Q1 23 Provision (1.3) Q1 23 Net Charge - Offs 1.25% $ 206.6 ACL as of 3/31/23 Allowance for Credit Losses on Loans and Loan Coverage Reserve for Unfunded Commitments As of 3/31/23 As of 12/31/22 As of 9/30/22 As of 6/30/22 As of 3/31/22 $ in millions $4,725 $5,000 $5,138 $4,473 $3,428 Unfunded Commitments $41.9 $41.9 $41.9 $25.9 $22.4 Reserve 0.9% 0.8% 0.8% 0.6% 0.7% Reserve / Unfunded Balance ACL METHODOLOGY AS OF 3/31/23: ▪ Moody’s March 2023 scenarios with management’s weighting: Baseline (60%) / S1 (10%) / S3 (30%) ▪ Total credit coverage / total commitments: 1.17% ACL/ALLL (1) / Loans (%) and ACL/ALLL ($) (2) $ in millions $57 $68 $220 $238 $205 $179 $213 $198 $197 $207 0.48% 0.46% 1.52% 1.85% 1.71% 1.49% 1.41% 1.27% 1.22% 1.25% 0.00% 0.20% 0.40% 0.60% 0.80% 1.00% 1.20% 1.40% 1.60% 1.80% 2.00% $0 $25 $50 $75 $100 $125 $150 $175 $200 $225 $250 2018 2019 1/1/20 CECL Adoption 2020 2021 Q1 22 Q2 22 Q3 22 Q4 22 Q1 23

Key Takeaways
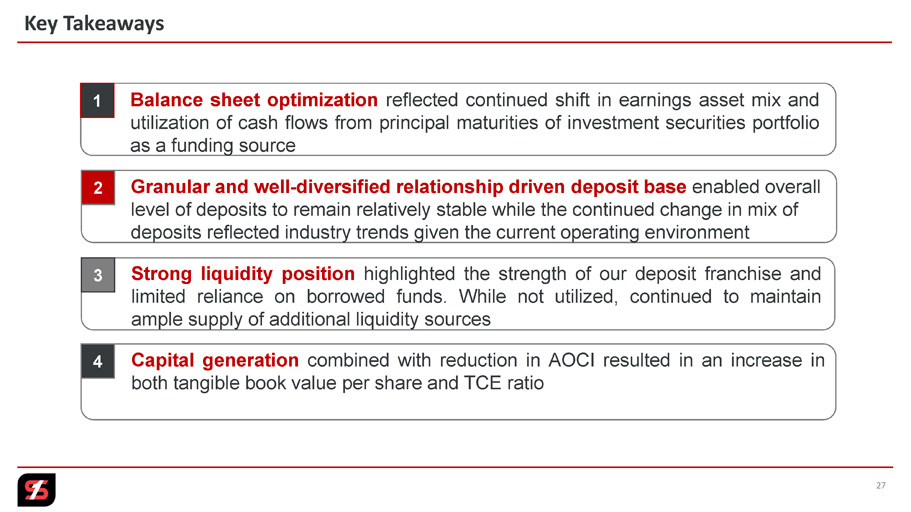
27 Key Takeaways 1 Balance sheet optimization reflected continued shift in earnings asset mix and utilization of cash flows from principal maturities of investment securities portfolio as a funding source 2 Capital generation combined with reduction in AOCI resulted in an increase in both tangible book value per share and TCE ratio 3 Strong liquidity position highlighted the strength of our deposit franchise and limited reliance on borrowed funds . While not utilized, continued to maintain ample supply of additional liquidity sources 4 Granular and well - diversified relationship driven deposit base enabled overall level of deposits to remain relatively stable while the continued change in mix of deposits reflected industry trends given the current operating environment

Appendix

29 Breakout: Loan portfolio by Category as of March 31, 2023 as of December 31, 2022 Unfunded Commitment Reserve Unfunded Commitment $ ACL % Nonperforming $ Classified $ % of Total Loans Balance $ % of Total Loans Balance $ $ in millions Total Loan Portfolio - - 3.5% 1 1 1% 189 1% 197 Consumer - Credit Card 1.0% 28 2.2% - - 1% 143 1% 153 Consumer - Other 1.3% 2,682 1.1% 5 13 17% 2,777 16% 2,567 Real Estate - Construction 0.5% 280 1.2% 12 97 45% 7,521 46% 7,468 Real Estate - Commercial 0.4% 334 1.8% 24 29 16% 2,590 16% 2,546 Real Estate - Single - family 0.2% 1,223 1.1% 22 30 16% 2,661 16% 2,622 Commercial - - - - - - 8 - 9 PPP - - 0.2% - - 1% 152 1% 95 Mortgage Warehouse 0.3% 177 0.5% - - 1% 221 1% 206 Agriculture 0.2% 1 0.8% - - 2% 293 2% 279 Other 0.9% 4,725 1.25% 64 170 100% 16,555 100% 16,142 Total Loan Portfolio Loan Concentration (Holding Company Level) : 92% 87% C&D 263% 259% CRE Select Loan Categories (excluding PPP) 1.2% 201 1.2% 1 4 9% 1,465 9% 1,479 Retail 0.4% 1 0.4% - - 2% 338 2% 341 Nursing / Extended Care 0.6% 164 0.7% 1 11 3% 528 3% 501 Healthcare 1.0% 1,007 0.7% - 8 7% 1,130 6% 1,004 Multifamily 5.3% 36 2.6% 7 55 5% 793 5% 822 Hotel 0.8% 37 1.2% 1 2 3% 519 3% 505 Restaurant 4.1% 103 2.3% - 4 6% 962 6% 973 NOO Office 0.3% 5 1.1% 3 3 - 34 - 53 Energy
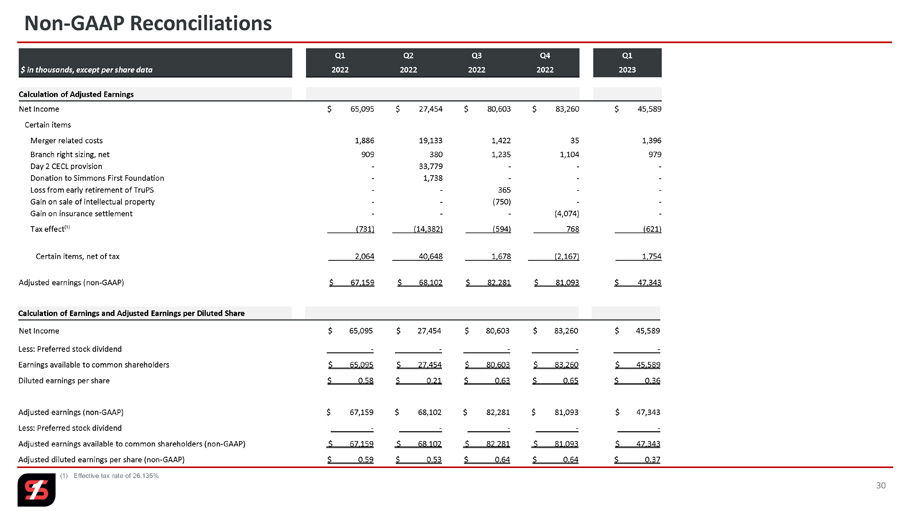
30 Non - GAAP Reconciliations Q1 Q4 Q3 Q2 Q1 2023 2022 2022 2022 2022 $ in thousands, except per share data Calculation of Adjusted Earnings $ 45,589 $ 83,260 $ 80,603 $ 27,454 $ 65,095 Net Income Certain items 1,396 35 1,422 19,133 1,886 Merger related costs 979 1,104 1,235 380 909 Branch right sizing, net - - - 33,779 - Day 2 CECL provision - - - 1,738 - Donation to Simmons First Foundation - - 365 - - Loss from early retirement of TruPS - - (750) - - Gain on sale of intellectual property - (4,074) - - - Gain on insurance settlement (621) _ 768 _ (594) _ (14,382) _ (731) Tax effect⁽¹⁾ 1,754 (2,167) 1,678 40,648 2,064 Certain items, net of tax $ 47,343 $ 81,093 $ 82,281 $ 68,102 $ 67,159 Adjusted earnings (non - GAAP) Calculation of Earnings and Adjusted Earnings per Diluted Share $ 45,589 $ 83,260 $ 80,603 $ 27,454 $ 65,095 Net Income _ - _ - _ - _ - _ - Less: Preferred stock dividend $ 45,589 $ 83,260 $ 80,603 $ 27,454 $ 65,095 Earnings available to common shareholders $ 0.36 $ 0.65 $ 0.63 $ 0.21 $ 0.58 Diluted earnings per share $ 47,343 $ 81,093 $ 82,281 $ 68,102 $ 67,159 Adjusted earnings (non - GAAP) - - - - - Less: Preferred stock dividend $ 47,343 $ 81,093 $ 82,281 $ 68,102 $ 67,159 Adjusted earnings available to common shareholders (non - GAAP) $ 0.37 $ 0.64 $ 0.64 $ 0.53 $ 0.59 Adjusted diluted earnings per share (non - GAAP) (1) Effective tax rate of 26.135%

Q1 Q4 Q3 Q2 Q1 2023 2022 2022 2022 2022 $ in thousands Calculation of Pre - Provision Net Revenue (PPNR) $ 177,835 $ 193,026 $ 193,585 $ 185,099 $ 145,606 Net interest income 45,835 44,647 43,023 40,178 42,218 Noninterest income - (52) (22) (150) (54) Less: Gain (loss) on sale of securities 143,228 142,575 138,943 156,813 128,417 Less: Noninterest expense $ 80,442 $ 95,150 $ 97,687 $ 68,614 $ 59,461 Pre - Provision Net Revenue (PPNR) (non - GAAP) Calculation of Adjusted Pre - Provision Net Revenue $ 80,442 $ 95,150 $ 97,687 $ 68,614 $ 59,461 Pre - Provision Net Revenue (PPNR) (non - GAAP) 1,396 35 1,422 19,133 1,886 Plus: Merger related costs 979 1,104 1,235 380 909 Plus: Branch right sizing costs, net - - 365 - - Plus: Loss from early retirement of TruPS - - - 1,738 - Plus: Donation to Simmons First Foundation - - (750) - - Less: Gain on sale of intellectual property - (4,074) - - - Less: Gain on insurance settlement $ 82,817 $ 92,215 $ 99,959 $ 89,865 $ 62,256 Adjusted Pre - Provision Net Revenue (non - GAAP) 31 Non - GAAP Reconciliations Calculation of Book Value and Tangible Book Value per Share $ 3,339,901 $ 3,269,362 $ 3,157,151 $ 3,259,895 $ 2,961,607 Total common stockholders' equity Intangible assets: (1,320,799) (1,319,598) (1,309,000) (1,310,528) (1,147,007) Goodwill (124,854) (128,951) (133,059) (137,285) (102,748) Other intangible assets (1,445,653) (1,448,549) (1,442,059) (1,447,813) (1,249,755) Total intangible assets $ 1,894,248 $ 1,820,813 $ 1,715,092 $ 1,812,082 $ 1,711,852 Tangible common stockholders' equity (non - GAAP) 127,282,192 127,046,654 126,943,467 128,787,764 112,505,555 Shares of common stock outstanding $ 26.24 $ 25.73 $ 24.87 $ 25.31 $ 26.32 Book value per common share $ 14.88 $ 14.33 $ 13.51 $ 14.07 $ 15.22 Tangible book value per common share (non - GAAP)
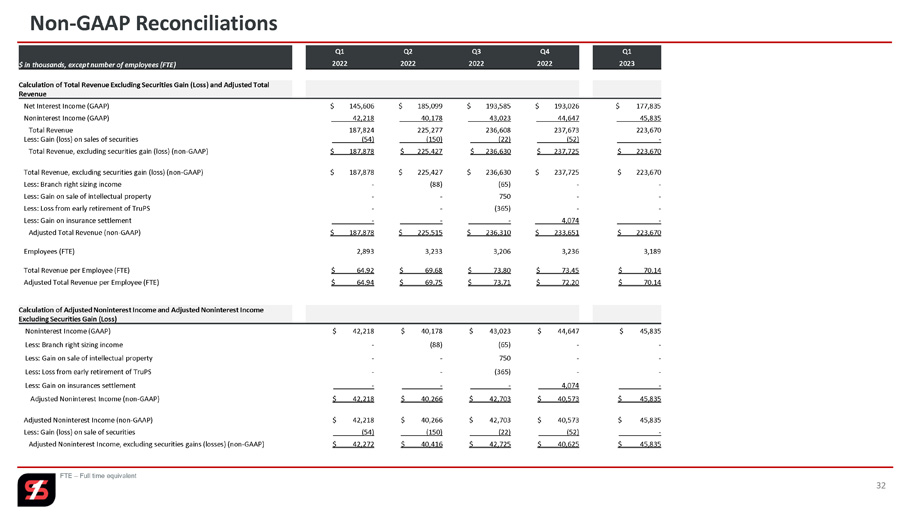
32 Non - GAAP Reconciliations Q1 Q4 Q3 Q2 Q1 2023 2022 2022 2022 2022 $ in thousands, except number of employees (FTE) Calculation of Total Revenue Excluding Securities Gain (Loss) and Adjusted Total Revenue $ 177,835 $ 193,026 $ 193,585 $ 185,099 $ 145,606 Net Interest Income (GAAP) 45,835 44,647 43,023 40,178 42,218 Noninterest Income (GAAP) 223,670 237,673 236,608 225,277 187,824 Total Revenue - (52) (22) (150) (54) Less: Gain (loss) on sales of securities $ 223,670 $ 237,725 $ 236,630 $ 225,427 $ 187,878 Total Revenue, excluding securities gain (loss) (non - GAAP) $ 223,670 $ 237,725 $ 236,630 $ 225,427 $ 187,878 Total Revenue, excluding securities gain (loss) (non - GAAP) - - (65) (88) - Less: Branch right sizing income - - 750 - - Less: Gain on sale of intellectual property - - (365) - - Less: Loss from early retirement of TruPS - 4,074 - - - Less: Gain on insurance settlement $ 223,670 $ 233,651 $ 236,310 $ 225,515 $ 187,878 Adjusted Total Revenue (non - GAAP) 3,189 3,236 3,206 3,233 2,893 Employees (FTE) $ 70.14 $ 73.45 $ 73.80 $ 69.68 $ 64.92 Total Revenue per Employee (FTE) $ 70.14 $ 72.20 $ 73.71 $ 69.75 $ 64.94 Adjusted Total Revenue per Employee (FTE) FTE – Full time equivalent Calculation of Adjusted Noninterest Income and Adjusted Noninterest Income Excluding Securities Gain (Loss) $ 45,835 $ 44,647 $ 43,023 $ 40,178 $ 42,218 Noninterest Income (GAAP) - - (65) (88) - Less: Branch right sizing income - - 750 - - Less: Gain on sale of intellectual property - - (365) - - Less: Loss from early retirement of TruPS - 4,074 - - ____ - Less: Gain on insurances settlement $ 45,835 $ 40,573 $ 42,703 $ 40,266 $ 42,218 Adjusted Noninterest Income (non - GAAP) $ 45,835 $ 40,573 $ 42,703 $ 40,266 $ 42,218 Adjusted Noninterest Income (non - GAAP) - (52) _ (22) _(150) _(54) Less: Gain (loss) on sale of securities $ 45,835 $ 40,625 $ 42,725 $ 40,416 $ 42,272 Adjusted Noninterest Income, excluding securities gains (losses) (non - GAAP)

33 Non - GAAP Reconciliations Calculation of Adjusted Noninterest Expense $ 143,228 $ 142,575 $ 138,943 $ 156,813 $ 128,417 Noninterest Expense (GAAP) 1,396 35 1,422 19,133 1,886 Less: Merger related costs 979 1,104 1,170 292 909 Less: Branch right sizing expense - - - 1,738 - Less: Donation to Simmons First Foundation $ 140,853 $ 141,436 $ 136,351 $ 135,650 $ 125,622 Adjusted Noninterest Expense (non - GAAP) Calculation of Noninterest Expense to Average Assets $ 27,488,732 $ 27,180,575 $ 26,868,731 $ 26,769,032 $ 24,826,199 Average total assets 2.11% 2.10% 2.07% 2.34% 2.07% Noninterest expense to average total assets 2.08% 2.08% 2.03% 2.03% 2.02% Adjusted noninterest expense to average assets (non - GAAP) FTE – Full time equivalent Q1 Q4 Q3 Q2 Q1 2023 2022 2022 2022 2022 $ in thousands Calculation of Noninterest Income to Total Revenue 20.49% 18.79% 18.18% 17.83% 22.48% Noninterest Income to Total Revenue 20.49% 17.39% 18.08% 17.92% 22.50% Adjusted Noninterest Income, excluding securities gain (loss) to Adjusted Total Revenue (non - GAAP) (reconciliation shown on page 33) $ 14.37 $ 13.80 $ 13.42 $ 12.43 $ 14.59 Noninterest Income per Employee $ 14.37 $ 12.55 $ 13.33 $ 12.50 $ 14.61 Adjusted Noninterest Income per Employee (FTE)
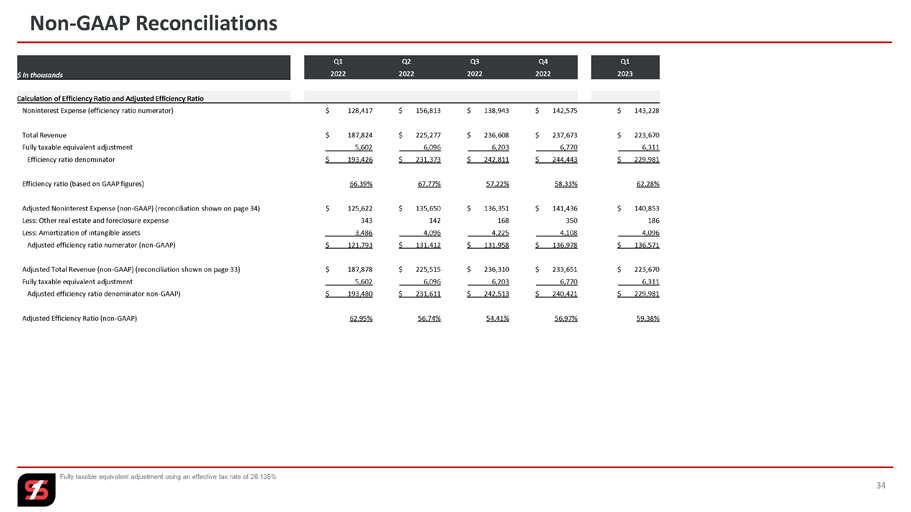
34 Non - GAAP Reconciliations Q1 Q4 Q3 Q2 Q1 2023 2022 2022 2022 2022 $ in thousands Calculation of Efficiency Ratio and Adjusted Efficiency Ratio $ 143,228 $ 142,575 $ 138,943 $ 156,813 $ 128,417 Noninterest Expense (efficiency ratio numerator) $ 223,670 $ 237,673 $ 236,608 $ 225,277 $ 187,824 Total Revenue ___ _ _6,311 ___ _ _6,770 ___ _ _6,203 ___ _ _6,096 ____ __ 5,602 Fully taxable equivalent adjustment $ 229,981 $ 244,443 $ 242,811 $ 231,373 $ 193,426 Efficiency ratio denominator 62.28% 58.33% 57.22% 67.77% 66.39% Efficiency ratio (based on GAAP figures) $ 140,853 $ 141,436 $ 136,351 $ 135,650 $ 125,622 Adjusted Noninterest Expense (non - GAAP) (reconciliation shown on page 34) 186 350 168 142 343 Less: Other real estate and foreclosure expense ___ __ 4,096 ___ __ 4,108 ___ __ 4,225 ___ _ _4,096 ____ __ _3,486 Less: Amortization of intangible assets $ 136,571 $ 136,978 $ 131,958 $ 131,412 $ 121,793 Adjusted efficiency ratio numerator (non - GAAP) $ 223,670 $ 233,651 $ 236,310 $ 225,515 $ 187,878 Adjusted Total Revenue (non - GAAP) (reconciliation shown on page 33) ___ _ _6,311 ___ _ _6,770 ___ _ _6,203 ___ _ _6,096 ____ __ 5,602 Fully taxable equivalent adjustment $ 229,981 $ 240,421 $ 242,513 $ 231,611 $ 193,480 Adjusted efficiency ratio denominator non - GAAP) 59.38% 56.97% 54.41% 56.74% 62.95% Adjusted Efficiency Ratio (non - GAAP) Fully taxable equivalent adjustment using an effective tax rate of 26.135%
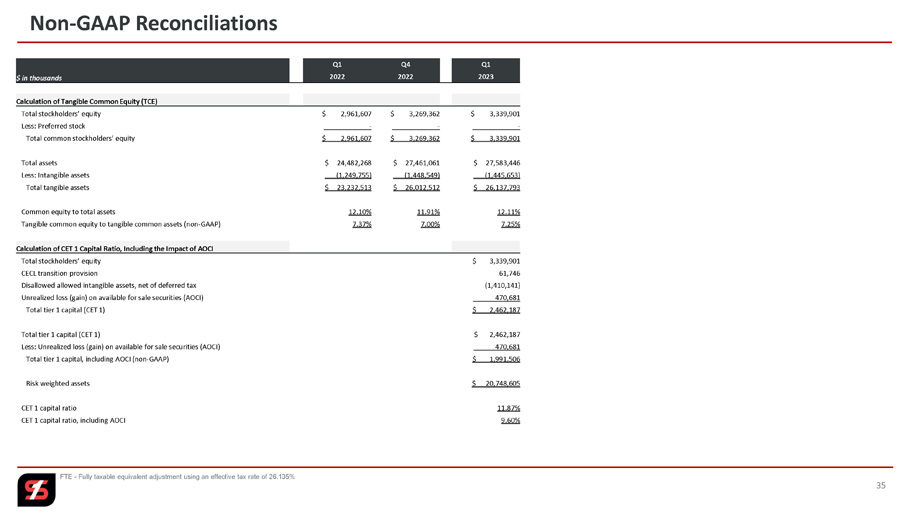
35 Non - GAAP Reconciliations FTE - Fully taxable equivalent adjustment using an effective tax rate of 26.135% Q1 Q4 Q1 2023 2022 2022 $ in thousands Calculation of Tangible Common Equity (TCE) $ 3,339,901 $ 3,269,362 $ 2,961,607 Total stockholders’ equity _______ _ - _______ _ - _______ _ - Less: Preferred stock $ 3,339,901 $ 3,269,362 $ 2,961,607 Total common stockholders’ equity $ 27,583,446 $ 27,461,061 $ 24,482,268 Total assets (1,445,653) (1,448,549) (1,249,755) Less: Intangible assets $ 26,137,793 $ 26,012,512 $ 23,232,513 Total tangible assets 12.11% 11.91% 12.10% Common equity to total assets 7.25% 7.00% 7.37% Tangible common equity to tangible common assets (non - GAAP) Calculation of CET 1 Capital Ratio, Including the Impact of AOCI $ 3,339,901 Total stockholders’ equity 61,746 CECL transition provision (1,410,141) Disallowed allowed intangible assets, net of deferred tax ____ _ 470,681 Unrealized loss (gain) on available for sale securities (AOCI) $ 2,462,187 Total tier 1 capital (CET 1) $ 2,462,187 Total tier 1 capital (CET 1) 470,681 Less: Unrealized loss (gain) on available for sale securities (AOCI) $ 1,991,506 Total tier 1 capital, including AOCI (non - GAAP) $ 20,748,605 Risk weighted assets 11.87% CET 1 capital ratio 9.60% CET 1 capital ratio, including AOCI
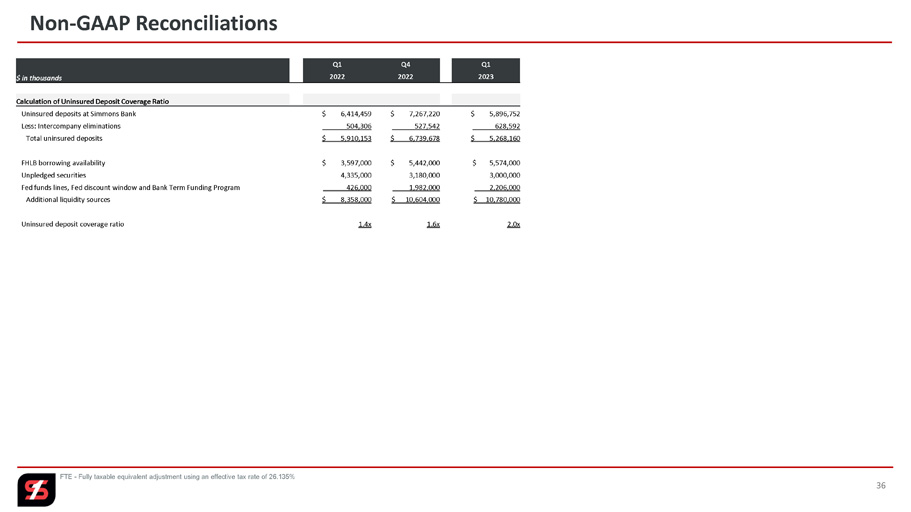
36 Non - GAAP Reconciliations FTE - Fully taxable equivalent adjustment using an effective tax rate of 26.135% Q1 Q4 Q1 2023 2022 2022 $ in thousands Calculation of Uninsured Deposit Coverage Ratio $ 5,896,752 $ 7,267,220 $ 6,414,459 Uninsured deposits at Simmons Bank ______628,592 ______527,542 ____ _504,306 Less: Intercompany eliminations $ 5,268,160 $ 6,739,678 $ 5,910,153 Total uninsured deposits $ 5,574,000 $ 5,442,000 $ 3,597,000 FHLB borrowing availability 3,000,000 3,180,000 4,335,000 Unpledged securities 2,206,000 1,982,000 426,000 Fed funds lines, Fed discount window and Bank Term Funding Program $ 10,780,000 $ 10,604,000 $ 8,358,000 Additional liquidity sources 2.0x 1.6x 1.4x Uninsured deposit coverage ratio

Nasdaq: SFNC 1 st Quarter 2023 Earnings Presentation Contents 3 Company Profile 4 Q1 Financial Highlights 11 Deposits, Securities, Liquidity, Interest Rate Sensitivity and Capital 19 Loans 23 Credit Quality 26 Key Takeaways 28 Appendix