Janus Aspen Flexible Bond Portfolio
Additional Information (unaudited)
· For Perkins Small Cap Value Fund, the Trustees noted that the Fund’s performance was in the bottom Broadridge quartile for the 36 months ended May 31, 2015 and the second Broadridge quartile for the 12 months ended May 31, 2015. The Trustees noted the reasons for the Fund’s underperformance, noting that the Fund has a performance fee structure that results in lower management fees during periods of underperformance, the steps Janus Capital and Perkins had taken or were taking to improve performance, and that the performance trend was improving.
· For Perkins Value Plus Income Fund, the Trustees noted that the Fund’s performance was in the second Broadridge quartile for the 36 months ended May 31, 2015 and the second Broadridge quartile for the 12 months ended May 31, 2015.
Mathematical Funds
· For INTECH Emerging Markets Managed Volatility Fund, the Trustees noted that, due to limited performance for the Fund, performance history was not a material factor.
· For INTECH Global Income Managed Volatility Fund, the Trustees noted that the Fund’s performance was in the first Broadridge quartile for the 36 months ended May 31, 2015 and the third Broadridge quartile for the 12 months ended May 31, 2015.
· For INTECH International Managed Volatility Fund, the Trustees noted that the Fund’s performance was in the bottom Broadridge quartile for the 36 months ended May 31, 2015 and the bottom Broadridge quartile for the 12 months ended May 31, 2015. The Trustees noted the reasons for the Fund’s underperformance and the steps Janus Capital and INTECH had taken or were taking to improve performance.
· For INTECH U.S. Core Fund, the Trustees noted that the Fund’s performance was in the second Broadridge quartile for the 36 months ended May 31, 2015 and the second Broadridge quartile for the 12 months ended May 31, 2015.
· For INTECH U.S. Managed Volatility Fund, the Trustees noted that the Fund’s performance was in the second Broadridge quartile for the 36 months ended May 31, 2015 and the third Broadridge quartile for the 12 months ended May 31, 2015.
Growth and Core Funds
· For Janus Balanced Fund, the Trustees noted that the Fund’s performance was in the first Broadridge quartile for the 36 months ended May 31, 2015 and the first Broadridge quartile for the 12 months ended May 31, 2015.
· For Janus Contrarian Fund, the Trustees noted that the Fund’s performance was in the first Broadridge quartile for the 36 months ended May 31, 2015 and the bottom Broadridge quartile for the 12 months ended May 31, 2015.
· For Janus Enterprise Fund, the Trustees noted that the Fund’s performance was in the second Broadridge quartile for the 36 months ended May 31, 2015 and the first Broadridge quartile for the 12 months ended May 31, 2015.
· For Janus Forty Fund, the Trustees noted that the Fund’s performance was in the second Broadridge quartile for the 36 months ended May 31, 2015 and the first Broadridge quartile for the 12 months ended May 31, 2015.
· For Janus Fund, the Trustees noted that the Fund’s performance was in the second Broadridge quartile for the 36 months ended May 31, 2015 and the first Broadridge quartile for the 12 months ended May 31, 2015.
· For Janus Growth and Income Fund, the Trustees noted that the Fund’s performance was in the third Broadridge quartile for the 36 months ended May 31, 2015 and in the third Broadridge quartile for the 12 months ended May 31, 2015. The Trustees noted the reasons for the Fund’s underperformance and the steps Janus Capital had taken or was taking to improve performance.
· For Janus Research Fund, the Trustees noted that the Fund’s performance was in the first Broadridge quartile for the 36 months ended May 31, 2015 and the first Broadridge quartile for the 12 months ended May 31, 2015.
Janus Aspen Flexible Bond Portfolio
Additional Information (unaudited)
· For Janus Triton Fund, the Trustees noted that the Fund’s performance was in the second Broadridge quartile for the 36 months ended May 31, 2015 and the first Broadridge quartile for the 12 months ended May 31, 2015.
· For Janus Twenty Fund, the Trustees noted that the Fund’s performance was in the third Broadridge quartile for the 36 months ended May 31, 2015 and the bottom Broadridge quartile for the 12 months ended May 31, 2015. The Trustees noted the reasons for the Fund’s underperformance, noting that the Fund has a performance fee structure that results in lower management fees during periods of underperformance, and the steps Janus Capital had taken or was taking to improve performance.
· For Janus Venture Fund, the Trustees noted that the Fund’s performance was in the first Broadridge quartile for the 36 months ended May 31, 2015 and the first Broadridge quartile for the 12 months ended May 31, 2015.
Global and International Funds
· For Janus Asia Equity Fund, the Trustees noted that the Fund’s performance was in the third Broadridge quartile for the 36 months ended May 31, 2015 and the first Broadridge quartile for the 12 months ended May 31, 2015. The Trustees noted the reasons for the Fund’s underperformance, noting that the Fund has a performance fee structure that results in lower management fees during periods of underperformance, the steps Janus Capital had taken or was taking to improve performance, and that the performance trend was improving.
· For Janus Emerging Markets Fund, the Trustees noted that the Fund’s performance was in the second Broadridge quartile for the 36 months ended May 31, 2015 and the first Broadridge quartile for the 12 months ended May 31, 2015.
· For Janus Global Life Sciences Fund, the Trustees noted that the Fund’s performance was in the first Broadridge quartile for the 36 months ended May 31, 2015 and the first Broadridge quartile for the 12 months ended May 31, 2015.
· For Janus Global Real Estate Fund, the Trustees noted that the Fund’s performance was in the first Broadridge quartile for the 36 months ended May 31, 2015 and the first Broadridge quartile for the 12 months ended May 31, 2015.
· For Janus Global Research Fund, the Trustees noted that the Fund’s performance was in the second Broadridge quartile for the 36 months ended May 31, 2015 and the first Broadridge quartile for the 12 months ended May 31, 2015.
· For Janus Global Select Fund, the Trustees noted that the Fund’s performance was in the second Broadridge quartile for the 36 months ended May 31, 2015 and the first Broadridge quartile for the 12 months ended May 31, 2015.
· For Janus Global Technology Fund, the Trustees noted that the Fund’s performance was in the third Broadridge quartile for the 36 months ended May 31, 2015 and the third Broadridge quartile for the 12 months ended May 31, 2015. The Trustees noted the reasons for the Fund’s underperformance and the steps Janus Capital had taken or was taking to improve performance.
· For Janus International Equity Fund, the Trustees noted that the Fund’s performance was in the second Broadridge quartile for the 36 months ended May 31, 2015 and the second Broadridge quartile for the 12 months ended May 31, 2015.
· For Janus Overseas Fund, the Trustees noted that the Fund’s performance was in the bottom Broadridge quartile for the 36 months ended May 31, 2015 and the bottom Broadridge quartile for the 12 months ended May 31, 2015. The Trustees noted the reasons for the Fund’s underperformance, noting that the Fund has a performance fee structure that results in lower management fees during periods of underperformance, and the steps Janus Capital had taken or was taking to improve performance.
Janus Aspen Flexible Bond Portfolio
Additional Information (unaudited)
Janus Aspen Series
· For Janus Aspen Balanced Portfolio, the Trustees noted that the Fund’s performance was in the first Broadridge quartile for the 36 months ended May 31, 2015 and the first Broadridge quartile for the 12 months ended May 31, 2015.
· For Janus Aspen Enterprise Portfolio, the Trustees noted that the Fund’s performance was in the second Broadridge quartile for the 36 months ended May 31, 2015 and the first Broadridge quartile for the 12 months ended May 31, 2015.
· For Janus Aspen Flexible Bond Portfolio, the Trustees noted that the Fund’s performance was in the second Broadridge quartile for the 36 months ended May 31, 2015 and the second Broadridge quartile for the 12 months ended May 31, 2015.
· For Janus Aspen Forty Portfolio, the Trustees noted that the Fund’s performance was in the second Broadridge quartile for the 36 months ended May 31, 2015 and the first Broadridge quartile for the 12 months ended May 31, 2015.
· For Janus Aspen Global Allocation Portfolio – Moderate, the Trustees noted that the Fund’s performance was in the first Broadridge quartile for the 36 months ended May 31, 2015 and the bottom Broadridge quartile for the 12 months ended May 31, 2015.
· For Janus Aspen Global Research Portfolio, the Trustees noted that the Fund’s performance was in the first Broadridge quartile for the 36 months ended May 31, 2015 and the second Broadridge quartile for the 12 months ended May 31, 2015.
· For Janus Aspen Global Technology Portfolio, the Trustees noted that the Fund’s performance was in the second Broadridge quartile for the 36 months ended May 31, 2015 and the third Broadridge quartile for the 12 months ended May 31, 2015.
· For Janus Aspen Global Unconstrained Bond Portfolio, the Trustees noted that, due to limited performance for the Fund, performance history was not a material factor.
· For Janus Aspen INTECH U.S. Low Volatility Portfolio, the Trustees noted that the Fund’s performance was in the first Broadridge quartile for the 12 months ended May 31, 2015.
· For Janus Aspen Janus Portfolio, the Trustees noted that the Fund’s performance was in the second Broadridge quartile for the 36 months ended May 31, 2015 and the first Broadridge quartile for the 12 months ended May 31, 2015.
· For Janus Aspen Overseas Portfolio, the Trustees noted that the Fund’s performance was in the bottom Broadridge quartile for the 36 months ended May 31, 2015 and the bottom Broadridge quartile for the 12 months ended May 31, 2015. The Trustees noted the reasons for the Fund’s underperformance, noting that the Fund has a performance fee structure that results in lower management fees during periods of underperformance, and the steps Janus Capital had taken or was taking to improve performance.
· For Janus Aspen Perkins Mid Cap Value Portfolio, the Trustees noted that the Fund’s performance was in the bottom Broadridge quartile for the 36 months ended May 31, 2015 and the bottom Broadridge quartile for the 12 months ended May 31, 2015. The Trustees noted the reasons for the Fund’s underperformance, noting that the Fund has a performance fee structure that results in lower management fees during periods of underperformance, and the steps Janus Capital and Perkins had taken or were taking to improve performance.
In consideration of each Fund’s performance, the Trustees concluded that, taking into account the factors relevant to performance, as well as other considerations, including steps taken to improve performance, the Fund’s performance warranted continuation of the Fund’s investment advisory and subadvisory agreement(s).
Costs of Services Provided
The Trustees examined information regarding the fees and expenses of each Fund in comparison to similar information for other comparable funds as provided by Broadridge, an independent data provider. They also reviewed an analysis of that information provided by their independent fee consultant and noted that the rate of management (investment advisory and any administration, but excluding out-of-pocket costs) fees for many of the Funds, after applicable waivers,
Janus Aspen Flexible Bond Portfolio
Additional Information (unaudited)
was below the mean management fee rate of the respective peer group of funds selected by an independent data provider. The Trustees also examined information regarding the subadvisory fees charged for subadvisory services, as applicable, noting that all such fees were paid by Janus Capital out of its management fees collected from such Fund.
The independent fee consultant provided its belief that the management fees charged by Janus Capital to each of the Funds under the current investment advisory and administration agreements are reasonable in relation to the services provided by Janus Capital. The independent fee consultant found: (1) the total expenses and management fees of the Funds to be reasonable relative to other mutual funds; (2) total expenses, on average, were 14% below the mean total expenses of their respective Broadridge Expense Group peers and 24% below the mean total expenses for their Broadridge Expense Universes; (3) management fees for the Funds, on average, were 15% below the mean management fees for their Expense Groups and 19% below the mean for their Expense Universes; and (4) Fund expenses at the functional level for each asset and share class category were reasonable. The Trustees also considered the total expenses for each share class of each Fund compared to the mean total expenses for its Broadridge Expense Group peers and to mean total expenses for its Broadridge Expense Universe.
The independent fee consultant concluded that, based on its strategic review of expenses at the complex, category and individual fund level, Fund expenses were found to be reasonable relative to both Expense Group and Expense Universe benchmarks. Further, for certain Funds, the independent fee consultant also performed a systematic “focus list” analysis of expenses in the context of the performance or service delivered to each set of investors in each share class in each selected Fund. Based on this analysis, the independent fee consultant found that the combination of service quality/performance and expenses on these individual Funds and share classes were reasonable in light of performance trends, performance histories, and existence of performance fees, breakpoints, and expense waivers on such Funds.
The Trustees considered the methodology used by Janus Capital and each subadviser in determining compensation payable to portfolio managers, the competitive environment for investment management talent, and the competitive market for mutual funds in different distribution channels.
The Trustees also reviewed management fees charged by Janus Capital and each subadviser to comparable separate account clients and to comparable non-affiliated funds subadvised by Janus Capital or by a subadviser (for which Janus Capital or the subadviser provides only or primarily portfolio management services). Although in most instances subadvisory and separate account fee rates for various investment strategies were lower than management fee rates for Funds having a similar strategy, the Trustees considered that Janus Capital noted that, under the terms of the management agreements with the Funds, Janus Capital performs significant additional services for the Funds that it does not provide to those other clients, including administration services, oversight of the Funds’ other service providers, trustee support, regulatory compliance and numerous other services, and that, in serving the Funds, Janus Capital assumes many legal risks and other costs that it does not assume in servicing its other clients. Moreover, they noted that the independent fee consultant found that: (1) the management fees Janus Capital charges to the Funds are reasonable in relation to the management fees Janus Capital charges to its institutional and subadvised accounts; (2) these institutional and subadvised accounts have different service and infrastructure needs; (3) the average spread between management fees charged to the Funds and those charged to Janus Capital’s institutional accounts is reasonable relative to the average spreads seen in the industry; and (4) by one estimation methodology, the fee margins implied by Janus Capital’s subadvised fees when compared to its mutual fund fees are reasonable relative to the estimated fee margins in the industry and relative to estimated fee margins of fund managers using Janus Capital as a subadviser.
The Trustees considered the fees for each Fund for its fiscal year ended in 2014, and noted the following with regard to each Fund’s total expenses, net of applicable fee waivers (the Fund’s “total expenses”):
Fixed-Income Funds and Money Market Funds
· For Janus Flexible Bond Fund, the Trustees noted that, although the Fund’s total expenses exceeded the peer group mean for certain share classes, overall the Fund’s total expenses were reasonable. The Trustees also noted that Janus Capital has contractually agreed to limit the Fund’s expenses, although this limit did not apply because the Fund’s total expenses were already below the applicable fee limit.
Janus Aspen Flexible Bond Portfolio
Additional Information (unaudited)
· For Janus Global Bond Fund, the Trustees noted that although the Fund’s total expenses exceeded the peer group mean for certain share classes, overall the Fund’s total expenses were reasonable. The Trustees also noted that Janus Capital has contractually agreed to limit the Fund’s expenses.
· For Janus Global Unconstrained Bond Fund, the Trustees noted that although the Fund’s total expenses exceeded the peer group mean for certain share classes, overall the Fund’s total expenses were reasonable. The Trustees also noted that Janus Capital has contractually agreed to limit the Fund’s expenses.
· For Janus High-Yield Fund, the Trustees noted that, although the Fund’s total expenses exceeded the peer group mean for certain share classes, overall the Fund’s total expenses were reasonable. The Trustees also noted that Janus Capital has contractually agreed to limit the Fund’s expenses, although this limit did not apply because the Fund’s total expenses were already below the applicable fee limit.
· For Janus Multi-Sector Income Fund, the Trustees noted that, although the Fund’s total expenses exceeded the peer group mean for certain share classes, overall the Fund’s total expenses were reasonable. The Trustees also noted that Janus has contractually agreed to limit the Fund’s expenses.
· For Janus Real Return Fund, the Trustees noted that, although the Fund’s total expenses exceeded the peer group mean for all share classes, overall the Fund’s total expenses were reasonable. The Trustees also noted that Janus Capital has contractually agreed to limit the Fund’s expenses.
· For Janus Short-Term Bond Fund, the Trustees noted that, although the Fund’s total expenses exceeded the peer group mean for all share classes, overall the Fund’s total expenses were reasonable. The Trustees also noted that Janus Capital has contractually agreed to limit the Fund’s expenses.
· For Janus Government Money Market Fund, the Trustees noted that the Fund’s total expenses exceeded the peer group mean for both share classes. The Trustees considered that management fees for this Fund are higher than the peer group mean due to the Fund’s management fee including other costs, such as custody and transfer agent services, while many funds in the peer group pay these expenses separately from their management fee. In addition, the Trustees considered that Janus Capital voluntarily waives one-half of its advisory fee and other expenses in order to maintain a positive yield.
· For Janus Money Market Fund, the Trustees noted that the Fund’s total expenses were below the peer group mean for both share classes. In addition, the Trustees considered that Janus Capital voluntarily waives one-half of its advisory fee and other expenses in order to maintain a positive yield.
Asset Allocation Funds
· For Janus Global Allocation Fund – Conservative, the Trustees noted that the Fund’s total expenses were below the peer group mean for all share classes.
· For Janus Global Allocation Fund – Growth, the Trustees noted that the Fund’s total expenses were below the peer group mean for all share classes.
· For Janus Global Allocation Fund – Moderate, the Trustees noted that, although the Fund’s total expenses exceeded the peer group mean for certain share classes, overall the Fund’s total expenses were reasonable. The Trustees also noted that Janus Capital has contractually agreed to limit the Fund’s expenses.
Alternative Fund
· For Janus Diversified Alternatives Fund, the Trustees noted that, although the Fund’s total expenses exceeded the peer group mean for one share class, overall the Fund’s total expenses were reasonable. The Trustees also noted that Janus Capital has contractually agreed to limit the Fund’s expenses.
Value Funds
· For Perkins International Value Fund, the Trustees noted that, although the Fund’s total expenses exceeded the peer group mean for certain share classes, overall the Fund’s total expenses were reasonable. The Trustees also noted that Janus Capital has contractually agreed to limit the Fund’s expenses.
· For Perkins Global Value Fund, the Trustees noted that, although the Fund’s total expenses exceeded the peer group mean for one share class, overall the Fund’s total expenses were reasonable.
Janus Aspen Flexible Bond Portfolio
Additional Information (unaudited)
· For Perkins Large Cap Value Fund, the Trustees noted that, although the Fund’s total expenses exceeded the peer group mean for certain share classes, overall the Fund’s total expenses were reasonable. The Trustees also noted that Janus Capital has contractually agreed to limit the Fund’s expenses.
· For Perkins Mid Cap Value Fund, the Trustees noted that, although the Fund’s total expenses exceeded the peer group mean for one share class, overall the Fund’s total expenses were reasonable. The Trustees also noted that Janus Capital has contractually agreed to limit the Fund’s expenses, although this limit did not apply because the Fund’s total expenses were already below the applicable fee limit.
· For Perkins Select Value Fund, the Trustees noted that, although the Fund’s total expenses exceeded the peer group mean for one share class, overall the Fund’s total expenses were reasonable. The Trustees also noted that Janus Capital has contractually agreed to limit the Fund’s expenses.
· For Perkins Small Cap Value Fund, the Trustees noted that the Fund’s total expenses were below the peer group mean for all share classes.
· For Perkins Value Plus Income Fund, the Trustees noted that although the Fund’s total expenses exceeded the peer group mean for one share class, overall the Fund’s total expenses were reasonable. The Trustees also noted that Janus Capital had contractually agreed to limit the Fund’s expenses.
Mathematical Funds
· For INTECH Emerging Markets Managed Volatility Fund, the Trustees noted that although the Fund’s total expenses exceeded the peer group mean for certain share classes, overall the Fund’s total expenses were reasonable. The Trustees also noted that Janus Capital has contractually agreed to limit the Fund’s expenses.
· For INTECH Global Income Managed Volatility Fund, the Trustees noted that the Fund’s total expenses were below the peer group mean for all share classes.
· For INTECH International Managed Volatility Fund, the Trustees noted that although the Fund’s total expenses exceeded the peer group mean for one share class, overall the Fund’s total expenses were reasonable. The Trustees also noted that Janus Capital had contractually agreed to limit the Fund’s expenses, although this limit did not apply because the Fund’s total expenses were already below the applicable fee limit.
· For INTECH U.S. Core Fund, the Trustees noted that although the Fund’s total expenses exceeded the peer group mean for one share class, overall the Fund’s total expenses were reasonable. The Trustees also noted that Janus Capital has contractually agreed to limit the Fund’s expenses, although this limit did not apply because the Fund’s total expenses were already below the applicable fee limit.
· For INTECH U.S. Managed Volatility Fund, the Trustees noted that the Fund’s total expenses exceeded the peer group mean for one share class. The Trustees also noted that Janus Capital had contractually agreed to limit the Fund’s expenses.
Growth and Core Funds
· For Janus Balanced Fund, the Trustees noted that, although the Fund’s total expenses exceeded the peer group mean for one share class, overall the Fund’s total expenses were reasonable. The Trustees also noted that Janus Capital has contractually agreed to limit the Fund’s expenses, although this limit did not apply because the Fund’s total expenses were already below the applicable fee limit.
· For Janus Contrarian Fund, the Trustees noted that, although the Fund’s total expenses exceeded the peer group mean for certain share classes, overall the Fund’s total expenses were reasonable. The Trustees also noted that Janus Capital has contractually agreed to limit the Fund’s expenses, although this limit did not apply because the Fund’s total expenses were already below the applicable fee limit.
· For Janus Enterprise Fund, the Trustees noted that, although the Fund’s total expenses exceeded the peer group mean for certain share classes, overall the Fund’s total expenses were reasonable. The Trustees also noted that Janus Capital has contractually agreed to limit the Fund’s expenses, although this limit did not apply because the Fund’s total expenses were already below the applicable fee limit.
· For Janus Forty Fund, the Trustees noted that the Fund’s total expenses were below the peer group mean for all share classes.
Janus Aspen Flexible Bond Portfolio
Additional Information (unaudited)
· For Janus Fund, the Trustees noted that the Fund’s total expenses were below the peer group mean for all share classes.
· For Janus Growth and Income Fund, the Trustees noted that, although the Fund’s total expenses exceeded the peer group mean for certain share classes, overall the Fund’s total expenses were reasonable. The Trustees also noted that Janus Capital has contractually agreed to limit the Fund’s expenses, although this limit did not apply because the Fund’s total expenses were already below the applicable fee limit.
· For Janus Research Fund, the Trustees noted that the Fund’s total expenses were below the peer group mean for all share classes.
· For Janus Triton Fund, the Trustees noted that, although the Fund’s total expenses exceeded the peer group mean for one share class, overall the Fund’s total expenses were reasonable. The Trustees also noted that Janus Capital has contractually agreed to limit the Fund’s expenses, although this limit did not apply because the Fund’s total expenses were already below the applicable fee limit.
· For Janus Twenty Fund, the Trustees noted that the Fund’s total expenses were below the peer group mean for all share classes.
· For Janus Venture Fund, the Trustees noted that, although the Fund’s total expenses exceeded the peer group mean for one share class, overall the Fund’s total expenses were reasonable. The Trustees also noted that Janus Capital has contractually agreed to limit the Fund’s expenses, although this limit did not apply because the Fund’s total expenses were already below the applicable fee limit.
Global and International Funds
· For Janus Asia Equity Fund, the Trustees noted that the Fund’s total expenses were below the peer group mean for all share classes.
· For Janus Emerging Markets Fund, the Trustees noted that, although the Fund’s total expenses exceeded the peer group mean for certain share classes, overall the Fund’s total expenses were reasonable. The Trustees also noted that Janus Capital has contractually agreed to limit the Fund’s expenses.
· For Janus Global Life Sciences Fund, the Trustees noted that the Fund’s total expenses were below the peer group mean for all share classes.
· For Janus Global Real Estate Fund, the Trustees noted that, although the Fund’s total expenses exceeded the peer group mean for one share class, overall the Fund’s total expenses were reasonable. The Trustees also noted that Janus Capital has contractually agreed to limit the Fund’s expenses.
· For Janus Global Research Fund, the Trustees noted that the Fund’s total expenses were below the peer group mean for all share classes.
· For Janus Global Select Fund, the Trustees noted that the Fund’s total expenses were below the peer group mean for all share classes.
· For Janus Global Technology Fund, the Trustees noted that the Fund’s total expenses were below the peer group mean for all share classes.
· For Janus International Equity Fund, the Trustees noted that, although the Fund’s total expenses exceeded the peer group mean for one share class, overall the Fund’s total expenses were reasonable. The Trustees also noted that Janus Capital has contractually agreed to limit the Fund’s expenses, although this limit did not apply because the Fund’s total expenses were already below the applicable fee limit.
· For Janus Overseas Fund, the Trustees noted that the Fund’s total expenses were below the peer group mean for all share classes.
Janus Aspen Series
· For Janus Aspen Balanced Portfolio, the Trustees noted that the Fund’s total expenses were below the peer group mean for both share classes.
Janus Aspen Flexible Bond Portfolio
Additional Information (unaudited)
· For Janus Aspen Enterprise Portfolio, the Trustees noted that the Fund’s total expenses were below the peer group mean for both share classes.
· For Janus Aspen Flexible Bond Portfolio, the Trustees noted that, although the Fund’s total expenses exceeded the peer group mean for one share class, overall the Fund’s total expenses were reasonable. The Trustees also noted that Janus Capital had contractually agreed to limit the Fund’s expenses.
· For Janus Aspen Forty Portfolio, the Trustees noted that the Fund’s total expenses were below the peer group mean for both share classes.
· For Janus Aspen Global Allocation Portfolio - Moderate, the Trustees noted that, although the Fund’s total expenses exceeded the peer group mean for both share classes, overall the Fund’s total expenses were reasonable. The Trustees also noted that Janus Capital has contractually agreed to limit the Fund’s expenses.
· For Janus Aspen Global Research Portfolio, the Trustees noted that the Fund’s total expenses were below the peer group mean for both share classes.
· For Janus Aspen Global Technology Portfolio, the Trustees noted that the Fund’s total expenses were below the peer group mean for both share classes.
· For Janus Aspen Global Unconstrained Bond Portfolio, the Trustees noted that, although the Fund’s total expenses exceeded the peer group mean for both share classes, overall the Fund’s total expenses were reasonable. The Trustees also noted that Janus Capital had contractually agreed to limit the Fund’s expenses.
· For Janus Aspen INTECH U.S. Low Volatility Portfolio, the Trustees noted that the Fund’s total expenses were below the peer group mean for its sole share class.
· For Janus Aspen Janus Portfolio, the Trustees noted that the Fund’s total expenses were below the peer group mean for both share classes.
· For Janus Aspen Overseas Portfolio, the Trustees noted that the Fund’s total expenses were below the peer group mean for both share classes.
· For Janus Aspen Perkins Mid Cap Value Portfolio, the Trustees noted that the Fund’s total expenses were below the peer group mean for both share classes.
The Trustees reviewed information on the profitability to Janus Capital and its affiliates of their relationships with each Fund, as well as an explanation of the methodology utilized by Janus Capital when allocating various expenses of Janus Capital and its affiliates with respect to contractual relationships with the Funds and other clients. The Trustees also reviewed the financial statements and corporate structure of Janus Capital’s parent company. In their review, the Trustees considered whether Janus Capital and each subadviser receive adequate incentives and resources to manage the Funds effectively. The Trustees recognized that profitability comparisons among fund managers are difficult because very little comparative information is publicly available, and the profitability of any fund manager is affected by numerous factors, including the organizational structure of the particular fund manager, the types of funds and other accounts it manages, possible other lines of business, the methodology for allocating expenses, and the fund manager’s capital structure and cost of capital. However, taking into account those factors and the analysis provided by the Trustees’ independent fee consultant, and based on the information available, the Trustees concluded that Janus Capital’s profitability with respect to each Fund in relation to the services rendered was reasonable.
The independent fee consultant found that, while assessing the reasonableness of expenses in light of Janus Capital’s profits is dependent on comparisons with other publicly-traded mutual fund advisers, and that these comparisons are limited in accuracy by differences in complex size, business mix, institutional account orientation, and other factors, after accepting these limitations, the level of profit earned by Janus Capital from managing the Funds is reasonable.
The Trustees concluded that the management fees payable by each Fund to Janus Capital and its affiliates, as well as the fees paid by Janus Capital to the subadvisers of subadvised Funds, were reasonable in relation to the nature, extent, and quality of the services provided, taking into account the fees charged by other advisers for managing comparable mutual funds with similar strategies, the fees Janus Capital and the subadvisers charge to other clients, and, as applicable, the impact of fund performance on management fees payable by the Funds. The Trustees also concluded that each Fund’s total expenses were reasonable, taking into account the size of the Fund, the quality of services
Janus Aspen Flexible Bond Portfolio
Additional Information (unaudited)
provided by Janus Capital and any subadviser, the investment performance of the Fund, and any expense limitations agreed to or provided by Janus Capital.
Economies of Scale
The Trustees considered information about the potential for Janus Capital to realize economies of scale as the assets of the Funds increase. They noted that their independent fee consultant provided an analysis of economies of scale, which included discussion of analysis from prior years. They also noted that, although many Funds pay advisory fees at a base fixed rate as a percentage of net assets, without any breakpoints, their independent fee consultant concluded that 85% of these Funds have contractual management fees (gross of waivers) below their Broadridge expense group averages and, overall, 80% of the Funds are below their respective expense group averages for contractual management fees. They also noted that for those Funds whose expenses are being reduced by the contractual expense limitations of Janus Capital, Janus Capital is subsidizing the Funds because they have not reached adequate scale. Moreover, as the assets of some of the Funds have declined in the past few years, certain Funds have benefited from having advisory fee rates that have remained constant rather than increasing as assets declined. In addition, performance fee structures have been implemented for various Funds that have caused the effective rate of advisory fees payable by such a Fund to vary depending on the investment performance of the Fund relative to its benchmark index over the measurement period; and a few Funds have fee schedules with breakpoints and reduced fee rates above certain asset levels. The Trustees also noted that the Funds share directly in economies of scale through the lower charges of third-party service providers that are based in part on the combined scale of all of the Funds. Based on all of the information they reviewed, including research and analysis conducted by the Trustees’ independent fee consultant, the Trustees concluded that the current fee structure of each Fund was reasonable and that the current rates of fees do reflect a sharing between Janus Capital and the Fund of any economies of scale that may be present at the current asset level of the Fund.
The independent fee consultant concluded that, given the limitations of various analytical approaches to economies of scale considered in prior years, and their conflicting results, its analyses could not confirm or deny the existence of economies of scale in the Janus complex. Further, the independent fee consultant provided its belief that Fund investors are well-served by the fee levels and performance fee structures in place on the Funds in light of any economies of scale that may be present at Janus Capital.
Other Benefits to Janus Capital
The Trustees also considered benefits that accrue to Janus Capital and its affiliates and subadvisers to the Funds from their relationships with the Funds. They recognized that two affiliates of Janus Capital separately serve the Funds as transfer agent and distributor, respectively, and the transfer agent receives compensation directly from the non-money market funds for services provided. The Trustees also considered Janus Capital’s past and proposed use of commissions paid by the Funds on portfolio brokerage transactions to obtain proprietary and third-party research products and services benefiting the Fund and/or other clients of Janus Capital and/or Janus Capital, and/or a subadviser to a Fund. The Trustees concluded that Janus Capital’s and the subadvisers’ use of these types of client commission arrangements to obtain proprietary and third-party research products and services was consistent with regulatory requirements and guidelines and was likely to benefit each Fund. The Trustees also concluded that, other than the services provided by Janus Capital and its affiliates and subadvisers pursuant to the agreements and the fees to be paid by each Fund therefor, the Funds and Janus Capital and the subadvisers may potentially benefit from their relationship with each other in other ways. They concluded that Janus Capital and/or the subadvisers benefits from the receipt of research products and services acquired through commissions paid on portfolio transactions of the Funds and that the Funds benefit from Janus Capital’s and/or the subadvisers’ receipt of those products and services as well as research products and services acquired through commissions paid by other clients of Janus Capital and/or other clients of the subadvisers. They further concluded that the success of any Fund could attract other business to Janus Capital, the subadvisers or other Janus funds, and that the success of Janus Capital and the subadvisers could enhance Janus Capital’s and the subadvisers’ ability to serve the Funds.
Janus Aspen Flexible Bond Portfolio
Useful Information About Your Portfolio Report (unaudited)
Management Commentary
The Management Commentary in this report includes valuable insight as well as statistical information to help you understand how your Portfolio’s performance and characteristics stack up against those of comparable indices.
If the Portfolio invests in foreign securities, this report may include information about country exposure. Country exposure is based primarily on the country of risk. A company may be allocated to a country based on other factors such as location of the company’s principal office, the location of the principal trading market for the company’s securities, or the country where a majority of the company’s revenues are derived.
Please keep in mind that the opinions expressed in the Management Commentary are just that: opinions. They are a reflection based on best judgment at the time this report was compiled, which was December 31, 2015. As the investing environment changes, so could opinions. These views are unique and are not necessarily shared by fellow employees or by Janus in general.
Performance Overviews
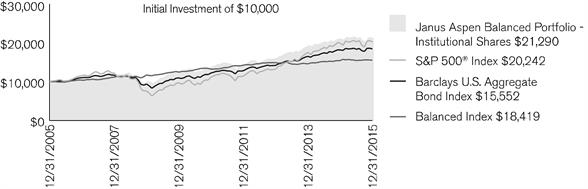
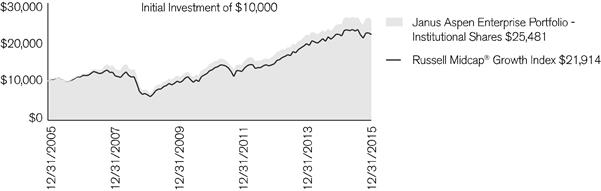
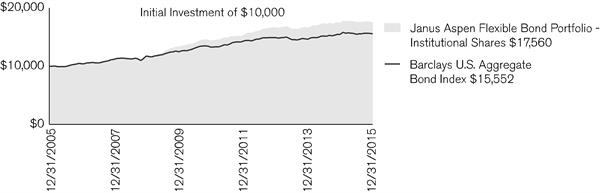
Performance overview graphs compare the performance of a hypothetical $10,000 investment in the Portfolio with one or more widely used market indices. When comparing the performance of the Portfolio with an index, keep in mind that market indices are not available for investment and do not reflect deduction of expenses.
Average annual total returns are quoted for a Portfolio with more than one year of performance history. Average annual total return is calculated by taking the growth or decline in value of an investment over a period of time, including reinvestment of dividends and distributions, then calculating the annual compounded percentage rate that would have produced the same result had the rate of growth been constant throughout the period. Average annual total return does not reflect the deduction of taxes that a shareholder would pay on Portfolio distributions or redemptions of Portfolio shares.
Cumulative total returns are quoted for a Portfolio with less than one year of performance history. Cumulative total return is the growth or decline in value of an investment over time, independent of the period of time involved. Cumulative total return does not reflect the deduction of taxes that a shareholder would pay on Portfolio distributions or redemptions of Portfolio shares.
Pursuant to federal securities rules, expense ratios shown in the performance chart reflect subsidized (if applicable) and unsubsidized ratios. The total annual fund operating expenses ratio is gross of any fee waivers, reflecting the Portfolio’s unsubsidized expense ratio. The net annual fund operating expenses ratio (if applicable) includes contractual waivers of Janus Capital and reflects the Portfolio’s subsidized expense ratio. Ratios may be higher or lower than those shown in the “Financial Highlights” in this report.
Schedule of Investments
Following the performance overview section is the Portfolio’s Schedule of Investments. This schedule reports the types of securities held in the Portfolio on the last day of the reporting period. Securities are usually listed by type (common stock, corporate bonds, U.S. Government obligations, etc.) and by industry classification (banking, communications, insurance, etc.). Holdings are subject to change without notice.
The value of each security is quoted as of the last day of the reporting period. The value of securities denominated in foreign currencies is converted into U.S. dollars.
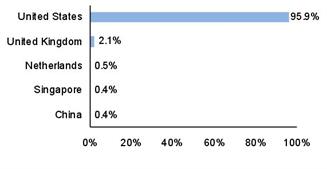
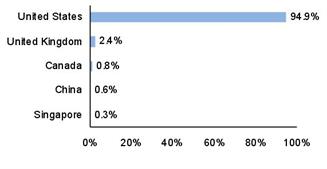
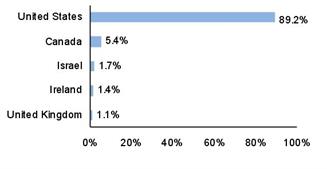
If the Portfolio invests in foreign securities, it will also provide a summary of investments by country. This summary reports the Portfolio exposure to different countries by providing the percentage of securities invested in each country. The country of each security represents the country of risk. The Portfolio’s Schedule of Investments relies upon the industry group and country classifications published by Barclays and/or MSCI Inc.
Tables listing details of individual forward currency contracts, futures, written options, and swaps follow the Portfolio’s Schedule of Investments (if applicable).
Statement of Assets and Liabilities
This statement is often referred to as the “balance sheet.” It lists the assets and liabilities of the Portfolio on the last day of the reporting period.
Janus Aspen Flexible Bond Portfolio
Useful Information About Your Portfolio Report (unaudited)
The Portfolio’s assets are calculated by adding the value of the securities owned, the receivable for securities sold but not yet settled, the receivable for dividends declared but not yet received on securities owned, and the receivable for Portfolio shares sold to investors but not yet settled. The Portfolio’s liabilities include payables for securities purchased but not yet settled, Portfolio shares redeemed but not yet paid, and expenses owed but not yet paid. Additionally, there may be other assets and liabilities such as unrealized gain or loss on forward currency contracts.
The section entitled “Net Assets Consist of” breaks down the components of the Portfolio’s net assets. Because the Portfolio must distribute substantially all earnings, you will notice that a significant portion of net assets is shareholder capital.
The last section of this statement reports the net asset value (“NAV”) per share on the last day of the reporting period. The NAV is calculated by dividing the Portfolio’s net assets for each share class (assets minus liabilities) by the number of shares outstanding.
Statement of Operations
This statement details the Portfolio’s income, expenses, realized gains and losses on securities and currency transactions, and changes in unrealized appreciation or depreciation of Portfolio holdings.
The first section in this statement, entitled “Investment Income,” reports the dividends earned from securities and interest earned from interest-bearing securities in the Portfolio.
The next section reports the expenses incurred by the Portfolio, including the advisory fee paid to the investment adviser, transfer agent fees and expenses, and printing and postage for mailing statements, financial reports and prospectuses. Expense offsets and expense reimbursements, if any, are also shown.
The last section lists the amounts of realized gains or losses from investment and foreign currency transactions, and changes in unrealized appreciation or depreciation of investments and foreign currency-denominated assets and liabilities. The Portfolio will realize a gain (or loss) when it sells its position in a particular security. A change in unrealized gain (or loss) refers to the change in net appreciation or depreciation of the Portfolio during the reporting period. “Net Realized and Unrealized Gain/(Loss) on Investments” is affected both by changes in the market value of Portfolio holdings and by gains (or losses) realized during the reporting period.
Statements of Changes in Net Assets
These statements report the increase or decrease in the Portfolio’s net assets during the reporting period. Changes in the Portfolio’s net assets are attributable to investment operations, dividends and distributions to investors, and capital share transactions. This is important to investors because it shows exactly what caused the Portfolio’s net asset size to change during the period.
The first section summarizes the information from the Statement of Operations regarding changes in net assets due to the Portfolio’s investment operations. The Portfolio’s net assets may also change as a result of dividend and capital gains distributions to investors. If investors receive their dividends and/or distributions in cash, money is taken out of the Portfolio to pay the dividend and/or distribution. If investors reinvest their dividends and/or distributions, the Portfolio’s net assets will not be affected. If you compare the Portfolio’s “Net Decrease from Dividends and Distributions” to “Reinvested Dividends and Distributions,” you will notice that dividends and distributions have little effect on the Portfolio’s net assets. This is because the majority of the Portfolio’s investors reinvest their dividends and/or distributions.
The reinvestment of dividends and distributions is included under “Capital Share Transactions.” “Capital Shares” refers to the money investors contribute to the Portfolio through purchases or withdrawals via redemptions. The Portfolio’s net assets will increase and decrease in value as investors purchase and redeem shares from the Portfolio.
Financial Highlights
This schedule provides a per-share breakdown of the components that affect the Portfolio’s NAV for current and past reporting periods as well as total return, asset size, ratios, and portfolio turnover rate.
The first line in the table reflects the NAV per share at the beginning of the reporting period. The next line reports the net investment income/(loss) per share. Following is the per share total of net gains/(losses), realized and unrealized. Per share dividends and distributions to investors are then subtracted to arrive at the NAV per share at the end of the period. The next line reflects the total return for the period. The total return may include adjustments in accordance with
Janus Aspen Flexible Bond Portfolio
Useful Information About Your Portfolio Report (unaudited)
generally accepted accounting principles required at the period end for financial reporting purposes. The total return does not include any charges at the separate account level or contract level. As a result, the total return may differ from the total return reflected for individual shareholder transactions. Also included are ratios of expenses and net investment income to average net assets.
The Portfolio’s expenses may be reduced through expense offsets and expense reimbursements. The ratios shown reflect expenses before and after any such offsets and reimbursements.
The ratio of net investment income/(loss) summarizes the income earned less expenses, divided by the average net assets of the Portfolio during the reporting period. Do not confuse this ratio with the Portfolio’s yield. The net investment income ratio is not a true measure of the Portfolio’s yield because it does not take into account the dividends distributed to the Portfolio’s investors.
The next figure is the portfolio turnover rate, which measures the buying and selling activity in the Portfolio. Portfolio turnover is affected by market conditions, changes in the asset size of the Portfolio, fluctuating volume of shareholder purchase and redemption orders, the nature of the Portfolio’s investments, and the investment style and/or outlook of the portfolio manager(s) and/or investment personnel. A 100% rate implies that an amount equal to the value of the entire portfolio was replaced once during the fiscal year; a 50% rate means that an amount equal to the value of half the portfolio is traded in a year; and a 200% rate means that an amount equal to the value of the entire portfolio is traded every six months.
Janus Aspen Flexible Bond Portfolio
Designation Requirements (unaudited)
For federal income tax purposes, the Portfolio designated the following for the year ended December 31, 2015:
| | |
| | |
Capital Gain Distributions | $2,675,529 |
Dividends Received Deduction Percentage | 2% |
Janus Aspen Flexible Bond Portfolio
Trustees and Officers (unaudited)
The Portfolio’s Statement of Additional Information includes additional information about the Trustees and officers and is available, without charge, by calling 1-877-335-2687
The following are the Trustees and officers of the Trust, together with a brief description of their principal occupations during the last five years (principal occupations for certain Trustees may include periods over five years).
Each Trustee has served in that capacity since he or she was originally elected or appointed. The Trustees do not serve a specified term of office. Each Trustee will hold office until the termination of the Trust or his or her earlier death, resignation, retirement, incapacity, or removal. Under the Portfolio’s Governance Procedures and Guidelines, the policy is for Trustees to retire no later than the end of the calendar year in which the Trustee turns 75. The Trustees review the Portfolio’s Governance Procedures and Guidelines from time to time and may make changes they deem appropriate. The Portfolio’s Nominating and Governance Committee will consider nominees for the position of Trustee recommended by shareholders. Shareholders may submit the name of a candidate for consideration by the Committee by submitting their recommendations to the Trust’s Secretary. Each Trustee is currently a Trustee of one other registered investment company advised by Janus Capital: Janus Investment Fund. Collectively, these two registered investment companies consist of 58 series or funds.
The Trust’s officers are elected annually by the Trustees for a one-year term. Certain officers also serve as officers of Janus Investment Fund. Certain officers of the Portfolio may also be officers and/or directors of Janus Capital. Portfolio officers receive no compensation from the Portfolio, except for the Portfolio’s Chief Compliance Officer, as authorized by the Trustees.
| | | | | | |
TRUSTEES |
Name, Address, and Age | Positions Held with the Trust | Length of Time Served | Principal Occupations During the Past Five Years | Number of Portfolios/Funds in Fund Complex Overseen by Trustee | Other Directorships Held by Trustee During the Past Five Years |
Independent Trustees |
William F. McCalpin
151 Detroit Street
Denver, CO 80206
DOB: 1957 | Chairman
Trustee | 1/08-Present
6/02-Present | Managing Director, Holos Consulting LLC (provides consulting services to foundations and other nonprofit organizations). Formerly, Chief Executive Officer, Imprint Capital (impact investment firm) (2013-2015) and Executive Vice President and Chief Operating Officer of The Rockefeller Brothers Fund (a private family foundation) (1998-2006). | 58 | Chairman of the Board and Director of The Investment Fund for Foundations Investment Program (TIP) (consisting of 2 funds), and Director of the F.B. Heron Foundation (a private grantmaking foundation). |
Janus Aspen Flexible Bond Portfolio
Trustees and Officers (unaudited)
| | | | | | |
TRUSTEES |
Name, Address, and Age | Positions Held with the Trust | Length of Time Served | Principal Occupations During the Past Five Years | Number of Portfolios/Funds in Fund Complex Overseen by Trustee | Other Directorships Held by Trustee During the Past Five Years |
Alan A. Brown
151 Detroit Street
Denver, CO 80206
DOB: 1962 | Trustee | 1/13-Present | Executive Vice President, Institutional Markets, of Dividend Capital Group (private equity real estate investment management firm) (since 2012). Formerly, Executive Vice President and Co-Head, Global Private Client Group (2007-2010), Executive Vice President, Mutual Funds (2005-2007), and Chief Marketing Officer (2001-2005) of Nuveen Investments, Inc. (asset management). | 58 | Director of MotiveQuest LLC (strategic social market research company) (since 2003), and Director of WTTW (PBS affiliate) (since 2003). Formerly, Director of Nuveen Global Investors LLC (2007-2011); Director of Communities in Schools (2004-2010); and Director of Mutual Fund Education Alliance (until 2010). |
William D. Cvengros
151 Detroit Street
Denver, CO 80206
DOB: 1948 | Trustee | 1/11-Present | Managing Member and Chief Executive Officer of SJC Capital, LLC (a personal investment company and consulting firm) (since 2002). Formerly, Venture Partner for The Edgewater Funds (a middle market private equity firm) (2002-2004); Chief Executive Officer and President of PIMCO Advisors Holdings L.P. (a publicly traded investment management firm) (1994-2000); and Chief Investment Officer of Pacific Life Insurance Company (a mutual life insurance and annuity company) (1987-1994). | 58 | Advisory Board Member, Innovate Partners Emerging Growth and Equity Fund I (early stage venture capital fund) (since 2014) and Managing Trustee of National Retirement Partners Liquidating Trust (since 2013). Formerly, Chairman, National Retirement Partners, Inc. (formerly a network of advisors to 401(k) plans) (2005-2013); Director of Prospect Acquisition Corp. (a special purpose acquisition corporation) (2007-2009); Director of RemedyTemp, Inc. (temporary help services company) (1996-2006); and Trustee of PIMCO Funds Multi-Manager Series (1990-2000) and Pacific Life Variable Life & Annuity Trusts (1987-1994). |
Janus Aspen Flexible Bond Portfolio
Trustees and Officers (unaudited)
| | | | | | |
TRUSTEES |
Name, Address, and Age | Positions Held with the Trust | Length of Time Served | Principal Occupations During the Past Five Years | Number of Portfolios/Funds in Fund Complex Overseen by Trustee | Other Directorships Held by Trustee During the Past Five Years |
James T. Rothe
151 Detroit Street
Denver, CO 80206
DOB: 1943 | Trustee | 1/97-Present | Co-founder and Managing Director of Roaring Fork Capital SBIC, L.P. (SBA, SBIC fund focusing on private investment in public equity firms) and Professor Emeritus of Business of the University of Colorado, Colorado Springs, CO (since 2004). Formerly, Professor of Business of the University of Colorado (2002-2004); and Distinguished Visiting Professor of Business (2001-2002) of Thunderbird (American Graduate School of International Management), Glendale, AZ. | 58 | Formerly, Director of Red Robin Gourmet Burgers, Inc. (RRGB) (2004- 2014). |
William D. Stewart
151 Detroit Street
Denver, CO 80206
DOB: 1944 | Trustee | 9/93-Present | Retired. Formerly, Corporate Vice President and General Manager of MKS Instruments - HPS Products, Boulder, CO (a manufacturer of vacuum fittings and valves) and PMFC Division, Andover, MA (manufacturing pressure measurement and flow products) (1976-2012). | 58 | None |
Janus Aspen Flexible Bond Portfolio
Trustees and Officers (unaudited)
| | | | | | |
TRUSTEES |
Name, Address, and Age | Positions Held with the Trust | Length of Time Served | Principal Occupations During the Past Five Years | Number of Portfolios/Funds in Fund Complex Overseen by Trustee | Other Directorships Held by Trustee During the Past Five Years |
Linda S. Wolf
151 Detroit Street
Denver, CO 80206
DOB: 1947 | Trustee | 12/05-Present | Retired. Formerly, Chairman and Chief Executive Officer of Leo Burnett (Worldwide) (advertising agency) (2001-2005). | 58 | Director of Chicago Community Trust (Regional Community Foundation), Chicago Council on Global Affairs, InnerWorkings (U.S. provider of print procurement solutions to corporate clients), Lurie Children’s Hospital (Chicago, IL), Rehabilitation Institute of Chicago, Walmart, and Wrapports, LLC (digital communications company). Formerly, Director of Chicago Convention & Tourism Bureau (until 2014) and The Field Museum of Natural History (Chicago, IL) (until 2014). |
Trustee Consultant |
Raudline Etienne*
151 Detroit Street
Denver, CO 80206
DOB: 1965 | Consultant | 6/14-Present | Senior Advisor, Albright Stonebridge Group LLC (global strategy firm) (since 2016). Formerly, Senior Vice President (2011-2015), Albright Stonebridge Group LLC; and Deputy Comptroller and Chief Investment Officer, New York State Common Retirement Fund (public pension fund) (2008-2011). | N/A | Director of Brightwood Capital Advisors, LLC (since 2014). |
* Raudline Etienne was appointed consultant to the Trustees effective June 2, 2014. Shareholders of the Janus Funds are expected to be asked to elect Ms. Etienne as a Trustee at a future shareholder meeting.
Janus Aspen Flexible Bond Portfolio
Trustees and Officers (unaudited)
| | | | |
OFFICERS |
Name, Address, and Age | Positions Held with the Trust | Term of Office* and Length of Time Served | Principal Occupations During the Past Five Years |
Michael Keough
151 Detroit Street
Denver, CO 80206
DOB: 1978 | Executive Vice President and Co-Portfolio Manager
Janus Aspen Flexible Bond Portfolio | 12/15-Present | Portfolio Manager for other Janus accounts and Research Analyst for Janus Capital. |
Mayur Saigal
151 Detroit Street
Denver, CO 80206
DOB: 1975 | Executive Vice President and Co-Portfolio Manager
Janus Aspen Flexible Bond Portfolio | 12/15-Present | Portfolio Manager for other Janus accounts and Research Analyst for Janus Capital. |
Gibson Smith
151 Detroit Street
Denver, CO 80206
DOB: 1968 | Executive Vice President and Co-Portfolio Manager
Janus Aspen Flexible Bond Portfolio | 5/07-Present | Chief Investment Officer Fixed Income and Executive Vice President of Janus Capital; Director of Perkins Investment Management LLC; and Portfolio Manager for other Janus accounts. Formerly, Executive Vice President of Janus Distributors LLC and Janus Services LLC (2007-2013). |
Darrell Watters
151 Detroit Street
Denver, CO 80206
DOB: 1963 | Executive Vice President and Co-Portfolio Manager
Janus Aspen Flexible Bond Portfolio | 5/07-Present | Vice President of Janus Capital and Portfolio Manager for other Janus accounts. |
Stephanie Grauerholz 151 Detroit Street
Denver, CO 80206
DOB: 1970 | Chief Legal Counsel and Secretary
Vice President | 1/06-Present
3/06-Present | Senior Vice President and Chief Legal Counsel of Janus Capital and Senior Vice President of Janus Services LLC (since 2015). Formerly, Vice President and Assistant General Counsel of Janus Capital, Vice President and Assistant Secretary of Janus Distributors LLC, and Vice President of Janus Services LLC (2007-2015). |
* Officers are elected at least annually by the Trustees for a one-year term and may also be elected from time to time by the Trustees for an interim period.
Janus Aspen Flexible Bond Portfolio
Trustees and Officers (unaudited)
| | | | |
OFFICERS |
Name, Address, and Age | Positions Held with the Trust | Term of Office* and Length of Time Served | Principal Occupations During the Past Five Years |
Bruce L. Koepfgen
151 Detroit Street
Denver, CO 80206
DOB: 1952 | President and Chief Executive Officer | 7/14-Present | President of Janus Capital Group Inc. and Janus Capital Management LLC (since 2013); Executive Vice President and Director of Janus International Holding LLC (since 2011); Executive Vice President of Janus Distributors LLC (since 2011); Executive Vice President and Working Director of INTECH Investment Management LLC (since 2011); Executive Vice President and Director of Perkins Investment Management LLC (since 2011); and Executive Vice President and Director of Janus Management Holdings Corporation (since 2011). Formerly, Executive Vice President of Janus Services LLC (2011-2015), Janus Capital Group Inc. and Janus Capital Management LLC (2011-2013); and Chief Financial Officer of Janus Capital Group Inc., Janus Capital Management LLC, Janus Distributors LLC, Janus Management Holdings Corporation, and Janus Services LLC (2011-2013). |
David R. Kowalski
151 Detroit Street
Denver, CO 80206
DOB: 1957 | Vice President, Chief Compliance Officer, and Anti-Money Laundering Officer | 6/02-Present | Senior Vice President and Chief Compliance Officer of Janus Capital, Janus Distributors LLC, and Janus Services LLC; Vice President of INTECH Investment Management LLC and Perkins Investment Management LLC; and Director of The Janus Foundation. |
Jesper Nergaard
151 Detroit Street
Denver, CO 80206
DOB: 1962 | Chief Financial Officer
Vice President, Treasurer, and Principal Accounting Officer | 3/05-Present
2/05-Present | Vice President of Janus Capital and Janus Services LLC. |
* Officers are elected at least annually by the Trustees for a one-year term and may also be elected from time to time by the Trustees for an interim period.
Janus Aspen Flexible Bond Portfolio
Notes
NotesPage1
Janus Aspen Flexible Bond Portfolio
Notes
NotesPage2
Janus provides access to a wide range of investment disciplines.
Alternative
Janus alternative funds seek to deliver strong risk-adjusted returns over a full market cycle with lower correlation to equity markets than traditional investments.
Asset Allocation
Janus’ asset allocation funds utilize our fundamental, bottom-up research to balance risk over the long term. From fund options that meet investors’ risk tolerance and objectives to a method that incorporates non-traditional investment choices to seek non-correlated sources of risk and return, Janus’ asset allocation funds aim to allocate risk more effectively.
Fixed Income
Janus fixed income funds attempt to provide less risk relative to equities while seeking to deliver a competitive total return through high current income and appreciation. Janus money market funds seek capital preservation and liquidity with current income as a secondary objective.
Global & International
Janus global and international funds seek to leverage Janus’ research capabilities by taking advantage of inefficiencies in foreign markets, where accurate information and analytical insight are often at a premium.
Growth & Core
Janus growth funds focus on companies believed to be the leaders in their respective industries, with solid management teams, expanding market share, margins and efficiencies. Janus core funds seek investments in more stable and predictable companies. Our core funds look for a strategic combination of steady growth and, for certain funds, some degree of income.
Mathematical
Our mathematical funds seek to outperform their respective indices while maintaining a risk profile equal to or lower than the index itself. Managed by INTECH® (a Janus subsidiary), these funds use a mathematical process in an attempt to build a more “efficient” portfolio than the index.
Value
Our value funds, managed by Perkins® (a Janus subsidiary), seek to identify companies with favorable reward to risk characteristics by conducting rigorous downside analysis before determining upside potential.
For more information about our funds, contact your investment professional or go to janus.com/variable-insurance.
| | | | | | | | | | | | | |
| | | | | |

| | | | |
| | | | | |
Please consider the charges, risks, expenses and investment objectives carefully before investing. For a prospectus or, if available, a summary prospectus containing this and other information, please call Janus at 877.33JANUS (52687) or download the file from janus.com/variable-insurance. Read it carefully before you invest or send money. |
Janus, INTECH and Perkins are registered trademarks of Janus International Holding LLC. © Janus International Holding LLC. Funds distributed by Janus Distributors LLC |
Investment products offered are: | NOT FDIC-INSURED | MAY LOSE VALUE | NO BANK GUARANTEE | |
C-0216-108539 | | | | 109-02-81114 02-16 |
| | | | |
| | | |
| | | ANNUAL REPORT December 31, 2015 |
| | |
| | Janus Aspen Forty Portfolio |
| | |
| | Janus Aspen Series |
| | | |
| | | HIGHLIGHTS · Portfolio management perspective · Investment strategy behind your fund · Portfolio performance, characteristics
and holdings |
| | | |
| | | 
|
Table of Contents
Janus Aspen Forty Portfolio
| | |
Management Commentary and Schedule of Investments | 1 |
Notes to Schedule of Investments and Other Information | 10 |
Statement of Assets and Liabilities | 11 |
Statement of Operations | 12 |
Statements of Changes in Net Assets | 13 |
Financial Highlights | 14 |
Notes to Financial Statements | 15 |
Report of Independent Registered Public Accounting Firm | 23 |
Additional Information | 24 |
Useful Information About Your Portfolio Report | 36 |
Designation Requirements | 39 |
Trustees and Officers | 40 |
Janus Aspen Forty Portfolio (unaudited)
| | | | | | |
PORTFOLIO SNAPSHOT We believe constructing a concentrated portfolio of quality growth companies will allow us to outperform our benchmark over time. We define quality as companies that enjoy sustainable “moats” around their businesses, potentially allowing companies to grow faster, with higher returns, than their competitors. We believe the market often underestimates these companies’ sustainable competitive advantage periods. | | | | | 
Doug Rao portfolio manager |
| | | |
PERFORMANCE OVERVIEW
For the 12-month period ended December 31, 2015, Janus Aspen Forty Portfolio’s Institutional Shares and Service Shares returned 12.22% and 11.94%, respectively, versus a return of 5.67% for the Portfolio’s primary benchmark, the Russell 1000 Growth Index. The Portfolio’s secondary benchmark, the S&P 500 Index, returned 1.38% for the period.
INVESTMENT ENVIRONMENT
The multi-year equities rally encountered significant turbulence during 2015. Cooling growth, weak commodities prices, a surging U.S. dollar and a shift in monetary policy were some of the factors investors had to consider when valuing stock portfolios. Volatility began early in the year as the slide in crude prices started being considered a potential harbinger for sagging demand rather than solely a consequence of overproduction. Global volatility was in the minds of Federal Reserve (Fed) officials when they chose to delay raising interest rates at their September meeting. However, improving U.S. employment data later led to a consensus that rates would indeed rise by the end of the year, and investors digested their first hike in nearly a decade with relative ease. Although markets were again roiled late year by energy prices coming under renewed pressure, bringing back the prospect that global growth may fall short of projections, large caps ended the year up.
PERFORMANCE DISCUSSION
The Portfolio outperformed both its primary benchmark, the Russell 1000 Growth Index, and its secondary benchmark, the S&P 500 Index, during the period. As part of our investment strategy, we seek companies that have built clear, sustainable competitive moats around their businesses, which should help them grow market share within their respective industries over time. Important competitive advantages could include a strong brand, network effects from a product or service that would be hard for a competitor to replicate, a lower cost structure than competitors in the industry, a distribution advantage or patent protection over valuable intellectual property. We think emphasizing these sustainable competitive advantages can be a meaningful driver of outperformance over longer time horizons because the market often underestimates the duration of growth for these companies and the long-term potential return to shareholders. During the year, we saw a number of companies in our portfolio put up impressive results, further validating our view that they are well positioned to grow in excess of the market.
Amazon was the largest individual contributor to performance. The company benefited as its gross merchandise volume (GMV) sales accelerated. Continued improvements in operating leverage in its core retail business also aided results. We believe Amazon is a good example of the types of competitively advantaged companies we tend to seek in our portfolio. Amazon has already rewritten the rules for retail shopping and we believe it will continue to gain consumers’ wallet share as more shopping moves from physical stores to online and mobile purchases. Meanwhile, Amazon’s cloud business, Amazon Web Services, has come to market with scale and a disruptive pricing model for businesses seeking cloud-based services, and has continued to experience rapid growth.
Alphabet Inc., formerly known as Google, was also a strong contributor to performance. The company continued to benefit from the acceleration of its core business. Strong earnings also continued to indicate that the company is well positioned to consolidate advertising spending as advertising becomes increasingly connected and personalized, and as it transitions from offline channels such as print and television to more measurable online channels such as mobile and online video. The market continued to be encouraged by the new CFO’s focus on expense discipline. The stock also benefited from increased visibility of the monetization of YouTube after the completion of Google’s restructuring under
Janus Aspen Forty Portfolio (unaudited)
Alphabet. As the network effects around Alphabet’s advertising business and Android ecosystem grow, we believe it further deepens the company’s competitive moat and enables it to better understand users’ context and intent and connect those users with suppliers of products and services.
Pharmacyclics was another top contributor to performance during the period. The stock was up significantly in the first quarter after it was announced that AbbVie had won a bidding war to acquire the company. The high interest Pharmacyclics received from other companies bidding for it validated our view that its blood cancer treatments are truly innovative and offer significant growth potential. We sold the stock after the announcement.
While pleased with our performance during the year, we did hold companies that detracted from performance. Canadian Pacific Railway was a large detractor. Softer rail volumes due to a weaker commodity market had a broad impact on the railroad industry, and Canadian Pacific was not immune to the slowdown. However, we continue to have a high level of conviction in the long-term potential of the company. We believe Canadian Pacific’s railroad network across Canada and the U.S. is a valuable asset that would be nearly impossible for other transportation and logistics companies to replicate. The company also has a significant cost advantage over the trucking industry. Going forward, we believe Canadian Pacific can continue to grow revenues and railroad volumes as it improves execution around its railroad network. The company has made substantial investments to improve its service and reliability to customers, and as service improves, which should drive more shippers to use Canadian Pacific instead of trucking services.
Chipotle Mexican Grill also detracted after news about food-related illnesses created volatility and headwinds for the company during the period. However, we continue to like the stock; we believe Chipotle’s higher throughput rates, which have led to higher unit economics at each store, still separate it from most competitors in the fast-food or fast-casual industry. We believe that, in time, the company will be able to re-establish its reputation for food integrity.
Alibaba also detracted. The Chinese e-commerce company provides consumer-to-consumer, business-to-consumer and business-to-business sales services via Web and mobile platforms. The weakness of the Chinese economy weighed on the stock’s performance and we exited our position during the period.
OUTLOOK
We believe that volatility will stay elevated amid continuing questions about global economic growth. While household balance sheets are strong and improving employment and early signs of wage growth are supportive of U.S consumer spending, the modern consumer is also sober minded, as shown by their long-term focus on using savings from cheaper gas and utilities to build up their personal savings. We expect this mindset to continue for the foreseeable future.
While there are concerns about the global economy, we think it underscores the importance of finding those select companies with truly sustainable competitive advantages that can take market share and continue to grow earnings, even without the backdrop of a strong global economy. Such companies are more appreciated in a world where growth is harder to come by, as they can create their own path to creating value.
Thank you for your investment in Janus Aspen Forty Portfolio.
Janus Aspen Forty Portfolio (unaudited)
Portfolio At A Glance
December 31, 2015
| | | | | | | |
| | | | | | | |
| | | | | | | |
| | | | | | | |
| | 5 Top Performers - Holdings | | | | 5 Bottom Performers - Holdings | |
| | | | Contribution | | | Contribution |
| | Casey's General Stores, Inc. | | 2.47% | | Canadian Pacific Railway Limited | -1.16% |
| | Amazon.com, Inc. | | 2.03% | | Chipotle Mexican Grill, Inc. | -0.99% |
| | Alphabet Inc. - Class C | | 1.31% | | Alibaba Group Holding Ltd. Sponsored ADR | -0.70% |
| | Pharmacyclics, Inc. | | 1.21% | | Precision Castparts Corp. | -0.64% |
| | Starbucks Corp. | | 1.05% | | Biogen Inc. | -0.40% |
| | | | | | | |
| | 5 Top Performers - Sectors* | | | | | |
| | | | | | Portfolio Weighting | Russell 1000® Growth Index |
| | | | Portfolio Contribution | | (Average % of Equity) | Weighting |
| | Health Care | | 2.46% | | 17.64% | 15.88% |
| | Consumer Discretionary | | 2.43% | | 26.07% | 20.02% |
| | Information Technology | | 1.17% | | 26.69% | 28.15% |
| | Materials | | 1.03% | | 2.85% | 3.79% |
| | Financials | | 1.00% | | 12.68% | 5.33% |
| | | | | | | |
| | 5 Bottom Performers - Sectors* | | | | | |
| | | | | | Portfolio Weighting | Russell 1000® Growth Index |
| | | | Portfolio Contribution | | (Average % of Equity) | Weighting |
| | Consumer Discretionary | | -0.69% | | 0.25% | 10.74% |
| | Industrials | | -0.46% | | 9.46% | 11.37% |
| | Other** | | -0.30% | | 3.43% | 0.00% |
| | Utilities | | 0.02% | | 0.00% | 0.06% |
| | Telecommunication Services | | 0.18% | | 0.30% | 2.07% |
| | Security contribution to performance is measured by using an algorithm that multiplies the daily performance of each security with the previous day’s ending weight in the portfolio and is gross of advisory fees. Fixed income securities and certain equity securities, such as private placements and some share classes of equity securities, are excluded. |
* | Based on sector classification according to the Global Industry Classification Standard (“GICS”) codes, which are the exclusive property and a service mark of MSCI Inc. and Standard & Poor’s. |
** | Not a GICS classified sector. | | | | | |
Janus Aspen Forty Portfolio (unaudited)
Portfolio At A Glance
December 31, 2015
| | |
5 Largest Equity Holdings - (% of Net Assets) |
Alphabet, Inc. - Class C | |
Internet Software & Services | 6.1% |
Lowe's Cos., Inc. | |
Specialty Retail | 4.8% |
General Electric Co. | |
Industrial Conglomerates | 4.1% |
MasterCard, Inc. - Class A | |
Information Technology Services | 4.0% |
Adobe Systems, Inc. | |
Software | 3.7% |
| | 22.7% |
| | | | | | |
Asset Allocation - (% of Net Assets) |
Common Stocks | | 97.0% |
Investment Companies | | 3.1% |
Other | | (0.1)% |
| | | 100.0% |
| | |
Top Country Allocations - Long Positions - (% of Investment Securities) |
As of December 31, 2015 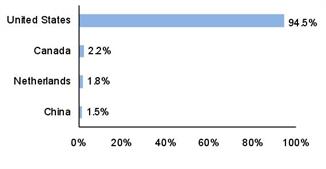
| As of December 31, 2014 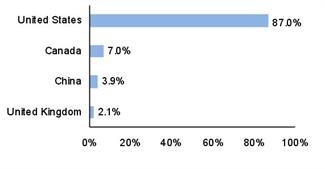
|
Janus Aspen Forty Portfolio (unaudited)
Performance
| |
See important disclosures on the next page. |
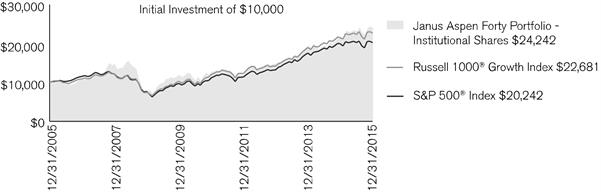
| | | | | | | | |
| | | | | | | |
| | | | | | | | Expense Ratios - |
Average Annual Total Return - for the periods ended December 31, 2015 | | per the May 1, 2015 prospectuses |
| One
Year | Five
Year | Ten
Year | Since
Inception* | | Total Annual Fund
Operating Expenses |
Institutional Shares | 12.22% | 13.15% | 9.26% | 11.02% | | 0.57% |
Service Shares | 11.94% | 12.87% | 8.99% | 10.71% | | 0.82% |
Russell 1000® Growth Index | 5.67% | 13.53% | 8.53% | 6.61% | | |
S&P 500® Index | 1.38% | 12.57% | 7.31% | 7.13% | | |
Morningstar Quartile - Institutional Shares | 1st | 1st | 1st | 1st | | |
Morningstar Ranking - based on total returns for Large Growth Funds | 15/1,745 | 361/1,548 | 116/1,331 | 17/741 | | |
Returns quoted are past performance and do not guarantee future results; current performance may be lower or higher. Investment returns and principal value will vary; there may be a gain or loss when shares are sold. For the most recent month-end performance call 877.33JANUS(52687) or visit janus.com/variable-insurance.
This Portfolio has a performance-based management fee that may adjust up or down based on the Portfolio’s performance.
A Portfolio’s performance may be affected by risks that include those associated with nondiversification, non-investment grade debt securities, high-yield/high-risk securities, undervalued or overlooked companies, investments in specific industries or countries and potential conflicts of interest. Additional risks to a Portfolio may also include, but are not limited to, those associated with investing in foreign securities, emerging markets, initial public offerings, real estate investment trusts (REITs), derivatives, short sales, commodity-linked investments and companies with relatively small market capitalizations. Each Portfolio has different risks. Please see a Janus prospectus for more information about risks, Portfolio holdings and other details.
Foreign securities are subject to additional risks including currency fluctuations, political and economic uncertainty, increased volatility, lower liquidity and differing financial and information reporting standards, all of which are magnified in emerging markets.
These returns do not reflect the charges and expenses of any particular insurance product or qualified plan. Returns shown would have been lower had they included insurance charges.
Returns include reinvestment of all dividends and distributions and do not reflect the deduction of taxes that a shareholder would pay on Portfolio distributions or redemptions of Portfolio shares. The returns do not include adjustments in accordance with generally accepted accounting principles required at the period end for financial reporting purposes.
Returns shown for Service Shares for periods prior to December 31, 1999 are derived from the historical performance of Institutional Shares, adjusted to reflect the higher operating expenses of Service Shares.
Ranking is for the share class shown only; other classes may have different performance characteristics.
© 2015 Morningstar, Inc. All Rights Reserved.
There is no assurance that the investment process will consistently lead to successful investing.
See Notes to Schedule of Investments and Other Information for index definitions.
Janus Aspen Forty Portfolio (unaudited)
Performance
A Portfolio's holdings may differ significantly from the securities held in an index. An index is unmanaged and not available for direct investment; therefore, its performance does not reflect the expenses associated with the active management of an actual portfolio.
See “Useful Information About Your Portfolio Report.”
*The Portfolio’s inception date – May 1, 1997
Janus Aspen Forty Portfolio (unaudited)
Expense Examples
As a shareholder of the Portfolio, you incur two types of costs: (1) transaction costs and (2) ongoing costs, including management fees; 12b-1 distribution and shareholder servicing fees (applicable to Service Shares only); transfer agent fees and expenses payable pursuant to the Transfer Agency Agreement; and other Portfolio expenses. This example is intended to help you understand your ongoing costs (in dollars) of investing in the Portfolio and to compare these costs with the ongoing costs of investing in other mutual funds. To do so, compare this 5% hypothetical example with the 5% hypothetical examples that appear in the shareholder reports of the other funds. The example is based upon an investment of $1,000 invested at the beginning of the period and held for the six-months indicated, unless noted otherwise in the table and footnotes below.
Actual Expenses
The information in the table under the heading “Actual” provides information about actual account values and actual expenses. You may use the information in these columns, together with the amount you invested, to estimate the expenses that you paid over the period. Simply divide your account value by $1,000 (for example, an $8,600 account value divided by $1,000 = 8.6), then multiply the result by the number in the appropriate column for your share class under the heading entitled “Expenses Paid During Period” to estimate the expenses you paid on your account during the period.
Hypothetical Example for Comparison Purposes
The information in the table under the heading “Hypothetical (5% return before expenses)” provides information about hypothetical account values and hypothetical expenses based upon the Portfolio’s actual expense ratio and an assumed rate of return of 5% per year before expenses, which is not the Portfolio’s actual return. The hypothetical account values and expenses may not be used to estimate the actual ending account balance or expenses you paid for the period. You may use this information to compare the ongoing costs of investing in the Portfolio and other funds. To do so, compare this 5% hypothetical example with the 5% hypothetical examples that appear in the shareholder reports of the other funds. Additionally, for an analysis of the fees associated with an investment in either share class or other similar funds, please visit www.finra.org/fundanalyzer.
Please note that the expenses shown in the table are meant to highlight your ongoing costs only and do not reflect any transaction costs, such as any charges at the separate account level or contract level. These fees are fully described in the Portfolio’s prospectuses. Therefore, the hypothetical examples are useful in comparing ongoing costs only, and will not help you determine the relative total costs of owning different funds. In addition, if these transaction costs were included, your costs would have been higher.
| | | | | | | | | | | |
| | | | | | | | | |
| | | | Actual | | Hypothetical
(5% return before expenses) | |
| Beginning
Account
Value
(7/1/15) | Ending
Account
Value
(12/31/15) | Expenses
Paid During
Period
(7/1/15 - 12/31/15)† | | Beginning
Account
Value
(7/1/15) | Ending
Account
Value
(12/31/15) | Expenses
Paid During
Period
(7/1/15 - 12/31/15)† | Net Annualized
Expense Ratio
(7/1/15 - 12/31/15) |
Institutional Shares | $1,000.00 | $1,038.50 | $3.55 | | $1,000.00 | $1,021.73 | $3.52 | 0.69% |
Service Shares | $1,000.00 | $1,037.30 | $4.88 | | $1,000.00 | $1,020.42 | $4.84 | 0.95% |
† | Expenses Paid During Period are equal to the Net Annualized Expense Ratio multiplied by the average account value over the period, multiplied by 184/365 (to reflect the one-half year period). Expenses in the examples include the effect of applicable fee waivers and/or expense reimbursements, if any. Had such waivers and/or reimbursements not been in effect, your expenses would have been higher. Please refer to the Notes to Financial Statements or the Portfolio’s prospectuses for more information regarding waivers and/or reimbursements. |
Janus Aspen Forty Portfolio
Schedule of Investments
December 31, 2015
| | | | | | | | |
Shares
| | | Value | |
Common Stocks – 97.0% | | | |
Auto Components – 1.2% | | | |
| | Delphi Automotive PLC | | 110,403 | | | $9,464,849 | |
Automobiles – 0.8% | | | |
| | Tesla Motors, Inc.* | | 28,037 | | | 6,729,160 | |
Biotechnology – 7.8% | | | |
| | Amgen, Inc. | | 156,550 | | | 25,412,761 | |
| | Celgene Corp.* | | 164,836 | | | 19,740,759 | |
| | Regeneron Pharmaceuticals, Inc.* | | 31,539 | | | 17,121,577 | |
| | | 62,275,097 | |
Capital Markets – 4.1% | | | |
| | Charles Schwab Corp. | | 323,118 | | | 10,640,276 | |
| | E*TRADE Financial Corp.* | | 732,151 | | | 21,700,956 | |
| | | 32,341,232 | |
Commercial Banks – 2.8% | | | |
| | US Bancorp | | 520,892 | | | 22,226,462 | |
Construction Materials – 2.8% | | | |
| | Vulcan Materials Co. | | 237,016 | | | 22,509,410 | |
Consumer Finance – 1.8% | | | |
| | Synchrony Financial* | | 477,389 | | | 14,517,399 | |
Diversified Financial Services – 2.6% | | | |
| | Intercontinental Exchange, Inc. | | 82,257 | | | 21,079,179 | |
Food & Staples Retailing – 1.8% | | | |
| | Costco Wholesale Corp. | | 89,163 | | | 14,399,824 | |
Health Care Equipment & Supplies – 2.4% | | | |
| | Boston Scientific Corp.* | | 1,023,484 | | | 18,873,045 | |
Hotels, Restaurants & Leisure – 7.6% | | | |
| | Chipotle Mexican Grill, Inc.* | | 40,531 | | | 19,448,800 | |
| | Norwegian Cruise Line Holdings, Ltd.* | | 397,003 | | | 23,264,376 | |
| | Starbucks Corp. | | 291,393 | | | 17,492,322 | |
| | | 60,205,498 | |
Industrial Conglomerates – 4.1% | | | |
| | General Electric Co. | | 1,035,125 | | | 32,244,144 | |
Information Technology Services – 4.0% | | | |
| | MasterCard, Inc. - Class A | | 327,413 | | | 31,876,930 | |
Internet & Catalog Retail – 7.3% | | | |
| | Amazon.com, Inc.* | | 36,511 | | | 24,677,420 | |
| | Ctrip.com International, Ltd. (ADR)* | | 261,982 | | | 12,137,626 | |
| | Priceline Group, Inc.* | | 16,738 | | | 21,340,113 | |
| | | 58,155,159 | |
Internet Software & Services – 11.5% | | | |
| | Alphabet, Inc. - Class C | | 64,479 | | | 48,931,823 | |
| | CoStar Group, Inc.* | | 98,349 | | | 20,327,755 | |
| | Facebook, Inc. - Class A* | | 214,474 | | | 22,446,849 | |
| | | 91,706,427 | |
Pharmaceuticals – 6.1% | | | |
| | Bristol-Myers Squibb Co. | | 334,705 | | | 23,024,357 | |
| | Zoetis, Inc. | | 526,336 | | | 25,222,021 | |
| | | 48,246,378 | |
Professional Services – 3.1% | | | |
| | Nielsen Holdings PLC | | 531,940 | | | 24,788,404 | |
Real Estate Investment Trusts (REITs) – 2.8% | | | |
| | Crown Castle International Corp. | | 256,023 | | | 22,133,188 | |
Road & Rail – 2.2% | | | |
| | Canadian Pacific Railway, Ltd. (U.S. Shares) | | 136,946 | | | 17,474,310 | |
Semiconductor & Semiconductor Equipment – 1.8% | | | |
| | NXP Semiconductor NV* | | 174,083 | | | 14,666,493 | |
Software – 8.0% | | | |
| | Adobe Systems, Inc.* | | 316,907 | | | 29,770,243 | |
| | Salesforce.com, Inc.* | | 307,693 | | | 24,123,131 | |
| | |
See Notes to Schedule of Investments and Other Information and Notes to Financial Statements. |
| |
8 | DECEMBER 31, 2015 |
Janus Aspen Forty Portfolio
Schedule of Investments
December 31, 2015
| | | | | | | | |
Shares
| | | Value | |
Common Stocks – (continued) | | | |
Software – (continued) | | | |
| | Workday, Inc. - Class A* | | 120,450 | | | $9,597,456 | |
| | | 63,490,830 | |
Specialty Retail – 8.0% | | | |
| | Advance Auto Parts, Inc. | | 117,407 | | | 17,670,928 | |
| | Lowe's Cos., Inc. | | 499,089 | | | 37,950,728 | |
| | TJX Cos., Inc. | | 116,507 | | | 8,261,511 | |
| | | 63,883,167 | |
Technology Hardware, Storage & Peripherals – 2.4% | | | |
| | Apple, Inc. | | 182,489 | | | 19,208,792 | |
Total Common Stocks (cost $602,378,484) | | 772,495,377 | |
Investment Companies – 3.1% | | | |
Money Markets – 3.1% | | | |
| | Janus Cash Liquidity Fund LLC, 0.3105%ºº,£ (cost $24,691,025) | | 24,691,025 | | | 24,691,025 | |
Total Investments (total cost $627,069,509) – 100.1% | | 797,186,402 | |
Liabilities, net of Cash, Receivables and Other Assets – (0.1)% | | (457,568) | |
Net Assets – 100% | | $796,728,834 | |
| | | | | | |
Summary of Investments by Country - (Long Positions) (unaudited) |
| |
| | | | | % of | |
| | | | | Investment | |
Country | | Value | | Securities | |
United States | | $752,907,974 | | 94.5 | % |
Canada | | 17,474,310 | | 2.2 | |
Netherlands | | 14,666,493 | | 1.8 | |
China | | 12,137,626 | | 1.5 | |
| | | | | | |
Total | | $797,186,403 | | 100.0 | % |
| | |
See Notes to Schedule of Investments and Other Information and Notes to Financial Statements. |
| |
Janus Aspen Series | 9 |
Janus Aspen Forty Portfolio
Notes to Schedule of Investments and Other Information
| | |
Russell 1000® Growth Index | Measures the performance of those Russell 1000 companies with higher price-to-book ratios and higher forecasted growth values. |
S&P 500® Index | Measures broad U.S. equity performance. |
| | |
ADR | American Depositary Receipt |
LLC | Limited Liability Company |
PLC | Public Limited Company |
U.S. Shares | Securities of foreign companies trading on an American stock exchange. |
| | |
* | Non-income producing security. |
| | |
ºº | Rate shown is the 7-day yield as of December 31, 2015. |
| | |
£ | The Portfolio may invest in certain securities that are considered affiliated companies. As defined by the Investment Company Act of 1940, as amended, an affiliated company is one in which the Portfolio owns 5% or more of the outstanding voting securities, or a company which is under common ownership or control. Based on the Portfolio’s relative ownership, the following securities were considered affiliated companies for all or some portion of the year ended December 31, 2015. Unless otherwise indicated, all information in the table is for the year ended December 31, 2015. |
| | | | | | | |
| Share
Balance
at 12/31/14 | Purchases | Sales | Share
Balance
at 12/31/15 | Dividend
Income | Value
at 12/31/15 |
Janus Cash Liquidity Fund LLC | 18,546,315 | 309,351,610 | (303,206,900) | 24,691,025 | $ 36,825 | $ 24,691,025 |
| | | | |
The following is a summary of the inputs that were used to value the Portfolio’s investments in securities and other financial instruments as of December 31, 2015. See Notes to Financial Statements for more information. |
Valuation Inputs Summary | | | |
| Level 1 -
Quoted Prices | Level 2 -
Other Significant
Observable Inputs | Level 3 -
Significant
Unobservable Inputs |
Assets | | | |
Investments in Securities: | | | |
Common Stocks | $ 772,495,377 | $ - | $ - |
Investment Companies | - | 24,691,025 | - |
Total Assets | $ 772,495,377 | $ 24,691,025 | $ - |
| |
Janus Aspen Forty Portfolio
Statement of Assets and Liabilities
December 31, 2015
| | | | | | | |
Assets: | | | | |
| | Investments, at cost | | $ | 627,069,509 | |
| | Unaffiliated investments, at value | | $ | 772,495,377 | |
| | Affiliated investments, at value | | | 24,691,025 | |
| | Cash | | | 591 | |
| | Non-interested Trustees' deferred compensation | | | 16,127 | |
| | Receivables: | | | | |
| | | Dividends | | | 528,372 | |
| | | Portfolio shares sold | | | 143,057 | |
| | | Foreign tax reclaims | | | 68,884 | |
| | | Dividends from affiliates | | | 6,179 | |
| | Other assets | | | 7,840 | |
Total Assets | | | 797,957,452 | |
Liabilities: | | | | |
| | Payables: | | | — | |
| | | Advisory fees | | | 476,858 | |
| | | Portfolio shares repurchased | | | 433,035 | |
| | | 12b-1 Distribution and shareholder servicing fees | | | 117,013 | |
| | | Postage fees | | | 57,170 | |
| | | Printing fees | | | 53,000 | |
| | | Professional fees | | | 35,334 | |
| | | Non-interested Trustees' deferred compensation fees | | | 16,127 | |
| | | Portfolio administration fees | | | 7,078 | |
| | | Non-interested Trustees' fees and expenses | | | 4,587 | |
| | | Custodian fees | | | 3,384 | |
| | | Transfer agent fees and expenses | | | 547 | |
| | | Accrued expenses and other payables | | | 24,485 | |
Total Liabilities | | | 1,228,618 | |
Net Assets | | $ | 796,728,834 | |
Net Assets Consist of: | | | | |
| | Capital (par value and paid-in surplus) | | $ | 524,549,471 | |
| | Undistributed net investment income/(loss) | | | (16,127) | |
| | Undistributed net realized gain/(loss) from investments and foreign currency transactions | | | 102,080,853 | |
| | Unrealized net appreciation/(depreciation) of investments, foreign currency translations and non-interested Trustees’ deferred compensation | | | 170,114,637 | |
Total Net Assets | | $ | 796,728,834 | |
Net Assets - Institutional Shares | | $ | 295,725,406 | |
| | Shares Outstanding, $0.01 Par Value (unlimited shares authorized) | | | 8,130,623 | |
Net Asset Value Per Share | | $ | 36.37 | |
Net Assets - Service Shares | | $ | 501,003,428 | |
| | Shares Outstanding, $0.01 Par Value (unlimited shares authorized) | | | 14,280,847 | |
Net Asset Value Per Share | | $ | 35.08 | |
| | |
See Notes to Financial Statements. |
| |
Janus Aspen Series | 11 |
Janus Aspen Forty Portfolio
Statement of Operations
For the year ended December 31, 2015
| | | | | | |
Investment Income: | | | |
| Dividends | $ | 5,603,044 | |
| | Dividends from affiliates | | 36,825 | |
| | Other income | | 427 | |
| | Foreign tax withheld | | (66,797) | |
Total Investment Income | | 5,573,499 | |
Expenses: | | | |
| | Advisory fees | | 5,265,418 | |
| | 12b-1Distribution and shareholder servicing fees: | | | |
| | | Service Shares | | 1,261,640 | |
| | Other transfer agent fees and expenses: | | | |
| | | Institutional Shares | | 2,180 | |
| | | Service Shares | | 2,148 | |
| | Portfolio administration fees | | 69,313 | |
| | Professional fees | | 48,955 | |
| | Registration fees | | 37,350 | |
| | Custodian fees | | 21,870 | |
| | Non-interested Trustees’ fees and expenses | | 18,687 | |
| | Shareholder reports expense | | 4,436 | |
| | Other expenses | | 58,514 | |
Total Expenses | | 6,790,511 | |
Net Investment Income/(Loss) | | (1,217,012) | |
Net Realized Gain/(Loss) on Investments: | | | |
| | Investments and foreign currency transactions | | 103,601,643 | |
Total Net Realized Gain/(Loss) on Investments | | 103,601,643 | |
Change in Unrealized Net Appreciation/Depreciation: | | | |
| | Investments, foreign currency translations and non-interested Trustees’ deferred compensation | | (11,093,868) | |
Total Change in Unrealized Net Appreciation/Depreciation | | (11,093,868) | |
Net Increase/(Decrease) in Net Assets Resulting from Operations | $ | 91,290,763 | |
| | | | | | |
| | |
See Notes to Financial Statements. |
| |
12 | DECEMBER 31, 2015 |
Janus Aspen Forty Portfolio
Statements of Changes in Net Assets
| | | | | | | | | |
| | | | | | | | | |
| | | Year ended
December 31, 2015 | | Year ended
December 31, 2014 | |
Operations: | | | | | | |
| | Net investment income/(loss) | $ | (1,217,012) | | $ | (637,518) | |
| | Net realized gain/(loss) on investments | | 103,601,643 | | | 160,492,743 | |
| | Change in unrealized net appreciation/depreciation | | (11,093,868) | | | (96,604,872) | |
Net Increase/(Decrease) in Net Assets Resulting from Operations | | 91,290,763 | | | 63,250,353 | |
Dividends and Distributions to Shareholders: | | | | | | |
| | | Institutional Shares | | — | | | (503,982) | |
| | | Service Shares | | — | | | (154,665) | |
| Total Dividends from Net Investment Income | | — | | | (658,647) | |
| | Distributions from Net Realized Gain from Investment Transactions | | | | | | |
| | | Institutional Shares | | (57,445,111) | | | (93,285,383) | |
| | | Service Shares | | (102,554,820) | | | (152,735,352) | |
| Total Distributions from Net Realized Gain from Investment Transactions | (159,999,931) | | | (246,020,735) | |
Net Decrease from Dividends and Distributions to Shareholders | | (159,999,931) | | | (246,679,382) | |
Capital Share Transactions: | | | | | | |
| | | Institutional Shares | | 18,828,189 | | | 13,703,390 | |
| | | Service Shares | | 54,810,568 | | | 79,125,154 | |
Net Increase/(Decrease) from Capital Share Transactions | | 73,638,757 | | | 92,828,544 | |
Net Increase/(Decrease) in Net Assets | | 4,929,589 | | | (90,600,485) | |
Net Assets: | | | | | | |
| | Beginning of period | | 791,799,245 | | | 882,399,730 | |
| End of period | $ | 796,728,834 | | $ | 791,799,245 | |
| | | | | | | | | |
Undistributed Net Investment Income/(Loss) | $ | (16,127) | | $ | (16,251) | |
| | |
See Notes to Financial Statements. |
| |
Janus Aspen Series | 13 |
Janus Aspen Forty Portfolio
Financial Highlights
| | | | | | | | | | | | | | | | | | | |
Institutional Shares | | | | | | | | | | | | | | | |
For a share outstanding during each year ended December 31 | | 2015 | | | 2014 | | | 2013 | | | 2012 | | | 2011 | |
| | Net Asset Value, Beginning of Period | | $40.27 | | | $53.34 | | | $40.95 | | | $33.22 | | | $35.74 | |
| | Income/(Loss) from Investment Operations: | | | | | | | | | | | | | | | |
| | | Net investment income/(loss) | | 0.03(1) | | | 0.03(1) | | | 0.38 | | | 0.47 | | | 0.23 | |
| | | Net realized and unrealized gain/(loss) | | 4.77 | | | 3.08 | | | 12.34 | | | 7.54 | | | (2.62) | |
| | Total from Investment Operations | | 4.80 | | | 3.11 | | | 12.72 | | | 8.01 | | | (2.39) | |
| | Less Dividends and Distributions: | | | | | | | | | | | | | | | |
| | | Dividends (from net investment income) | | — | | | (0.09) | | | (0.33) | | | (0.28) | | | (0.13) | |
| | | Distributions (from capital gains) | | (8.70) | | | (16.09) | | | — | | | — | | | — | |
| | Total Dividends and Distributions | | (8.70) | | | (16.18) | | | (0.33) | | | (0.28) | | | (0.13) | |
| | Net Asset Value, End of Period | | $36.37 | | | $40.27 | | | $53.34 | | | $40.95 | | | $33.22 | |
| | Total Return* | | 12.22% | | | 8.73% | | | 31.23% | | | 24.16% | | | (6.69)% | |
| | Net Assets, End of Period (in thousands) | | $295,725 | | | $299,546 | | | $355,429 | | | $488,374 | | | $459,459 | |
| | Average Net Assets for the Period (in thousands) | | $298,904 | | | $307,359 | | | $491,231 | | | $512,799 | | | $518,818 | |
| | Ratios to Average Net Assets**: | | | | | | | | | | | | | | | |
| | | Ratio of Gross Expenses | | 0.69% | | | 0.57% | | | 0.55% | | | 0.55% | | | 0.70% | |
| | | Ratio of Net Expenses (After Waivers and Expense Offsets) | | 0.69% | | | 0.57% | | | 0.55% | | | 0.55% | | | 0.70% | |
| | | Ratio of Net Investment Income/(Loss) | | 0.08% | | | 0.07% | | | 0.31% | | | 1.03% | | | 0.56% | |
| | Portfolio Turnover Rate | | 55% | | | 46% | | | 61% | | | 10% | | | 46% | |
| | | | | | | | | | | | | | 1 | | | | | |
| | | | | | | | | | | | | | | | | | | |
Service Shares | | | | | | | | | | | | | | | |
For a share outstanding during each year ended December 31 | | 2015 | | | 2014 | | | 2013 | | | 2012 | | | 2011 | |
| | Net Asset Value, Beginning of Period | | $39.21 | | | $52.40 | | | $40.28 | | | $32.72 | | | $35.24 | |
| | Income/(Loss) from Investment Operations: | | | | | | | | | | | | | | | |
| | | Net investment income/(loss) | | (0.06)(1) | | | (0.07)(1) | | | —(2) | | | 0.31 | | | 0.09 | |
| | | Net realized and unrealized gain/(loss) | | 4.63 | | | 2.99 | | | 12.38 | | | 7.47 | | | (2.52) | |
| | Total from Investment Operations | | 4.57 | | | 2.92 | | | 12.38 | | | 7.78 | | | (2.43) | |
| | Less Dividends and Distributions: | | | | | | | | | | | | | | | |
| | | Dividends (from net investment income) | | — | | | (0.02) | | | (0.26) | | | (0.22) | | | (0.09) | |
| | | Distributions (from capital gains) | | (8.70) | | | (16.09) | | | — | | | — | | | — | |
| | Total Dividends and Distributions | | (8.70) | | | (16.11) | | | (0.26) | | | (0.22) | | | (0.09) | |
| | Net Asset Value, End of Period | | $35.08 | | | $39.21 | | | $52.40 | | | $40.28 | | | $32.72 | |
| | Total Return* | | 11.94% | | | 8.47% | | | 30.89% | | | 23.82% | | | (6.91)% | |
| | Net Assets, End of Period (in thousands) | | $501,003 | | | $492,253 | | | $526,971 | | | $471,002 | | | $417,408 | |
| | Average Net Assets for the Period (in thousands) | | $501,868 | | | $493,575 | | | $486,845 | | | $468,967 | | | $475,743 | |
| | Ratios to Average Net Assets**: | | | | | | | | | | | | | | | |
| | | Ratio of Gross Expenses | | 0.94% | | | 0.82% | | | 0.81% | | | 0.80% | | | 0.95% | |
| | | Ratio of Net Expenses (After Waivers and Expense Offsets) | | 0.94% | | | 0.82% | | | 0.81% | | | 0.80% | | | 0.95% | |
| | | Ratio of Net Investment Income/(Loss) | | (0.17)% | | | (0.17)% | | | 0.04% | | | 0.81% | | | 0.31% | |
| | Portfolio Turnover Rate | | 55% | | | 46% | | | 61% | | | 10% | | | 46% | |
| | | | | | | | | | | | | | | | | | | |
| |
* Total return not annualized for periods of less than one full year. ** Annualized for periods of less than one full year. (1) Per share amounts are calculated based on average shares outstanding during the year or period. (2) Less than $0.005 on a per share basis. |
| | |
See Notes to Financial Statements. |
| |
14 | DECEMBER 31, 2015 |
Janus Aspen Forty Portfolio
Notes to Financial Statements
1. Organization and Significant Accounting Policies
Janus Aspen Forty Portfolio (the “Portfolio”) is a series fund. The Portfolio is part of Janus Aspen Series (the “Trust”), which is organized as a Delaware statutory trust and is registered under the Investment Company Act of 1940, as amended (the “1940 Act”), as an open-end management investment company, and therefore has applied the specialized accounting and reporting guidance in Financial Accounting Standards Board (“FASB”) Accounting Standards Codification (“ASC”) Topic 946. The Trust offers twelve Portfolios which include multiple series of shares, with differing investment objectives and policies. The Portfolio invests primarily in common stocks. The Portfolio is classified as nondiversified, as defined in the 1940 Act.
The Portfolio currently offers two classes of shares: Institutional Shares and Service Shares. Each class represents an interest in the same portfolio of investments. Institutional Shares are offered only in connection with investment in and payments under variable insurance contracts as well as certain qualified retirement plans. Service Shares are offered only in connection with investment in and payments under variable insurance contracts as well as certain qualified retirement plans that require a fee from Portfolio assets to procure distribution and administrative services to contract owners and plan participants.
Shareholders, including other portfolios, participating insurance companies, as well as accounts, may from time to time own (beneficially or of record) a significant percentage of the Portfolio’s Shares and can be considered to “control” the Portfolio when that ownership exceeds 25% of the Portfolio’s assets (and which may differ from control as determined in accordance with accounting principles generally accepted in the United States of America).
The following accounting policies have been followed by the Portfolio and are in conformity with accounting principles generally accepted in the United States of America.
Investment Valuation
Securities held by the Portfolio are valued in accordance with policies and procedures established by and under the supervision of the Trustees (the “Valuation Procedures”). Equity securities traded on a domestic securities exchange are generally valued at the closing prices on the primary market or exchange on which they trade. If such price is lacking for the trading period immediately preceding the time of determination, such securities are valued at their current bid price. Equity securities that are traded on a foreign exchange are generally valued at the closing prices on such markets. In the event that there is no current trading volume on a particular security in such foreign exchange, the bid price from the primary exchange is generally used to value the security. Securities that are traded on the over-the-counter (“OTC”) markets are generally valued at their closing or latest bid prices as available. Foreign securities and currencies are converted to U.S. dollars using the applicable exchange rate in effect at the close of the New York Stock Exchange (“NYSE”). The Portfolio will determine the market value of individual securities held by it by using prices provided by one or more approved professional pricing services or, as needed, by obtaining market quotations from independent broker-dealers. Most debt securities are valued in accordance with the evaluated bid price supplied by the pricing service that is intended to reflect market value. The evaluated bid price supplied by the pricing service is an evaluation that may consider factors such as security prices, yields, maturities and ratings. Certain short-term securities maturing within 60 days or less may be evaluated and valued on an amortized cost basis provided that the amortized cost determined approximates market value. Securities for which market quotations or evaluated prices are not readily available or deemed unreliable are valued at fair value determined in good faith under the Valuation Procedures. Circumstances in which fair value pricing may be utilized include, but are not limited to: (i) a significant event that may affect the securities of a single issuer, such as a merger, bankruptcy, or significant issuer-specific development; (ii) an event that may affect an entire market, such as a natural disaster or significant governmental action; (iii) a nonsignificant event such as a market closing early or not opening, or a security trading halt; and (iv) pricing of a nonvalued security and a restricted or nonpublic security. Special valuation considerations may apply with respect to “odd-lot” fixed-income transactions which, due to their small size, may receive evaluated prices by pricing services which reflect a large block trade and not what actually could be obtained for the odd-lot position. The Portfolio uses systematic fair valuation models provided by independent third parties to value international equity securities in order to adjust for stale pricing, which may occur between the close of certain foreign exchanges and the close of the NYSE.
Valuation Inputs Summary
FASB ASC 820, Fair Value Measurements and Disclosures (“ASC 820”), defines fair value, establishes a framework for measuring fair value, and expands disclosure requirements regarding fair value measurements. This standard emphasizes that fair value is a market-based measurement that should be determined based on the assumptions that
Janus Aspen Forty Portfolio
Notes to Financial Statements
market participants would use in pricing an asset or liability and establishes a hierarchy that prioritizes inputs to valuation techniques used to measure fair value. These inputs are summarized into three broad levels:
Level 1 – Unadjusted quoted prices in active markets the Portfolio has the ability to access for identical assets or liabilities.
Level 2 – Observable inputs other than unadjusted quoted prices included in Level 1 that are observable for the asset or liability either directly or indirectly. These inputs may include quoted prices for the identical instrument on an inactive market, prices for similar instruments, interest rates, prepayment speeds, credit risk, yield curves, default rates and similar data.
Assets or liabilities categorized as Level 2 in the hierarchy generally include: debt securities fair valued in accordance with the evaluated bid or ask prices supplied by a pricing service; securities traded on OTC markets and listed securities for which no sales are reported that are fair valued at the latest bid price (or yield equivalent thereof) obtained from one or more dealers transacting in a market for such securities or by a pricing service approved by the Portfolio’s Trustees; certain short-term debt securities with maturities of 60 days or less that are fair valued at amortized cost; and equity securities of foreign issuers whose fair value is determined by using systematic fair valuation models provided by independent third parties in order to adjust for stale pricing which may occur between the close of certain foreign exchanges and the close of the NYSE. Other securities that may be categorized as Level 2 in the hierarchy include, but are not limited to, preferred stocks, bank loans, swaps, investments in unregistered investment companies, options, and forward contracts.
Level 3 – Unobservable inputs for the asset or liability to the extent that relevant observable inputs are not available, representing the Portfolio’s own assumptions about the assumptions that a market participant would use in valuing the asset or liability, and that would be based on the best information available.
There have been no significant changes in valuation techniques used in valuing any such positions held by the Portfolio since the beginning of the fiscal year.
The inputs or methodology used for fair valuing securities are not necessarily an indication of the risk associated with investing in those securities. The summary of inputs used as of December 31, 2015 to fair value the Portfolio’s investments in securities and other financial instruments is included in the “Valuation Inputs Summary” in the Notes to Schedule of Investments and Other Information.
There were no transfers between Level 1, Level 2 and Level 3 of the fair value hierarchy during the year. The Portfolio recognizes transfers between the levels as of the beginning of the fiscal year.
Investment Transactions and Investment Income
Investment transactions are accounted for as of the date purchased or sold (trade date). Dividend income is recorded on the ex-dividend date. Certain dividends from foreign securities will be recorded as soon as the Portfolio is informed of the dividend, if such information is obtained subsequent to the ex-dividend date. Dividends from foreign securities may be subject to withholding taxes in foreign jurisdictions. Interest income is recorded on the accrual basis and includes amortization of premiums and accretion of discounts. Gains and losses are determined on the identified cost basis, which is the same basis used for federal income tax purposes. Income, as well as gains and losses, both realized and unrealized, are allocated daily to each class of shares based upon the ratio of net assets represented by each class as a percentage of total net assets.
Expenses
The Portfolio bears expenses incurred specifically on its behalf, as well as a portion of general expenses, which may be allocated pro rata to the Portfolio. Each class of shares bears a portion of general expenses, which are allocated daily to each class of shares based upon the ratio of net assets represented by each class as a percentage of total net assets. Expenses directly attributable to a specific class of shares are charged against the operations of such class.
Estimates
The preparation of financial statements in conformity with accounting principles generally accepted in the United States of America requires management to make estimates and assumptions that affect the reported amount of assets and liabilities and disclosure of contingent assets and liabilities at the date of the financial statements, and the reported amounts of income and expenses during the reporting period. Actual results could differ from those estimates.
Janus Aspen Forty Portfolio
Notes to Financial Statements
Indemnifications
In the normal course of business, the Portfolio may enter into contracts that contain provisions for indemnification of other parties against certain potential liabilities. The Portfolio’s maximum exposure under these arrangements is unknown, and would involve future claims that may be made against the Portfolio that have not yet occurred. Currently, the risk of material loss from such claims is considered remote.
Foreign Currency Translations
The Portfolio does not isolate that portion of the results of operations resulting from the effect of changes in foreign exchange rates on investments from the fluctuations arising from changes in market prices of securities held at the date of the financial statements. Net unrealized appreciation or depreciation of investments and foreign currency translations arise from changes in the value of assets and liabilities, including investments in securities held at the date of the financial statements, resulting from changes in the exchange rates and changes in market prices of securities held.
Currency gains and losses are also calculated on payables and receivables that are denominated in foreign currencies. The payables and receivables are generally related to foreign security transactions and income translations.
Foreign currency-denominated assets and forward currency contracts may involve more risks than domestic transactions, including currency risk, counterparty risk, political and economic risk, regulatory risk and equity risk. Risks may arise from unanticipated movements in the value of foreign currencies relative to the U.S. dollar.
Dividends and Distributions
The Portfolio may make semiannual distributions of substantially all of its investment income and an annual distribution of its net realized capital gains (if any).
The Portfolio may make certain investments in real estate investment trusts (“REITs”) which pay dividends to their shareholders based upon funds available from operations. It is quite common for these dividends to exceed the REITs’ taxable earnings and profits, resulting in the excess portion of such dividends being designated as a return of capital. If the Portfolio distributes such amounts, such distributions could constitute a return of capital to shareholders for federal income tax purposes.
Federal Income Taxes
The Portfolio intends to continue to qualify as a regulated investment company and distribute all of its taxable income in accordance with the requirements of Subchapter M of the Internal Revenue Code. Management has analyzed the Portfolio’s tax positions taken for all open federal income tax years, generally a three-year period, and has concluded that no provision for federal income tax is required in the Portfolio’s financial statements. The Portfolio is not aware of any tax positions for which it is reasonably possible that the total amounts of unrecognized tax benefits will significantly change in the next twelve months.
2. Other Investments and Strategies
Additional Investment Risk
The financial crisis in both the U.S. and global economies over the past several years has resulted, and may continue to result, in a significant decline in the value and liquidity of many securities of issuers worldwide in the equity and fixed-income/credit markets. In response to the crisis, the United States and certain foreign governments, along with the U.S. Federal Reserve and certain foreign central banks, took steps to support the financial markets. The withdrawal of this support, a failure of measures put in place to respond to the crisis, or investor perception that such efforts were not sufficient could each negatively affect financial markets generally, and the value and liquidity of specific securities. In addition, policy and legislative changes in the United States and in other countries continue to impact many aspects of financial regulation. The effect of these changes on the markets, and the practical implications for market participants, including the Portfolio, may not be fully known for some time. As a result, it may also be unusually difficult to identify both investment risks and opportunities, which could limit or preclude the Portfolio’s ability to achieve its investment objective. Therefore, it is important to understand that the value of your investment may fall, sometimes sharply, and you could lose money.
The enactment of the Dodd-Frank Wall Street Reform and Consumer Protection Act (the “Dodd-Frank Act”) provided for widespread regulation of financial institutions, consumer financial products and services, broker-dealers, OTC derivatives, investment advisers, credit rating agencies, and mortgage lending, which expanded federal oversight in the financial sector, including the investment management industry. Many provisions of the Dodd-Frank Act remain pending
Janus Aspen Forty Portfolio
Notes to Financial Statements
and will be implemented through future rulemaking. Therefore, the ultimate impact of the Dodd-Frank Act and the regulations under the Dodd-Frank Act on the Portfolio and the investment management industry as a whole, is not yet certain.
A number of countries in the European Union (“EU”) have experienced, and may continue to experience, severe economic and financial difficulties. In particular, many EU nations are susceptible to economic risks associated with high levels of debt, notably due to investments in sovereign debt of countries such as Greece, Italy, Spain, Portugal, and Ireland. Many non-governmental issuers, and even certain governments, have defaulted on, or been forced to restructure, their debts. Many other issuers have faced difficulties obtaining credit or refinancing existing obligations. Financial institutions have in many cases required government or central bank support, have needed to raise capital, and/or have been impaired in their ability to extend credit. As a result, financial markets in the EU experienced extreme volatility and declines in asset values and liquidity. Responses to these financial problems by European governments, central banks, and others, including austerity measures and reforms, may not work, may result in social unrest, and may limit future growth and economic recovery or have other unintended consequences. Further defaults or restructurings by governments and others of their debt could have additional adverse effects on economies, financial markets, and asset valuations around the world. Greece, Ireland, and Portugal have already received one or more "bailouts" from other Eurozone member states, and it is unclear how much additional funding they will require or if additional Eurozone member states will require bailouts in the future. One or more countries may abandon the euro and/or withdraw from the EU, placing its currency and banking system in jeopardy.
Certain areas of the world have historically been prone to and economically sensitive to environmental events such as, but not limited to, hurricanes, earthquakes, typhoons, flooding, tidal waves, tsunamis, erupting volcanoes, wildfires or droughts, tornadoes, mudslides, or other weather-related phenomena. Such disasters, and the resulting physical or economic damage, could have a severe and negative impact on the Portfolio’s investment portfolio and, in the longer term, could impair the ability of issuers in which the Portfolio invests to conduct their businesses as they would under normal conditions. Adverse weather conditions may also have a particularly significant negative effect on issuers in the agricultural sector and on insurance companies that insure against the impact of natural disasters.
Real Estate Investing
The Portfolio may invest in equity and debt securities of real estate-related companies. Such companies may include those in the real estate industry or real estate-related industries. These securities may include common stocks, corporate bonds, preferred stocks, and other equity securities, including, but not limited to, mortgage-backed securities, real estate-backed securities, securities of REITs and similar REIT-like entities. A REIT is a trust that invests in real estate-related projects, such as properties, mortgage loans, and construction loans. REITs are generally categorized as equity, mortgage, or hybrid REITs. A REIT may be listed on an exchange or traded OTC.
3. Investment Advisory Agreements and Other Transactions with Affiliates
The Portfolio pays Janus Capital an investment advisory fee which is calculated daily and paid monthly. The Portfolio’s “base” fee rate prior to any performance adjustment (expressed as an annual rate) is 0.64%.
The investment advisory fee rate is determined by calculating a base fee and applying a performance adjustment. The base fee rate is the same as the contractual investment advisory fee rate. The performance adjustment either increases or decreases the base fee depending on how well the Portfolio has performed relative to its benchmark index. The Portfolio's benchmark index used in the calculation is the Russell 1000® Growth Index.
The calculation of the performance adjustment applies as follows:
Investment Advisory Fee = Base Fee Rate +/- Performance Adjustment
The investment advisory fee rate paid to Janus Capital by the Portfolio consists of two components: (1) a base fee calculated by applying the contractual fixed rate of the advisory fee to the Portfolio’s average daily net assets during the previous month (“Base Fee Rate”), plus or minus (2) a performance-fee adjustment (“Performance Adjustment”) calculated by applying a variable rate of up to 0.15% (positive or negative) to the Portfolio’s average daily net assets during the applicable performance measurement period, which is generally the previous 36 months.
The Portfolio’s prospectuses and statement(s) of additional information contain additional information about performance-based fees. The amount shown as advisory fees on the Statement of Operations reflects the Base Fee
Janus Aspen Forty Portfolio
Notes to Financial Statements
Rate plus/minus any Performance Adjustment. For the year ended December 31, 2015, the performance adjusted investment advisory fee rate before any waivers and/or reimbursements of expenses is 0.65%.
Janus Services LLC (“Janus Services”), a wholly-owned subsidiary of Janus Capital, is the Portfolio’s transfer agent. In addition, Janus Services provides or arranges for the provision of certain other administrative services including, but not limited to, recordkeeping, accounting, order processing, and other shareholder services for the Portfolio. Janus Services is not compensated for its services related to the shares, except for out-of-pocket costs. These amounts are disclosed as “Other transfer agent fees and expenses” on the Statement of Operations.
Under a distribution and shareholder servicing plan (the “Plan”) adopted in accordance with Rule 12b-1 under the 1940 Act, the Service Shares may pay the Trust’s distributor, Janus Distributors LLC (“Janus Distributors”), a wholly-owned subsidiary of Janus Capital, a fee for the sale and distribution and/or shareholder servicing of the Service Shares at an annual rate of up to 0.25% of the average daily net assets of the Service Shares. Under the terms of the Plan, the Trust is authorized to make payments to Janus Distributors for remittance to insurance companies and qualified plan service providers as compensation for distribution and/or shareholder services performed by such entities. These amounts are disclosed as “12b-1 Distribution and shareholder servicing fees” on the Statement of Operations. Payments under the Plan are not tied exclusively to actual 12b-1 distribution and servicing fees, and the payments may exceed 12b-1 distribution and servicing fees actually incurred. If any of the Portfolio’s actual 12b-1 distribution and servicing fees incurred during a calendar year are less than the payments made during a calendar year, the Portfolio will be refunded the difference. Refunds, if any, are included in “12b-1 Distribution fees and shareholder servicing fees” in the Statement of Operations.
Janus Capital furnishes certain administration, compliance, and accounting services for the Portfolio and is reimbursed by the Portfolio for certain of its costs in providing those services (to the extent Janus Capital seeks reimbursement and such costs are not otherwise waived). The Portfolio also pays for salaries, fees, and expenses of certain Janus Capital employees and Portfolio officers, with respect to certain specified administration functions they perform on behalf of the Portfolio. The Portfolio pays these costs based on out-of-pocket expenses incurred by Janus Capital, and these costs are separate and apart from advisory fees and other expenses paid in connection with the investment advisory services Janus Capital provides to the Portfolio. These amounts are disclosed as “Portfolio administration fees” on the Statement of Operations. In addition, employees of Janus Capital and/or its affiliates may serve as officers of the Trust. Some expenses related to compensation payable to the Portfolio's Chief Compliance Officer and compliance staff are shared with the Portfolio. Total compensation of $43,224 was paid to the Chief Compliance Officer and certain compliance staff by the Trust during the year ended December 31, 2015. The Portfolio's portion is reported as part of “Other expenses” on the Statement of Operations.
The Board of Trustees has adopted a deferred compensation plan (the “Deferred Plan”) for independent Trustees to elect to defer receipt of all or a portion of the annual compensation they are entitled to receive from the Portfolio. All deferred fees are credited to an account established in the name of the Trustees. The amounts credited to the account then increase or decrease, as the case may be, in accordance with the performance of one or more of the Janus funds that are selected by the Trustees. The account balance continues to fluctuate in accordance with the performance of the selected fund or funds until final payment of all amounts are credited to the account. The fluctuation of the account balance is recorded by the Portfolio as unrealized appreciation/(depreciation) and is included as of December 31, 2015 on the Statement of Assets and Liabilities in the asset, “Non-interested Trustees’ deferred compensation,” and liability, “Non-interested Trustees’ deferred compensation fees.” Additionally, the recorded unrealized appreciation/(depreciation) is included in “Unrealized net appreciation/(depreciation) of investments, foreign currency translations and non-interested Trustees’ deferred compensation” on the Statement of Assets and Liabilities. Deferred compensation expenses for the year ended December 31, 2015 are included in “Non-interested Trustees’ fees and expenses” on the Statement of Operations. Trustees are allowed to change their designation of mutual funds from time to time. Amounts will be deferred until distributed in accordance with the Deferred Plan. Deferred fees of $317,200 were paid by the Trust to a Trustee under the Deferred Plan during the year ended December 31, 2015.
Pursuant to the provisions of the 1940 Act and related rules, the Portfolio may participate in an affiliated or nonaffiliated cash sweep program. In the cash sweep program, uninvested cash balances of the Portfolio may be used to purchase shares of affiliated or nonaffiliated money market funds or cash management pooled investment vehicles. The Portfolio is eligible to participate in the cash sweep program (the “Investing Funds”). As adviser, Janus Capital has an inherent conflict of interest because of its fiduciary duties to the affiliated money market funds or cash management pooled investment vehicles and the Investing Funds. Janus Cash Liquidity Fund LLC is an affiliated unregistered cash
Janus Aspen Forty Portfolio
Notes to Financial Statements
management pooled investment vehicle that invests primarily in highly-rated short-term fixed-income securities. Janus Cash Liquidity Fund LLC currently maintains a NAV of $1.00 per share and distributes income daily in a manner consistent with a registered product compliant with Rule 2a-7 under the 1940 Act. There are no restrictions on the Portfolio's ability to withdraw investments from Janus Cash Liquidity Fund LLC at will, and there are no unfunded capital commitments due from the Portfolio to Janus Cash Liquidity Fund LLC. The units of Janus Cash Liquidity Fund LLC are not charged any management fee, sales charge or service fee.
Any purchases and sales, realized gains/losses and recorded dividends from affiliated investments during the year ended December 31, 2015 can be found in a table located in the Notes to Schedule of Investments and Other Information.
The Portfolio is permitted to purchase or sell securities (“cross-trade”) between itself and other funds or accounts managed by Janus Capital Management LLC in accordance with Rule 17a-7 under the Investment Company Act of 1940 (“Rule 17a-7”), when the transaction is consistent with the investment objectives and policies of the Portfolio and in accordance with the Internal Cross Trade Procedures adopted by the Trust’s Board of Trustees. These procedures have been designed to ensure that any cross-trade of securities by the Portfolio from or to another fund or account that is or could be considered an affiliate of the Portfolio under certain limited circumstances by virtue of having a common investment adviser, common Officer, or common Trustee complies with Rule 17a-7. Under these procedures, each cross-trade is effected at the current market price to save costs where allowed. During the year ended December 31, 2015, the Portfolio engaged in cross trades amounting to $30,619,365 in sales, resulting in a net realized gain/loss of $5,861,179. The net realized gain/loss is included in “Investments and foreign currency transactions” within the “Net Realized and Unrealized Gain/(Loss) on Investments” section of the Portfolio’s Statement of Operations.
4. Federal Income Tax
The tax components of capital shown in the table below represent: (1) distribution requirements the Portfolio must satisfy under the income tax regulations; (2) losses or deductions the Portfolio may be able to offset against income and gains realized in future years; and (3) unrealized appreciation or depreciation of investments for federal income tax purposes.
Other book to tax differences primarily consist of deferred compensation and foreign currency contract adjustments. The Portfolio has elected to treat gains and losses on forward foreign currency contracts as capital gains and losses, if applicable. Other foreign currency gains and losses on debt instruments are treated as ordinary income for federal income tax purposes pursuant to Section 988 of the Internal Revenue Code.
| | | | | | | | |
| | | | | | | | |
| | | | Loss Deferrals | | Net Tax | |
Undistributed
Ordinary Income | Undistributed
Long-Term Gains | Accumulated
Capital Losses | Late-Year
Ordinary Loss | Post-October
Capital Loss | Other Book
to Tax Differences | Appreciation/
(Depreciation) | |
$ 6,437,226 | $ 95,750,642 | $ - | $ - | $ - | $ (18,380) | $170,009,875 | |
The aggregate cost of investments and the composition of unrealized appreciation and depreciation of investment securities for federal income tax purposes as of December 31, 2015 are noted below.
Unrealized appreciation and unrealized depreciation in the table below exclude appreciation/depreciation on foreign currency translations. The primary differences between book and tax appreciation or depreciation of investments is wash sale loss deferrals
| | | | |
Federal Tax Cost | Unrealized
Appreciation | Unrealized
(Depreciation) | Net Tax Appreciation/
(Depreciation) |
$ 627,176,527 | $183,969,994 | $(13,960,119) | $ 170,009,875 |
| | | | |
Janus Aspen Forty Portfolio
Notes to Financial Statements
Income and capital gains distributions are determined in accordance with income tax regulations that may differ from accounting principles generally accepted in the United States of America. These differences are due to differing treatments for items such as net short-term gains, deferral of wash sale losses, foreign currency transactions, net investment losses, and capital loss carryovers. Certain permanent differences such as tax returns of capital and net investment losses noted below have been reclassified to capital.
| | | | | |
For the year ended December 31, 2015 | |
Distributions | | |
From Ordinary Income | From Long-Term Capital Gains | Tax Return of Capital | Net Investment Loss | |
$ 9,606,802 | $ 150,393,129 | $ - | $ - | |
| | | | | |
For the year ended December 31, 2014 | |
Distributions | | |
From Ordinary Income | From Long-Term Capital Gains | Tax Return of Capital | Net Investment Loss | |
$ 658,647 | $ 246,020,735 | $ - | $ - | |
Permanent book to tax basis differences may result in reclassifications between the components of net assets. These differences have no impact on the results of operations or net assets. The following reclassifications have been made to the Portfolio:
| | | | |
Increase/(Decrease) to Capital | Increase/(Decrease) to Undistributed
Net Investment Income/Loss | Increase/(Decrease) to Undistributed
Net Realized Gain/Loss | |
$ - | $ 1,217,136 | $ (1,217,136) | |
5. Capital Share Transactions
| | | | | | | |
| | | | | | | |
| | | Year ended December 31, 2015 | | Year ended December 31, 2014 |
| | Shares | Amount | | Shares | Amount |
Institutional Shares: | | | | | |
Shares sold | 1,146,883 | $ 44,193,370 | | 438,521 | $19,546,852 |
Reinvested dividends and distributions | 1,601,927 | 57,445,111 | | 2,552,786 | 93,789,365 |
Shares repurchased | (2,057,242) | (82,810,292) | | (2,216,104) | (99,632,827) |
Net Increase/(Decrease) | 691,568 | $ 18,828,189 | | 775,203 | $13,703,390 |
Service Shares: | | | | | |
Shares sold | 1,444,396 | $ 53,479,766 | | 568,799 | $25,026,559 |
Reinvested dividends and distributions | 2,961,444 | 102,554,820 | | 4,268,286 | 152,890,017 |
Shares repurchased | (2,680,089) | (101,224,018) | | (2,338,393) | (98,791,422) |
Net Increase/(Decrease) | 1,725,751 | $ 54,810,568 | | 2,498,692 | $79,125,154 |
6. Purchases and Sales of Investment Securities
For the year ended December 31, 2015, the aggregate cost of purchases and proceeds from sales of investment securities (excluding any short-term securities, short-term options contracts, and in-kind transactions) was as follows:
| | | | |
Purchases of
Securities | Proceeds from Sales
of Securities | Purchases of Long-
Term U.S. Government
Obligations | Proceeds from Sales
of Long-Term U.S.
Government Obligations |
$423,573,271 | $ 516,653,749 | $ - | $ - |
Janus Aspen Forty Portfolio
Notes to Financial Statements
7. Subsequent Event
Management has evaluated whether any events or transactions occurred subsequent to December 31, 2015 and through the date of issuance of the Portfolio’s financial statements and determined that there were material events or transactions that would require recognition or disclosure in the Portfolio’s financial statements, as discussed below.
Effective May 1, 2016, the Portfolio pays Janus Services a fee at an annual rate of up to 0.05% of the average daily net assets of the Portfolio’s Institutional Shares and Service Shares to compensate insurance companies for services provided to contract owners. Any unused portion will be reimbursed back to the respective share class.
Janus Aspen Forty Portfolio
Independent Auditor’s Report
To the Board of Trustees of Janus Aspen Series and Shareholders of Janus Aspen Forty Portfolio:
In our opinion, the accompanying statement of assets and liabilities, including the schedule of investments, and the related statements of operations and of changes in net assets and the financial highlights present fairly, in all material respects, the financial position of Janus Aspen Forty Portfolio (one of the portfolios constituting Janus Aspen Series, hereafter referred to as the “Portfolio”) at December 31, 2015, the results of its operations for the year then ended, the changes in its net assets for each of the two years in the period then ended and the financial highlights for each of the five years in the period then ended, in conformity with accounting principles generally accepted in the United States of America. These financial statements and financial highlights (hereafter referred to as “financial statements”) are the responsibility of the Portfolio’s management; our responsibility is to express an opinion on these financial statements based on our audits. We conducted our audits of these financial statements in accordance with the standards of the Public Company Accounting Oversight Board (United States). Those standards require that we plan and perform the audit to obtain reasonable assurance about whether the financial statements are free of material misstatement. An audit includes examining, on a test basis, evidence supporting the amounts and disclosures in the financial statements, assessing the accounting principles used and significant estimates made by management, and evaluating the overall financial statement presentation. We believe that our audits, which included confirmation of securities at December 31, 2015 by correspondence with the custodian and transfer agent, provide a reasonable basis for our opinion.

Denver, Colorado
February 12, 2016
Janus Aspen Forty Portfolio
Additional Information (unaudited)
Proxy Voting Policies and Voting Record
A description of the policies and procedures that the Portfolio uses to determine how to vote proxies relating to its portfolio securities is available without charge: (i) upon request, by calling 1-800-525-0020 (toll free); (ii) on the Portfolio’s website at janus.com/proxyvoting; and (iii) on the SEC’s website at http://www.sec.gov. Additionally, information regarding the Portfolio’s proxy voting record for the most recent twelve-month period ended June 30 is also available, free of charge, through janus.com/ proxyvoting and from the SEC’s website at http://www.sec.gov.
Quarterly Portfolio Holdings
The Portfolio files its complete portfolio holdings (schedule of investments) with the SEC for the first and third quarters of each fiscal year on Form N-Q within 60 days of the end of such fiscal quarter. The Portfolio’s Form N-Q: (i) is available on the SEC’s website at http://www.sec.gov; (ii) may be reviewed and copied at the SEC’s Public Reference Room in Washington, D.C. (information on the Public Reference Room may be obtained by calling 1-800-SEC-0330); and (iii) is available without charge, upon request, by calling Janus at 1-800-525-0020 (toll free).
APPROVAL OF ADVISORY AGREEMENTS DURING THE PERIOD
The Trustees of Janus Investment Fund and Janus Aspen Series, each of whom serves as an “independent” Trustee (the “Trustees”), oversee the management of each Fund of Janus Investment Fund and each Portfolio of Janus Aspen Series (each, a “Fund” and collectively, the “Funds”), and as required by law, determine annually whether to continue the investment advisory agreement for each Fund and the subadvisory agreements for the 16 Funds that utilize subadvisers.
In connection with their most recent consideration of those agreements for each Fund, the Trustees received and reviewed information provided by Janus Capital and the respective subadvisers in response to requests of the Trustees and their independent legal counsel. They also received and reviewed information and analysis provided by, and in response to requests of, their independent fee consultant. Throughout their consideration of the agreements, the Trustees were advised by their independent legal counsel. The Trustees met with management to consider the agreements, and also met separately in executive session with their independent legal counsel and their independent fee consultant.
At a meeting held on December 9, 2015, based on the Trustees’ evaluation of the information provided by Janus Capital, the subadvisers, and the independent fee consultant, as well as other information, the Trustees determined that the overall arrangements between each Fund and Janus Capital and each subadviser, as applicable, were fair and reasonable in light of the nature, extent and quality of the services provided by Janus Capital, its affiliates and the subadvisers, the fees charged for those services, and other matters that the Trustees considered relevant in the exercise of their business judgment. At that meeting, the Trustees unanimously approved the continuation of the investment advisory agreement for each Fund, and the subadvisory agreement for each subadvised Fund, for the period from either January 1 or February 1, 2016 through January 1 or February 1, 2017, respectively, subject to earlier termination as provided for in each agreement.
In considering the continuation of those agreements, the Trustees reviewed and analyzed various factors that they determined were relevant, including the factors described below, none of which by itself was considered dispositive. However, the material factors and conclusions that formed the basis for the Trustees’ determination to approve the continuation of the agreements are discussed separately below. Also included is a summary of the independent fee consultant’s conclusions and opinions that arose during, and were included as part of, the Trustees’ consideration of the agreements. “Management fees,” as used herein, reflect actual annual advisory fees and any administration fees (excluding out of pocket costs), net of any waivers.
Nature, Extent and Quality of Services
The Trustees reviewed the nature, extent and quality of the services provided by Janus Capital and the subadvisers to the Funds, taking into account the investment objective, strategies and policies of each Fund, and the knowledge the Trustees gained from their regular meetings with management on at least a quarterly basis and their ongoing review of information related to the Funds. In addition, the Trustees reviewed the resources and key personnel of Janus Capital and each subadviser, particularly noting those employees who provide investment and risk management services to the Funds. The Trustees also considered other services provided to the Funds by Janus Capital or the subadvisers, such as managing the execution of portfolio transactions and the selection of broker-dealers for those transactions. The Trustees considered Janus Capital’s role as administrator to the Funds, noting that Janus Capital does not receive a fee
Janus Aspen Forty Portfolio
Additional Information (unaudited)
for its services but is reimbursed for its out-of-pocket costs. The Trustees considered the role of Janus Capital in monitoring adherence to the Funds’ investment restrictions, providing support services for the Trustees and Trustee committees, and overseeing communications with shareholders and the activities of other service providers, including monitoring compliance with various policies and procedures of the Funds and with applicable securities laws and regulations.
In this regard, the independent fee consultant noted that Janus Capital provides a number of different services for the Funds and Fund shareholders, ranging from investment management services to various other servicing functions, and that, in its opinion, Janus Capital is a capable provider of those services. The independent fee consultant also provided its belief that Janus Capital has developed a number of institutional competitive advantages that should enable it to provide superior investment and service performance over the long term.
The Trustees concluded that the nature, extent and quality of the services provided by Janus Capital or the subadviser to each Fund were appropriate and consistent with the terms of the respective advisory and subadvisory agreements, and that, taking into account steps taken to address those Funds whose performance lagged that of their peers for certain periods, the Funds were likely to benefit from the continued provision of those services. They also concluded that Janus Capital and each subadviser had sufficient personnel, with the appropriate education and experience, to serve the Funds effectively and had demonstrated its ability to attract well-qualified personnel.
Performance of the Funds
The Trustees considered the performance results of each Fund over various time periods. They noted that they considered Fund performance data throughout the year, including periodic meetings with each Fund’s portfolio manager(s), and also reviewed information comparing each Fund’s performance with the performance of comparable funds and peer groups identified by Broadridge Financial Solutions, Inc. (“Broadridge”), an independent data provider, and with the Fund’s benchmark index. In this regard, the independent fee consultant found that the overall Funds’ performance has been strong: for the 36 months ended September 30, 2015, approximately 70% of the Funds were in the top two Broadridge quartiles of performance, and for the 12 months ended September 30, 2015, approximately 61% of the Funds were in the top two Broadridge quartiles of performance.
The Trustees considered the performance of each Fund, noting that performance may vary by share class, and noted the following:
Fixed-Income Funds and Money Market Funds
· For Janus Flexible Bond Fund, the Trustees noted that the Fund’s performance was in the third Broadridge quartile for the 36 months ended May 31, 2015 and the third Broadridge quartile for the 12 months ended May 31, 2015. The Trustees noted the reasons for the Fund’s underperformance and the steps Janus Capital had taken or was taking to improve performance.
· For Janus Global Bond Fund, the Trustees noted that the Fund’s performance was in the second Broadridge quartile for the 36 months ended May 31, 2015 and the second Broadridge quartile for the 12 months ended May 31, 2015.
· For Janus Global Unconstrained Bond Fund, the Trustees noted that the Fund’s performance was in the bottom Broadridge quartile for the 12 months ended May 31, 2015. The Trustees noted the reasons for the Fund’s underperformance, the steps Janus Capital had taken or was taking to improve performance, and its limited performance history.
· For Janus High-Yield Fund, the Trustees noted that the Fund’s performance was in the third Broadridge quartile for the 36 months ended May 31, 2015 and the third Broadridge quartile for the 12 months ended May 31, 2015. The Trustees noted the reasons for the Fund’s underperformance and the steps Janus Capital had taken or was taking to improve performance.
· For Janus Multi-Sector Income Fund, the Trustees noted that the Fund’s performance was in the first Broadridge quartile for the 12 months ended May 31, 2015.
· For Janus Real Return Fund, the Trustees noted that the Fund’s performance was in the first Broadridge quartile for the 36 months ended May 31, 2015 and the first Broadridge quartile for the 12 months ended May 31, 2015.
Janus Aspen Forty Portfolio
Additional Information (unaudited)
· For Janus Short-Term Bond Fund, the Trustees noted that the Fund’s performance was in the second Broadridge quartile for the 36 months ended May 31, 2015 and the third Broadridge quartile for the 12 months ended May 31, 2015.
· For Janus Government Money Market Fund, the Trustees noted that the Fund’s performance was in the third Broadridge quartile for the 36 months ended May 31, 2015 and the third Broadridge quartile for the 12 months ended May 31, 2015. The Trustees noted the reasons for the Fund’s underperformance.
· For Janus Money Market Fund, the Trustees noted that the Fund’s performance was in the third Broadridge quartile for the 36 months ended May 31, 2015 and the bottom Broadridge quartile for the 12 months ended May 31, 2015. The Trustees noted the reasons for the Fund’s underperformance.
Asset Allocation Funds
· For Janus Global Allocation Fund – Conservative, the Trustees noted that the Fund’s performance was in the first Broadridge quartile for the 36 months ended May 31, 2015 and the third Broadridge quartile for the 12 months ended May 31, 2015.
· For Janus Global Allocation Fund – Growth, the Trustees noted that the Fund’s performance was in the third Broadridge quartile for the 36 months ended May 31, 2015 and the bottom Broadridge quartile for the 12 months ended May 31, 2015. The Trustees noted the reasons for the Fund’s underperformance and the steps Janus Capital had taken or was taking to improve performance.
· For Janus Global Allocation Fund – Moderate, the Trustees noted that the Fund’s performance was in the second Broadridge quartile for the 36 months ended May 31, 2015 and the third Broadridge quartile for the 12 months ended May 31, 2015.
Alternative Fund
· For Janus Diversified Alternatives Fund, the Trustees noted that the Fund’s performance was in the second Broadridge quartile for the 12 months ended May 31, 2015.
Value Funds
· For Perkins International Value Fund, the Trustees noted that the Fund’s performance was in the second Broadridge quartile for the 12 months ended May 31, 2015.
· For Perkins Global Value Fund, the Trustees noted that the Fund’s performance was in the third Broadridge quartile for the 36 months ended May 31, 2015 and the third Broadridge quartile for the 12 months ended May 31, 2015. The Trustees noted the reasons for the Fund’s underperformance, noting that the Fund has a performance fee structure that results in lower management fees during periods of underperformance, and the steps Janus Capital and Perkins had taken or were taking to improve performance.
· For Perkins Large Cap Value Fund, the Trustees noted that the Fund’s performance was in the bottom Broadridge quartile for the 36 months ended May 31, 2015 and the bottom Broadridge quartile for the 12 months ended May 31, 2015. The Trustees noted the reasons for the Fund’s underperformance, noting that the Fund has a performance fee structure that results in lower management fees during periods of underperformance, and the steps Janus Capital and Perkins had taken or were taking to improve performance.
· For Perkins Mid Cap Value Fund, the Trustees noted that the Fund’s performance was in the bottom Broadridge quartile for the 36 months ended May 31, 2015 and the bottom Broadridge quartile for the 12 months ended May 31, 2015. The Trustees noted the reasons for the Fund’s underperformance, noting that the Fund has a performance fee structure that results in lower management fees during periods of underperformance, and the steps Janus Capital and Perkins had taken or were taking to improve performance.
· For Perkins Select Value Fund, the Trustees noted that the Fund’s performance was in the bottom Broadridge quartile for the 36 months ended May 31, 2015 and the second Broadridge quartile for the 12 months ended May 31, 2015. The Trustees noted the reasons for the Fund’s underperformance, noting that the Fund has a performance fee structure that results in lower management fees during periods of underperformance, the steps Janus Capital and Perkins had taken or were taking to improve performance, and that the performance trend was improving.
Janus Aspen Forty Portfolio
Additional Information (unaudited)
· For Perkins Small Cap Value Fund, the Trustees noted that the Fund’s performance was in the bottom Broadridge quartile for the 36 months ended May 31, 2015 and the second Broadridge quartile for the 12 months ended May 31, 2015. The Trustees noted the reasons for the Fund’s underperformance, noting that the Fund has a performance fee structure that results in lower management fees during periods of underperformance, the steps Janus Capital and Perkins had taken or were taking to improve performance, and that the performance trend was improving.
· For Perkins Value Plus Income Fund, the Trustees noted that the Fund’s performance was in the second Broadridge quartile for the 36 months ended May 31, 2015 and the second Broadridge quartile for the 12 months ended May 31, 2015.
Mathematical Funds
· For INTECH Emerging Markets Managed Volatility Fund, the Trustees noted that, due to limited performance for the Fund, performance history was not a material factor.
· For INTECH Global Income Managed Volatility Fund, the Trustees noted that the Fund’s performance was in the first Broadridge quartile for the 36 months ended May 31, 2015 and the third Broadridge quartile for the 12 months ended May 31, 2015.
· For INTECH International Managed Volatility Fund, the Trustees noted that the Fund’s performance was in the bottom Broadridge quartile for the 36 months ended May 31, 2015 and the bottom Broadridge quartile for the 12 months ended May 31, 2015. The Trustees noted the reasons for the Fund’s underperformance and the steps Janus Capital and INTECH had taken or were taking to improve performance.
· For INTECH U.S. Core Fund, the Trustees noted that the Fund’s performance was in the second Broadridge quartile for the 36 months ended May 31, 2015 and the second Broadridge quartile for the 12 months ended May 31, 2015.
· For INTECH U.S. Managed Volatility Fund, the Trustees noted that the Fund’s performance was in the second Broadridge quartile for the 36 months ended May 31, 2015 and the third Broadridge quartile for the 12 months ended May 31, 2015.
Growth and Core Funds
· For Janus Balanced Fund, the Trustees noted that the Fund’s performance was in the first Broadridge quartile for the 36 months ended May 31, 2015 and the first Broadridge quartile for the 12 months ended May 31, 2015.
· For Janus Contrarian Fund, the Trustees noted that the Fund’s performance was in the first Broadridge quartile for the 36 months ended May 31, 2015 and the bottom Broadridge quartile for the 12 months ended May 31, 2015.
· For Janus Enterprise Fund, the Trustees noted that the Fund’s performance was in the second Broadridge quartile for the 36 months ended May 31, 2015 and the first Broadridge quartile for the 12 months ended May 31, 2015.
· For Janus Forty Fund, the Trustees noted that the Fund’s performance was in the second Broadridge quartile for the 36 months ended May 31, 2015 and the first Broadridge quartile for the 12 months ended May 31, 2015.
· For Janus Fund, the Trustees noted that the Fund’s performance was in the second Broadridge quartile for the 36 months ended May 31, 2015 and the first Broadridge quartile for the 12 months ended May 31, 2015.
· For Janus Growth and Income Fund, the Trustees noted that the Fund’s performance was in the third Broadridge quartile for the 36 months ended May 31, 2015 and in the third Broadridge quartile for the 12 months ended May 31, 2015. The Trustees noted the reasons for the Fund’s underperformance and the steps Janus Capital had taken or was taking to improve performance.
· For Janus Research Fund, the Trustees noted that the Fund’s performance was in the first Broadridge quartile for the 36 months ended May 31, 2015 and the first Broadridge quartile for the 12 months ended May 31, 2015.
Janus Aspen Forty Portfolio
Additional Information (unaudited)
· For Janus Triton Fund, the Trustees noted that the Fund’s performance was in the second Broadridge quartile for the 36 months ended May 31, 2015 and the first Broadridge quartile for the 12 months ended May 31, 2015.
· For Janus Twenty Fund, the Trustees noted that the Fund’s performance was in the third Broadridge quartile for the 36 months ended May 31, 2015 and the bottom Broadridge quartile for the 12 months ended May 31, 2015. The Trustees noted the reasons for the Fund’s underperformance, noting that the Fund has a performance fee structure that results in lower management fees during periods of underperformance, and the steps Janus Capital had taken or was taking to improve performance.
· For Janus Venture Fund, the Trustees noted that the Fund’s performance was in the first Broadridge quartile for the 36 months ended May 31, 2015 and the first Broadridge quartile for the 12 months ended May 31, 2015.
Global and International Funds
· For Janus Asia Equity Fund, the Trustees noted that the Fund’s performance was in the third Broadridge quartile for the 36 months ended May 31, 2015 and the first Broadridge quartile for the 12 months ended May 31, 2015. The Trustees noted the reasons for the Fund’s underperformance, noting that the Fund has a performance fee structure that results in lower management fees during periods of underperformance, the steps Janus Capital had taken or was taking to improve performance, and that the performance trend was improving.
· For Janus Emerging Markets Fund, the Trustees noted that the Fund’s performance was in the second Broadridge quartile for the 36 months ended May 31, 2015 and the first Broadridge quartile for the 12 months ended May 31, 2015.
· For Janus Global Life Sciences Fund, the Trustees noted that the Fund’s performance was in the first Broadridge quartile for the 36 months ended May 31, 2015 and the first Broadridge quartile for the 12 months ended May 31, 2015.
· For Janus Global Real Estate Fund, the Trustees noted that the Fund’s performance was in the first Broadridge quartile for the 36 months ended May 31, 2015 and the first Broadridge quartile for the 12 months ended May 31, 2015.
· For Janus Global Research Fund, the Trustees noted that the Fund’s performance was in the second Broadridge quartile for the 36 months ended May 31, 2015 and the first Broadridge quartile for the 12 months ended May 31, 2015.
· For Janus Global Select Fund, the Trustees noted that the Fund’s performance was in the second Broadridge quartile for the 36 months ended May 31, 2015 and the first Broadridge quartile for the 12 months ended May 31, 2015.
· For Janus Global Technology Fund, the Trustees noted that the Fund’s performance was in the third Broadridge quartile for the 36 months ended May 31, 2015 and the third Broadridge quartile for the 12 months ended May 31, 2015. The Trustees noted the reasons for the Fund’s underperformance and the steps Janus Capital had taken or was taking to improve performance.
· For Janus International Equity Fund, the Trustees noted that the Fund’s performance was in the second Broadridge quartile for the 36 months ended May 31, 2015 and the second Broadridge quartile for the 12 months ended May 31, 2015.
· For Janus Overseas Fund, the Trustees noted that the Fund’s performance was in the bottom Broadridge quartile for the 36 months ended May 31, 2015 and the bottom Broadridge quartile for the 12 months ended May 31, 2015. The Trustees noted the reasons for the Fund’s underperformance, noting that the Fund has a performance fee structure that results in lower management fees during periods of underperformance, and the steps Janus Capital had taken or was taking to improve performance.
Janus Aspen Forty Portfolio
Additional Information (unaudited)
Janus Aspen Series
· For Janus Aspen Balanced Portfolio, the Trustees noted that the Fund’s performance was in the first Broadridge quartile for the 36 months ended May 31, 2015 and the first Broadridge quartile for the 12 months ended May 31, 2015.
· For Janus Aspen Enterprise Portfolio, the Trustees noted that the Fund’s performance was in the second Broadridge quartile for the 36 months ended May 31, 2015 and the first Broadridge quartile for the 12 months ended May 31, 2015.
· For Janus Aspen Flexible Bond Portfolio, the Trustees noted that the Fund’s performance was in the second Broadridge quartile for the 36 months ended May 31, 2015 and the second Broadridge quartile for the 12 months ended May 31, 2015.
· For Janus Aspen Forty Portfolio, the Trustees noted that the Fund’s performance was in the second Broadridge quartile for the 36 months ended May 31, 2015 and the first Broadridge quartile for the 12 months ended May 31, 2015.
· For Janus Aspen Global Allocation Portfolio – Moderate, the Trustees noted that the Fund’s performance was in the first Broadridge quartile for the 36 months ended May 31, 2015 and the bottom Broadridge quartile for the 12 months ended May 31, 2015.
· For Janus Aspen Global Research Portfolio, the Trustees noted that the Fund’s performance was in the first Broadridge quartile for the 36 months ended May 31, 2015 and the second Broadridge quartile for the 12 months ended May 31, 2015.
· For Janus Aspen Global Technology Portfolio, the Trustees noted that the Fund’s performance was in the second Broadridge quartile for the 36 months ended May 31, 2015 and the third Broadridge quartile for the 12 months ended May 31, 2015.
· For Janus Aspen Global Unconstrained Bond Portfolio, the Trustees noted that, due to limited performance for the Fund, performance history was not a material factor.
· For Janus Aspen INTECH U.S. Low Volatility Portfolio, the Trustees noted that the Fund’s performance was in the first Broadridge quartile for the 12 months ended May 31, 2015.
· For Janus Aspen Janus Portfolio, the Trustees noted that the Fund’s performance was in the second Broadridge quartile for the 36 months ended May 31, 2015 and the first Broadridge quartile for the 12 months ended May 31, 2015.
· For Janus Aspen Overseas Portfolio, the Trustees noted that the Fund’s performance was in the bottom Broadridge quartile for the 36 months ended May 31, 2015 and the bottom Broadridge quartile for the 12 months ended May 31, 2015. The Trustees noted the reasons for the Fund’s underperformance, noting that the Fund has a performance fee structure that results in lower management fees during periods of underperformance, and the steps Janus Capital had taken or was taking to improve performance.
· For Janus Aspen Perkins Mid Cap Value Portfolio, the Trustees noted that the Fund’s performance was in the bottom Broadridge quartile for the 36 months ended May 31, 2015 and the bottom Broadridge quartile for the 12 months ended May 31, 2015. The Trustees noted the reasons for the Fund’s underperformance, noting that the Fund has a performance fee structure that results in lower management fees during periods of underperformance, and the steps Janus Capital and Perkins had taken or were taking to improve performance.
In consideration of each Fund’s performance, the Trustees concluded that, taking into account the factors relevant to performance, as well as other considerations, including steps taken to improve performance, the Fund’s performance warranted continuation of the Fund’s investment advisory and subadvisory agreement(s).
Costs of Services Provided
The Trustees examined information regarding the fees and expenses of each Fund in comparison to similar information for other comparable funds as provided by Broadridge, an independent data provider. They also reviewed an analysis of that information provided by their independent fee consultant and noted that the rate of management (investment advisory and any administration, but excluding out-of-pocket costs) fees for many of the Funds, after applicable waivers,
Janus Aspen Forty Portfolio
Additional Information (unaudited)
was below the mean management fee rate of the respective peer group of funds selected by an independent data provider. The Trustees also examined information regarding the subadvisory fees charged for subadvisory services, as applicable, noting that all such fees were paid by Janus Capital out of its management fees collected from such Fund.
The independent fee consultant provided its belief that the management fees charged by Janus Capital to each of the Funds under the current investment advisory and administration agreements are reasonable in relation to the services provided by Janus Capital. The independent fee consultant found: (1) the total expenses and management fees of the Funds to be reasonable relative to other mutual funds; (2) total expenses, on average, were 14% below the mean total expenses of their respective Broadridge Expense Group peers and 24% below the mean total expenses for their Broadridge Expense Universes; (3) management fees for the Funds, on average, were 15% below the mean management fees for their Expense Groups and 19% below the mean for their Expense Universes; and (4) Fund expenses at the functional level for each asset and share class category were reasonable. The Trustees also considered the total expenses for each share class of each Fund compared to the mean total expenses for its Broadridge Expense Group peers and to mean total expenses for its Broadridge Expense Universe.
The independent fee consultant concluded that, based on its strategic review of expenses at the complex, category and individual fund level, Fund expenses were found to be reasonable relative to both Expense Group and Expense Universe benchmarks. Further, for certain Funds, the independent fee consultant also performed a systematic “focus list” analysis of expenses in the context of the performance or service delivered to each set of investors in each share class in each selected Fund. Based on this analysis, the independent fee consultant found that the combination of service quality/performance and expenses on these individual Funds and share classes were reasonable in light of performance trends, performance histories, and existence of performance fees, breakpoints, and expense waivers on such Funds.
The Trustees considered the methodology used by Janus Capital and each subadviser in determining compensation payable to portfolio managers, the competitive environment for investment management talent, and the competitive market for mutual funds in different distribution channels.
The Trustees also reviewed management fees charged by Janus Capital and each subadviser to comparable separate account clients and to comparable non-affiliated funds subadvised by Janus Capital or by a subadviser (for which Janus Capital or the subadviser provides only or primarily portfolio management services). Although in most instances subadvisory and separate account fee rates for various investment strategies were lower than management fee rates for Funds having a similar strategy, the Trustees considered that Janus Capital noted that, under the terms of the management agreements with the Funds, Janus Capital performs significant additional services for the Funds that it does not provide to those other clients, including administration services, oversight of the Funds’ other service providers, trustee support, regulatory compliance and numerous other services, and that, in serving the Funds, Janus Capital assumes many legal risks and other costs that it does not assume in servicing its other clients. Moreover, they noted that the independent fee consultant found that: (1) the management fees Janus Capital charges to the Funds are reasonable in relation to the management fees Janus Capital charges to its institutional and subadvised accounts; (2) these institutional and subadvised accounts have different service and infrastructure needs; (3) the average spread between management fees charged to the Funds and those charged to Janus Capital’s institutional accounts is reasonable relative to the average spreads seen in the industry; and (4) by one estimation methodology, the fee margins implied by Janus Capital’s subadvised fees when compared to its mutual fund fees are reasonable relative to the estimated fee margins in the industry and relative to estimated fee margins of fund managers using Janus Capital as a subadviser.
The Trustees considered the fees for each Fund for its fiscal year ended in 2014, and noted the following with regard to each Fund’s total expenses, net of applicable fee waivers (the Fund’s “total expenses”):
Fixed-Income Funds and Money Market Funds
· For Janus Flexible Bond Fund, the Trustees noted that, although the Fund’s total expenses exceeded the peer group mean for certain share classes, overall the Fund’s total expenses were reasonable. The Trustees also noted that Janus Capital has contractually agreed to limit the Fund’s expenses, although this limit did not apply because the Fund’s total expenses were already below the applicable fee limit.
Janus Aspen Forty Portfolio
Additional Information (unaudited)
· For Janus Global Bond Fund, the Trustees noted that although the Fund’s total expenses exceeded the peer group mean for certain share classes, overall the Fund’s total expenses were reasonable. The Trustees also noted that Janus Capital has contractually agreed to limit the Fund’s expenses.
· For Janus Global Unconstrained Bond Fund, the Trustees noted that although the Fund’s total expenses exceeded the peer group mean for certain share classes, overall the Fund’s total expenses were reasonable. The Trustees also noted that Janus Capital has contractually agreed to limit the Fund’s expenses.
· For Janus High-Yield Fund, the Trustees noted that, although the Fund’s total expenses exceeded the peer group mean for certain share classes, overall the Fund’s total expenses were reasonable. The Trustees also noted that Janus Capital has contractually agreed to limit the Fund’s expenses, although this limit did not apply because the Fund’s total expenses were already below the applicable fee limit.
· For Janus Multi-Sector Income Fund, the Trustees noted that, although the Fund’s total expenses exceeded the peer group mean for certain share classes, overall the Fund’s total expenses were reasonable. The Trustees also noted that Janus has contractually agreed to limit the Fund’s expenses.
· For Janus Real Return Fund, the Trustees noted that, although the Fund’s total expenses exceeded the peer group mean for all share classes, overall the Fund’s total expenses were reasonable. The Trustees also noted that Janus Capital has contractually agreed to limit the Fund’s expenses.
· For Janus Short-Term Bond Fund, the Trustees noted that, although the Fund’s total expenses exceeded the peer group mean for all share classes, overall the Fund’s total expenses were reasonable. The Trustees also noted that Janus Capital has contractually agreed to limit the Fund’s expenses.
· For Janus Government Money Market Fund, the Trustees noted that the Fund’s total expenses exceeded the peer group mean for both share classes. The Trustees considered that management fees for this Fund are higher than the peer group mean due to the Fund’s management fee including other costs, such as custody and transfer agent services, while many funds in the peer group pay these expenses separately from their management fee. In addition, the Trustees considered that Janus Capital voluntarily waives one-half of its advisory fee and other expenses in order to maintain a positive yield.
· For Janus Money Market Fund, the Trustees noted that the Fund’s total expenses were below the peer group mean for both share classes. In addition, the Trustees considered that Janus Capital voluntarily waives one-half of its advisory fee and other expenses in order to maintain a positive yield.
Asset Allocation Funds
· For Janus Global Allocation Fund – Conservative, the Trustees noted that the Fund’s total expenses were below the peer group mean for all share classes.
· For Janus Global Allocation Fund – Growth, the Trustees noted that the Fund’s total expenses were below the peer group mean for all share classes.
· For Janus Global Allocation Fund – Moderate, the Trustees noted that, although the Fund’s total expenses exceeded the peer group mean for certain share classes, overall the Fund’s total expenses were reasonable. The Trustees also noted that Janus Capital has contractually agreed to limit the Fund’s expenses.
Alternative Fund
· For Janus Diversified Alternatives Fund, the Trustees noted that, although the Fund’s total expenses exceeded the peer group mean for one share class, overall the Fund’s total expenses were reasonable. The Trustees also noted that Janus Capital has contractually agreed to limit the Fund’s expenses.
Value Funds
· For Perkins International Value Fund, the Trustees noted that, although the Fund’s total expenses exceeded the peer group mean for certain share classes, overall the Fund’s total expenses were reasonable. The Trustees also noted that Janus Capital has contractually agreed to limit the Fund’s expenses.
· For Perkins Global Value Fund, the Trustees noted that, although the Fund’s total expenses exceeded the peer group mean for one share class, overall the Fund’s total expenses were reasonable.
Janus Aspen Forty Portfolio
Additional Information (unaudited)
· For Perkins Large Cap Value Fund, the Trustees noted that, although the Fund’s total expenses exceeded the peer group mean for certain share classes, overall the Fund’s total expenses were reasonable. The Trustees also noted that Janus Capital has contractually agreed to limit the Fund’s expenses.
· For Perkins Mid Cap Value Fund, the Trustees noted that, although the Fund’s total expenses exceeded the peer group mean for one share class, overall the Fund’s total expenses were reasonable. The Trustees also noted that Janus Capital has contractually agreed to limit the Fund’s expenses, although this limit did not apply because the Fund’s total expenses were already below the applicable fee limit.
· For Perkins Select Value Fund, the Trustees noted that, although the Fund’s total expenses exceeded the peer group mean for one share class, overall the Fund’s total expenses were reasonable. The Trustees also noted that Janus Capital has contractually agreed to limit the Fund’s expenses.
· For Perkins Small Cap Value Fund, the Trustees noted that the Fund’s total expenses were below the peer group mean for all share classes.
· For Perkins Value Plus Income Fund, the Trustees noted that although the Fund’s total expenses exceeded the peer group mean for one share class, overall the Fund’s total expenses were reasonable. The Trustees also noted that Janus Capital had contractually agreed to limit the Fund’s expenses.
Mathematical Funds
· For INTECH Emerging Markets Managed Volatility Fund, the Trustees noted that although the Fund’s total expenses exceeded the peer group mean for certain share classes, overall the Fund’s total expenses were reasonable. The Trustees also noted that Janus Capital has contractually agreed to limit the Fund’s expenses.
· For INTECH Global Income Managed Volatility Fund, the Trustees noted that the Fund’s total expenses were below the peer group mean for all share classes.
· For INTECH International Managed Volatility Fund, the Trustees noted that although the Fund’s total expenses exceeded the peer group mean for one share class, overall the Fund’s total expenses were reasonable. The Trustees also noted that Janus Capital had contractually agreed to limit the Fund’s expenses, although this limit did not apply because the Fund’s total expenses were already below the applicable fee limit.
· For INTECH U.S. Core Fund, the Trustees noted that although the Fund’s total expenses exceeded the peer group mean for one share class, overall the Fund’s total expenses were reasonable. The Trustees also noted that Janus Capital has contractually agreed to limit the Fund’s expenses, although this limit did not apply because the Fund’s total expenses were already below the applicable fee limit.
· For INTECH U.S. Managed Volatility Fund, the Trustees noted that the Fund’s total expenses exceeded the peer group mean for one share class. The Trustees also noted that Janus Capital had contractually agreed to limit the Fund’s expenses.
Growth and Core Funds
· For Janus Balanced Fund, the Trustees noted that, although the Fund’s total expenses exceeded the peer group mean for one share class, overall the Fund’s total expenses were reasonable. The Trustees also noted that Janus Capital has contractually agreed to limit the Fund’s expenses, although this limit did not apply because the Fund’s total expenses were already below the applicable fee limit.
· For Janus Contrarian Fund, the Trustees noted that, although the Fund’s total expenses exceeded the peer group mean for certain share classes, overall the Fund’s total expenses were reasonable. The Trustees also noted that Janus Capital has contractually agreed to limit the Fund’s expenses, although this limit did not apply because the Fund’s total expenses were already below the applicable fee limit.
· For Janus Enterprise Fund, the Trustees noted that, although the Fund’s total expenses exceeded the peer group mean for certain share classes, overall the Fund’s total expenses were reasonable. The Trustees also noted that Janus Capital has contractually agreed to limit the Fund’s expenses, although this limit did not apply because the Fund’s total expenses were already below the applicable fee limit.
· For Janus Forty Fund, the Trustees noted that the Fund’s total expenses were below the peer group mean for all share classes.
Janus Aspen Forty Portfolio
Additional Information (unaudited)
· For Janus Fund, the Trustees noted that the Fund’s total expenses were below the peer group mean for all share classes.
· For Janus Growth and Income Fund, the Trustees noted that, although the Fund’s total expenses exceeded the peer group mean for certain share classes, overall the Fund’s total expenses were reasonable. The Trustees also noted that Janus Capital has contractually agreed to limit the Fund’s expenses, although this limit did not apply because the Fund’s total expenses were already below the applicable fee limit.
· For Janus Research Fund, the Trustees noted that the Fund’s total expenses were below the peer group mean for all share classes.
· For Janus Triton Fund, the Trustees noted that, although the Fund’s total expenses exceeded the peer group mean for one share class, overall the Fund’s total expenses were reasonable. The Trustees also noted that Janus Capital has contractually agreed to limit the Fund’s expenses, although this limit did not apply because the Fund’s total expenses were already below the applicable fee limit.
· For Janus Twenty Fund, the Trustees noted that the Fund’s total expenses were below the peer group mean for all share classes.
· For Janus Venture Fund, the Trustees noted that, although the Fund’s total expenses exceeded the peer group mean for one share class, overall the Fund’s total expenses were reasonable. The Trustees also noted that Janus Capital has contractually agreed to limit the Fund’s expenses, although this limit did not apply because the Fund’s total expenses were already below the applicable fee limit.
Global and International Funds
· For Janus Asia Equity Fund, the Trustees noted that the Fund’s total expenses were below the peer group mean for all share classes.
· For Janus Emerging Markets Fund, the Trustees noted that, although the Fund’s total expenses exceeded the peer group mean for certain share classes, overall the Fund’s total expenses were reasonable. The Trustees also noted that Janus Capital has contractually agreed to limit the Fund’s expenses.
· For Janus Global Life Sciences Fund, the Trustees noted that the Fund’s total expenses were below the peer group mean for all share classes.
· For Janus Global Real Estate Fund, the Trustees noted that, although the Fund’s total expenses exceeded the peer group mean for one share class, overall the Fund’s total expenses were reasonable. The Trustees also noted that Janus Capital has contractually agreed to limit the Fund’s expenses.
· For Janus Global Research Fund, the Trustees noted that the Fund’s total expenses were below the peer group mean for all share classes.
· For Janus Global Select Fund, the Trustees noted that the Fund’s total expenses were below the peer group mean for all share classes.
· For Janus Global Technology Fund, the Trustees noted that the Fund’s total expenses were below the peer group mean for all share classes.
· For Janus International Equity Fund, the Trustees noted that, although the Fund’s total expenses exceeded the peer group mean for one share class, overall the Fund’s total expenses were reasonable. The Trustees also noted that Janus Capital has contractually agreed to limit the Fund’s expenses, although this limit did not apply because the Fund’s total expenses were already below the applicable fee limit.
· For Janus Overseas Fund, the Trustees noted that the Fund’s total expenses were below the peer group mean for all share classes.
Janus Aspen Series
· For Janus Aspen Balanced Portfolio, the Trustees noted that the Fund’s total expenses were below the peer group mean for both share classes.
Janus Aspen Forty Portfolio
Additional Information (unaudited)
· For Janus Aspen Enterprise Portfolio, the Trustees noted that the Fund’s total expenses were below the peer group mean for both share classes.
· For Janus Aspen Flexible Bond Portfolio, the Trustees noted that, although the Fund’s total expenses exceeded the peer group mean for one share class, overall the Fund’s total expenses were reasonable. The Trustees also noted that Janus Capital had contractually agreed to limit the Fund’s expenses.
· For Janus Aspen Forty Portfolio, the Trustees noted that the Fund’s total expenses were below the peer group mean for both share classes.
· For Janus Aspen Global Allocation Portfolio - Moderate, the Trustees noted that, although the Fund’s total expenses exceeded the peer group mean for both share classes, overall the Fund’s total expenses were reasonable. The Trustees also noted that Janus Capital has contractually agreed to limit the Fund’s expenses.
· For Janus Aspen Global Research Portfolio, the Trustees noted that the Fund’s total expenses were below the peer group mean for both share classes.
· For Janus Aspen Global Technology Portfolio, the Trustees noted that the Fund’s total expenses were below the peer group mean for both share classes.
· For Janus Aspen Global Unconstrained Bond Portfolio, the Trustees noted that, although the Fund’s total expenses exceeded the peer group mean for both share classes, overall the Fund’s total expenses were reasonable. The Trustees also noted that Janus Capital had contractually agreed to limit the Fund’s expenses.
· For Janus Aspen INTECH U.S. Low Volatility Portfolio, the Trustees noted that the Fund’s total expenses were below the peer group mean for its sole share class.
· For Janus Aspen Janus Portfolio, the Trustees noted that the Fund’s total expenses were below the peer group mean for both share classes.
· For Janus Aspen Overseas Portfolio, the Trustees noted that the Fund’s total expenses were below the peer group mean for both share classes.
· For Janus Aspen Perkins Mid Cap Value Portfolio, the Trustees noted that the Fund’s total expenses were below the peer group mean for both share classes.
The Trustees reviewed information on the profitability to Janus Capital and its affiliates of their relationships with each Fund, as well as an explanation of the methodology utilized by Janus Capital when allocating various expenses of Janus Capital and its affiliates with respect to contractual relationships with the Funds and other clients. The Trustees also reviewed the financial statements and corporate structure of Janus Capital’s parent company. In their review, the Trustees considered whether Janus Capital and each subadviser receive adequate incentives and resources to manage the Funds effectively. The Trustees recognized that profitability comparisons among fund managers are difficult because very little comparative information is publicly available, and the profitability of any fund manager is affected by numerous factors, including the organizational structure of the particular fund manager, the types of funds and other accounts it manages, possible other lines of business, the methodology for allocating expenses, and the fund manager’s capital structure and cost of capital. However, taking into account those factors and the analysis provided by the Trustees’ independent fee consultant, and based on the information available, the Trustees concluded that Janus Capital’s profitability with respect to each Fund in relation to the services rendered was reasonable.
The independent fee consultant found that, while assessing the reasonableness of expenses in light of Janus Capital’s profits is dependent on comparisons with other publicly-traded mutual fund advisers, and that these comparisons are limited in accuracy by differences in complex size, business mix, institutional account orientation, and other factors, after accepting these limitations, the level of profit earned by Janus Capital from managing the Funds is reasonable.
The Trustees concluded that the management fees payable by each Fund to Janus Capital and its affiliates, as well as the fees paid by Janus Capital to the subadvisers of subadvised Funds, were reasonable in relation to the nature, extent, and quality of the services provided, taking into account the fees charged by other advisers for managing comparable mutual funds with similar strategies, the fees Janus Capital and the subadvisers charge to other clients, and, as applicable, the impact of fund performance on management fees payable by the Funds. The Trustees also concluded that each Fund’s total expenses were reasonable, taking into account the size of the Fund, the quality of services
Janus Aspen Forty Portfolio
Additional Information (unaudited)
provided by Janus Capital and any subadviser, the investment performance of the Fund, and any expense limitations agreed to or provided by Janus Capital.
Economies of Scale
The Trustees considered information about the potential for Janus Capital to realize economies of scale as the assets of the Funds increase. They noted that their independent fee consultant provided an analysis of economies of scale, which included discussion of analysis from prior years. They also noted that, although many Funds pay advisory fees at a base fixed rate as a percentage of net assets, without any breakpoints, their independent fee consultant concluded that 85% of these Funds have contractual management fees (gross of waivers) below their Broadridge expense group averages and, overall, 80% of the Funds are below their respective expense group averages for contractual management fees. They also noted that for those Funds whose expenses are being reduced by the contractual expense limitations of Janus Capital, Janus Capital is subsidizing the Funds because they have not reached adequate scale. Moreover, as the assets of some of the Funds have declined in the past few years, certain Funds have benefited from having advisory fee rates that have remained constant rather than increasing as assets declined. In addition, performance fee structures have been implemented for various Funds that have caused the effective rate of advisory fees payable by such a Fund to vary depending on the investment performance of the Fund relative to its benchmark index over the measurement period; and a few Funds have fee schedules with breakpoints and reduced fee rates above certain asset levels. The Trustees also noted that the Funds share directly in economies of scale through the lower charges of third-party service providers that are based in part on the combined scale of all of the Funds. Based on all of the information they reviewed, including research and analysis conducted by the Trustees’ independent fee consultant, the Trustees concluded that the current fee structure of each Fund was reasonable and that the current rates of fees do reflect a sharing between Janus Capital and the Fund of any economies of scale that may be present at the current asset level of the Fund.
The independent fee consultant concluded that, given the limitations of various analytical approaches to economies of scale considered in prior years, and their conflicting results, its analyses could not confirm or deny the existence of economies of scale in the Janus complex. Further, the independent fee consultant provided its belief that Fund investors are well-served by the fee levels and performance fee structures in place on the Funds in light of any economies of scale that may be present at Janus Capital.
Other Benefits to Janus Capital
The Trustees also considered benefits that accrue to Janus Capital and its affiliates and subadvisers to the Funds from their relationships with the Funds. They recognized that two affiliates of Janus Capital separately serve the Funds as transfer agent and distributor, respectively, and the transfer agent receives compensation directly from the non-money market funds for services provided. The Trustees also considered Janus Capital’s past and proposed use of commissions paid by the Funds on portfolio brokerage transactions to obtain proprietary and third-party research products and services benefiting the Fund and/or other clients of Janus Capital and/or Janus Capital, and/or a subadviser to a Fund. The Trustees concluded that Janus Capital’s and the subadvisers’ use of these types of client commission arrangements to obtain proprietary and third-party research products and services was consistent with regulatory requirements and guidelines and was likely to benefit each Fund. The Trustees also concluded that, other than the services provided by Janus Capital and its affiliates and subadvisers pursuant to the agreements and the fees to be paid by each Fund therefor, the Funds and Janus Capital and the subadvisers may potentially benefit from their relationship with each other in other ways. They concluded that Janus Capital and/or the subadvisers benefits from the receipt of research products and services acquired through commissions paid on portfolio transactions of the Funds and that the Funds benefit from Janus Capital’s and/or the subadvisers’ receipt of those products and services as well as research products and services acquired through commissions paid by other clients of Janus Capital and/or other clients of the subadvisers. They further concluded that the success of any Fund could attract other business to Janus Capital, the subadvisers or other Janus funds, and that the success of Janus Capital and the subadvisers could enhance Janus Capital’s and the subadvisers’ ability to serve the Funds.
Janus Aspen Forty Portfolio
Useful Information About Your Portfolio Report (unaudited)
Management Commentary
The Management Commentary in this report includes valuable insight as well as statistical information to help you understand how your Portfolio’s performance and characteristics stack up against those of comparable indices.
If the Portfolio invests in foreign securities, this report may include information about country exposure. Country exposure is based primarily on the country of risk. A company may be allocated to a country based on other factors such as location of the company’s principal office, the location of the principal trading market for the company’s securities, or the country where a majority of the company’s revenues are derived.
Please keep in mind that the opinions expressed in the Management Commentary are just that: opinions. They are a reflection based on best judgment at the time this report was compiled, which was December 31, 2015. As the investing environment changes, so could opinions. These views are unique and are not necessarily shared by fellow employees or by Janus in general.
Performance Overviews
Performance overview graphs compare the performance of a hypothetical $10,000 investment in the Portfolio with one or more widely used market indices. When comparing the performance of the Portfolio with an index, keep in mind that market indices are not available for investment and do not reflect deduction of expenses.
Average annual total returns are quoted for a Portfolio with more than one year of performance history. Average annual total return is calculated by taking the growth or decline in value of an investment over a period of time, including reinvestment of dividends and distributions, then calculating the annual compounded percentage rate that would have produced the same result had the rate of growth been constant throughout the period. Average annual total return does not reflect the deduction of taxes that a shareholder would pay on Portfolio distributions or redemptions of Portfolio shares.
Cumulative total returns are quoted for a Portfolio with less than one year of performance history. Cumulative total return is the growth or decline in value of an investment over time, independent of the period of time involved. Cumulative total return does not reflect the deduction of taxes that a shareholder would pay on Portfolio distributions or redemptions of Portfolio shares.
Pursuant to federal securities rules, expense ratios shown in the performance chart reflect subsidized (if applicable) and unsubsidized ratios. The total annual fund operating expenses ratio is gross of any fee waivers, reflecting the Portfolio’s unsubsidized expense ratio. The net annual fund operating expenses ratio (if applicable) includes contractual waivers of Janus Capital and reflects the Portfolio’s subsidized expense ratio. Ratios may be higher or lower than those shown in the “Financial Highlights” in this report.
Schedule of Investments
Following the performance overview section is the Portfolio’s Schedule of Investments. This schedule reports the types of securities held in the Portfolio on the last day of the reporting period. Securities are usually listed by type (common stock, corporate bonds, U.S. Government obligations, etc.) and by industry classification (banking, communications, insurance, etc.). Holdings are subject to change without notice.
The value of each security is quoted as of the last day of the reporting period. The value of securities denominated in foreign currencies is converted into U.S. dollars.
If the Portfolio invests in foreign securities, it will also provide a summary of investments by country. This summary reports the Portfolio exposure to different countries by providing the percentage of securities invested in each country. The country of each security represents the country of risk. The Portfolio’s Schedule of Investments relies upon the industry group and country classifications published by Barclays and/or MSCI Inc.
Tables listing details of individual forward currency contracts, futures, written options, and swaps follow the Portfolio’s Schedule of Investments (if applicable).
Statement of Assets and Liabilities
This statement is often referred to as the “balance sheet.” It lists the assets and liabilities of the Portfolio on the last day of the reporting period.
Janus Aspen Forty Portfolio
Useful Information About Your Portfolio Report (unaudited)
The Portfolio’s assets are calculated by adding the value of the securities owned, the receivable for securities sold but not yet settled, the receivable for dividends declared but not yet received on securities owned, and the receivable for Portfolio shares sold to investors but not yet settled. The Portfolio’s liabilities include payables for securities purchased but not yet settled, Portfolio shares redeemed but not yet paid, and expenses owed but not yet paid. Additionally, there may be other assets and liabilities such as unrealized gain or loss on forward currency contracts.
The section entitled “Net Assets Consist of” breaks down the components of the Portfolio’s net assets. Because the Portfolio must distribute substantially all earnings, you will notice that a significant portion of net assets is shareholder capital.
The last section of this statement reports the net asset value (“NAV”) per share on the last day of the reporting period. The NAV is calculated by dividing the Portfolio’s net assets for each share class (assets minus liabilities) by the number of shares outstanding.
Statement of Operations
This statement details the Portfolio’s income, expenses, realized gains and losses on securities and currency transactions, and changes in unrealized appreciation or depreciation of Portfolio holdings.
The first section in this statement, entitled “Investment Income,” reports the dividends earned from securities and interest earned from interest-bearing securities in the Portfolio.
The next section reports the expenses incurred by the Portfolio, including the advisory fee paid to the investment adviser, transfer agent fees and expenses, and printing and postage for mailing statements, financial reports and prospectuses. Expense offsets and expense reimbursements, if any, are also shown.
The last section lists the amounts of realized gains or losses from investment and foreign currency transactions, and changes in unrealized appreciation or depreciation of investments and foreign currency-denominated assets and liabilities. The Portfolio will realize a gain (or loss) when it sells its position in a particular security. A change in unrealized gain (or loss) refers to the change in net appreciation or depreciation of the Portfolio during the reporting period. “Net Realized and Unrealized Gain/(Loss) on Investments” is affected both by changes in the market value of Portfolio holdings and by gains (or losses) realized during the reporting period.
Statements of Changes in Net Assets
These statements report the increase or decrease in the Portfolio’s net assets during the reporting period. Changes in the Portfolio’s net assets are attributable to investment operations, dividends and distributions to investors, and capital share transactions. This is important to investors because it shows exactly what caused the Portfolio’s net asset size to change during the period.
The first section summarizes the information from the Statement of Operations regarding changes in net assets due to the Portfolio’s investment operations. The Portfolio’s net assets may also change as a result of dividend and capital gains distributions to investors. If investors receive their dividends and/or distributions in cash, money is taken out of the Portfolio to pay the dividend and/or distribution. If investors reinvest their dividends and/or distributions, the Portfolio’s net assets will not be affected. If you compare the Portfolio’s “Net Decrease from Dividends and Distributions” to “Reinvested Dividends and Distributions,” you will notice that dividends and distributions have little effect on the Portfolio’s net assets. This is because the majority of the Portfolio’s investors reinvest their dividends and/or distributions.
The reinvestment of dividends and distributions is included under “Capital Share Transactions.” “Capital Shares” refers to the money investors contribute to the Portfolio through purchases or withdrawals via redemptions. The Portfolio’s net assets will increase and decrease in value as investors purchase and redeem shares from the Portfolio.
Financial Highlights
This schedule provides a per-share breakdown of the components that affect the Portfolio’s NAV for current and past reporting periods as well as total return, asset size, ratios, and portfolio turnover rate.
The first line in the table reflects the NAV per share at the beginning of the reporting period. The next line reports the net investment income/(loss) per share. Following is the per share total of net gains/(losses), realized and unrealized. Per share dividends and distributions to investors are then subtracted to arrive at the NAV per share at the end of the period. The next line reflects the total return for the period. The total return may include adjustments in accordance with
Janus Aspen Forty Portfolio
Useful Information About Your Portfolio Report (unaudited)
generally accepted accounting principles required at the period end for financial reporting purposes. The total return does not include any charges at the separate account level or contract level. As a result, the total return may differ from the total return reflected for individual shareholder transactions. Also included are ratios of expenses and net investment income to average net assets.
The Portfolio’s expenses may be reduced through expense offsets and expense reimbursements. The ratios shown reflect expenses before and after any such offsets and reimbursements.
The ratio of net investment income/(loss) summarizes the income earned less expenses, divided by the average net assets of the Portfolio during the reporting period. Do not confuse this ratio with the Portfolio’s yield. The net investment income ratio is not a true measure of the Portfolio’s yield because it does not take into account the dividends distributed to the Portfolio’s investors.
The next figure is the portfolio turnover rate, which measures the buying and selling activity in the Portfolio. Portfolio turnover is affected by market conditions, changes in the asset size of the Portfolio, fluctuating volume of shareholder purchase and redemption orders, the nature of the Portfolio’s investments, and the investment style and/or outlook of the portfolio manager(s) and/or investment personnel. A 100% rate implies that an amount equal to the value of the entire portfolio was replaced once during the fiscal year; a 50% rate means that an amount equal to the value of half the portfolio is traded in a year; and a 200% rate means that an amount equal to the value of the entire portfolio is traded every six months.
Janus Aspen Forty Portfolio
Designation Requirements (unaudited)
For federal income tax purposes, the Portfolio designated the following for the year ended December 31, 2015:
| | |
| | |
Capital Gain Distributions | $150,393,129 |
Dividends Received Deduction Percentage | 39% |
Janus Aspen Forty Portfolio
Trustees and Officers (unaudited)
The Portfolio’s Statement of Additional Information includes additional information about the Trustees and officers and is available, without charge, by calling 1-877-335-2687
The following are the Trustees and officers of the Trust, together with a brief description of their principal occupations during the last five years (principal occupations for certain Trustees may include periods over five years).
Each Trustee has served in that capacity since he or she was originally elected or appointed. The Trustees do not serve a specified term of office. Each Trustee will hold office until the termination of the Trust or his or her earlier death, resignation, retirement, incapacity, or removal. Under the Portfolio’s Governance Procedures and Guidelines, the policy is for Trustees to retire no later than the end of the calendar year in which the Trustee turns 75. The Trustees review the Portfolio’s Governance Procedures and Guidelines from time to time and may make changes they deem appropriate. The Portfolio’s Nominating and Governance Committee will consider nominees for the position of Trustee recommended by shareholders. Shareholders may submit the name of a candidate for consideration by the Committee by submitting their recommendations to the Trust’s Secretary. Each Trustee is currently a Trustee of one other registered investment company advised by Janus Capital: Janus Investment Fund. Collectively, these two registered investment companies consist of 58 series or funds.
The Trust’s officers are elected annually by the Trustees for a one-year term. Certain officers also serve as officers of Janus Investment Fund. Certain officers of the Portfolio may also be officers and/or directors of Janus Capital. Portfolio officers receive no compensation from the Portfolio, except for the Portfolio’s Chief Compliance Officer, as authorized by the Trustees.
| | | | | | |
TRUSTEES |
Name, Address, and Age | Positions Held with the Trust | Length of Time Served | Principal Occupations During the Past Five Years | Number of Portfolios/Funds in Fund Complex Overseen by Trustee | Other Directorships Held by Trustee During the Past Five Years |
Independent Trustees |
William F. McCalpin
151 Detroit Street
Denver, CO 80206
DOB: 1957 | Chairman
Trustee | 1/08-Present
6/02-Present | Managing Director, Holos Consulting LLC (provides consulting services to foundations and other nonprofit organizations). Formerly, Chief Executive Officer, Imprint Capital (impact investment firm) (2013-2015) and Executive Vice President and Chief Operating Officer of The Rockefeller Brothers Fund (a private family foundation) (1998-2006). | 58 | Chairman of the Board and Director of The Investment Fund for Foundations Investment Program (TIP) (consisting of 2 funds), and Director of the F.B. Heron Foundation (a private grantmaking foundation). |
Janus Aspen Forty Portfolio
Trustees and Officers (unaudited)
| | | | | | |
TRUSTEES |
Name, Address, and Age | Positions Held with the Trust | Length of Time Served | Principal Occupations During the Past Five Years | Number of Portfolios/Funds in Fund Complex Overseen by Trustee | Other Directorships Held by Trustee During the Past Five Years |
Alan A. Brown
151 Detroit Street
Denver, CO 80206
DOB: 1962 | Trustee | 1/13-Present | Executive Vice President, Institutional Markets, of Dividend Capital Group (private equity real estate investment management firm) (since 2012). Formerly, Executive Vice President and Co-Head, Global Private Client Group (2007-2010), Executive Vice President, Mutual Funds (2005-2007), and Chief Marketing Officer (2001-2005) of Nuveen Investments, Inc. (asset management). | 58 | Director of MotiveQuest LLC (strategic social market research company) (since 2003), and Director of WTTW (PBS affiliate) (since 2003). Formerly, Director of Nuveen Global Investors LLC (2007-2011); Director of Communities in Schools (2004-2010); and Director of Mutual Fund Education Alliance (until 2010). |
William D. Cvengros
151 Detroit Street
Denver, CO 80206
DOB: 1948 | Trustee | 1/11-Present | Managing Member and Chief Executive Officer of SJC Capital, LLC (a personal investment company and consulting firm) (since 2002). Formerly, Venture Partner for The Edgewater Funds (a middle market private equity firm) (2002-2004); Chief Executive Officer and President of PIMCO Advisors Holdings L.P. (a publicly traded investment management firm) (1994-2000); and Chief Investment Officer of Pacific Life Insurance Company (a mutual life insurance and annuity company) (1987-1994). | 58 | Advisory Board Member, Innovate Partners Emerging Growth and Equity Fund I (early stage venture capital fund) (since 2014) and Managing Trustee of National Retirement Partners Liquidating Trust (since 2013). Formerly, Chairman, National Retirement Partners, Inc. (formerly a network of advisors to 401(k) plans) (2005-2013); Director of Prospect Acquisition Corp. (a special purpose acquisition corporation) (2007-2009); Director of RemedyTemp, Inc. (temporary help services company) (1996-2006); and Trustee of PIMCO Funds Multi-Manager Series (1990-2000) and Pacific Life Variable Life & Annuity Trusts (1987-1994). |
Janus Aspen Forty Portfolio
Trustees and Officers (unaudited)
| | | | | | |
TRUSTEES |
Name, Address, and Age | Positions Held with the Trust | Length of Time Served | Principal Occupations During the Past Five Years | Number of Portfolios/Funds in Fund Complex Overseen by Trustee | Other Directorships Held by Trustee During the Past Five Years |
James T. Rothe
151 Detroit Street
Denver, CO 80206
DOB: 1943 | Trustee | 1/97-Present | Co-founder and Managing Director of Roaring Fork Capital SBIC, L.P. (SBA, SBIC fund focusing on private investment in public equity firms) and Professor Emeritus of Business of the University of Colorado, Colorado Springs, CO (since 2004). Formerly, Professor of Business of the University of Colorado (2002-2004); and Distinguished Visiting Professor of Business (2001-2002) of Thunderbird (American Graduate School of International Management), Glendale, AZ. | 58 | Formerly, Director of Red Robin Gourmet Burgers, Inc. (RRGB) (2004- 2014). |
William D. Stewart
151 Detroit Street
Denver, CO 80206
DOB: 1944 | Trustee | 9/93-Present | Retired. Formerly, Corporate Vice President and General Manager of MKS Instruments - HPS Products, Boulder, CO (a manufacturer of vacuum fittings and valves) and PMFC Division, Andover, MA (manufacturing pressure measurement and flow products) (1976-2012). | 58 | None |
Janus Aspen Forty Portfolio
Trustees and Officers (unaudited)
| | | | | | |
TRUSTEES |
Name, Address, and Age | Positions Held with the Trust | Length of Time Served | Principal Occupations During the Past Five Years | Number of Portfolios/Funds in Fund Complex Overseen by Trustee | Other Directorships Held by Trustee During the Past Five Years |
Linda S. Wolf
151 Detroit Street
Denver, CO 80206
DOB: 1947 | Trustee | 12/05-Present | Retired. Formerly, Chairman and Chief Executive Officer of Leo Burnett (Worldwide) (advertising agency) (2001-2005). | 58 | Director of Chicago Community Trust (Regional Community Foundation), Chicago Council on Global Affairs, InnerWorkings (U.S. provider of print procurement solutions to corporate clients), Lurie Children’s Hospital (Chicago, IL), Rehabilitation Institute of Chicago, Walmart, and Wrapports, LLC (digital communications company). Formerly, Director of Chicago Convention & Tourism Bureau (until 2014) and The Field Museum of Natural History (Chicago, IL) (until 2014). |
Trustee Consultant |
Raudline Etienne*
151 Detroit Street
Denver, CO 80206
DOB: 1965 | Consultant | 6/14-Present | Senior Advisor, Albright Stonebridge Group LLC (global strategy firm) (since 2016). Formerly, Senior Vice President (2011-2015), Albright Stonebridge Group LLC; and Deputy Comptroller and Chief Investment Officer, New York State Common Retirement Fund (public pension fund) (2008-2011). | N/A | Director of Brightwood Capital Advisors, LLC (since 2014). |
* Raudline Etienne was appointed consultant to the Trustees effective June 2, 2014. Shareholders of the Janus Funds are expected to be asked to elect Ms. Etienne as a Trustee at a future shareholder meeting.
Janus Aspen Forty Portfolio
Trustees and Officers (unaudited)
| | | | |
OFFICERS |
Name, Address, and Age | Positions Held with the Trust | Term of Office* and Length of Time Served | Principal Occupations During the Past Five Years |
A. Douglas Rao
151 Detroit Street
Denver, CO 80206
DOB: 1974 | Executive Vice President and Co-Portfolio Manager
Janus Aspen Forty Portfolio | 6/13-Present | Portfolio Manager for other Janus accounts. Formerly, Partner and Portfolio Manager for Chautauqua Capital Management (2012-2013) and Portfolio Manager for Marsico Capital Management, LLC (2007-2012). |
Stephanie Grauerholz 151 Detroit Street
Denver, CO 80206
DOB: 1970 | Chief Legal Counsel and Secretary
Vice President | 1/06-Present
3/06-Present | Senior Vice President and Chief Legal Counsel of Janus Capital and Senior Vice President of Janus Services LLC (since 2015). Formerly, Vice President and Assistant General Counsel of Janus Capital, Vice President and Assistant Secretary of Janus Distributors LLC, and Vice President of Janus Services LLC (2007-2015). |
Bruce L. Koepfgen
151 Detroit Street
Denver, CO 80206
DOB: 1952 | President and Chief Executive Officer | 7/14-Present | President of Janus Capital Group Inc. and Janus Capital Management LLC (since 2013); Executive Vice President and Director of Janus International Holding LLC (since 2011); Executive Vice President of Janus Distributors LLC (since 2011); Executive Vice President and Working Director of INTECH Investment Management LLC (since 2011); Executive Vice President and Director of Perkins Investment Management LLC (since 2011); and Executive Vice President and Director of Janus Management Holdings Corporation (since 2011). Formerly, Executive Vice President of Janus Services LLC (2011-2015), Janus Capital Group Inc. and Janus Capital Management LLC (2011-2013); and Chief Financial Officer of Janus Capital Group Inc., Janus Capital Management LLC, Janus Distributors LLC, Janus Management Holdings Corporation, and Janus Services LLC (2011-2013). |
David R. Kowalski
151 Detroit Street
Denver, CO 80206
DOB: 1957 | Vice President, Chief Compliance Officer, and Anti-Money Laundering Officer | 6/02-Present | Senior Vice President and Chief Compliance Officer of Janus Capital, Janus Distributors LLC, and Janus Services LLC; Vice President of INTECH Investment Management LLC and Perkins Investment Management LLC; and Director of The Janus Foundation. |
Jesper Nergaard
151 Detroit Street
Denver, CO 80206
DOB: 1962 | Chief Financial Officer
Vice President, Treasurer, and Principal Accounting Officer | 3/05-Present
2/05-Present | Vice President of Janus Capital and Janus Services LLC. |
* Officers are elected at least annually by the Trustees for a one-year term and may also be elected from time to time by the Trustees for an interim period.
Janus Aspen Forty Portfolio
Notes
NotesPage1
Janus provides access to a wide range of investment disciplines.
Alternative
Janus alternative funds seek to deliver strong risk-adjusted returns over a full market cycle with lower correlation to equity markets than traditional investments.
Asset Allocation
Janus’ asset allocation funds utilize our fundamental, bottom-up research to balance risk over the long term. From fund options that meet investors’ risk tolerance and objectives to a method that incorporates non-traditional investment choices to seek non-correlated sources of risk and return, Janus’ asset allocation funds aim to allocate risk more effectively.
Fixed Income
Janus fixed income funds attempt to provide less risk relative to equities while seeking to deliver a competitive total return through high current income and appreciation. Janus money market funds seek capital preservation and liquidity with current income as a secondary objective.
Global & International
Janus global and international funds seek to leverage Janus’ research capabilities by taking advantage of inefficiencies in foreign markets, where accurate information and analytical insight are often at a premium.
Growth & Core
Janus growth funds focus on companies believed to be the leaders in their respective industries, with solid management teams, expanding market share, margins and efficiencies. Janus core funds seek investments in more stable and predictable companies. Our core funds look for a strategic combination of steady growth and, for certain funds, some degree of income.
Mathematical
Our mathematical funds seek to outperform their respective indices while maintaining a risk profile equal to or lower than the index itself. Managed by INTECH® (a Janus subsidiary), these funds use a mathematical process in an attempt to build a more “efficient” portfolio than the index.
Value
Our value funds, managed by Perkins® (a Janus subsidiary), seek to identify companies with favorable reward to risk characteristics by conducting rigorous downside analysis before determining upside potential.
For more information about our funds, contact your investment professional or go to janus.com/variable-insurance.
| | | | | | | | | | | | | |
| | | | | |

| | | | |
| | | | | |
Please consider the charges, risks, expenses and investment objectives carefully before investing. For a prospectus or, if available, a summary prospectus containing this and other information, please call Janus at 877.33JANUS (52687) or download the file from janus.com/variable-insurance. Read it carefully before you invest or send money. |
Janus, INTECH and Perkins are registered trademarks of Janus International Holding LLC. © Janus International Holding LLC. Funds distributed by Janus Distributors LLC |
Investment products offered are: | NOT FDIC-INSURED | MAY LOSE VALUE | NO BANK GUARANTEE | |
C-0216-108236 | | | | 109-02-81115 02-16 |
| | | | |
| | | |
| | | ANNUAL REPORT December 31, 2015 |
| | |
| | Janus Aspen Global Allocation Portfolio - Moderate |
| | |
| | Janus Aspen Series |
| | | |
| | | HIGHLIGHTS · Portfolio management perspective · Investment strategy behind your fund · Portfolio performance, characteristics
and holdings |
| | | |
| | | 
|
Table of Contents
Janus Aspen Global Allocation Portfolio - Moderate
| | |
Management Commentary and Schedule of Investments | 1 |
Notes to Schedule of Investments and Other Information | 8 |
Statement of Assets and Liabilities | 10 |
Statement of Operations | 11 |
Statements of Changes in Net Assets | 12 |
Financial Highlights | 13 |
Notes to Financial Statements | 14 |
Report of Independent Registered Public Accounting Firm | 19 |
Additional Information | 20 |
Useful Information About Your Portfolio Report | 32 |
Designation Requirements | 35 |
Trustees and Officers | 36 |
Janus Aspen Global Allocation Portfolio - Moderate (unaudited)
| | | | | | |
PORTFOLIO SNAPSHOT This fund of funds offers broad global diversification for investors by utilizing the full spectrum of Janus' investment expertise and solutions, with the goal of providing higher risk-adjusted returns than the broad markets. | | | | 
Enrique Chang co-portfolio manager | 
Ashwin Alankar co-portfolio manager |
| | | |
PERFORMANCE OVERVIEW
For the 12 months ended December 31, 2015, Janus Aspen Global Allocation Portfolio – Moderate’s Institutional Shares and Service Shares returned -2.08% and -2.37%, respectively. This compares with a return of
-2.36% for its primary benchmark, the MSCI All Country World Index, and a -2.47% return for its secondary benchmark, the Global Moderate Allocation Index, an internally calculated, hypothetical combination of total returns from the MSCI All Country World Index (60%) and the Barclays Global Aggregate Bond Index (40%).
INVESTMENT ENVIRONMENT
Global equities ended the year down. Broad U.S. indices posted modest gains, while small- and mid-cap indices ended the year in negative territory. Growth stocks outperformed value during the year. Accommodative monetary policies from major central banks around the world provided a supportive environment for equities during the first half of 2015. However, concerns over China’s slowing economy, weakness in emerging markets, and falling oil and other commodity prices negatively impacted equities in the back half of the year.
U.S. fixed income markets endured a volatile 2015, with investor angst driven by the prospect of diverging monetary policy and varying growth trajectories among major economies. Investment-grade corporate spreads began to widen in the spring and as fear gripped the market in late summer the widening not only accelerated but became very volatile. High-yield credits followed a similar pattern but with greater widening, with the riskiest credits selling off the most, in particular energy, industrials and materials. For the year, the Treasury yield curve flattened with upward pressure felt most on the front end of the curve.
INVESTMENT PROCESS
Janus Aspen Global Allocation Portfolio – Moderate invests across a broad set of Janus, INTECH and Perkins funds that span a wide range of global asset categories with a base allocation of 45% to 65% equity investments, 30% to 45% fixed income investments and 5% to 20% alternative investments that are rebalanced quarterly. The Portfolio is structured as a “fund of funds” portfolio that provides investors with broad, diversified exposure to various types of investments with an emphasis on managing investment risk. The Portfolio is also designed to blend the three core competencies that Janus practices as an organization: mathematically driven strategies, risk-managed strategies and fundamentally-driven, growth and value-oriented strategies. We believe that combining these very different approaches in a single investment can potentially produce a portfolio with a unique and powerful performance profile.
The investment process involves setting return expectations for a broad range of Janus mutual funds that we believe best represent the full opportunity set available to today’s investor. We then establish an ideal “model” portfolio based upon the specific risk/return objective of Janus Aspen Global Allocation Portfolio – Moderate. The Janus Asset Allocation Committee also provides input on the overall allocation. Finally, we select the appropriate Janus, Perkins and INTECH funds that replicate our desired exposure. The allocations assigned to each selected underlying fund are consistent with our view of current market conditions and the long-term trade-off between risk and reward potential that each of these investment types represent. However, as a result of changing market conditions, both the mix of underlying funds and the allocations to these funds will change from time to time.
PERFORMANCE DISCUSSION
The Portfolio outperformed its benchmark and also its secondary benchmark during the period. On an absolute basis, our top contributors to performance included the Janus Forty Fund, INTECH U.S. Managed Volatility Fund, Janus Fund and Janus Twenty Fund. Each of those Funds has a lot of exposure to U.S. large cap equities, which
Janus Aspen Global Allocation Portfolio - Moderate (unaudited)
generally outperformed U.S. small-caps and broader global equity markets during the period.
Our largest detractors included the Janus Contrarian Fund, Janus Emerging Markets Fund, Janus Overseas Fund and Janus Asia Equity Fund. The Janus Contrarian Fund underperformed its benchmark this year. The other funds have high exposure toward emerging markets and international equities, which suffered steeper losses than U.S. equities or other asset classes, so we were not surprised to see those funds weigh on absolute performance.
OUTLOOK
As we look ahead to 2016, we see a number of potential tipping points for financial markets. Risk premiums are yet to adjust to a likely increase in real interest rates. Questions remain about China’s economic growth and just how far oil prices could decline. Geopolitical tension remains in various regions and countries and the U.S. is in an election year.
While these sources of uncertainty will create volatility in financial markets, they also create opportunities for asset allocators. We will be watchful for market dislocations, and look forward to the opportunities volatility may provide both for the underlying funds we invest in, and our ability to change our exposure across those different funds.
Thank you for investing in Janus Aspen Global Allocation Portfolio – Moderate.
Janus Aspen Global Allocation Portfolio - Moderate (unaudited)
Portfolio At A Glance
December 31, 2015
| | | | |
Holdings - (% of Net Assets) | | | |
Janus Global Bond Fund - Class N Shares | | 25.1% | |
Janus International Equity Fund - Class N Shares | | 11.5 | |
Perkins Large Cap Value Fund - Class N Shares | | 9.1 | |
INTECH U.S. Managed Volatility Fund - Class N Shares | | 8.6 | |
Janus Diversified Alternatives Fund - Class N Shares | | 7.9 | |
INTECH International Managed Volatility Fund - Class I Shares | | 7.4 | |
Janus Adaptive Global Allocation Fund - Class N Shares | | 5.1 | |
Janus Short-Term Bond Fund - Class N Shares | | 4.5 | |
Janus Overseas Fund - Class N Shares | | 3.0 | |
Janus Global Real Estate Fund - Class I Shares | | 2.8 | |
Janus Triton Fund - Class N Shares | | 2.5 | |
Perkins Small Cap Value Fund - Class N Shares | | 2.2 | |
Janus Emerging Markets Fund - Class I Shares | | 2.1 | |
Janus Forty Fund - Class N Shares | | 1.8 | |
Janus Fund - Class N Shares | | 1.7 | |
Janus Twenty Fund - Class D Shares | | 1.5 | |
Janus Aspen Global Research Portfolio - Institutional Shares | | 1.2 | |
Janus Contrarian Fund - Class I Shares | | 1.1 | |
Janus Global Select Fund - Class I Shares | | 0.9 | |
Janus Asia Equity Fund - Class I Shares | | 0.3 | |
| | | | | |
Asset Allocation - (% of Net Assets) |
Equity Funds | | 60.0% |
Fixed Income Funds | | 29.6% |
Alternative Funds | | 10.7% |
Other | | (0.3)% |
| | | 100.0% |
Janus Aspen Global Allocation Portfolio - Moderate (unaudited)
Performance
| |
See important disclosures on the next page. |
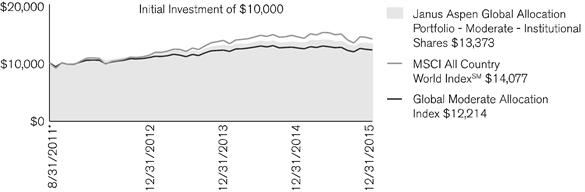
| | | | | | | |
| | | | | | |
| | | | | | Expense Ratios - |
Average Annual Total Return - for the periods ended December 31, 2015 | | per the May 1, 2015 prospectuses |
| One
Year | Since
Inception* | | Total Annual Fund
Operating Expenses | Net Annual Fund
Operating Expenses |
Institutional Shares | -2.08% | 6.94% | | 1.80% | 1.02% |
Service Shares | -2.37% | 6.78% | | 1.89% | 1.14% |
MSCI All Country World IndexSM | -2.36% | 8.21% | | | |
Global Moderate Allocation Index | -2.47% | 4.72% | | | |
Morningstar Quartile - Institutional Shares | 2nd | 1st | | | |
Morningstar Ranking - based on total returns for World Allocation Funds | 202/584 | 56/442 | | | |
Returns quoted are past performance and do not guarantee future results; current performance may be lower or higher. Investment returns and principal value will vary; there may be a gain or loss when shares are sold. For the most recent month-end performance call 877.33JANUS(52687) or visit janus.com/variable-insurance.
Net expense ratios reflect the expense waiver, if any, Janus Capital has contractually agreed to through May 1, 2016.
A Portfolio's performance may be affected by risks that include those associated with nondiversification, non-investment grade debt securities, high-yield/high-risk securities, undervalued or overlooked companies, investments in specific industries or countries and potential conflicts of interest. Additional risks to a Portfolio may also include, but are not limited to, those associated with investing in foreign securities, emerging markets, initial public offerings, real estate investment trusts (REITs), derivatives, short sales, commodity-linked investments and companies with relatively small market capitalizations. Each Portfolio has different risks. Please see a Janus prospectus for more information about risks, portfolio holdings and other details.
Performance of the Janus Aspen Global Allocation Portfolio depends on that of the underlying funds. They are subject to the volatility of the financial markets. Because Janus Capital is the adviser to the Fund and to the underlying affiliated funds held within the Fund, it is subject to certain potential conflicts of interest.
Returns shown do not represent actual returns since they do not include insurance charges. Returns shown would have been lower had they included insurance charges.
Returns include reinvestment of all dividends and distributions and do not reflect the deduction of taxes that a shareholder would pay on Portfolio distributions or redemptions of Portfolio shares. The returns do not include adjustments in accordance with generally accepted accounting principles required at the period end for financial reporting purposes.
Ranking is for the share class shown only; other classes may have different performance characteristics. When an expense waiver is in effect, it may have a material effect on the total return, and therefore the ranking for the period.
© 2015 Morningstar, Inc. All Rights Reserved.
There is no assurance that the investment process will consistently lead to successful investing.
Janus Aspen Global Allocation Portfolio - Moderate (unaudited)
Performance
See Notes to Schedule of Investments and Other Information for index definitions.
A Portfolio’s holdings may differ significantly from the securities held in an index. An index is unmanaged and not available for direct investment; therefore its performance does not reflect the expenses associated with the active management of an actual portfolio.
See “Useful Information About Your Portfolio Report.”
*The Portfolio’s inception date – August 31, 2011
Janus Aspen Global Allocation Portfolio - Moderate (unaudited)
Expense Examples
As a shareholder of the Portfolio, you incur two types of costs: (1) transaction costs and (2) ongoing costs, including management fees; 12b-1 distribution and shareholder servicing fees (applicable to Service Shares only); transfer agent fees and expenses payable pursuant to the Transfer Agency Agreement; and other Portfolio expenses. This example is intended to help you understand your ongoing costs (in dollars) of investing in the Portfolio and to compare these costs with the ongoing costs of investing in other mutual funds. To do so, compare this 5% hypothetical example with the 5% hypothetical examples that appear in the shareholder reports of the other funds. The example is based upon an investment of $1,000 invested at the beginning of the period and held for the six-months indicated, unless noted otherwise in the table and footnotes below.
Actual Expenses
The information in the table under the heading “Actual” provides information about actual account values and actual expenses. You may use the information in these columns, together with the amount you invested, to estimate the expenses that you paid over the period. Simply divide your account value by $1,000 (for example, an $8,600 account value divided by $1,000 = 8.6), then multiply the result by the number in the appropriate column for your share class under the heading entitled “Expenses Paid During Period” to estimate the expenses you paid on your account during the period.
Hypothetical Example for Comparison Purposes
The information in the table under the heading “Hypothetical (5% return before expenses)” provides information about hypothetical account values and hypothetical expenses based upon the Portfolio’s actual expense ratio and an assumed rate of return of 5% per year before expenses, which is not the Portfolio’s actual return. The hypothetical account values and expenses may not be used to estimate the actual ending account balance or expenses you paid for the period. You may use this information to compare the ongoing costs of investing in the Portfolio and other funds. To do so, compare this 5% hypothetical example with the 5% hypothetical examples that appear in the shareholder reports of the other funds. Additionally, for an analysis of the fees associated with an investment in either share class or other similar funds, please visit www.finra.org/fundanalyzer.
Please note that the expenses shown in the table are meant to highlight your ongoing costs only and do not reflect any transaction costs, such as any charges at the separate account level or contract level. These fees are fully described in the Portfolio’s prospectuses. Therefore, the hypothetical examples are useful in comparing ongoing costs only, and will not help you determine the relative total costs of owning different funds. In addition, if these transaction costs were included, your costs would have been higher.
| | | | | | | | | | | |
| | | | | | | | | |
| | | | Actual | | Hypothetical
(5% return before expenses) | |
| Beginning
Account
Value
(7/1/15) | Ending
Account
Value
(12/31/15) | Expenses
Paid During
Period
(7/1/15 - 12/31/15)† | | Beginning
Account
Value
(7/1/15) | Ending
Account
Value
(12/31/15) | Expenses
Paid During
Period
(7/1/15 - 12/31/15)† | Net Annualized
Expense Ratio
(7/1/15 - 12/31/15)†† |
Institutional Shares | $1,000.00 | $968.50 | ($0.74) | | $1,000.00 | $1,025.96 | ($0.77) | -0.15% |
Service Shares | $1,000.00 | $965.50 | $1.98 | | $1,000.00 | $1,023.19 | $2.04 | 0.40% |
† | Expenses Paid During Period are equal to the Net Annualized Expense Ratio multiplied by the average account value over the period, multiplied by 184/365 (to reflect the one-half year period). Expenses in the examples include the effect of applicable fee waivers and/or expense reimbursements, if any. Had such waivers and/or reimbursements not been in effect, your expenses would have been higher. Please refer to the Notes to Financial Statements or the Portfolio’s prospectuses for more information regarding waivers and/or reimbursements. |
†† | Ratios do not include indirect expenses of the underlying funds and/or investment companies in which the Portfolio invests. |
Janus Aspen Global Allocation Portfolio - Moderate
Schedule of Investments
December 31, 2015
| | | | | | | | |
Shares
| | | Value | |
Investment Companies£ – 100.3% | | | |
Alternative Funds – 10.7% | | | |
| | Janus Diversified Alternatives Fund - Class N Shares | | 91,237 | | | $867,661 | |
| | Janus Global Real Estate Fund - Class I Shares | | 30,702 | | | 316,538 | |
| | | 1,184,199 | |
Equity Funds – 60.0% | | | |
| | INTECH International Managed Volatility Fund - Class I Shares | | 105,740 | | | 819,482 | |
| | INTECH U.S. Managed Volatility Fund - Class N Shares | | 104,839 | | | 947,740 | |
| | Janus Adaptive Global Allocation Fund - Class N Shares | | 59,602 | | | 557,870 | |
| | Janus Asia Equity Fund - Class I Shares | | 3,628 | | | 30,656 | |
| | Janus Aspen Global Research Portfolio - Institutional Shares | | 3,436 | | | 138,247 | |
| | Janus Contrarian Fund - Class I Shares | | 6,478 | | | 120,548 | |
| | Janus Emerging Markets Fund - Class I Shares | | 31,079 | | | 231,539 | |
| | Janus Forty Fund - Class N Shares | | 6,605 | | | 196,777 | |
| | Janus Fund - Class N Shares | | 5,545 | | | 193,949 | |
| | Janus Global Select Fund - Class I Shares | | 7,596 | | | 96,466 | |
| | Janus International Equity Fund - Class N Shares | | 109,645 | | | 1,266,401 | |
| | Janus Overseas Fund - Class N Shares | | 12,065 | | | 331,542 | |
| | Janus Triton Fund - Class N Shares | | 12,678 | | | 281,956 | |
| | Janus Twenty Fund - Class D Shares | | 2,937 | | | 160,988 | |
| | Perkins Large Cap Value Fund - Class N Shares | | 66,912 | | | 1,001,670 | |
| | Perkins Small Cap Value Fund - Class N Shares | | 13,093 | | | 238,297 | |
| | | 6,614,128 | |
Fixed Income Funds – 29.6% | | | |
| | Janus Global Bond Fund - Class N Shares | | 295,375 | | | 2,767,668 | |
| | Janus Short-Term Bond Fund - Class N Shares | | 162,534 | | | 489,226 | |
| | | 3,256,894 | |
Total Investments (total cost $11,748,975) – 100.3% | | 11,055,221 | |
Liabilities, net of Cash, Receivables and Other Assets – (0.3)% | | (38,529) | |
Net Assets – 100% | | $11,016,692 | |
| | |
See Notes to Schedule of Investments and Other Information and Notes to Financial Statements. |
| |
Janus Aspen Series | 7 |
Janus Aspen Global Allocation Portfolio - Moderate
Notes to Schedule of Investments and Other Information
| | |
Barclays Global Aggregate Bond Index | A broad-based measure of the global investment grade fixed-rate debt markets. |
Global Moderate Allocation Index | An internally calculated, hypothetical combination of total returns from the MSCI All Country World IndexSM (60%) and Barclays Global Aggregate Bond Index (40%). |
MSCI All Country World IndexSM | An unmanaged, free float-adjusted market capitalization weighted index composed of stocks of companies located in countries throughout the world. It is designed to measure equity market performance in global developed and emerging markets. The index includes reinvestment of dividends, net of foreign withholding taxes. |
| | |
£ | The Portfolio may invest in certain securities that are considered affiliated companies. As defined by the Investment Company Act of 1940, as amended, an affiliated company is one in which the Portfolio owns 5% or more of the outstanding voting securities, or a company which is under common ownership or control. The following securities were considered affiliated companies for all or some portion of the year ended December 31, 2015. Unless otherwise indicated, all information in the table is for the year ended December 31, 2015. |
| | | | | | | | |
| Share
Balance
at 12/31/14 | Purchases | Sales | Share
Balance
at 12/31/15 | Realized
Gain/(Loss) | Dividend
Income | Value
at 12/31/15 |
INTECH International Managed Volatility Fund – Class I Shares: | | | | | |
| | 105,995 | 22,945 | (23,200) | 105,740 | $ (14,861) | $ 12,194 | $ 819,482 |
INTECH U.S. Managed Volatility Fund – Class N Shares: | | | | | |
| | 47,078 | 76,114 | (18,353) | 104,839 | (39,742) | 4,311 | 947,740 |
INTECH U.S. Managed Volatility Fund II – Class I Shares: | | | | | |
| | 21,247 | 1,789 | (23,036) | - | 1,328 | 1,481 | - |
Janus Adaptive Global Allocation Fund – Class N: | | | | | |
| | - | 66,749 | (7,147) | 59,602 | (2,165) | 1,738 | 557,870 |
Janus Asia Equity Fund – Class I Shares: | | | | | |
| | 3,452 | 1,203 | (1,027) | 3,628 | (440) | 68 | 30,656 |
Janus Aspen Global Research Portfolio – Institutional Shares: | | | | | |
| | 9,015 | 1,391 | (6,970) | 3,436 | 35,848 | 1,970 | 138,247 |
Janus Contrarian Fund – Class I Shares: | | | | | |
| | 6,413 | 1,377 | (1,312) | 6,478 | (2,147) | 523 | 120,548 |
Janus Diversified Alternatives Fund – Class N Shares: | | | | | |
| | 91,318 | 21,434 | (21,515) | 91,237 | (3,025) | 541 | 867,661 |
Janus Emerging Markets Fund – Class I Shares: | | | | | |
| | 31,440 | 7,014 | (7,375) | 31,079 | (4,979) | 894 | 231,539 |
Janus Forty Fund – Class N Shares: | | | | | |
| | 5,796 | 2,245 | (1,436) | 6,605 | (11,023) | 844 | 196,777 |
Janus Fund – Class N Shares: | | | | | |
| | 5,121 | 1,333 | (909) | 5,545 | (1,930) | 3,409 | 193,949 |
Janus Global Bond Fund – Class N Shares: | | | | | |
| | 311,168 | 72,366 | (88,159) | 295,375 | (36,465) | 61,009 | 2,767,668 |
Janus Global Real Estate Fund – Class I Shares: | | | | | |
| | 29,032 | 8,264 | (6,594) | 30,702 | (1,056) | 12,758 | 316,538 |
Janus Global Select Fund – Class I Shares: | | | | | |
| | 19,993 | 2,910 | (15,307) | 7,596 | 27,922 | 1,215 | 96,466 |
Janus International Equity Fund – Class N Shares: | | | | | |
| | 109,503 | 24,721 | (24,579) | 109,645 | (23,079) | 24,204 | 1,266,401 |
Janus Aspen Global Allocation Portfolio - Moderate
Notes to Schedule of Investments and Other Information
| | | | | | | | |
| Share
Balance
at 12/31/14 | Purchases | Sales | Share
Balance
at 12/31/15 | Realized
Gain/(Loss) | Dividend
Income | Value
at 12/31/15 |
Janus Overseas Fund – Class N Shares: | | | | | |
| | 11,680 | 3,110 | (2,725) | 12,065 | (9,899) | 15,325 | 331,542 |
Janus Short-Term Bond Fund – Class N Shares: | | | | | |
| | 161,680 | 39,999 | (39,145) | 162,534 | (1,094) | 7,145 | 489,226 |
Janus Triton Fund – Class N Shares: | | | | | |
| | 12,031 | 3,051 | (2,404) | 12,678 | (1,083) | 746 | 281,956 |
Janus Twenty Fund – Class D Shares: | | | | | |
| | 2,689 | 769 | (521) | 2,937 | (2,147) | 891 | 160,988 |
Perkins Large Cap Value Fund – Class N Shares: | | | | | |
| | 64,455 | 16,141 | (13,684) | 66,912 | (20,385) | 16,640 | 1,001,670 |
Perkins Small Cap Value Fund – Class N Shares: | | | | | |
| | 11,510 | 4,049 | (2,466) | 13,093 | (5,860) | 7,029 | 238,297 |
| | | | | | $ (116,282) | $ 174,935 | $11,055,221 |
| | | | |
The following is a summary of the inputs that were used to value the Portfolio’s investments in securities and other financial instruments as of December 31, 2015. See Notes to Financial Statements for more information. |
Valuation Inputs Summary | | | |
| Level 1 -
Quoted Prices | Level 2 -
Other Significant
Observable Inputs | Level 3 -
Significant
Unobservable Inputs |
Assets | | | |
Investments in Securities: | | | |
Investment Companies | | | |
Alternative Funds | $ 1,184,199 | $ - | $ - |
Equity Funds | 6,614,128 | - | - |
Fixed Income Funds | 3,256,894 | - | - |
Total Assets | $ 11,055,221 | $ - | $ - |
Janus Aspen Global Allocation Portfolio - Moderate
Statement of Assets and Liabilities
December 31, 2015
| | | | | | | |
Assets: | | | | |
| | Investments, at cost | | $ | 11,748,975 | |
| | Affiliated investments, at value | | $ | 11,055,221 | |
| | Non-interested Trustees' deferred compensation | | | 223 | |
| | Receivables: | | | | |
| | | Due from adviser | | | 20,631 | |
| | | Portfolio shares sold | | | 10,576 | |
| | | Dividends from affiliates | | | 6,908 | |
| | Other assets | | | 114 | |
Total Assets | | | 11,093,673 | |
Liabilities: | | | | |
| | Payables: | | | — | |
| | | Professional fees | | | 28,223 | |
| | | Portfolio shares repurchased | | | 18,760 | |
| | | Investments purchased | | | 14,635 | |
| | | Printing fees | | | 6,070 | |
| | | Accounting systems fees | | | 4,657 | |
| | | 12b-1 Distribution and shareholder servicing fees | | | 2,565 | |
| | | Advisory fees | | | 516 | |
| | | Non-interested Trustees' deferred compensation fees | | | 223 | |
| | | Portfolio administration fees | | | 98 | |
| | | Non-interested Trustees' fees and expenses | | | 67 | |
| | | Transfer agent fees and expenses | | | 47 | |
| | | Accrued expenses and other payables | | | 1,120 | |
Total Liabilities | | | 76,981 | |
Net Assets | | $ | 11,016,692 | |
Net Assets Consist of: | | | | |
| | Capital (par value and paid-in surplus) | | $ | 11,611,298 | |
| | Undistributed net investment income/(loss) | | | 39,749 | |
| | Undistributed net realized gain/(loss) from investments | | | 59,368 | |
| | Unrealized net appreciation/(depreciation) of investments and non-interested Trustees’ deferred compensation | | | (693,723) | |
Total Net Assets | | $ | 11,016,692 | |
Net Assets - Institutional Shares | | $ | 63,027 | |
| | Shares Outstanding, $0.01 Par Value (unlimited shares authorized) | | | 5,620 | |
Net Asset Value Per Share | | $ | 11.21 | |
Net Assets - Service Shares | | $ | 10,953,665 | |
| | Shares Outstanding, $0.01 Par Value (unlimited shares authorized) | | | 977,167 | |
Net Asset Value Per Share | | $ | 11.21 | |
| | |
See Notes to Financial Statements. |
| |
10 | DECEMBER 31, 2015 |
Janus Aspen Global Allocation Portfolio - Moderate
Statement of Operations
For the year ended December 31, 2015
| | | | | | | | |
Investment Income: | | | | | |
| | Dividends from affiliates | | $ | 174,935 | | |
Total Investment Income | | | 174,935 | | |
Expenses: | | | | | |
| | Advisory fees | | | 5,829 | | |
| | 12b-1Distribution and shareholder servicing fees: | | | | | |
| | | Service Shares | | | 28,982 | | |
| | Other transfer agent fees and expenses: | | | | | |
| | | Service Shares | | | 658 | | |
| | Shareholder reports expense | | | 67,107 | | |
| | Professional fees | | | 33,318 | | |
| | Accounting systems fee | | | 18,925 | | |
| | Registration fees | | | 8,653 | | |
| | Portfolio administration fees | | | 1,084 | | |
| | Non-interested Trustees’ fees and expenses | | | 280 | | |
| | Other expenses | | | 267 | | |
Total Expenses | | | 165,103 | | |
Less: Excess Expense Reimbursement | | | (118,875) | | |
Net Expenses | | | 46,228 | | |
Net Investment Income/(Loss) | | | 128,707 | | |
Net Realized Gain/(Loss) on Investments: | | | | | |
| | Investments in affiliates | | | (116,282) | | |
| | Capital gain distributions from underlying funds | | | 228,985 | | |
Total Net Realized Gain/(Loss) on Investments | | | 112,703 | | |
Change in Unrealized Net Appreciation/Depreciation: | | | | | |
| | Investments and non-interested Trustees’ deferred compensation | | | (540,788) | | |
Total Change in Unrealized Net Appreciation/Depreciation | | | (540,788) | | |
Net Increase/(Decrease) in Net Assets Resulting from Operations | | $ | (299,378) | | |
| | |
See Notes to Financial Statements. |
| |
Janus Aspen Series | 11 |
Janus Aspen Global Allocation Portfolio - Moderate
Statements of Changes in Net Assets
| | | | | | | | | |
| | | | | | | | | |
| | | Year ended
December 31, 2015 | | Year ended
December 31, 2014 | |
Operations: | | | | | | |
| | Net investment income/(loss) | $ | 128,707 | | $ | 301,546 | |
| | Net realized gain/(loss) on investments | | 112,703 | | | 482,183 | |
| | Change in unrealized net appreciation/depreciation | | (540,788) | | | (433,026) | |
Net Increase/(Decrease) in Net Assets Resulting from Operations | | (299,378) | | | 350,703 | |
Dividends and Distributions to Shareholders: | | | | | | |
| | Dividends from Net Investment Income | | | | | | |
| | | Institutional Shares | | (568) | | | (2,009) | |
| | | Service Shares | | (88,155) | | | (308,870) | |
| Total Dividends from Net Investment Income | | (88,723) | | | (310,879) | |
| | Distributions from Net Realized Gain from Investment Transactions | | | | | | |
| | | Institutional Shares | | (2,781) | | | (3,271) | |
| | | Service Shares | | (497,196) | | | (230,552) | |
| Total Distributions from Net Realized Gain from Investment Transactions | (499,977) | | | (233,823) | |
Net Decrease from Dividends and Distributions to Shareholders | | (588,700) | | | (544,702) | |
Capital Share Transactions: | | | | | | |
| | | Institutional Shares | | 3,349 | | | (101,479) | |
| | | Service Shares | | 467,396 | | | 1,870,367 | |
Net Increase/(Decrease) from Capital Share Transactions | | 470,745 | | | 1,768,888 | |
Net Increase/(Decrease) in Net Assets | | (417,333) | | | 1,574,889 | |
Net Assets: | | | | | | |
| | Beginning of period | | 11,434,025 | | | 9,859,136 | |
| End of period | $ | 11,016,692 | | $ | 11,434,025 | |
| | | | | | | | | |
Undistributed Net Investment Income/(Loss) | $ | 39,749 | | $ | (235) | |
| | |
See Notes to Financial Statements. |
| |
12 | DECEMBER 31, 2015 |
Janus Aspen Global Allocation Portfolio - Moderate
Financial Highlights
| | | | | | | | | | | | | | | | | | | |
Institutional Shares | | | | | | | | | | | | | | | |
For a share outstanding during each year or period ended December 31 | | 2015 | | | 2014 | | | 2013 | | | 2012 | | | 2011(1) | |
| | Net Asset Value, Beginning of Period | | $12.07 | | | $12.28 | | | $11.00 | | | $9.79 | | | $10.00 | |
| | Income/(Loss) from Investment Operations: | | | | | | | | | | | | | | | |
| | | Net investment income/(loss) | | 0.16(2) | | | 0.21(2) | | | 0.17 | | | 0.20 | | | 0.17 | |
| | | Net realized and unrealized gain/(loss) | | (0.40) | | | 0.19 | | | 1.47 | | | 1.32 | | | (0.21) | |
| | Total from Investment Operations | | (0.24) | | | 0.40 | | | 1.64 | | | 1.52 | | | (0.04) | |
| | Less Dividends and Distributions: | | | | | | | | | | | | | | | |
| | | Dividends (from net investment income) | | (0.10) | | | (0.35) | | | (0.20) | | | (0.18) | | | (0.17) | |
| | | Distributions (from capital gains) | | (0.52) | | | (0.26) | | | (0.16) | | | (0.13) | | | — | |
| | Total Dividends and Distributions | | (0.62) | | | (0.61) | | | (0.36) | | | (0.31) | | | (0.17) | |
| | Net Asset Value, End of Period | | $11.21 | | | $12.07 | | | $12.28 | | | $11.00 | | | $9.79 | |
| | Total Return* | | (2.08)% | | | 3.20% | | | 14.90% | | | 15.63% | | | (0.38)% | |
| | Net Assets, End of Period (in thousands) | | $63 | | | $64 | | | $165 | | | $144 | | | $125 | |
| | Average Net Assets for the Period (in thousands) | | $65 | | | $126 | | | $154 | | | $137 | | | $123 | |
| | Ratios to Average Net Assets**: | | | | | | | | | | | | | | | |
| | | Ratio of Gross Expenses(3) | | 1.18% | | | 1.06% | | | 2.92% | | | 24.54% | | | 69.84% | |
| | | Ratio of Net Expenses (After Waivers and Expense Offsets)(3) | | 0.15% | | | 0.39% | | | 0.49% | | | 0.60% | | | 1.00% | |
| | | Ratio of Net Investment Income/(Loss)(3) | | 1.35% | | | 1.71% | | | 1.45% | | | 1.87% | | | 5.27% | |
| | Portfolio Turnover Rate | | 27% | | | 27% | | | 68% | | | 42% | | | 7% | |
| | | | | | | | | | | | | | 1 | | | | | |
| | | | | | | | | | | | | | | | | | | |
Service Shares | | | | | | | | | | | | | | | |
For a share outstanding during each year or period ended December 31 | | 2015 | | | 2014 | | | 2013 | | | 2012 | | | 2011(1) | |
| | Net Asset Value, Beginning of Period | | $12.08 | | | $12.28 | | | $10.98 | | | $9.79 | | | $10.00 | |
| | Income/(Loss) from Investment Operations: | | | | | | | | | | | | | | | |
| | | Net investment income/(loss) | | 0.13(2) | | | 0.35(2) | | | 0.16 | | | 0.17 | | | 0.17 | |
| | | Net realized and unrealized gain/(loss) | | (0.39) | | | 0.05 | | | 1.45 | | | 1.33 | | | (0.21) | |
| | Total from Investment Operations | | (0.26) | | | 0.40 | | | 1.61 | | | 1.50 | | | (0.04) | |
| | Less Dividends and Distributions: | | | | | | | | | | | | | | | |
| | | Dividends (from net investment income) | | (0.09) | | | (0.34) | | | (0.15) | | | (0.18) | | | (0.17) | |
| | | Distributions (from capital gains) | | (0.52) | | | (0.26) | | | (0.16) | | | (0.13) | | | — | |
| | Total Dividends and Distributions | | (0.61) | | | (0.60) | | | (0.31) | | | (0.31) | | | (0.17) | |
| | Net Asset Value, End of Period | | $11.21 | | | $12.08 | | | $12.28 | | | $10.98 | | | $9.79 | |
| | Total Return* | | (2.37)% | | | 3.22% | | | 14.69% | | | 15.44% | | | (0.38)% | |
| | Net Assets, End of Period (in thousands) | | $10,954 | | | $11,370 | | | $9,694 | | | $603 | | | $124 | |
| | Average Net Assets for the Period (in thousands) | | $11,534 | | | $10,761 | | | $4,800 | | | $316 | | | $123 | |
| | Ratios to Average Net Assets**: | | | | | | | | | | | | | | | |
| | | Ratio of Gross Expenses(3) | | 1.42% | | | 1.15% | | | 2.42% | | | 26.76% | | | 70.08% | |
| | | Ratio of Net Expenses (After Waivers and Expense Offsets)(3) | | 0.40% | | | 0.47% | | | 0.66% | | | 0.73% | | | 1.00%(4) | |
| | | Ratio of Net Investment Income/(Loss)(3) | | 1.11% | | | 2.78% | | | 2.58% | | | 2.78% | | | 5.28% | |
| | Portfolio Turnover Rate | | 27% | | | 27% | | | 68% | | | 42% | | | 7% | |
| | | | | | | | | | | | | | | | | | | |
| |
* Total return not annualized for periods of less than one full year. ** Annualized for periods of less than one full year. (1) Period from August 31, 2011 (inception date) through December 31, 2011. (2) Per share amounts are calculated based on average shares outstanding during the year or period. (3) Ratios do not include indirect expenses of the underlying funds and/or investment companies in which the Portfolio invests. (4) Pursuant to a contractual agreement, Janus waived certain fees and expenses during the period. The Ratio of Net Expenses (After Waivers and Expense Offsets) to Average Net Assets would be 1.25% without the waiver of these fees and expenses. |
| | |
See Notes to Financial Statements. |
| |
Janus Aspen Series | 13 |
Janus Aspen Global Allocation Portfolio - Moderate
Notes to Financial Statements
1. Organization and Significant Accounting Policies
Janus Aspen Global Allocation Portfolio - Moderate (the “Portfolio”) is a series fund. The Portfolio operates as a “fund of funds,” meaning substantially all of the Portfolio’s assets will be invested in other Janus funds (the “underlying funds”). The Portfolio is part of Janus Aspen Series (the “Trust”), which is organized as a Delaware statutory trust and is registered under the Investment Company Act of 1940, as amended (the “1940 Act”), as an open-end management investment company, and therefore has applied the specialized accounting and reporting guidance in Financial Accounting Standards Board (“FASB”) Accounting Standards Codification (“ASC”) Topic 946. The Trust offers twelve Portfolios which include multiple series of shares, with differing investment objectives and policies. The Portfolio is classified as diversified, as defined in the 1940 Act.
The Portfolio currently offers two classes of shares: Institutional Shares and Service Shares. Each class represents an interest in the same portfolio of investments. Institutional Shares are offered only in connection with investment in and payments under variable insurance contracts as well as certain qualified retirement plans. Service Shares are offered only in connection with investment in and payments under variable insurance contracts as well as certain qualified retirement plans that require a fee from Portfolio assets to procure distribution and administrative services to contract owners and plan participants.
Underlying Funds
The Portfolio invests in a variety of underlying funds to pursue a target allocation of equity investments, fixed-income securities, and alternative investments and may also invest in money market instruments or cash/cash equivalents. The Portfolio has a target allocation, which is how the Portfolio's investments generally will be allocated among the major asset classes over the long term, as well as normal ranges, under normal market conditions, within which the Portfolio's asset class allocations generally will vary over short-term periods. The Portfolio's long-term expected average asset allocation is as follows: 55% to equity investments, 35% to fixed-income securities and money market instruments, and 10% to alternative investments. Additional details and descriptions of the investment objectives and strategies of each of the underlying funds are available in the Portfolio’s and underlying funds’ prospectuses. The Trustees of the underlying funds may change the investment objectives or strategies of the underlying funds at any time without prior notice to fund shareholders.
The following accounting policies have been followed by the Portfolio and are in conformity with accounting principles generally accepted in the United States of America.
Investment Valuation
The Portfolio’s net asset value (“NAV”) is calculated based upon the NAV of each of the underlying funds in which the Portfolio invests on the day of valuation. The NAV for each class of the underlying funds is computed by dividing the total value of securities and other assets allocated to the class, less liabilities allocated to that class, by the total number of shares outstanding for the class.
Valuation Inputs Summary
FASB ASC 820, Fair Value Measurements and Disclosures (“ASC 820”), defines fair value, establishes a framework for measuring fair value, and expands disclosure requirements regarding fair value measurements. This standard emphasizes that fair value is a market-based measurement that should be determined based on the assumptions that market participants would use in pricing an asset or liability and establishes a hierarchy that prioritizes inputs to valuation techniques used to measure fair value. These inputs are summarized into three broad levels:
Level 1 – Unadjusted quoted prices in active markets the Portfolio has the ability to access for identical assets or liabilities.
The Portfolio classifies each of its investments in underlying funds as Level 1, without consideration as to the classification level of the specific investments held by the underlying funds.
Level 2 – Observable inputs other than unadjusted quoted prices included in Level 1 that are observable for the asset or liability either directly or indirectly. These inputs may include quoted prices for the identical instrument on an inactive market, prices for similar instruments, interest rates, prepayment speeds, credit risk, yield curves, default rates and similar data.
Janus Aspen Global Allocation Portfolio - Moderate
Notes to Financial Statements
Level 3 – Unobservable inputs for the asset or liability to the extent that relevant observable inputs are not available, representing the Portfolio’s own assumptions about the assumptions that a market participant would use in valuing the asset or liability, and that would be based on the best information available.
There have been no significant changes in valuation techniques used in valuing any such positions held by the Portfolio since the beginning of the fiscal year.
The inputs or methodology used for fair valuing securities are not necessarily an indication of the risk associated with investing in those securities. The summary of inputs used as of December 31, 2015 to fair value the Portfolio’s investments in securities and other financial instruments is included in the “Valuation Inputs Summary” in the Notes to Schedule of Investments and Other Information.
There were no transfers between Level 1, Level 2 and Level 3 of the fair value hierarchy during the period. The Portfolio recognizes transfers between the levels as of the beginning of the fiscal year.
Investment Transactions and Investment Income
Investment transactions are accounted for as of the date purchased or sold (trade date). Dividend income is recorded on the ex-dividend date. Certain dividends from foreign securities held by the underlying funds will be recorded as soon as the Portfolio is informed of the dividend, if such information is obtained subsequent to the ex-dividend date. Dividends from foreign securities may be subject to withholding taxes in foreign jurisdictions. Any distributions from the underlying funds are recorded in accordance with the character of the distributions as designated by the underlying funds. Gains and losses are determined on the identified cost basis, which is the same basis used for federal income tax purposes. Income, as well as gains and losses, both realized and unrealized, are allocated daily to each class of shares based upon the ratio of net assets represented by each class as a percentage of total net assets.
Expenses
The Portfolio bears expenses incurred specifically on its behalf, as well as a portion of general expenses, which may be allocated pro rata to the Portfolio. Additionally, the Portfolio, as a shareholder in the underlying funds, will also indirectly bear its pro rata share of the expenses incurred by the underlying funds. Each class of shares bears a portion of general expenses, which are allocated daily to each class of shares based upon the ratio of net assets represented by each class as a percentage of total net assets. Expenses directly attributable to a specific class of shares are charged against the operations of such class.
Estimates
The preparation of financial statements in conformity with accounting principles generally accepted in the United States of America requires management to make estimates and assumptions that affect the reported amount of assets and liabilities and disclosure of contingent assets and liabilities at the date of the financial statements, and the reported amounts of income and expenses during the reporting period. Actual results could differ from those estimates.
Indemnifications
In the normal course of business, the Portfolio may enter into contracts that contain provisions for indemnification of other parties against certain potential liabilities. The Portfolio’s maximum exposure under these arrangements is unknown, and would involve future claims that may be made against the Portfolio that have not yet occurred. Currently, the risk of material loss from such claims is considered remote.
Dividends and Distributions
The Portfolio may make semiannual distributions of substantially all of its investment income and an annual distribution of its net realized capital gains (if any).
The underlying funds may make certain investments in real estate investment trusts (“REITs”) which pay dividends to their shareholders based upon funds available from operations. It is quite common for these dividends to exceed the REITs’ taxable earnings and profits, resulting in the excess portion of such dividends being designated as a return of capital. If the underlying funds distribute such amounts, such distributions could constitute a return of capital to shareholders for federal income tax purposes.
Federal Income Taxes
The Portfolio intends to continue to qualify as a regulated investment company and distribute all of its taxable income in accordance with the requirements of Subchapter M of the Internal Revenue Code. Management has analyzed the Portfolio’s tax positions taken for all open federal income tax years, generally a three-year period, and has concluded
Janus Aspen Global Allocation Portfolio - Moderate
Notes to Financial Statements
that no provision for federal income tax is required in the Portfolio’s financial statements. The Portfolio is not aware of any tax positions for which it is reasonably possible that the total amounts of unrecognized tax benefits will significantly change in the next twelve months.
2. Investment Advisory Agreements and Other Transactions with Affiliates
The Portfolio pays Janus Capital an investment advisory fee which is calculated daily and paid monthly. The Portfolio’s contractual investment advisory fee rate (expressed as an annual rate) is 0.05%.
Janus Capital has contractually agreed to waive the advisory fee payable by the Portfolio or reimburse expenses in an amount equal to the amount, if any, that the Portfolio’s normal operating expenses in any fiscal year, including the investment advisory fee, but excluding any expenses of an underlying fund (acquired fund fees and expenses), the 12b-1 distribution and shareholder servicing fees (applicable to Service Shares), transfer agent fees and expenses payable pursuant to the Transfer Agency Agreement, brokerage commissions, interest, dividends, taxes, acquired fund fees and expenses, and extraordinary expenses, exceed the annual rate of 0.14%. Janus Capital has agreed to continue the waiver until at least May 1, 2016. If applicable, amounts reimbursed to the Portfolio by Janus Capital are disclosed as “Excess Expense Reimbursement” on the Statement of Operations.
Janus Services LLC (“Janus Services”), a wholly-owned subsidiary of Janus Capital, is the Portfolio’s and the underlying funds’ transfer agent. In addition, Janus Services provides or arranges for the provision of certain other administrative services including, but not limited to, recordkeeping, accounting, order processing, and other shareholder services for the Portfolio. Janus Services is not compensated for its services related to the shares, except for out-of-pocket costs. These amounts are disclosed as “Other transfer agent fees and expenses” on the Statement of Operations.
Under a distribution and shareholder servicing plan (the “Plan”) adopted in accordance with Rule 12b-1 under the 1940 Act, the Service Shares may pay the Trust’s distributor, Janus Distributors LLC (“Janus Distributors”), a wholly-owned subsidiary of Janus Capital, a fee for the sale and distribution and/or shareholder servicing of the Service Shares at an annual rate of up to 0.25% of the average daily net assets of the Service Shares. Under the terms of the Plan, the Trust is authorized to make payments to Janus Distributors for remittance to insurance companies and qualified plan service providers as compensation for distribution and/or shareholder services performed by such entities. These amounts are disclosed as “12b-1 Distribution and shareholder servicing fees” on the Statement of Operations. Payments under the Plan are not tied exclusively to actual 12b-1 distribution and servicing fees, and the payments may exceed 12b-1 distribution and servicing fees actually incurred. If any of the Portfolio’s actual 12b-1 distribution and servicing fees incurred during a calendar year are less than the payments made during a calendar year, the Portfolio will be refunded the difference. Refunds, if any, are included in “12b-1 Distribution fees and shareholder servicing fees” in the Statement of Operations.
Janus Capital furnishes certain administration, compliance, and accounting services for the Portfolio and is reimbursed by the Portfolio for certain of its costs in providing those services (to the extent Janus Capital seeks reimbursement and such costs are not otherwise waived). The Portfolio also pays for salaries, fees, and expenses of certain Janus Capital employees and Portfolio officers, with respect to certain specified administration functions they perform on behalf of the Portfolio. The Portfolio pays these costs based on out-of-pocket expenses incurred by Janus Capital, and these costs are separate and apart from advisory fees and other expenses paid in connection with the investment advisory services Janus Capital provides to the Portfolio. These amounts are disclosed as “Portfolio administration fees” on the Statement of Operations. In addition, employees of Janus Capital and/or its affiliates may serve as officers of the Trust. Some expenses related to compensation payable to the Portfolio's Chief Compliance Officer and compliance staff are shared with the Portfolio. Total compensation of $43,224 was paid to the Chief Compliance Officer and certain compliance staff by the Trust during the year ended December 31, 2015. The Portfolio's portion is reported as part of “Other expenses” on the Statement of Operations.
The Board of Trustees has adopted a deferred compensation plan (the “Deferred Plan”) for independent Trustees to elect to defer receipt of all or a portion of the annual compensation they are entitled to receive from the Portfolio. All deferred fees are credited to an account established in the name of the Trustees. The amounts credited to the account then increase or decrease, as the case may be, in accordance with the performance of one or more of the Janus funds that are selected by the Trustees. The account balance continues to fluctuate in accordance with the performance of the selected fund or funds until final payment of all amounts are credited to the account. The fluctuation of the account balance is recorded by the Portfolio as unrealized appreciation/(depreciation) and is included as of December 31, 2015 on the Statement of Assets and Liabilities in the asset, “Non-interested Trustees’ deferred compensation,” and liability,
Janus Aspen Global Allocation Portfolio - Moderate
Notes to Financial Statements
“Non-interested Trustees’ deferred compensation fees.” Additionally, the recorded unrealized appreciation/(depreciation) is included in “Unrealized net appreciation/(depreciation) of investments, foreign currency translations and non-interested Trustees’ deferred compensation” on the Statement of Assets and Liabilities. Deferred compensation expenses for the year ended December 31, 2015 are included in “Non-interested Trustees’ fees and expenses” on the Statement of Operations. Trustees are allowed to change their designation of mutual funds from time to time. Amounts will be deferred until distributed in accordance with the Deferred Plan. Deferred fees of $317,200 were paid by the Trust to a Trustee under the Deferred Plan during the year ended December 31, 2015.
Any purchases and sales, realized gains/losses and recorded dividends from affiliated investments during the year ended December 31, 2015 can be found in a table located in the Notes to Schedule of Investmentsand Other Information .
As of December 31, 2015, shares of the Portfolio were owned by Janus Capital and/or other funds advised by Janus Capital, as indicated in the table below: