The preparation of financial statements in conformity with accounting principles generally accepted in the United States of America requires management to make estimates and assumptions that affect the reported amount of assets and liabilities and disclosure of contingent assets and liabilities at the date of the financial statements, and the reported amounts of income and expenses during the reporting period. Actual results could differ from those estimates.
In the normal course of business, the Portfolio may enter into contracts that contain provisions for indemnification of other parties against certain potential liabilities. The Portfolio’s maximum exposure under these arrangements is unknown, and would involve future claims that may be made against the Portfolio that have not yet occurred. Currently, the risk of material loss from such claims is considered remote.
The Portfolio does not isolate that portion of the results of operations resulting from the effect of changes in foreign exchange rates on investments from the fluctuations arising from changes in market prices of securities held at the date of the financial statements. Net unrealized appreciation or depreciation of investments and foreign currency translations arise from changes in the value of assets and liabilities, including investments in securities held at the date of the financial statements, resulting from changes in the exchange rates and changes in market prices of securities held.
Currency gains and losses are also calculated on payables and receivables that are denominated in foreign currencies. The payables and receivables are generally related to foreign security transactions and income translations.
Foreign currency-denominated assets and forward currency contracts may involve more risks than domestic transactions, including currency risk, counterparty risk, political and economic risk, regulatory risk and equity risk. Risks may arise from unanticipated movements in the value of foreign currencies relative to the U.S. dollar.
The Portfolio may make semiannual distributions of substantially all of its investment income and an annual distribution of its net realized capital gains (if any).
The Portfolio may make certain investments in real estate investment trusts (“REITs”) which pay dividends to their shareholders based upon funds available from operations. It is quite common for these dividends to exceed the REITs’ taxable earnings and profits, resulting in the excess portion of such dividends being designated as a return of capital. If the Portfolio distributes such amounts, such distributions could constitute a return of capital to shareholders for federal income tax purposes.
The Portfolio intends to continue to qualify as a regulated investment company and distribute all of its taxable income in accordance with the requirements of Subchapter M of the Internal Revenue Code. Management has analyzed the Portfolio’s tax positions taken for all open federal income tax years, generally a three-year period, and has concluded that no provision for federal income tax is required in the Portfolio’s financial statements. The Portfolio is not aware of any tax positions for which it is reasonably possible that the total amounts of unrecognized tax benefits will significantly change in the next twelve months.
On December 22, 2017, the Tax Cuts and Jobs Act was signed into law. Currently, Management does not believe the bill will have a material impact on the Portfolio’s intention to continue to qualify as a regulated investment company, which is generally not subject to U.S. federal income tax.
2. Other Investments and Strategies
The Portfolio may be invested in lower-rated debt securities that have a higher risk of default or loss of value since these securities may be sensitive to economic changes, political changes, or adverse developments specific to the issuer.
The financial crisis in both the U.S. and global economies over the past several years has resulted, and may continue to result, in a significant decline in the value and liquidity of many securities of issuers worldwide in the equity and fixed-income/credit markets. In response to the crisis, the United States and certain foreign governments, along with the U.S. Federal Reserve and certain foreign central banks, took steps to support the financial markets. The withdrawal of this
Janus Henderson VIT Balanced Portfolio
Notes to Financial Statements
support, a failure of measures put in place to respond to the crisis, or investor perception that such efforts were not sufficient could each negatively affect financial markets generally, and the value and liquidity of specific securities. In addition, policy and legislative changes in the United States and in other countries continue to impact many aspects of financial regulation. The effect of these changes on the markets, and the practical implications for market participants, including the Portfolio, may not be fully known for some time. As a result, it may also be unusually difficult to identify both investment risks and opportunities, which could limit or preclude the Portfolio’s ability to achieve its investment objective. Therefore, it is important to understand that the value of your investment may fall, sometimes sharply, and you could lose money.
The enactment of the Dodd-Frank Wall Street Reform and Consumer Protection Act (the “Dodd-Frank Act”) of 2010 provided for widespread regulation of financial institutions, consumer financial products and services, broker-dealers, OTC derivatives, investment advisers, credit rating agencies, and mortgage lending, which expanded federal oversight in the financial sector, including the investment management industry. Many provisions of the Dodd-Frank Act remain pending and will be implemented through future rulemaking. Therefore, the ultimate impact of the Dodd-Frank Act and the regulations under the Dodd-Frank Act on the Portfolio and the investment management industry as a whole, is not yet certain.
A number of countries in the European Union (“EU”) have experienced, and may continue to experience, severe economic and financial difficulties. In particular, many EU nations are susceptible to economic risks associated with high levels of debt, notably due to investments in sovereign debt of countries such as Greece, Italy, Spain, Portugal, and Ireland. Many non-governmental issuers, and even certain governments, have defaulted on, or been forced to restructure, their debts. Many other issuers have faced difficulties obtaining credit or refinancing existing obligations. Financial institutions have in many cases required government or central bank support, have needed to raise capital, and/or have been impaired in their ability to extend credit. As a result, financial markets in the EU experienced extreme volatility and declines in asset values and liquidity. Responses to these financial problems by European governments, central banks, and others, including austerity measures and reforms, may not work, may result in social unrest, and may limit future growth and economic recovery or have other unintended consequences. Further defaults or restructurings by governments and others of their debt could have additional adverse effects on economies, financial markets, and asset valuations around the world. Greece, Ireland, and Portugal have already received one or more "bailouts" from other Eurozone member states, and it is unclear how much additional funding they will require or if additional Eurozone member states will require bailouts in the future. The risk of investing in securities in the European markets may also be heightened due to the referendum in which the United Kingdom voted to exit the EU (known as “Brexit”). There is considerable uncertainty about how Brexit will be conducted, how negotiations of necessary treaties and trade agreements will proceed, or how financial markets will react. In addition, one or more other countries may also abandon the euro and/or withdraw from the EU, placing its currency and banking system in jeopardy.
Certain areas of the world have historically been prone to and economically sensitive to environmental events such as, but not limited to, hurricanes, earthquakes, typhoons, flooding, tidal waves, tsunamis, erupting volcanoes, wildfires or droughts, tornadoes, mudslides, or other weather-related phenomena. Such disasters, and the resulting physical or economic damage, could have a severe and negative impact on the Portfolio’s investment portfolio and, in the longer term, could impair the ability of issuers in which the Portfolio invests to conduct their businesses as they would under normal conditions. Adverse weather conditions may also have a particularly significant negative effect on issuers in the agricultural sector and on insurance companies that insure against the impact of natural disasters.
Loans
The Portfolio may invest in various commercial loans, including bank loans, bridge loans, debtor-in-possession (“DIP”) loans, mezzanine loans, and other fixed and floating rate loans. These loans may be acquired through loan participations and assignments or on a when-issued basis. Commercial loans will comprise no more than 20% of the Portfolio’s total assets. Below are descriptions of the types of loans held by the Portfolio as of December 31, 2018.
· Bank Loans - Bank loans are obligations of companies or other entities entered into in connection with recapitalizations, acquisitions, and refinancings. The Portfolio’s investments in bank loans are generally acquired as a participation interest in, or assignment of, loans originated by a lender or other financial institution. These investments may include institutionally-traded floating and fixed-rate debt securities.
· Floating Rate Loans – Floating rate loans are debt securities that have floating interest rates, that adjust periodically, and are tied to a benchmark lending rate, such as London Interbank Offered Rate (“LIBOR”). In
Janus Henderson VIT Balanced Portfolio
Notes to Financial Statements
other cases, the lending rate could be tied to the prime rate offered by one or more major U.S. banks or the rate paid on large certificates of deposit traded in the secondary markets. If the benchmark lending rate changes, the rate payable to lenders under the loan will change at the next scheduled adjustment date specified in the loan agreement. Floating rate loans are typically issued to companies (‘‘borrowers’’) in connection with recapitalizations, acquisitions, and refinancings. Floating rate loan investments are generally below investment grade. Senior floating rate loans are secured by specific collateral of a borrower and are senior in the borrower’s capital structure. The senior position in the borrower’s capital structure generally gives holders of senior loans a claim on certain of the borrower’s assets that is senior to subordinated debt and preferred and common stock in the case of a borrower’s default. Floating rate loan investments may involve foreign borrowers, and investments may be denominated in foreign currencies. Floating rate loans often involve borrowers whose financial condition is troubled or uncertain and companies that are highly leveraged. The Portfolio may invest in obligations of borrowers who are in bankruptcy proceedings. While the Portfolio generally expects to invest in fully funded term loans, certain of the loans in which the Portfolio may invest include revolving loans, bridge loans, and delayed draw term loans.
Purchasers of floating rate loans may pay and/or receive certain fees. The Portfolio may receive fees such as covenant waiver fees or prepayment penalty fees. The Portfolio may pay fees such as facility fees. Such fees may affect the Portfolio’s return.
· Mezzanine Loans - Mezzanine loans are secured by the stock of the company that owns the assets. Mezzanine loans are a hybrid of debt and equity financing that is typically used to fund the expansion of existing companies. A mezzanine loan is composed of debt capital that gives the lender the right to convert to an ownership or equity interest in the company if the loan is not paid back in time and in full. Mezzanine loans typically are the most subordinated debt obligation in an issuer’s capital structure.
Mortgage- and Asset-Backed Securities
Mortgage- and asset-backed securities represent interests in “pools” of commercial or residential mortgages or other assets, including consumer loans or receivables. The Portfolio may purchase fixed or variable rate commercial or residential mortgage-backed securities issued by the Government National Mortgage Association (“Ginnie Mae”), the Federal National Mortgage Association (“Fannie Mae”), the Federal Home Loan Mortgage Corporation (“Freddie Mac”), or other governmental or government-related entities. Ginnie Mae’s guarantees are backed by the full faith and credit of the U.S. Government, which means that the U.S. Government guarantees that the interest and principal will be paid when due. Fannie Mae and Freddie Mac securities are not backed by the full faith and credit of the U.S. Government. In September 2008, the Federal Housing Finance Agency (“FHFA”), an agency of the U.S. Government, placed Fannie Mae and Freddie Mac under conservatorship. Since that time, Fannie Mae and Freddie Mac have received capital support through U.S. Treasury preferred stock purchases, and Treasury and Federal Reserve purchases of their mortgage-backed securities. The FHFA and the U.S. Treasury have imposed strict limits on the size of these entities’ mortgage portfolios. The FHFA has the power to cancel any contract entered into by Fannie Mae and Freddie Mac prior to FHFA’s appointment as conservator or receiver, including the guarantee obligations of Fannie Mae and Freddie Mac.
The Portfolio may also purchase other mortgage- and asset-backed securities through single- and multi-seller conduits, collateralized debt obligations, structured investment vehicles, and other similar securities. Asset-backed securities may be backed by various consumer obligations, including automobile loans, equipment leases, credit card receivables, or other collateral. In the event the underlying loans are not paid, the securities’ issuer could be forced to sell the assets and recognize losses on such assets, which could impact your return. Unlike traditional debt instruments, payments on these securities include both interest and a partial payment of principal. Mortgage- and asset-backed securities are subject to both extension risk, where borrowers pay off their debt obligations more slowly in times of rising interest rates, and prepayment risk, where borrowers pay off their debt obligations sooner than expected in times of declining interest rates. These risks may reduce the Portfolio’s returns. In addition, investments in mortgage- and asset-backed securities, including those comprised of subprime mortgages, may be subject to a higher degree of credit risk, valuation risk, and liquidity risk than various other types of fixed-income securities. Additionally, although mortgage-backed securities are generally supported by some form of government or private guarantee and/or insurance, there is no assurance that guarantors or insurers will meet their obligations.
Real Estate Investing
The Portfolio may invest in equity and debt securities of real estate-related companies. Such companies may include those in the real estate industry or real estate-related industries. These securities may include common stocks,
Janus Henderson VIT Balanced Portfolio
Notes to Financial Statements
corporate bonds, preferred stocks, and other equity securities, including, but not limited to, mortgage-backed securities, real estate-backed securities, securities of REITs and similar REIT-like entities. A REIT is a trust that invests in real estate-related projects, such as properties, mortgage loans, and construction loans. REITs are generally categorized as equity, mortgage, or hybrid REITs. A REIT may be listed on an exchange or traded OTC.
Restricted Security Transactions
Restricted securities held by the Portfolio may not be sold except in exempt transactions or in a public offering registered under the Securities Act of 1933, as amended. The risk of investing in such securities is generally greater than the risk of investing in the securities of widely held, publicly traded companies. Lack of a secondary market and resale restrictions may result in the inability of the Portfolio to sell a security at a fair price and may substantially delay the sale of the security. In addition, these securities may exhibit greater price volatility than securities for which secondary markets exist.
Sovereign Debt
The Portfolio may invest in U.S. and non-U.S. government debt securities (“sovereign debt”). Some investments in sovereign debt, such as U.S. sovereign debt, are considered low risk. However, investments in sovereign debt, especially the debt of less developed countries, can involve a high degree of risk, including the risk that the governmental entity that controls the repayment of sovereign debt may not be willing or able to repay the principal and/or to pay the interest on its sovereign debt in a timely manner. A sovereign debtor’s willingness or ability to satisfy its debt obligation may be affected by various factors including, but not limited to, its cash flow situation, the extent of its foreign currency reserves, the availability of foreign exchange when a payment is due, the relative size of its debt position in relation to its economy as a whole, the sovereign debtor’s policy toward international lenders, and local political constraints to which the governmental entity may be subject. Sovereign debtors may also be dependent on expected disbursements from foreign governments, multilateral agencies, and other entities. The failure of a sovereign debtor to implement economic reforms, achieve specified levels of economic performance, or repay principal or interest when due may result in the cancellation of third party commitments to lend funds to the sovereign debtor, which may further impair such debtor’s ability or willingness to timely service its debts. The Portfolio may be requested to participate in the rescheduling of such sovereign debt and to extend further loans to governmental entities, which may adversely affect the Portfolio’s holdings. In the event of default, there may be limited or no legal remedies for collecting sovereign debt and there may be no bankruptcy proceedings through which the Portfolio may collect all or part of the sovereign debt that a governmental entity has not repaid. In addition, to the extent the Portfolio invests in non-U.S. sovereign debt, it may be subject to currency risk.
TBA Commitments
The Portfolio may enter into “to be announced” or “TBA” commitments. TBAs are forward agreements for the purchase or sale of securities, including mortgage-backed securities, for a fixed price, with payment and delivery on an agreed upon future settlement date. The specific securities to be delivered are not identified at the trade date. However, delivered securities must meet specified terms, including issuer, rate, and mortgage terms. Although the particular TBA securities must meet industry-accepted “good delivery” standards, there can be no assurance that a security purchased on forward commitment basis will ultimately be issued or delivered by the counterparty. During the settlement period, the Portfolio will still bear the risk of any decline in the value of the security to be delivered. Because TBA commitments do not require the purchase and sale of identical securities, the characteristics of the security delivered to the Portfolio may be less favorable than the security delivered to the dealer. If the counterparty to a transaction fails to deliver the security, the Portfolio could suffer a loss.
When-Issued, Delayed Delivery and Forward Commitment Transactions
The Portfolio may purchase or sell securities on a when-issued, delayed delivery, or forward commitment basis. When purchasing a security on a when-issued, delayed delivery, or forward commitment basis, the Portfolio assumes the rights and risks of ownership of the security, including the risk of price and yield fluctuations, and takes such fluctuations into account when determining its net asset value. Typically, no income accrues on securities the Portfolio has committed to purchase prior to the time delivery of the securities is made. Because the Portfolio is not required to pay for the security until the delivery date, these risks are in addition to the risks associated with the Portfolio’s other investments. If the other party to a transaction fails to deliver the securities, the Portfolio could miss a favorable price or yield opportunity. If the Portfolio remains substantially fully invested at a time when when-issued, delayed delivery, or forward commitment purchases are outstanding, the purchases may result in a form of leverage.
Janus Henderson VIT Balanced Portfolio
Notes to Financial Statements
When the Portfolio has sold a security on a when-issued, delayed delivery, or forward commitment basis, the Portfolio does not participate in future gains or losses with respect to the security. If the other party to a transaction fails to pay for the securities, the Portfolio could suffer a loss. Additionally, when selling a security on a when-issued, delayed delivery, or forward commitment basis without owning the security, the Portfolio will incur a loss if the security’s price appreciates in value such that the security’s price is above the agreed upon price on the settlement date. The Portfolio may dispose of or renegotiate a transaction after it is entered into, and may purchase or sell when-issued, delayed delivery or forward commitment securities before the settlement date, which may result in a gain or loss.
3. Investment Advisory Agreements and Other Transactions with Affiliates
The Portfolio pays Janus Capital Management LLC (“Janus Capital”) an investment advisory fee which is calculated daily and paid monthly. The Portfolio’s contractual investment advisory fee rate (expressed as an annual rate) is 0.55% of its average daily net assets.
Janus Services LLC (“Janus Services”), a wholly-owned subsidiary of Janus Capital, is the Portfolio’s transfer agent. Janus Services receives an administrative services fee at an annual rate of 0.05% of the average daily net assets of the Portfolio for arranging for the provision by participating insurance companies and qualified plan service providers of administrative services, including recordkeeping, subaccounting, order processing, or other shareholder services provided on behalf of contract holders or plan participants investing in the Portfolio. Other shareholder services may include the provision of order confirmations, periodic account statements, forwarding prospectuses, shareholder reports, and other materials to existing investors, and answering inquiries regarding accounts. Janus Services expects to use this entire fee to compensate insurance companies and qualified plan service providers for providing these services to their customers who invest in the Portfolio. Any unused portion will be reimbursed to the applicable share class at least annually.
In addition, Janus Services provides or arranges for the provision of certain other internal administrative, recordkeeping, and shareholder relations services for the Portfolio. Janus Services is not compensated for these internal services related to the shares, except for out-of-pocket costs. These amounts are disclosed as “Other transfer agent fees and expenses” on the Statement of Operations.
Under a distribution and shareholder servicing plan (the “Plan”) adopted in accordance with Rule 12b-1 under the 1940 Act, the Service Shares may pay the Trust’s distributor, Janus Distributors LLC (“Janus Distributors”), a wholly-owned subsidiary of Janus Capital, a fee for the sale and distribution and/or shareholder servicing of the Service Shares at an annual rate of up to 0.25% of the average daily net assets of the Service Shares. Under the terms of the Plan, the Trust is authorized to make payments to Janus Distributors for remittance to insurance companies and qualified plan service providers as compensation for distribution and/or shareholder services performed by such entities. These amounts are disclosed as “12b-1 Distribution and shareholder servicing fees” on the Statement of Operations. Payments under the Plan are not tied exclusively to actual 12b-1 distribution and servicing fees, and the payments may exceed 12b-1 distribution and servicing fees actually incurred. If any of the Portfolio’s actual 12b-1 distribution and servicing fees incurred during a calendar year are less than the payments made during a calendar year, the Portfolio will be refunded the difference. Refunds, if any, are included in “12b-1 Distribution and shareholder servicing fees” in the Statement of Operations.
Janus Capital serves as administrator to the Portfolio pursuant to an administration agreement between Janus Capital and the Trust. Under the administration agreement, Janus Capital is obligated to provide or arrange for the provision of certain administration, compliance, and accounting services to the Portfolio, including providing office space for the Portfolio, and is reimbursed by the Portfolio for certain of its costs in providing these services (to the extent Janus Capital seeks reimbursement and such costs are not otherwise waived). In addition, employees of Janus Capital and/or its affiliates may serve as officers of the Trust. The Portfolio pays for some or all of the salaries, fees, and expenses of Janus Capital employees and Portfolio officers, with respect to certain specified administration functions they perform on behalf of the Portfolio. The Portfolio pays these costs based on out-of-pocket expenses incurred by Janus Capital, and these costs are separate and apart from advisory fees and other expenses paid in connection with the investment advisory services Janus Capital (or any subadvisor, as applicable) provides to the Portfolio. These amounts are disclosed as “Affiliated portfolio administration fees” on the Statement of Operations. In addition, some expenses related to compensation payable to the Portfolio’s Chief Compliance Officer and certain compliance staff, all of whom are employees of Janus Capital and/or its affiliates, are shared with the Portfolio. Total compensation of $34,180 was paid to the Chief Compliance Officer and certain compliance staff by the Trust during the year ended December 31, 2018. The Portfolio's portion is reported as part of “Other expenses” on the Statement of Operations.
Janus Henderson VIT Balanced Portfolio
Notes to Financial Statements
Effective April 1, 2018, BNP Paribas Financial Services (“BPFS”) provides certain administrative services to the Portfolio, including services related to Portfolio accounting, calculation of the Portfolio’s daily NAV, and Portfolio audit, tax, and reporting obligations, pursuant to a sub-administration agreement with Janus Capital on behalf of the Portfolio. Janus Capital, as administrator, oversees the provision of these services by BPFS. As compensation for such services, Janus Capital pays BPFS a fee based on a percentage of the Portfolio’s assets, along with a flat fee, and is reimbursed by the Portfolio for amounts paid to BPFS (to the extent Janus Capital seeks reimbursement and such costs are not otherwise waived). These amounts are disclosed as part of "Other expenses" on the Statement of Operations.
The Board of Trustees has adopted a deferred compensation plan (the “Deferred Plan”) for independent Trustees to elect to defer receipt of all or a portion of the annual compensation they are entitled to receive from the Portfolio. All deferred fees are credited to an account established in the name of the Trustees. The amounts credited to the account then increase or decrease, as the case may be, in accordance with the performance of one or more of the Janus Henderson funds that are selected by the Trustees. The account balance continues to fluctuate in accordance with the performance of the selected fund or funds until final payment of all amounts are credited to the account. The fluctuation of the account balance is recorded by the Portfolio as unrealized appreciation/(depreciation) and is included as of December 31, 2018 on the Statement of Assets and Liabilities in the asset, “Non-interested Trustees’ deferred compensation,” and liability, “Non-interested Trustees’ deferred compensation fees.” Additionally, the recorded unrealized appreciation/(depreciation) is included in “Unrealized net appreciation/(depreciation) of investments and non-interested Trustees’ deferred compensation” on the Statement of Assets and Liabilities. Deferred compensation expenses for the year ended December 31, 2018 are included in “Non-interested Trustees’ fees and expenses” on the Statement of Operations. Trustees are allowed to change their designation of mutual funds from time to time. Amounts will be deferred until distributed in accordance with the Deferred Plan. Deferred fees of $511,200 were paid by the Trust to the Trustees under the Deferred Plan during the year ended December 31, 2018.
Pursuant to the provisions of the 1940 Act and related rules, the Portfolio may participate in an affiliated or nonaffiliated cash sweep program. In the cash sweep program, uninvested cash balances of the Portfolio may be used to purchase shares of affiliated or nonaffiliated money market funds or cash management pooled investment vehicles. The Portfolio is eligible to participate in the cash sweep program (the “Investing Funds”). As adviser, Janus Capital has an inherent conflict of interest because of its fiduciary duties to the affiliated money market funds or cash management pooled investment vehicles and the Investing Funds. Janus Henderson Cash Liquidity Fund LLC is an affiliated unregistered cash management pooled investment vehicle that invests primarily in highly-rated short-term fixed-income securities. Janus Henderson Cash Liquidity Fund LLC currently maintains a NAV of $1.00 per share and distributes income daily in a manner consistent with a registered product compliant with Rule 2a-7 under the 1940 Act. There are no restrictions on the Portfolio's ability to withdraw investments from Janus Henderson Cash Liquidity Fund LLC at will, and there are no unfunded capital commitments due from the Portfolio to Janus Henderson Cash Liquidity Fund LLC. The units of Janus Henderson Cash Liquidity Fund LLC are not charged any management fee, sales charge or service fee.
Any purchases and sales, realized gains/losses and recorded dividends from affiliated investments during the year ended December 31, 2018 can be found in the “Schedules of Affiliated Investments” located in the Schedule of Investments.
The Portfolio is permitted to purchase or sell securities (“cross-trade”) between itself and other funds or accounts managed by Janus Capital in accordance with Rule 17a-7 under the Investment Company Act of 1940 (“Rule 17a-7”), when the transaction is consistent with the investment objectives and policies of the Portfolio and in accordance with the Internal Cross Trade Procedures adopted by the Trust’s Board of Trustees. These procedures have been designed to ensure that any cross-trade of securities by the Portfolio from or to another fund or account that is or could be considered an affiliate of the Portfolio under certain limited circumstances by virtue of having a common investment adviser, common Officer, or common Trustee complies with Rule 17a-7. Under these procedures, each cross-trade is effected at the current market price to save costs where allowed. During the year ended December 31, 2018, the Portfolio engaged in cross trades amounting to $79,791,223 in purchases and $24,290,485 in sales, resulting in a net realized loss of $214,432. The net realized loss is included within the “Net Realized Gain/(Loss) on Investments” section of the Portfolio’s Statement of Operations.
Janus Henderson VIT Balanced Portfolio
Notes to Financial Statements
4. Federal Income Tax
The tax components of capital shown in the table below represent: (1) distribution requirements the Portfolio must satisfy under the income tax regulations; (2) losses or deductions the Portfolio may be able to offset against income and gains realized in future years; and (3) unrealized appreciation or depreciation of investments for federal income tax purposes.
Other book to tax differences primarily consist of deferred compensation. The Portfolio has elected to treat gains and losses on forward foreign currency contracts as capital gains and losses, if applicable. Other foreign currency gains and losses on debt instruments are treated as ordinary income for federal income tax purposes pursuant to Section 988 of the Internal Revenue Code.
| | | | | | | | |
| | | | Loss Deferrals | Other Book | Net Tax | |
Undistributed
Ordinary Income | Undistributed
Long-Term Gains | Accumulated
Capital Losses | Late-Year
Ordinary Loss | Post-October
Capital Loss | to Tax
Differences | Appreciation/
(Depreciation) | |
$ 15,627,636 | $ 115,560,841 | | $ - | $ - | $ (89,109) | $445,595,726 | |
During the year ended December 31, 2018, capital loss carryovers of 96,189 were utilized by the Portfolio. The capital loss carryover utilized was acquired from the merger with Janus Henderson Global Allocation Portfolio – Moderate.
The aggregate cost of investments and the composition of unrealized appreciation and depreciation of investment securities for federal income tax purposes as of December 31, 2018 are noted below. The primary differences between book and tax appreciation or depreciation of investments are wash sale loss deferrals and investments in partnerships.
| | | | |
Federal Tax Cost | Unrealized
Appreciation | Unrealized
(Depreciation) | Net Tax Appreciation/
(Depreciation) |
$ 3,407,984,425 | $547,241,582 | $(101,645,856) | $ 445,595,726 |
| | | | |
Income and capital gains distributions are determined in accordance with income tax regulations that may differ from accounting principles generally accepted in the United States of America. These differences are due to differing treatments for items such as net short-term gains, deferral of wash sale losses, foreign currency transactions, net investment losses, and capital loss carryovers. Certain permanent differences such as tax returns of capital and net investment losses noted below have been reclassified to capital.
| | | | | |
For the year ended December 31, 2018 | |
Distributions | | |
From Ordinary Income | From Long-Term Capital Gains | Tax Return of Capital | Net Investment Loss | |
$ 67,128,507 | $ 91,459,862 | $ - | $ - | |
| | | | | |
For the year ended December 31, 2017 | |
Distributions | | |
From Ordinary Income | From Long-Term Capital Gains | Tax Return of Capital | Net Investment Loss | |
$ 42,827,309 | $ 5,766,022 | $ - | $ - | |
Permanent book to tax basis differences may result in reclassifications between the components of net assets. These differences have no impact on the results of operations or net assets. The following reclassifications have been made to the Portfolio:
Janus Henderson VIT Balanced Portfolio
Notes to Financial Statements
| | | |
| | | |
Increase/(Decrease) to Capital | Increase/(Decrease) to Undistributed
Net Investment Income/Loss | Increase/(Decrease) to Undistributed
Net Realized Gain/Loss |
$ 180,991 | $ (108,473) | $ (72,518) |
| | | |
5. Capital Share Transactions
| | | | | | | |
| | | | | | | |
| | | Year ended December 31, 2018 | | Year ended December 31, 2017 |
| | | Shares | Amount | | Shares | Amount |
| | | | | | | |
Institutional Shares: | | | | | |
Shares sold | 726,691 | $ 25,520,230 | | 525,764 | $ 17,251,280 |
Shares from the Acquisition (See Note 9) | 2,240 | 76,489 | | - | - |
Reinvested dividends and distributions | 611,981 | 20,863,874 | | 225,051 | 7,519,526 |
Shares repurchased | (1,582,300) | (56,174,445) | | (1,895,270) | (62,314,402) |
Net Increase/(Decrease) | (241,388) | $ (9,713,852) | | (1,144,455) | $ (37,543,596) |
Service Shares: | | | | | |
Shares sold | 20,226,560 | $756,832,931 | | 12,641,440 | $439,491,829 |
Shares from the Acquisition (See Note 9) | 228,198 | 8,210,624 | | - | - |
Reinvested dividends and distributions | 3,834,282 | 137,724,495 | | 1,167,543 | 41,073,805 |
Shares repurchased | (5,336,065) | (198,934,980) | | (5,816,644) | (199,315,445) |
Net Increase/(Decrease) | 18,952,975 | $703,833,070 | | 7,992,339 | $281,250,189 |
6. Purchases and Sales of Investment Securities
For the year ended December 31, 2018, the aggregate cost of purchases and proceeds from sales of investment securities (excluding any short-term securities, short-term options contracts, TBAs, and in-kind transactions, as applicable) was as follows:
| | | | |
Purchases of
Securities | Proceeds from Sales
of Securities | Purchases of Long-
Term U.S. Government
Obligations | Proceeds from Sales
of Long-Term U.S.
Government Obligations |
$1,784,904,243 | $1,611,821,364 | $ 2,344,332,163 | $ 1,845,381,630 |
7. Recent Accounting Pronouncements
The Securities and Exchange Commission adopted amendments to Regulation S-X for the presentation of distributable earnings and distributions to align with US Generally Accepted Accounting Principles (GAAP). The compliance date of the amendments to Regulation S-X was November 5, 2018. This report incorporates the amendments to Regulation S-X.
The FASB issued Accounting Standards Update No. 2017-08, Receivables – Nonrefundable Fees and Other Costs (Subtopic 310-20), Premium Amortization on Purchased Callable Debt Securities ("ASU 2017-08") to amend the amortization period for certain purchased callable debt securities held at a premium. The guidance requires certain premiums on callable debt securities to be amortized to the earliest call date. The amortization period for callable debt securities purchased at a discount will not be impacted. The amendments are effective for fiscal years, and interim periods within those fiscal years, beginning after December 15, 2018. Early adoption is permitted, including adoption in an interim period. Management is currently evaluating the impacts of ASU 2017-08 on the financial statements.
The FASB issued Accounting Standards Update 2018-13, Fair Value Measurement (Topic 820), in August 2018. The new guidance removes, modifies and enhances the disclosures to Topic 820. For public entities, the amendments are effective for financial statements issued for fiscal years beginning after December 15, 2019, and interim periods within those fiscal years. Management is currently evaluating the impact of this new guidance on the financial statements.
Janus Henderson VIT Balanced Portfolio
Notes to Financial Statements
8. Subsequent Event
Management has evaluated whether any events or transactions occurred subsequent to December 31, 2018 and through the date of issuance of the Portfolio’s financial statements and determined that there were no material events or transactions that would require recognition or disclosure in the Portfolio’s financial statements.
9. Fund Acquisition
Shareholders of the Janus Henderson Global Allocation Portfolio – Moderate (the “Target Portfolio”) approved an Agreement and Plan of Reorganization (the “Merger”) that provided for the merger of the Target Portfolio with and into the Portfolio, effective at the close of business on April 27, 2018. The Merger resulted in shareholders of the Target Portfolio receiving shares of the Portfolio which investment strategy is focused on a dynamic approach to asset allocation that leverages Janus Capital’s bottom-up, fundamental equity and fixed-income research, combined with a greater asset size that should create greater opportunity to benefit from long-term economies of scale and lower total expenses. The Merger was tax-free for federal income purposes. The table below reflects merger activity.
| | | | | | |
Target Portfolio’s Shares
Outstanding Prior to Merger | Target Portfolio’s Net
Assets Prior to Merger | Portfolio’s
Shares Issued in Merger | Portfolio’s Net
Assets Prior to Merger | Combined Net Assets after Merger | Target Portfolio’s Unrealized
Appreciation/(Depreciation) Prior to Merger |
644,959 | $8,287,113 | 230,438 | $3,432,633,526 | $3,440,920,639 | $522,786 |
Unaudited pro forma information:
Assuming the Merger had been completed on January 1, 2018, the pro forma results of operations for the year ended December 31, 2018, are as follows:
Net investment income $6,402,168
Net gain/(loss) on investments $58,297,962
Change in unrealized net appreciation/depreciation $ 17,543,651
Net increase/(decrease) in net assets resulting from operations $82,243,781
Because the combined investment portfolios have been managed as a single portfolio since the acquisition was completed, it is not practicable to separate the amounts of revenue and earnings of the Target Portfolio that have been included in the Portfolio’s accompanying Statement of Operations since the close of business on April 27, 2018.
Janus Henderson VIT Balanced Portfolio
Report of Independent Registered Public Accounting Firm
To the Board of Trustees of Janus Aspen Series and Shareholders of Janus Henderson VIT Balanced Portfolio:
Opinion on the Financial Statements
We have audited the accompanying statement of assets and liabilities, including the schedule of investments, of Janus Henderson VIT Balanced Portfolio (one of the portfolios constituting Janus Aspen Series, referred to hereafter as the "Portfolio") as of December 31, 2018, the related statement of operations for the year ended December 31, 2018, the statements of changes in net assets for each of the two years in the period ended December 31, 2018, including the related notes, and the financial highlights for each of the five years in the period ended December 31, 2018 (collectively referred to as the “financial statements”). In our opinion, the financial statements present fairly, in all material respects, the financial position of the Portfolio as of December 31, 2018, the results of its operations for the year then ended, the changes in its net assets for each of the two years in the period ended December 31, 2018 and the financial highlights for each of the five years in the period ended December 31, 2018 in conformity with accounting principles generally accepted in the United States of America.
Basis for Opinion
These financial statements are the responsibility of the Portfolio’s management. Our responsibility is to express an opinion on the Portfolio’s financial statements based on our audits. We are a public accounting firm registered with the Public Company Accounting Oversight Board (United States) (PCAOB) and are required to be independent with respect to the Portfolio in accordance with the U.S. federal securities laws and the applicable rules and regulations of the Securities and Exchange Commission and the PCAOB.
We conducted our audits of these financial statements in accordance with the standards of the PCAOB. Those standards require that we plan and perform the audit to obtain reasonable assurance about whether the financial statements are free of material misstatement, whether due to error or fraud.
Our audits included performing procedures to assess the risks of material misstatement of the financial statements, whether due to error or fraud, and performing procedures that respond to those risks. Such procedures included examining, on a test basis, evidence regarding the amounts and disclosures in the financial statements. Our audits also included evaluating the accounting principles used and significant estimates made by management, as well as evaluating the overall presentation of the financial statements. Our procedures included confirmation of securities owned as of December 31, 2018 by correspondence with the custodian, transfer agent, investee companies, and brokers; when replies were not received from brokers, we performed other auditing procedures. We believe that our audits provide a reasonable basis for our opinion.

Denver, Colorado
February 15, 2019
We have served as the auditor of one or more investment companies in Janus Henderson Funds since 1990.
Janus Henderson VIT Balanced Portfolio
Additional Information (unaudited)
Proxy Voting Policies and Voting Record
A description of the policies and procedures that the Portfolio uses to determine how to vote proxies relating to its portfolio securities is available without charge: (i) upon request, by calling 1-800-525-1093; (ii) on the Portfolio’s website at janushenderson.com/proxyvoting; and (iii) on the SEC’s website at http://www.sec.gov. Additionally, information regarding the Portfolio’s proxy voting record for the most recent twelve-month period ended June 30 is also available, free of charge, through janushenderson.com/proxyvoting and from the SEC’s website at http://www.sec.gov.
Full Holdings
The Portfolio is required to disclose its complete holdings on Form N-Q within 60 days of the end of the first and third fiscal quarters, and in the annual report and semiannual report to Portfolio shareholders. These reports (i) are available on the SEC’s website at http://www.sec.gov; (ii) may be reviewed and copied at the SEC’s Public Reference Room in Washington, D.C. (information on the Public Reference Room may be obtained by calling 1-800-SEC-0330); and (iii) are available without charge, upon request, by calling a Janus Henderson representative at 1-877-335-2687 (toll free) . Portfolio holdings consisting of at least the names of the holdings are generally available on a monthly basis with a 30-day lag. Holdings are generally posted approximately two business days thereafter under Full Holdings for the Portfolio at janushenderson.com/vit.
APPROVAL OF ADVISORY AGREEMENTS DURING THE PERIOD
The Trustees of Janus Aspen Series, each of whom serves as an “independent” Trustee (the “Trustees”), oversee the management of each Portfolio of Janus Aspen Series (each, a “VIT Portfolio,” and collectively, the “VIT Portfolios”), as well as each Fund of Janus Investment Fund (together with the VIT Portfolios, the “Janus Henderson Funds,” and each, a “Janus Henderson Fund”). As required by law, the Trustees determine annually whether to continue the investment advisory agreement for each Janus Henderson Fund and the subadvisory agreement for each Janus Henderson Funds that utilizes a subadviser.
In connection with their most recent consideration of those agreements for each Janus Henderson Fund, the Trustees received and reviewed information provided by Janus Capital and each subadviser in response to requests of the Trustees and their independent legal counsel. They also received and reviewed information and analysis provided by, and in response to requests of, their independent fee consultant. Throughout their consideration of the agreements, the Trustees were advised by their independent legal counsel. The Trustees met with management to consider the agreements and the information provided, and also met separately in executive session with their independent legal counsel and their independent fee consultant.
At a meeting held on December 6, 2018, based on the Trustees’ evaluation of the information provided by Janus Capital, the subadvisers, and the independent fee consultant, as well as other information, the Trustees determined that the overall arrangements between each Janus Henderson Fund and Janus Capital and each subadviser, as applicable, were fair and reasonable in light of the nature, extent and quality of the services provided by Janus Capital, its affiliates and the subadvisers, the fees charged for those services, and other matters that the Trustees considered relevant in the exercise of their business judgment. At that meeting, the Trustees unanimously approved the continuation of the investment advisory agreement for each Janus Henderson Fund, and the subadvisory agreement for each subadvised Janus Henderson Fund, for the period from February 1, 2019 through February 1, 2020, subject to earlier termination as provided for in each agreement.
In considering the continuation of those agreements, the Trustees reviewed and analyzed various factors that they determined were relevant, including the factors described below, none of which by itself was considered dispositive. However, the material factors and conclusions that formed the basis for the Trustees’ determination to approve the continuation of the agreements are discussed separately below. Also included is a summary of the independent fee consultant’s conclusions and opinions that arose during, and were included as part of, the Trustees’ consideration of the agreements. “Management fees,” as used herein, refer to actual annual advisory fees (and, for the purposes of peer comparisons any administration fees excluding out of pocket costs), net of any waivers, paid by a fund as a percentage of average net assets.
Nature, Extent and Quality of Services
The Trustees reviewed the nature, extent and quality of the services provided by Janus Capital and the subadvisers to the Janus Henderson Funds, taking into account the investment objective, strategies and policies of each Janus Henderson Fund, and the knowledge the Trustees gained from their regular meetings with management on at least a
Janus Henderson VIT Balanced Portfolio
Additional Information (unaudited)
quarterly basis and their ongoing review of information related to the Janus Henderson Funds. In addition, the Trustees reviewed the resources and key personnel of Janus Capital and each subadviser, particularly noting those employees who provide investment and risk management services to the Janus Henderson Funds. The Trustees also considered other services provided to the Janus Henderson Funds by Janus Capital or the subadvisers, such as managing the execution of portfolio transactions and the selection of broker-dealers for those transactions. The Trustees considered Janus Capital’s role as administrator to the Janus Henderson Funds, noting that Janus Capital does not receive a fee for its services but is reimbursed for its out-of-pocket costs. The Trustees considered the role of Janus Capital in monitoring adherence to the Janus Henderson Funds’ investment restrictions, providing support services for the Trustees and Trustee committees, and overseeing communications with fund shareholders and the activities of other service providers, including monitoring compliance with various policies and procedures of the Janus Henderson Funds and with applicable securities laws and regulations.
In this regard, the independent fee consultant noted that Janus Capital provides a number of different services for the Janus Henderson Funds and fund shareholders, ranging from investment management services to various other servicing functions, and that, in its view, Janus Capital is a capable provider of those services. The independent fee consultant also expressed the view that Janus Capital has developed a number of institutional competitive advantages that should enable it to provide superior investment and service performance over the long term.
The Trustees concluded that the nature, extent and quality of the services provided by Janus Capital and the subadviser to each Janus Henderson Fund that utilizes a subadviser were appropriate and consistent with the terms of the respective investment advisory and subadvisory agreements, and that, taking into account steps taken to address those Janus Henderson Funds whose performance lagged that of their peers for certain periods, the Janus Henderson Funds were likely to benefit from the continued provision of those services. They also concluded that Janus Capital and each subadviser had sufficient personnel, with the appropriate education and experience, to serve the Janus Henderson Funds effectively and had demonstrated its ability to attract well-qualified personnel.
Performance of the Funds
The Trustees considered the performance results of each Janus Henderson Fund over various time periods. They noted that they considered Janus Henderson Fund performance data throughout the year, including periodic meetings with each Janus Henderson Fund’s portfolio manager(s), and also reviewed information comparing each Janus Henderson Fund’s performance with the performance of comparable funds and peer groups identified by Broadridge Financial Solutions, Inc. (“Broadridge”), an independent data provider, and with the Janus Henderson Fund’s benchmark index. In this regard, the independent fee consultant found that the overall Janus Henderson Funds’ performance has been reasonable: for the 36 months ended September 30, 2018, approximately 48% of the Janus Henderson Funds were in the top two quartiles of performance, as reported by Morningstar, and for the 12 months ended September 30, 2018, approximately 56% of the Janus Henderson Funds were in the top two quartiles of performance, as reported by Morningstar.
The Trustees considered the performance of each Janus Henderson Fund, noting that performance may vary by share class, and noted the following with respect to the VIT Portfolios:
· For Janus Henderson Balanced Portfolio, the Trustees noted that the Fund’s performance was in the first Broadridge quartile for the 36 months ended May 31, 2018 and the first Broadridge quartile for the 12 months ended May 31, 2018.
· For Janus Henderson Enterprise Portfolio, the Trustees noted that the Fund’s performance was in the first Broadridge quartile for the 36 months ended May 31, 2018 and the second Broadridge quartile for the 12 months ended May 31, 2018.
· For Janus Henderson Flexible Bond Portfolio, the Trustees noted that the Fund’s performance was in the bottom Broadridge quartile for the 36 months ended May 31, 2018 and the bottom Broadridge quartile for the 12 months ended May 31, 2018. The Trustees noted the reasons for the Fund’s underperformance and the steps Janus Capital had taken or was taking to improve performance.
· For Janus Henderson Forty Portfolio, the Trustees noted that the Fund’s performance was in the third Broadridge quartile for the 36 months ended May 31, 2018 and the third Broadridge quartile for the 12 months ended May 31,
Janus Henderson VIT Balanced Portfolio
Additional Information (unaudited)
2018. The Trustees noted the reasons for the Fund’s underperformance, while also noting that the Fund has a performance fee structure that results in lower management fees during periods of underperformance, and the steps Janus Capital had taken or was taking to improve performance.
· For Janus Henderson Global Research Portfolio, the Trustees noted that the Fund’s performance was in the bottom Broadridge quartile for the 36 months ended May 31, 2018 and the third Broadridge quartile for the 12 months ended May 31, 2018. The Trustees noted the reasons for the Fund’s underperformance, while also noting that the Fund has a performance fee structure that results in lower management fees during periods of underperformance, and the steps Janus Capital had taken or was taking to improve performance.
· For Janus Henderson Global Technology Portfolio, the Trustees noted that the Fund’s performance was in the first Broadridge quartile for the 36 months ended May 31, 2018 and the first Broadridge quartile for the 12 months ended May 31, 2018.
· For Janus Henderson Global Unconstrained Bond Portfolio, the Trustees noted that the Fund’s performance was in the bottom Broadridge quartile for the 36 months ended May 31, 2018 and the bottom Broadridge quartile for the 12 months ended May 31, 2018. The Trustees noted the reasons for the Fund’s underperformance and the steps Janus Capital had taken or was taking to improve performance.
· For Janus Henderson Mid Cap Value Portfolio, the Trustees noted that the Fund’s performance was in the second Broadridge quartile for the 36 months ended May 31, 2018 and the bottom Broadridge quartile for the 12 months ended May 31, 2018.
· For Janus Henderson Overseas Portfolio, the Trustees noted that the Fund’s performance was in the bottom Broadridge quartile for the 36 months ended May 31, 2018 and the second Broadridge quartile for the 12 months ended May 31, 2018. The Trustees noted the reasons for the Fund’s underperformance, while also noting that the Fund has a performance fee structure that results in lower management fees during periods of underperformance, the steps Janus Capital had taken or was taking to improve performance, and that the performance trend was improving.
· For Janus Henderson Research Portfolio, the Trustees noted that the Fund’s performance was in the third Broadridge quartile for the 36 months ended May 31, 2018 and the third Broadridge quartile for the 12 months ended May 31, 2018. The Trustees noted the reasons for the Fund’s underperformance, while also noting that the Fund has a performance fee structure that results in lower management fees during periods of underperformance, and the steps Janus Capital had taken or was taking to improve performance.
· For Janus Henderson U.S. Low Volatility Portfolio, the Trustees noted that the Fund’s performance was in the third Broadridge quartile for the 36 months ended May 31, 2018 and the bottom Broadridge quartile for the 12 months ended May 31, 2018. The Trustees noted the reasons for the Fund’s underperformance and the steps Janus Capital and Intech had taken or were taking to improve performance.
In consideration of each Janus Henderson Fund’s performance, the Trustees concluded that, taking into account the factors relevant to performance, as well as other considerations, including steps taken to improve performance, the Janus Henderson Fund’s performance warranted continuation of such Janus Henderson Fund’s investment advisory and subadvisory agreement(s).
Costs of Services Provided
The Trustees examined information regarding the fees and expenses of each Janus Henderson Fund in comparison to similar information for other comparable funds as provided by Broadridge, an independent data provider. They also reviewed an analysis of that information provided by their independent fee consultant and noted that the management fee rate (investment advisory and any administration fees, but excluding out-of-pocket costs) for many of the Janus Henderson Funds, net of waivers, was below the average management fee rate of the respective peer group of funds selected by Broadridge. The Trustees also examined information regarding the subadvisory fees charged for subadvisory services, as applicable, noting that all such fees were paid by Janus Capital out of its management fees collected from such Janus Henderson Fund. The Trustees also considered the total expenses for each share class of each Janus Henderson Fund compared to the average total expenses for its Broadridge Expense Group peers and to average total expenses for its Broadridge Expense Universe.
The independent fee consultant expressed the view that the management fees charged by Janus Capital to each of the Janus Henderson Funds under the current investment advisory and administration agreements are reasonable in relation to the services provided by Janus Capital. At the fund complex level, the independent fee consultant found: (1)
Janus Henderson VIT Balanced Portfolio
Additional Information (unaudited)
the total expenses and management fees of the Janus Henderson Funds to be reasonable relative to other mutual funds; (2) total expenses, on average, were 10% under the average total expenses for the respective Broadridge Expense Group peers and 19% under the average total expenses for the respective Broadridge Expense Universes; (3) management fees for the Janus Henderson Funds, on average, were 8% under the average management fees for the respective Expense Groups and 10% under the average for the respective Expense Universes; and (4) Janus Henderson Fund expenses by function for each asset and share class category were reasonable relative to peer benchmarks.
The independent fee consultant concluded that, based on its strategic review of expenses at the complex, category and individual share class level, Janus Henderson Fund expenses were found to be reasonable relative to peer benchmarks. Further, for certain Janus Henderson Funds, the independent fee consultant also performed a systematic “focus list” analysis of expenses in the context of the performance or service delivered to investors in each Janus Henderson Fund. Based on this analysis, the independent fee consultant found that the combination of service quality/performance and expenses on these individual Janus Henderson Funds were reasonable in light of performance trends, performance histories, and existence of performance fees, breakpoints, and expense waivers on such “focus list” Funds.
The Trustees considered the methodology used by Janus Capital and each subadviser in determining compensation payable to portfolio managers, the competitive environment for investment management talent, and the competitive market for mutual funds in different distribution channels.
The Trustees also reviewed management fees charged by Janus Capital and each subadviser to comparable separate account clients and to comparable non-affiliated funds subadvised by Janus Capital or by a subadviser (for which Janus Capital or the subadviser provides only or primarily portfolio management services). Although in most instances comparable subadvisory and separate account fee rates for various investment strategies were lower than management fee rates for Janus Henderson Funds having a similar strategy, while subadviser fee rates charged to the Janus Henderson Funds were generally within a reasonable range of the fee rates that the subadviser charges to comparable separate account clients or non-affiliated funds. The Trustees considered that Janus Capital noted that, under the terms of the management agreements with the Janus Henderson Funds, Janus Capital performs significant additional services for the Janus Henderson Funds that it does not provide to those other clients, including administration services, oversight of the Janus Henderson Funds’ other service providers, trustee support, regulatory compliance and numerous other services, and that, in serving the Janus Henderson Funds, Janus Capital assumes many legal risks and other costs that it does not assume in servicing its other clients. Moreover, the Trustees noted that the independent fee consultant found that: (1) the management fees Janus Capital charges to the Janus Henderson Funds are reasonable in relation to the management fees Janus Capital charges to its institutional clients and to the fees Janus Capital charges to funds subadvised by Janus Capital; (2) these institutional and subadvised accounts have different service and infrastructure needs; (3) Janus Henderson mutual fund investors enjoy reasonable fees relative to the fees charged to Janus Henderson institutional and subadvised fund investors; (4) in three of five product categories, the Janus Henderson Funds receive proportionally better pricing than the industry in relation to Janus Henderson institutional clients; and (5) in six of seven strategies, Janus Capital has lower management fees than the management fees charged to funds subadvised by Janus Capital.
The Trustees considered the fees for each Janus Henderson Fund for its fiscal year ended in 2017, including the VIT Portfolios, and noted the following with regard to each VIT Portfolio’s total expenses, net of applicable fee waivers (the VIT Portfolio’s “total expenses”):
· For Janus Henderson Balanced Portfolio, the Trustees noted that, although the Fund’s total expenses exceeded the peer group average for one share class, overall the Fund’s total expenses were reasonable.
· For Janus Henderson Enterprise Portfolio, the Trustees noted that, although the Fund’s total expenses exceeded the peer group average for one share class, overall the Fund’s total expenses were reasonable.
· For Janus Henderson Flexible Bond Portfolio, the Trustees noted that, although the Fund’s total expenses exceeded the peer group average for one share class, overall the Fund’s total expenses were reasonable. The Trustees also noted that Janus Capital has contractually agreed to limit the Fund’s expenses, although this limit did not apply because the Fund’s total expenses were already below the applicable fee limit.
· For Janus Henderson Forty Portfolio, the Trustees noted that, although the Fund’s total expenses exceeded the peer group average for one share class, overall the Fund’s total expenses were reasonable.
Janus Henderson VIT Balanced Portfolio
Additional Information (unaudited)
· For Janus Henderson Global Research Portfolio, the Trustees noted that the Fund’s total expenses were below the peer group average for both share classes.
· For Janus Henderson Global Technology Portfolio, the Trustees noted that the Fund’s total expenses were below the peer group average for both share classes.
· For Janus Henderson Global Unconstrained Bond Portfolio, the Trustees noted that, although the Fund’s total expenses exceeded the peer group average for both share classes, overall the Fund’s total expenses were reasonable. The Trustees also noted that Janus Capital has contractually agreed to limit the Fund’s expenses.
· For Janus Henderson Mid Cap Value Portfolio, the Trustees noted that the Fund’s total expenses were below the peer group average for both share classes.
· For Janus Henderson Overseas Portfolio, the Trustees noted that the Fund’s total expenses were below the peer group average for both share classes.
· For Janus Henderson Research Portfolio, the Trustees noted that the Fund’s total expenses were below the peer group average for both share classes.
· For Janus Henderson U.S. Low Volatility Portfolio, the Trustees noted that the Fund’s total expenses were below the peer group average for its sole share class.
The Trustees reviewed information on the overall profitability to Janus Capital and its affiliates of their relationship with the Janus Henderson Funds, and considered profitability data of other publicly traded fund managers. The Trustees recognized that profitability comparisons among fund managers are difficult because of the variation in the type of comparative information that is publicly available, and the profitability of any fund manager is affected by numerous factors, including the organizational structure of the particular fund manager, differences in complex size, differences in product mix, differences in types of business (mutual fund, institutional and other), differences in the methodology for allocating expenses, and the fund manager’s capital structure and cost of capital.
Additionally, the Trustees considered the estimated profitability to Janus Capital from the investment management services it provides to each Janus Henderson Fund. In their review, the Trustees considered whether Janus Capital and each subadviser receive adequate incentives and resources to manage the Janus Henderson Funds effectively. In reviewing profitability, the Trustees noted that the estimated profitability for an individual Janus Henderson Fund is necessarily a product of the allocation methodology utilized by Janus Capital to allocate its expenses as part of the estimated profitability calculation. In this regard, the Trustees noted that the independent fee consultant concluded that (1) the expense allocation methodology utilized by Janus Capital was reasonable and (2) the estimated profitability to Janus Capital from the investment management services it provided to each Janus Henderson Fund was reasonable. The Trustees also considered that the estimated profitability for an individual Janus Henderson Fund was influenced by a number of factors, including not only the allocation methodology selected, but also the presence of fee waivers and expense caps, and whether the Janus Henderson Fund’s investment management agreement contained breakpoints or a performance fee component. The Trustees determined, after taking into account these factors, among others, that Janus Capital’s estimated profitability with respect to each Janus Henderson Fund was not unreasonable in relation to the services provided, and that the variation in the range of such estimated profitability among the Janus Henderson Funds was not a material factor in the Board’s approval of the reasonableness of any Janus Henderson Fund’s investment management fees.
The Trustees concluded that the management fees payable by each Janus Henderson Fund to Janus Capital, as well as the fees paid by Janus Capital to the subadvisers of subadvised Janus Henderson Funds, were reasonable in relation to the nature, extent, and quality of the services provided, taking into account the fees charged by other advisers for managing comparable mutual funds with similar strategies, the fees Janus Capital and the subadvisers charge to other clients, and, as applicable, the impact of fund performance on management fees payable by the Janus Henderson Funds. The Trustees also concluded that each Janus Henderson Fund’s total expenses were reasonable, taking into account the size of the Janus Henderson Fund, the quality of services provided by Janus Capital and any subadviser, the investment performance of the Janus Henderson Fund, and any expense limitations agreed to or provided by Janus Capital.
Economies of Scale
The Trustees considered information about the potential for Janus Capital to realize economies of scale as the assets of the Janus Henderson Funds increase. They noted the independent fee consultant’s analysis of economies of scale
Janus Henderson VIT Balanced Portfolio
Additional Information (unaudited)
in prior years. They also noted that, although many Janus Henderson Funds pay advisory fees at a base fixed rate as a percentage of net assets, without any breakpoints or performance fees, the independent fee consultant concluded that 74% of these Janus Henderson Funds’ share classes have contractual management fees (gross of waivers) below their Broadridge Expense Group averages. They also noted that for those Janus Henderson Funds whose expenses are being reduced by contractual expense limitations with Janus Capital, Janus Capital is subsidizing certain of these Janus Henderson Funds because they have not reached adequate scale. Moreover, as the assets of some of the Janus Henderson Funds have declined in the past few years, certain Janus Henderson Funds have benefited from having advisory fee rates that have remained constant rather than increasing as assets declined. In addition, performance fee structures have been implemented for various Janus Henderson Funds that have caused the effective rate of advisory fees payable by such a Janus Henderson Fund to vary depending on the investment performance of the Janus Henderson Fund relative to its benchmark index over the measurement period; and a few Janus Henderson Funds have fee schedules with breakpoints and reduced fee rates above certain asset levels. The Trustees also noted that the Janus Henderson Funds share directly in economies of scale through the lower charges of third-party service providers that are based in part on the combined scale of all of the Janus Henderson Funds.
The Trustees also considered information provided by the independent fee consultant, which concluded that, given the limitations of various analytical approaches to economies of scale it had considered in prior years, and their conflicting results, it is difficult to analytically confirm or deny the existence of economies of scale in the Janus Henderson complex. The independent consultant further concluded that (1) to the extent there were economies of scale at Janus Capital, Janus Capital’s general strategy of setting fixed management fees below peers appeared to share any such economies with investors even on smaller Janus Henderson Funds which have not yet achieved those economies and (2) by setting lower fixed fees from the start on these Janus Henderson Funds, Janus Capital appeared to be investing to increase the likelihood that these Janus Henderson Funds will grow to a level to achieve any scale economies that may exist. Further, the independent fee consultant expressed the view that Janus Henderson Fund investors are well-served by the performance fee structures in place on the Janus Henderson Funds in light of any economies of scale that may be present at Janus Capital.
Based on all of the information they reviewed, including past research and analysis conducted by the Trustees’ independent fee consultant, the Trustees concluded that the current fee structure of each Janus Henderson Fund was reasonable and that the current rates of fees do reflect a sharing between Janus Capital and the Janus Henderson Fund of any economies of scale that may be present at the current asset level of the Janus Henderson Fund.
Other Benefits to Janus Capital
The Trustees also considered benefits that accrue to Janus Capital and its affiliates and subadvisers to the Janus Henderson Funds from their relationships with the Janus Henderson Funds. They recognized that two affiliates of Janus Capital separately serve the Janus Henderson Funds as transfer agent and distributor, respectively, and the transfer agent receives compensation directly from the non-money market funds for services provided, and that such compensation contributes to the overall profitability of Janus Capital and its affiliates that results from their relationship with the Janus Henderson Funds. The Trustees also considered Janus Capital’s and each subadviser’s past and proposed use of commissions paid by the Janus Henderson Funds on portfolio brokerage transactions to obtain proprietary and third-party research products and services benefiting the Janus Henderson Fund and/or other clients of Janus Capital and/or Janus Capital, and/or a subadviser to a Janus Henderson Fund. The Trustees concluded that Janus Capital’s and the subadvisers’ use of these types of client commission arrangements to obtain proprietary and third-party research products and services was likely to benefit each Janus Henderson Fund. The Trustees also concluded that, other than the services provided by Janus Capital and its affiliates and subadvisers pursuant to the agreements and the fees to be paid by each Janus Henderson Fund therefor, the Janus Henderson Funds and Janus Capital and the subadvisers may potentially benefit from their relationship with each other in other ways. They concluded that Janus Capital and its affiliates share directly in economies of scale through the lower charges of third-party service providers that are based in part on the combined scale of the Janus Henderson Funds and other clients serviced by Janus Capital and its affiliates. They also concluded that Janus Capital and/or the subadvisers benefit from the receipt of research products and services acquired through commissions paid on portfolio transactions of the Janus Henderson Funds and that the Janus Henderson Funds benefit from Janus Capital’s and/or the subadvisers’ receipt of those products and services as well as research products and services acquired through commissions paid by certain other clients of Janus Capital and/or other clients of the subadvisers. They further concluded that the success of any Janus Henderson Fund could attract other business to Janus Capital, the subadvisers or other Janus Henderson funds,
Janus Henderson VIT Balanced Portfolio
Additional Information (unaudited)
and that the success of Janus Capital and the subadvisers could enhance Janus Capital’s and the subadvisers’ ability to serve the Janus Henderson Funds.
Janus Henderson VIT Balanced Portfolio
Useful Information About Your Portfolio Report (unaudited)
Management Commentary
The Management Commentary in this report includes valuable insight as well as statistical information to help you understand how your Portfolio’s performance and characteristics stack up against those of comparable indices.
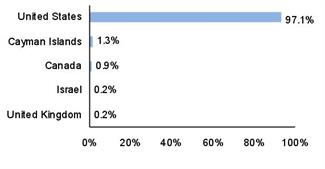
If the Portfolio invests in foreign securities, this report may include information about country exposure. Country exposure is based primarily on the country of risk. A company may be allocated to a country based on other factors such as location of the company’s principal office, the location of the principal trading market for the company’s securities, or the country where a majority of the company’s revenues are derived.
Please keep in mind that the opinions expressed in the Management Commentary are just that: opinions. They are a reflection based on best judgment at the time this report was compiled, which was December 31, 2018. As the investing environment changes, so could opinions. These views are unique and are not necessarily shared by fellow employees or by Janus Henderson in general.
Performance Overviews
Performance overview graphs compare the performance of a hypothetical $10,000 investment in the Portfolio with one or more widely used market indices. When comparing the performance of the Portfolio with an index, keep in mind that market indices are not available for investment and do not reflect deduction of expenses.
Average annual total returns are quoted for a Portfolio with more than one year of performance history. Average annual total return is calculated by taking the growth or decline in value of an investment over a period of time, including reinvestment of dividends and distributions, then calculating the annual compounded percentage rate that would have produced the same result had the rate of growth been constant throughout the period. Average annual total return does not reflect the deduction of taxes that a shareholder would pay on Portfolio distributions or redemptions of Portfolio shares.
Cumulative total returns are quoted for a Portfolio with less than one year of performance history. Cumulative total return is the growth or decline in value of an investment over time, independent of the period of time involved. Cumulative total return does not reflect the deduction of taxes that a shareholder would pay on Portfolio distributions or redemptions of Portfolio shares.
Pursuant to federal securities rules, expense ratios shown in the performance chart reflect subsidized (if applicable) and unsubsidized ratios. The total annual fund operating expenses ratio is gross of any fee waivers, reflecting the Portfolio’s unsubsidized expense ratio. The net annual fund operating expenses ratio (if applicable) includes contractual waivers of Janus Capital and reflects the Portfolio’s subsidized expense ratio. Ratios may be higher or lower than those shown in the “Financial Highlights” in this report.
Schedule of Investments
Following the performance overview section is the Portfolio’s Schedule of Investments. This schedule reports the types of securities held in the Portfolio on the last day of the reporting period. Securities are usually listed by type (common stock, corporate bonds, U.S. Government obligations, etc.) and by industry classification (banking, communications, insurance, etc.). Holdings are subject to change without notice.
The value of each security is quoted as of the last day of the reporting period. The value of securities denominated in foreign currencies is converted into U.S. dollars.
If the Portfolio invests in foreign securities, it will also provide a summary of investments by country. This summary reports the Portfolio exposure to different countries by providing the percentage of securities invested in each country. The country of each security represents the country of risk. The Portfolio’s Schedule of Investments relies upon the industry group and country classifications published by Barclays and/or MSCI Inc.
Tables listing details of individual forward currency contracts, futures, written options, swaptions, and swaps follow the Portfolio’s Schedule of Investments (if applicable).
Statement of Assets and Liabilities
This statement is often referred to as the “balance sheet.” It lists the assets and liabilities of the Portfolio on the last day of the reporting period.
Janus Henderson VIT Balanced Portfolio
Useful Information About Your Portfolio Report (unaudited)
The Portfolio’s assets are calculated by adding the value of the securities owned, the receivable for securities sold but not yet settled, the receivable for dividends declared but not yet received on securities owned, and the receivable for Portfolio shares sold to investors but not yet settled. The Portfolio’s liabilities include payables for securities purchased but not yet settled, Portfolio shares redeemed but not yet paid, and expenses owed but not yet paid. Additionally, there may be other assets and liabilities such as unrealized gain or loss on forward currency contracts.
The section entitled “Net Assets Consist of” breaks down the components of the Portfolio’s net assets. Because the Portfolio must distribute substantially all earnings, you will notice that a significant portion of net assets is shareholder capital.
The last section of this statement reports the net asset value (“NAV”) per share on the last day of the reporting period. The NAV is calculated by dividing the Portfolio’s net assets for each share class (assets minus liabilities) by the number of shares outstanding.
Statement of Operations
This statement details the Portfolio’s income, expenses, realized gains and losses on securities and currency transactions, and changes in unrealized appreciation or depreciation of Portfolio holdings.
The first section in this statement, entitled “Investment Income,” reports the dividends earned from securities and interest earned from interest-bearing securities in the Portfolio.
The next section reports the expenses incurred by the Portfolio, including the advisory fee paid to the investment adviser, transfer agent fees and expenses, and printing and postage for mailing statements, financial reports and prospectuses. Expense offsets and expense reimbursements, if any, are also shown.
The last section lists the amounts of realized gains or losses from investment and foreign currency transactions, and changes in unrealized appreciation or depreciation of investments and foreign currency-denominated assets and liabilities. The Portfolio will realize a gain (or loss) when it sells its position in a particular security. A change in unrealized gain (or loss) refers to the change in net appreciation or depreciation of the Portfolio during the reporting period. “Net Realized and Unrealized Gain/(Loss) on Investments” is affected both by changes in the market value of Portfolio holdings and by gains (or losses) realized during the reporting period.
Statements of Changes in Net Assets
These statements report the increase or decrease in the Portfolio’s net assets during the reporting period. Changes in the Portfolio’s net assets are attributable to investment operations, dividends and distributions to investors, and capital share transactions. This is important to investors because it shows exactly what caused the Portfolio’s net asset size to change during the period.
The first section summarizes the information from the Statement of Operations regarding changes in net assets due to the Portfolio’s investment operations. The Portfolio’s net assets may also change as a result of dividend and capital gains distributions to investors. If investors receive their dividends and/or distributions in cash, money is taken out of the Portfolio to pay the dividend and/or distribution. If investors reinvest their dividends and/or distributions, the Portfolio’s net assets will not be affected. If you compare the Portfolio’s “Net Decrease from Dividends and Distributions” to “Reinvested Dividends and Distributions,” you will notice that dividends and distributions have little effect on the Portfolio’s net assets. This is because the majority of the Portfolio’s investors reinvest their dividends and/or distributions.
The reinvestment of dividends and distributions is included under “Capital Share Transactions.” “Capital Shares” refers to the money investors contribute to the Portfolio through purchases or withdrawals via redemptions. The Portfolio’s net assets will increase and decrease in value as investors purchase and redeem shares from the Portfolio.
Financial Highlights
This schedule provides a per-share breakdown of the components that affect the Portfolio’s NAV for current and past reporting periods as well as total return, asset size, ratios, and portfolio turnover rate.
The first line in the table reflects the NAV per share at the beginning of the reporting period. The next line reports the net investment income/(loss) per share. Following is the per share total of net gains/(losses), realized and unrealized. Per share dividends and distributions to investors are then subtracted to arrive at the NAV per share at the end of the
Janus Henderson VIT Balanced Portfolio
Useful Information About Your Portfolio Report (unaudited)
period. The next line reflects the total return for the period. Also included are ratios of expenses and net investment income to average net assets.
The Portfolio’s expenses may be reduced through expense offsets and expense reimbursements. The ratios shown reflect expenses before and after any such offsets and reimbursements.
The ratio of net investment income/(loss) summarizes the income earned less expenses, divided by the average net assets of the Portfolio during the reporting period. Do not confuse this ratio with the Portfolio’s yield. The net investment income ratio is not a true measure of the Portfolio’s yield because it does not take into account the dividends distributed to the Portfolio’s investors.
The next figure is the portfolio turnover rate, which measures the buying and selling activity in the Portfolio. Portfolio turnover is affected by market conditions, changes in the asset size of the Portfolio, fluctuating volume of shareholder purchase and redemption orders, the nature of the Portfolio’s investments, and the investment style and/or outlook of the portfolio manager(s) and/or investment personnel. A 100% rate implies that an amount equal to the value of the entire portfolio was replaced once during the fiscal year; a 50% rate means that an amount equal to the value of half the portfolio is traded in a year; and a 200% rate means that an amount equal to the value of the entire portfolio is traded every six months.
Janus Henderson VIT Balanced Portfolio
Designation Requirements (unaudited)
For federal income tax purposes, the Portfolio designated the following for the year ended December 31, 2018:
| | |
| | |
Capital Gain Distributions | $91,459,862 |
Dividends Received Deduction Percentage | 64% |
Janus Henderson VIT Balanced Portfolio
Trustees and Officers (unaudited)
The Portfolio’s Statement of Additional Information includes additional information about the Trustees and officers and is available, without charge, by calling 1-877-335-2687.
The following are the Trustees and officers of the Trust, together with a brief description of their principal occupations during the last five years (principal occupations for certain Trustees may include periods over five years).
Each Trustee has served in that capacity since he or she was originally elected or appointed. The Trustees do not serve a specified term of office. Each Trustee will hold office until the termination of the Trust or his or her earlier death, resignation, retirement, incapacity, or removal. Under the Portfolio’s Governance Procedures and Guidelines, the policy is for Trustees to retire no later than the end of the calendar year in which the Trustee turns 75. The Trustees review the Portfolio’s Governance Procedures and Guidelines from time to time and may make changes they deem appropriate. The Portfolio’s Nominating and Governance Committee will consider nominees for the position of Trustee recommended by shareholders. Shareholders may submit the name of a candidate for consideration by the Committee by submitting their recommendations to the Trust’s Secretary. Each Trustee is currently a Trustee of one other registered investment company advised by Janus Capital: Janus Investment Fund. Collectively, these two registered investment companies consist of 60 series or funds.
The Trust’s officers are elected annually by the Trustees for a one-year term. Certain officers also serve as officers of Janus Investment Fund. Certain officers of the Portfolio may also be officers and/or directors of Janus Capital. Except as otherwise disclosed, Portfolio officers receive no compensation from the Portfolio, except for the Portfolio’s Chief Compliance Officer, as authorized by the Trustees.
Janus Henderson VIT Balanced Portfolio
Trustees and Officers (unaudited)
| | | | | | |
TRUSTEES |
Name, Address, and Age | Positions Held with the Trust | Length of Time Served | Principal Occupations During the Past Five Years | Number of Portfolios/Funds in Fund Complex Overseen by Trustee | Other Directorships Held by Trustee During the Past Five Years |
Independent Trustees |
William F. McCalpin
151 Detroit Street
Denver, CO 80206
DOB: 1957 | Chairman
Trustee | 1/08-Present
6/02-Present | Managing Partner, Impact Investments, Athena Capital Advisors LLC (independent registered investment advisor) (since 2016). Formerly, Managing Director, Holos Consulting LLC (provides consulting services to foundations and other nonprofit organizations) (2009-2016), Chief Executive Officer, Imprint Capital Advisors (impact investment firm) (2013-2015) and Executive Vice President and Chief Operating Officer of The Rockefeller Brothers Fund (a private family foundation) (1998-2006). | 60 | Director of Mutual Fund Directors Forum (a non-profit organization serving independent directors of U.S. mutual funds), Chairman of the Board and Trustee of The Investment Fund for Foundations Investment Program (TIP) (consisting of 2 funds), and Director of the F.B. Heron Foundation (a private grantmaking foundation). |
Janus Henderson VIT Balanced Portfolio
Trustees and Officers (unaudited)
| | | | | | |
TRUSTEES |
Name, Address, and Age | Positions Held with the Trust | Length of Time Served | Principal Occupations During the Past Five Years | Number of Portfolios/Funds in Fund Complex Overseen by Trustee | Other Directorships Held by Trustee During the Past Five Years |
Independent Trustees |
Alan A. Brown
151 Detroit Street
Denver, CO 80206
DOB: 1962 | Trustee | 1/13-Present | Principal, Principal Curam Holdings (since 2018). Formery, Executive Vice President, Institutional Markets, of Black Creek Group (private equity real estate investment management firm) (2012-2018), Executive Vice President and Co-Head, Global Private Client Group (2007-2010), Executive Vice President, Mutual Funds (2005-2007), and Chief Marketing Officer (2001-2005) of Nuveen Investments, Inc. (asset management). | 60 | Director of WTTW (PBS affiliate) (since 2003). Formerly, Director of MotiveQuest LLC (strategic social market research company) (2003-2016); Director of Nuveen Global Investors LLC (2007-2011); Director of Communities in Schools (2004-2010); and Director of Mutual Fund Education Alliance (until 2010). |
Janus Henderson VIT Balanced Portfolio
Trustees and Officers (unaudited)
| | | | | | |
TRUSTEES |
Name, Address, and Age | Positions Held with the Trust | Length of Time Served | Principal Occupations During the Past Five Years | Number of Portfolios/Funds in Fund Complex Overseen by Trustee | Other Directorships Held by Trustee During the Past Five Years |
Independent Trustees |
William D. Cvengros
151 Detroit Street
Denver, CO 80206
DOB: 1948 | Trustee | 1/11-Present | Chief Executive Officer of SJC Capital, LLC (a personal investment company and consulting firm) (since 2002). Formerly, Venture Partner for The Edgewater Funds (a middle market private equity firm) (2002-2004); Chief Executive Officer and President of PIMCO Advisors Holdings L.P. (a publicly traded investment management firm) (1994-2000); and Chief Investment Officer (1987-1994) and Vice Chairman and Director (1990-1994) of Pacific Life Insurance Company (a mutual life insurance and annuity company) (1987-1994). | 60 | Advisory Board Member, Innovate Partners Emerging Growth and Equity Fund I (early stage venture capital fund) (since 2014). Formerly, Managing Trustee of National Retirement Partners Liquidating Trust (2013-2016); Chairman, National Retirement Partners, Inc. (formerly a network of advisors to 401(k) plans) (2005-2013); Director of Prospect Acquisition Corp. (a special purpose acquisition corporation) (2007-2009); Director of RemedyTemp, Inc. (temporary help services company) (1996-2006); and Trustee of PIMCO Funds Multi-Manager Series (1990-2000) and Pacific Life Variable Life & Annuity Trusts (1987-1994). |
Janus Henderson VIT Balanced Portfolio
Trustees and Officers (unaudited)
| | | | | | |
TRUSTEES |
Name, Address, and Age | Positions Held with the Trust | Length of Time Served | Principal Occupations During the Past Five Years | Number of Portfolios/Funds in Fund Complex Overseen by Trustee | Other Directorships Held by Trustee During the Past Five Years |
Independent Trustees |
Raudline Etienne
151 Detroit Street
Denver, CO 80206
DOB: 1965 | Trustee | 6/16-Present | Founder, Daraja Capital (advisory and investment firm) (since 2016), and Senior Advisor, Albright Stonebridge Group LLC (global strategy firm) (since 2016). Formerly, Senior Vice President (2011-2015), Albright Stonebridge Group LLC; and Deputy Comptroller and Chief Investment Officer, New York State Common Retirement Fund (public pension fund) (2008-2011). | 60 | Director of Brightwood Capital Advisors, LLC (since 2014). |
Janus Henderson VIT Balanced Portfolio
Trustees and Officers (unaudited)
| | | | | | |
TRUSTEES |
Name, Address, and Age | Positions Held with the Trust | Length of Time Served | Principal Occupations During the Past Five Years | Number of Portfolios/Funds in Fund Complex Overseen by Trustee | Other Directorships Held by Trustee During the Past Five Years |
Independent Trustees |
Gary A. Poliner 151 Detroit Street Denver, CO 80206
DOB: 1953 | Trustee | 6/16-Present | Retired. Formerly, President (2010-2013) of Northwestern Mutual Life Insurance Company. | 60 | Director of MGIC Investment Corporation (private mortgage insurance) (since 2013) and West Bend Mutual Insurance Company (property/casualty insurance) (since 2013). Formerly, Trustee of Northwestern Mutual Life Insurance Company (2010-2013); and Director of Frank Russell Company (global asset management firm) (2008-2013). |
Janus Henderson VIT Balanced Portfolio
Trustees and Officers (unaudited)
| | | | | | |
TRUSTEES |
Name, Address, and Age | Positions Held with the Trust | Length of Time Served | Principal Occupations During the Past Five Years | Number of Portfolios/Funds in Fund Complex Overseen by Trustee | Other Directorships Held by Trustee During the Past Five Years |
Independent Trustees |
James T. Rothe*
151 Detroit Street
Denver, CO 80206
DOB: 1943 | Trustee | 1/97-Present | Professor Emeritus of Business of the University of Colorado, Colorado Springs, CO (since 2004). Formerly, Co-founder and Managing Director of Roaring Fork Capital SBIC, L.P. (SBA SBIC fund focusing on private investment in public equity firms) (2004-2014), Professor of Business of the University of Colorado (2002-2004), and Distinguished Visiting Professor of Business (2001-2002) of Thunderbird (American Graduate School of International Management), Glendale, AZ. | 60 | Formerly, Director of Red Robin Gourmet Burgers, Inc. (RRGB) (2004-2014). |
*James T. Rothe retired from his role as Independent Trustee, effective December 31, 2018. | |
Janus Henderson VIT Balanced Portfolio
Trustees and Officers (unaudited)
| | | | | | |
TRUSTEES |
Name, Address, and Age | Positions Held with the Trust | Length of Time Served | Principal Occupations During the Past Five Years | Number of Portfolios/Funds in Fund Complex Overseen by Trustee | Other Directorships Held by Trustee During the Past Five Years |
Independent Trustees |
William D. Stewart
151 Detroit Street
Denver, CO 80206
DOB: 1944 | Trustee | 6/84-Present | Retired. Formerly, President and founder of HPS Products and Corporate Vice President of MKS Instruments, Boulder, CO (a provider of advanced process control systems for the semiconductor industry) (1976-2012). | 60 | None |
Diane L. Wallace
151 Detroit Street
Denver, CO 80206
DOB: 1958 | Trustee | 6/17-Present | Retired. | 60 | Formerly, Independent Trustee, Henderson Global Funds (13 portfolios) (2015-2017); Independent Trustee, State Farm Associates' Funds Trust, State Farm Mutual Fund Trust, and State Farm Variable Product Trust (28 portfolios) (2013-2017); Chief Operating Officer, Senior Vice President-Operations, and Chief Financial Officer for Driehaus Capital Management, LLC (1988-2006); and Treasurer for Driehaus Mutual Funds (1996-2002). |
Janus Henderson VIT Balanced Portfolio
Trustees and Officers (unaudited)
| | | | | | |
TRUSTEES |
Name, Address, and Age | Positions Held with the Trust | Length of Time Served | Principal Occupations During the Past Five Years | Number of Portfolios/Funds in Fund Complex Overseen by Trustee | Other Directorships Held by Trustee During the Past Five Years |
Independent Trustees |
Linda S. Wolf
151 Detroit Street
Denver, CO 80206
DOB: 1947 | Trustee | 11/05-Present | Retired. Formerly, Chairman and Chief Executive Officer of Leo Burnett (Worldwide) (advertising agency) (2001-2005). | 60 | Director of Chicago Community Trust (Regional Community Foundation), Chicago Council on Global Affairs, InnerWorkings (U.S. provider of print procurement solutions to corporate clients), Lurie Children’s Hospital (Chicago, IL), Shirley Ryan Ability Lab and Wrapports, LLC (digital communications company). Formerly, Director of Walmart (until 2017), Director of Chicago Convention & Tourism Bureau (until 2014) and The Field Museum of Natural History (Chicago, IL) (until 2014). |
Janus Henderson VIT Balanced Portfolio
Trustees and Officers (unaudited)
| | | | |
OFFICERS |
Name, Address, and Age | Positions Held with the Trust | Term of Office* and Length of Time Served | Principal Occupations During the Past Five Years |
Jeremiah Buckley
151 Detroit Street
Denver, CO 80206
DOB: 1976 | Executive Vice President and Co-Portfolio Manager Janus Henderson Balanced Portfolio | 12/15-Present
| Portfolio Manager for other Janus Henderson accounts. |
Marc Pinto
151 Detroit Street
Denver, CO 80206
DOB: 1961 | Executive Vice President and Co-Portfolio Manager Janus Henderson Balanced Portfolio | 5/05-Present
| Portfolio Manager for other Janus Henderson accounts. |
Mayur Saigal
151 Detroit Street
Denver, CO 80206
DOB: 1975 | Executive Vice President and Co-Portfolio Manager Janus Henderson Balanced Portfolio | 12/15 - Present | Portfolio Manager for other Janus Henderson accounts. |
Darrell Watters
151 Detroit Street
Denver, CO 80206
DOB: 1963 | Executive Vice President and Co-Portfolio Manager Janus Henderson Balanced Portfolio | 12/15 - Present | Head of U.S. Fundamental Fixed Income of Janus Henderson Investors and Portfolio Manager for other Janus Henderson accounts. |
* Officers are elected at least annually by the Trustees for a one-year term and may also be elected from time to time by the Trustees for an interim period. |
| | | | |
Janus Henderson VIT Balanced Portfolio
Trustees and Officers (unaudited)
| | | | |
OFFICERS |
Name, Address, and Age | Positions Held with the Trust | Term of Office* and Length of Time Served | Principal Occupations During the Past Five Years |
Bruce L. Koepfgen
151 Detroit Street
Denver, CO 80206
DOB: 1952 | President and Chief Executive Officer | 7/14-Present | Head of North America at Janus Henderson Investors and Janus Capital Management LLC (since 2017); Executive Vice President and Director of Janus International Holding LLC (since 2011); Executive Vice President of Janus Distributors LLC (since 2011); Vice President and Director of INTECH Investment Management LLC (since 2011); Executive Vice President and Director of Perkins Investment Management LLC (since 2011); and Executive Vice President and Director of Janus Management Holdings Corporation (since 2011). Formerly, President of Janus Capital Group Inc. and Janus Capital Management LLC (2013-2017); Executive Vice President of Janus Services LLC (2011-2015), Janus Capital Group Inc. and Janus Capital Management LLC (2011-2013); and Chief Financial Officer of Janus Capital Group Inc., Janus Capital Management LLC, Janus Distributors LLC, Janus Management Holdings Corporation, and Janus Services LLC (2011-2013). |
Susan K. Wold
151 Detroit Street
Denver, CO 80206
DOB: 1960 | Vice President, Chief Compliance Officer, and Anti-Money Laundering Officer | 9/17-Present | Senior Vice President and Head of
Compliance, North America for Janus
Henderson (since September 2017);
Formerly, Vice President, Head of Global
Corporate Compliance, and Chief
Compliance Officer for Janus Capital
Management LLC (May 2017-September
2017); Vice President, Compliance at Janus
Capital Group Inc. and Janus Capital
Management LLC (2005-2017). |
Jesper Nergaard
151 Detroit Street
Denver, CO 80206
DOB: 1962 | Chief Financial Officer
Vice President, Treasurer, and Principal Accounting Officer | 3/05-Present
2/05-Present | Vice President of Janus Capital and Janus Services LLC. |
* Officers are elected at least annually by the Trustees for a one-year term and may also be elected from time to time by the Trustees for an interim period. |
Janus Henderson VIT Balanced Portfolio
Trustees and Officers (unaudited)
| | | | |
OFFICERS |
Name, Address, and Age | Positions Held with the Trust | Term of Office* and Length of Time Served | Principal Occupations During the Past Five Years |
Kathryn L. Santoro
151 Detroit Street
Denver, CO 80206
DOB: 1974 | Vice President, Chief Legal Counsel, and Secretary | 12/16-Present | Vice President of Janus Capital and Janus Services LLC (since 2016). Formerly, Vice President and Associate Counsel of Curian Capital, LLC and Curian Clearing LLC
(2013-2016); and General Counsel and Secretary (2011-2012) and Vice President (2009-2012) of Old Mutual Capital, Inc. |
* Officers are elected at least annually by the Trustees for a one-year term and may also be elected from time to time by the Trustees for an interim period. |
Janus Henderson VIT Balanced Portfolio
Notes
NotesPage1
Knowledge. Shared
At Janus Henderson, we believe in the sharing of expert insight for better investment and business decisions. We call this ethos Knowledge. Shared.
Learn more by visiting janushenderson.com.
| | | | | | | | | |
| | | | | |

| | | | |
This report is submitted for the general information of shareholders of the Portfolio. It is not an offer or solicitation for the Portfolio and is not authorized for distribution to prospective investors unless preceded or accompanied by an effective prospectus. |
Janus Henderson, Janus, Henderson, Perkins, Intech and Knowledge. Shared are trademarks of Janus Henderson Group plc or one of its subsidiaries. © Janus Henderson Group plc. Janus Henderson Distributors |
| | | | | 109-02-81113 02-19 |
| | | |
| | | |
| | | ANNUAL REPORT December 31, 2018 |
| | |
| | Janus Henderson VIT Enterprise Portfolio |
| | |
| | Janus Aspen Series |
Beginning on January 1, 2021, as permitted by regulations adopted by the Securities and Exchange Commission, the insurance company that offers your variable life insurance contract or variable annuity contract, may determine that it will no longer send you paper copies of the Portfolio’s shareholder reports, unless you specifically request paper copies of the reports. Beginning on January 1, 2021, for shareholders who are not insurance contract holders, paper copies of the Portfolio’s shareholder reports will no longer be sent by mail unless you specifically request paper copies of the reports. Instead, the reports will be made available on a website, and your insurance company or plan sponsor, broker-dealer, or financial intermediary will notify you by mail each time a report is posted and provide you with a website link to access the report. Instructions for requesting paper copies will be provided by your insurance company or plan sponsor, broker-dealer, or financial intermediary. If you already elected to receive shareholder reports electronically, you will not be affected by this change and you need not take any action. You may elect to receive shareholder reports and other communications from the Portfolio electronically by contacting your insurance company or plan sponsor, broker-dealer, or other financial intermediary. You may elect to receive all future reports in paper free of charge by contacting your insurance company or plan sponsor, broker dealer or other financial intermediary. Your election to receive reports in paper will apply to all funds held in your account with your insurance company or plan sponsor, broker dealer or other financial intermediary. |
| | | |
| | | HIGHLIGHTS · Portfolio management perspective · Investment strategy behind your portfolio · Portfolio performance, characteristics
and holdings |
| | | |
| | | 
|
Table of Contents
Janus Henderson VIT Enterprise Portfolio
| | |
Management Commentary and Schedule of Investments | 1 |
Notes to Schedule of Investments and Other Information | 13 |
Statement of Assets and Liabilities | 14 |
Statement of Operations | 15 |
Statements of Changes in Net Assets | 16 |
Financial Highlights | 17 |
Notes to Financial Statements | 18 |
Report of Independent Registered Public Accounting Firm | 30 |
Additional Information | 31 |
Useful Information About Your Portfolio Report | 38 |
Designation Requirements | 41 |
Trustees and Officers | 42 |
Janus Henderson VIT Enterprise Portfolio (unaudited)
| | | | | | |
PORTFOLIO SNAPSHOT We believe that investing in companies with sustainable growth and high return on invested capital can drive consistent returns and allow us to outperform our benchmark and peers over time with moderate risk. We seek to identify mid-cap companies with high-quality management teams that wisely allocate capital to fund and drive growth over time. | | | | 
Philip Cody Wheaton co-portfolio manager | 
Brian Demain co-portfolio manager |
| | | |
PERFORMANCE OVERVIEW
During the 12 months ended December 31, 2018, Janus Henderson VIT Enterprise Portfolio’s Institutional Shares and Service Shares returned -0.41% and -0.66%, respectively. Meanwhile, the Portfolio’s benchmark, the Russell Midcap® Growth Index, returned -4.75%.
INVESTMENT ENVIRONMENT
Mid-cap stocks were volatile and lost ground during the year. While corporate earnings growth was solid, global trade tensions and the prospect of rising interest rates weighed on stocks. In the fourth quarter, markets fell sharply as trade tensions between the U.S. and China escalated and data suggested weaker international economic growth. The materials and energy sectors suffered the steepest losses within the index.
PERFORMANCE DISCUSSION
The Portfolio outperformed its benchmark, the Russell Midcap Growth Index, during the year. Our Fund tends to emphasize “durable growth” companies that we believe have more predictable business models, recurring revenue streams, strong free-cash-flow growth and strong competitive positioning that should allow them to take market share and experience sustainable long-term growth across a variety of economic environments. We believe a collection of such companies can help the Fund outperform when markets are down and the economic outlook is uncertain, leading to relative outperformance over full market cycles. We saw that play out this year, as much of our outperformance occurred in the fourth quarter, when mid-cap stocks sold off.
Stock selection in the financial sector was a large contributor to relative performance. Within the sector, we have limited exposure to banks and that helped relative results as bank stocks fell sharply due to concerns about a weakening economy. We find more opportunity with insurance companies and other financial companies less exposed to capital market and macroeconomic cycles.
Strong stock selection in the health care sector was another large contributor to relative performance. We’ve been underweight biotech stocks within the sector due to valuation concerns, and that underweight helped late in the period as biotechnology stocks sold off more sharply than the rest of the index. Within the sector we see more opportunity in medical device companies. We highlight that opportunity more in our outlook, but in short, we like the durable business models associated with companies producing innovative devices that people depend on to improve or extend their lives. Two of our top contributors to Fund performance this year, Boston Scientific and Dexcom, are both medical device companies. We sold Dexcom in the fourth quarter after strong performance in 2018 brought the stock to our valuation target.
While stock selection in the health care and financial sectors were large drivers of relative outperformance, we also had bright spots outside those sectors. Atlassian was our largest contributor to performance. The company has strung together consecutive quarters of strong revenue growth, validating the value of the business and driving the stock higher. We believe Atlassian’s software tools play a valuable role allowing business teams to collaborate with each other more effectively. We like the recurring revenue streams its subscription-based services provide, its potential long-term pricing power due to low-cost offerings and that many of Atlassian’s services have gained traction virally, allowing the company to grow without a large sales force. However, we trimmed the position in recent months after significant gains brought the stock closer to our valuation target.
Even though we outperformed the market on a relative basis, in a sharp down market we also held stocks that detracted from performance. Flextronics International, Ltd. was our largest detractor. The supply chain solutions company had been working on a solution to near-source manufacturing for Nike, but after delays on the project both sides walked away from it. While this was a negative
Janus Henderson VIT Enterprise Portfolio (unaudited)
for the company, we continue to like the stock and believe the company provides great value to its customers.
Sealed Air Corp. also detracted. The packaging materials manufacturer has delivered strong revenue growth, but has done so at a lower-margin than we had hoped. We view this as a minor setback, however, and were encouraged by a major cost initiative management recently announced that could put margins at a better trajectory. Further, we believe the company is bringing innovative packaging solutions to the food packaging industry it serves.
Celgene was another stock that detracted from performance this year. The biotechnology company faced a few headwinds this year including management turnover, and news that the FDA issued a Refusal to File letter for Celgene’s multiple sclerosis (MS) drug, ozanimod. Although the news was an unwelcome setback, phase 3 data for the drug were promising, and the company reports that another pivotal trial will not be needed. We still think ozanimod will get FDA approval and that the delay should only moderately impact the drug’s sales potential. Meanwhile, we think the stock’s current valuation overlooks Celgene’s promising pipeline. In the next two years, the company could launch several new treatments addressing multiple sclerosis, myeloma, lymphoma, beta thalassemia and myeloproliferative disorders.
DERIVATIVES
To the extent we invest in foreign holdings, we may use forward exchange contracts to hedge the foreign currency. During the period, our aggregate derivative positions contributed to relative results. (Please see “Notes to Financial Statements” for information about the derivatives used by the Fund.)
OUTLOOK
One of the ways we manage volatility in the Portfolio is by carefully balancing our exposure between economically sensitive growth stocks and those with more defensive characteristics. However, we believe commonly held assumptions about what qualifies as a “defensive” stock deserve a rethink. Too often, investors seek safety within the consumer staples sector. We saw this investment trend play out again in the fourth quarter, with consumer staples stocks broadly outperforming the market.
We believe the notion that these stocks provide safety is misguided, and this is reflected in our Portfolio where we are underweight the consumer staples sector. Not only do consumer staples stocks trade at high valuations relative to the market, but new distribution channels and digital touchpoints for reaching consumers have whittled away the barriers to entry they once enjoyed. Other trends such as changing consumer preferences toward more authentic, local, organic or natural products may create further headwinds for many staples companies.
We believe we can find better stability – and better growth – by sticking to the core tenets that have always guided our investment process: valuation discipline and rigorous analysis of competitive advantage, management team strength and other company- and industry-specific fundamentals that ultimately determine the duration and resiliency of growth ahead.
This analysis has uncovered better defensive growth stocks outside the consumer staples sector. In recent months we have increased our exposure to financial technology and “information services” companies. These companies provide data, analytics or business process software that is absolutely vital to the businesses that depend on it. The mission-critical nature of these data and services give these companies a high degree of pricing power and, in our view, make their revenue streams less cyclical.
Another area where we see opportunity is in medical device companies. A convergence of factors including innovation, a rising global middle class that demands better health care and a rising aging population all underpin strong demand. And similar to information services companies, the critical nature of medical devices to someone’s survival removes cyclicality from their revenue streams. A surgery to install a new heart valve, for example, can’t wait until the economy improves.
Both the information services and medical device stocks generally trade at a slight premium to consumer staples companies, but in our view they have similar defensive characteristics, stronger competitive advantages and ultimately, better growth. If volatility persists, we’ll rest easier holding these stocks than what we currently see in the consumer staples sector.
Thank you for your investment in Janus Henderson VIT Enterprise Portfolio.
Janus Henderson VIT Enterprise Portfolio (unaudited)
Portfolio At A Glance
December 31, 2018
| | | | | | | |
| | | | | | | |
| | | | | | | |
| | | | | | | |
| | 5 Top Performers - Holdings | | | | 5 Bottom Performers - Holdings | |
| | | | Contribution | | | Contribution |
| | Atlassian Corp PLC | | 1.22% | | Flex Ltd | -0.93% |
| | Boston Scientific Corp | | 0.70% | | Sealed Air Corp | -0.49% |
| | DexCom Inc | | 0.58% | | Celgene Corp | -0.46% |
| | Xilinx Inc | | 0.48% | | TE Connectivity Ltd | -0.45% |
| | STERIS PLC | | 0.36% | | Belden Inc | -0.38% |
| | | | | | | |
| | 5 Top Performers - Sectors* | | | | | |
| | | | Portfolio | | Portfolio Weighting | Russell Midcap Growth Index |
| | | | Contribution | | (Average % of Equity) | Weighting |
| | Financials | | 1.28% | | 9.48% | 7.15% |
| | Health Care | | 1.24% | | 17.39% | 14.11% |
| | Industrials | | 0.87% | | 20.59% | 16.79% |
| | Materials | | 0.77% | | 1.35% | 4.76% |
| | Other** | | 0.51% | | 4.68% | 0.00% |
| | | | | | | |
| | 5 Bottom Performers - Sectors* | | | | | |
| | | | Portfolio | | Portfolio Weighting | Russell Midcap Growth Index |
| | | | Contribution | | (Average % of Equity) | Weighting |
| | Consumer Staples | | -0.37% | | 0.00% | 3.55% |
| | Information Technology | | -0.18% | | 33.22% | 30.54% |
| | Utilities | | 0.00% | | 0.00% | 0.03% |
| | Communication Services | | 0.07% | | 0.32% | 1.19% |
| | Consumer Discretionary | | 0.12% | | 9.07% | 17.26% |
| | | | | | | |
| | Security contribution to performance is measured by using an algorithm that multiplies the daily performance of each security with the previous day’s ending weight in the portfolio and is gross of advisory fees. Fixed income securities and certain equity securities, such as private placements and some share classes of equity securities, are excluded. |
* | Based on sector classification according to the Global Industry Classification Standard (“GICS”) codes, which are the exclusive property and a service mark of MSCI Inc. and Standard & Poor’s. |
** | Not a GICS classified sector. | | | | | |
Janus Henderson VIT Enterprise Portfolio (unaudited)
Portfolio At A Glance
December 31, 2018
| | |
5 Largest Equity Holdings - (% of Net Assets) |
Boston Scientific Corp | |
Health Care Equipment & Supplies | 2.3% |
Nice Ltd (ADR) | |
Software | 2.3% |
TD Ameritrade Holding Corp | |
Capital Markets | 2.3% |
Sensata Technologies Holding PLC | |
Electrical Equipment | 2.2% |
Cooper Cos Inc | |
Health Care Equipment & Supplies | 2.0% |
| | 11.1% |
| | | | | | |
Asset Allocation - (% of Net Assets) |
Common Stocks | | 94.8% |
Investment Companies | | 5.6% |
Preferred Stocks | | 0.1% |
Other | | (0.5)% |
| | | 100.0% |
| | |
Top Country Allocations - Long Positions - (% of Investment Securities) |
As of December 31, 2018 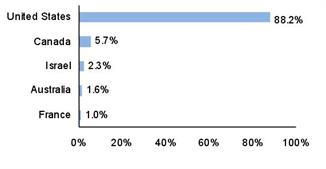
| As of December 31, 2017 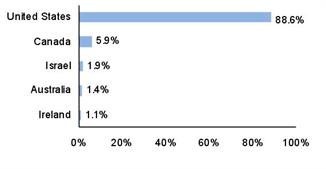
|
Janus Henderson VIT Enterprise Portfolio (unaudited)
Performance
| |
See important disclosures on the next page. |
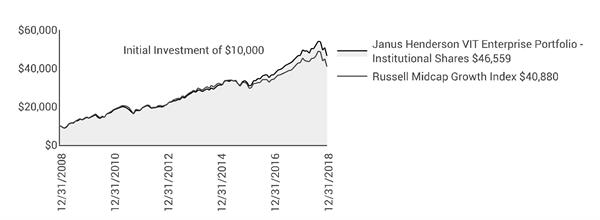
| | | | | | | | | | |
| | | | | | | | | |
| | | | | | | | | | Expense Ratios - |
Average Annual Total Return - for the periods ended December 31, 2018 | | | per the April 30, 2018 prospectuses |
| | One
Year | Five
Year | Ten
Year | Since
Inception* | | | Total Annual Fund
Operating Expenses |
Institutional Shares(1) | | -0.41% | 10.79% | 16.63% | 10.59% | | | 0.73% |
Service Shares(1) | | -0.66% | 10.51% | 16.33% | 10.31% | | | 0.98% |
Russell Midcap Growth Index | | -4.75% | 7.42% | 15.12% | 9.23% | | | |
Morningstar Quartile - Institutional Shares | | 1st | 1st | 1st | 1st | | | |
Morningstar Ranking - based on total returns for Mid-Cap Growth Funds | | 79/617 | 7/562 | 12/501 | 21/142 | | | |
Returns quoted are past performance and do not guarantee future results; current performance may be lower or higher. Investment returns and principal value will vary; there may be a gain or loss when shares are sold. For the most recent month-end performance call 800.668.0434 or visit janushenderson.com/VITperformance.
Performance may be affected by risks that include those associated with non-diversification, portfolio turnover, short sales, potential conflicts of interest, foreign and emerging markets, initial public offerings (IPOs), high-yield and high-risk securities, undervalued, overlooked and smaller capitalization companies, real estate related securities including Real Estate Investment Trusts (REITs), derivatives, and commodity-linked investments. Each product has different risks. Please see the prospectus for more information about risks, holdings and other details.
Returns do not reflect the deduction of fees, charges or expenses of any insurance product. If applied, returns would have been lower.
Returns include reinvestment of all dividends and distributions and do not reflect the deduction of taxes that a shareholder would pay on Portfolio distributions or redemptions of Portfolio shares. The returns do not include adjustments in accordance with generally accepted accounting principles required at the period end for financial reporting purposes.
See Financial Highlights for actual expense ratios during the reporting period.
Performance for Service Shares prior to December 31, 1999 reflects the performance of Institutional Shares, adjusted to reflect the expenses of Service Shares.
Janus Henderson VIT Enterprise Portfolio (unaudited)
Performance
Ranking is for the share class shown only; other classes may have different performance characteristics.
© 2018 Morningstar, Inc. All Rights Reserved.
There is no assurance that the investment process will consistently lead to successful investing.
See Notes to Schedule of Investments and Other Information for index definitions.
Index performance does not reflect the expenses of managing a portfolio as an index is unmanaged and not available for direct investment.
See “Useful Information About Your Portfolio Report.”
*The Portfolio’s inception date – September 13, 1993
(1) Closed to certain new investors.
Janus Henderson VIT Enterprise Portfolio (unaudited)
Expense Examples
As a shareholder of the Portfolio, you incur two types of costs: (1) transaction costs and (2) ongoing costs, including management fees; 12b-1 distribution and shareholder servicing fees (applicable to Service Shares only); transfer agent fees and expenses payable pursuant to the Transfer Agency Agreement; and other Portfolio expenses. This example is intended to help you understand your ongoing costs (in dollars) of investing in the Portfolio and to compare these costs with the ongoing costs of investing in other mutual funds. To do so, compare this 5% hypothetical example with the 5% hypothetical examples that appear in the shareholder reports of the other funds. The example is based upon an investment of $1,000 invested at the beginning of the period and held for the six-months indicated, unless noted otherwise in the table and footnotes below.
Actual Expenses
The information in the table under the heading “Actual” provides information about actual account values and actual expenses. You may use the information in these columns, together with the amount you invested, to estimate the expenses that you paid over the period. Simply divide your account value by $1,000 (for example, an $8,600 account value divided by $1,000 = 8.6), then multiply the result by the number in the appropriate column for your share class under the heading entitled “Expenses Paid During Period” to estimate the expenses you paid on your account during the period.
Hypothetical Example for Comparison Purposes
The information in the table under the heading “Hypothetical (5% return before expenses)” provides information about hypothetical account values and hypothetical expenses based upon the Portfolio’s actual expense ratio and an assumed rate of return of 5% per year before expenses, which is not the Portfolio’s actual return. The hypothetical account values and expenses may not be used to estimate the actual ending account balance or expenses you paid for the period. You may use this information to compare the ongoing costs of investing in the Portfolio and other funds. To do so, compare this 5% hypothetical example with the 5% hypothetical examples that appear in the shareholder reports of the other funds. Additionally, for an analysis of the fees associated with an investment in either share class or other similar funds, please visit www.finra.org/fundanalyzer.
Please note that the expenses shown in the table are meant to highlight your ongoing costs only and do not reflect any transaction costs, such as any charges at the separate account level or contract level. These fees are fully described in the Portfolio’s prospectuses. Therefore, the hypothetical examples are useful in comparing ongoing costs only, and will not help you determine the relative total costs of owning different funds. In addition, if these transaction costs were included, your costs would have been higher.
| | | | | | | | | | | |
| | | | | | | | | |
| | | | Actual | | Hypothetical
(5% return before expenses) | |
| Beginning
Account
Value
(7/1/18) | Ending
Account
Value
(12/31/18) | Expenses
Paid During
Period
(7/1/18 - 12/31/18)† | | Beginning
Account
Value
(7/1/18) | Ending
Account
Value
(12/31/18) | Expenses
Paid During
Period
(7/1/18 - 12/31/18)† | Net Annualized
Expense Ratio
(7/1/18 - 12/31/18) |
Institutional Shares | $1,000.00 | $926.90 | $3.55 | | $1,000.00 | $1,021.53 | $3.72 | 0.73% |
Service Shares | $1,000.00 | $925.70 | $4.76 | | $1,000.00 | $1,020.27 | $4.99 | 0.98% |
† | Expenses Paid During Period are equal to the Net Annualized Expense Ratio multiplied by the average account value over the period, multiplied by 184/365 (to reflect the one-half year period). Expenses in the examples include the effect of applicable fee waivers and/or expense reimbursements, if any. Had such waivers and/or reimbursements not been in effect, your expenses would have been higher. Please refer to the Notes to Financial Statements or the Portfolio’s prospectuses for more information regarding waivers and/or reimbursements. |
Janus Henderson VIT Enterprise Portfolio
Schedule of Investments
December 31, 2018
| | | | | | | | |
Shares
| | | Value | |
Common Stocks – 94.8% | | | |
Aerospace & Defense – 3.6% | | | |
| | Harris Corp | | 87,473 | | | $11,778,239 | |
| | HEICO Corp - Class A | | 192,482 | | | 12,126,366 | |
| | Teledyne Technologies Inc* | | 88,061 | | | 18,234,791 | |
| | | 42,139,396 | |
Airlines – 0.6% | | | |
| | Ryanair Holdings PLC (ADR)* | | 104,113 | | | 7,427,421 | |
Auto Components – 0.3% | | | |
| | Visteon Corp* | | 61,582 | | | 3,712,163 | |
Banks – 0.4% | | | |
| | SVB Financial Group* | | 26,896 | | | 5,108,088 | |
Biotechnology – 2.4% | | | |
| | ACADIA Pharmaceuticals Inc* | | 169,965 | | | 2,748,334 | |
| | Alkermes PLC* | | 98,759 | | | 2,914,378 | |
| | Celgene Corp* | | 157,065 | | | 10,066,296 | |
| | Neurocrine Biosciences Inc* | | 128,843 | | | 9,200,679 | |
| | Sarepta Therapeutics Inc* | | 33,338 | | | 3,638,176 | |
| | | 28,567,863 | |
Building Products – 0.7% | | | |
| | AO Smith Corp | | 187,700 | | | 8,014,790 | |
Capital Markets – 4.6% | | | |
| | LPL Financial Holdings Inc | | 319,066 | | | 19,488,551 | |
| | MSCI Inc | | 52,672 | | | 7,765,433 | |
| | TD Ameritrade Holding Corp | | 540,679 | | | 26,471,644 | |
| | | 53,725,628 | |
Commercial Services & Supplies – 3.4% | | | |
| | Cimpress NV* | | 145,113 | | | 15,007,586 | |
| | Edenred | | 321,747 | | | 11,792,728 | |
| | Ritchie Bros Auctioneers Inc | | 377,759 | | | 12,360,274 | |
| | | 39,160,588 | |
Consumer Finance – 0.5% | | | |
| | Synchrony Financial | | 233,256 | | | 5,472,186 | |
Containers & Packaging – 1.3% | | | |
| | Sealed Air Corp | | 451,026 | | | 15,713,746 | |
Diversified Consumer Services – 1.6% | | | |
| | frontdoor Inc* | | 181,704 | | | 4,835,143 | |
| | ServiceMaster Global Holdings Inc* | | 363,409 | | | 13,351,647 | |
| | | 18,186,790 | |
Electrical Equipment – 2.6% | | | |
| | AMETEK Inc | | 56,145 | | | 3,801,017 | |
| | Sensata Technologies Holding PLC* | | 581,594 | | | 26,078,675 | |
| | | 29,879,692 | |
Electronic Equipment, Instruments & Components – 5.7% | | | |
| | Belden Inc | | 126,193 | | | 5,271,082 | |
| | Dolby Laboratories Inc | | 157,507 | | | 9,740,233 | |
| | Flex Ltd* | | 1,103,036 | | | 8,394,104 | |
| | National Instruments Corp | | 424,583 | | | 19,267,577 | |
| | TE Connectivity Ltd | | 313,876 | | | 23,738,442 | |
| | | 66,411,438 | |
Entertainment – 0.5% | | | |
| | Liberty Media Corp-Liberty Formula One* | | 184,442 | | | 5,662,369 | |
Equity Real Estate Investment Trusts (REITs) – 3.8% | | | |
| | Crown Castle International Corp | | 207,128 | | | 22,500,315 | |
| | Lamar Advertising Co | | 314,915 | | | 21,785,820 | |
| | | 44,286,135 | |
Health Care Equipment & Supplies – 9.0% | | | |
| | Boston Scientific Corp* | | 767,941 | | | 27,139,035 | |
| | Cooper Cos Inc | | 93,802 | | | 23,872,609 | |
| | ICU Medical Inc* | | 55,143 | | | 12,662,487 | |
| | |
See Notes to Schedule of Investments and Other Information and Notes to Financial Statements. |
| |
8 | DECEMBER 31, 2018 |
Janus Henderson VIT Enterprise Portfolio
Schedule of Investments
December 31, 2018
| | | | | | | | |
Shares
| | | Value | |
Common Stocks – (continued) | | | |
Health Care Equipment & Supplies – (continued) | | | |
| | STERIS PLC | | 188,883 | | | $20,182,149 | |
| | Teleflex Inc | | 41,526 | | | 10,733,640 | |
| | Varian Medical Systems Inc* | | 86,859 | | | 9,841,993 | |
| | | 104,431,913 | |
Health Care Technology – 1.2% | | | |
| | athenahealth Inc* | | 109,297 | | | 14,419,553 | |
Hotels, Restaurants & Leisure – 3.1% | | | |
| | Aramark | | 312,947 | | | 9,066,075 | |
| | Dunkin' Brands Group Inc | | 245,287 | | | 15,727,802 | |
| | Norwegian Cruise Line Holdings Ltd* | | 254,860 | | | 10,803,515 | |
| | | 35,597,392 | |
Industrial Conglomerates – 1.1% | | | |
| | Carlisle Cos Inc | | 123,208 | | | 12,384,868 | |
Information Technology Services – 9.8% | | | |
| | Amdocs Ltd | | 325,474 | | | 19,066,267 | |
| | Broadridge Financial Solutions Inc | | 98,033 | | | 9,435,676 | |
| | Euronet Worldwide Inc* | | 45,657 | | | 4,674,364 | |
| | Fidelity National Information Services Inc | | 188,370 | | | 19,317,344 | |
| | Gartner Inc* | | 84,597 | | | 10,814,880 | |
| | Global Payments Inc | | 213,984 | | | 22,068,170 | |
| | GoDaddy Inc* | | 143,671 | | | 9,427,691 | |
| | WEX Inc* | | 138,445 | | | 19,390,607 | |
| | | 114,194,999 | |
Insurance – 4.9% | | | |
| | Aon PLC | | 163,736 | | | 23,800,665 | |
| | Intact Financial Corp | | 225,021 | | | 16,351,526 | |
| | WR Berkley Corp | | 224,978 | | | 16,628,124 | |
| | | 56,780,315 | |
Internet & Direct Marketing Retail – 0.3% | | | |
| | Wayfair Inc* | | 44,803 | | | 4,035,854 | |
Life Sciences Tools & Services – 5.0% | | | |
| | IQVIA Holdings Inc* | | 151,914 | | | 17,647,849 | |
| | PerkinElmer Inc | | 286,676 | | | 22,518,400 | |
| | Waters Corp* | | 98,862 | | | 18,650,316 | |
| | | 58,816,565 | |
Machinery – 2.2% | | | |
| | Middleby Corp* | | 79,613 | | | 8,178,644 | |
| | Rexnord Corp* | | 561,124 | | | 12,877,796 | |
| | Wabtec Corp | | 73,583 | | | 5,169,206 | |
| | | 26,225,646 | |
Media – 0.8% | | | |
| | Omnicom Group Inc | | 131,359 | | | 9,620,733 | |
Oil, Gas & Consumable Fuels – 0.1% | | | |
| | World Fuel Services Corp | | 55,745 | | | 1,193,500 | |
Pharmaceuticals – 0.7% | | | |
| | Catalent Inc* | | 224,908 | | | 7,012,631 | |
| | Elanco Animal Health Inc* | | 54,447 | | | 1,716,714 | |
| | | 8,729,345 | |
Professional Services – 4.3% | | | |
| | CoStar Group Inc* | | 53,172 | | | 17,937,042 | |
| | IHS Markit Ltd* | | 204,021 | | | 9,786,887 | |
| | Verisk Analytics Inc* | | 209,318 | | | 22,824,035 | |
| | | 50,547,964 | |
Road & Rail – 0.8% | | | |
| | Old Dominion Freight Line Inc | | 71,430 | | | 8,820,891 | |
Semiconductor & Semiconductor Equipment – 6.7% | | | |
| | KLA-Tencor Corp | | 152,971 | | | 13,689,375 | |
| | Lam Research Corp | | 91,546 | | | 12,465,819 | |
| | |
See Notes to Schedule of Investments and Other Information and Notes to Financial Statements. |
| |
Janus Aspen Series | 9 |
Janus Henderson VIT Enterprise Portfolio
Schedule of Investments
December 31, 2018
| | | | | | | | |
Shares
| | | Value | |
Common Stocks – (continued) | | | |
Semiconductor & Semiconductor Equipment – (continued) | | | |
| | Microchip Technology Inc | | 316,623 | | | $22,771,526 | |
| | ON Semiconductor Corp* | | 980,693 | | | 16,191,241 | |
| | Xilinx Inc | | 155,517 | | | 13,245,383 | |
| | | 78,363,344 | |
Software – 9.4% | | | |
| | Atlassian Corp PLC* | | 203,604 | | | 18,116,684 | |
| | Constellation Software Inc/Canada | | 36,314 | | | 23,247,877 | |
| | Intuit Inc | | 38,480 | | | 7,574,788 | |
| | Nice Ltd (ADR)* | | 246,748 | | | 26,700,601 | |
| | SS&C Technologies Holdings Inc | | 488,553 | | | 22,038,626 | |
| | Ultimate Software Group Inc* | | 47,946 | | | 11,740,537 | |
| | | 109,419,113 | |
Specialty Retail – 0.5% | | | |
| | Williams-Sonoma Inc# | | 111,577 | | | 5,629,060 | |
Textiles, Apparel & Luxury Goods – 2.3% | | | |
| | Carter's Inc | | 74,257 | | | 6,060,856 | |
| | Gildan Activewear Inc | | 503,751 | | | 15,293,880 | |
| | Lululemon Athletica Inc* | | 41,470 | | | 5,043,167 | |
| | | 26,397,903 | |
Trading Companies & Distributors – 0.6% | | | |
| | Ferguson PLC | | 102,952 | | | 6,592,647 | |
Total Common Stocks (cost $739,475,256) | | 1,105,669,898 | |
Preferred Stocks – 0.1% | | | |
Electronic Equipment, Instruments & Components – 0.1% | | | |
| | Belden Inc, 6.7500%, 7/15/19 (cost $1,200,000) | | 12,000 | | | 689,160 | |
Investment Companies – 5.6% | | | |
Investments Purchased with Cash Collateral from Securities Lending – 0.2% | | | |
| | Janus Henderson Cash Collateral Fund LLC, 2.4428%ºº,£ | | 2,758,029 | | | 2,758,029 | |
Money Markets – 5.4% | | | |
| | Janus Henderson Cash Liquidity Fund LLC, 2.4621%ºº,£ | | 63,166,325 | | | 63,166,325 | |
Total Investment Companies (cost $65,924,354) | | 65,924,354 | |
Total Investments (total cost $806,599,610) – 100.5% | | 1,172,283,412 | |
Liabilities, net of Cash, Receivables and Other Assets – (0.5)% | | (5,834,106) | |
Net Assets – 100% | | $1,166,449,306 | |
| | | | | | |
Summary of Investments by Country - (Long Positions) (unaudited) |
| |
| | | | | % of | |
| | | | | Investment | |
Country | | Value | | Securities | |
United States | | $1,034,399,774 | | 88.2 | % |
Canada | | 67,253,557 | | 5.7 | |
Israel | | 26,700,601 | | 2.3 | |
Australia | | 18,116,684 | | 1.6 | |
France | | 11,792,728 | | 1.0 | |
Ireland | | 7,427,421 | | 0.6 | |
United Kingdom | | 6,592,647 | | 0.6 | |
| | | | | | |
| | | | | | |
Total | | $1,172,283,412 | | 100.0 | % |
| | |
See Notes to Schedule of Investments and Other Information and Notes to Financial Statements. |
| |
10 | DECEMBER 31, 2018 |
Janus Henderson VIT Enterprise Portfolio
Schedule of Investments
December 31, 2018
Schedules of Affiliated Investments – (% of Net Assets)
| | | | | | | | | | | |
| | Dividend Income | Realized Gain/(Loss) | Change in Unrealized Appreciation/ Depreciation | Value at 12/31/18 |
Investment Companies - 5.6% |
Investments Purchased with Cash Collateral from Securities Lending - 0.2% |
| | Janus Henderson Cash Collateral Fund LLC, 2.4428%ºº | $ | 41,826∆ | $ | - | $ | - | $ | 2,758,029 |
Money Markets - 5.4% |
| | Janus Henderson Cash Liquidity Fund LLC, 2.4621%ºº | | 1,079,920 | | - | | - | | 63,166,325 |
Total Affiliated Investments - 5.6% | $ | 1,121,746 | $ | - | $ | - | $ | 65,924,354 |
| | | | | | | | | | | |
| | Share Balance at 12/31/17 | Purchases | Sales | Share Balance at 12/31/18 |
Investment Companies - 5.6% |
Investments Purchased with Cash Collateral from Securities Lending - 0.2% |
| | Janus Henderson Cash Collateral Fund LLC, 2.4428%ºº | | 6,842,000 | | 196,362,215 | | (200,446,186) | | 2,758,029 |
Money Markets - 5.4% |
| | Janus Henderson Cash Liquidity Fund LLC, 2.4621%ºº | | 61,393,542 | | 148,465,783 | | (146,693,000) | | 63,166,325 |
| | | | | | | |
Schedule of Forward Foreign Currency Exchange Contracts, Open | | | | | | |
| | | | | | | | | |
Counterparty/ Foreign Currency | Settlement Date | Foreign Currency Amount (Sold)/ Purchased | | USD Currency Amount (Sold)/ Purchased | | Market Value and Unrealized Appreciation/ (Depreciation) | |
Barclays Capital Inc: | | | | | | | |
Canadian Dollar | 1/10/19 | (3,653,000) | $ | 2,756,357 | $ | 79,573 | |
Euro | 1/10/19 | (1,495,000) | | 1,708,935 | | (4,852) | |
| | | | | | | | |
| | | | | | | 74,721 | |
Citibank NA: | | | | | | | |
Canadian Dollar | 1/10/19 | (4,835,000) | | 3,652,680 | | 109,771 | |
Euro | 1/10/19 | (4,630,000) | | 5,293,525 | | (14,053) | |
| | | | | | | | |
| | | | | | | 95,718 | |
Credit Suisse International: | | | | | | | |
Canadian Dollar | 1/17/19 | (5,822,000) | | 4,393,200 | | 126,107 | |
HSBC Securities (USA) Inc: | | | | | | | |
Canadian Dollar | 1/31/19 | (6,610,000) | | 4,951,570 | | 104,783 | |
Euro | 1/31/19 | (4,386,000) | | 4,998,185 | | (39,605) | |
| | | | | | | | |
| | |
See Notes to Schedule of Investments and Other Information and Notes to Financial Statements. |
| |
Janus Aspen Series | 11 |
Janus Henderson VIT Enterprise Portfolio
Schedule of Investments
December 31, 2018
| | | | | | | | | |
Counterparty/ Foreign Currency | Settlement Date | Foreign Currency Amount (Sold)/ Purchased | | USD Currency Amount (Sold)/ Purchased | | Market Value and Unrealized Appreciation/ (Depreciation) | |
| | | | | | | 65,178 | |
JPMorgan Chase & Co: | | | | | | | |
Euro | 1/10/19 | (5,469,000) | $ | 6,247,073 | | (22,290) | |
Total | | | | | $ | 339,434 | |
The following table, grouped by derivative type, provides information about the fair value and location of derivatives within the Statement of Assets and Liabilities as of December 31, 2018.
| | | | | | |
Fair Value of Derivative Instruments (not accounted for as hedging instruments) as of December 31, 2018 |
| | | | | | |
| | | | | Currency
Contracts |
Asset Derivatives: | | | |
Forward foreign currency exchange contracts | | | $420,234 |
| | | | |
| | | |
Liability Derivatives: | | | |
Forward foreign currency exchange contracts | | | $ 80,800 |
| | | | |
The following tables provide information about the effect of derivatives and hedging activities on the Portfolio’s Statement of Operations for the year ended December 31, 2018.
| | | | | |
The effect of Derivative Instruments (not accounted for as hedging instruments) on the Statement of Operations for the year ended December 31, 2018 |
| | | | | |
Amount of Realized Gain/(Loss) Recognized on Derivatives |
Derivative | | Currency
Contracts |
Forward foreign currency exchange contracts | | $2,195,747 |
| | | | | |
| | | | | |
| | | | | |
Amount of Change in Unrealized Appreciation/Depreciation Recognized on Derivatives |
Derivative | | Currency
Contracts |
Forward foreign currency exchange contracts | | $ 824,493 |
| | | | | |
Please see the "Net Realized Gain/(Loss) on Investments" and "Change in Unrealized Net Appreciation/Depreciation" sections of the Portfolio’s Statement of Operations.
| | |
Average Ending Monthly Market Value of Derivative Instruments During the Year Ended December 31, 2018 |
| | |
| Market Value(a) |
Forward foreign currency exchange contracts, sold | $ 37,080,544 |
| | |
(a) Forward foreign currency exchange contracts are reported as the average ending monthly currency amount sold. |
| | |
See Notes to Schedule of Investments and Other Information and Notes to Financial Statements. |
| |
12 | DECEMBER 31, 2018 |
Janus Henderson VIT Enterprise Portfolio
Notes to Schedule of Investments and Other Information
| | |
Russell Midcap® Growth Index | Russell Midcap® Growth Index reflects the performance of U.S. mid-cap equities with higher price-to-book ratios and higher forecasted growth values. |
| | |
ADR | American Depositary Receipt |
LLC | Limited Liability Company |
PLC | Public Limited Company |
| | |
* | Non-income producing security. |
| | |
ºº | Rate shown is the 7-day yield as of December 31, 2018. |
| | |
# | Loaned security; a portion of the security is on loan at December 31, 2018. |
| | |
£ | The Portfolio may invest in certain securities that are considered affiliated companies. As defined by the Investment Company Act of 1940, as amended, an affiliated company is one in which the Portfolio owns 5% or more of the outstanding voting securities, or a company which is under common ownership or control. |
| | |
∆ | Net of income paid to the securities lending agent and rebates paid to the borrowing counterparties. |
| | | | | | | | | | | | | | |
The following is a summary of the inputs that were used to value the Portfolio’s investments in securities and other financial instruments as of December 31, 2018. See Notes to Financial Statements for more information. |
| |
Valuation Inputs Summary |
| | | | | | | |
| | | | | Level 2 - | | Level 3 - |
| | | Level 1 - | | Other Significant | | Significant |
| | | Quoted Prices | | Observable Inputs | | Unobservable Inputs |
| | | | | | | |
Assets | | | | | | |
Investments in Securities: | | | | | | |
Common Stocks | | | | | | |
Commercial Services & Supplies | $ | 27,367,860 | $ | 11,792,728 | $ | - |
Trading Companies & Distributors | | - | | 6,592,647 | | - |
All Other | | 1,059,916,663 | | - | | - |
Preferred Stocks | | - | | 689,160 | | - |
Investment Companies | | - | | 65,924,354 | | - |
Total Investments in Securities | $ | 1,087,284,523 | $ | 84,998,889 | $ | - |
Other Financial Instruments(a): | | | | | | |
Forward Foreign Currency Exchange Contracts | | - | | 420,234 | | - |
Total Assets | $ | 1,087,284,523 | $ | 85,419,123 | $ | - |
Liabilities | | | | | | |
Other Financial Instruments(a): | | | | | | |
Forward Foreign Currency Exchange Contracts | $ | - | $ | 80,800 | $ | - |
| | | | | | | |
(a) | Other financial instruments include forward foreign currency exchange, futures, written options, written swaptions, and swap contracts. Forward foreign currency exchange contracts are reported at their unrealized appreciation/(depreciation) at measurement date, which represents the change in the contract's value from trade date. Futures, certain written options on futures, and centrally cleared swap contracts are reported at their variation margin at measurement date, which represents the amount due to/from the Portfolio at that date. Written options, written swaptions, and other swap contracts are reported at their market value at measurement date. |
Janus Henderson VIT Enterprise Portfolio
Statement of Assets and Liabilities
December 31, 2018
| | | | | | | |
| | | | | | |
Assets: | | | | |
| | Unaffiliated investments, at value(1)(2) | | $ | 1,106,359,058 | |
| | Affiliated investments, at value(3) | | | 65,924,354 | |
| | Forward foreign currency exchange contracts | | | 420,234 | |
| | Cash denominated in foreign currency(4) | | | 98,086 | |
| | Closed foreign currency contracts | | | 13,065 | |
| | Non-interested Trustees' deferred compensation | | | 28,304 | |
| | Receivables: | | | | |
| | | Investments sold | | | 702,735 | |
| | | Portfolio shares sold | | | 515,632 | |
| | | Dividends | | | 265,253 | |
| | | Dividends from affiliates | | | 113,222 | |
| | Other assets | | | 11,233 | |
Total Assets | | | 1,174,451,176 | |
Liabilities: | | | | |
| | Due to custodian | | | 44,407 | |
| | Collateral for securities loaned (Note 3) | | | 2,758,029 | |
| | Forward foreign currency exchange contracts | | | 80,800 | |
| | Closed foreign currency contracts | | | 852 | |
| | Payables: | | | — | |
| | | Portfolio shares repurchased | | | 2,243,623 | |
| | | Investments purchased | | | 1,826,130 | |
| | | Advisory fees | | | 670,630 | |
| | | 12b-1 Distribution and shareholder servicing fees | | | 131,895 | |
| | | Transfer agent fees and expenses | | | 55,204 | |
| | | Professional fees | | | 30,485 | |
| | | Non-interested Trustees' deferred compensation fees | | | 28,304 | |
| | | Non-interested Trustees' fees and expenses | | | 9,533 | |
| | | Custodian fees | | | 3,570 | |
| | | Affiliated portfolio administration fees payable | | | 2,620 | |
| | | Accrued expenses and other payables | | | 115,788 | |
Total Liabilities | | | 8,001,870 | |
Net Assets | | $ | 1,166,449,306 | |
Net Assets Consist of: | | | | |
| | Capital (par value and paid-in surplus) | | $ | 714,517,391 | |
| | Total distributable earnings (loss) | | | 451,931,915 | |
Total Net Assets | | $ | 1,166,449,306 | |
Net Assets - Institutional Shares | | $ | 577,476,648 | |
| | Shares Outstanding, $0.01 Par Value (unlimited shares authorized) | | | 8,616,640 | |
Net Asset Value Per Share | | $ | 67.02 | |
Net Assets - Service Shares | | $ | 588,972,658 | |
| | Shares Outstanding, $0.01 Par Value (unlimited shares authorized) | | | 9,349,489 | |
Net Asset Value Per Share | | $ | 63.00 | |
| |
(1) Includes cost of $740,675,256. (2) Includes $2,697,461 of securities on loan. See Note 3 in Notes to Financial Statements. (3) Includes cost of $65,924,354. (4) Includes cost of $98,086. |
| | |
See Notes to Financial Statements. |
| |
14 | DECEMBER 31, 2018 |
Janus Henderson VIT Enterprise Portfolio
Statement of Operations
For the year ended December 31, 2018
| | | | | | |
| | | | | |
Investment Income: | | | |
| Dividends | $ | 11,774,279 | |
| | Dividends from affiliates | | 1,079,920 | |
| | Affiliated securities lending income, net | | 41,826 | |
| | Other income | | 111 | |
| | Foreign tax withheld | | (205,648) | |
Total Investment Income | | 12,690,488 | |
Expenses: | | | |
| | Advisory fees | | 8,024,023 | |
| | 12b-1 Distribution and shareholder servicing fees: | | | |
| | | Service Shares | | 1,531,244 | |
| | Transfer agent administrative fees and expenses: | | | |
| | | Institutional Shares | | 320,628 | |
| | | Service Shares | | 306,249 | |
| | Other transfer agent fees and expenses: | | | |
| | | Institutional Shares | | 17,742 | |
| | | Service Shares | | 9,534 | |
| | Shareholder reports expense | | 129,677 | |
| | Professional fees | | 54,405 | |
| | Affiliated portfolio administration fees | | 44,210 | |
| | Non-interested Trustees’ fees and expenses | | 37,983 | |
| | Custodian fees | | 23,366 | |
| | Registration fees | | 21,041 | |
| | Other expenses | | 96,182 | |
Total Expenses | | 10,616,284 | |
Net Investment Income/(Loss) | | 2,074,204 | |
Net Realized Gain/(Loss) on Investments: | | | |
| | Investments and foreign currency transactions | | 82,529,040 | |
| | Forward foreign currency exchange contracts | | 2,195,747 | |
Total Net Realized Gain/(Loss) on Investments | | 84,724,787 | |
Change in Unrealized Net Appreciation/Depreciation: | | | |
| | Investments, foreign currency translations and non-interested Trustees’ deferred compensation | | (95,452,193) | |
| | Forward foreign currency exchange contracts | | 824,493 | |
Total Change in Unrealized Net Appreciation/Depreciation | | (94,627,700) | |
Net Increase/(Decrease) in Net Assets Resulting from Operations | $ | (7,828,709) | |
| | | | | | |
| | |
See Notes to Financial Statements. |
| |
Janus Aspen Series | 15 |
Janus Henderson VIT Enterprise Portfolio
Statements of Changes in Net Assets
| | | | | | | | | |
| | | | | | | | | |
| | | Year ended
December 31, 2018 | | Year ended
December 31, 2017 | |
| | | | | | | | | |
Operations: | | | | | | |
| | Net investment income/(loss) | $ | 2,074,204 | | $ | 542,211 | |
| | Net realized gain/(loss) on investments | | 84,724,787 | | | 59,654,236 | |
| | Change in unrealized net appreciation/depreciation | | (94,627,700) | | | 188,738,865 | |
Net Increase/(Decrease) in Net Assets Resulting from Operations | | (7,828,709) | | | 248,935,312 | |
Dividends and Distributions to Shareholders(1) | | | | | | |
| | | Institutional Shares | | (30,474,258) | | | N/A | |
| | | Service Shares | | (30,628,519) | | | N/A | |
| Total Dividends and Distributions to Shareholders | | (61,102,777) | | | N/A | |
| | Dividends from Net Investment Income(1) | | | | | | |
| | | Institutional Shares | | N/A | | | (1,431,060) | |
| | | Service Shares | | N/A | | | (715,202) | |
| Total Dividends from Net Investment Income | | N/A | | | (2,146,262) | |
| | Distributions from Net Realized Gain from Investment Transactions(1) | | | | | | |
| | | Institutional Shares | | N/A | | | (35,399,828) | |
| | | Service Shares | | N/A | | | (32,692,941) | |
| Total Distributions from Net Realized Gain from Investment Transactions | N/A | | | (68,092,769) | |
Net Decrease from Dividends and Distributions to Shareholders | | (61,102,777) | | | (70,239,031) | |
Capital Share Transactions: | | | | | | |
| | | Institutional Shares | | (10,085,696) | | | 63,180,886 | |
| | | Service Shares | | 71,166,601 | | | 53,921,594 | |
Net Increase/(Decrease) from Capital Share Transactions | | 61,080,905 | | | 117,102,480 | |
Net Increase/(Decrease) in Net Assets | | (7,850,581) | | | 295,798,761 | |
Net Assets: | | | | | | |
| | Beginning of period | | 1,174,299,887 | | | 878,501,126 | |
| End of period(2) | $ | 1,166,449,306 | | $ | 1,174,299,887 | |
| | | | | | | | | |
| |
(1) The requirement to disclose dividends and distributions paid to shareholders from net investment income and/or net realized gain from investment transactions was eliminated by the SEC (Securities Exchange Commission) in 2018. (2) Net assets - End of period includes undistributed (overdistributed) net investment income of $962,521 as of December 31, 2017. The requirement to disclose undistributed (overdistributed) net investment income was eliminated by the SEC in 2018. |
| | |
See Notes to Financial Statements. |
| |
16 | DECEMBER 31, 2018 |
Janus Henderson VIT Enterprise Portfolio
Financial Highlights
| | | | | | | | | | | | | | | | | | | |
Institutional Shares | | | | | | | | | | | | | | | |
For a share outstanding during the year ended December 31 | | 2018 | | | 2017 | | | 2016 | | | 2015 | | | 2014 | |
| | Net Asset Value, Beginning of Period | | $70.65 | | | $59.27 | | | $57.33 | | | $61.75 | | | $58.96 | |
| | Income/(Loss) from Investment Operations: | | | | | | | | | | | | | | | |
| | | Net investment income/(loss)(1) | | 0.21 | | | 0.11 | | | 0.28 | | | 0.27 | | | 0.27 | |
| | | Net realized and unrealized gain/(loss) | | (0.16) | | | 15.67 | | | 6.50 | | | 2.55 | | | 6.79 | |
| | Total from Investment Operations | | 0.05 | | | 15.78 | | | 6.78 | | | 2.82 | | | 7.06 | |
| | Less Dividends and Distributions: | | | | | | | | | | | | | | | |
| | | Dividends (from net investment income) | | (0.18) | | | (0.17) | | | (0.09) | | | (0.40) | | | (0.10) | |
| | | Distributions (from capital gains) | | (3.50) | | | (4.23) | | | (4.75) | | | (6.84) | | | (4.17) | |
| | Total Dividends and Distributions | | (3.68) | | | (4.40) | | | (4.84) | | | (7.24) | | | (4.27) | |
| | Net Asset Value, End of Period | | $67.02 | | | $70.65 | | | $59.27 | | | $57.33 | | | $61.75 | |
| | Total Return* | | (0.41)% | | | 27.42% | | | 12.36% | | | 4.05% | | | 12.50% | |
| | Net Assets, End of Period (in thousands) | | $577,477 | | | $618,750 | | | $459,250 | | | $418,158 | | | $417,895 | |
| | Average Net Assets for the Period (in thousands) | | $641,390 | | | $556,940 | | | $435,190 | | | $427,941 | | | $402,634 | |
| | Ratios to Average Net Assets**: | | | | | | | | | | | | | | | |
| | | Ratio of Gross Expenses | | 0.72% | | | 0.73% | | | 0.72% | | | 0.68% | | | 0.68% | |
| | | Ratio of Net Expenses (After Waivers and Expense Offsets) | | 0.72% | | | 0.73% | | | 0.72% | | | 0.68% | | | 0.68% | |
| | | Ratio of Net Investment Income/(Loss) | | 0.29% | | | 0.17% | | | 0.48% | | | 0.44% | | | 0.45% | |
| | Portfolio Turnover Rate | | 14% | | | 14% | | | 20% | | | 22% | | | 16% | |
| | | | | | | | | | | | | | 1 | | | | | |
| | | | | | | | | | | | | | | | | | | |
Service Shares | | | | | | | | | | | | | | | |
For a share outstanding during the year ended December 31 | | 2018 | | | 2017 | | | 2016 | | | 2015 | | | 2014 | |
| | Net Asset Value, Beginning of Period | | $66.67 | | | $56.22 | | | $54.67 | | | $59.26 | | | $56.80 | |
| | Income/(Loss) from Investment Operations: | | | | | | | | | | | | | | | |
| | | Net investment income/(loss)(1) | | 0.03 | | | (0.05) | | | 0.12 | | | 0.11 | | | 0.12 | |
| | | Net realized and unrealized gain/(loss) | | (0.12) | | | 14.82 | | | 6.19 | | | 2.45 | | | 6.53 | |
| | Total from Investment Operations | | (0.09) | | | 14.77 | | | 6.31 | | | 2.56 | | | 6.65 | |
| | Less Dividends and Distributions: | | | | | | | | | | | | | | | |
| | | Dividends (from net investment income) | | (0.08) | | | (0.09) | | | (0.01) | | | (0.31) | | | (0.02) | |
| | | Distributions (from capital gains) | | (3.50) | | | (4.23) | | | (4.75) | | | (6.84) | | | (4.17) | |
| | Total Dividends and Distributions | | (3.58) | | | (4.32) | | | (4.76) | | | (7.15) | | | (4.19) | |
| | Net Asset Value, End of Period | | $63.00 | | | $66.67 | | | $56.22 | | | $54.67 | | | $59.26 | |
| | Total Return* | | (0.65)% | | | 27.09% | | | 12.10% | | | 3.77% | | | 12.24% | |
| | Net Assets, End of Period (in thousands) | | $588,973 | | | $555,550 | | | $419,251 | | | $321,482 | | | $278,240 | |
| | Average Net Assets for the Period (in thousands) | | $612,433 | | | $489,237 | | | $373,400 | | | $299,393 | | | $262,698 | |
| | Ratios to Average Net Assets**: | | | | | | | | | | | | | | | |
| | | Ratio of Gross Expenses | | 0.97% | | | 0.98% | | | 0.97% | | | 0.94% | | | 0.93% | |
| | | Ratio of Net Expenses (After Waivers and Expense Offsets) | | 0.97% | | | 0.98% | | | 0.97% | | | 0.94% | | | 0.93% | |
| | | Ratio of Net Investment Income/(Loss) | | 0.04% | | | (0.08)% | | | 0.22% | | | 0.19% | | | 0.20% | |
| | Portfolio Turnover Rate | | 14% | | | 14% | | | 20% | | | 22% | | | 16% | |
| | | | | | | | | | | | | | | | | | | |
| |
* Total return includes adjustments in accordance with generally accepted accounting principles required at the year or period end and are not annualized for periods of less than one full year. Total return does not include fees, charges, or expenses imposed by the variable annuity and life insurance contracts for which Janus Aspen Series serves as an underlying investment vehicle. ** Annualized for periods of less than one full year. (1) Per share amounts are calculated based on average shares outstanding during the year or period. |
| | |
See Notes to Financial Statements. |
| |
Janus Aspen Series | 17 |
Janus Henderson VIT Enterprise Portfolio
Notes to Financial Statements
1. Organization and Significant Accounting Policies
Janus Henderson VIT Enterprise Portfolio (the “Portfolio”) is a series of Janus Aspen Series (the “Trust”), which is organized as a Delaware statutory trust and is registered under the Investment Company Act of 1940, as amended (the “1940 Act”), as an open-end management investment company, and therefore has applied the specialized accounting and reporting guidance in Financial Accounting Standards Board (“FASB”) Accounting Standards Codification (“ASC”) Topic 946. The Trust offers 11 portfolios, each of which offers multiple share classes, with differing investment objectives and policies. The Portfolio seeks long-term growth of capital. The Portfolio is classified as diversified, as defined in the 1940 Act.
The Portfolio currently offers two classes of shares: Institutional Shares and Service Shares. Each class represents an interest in the same portfolio of investments. Institutional Shares are offered only in connection with investment in and payments under variable insurance contracts as well as certain qualified retirement plans. Service Shares are offered only in connection with investment in and payments under variable insurance contracts as well as certain qualified retirement plans that require a fee from Portfolio assets to procure distribution and administrative services to contract owners and plan participants.
Shareholders, including other portfolios, participating insurance companies, as well as accounts, may from time to time own (beneficially or of record) a significant percentage of the Portfolio’s Shares and can be considered to “control” the Portfolio when that ownership exceeds 25% of the Portfolio’s assets (and which may differ from control as determined in accordance with accounting principles generally accepted in the United States of America).
The following accounting policies have been followed by the Portfolio and are in conformity with accounting principles generally accepted in the United States of America.
Investment Valuation
Securities held by the Portfolio are valued in accordance with policies and procedures established by and under the supervision of the Trustees (the “Valuation Procedures”). Equity securities traded on a domestic securities exchange are generally valued at the closing prices on the primary market or exchange on which they trade. If such price is lacking for the trading period immediately preceding the time of determination, such securities are valued at their current bid price. Equity securities that are traded on a foreign exchange are generally valued at the closing prices on such markets. In the event that there is no current trading volume on a particular security in such foreign exchange, the bid price from the primary exchange is generally used to value the security. Securities that are traded on the over-the-counter (“OTC”) markets are generally valued at their closing or latest bid prices as available. Foreign securities and currencies are converted to U.S. dollars using the applicable exchange rate in effect at the close of the New York Stock Exchange (“NYSE”). The Portfolio will determine the market value of individual securities held by it by using prices provided by one or more approved professional pricing services or, as needed, by obtaining market quotations from independent broker-dealers. Most debt securities are valued in accordance with the evaluated bid price supplied by the pricing service that is intended to reflect market value. The evaluated bid price supplied by the pricing service is an evaluation that may consider factors such as security prices, yields, maturities and ratings. Certain short-term securities maturing within 60 days or less may be evaluated and valued on an amortized cost basis provided that the amortized cost determined approximates market value. Securities for which market quotations or evaluated prices are not readily available or deemed unreliable are valued at fair value determined in good faith under the Valuation Procedures. Circumstances in which fair value pricing may be utilized include, but are not limited to: (i) a significant event that may affect the securities of a single issuer, such as a merger, bankruptcy, or significant issuer-specific development; (ii) an event that may affect an entire market, such as a natural disaster or significant governmental action; (iii) a nonsignificant event such as a market closing early or not opening, or a security trading halt; and (iv) pricing of a nonvalued security and a restricted or nonpublic security. Special valuation considerations may apply with respect to “odd-lot” fixed-income transactions which, due to their small size, may receive evaluated prices by pricing services which reflect a large block trade and not what actually could be obtained for the odd-lot position. The Portfolio uses systematic fair valuation models provided by independent third parties to value international equity securities in order to adjust for stale pricing, which may occur between the close of certain foreign exchanges and the close of the NYSE.
Valuation Inputs Summary
FASB ASC 820, Fair Value Measurements and Disclosures (“ASC 820”), defines fair value, establishes a framework for measuring fair value, and expands disclosure requirements regarding fair value measurements. This standard emphasizes that fair value is a market-based measurement that should be determined based on the assumptions that
Janus Henderson VIT Enterprise Portfolio
Notes to Financial Statements
market participants would use in pricing an asset or liability and establishes a hierarchy that prioritizes inputs to valuation techniques used to measure fair value. These inputs are summarized into three broad levels:
Level 1 – Unadjusted quoted prices in active markets the Portfolio has the ability to access for identical assets or liabilities.
Level 2 – Observable inputs other than unadjusted quoted prices included in Level 1 that are observable for the asset or liability either directly or indirectly. These inputs may include quoted prices for the identical instrument on an inactive market, prices for similar instruments, interest rates, prepayment speeds, credit risk, yield curves, default rates and similar data.
Assets or liabilities categorized as Level 2 in the hierarchy generally include: debt securities fair valued in accordance with the evaluated bid or ask prices supplied by a pricing service; securities traded on OTC markets and listed securities for which no sales are reported that are fair valued at the latest bid price (or yield equivalent thereof) obtained from one or more dealers transacting in a market for such securities or by a pricing service approved by the Portfolio’s Trustees; certain short-term debt securities with maturities of 60 days or less that are fair valued at amortized cost; and equity securities of foreign issuers whose fair value is determined by using systematic fair valuation models provided by independent third parties in order to adjust for stale pricing which may occur between the close of certain foreign exchanges and the close of the NYSE. Other securities that may be categorized as Level 2 in the hierarchy include, but are not limited to, preferred stocks, bank loans, swaps, investments in unregistered investment companies, options, and forward contracts.
Level 3 – Unobservable inputs for the asset or liability to the extent that relevant observable inputs are not available, representing the Portfolio’s own assumptions about the assumptions that a market participant would use in valuing the asset or liability, and that would be based on the best information available.
There have been no significant changes in valuation techniques used in valuing any such positions held by the Portfolio since the beginning of the fiscal year.
The inputs or methodology used for fair valuing securities are not necessarily an indication of the risk associated with investing in those securities. The summary of inputs used as of December 31, 2018 to fair value the Portfolio’s investments in securities and other financial instruments is included in the “Valuation Inputs Summary” in the Notes to Schedule of Investments and Other Information.
The Portfolio recognizes transfers between the levels as of the beginning of the fiscal year. The following describes the amounts of transfers between Level 1, Level 2 and Level 3 of the fair value hierarchy during the year.
Financial assets of $32,817,554 were transferred out of Level 2 to Level 1 since certain foreign equity prices were applied a fair valuation adjustment factor at the end of the prior fiscal year and no factor was applied at the end of the current period.
Investment Transactions and Investment Income
Investment transactions are accounted for as of the date purchased or sold (trade date). Dividend income is recorded on the ex-dividend date. Certain dividends from foreign securities will be recorded as soon as the Portfolio is informed of the dividend, if such information is obtained subsequent to the ex-dividend date. Dividends from foreign securities may be subject to withholding taxes in foreign jurisdictions. Interest income is recorded on the accrual basis and includes amortization of premiums and accretion of discounts. Gains and losses are determined on the identified cost basis, which is the same basis used for federal income tax purposes. Income, as well as gains and losses, both realized and unrealized, are allocated daily to each class of shares based upon the ratio of net assets represented by each class as a percentage of total net assets.
Expenses
The Portfolio bears expenses incurred specifically on its behalf. Each class of shares bears a portion of general expenses, which are allocated daily to each class of shares based upon the ratio of net assets represented by each class as a percentage of total net assets. Expenses directly attributable to a specific class of shares are charged against the operations of such class.
Estimates
The preparation of financial statements in conformity with accounting principles generally accepted in the United States of America requires management to make estimates and assumptions that affect the reported amount of assets and
Janus Henderson VIT Enterprise Portfolio
Notes to Financial Statements
liabilities and disclosure of contingent assets and liabilities at the date of the financial statements, and the reported amounts of income and expenses during the reporting period. Actual results could differ from those estimates.
Indemnifications
In the normal course of business, the Portfolio may enter into contracts that contain provisions for indemnification of other parties against certain potential liabilities. The Portfolio’s maximum exposure under these arrangements is unknown, and would involve future claims that may be made against the Portfolio that have not yet occurred. Currently, the risk of material loss from such claims is considered remote.
Foreign Currency Translations
The Portfolio does not isolate that portion of the results of operations resulting from the effect of changes in foreign exchange rates on investments from the fluctuations arising from changes in market prices of securities held at the date of the financial statements. Net unrealized appreciation or depreciation of investments and foreign currency translations arise from changes in the value of assets and liabilities, including investments in securities held at the date of the financial statements, resulting from changes in the exchange rates and changes in market prices of securities held.
Currency gains and losses are also calculated on payables and receivables that are denominated in foreign currencies. The payables and receivables are generally related to foreign security transactions and income translations.
Foreign currency-denominated assets and forward currency contracts may involve more risks than domestic transactions, including currency risk, counterparty risk, political and economic risk, regulatory risk and equity risk. Risks may arise from unanticipated movements in the value of foreign currencies relative to the U.S. dollar.
Dividends and Distributions
The Portfolio may make semiannual distributions of substantially all of its investment income and an annual distribution of its net realized capital gains (if any).
The Portfolio may make certain investments in real estate investment trusts (“REITs”) which pay dividends to their shareholders based upon funds available from operations. It is quite common for these dividends to exceed the REITs’ taxable earnings and profits, resulting in the excess portion of such dividends being designated as a return of capital. If the Portfolio distributes such amounts, such distributions could constitute a return of capital to shareholders for federal income tax purposes.
Federal Income Taxes
The Portfolio intends to continue to qualify as a regulated investment company and distribute all of its taxable income in accordance with the requirements of Subchapter M of the Internal Revenue Code. Management has analyzed the Portfolio’s tax positions taken for all open federal income tax years, generally a three-year period, and has concluded that no provision for federal income tax is required in the Portfolio’s financial statements. The Portfolio is not aware of any tax positions for which it is reasonably possible that the total amounts of unrecognized tax benefits will significantly change in the next twelve months.
On December 22, 2017, the Tax Cuts and Jobs Act was signed into law. Currently, Management does not believe the bill will have a material impact on the Portfolio’s intention to continue to qualify as a regulated investment company, which is generally not subject to U.S. federal income tax.
2. Derivative Instruments
The Portfolio may invest in various types of derivatives, which may at times result in significant derivative exposure. A derivative is a financial instrument whose performance is derived from the performance of another asset. The Portfolio may invest in derivative instruments including, but not limited to: futures contracts, put options, call options, options on future contracts, options on foreign currencies, options on recovery locks, options on security and commodity indices, swaps, forward contracts, structured investments, and other equity-linked derivatives. Each derivative instrument that was held by the Portfolio during the year ended December 31, 2018 is discussed in further detail below. A summary of derivative activity by the Portfolio is reflected in the tables at the end of the Schedule of Investments.
The Portfolio may use derivative instruments for hedging purposes (to offset risks associated with an investment, currency exposure, or market conditions), to adjust currency exposure relative to a benchmark index, or for speculative purposes (to earn income and seek to enhance returns). When the Portfolio invests in a derivative for speculative purposes, the Portfolio will be fully exposed to the risks of loss of that derivative, which may sometimes be greater than
Janus Henderson VIT Enterprise Portfolio
Notes to Financial Statements
the derivative’s cost. The Portfolio may not use any derivative to gain exposure to an asset or class of assets that it would be prohibited by its investment restrictions from purchasing directly. The Portfolio’s ability to use derivative instruments may also be limited by tax considerations.
Investments in derivatives in general are subject to market risks that may cause their prices to fluctuate over time. Investments in derivatives may not directly correlate with the price movements of the underlying instrument. As a result, the use of derivatives may expose the Portfolio to additional risks that it would not be subject to if it invested directly in the securities underlying those derivatives. The use of derivatives may result in larger losses or smaller gains than otherwise would be the case. Derivatives can be volatile and may involve significant risks.
In pursuit of its investment objective, the Portfolio may seek to use derivatives to increase or decrease exposure to the following market risk factors:
· Commodity Risk – the risk related to the change in value of commodities or commodity-linked investments due to changes in the overall market movements, volatility of the underlying benchmark, changes in interest rates, or other factors affecting a particular industry or commodity such as drought, floods, weather, livestock disease, embargoes, tariffs, and international economic, political, and regulatory developments.
· Counterparty Risk – the risk that the counterparty (the party on the other side of the transaction) on a derivative transaction will be unable to honor its financial obligation to the Portfolio.
· Credit Risk – the risk an issuer will be unable to make principal and interest payments when due, or will default on its obligations.
· Currency Risk – the risk that changes in the exchange rate between currencies will adversely affect the value (in U.S. dollar terms) of an investment.
· Equity Risk – the risk related to the change in value of equity securities as they relate to increases or decreases in the general market.
· Index Risk – if the derivative is linked to the performance of an index, it will be subject to the risks associated with changes in that index. If the index changes, the Portfolio could receive lower interest payments or experience a reduction in the value of the derivative to below what the Portfolio paid. Certain indexed securities, including inverse securities (which move in an opposite direction to the index), may create leverage, to the extent that they increase or decrease in value at a rate that is a multiple of the changes in the applicable index.
· Interest Rate Risk – the risk that the value of fixed-income securities will generally decline as prevailing interest rates rise, which may cause the Portfolio’s NAV to likewise decrease.
· Leverage Risk – the risk associated with certain types of leveraged investments or trading strategies pursuant to which relatively small market movements may result in large changes in the value of an investment. The Portfolio creates leverage by investing in instruments, including derivatives, where the investment loss can exceed the original amount invested. Certain investments or trading strategies, such as short sales, that involve leverage can result in losses that greatly exceed the amount originally invested.
· Liquidity Risk – the risk that certain securities may be difficult or impossible to sell at the time that the seller would like or at the price that the seller believes the security is currently worth.
Derivatives may generally be traded OTC or on an exchange. Derivatives traded OTC are agreements that are individually negotiated between parties and can be tailored to meet a purchaser’s needs. OTC derivatives are not guaranteed by a clearing agency and may be subject to increased credit risk.
In an effort to mitigate credit risk associated with derivatives traded OTC, the Portfolio may enter into collateral agreements with certain counterparties whereby, subject to certain minimum exposure requirements, the Portfolio may require the counterparty to post collateral if the Portfolio has a net aggregate unrealized gain on all OTC derivative contracts with a particular counterparty. Additionally, the Portfolio may deposit cash and/or treasuries as collateral with the counterparty and/or custodian daily (based on the daily valuation of the financial asset) if the Portfolio has a net aggregate unrealized loss on OTC derivative contracts with a particular counterparty. All liquid securities and restricted cash are considered to cover in an amount at all times equal to or greater than the Portfolio’s commitment with respect to certain exchange-traded derivatives, centrally cleared derivatives, forward foreign currency exchange contracts, short
Janus Henderson VIT Enterprise Portfolio
Notes to Financial Statements
sales, and/or securities with extended settlement dates. There is no guarantee that counterparty exposure is reduced and these arrangements are dependent on Janus Capital Management LLC's ("Janus Capital") ability to establish and maintain appropriate systems and trading.
Forward Foreign Currency Exchange Contracts
A forward foreign currency exchange contract (“forward currency contract”) is an obligation to buy or sell a specified currency at a future date at a negotiated rate (which may be U.S. dollars or a foreign currency). The Portfolio may enter into forward currency contracts for hedging purposes, including, but not limited to, reducing exposure to changes in foreign currency exchange rates on foreign portfolio holdings and locking in the U.S. dollar cost of firm purchase and sale commitments for securities denominated in or exposed to foreign currencies. The Portfolio may also invest in forward currency contracts for non-hedging purposes such as seeking to enhance returns. The Portfolio is subject to currency risk and counterparty risk in the normal course of pursuing its investment objective through its investments in forward currency contracts.
Forward currency contracts are valued by converting the foreign value to U.S. dollars by using the current spot U.S. dollar exchange rate and/or forward rate for that currency. Exchange and forward rates as of the close of the NYSE shall be used to value the forward currency contracts. The unrealized appreciation/(depreciation) for forward currency contracts is reported in the Statement of Assets and Liabilities as a receivable or payable and in the Statement of Operations for the change in unrealized net appreciation/depreciation (if applicable). The gain or loss arising from the difference between the U.S. dollar cost of the original contract and the value of the foreign currency in U.S. dollars upon closing a forward currency contract is reported on the Statement of Operations (if applicable).
During the year, the Portfolio entered into forward currency contracts with the obligation to sell foreign currencies in the future at an agreed upon rate in order to decrease exposure to currency risk associated with foreign currency denominated securities held by the Portfolio.
3. Other Investments and Strategies
Additional Investment Risk
The financial crisis in both the U.S. and global economies over the past several years has resulted, and may continue to result, in a significant decline in the value and liquidity of many securities of issuers worldwide in the equity and fixed-income/credit markets. In response to the crisis, the United States and certain foreign governments, along with the U.S. Federal Reserve and certain foreign central banks, took steps to support the financial markets. The withdrawal of this support, a failure of measures put in place to respond to the crisis, or investor perception that such efforts were not sufficient could each negatively affect financial markets generally, and the value and liquidity of specific securities. In addition, policy and legislative changes in the United States and in other countries continue to impact many aspects of financial regulation. The effect of these changes on the markets, and the practical implications for market participants, including the Portfolio, may not be fully known for some time. As a result, it may also be unusually difficult to identify both investment risks and opportunities, which could limit or preclude the Portfolio’s ability to achieve its investment objective. Therefore, it is important to understand that the value of your investment may fall, sometimes sharply, and you could lose money.
The enactment of the Dodd-Frank Wall Street Reform and Consumer Protection Act (the “Dodd-Frank Act”) of 2010 provided for widespread regulation of financial institutions, consumer financial products and services, broker-dealers, OTC derivatives, investment advisers, credit rating agencies, and mortgage lending, which expanded federal oversight in the financial sector, including the investment management industry. Many provisions of the Dodd-Frank Act remain pending and will be implemented through future rulemaking. Therefore, the ultimate impact of the Dodd-Frank Act and the regulations under the Dodd-Frank Act on the Portfolio and the investment management industry as a whole, is not yet certain.
A number of countries in the European Union (“EU”) have experienced, and may continue to experience, severe economic and financial difficulties. In particular, many EU nations are susceptible to economic risks associated with high levels of debt, notably due to investments in sovereign debt of countries such as Greece, Italy, Spain, Portugal, and Ireland. Many non-governmental issuers, and even certain governments, have defaulted on, or been forced to restructure, their debts. Many other issuers have faced difficulties obtaining credit or refinancing existing obligations. Financial institutions have in many cases required government or central bank support, have needed to raise capital, and/or have been impaired in their ability to extend credit. As a result, financial markets in the EU experienced extreme volatility and declines in asset values and liquidity. Responses to these financial problems by European governments,
Janus Henderson VIT Enterprise Portfolio
Notes to Financial Statements
central banks, and others, including austerity measures and reforms, may not work, may result in social unrest, and may limit future growth and economic recovery or have other unintended consequences. Further defaults or restructurings by governments and others of their debt could have additional adverse effects on economies, financial markets, and asset valuations around the world. Greece, Ireland, and Portugal have already received one or more "bailouts" from other Eurozone member states, and it is unclear how much additional funding they will require or if additional Eurozone member states will require bailouts in the future. The risk of investing in securities in the European markets may also be heightened due to the referendum in which the United Kingdom voted to exit the EU (known as “Brexit”). There is considerable uncertainty about how Brexit will be conducted, how negotiations of necessary treaties and trade agreements will proceed, or how financial markets will react. In addition, one or more other countries may also abandon the euro and/or withdraw from the EU, placing its currency and banking system in jeopardy.
Certain areas of the world have historically been prone to and economically sensitive to environmental events such as, but not limited to, hurricanes, earthquakes, typhoons, flooding, tidal waves, tsunamis, erupting volcanoes, wildfires or droughts, tornadoes, mudslides, or other weather-related phenomena. Such disasters, and the resulting physical or economic damage, could have a severe and negative impact on the Portfolio’s investment portfolio and, in the longer term, could impair the ability of issuers in which the Portfolio invests to conduct their businesses as they would under normal conditions. Adverse weather conditions may also have a particularly significant negative effect on issuers in the agricultural sector and on insurance companies that insure against the impact of natural disasters.
Counterparties
Portfolio transactions involving a counterparty are subject to the risk that the counterparty or a third party will not fulfill its obligation to the Portfolio (“counterparty risk”). Counterparty risk may arise because of the counterparty’s financial condition (i.e., financial difficulties, bankruptcy, or insolvency), market activities and developments, or other reasons, whether foreseen or not. A counterparty’s inability to fulfill its obligation may result in significant financial loss to the Portfolio. The Portfolio may be unable to recover its investment from the counterparty or may obtain a limited recovery, and/or recovery may be delayed. The extent of the Portfolio’s exposure to counterparty risk with respect to financial assets and liabilities approximates its carrying value. See the "Offsetting Assets and Liabilities" section of this Note for further details.
The Portfolio may be exposed to counterparty risk through participation in various programs, including, but not limited to, lending its securities to third parties, cash sweep arrangements whereby the Portfolio’s cash balance is invested in one or more types of cash management vehicles, as well as investments in, but not limited to, repurchase agreements, debt securities, and derivatives, including various types of swaps, futures and options. The Portfolio intends to enter into financial transactions with counterparties that Janus Capital believes to be creditworthy at the time of the transaction. There is always the risk that Janus Capital’s analysis of a counterparty’s creditworthiness is incorrect or may change due to market conditions. To the extent that the Portfolio focuses its transactions with a limited number of counterparties, it will have greater exposure to the risks associated with one or more counterparties.
Offsetting Assets and Liabilities
The Portfolio presents gross and net information about transactions that are either offset in the financial statements or subject to an enforceable master netting arrangement or similar agreement with a designated counterparty, regardless of whether the transactions are actually offset in the Statement of Assets and Liabilities.
In order to better define its contractual rights and to secure rights that will help the Portfolio mitigate its counterparty risk, the Portfolio has entered into an International Swaps and Derivatives Association, Inc. Master Agreement (“ISDA Master Agreement”) or similar agreement with its derivative contract counterparties. An ISDA Master Agreement is a bilateral agreement between the Portfolio and a counterparty that governs OTC derivatives and forward foreign currency exchange contracts and typically contains, among other things, collateral posting terms and netting provisions in the event of a default and/or termination event. Under an ISDA Master Agreement, in the event of a default and/or termination event, the Portfolio may offset with each counterparty certain derivative financial instruments’ payables and/or receivables with collateral held and/or posted and create one single net payment.
The following tables present gross amounts of recognized assets and/or liabilities and the net amounts after deducting collateral that has been pledged by counterparties or has been pledged to counterparties (if applicable). For corresponding information grouped by type of instrument, see the “Fair Value of Derivative Instruments (not accounted for as hedging instruments) as of December 31, 2018” table located in the Portfolio’s Schedule of Investments.
Janus Henderson VIT Enterprise Portfolio
Notes to Financial Statements
| | | | | | | | | | |
Offsetting of Financial Assets and Derivative Assets |
| |
| | | Gross Amounts | | | | | | |
| | | of Recognized | | Offsetting Asset | | Collateral | | |
Counterparty | | Assets | | or Liability(a) | | Pledged(b) | | Net Amount |
| | | | | | | | | |
Barclays Capital Inc | $ | 79,573 | $ | (4,852) | $ | — | $ | 74,721 |
Citibank NA | | 109,771 | | (14,053) | | — | | 95,718 |
Credit Suisse International | | 126,107 | | — | | — | | 126,107 |
Deutsche Bank AG | | 2,697,461 | | — | | (2,697,461) | | — |
HSBC Securities (USA) Inc | | 104,783 | | (39,605) | | — | | 65,178 |
| | | | | | | | | |
Total | $ | 3,117,695 | $ | (58,510) | $ | (2,697,461) | $ | 361,724 |
Offsetting of Financial Liabilities and Derivative Liabilities |
| |
| | | Gross Amounts | | | | | | |
| | | of Recognized | | Offsetting Asset | | Collateral | | |
Counterparty | | Liabilities | | or Liability(a) | | Pledged(b) | | Net Amount |
| | | | | | | | | |
Barclays Capital Inc | $ | 4,852 | $ | (4,852) | $ | — | $ | — |
Citibank NA | | 14,053 | | (14,053) | | — | | — |
HSBC Securities (USA) Inc | | 39,605 | | (39,605) | | — | | — |
JPMorgan Chase & Co | | 22,290 | | — | | — | | 22,290 |
| | | | | | | | | |
Total | $ | 80,800 | $ | (58,510) | $ | — | $ | 22,290 |
(a) | Represents the amount of assets or liabilities that could be offset with the same counterparty under master netting or similar agreements that management elects not to offset on the Statement of Assets and Liabilities. |
(b) | Collateral pledged is limited to the net outstanding amount due to/from an individual counterparty. The actual collateral amounts pledged may exceed these amounts and may fluctuate in value. |
Deutsche Bank AG acts as securities lending agent and a limited purpose custodian or subcustodian to receive and disburse cash balances and cash collateral, hold short-term investments, hold collateral, and perform other custodian functions in accordance with the Agency Securities Lending and Repurchase Agreement. For financial reporting purposes, the Portfolio does not offset financial instruments' payables and receivables and related collateral on the Statement of Assets and Liabilities. Securities on loan will be continuously secured by collateral which may consist of cash, U.S. Government securities, domestic and foreign short-term debt instruments, letters of credit, time deposits, repurchase agreements, money market mutual funds or other money market accounts, or such other collateral as permitted by the SEC. The value of the collateral must be at least 102% of the market value of the loaned securities that are denominated in U.S. dollars and 105% of the market value of the loaned securities that are not denominated in U.S. dollars. Upon receipt of cash collateral, Janus Capital intends to invest the cash collateral in a cash management vehicle for which Janus Capital serves as investment adviser, Janus Henderson Cash Collateral Fund LLC. Loaned securities and related collateral are marked-to-market each business day based upon the market value of the loaned securities at the close of business, employing the most recent available pricing information. Collateral levels are then adjusted based on this mark-to-market evaluation.
The Portfolio generally does not exchange collateral on its forward foreign currency contracts with its counterparties; however, all liquid securities and restricted cash are considered to cover in an amount at all times equal to or greater than the Portfolio’s commitment with respect to these contracts. Certain securities may be segregated at the Portfolio’s custodian. These segregated securities are denoted on the accompanying Schedule of Investments and are evaluated daily to ensure their cover and/or market value equals or exceeds the Portfolio’s corresponding forward foreign currency exchange contract's obligation value.
Real Estate Investing
The Portfolio may invest in equity and debt securities of real estate-related companies. Such companies may include those in the real estate industry or real estate-related industries. These securities may include common stocks, corporate bonds, preferred stocks, and other equity securities, including, but not limited to, mortgage-backed securities, real estate-backed securities, securities of REITs and similar REIT-like entities. A REIT is a trust that invests in real estate-related projects, such as properties, mortgage loans, and construction loans. REITs are generally categorized as equity, mortgage, or hybrid REITs. A REIT may be listed on an exchange or traded OTC.
Janus Henderson VIT Enterprise Portfolio
Notes to Financial Statements
Securities Lending
Under procedures adopted by the Trustees, the Portfolio may seek to earn additional income by lending securities to certain qualified broker-dealers and institutions. Deutsche Bank AG acts as securities lending agent and a limited purpose custodian or subcustodian to receive and disburse cash balances and cash collateral, hold short-term investments, hold collateral, and perform other custodian functions in accordance with the Agency Securities Lending and Repurchase Agreement. The Portfolio may lend portfolio securities in an amount equal to up to 1/3 of its total assets as determined at the time of the loan origination. There is the risk of delay in recovering a loaned security or the risk of loss in collateral rights if the borrower fails financially. In addition, Janus Capital makes efforts to balance the benefits and risks from granting such loans. All loans will be continuously secured by collateral which may consist of cash, U.S. Government securities, domestic and foreign short-term debt instruments, letters of credit, time deposits, repurchase agreements, money market mutual funds or other money market accounts, or such other collateral as permitted by the SEC. If the Portfolio is unable to recover a security on loan, the Portfolio may use the collateral to purchase replacement securities in the market. There is a risk that the value of the collateral could decrease below the cost of the replacement security by the time the replacement investment is made, resulting in a loss to the Portfolio.
Upon receipt of cash collateral, Janus Capital may invest it in affiliated or non-affiliated cash management vehicles, whether registered or unregistered entities, as permitted by the 1940 Act and rules promulgated thereunder. Janus Capital currently intends to invest the cash collateral in a cash management vehicle for which Janus Capital serves as investment adviser, Janus Henderson Cash Collateral Fund LLC. An investment in Janus Henderson Cash Collateral Fund LLC is generally subject to the same risks that shareholders experience when investing in similarly structured vehicles, such as the potential for significant fluctuations in assets as a result of the purchase and redemption activity of the securities lending program, a decline in the value of the collateral, and possible liquidity issues. Such risks may delay the return of the cash collateral and cause the Portfolio to violate its agreement to return the cash collateral to a borrower in a timely manner. As adviser to the Portfolio and Janus Henderson Cash Collateral Fund LLC, Janus Capital has an inherent conflict of interest as a result of its fiduciary duties to both the Portfolio and Janus Henderson Cash Collateral Fund LLC. Additionally, Janus Capital receives an investment advisory fee of 0.05% for managing Janus Henderson Cash Collateral Fund LLC, but it may not receive a fee for managing certain other affiliated cash management vehicles in which the Portfolio may invest, and therefore may have an incentive to allocate preferred investment opportunities to investment vehicles for which it is receiving a fee.
The value of the collateral must be at least 102% of the market value of the loaned securities that are denominated in U.S. dollars and 105% of the market value of the loaned securities that are not denominated in U.S. dollars. Loaned securities and related collateral are marked-to-market each business day based upon the market value of the loaned securities at the close of business, employing the most recent available pricing information. Collateral levels are then adjusted based on this mark-to-market evaluation.
The cash collateral invested by Janus Capital is disclosed in the Schedule of Investments (if applicable). Income earned from the investment of the cash collateral, net of rebates paid to, or fees paid by, borrowers and less the fees paid to the lending agent are included as “Affiliated securities lending income, net” on the Statement of Operations. As of December 31, 2018, securities lending transactions accounted for as secured borrowings with an overnight and continuous contractual maturity are $2,697,461 for equity securities. Gross amounts of recognized liabilities for securities lending (collateral received) as of December 31, 2018 is $2,758,029, resulting in the net amount due to the counterparty of $60,568.
4. Investment Advisory Agreements and Other Transactions with Affiliates
The Portfolio pays Janus Capital an investment advisory fee which is calculated daily and paid monthly. The Portfolio’s contractual investment advisory fee rate (expressed as an annual rate) is 0.64% of its average daily net assets.
Janus Services LLC (“Janus Services”), a wholly-owned subsidiary of Janus Capital, is the Portfolio’s transfer agent. Janus Services receives an administrative services fee at an annual rate of 0.05% of the average daily net assets of the Portfolio for arranging for the provision by participating insurance companies and qualified plan service providers of administrative services, including recordkeeping, subaccounting, order processing, or other shareholder services provided on behalf of contract holders or plan participants investing in the Portfolio. Other shareholder services may include the provision of order confirmations, periodic account statements, forwarding prospectuses, shareholder reports, and other materials to existing investors, and answering inquiries regarding accounts. Janus Services expects to use this entire fee to compensate insurance companies and qualified plan service providers for providing these services to
Janus Henderson VIT Enterprise Portfolio
Notes to Financial Statements
their customers who invest in the Portfolio. Any unused portion will be reimbursed to the applicable share class at least annually.
In addition, Janus Services provides or arranges for the provision of certain other internal administrative, recordkeeping, and shareholder relations services for the Portfolio. Janus Services is not compensated for these internal services related to the shares, except for out-of-pocket costs. These amounts are disclosed as “Other transfer agent fees and expenses” on the Statement of Operations.
Under a distribution and shareholder servicing plan (the “Plan”) adopted in accordance with Rule 12b-1 under the 1940 Act, the Service Shares may pay the Trust’s distributor, Janus Distributors LLC (“Janus Distributors”), a wholly-owned subsidiary of Janus Capital, a fee for the sale and distribution and/or shareholder servicing of the Service Shares at an annual rate of up to 0.25% of the average daily net assets of the Service Shares. Under the terms of the Plan, the Trust is authorized to make payments to Janus Distributors for remittance to insurance companies and qualified plan service providers as compensation for distribution and/or shareholder services performed by such entities. These amounts are disclosed as “12b-1 Distribution and shareholder servicing fees” on the Statement of Operations. Payments under the Plan are not tied exclusively to actual 12b-1 distribution and servicing fees, and the payments may exceed 12b-1 distribution and servicing fees actually incurred. If any of the Portfolio’s actual 12b-1 distribution and servicing fees incurred during a calendar year are less than the payments made during a calendar year, the Portfolio will be refunded the difference. Refunds, if any, are included in “12b-1 Distribution and shareholder servicing fees” in the Statement of Operations.
Janus Capital serves as administrator to the Portfolio pursuant to an administration agreement between Janus Capital and the Trust. Under the administration agreement, Janus Capital is obligated to provide or arrange for the provision of certain administration, compliance, and accounting services to the Portfolio, including providing office space for the Portfolio, and is reimbursed by the Portfolio for certain of its costs in providing these services (to the extent Janus Capital seeks reimbursement and such costs are not otherwise waived). In addition, employees of Janus Capital and/or its affiliates may serve as officers of the Trust. The Portfolio pays for some or all of the salaries, fees, and expenses of Janus Capital employees and Portfolio officers, with respect to certain specified administration functions they perform on behalf of the Portfolio. The Portfolio pays these costs based on out-of-pocket expenses incurred by Janus Capital, and these costs are separate and apart from advisory fees and other expenses paid in connection with the investment advisory services Janus Capital (or any subadvisor, as applicable) provides to the Portfolio. These amounts are disclosed as “Affiliated portfolio administration fees” on the Statement of Operations. In addition, some expenses related to compensation payable to the Portfolio’s Chief Compliance Officer and certain compliance staff, all of whom are employees of Janus Capital and/or its affiliates, are shared with the Portfolio. Total compensation of $34,180 was paid to the Chief Compliance Officer and certain compliance staff by the Trust during the year ended December 31, 2018. The Portfolio's portion is reported as part of “Other expenses” on the Statement of Operations.
Effective April 1, 2018, BNP Paribas Financial Services (“BPFS”) provides certain administrative services to the Portfolio, including services related to Portfolio accounting, calculation of the Portfolio’s daily NAV, and Portfolio audit, tax, and reporting obligations, pursuant to a sub-administration agreement with Janus Capital on behalf of the Portfolio. Janus Capital, as administrator, oversees the provision of these services by BPFS. As compensation for such services, Janus Capital pays BPFS a fee based on a percentage of the Portfolio’s assets, along with a flat fee, and is reimbursed by the Portfolio for amounts paid to BPFS (to the extent Janus Capital seeks reimbursement and such costs are not otherwise waived). These amounts are disclosed as part of "Other expenses" on the Statement of Operations.
The Board of Trustees has adopted a deferred compensation plan (the “Deferred Plan”) for independent Trustees to elect to defer receipt of all or a portion of the annual compensation they are entitled to receive from the Portfolio. All deferred fees are credited to an account established in the name of the Trustees. The amounts credited to the account then increase or decrease, as the case may be, in accordance with the performance of one or more of the Janus Henderson funds that are selected by the Trustees. The account balance continues to fluctuate in accordance with the performance of the selected fund or funds until final payment of all amounts are credited to the account. The fluctuation of the account balance is recorded by the Portfolio as unrealized appreciation/(depreciation) and is included as of December 31, 2018 on the Statement of Assets and Liabilities in the asset, “Non-interested Trustees’ deferred compensation,” and liability, “Non-interested Trustees’ deferred compensation fees.” Additionally, the recorded unrealized appreciation/(depreciation) is included in “Unrealized net appreciation/(depreciation) of investments, foreign currency translations and non-interested Trustees’ deferred compensation” on the Statement of Assets and Liabilities. Deferred compensation expenses for the year ended December 31, 2018 are included in “Non-interested Trustees’
Janus Henderson VIT Enterprise Portfolio
Notes to Financial Statements
fees and expenses” on the Statement of Operations. Trustees are allowed to change their designation of mutual funds from time to time. Amounts will be deferred until distributed in accordance with the Deferred Plan. Deferred fees of $511,200 were paid by the Trust to the Trustees under the Deferred Plan during the year ended December 31, 2018.
Pursuant to the provisions of the 1940 Act and related rules, the Portfolio may participate in an affiliated or nonaffiliated cash sweep program. In the cash sweep program, uninvested cash balances of the Portfolio may be used to purchase shares of affiliated or nonaffiliated money market funds or cash management pooled investment vehicles. The Portfolio is eligible to participate in the cash sweep program (the “Investing Funds”). As adviser, Janus Capital has an inherent conflict of interest because of its fiduciary duties to the affiliated money market funds or cash management pooled investment vehicles and the Investing Funds. Janus Henderson Cash Liquidity Fund LLC is an affiliated unregistered cash management pooled investment vehicle that invests primarily in highly-rated short-term fixed-income securities. Janus Henderson Cash Liquidity Fund LLC currently maintains a NAV of $1.00 per share and distributes income daily in a manner consistent with a registered product compliant with Rule 2a-7 under the 1940 Act. There are no restrictions on the Portfolio's ability to withdraw investments from Janus Henderson Cash Liquidity Fund LLC at will, and there are no unfunded capital commitments due from the Portfolio to Janus Henderson Cash Liquidity Fund LLC. The units of Janus Henderson Cash Liquidity Fund LLC are not charged any management fee, sales charge or service fee.
Any purchases and sales, realized gains/losses and recorded dividends from affiliated investments during the year ended December 31, 2018 can be found in the “Schedules of Affiliated Investments” located in the Schedule of Investments.
5. Federal Income Tax
The tax components of capital shown in the table below represent: (1) distribution requirements the Portfolio must satisfy under the income tax regulations; (2) losses or deductions the Portfolio may be able to offset against income and gains realized in future years; and (3) unrealized appreciation or depreciation of investments for federal income tax purposes.
Other book to tax differences primarily consist of deferred compensation, derivatives, and foreign currency contract adjustments. The Portfolio has elected to treat gains and losses on forward foreign currency contracts as capital gains and losses, if applicable. Other foreign currency gains and losses on debt instruments are treated as ordinary income for federal income tax purposes pursuant to Section 988 of the Internal Revenue Code.
| | | | | | | | |
| | | | Loss Deferrals | Other Book | Net Tax | |
Undistributed
Ordinary Income | Undistributed
Long-Term Gains | Accumulated
Capital Losses | Late-Year
Ordinary Loss | Post-October
Capital Loss | to Tax
Differences | Appreciation/
(Depreciation) | |
$ 798,385 | $ 85,522,672 | $ - | $ - | $ - | $ (26,912) | $365,637,770 | |
The aggregate cost of investments and the composition of unrealized appreciation and depreciation of investment securities for federal income tax purposes as of December 31, 2018 are noted below. The primary differences between book and tax appreciation or depreciation of investments are wash sale loss deferrals and investments in partnerships.
| | | | |
Federal Tax Cost | Unrealized
Appreciation | Unrealized
(Depreciation) | Net Tax Appreciation/
(Depreciation) |
$ 806,645,642 | $403,841,925 | $(38,204,155) | $ 365,637,770 |
| | | | |
Information on the tax components of derivatives as of December 31, 2018 is as follows:
| | | | |
Federal Tax Cost | Unrealized
Appreciation | Unrealized
(Depreciation) | Net Tax Appreciation/
(Depreciation) |
$ 339,434 | $ - | $ - | $ - |
| | | | |
Janus Henderson VIT Enterprise Portfolio
Notes to Financial Statements
Tax cost of investments and unrealized appreciation/(depreciation) may also include timing differences that do not constitute adjustments to tax basis.
Income and capital gains distributions are determined in accordance with income tax regulations that may differ from accounting principles generally accepted in the United States of America. These differences are due to differing treatments for items such as net short-term gains, deferral of wash sale losses, foreign currency transactions, net investment losses, and capital loss carryovers. Certain permanent differences such as tax returns of capital and net investment losses noted below have been reclassified to capital.
| | | | | |
For the year ended December 31, 2018 | |
Distributions | | |
From Ordinary Income | From Long-Term Capital Gains | Tax Return of Capital | Net Investment Loss | |
$ 2,472,586 | $ 58,630,191 | $ - | $ - | |
| | | | | |
For the year ended December 31, 2017 | |
Distributions | | |
From Ordinary Income | From Long-Term Capital Gains | Tax Return of Capital | Net Investment Loss | |
$ 6,165,712 | $ 64,073,319 | $ - | $ - | |
Permanent book to tax basis differences may result in reclassifications between the components of net assets. These differences have no impact on the results of operations or net assets. The following reclassifications have been made to the Portfolio:
| | | |
| | | |
Increase/(Decrease) to Capital | Increase/(Decrease) to Undistributed
Net Investment Income/Loss | Increase/(Decrease) to Undistributed
Net Realized Gain/Loss |
$ - | $ (109,120) | $ 109,120 |
| | | |
6. Capital Share Transactions
| | | | | | | |
| | | | | | | |
| | | Year ended December 31, 2018 | | Year ended December 31, 2017 |
| | | Shares | Amount | | Shares | Amount |
| | | | | | | |
Institutional Shares: | | | | | |
Shares sold | 1,094,919 | $ 81,180,091 | | 1,890,480 | $121,760,466 |
Reinvested dividends and distributions | 411,872 | 30,474,258 | | 576,744 | 36,830,888 |
Shares repurchased | (1,648,195) | (121,740,045) | | (1,457,793) | (95,410,468) |
Net Increase/(Decrease) | (141,404) | $ (10,085,696) | | 1,009,431 | $ 63,180,886 |
Service Shares: | | | | | |
Shares sold | 2,327,514 | $162,490,283 | | 2,014,812 | $125,011,366 |
Reinvested dividends and distributions | 439,794 | 30,628,519 | | 553,573 | 33,408,143 |
Shares repurchased | (1,750,080) | (121,952,201) | | (1,693,457) | (104,497,915) |
Net Increase/(Decrease) | 1,017,228 | $ 71,166,601 | | 874,928 | $ 53,921,594 |
7. Purchases and Sales of Investment Securities
For the year ended December 31, 2018, the aggregate cost of purchases and proceeds from sales of investment securities (excluding any short-term securities, short-term options contracts, TBAs, and in-kind transactions, as applicable) was as follows:
Janus Henderson VIT Enterprise Portfolio
Notes to Financial Statements
| | | | |
Purchases of
Securities | Proceeds from Sales
of Securities | Purchases of Long-
Term U.S. Government
Obligations | Proceeds from Sales
of Long-Term U.S.
Government Obligations |
$171,581,264 | $ 166,321,275 | $ - | $ - |
8. Recent Accounting Pronouncements
The Securities and Exchange Commission adopted amendments to Regulation S-X for the presentation of distributable earnings and distributions to align with US Generally Accepted Accounting Principles (GAAP). The compliance date of the amendments to Regulation S-X was November 5, 2018. This report incorporates the amendments to Regulation S-X.
The FASB issued Accounting Standards Update No. 2017-08, Receivables – Nonrefundable Fees and Other Costs (Subtopic 310-20), Premium Amortization on Purchased Callable Debt Securities ("ASU 2017-08") to amend the amortization period for certain purchased callable debt securities held at a premium. The guidance requires certain premiums on callable debt securities to be amortized to the earliest call date. The amortization period for callable debt securities purchased at a discount will not be impacted. The amendments are effective for fiscal years, and interim periods within those fiscal years, beginning after December 15, 2018. Early adoption is permitted, including adoption in an interim period. Management is currently evaluating the impacts of ASU 2017-08 on the financial statements.
The FASB issued Accounting Standards Update 2018-13, Fair Value Measurement (Topic 820), in August 2018. The new guidance removes, modifies and enhances the disclosures to Topic 820. For public entities, the amendments are effective for financial statements issued for fiscal years beginning after December 15, 2019, and interim periods within those fiscal years. Management is currently evaluating the impact of this new guidance on the financial statements.
9. Subsequent Event
Management has evaluated whether any events or transactions occurred subsequent to December 31, 2018 and through the date of issuance of the Portfolio’s financial statements and determined that there were no material events or transactions that would require recognition or disclosure in the Portfolio’s financial statements.
Janus Henderson VIT Enterprise Portfolio
Report of Independent Registered Public Accounting Firm
To the Board of Trustees of Janus Aspen Series and Shareholders of Janus Henderson VIT Enterprise Portfolio:
Opinion on the Financial Statements
We have audited the accompanying statement of assets and liabilities, including the schedule of investments, of Janus Henderson VIT Enterprise Portfolio (one of the portfolios constituting Janus Aspen Series, referred to hereafter as the "Portfolio") as of December 31, 2018, the related statement of operations for the year ended December 31, 2018, the statements of changes in net assets for each of the two years in the period ended December 31, 2018, including the related notes, and the financial highlights for each of the five years in the period ended December 31, 2018 (collectively referred to as the “financial statements”). In our opinion, the financial statements present fairly, in all material respects, the financial position of the Portfolio as of December 31, 2018, the results of its operations for the year then ended, the changes in its net assets for each of the two years in the period ended December 31, 2018 and the financial highlights for each of the five years in the period ended December 31, 2018 in conformity with accounting principles generally accepted in the United States of America.
Basis for Opinion
These financial statements are the responsibility of the Portfolio’s management. Our responsibility is to express an opinion on the Portfolio’s financial statements based on our audits. We are a public accounting firm registered with the Public Company Accounting Oversight Board (United States) (PCAOB) and are required to be independent with respect to the Portfolio in accordance with the U.S. federal securities laws and the applicable rules and regulations of the Securities and Exchange Commission and the PCAOB.
We conducted our audits of these financial statements in accordance with the standards of the PCAOB. Those standards require that we plan and perform the audit to obtain reasonable assurance about whether the financial statements are free of material misstatement, whether due to error or fraud.
Our audits included performing procedures to assess the risks of material misstatement of the financial statements, whether due to error or fraud, and performing procedures that respond to those risks. Such procedures included examining, on a test basis, evidence regarding the amounts and disclosures in the financial statements. Our audits also included evaluating the accounting principles used and significant estimates made by management, as well as evaluating the overall presentation of the financial statements. Our procedures included confirmation of securities owned as of December 31, 2018 by correspondence with the custodian, transfer agent, and brokers; when replies were not received from brokers, we performed other auditing procedures. We believe that our audits provide a reasonable basis for our opinion.

Denver, Colorado
February 15, 2019
We have served as the auditor of one or more investment companies in Janus Henderson Funds since 1990.
Janus Henderson VIT Enterprise Portfolio
Additional Information (unaudited)
Proxy Voting Policies and Voting Record
A description of the policies and procedures that the Portfolio uses to determine how to vote proxies relating to its portfolio securities is available without charge: (i) upon request, by calling 1-800-525-1093; (ii) on the Portfolio’s website at janushenderson.com/proxyvoting; and (iii) on the SEC’s website at http://www.sec.gov. Additionally, information regarding the Portfolio’s proxy voting record for the most recent twelve-month period ended June 30 is also available, free of charge, through janushenderson.com/proxyvoting and from the SEC’s website at http://www.sec.gov.
Full Holdings
The Portfolio is required to disclose its complete holdings on Form N-Q within 60 days of the end of the first and third fiscal quarters, and in the annual report and semiannual report to Portfolio shareholders. These reports (i) are available on the SEC’s website at http://www.sec.gov; (ii) may be reviewed and copied at the SEC’s Public Reference Room in Washington, D.C. (information on the Public Reference Room may be obtained by calling 1-800-SEC-0330); and (iii) are available without charge, upon request, by calling a Janus Henderson representative at 1-877-335-2687 (toll free) . Portfolio holdings consisting of at least the names of the holdings are generally available on a monthly basis with a 30-day lag. Holdings are generally posted approximately two business days thereafter under Full Holdings for the Portfolio at janushenderson.com/vit.
APPROVAL OF ADVISORY AGREEMENTS DURING THE PERIOD
The Trustees of Janus Aspen Series, each of whom serves as an “independent” Trustee (the “Trustees”), oversee the management of each Portfolio of Janus Aspen Series (each, a “VIT Portfolio,” and collectively, the “VIT Portfolios”), as well as each Fund of Janus Investment Fund (together with the VIT Portfolios, the “Janus Henderson Funds,” and each, a “Janus Henderson Fund”). As required by law, the Trustees determine annually whether to continue the investment advisory agreement for each Janus Henderson Fund and the subadvisory agreement for each Janus Henderson Funds that utilizes a subadviser.
In connection with their most recent consideration of those agreements for each Janus Henderson Fund, the Trustees received and reviewed information provided by Janus Capital and each subadviser in response to requests of the Trustees and their independent legal counsel. They also received and reviewed information and analysis provided by, and in response to requests of, their independent fee consultant. Throughout their consideration of the agreements, the Trustees were advised by their independent legal counsel. The Trustees met with management to consider the agreements and the information provided, and also met separately in executive session with their independent legal counsel and their independent fee consultant.
At a meeting held on December 6, 2018, based on the Trustees’ evaluation of the information provided by Janus Capital, the subadvisers, and the independent fee consultant, as well as other information, the Trustees determined that the overall arrangements between each Janus Henderson Fund and Janus Capital and each subadviser, as applicable, were fair and reasonable in light of the nature, extent and quality of the services provided by Janus Capital, its affiliates and the subadvisers, the fees charged for those services, and other matters that the Trustees considered relevant in the exercise of their business judgment. At that meeting, the Trustees unanimously approved the continuation of the investment advisory agreement for each Janus Henderson Fund, and the subadvisory agreement for each subadvised Janus Henderson Fund, for the period from February 1, 2019 through February 1, 2020, subject to earlier termination as provided for in each agreement.
In considering the continuation of those agreements, the Trustees reviewed and analyzed various factors that they determined were relevant, including the factors described below, none of which by itself was considered dispositive. However, the material factors and conclusions that formed the basis for the Trustees’ determination to approve the continuation of the agreements are discussed separately below. Also included is a summary of the independent fee consultant’s conclusions and opinions that arose during, and were included as part of, the Trustees’ consideration of the agreements. “Management fees,” as used herein, refer to actual annual advisory fees (and, for the purposes of peer comparisons any administration fees excluding out of pocket costs), net of any waivers, paid by a fund as a percentage of average net assets.
Nature, Extent and Quality of Services
The Trustees reviewed the nature, extent and quality of the services provided by Janus Capital and the subadvisers to the Janus Henderson Funds, taking into account the investment objective, strategies and policies of each Janus Henderson Fund, and the knowledge the Trustees gained from their regular meetings with management on at least a
Janus Henderson VIT Enterprise Portfolio
Additional Information (unaudited)
quarterly basis and their ongoing review of information related to the Janus Henderson Funds. In addition, the Trustees reviewed the resources and key personnel of Janus Capital and each subadviser, particularly noting those employees who provide investment and risk management services to the Janus Henderson Funds. The Trustees also considered other services provided to the Janus Henderson Funds by Janus Capital or the subadvisers, such as managing the execution of portfolio transactions and the selection of broker-dealers for those transactions. The Trustees considered Janus Capital’s role as administrator to the Janus Henderson Funds, noting that Janus Capital does not receive a fee for its services but is reimbursed for its out-of-pocket costs. The Trustees considered the role of Janus Capital in monitoring adherence to the Janus Henderson Funds’ investment restrictions, providing support services for the Trustees and Trustee committees, and overseeing communications with fund shareholders and the activities of other service providers, including monitoring compliance with various policies and procedures of the Janus Henderson Funds and with applicable securities laws and regulations.
In this regard, the independent fee consultant noted that Janus Capital provides a number of different services for the Janus Henderson Funds and fund shareholders, ranging from investment management services to various other servicing functions, and that, in its view, Janus Capital is a capable provider of those services. The independent fee consultant also expressed the view that Janus Capital has developed a number of institutional competitive advantages that should enable it to provide superior investment and service performance over the long term.
The Trustees concluded that the nature, extent and quality of the services provided by Janus Capital and the subadviser to each Janus Henderson Fund that utilizes a subadviser were appropriate and consistent with the terms of the respective investment advisory and subadvisory agreements, and that, taking into account steps taken to address those Janus Henderson Funds whose performance lagged that of their peers for certain periods, the Janus Henderson Funds were likely to benefit from the continued provision of those services. They also concluded that Janus Capital and each subadviser had sufficient personnel, with the appropriate education and experience, to serve the Janus Henderson Funds effectively and had demonstrated its ability to attract well-qualified personnel.
Performance of the Funds
The Trustees considered the performance results of each Janus Henderson Fund over various time periods. They noted that they considered Janus Henderson Fund performance data throughout the year, including periodic meetings with each Janus Henderson Fund’s portfolio manager(s), and also reviewed information comparing each Janus Henderson Fund’s performance with the performance of comparable funds and peer groups identified by Broadridge Financial Solutions, Inc. (“Broadridge”), an independent data provider, and with the Janus Henderson Fund’s benchmark index. In this regard, the independent fee consultant found that the overall Janus Henderson Funds’ performance has been reasonable: for the 36 months ended September 30, 2018, approximately 48% of the Janus Henderson Funds were in the top two quartiles of performance, as reported by Morningstar, and for the 12 months ended September 30, 2018, approximately 56% of the Janus Henderson Funds were in the top two quartiles of performance, as reported by Morningstar.
The Trustees considered the performance of each Janus Henderson Fund, noting that performance may vary by share class, and noted the following with respect to the VIT Portfolios:
· For Janus Henderson Balanced Portfolio, the Trustees noted that the Fund’s performance was in the first Broadridge quartile for the 36 months ended May 31, 2018 and the first Broadridge quartile for the 12 months ended May 31, 2018.
· For Janus Henderson Enterprise Portfolio, the Trustees noted that the Fund’s performance was in the first Broadridge quartile for the 36 months ended May 31, 2018 and the second Broadridge quartile for the 12 months ended May 31, 2018.
· For Janus Henderson Flexible Bond Portfolio, the Trustees noted that the Fund’s performance was in the bottom Broadridge quartile for the 36 months ended May 31, 2018 and the bottom Broadridge quartile for the 12 months ended May 31, 2018. The Trustees noted the reasons for the Fund’s underperformance and the steps Janus Capital had taken or was taking to improve performance.
· For Janus Henderson Forty Portfolio, the Trustees noted that the Fund’s performance was in the third Broadridge quartile for the 36 months ended May 31, 2018 and the third Broadridge quartile for the 12 months ended May 31,
Janus Henderson VIT Enterprise Portfolio
Additional Information (unaudited)
2018. The Trustees noted the reasons for the Fund’s underperformance, while also noting that the Fund has a performance fee structure that results in lower management fees during periods of underperformance, and the steps Janus Capital had taken or was taking to improve performance.
· For Janus Henderson Global Research Portfolio, the Trustees noted that the Fund’s performance was in the bottom Broadridge quartile for the 36 months ended May 31, 2018 and the third Broadridge quartile for the 12 months ended May 31, 2018. The Trustees noted the reasons for the Fund’s underperformance, while also noting that the Fund has a performance fee structure that results in lower management fees during periods of underperformance, and the steps Janus Capital had taken or was taking to improve performance.
· For Janus Henderson Global Technology Portfolio, the Trustees noted that the Fund’s performance was in the first Broadridge quartile for the 36 months ended May 31, 2018 and the first Broadridge quartile for the 12 months ended May 31, 2018.
· For Janus Henderson Global Unconstrained Bond Portfolio, the Trustees noted that the Fund’s performance was in the bottom Broadridge quartile for the 36 months ended May 31, 2018 and the bottom Broadridge quartile for the 12 months ended May 31, 2018. The Trustees noted the reasons for the Fund’s underperformance and the steps Janus Capital had taken or was taking to improve performance.
· For Janus Henderson Mid Cap Value Portfolio, the Trustees noted that the Fund’s performance was in the second Broadridge quartile for the 36 months ended May 31, 2018 and the bottom Broadridge quartile for the 12 months ended May 31, 2018.
· For Janus Henderson Overseas Portfolio, the Trustees noted that the Fund’s performance was in the bottom Broadridge quartile for the 36 months ended May 31, 2018 and the second Broadridge quartile for the 12 months ended May 31, 2018. The Trustees noted the reasons for the Fund’s underperformance, while also noting that the Fund has a performance fee structure that results in lower management fees during periods of underperformance, the steps Janus Capital had taken or was taking to improve performance, and that the performance trend was improving.
· For Janus Henderson Research Portfolio, the Trustees noted that the Fund’s performance was in the third Broadridge quartile for the 36 months ended May 31, 2018 and the third Broadridge quartile for the 12 months ended May 31, 2018. The Trustees noted the reasons for the Fund’s underperformance, while also noting that the Fund has a performance fee structure that results in lower management fees during periods of underperformance, and the steps Janus Capital had taken or was taking to improve performance.
· For Janus Henderson U.S. Low Volatility Portfolio, the Trustees noted that the Fund’s performance was in the third Broadridge quartile for the 36 months ended May 31, 2018 and the bottom Broadridge quartile for the 12 months ended May 31, 2018. The Trustees noted the reasons for the Fund’s underperformance and the steps Janus Capital and Intech had taken or were taking to improve performance.
In consideration of each Janus Henderson Fund’s performance, the Trustees concluded that, taking into account the factors relevant to performance, as well as other considerations, including steps taken to improve performance, the Janus Henderson Fund’s performance warranted continuation of such Janus Henderson Fund’s investment advisory and subadvisory agreement(s).
Costs of Services Provided
The Trustees examined information regarding the fees and expenses of each Janus Henderson Fund in comparison to similar information for other comparable funds as provided by Broadridge, an independent data provider. They also reviewed an analysis of that information provided by their independent fee consultant and noted that the management fee rate (investment advisory and any administration fees, but excluding out-of-pocket costs) for many of the Janus Henderson Funds, net of waivers, was below the average management fee rate of the respective peer group of funds selected by Broadridge. The Trustees also examined information regarding the subadvisory fees charged for subadvisory services, as applicable, noting that all such fees were paid by Janus Capital out of its management fees collected from such Janus Henderson Fund. The Trustees also considered the total expenses for each share class of each Janus Henderson Fund compared to the average total expenses for its Broadridge Expense Group peers and to average total expenses for its Broadridge Expense Universe.
The independent fee consultant expressed the view that the management fees charged by Janus Capital to each of the Janus Henderson Funds under the current investment advisory and administration agreements are reasonable in relation to the services provided by Janus Capital. At the fund complex level, the independent fee consultant found: (1)
Janus Henderson VIT Enterprise Portfolio
Additional Information (unaudited)
the total expenses and management fees of the Janus Henderson Funds to be reasonable relative to other mutual funds; (2) total expenses, on average, were 10% under the average total expenses for the respective Broadridge Expense Group peers and 19% under the average total expenses for the respective Broadridge Expense Universes; (3) management fees for the Janus Henderson Funds, on average, were 8% under the average management fees for the respective Expense Groups and 10% under the average for the respective Expense Universes; and (4) Janus Henderson Fund expenses by function for each asset and share class category were reasonable relative to peer benchmarks.
The independent fee consultant concluded that, based on its strategic review of expenses at the complex, category and individual share class level, Janus Henderson Fund expenses were found to be reasonable relative to peer benchmarks. Further, for certain Janus Henderson Funds, the independent fee consultant also performed a systematic “focus list” analysis of expenses in the context of the performance or service delivered to investors in each Janus Henderson Fund. Based on this analysis, the independent fee consultant found that the combination of service quality/performance and expenses on these individual Janus Henderson Funds were reasonable in light of performance trends, performance histories, and existence of performance fees, breakpoints, and expense waivers on such “focus list” Funds.
The Trustees considered the methodology used by Janus Capital and each subadviser in determining compensation payable to portfolio managers, the competitive environment for investment management talent, and the competitive market for mutual funds in different distribution channels.
The Trustees also reviewed management fees charged by Janus Capital and each subadviser to comparable separate account clients and to comparable non-affiliated funds subadvised by Janus Capital or by a subadviser (for which Janus Capital or the subadviser provides only or primarily portfolio management services). Although in most instances comparable subadvisory and separate account fee rates for various investment strategies were lower than management fee rates for Janus Henderson Funds having a similar strategy, while subadviser fee rates charged to the Janus Henderson Funds were generally within a reasonable range of the fee rates that the subadviser charges to comparable separate account clients or non-affiliated funds. The Trustees considered that Janus Capital noted that, under the terms of the management agreements with the Janus Henderson Funds, Janus Capital performs significant additional services for the Janus Henderson Funds that it does not provide to those other clients, including administration services, oversight of the Janus Henderson Funds’ other service providers, trustee support, regulatory compliance and numerous other services, and that, in serving the Janus Henderson Funds, Janus Capital assumes many legal risks and other costs that it does not assume in servicing its other clients. Moreover, the Trustees noted that the independent fee consultant found that: (1) the management fees Janus Capital charges to the Janus Henderson Funds are reasonable in relation to the management fees Janus Capital charges to its institutional clients and to the fees Janus Capital charges to funds subadvised by Janus Capital; (2) these institutional and subadvised accounts have different service and infrastructure needs; (3) Janus Henderson mutual fund investors enjoy reasonable fees relative to the fees charged to Janus Henderson institutional and subadvised fund investors; (4) in three of five product categories, the Janus Henderson Funds receive proportionally better pricing than the industry in relation to Janus Henderson institutional clients; and (5) in six of seven strategies, Janus Capital has lower management fees than the management fees charged to funds subadvised by Janus Capital.
The Trustees considered the fees for each Janus Henderson Fund for its fiscal year ended in 2017, including the VIT Portfolios, and noted the following with regard to each VIT Portfolio’s total expenses, net of applicable fee waivers (the VIT Portfolio’s “total expenses”):
· For Janus Henderson Balanced Portfolio, the Trustees noted that, although the Fund’s total expenses exceeded the peer group average for one share class, overall the Fund’s total expenses were reasonable.
· For Janus Henderson Enterprise Portfolio, the Trustees noted that, although the Fund’s total expenses exceeded the peer group average for one share class, overall the Fund’s total expenses were reasonable.
· For Janus Henderson Flexible Bond Portfolio, the Trustees noted that, although the Fund’s total expenses exceeded the peer group average for one share class, overall the Fund’s total expenses were reasonable. The Trustees also noted that Janus Capital has contractually agreed to limit the Fund’s expenses, although this limit did not apply because the Fund’s total expenses were already below the applicable fee limit.
· For Janus Henderson Forty Portfolio, the Trustees noted that, although the Fund’s total expenses exceeded the peer group average for one share class, overall the Fund’s total expenses were reasonable.
Janus Henderson VIT Enterprise Portfolio
Additional Information (unaudited)
· For Janus Henderson Global Research Portfolio, the Trustees noted that the Fund’s total expenses were below the peer group average for both share classes.
· For Janus Henderson Global Technology Portfolio, the Trustees noted that the Fund’s total expenses were below the peer group average for both share classes.
· For Janus Henderson Global Unconstrained Bond Portfolio, the Trustees noted that, although the Fund’s total expenses exceeded the peer group average for both share classes, overall the Fund’s total expenses were reasonable. The Trustees also noted that Janus Capital has contractually agreed to limit the Fund’s expenses.
· For Janus Henderson Mid Cap Value Portfolio, the Trustees noted that the Fund’s total expenses were below the peer group average for both share classes.
· For Janus Henderson Overseas Portfolio, the Trustees noted that the Fund’s total expenses were below the peer group average for both share classes.
· For Janus Henderson Research Portfolio, the Trustees noted that the Fund’s total expenses were below the peer group average for both share classes.
· For Janus Henderson U.S. Low Volatility Portfolio, the Trustees noted that the Fund’s total expenses were below the peer group average for its sole share class.
The Trustees reviewed information on the overall profitability to Janus Capital and its affiliates of their relationship with the Janus Henderson Funds, and considered profitability data of other publicly traded fund managers. The Trustees recognized that profitability comparisons among fund managers are difficult because of the variation in the type of comparative information that is publicly available, and the profitability of any fund manager is affected by numerous factors, including the organizational structure of the particular fund manager, differences in complex size, differences in product mix, differences in types of business (mutual fund, institutional and other), differences in the methodology for allocating expenses, and the fund manager’s capital structure and cost of capital.
Additionally, the Trustees considered the estimated profitability to Janus Capital from the investment management services it provides to each Janus Henderson Fund. In their review, the Trustees considered whether Janus Capital and each subadviser receive adequate incentives and resources to manage the Janus Henderson Funds effectively. In reviewing profitability, the Trustees noted that the estimated profitability for an individual Janus Henderson Fund is necessarily a product of the allocation methodology utilized by Janus Capital to allocate its expenses as part of the estimated profitability calculation. In this regard, the Trustees noted that the independent fee consultant concluded that (1) the expense allocation methodology utilized by Janus Capital was reasonable and (2) the estimated profitability to Janus Capital from the investment management services it provided to each Janus Henderson Fund was reasonable. The Trustees also considered that the estimated profitability for an individual Janus Henderson Fund was influenced by a number of factors, including not only the allocation methodology selected, but also the presence of fee waivers and expense caps, and whether the Janus Henderson Fund’s investment management agreement contained breakpoints or a performance fee component. The Trustees determined, after taking into account these factors, among others, that Janus Capital’s estimated profitability with respect to each Janus Henderson Fund was not unreasonable in relation to the services provided, and that the variation in the range of such estimated profitability among the Janus Henderson Funds was not a material factor in the Board’s approval of the reasonableness of any Janus Henderson Fund’s investment management fees.
The Trustees concluded that the management fees payable by each Janus Henderson Fund to Janus Capital, as well as the fees paid by Janus Capital to the subadvisers of subadvised Janus Henderson Funds, were reasonable in relation to the nature, extent, and quality of the services provided, taking into account the fees charged by other advisers for managing comparable mutual funds with similar strategies, the fees Janus Capital and the subadvisers charge to other clients, and, as applicable, the impact of fund performance on management fees payable by the Janus Henderson Funds. The Trustees also concluded that each Janus Henderson Fund’s total expenses were reasonable, taking into account the size of the Janus Henderson Fund, the quality of services provided by Janus Capital and any subadviser, the investment performance of the Janus Henderson Fund, and any expense limitations agreed to or provided by Janus Capital.
Economies of Scale
The Trustees considered information about the potential for Janus Capital to realize economies of scale as the assets of the Janus Henderson Funds increase. They noted the independent fee consultant’s analysis of economies of scale
Janus Henderson VIT Enterprise Portfolio
Additional Information (unaudited)
in prior years. They also noted that, although many Janus Henderson Funds pay advisory fees at a base fixed rate as a percentage of net assets, without any breakpoints or performance fees, the independent fee consultant concluded that 74% of these Janus Henderson Funds’ share classes have contractual management fees (gross of waivers) below their Broadridge Expense Group averages. They also noted that for those Janus Henderson Funds whose expenses are being reduced by contractual expense limitations with Janus Capital, Janus Capital is subsidizing certain of these Janus Henderson Funds because they have not reached adequate scale. Moreover, as the assets of some of the Janus Henderson Funds have declined in the past few years, certain Janus Henderson Funds have benefited from having advisory fee rates that have remained constant rather than increasing as assets declined. In addition, performance fee structures have been implemented for various Janus Henderson Funds that have caused the effective rate of advisory fees payable by such a Janus Henderson Fund to vary depending on the investment performance of the Janus Henderson Fund relative to its benchmark index over the measurement period; and a few Janus Henderson Funds have fee schedules with breakpoints and reduced fee rates above certain asset levels. The Trustees also noted that the Janus Henderson Funds share directly in economies of scale through the lower charges of third-party service providers that are based in part on the combined scale of all of the Janus Henderson Funds.
The Trustees also considered information provided by the independent fee consultant, which concluded that, given the limitations of various analytical approaches to economies of scale it had considered in prior years, and their conflicting results, it is difficult to analytically confirm or deny the existence of economies of scale in the Janus Henderson complex. The independent consultant further concluded that (1) to the extent there were economies of scale at Janus Capital, Janus Capital’s general strategy of setting fixed management fees below peers appeared to share any such economies with investors even on smaller Janus Henderson Funds which have not yet achieved those economies and (2) by setting lower fixed fees from the start on these Janus Henderson Funds, Janus Capital appeared to be investing to increase the likelihood that these Janus Henderson Funds will grow to a level to achieve any scale economies that may exist. Further, the independent fee consultant expressed the view that Janus Henderson Fund investors are well-served by the performance fee structures in place on the Janus Henderson Funds in light of any economies of scale that may be present at Janus Capital.
Based on all of the information they reviewed, including past research and analysis conducted by the Trustees’ independent fee consultant, the Trustees concluded that the current fee structure of each Janus Henderson Fund was reasonable and that the current rates of fees do reflect a sharing between Janus Capital and the Janus Henderson Fund of any economies of scale that may be present at the current asset level of the Janus Henderson Fund.
Other Benefits to Janus Capital
The Trustees also considered benefits that accrue to Janus Capital and its affiliates and subadvisers to the Janus Henderson Funds from their relationships with the Janus Henderson Funds. They recognized that two affiliates of Janus Capital separately serve the Janus Henderson Funds as transfer agent and distributor, respectively, and the transfer agent receives compensation directly from the non-money market funds for services provided, and that such compensation contributes to the overall profitability of Janus Capital and its affiliates that results from their relationship with the Janus Henderson Funds. The Trustees also considered Janus Capital’s and each subadviser’s past and proposed use of commissions paid by the Janus Henderson Funds on portfolio brokerage transactions to obtain proprietary and third-party research products and services benefiting the Janus Henderson Fund and/or other clients of Janus Capital and/or Janus Capital, and/or a subadviser to a Janus Henderson Fund. The Trustees concluded that Janus Capital’s and the subadvisers’ use of these types of client commission arrangements to obtain proprietary and third-party research products and services was likely to benefit each Janus Henderson Fund. The Trustees also concluded that, other than the services provided by Janus Capital and its affiliates and subadvisers pursuant to the agreements and the fees to be paid by each Janus Henderson Fund therefor, the Janus Henderson Funds and Janus Capital and the subadvisers may potentially benefit from their relationship with each other in other ways. They concluded that Janus Capital and its affiliates share directly in economies of scale through the lower charges of third-party service providers that are based in part on the combined scale of the Janus Henderson Funds and other clients serviced by Janus Capital and its affiliates. They also concluded that Janus Capital and/or the subadvisers benefit from the receipt of research products and services acquired through commissions paid on portfolio transactions of the Janus Henderson Funds and that the Janus Henderson Funds benefit from Janus Capital’s and/or the subadvisers’ receipt of those products and services as well as research products and services acquired through commissions paid by certain other clients of Janus Capital and/or other clients of the subadvisers. They further concluded that the success of any Janus Henderson Fund could attract other business to Janus Capital, the subadvisers or other Janus Henderson funds,
Janus Henderson VIT Enterprise Portfolio
Additional Information (unaudited)
and that the success of Janus Capital and the subadvisers could enhance Janus Capital’s and the subadvisers’ ability to serve the Janus Henderson Funds.
Janus Henderson VIT Enterprise Portfolio
Useful Information About Your Portfolio Report (unaudited)
Management Commentary
The Management Commentary in this report includes valuable insight as well as statistical information to help you understand how your Portfolio’s performance and characteristics stack up against those of comparable indices.
If the Portfolio invests in foreign securities, this report may include information about country exposure. Country exposure is based primarily on the country of risk. A company may be allocated to a country based on other factors such as location of the company’s principal office, the location of the principal trading market for the company’s securities, or the country where a majority of the company’s revenues are derived.
Please keep in mind that the opinions expressed in the Management Commentary are just that: opinions. They are a reflection based on best judgment at the time this report was compiled, which was December 31, 2018. As the investing environment changes, so could opinions. These views are unique and are not necessarily shared by fellow employees or by Janus Henderson in general.
Performance Overviews
Performance overview graphs compare the performance of a hypothetical $10,000 investment in the Portfolio with one or more widely used market indices. When comparing the performance of the Portfolio with an index, keep in mind that market indices are not available for investment and do not reflect deduction of expenses.
Average annual total returns are quoted for a Portfolio with more than one year of performance history. Average annual total return is calculated by taking the growth or decline in value of an investment over a period of time, including reinvestment of dividends and distributions, then calculating the annual compounded percentage rate that would have produced the same result had the rate of growth been constant throughout the period. Average annual total return does not reflect the deduction of taxes that a shareholder would pay on Portfolio distributions or redemptions of Portfolio shares.
Cumulative total returns are quoted for a Portfolio with less than one year of performance history. Cumulative total return is the growth or decline in value of an investment over time, independent of the period of time involved. Cumulative total return does not reflect the deduction of taxes that a shareholder would pay on Portfolio distributions or redemptions of Portfolio shares.
Pursuant to federal securities rules, expense ratios shown in the performance chart reflect subsidized (if applicable) and unsubsidized ratios. The total annual fund operating expenses ratio is gross of any fee waivers, reflecting the Portfolio’s unsubsidized expense ratio. The net annual fund operating expenses ratio (if applicable) includes contractual waivers of Janus Capital and reflects the Portfolio’s subsidized expense ratio. Ratios may be higher or lower than those shown in the “Financial Highlights” in this report.
Schedule of Investments
Following the performance overview section is the Portfolio’s Schedule of Investments. This schedule reports the types of securities held in the Portfolio on the last day of the reporting period. Securities are usually listed by type (common stock, corporate bonds, U.S. Government obligations, etc.) and by industry classification (banking, communications, insurance, etc.). Holdings are subject to change without notice.
The value of each security is quoted as of the last day of the reporting period. The value of securities denominated in foreign currencies is converted into U.S. dollars.
If the Portfolio invests in foreign securities, it will also provide a summary of investments by country. This summary reports the Portfolio exposure to different countries by providing the percentage of securities invested in each country. The country of each security represents the country of risk. The Portfolio’s Schedule of Investments relies upon the industry group and country classifications published by Barclays and/or MSCI Inc.
Tables listing details of individual forward currency contracts, futures, written options, swaptions, and swaps follow the Portfolio’s Schedule of Investments (if applicable).
Statement of Assets and Liabilities
This statement is often referred to as the “balance sheet.” It lists the assets and liabilities of the Portfolio on the last day of the reporting period.
Janus Henderson VIT Enterprise Portfolio
Useful Information About Your Portfolio Report (unaudited)
The Portfolio’s assets are calculated by adding the value of the securities owned, the receivable for securities sold but not yet settled, the receivable for dividends declared but not yet received on securities owned, and the receivable for Portfolio shares sold to investors but not yet settled. The Portfolio’s liabilities include payables for securities purchased but not yet settled, Portfolio shares redeemed but not yet paid, and expenses owed but not yet paid. Additionally, there may be other assets and liabilities such as unrealized gain or loss on forward currency contracts.
The section entitled “Net Assets Consist of” breaks down the components of the Portfolio’s net assets. Because the Portfolio must distribute substantially all earnings, you will notice that a significant portion of net assets is shareholder capital.
The last section of this statement reports the net asset value (“NAV”) per share on the last day of the reporting period. The NAV is calculated by dividing the Portfolio’s net assets for each share class (assets minus liabilities) by the number of shares outstanding.
Statement of Operations
This statement details the Portfolio’s income, expenses, realized gains and losses on securities and currency transactions, and changes in unrealized appreciation or depreciation of Portfolio holdings.
The first section in this statement, entitled “Investment Income,” reports the dividends earned from securities and interest earned from interest-bearing securities in the Portfolio.
The next section reports the expenses incurred by the Portfolio, including the advisory fee paid to the investment adviser, transfer agent fees and expenses, and printing and postage for mailing statements, financial reports and prospectuses. Expense offsets and expense reimbursements, if any, are also shown.
The last section lists the amounts of realized gains or losses from investment and foreign currency transactions, and changes in unrealized appreciation or depreciation of investments and foreign currency-denominated assets and liabilities. The Portfolio will realize a gain (or loss) when it sells its position in a particular security. A change in unrealized gain (or loss) refers to the change in net appreciation or depreciation of the Portfolio during the reporting period. “Net Realized and Unrealized Gain/(Loss) on Investments” is affected both by changes in the market value of Portfolio holdings and by gains (or losses) realized during the reporting period.
Statements of Changes in Net Assets
These statements report the increase or decrease in the Portfolio’s net assets during the reporting period. Changes in the Portfolio’s net assets are attributable to investment operations, dividends and distributions to investors, and capital share transactions. This is important to investors because it shows exactly what caused the Portfolio’s net asset size to change during the period.
The first section summarizes the information from the Statement of Operations regarding changes in net assets due to the Portfolio’s investment operations. The Portfolio’s net assets may also change as a result of dividend and capital gains distributions to investors. If investors receive their dividends and/or distributions in cash, money is taken out of the Portfolio to pay the dividend and/or distribution. If investors reinvest their dividends and/or distributions, the Portfolio’s net assets will not be affected. If you compare the Portfolio’s “Net Decrease from Dividends and Distributions” to “Reinvested Dividends and Distributions,” you will notice that dividends and distributions have little effect on the Portfolio’s net assets. This is because the majority of the Portfolio’s investors reinvest their dividends and/or distributions.
The reinvestment of dividends and distributions is included under “Capital Share Transactions.” “Capital Shares” refers to the money investors contribute to the Portfolio through purchases or withdrawals via redemptions. The Portfolio’s net assets will increase and decrease in value as investors purchase and redeem shares from the Portfolio.
Financial Highlights
This schedule provides a per-share breakdown of the components that affect the Portfolio’s NAV for current and past reporting periods as well as total return, asset size, ratios, and portfolio turnover rate.
The first line in the table reflects the NAV per share at the beginning of the reporting period. The next line reports the net investment income/(loss) per share. Following is the per share total of net gains/(losses), realized and unrealized. Per share dividends and distributions to investors are then subtracted to arrive at the NAV per share at the end of the
Janus Henderson VIT Enterprise Portfolio
Useful Information About Your Portfolio Report (unaudited)
period. The next line reflects the total return for the period. Also included are ratios of expenses and net investment income to average net assets.
The Portfolio’s expenses may be reduced through expense offsets and expense reimbursements. The ratios shown reflect expenses before and after any such offsets and reimbursements.
The ratio of net investment income/(loss) summarizes the income earned less expenses, divided by the average net assets of the Portfolio during the reporting period. Do not confuse this ratio with the Portfolio’s yield. The net investment income ratio is not a true measure of the Portfolio’s yield because it does not take into account the dividends distributed to the Portfolio’s investors.
The next figure is the portfolio turnover rate, which measures the buying and selling activity in the Portfolio. Portfolio turnover is affected by market conditions, changes in the asset size of the Portfolio, fluctuating volume of shareholder purchase and redemption orders, the nature of the Portfolio’s investments, and the investment style and/or outlook of the portfolio manager(s) and/or investment personnel. A 100% rate implies that an amount equal to the value of the entire portfolio was replaced once during the fiscal year; a 50% rate means that an amount equal to the value of half the portfolio is traded in a year; and a 200% rate means that an amount equal to the value of the entire portfolio is traded every six months.
Janus Henderson VIT Enterprise Portfolio
Designation Requirements (unaudited)
For federal income tax purposes, the Portfolio designated the following for the year ended December 31, 2018:
| | |
| | |
Capital Gain Distributions | $58,630,191 |
Dividends Received Deduction Percentage | 100% |
Janus Henderson VIT Enterprise Portfolio
Trustees and Officers (unaudited)
The Portfolio’s Statement of Additional Information includes additional information about the Trustees and officers and is available, without charge, by calling 1-877-335-2687.
The following are the Trustees and officers of the Trust, together with a brief description of their principal occupations during the last five years (principal occupations for certain Trustees may include periods over five years).
Each Trustee has served in that capacity since he or she was originally elected or appointed. The Trustees do not serve a specified term of office. Each Trustee will hold office until the termination of the Trust or his or her earlier death, resignation, retirement, incapacity, or removal. Under the Portfolio’s Governance Procedures and Guidelines, the policy is for Trustees to retire no later than the end of the calendar year in which the Trustee turns 75. The Trustees review the Portfolio’s Governance Procedures and Guidelines from time to time and may make changes they deem appropriate. The Portfolio’s Nominating and Governance Committee will consider nominees for the position of Trustee recommended by shareholders. Shareholders may submit the name of a candidate for consideration by the Committee by submitting their recommendations to the Trust’s Secretary. Each Trustee is currently a Trustee of one other registered investment company advised by Janus Capital: Janus Investment Fund. Collectively, these two registered investment companies consist of 60 series or funds.
The Trust’s officers are elected annually by the Trustees for a one-year term. Certain officers also serve as officers of Janus Investment Fund. Certain officers of the Portfolio may also be officers and/or directors of Janus Capital. Except as otherwise disclosed, Portfolio officers receive no compensation from the Portfolio, except for the Portfolio’s Chief Compliance Officer, as authorized by the Trustees.
Janus Henderson VIT Enterprise Portfolio
Trustees and Officers (unaudited)
| | | | | | |
TRUSTEES |
Name, Address, and Age | Positions Held with the Trust | Length of Time Served | Principal Occupations During the Past Five Years | Number of Portfolios/Funds in Fund Complex Overseen by Trustee | Other Directorships Held by Trustee During the Past Five Years |
Independent Trustees |
William F. McCalpin
151 Detroit Street
Denver, CO 80206
DOB: 1957 | Chairman
Trustee | 1/08-Present
6/02-Present | Managing Partner, Impact Investments, Athena Capital Advisors LLC (independent registered investment advisor) (since 2016). Formerly, Managing Director, Holos Consulting LLC (provides consulting services to foundations and other nonprofit organizations) (2009-2016), Chief Executive Officer, Imprint Capital Advisors (impact investment firm) (2013-2015) and Executive Vice President and Chief Operating Officer of The Rockefeller Brothers Fund (a private family foundation) (1998-2006). | 60 | Director of Mutual Fund Directors Forum (a non-profit organization serving independent directors of U.S. mutual funds), Chairman of the Board and Trustee of The Investment Fund for Foundations Investment Program (TIP) (consisting of 2 funds), and Director of the F.B. Heron Foundation (a private grantmaking foundation). |
Janus Henderson VIT Enterprise Portfolio
Trustees and Officers (unaudited)
| | | | | | |
TRUSTEES |
Name, Address, and Age | Positions Held with the Trust | Length of Time Served | Principal Occupations During the Past Five Years | Number of Portfolios/Funds in Fund Complex Overseen by Trustee | Other Directorships Held by Trustee During the Past Five Years |
Independent Trustees |
Alan A. Brown
151 Detroit Street
Denver, CO 80206
DOB: 1962 | Trustee | 1/13-Present | Principal, Principal Curam Holdings (since 2018). Formery, Executive Vice President, Institutional Markets, of Black Creek Group (private equity real estate investment management firm) (2012-2018), Executive Vice President and Co-Head, Global Private Client Group (2007-2010), Executive Vice President, Mutual Funds (2005-2007), and Chief Marketing Officer (2001-2005) of Nuveen Investments, Inc. (asset management). | 60 | Director of WTTW (PBS affiliate) (since 2003). Formerly, Director of MotiveQuest LLC (strategic social market research company) (2003-2016); Director of Nuveen Global Investors LLC (2007-2011); Director of Communities in Schools (2004-2010); and Director of Mutual Fund Education Alliance (until 2010). |
Janus Henderson VIT Enterprise Portfolio
Trustees and Officers (unaudited)
| | | | | | |
TRUSTEES |
Name, Address, and Age | Positions Held with the Trust | Length of Time Served | Principal Occupations During the Past Five Years | Number of Portfolios/Funds in Fund Complex Overseen by Trustee | Other Directorships Held by Trustee During the Past Five Years |
Independent Trustees |
William D. Cvengros
151 Detroit Street
Denver, CO 80206
DOB: 1948 | Trustee | 1/11-Present | Chief Executive Officer of SJC Capital, LLC (a personal investment company and consulting firm) (since 2002). Formerly, Venture Partner for The Edgewater Funds (a middle market private equity firm) (2002-2004); Chief Executive Officer and President of PIMCO Advisors Holdings L.P. (a publicly traded investment management firm) (1994-2000); and Chief Investment Officer (1987-1994) and Vice Chairman and Director (1990-1994) of Pacific Life Insurance Company (a mutual life insurance and annuity company) (1987-1994). | 60 | Advisory Board Member, Innovate Partners Emerging Growth and Equity Fund I (early stage venture capital fund) (since 2014). Formerly, Managing Trustee of National Retirement Partners Liquidating Trust (2013-2016); Chairman, National Retirement Partners, Inc. (formerly a network of advisors to 401(k) plans) (2005-2013); Director of Prospect Acquisition Corp. (a special purpose acquisition corporation) (2007-2009); Director of RemedyTemp, Inc. (temporary help services company) (1996-2006); and Trustee of PIMCO Funds Multi-Manager Series (1990-2000) and Pacific Life Variable Life & Annuity Trusts (1987-1994). |
Janus Henderson VIT Enterprise Portfolio
Trustees and Officers (unaudited)
| | | | | | |
TRUSTEES |
Name, Address, and Age | Positions Held with the Trust | Length of Time Served | Principal Occupations During the Past Five Years | Number of Portfolios/Funds in Fund Complex Overseen by Trustee | Other Directorships Held by Trustee During the Past Five Years |
Independent Trustees |
Raudline Etienne
151 Detroit Street
Denver, CO 80206
DOB: 1965 | Trustee | 6/16-Present | Founder, Daraja Capital (advisory and investment firm) (since 2016), and Senior Advisor, Albright Stonebridge Group LLC (global strategy firm) (since 2016). Formerly, Senior Vice President (2011-2015), Albright Stonebridge Group LLC; and Deputy Comptroller and Chief Investment Officer, New York State Common Retirement Fund (public pension fund) (2008-2011). | 60 | Director of Brightwood Capital Advisors, LLC (since 2014). |
Janus Henderson VIT Enterprise Portfolio
Trustees and Officers (unaudited)
| | | | | | |
TRUSTEES |
Name, Address, and Age | Positions Held with the Trust | Length of Time Served | Principal Occupations During the Past Five Years | Number of Portfolios/Funds in Fund Complex Overseen by Trustee | Other Directorships Held by Trustee During the Past Five Years |
Independent Trustees |
Gary A. Poliner 151 Detroit Street Denver, CO 80206
DOB: 1953 | Trustee | 6/16-Present | Retired. Formerly, President (2010-2013) of Northwestern Mutual Life Insurance Company. | 60 | Director of MGIC Investment Corporation (private mortgage insurance) (since 2013) and West Bend Mutual Insurance Company (property/casualty insurance) (since 2013). Formerly, Trustee of Northwestern Mutual Life Insurance Company (2010-2013); and Director of Frank Russell Company (global asset management firm) (2008-2013). |
Janus Henderson VIT Enterprise Portfolio
Trustees and Officers (unaudited)
| | | | | | |
TRUSTEES |
Name, Address, and Age | Positions Held with the Trust | Length of Time Served | Principal Occupations During the Past Five Years | Number of Portfolios/Funds in Fund Complex Overseen by Trustee | Other Directorships Held by Trustee During the Past Five Years |
Independent Trustees |
James T. Rothe*
151 Detroit Street
Denver, CO 80206
DOB: 1943 | Trustee | 1/97-Present | Professor Emeritus of Business of the University of Colorado, Colorado Springs, CO (since 2004). Formerly, Co-founder and Managing Director of Roaring Fork Capital SBIC, L.P. (SBA SBIC fund focusing on private investment in public equity firms) (2004-2014), Professor of Business of the University of Colorado (2002-2004), and Distinguished Visiting Professor of Business (2001-2002) of Thunderbird (American Graduate School of International Management), Glendale, AZ. | 60 | Formerly, Director of Red Robin Gourmet Burgers, Inc. (RRGB) (2004-2014). |
*James T. Rothe retired from his role as Independent Trustee, effective December 31, 2018. | |
Janus Henderson VIT Enterprise Portfolio
Trustees and Officers (unaudited)
| | | | | | |
TRUSTEES |
Name, Address, and Age | Positions Held with the Trust | Length of Time Served | Principal Occupations During the Past Five Years | Number of Portfolios/Funds in Fund Complex Overseen by Trustee | Other Directorships Held by Trustee During the Past Five Years |
Independent Trustees |
William D. Stewart
151 Detroit Street
Denver, CO 80206
DOB: 1944 | Trustee | 6/84-Present | Retired. Formerly, President and founder of HPS Products and Corporate Vice President of MKS Instruments, Boulder, CO (a provider of advanced process control systems for the semiconductor industry) (1976-2012). | 60 | None |
Diane L. Wallace
151 Detroit Street
Denver, CO 80206
DOB: 1958 | Trustee | 6/17-Present | Retired. | 60 | Formerly, Independent Trustee, Henderson Global Funds (13 portfolios) (2015-2017); Independent Trustee, State Farm Associates' Funds Trust, State Farm Mutual Fund Trust, and State Farm Variable Product Trust (28 portfolios) (2013-2017); Chief Operating Officer, Senior Vice President-Operations, and Chief Financial Officer for Driehaus Capital Management, LLC (1988-2006); and Treasurer for Driehaus Mutual Funds (1996-2002). |
Janus Henderson VIT Enterprise Portfolio
Trustees and Officers (unaudited)
| | | | | | |
TRUSTEES |
Name, Address, and Age | Positions Held with the Trust | Length of Time Served | Principal Occupations During the Past Five Years | Number of Portfolios/Funds in Fund Complex Overseen by Trustee | Other Directorships Held by Trustee During the Past Five Years |
Independent Trustees |
Linda S. Wolf
151 Detroit Street
Denver, CO 80206
DOB: 1947 | Trustee | 11/05-Present | Retired. Formerly, Chairman and Chief Executive Officer of Leo Burnett (Worldwide) (advertising agency) (2001-2005). | 60 | Director of Chicago Community Trust (Regional Community Foundation), Chicago Council on Global Affairs, InnerWorkings (U.S. provider of print procurement solutions to corporate clients), Lurie Children’s Hospital (Chicago, IL), Shirley Ryan Ability Lab and Wrapports, LLC (digital communications company). Formerly, Director of Walmart (until 2017), Director of Chicago Convention & Tourism Bureau (until 2014) and The Field Museum of Natural History (Chicago, IL) (until 2014). |
Janus Henderson VIT Enterprise Portfolio
Trustees and Officers (unaudited)
| | | | |
OFFICERS |
Name, Address, and Age | Positions Held with the Trust | Term of Office* and Length of Time Served | Principal Occupations During the Past Five Years |
Brian Demain
151 Detroit Street
Denver, CO 80206
DOB: 1977 | Executive Vice President and Co-Portfolio Manager Janus Henderson Enterprise Portfolio | 11/07-Present | Portfolio Manager for other Janus Henderson accounts. |
Cody Wheaton
151 Detroit Street
Denver, CO 80206
DOB: 1978 | Executive Vice President and Co-Portfolio Manager
Janus Henderson Enterprise Portfolio | 7/16-Present | Portfolio Manager for other Janus
Henderson accounts and Analyst for Janus Capital. |
Bruce L. Koepfgen
151 Detroit Street
Denver, CO 80206
DOB: 1952 | President and Chief Executive Officer | 7/14-Present | Head of North America at Janus Henderson Investors and Janus Capital Management LLC (since 2017); Executive Vice President and Director of Janus International Holding LLC (since 2011); Executive Vice President of Janus Distributors LLC (since 2011); Vice President and Director of INTECH Investment Management LLC (since 2011); Executive Vice President and Director of Perkins Investment Management LLC (since 2011); and Executive Vice President and Director of Janus Management Holdings Corporation (since 2011). Formerly, President of Janus Capital Group Inc. and Janus Capital Management LLC (2013-2017); Executive Vice President of Janus Services LLC (2011-2015), Janus Capital Group Inc. and Janus Capital Management LLC (2011-2013); and Chief Financial Officer of Janus Capital Group Inc., Janus Capital Management LLC, Janus Distributors LLC, Janus Management Holdings Corporation, and Janus Services LLC (2011-2013). |
* Officers are elected at least annually by the Trustees for a one-year term and may also be elected from time to time by the Trustees for an interim period. |
Janus Henderson VIT Enterprise Portfolio
Trustees and Officers (unaudited)
| | | | |
OFFICERS |
Name, Address, and Age | Positions Held with the Trust | Term of Office* and Length of Time Served | Principal Occupations During the Past Five Years |
Susan K. Wold
151 Detroit Street
Denver, CO 80206
DOB: 1960 | Vice President, Chief Compliance Officer, and Anti-Money Laundering Officer | 9/17-Present | Senior Vice President and Head of Compliance, North America for Janus Henderson (since September 2017); Formerly, Vice President, Head of Global Corporate Compliance, and Chief Compliance Officer for Janus Capital Management LLC (May 2017-September 2017); Vice President, Compliance at Janus Capital Group Inc. and Janus Capital Management LLC (2005-2017). |
Jesper Nergaard
151 Detroit Street
Denver, CO 80206
DOB: 1962 | Chief Financial Officer
Vice President, Treasurer, and Principal Accounting Officer | 3/05-Present
2/05-Present | Vice President of Janus Capital and Janus Services LLC. |
Kathryn L. Santoro
151 Detroit Street
Denver, CO 80206
DOB: 1974 | Vice President, Chief Legal Counsel, and Secretary | 12/16-Present | Vice President of Janus Capital and Janus Services LLC (since 2016). Formerly, Vice President and Associate Counsel of Curian Capital, LLC and Curian Clearing LLC (2013-2016); and General Counsel and Secretary (2011-2012) and Vice President (2009-2012) of Old Mutual Capital, Inc. |
* Officers are elected at least annually by the Trustees for a one-year term and may also be elected from time to time by the Trustees for an interim period. |
Janus Henderson VIT Enterprise Portfolio
Notes
NotesPage1
Knowledge. Shared
At Janus Henderson, we believe in the sharing of expert insight for better investment and business decisions. We call this ethos Knowledge. Shared.
Learn more by visiting janushenderson.com.
| | | | | | | | | |
| | | | | |

| | | | |
This report is submitted for the general information of shareholders of the Portfolio. It is not an offer or solicitation for the Portfolio and is not authorized for distribution to prospective investors unless preceded or accompanied by an effective prospectus. |
Janus Henderson, Janus, Henderson, Perkins, Intech and Knowledge. Shared are trademarks of Janus Henderson Group plc or one of its subsidiaries. © Janus Henderson Group plc. Janus Henderson Distributors |
| | | | | 109-02-81116 02-19 |
| | | | | | |
| | | |
| | | ANNUAL REPORT December 31, 2018 |
| | |
| | Janus Henderson VIT Flexible Bond Portfolio |
| | |
| | Janus Aspen Series |
Beginning on January 1, 2021, as permitted by regulations adopted by the Securities and Exchange Commission, the insurance company that offers your variable life insurance contract or variable annuity contract, may determine that it will no longer send you paper copies of the Portfolio’s shareholder reports, unless you specifically request paper copies of the reports. Beginning on January 1, 2021, for shareholders who are not insurance contract holders, paper copies of the Portfolio’s shareholder reports will no longer be sent by mail unless you specifically request paper copies of the reports. Instead, the reports will be made available on a website, and your insurance company or plan sponsor, broker-dealer, or financial intermediary will notify you by mail each time a report is posted and provide you with a website link to access the report. Instructions for requesting paper copies will be provided by your insurance company or plan sponsor, broker-dealer, or financial intermediary. If you already elected to receive shareholder reports electronically, you will not be affected by this change and you need not take any action. You may elect to receive shareholder reports and other communications from the Portfolio electronically by contacting your insurance company or plan sponsor, broker-dealer, or other financial intermediary. You may elect to receive all future reports in paper free of charge by contacting your insurance company or plan sponsor, broker dealer or other financial intermediary. Your election to receive reports in paper will apply to all funds held in your account with your insurance company or plan sponsor, broker dealer or other financial intermediary. |
| | | HIGHLIGHTS · Portfolio management perspective · Investment strategy behind your portfolio · Portfolio performance, characteristics
and holdings |
| | | |
| | | 
|
Table of Contents
Janus Henderson VIT Flexible Bond Portfolio
| | |
Management Commentary and Schedule of Investments | 1 |
Notes to Schedule of Investments and Other Information | 18 |
Statement of Assets and Liabilities | 20 |
Statement of Operations | 21 |
Statements of Changes in Net Assets | 22 |
Financial Highlights | 23 |
Notes to Financial Statements | 24 |
Report of Independent Registered Public Accounting Firm | 36 |
Additional Information | 37 |
Useful Information About Your Portfolio Report | 44 |
Trustees and Officers | 47 |
Janus Henderson VIT Flexible Bond Portfolio (unaudited)
| | | | | | |
PORTFOLIO SNAPSHOT This dynamic core bond portfolio leverages a bottom-up, fundamentally driven investment process designed to generate risk-adjusted outperformance and capital preservation. Throughout its history, the portfolio has utilized an active and flexible approach to manage across a variety of market and rate cycles. | | | 
Michael Keough co-portfolio manager | 
Mayur Saigal co-portfolio manager | 
Darrell Watters co-portfolio manager |
| | | |
PERFORMANCE OVERVIEW
During the 12-month period ended December 31, 2018, Janus Henderson VIT Flexible Bond Portfolio’s Institutional Shares and Service Shares returned -1.00% and -1.29%, respectively, compared with 0.01% for the Portfolio’s benchmark, the Bloomberg Barclays U.S. Aggregate Bond Index.
INVESTMENT ENVIRONMENT
The Bloomberg Barclays U.S. Aggregate Bond Index was roughly flat for the period. A steady U.S. economic backdrop coupled with the emergence of rising wages caused many to fear that inflation would run ahead of Federal Reserve (Fed) expectations. The prospect of higher interest rates pushed yields on U.S. Treasuries higher for much of the year. That reversed in the autumn when escalating trade tensions and fears of slowing global economic growth led to a rally in government bonds. Fed rhetoric added to market volatility as it created concern over the possibility that the central bank might maintain its hiking cadence even amid economic and market weakness. Risk assets came under significant pressure, despite generally healthy corporate earnings. After reaching the tightest levels of this credit cycle earlier in the year, spreads (the difference in yield between a security and its underlying risk-free benchmark) on corporate credit widened back in line with long-term averages. Investment-grade corporate spreads widened 60 basis points (one basis point equals 1/100 of a percentage point). High yield fared worse, widening 183 basis points, due in part to a late-period plunge in oil prices.
The Treasury curve generally flattened, and despite the late-period rally in rates, yields ultimately rose across the curve. Shorter-dated yields rose on Fed actions – the central bank raised its benchmark rate four times in 2018. Longer-dated yields sold off less dramatically as investors ultimately expressed their view that inflationary pressures remain benign while the potential for Fed policy error and an economic slowdown grows. After reaching a high of 3.24%, the yield on the 10-year Treasury note finished December at 2.68%, up from 2.41% one year ago.
PERFORMANCE DISCUSSION
For the year ending December 31, 2018, the Fund underperformed the Bloomberg Barclays U.S. Aggregate Bond Index.
Tightening financial conditions, diminished liquidity and credit rating downgrades of a few large investment-grade complexes helped to confirm our view that we are progressing through the later stages of the credit cycle. Given our late-cycle concerns and the darkening macroeconomic picture, we sought to lower the Portfolio’s risk exposure. While we found liquidity to be challenged at times (particularly late in the period) we did reduce our corporate bond allocation by 17%, ending the period around 30% of the Fund. In our effort to achieve a more defensive posture, we added nearly 12% to our Treasury allocation and extended duration (a measure of sensitivity to changes in interest rates) to 100% of the index.
Our positioning in Treasuries drove underperformance. Although we added to Treasuries considerably toward the end of the year, our general underweight as well as our yield curve positioning weighed on results. Investors flocked to more defensive assets such as Treasuries on multiple occasions.
Despite our efforts to reduce risk, our out-of-index allocation to high-yield corporate credit also contributed to underperformance. We seek higher-quality, high-yield names, with consistent free-cash-flow generation potential and management teams committed to paying down debt, but even those names were challenged amid the dramatic spread widening in the asset class.
An out-of-index position in Freeport-McMoRan was the leading corporate credit detractor from relative returns. A drawn-out dispute surrounding its Grasberg mine in Indonesia weighed on the copper miner earlier in the
Janus Henderson VIT Flexible Bond Portfolio (unaudited)
period. Later, balance sheet improvement progress was overshadowed by fears of a slowdown in China coupled with trade war uncertainty, given that China consumes a significant portion of the world’s copper. We appreciate the value of Freeport’s assets, and ultimately expect the miner to benefit from limited supply and growing demand for copper, particularly as the electrification of vehicles accelerates. We also expect management to continue paying down debt, which we believe will eventually drive investment-grade ratings.
Positioning in mortgage-backed securities (MBS) contributed to the sleeve’s relative performance. The asset class was one of the strongest-performing fixed income segments, given its limited credit risk and strong liquidity profile. We reduced investment-grade corporate credit throughout the year, which also proved beneficial amid the general spread widening. Security selection, including our positioning in Anheuser-Busch, further aided results. We exited our position early in the year, as we grew uncomfortable with weakening fundamentals and the fact that its debt pay-down progress is happening at a slower-than-expected pace. We were out of the name well ahead of the dramatic spread widening that followed Moody’s downgrade of the company’s credit rating in the fourth quarter.
OUTLOOK
There are plenty of risk factors on the horizon, including slowing global economic growth, unresolved trade disputes, the potential for Fed policy error and the continued progression of the credit cycle. As a result, we expect market volatility to persist. We anticipate market liquidity will also remain challenged as the Fed continues to drain liquidity from the system.
We will be closely monitoring U.S. economic data, particularly inflation figures, as well as Fed rhetoric. This will be pivotal in assessing the likelihood of the Fed hiking in excess of what is warranted and potentially accelerating a U.S. slowdown, versus it pausing in 2019. We are mindful of wage pressures and an uptick in oil prices near period end, as well as the importance of the U.S. dollar. Continued dollar weakness could create inflationary pressures and threaten the Fed’s ability to pause. However, our base case is that the Fed will be more cautious in its cadence throughout 2019. As we approach the end of the Fed’s hiking cycle, we will continue to review our floating rate allocation. And, as always, we will employ a tactical approach to yield curve positioning with a focus on capital preservation.
While the U.S. economic and corporate fundamental outlooks are slowing, they remain stable. We are monitoring the impact of Fed policy for insight into whether we are going through another modest slowdown in this extended cycle or if recession probabilities are increasing for 2020. High debt loads and diminishing liquidity create headwinds for the outlook. Tighter financial conditions and escalated market volatility could also negatively impact business confidence and capital investment trends in 2019. Despite recent spread widening, overall levels have only repriced to longer-term averages, which we generally do not believe offer just compensation for the stated risk factors and the likely increase in defaults and downgrades to come. Our outlook is cautious and we intend to be deliberate in our corporate credit positioning, emphasizing our highest-conviction names with consistent free-cash-flow generation potential, strong management teams and a commitment to paying down debt. Thorough vetting of opportunities, coupled with security avoidance remains critical as we strive to deliver on our core tenets of capital preservation and strong risk-adjusted returns.
Thank you for your investment in the Janus Henderson VIT Flexible Bond Portfolio.
Janus Henderson VIT Flexible Bond Portfolio (unaudited)
Portfolio At A Glance
December 31, 2018
| | | |
Fund Profile | | |
30-day Current Yield* | Without
Reimbursement | With
Reimbursement |
Institutional Shares | 2.76% | 2.76% |
Service Shares | 2.51% | 2.51% |
Weighted Average Maturity | 9.1 |
Average Effective Duration** | 5.8 |
* Yield will fluctuate. | | |
** A theoretical measure of price volatility. | |
| | |
Ratings† Summary - (% of Total Investments) | |
AAA | 1.4% |
AA | 52.7% |
A | 5.2% |
BBB | 21.4% |
BB | 7.9% |
B | 1.5% |
Not Rated | 9.3% |
Other | 0.6% |
† Credit ratings provided by Standard & Poor's (S&P), an independent credit rating agency. Credit ratings range from AAA (highest) to D (lowest) based on S&P's measures. Further information on S&P's rating methodology may be found at www.standardandpoors.com. Other rating agencies may rate the same securities differently. Ratings are relative and subjective and are not absolute standards of quality. Credit quality does not remove market risk and is subject to change. "Not Rated" securities are not rated by S&P, but may be rated by other rating agencies and do not necessarily indicate low quality. "Other" includes cash equivalents, equity securities, and certain derivative instruments. |
Significant Areas of Investment - (% of Net Assets)

| | | | | | |
Asset Allocation - (% of Net Assets) |
Corporate Bonds | | 30.1% |
United States Treasury Notes/Bonds | | 27.4% |
Mortgage-Backed Securities | | 24.1% |
Asset-Backed/Commercial Mortgage-Backed Securities | | 13.5% |
Bank Loans and Mezzanine Loans | | 3.7% |
Investment Companies | | 0.5% |
Other | | 0.7% |
| | | 100.0% |
Janus Henderson VIT Flexible Bond Portfolio (unaudited)
Performance
| |
See important disclosures on the next page. |
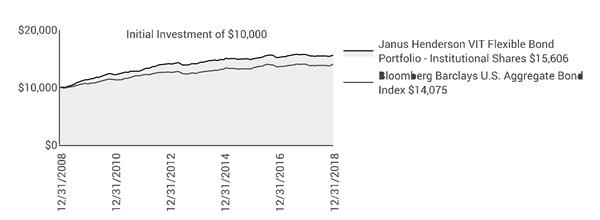
| | | | | | | | | | |
| | | | | | | | | |
| | | | | | | | | | Expense Ratios - |
Average Annual Total Return - for the periods ended December 31, 2018 | | | per the April 30, 2018 prospectuses |
| | One
Year | Five
Year | Ten
Year | Since
Inception* | | | Total Annual Fund
Operating Expenses |
Institutional Shares | | -1.00% | 2.02% | 4.55% | 6.03% | | | 0.60% |
Service Shares | | -1.29% | 1.76% | 4.29% | 5.80% | | | 0.85% |
Bloomberg Barclays U.S. Aggregate Bond Index | | 0.01% | 2.52% | 3.48% | 5.01% | | | |
Morningstar Quartile - Institutional Shares | | 3rd | 3rd | 2nd | 1st | | | |
Morningstar Ranking - based on total returns for Intermediate-Term Bond Funds | | 714/1,046 | 624/909 | 360/802 | 7/377 | | | |
Returns quoted are past performance and do not guarantee future results; current performance may be lower or higher. Investment returns and principal value will vary; there may be a gain or loss when shares are sold. For the most recent month-end performance call 800.668.0434 or visit janushenderson.com/VITperformance.
Performance may be affected by risks that include those associated with non-diversification, portfolio turnover, short sales, potential conflicts of interest, foreign and emerging markets, initial public offerings (IPOs), high-yield and high-risk securities, undervalued, overlooked and smaller capitalization companies, real estate related securities including Real Estate Investment Trusts (REITs), derivatives, and commodity-linked investments. Each product has different risks. Please see the prospectus for more information about risks, holdings and other details.
The Portfolio will normally invest at least 80% of its net assets, measured at the time of purchase, in the type of securities described by its name.
Returns do not reflect the deduction of fees, charges or expenses of any insurance product. If applied, returns would have been lower.
Returns include reinvestment of all dividends and distributions and do not reflect the deduction of taxes that a shareholder would pay on Portfolio distributions or redemptions of Portfolio shares. The returns do not include adjustments in accordance with generally accepted accounting principles required at the period end for financial reporting purposes.
See Financial Highlights for actual expense ratios during the reporting period.
Performance for Service Shares prior to December 31, 1999 reflects the performance of Institutional Shares, adjusted to reflect the expenses of Service Shares.
Ranking is for the share class shown only; other classes may have different performance characteristics. When an expense waiver is in effect, it may have a material effect on the total return, and therefore the ranking for the period.
Janus Henderson VIT Flexible Bond Portfolio (unaudited)
Performance
© 2018 Morningstar, Inc. All Rights Reserved.
There is no assurance that the investment process will consistently lead to successful investing.
See Notes to Schedule of Investments and Other Information for index definitions.
Index performance does not reflect the expenses of managing a portfolio as an index is unmanaged and not available for direct investment.
See “Useful Information About Your Portfolio Report.”
*The Portfolio’s inception date – September 13, 1993
Janus Henderson VIT Flexible Bond Portfolio (unaudited)
Expense Examples
As a shareholder of the Portfolio, you incur two types of costs: (1) transaction costs and (2) ongoing costs, including management fees; 12b-1 distribution and shareholder servicing fees (applicable to Service Shares only); transfer agent fees and expenses payable pursuant to the Transfer Agency Agreement; and other Portfolio expenses. This example is intended to help you understand your ongoing costs (in dollars) of investing in the Portfolio and to compare these costs with the ongoing costs of investing in other mutual funds. To do so, compare this 5% hypothetical example with the 5% hypothetical examples that appear in the shareholder reports of the other funds. The example is based upon an investment of $1,000 invested at the beginning of the period and held for the six-months indicated, unless noted otherwise in the table and footnotes below.
Actual Expenses
The information in the table under the heading “Actual” provides information about actual account values and actual expenses. You may use the information in these columns, together with the amount you invested, to estimate the expenses that you paid over the period. Simply divide your account value by $1,000 (for example, an $8,600 account value divided by $1,000 = 8.6), then multiply the result by the number in the appropriate column for your share class under the heading entitled “Expenses Paid During Period” to estimate the expenses you paid on your account during the period.
Hypothetical Example for Comparison Purposes
The information in the table under the heading “Hypothetical (5% return before expenses)” provides information about hypothetical account values and hypothetical expenses based upon the Portfolio’s actual expense ratio and an assumed rate of return of 5% per year before expenses, which is not the Portfolio’s actual return. The hypothetical account values and expenses may not be used to estimate the actual ending account balance or expenses you paid for the period. You may use this information to compare the ongoing costs of investing in the Portfolio and other funds. To do so, compare this 5% hypothetical example with the 5% hypothetical examples that appear in the shareholder reports of the other funds. Additionally, for an analysis of the fees associated with an investment in either share class or other similar funds, please visit www.finra.org/fundanalyzer.
Please note that the expenses shown in the table are meant to highlight your ongoing costs only and do not reflect any transaction costs, such as any charges at the separate account level or contract level. These fees are fully described in the Portfolio’s prospectuses. Therefore, the hypothetical examples are useful in comparing ongoing costs only, and will not help you determine the relative total costs of owning different funds. In addition, if these transaction costs were included, your costs would have been higher.
| | | | | | | | | | | |
| | | | | | | | | |
| | | | Actual | | Hypothetical
(5% return before expenses) | |
| Beginning
Account
Value
(7/1/18) | Ending
Account
Value
(12/31/18) | Expenses
Paid During
Period
(7/1/18 - 12/31/18)† | | Beginning
Account
Value
(7/1/18) | Ending
Account
Value
(12/31/18) | Expenses
Paid During
Period
(7/1/18 - 12/31/18)† | Net Annualized
Expense Ratio
(7/1/18 - 12/31/18) |
Institutional Shares | $1,000.00 | $1,007.00 | $3.14 | | $1,000.00 | $1,022.08 | $3.16 | 0.62% |
Service Shares | $1,000.00 | $1,005.50 | $4.40 | | $1,000.00 | $1,020.82 | $4.43 | 0.87% |
† | Expenses Paid During Period are equal to the Net Annualized Expense Ratio multiplied by the average account value over the period, multiplied by 184/365 (to reflect the one-half year period). Expenses in the examples include the effect of applicable fee waivers and/or expense reimbursements, if any. Had such waivers and/or reimbursements not been in effect, your expenses would have been higher. Please refer to the Notes to Financial Statements or the Portfolio’s prospectuses for more information regarding waivers and/or reimbursements. |
Janus Henderson VIT Flexible Bond Portfolio
Schedule of Investments
December 31, 2018
| | | | | | | | |
Shares or
Principal Amounts | | | Value | |
Asset-Backed/Commercial Mortgage-Backed Securities – 13.5% | | | |
| | AmeriCredit Automobile Receivables 2016-1, 3.5900%, 2/8/22 | | $1,379,000 | | | $1,385,532 | |
| | Angel Oak Mortgage Trust I LLC 2018-2, 3.6740%, 7/27/48 (144A)‡ | | 360,966 | | | 359,804 | |
| | Applebee's Funding LLC / IHOP Funding LLC, 4.2770%, 9/5/44 (144A) | | 3,314,050 | | | 3,305,645 | |
| | Arroyo Mortgage Trust 2018-1, 3.7630%, 4/25/48 (144A)‡ | | 562,300 | | | 560,986 | |
| | Atrium IX, ICE LIBOR USD 3 Month + 1.2400%, 3.9468%, 5/28/30 (144A)‡ | | 944,700 | | | 938,261 | |
| | BAMLL Commercial Mortgage Securities Trust 2013-WBRK, | | | | | | |
| | 3.5343%, 3/10/37 (144A)‡ | | 1,238,000 | | | 1,216,290 | |
| | BAMLL Commercial Mortgage Securities Trust 2018-DSNY, | | | | | | |
| | ICE LIBOR USD 1 Month + 0.8500%, 3.3051%, 9/15/34 (144A)‡ | | 1,413,000 | | | 1,405,982 | |
| | BBCMS 2018-TALL Mortgage Trust, | | | | | | |
| | ICE LIBOR USD 1 Month + 0.7220%, 3.1771%, 3/15/37 (144A)‡ | | 5,083,000 | | | 4,993,539 | |
| | BBCMS Trust 2015-SRCH, 4.1970%, 8/10/35 (144A) | | 1,447,000 | | | 1,465,255 | |
| | Bean Creek CLO Ltd, | | | | | | |
| | ICE LIBOR USD 3 Month + 1.0200%, 3.4890%, 4/20/31 (144A)‡ | | 1,321,000 | | | 1,288,439 | |
| | BHMS 2018-ATLS, ICE LIBOR USD 1 Month + 1.2500%, 3.7051%, 7/15/35 (144A)‡ | | 1,286,000 | | | 1,279,642 | |
| | BX Commercial Mortgage Trust 2018-IND, | | | | | | |
| | ICE LIBOR USD 1 Month + 0.7500%, 3.2051%, 11/15/33 (144A)‡ | | 2,300,567 | | | 2,286,186 | |
| | BXP Trust 2017-GM, 3.3790%, 6/13/39 (144A) | | 696,000 | | | 679,675 | |
| | Caesars Palace Las Vegas Trust 2017-VICI C, 4.1384%, 10/15/34 (144A) | | 859,000 | | | 863,102 | |
| | Caesars Palace Las Vegas Trust 2017-VICI D, 4.3540%, 10/15/34 (144A)‡ | | 980,000 | | | 980,988 | |
| | Caesars Palace Las Vegas Trust 2017-VICI E, 4.3540%, 10/15/34 (144A)‡ | | 1,334,000 | | | 1,303,293 | |
| | Carlyle Global Market Strategies CLO 2014-2R Ltd, | | | | | | |
| | ICE LIBOR USD 3 Month + 1.0500%, 3.6661%, 5/15/31 (144A)‡ | | 1,027,615 | | | 1,006,255 | |
| | Carlyle Global Market Strategies CLO 2016-1 Ltd, | | | | | | |
| | ICE LIBOR USD 3 Month + 1.4500%, 3.9190%, 4/20/27 (144A)‡ | | 869,000 | | | 856,087 | |
| | Carlyle Global Market Strategies CLO 2016-2 Ltd, | | | | | | |
| | ICE LIBOR USD 3 Month + 1.5000%, 3.9363%, 7/15/27 (144A)‡ | | 547,000 | | | 538,742 | |
| | Carlyle US CLO 2018-1 Ltd, | | | | | | |
| | ICE LIBOR USD 3 Month + 1.0200%, 3.4890%, 4/20/31 (144A)‡ | | 1,161,000 | | | 1,135,261 | |
| | Cenovus Energy Inc, 5.7000%, 10/15/19 | | 15,000 | | | 15,269 | |
| | CIFC Funding 2013-IV Ltd, | | | | | | |
| | ICE LIBOR USD 3 Month + 1.0600%, 3.5693%, 4/27/31 (144A)‡ | | 773,726 | | | 756,249 | |
| | CIFC Funding 2018-I Ltd, | | | | | | |
| | ICE LIBOR USD 3 Month + 1.0000%, 3.4446%, 4/18/31 (144A)‡ | | 941,000 | | | 916,766 | |
| | CIFC Funding 2018-II Ltd, | | | | | | |
| | ICE LIBOR USD 3 Month + 1.0400%, 3.5090%, 4/20/31 (144A)‡ | | 1,572,000 | | | 1,534,656 | |
| | Credit Acceptance Auto Loan Trust 2018-2, 3.9400%, 7/15/27 (144A) | | 563,000 | | | 568,394 | |
| | Credit Acceptance Auto Loan Trust 2018-2, 4.1600%, 9/15/27 (144A) | | 250,000 | | | 253,572 | |
| | CSMLT 2015-2 Trust, 3.5000%, 8/25/45 (144A)‡ | | 680,929 | | | 674,858 | |
| | Drive Auto Receivables Trust 2017-1, 3.8400%, 3/15/23 | | 142,000 | | | 142,512 | |
| | Drive Auto Receivables Trust 2017-1, 5.1700%, 9/16/24 | | 1,590,000 | | | 1,623,648 | |
| | Drive Auto Receivables Trust 2017-2, 5.2700%, 11/15/24 | | 1,400,000 | | | 1,437,048 | |
| | Drive Auto Receivables Trust 2017-A, 4.1600%, 5/15/24 (144A) | | 822,000 | | | 831,278 | |
| | Dryden 41 Senior Loan Fund, | | | | | | |
| | ICE LIBOR USD 3 Month + 0.9700%, 3.4063%, 4/15/31 (144A)‡ | | 1,292,000 | | | 1,260,104 | |
| | Dryden 55 CLO Ltd, | | | | | | |
| | ICE LIBOR USD 3 Month + 1.0200%, 3.4563%, 4/15/31 (144A)‡ | | 771,000 | | | 754,279 | |
| | Dryden 64 CLO Ltd, | | | | | | |
| | ICE LIBOR USD 3 Month + 0.9700%, 3.4146%, 4/18/31 (144A)‡ | | 1,913,000 | | | 1,865,780 | |
| | Exeter Automobile Receivables Trust 2018-2, 3.6900%, 3/15/23 (144A) | | 640,000 | | | 642,230 | |
| | Fannie Mae Connecticut Avenue Securities, | | | | | | |
| | ICE LIBOR USD 1 Month + 2.6000%, 5.1063%, 5/25/24‡ | | 648,816 | | | 679,716 | |
| | Fannie Mae Connecticut Avenue Securities, | | | | | | |
| | ICE LIBOR USD 1 Month + 3.0000%, 5.5063%, 7/25/24‡ | | 2,739,922 | | | 2,880,816 | |
| | Fannie Mae Connecticut Avenue Securities, | | | | | | |
| | ICE LIBOR USD 1 Month + 4.0000%, 6.5063%, 5/25/25‡ | | 514,956 | | | 551,525 | |
| | Fannie Mae REMICS, 3.0000%, 5/25/48 | | 1,895,830 | | | 1,864,287 | |
| | Flatiron CLO 18 Ltd, | | | | | | |
| | ICE LIBOR USD 3 Month + 0.9500%, 3.4174%, 4/17/31 (144A)‡ | | 1,022,000 | | | 993,412 | |
| | |
See Notes to Schedule of Investments and Other Information and Notes to Financial Statements. |
| |
Janus Aspen Series | 7 |
Janus Henderson VIT Flexible Bond Portfolio
Schedule of Investments
December 31, 2018
| | | | | | | | |
Shares or
Principal Amounts | | | Value | |
Asset-Backed/Commercial Mortgage-Backed Securities – (continued) | | | |
| | Freddie Mac Structured Agency Credit Risk Debt Notes, | | | | | | |
| | ICE LIBOR USD 1 Month + 4.5000%, 7.0063%, 2/25/24‡ | | $1,874,798 | | | $2,102,016 | |
| | Freddie Mac Structured Agency Credit Risk Debt Notes, | | | | | | |
| | ICE LIBOR USD 1 Month + 3.6000%, 6.1063%, 4/25/24‡ | | 892,319 | | | 962,127 | |
| | J.P. Morgan Chase Commercial Mortgage Securities Trust 2016-WIKI, | | | | | | |
| | 3.5537%, 10/5/31 (144A) | | 282,000 | | | 277,227 | |
| | J.P. Morgan Chase Commercial Mortgage Securities Trust 2016-WIKI, | | | | | | |
| | 4.0090%, 10/5/31 (144A)‡ | | 433,000 | | | 424,231 | |
| | JP Morgan Chase Commercial Mortgage Securities Trust 2015-UES, | | | | | | |
| | 3.6210%, 9/5/32 (144A)‡ | | 848,000 | | | 830,419 | |
| | JP Morgan Mortgage Trust 2018-8, 4.0000%, 1/25/49 (144A)‡ | | 383,567 | | | 379,715 | |
| | LCM XIV LP, ICE LIBOR USD 3 Month + 1.0400%, 3.5090%, 7/20/31 (144A)‡ | | 537,053 | | | 525,493 | |
| | LCM XVIII LP, ICE LIBOR USD 3 Month + 1.0200%, 3.4890%, 4/20/31 (144A)‡ | | 1,128,000 | | | 1,103,651 | |
| | loanDepot Station Place Agency Securitization Trust 2017-1, | | | | | | |
| | ICE LIBOR USD 1 Month + 0.8000%, 3.3063%, 11/25/50 (144A)‡,§ | | 2,069,000 | | | 2,062,712 | |
| | loanDepot Station Place Agency Securitization Trust 2017-1, | | | | | | |
| | ICE LIBOR USD 1 Month + 1.0000%, 3.5063%, 11/25/50 (144A)‡,§ | | 414,000 | | | 412,932 | |
| | Magnetite VIII Ltd, | | | | | | |
| | ICE LIBOR USD 3 Month + 0.9800%, 3.4163%, 4/15/31 (144A)‡ | | 960,000 | | | 945,623 | |
| | Magnetite XV Ltd, ICE LIBOR USD 3 Month + 1.0100%, 3.4999%, 7/25/31 (144A)‡ | | 1,260,941 | | | 1,231,238 | |
| | Mello Warehouse Securitization Trust 2018-1, | | | | | | |
| | ICE LIBOR USD 1 Month + 0.8500%, 3.3563%, 11/25/51 (144A)‡ | | 2,658,000 | | | 2,657,224 | |
| | New Residential Mortgage Loan Trust 2018-2, 4.5000%, 2/25/58 (144A)‡ | | 656,180 | | | 668,721 | |
| | Octagon Investment Partners 36 Ltd, | | | | | | |
| | ICE LIBOR USD 3 Month + 0.9700%, 3.4063%, 4/15/31 (144A)‡ | | 953,000 | | | 927,381 | |
| | Octagon Loan Funding Ltd, | | | | | | |
| | ICE LIBOR USD 3 Month + 1.1800%, 3.8200%, 11/18/31 (144A)‡ | | 1,754,000 | | | 1,733,115 | |
| | OneMain Direct Auto Receivables Trust 2018-1, 3.8500%, 10/14/25 (144A) | | 254,000 | | | 257,781 | |
| | OneMain Direct Auto Receivables Trust 2018-1, 4.4000%, 1/14/28 (144A) | | 252,000 | | | 257,175 | |
| | Santander Drive Auto Receivables Trust 2016-3, 4.2900%, 2/15/24 | | 1,868,000 | | | 1,890,425 | |
| | Santander Drive Auto Receivables Trust 2018-1, 4.3700%, 5/15/25 (144A) | | 2,500,000 | | | 2,480,154 | |
| | Sequoia Mortgage Trust 2018-7 A19, 4.0000%, 9/25/48 (144A)‡ | | 388,487 | | | 389,133 | |
| | Sequoia Mortgage Trust 2018-7 A4, 4.0000%, 9/25/48 (144A)‡ | | 494,274 | | | 499,314 | |
| | Sequoia Mortgage Trust 2018-CH2, 4.0000%, 6/25/48 (144A)‡ | | 1,452,950 | | | 1,463,824 | |
| | Sequoia Mortgage Trust 2018-CH3, 4.0000%, 8/25/48 (144A)‡ | | 689,427 | | | 694,975 | |
| | Sounds Point CLO IV-R LTD, | | | | | | |
| | ICE LIBOR USD 3 Month + 1.1500%, 3.5946%, 4/18/31 (144A)‡ | | 1,269,000 | | | 1,252,347 | |
| | Starwood Retail Property Trust 2014-STAR, | | | | | | |
| | ICE LIBOR USD 1 Month + 4.1500%, 6.6051%, 11/15/27 (144A)‡ | | 114,045 | | | 85,920 | |
| | Station Place Securitization Trust 2018-7, | | | | | | |
| | ICE LIBOR USD 1 Month + 0.8500%, 3.1651%, 9/24/19 (144A)‡ | | 2,541,000 | | | 2,541,000 | |
| | Towd Point Mortgage Trust 2015-3, 3.5000%, 3/25/54 (144A)‡ | | 39,439 | | | 39,235 | |
| | Towd Point Mortgage Trust 2018-3, 3.7500%, 5/25/58 (144A)‡ | | 538,260 | | | 537,710 | |
| | Towd Point Mortgage Trust 2018-4, 3.0000%, 6/25/58 (144A)‡ | | 876,703 | | | 851,970 | |
| | Voya CLO 2015-2 Ltd, | | | | | | |
| | ICE LIBOR USD 3 Month + 1.5000%, 3.9772%, 7/23/27 (144A)‡ | | 250,000 | | | 245,798 | |
| | Voya CLO 2018-1 Ltd, | | | | | | |
| | ICE LIBOR USD 3 Month + 0.9500%, 3.2926%, 4/19/31 (144A)‡ | | 1,376,000 | | | 1,354,830 | |
| | Voya CLO 2018-2 Ltd, | | | | | | |
| | ICE LIBOR USD 3 Month + 1.0000%, 3.3740%, 7/15/31 (144A)‡ | | 1,466,311 | | | 1,428,027 | |
| | Wachovia Bank Commercial Mortgage Trust Series 2007-C34, 6.1412%, 5/15/46‡ | | 291,084 | | | 292,806 | |
| | Wells Fargo Mortgage Backed Securities 2018-1, 3.5000%, 7/25/47 (144A)‡ | | 288,465 | | | 281,246 | |
| | Westlake Automobile Receivables Trust 2018-1, 3.4100%, 5/15/23 (144A) | | 113,000 | | | 112,198 | |
| | WinWater Mortgage Loan Trust 2015-5, 3.5000%, 8/20/45 (144A)‡ | | 2,056,962 | | | 2,045,971 | |
Total Asset-Backed/Commercial Mortgage-Backed Securities (cost $85,160,036) | | 84,341,027 | |
Bank Loans and Mezzanine Loans – 3.7% | | | |
Basic Industry – 0.3% | | | |
| | Axalta Coating Systems US Holdings Inc, | | | | | | |
| | ICE LIBOR USD 3 Month + 1.7500%, 4.5530%, 6/1/24‡ | | 2,254,680 | | | 2,119,399 | |
| | |
See Notes to Schedule of Investments and Other Information and Notes to Financial Statements. |
| |
8 | DECEMBER 31, 2018 |
Janus Henderson VIT Flexible Bond Portfolio
Schedule of Investments
December 31, 2018
| | | | | | | | |
Shares or
Principal Amounts | | | Value | |
Bank Loans and Mezzanine Loans – (continued) | | | |
Capital Goods – 0.3% | | | |
| | HD Supply Inc, ICE LIBOR USD 3 Month + 1.7500%, 0%, 10/17/23(a),‡ | | $827,000 | | | $791,853 | |
| | Reynolds Group Holdings Inc, | | | | | | |
| | ICE LIBOR USD 3 Month + 2.7500%, 5.2724%, 2/5/23‡ | | 1,141,351 | | | 1,084,283 | |
| | | 1,876,136 | |
Communications – 0.3% | | | |
| | Mission Broadcasting Inc, ICE LIBOR USD 3 Month + 2.2500%, 0%, 1/17/24(a),‡ | | 154,802 | | | 146,211 | |
| | Nexstar Broadcasting Inc, ICE LIBOR USD 3 Month + 2.2500%, 0%, 1/17/24(a),‡ | | 967,708 | | | 914,001 | |
| | Zayo Group LLC, ICE LIBOR USD 3 Month + 2.0000%, 4.5224%, 1/19/21‡ | | 139,515 | | | 135,592 | |
| | Zayo Group LLC, ICE LIBOR USD 3 Month + 2.2500%, 4.7724%, 1/19/24‡ | | 921,372 | | | 880,242 | |
| | | 2,076,046 | |
Consumer Cyclical – 1.0% | | | |
| | Golden Nugget LLC, ICE LIBOR USD 3 Month + 2.7500%, 5.2365%, 10/4/23‡ | | 1,425,351 | | | 1,373,896 | |
| | Hilton Worldwide Finance LLC, | | | | | | |
| | ICE LIBOR USD 3 Month + 1.7500%, 4.2563%, 10/25/23‡ | | 2,770,740 | | | 2,666,838 | |
| | KFC Holding Co, ICE LIBOR USD 3 Month + 1.7500%, 4.2196%, 4/3/25‡ | | 2,199,188 | | | 2,142,845 | |
| | | 6,183,579 | |
Consumer Non-Cyclical – 1.1% | | | |
| | Aramark Services Inc, ICE LIBOR USD 3 Month + 1.7500%, 4.2724%, 3/28/24‡ | | 977,240 | | | 945,177 | |
| | Gentiva Health Services Inc, | | | | | | |
| | ICE LIBOR USD 3 Month + 3.7500%, 6.3125%, 7/2/25‡ | | 2,674,265 | | | 2,587,351 | |
| | IQVIA Inc, ICE LIBOR USD 3 Month + 2.0000%, 4.8030%, 3/7/24‡ | | 346,647 | | | 335,641 | |
| | Moffett Towers Phase II, | | | | | | |
| | ICE LIBOR USD 3 Month + 2.8000%, 5.2560%, 6/15/21‡,§ | | 2,691,467 | | | 2,675,480 | |
| | Valeant Pharmaceuticals International, | | | | | | |
| | ICE LIBOR USD 3 Month + 3.0000%, 5.3789%, 6/2/25‡ | | 71,225 | | | 67,882 | |
| | | 6,611,531 | |
Electric – 0.6% | | | |
| | NRG Energy Inc, ICE LIBOR USD 3 Month + 1.7500%, 4.2724%, 6/30/23‡ | | 1,545,720 | | | 1,485,868 | |
| | Vistra Operations Co LLC, ICE LIBOR USD 3 Month + 2.0000%, 4.5224%, 8/4/23‡ | | 2,660,181 | | | 2,558,934 | |
| | | 4,044,802 | |
Technology – 0.1% | | | |
| | CommScope Inc, ICE LIBOR USD 3 Month + 2.0000%, 4.5224%, 12/29/22‡ | | 465,159 | | | 439,575 | |
Total Bank Loans and Mezzanine Loans (cost $24,247,208) | | 23,351,068 | |
Corporate Bonds – 30.1% | | | |
Banking – 3.2% | | | |
| | Bank of America Corp, 2.5030%, 10/21/22 | | 4,410,000 | | | 4,245,847 | |
| | Citibank NA, ICE LIBOR USD 3 Month + 0.3200%, 2.8610%, 5/1/20‡ | | 4,791,000 | | | 4,774,431 | |
| | Citizens Financial Group Inc, 3.7500%, 7/1/24 | | 613,000 | | | 596,792 | |
| | Citizens Financial Group Inc, 4.3500%, 8/1/25 | | 427,000 | | | 419,451 | |
| | Citizens Financial Group Inc, 4.3000%, 12/3/25 | | 2,161,000 | | | 2,133,668 | |
| | Goldman Sachs Capital I, 6.3450%, 2/15/34 | | 2,366,000 | | | 2,642,988 | |
| | JPMorgan Chase & Co, 2.2950%, 8/15/21 | | 2,144,000 | | | 2,091,690 | |
| | JPMorgan Chase Bank NA, ICE LIBOR USD 3 Month + 0.3400%, 2.8480%, 4/26/21‡ | | 1,964,000 | | | 1,945,785 | |
| | SVB Financial Group, 5.3750%, 9/15/20 | | 1,360,000 | | | 1,402,650 | |
| | | 20,253,302 | |
Basic Industry – 3.0% | | | |
| | Allegheny Technologies Inc, 5.9500%, 1/15/21 | | 2,062,000 | | | 2,020,760 | |
| | Anglo American Capital PLC, 4.1250%, 9/27/22 (144A) | | 312,000 | | | 307,479 | |
| | CF Industries Inc, 4.5000%, 12/1/26 (144A) | | 665,000 | | | 650,249 | |
| | CF Industries Inc, 5.3750%, 3/15/44 | | 766,000 | | | 620,460 | |
| | Freeport-McMoRan Inc, 3.1000%, 3/15/20 | | 590,000 | | | 576,725 | |
| | Freeport-McMoRan Inc, 3.5500%, 3/1/22 | | 1,106,000 | | | 1,046,552 | |
| | Freeport-McMoRan Inc, 3.8750%, 3/15/23 | | 1,745,000 | | | 1,614,125 | |
| | Freeport-McMoRan Inc, 4.5500%, 11/14/24 | | 1,535,000 | | | 1,416,037 | |
| | Freeport-McMoRan Inc, 5.4500%, 3/15/43 | | 1,505,000 | | | 1,145,681 | |
| | Georgia-Pacific LLC, 3.1630%, 11/15/21 (144A) | | 2,870,000 | | | 2,843,942 | |
| | Georgia-Pacific LLC, 3.6000%, 3/1/25 (144A) | | 1,106,000 | | | 1,103,879 | |
| | |
See Notes to Schedule of Investments and Other Information and Notes to Financial Statements. |
| |
Janus Aspen Series | 9 |
Janus Henderson VIT Flexible Bond Portfolio
Schedule of Investments
December 31, 2018
| | | | | | | | |
Shares or
Principal Amounts | | | Value | |
Corporate Bonds – (continued) | | | |
Basic Industry – (continued) | | | |
| | Novelis Corp, 6.2500%, 8/15/24 (144A) | | $780,000 | | | $733,200 | |
| | Reliance Steel & Aluminum Co, 4.5000%, 4/15/23 | | 1,564,000 | | | 1,580,287 | |
| | Steel Dynamics Inc, 4.1250%, 9/15/25 | | 1,493,000 | | | 1,371,694 | |
| | Teck Resources Ltd, 8.5000%, 6/1/24 (144A) | | 1,400,000 | | | 1,499,750 | |
| | | 18,530,820 | |
Brokerage – 1.8% | | | |
| | Cboe Global Markets Inc, 3.6500%, 1/12/27 | | 1,805,000 | | | 1,757,702 | |
| | Charles Schwab Corp, ICE LIBOR USD 3 Month + 0.3200%, 2.9658%, 5/21/21‡ | | 951,000 | | | 947,027 | |
| | Charles Schwab Corp, 3.2500%, 5/21/21 | | 523,000 | | | 525,533 | |
| | E*TRADE Financial Corp, 2.9500%, 8/24/22 | | 1,801,000 | | | 1,747,157 | |
| | E*TRADE Financial Corp, 3.8000%, 8/24/27 | | 2,265,000 | | | 2,139,587 | |
| | E*TRADE Financial Corp, 4.5000%, 6/20/28 | | 614,000 | | | 605,415 | |
| | Raymond James Financial Inc, 5.6250%, 4/1/24 | | 841,000 | | | 909,387 | |
| | Raymond James Financial Inc, 3.6250%, 9/15/26 | | 787,000 | | | 742,035 | |
| | Raymond James Financial Inc, 4.9500%, 7/15/46 | | 1,675,000 | | | 1,611,353 | |
| | | 10,985,196 | |
Capital Goods – 1.6% | | | |
| | Ardagh Packaging Finance PLC / Ardagh Holdings USA Inc, | | | | | | |
| | 4.2500%, 9/15/22 (144A) | | 268,000 | | | 255,270 | |
| | Ball Corp, 4.3750%, 12/15/20 | | 1,174,000 | | | 1,178,402 | |
| | Eagle Materials Inc, 4.5000%, 8/1/26 | | 132,000 | | | 131,123 | |
| | Huntington Ingalls Industries Inc, 5.0000%, 11/15/25 (144A) | | 2,760,000 | | | 2,804,022 | |
| | Martin Marietta Materials Inc, 4.2500%, 7/2/24 | | 811,000 | | | 820,738 | |
| | Masonite International Corp, 5.6250%, 3/15/23 (144A) | | 473,000 | | | 458,810 | |
| | Northrop Grumman Corp, 2.5500%, 10/15/22 | | 1,920,000 | | | 1,859,621 | |
| | Owens Corning, 4.2000%, 12/1/24 | | 651,000 | | | 645,773 | |
| | United Technologies Corp, 3.9500%, 8/16/25 | | 720,000 | | | 714,747 | |
| | Vulcan Materials Co, 4.5000%, 4/1/25 | | 139,000 | | | 138,137 | |
| | Wabtec Corp, 4.1500%, 3/15/24 | | 411,000 | | | 397,141 | |
| | Wabtec Corp, 4.7000%, 9/15/28 | | 810,000 | | | 760,118 | |
| | | 10,163,902 | |
Communications – 3.4% | | | |
| | AT&T Inc, 4.7500%, 5/15/46 | | 1,086,000 | | | 966,563 | |
| | BellSouth LLC, 4.3330%, 4/26/19 (144A) | | 3,393,000 | | | 3,403,654 | |
| | CCO Holdings LLC / CCO Holdings Capital Corp, 5.2500%, 3/15/21 | | 1,318,000 | | | 1,318,824 | |
| | Comcast Corp, 3.1500%, 3/1/26 | | 735,000 | | | 703,607 | |
| | Comcast Corp, 4.2500%, 10/15/30 | | 984,000 | | | 995,833 | |
| | Comcast Corp, 4.6000%, 10/15/38 | | 800,000 | | | 808,734 | |
| | Comcast Corp, 4.9500%, 10/15/58 | | 824,000 | | | 839,013 | |
| | Crown Castle International Corp, 5.2500%, 1/15/23 | | 1,177,000 | | | 1,222,159 | |
| | Crown Castle International Corp, 3.2000%, 9/1/24 | | 1,096,000 | | | 1,037,307 | |
| | T-Mobile USA Inc, 6.3750%, 3/1/25 | | 1,332,000 | | | 1,348,597 | |
| | UBM PLC, 5.7500%, 11/3/20 (144A) | | 1,726,000 | | | 1,767,309 | |
| | Unitymedia GmbH, 6.1250%, 1/15/25 (144A) | | 1,371,000 | | | 1,377,718 | |
| | Verizon Communications Inc, 2.6250%, 8/15/26 | | 1,982,000 | | | 1,797,896 | |
| | Verizon Communications Inc, 4.3290%, 9/21/28 | | 1,202,000 | | | 1,207,684 | |
| | Viacom Inc, 5.8500%, 9/1/43 | | 1,551,000 | | | 1,517,673 | |
| | Warner Media LLC, 3.6000%, 7/15/25 | | 1,055,000 | | | 999,662 | |
| | | 21,312,233 | |
Consumer Cyclical – 2.4% | | | |
| | DR Horton Inc, 3.7500%, 3/1/19 | | 1,051,000 | | | 1,050,913 | |
| | DR Horton Inc, 4.0000%, 2/15/20 | | 251,000 | | | 251,444 | |
| | Ford Motor Co, 4.3460%, 12/8/26 | | 984,000 | | | 878,360 | |
| | Ford Motor Credit Co LLC, 4.6870%, 6/9/25 | | 983,000 | | | 912,059 | |
| | Ford Motor Credit Co LLC, 4.3890%, 1/8/26 | | 212,000 | | | 191,207 | |
| | General Motors Co, 5.0000%, 10/1/28 | | 1,242,000 | | | 1,177,515 | |
| | General Motors Financial Co Inc, 3.1000%, 1/15/19 | | 162,000 | | | 161,994 | |
| | General Motors Financial Co Inc, 4.3500%, 1/17/27 | | 598,000 | | | 550,706 | |
| | IHS Markit Ltd, 4.7500%, 2/15/25 (144A) | | 1,507,000 | | | 1,482,511 | |
| | |
See Notes to Schedule of Investments and Other Information and Notes to Financial Statements. |
| |
10 | DECEMBER 31, 2018 |
Janus Henderson VIT Flexible Bond Portfolio
Schedule of Investments
December 31, 2018
| | | | | | | | |
Shares or
Principal Amounts | | | Value | |
Corporate Bonds – (continued) | | | |
Consumer Cyclical – (continued) | | | |
| | IHS Markit Ltd, 4.0000%, 3/1/26 (144A) | | $1,081,000 | | | $1,005,330 | |
| | MDC Holdings Inc, 5.5000%, 1/15/24 | | 1,101,000 | | | 1,056,960 | |
| | MGM Growth Properties Operating Partnership LP / MGP Finance Co-Issuer Inc, | | | | | | |
| | 5.6250%, 5/1/24 | | 911,000 | | | 901,890 | |
| | MGM Resorts International, 6.7500%, 10/1/20 | | 1,869,000 | | | 1,920,397 | |
| | MGM Resorts International, 6.6250%, 12/15/21 | | 783,000 | | | 802,575 | |
| | MGM Resorts International, 7.7500%, 3/15/22 | | 281,000 | | | 298,914 | |
| | MGM Resorts International, 6.0000%, 3/15/23 | | 141,000 | | | 141,705 | |
| | Service Corp International/US, 5.3750%, 5/15/24 | | 882,000 | | | 873,180 | |
| | Toll Brothers Finance Corp, 5.8750%, 2/15/22 | | 418,000 | | | 420,090 | |
| | Toll Brothers Finance Corp, 4.3750%, 4/15/23 | | 286,000 | | | 268,125 | |
| | Wyndham Destinations Inc, 5.4000%, 4/1/24 | | 512,000 | | | 487,680 | |
| | ZF North America Capital Inc, 4.5000%, 4/29/22 (144A) | | 288,000 | | | 281,310 | |
| | | 15,114,865 | |
Consumer Non-Cyclical – 2.8% | | | |
| | Becton Dickinson and Co, 2.8940%, 6/6/22 | | 908,000 | | | 879,374 | |
| | Campbell Soup Co, 3.9500%, 3/15/25 | | 797,000 | | | 763,890 | |
| | Campbell Soup Co, 4.1500%, 3/15/28 | | 1,224,000 | | | 1,140,201 | |
| | Campbell Soup Co, 4.8000%, 3/15/48 | | 2,810,000 | | | 2,383,027 | |
| | CVS Health Corp, 4.7500%, 12/1/22 | | 759,000 | | | 783,073 | |
| | CVS Health Corp, 4.1000%, 3/25/25 | | 2,020,000 | | | 2,002,272 | |
| | CVS Health Corp, 4.3000%, 3/25/28 | | 1,098,000 | | | 1,075,148 | |
| | CVS Health Corp, 5.0500%, 3/25/48 | | 953,000 | | | 928,129 | |
| | Elanco Animal Health Inc, 3.9120%, 8/27/21 (144A) | | 244,000 | | | 245,508 | |
| | Elanco Animal Health Inc, 4.2720%, 8/28/23 (144A) | | 621,000 | | | 620,436 | |
| | Elanco Animal Health Inc, 4.9000%, 8/28/28 (144A) | | 579,000 | | | 589,522 | |
| | HCA Inc, 5.6250%, 9/1/28 | | 874,000 | | | 843,410 | |
| | IHS Markit Ltd, 5.0000%, 11/1/22 (144A) | | 1,034,000 | | | 1,044,340 | |
| | Life Technologies Corp, 6.0000%, 3/1/20 | | 1,195,000 | | | 1,228,303 | |
| | Newell Brands Inc, 5.0000%, 11/15/23 | | 938,000 | | | 954,356 | |
| | Teva Pharmaceutical Finance Co BV, 2.9500%, 12/18/22 | | 167,000 | | | 147,680 | |
| | Teva Pharmaceutical Finance Netherlands III BV, 2.8000%, 7/21/23 | | 945,000 | | | 813,826 | |
| | Wm Wrigley Jr Co, 3.3750%, 10/21/20 (144A) | | 1,222,000 | | | 1,225,204 | |
| | | 17,667,699 | |
Electric – 0.8% | | | |
| | Duke Energy Corp, 2.4000%, 8/15/22 | | 813,000 | | | 781,034 | |
| | NextEra Energy Operating Partners LP, 4.2500%, 9/15/24 (144A) | | 261,000 | | | 241,425 | |
| | NRG Energy Inc, 7.2500%, 5/15/26 | | 1,530,000 | | | 1,593,112 | |
| | PPL WEM Ltd / Western Power Distribution Ltd, 5.3750%, 5/1/21 (144A) | | 1,336,000 | | | 1,379,463 | |
| | Southern Co, 2.9500%, 7/1/23 | | 1,222,000 | | | 1,180,601 | |
| | | 5,175,635 | |
Energy – 4.0% | | | |
| | Cheniere Corpus Christi Holdings LLC, 5.1250%, 6/30/27 | | 1,136,000 | | | 1,072,441 | |
| | Cheniere Energy Partners LP, 5.6250%, 10/1/26 (144A) | | 1,616,000 | | | 1,510,960 | |
| | Continental Resources Inc/OK, 5.0000%, 9/15/22 | | 2,091,000 | | | 2,076,060 | |
| | Continental Resources Inc/OK, 4.5000%, 4/15/23 | | 1,754,000 | | | 1,726,147 | |
| | DCP Midstream Operating LP, 4.7500%, 9/30/21 (144A) | | 267,000 | | | 263,663 | |
| | Enbridge Energy Partners LP, 5.8750%, 10/15/25 | | 508,000 | | | 550,620 | |
| | Energy Transfer LP, 4.2500%, 3/15/23 | | 943,000 | | | 907,638 | |
| | Energy Transfer LP, 5.8750%, 1/15/24 | | 1,015,000 | | | 1,036,193 | |
| | Energy Transfer LP, 5.5000%, 6/1/27 | | 106,000 | | | 103,350 | |
| | Energy Transfer Operating LP, 4.9500%, 6/15/28 | | 548,000 | | | 537,248 | |
| | Energy Transfer Operating LP, 6.1250%, 12/15/45 | | 403,000 | | | 394,573 | |
| | Energy Transfer Operating LP, 6.0000%, 6/15/48 | | 1,882,000 | | | 1,834,914 | |
| | EnLink Midstream Partners LP, 4.1500%, 6/1/25 | | 1,527,000 | | | 1,377,238 | |
| | EnLink Midstream Partners LP, 4.8500%, 7/15/26 | | 1,934,000 | | | 1,744,854 | |
| | EQM Midstream Partners LP, 4.7500%, 7/15/23 | | 134,000 | | | 133,372 | |
| | EQM Midstream Partners LP, 4.0000%, 8/1/24 | | 458,000 | | | 438,176 | |
| | EQT Midstream Partners LP, 5.5000%, 7/15/28 | | 1,966,000 | | | 1,926,601 | |
| | |
See Notes to Schedule of Investments and Other Information and Notes to Financial Statements. |
| |
Janus Aspen Series | 11 |
Janus Henderson VIT Flexible Bond Portfolio
Schedule of Investments
December 31, 2018
| | | | | | | | |
Shares or
Principal Amounts | | | Value | |
Corporate Bonds – (continued) | | | |
Energy – (continued) | | | |
| | Kinder Morgan Energy Partners LP, 5.0000%, 10/1/21 | | $728,000 | | | $748,501 | |
| | Kinder Morgan Inc/DE, 6.5000%, 9/15/20 | | 84,000 | | | 87,986 | |
| | Kinder Morgan Inc/DE, 4.3000%, 3/1/28 | | 134,000 | | | 131,554 | |
| | Kinder Morgan Inc/DE, 5.5500%, 6/1/45 | | 376,000 | | | 372,831 | |
| | Kinder Morgan Inc/DE, 5.2000%, 3/1/48 | | 250,000 | | | 239,274 | |
| | Motiva Enterprises LLC, 5.7500%, 1/15/20 (144A) | | 214,000 | | | 217,727 | |
| | NGPL PipeCo LLC, 4.3750%, 8/15/22 (144A) | | 1,356,000 | | | 1,328,880 | |
| | NGPL PipeCo LLC, 4.8750%, 8/15/27 (144A) | | 608,000 | | | 573,040 | |
| | NuStar Logistics LP, 5.6250%, 4/28/27 | | 1,029,000 | | | 959,542 | |
| | Plains All American Pipeline LP / PAA Finance Corp, 4.6500%, 10/15/25 | | 1,928,000 | | | 1,896,930 | |
| | Plains All American Pipeline LP / PAA Finance Corp, 4.5000%, 12/15/26 | | 533,000 | | | 513,650 | |
| | | 24,703,963 | |
Financial Institutions – 0.6% | | | |
| | Jones Lang LaSalle Inc, 4.4000%, 11/15/22 | | 2,121,000 | | | 2,142,399 | |
| | Kennedy-Wilson Inc, 5.8750%, 4/1/24 | | 1,702,000 | | | 1,591,370 | |
| | | 3,733,769 | |
Insurance – 1.1% | | | |
| | Aetna Inc, 2.8000%, 6/15/23 | | 804,000 | | | 764,563 | |
| | Centene Corp, 4.7500%, 5/15/22 | | 124,000 | | | 122,450 | |
| | Centene Corp, 6.1250%, 2/15/24 | | 1,068,000 | | | 1,093,365 | |
| | Centene Corp, 4.7500%, 1/15/25 | | 1,226,000 | | | 1,170,830 | |
| | Cigna Corp, 3.4000%, 9/17/21 (144A) | | 250,000 | | | 249,421 | |
| | Cigna Corp, 3.7500%, 7/15/23 (144A) | | 1,019,000 | | | 1,015,544 | |
| | Cigna Corp, 4.3750%, 10/15/28 (144A) | | 478,000 | | | 480,959 | |
| | WellCare Health Plans Inc, 5.2500%, 4/1/25 | | 1,083,000 | | | 1,042,387 | |
| | WellCare Health Plans Inc, 5.3750%, 8/15/26 (144A) | | 697,000 | | | 672,605 | |
| | | 6,612,124 | |
Natural Gas – 0.2% | | | |
| | Sempra Energy, ICE LIBOR USD 3 Month + 0.5000%, 2.9363%, 1/15/21‡ | | 1,335,000 | | | 1,312,580 | |
Owned No Guarantee – 0.3% | | | |
| | Syngenta Finance NV, 3.6980%, 4/24/20 (144A) | | 636,000 | | | 631,304 | |
| | Syngenta Finance NV, 3.9330%, 4/23/21 (144A) | | 607,000 | | | 598,684 | |
| | Syngenta Finance NV, 4.4410%, 4/24/23 (144A) | | 200,000 | | | 192,734 | |
| | Syngenta Finance NV, 4.8920%, 4/24/25 (144A) | | 271,000 | | | 256,351 | |
| | | 1,679,073 | |
Real Estate Investment Trusts (REITs) – 0.9% | | | |
| | Alexandria Real Estate Equities Inc, 2.7500%, 1/15/20 | | 439,000 | | | 435,521 | |
| | Alexandria Real Estate Equities Inc, 4.6000%, 4/1/22 | | 2,162,000 | | | 2,225,577 | |
| | Reckson Operating Partnership LP, 7.7500%, 3/15/20 | | 1,681,000 | | | 1,758,779 | |
| | Senior Housing Properties Trust, 6.7500%, 4/15/20 | | 456,000 | | | 462,816 | |
| | Senior Housing Properties Trust, 6.7500%, 12/15/21 | | 533,000 | | | 558,480 | |
| | | 5,441,173 | |
Technology – 4.0% | | | |
| | Broadcom Corp / Broadcom Cayman Finance Ltd, 3.1250%, 1/15/25 | | 1,305,000 | | | 1,178,599 | |
| | Cadence Design Systems Inc, 4.3750%, 10/15/24 | | 2,887,000 | | | 2,912,391 | |
| | Dell International LLC / EMC Corp, 6.0200%, 6/15/26 (144A) | | 2,449,000 | | | 2,461,187 | |
| | Fidelity National Information Services Inc, 3.6250%, 10/15/20 | | 508,000 | | | 510,218 | |
| | Fidelity National Information Services Inc, 4.5000%, 10/15/22 | | 601,000 | | | 618,975 | |
| | Marvell Technology Group Ltd, 4.2000%, 6/22/23 | | 619,000 | | | 617,170 | |
| | Marvell Technology Group Ltd, 4.8750%, 6/22/28 | | 700,000 | | | 682,411 | |
| | Total System Services Inc, 3.8000%, 4/1/21 | | 963,000 | | | 962,774 | |
| | Total System Services Inc, 4.8000%, 4/1/26 | | 2,691,000 | | | 2,713,188 | |
| | Trimble Inc, 4.7500%, 12/1/24 | | 3,448,000 | | | 3,476,248 | |
| | Trimble Inc, 4.9000%, 6/15/28 | | 3,385,000 | | | 3,334,903 | |
| | Verisk Analytics Inc, 4.8750%, 1/15/19 | | 901,000 | | | 901,314 | |
| | Verisk Analytics Inc, 5.8000%, 5/1/21 | | 2,506,000 | | | 2,634,346 | |
| | Verisk Analytics Inc, 4.1250%, 9/12/22 | | 1,053,000 | | | 1,066,635 | |
| | |
See Notes to Schedule of Investments and Other Information and Notes to Financial Statements. |
| |
12 | DECEMBER 31, 2018 |
Janus Henderson VIT Flexible Bond Portfolio
Schedule of Investments
December 31, 2018
| | | | | | | | |
Shares or
Principal Amounts | | | Value | |
Corporate Bonds – (continued) | | | |
Technology – (continued) | | | |
| | Verisk Analytics Inc, 5.5000%, 6/15/45 | | $1,088,000 | | | $1,102,671 | |
| | | 25,173,030 | |
Total Corporate Bonds (cost $192,454,050) | | 187,859,364 | |
Mortgage-Backed Securities – 24.1% | | | |
Fannie Mae Pool: | | | |
| | 6.0000%, 2/1/37 | | 142,316 | | | 157,276 | |
| | 4.5000%, 9/1/37 | | 1,039,106 | | | 1,085,137 | |
| | 4.5000%, 10/1/37 | | 547,934 | | | 572,442 | |
| | 4.5000%, 5/1/38 | | 637,151 | | | 665,624 | |
| | 4.5000%, 7/1/38 | | 833,659 | | | 870,915 | |
| | 3.5000%, 10/1/42 | | 680,951 | | | 686,026 | |
| | 4.5000%, 11/1/42 | | 339,513 | | | 355,769 | |
| | 3.5000%, 12/1/42 | | 1,560,981 | | | 1,570,715 | |
| | 3.0000%, 2/1/43 | | 54,445 | | | 53,533 | |
| | 3.5000%, 2/1/43 | | 2,125,223 | | | 2,138,445 | |
| | 3.5000%, 2/1/43 | | 397,404 | | | 399,880 | |
| | 3.5000%, 3/1/43 | | 1,201,672 | | | 1,209,081 | |
| | 3.5000%, 4/1/43 | | 570,399 | | | 573,950 | |
| | 3.0000%, 5/1/43 | | 201,515 | | | 198,137 | |
| | 3.5000%, 4/1/44 | | 796,302 | | | 802,517 | |
| | 5.0000%, 7/1/44 | | 951,647 | | | 1,018,741 | |
| | 4.5000%, 10/1/44 | | 697,780 | | | 733,879 | |
| | 3.5000%, 2/1/45 | | 2,059,456 | | | 2,072,308 | |
| | 4.5000%, 3/1/45 | | 1,140,100 | | | 1,199,071 | |
| | 4.5000%, 6/1/45 | | 657,303 | | | 687,375 | |
| | 3.0000%, 10/1/45 | | 378,024 | | | 369,026 | |
| | 3.0000%, 10/1/45 | | 237,669 | | | 232,011 | |
| | 3.5000%, 12/1/45 | | 683,672 | | | 688,588 | |
| | 4.5000%, 2/1/46 | | 1,330,931 | | | 1,394,313 | |
| | 3.5000%, 7/1/46 | | 1,352,512 | | | 1,358,048 | |
| | 4.0000%, 10/1/46 | | 55,559 | | | 56,878 | |
| | 3.0000%, 11/1/46 | | 295,438 | | | 288,882 | |
| | 3.0000%, 11/1/46 | | 285,572 | | | 279,231 | |
| | 3.0000%, 2/1/47 | | 2,042,914 | | | 2,010,905 | |
| | 4.0000%, 5/1/47 | | 417,503 | | | 426,073 | |
| | 4.5000%, 5/1/47 | | 225,000 | | | 236,000 | |
| | 4.5000%, 5/1/47 | | 184,889 | | | 193,362 | |
| | 4.5000%, 5/1/47 | | 184,235 | | | 192,679 | |
| | 4.5000%, 5/1/47 | | 134,726 | | | 141,412 | |
| | 4.5000%, 5/1/47 | | 130,123 | | | 136,087 | |
| | 4.5000%, 5/1/47 | | 108,713 | | | 113,998 | |
| | 4.5000%, 5/1/47 | | 63,542 | | | 66,454 | |
| | 4.5000%, 5/1/47 | | 45,443 | | | 47,622 | |
| | 4.5000%, 5/1/47 | | 42,403 | | | 44,433 | |
| | 4.0000%, 6/1/47 | | 231,175 | | | 236,336 | |
| | 4.0000%, 6/1/47 | | 116,907 | | | 119,312 | |
| | 4.0000%, 6/1/47 | | 112,252 | | | 114,759 | |
| | 4.0000%, 6/1/47 | | 54,028 | | | 55,137 | |
| | 4.5000%, 6/1/47 | | 796,843 | | | 833,364 | |
| | 4.5000%, 6/1/47 | | 79,711 | | | 83,534 | |
| | 4.0000%, 7/1/47 | | 199,510 | | | 203,965 | |
| | 4.0000%, 7/1/47 | | 185,678 | | | 189,824 | |
| | 4.0000%, 7/1/47 | | 80,994 | | | 82,802 | |
| | 4.0000%, 7/1/47 | | 55,958 | | | 57,207 | |
| | 4.5000%, 7/1/47 | | 571,814 | | | 598,022 | |
| | 4.5000%, 7/1/47 | | 511,077 | | | 534,501 | |
| | 4.5000%, 7/1/47 | | 500,888 | | | 523,845 | |
| | 4.5000%, 7/1/47 | | 150,552 | | | 157,109 | |
| | 3.5000%, 8/1/47 | | 600,585 | | | 601,308 | |
| | |
See Notes to Schedule of Investments and Other Information and Notes to Financial Statements. |
| |
Janus Aspen Series | 13 |
Janus Henderson VIT Flexible Bond Portfolio
Schedule of Investments
December 31, 2018
| | | | | | | | |
Shares or
Principal Amounts | | | Value | |
Mortgage-Backed Securities – (continued) | | | |
Fannie Mae Pool – (continued) | | | |
| | 4.0000%, 8/1/47 | | $1,033,522 | | | $1,054,195 | |
| | 4.0000%, 8/1/47 | | 341,876 | | | 349,510 | |
| | 4.0000%, 8/1/47 | | 212,321 | | | 217,062 | |
| | 4.0000%, 8/1/47 | | 90,344 | | | 92,144 | |
| | 4.5000%, 8/1/47 | | 684,270 | | | 715,632 | |
| | 4.5000%, 8/1/47 | | 178,558 | | | 186,742 | |
| | 4.0000%, 9/1/47 | | 86,049 | | | 87,970 | |
| | 4.5000%, 9/1/47 | | 596,797 | | | 624,151 | |
| | 4.5000%, 9/1/47 | | 445,472 | | | 465,891 | |
| | 4.5000%, 9/1/47 | | 414,343 | | | 433,335 | |
| | 3.5000%, 10/1/47 | | 2,613,245 | | | 2,614,231 | |
| | 4.0000%, 10/1/47 | | 453,337 | | | 463,459 | |
| | 4.0000%, 10/1/47 | | 386,650 | | | 395,283 | |
| | 4.0000%, 10/1/47 | | 373,179 | | | 381,512 | |
| | 4.0000%, 10/1/47 | | 237,156 | | | 242,452 | |
| | 4.0000%, 10/1/47 | | 207,932 | | | 212,575 | |
| | 4.5000%, 10/1/47 | | 105,564 | | | 110,402 | |
| | 4.5000%, 10/1/47 | | 48,466 | | | 50,688 | |
| | 4.0000%, 11/1/47 | | 890,658 | | | 909,813 | |
| | 4.0000%, 11/1/47 | | 572,282 | | | 583,685 | |
| | 4.0000%, 11/1/47 | | 568,332 | | | 581,022 | |
| | 4.0000%, 11/1/47 | | 176,818 | | | 180,766 | |
| | 4.5000%, 11/1/47 | | 509,600 | | | 532,958 | |
| | 4.5000%, 11/1/47 | | 76,858 | | | 80,206 | |
| | 3.5000%, 12/1/47 | | 829,945 | | | 832,645 | |
| | 3.5000%, 12/1/47 | | 176,592 | | | 176,907 | |
| | 4.0000%, 12/1/47 | | 1,119,814 | | | 1,142,128 | |
| | 3.5000%, 1/1/48 | | 614,626 | | | 616,993 | |
| | 3.5000%, 1/1/48 | | 256,941 | | | 257,624 | |
| | 4.0000%, 1/1/48 | | 2,146,959 | | | 2,189,721 | |
| | 4.0000%, 1/1/48 | | 2,096,916 | | | 2,145,956 | |
| | 4.0000%, 1/1/48 | | 1,997,515 | | | 2,043,035 | |
| | 4.0000%, 1/1/48 | | 211,505 | | | 216,831 | |
| | 4.5000%, 2/1/48 | | 128,065 | | | 132,691 | |
| | 4.5000%, 2/1/48 | | 102,359 | | | 106,056 | |
| | 3.5000%, 3/1/48 | | 363,259 | | | 364,658 | |
| | 4.0000%, 3/1/48 | | 880,681 | | | 901,304 | |
| | 4.0000%, 3/1/48 | | 186,683 | | | 191,382 | |
| | 4.5000%, 3/1/48 | | 668,048 | | | 700,827 | |
| | 4.0000%, 4/1/48 | | 399,128 | | | 409,238 | |
| | 4.5000%, 4/1/48 | | 514,048 | | | 539,825 | |
| | 4.5000%, 4/1/48 | | 230,924 | | | 239,265 | |
| | 4.5000%, 4/1/48 | | 178,625 | | | 185,077 | |
| | 4.5000%, 4/1/48 | | 173,213 | | | 179,470 | |
| | 4.5000%, 4/1/48 | | 106,402 | | | 111,032 | |
| | 4.5000%, 4/1/48 | | 84,794 | | | 87,857 | |
| | 4.0000%, 5/1/48 | | 2,098,907 | | | 2,140,714 | |
| | 4.0000%, 5/1/48 | | 1,735,012 | | | 1,769,591 | |
| | 4.5000%, 5/1/48 | | 407,854 | | | 426,706 | |
| | 4.5000%, 5/1/48 | | 355,409 | | | 372,303 | |
| | 4.0000%, 6/1/48 | | 828,947 | | | 845,460 | |
| | 4.0000%, 6/1/48 | | 713,800 | | | 728,019 | |
| | 4.5000%, 6/1/48 | | 396,118 | | | 413,420 | |
| | 4.0000%, 7/1/48 | | 4,873,529 | | | 4,970,612 | |
| | 4.0000%, 8/1/48 | | 260,525 | | | 265,715 | |
| | 4.0000%, 9/1/48 | | 294,330 | | | 300,194 | |
| | 3.5000%, 8/1/56 | | 3,173,149 | | | 3,165,005 | |
| | 3.0000%, 2/1/57 | | 1,954,747 | | | 1,889,221 | |
| | |
See Notes to Schedule of Investments and Other Information and Notes to Financial Statements. |
| |
14 | DECEMBER 31, 2018 |
Janus Henderson VIT Flexible Bond Portfolio
Schedule of Investments
December 31, 2018
| | | | | | | | |
Shares or
Principal Amounts | | | Value | |
Mortgage-Backed Securities – (continued) | | | |
Fannie Mae Pool – (continued) | | | |
| | 3.5000%, 2/1/57 | | $3,258,171 | | | $3,249,809 | |
| | | 75,590,823 | |
Freddie Mac Gold Pool: | | | |
| | 4.5000%, 5/1/38 | | 1,416,504 | | | 1,474,280 | |
| | 4.5000%, 8/1/38 | | 919,180 | | | 959,744 | |
| | 4.5000%, 10/1/38 | | 151,116 | | | 157,785 | |
| | 4.5000%, 11/1/38 | | 1,015,681 | | | 1,060,507 | |
| | 6.0000%, 4/1/40 | | 224,808 | | | 249,571 | |
| | 3.5000%, 2/1/43 | | 600,086 | | | 603,566 | |
| | 3.5000%, 2/1/44 | | 859,256 | | | 864,238 | |
| | 4.5000%, 5/1/44 | | 659,917 | | | 691,721 | |
| | 3.0000%, 1/1/45 | | 832,789 | | | 816,284 | |
| | 4.0000%, 2/1/46 | | 594,147 | | | 609,630 | |
| | 4.0000%, 5/1/46 | | 403,589 | | | 413,389 | |
| | 3.5000%, 7/1/46 | | 2,590,326 | | | 2,604,999 | |
| | 3.5000%, 7/1/46 | | 520,661 | | | 521,486 | |
| | 3.0000%, 10/1/46 | | 2,448,800 | | | 2,390,111 | |
| | 3.0000%, 12/1/46 | | 4,426,127 | | | 4,319,997 | |
| | 3.5000%, 2/1/47 | | 1,903,712 | | | 1,909,291 | |
| | 3.0000%, 9/1/47 | | 4,403,747 | | | 4,298,175 | |
| | 3.5000%, 9/1/47 | | 2,128,451 | | | 2,132,600 | |
| | 3.5000%, 9/1/47 | | 612,766 | | | 613,414 | |
| | 3.5000%, 10/1/47 | | 1,733,261 | | | 1,733,753 | |
| | 3.5000%, 11/1/47 | | 693,604 | | | 694,394 | |
| | 3.5000%, 12/1/47 | | 2,497,823 | | | 2,505,401 | |
| | 3.5000%, 12/1/47 | | 489,836 | | | 491,505 | |
| | 3.5000%, 2/1/48 | | 243,035 | | | 243,305 | |
| | 3.5000%, 2/1/48 | | 239,975 | | | 240,507 | |
| | 3.5000%, 3/1/48 | | 469,009 | | | 469,025 | |
| | 4.0000%, 3/1/48 | | 570,286 | | | 583,488 | |
| | 4.0000%, 4/1/48 | | 2,540,709 | | | 2,590,665 | |
| | 4.0000%, 4/1/48 | | 681,215 | | | 696,575 | |
| | 4.0000%, 5/1/48 | | 2,341,052 | | | 2,387,422 | |
| | 4.0000%, 5/1/48 | | 1,223,733 | | | 1,247,859 | |
| | 4.0000%, 6/1/48 | | 2,766,556 | | | 2,821,214 | |
| | 4.0000%, 6/1/48 | | 592,153 | | | 603,836 | |
| | 4.5000%, 7/1/48 | | 1,027,224 | | | 1,064,059 | |
| | 4.0000%, 8/1/48 | | 2,518,086 | | | 2,581,206 | |
| | 4.5000%, 8/1/48 | | 5,340,113 | | | 5,530,011 | |
| | 4.5000%, 8/1/48 | | 611,164 | | | 633,081 | |
| | 5.0000%, 9/1/48 | | 145,144 | | | 152,082 | |
| | | 53,960,176 | |
Ginnie Mae I Pool: | | | |
| | 4.5000%, 9/15/40 | | 416,527 | | | 435,930 | |
| | 4.5000%, 5/15/41 | | 385,534 | | | 402,460 | |
| | 4.0000%, 1/15/45 | | 2,388,031 | | | 2,462,613 | |
| | 4.5000%, 8/15/46 | | 2,760,576 | | | 2,890,832 | |
| | 4.0000%, 7/15/47 | | 1,539,571 | | | 1,579,463 | |
| | 4.0000%, 8/15/47 | | 327,599 | | | 336,072 | |
| | 4.0000%, 11/15/47 | | 481,256 | | | 494,261 | |
| | 4.0000%, 12/15/47 | | 641,317 | | | 658,670 | |
| | | 9,260,301 | |
Ginnie Mae II Pool: | | | |
| | 4.0000%, 8/20/47 | | 247,090 | | | 254,674 | |
| | 4.0000%, 8/20/47 | | 60,211 | | | 61,816 | |
| | 4.0000%, 8/20/47 | | 45,895 | | | 47,307 | |
| | 4.5000%, 5/20/48 | | 1,194,304 | | | 1,250,042 | |
| | 4.5000%, 5/20/48 | | 285,533 | | | 298,859 | |
| | 5.0000%, 7/20/48 | | 2,352,414 | | | 2,449,446 | |
| | |
See Notes to Schedule of Investments and Other Information and Notes to Financial Statements. |
| |
Janus Aspen Series | 15 |
Janus Henderson VIT Flexible Bond Portfolio
Schedule of Investments
December 31, 2018
| | | | | | | | |
Shares or
Principal Amounts | | | Value | |
Mortgage-Backed Securities – (continued) | | | |
Ginnie Mae II Pool – (continued) | | | |
| | 4.5000%, 8/20/48 | | $2,376,928 | | | $2,461,366 | |
| | 4.5000%, 12/20/48 | | 1,627,000 | | | 1,687,085 | |
| | 5.0000%, 12/20/48 | | 2,905,375 | | | 3,032,331 | |
| | | 11,542,926 | |
Total Mortgage-Backed Securities (cost $152,137,018) | | 150,354,226 | |
United States Treasury Notes/Bonds – 27.4% | | | |
| | 2.7500%, 11/30/20 | | 5,612,000 | | | 5,636,372 | |
| | 2.8750%, 10/15/21 | | 2,476,000 | | | 2,501,895 | |
| | 2.7500%, 5/31/23 | | 3,195,000 | | | 3,229,831 | |
| | 2.8750%, 9/30/23 | | 15,702,000 | | | 15,956,558 | |
| | 2.8750%, 10/31/23 | | 14,028,000 | | | 14,260,738 | |
| | 2.8750%, 11/30/23 | | 9,648,000 | | | 9,815,496 | |
| | 2.6250%, 3/31/25 | | 1,025,000 | | | 1,028,243 | |
| | 2.8750%, 11/30/25 | | 12,000 | | | 12,221 | |
| | 2.7500%, 2/15/28 | | 1,708,000 | | | 1,718,084 | |
| | 2.8750%, 8/15/28 | | 14,768,000 | | | 15,006,878 | |
| | 3.1250%, 11/15/28 | | 41,305,000 | | | 42,874,136 | |
| | 3.6250%, 2/15/44 | | 1,689,000 | | | 1,874,211 | |
| | 3.0000%, 5/15/47 | | 2,702,000 | | | 2,695,166 | |
| | 2.7500%, 8/15/47 | | 5,270,000 | | | 5,000,034 | |
| | 2.7500%, 11/15/47 | | 14,053,000 | | | 13,320,887 | |
| | 3.0000%, 2/15/48 | | 5,679,000 | | | 5,658,484 | |
| | 3.1250%, 5/15/48 | | 2,940,000 | | | 3,000,979 | |
| | 3.0000%, 8/15/48 | | 11,454,000 | | | 11,419,567 | |
| | 3.3750%, 11/15/48 | | 15,420,000 | | | 16,517,417 | |
Total United States Treasury Notes/Bonds (cost $167,307,510) | | 171,527,197 | |
Investment Companies – 0.5% | | | |
Money Markets – 0.5% | | | |
| | Janus Henderson Cash Liquidity Fund LLC, 2.4621%ºº,£ (cost $3,199,600) | | 3,199,600 | | | 3,199,600 | |
Total Investments (total cost $624,505,422) – 99.3% | | 620,632,482 | |
Cash, Receivables and Other Assets, net of Liabilities – 0.7% | | 4,618,513 | |
Net Assets – 100% | | $625,250,995 | |
| | | | | | |
Summary of Investments by Country - (Long Positions) (unaudited) |
| |
| | | | | % of | |
| | | | | Investment | |
Country | | Value | | Securities | |
United States | | $586,516,541 | | 94.5 | % |
Cayman Islands | | 24,591,794 | | 4.0 | |
United Kingdom | | 3,146,772 | | 0.5 | |
Switzerland | | 1,679,073 | | 0.3 | |
Germany | | 1,659,028 | | 0.3 | |
Canada | | 1,515,019 | | 0.2 | |
Israel | | 961,506 | | 0.2 | |
South Africa | | 307,479 | | 0.0 | |
Ireland | | 255,270 | | 0.0 | |
| | | | | | |
| | | | | | |
Total | | $620,632,482 | | 100.0 | % |
| | |
See Notes to Schedule of Investments and Other Information and Notes to Financial Statements. |
| |
16 | DECEMBER 31, 2018 |
Janus Henderson VIT Flexible Bond Portfolio
Schedule of Investments
December 31, 2018
Schedules of Affiliated Investments – (% of Net Assets)
| | | | | | | | | | | |
| | Dividend Income | Realized Gain/(Loss) | Change in Unrealized Appreciation/ Depreciation | Value at 12/31/18 |
Investment Companies - 0.5% |
Investments Purchased with Cash Collateral from Securities Lending - N/A |
| | Janus Henderson Cash Collateral Fund LLC, 2.4428%ºº | $ | 2,625∆ | $ | - | $ | - | $ | - |
Money Markets - 0.5% |
| | Janus Henderson Cash Liquidity Fund LLC, 2.4621%ºº | | 616,391 | | - | | - | | 3,199,600 |
Total Affiliated Investments - 0.5% | $ | 619,016 | $ | - | $ | - | $ | 3,199,600 |
| | | | | | | | | | | |
| | Share Balance at 12/31/17 | Purchases | Sales | Share Balance at 12/31/18 |
Investment Companies - 0.5% |
Investments Purchased with Cash Collateral from Securities Lending - N/A |
| | Janus Henderson Cash Collateral Fund LLC, 2.4428%ºº | | - | | 112,849,620 | | (112,849,620) | | - |
Money Markets - 0.5% |
| | Janus Henderson Cash Liquidity Fund LLC, 2.4621%ºº | | 45,272,152 | | 531,029,047 | | (573,101,599) | | 3,199,600 |
| | |
See Notes to Schedule of Investments and Other Information and Notes to Financial Statements. |
| |
Janus Aspen Series | 17 |
Janus Henderson VIT Flexible Bond Portfolio
Notes to Schedule of Investments and Other Information
| | |
Bloomberg Barclays U.S. Aggregate Bond Index | Bloomberg Barclays U.S. Aggregate Bond Index is a broad-based measure of the investment grade, US dollar-denominated, fixed-rate taxable bond market. |
| | |
ICE | Intercontinental Exchange |
LIBOR | London Interbank Offered Rate |
LLC | Limited Liability Company |
LP | Limited Partnership |
PLC | Public Limited Company |
| | |
144A | Securities sold under Rule 144A of the Securities Act of 1933, as amended, are subject to legal and/or contractual restrictions on resale and may not be publicly sold without registration under the 1933 Act. Unless otherwise noted, these securities have been determined to be liquid under guidelines established by the Board of Trustees. The total value of 144A securities as of the year ended December 31, 2018 is $104,286,690, which represents 16.7% of net assets. |
| | |
(a) | All or a portion of this position is not funded, or has been purchased on a delayed delivery or when-issued basis. If applicable, interest rates will be determined and interest will begin to accrue at a future date. See Notes to Financial Statements. |
| | |
‡ | Variable or floating rate security. Rate shown is the current rate as of December 31, 2018. Certain variable rate securities are not based on a published reference rate and spread; they are determined by the issuer or agent and current market conditions. Reference rate is as of reset date and may vary by security, which may not indicate a reference rate and/or spread in their description. |
| | |
ºº | Rate shown is the 7-day yield as of December 31, 2018. |
| | |
£ | The Portfolio may invest in certain securities that are considered affiliated companies. As defined by the Investment Company Act of 1940, as amended, an affiliated company is one in which the Portfolio owns 5% or more of the outstanding voting securities, or a company which is under common ownership or control. |
| | |
∆ | Net of income paid to the securities lending agent and rebates paid to the borrowing counterparties. |
| | | | | | | | | | | |
§ | Schedule of Restricted and Illiquid Securities (as of December 31, 2018) |
| | | | | | | | Value as a | |
| | Acquisition | | | | | | % of Net | |
| | Date | | Cost | | Value | | Assets | |
loanDepot Station Place Agency Securitization Trust 2017-1, ICE LIBOR USD 1 Month + 1.0000%, 3.5063%, 11/25/50 | 11/29/17 | $ | 414,000 | $ | 412,932 | | 0.1 | % |
loanDepot Station Place Agency Securitization Trust 2017-1, ICE LIBOR USD 1 Month + 0.8000%, 3.3063%, 11/25/50 | 11/29/2017 - 3/23/18 | | 2,069,254 | | 2,062,712 | | 0.3 | |
Moffett Towers Phase II, ICE LIBOR USD 3 Month + 2.8000%, 5.2560%, 6/15/21 | 6/25/2018 - 12/4/18 | | 2,682,892 | | 2,675,480 | | 0.4 | |
Total | | $ | 5,166,146 | $ | 5,151,124 | | 0.8 | % |
| | | | | | | | | |
The Portfolio has registration rights for certain restricted securities held as of December 31, 2018. The issuer incurs all registration costs. | |
Janus Henderson VIT Flexible Bond Portfolio
Notes to Schedule of Investments and Other Information
| | | | | | | | | | | | | |
The following is a summary of the inputs that were used to value the Portfolio’s investments in securities and other financial instruments as of December 31, 2018. See Notes to Financial Statements for more information. |
| |
Valuation Inputs Summary |
| | | | | | | |
| | | | | Level 2 - | | Level 3 - |
| | | Level 1 - | | Other Significant | | Significant |
| | | Quoted Prices | | Observable Inputs | | Unobservable Inputs |
| | | | | | | |
Assets | | | | | | |
Investments in Securities: | | | | | | |
Asset-Backed/Commercial Mortgage-Backed Securities | $ | - | $ | 84,341,027 | $ | - |
Bank Loans and Mezzanine Loans | | - | | 23,351,068 | | - |
Corporate Bonds | | - | | 187,859,364 | | - |
Mortgage-Backed Securities | | - | | 150,354,226 | | - |
United States Treasury Notes/Bonds | | - | | 171,527,197 | | - |
Investment Companies | | - | | 3,199,600 | | - |
Total Assets | $ | - | $ | 620,632,482 | $ | - |
| | | | | | | |
Janus Henderson VIT Flexible Bond Portfolio
Statement of Assets and Liabilities
December 31, 2018
| | | | | | | |
| | | | | | |
Assets: | | | | |
| | Unaffiliated investments, at value(1) | | $ | 617,432,882 | |
| | Affiliated investments, at value(2) | | | 3,199,600 | |
| | Cash | | | 515,735 | |
| | Non-interested Trustees' deferred compensation | | | 15,161 | |
| | Receivables: | | | | |
| | | Investments sold | | | 4,720,695 | |
| | | Interest | | | 4,246,854 | |
| | | Portfolio shares sold | | | 445,646 | |
| | | Dividends from affiliates | | | 9,901 | |
| | Other assets | | | 3,036 | |
Total Assets | | | 630,589,510 | |
Liabilities: | | | | |
| | Payables: | | | — | |
| | | Investments purchased | | | 3,807,513 | |
| | | Portfolio shares repurchased | | | 919,304 | |
| | | Advisory fees | | | 272,586 | |
| | | 12b-1 Distribution and shareholder servicing fees | | | 84,089 | |
| | | Professional fees | | | 39,759 | |
| | | Transfer agent fees and expenses | | | 28,841 | |
| | | Non-interested Trustees' deferred compensation fees | | | 15,161 | |
| | | Non-interested Trustees' fees and expenses | | | 4,732 | |
| | | Custodian fees | | | 3,165 | |
| | | Affiliated portfolio administration fees payable | | | 1,368 | |
| | | Accrued expenses and other payables | | | 161,997 | |
Total Liabilities | | | 5,338,515 | |
Net Assets | | $ | 625,250,995 | |
Net Assets Consist of: | | | | |
| | Capital (par value and paid-in surplus) | | $ | 654,177,946 | |
| | Total distributable earnings (loss) | | | (28,926,951) | |
Total Net Assets | | $ | 625,250,995 | |
Net Assets - Institutional Shares | | $ | 240,426,901 | |
| | Shares Outstanding, $0.01 Par Value (unlimited shares authorized) | | | 21,451,113 | |
Net Asset Value Per Share | | $ | 11.21 | |
Net Assets - Service Shares | | $ | 384,824,094 | |
| | Shares Outstanding, $0.01 Par Value (unlimited shares authorized) | | | 31,458,592 | |
Net Asset Value Per Share | | $ | 12.23 | |
| |
(1) Includes cost of $621,305,822. (2) Includes cost of $3,199,600. |
| | |
See Notes to Financial Statements. |
| |
20 | DECEMBER 31, 2018 |
Janus Henderson VIT Flexible Bond Portfolio
Statement of Operations
For the year ended December 31, 2018
| | | | | | |
| | | | | |
Investment Income: | | | |
| Interest | $ | 22,245,188 | |
| | Dividends from affiliates | | 616,391 | |
| | Affiliated securities lending income, net | | 2,625 | |
| | Other income | | 104,936 | |
Total Investment Income | | 22,969,140 | |
Expenses: | | | |
| | Advisory fees | | 3,249,730 | |
| | 12b-1 Distribution and shareholder servicing fees: | | | |
| | | Service Shares | | 973,030 | |
| | Transfer agent administrative fees and expenses: | | | |
| | | Institutional Shares | | 133,142 | |
| | | Service Shares | | 194,606 | |
| | Other transfer agent fees and expenses: | | | |
| | | Institutional Shares | | 7,646 | |
| | | Service Shares | | 6,306 | |
| | Shareholder reports expense | | 119,503 | |
| | Professional fees | | 58,088 | |
| | Affiliated portfolio administration fees | | 23,063 | |
| | Registration fees | | 23,058 | |
| | Custodian fees | | 22,276 | |
| | Non-interested Trustees’ fees and expenses | | 18,961 | |
| | Other expenses | | 164,710 | |
Total Expenses | | 4,994,119 | |
Net Investment Income/(Loss) | | 17,975,021 | |
Net Realized Gain/(Loss) on Investments: | | | |
| | Investments | | (18,429,882) | |
Total Net Realized Gain/(Loss) on Investments | | (18,429,882) | |
Change in Unrealized Net Appreciation/Depreciation: | | | |
| | Investments and non-interested Trustees’ deferred compensation | | (7,934,492) | |
Total Change in Unrealized Net Appreciation/Depreciation | | (7,934,492) | |
Net Increase/(Decrease) in Net Assets Resulting from Operations | $ | (8,389,353) | |
| | | | | | |
| | |
See Notes to Financial Statements. |
| |
Janus Aspen Series | 21 |
Janus Henderson VIT Flexible Bond Portfolio
Statements of Changes in Net Assets
| | | | | | | | | |
| | | | | | | | | |
| | | Year ended
December 31, 2018 | | Year ended
December 31, 2017 | |
| | | | | | | | | |
Operations: | | | | | | |
| | Net investment income/(loss) | $ | 17,975,021 | | $ | 17,147,693 | |
| | Net realized gain/(loss) on investments | | (18,429,882) | | | 1,927,983 | |
| | Change in unrealized net appreciation/depreciation | | (7,934,492) | | | 5,918,589 | |
Net Increase/(Decrease) in Net Assets Resulting from Operations | | (8,389,353) | | | 24,994,265 | |
Dividends and Distributions to Shareholders(1) | | | | | | |
| | | Institutional Shares | | (8,145,523) | | | N/A | |
| | | Service Shares | | (10,421,559) | | | N/A | |
| Total Dividends and Distributions to Shareholders | | (18,567,082) | | | N/A | |
| | Dividends from Net Investment Income(1) | | | | | | |
| | | Institutional Shares | | N/A | | | (9,202,522) | |
| | | Service Shares | | N/A | | | (10,135,006) | |
| Total Dividends from Net Investment Income | | N/A | | | (19,337,528) | |
Net Decrease from Dividends and Distributions to Shareholders | | (18,567,082) | | | (19,337,528) | |
Capital Share Transactions: | | | | | | |
| | | Institutional Shares | | (40,394,387) | | | (45,488,748) | |
| | | Service Shares | | (2,892,011) | | | (1,068,449) | |
Net Increase/(Decrease) from Capital Share Transactions | | (43,286,398) | | | (46,557,197) | |
Net Increase/(Decrease) in Net Assets | | (70,242,833) | | | (40,900,460) | |
Net Assets: | | | | | | |
| | Beginning of period | | 695,493,828 | | | 736,394,288 | |
| End of period(2) | $ | 625,250,995 | | $ | 695,493,828 | |
| | | | | | | | | |
| |
(1) The requirement to disclose dividends and distributions paid to shareholders from net investment income and/or net realized gain from investment transactions was eliminated by the SEC (Securities Exchange Commission) in 2018. (2) Net assets - End of period includes undistributed (overdistributed) net investment income of $3,349,745 as of December 31, 2017. The requirement to disclose undistributed (overdistributed) net investment income was eliminated by the SEC in 2018. |
| | |
See Notes to Financial Statements. |
| |
22 | DECEMBER 31, 2018 |
Janus Henderson VIT Flexible Bond Portfolio
Financial Highlights
| | | | | | | | | | | | | | | | | | | |
Institutional Shares | | | | | | | | | | | | | | | |
For a share outstanding during the year ended December 31 | | 2018 | | | 2017 | | | 2016 | | | 2015 | | | 2014 | |
| | Net Asset Value, Beginning of Period | | $11.69 | | | $11.62 | | | $11.67 | | | $11.98 | | | $11.82 | |
| | Income/(Loss) from Investment Operations: | | | | | | | | | | | | | | | |
| | | Net investment income/(loss)(1) | | 0.33 | | | 0.30 | | | 0.28 | | | 0.28 | | | 0.33 | |
| | | Net realized and unrealized gain/(loss) | | (0.45) | | | 0.12 | | | 0.01 | | | (0.25) | | | 0.25 | |
| | Total from Investment Operations | | (0.12) | | | 0.42 | | | 0.29 | | | 0.03 | | | 0.58 | |
| | Less Dividends and Distributions: | | | | | | | | | | | | | | | |
| | | Dividends (from net investment income) | | (0.36) | | | (0.35) | | | (0.34) | | | (0.28) | | | (0.42) | |
| | | Distributions (from capital gains) | | — | | | — | | | — | | | (0.06) | | | — | |
| | Total Dividends and Distributions | | (0.36) | | | (0.35) | | | (0.34) | | | (0.34) | | | (0.42) | |
| | Net Asset Value, End of Period | | $11.21 | | | $11.69 | | | $11.62 | | | $11.67 | | | $11.98 | |
| | Total Return* | | (1.00)% | | | 3.62% | | | 2.46% | | | 0.22% | | | 4.94% | |
| | Net Assets, End of Period (in thousands) | | $240,427 | | | $292,251 | | | $335,208 | | | $355,569 | | | $363,977 | |
| | Average Net Assets for the Period (in thousands) | | $266,429 | | | $319,492 | | | $350,120 | | | $347,338 | | | $345,064 | |
| | Ratios to Average Net Assets**: | | | | | | | | | | | | | | | |
| | | Ratio of Gross Expenses | | 0.61% | | | 0.60% | | | 0.58% | | | 0.57% | | | 0.59% | |
| | | Ratio of Net Expenses (After Waivers and Expense Offsets) | | 0.61% | | | 0.60% | | | 0.58% | | | 0.57% | | | 0.58% | |
| | | Ratio of Net Investment Income/(Loss) | | 2.88% | | | 2.51% | | | 2.31% | | | 2.33% | | | 2.74% | |
| | Portfolio Turnover Rate | | 238%(2) | | | 130%(2) | | | 112% | | | 111% | | | 144% | |
| | | | | | | | | | | | | | 1 | | | | | |
| | | | | | | | | | | | | | | | | | | |
Service Shares | | | | | | | | | | | | | | | |
For a share outstanding during the year ended December 31 | | 2018 | | | 2017 | | | 2016 | | | 2015 | | | 2014 | |
| | Net Asset Value, Beginning of Period | | $12.73 | | | $12.63 | | | $12.66 | | | $12.98 | | | $12.78 | |
| | Income/(Loss) from Investment Operations: | | | | | | | | | | | | | | | |
| | | Net investment income/(loss)(1) | | 0.33 | | | 0.29 | | | 0.27 | | | 0.27 | | | 0.32 | |
| | | Net realized and unrealized gain/(loss) | | (0.50) | | | 0.13 | | | 0.01 | | | (0.27) | | | 0.28 | |
| | Total from Investment Operations | | (0.17) | | | 0.42 | | | 0.28 | | | — | | | 0.60 | |
| | Less Dividends and Distributions: | | | | | | | | | | | | | | | |
| | | Dividends (from net investment income) | | (0.33) | | | (0.32) | | | (0.31) | | | (0.26) | | | (0.40) | |
| | | Distributions (from capital gains) | | — | | | — | | | — | | | (0.06) | | | — | |
| | Total Dividends and Distributions | | (0.33) | | | (0.32) | | | (0.31) | | | (0.32) | | | (0.40) | |
| | Net Asset Value, End of Period | | $12.23 | | | $12.73 | | | $12.63 | | | $12.66 | | | $12.98 | |
| | Total Return* | | (1.29)% | | | 3.35% | | | 2.22% | | | (0.06)% | | | 4.69% | |
| | Net Assets, End of Period (in thousands) | | $384,824 | | | $403,243 | | | $401,186 | | | $303,873 | | | $207,850 | |
| | Average Net Assets for the Period (in thousands) | | $389,260 | | | $402,544 | | | $383,710 | | | $250,537 | | | $146,672 | |
| | Ratios to Average Net Assets**: | | | | | | | | | | | | | | | |
| | | Ratio of Gross Expenses | | 0.86% | | | 0.85% | | | 0.83% | | | 0.82% | | | 0.85% | |
| | | Ratio of Net Expenses (After Waivers and Expense Offsets) | | 0.86% | | | 0.85% | | | 0.83% | | | 0.82% | | | 0.84% | |
| | | Ratio of Net Investment Income/(Loss) | | 2.64% | | | 2.27% | | | 2.06% | | | 2.09% | | | 2.49% | |
| | Portfolio Turnover Rate | | 238%(2) | | | 130%(2) | | | 112% | | | 111% | | | 144% | |
| | | | | | | | | | | | | | | | | | | |
| |
* Total return includes adjustments in accordance with generally accepted accounting principles required at the year or period end and are not annualized for periods of less than one full year. Total return does not include fees, charges, or expenses imposed by the variable annuity and life insurance contracts for which Janus Aspen Series serves as an underlying investment vehicle. ** Annualized for periods of less than one full year. (1) Per share amounts are calculated based on average shares outstanding during the year or period. (2) Portfolio Turnover Rate excludes TBA (to be announced) purchase and sales commitments. |
| | |
See Notes to Financial Statements. |
| |
Janus Aspen Series | 23 |
Janus Henderson VIT Flexible Bond Portfolio
Notes to Financial Statements
1. Organization and Significant Accounting Policies
Janus Henderson VIT Flexible Bond Portfolio (the “Portfolio”) is a series of Janus Aspen Series (the “Trust”), which is organized as a Delaware statutory trust and is registered under the Investment Company Act of 1940, as amended (the “1940 Act”), as an open-end management investment company, and therefore has applied the specialized accounting and reporting guidance in Financial Accounting Standards Board (“FASB”) Accounting Standards Codification (“ASC”) Topic 946. The Trust offers 11 portfolios, each of which offers multiple share classes, with differing investment objectives and policies. The Portfolio seeks to obtain maximum total return, consistent with preservation of capital. The Portfolio is classified as diversified, as defined in the 1940 Act.
The Portfolio currently offers two classes of shares: Institutional Shares and Service Shares. Each class represents an interest in the same portfolio of investments. Institutional Shares are offered only in connection with investment in and payments under variable insurance contracts as well as certain qualified retirement plans. Service Shares are offered only in connection with investment in and payments under variable insurance contracts as well as certain qualified retirement plans that require a fee from Portfolio assets to procure distribution and administrative services to contract owners and plan participants.
Shareholders, including other portfolios, participating insurance companies, as well as accounts, may from time to time own (beneficially or of record) a significant percentage of the Portfolio’s Shares and can be considered to “control” the Portfolio when that ownership exceeds 25% of the Portfolio’s assets (and which may differ from control as determined in accordance with accounting principles generally accepted in the United States of America).
The following accounting policies have been followed by the Portfolio and are in conformity with accounting principles generally accepted in the United States of America.
Investment Valuation
Securities held by the Portfolio are valued in accordance with policies and procedures established by and under the supervision of the Trustees (the “Valuation Procedures”). Equity securities traded on a domestic securities exchange are generally valued at the closing prices on the primary market or exchange on which they trade. If such price is lacking for the trading period immediately preceding the time of determination, such securities are valued at their current bid price. Equity securities that are traded on a foreign exchange are generally valued at the closing prices on such markets. In the event that there is no current trading volume on a particular security in such foreign exchange, the bid price from the primary exchange is generally used to value the security. Securities that are traded on the over-the-counter (“OTC”) markets are generally valued at their closing or latest bid prices as available. Foreign securities and currencies are converted to U.S. dollars using the applicable exchange rate in effect at the close of the New York Stock Exchange (“NYSE”). The Portfolio will determine the market value of individual securities held by it by using prices provided by one or more approved professional pricing services or, as needed, by obtaining market quotations from independent broker-dealers. Most debt securities are valued in accordance with the evaluated bid price supplied by the pricing service that is intended to reflect market value. The evaluated bid price supplied by the pricing service is an evaluation that may consider factors such as security prices, yields, maturities and ratings. Certain short-term securities maturing within 60 days or less may be evaluated and valued on an amortized cost basis provided that the amortized cost determined approximates market value. Securities for which market quotations or evaluated prices are not readily available or deemed unreliable are valued at fair value determined in good faith under the Valuation Procedures. Circumstances in which fair value pricing may be utilized include, but are not limited to: (i) a significant event that may affect the securities of a single issuer, such as a merger, bankruptcy, or significant issuer-specific development; (ii) an event that may affect an entire market, such as a natural disaster or significant governmental action; (iii) a nonsignificant event such as a market closing early or not opening, or a security trading halt; and (iv) pricing of a nonvalued security and a restricted or nonpublic security. Special valuation considerations may apply with respect to “odd-lot” fixed-income transactions which, due to their small size, may receive evaluated prices by pricing services which reflect a large block trade and not what actually could be obtained for the odd-lot position. The Portfolio uses systematic fair valuation models provided by independent third parties to value international equity securities in order to adjust for stale pricing, which may occur between the close of certain foreign exchanges and the close of the NYSE.
Valuation Inputs Summary
FASB ASC 820, Fair Value Measurements and Disclosures (“ASC 820”), defines fair value, establishes a framework for measuring fair value, and expands disclosure requirements regarding fair value measurements. This standard emphasizes that fair value is a market-based measurement that should be determined based on the assumptions that
Janus Henderson VIT Flexible Bond Portfolio
Notes to Financial Statements
market participants would use in pricing an asset or liability and establishes a hierarchy that prioritizes inputs to valuation techniques used to measure fair value. These inputs are summarized into three broad levels:
Level 1 – Unadjusted quoted prices in active markets the Portfolio has the ability to access for identical assets or liabilities.
Level 2 – Observable inputs other than unadjusted quoted prices included in Level 1 that are observable for the asset or liability either directly or indirectly. These inputs may include quoted prices for the identical instrument on an inactive market, prices for similar instruments, interest rates, prepayment speeds, credit risk, yield curves, default rates and similar data.
Assets or liabilities categorized as Level 2 in the hierarchy generally include: debt securities fair valued in accordance with the evaluated bid or ask prices supplied by a pricing service; securities traded on OTC markets and listed securities for which no sales are reported that are fair valued at the latest bid price (or yield equivalent thereof) obtained from one or more dealers transacting in a market for such securities or by a pricing service approved by the Portfolio’s Trustees; certain short-term debt securities with maturities of 60 days or less that are fair valued at amortized cost; and equity securities of foreign issuers whose fair value is determined by using systematic fair valuation models provided by independent third parties in order to adjust for stale pricing which may occur between the close of certain foreign exchanges and the close of the NYSE. Other securities that may be categorized as Level 2 in the hierarchy include, but are not limited to, preferred stocks, bank loans, swaps, investments in unregistered investment companies, options, and forward contracts.
Level 3 – Unobservable inputs for the asset or liability to the extent that relevant observable inputs are not available, representing the Portfolio’s own assumptions about the assumptions that a market participant would use in valuing the asset or liability, and that would be based on the best information available.
There have been no significant changes in valuation techniques used in valuing any such positions held by the Portfolio since the beginning of the fiscal year.
The inputs or methodology used for fair valuing securities are not necessarily an indication of the risk associated with investing in those securities. The summary of inputs used as of December 31, 2018 to fair value the Portfolio’s investments in securities and other financial instruments is included in the “Valuation Inputs Summary” in the Notes to Schedule of Investments and Other Information.
There were no transfers between Level 1, Level 2 and Level 3 of the fair value hierarchy during the year. The Portfolio recognizes transfers between the levels as of the beginning of the fiscal year.
Investment Transactions and Investment Income
Investment transactions are accounted for as of the date purchased or sold (trade date). Dividend income is recorded on the ex-dividend date. Certain dividends from foreign securities will be recorded as soon as the Portfolio is informed of the dividend, if such information is obtained subsequent to the ex-dividend date. Dividends from foreign securities may be subject to withholding taxes in foreign jurisdictions. Interest income is recorded on the accrual basis and includes amortization of premiums and accretion of discounts. Gains and losses are determined on the identified cost basis, which is the same basis used for federal income tax purposes. Income, as well as gains and losses, both realized and unrealized, are allocated daily to each class of shares based upon the ratio of net assets represented by each class as a percentage of total net assets.
Expenses
The Portfolio bears expenses incurred specifically on its behalf. Each class of shares bears a portion of general expenses, which are allocated daily to each class of shares based upon the ratio of net assets represented by each class as a percentage of total net assets. Expenses directly attributable to a specific class of shares are charged against the operations of such class.
Estimates
The preparation of financial statements in conformity with accounting principles generally accepted in the United States of America requires management to make estimates and assumptions that affect the reported amount of assets and liabilities and disclosure of contingent assets and liabilities at the date of the financial statements, and the reported amounts of income and expenses during the reporting period. Actual results could differ from those estimates.
Janus Henderson VIT Flexible Bond Portfolio
Notes to Financial Statements
Indemnifications
In the normal course of business, the Portfolio may enter into contracts that contain provisions for indemnification of other parties against certain potential liabilities. The Portfolio’s maximum exposure under these arrangements is unknown, and would involve future claims that may be made against the Portfolio that have not yet occurred. Currently, the risk of material loss from such claims is considered remote.
Dividends and Distributions
The Portfolio may make semiannual distributions of substantially all of its investment income and an annual distribution of its net realized capital gains (if any).
The Portfolio may make certain investments in real estate investment trusts (“REITs”) which pay dividends to their shareholders based upon funds available from operations. It is quite common for these dividends to exceed the REITs’ taxable earnings and profits, resulting in the excess portion of such dividends being designated as a return of capital. If the Portfolio distributes such amounts, such distributions could constitute a return of capital to shareholders for federal income tax purposes.
Federal Income Taxes
The Portfolio intends to continue to qualify as a regulated investment company and distribute all of its taxable income in accordance with the requirements of Subchapter M of the Internal Revenue Code. Management has analyzed the Portfolio’s tax positions taken for all open federal income tax years, generally a three-year period, and has concluded that no provision for federal income tax is required in the Portfolio’s financial statements. The Portfolio is not aware of any tax positions for which it is reasonably possible that the total amounts of unrecognized tax benefits will significantly change in the next twelve months.
On December 22, 2017, the Tax Cuts and Jobs Act was signed into law. Currently, Management does not believe the bill will have a material impact on the Portfolio’s intention to continue to qualify as a regulated investment company, which is generally not subject to U.S. federal income tax.
2. Other Investments and Strategies
Additional Investment Risk
The Portfolio may be invested in lower-rated debt securities that have a higher risk of default or loss of value since these securities may be sensitive to economic changes, political changes, or adverse developments specific to the issuer.
The financial crisis in both the U.S. and global economies over the past several years has resulted, and may continue to result, in a significant decline in the value and liquidity of many securities of issuers worldwide in the equity and fixed-income/credit markets. In response to the crisis, the United States and certain foreign governments, along with the U.S. Federal Reserve and certain foreign central banks, took steps to support the financial markets. The withdrawal of this support, a failure of measures put in place to respond to the crisis, or investor perception that such efforts were not sufficient could each negatively affect financial markets generally, and the value and liquidity of specific securities. In addition, policy and legislative changes in the United States and in other countries continue to impact many aspects of financial regulation. The effect of these changes on the markets, and the practical implications for market participants, including the Portfolio, may not be fully known for some time. As a result, it may also be unusually difficult to identify both investment risks and opportunities, which could limit or preclude the Portfolio’s ability to achieve its investment objective. Therefore, it is important to understand that the value of your investment may fall, sometimes sharply, and you could lose money.
The enactment of the Dodd-Frank Wall Street Reform and Consumer Protection Act (the “Dodd-Frank Act”) of 2010 provided for widespread regulation of financial institutions, consumer financial products and services, broker-dealers, OTC derivatives, investment advisers, credit rating agencies, and mortgage lending, which expanded federal oversight in the financial sector, including the investment management industry. Many provisions of the Dodd-Frank Act remain pending and will be implemented through future rulemaking. Therefore, the ultimate impact of the Dodd-Frank Act and the regulations under the Dodd-Frank Act on the Portfolio and the investment management industry as a whole, is not yet certain.
A number of countries in the European Union (“EU”) have experienced, and may continue to experience, severe economic and financial difficulties. In particular, many EU nations are susceptible to economic risks associated with high levels of debt, notably due to investments in sovereign debt of countries such as Greece, Italy, Spain, Portugal, and
Janus Henderson VIT Flexible Bond Portfolio
Notes to Financial Statements
Ireland. Many non-governmental issuers, and even certain governments, have defaulted on, or been forced to restructure, their debts. Many other issuers have faced difficulties obtaining credit or refinancing existing obligations. Financial institutions have in many cases required government or central bank support, have needed to raise capital, and/or have been impaired in their ability to extend credit. As a result, financial markets in the EU experienced extreme volatility and declines in asset values and liquidity. Responses to these financial problems by European governments, central banks, and others, including austerity measures and reforms, may not work, may result in social unrest, and may limit future growth and economic recovery or have other unintended consequences. Further defaults or restructurings by governments and others of their debt could have additional adverse effects on economies, financial markets, and asset valuations around the world. Greece, Ireland, and Portugal have already received one or more "bailouts" from other Eurozone member states, and it is unclear how much additional funding they will require or if additional Eurozone member states will require bailouts in the future. The risk of investing in securities in the European markets may also be heightened due to the referendum in which the United Kingdom voted to exit the EU (known as “Brexit”). There is considerable uncertainty about how Brexit will be conducted, how negotiations of necessary treaties and trade agreements will proceed, or how financial markets will react. In addition, one or more other countries may also abandon the euro and/or withdraw from the EU, placing its currency and banking system in jeopardy.
Certain areas of the world have historically been prone to and economically sensitive to environmental events such as, but not limited to, hurricanes, earthquakes, typhoons, flooding, tidal waves, tsunamis, erupting volcanoes, wildfires or droughts, tornadoes, mudslides, or other weather-related phenomena. Such disasters, and the resulting physical or economic damage, could have a severe and negative impact on the Portfolio’s investment portfolio and, in the longer term, could impair the ability of issuers in which the Portfolio invests to conduct their businesses as they would under normal conditions. Adverse weather conditions may also have a particularly significant negative effect on issuers in the agricultural sector and on insurance companies that insure against the impact of natural disasters.
Counterparties
Portfolio transactions involving a counterparty are subject to the risk that the counterparty or a third party will not fulfill its obligation to the Portfolio (“counterparty risk”). Counterparty risk may arise because of the counterparty’s financial condition (i.e., financial difficulties, bankruptcy, or insolvency), market activities and developments, or other reasons, whether foreseen or not. A counterparty’s inability to fulfill its obligation may result in significant financial loss to the Portfolio. The Portfolio may be unable to recover its investment from the counterparty or may obtain a limited recovery, and/or recovery may be delayed. The extent of the Portfolio’s exposure to counterparty risk with respect to financial assets and liabilities approximates its carrying value. See the "Offsetting Assets and Liabilities" section of this Note for further details.
The Portfolio may be exposed to counterparty risk through participation in various programs, including, but not limited to, lending its securities to third parties, cash sweep arrangements whereby the Portfolio’s cash balance is invested in one or more types of cash management vehicles, as well as investments in, but not limited to, repurchase agreements, debt securities, and derivatives, including various types of swaps, futures and options. The Portfolio intends to enter into financial transactions with counterparties that Janus Capital Management LLC (“Janus Capital”) believes to be creditworthy at the time of the transaction. There is always the risk that Janus Capital’s analysis of a counterparty’s creditworthiness is incorrect or may change due to market conditions. To the extent that the Portfolio focuses its transactions with a limited number of counterparties, it will have greater exposure to the risks associated with one or more counterparties.
Loans
The Portfolio may invest in various commercial loans, including bank loans, bridge loans, debtor-in-possession (“DIP”) loans, mezzanine loans, and other fixed and floating rate loans. These loans may be acquired through loan participations and assignments or on a when-issued basis. Commercial loans will comprise no more than 20% of the Portfolio’s total assets. Below are descriptions of the types of loans held by the Portfolio as of December 31, 2018.
· Bank Loans - Bank loans are obligations of companies or other entities entered into in connection with recapitalizations, acquisitions, and refinancings. The Portfolio’s investments in bank loans are generally acquired as a participation interest in, or assignment of, loans originated by a lender or other financial institution. These investments may include institutionally-traded floating and fixed-rate debt securities.
· Floating Rate Loans – Floating rate loans are debt securities that have floating interest rates, that adjust periodically, and are tied to a benchmark lending rate, such as London Interbank Offered Rate (“LIBOR”). In
Janus Henderson VIT Flexible Bond Portfolio
Notes to Financial Statements
other cases, the lending rate could be tied to the prime rate offered by one or more major U.S. banks or the rate paid on large certificates of deposit traded in the secondary markets. If the benchmark lending rate changes, the rate payable to lenders under the loan will change at the next scheduled adjustment date specified in the loan agreement. Floating rate loans are typically issued to companies (‘‘borrowers’’) in connection with recapitalizations, acquisitions, and refinancings. Floating rate loan investments are generally below investment grade. Senior floating rate loans are secured by specific collateral of a borrower and are senior in the borrower’s capital structure. The senior position in the borrower’s capital structure generally gives holders of senior loans a claim on certain of the borrower’s assets that is senior to subordinated debt and preferred and common stock in the case of a borrower’s default. Floating rate loan investments may involve foreign borrowers, and investments may be denominated in foreign currencies. Floating rate loans often involve borrowers whose financial condition is troubled or uncertain and companies that are highly leveraged. The Portfolio may invest in obligations of borrowers who are in bankruptcy proceedings. While the Portfolio generally expects to invest in fully funded term loans, certain of the loans in which the Portfolio may invest include revolving loans, bridge loans, and delayed draw term loans.
Purchasers of floating rate loans may pay and/or receive certain fees. The Portfolio may receive fees such as covenant waiver fees or prepayment penalty fees. The Portfolio may pay fees such as facility fees. Such fees may affect the Portfolio’s return.
· Mezzanine Loans - Mezzanine loans are secured by the stock of the company that owns the assets. Mezzanine loans are a hybrid of debt and equity financing that is typically used to fund the expansion of existing companies. A mezzanine loan is composed of debt capital that gives the lender the right to convert to an ownership or equity interest in the company if the loan is not paid back in time and in full. Mezzanine loans typically are the most subordinated debt obligation in an issuer’s capital structure.
Mortgage- and Asset-Backed Securities
Mortgage- and asset-backed securities represent interests in “pools” of commercial or residential mortgages or other assets, including consumer loans or receivables. The Portfolio may purchase fixed or variable rate commercial or residential mortgage-backed securities issued by the Government National Mortgage Association (“Ginnie Mae”), the Federal National Mortgage Association (“Fannie Mae”), the Federal Home Loan Mortgage Corporation (“Freddie Mac”), or other governmental or government-related entities. Ginnie Mae’s guarantees are backed by the full faith and credit of the U.S. Government, which means that the U.S. Government guarantees that the interest and principal will be paid when due. Fannie Mae and Freddie Mac securities are not backed by the full faith and credit of the U.S. Government. In September 2008, the Federal Housing Finance Agency (“FHFA”), an agency of the U.S. Government, placed Fannie Mae and Freddie Mac under conservatorship. Since that time, Fannie Mae and Freddie Mac have received capital support through U.S. Treasury preferred stock purchases, and Treasury and Federal Reserve purchases of their mortgage-backed securities. The FHFA and the U.S. Treasury have imposed strict limits on the size of these entities’ mortgage portfolios. The FHFA has the power to cancel any contract entered into by Fannie Mae and Freddie Mac prior to FHFA’s appointment as conservator or receiver, including the guarantee obligations of Fannie Mae and Freddie Mac.
The Portfolio may also purchase other mortgage- and asset-backed securities through single- and multi-seller conduits, collateralized debt obligations, structured investment vehicles, and other similar securities. Asset-backed securities may be backed by various consumer obligations, including automobile loans, equipment leases, credit card receivables, or other collateral. In the event the underlying loans are not paid, the securities’ issuer could be forced to sell the assets and recognize losses on such assets, which could impact your return. Unlike traditional debt instruments, payments on these securities include both interest and a partial payment of principal. Mortgage- and asset-backed securities are subject to both extension risk, where borrowers pay off their debt obligations more slowly in times of rising interest rates, and prepayment risk, where borrowers pay off their debt obligations sooner than expected in times of declining interest rates. These risks may reduce the Portfolio’s returns. In addition, investments in mortgage- and asset-backed securities, including those comprised of subprime mortgages, may be subject to a higher degree of credit risk, valuation risk, and liquidity risk than various other types of fixed-income securities. Additionally, although mortgage-backed securities are generally supported by some form of government or private guarantee and/or insurance, there is no assurance that guarantors or insurers will meet their obligations.
Real Estate Investing
The Portfolio may invest in equity and debt securities of real estate-related companies. Such companies may include those in the real estate industry or real estate-related industries. These securities may include common stocks,
Janus Henderson VIT Flexible Bond Portfolio
Notes to Financial Statements
corporate bonds, preferred stocks, and other equity securities, including, but not limited to, mortgage-backed securities, real estate-backed securities, securities of REITs and similar REIT-like entities. A REIT is a trust that invests in real estate-related projects, such as properties, mortgage loans, and construction loans. REITs are generally categorized as equity, mortgage, or hybrid REITs. A REIT may be listed on an exchange or traded OTC.
Restricted Security Transactions
Restricted securities held by the Portfolio may not be sold except in exempt transactions or in a public offering registered under the Securities Act of 1933, as amended. The risk of investing in such securities is generally greater than the risk of investing in the securities of widely held, publicly traded companies. Lack of a secondary market and resale restrictions may result in the inability of the Portfolio to sell a security at a fair price and may substantially delay the sale of the security. In addition, these securities may exhibit greater price volatility than securities for which secondary markets exist.
Securities Lending
Under procedures adopted by the Trustees, the Portfolio may seek to earn additional income by lending securities to certain qualified broker-dealers and institutions. Deutsche Bank AG acts as securities lending agent and a limited purpose custodian or subcustodian to receive and disburse cash balances and cash collateral, hold short-term investments, hold collateral, and perform other custodian functions in accordance with the Agency Securities Lending and Repurchase Agreement. The Portfolio may lend portfolio securities in an amount equal to up to 1/3 of its total assets as determined at the time of the loan origination. There is the risk of delay in recovering a loaned security or the risk of loss in collateral rights if the borrower fails financially. In addition, Janus Capital makes efforts to balance the benefits and risks from granting such loans. All loans will be continuously secured by collateral which may consist of cash, U.S. Government securities, domestic and foreign short-term debt instruments, letters of credit, time deposits, repurchase agreements, money market mutual funds or other money market accounts, or such other collateral as permitted by the SEC. If the Portfolio is unable to recover a security on loan, the Portfolio may use the collateral to purchase replacement securities in the market. There is a risk that the value of the collateral could decrease below the cost of the replacement security by the time the replacement investment is made, resulting in a loss to the Portfolio.
Upon receipt of cash collateral, Janus Capital may invest it in affiliated or non-affiliated cash management vehicles, whether registered or unregistered entities, as permitted by the 1940 Act and rules promulgated thereunder. Janus Capital currently intends to invest the cash collateral in a cash management vehicle for which Janus Capital serves as investment adviser, Janus Henderson Cash Collateral Fund LLC. An investment in Janus Henderson Cash Collateral Fund LLC is generally subject to the same risks that shareholders experience when investing in similarly structured vehicles, such as the potential for significant fluctuations in assets as a result of the purchase and redemption activity of the securities lending program, a decline in the value of the collateral, and possible liquidity issues. Such risks may delay the return of the cash collateral and cause the Portfolio to violate its agreement to return the cash collateral to a borrower in a timely manner. As adviser to the Portfolio and Janus Henderson Cash Collateral Fund LLC, Janus Capital has an inherent conflict of interest as a result of its fiduciary duties to both the Portfolio and Janus Henderson Cash Collateral Fund LLC. Additionally, Janus Capital receives an investment advisory fee of 0.05% for managing Janus Henderson Cash Collateral Fund LLC, but it may not receive a fee for managing certain other affiliated cash management vehicles in which the Portfolio may invest, and therefore may have an incentive to allocate preferred investment opportunities to investment vehicles for which it is receiving a fee.
The value of the collateral must be at least 102% of the market value of the loaned securities that are denominated in U.S. dollars and 105% of the market value of the loaned securities that are not denominated in U.S. dollars. Loaned securities and related collateral are marked-to-market each business day based upon the market value of the loaned securities at the close of business, employing the most recent available pricing information. Collateral levels are then adjusted based on this mark-to-market evaluation.
The cash collateral invested by Janus Capital is disclosed in the Schedule of Investments (if applicable). Income earned from the investment of the cash collateral, net of rebates paid to, or fees paid by, borrowers and less the fees paid to the lending agent are included as “Affiliated securities lending income, net” on the Statement of Operations. There were no securities on loan as of December 31, 2018.
Sovereign Debt
The Portfolio may invest in U.S. and non-U.S. government debt securities (“sovereign debt”). Some investments in sovereign debt, such as U.S. sovereign debt, are considered low risk. However, investments in sovereign debt, especially
Janus Henderson VIT Flexible Bond Portfolio
Notes to Financial Statements
the debt of less developed countries, can involve a high degree of risk, including the risk that the governmental entity that controls the repayment of sovereign debt may not be willing or able to repay the principal and/or to pay the interest on its sovereign debt in a timely manner. A sovereign debtor’s willingness or ability to satisfy its debt obligation may be affected by various factors including, but not limited to, its cash flow situation, the extent of its foreign currency reserves, the availability of foreign exchange when a payment is due, the relative size of its debt position in relation to its economy as a whole, the sovereign debtor’s policy toward international lenders, and local political constraints to which the governmental entity may be subject. Sovereign debtors may also be dependent on expected disbursements from foreign governments, multilateral agencies, and other entities. The failure of a sovereign debtor to implement economic reforms, achieve specified levels of economic performance, or repay principal or interest when due may result in the cancellation of third party commitments to lend funds to the sovereign debtor, which may further impair such debtor’s ability or willingness to timely service its debts. The Portfolio may be requested to participate in the rescheduling of such sovereign debt and to extend further loans to governmental entities, which may adversely affect the Portfolio’s holdings. In the event of default, there may be limited or no legal remedies for collecting sovereign debt and there may be no bankruptcy proceedings through which the Portfolio may collect all or part of the sovereign debt that a governmental entity has not repaid. In addition, to the extent the Portfolio invests in non-U.S. sovereign debt, it may be subject to currency risk.
TBA Commitments
The Portfolio may enter into “to be announced” or “TBA” commitments. TBAs are forward agreements for the purchase or sale of securities, including mortgage-backed securities, for a fixed price, with payment and delivery on an agreed upon future settlement date. The specific securities to be delivered are not identified at the trade date. However, delivered securities must meet specified terms, including issuer, rate, and mortgage terms. Although the particular TBA securities must meet industry-accepted “good delivery” standards, there can be no assurance that a security purchased on forward commitment basis will ultimately be issued or delivered by the counterparty. During the settlement period, the Portfolio will still bear the risk of any decline in the value of the security to be delivered. Because TBA commitments do not require the purchase and sale of identical securities, the characteristics of the security delivered to the Portfolio may be less favorable than the security delivered to the dealer. If the counterparty to a transaction fails to deliver the security, the Portfolio could suffer a loss.
When-Issued, Delayed Delivery and Forward Commitment Transactions
The Portfolio may purchase or sell securities on a when-issued, delayed delivery, or forward commitment basis. When purchasing a security on a when-issued, delayed delivery, or forward commitment basis, the Portfolio assumes the rights and risks of ownership of the security, including the risk of price and yield fluctuations, and takes such fluctuations into account when determining its net asset value. Typically, no income accrues on securities the Portfolio has committed to purchase prior to the time delivery of the securities is made. Because the Portfolio is not required to pay for the security until the delivery date, these risks are in addition to the risks associated with the Portfolio’s other investments. If the other party to a transaction fails to deliver the securities, the Portfolio could miss a favorable price or yield opportunity. If the Portfolio remains substantially fully invested at a time when when-issued, delayed delivery, or forward commitment purchases are outstanding, the purchases may result in a form of leverage.
When the Portfolio has sold a security on a when-issued, delayed delivery, or forward commitment basis, the Portfolio does not participate in future gains or losses with respect to the security. If the other party to a transaction fails to pay for the securities, the Portfolio could suffer a loss. Additionally, when selling a security on a when-issued, delayed delivery, or forward commitment basis without owning the security, the Portfolio will incur a loss if the security’s price appreciates in value such that the security’s price is above the agreed upon price on the settlement date. The Portfolio may dispose of or renegotiate a transaction after it is entered into, and may purchase or sell when-issued, delayed delivery or forward commitment securities before the settlement date, which may result in a gain or loss.
3. Investment Advisory Agreements and Other Transactions with Affiliates
The Portfolio pays Janus Capital an investment advisory fee which is calculated daily and paid monthly. The following table reflects the Portfolio’s contractual investment advisory fee rate (expressed as an annual rate).
| | |
Average Daily Net Assets of the Portfolio | Contractual Investment Advisory Fee (%) |
First $300 Million | 0.55 |
Over $300 Million | 0.45 |
Janus Henderson VIT Flexible Bond Portfolio
Notes to Financial Statements
Janus Capital has contractually agreed to waive the advisory fee payable by the Portfolio or reimburse expenses in an amount equal to the amount, if any, that the Portfolio’s total annual fund operating expenses, including the investment advisory fee, but excluding the 12b-1 distribution and shareholder servicing fees (applicable to Service Shares), transfer agent fees and expenses payable pursuant to the Transfer Agency Agreement, brokerage commissions, interest, dividends, taxes, acquired fund fees and expenses, and extraordinary expenses, exceed the annual rate of 0.57% of the Portfolio’s average daily net assets. Janus Capital has agreed to continue the waivers until at least May 1, 2019. If applicable, amounts waived and/or reimbursed to the Portfolio by Janus Capital are disclosed as “Excess Expense Reimbursement and Waivers” on the Statement of Operations.
Janus Services LLC (“Janus Services”), a wholly-owned subsidiary of Janus Capital, is the Portfolio’s transfer agent. Janus Services receives an administrative services fee at an annual rate of 0.05% of the average daily net assets of the Portfolio for arranging for the provision by participating insurance companies and qualified plan service providers of administrative services, including recordkeeping, subaccounting, order processing, or other shareholder services provided on behalf of contract holders or plan participants investing in the Portfolio. Other shareholder services may include the provision of order confirmations, periodic account statements, forwarding prospectuses, shareholder reports, and other materials to existing investors, and answering inquiries regarding accounts. Janus Services expects to use this entire fee to compensate insurance companies and qualified plan service providers for providing these services to their customers who invest in the Portfolio. Any unused portion will be reimbursed to the applicable share class at least annually.
In addition, Janus Services provides or arranges for the provision of certain other internal administrative, recordkeeping, and shareholder relations services for the Portfolio. Janus Services is not compensated for these internal services related to the shares, except for out-of-pocket costs. These amounts are disclosed as “Other transfer agent fees and expenses” on the Statement of Operations.
Under a distribution and shareholder servicing plan (the “Plan”) adopted in accordance with Rule 12b-1 under the 1940 Act, the Service Shares may pay the Trust’s distributor, Janus Distributors LLC (“Janus Distributors”), a wholly-owned subsidiary of Janus Capital, a fee for the sale and distribution and/or shareholder servicing of the Service Shares at an annual rate of up to 0.25% of the average daily net assets of the Service Shares. Under the terms of the Plan, the Trust is authorized to make payments to Janus Distributors for remittance to insurance companies and qualified plan service providers as compensation for distribution and/or shareholder services performed by such entities. These amounts are disclosed as “12b-1 Distribution and shareholder servicing fees” on the Statement of Operations. Payments under the Plan are not tied exclusively to actual 12b-1 distribution and servicing fees, and the payments may exceed 12b-1 distribution and servicing fees actually incurred. If any of the Portfolio’s actual 12b-1 distribution and servicing fees incurred during a calendar year are less than the payments made during a calendar year, the Portfolio will be refunded the difference. Refunds, if any, are included in “12b-1 Distribution and shareholder servicing fees” in the Statement of Operations.
Janus Capital serves as administrator to the Portfolio pursuant to an administration agreement between Janus Capital and the Trust. Under the administration agreement, Janus Capital is obligated to provide or arrange for the provision of certain administration, compliance, and accounting services to the Portfolio, including providing office space for the Portfolio, and is reimbursed by the Portfolio for certain of its costs in providing these services (to the extent Janus Capital seeks reimbursement and such costs are not otherwise waived). In addition, employees of Janus Capital and/or its affiliates may serve as officers of the Trust. The Portfolio pays for some or all of the salaries, fees, and expenses of Janus Capital employees and Portfolio officers, with respect to certain specified administration functions they perform on behalf of the Portfolio. The Portfolio pays these costs based on out-of-pocket expenses incurred by Janus Capital, and these costs are separate and apart from advisory fees and other expenses paid in connection with the investment advisory services Janus Capital (or any subadvisor, as applicable) provides to the Portfolio. These amounts are disclosed as “Affiliated portfolio administration fees” on the Statement of Operations. In addition, some expenses related to compensation payable to the Portfolio’s Chief Compliance Officer and certain compliance staff, all of whom are employees of Janus Capital and/or its affiliates, are shared with the Portfolio. Total compensation of $34,180 was paid to the Chief Compliance Officer and certain compliance staff by the Trust during the year ended December 31, 2018. The Portfolio's portion is reported as part of “Other expenses” on the Statement of Operations.
Effective April 1, 2018, BNP Paribas Financial Services (“BPFS”) provides certain administrative services to the Portfolio, including services related to Portfolio accounting, calculation of the Portfolio’s daily NAV, and Portfolio audit, tax, and reporting obligations, pursuant to a sub-administration agreement with Janus Capital on behalf of the Portfolio.
Janus Henderson VIT Flexible Bond Portfolio
Notes to Financial Statements
Janus Capital, as administrator, oversees the provision of these services by BPFS. As compensation for such services, Janus Capital pays BPFS a fee based on a percentage of the Portfolio’s assets, along with a flat fee, and is reimbursed by the Portfolio for amounts paid to BPFS (to the extent Janus Capital seeks reimbursement and such costs are not otherwise waived). These amounts are disclosed as part of "Other expenses" on the Statement of Operations.
The Board of Trustees has adopted a deferred compensation plan (the “Deferred Plan”) for independent Trustees to elect to defer receipt of all or a portion of the annual compensation they are entitled to receive from the Portfolio. All deferred fees are credited to an account established in the name of the Trustees. The amounts credited to the account then increase or decrease, as the case may be, in accordance with the performance of one or more of the Janus Henderson funds that are selected by the Trustees. The account balance continues to fluctuate in accordance with the performance of the selected fund or funds until final payment of all amounts are credited to the account. The fluctuation of the account balance is recorded by the Portfolio as unrealized appreciation/(depreciation) and is included as of December 31, 2018 on the Statement of Assets and Liabilities in the asset, “Non-interested Trustees’ deferred compensation,” and liability, “Non-interested Trustees’ deferred compensation fees.” Additionally, the recorded unrealized appreciation/(depreciation) is included in “Unrealized net appreciation/(depreciation) of investments and non-interested Trustees’ deferred compensation” on the Statement of Assets and Liabilities. Deferred compensation expenses for the year ended December 31, 2018 are included in “Non-interested Trustees’ fees and expenses” on the Statement of Operations. Trustees are allowed to change their designation of mutual funds from time to time. Amounts will be deferred until distributed in accordance with the Deferred Plan. Deferred fees of $511,200 were paid by the Trust to the Trustees under the Deferred Plan during the year ended December 31, 2018.
Pursuant to the provisions of the 1940 Act and related rules, the Portfolio may participate in an affiliated or nonaffiliated cash sweep program. In the cash sweep program, uninvested cash balances of the Portfolio may be used to purchase shares of affiliated or nonaffiliated money market funds or cash management pooled investment vehicles. The Portfolio is eligible to participate in the cash sweep program (the “Investing Funds”). As adviser, Janus Capital has an inherent conflict of interest because of its fiduciary duties to the affiliated money market funds or cash management pooled investment vehicles and the Investing Funds. Janus Henderson Cash Liquidity Fund LLC is an affiliated unregistered cash management pooled investment vehicle that invests primarily in highly-rated short-term fixed-income securities. Janus Henderson Cash Liquidity Fund LLC currently maintains a NAV of $1.00 per share and distributes income daily in a manner consistent with a registered product compliant with Rule 2a-7 under the 1940 Act. There are no restrictions on the Portfolio's ability to withdraw investments from Janus Henderson Cash Liquidity Fund LLC at will, and there are no unfunded capital commitments due from the Portfolio to Janus Henderson Cash Liquidity Fund LLC. The units of Janus Henderson Cash Liquidity Fund LLC are not charged any management fee, sales charge or service fee.
Any purchases and sales, realized gains/losses and recorded dividends from affiliated investments during the year ended December 31, 2018 can be found in the “Schedules of Affiliated Investments” located in the Schedule of Investments.
The Portfolio is permitted to purchase or sell securities (“cross-trade”) between itself and other funds or accounts managed by Janus Capital in accordance with Rule 17a-7 under the Investment Company Act of 1940 (“Rule 17a-7”), when the transaction is consistent with the investment objectives and policies of the Portfolio and in accordance with the Internal Cross Trade Procedures adopted by the Trust’s Board of Trustees. These procedures have been designed to ensure that any cross-trade of securities by the Portfolio from or to another fund or account that is or could be considered an affiliate of the Portfolio under certain limited circumstances by virtue of having a common investment adviser, common Officer, or common Trustee complies with Rule 17a-7. Under these procedures, each cross-trade is effected at the current market price to save costs where allowed. During the year ended December 31, 2018, the Portfolio engaged in cross trades amounting to $43,086,456 in purchases and $29,100,979 in sales, resulting in a net realized loss of $424,002. The net realized loss is included within the “Net Realized Gain/(Loss) on Investments” section of the Portfolio’s Statement of Operations.
4. Federal Income Tax
The tax components of capital shown in the table below represent: (1) distribution requirements the Portfolio must satisfy under the income tax regulations; (2) losses or deductions the Portfolio may be able to offset against income and gains realized in future years; and (3) unrealized appreciation or depreciation of investments for federal income tax purposes.
Janus Henderson VIT Flexible Bond Portfolio
Notes to Financial Statements
Other book to tax differences primarily consist of deferred compensation. The Portfolio has elected to treat gains and losses on forward foreign currency contracts as capital gains and losses, if applicable. Other foreign currency gains and losses on debt instruments are treated as ordinary income for federal income tax purposes pursuant to Section 988 of the Internal Revenue Code.
| | | | | | | | |
| | | | Loss Deferrals | Other Book | Net Tax | |
Undistributed
Ordinary Income | Undistributed
Long-Term Gains | Accumulated
Capital Losses | Late-Year
Ordinary Loss | Post-October
Capital Loss | to Tax
Differences | Appreciation/
(Depreciation) | |
$ 3,379,701 | $ - | $ (26,436,027) | $ - | $ - | $ (15,159) | $ (5,855,466) | |
Accumulated capital losses noted below represent net capital loss carryovers, as of December 31, 2018, that may be available to offset future realized capital gains and thereby reduce future taxable gains distributions. The following table shows these capital loss carryovers.
| | | | | | |
| | | | | | |
Capital Loss Carryover Schedule | | |
For the year ended December 31, 2018 | | |
| | No Expiration | | | |
| Short-Term | Long-Term | Accumulated
Capital Losses | | |
| $(22,717,558) | $(3,718,469) | $ (26,436,027) | | |
The aggregate cost of investments and the composition of unrealized appreciation and depreciation of investment securities for federal income tax purposes as of December 31, 2018 are noted below. The primary differences between book and tax appreciation or depreciation of investments are wash sale loss deferrals and investments in partnerships.
| | | | |
Federal Tax Cost | Unrealized
Appreciation | Unrealized
(Depreciation) | Net Tax Appreciation/
(Depreciation) |
$ 626,487,948 | $ 4,193,357 | $(10,048,823) | $ (5,855,466) |
| | | | |
Income and capital gains distributions are determined in accordance with income tax regulations that may differ from accounting principles generally accepted in the United States of America. These differences are due to differing treatments for items such as net short-term gains, deferral of wash sale losses, net investment losses, and capital loss carryovers. Certain permanent differences such as tax returns of capital and net investment losses noted below have been reclassified to capital.
| | | | | |
For the year ended December 31, 2018 | |
Distributions | | |
From Ordinary Income | From Long-Term Capital Gains | Tax Return of Capital | Net Investment Loss | |
$ 18,567,082 | $ - | $ - | $ - | |
| | | | | |
For the year ended December 31, 2017 | |
Distributions | | |
From Ordinary Income | From Long-Term Capital Gains | Tax Return of Capital | Net Investment Loss | |
$ 19,337,528 | $ - | $ - | $ - | |
Janus Henderson VIT Flexible Bond Portfolio
Notes to Financial Statements
Permanent book to tax basis differences may result in reclassifications between the components of net assets. These differences have no impact on the results of operations or net assets. The following reclassifications have been made to the Portfolio:
| | | |
| | | |
Increase/(Decrease) to Capital | Increase/(Decrease) to Undistributed
Net Investment Income/Loss | Increase/(Decrease) to Undistributed
Net Realized Gain/Loss |
$ - | $ 606,859 | $ (606,859) |
| | | |
5. Capital Share Transactions
| | | | | | | |
| | | | | | | |
| | | Year ended December 31, 2018 | | Year ended December 31, 2017 |
| | | Shares | Amount | | Shares | Amount |
| | | | | | | |
Institutional Shares: | | | | | |
Shares sold | 2,289,421 | $ 26,034,627 | | 3,453,758 | $ 40,639,685 |
Reinvested dividends and distributions | 725,542 | 8,145,523 | | 785,137 | 9,202,522 |
Shares repurchased | (6,562,712) | (74,574,537) | | (8,082,750) | (95,330,955) |
Net Increase/(Decrease) | (3,547,749) | $(40,394,387) | | (3,843,855) | $(45,488,748) |
Service Shares: | | | | | |
Shares sold | 6,052,211 | $ 75,073,739 | | 6,337,426 | $ 81,111,460 |
Reinvested dividends and distributions | 851,192 | 10,421,559 | | 794,338 | 10,135,006 |
Shares repurchased | (7,120,496) | (88,387,309) | | (7,219,792) | (92,314,915) |
Net Increase/(Decrease) | (217,093) | $ (2,892,011) | | (88,028) | $ (1,068,449) |
6. Purchases and Sales of Investment Securities
For the year ended December 31, 2018, the aggregate cost of purchases and proceeds from sales of investment securities (excluding any short-term securities, short-term options contracts, TBAs, and in-kind transactions, as applicable) was as follows:
| | | | |
Purchases of
Securities | Proceeds from Sales
of Securities | Purchases of Long-
Term U.S. Government
Obligations | Proceeds from Sales
of Long-Term U.S.
Government Obligations |
$516,252,511 | $ 624,778,374 | $ 966,576,565 | $ 861,538,040 |
7. Recent Accounting Pronouncements
The Securities and Exchange Commission adopted amendments to Regulation S-X for the presentation of distributable earnings and distributions to align with US Generally Accepted Accounting Principles (GAAP). The compliance date of the amendments to Regulation S-X was November 5, 2018. This report incorporates the amendments to Regulation S-X.
The FASB issued Accounting Standards Update No. 2017-08, Receivables – Nonrefundable Fees and Other Costs (Subtopic 310-20), Premium Amortization on Purchased Callable Debt Securities ("ASU 2017-08") to amend the amortization period for certain purchased callable debt securities held at a premium. The guidance requires certain premiums on callable debt securities to be amortized to the earliest call date. The amortization period for callable debt securities purchased at a discount will not be impacted. The amendments are effective for fiscal years, and interim periods within those fiscal years, beginning after December 15, 2018. Early adoption is permitted, including adoption in an interim period. Management is currently evaluating the impacts of ASU 2017-08 on the financial statements.
The FASB issued Accounting Standards Update 2018-13, Fair Value Measurement (Topic 820), in August 2018. The new guidance removes, modifies and enhances the disclosures to Topic 820. For public entities, the amendments are effective for financial statements issued for fiscal years beginning after December 15, 2019, and interim periods within those fiscal years. Management is currently evaluating the impact of this new guidance on the financial statements.
Janus Henderson VIT Flexible Bond Portfolio
Notes to Financial Statements
8. Subsequent Event
Management has evaluated whether any events or transactions occurred subsequent to December 31, 2018 and through the date of issuance of the Portfolio’s financial statements and determined that there were no material events or transactions that would require recognition or disclosure in the Portfolio’s financial statements.
Janus Henderson VIT Flexible Bond Portfolio
Report of Independent Registered Public Accounting Firm
To the Board of Trustees of Janus Aspen Series and Shareholders of Janus Henderson VIT Flexible Bond Portfolio:
Opinion on the Financial Statements
We have audited the accompanying statement of assets and liabilities, including the schedule of investments, of Janus Henderson VIT Flexible Bond Portfolio (one of the portfolios constituting Janus Aspen Series, referred to hereafter as the "Portfolio") as of December 31, 2018, the related statement of operations for the year ended December 31, 2018, the statements of changes in net assets for each of the two years in the period ended December 31, 2018, including the related notes, and the financial highlights for each of the five years in the period ended December 31, 2018 (collectively referred to as the “financial statements”). In our opinion, the financial statements present fairly, in all material respects, the financial position of the Portfolio as of December 31, 2018, the results of its operations for the year then ended, the changes in its net assets for each of the two years in the period ended December 31, 2018 and the financial highlights for each of the five years in the period ended December 31, 2018 in conformity with accounting principles generally accepted in the United States of America.
Basis for Opinion
These financial statements are the responsibility of the Portfolio’s management. Our responsibility is to express an opinion on the Portfolio’s financial statements based on our audits. We are a public accounting firm registered with the Public Company Accounting Oversight Board (United States) (PCAOB) and are required to be independent with respect to the Portfolio in accordance with the U.S. federal securities laws and the applicable rules and regulations of the Securities and Exchange Commission and the PCAOB.
We conducted our audits of these financial statements in accordance with the standards of the PCAOB. Those standards require that we plan and perform the audit to obtain reasonable assurance about whether the financial statements are free of material misstatement, whether due to error or fraud.
Our audits included performing procedures to assess the risks of material misstatement of the financial statements, whether due to error or fraud, and performing procedures that respond to those risks. Such procedures included examining, on a test basis, evidence regarding the amounts and disclosures in the financial statements. Our audits also included evaluating the accounting principles used and significant estimates made by management, as well as evaluating the overall presentation of the financial statements. Our procedures included confirmation of securities owned as of December 31, 2018 by correspondence with the custodian, transfer agent, and brokers; when replies were not received from brokers, we performed other auditing procedures. We believe that our audits provide a reasonable basis for our opinion.

Denver, Colorado
February 15, 2019
We have served as the auditor of one or more investment companies in Janus Henderson Funds since 1990.
Janus Henderson VIT Flexible Bond Portfolio
Additional Information (unaudited)
Proxy Voting Policies and Voting Record
A description of the policies and procedures that the Portfolio uses to determine how to vote proxies relating to its portfolio securities is available without charge: (i) upon request, by calling 1-800-525-1093; (ii) on the Portfolio’s website at janushenderson.com/proxyvoting; and (iii) on the SEC’s website at http://www.sec.gov. Additionally, information regarding the Portfolio’s proxy voting record for the most recent twelve-month period ended June 30 is also available, free of charge, through janushenderson.com/proxyvoting and from the SEC’s website at http://www.sec.gov.
Full Holdings
The Portfolio is required to disclose its complete holdings on Form N-Q within 60 days of the end of the first and third fiscal quarters, and in the annual report and semiannual report to Portfolio shareholders. These reports (i) are available on the SEC’s website at http://www.sec.gov; (ii) may be reviewed and copied at the SEC’s Public Reference Room in Washington, D.C. (information on the Public Reference Room may be obtained by calling 1-800-SEC-0330); and (iii) are available without charge, upon request, by calling a Janus Henderson representative at 1-877-335-2687 (toll free) . Portfolio holdings consisting of at least the names of the holdings are generally available on a monthly basis with a 30-day lag. Holdings are generally posted approximately two business days thereafter under Full Holdings for the Portfolio at janushenderson.com/vit.
APPROVAL OF ADVISORY AGREEMENTS DURING THE PERIOD
The Trustees of Janus Aspen Series, each of whom serves as an “independent” Trustee (the “Trustees”), oversee the management of each Portfolio of Janus Aspen Series (each, a “VIT Portfolio,” and collectively, the “VIT Portfolios”), as well as each Fund of Janus Investment Fund (together with the VIT Portfolios, the “Janus Henderson Funds,” and each, a “Janus Henderson Fund”). As required by law, the Trustees determine annually whether to continue the investment advisory agreement for each Janus Henderson Fund and the subadvisory agreement for each Janus Henderson Funds that utilizes a subadviser.
In connection with their most recent consideration of those agreements for each Janus Henderson Fund, the Trustees received and reviewed information provided by Janus Capital and each subadviser in response to requests of the Trustees and their independent legal counsel. They also received and reviewed information and analysis provided by, and in response to requests of, their independent fee consultant. Throughout their consideration of the agreements, the Trustees were advised by their independent legal counsel. The Trustees met with management to consider the agreements and the information provided, and also met separately in executive session with their independent legal counsel and their independent fee consultant.
At a meeting held on December 6, 2018, based on the Trustees’ evaluation of the information provided by Janus Capital, the subadvisers, and the independent fee consultant, as well as other information, the Trustees determined that the overall arrangements between each Janus Henderson Fund and Janus Capital and each subadviser, as applicable, were fair and reasonable in light of the nature, extent and quality of the services provided by Janus Capital, its affiliates and the subadvisers, the fees charged for those services, and other matters that the Trustees considered relevant in the exercise of their business judgment. At that meeting, the Trustees unanimously approved the continuation of the investment advisory agreement for each Janus Henderson Fund, and the subadvisory agreement for each subadvised Janus Henderson Fund, for the period from February 1, 2019 through February 1, 2020, subject to earlier termination as provided for in each agreement.
In considering the continuation of those agreements, the Trustees reviewed and analyzed various factors that they determined were relevant, including the factors described below, none of which by itself was considered dispositive. However, the material factors and conclusions that formed the basis for the Trustees’ determination to approve the continuation of the agreements are discussed separately below. Also included is a summary of the independent fee consultant’s conclusions and opinions that arose during, and were included as part of, the Trustees’ consideration of the agreements. “Management fees,” as used herein, refer to actual annual advisory fees (and, for the purposes of peer comparisons any administration fees excluding out of pocket costs), net of any waivers, paid by a fund as a percentage of average net assets.
Nature, Extent and Quality of Services
The Trustees reviewed the nature, extent and quality of the services provided by Janus Capital and the subadvisers to the Janus Henderson Funds, taking into account the investment objective, strategies and policies of each Janus Henderson Fund, and the knowledge the Trustees gained from their regular meetings with management on at least a
Janus Henderson VIT Flexible Bond Portfolio
Additional Information (unaudited)
quarterly basis and their ongoing review of information related to the Janus Henderson Funds. In addition, the Trustees reviewed the resources and key personnel of Janus Capital and each subadviser, particularly noting those employees who provide investment and risk management services to the Janus Henderson Funds. The Trustees also considered other services provided to the Janus Henderson Funds by Janus Capital or the subadvisers, such as managing the execution of portfolio transactions and the selection of broker-dealers for those transactions. The Trustees considered Janus Capital’s role as administrator to the Janus Henderson Funds, noting that Janus Capital does not receive a fee for its services but is reimbursed for its out-of-pocket costs. The Trustees considered the role of Janus Capital in monitoring adherence to the Janus Henderson Funds’ investment restrictions, providing support services for the Trustees and Trustee committees, and overseeing communications with fund shareholders and the activities of other service providers, including monitoring compliance with various policies and procedures of the Janus Henderson Funds and with applicable securities laws and regulations.
In this regard, the independent fee consultant noted that Janus Capital provides a number of different services for the Janus Henderson Funds and fund shareholders, ranging from investment management services to various other servicing functions, and that, in its view, Janus Capital is a capable provider of those services. The independent fee consultant also expressed the view that Janus Capital has developed a number of institutional competitive advantages that should enable it to provide superior investment and service performance over the long term.
The Trustees concluded that the nature, extent and quality of the services provided by Janus Capital and the subadviser to each Janus Henderson Fund that utilizes a subadviser were appropriate and consistent with the terms of the respective investment advisory and subadvisory agreements, and that, taking into account steps taken to address those Janus Henderson Funds whose performance lagged that of their peers for certain periods, the Janus Henderson Funds were likely to benefit from the continued provision of those services. They also concluded that Janus Capital and each subadviser had sufficient personnel, with the appropriate education and experience, to serve the Janus Henderson Funds effectively and had demonstrated its ability to attract well-qualified personnel.
Performance of the Funds
The Trustees considered the performance results of each Janus Henderson Fund over various time periods. They noted that they considered Janus Henderson Fund performance data throughout the year, including periodic meetings with each Janus Henderson Fund’s portfolio manager(s), and also reviewed information comparing each Janus Henderson Fund’s performance with the performance of comparable funds and peer groups identified by Broadridge Financial Solutions, Inc. (“Broadridge”), an independent data provider, and with the Janus Henderson Fund’s benchmark index. In this regard, the independent fee consultant found that the overall Janus Henderson Funds’ performance has been reasonable: for the 36 months ended September 30, 2018, approximately 48% of the Janus Henderson Funds were in the top two quartiles of performance, as reported by Morningstar, and for the 12 months ended September 30, 2018, approximately 56% of the Janus Henderson Funds were in the top two quartiles of performance, as reported by Morningstar.
The Trustees considered the performance of each Janus Henderson Fund, noting that performance may vary by share class, and noted the following with respect to the VIT Portfolios:
· For Janus Henderson Balanced Portfolio, the Trustees noted that the Fund’s performance was in the first Broadridge quartile for the 36 months ended May 31, 2018 and the first Broadridge quartile for the 12 months ended May 31, 2018.
· For Janus Henderson Enterprise Portfolio, the Trustees noted that the Fund’s performance was in the first Broadridge quartile for the 36 months ended May 31, 2018 and the second Broadridge quartile for the 12 months ended May 31, 2018.
· For Janus Henderson Flexible Bond Portfolio, the Trustees noted that the Fund’s performance was in the bottom Broadridge quartile for the 36 months ended May 31, 2018 and the bottom Broadridge quartile for the 12 months ended May 31, 2018. The Trustees noted the reasons for the Fund’s underperformance and the steps Janus Capital had taken or was taking to improve performance.
· For Janus Henderson Forty Portfolio, the Trustees noted that the Fund’s performance was in the third Broadridge quartile for the 36 months ended May 31, 2018 and the third Broadridge quartile for the 12 months ended May 31,
Janus Henderson VIT Flexible Bond Portfolio
Additional Information (unaudited)
2018. The Trustees noted the reasons for the Fund’s underperformance, while also noting that the Fund has a performance fee structure that results in lower management fees during periods of underperformance, and the steps Janus Capital had taken or was taking to improve performance.
· For Janus Henderson Global Research Portfolio, the Trustees noted that the Fund’s performance was in the bottom Broadridge quartile for the 36 months ended May 31, 2018 and the third Broadridge quartile for the 12 months ended May 31, 2018. The Trustees noted the reasons for the Fund’s underperformance, while also noting that the Fund has a performance fee structure that results in lower management fees during periods of underperformance, and the steps Janus Capital had taken or was taking to improve performance.
· For Janus Henderson Global Technology Portfolio, the Trustees noted that the Fund’s performance was in the first Broadridge quartile for the 36 months ended May 31, 2018 and the first Broadridge quartile for the 12 months ended May 31, 2018.
· For Janus Henderson Global Unconstrained Bond Portfolio, the Trustees noted that the Fund’s performance was in the bottom Broadridge quartile for the 36 months ended May 31, 2018 and the bottom Broadridge quartile for the 12 months ended May 31, 2018. The Trustees noted the reasons for the Fund’s underperformance and the steps Janus Capital had taken or was taking to improve performance.
· For Janus Henderson Mid Cap Value Portfolio, the Trustees noted that the Fund’s performance was in the second Broadridge quartile for the 36 months ended May 31, 2018 and the bottom Broadridge quartile for the 12 months ended May 31, 2018.
· For Janus Henderson Overseas Portfolio, the Trustees noted that the Fund’s performance was in the bottom Broadridge quartile for the 36 months ended May 31, 2018 and the second Broadridge quartile for the 12 months ended May 31, 2018. The Trustees noted the reasons for the Fund’s underperformance, while also noting that the Fund has a performance fee structure that results in lower management fees during periods of underperformance, the steps Janus Capital had taken or was taking to improve performance, and that the performance trend was improving.
· For Janus Henderson Research Portfolio, the Trustees noted that the Fund’s performance was in the third Broadridge quartile for the 36 months ended May 31, 2018 and the third Broadridge quartile for the 12 months ended May 31, 2018. The Trustees noted the reasons for the Fund’s underperformance, while also noting that the Fund has a performance fee structure that results in lower management fees during periods of underperformance, and the steps Janus Capital had taken or was taking to improve performance.
· For Janus Henderson U.S. Low Volatility Portfolio, the Trustees noted that the Fund’s performance was in the third Broadridge quartile for the 36 months ended May 31, 2018 and the bottom Broadridge quartile for the 12 months ended May 31, 2018. The Trustees noted the reasons for the Fund’s underperformance and the steps Janus Capital and Intech had taken or were taking to improve performance.
In consideration of each Janus Henderson Fund’s performance, the Trustees concluded that, taking into account the factors relevant to performance, as well as other considerations, including steps taken to improve performance, the Janus Henderson Fund’s performance warranted continuation of such Janus Henderson Fund’s investment advisory and subadvisory agreement(s).
Costs of Services Provided
The Trustees examined information regarding the fees and expenses of each Janus Henderson Fund in comparison to similar information for other comparable funds as provided by Broadridge, an independent data provider. They also reviewed an analysis of that information provided by their independent fee consultant and noted that the management fee rate (investment advisory and any administration fees, but excluding out-of-pocket costs) for many of the Janus Henderson Funds, net of waivers, was below the average management fee rate of the respective peer group of funds selected by Broadridge. The Trustees also examined information regarding the subadvisory fees charged for subadvisory services, as applicable, noting that all such fees were paid by Janus Capital out of its management fees collected from such Janus Henderson Fund. The Trustees also considered the total expenses for each share class of each Janus Henderson Fund compared to the average total expenses for its Broadridge Expense Group peers and to average total expenses for its Broadridge Expense Universe.
The independent fee consultant expressed the view that the management fees charged by Janus Capital to each of the Janus Henderson Funds under the current investment advisory and administration agreements are reasonable in relation to the services provided by Janus Capital. At the fund complex level, the independent fee consultant found: (1)
Janus Henderson VIT Flexible Bond Portfolio
Additional Information (unaudited)
the total expenses and management fees of the Janus Henderson Funds to be reasonable relative to other mutual funds; (2) total expenses, on average, were 10% under the average total expenses for the respective Broadridge Expense Group peers and 19% under the average total expenses for the respective Broadridge Expense Universes; (3) management fees for the Janus Henderson Funds, on average, were 8% under the average management fees for the respective Expense Groups and 10% under the average for the respective Expense Universes; and (4) Janus Henderson Fund expenses by function for each asset and share class category were reasonable relative to peer benchmarks.
The independent fee consultant concluded that, based on its strategic review of expenses at the complex, category and individual share class level, Janus Henderson Fund expenses were found to be reasonable relative to peer benchmarks. Further, for certain Janus Henderson Funds, the independent fee consultant also performed a systematic “focus list” analysis of expenses in the context of the performance or service delivered to investors in each Janus Henderson Fund. Based on this analysis, the independent fee consultant found that the combination of service quality/performance and expenses on these individual Janus Henderson Funds were reasonable in light of performance trends, performance histories, and existence of performance fees, breakpoints, and expense waivers on such “focus list” Funds.
The Trustees considered the methodology used by Janus Capital and each subadviser in determining compensation payable to portfolio managers, the competitive environment for investment management talent, and the competitive market for mutual funds in different distribution channels.
The Trustees also reviewed management fees charged by Janus Capital and each subadviser to comparable separate account clients and to comparable non-affiliated funds subadvised by Janus Capital or by a subadviser (for which Janus Capital or the subadviser provides only or primarily portfolio management services). Although in most instances comparable subadvisory and separate account fee rates for various investment strategies were lower than management fee rates for Janus Henderson Funds having a similar strategy, while subadviser fee rates charged to the Janus Henderson Funds were generally within a reasonable range of the fee rates that the subadviser charges to comparable separate account clients or non-affiliated funds. The Trustees considered that Janus Capital noted that, under the terms of the management agreements with the Janus Henderson Funds, Janus Capital performs significant additional services for the Janus Henderson Funds that it does not provide to those other clients, including administration services, oversight of the Janus Henderson Funds’ other service providers, trustee support, regulatory compliance and numerous other services, and that, in serving the Janus Henderson Funds, Janus Capital assumes many legal risks and other costs that it does not assume in servicing its other clients. Moreover, the Trustees noted that the independent fee consultant found that: (1) the management fees Janus Capital charges to the Janus Henderson Funds are reasonable in relation to the management fees Janus Capital charges to its institutional clients and to the fees Janus Capital charges to funds subadvised by Janus Capital; (2) these institutional and subadvised accounts have different service and infrastructure needs; (3) Janus Henderson mutual fund investors enjoy reasonable fees relative to the fees charged to Janus Henderson institutional and subadvised fund investors; (4) in three of five product categories, the Janus Henderson Funds receive proportionally better pricing than the industry in relation to Janus Henderson institutional clients; and (5) in six of seven strategies, Janus Capital has lower management fees than the management fees charged to funds subadvised by Janus Capital.
The Trustees considered the fees for each Janus Henderson Fund for its fiscal year ended in 2017, including the VIT Portfolios, and noted the following with regard to each VIT Portfolio’s total expenses, net of applicable fee waivers (the VIT Portfolio’s “total expenses”):
· For Janus Henderson Balanced Portfolio, the Trustees noted that, although the Fund’s total expenses exceeded the peer group average for one share class, overall the Fund’s total expenses were reasonable.
· For Janus Henderson Enterprise Portfolio, the Trustees noted that, although the Fund’s total expenses exceeded the peer group average for one share class, overall the Fund’s total expenses were reasonable.
· For Janus Henderson Flexible Bond Portfolio, the Trustees noted that, although the Fund’s total expenses exceeded the peer group average for one share class, overall the Fund’s total expenses were reasonable. The Trustees also noted that Janus Capital has contractually agreed to limit the Fund’s expenses, although this limit did not apply because the Fund’s total expenses were already below the applicable fee limit.
· For Janus Henderson Forty Portfolio, the Trustees noted that, although the Fund’s total expenses exceeded the peer group average for one share class, overall the Fund’s total expenses were reasonable.
Janus Henderson VIT Flexible Bond Portfolio
Additional Information (unaudited)
· For Janus Henderson Global Research Portfolio, the Trustees noted that the Fund’s total expenses were below the peer group average for both share classes.
· For Janus Henderson Global Technology Portfolio, the Trustees noted that the Fund’s total expenses were below the peer group average for both share classes.
· For Janus Henderson Global Unconstrained Bond Portfolio, the Trustees noted that, although the Fund’s total expenses exceeded the peer group average for both share classes, overall the Fund’s total expenses were reasonable. The Trustees also noted that Janus Capital has contractually agreed to limit the Fund’s expenses.
· For Janus Henderson Mid Cap Value Portfolio, the Trustees noted that the Fund’s total expenses were below the peer group average for both share classes.
· For Janus Henderson Overseas Portfolio, the Trustees noted that the Fund’s total expenses were below the peer group average for both share classes.
· For Janus Henderson Research Portfolio, the Trustees noted that the Fund’s total expenses were below the peer group average for both share classes.
· For Janus Henderson U.S. Low Volatility Portfolio, the Trustees noted that the Fund’s total expenses were below the peer group average for its sole share class.
The Trustees reviewed information on the overall profitability to Janus Capital and its affiliates of their relationship with the Janus Henderson Funds, and considered profitability data of other publicly traded fund managers. The Trustees recognized that profitability comparisons among fund managers are difficult because of the variation in the type of comparative information that is publicly available, and the profitability of any fund manager is affected by numerous factors, including the organizational structure of the particular fund manager, differences in complex size, differences in product mix, differences in types of business (mutual fund, institutional and other), differences in the methodology for allocating expenses, and the fund manager’s capital structure and cost of capital.
Additionally, the Trustees considered the estimated profitability to Janus Capital from the investment management services it provides to each Janus Henderson Fund. In their review, the Trustees considered whether Janus Capital and each subadviser receive adequate incentives and resources to manage the Janus Henderson Funds effectively. In reviewing profitability, the Trustees noted that the estimated profitability for an individual Janus Henderson Fund is necessarily a product of the allocation methodology utilized by Janus Capital to allocate its expenses as part of the estimated profitability calculation. In this regard, the Trustees noted that the independent fee consultant concluded that (1) the expense allocation methodology utilized by Janus Capital was reasonable and (2) the estimated profitability to Janus Capital from the investment management services it provided to each Janus Henderson Fund was reasonable. The Trustees also considered that the estimated profitability for an individual Janus Henderson Fund was influenced by a number of factors, including not only the allocation methodology selected, but also the presence of fee waivers and expense caps, and whether the Janus Henderson Fund’s investment management agreement contained breakpoints or a performance fee component. The Trustees determined, after taking into account these factors, among others, that Janus Capital’s estimated profitability with respect to each Janus Henderson Fund was not unreasonable in relation to the services provided, and that the variation in the range of such estimated profitability among the Janus Henderson Funds was not a material factor in the Board’s approval of the reasonableness of any Janus Henderson Fund’s investment management fees.
The Trustees concluded that the management fees payable by each Janus Henderson Fund to Janus Capital, as well as the fees paid by Janus Capital to the subadvisers of subadvised Janus Henderson Funds, were reasonable in relation to the nature, extent, and quality of the services provided, taking into account the fees charged by other advisers for managing comparable mutual funds with similar strategies, the fees Janus Capital and the subadvisers charge to other clients, and, as applicable, the impact of fund performance on management fees payable by the Janus Henderson Funds. The Trustees also concluded that each Janus Henderson Fund’s total expenses were reasonable, taking into account the size of the Janus Henderson Fund, the quality of services provided by Janus Capital and any subadviser, the investment performance of the Janus Henderson Fund, and any expense limitations agreed to or provided by Janus Capital.
Economies of Scale
The Trustees considered information about the potential for Janus Capital to realize economies of scale as the assets of the Janus Henderson Funds increase. They noted the independent fee consultant’s analysis of economies of scale
Janus Henderson VIT Flexible Bond Portfolio
Additional Information (unaudited)
in prior years. They also noted that, although many Janus Henderson Funds pay advisory fees at a base fixed rate as a percentage of net assets, without any breakpoints or performance fees, the independent fee consultant concluded that 74% of these Janus Henderson Funds’ share classes have contractual management fees (gross of waivers) below their Broadridge Expense Group averages. They also noted that for those Janus Henderson Funds whose expenses are being reduced by contractual expense limitations with Janus Capital, Janus Capital is subsidizing certain of these Janus Henderson Funds because they have not reached adequate scale. Moreover, as the assets of some of the Janus Henderson Funds have declined in the past few years, certain Janus Henderson Funds have benefited from having advisory fee rates that have remained constant rather than increasing as assets declined. In addition, performance fee structures have been implemented for various Janus Henderson Funds that have caused the effective rate of advisory fees payable by such a Janus Henderson Fund to vary depending on the investment performance of the Janus Henderson Fund relative to its benchmark index over the measurement period; and a few Janus Henderson Funds have fee schedules with breakpoints and reduced fee rates above certain asset levels. The Trustees also noted that the Janus Henderson Funds share directly in economies of scale through the lower charges of third-party service providers that are based in part on the combined scale of all of the Janus Henderson Funds.
The Trustees also considered information provided by the independent fee consultant, which concluded that, given the limitations of various analytical approaches to economies of scale it had considered in prior years, and their conflicting results, it is difficult to analytically confirm or deny the existence of economies of scale in the Janus Henderson complex. The independent consultant further concluded that (1) to the extent there were economies of scale at Janus Capital, Janus Capital’s general strategy of setting fixed management fees below peers appeared to share any such economies with investors even on smaller Janus Henderson Funds which have not yet achieved those economies and (2) by setting lower fixed fees from the start on these Janus Henderson Funds, Janus Capital appeared to be investing to increase the likelihood that these Janus Henderson Funds will grow to a level to achieve any scale economies that may exist. Further, the independent fee consultant expressed the view that Janus Henderson Fund investors are well-served by the performance fee structures in place on the Janus Henderson Funds in light of any economies of scale that may be present at Janus Capital.
Based on all of the information they reviewed, including past research and analysis conducted by the Trustees’ independent fee consultant, the Trustees concluded that the current fee structure of each Janus Henderson Fund was reasonable and that the current rates of fees do reflect a sharing between Janus Capital and the Janus Henderson Fund of any economies of scale that may be present at the current asset level of the Janus Henderson Fund.
Other Benefits to Janus Capital
The Trustees also considered benefits that accrue to Janus Capital and its affiliates and subadvisers to the Janus Henderson Funds from their relationships with the Janus Henderson Funds. They recognized that two affiliates of Janus Capital separately serve the Janus Henderson Funds as transfer agent and distributor, respectively, and the transfer agent receives compensation directly from the non-money market funds for services provided, and that such compensation contributes to the overall profitability of Janus Capital and its affiliates that results from their relationship with the Janus Henderson Funds. The Trustees also considered Janus Capital’s and each subadviser’s past and proposed use of commissions paid by the Janus Henderson Funds on portfolio brokerage transactions to obtain proprietary and third-party research products and services benefiting the Janus Henderson Fund and/or other clients of Janus Capital and/or Janus Capital, and/or a subadviser to a Janus Henderson Fund. The Trustees concluded that Janus Capital’s and the subadvisers’ use of these types of client commission arrangements to obtain proprietary and third-party research products and services was likely to benefit each Janus Henderson Fund. The Trustees also concluded that, other than the services provided by Janus Capital and its affiliates and subadvisers pursuant to the agreements and the fees to be paid by each Janus Henderson Fund therefor, the Janus Henderson Funds and Janus Capital and the subadvisers may potentially benefit from their relationship with each other in other ways. They concluded that Janus Capital and its affiliates share directly in economies of scale through the lower charges of third-party service providers that are based in part on the combined scale of the Janus Henderson Funds and other clients serviced by Janus Capital and its affiliates. They also concluded that Janus Capital and/or the subadvisers benefit from the receipt of research products and services acquired through commissions paid on portfolio transactions of the Janus Henderson Funds and that the Janus Henderson Funds benefit from Janus Capital’s and/or the subadvisers’ receipt of those products and services as well as research products and services acquired through commissions paid by certain other clients of Janus Capital and/or other clients of the subadvisers. They further concluded that the success of any Janus Henderson Fund could attract other business to Janus Capital, the subadvisers or other Janus Henderson funds,
Janus Henderson VIT Flexible Bond Portfolio
Additional Information (unaudited)
and that the success of Janus Capital and the subadvisers could enhance Janus Capital’s and the subadvisers’ ability to serve the Janus Henderson Funds.
Janus Henderson VIT Flexible Bond Portfolio
Useful Information About Your Portfolio Report (unaudited)
Management Commentary
The Management Commentary in this report includes valuable insight as well as statistical information to help you understand how your Portfolio’s performance and characteristics stack up against those of comparable indices.
If the Portfolio invests in foreign securities, this report may include information about country exposure. Country exposure is based primarily on the country of risk. A company may be allocated to a country based on other factors such as location of the company’s principal office, the location of the principal trading market for the company’s securities, or the country where a majority of the company’s revenues are derived.
Please keep in mind that the opinions expressed in the Management Commentary are just that: opinions. They are a reflection based on best judgment at the time this report was compiled, which was December 31, 2018. As the investing environment changes, so could opinions. These views are unique and are not necessarily shared by fellow employees or by Janus Henderson in general.
Performance Overviews
Performance overview graphs compare the performance of a hypothetical $10,000 investment in the Portfolio with one or more widely used market indices. When comparing the performance of the Portfolio with an index, keep in mind that market indices are not available for investment and do not reflect deduction of expenses.
Average annual total returns are quoted for a Portfolio with more than one year of performance history. Average annual total return is calculated by taking the growth or decline in value of an investment over a period of time, including reinvestment of dividends and distributions, then calculating the annual compounded percentage rate that would have produced the same result had the rate of growth been constant throughout the period. Average annual total return does not reflect the deduction of taxes that a shareholder would pay on Portfolio distributions or redemptions of Portfolio shares.
Cumulative total returns are quoted for a Portfolio with less than one year of performance history. Cumulative total return is the growth or decline in value of an investment over time, independent of the period of time involved. Cumulative total return does not reflect the deduction of taxes that a shareholder would pay on Portfolio distributions or redemptions of Portfolio shares.
Pursuant to federal securities rules, expense ratios shown in the performance chart reflect subsidized (if applicable) and unsubsidized ratios. The total annual fund operating expenses ratio is gross of any fee waivers, reflecting the Portfolio’s unsubsidized expense ratio. The net annual fund operating expenses ratio (if applicable) includes contractual waivers of Janus Capital and reflects the Portfolio’s subsidized expense ratio. Ratios may be higher or lower than those shown in the “Financial Highlights” in this report.
Schedule of Investments
Following the performance overview section is the Portfolio’s Schedule of Investments. This schedule reports the types of securities held in the Portfolio on the last day of the reporting period. Securities are usually listed by type (common stock, corporate bonds, U.S. Government obligations, etc.) and by industry classification (banking, communications, insurance, etc.). Holdings are subject to change without notice.
The value of each security is quoted as of the last day of the reporting period. The value of securities denominated in foreign currencies is converted into U.S. dollars.
If the Portfolio invests in foreign securities, it will also provide a summary of investments by country. This summary reports the Portfolio exposure to different countries by providing the percentage of securities invested in each country. The country of each security represents the country of risk. The Portfolio’s Schedule of Investments relies upon the industry group and country classifications published by Barclays and/or MSCI Inc.
Tables listing details of individual forward currency contracts, futures, written options, swaptions, and swaps follow the Portfolio’s Schedule of Investments (if applicable).
Statement of Assets and Liabilities
This statement is often referred to as the “balance sheet.” It lists the assets and liabilities of the Portfolio on the last day of the reporting period.
Janus Henderson VIT Flexible Bond Portfolio
Useful Information About Your Portfolio Report (unaudited)
The Portfolio’s assets are calculated by adding the value of the securities owned, the receivable for securities sold but not yet settled, the receivable for dividends declared but not yet received on securities owned, and the receivable for Portfolio shares sold to investors but not yet settled. The Portfolio’s liabilities include payables for securities purchased but not yet settled, Portfolio shares redeemed but not yet paid, and expenses owed but not yet paid. Additionally, there may be other assets and liabilities such as unrealized gain or loss on forward currency contracts.
The section entitled “Net Assets Consist of” breaks down the components of the Portfolio’s net assets. Because the Portfolio must distribute substantially all earnings, you will notice that a significant portion of net assets is shareholder capital.
The last section of this statement reports the net asset value (“NAV”) per share on the last day of the reporting period. The NAV is calculated by dividing the Portfolio’s net assets for each share class (assets minus liabilities) by the number of shares outstanding.
Statement of Operations
This statement details the Portfolio’s income, expenses, realized gains and losses on securities and currency transactions, and changes in unrealized appreciation or depreciation of Portfolio holdings.
The first section in this statement, entitled “Investment Income,” reports the dividends earned from securities and interest earned from interest-bearing securities in the Portfolio.
The next section reports the expenses incurred by the Portfolio, including the advisory fee paid to the investment adviser, transfer agent fees and expenses, and printing and postage for mailing statements, financial reports and prospectuses. Expense offsets and expense reimbursements, if any, are also shown.
The last section lists the amounts of realized gains or losses from investment and foreign currency transactions, and changes in unrealized appreciation or depreciation of investments and foreign currency-denominated assets and liabilities. The Portfolio will realize a gain (or loss) when it sells its position in a particular security. A change in unrealized gain (or loss) refers to the change in net appreciation or depreciation of the Portfolio during the reporting period. “Net Realized and Unrealized Gain/(Loss) on Investments” is affected both by changes in the market value of Portfolio holdings and by gains (or losses) realized during the reporting period.
Statements of Changes in Net Assets
These statements report the increase or decrease in the Portfolio’s net assets during the reporting period. Changes in the Portfolio’s net assets are attributable to investment operations, dividends and distributions to investors, and capital share transactions. This is important to investors because it shows exactly what caused the Portfolio’s net asset size to change during the period.
The first section summarizes the information from the Statement of Operations regarding changes in net assets due to the Portfolio’s investment operations. The Portfolio’s net assets may also change as a result of dividend and capital gains distributions to investors. If investors receive their dividends and/or distributions in cash, money is taken out of the Portfolio to pay the dividend and/or distribution. If investors reinvest their dividends and/or distributions, the Portfolio’s net assets will not be affected. If you compare the Portfolio’s “Net Decrease from Dividends and Distributions” to “Reinvested Dividends and Distributions,” you will notice that dividends and distributions have little effect on the Portfolio’s net assets. This is because the majority of the Portfolio’s investors reinvest their dividends and/or distributions.
The reinvestment of dividends and distributions is included under “Capital Share Transactions.” “Capital Shares” refers to the money investors contribute to the Portfolio through purchases or withdrawals via redemptions. The Portfolio’s net assets will increase and decrease in value as investors purchase and redeem shares from the Portfolio.
Financial Highlights
This schedule provides a per-share breakdown of the components that affect the Portfolio’s NAV for current and past reporting periods as well as total return, asset size, ratios, and portfolio turnover rate.
The first line in the table reflects the NAV per share at the beginning of the reporting period. The next line reports the net investment income/(loss) per share. Following is the per share total of net gains/(losses), realized and unrealized. Per share dividends and distributions to investors are then subtracted to arrive at the NAV per share at the end of the
Janus Henderson VIT Flexible Bond Portfolio
Useful Information About Your Portfolio Report (unaudited)
period. The next line reflects the total return for the period. Also included are ratios of expenses and net investment income to average net assets.
The Portfolio’s expenses may be reduced through expense offsets and expense reimbursements. The ratios shown reflect expenses before and after any such offsets and reimbursements.
The ratio of net investment income/(loss) summarizes the income earned less expenses, divided by the average net assets of the Portfolio during the reporting period. Do not confuse this ratio with the Portfolio’s yield. The net investment income ratio is not a true measure of the Portfolio’s yield because it does not take into account the dividends distributed to the Portfolio’s investors.
The next figure is the portfolio turnover rate, which measures the buying and selling activity in the Portfolio. Portfolio turnover is affected by market conditions, changes in the asset size of the Portfolio, fluctuating volume of shareholder purchase and redemption orders, the nature of the Portfolio’s investments, and the investment style and/or outlook of the portfolio manager(s) and/or investment personnel. A 100% rate implies that an amount equal to the value of the entire portfolio was replaced once during the fiscal year; a 50% rate means that an amount equal to the value of half the portfolio is traded in a year; and a 200% rate means that an amount equal to the value of the entire portfolio is traded every six months.
Janus Henderson VIT Flexible Bond Portfolio
Trustees and Officers (unaudited)
The Portfolio’s Statement of Additional Information includes additional information about the Trustees and officers and is available, without charge, by calling 1-877-335-2687.
The following are the Trustees and officers of the Trust, together with a brief description of their principal occupations during the last five years (principal occupations for certain Trustees may include periods over five years).
Each Trustee has served in that capacity since he or she was originally elected or appointed. The Trustees do not serve a specified term of office. Each Trustee will hold office until the termination of the Trust or his or her earlier death, resignation, retirement, incapacity, or removal. Under the Portfolio’s Governance Procedures and Guidelines, the policy is for Trustees to retire no later than the end of the calendar year in which the Trustee turns 75. The Trustees review the Portfolio’s Governance Procedures and Guidelines from time to time and may make changes they deem appropriate. The Portfolio’s Nominating and Governance Committee will consider nominees for the position of Trustee recommended by shareholders. Shareholders may submit the name of a candidate for consideration by the Committee by submitting their recommendations to the Trust’s Secretary. Each Trustee is currently a Trustee of one other registered investment company advised by Janus Capital: Janus Investment Fund. Collectively, these two registered investment companies consist of 60 series or funds.
The Trust’s officers are elected annually by the Trustees for a one-year term. Certain officers also serve as officers of Janus Investment Fund. Certain officers of the Portfolio may also be officers and/or directors of Janus Capital. Except as otherwise disclosed, Portfolio officers receive no compensation from the Portfolio, except for the Portfolio’s Chief Compliance Officer, as authorized by the Trustees.
Janus Henderson VIT Flexible Bond Portfolio
Trustees and Officers (unaudited)
| | | | | | |
TRUSTEES |
Name, Address, and Age | Positions Held with the Trust | Length of Time Served | Principal Occupations During the Past Five Years | Number of Portfolios/Funds in Fund Complex Overseen by Trustee | Other Directorships Held by Trustee During the Past Five Years |
Independent Trustees |
William F. McCalpin
151 Detroit Street
Denver, CO 80206
DOB: 1957 | Chairman
Trustee | 1/08-Present
6/02-Present | Managing Partner, Impact Investments, Athena Capital Advisors LLC (independent registered investment advisor) (since 2016). Formerly, Managing Director, Holos Consulting LLC (provides consulting services to foundations and other nonprofit organizations) (2009-2016), Chief Executive Officer, Imprint Capital Advisors (impact investment firm) (2013-2015) and Executive Vice President and Chief Operating Officer of The Rockefeller Brothers Fund (a private family foundation) (1998-2006). | 60 | Director of Mutual Fund Directors Forum (a non-profit organization serving independent directors of U.S. mutual funds), Chairman of the Board and Trustee of The Investment Fund for Foundations Investment Program (TIP) (consisting of 2 funds), and Director of the F.B. Heron Foundation (a private grantmaking foundation). |
Janus Henderson VIT Flexible Bond Portfolio
Trustees and Officers (unaudited)
| | | | | | |
TRUSTEES |
Name, Address, and Age | Positions Held with the Trust | Length of Time Served | Principal Occupations During the Past Five Years | Number of Portfolios/Funds in Fund Complex Overseen by Trustee | Other Directorships Held by Trustee During the Past Five Years |
Independent Trustees |
Alan A. Brown
151 Detroit Street
Denver, CO 80206
DOB: 1962 | Trustee | 1/13-Present | Principal, Principal Curam Holdings (since 2018). Formery, Executive Vice President, Institutional Markets, of Black Creek Group (private equity real estate investment management firm) (2012-2018), Executive Vice President and Co-Head, Global Private Client Group (2007-2010), Executive Vice President, Mutual Funds (2005-2007), and Chief Marketing Officer (2001-2005) of Nuveen Investments, Inc. (asset management). | 60 | Director of WTTW (PBS affiliate) (since 2003). Formerly, Director of MotiveQuest LLC (strategic social market research company) (2003-2016); Director of Nuveen Global Investors LLC (2007-2011); Director of Communities in Schools (2004-2010); and Director of Mutual Fund Education Alliance (until 2010). |
Janus Henderson VIT Flexible Bond Portfolio
Trustees and Officers (unaudited)
| | | | | | |
TRUSTEES |
Name, Address, and Age | Positions Held with the Trust | Length of Time Served | Principal Occupations During the Past Five Years | Number of Portfolios/Funds in Fund Complex Overseen by Trustee | Other Directorships Held by Trustee During the Past Five Years |
Independent Trustees |
William D. Cvengros
151 Detroit Street
Denver, CO 80206
DOB: 1948 | Trustee | 1/11-Present | Chief Executive Officer of SJC Capital, LLC (a personal investment company and consulting firm) (since 2002). Formerly, Venture Partner for The Edgewater Funds (a middle market private equity firm) (2002-2004); Chief Executive Officer and President of PIMCO Advisors Holdings L.P. (a publicly traded investment management firm) (1994-2000); and Chief Investment Officer (1987-1994) and Vice Chairman and Director (1990-1994) of Pacific Life Insurance Company (a mutual life insurance and annuity company) (1987-1994). | 60 | Advisory Board Member, Innovate Partners Emerging Growth and Equity Fund I (early stage venture capital fund) (since 2014). Formerly, Managing Trustee of National Retirement Partners Liquidating Trust (2013-2016); Chairman, National Retirement Partners, Inc. (formerly a network of advisors to 401(k) plans) (2005-2013); Director of Prospect Acquisition Corp. (a special purpose acquisition corporation) (2007-2009); Director of RemedyTemp, Inc. (temporary help services company) (1996-2006); and Trustee of PIMCO Funds Multi-Manager Series (1990-2000) and Pacific Life Variable Life & Annuity Trusts (1987-1994). |
Janus Henderson VIT Flexible Bond Portfolio
Trustees and Officers (unaudited)
| | | | | | |
TRUSTEES |
Name, Address, and Age | Positions Held with the Trust | Length of Time Served | Principal Occupations During the Past Five Years | Number of Portfolios/Funds in Fund Complex Overseen by Trustee | Other Directorships Held by Trustee During the Past Five Years |
Independent Trustees |
Raudline Etienne
151 Detroit Street
Denver, CO 80206
DOB: 1965 | Trustee | 6/16-Present | Founder, Daraja Capital (advisory and investment firm) (since 2016), and Senior Advisor, Albright Stonebridge Group LLC (global strategy firm) (since 2016). Formerly, Senior Vice President (2011-2015), Albright Stonebridge Group LLC; and Deputy Comptroller and Chief Investment Officer, New York State Common Retirement Fund (public pension fund) (2008-2011). | 60 | Director of Brightwood Capital Advisors, LLC (since 2014). |
Janus Henderson VIT Flexible Bond Portfolio
Trustees and Officers (unaudited)
| | | | | | |
TRUSTEES |
Name, Address, and Age | Positions Held with the Trust | Length of Time Served | Principal Occupations During the Past Five Years | Number of Portfolios/Funds in Fund Complex Overseen by Trustee | Other Directorships Held by Trustee During the Past Five Years |
Independent Trustees |
Gary A. Poliner 151 Detroit Street Denver, CO 80206
DOB: 1953 | Trustee | 6/16-Present | Retired. Formerly, President (2010-2013) of Northwestern Mutual Life Insurance Company. | 60 | Director of MGIC Investment Corporation (private mortgage insurance) (since 2013) and West Bend Mutual Insurance Company (property/casualty insurance) (since 2013). Formerly, Trustee of Northwestern Mutual Life Insurance Company (2010-2013); and Director of Frank Russell Company (global asset management firm) (2008-2013). |
Janus Henderson VIT Flexible Bond Portfolio
Trustees and Officers (unaudited)
| | | | | | |
TRUSTEES |
Name, Address, and Age | Positions Held with the Trust | Length of Time Served | Principal Occupations During the Past Five Years | Number of Portfolios/Funds in Fund Complex Overseen by Trustee | Other Directorships Held by Trustee During the Past Five Years |
Independent Trustees |
James T. Rothe*
151 Detroit Street
Denver, CO 80206
DOB: 1943 | Trustee | 1/97-Present | Professor Emeritus of Business of the University of Colorado, Colorado Springs, CO (since 2004). Formerly, Co-founder and Managing Director of Roaring Fork Capital SBIC, L.P. (SBA SBIC fund focusing on private investment in public equity firms) (2004-2014), Professor of Business of the University of Colorado (2002-2004), and Distinguished Visiting Professor of Business (2001-2002) of Thunderbird (American Graduate School of International Management), Glendale, AZ. | 60 | Formerly, Director of Red Robin Gourmet Burgers, Inc. (RRGB) (2004-2014). |
*James T. Rothe retired from his role as Independent Trustee, effective December 31, 2018. | |
Janus Henderson VIT Flexible Bond Portfolio
Trustees and Officers (unaudited)
| | | | | | |
TRUSTEES |
Name, Address, and Age | Positions Held with the Trust | Length of Time Served | Principal Occupations During the Past Five Years | Number of Portfolios/Funds in Fund Complex Overseen by Trustee | Other Directorships Held by Trustee During the Past Five Years |
Independent Trustees |
William D. Stewart
151 Detroit Street
Denver, CO 80206
DOB: 1944 | Trustee | 6/84-Present | Retired. Formerly, President and founder of HPS Products and Corporate Vice President of MKS Instruments, Boulder, CO (a provider of advanced process control systems for the semiconductor industry) (1976-2012). | 60 | None |
Diane L. Wallace
151 Detroit Street
Denver, CO 80206
DOB: 1958 | Trustee | 6/17-Present | Retired. | 60 | Formerly, Independent Trustee, Henderson Global Funds (13 portfolios) (2015-2017); Independent Trustee, State Farm Associates' Funds Trust, State Farm Mutual Fund Trust, and State Farm Variable Product Trust (28 portfolios) (2013-2017); Chief Operating Officer, Senior Vice President-Operations, and Chief Financial Officer for Driehaus Capital Management, LLC (1988-2006); and Treasurer for Driehaus Mutual Funds (1996-2002). |
Janus Henderson VIT Flexible Bond Portfolio
Trustees and Officers (unaudited)
| | | | | | |
TRUSTEES |
Name, Address, and Age | Positions Held with the Trust | Length of Time Served | Principal Occupations During the Past Five Years | Number of Portfolios/Funds in Fund Complex Overseen by Trustee | Other Directorships Held by Trustee During the Past Five Years |
Independent Trustees |
Linda S. Wolf
151 Detroit Street
Denver, CO 80206
DOB: 1947 | Trustee | 11/05-Present | Retired. Formerly, Chairman and Chief Executive Officer of Leo Burnett (Worldwide) (advertising agency) (2001-2005). | 60 | Director of Chicago Community Trust (Regional Community Foundation), Chicago Council on Global Affairs, InnerWorkings (U.S. provider of print procurement solutions to corporate clients), Lurie Children’s Hospital (Chicago, IL), Shirley Ryan Ability Lab and Wrapports, LLC (digital communications company). Formerly, Director of Walmart (until 2017), Director of Chicago Convention & Tourism Bureau (until 2014) and The Field Museum of Natural History (Chicago, IL) (until 2014). |
Janus Henderson VIT Flexible Bond Portfolio
Trustees and Officers (unaudited)
| | | | |
OFFICERS |
Name, Address, and Age | Positions Held with the Trust | Term of Office* and Length of Time Served | Principal Occupations During the Past Five Years |
Michael Keough
151 Detroit Street
Denver, CO 80206
DOB: 1978 | Executive Vice President and Co-Portfolio Manager Janus Henderson Flexible Bond Portfolio | 12/15 - Present | Portfolio Manager for other Janus Henderson accounts. |
Mayur Saigal
151 Detroit Street
Denver, CO 80206
DOB: 1975 | Executive Vice President and Co-Portfolio Manager Janus Henderson Flexible Bond Portfolio | 12/15 - Present | Portfolio Manager for other Janus Henderson accounts. |
Darrell Watters
151 Detroit Street
Denver, CO 80206
DOB: 1963 | Executive Vice President and Co-Portfolio Manager Janus Henderson Flexible Bond Portfolio | 5/07-Present
| Head of U.S. Fundamental Fixed Income of Janus Henderson Investors and Portfolio Manager for other Janus Henderson accounts. |
Bruce L. Koepfgen
151 Detroit Street
Denver, CO 80206
DOB: 1952 | President and Chief Executive Officer | 7/14-Present | Head of North America at Janus Henderson Investors and Janus Capital Management LLC (since 2017); Executive Vice President and Director of Janus International Holding LLC (since 2011); Executive Vice President of Janus Distributors LLC (since 2011); Vice President and Director of INTECH Investment Management LLC (since 2011); Executive Vice President and Director of Perkins Investment Management LLC (since 2011); and Executive Vice President and Director of Janus Management Holdings Corporation (since 2011). Formerly, President of Janus Capital Group Inc. and Janus Capital Management LLC (2013-2017); Executive Vice President of Janus Services LLC (2011-2015), Janus Capital Group Inc. and Janus Capital Management LLC (2011-2013); and Chief Financial Officer of Janus Capital Group Inc., Janus Capital Management LLC, Janus Distributors LLC, Janus Management Holdings Corporation, and Janus Services LLC (2011-2013). |
* Officers are elected at least annually by the Trustees for a one-year term and may also be elected from time to time by the Trustees for an interim period. |
Janus Henderson VIT Flexible Bond Portfolio
Trustees and Officers (unaudited)
| | | | |
OFFICERS |
Name, Address, and Age | Positions Held with the Trust | Term of Office* and Length of Time Served | Principal Occupations During the Past Five Years |
Susan K. Wold
151 Detroit Street
Denver, CO 80206
DOB: 1960 | Vice President, Chief Compliance Officer, and Anti-Money Laundering Officer | 9/17-Present | Senior Vice President and Head of
Compliance, North America for Janus
Henderson (since September 2017);
Formerly, Vice President, Head of Global Corporate Compliance, and Chief
Compliance Officer for Janus Capital
Management LLC (May 2017-September 2017); Vice President, Compliance at Janus Capital Group Inc. and Janus Capital Management LLC (2005-2017). |
Jesper Nergaard
151 Detroit Street
Denver, CO 80206
DOB: 1962 | Chief Financial Officer
Vice President, Treasurer, and Principal Accounting Officer | 3/05-Present
2/05-Present | Vice President of Janus Capital and Janus Services LLC. |
Kathryn L. Santoro
151 Detroit Street
Denver, CO 80206
DOB: 1974 | Vice President, Chief Legal Counsel, and Secretary | 12/16-Present | Vice President of Janus Capital and Janus Services LLC (since 2016). Formerly, Vice President and Associate Counsel of Curian Capital, LLC and Curian Clearing LLC (2013-2016); and General Counsel and Secretary (2011-2012) and Vice President (2009-2012) of Old Mutual Capital, Inc. |
* Officers are elected at least annually by the Trustees for a one-year term and may also be elected from time to time by the Trustees for an interim period. |
Knowledge. Shared
At Janus Henderson, we believe in the sharing of expert insight for better investment and business decisions. We call this ethos Knowledge. Shared.
Learn more by visiting janushenderson.com.
| | | | | | | | | |
| | | | | |

| | | | |
This report is submitted for the general information of shareholders of the Portfolio. It is not an offer or solicitation for the Portfolio and is not authorized for distribution to prospective investors unless preceded or accompanied by an effective prospectus. |
Janus Henderson, Janus, Henderson, Perkins, Intech and Knowledge. Shared are trademarks of Janus Henderson Group plc or one of its subsidiaries. © Janus Henderson Group plc. Janus Henderson Distributors |
| | | | | 109-02-81114 02-19 |
| | | |
| | | |
| | | ANNUAL REPORT December 31, 2018 |
| | |
| | Janus Henderson VIT Forty Portfolio |
| | |
| | Janus Aspen Series |
Beginning on January 1, 2021, as permitted by regulations adopted by the Securities and Exchange Commission, the insurance company that offers your variable life insurance contract or variable annuity contract, may determine that it will no longer send you paper copies of the Portfolio’s shareholder reports, unless you specifically request paper copies of the reports. Beginning on January 1, 2021, for shareholders who are not insurance contract holders, paper copies of the Portfolio’s shareholder reports will no longer be sent by mail unless you specifically request paper copies of the reports. Instead, the reports will be made available on a website, and your insurance company or plan sponsor, broker-dealer, or financial intermediary will notify you by mail each time a report is posted and provide you with a website link to access the report. Instructions for requesting paper copies will be provided by your insurance company or plan sponsor, broker-dealer, or financial intermediary. If you already elected to receive shareholder reports electronically, you will not be affected by this change and you need not take any action. You may elect to receive shareholder reports and other communications from the Portfolio electronically by contacting your insurance company or plan sponsor, broker-dealer, or other financial intermediary. You may elect to receive all future reports in paper free of charge by contacting your insurance company or plan sponsor, broker dealer or other financial intermediary. Your election to receive reports in paper will apply to all funds held in your account with your insurance company or plan sponsor, broker dealer or other financial intermediary. |
| | | |
| | | HIGHLIGHTS · Portfolio management perspective · Investment strategy behind your portfolio · Portfolio performance, characteristics
and holdings |
| | | |
| | | 
|
Table of Contents
Janus Henderson VIT Forty Portfolio
| | |
Management Commentary and Schedule of Investments | 1 |
Notes to Schedule of Investments and Other Information | 11 |
Statement of Assets and Liabilities | 12 |
Statement of Operations | 13 |
Statements of Changes in Net Assets | 14 |
Financial Highlights | 15 |
Notes to Financial Statements | 16 |
Report of Independent Registered Public Accounting Firm | 24 |
Additional Information | 25 |
Useful Information About Your Portfolio Report | 32 |
Designation Requirements | 35 |
Trustees and Officers | 36 |
Janus Henderson VIT Forty Portfolio (unaudited)
| | | | | | |
PORTFOLIO SNAPSHOT We believe that constructing a concentrated portfolio of quality growth companies will allow us to outperform our benchmark over time. We define quality as companies that enjoy sustainable “moats” around their businesses, potentially allowing them to grow faster, with higher returns, than their competitors. We believe the market often underestimates these companies’ sustainable competitive advantage periods. | | | | 
Doug Rao co-portfolio manager | 
Nick Schommer co-portfolio manager |
| | | |
PERFORMANCE OVERVIEW
For the 12-month period ended December 31, 2018, Janus Henderson VIT Forty Portfolio’s Institutional Shares and Service Shares returned 1.98% and 1.72%, respectively, versus a return of -1.51% for the Portfolio’s primary benchmark, the Russell 1000® Growth Index. The Portfolio’s secondary benchmark, the S&P 500® Index, returned -4.38% for the period.
INVESTMENT ENVIRONMENT
U.S. equities were volatile and lost ground during the year. While corporate earnings growth was solid, global trade tensions and the prospect of rising interest rates weighed on stocks. In the fourth quarter, markets fell sharply as trade tensions between the U.S. and China escalated and data suggested weaker international economic growth. The energy and materials sectors suffered the steepest losses within the index.
PERFORMANCE DISCUSSION
The Portfolio outperformed both its primary benchmark, the Russell 1000 Growth Index, and its secondary benchmark, the S&P 500 Index, during the period. As part of our investment strategy, we seek companies that have built clear, sustainable, competitive moats around their businesses, which should help them grow market share within their respective industries over time. Important competitive advantages could include a strong brand, network effects from a product or service that would be hard for a competitor to replicate, a lower cost structure than competitors in the industry, a distribution advantage or patent protection over valuable intellectual property. We think emphasizing these sustainable competitive advantages can be a meaningful driver of outperformance over longer time horizons because the market often underestimates the duration of growth for these companies and the long-term potential return to shareholders. This year we saw a number of companies in our Portfolio put up impressive results, further validating our view that they are well positioned to grow in excess of the market.
Salesforce was our top contributor to performance during the year. Strong revenue growth and continued appreciation for its business model have driven the stock higher. We continue to like Salesforce’s position as a leader in cloud-based enterprise software, and believe it will benefit as marketing and sales departments move more functions from on-premises software to the cloud, and as the company moves into new adjacencies beyond sales and marketing departments.
Mastercard was another top contributor. The stock is a longtime holding in which we continue to see its thesis play out. Our long-term view is that payments companies such as Mastercard are poised to benefit as consumers and businesses switch from cash and check to plastic and electronic payments. Mastercard is particularly well positioned to benefit from this shift because a majority of its revenues are generated outside the U.S., where many markets have a lower penetration of card and electronic payments and are experiencing significantly faster electronic purchase volume growth. Several quarters of strong revenue and earnings growth only confirm our point of view.
Amazon also made meaningful contributions to performance. Strong earnings growth has helped reaffirm its powerful, secular growth potential. Amazon is another longtime holding in our Portfolio and our views on the company remain the same: The company’s scale and distribution advantage have entrenched it as the dominant e-commerce platform, which should allow it to continue gaining consumer wallet share as shopping gravitates to online and mobile purchases. Meanwhile, Amazon Web Services is revolutionizing the way companies utilize IT services, using its scale to offer a disruptive pricing model to businesses seeking IT functions in the cloud.
While pleased with the results of most companies in our Portfolio, we still held stocks that detracted from
Janus Henderson VIT Forty Portfolio (unaudited)
performance. Nvidia was one of our largest detractors. The stock declined after the company reported earnings below consensus expectations. We continue to like Nvidia’s long-term outlook, however. The company is a leading supplier of graphics processing units (GPUs), which are at the forefront of accelerated computing, artificial intelligence and autonomous driving. We like the company’s growth potential as these secular themes push forward.
Biotechnology stock Celgene also fell during the period. The biotechnology company faced a few headwinds this year including management turnover, and news that the FDA issued a Refusal to File letter for Celgene’s multiple sclerosis (MS) drug, ozanimod. Although the news was an unwelcome setback, phase 3 data for the drug was promising, and the company reports that another pivotal trial will not be needed. We still think ozanimod will get FDA approval and that the delay should only moderately impact the drug’s sales potential. We also do not feel the market is giving Celgene enough credit for the cash-flow-generation potential of its blood cancer treatment, Revlimid, or the potential of other products in its pipeline.
Facebook was another detractor. Concerns about increased regulatory scrutiny after users have abused the platform have been an overhang for the stock. We expect expense growth to remain elevated as the company addresses these concerns, but continue to own a small position in the company.
OUTLOOK
While global economic growth is slowing, we believe U.S. consumer strength will continue to support the domestic economy in early 2019. For U.S. workers, wage growth remains strong. Lower-wage earners have particularly benefited from a tight labor market, and are experiencing their best income growth in at least a decade. Meanwhile, the benefits of tax reform won’t hit most consumers’ pockets until they receive tax refunds in 2019.
While we believe U.S. consumer spending will continue to support the domestic economy, we are not naïve to risks. Rising interest rates are beginning to affect cyclical segments of the economy and heightened trade tensions present another headwind for growth. But after a market sell-off in the fourth quarter, valuations already reflect many of these concerns.
In our view, the recent sell-off has left valuations more attractive than at any point in at least a few years. This is particularly true for stocks tied to many secular growth trends, which sold off more sharply as some investors holding these stocks were forced to sell positions to deleverage portfolios. We’ve used that volatility as a buying opportunity, and selectively added to position sizes of several secular growth companies.
In prior letters, we’ve mentioned some of the secular trends represented in our Portfolio: the shift from traditional brick and mortar shopping to online spending, the switch of enterprise software from on-premises to the cloud, a proliferation of connected devices in the home and business, the shift in autos from the combustible engine to electronic vehicles and a growing global middle class, to name a few. While many of these themes are well known, they are still nascent in their development, and should continue to push forward regardless of the economic backdrop. We remain focused on our companies’ long-term growth potential as these themes progress.
Thank you for your investment in Janus Henderson VIT Forty Portfolio.
Janus Henderson VIT Forty Portfolio (unaudited)
Portfolio At A Glance
December 31, 2018
| | | | | | | |
| | | | | | | |
| | | | | | | |
| | | | | | | |
| | 5 Top Performers - Holdings | | | | 5 Bottom Performers - Holdings | |
| | | | Contribution | | | Contribution |
| | salesforce.com Inc | | 1.64% | | Apple Inc | -1.19% |
| | Mastercard Inc | | 1.40% | | NVIDIA Corp | -1.06% |
| | Amazon.com Inc | | 1.38% | | Celgene Corp | -1.05% |
| | Microsoft Corp | | 1.06% | | Bank of America Corp | -0.52% |
| | Boston Scientific Corp | | 0.99% | | Facebook Inc | -0.49% |
| | | | | | | |
| | 5 Top Performers - Sectors* | | | | | |
| | | | Portfolio | | Portfolio Weighting | Russell 1000 Growth Index |
| | | | Contribution | | (Average % of Equity) | Weighting |
| | Industrials | | 1.46% | | 5.70% | 12.22% |
| | Consumer Discretionary | | 1.34% | | 14.95% | 17.53% |
| | Information Technology | | 0.95% | | 40.87% | 37.99% |
| | Real Estate | | 0.32% | | 2.02% | 2.22% |
| | Energy | | 0.30% | | 0.00% | 0.87% |
| | | | | | | |
| | 5 Bottom Performers - Sectors* | | | | | |
| | | | Portfolio | | Portfolio Weighting | Russell 1000 Growth Index |
| | | | Contribution | | (Average % of Equity) | Weighting |
| | Financials | | -1.10% | | 9.66% | 3.91% |
| | Communication Services | | -0.10% | | 2.72% | 3.46% |
| | Utilities | | 0.00% | | 0.00% | 0.01% |
| | Other** | | 0.11% | | 2.92% | 0.00% |
| | Health Care | | 0.15% | | 16.31% | 13.26% |
| | | | | | | |
| | Security contribution to performance is measured by using an algorithm that multiplies the daily performance of each security with the previous day’s ending weight in the portfolio and is gross of advisory fees. Fixed income securities and certain equity securities, such as private placements and some share classes of equity securities, are excluded. |
* | Based on sector classification according to the Global Industry Classification Standard (“GICS”) codes, which are the exclusive property and a service mark of MSCI Inc. and Standard & Poor’s. |
** | Not a GICS classified sector. | | | | | |
Janus Henderson VIT Forty Portfolio (unaudited)
Portfolio At A Glance
December 31, 2018
| | |
5 Largest Equity Holdings - (% of Net Assets) |
Alphabet Inc - Class C | |
Interactive Media & Services | 6.9% |
Microsoft Corp | |
Software | 6.4% |
Mastercard Inc | |
Information Technology Services | 5.7% |
Amazon.com Inc | |
Internet & Direct Marketing Retail | 5.2% |
salesforce.com Inc | |
Software | 4.8% |
| | 29.0% |
| | | | | | |
Asset Allocation - (% of Net Assets) |
Common Stocks | | 96.8% |
Investment Companies | | 3.5% |
Other | | (0.3)% |
| | | 100.0% |
| | |
Top Country Allocations - Long Positions - (% of Investment Securities) |
As of December 31, 2018 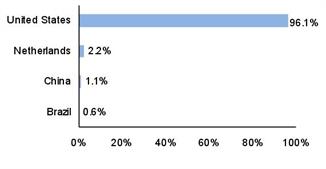
| As of December 31, 2017 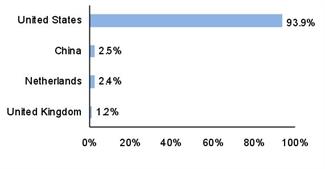
|
Janus Henderson VIT Forty Portfolio (unaudited)
Performance
| |
See important disclosures on the next page. |

| | | | | | | | | | |
| | | | | | | | | |
| | | | | | | | | | Expense Ratios - |
Average Annual Total Return - for the periods ended December 31, 2018 | | | per the April 30, 2018 prospectuses |
| | One
Year | Five
Year | Ten
Year | Since
Inception* | | | Total Annual Fund
Operating Expenses |
Institutional Shares | | 1.98% | 10.63% | 14.68% | 10.98% | | | 0.82% |
Service Shares | | 1.72% | 10.35% | 14.40% | 10.67% | | | 1.06% |
Russell 1000 Growth Index | | -1.51% | 10.40% | 15.29% | 7.22% | | | |
S&P 500 Index | | -4.38% | 8.49% | 13.12% | 7.42% | | | |
Morningstar Quartile - Institutional Shares | | 1st | 1st | 2nd | 1st | | | |
Morningstar Ranking - based on total returns for Large Growth Funds | | 214/1440 | 147/1322 | 331/1131 | 11/621 | | | |
Returns quoted are past performance and do not guarantee future results; current performance may be lower or higher. Investment returns and principal value will vary; there may be a gain or loss when shares are sold. For the most recent month-end performance call 800.668.0434 or visit janushenderson.com/VITperformance.
This Portfolio has a performance-based management fee that may adjust up or down based on the Portfolio’s performance.
Performance may be affected by risks that include those associated with non-diversification, portfolio turnover, short sales, potential conflicts of interest, foreign and emerging markets, initial public offerings (IPOs), high-yield and high-risk securities, undervalued, overlooked and smaller capitalization companies, real estate related securities including Real Estate Investment Trusts (REITs), derivatives, and commodity-linked investments. Each product has different risks. Please see the prospectus for more information about risks, holdings and other details.
Returns do not reflect the deduction of fees, charges or expenses of any insurance product. If applied, returns would have been lower.
Returns include reinvestment of all dividends and distributions and do not reflect the deduction of taxes that a shareholder would pay on Portfolio distributions or redemptions of Portfolio shares. The returns do not include adjustments in accordance with generally accepted accounting principles required at the period end for financial reporting purposes.
See Financial Highlights for actual expense ratios during the reporting period.
Performance for Service Shares prior to December 31, 1999 reflects the performance of Institutional Shares, adjusted to reflect the expenses of Service Shares.
Janus Henderson VIT Forty Portfolio (unaudited)
Performance
Ranking is for the share class shown only; other classes may have different performance characteristics.
© 2018 Morningstar, Inc. All Rights Reserved.
There is no assurance that the investment process will consistently lead to successful investing.
See Notes to Schedule of Investments and Other Information for index definitions.
Index performance does not reflect the expenses of managing a portfolio as an index is unmanaged and not available for direct investment.
See “Useful Information About Your Portfolio Report.”
*The Portfolio’s inception date – May 1 ,1997
Janus Henderson VIT Forty Portfolio (unaudited)
Expense Examples
As a shareholder of the Portfolio, you incur two types of costs: (1) transaction costs and (2) ongoing costs, including management fees; 12b-1 distribution and shareholder servicing fees (applicable to Service Shares only); transfer agent fees and expenses payable pursuant to the Transfer Agency Agreement; and other Portfolio expenses. This example is intended to help you understand your ongoing costs (in dollars) of investing in the Portfolio and to compare these costs with the ongoing costs of investing in other mutual funds. To do so, compare this 5% hypothetical example with the 5% hypothetical examples that appear in the shareholder reports of the other funds. The example is based upon an investment of $1,000 invested at the beginning of the period and held for the six-months indicated, unless noted otherwise in the table and footnotes below.
Actual Expenses
The information in the table under the heading “Actual” provides information about actual account values and actual expenses. You may use the information in these columns, together with the amount you invested, to estimate the expenses that you paid over the period. Simply divide your account value by $1,000 (for example, an $8,600 account value divided by $1,000 = 8.6), then multiply the result by the number in the appropriate column for your share class under the heading entitled “Expenses Paid During Period” to estimate the expenses you paid on your account during the period.
Hypothetical Example for Comparison Purposes
The information in the table under the heading “Hypothetical (5% return before expenses)” provides information about hypothetical account values and hypothetical expenses based upon the Portfolio’s actual expense ratio and an assumed rate of return of 5% per year before expenses, which is not the Portfolio’s actual return. The hypothetical account values and expenses may not be used to estimate the actual ending account balance or expenses you paid for the period. You may use this information to compare the ongoing costs of investing in the Portfolio and other funds. To do so, compare this 5% hypothetical example with the 5% hypothetical examples that appear in the shareholder reports of the other funds. Additionally, for an analysis of the fees associated with an investment in either share class or other similar funds, please visit www.finra.org/fundanalyzer.
Please note that the expenses shown in the table are meant to highlight your ongoing costs only and do not reflect any transaction costs, such as any charges at the separate account level or contract level. These fees are fully described in the Portfolio’s prospectuses. Therefore, the hypothetical examples are useful in comparing ongoing costs only, and will not help you determine the relative total costs of owning different funds. In addition, if these transaction costs were included, your costs would have been higher.
| | | | | | | | | | | |
| | | | | | | | | |
| | | | Actual | | Hypothetical
(5% return before expenses) | |
| Beginning
Account
Value
(7/1/18) | Ending
Account
Value
(12/31/18) | Expenses
Paid During
Period
(7/1/18 - 12/31/18)† | | Beginning
Account
Value
(7/1/18) | Ending
Account
Value
(12/31/18) | Expenses
Paid During
Period
(7/1/18 - 12/31/18)† | Net Annualized
Expense Ratio
(7/1/18 - 12/31/18) |
Institutional Shares | $1,000.00 | $916.20 | $3.33 | | $1,000.00 | $1,021.73 | $3.52 | 0.69% |
Service Shares | $1,000.00 | $914.70 | $4.54 | | $1,000.00 | $1,020.47 | $4.79 | 0.94% |
† | Expenses Paid During Period are equal to the Net Annualized Expense Ratio multiplied by the average account value over the period, multiplied by 184/365 (to reflect the one-half year period). Expenses in the examples include the effect of applicable fee waivers and/or expense reimbursements, if any. Had such waivers and/or reimbursements not been in effect, your expenses would have been higher. Please refer to the Notes to Financial Statements or the Portfolio’s prospectuses for more information regarding waivers and/or reimbursements. |
Janus Henderson VIT Forty Portfolio
Schedule of Investments
December 31, 2018
| | | | | | | | |
Shares
| | | Value | |
Common Stocks – 96.8% | | | |
Aerospace & Defense – 5.0% | | | |
| | Boeing Co | | 72,073 | | | $23,243,542 | |
| | Harris Corp | | 95,008 | | | 12,792,827 | |
| | | 36,036,369 | |
Banks – 2.6% | | | |
| | Bank of America Corp | | 759,527 | | | 18,714,745 | |
Biotechnology – 2.4% | | | |
| | Celgene Corp* | | 181,154 | | | 11,610,160 | |
| | Regeneron Pharmaceuticals Inc* | | 14,858 | | | 5,549,463 | |
| | | 17,159,623 | |
Capital Markets – 5.6% | | | |
| | Charles Schwab Corp | | 363,897 | | | 15,112,642 | |
| | Intercontinental Exchange Inc | | 334,285 | | | 25,181,689 | |
| | | 40,294,331 | |
Chemicals – 4.0% | | | |
| | Air Products & Chemicals Inc | | 76,619 | | | 12,262,871 | |
| | Sherwin-Williams Co | | 41,967 | | | 16,512,336 | |
| | | 28,775,207 | |
Construction Materials – 1.2% | | | |
| | Vulcan Materials Co | | 85,022 | | | 8,400,174 | |
Electronic Equipment, Instruments & Components – 0.8% | | | |
| | TE Connectivity Ltd | | 74,904 | | | 5,664,990 | |
Entertainment – 2.6% | | | |
| | Live Nation Entertainment Inc* | | 151,779 | | | 7,475,116 | |
| | Netflix Inc* | | 42,748 | | | 11,441,930 | |
| | | 18,917,046 | |
Equity Real Estate Investment Trusts (REITs) – 2.5% | | | |
| | American Tower Corp | | 112,448 | | | 17,788,149 | |
Health Care Equipment & Supplies – 8.7% | | | |
| | Abbott Laboratories | | 111,138 | | | 8,038,612 | |
| | Boston Scientific Corp* | | 638,021 | | | 22,547,662 | |
| | Edwards Lifesciences Corp* | | 77,489 | | | 11,868,990 | |
| | Intuitive Surgical Inc* | | 41,356 | | | 19,806,216 | |
| | | 62,261,480 | |
Health Care Providers & Services – 2.2% | | | |
| | Humana Inc | | 56,234 | | | 16,109,916 | |
Hotels, Restaurants & Leisure – 1.9% | | | |
| | Starbucks Corp | | 215,641 | | | 13,887,280 | |
Information Technology Services – 8.7% | | | |
| | Mastercard Inc | | 218,544 | | | 41,228,326 | |
| | Pagseguro Digital Ltd* | | 213,662 | | | 4,001,889 | |
| | PayPal Holdings Inc* | | 202,009 | | | 16,986,937 | |
| | | 62,217,152 | |
Interactive Media & Services – 7.7% | | | |
| | Alphabet Inc - Class C* | | 48,187 | | | 49,902,939 | |
| | Facebook Inc* | | 41,581 | | | 5,450,853 | |
| | | 55,353,792 | |
Internet & Direct Marketing Retail – 6.4% | | | |
| | Alibaba Group Holding Ltd (ADR)* | | 60,526 | | | 8,296,299 | |
| | Amazon.com Inc* | | 25,027 | | | 37,589,803 | |
| | | 45,886,102 | |
Pharmaceuticals – 6.0% | | | |
| | Allergan PLC | | 112,669 | | | 15,059,339 | |
| | Merck & Co Inc | | 201,874 | | | 15,425,192 | |
| | Zoetis Inc | | 150,402 | | | 12,865,387 | |
| | | 43,349,918 | |
Professional Services – 1.0% | | | |
| | CoStar Group Inc* | | 21,347 | | | 7,201,197 | |
| | |
See Notes to Schedule of Investments and Other Information and Notes to Financial Statements. |
| |
8 | DECEMBER 31, 2018 |
Janus Henderson VIT Forty Portfolio
Schedule of Investments
December 31, 2018
| | | | | | | | |
Shares
| | | Value | |
Common Stocks – (continued) | | | |
Road & Rail – 1.3% | | | |
| | Union Pacific Corp | | 67,864 | | | $9,380,841 | |
Semiconductor & Semiconductor Equipment – 6.5% | | | |
| | ASML Holding NV | | 101,094 | | | 15,732,248 | |
| | NVIDIA Corp | | 84,069 | | | 11,223,212 | |
| | Texas Instruments Inc | | 210,780 | | | 19,918,710 | |
| | | 46,874,170 | |
Software – 14.2% | | | |
| | Adobe Inc* | | 52,452 | | | 11,866,740 | |
| | Intuit Inc | | 52,605 | | | 10,355,294 | |
| | Microsoft Corp | | 451,114 | | | 45,819,649 | |
| | salesforce.com Inc* | | 249,866 | | | 34,224,146 | |
| | | 102,265,829 | |
Specialty Retail – 2.3% | | | |
| | Home Depot Inc | | 97,017 | | | 16,669,461 | |
Technology Hardware, Storage & Peripherals – 1.4% | | | |
| | Apple Inc | | 65,088 | | | 10,266,981 | |
Textiles, Apparel & Luxury Goods – 1.8% | | | |
| | NIKE Inc | | 174,486 | | | 12,936,392 | |
Total Common Stocks (cost $523,472,608) | | 696,411,145 | |
Investment Companies – 3.5% | | | |
Money Markets – 3.5% | | | |
| | Janus Henderson Cash Liquidity Fund LLC, 2.4621%ºº,£ (cost $25,348,887) | | 25,348,887 | | | 25,348,887 | |
Total Investments (total cost $548,821,495) – 100.3% | | 721,760,032 | |
Liabilities, net of Cash, Receivables and Other Assets – (0.3)% | | (2,306,927) | |
Net Assets – 100% | | $719,453,105 | |
| | | | | | |
Summary of Investments by Country - (Long Positions) (unaudited) |
| |
| | | | | % of | |
| | | | | Investment | |
Country | | Value | | Securities | |
United States | | $693,729,596 | | 96.1 | % |
Netherlands | | 15,732,248 | | 2.2 | |
China | | 8,296,299 | | 1.1 | |
Brazil | | 4,001,889 | | 0.6 | |
| | | | | | |
| | | | | | |
Total | | $721,760,032 | | 100.0 | % |
| | |
See Notes to Schedule of Investments and Other Information and Notes to Financial Statements. |
| |
Janus Aspen Series | 9 |
Janus Henderson VIT Forty Portfolio
Schedule of Investments
December 31, 2018
Schedules of Affiliated Investments – (% of Net Assets)
| | | | | | | | | | | |
| | Dividend Income | Realized Gain/(Loss) | Change in Unrealized Appreciation/ Depreciation | Value at 12/31/18 |
Investment Companies - 3.5% |
Money Markets - 3.5% |
| | Janus Henderson Cash Liquidity Fund LLC, 2.4621%ºº | $ | 415,295 | $ | - | $ | - | $ | 25,348,887 |
| |
| | | | | | | | | | | |
| | Share Balance at 12/31/17 | Purchases | Sales | Share Balance at 12/31/18 |
Investment Companies - 3.5% |
Money Markets - 3.5% |
| | Janus Henderson Cash Liquidity Fund LLC, 2.4621%ºº | | 38,903,503 | | 207,897,384 | | (221,452,000) | | 25,348,887 |
| | |
See Notes to Schedule of Investments and Other Information and Notes to Financial Statements. |
| |
10 | DECEMBER 31, 2018 |
Janus Henderson VIT Forty Portfolio
Notes to Schedule of Investments and Other Information
| | |
Russell 1000® Growth Index | Russell 1000® Growth Index reflects the performance of U.S. large-cap equities with higher price-to-book ratios and higher forecasted growth values. |
S&P 500® Index | S&P 500® Index reflects U.S. large-cap equity performance and represents broad U.S. equity market performance. |
| | |
ADR | American Depositary Receipt |
LLC | Limited Liability Company |
PLC | Public Limited Company |
| | |
* | Non-income producing security. |
| | |
ºº | Rate shown is the 7-day yield as of December 31, 2018. |
| | |
£ | The Portfolio may invest in certain securities that are considered affiliated companies. As defined by the Investment Company Act of 1940, as amended, an affiliated company is one in which the Portfolio owns 5% or more of the outstanding voting securities, or a company which is under common ownership or control. |
| | | | | | | | | | | | | |
The following is a summary of the inputs that were used to value the Portfolio’s investments in securities and other financial instruments as of December 31, 2018. See Notes to Financial Statements for more information. |
| |
Valuation Inputs Summary |
| | | | | | | |
| | | | | Level 2 - | | Level 3 - |
| | | Level 1 - | | Other Significant | | Significant |
| | | Quoted Prices | | Observable Inputs | | Unobservable Inputs |
| | | | | | | |
Assets | | | | | | |
Investments in Securities: | | | | | | |
Common Stocks | $ | 696,411,145 | $ | - | $ | - |
Investment Companies | | - | | 25,348,887 | | - |
Total Assets | $ | 696,411,145 | $ | 25,348,887 | $ | - |
| | | | | | | |
Janus Henderson VIT Forty Portfolio
Statement of Assets and Liabilities
December 31, 2018
| | | | | | | |
| | | | | | |
Assets: | | | | |
| | Unaffiliated investments, at value(1) | | $ | 696,411,145 | |
| | Affiliated investments, at value(2) | | | 25,348,887 | |
| | Non-interested Trustees' deferred compensation | | | 17,442 | |
| | Receivables: | | | | |
| | | Dividends | | | 369,971 | |
| | | Portfolio shares sold | | | 121,866 | |
| | | Dividends from affiliates | | | 47,556 | |
| | Other assets | | | 7,309 | |
Total Assets | | | 722,324,176 | |
Liabilities: | | | | |
| | Due to custodian | | | 36,869 | |
| | Payables: | | | — | |
| | | Investments purchased | | | 1,641,697 | |
| | | Portfolio shares repurchased | | | 512,719 | |
| | | Advisory fees | | | 362,912 | |
| | | 12b-1 Distribution and shareholder servicing fees | | | 96,093 | |
| | | Transfer agent fees and expenses | | | 34,152 | |
| | | Professional fees | | | 29,844 | |
| | | Non-interested Trustees' deferred compensation fees | | | 17,442 | |
| | | Non-interested Trustees' fees and expenses | | | 6,215 | |
| | | Custodian fees | | | 2,701 | |
| | | Affiliated portfolio administration fees payable | | | 1,617 | |
| | | Accrued expenses and other payables | | | 128,810 | |
Total Liabilities | | | 2,871,071 | |
Net Assets | | $ | 719,453,105 | |
Net Assets Consist of: | | | | |
| | Capital (par value and paid-in surplus) | | $ | 477,105,533 | |
| | Total distributable earnings (loss) | | | 242,347,572 | |
Total Net Assets | | $ | 719,453,105 | |
Net Assets - Institutional Shares | | $ | 292,131,621 | |
| | Shares Outstanding, $0.01 Par Value (unlimited shares authorized) | | | 8,299,342 | |
Net Asset Value Per Share | | $ | 35.20 | |
Net Assets - Service Shares | | $ | 427,321,484 | |
| | Shares Outstanding, $0.01 Par Value (unlimited shares authorized) | | | 12,889,490 | |
Net Asset Value Per Share | | $ | 33.15 | |
| |
(1) Includes cost of $523,472,608. (2) Includes cost of $25,348,887. |
| | |
See Notes to Financial Statements. |
| |
12 | DECEMBER 31, 2018 |
Janus Henderson VIT Forty Portfolio
Statement of Operations
For the year ended December 31, 2018
| | | | | | |
| | | | | |
Investment Income: | | | |
| Dividends | $ | 6,732,487 | |
| | Dividends from affiliates | | 415,295 | |
| | Foreign tax withheld | | (29,743) | |
Total Investment Income | | 7,118,039 | |
Expenses: | | | |
| | Advisory fees | | 5,042,172 | |
| | 12b-1 Distribution and shareholder servicing fees: | | | |
| | | Service Shares | | 1,218,577 | |
| | Transfer agent administrative fees and expenses: | | | |
| | | Institutional Shares | | 163,945 | |
| | | Service Shares | | 243,715 | |
| | Other transfer agent fees and expenses: | | | |
| | | Institutional Shares | | 9,218 | |
| | | Service Shares | | 7,827 | |
| | Shareholder reports expense | | 88,177 | |
| | Professional fees | | 47,380 | |
| | Affiliated portfolio administration fees | | 28,766 | |
| | Non-interested Trustees’ fees and expenses | | 24,540 | |
| | Registration fees | | 23,035 | |
| | Custodian fees | | 13,571 | |
| | Other expenses | | 75,400 | |
Total Expenses | | 6,986,323 | |
Net Investment Income/(Loss) | | 131,716 | |
Net Realized Gain/(Loss) on Investments: | | | |
| | Investments | | 69,559,947 | |
Total Net Realized Gain/(Loss) on Investments | | 69,559,947 | |
Change in Unrealized Net Appreciation/Depreciation: | | | |
| | Investments and non-interested Trustees’ deferred compensation | | (50,240,415) | |
Total Change in Unrealized Net Appreciation/Depreciation | | (50,240,415) | |
Net Increase/(Decrease) in Net Assets Resulting from Operations | $ | 19,451,248 | |
| | | | | | |
| | |
See Notes to Financial Statements. |
| |
Janus Aspen Series | 13 |
Janus Henderson VIT Forty Portfolio
Statements of Changes in Net Assets
| | | | | | | | | |
| | | | | | | | | |
| | | Year ended
December 31, 2018 | | Year ended
December 31, 2017 | |
| | | | | | | | | |
Operations: | | | | | | |
| | Net investment income/(loss) | $ | 131,716 | | $ | (731,720) | |
| | Net realized gain/(loss) on investments | | 69,559,947 | | | 115,587,643 | |
| | Change in unrealized net appreciation/depreciation | | (50,240,415) | | | 79,778,500 | |
Net Increase/(Decrease) in Net Assets Resulting from Operations | | 19,451,248 | | | 194,634,423 | |
Dividends and Distributions to Shareholders(1) | | | | | | |
| | | Institutional Shares | | (44,744,555) | | | N/A | |
| | | Service Shares | | (70,046,355) | | | N/A | |
| Total Dividends and Distributions to Shareholders | | (114,790,910) | | | N/A | |
| | Distributions from Net Realized Gain from Investment Transactions(1) | | | | | | |
| | | Institutional Shares | | N/A | | | (15,738,032) | |
| | | Service Shares | | N/A | | | (24,926,390) | |
| Total Distributions from Net Realized Gain from Investment Transactions | N/A | | | (40,664,422) | |
Net Decrease from Dividends and Distributions to Shareholders | | (114,790,910) | | | (40,664,422) | |
Capital Share Transactions: | | | | | | |
| | | Institutional Shares | | 19,835,832 | | | (8,524,718) | |
| | | Service Shares | | 18,730,103 | | | (56,736,961) | |
Net Increase/(Decrease) from Capital Share Transactions | | 38,565,935 | | | (65,261,679) | |
Net Increase/(Decrease) in Net Assets | | (56,773,727) | | | 88,708,322 | |
Net Assets: | | | | | | |
| | Beginning of period | | 776,226,832 | | | 687,518,510 | |
| End of period(2) | $ | 719,453,105 | | $ | 776,226,832 | |
| | | | | | | | | |
| |
(1) The requirement to disclose dividends and distributions paid to shareholders from net investment income and/or net realized gain from investment transactions was eliminated by the SEC (Securities Exchange Commission) in 2018. (2) Net assets - End of period includes undistributed (overdistributed) net investment income of $(14,921) as of December 31, 2017. The requirement to disclose undistributed (overdistributed) net investment income was eliminated by the SEC in 2018. |
| | |
See Notes to Financial Statements. |
| |
14 | DECEMBER 31, 2018 |
Janus Henderson VIT Forty Portfolio
Financial Highlights
| | | | | | | | | | | | | | | | | | | |
Institutional Shares | | | | | | | | | | | | | | | |
For a share outstanding during the year ended December 31 | | 2018 | | | 2017 | | | 2016 | | | 2015 | | | 2014 | |
| | Net Asset Value, Beginning of Period | | $39.76 | | | $32.19 | | | $36.37 | | | $40.27 | | | $53.34 | |
| | Income/(Loss) from Investment Operations: | | | | | | | | | | | | | | | |
| | | Net investment income/(loss)(1) | | 0.07 | | | 0.02 | | | 0.05 | | | 0.03 | | | 0.03 | |
| | | Net realized and unrealized gain/(loss) | | 1.31 | | | 9.58 | | | 0.58 | | | 4.77 | | | 3.08 | |
| | Total from Investment Operations | | 1.38 | | | 9.60 | | | 0.63 | | | 4.80 | | | 3.11 | |
| | Less Dividends and Distributions: | | | | | | | | | | | | | | | |
| | | Dividends (from net investment income) | | — | | | — | | | — | | | — | | | (0.09) | |
| | | Distributions (from capital gains) | | (5.94) | | | (2.03) | | | (4.81) | | | (8.70) | | | (16.09) | |
| | Total Dividends and Distributions | | (5.94) | | | (2.03) | | | (4.81) | | | (8.70) | | | (16.18) | |
| | Net Asset Value, End of Period | | $35.20 | | | $39.76 | | | $32.19 | | | $36.37 | | | $40.27 | |
| | Total Return* | | 1.98% | | | 30.31% | | | 2.20% | | | 12.22% | | | 8.73% | |
| | Net Assets, End of Period (in thousands) | | $292,132 | | | $309,258 | | | $257,009 | | | $295,725 | | | $299,546 | |
| | Average Net Assets for the Period (in thousands) | | $327,962 | | | $297,125 | | | $273,374 | | | $298,904 | | | $307,359 | |
| | Ratios to Average Net Assets**: | | | | | | | | | | | | | | | |
| | | Ratio of Gross Expenses | | 0.71% | | | 0.82% | | | 0.72% | | | 0.69% | | | 0.57% | |
| | | Ratio of Net Expenses (After Waivers and Expense Offsets) | | 0.71% | | | 0.82% | | | 0.72% | | | 0.69% | | | 0.57% | |
| | | Ratio of Net Investment Income/(Loss) | | 0.17% | | | 0.05% | | | 0.15% | | | 0.08% | | | 0.07% | |
| | Portfolio Turnover Rate | | 41% | | | 39% | | | 53% | | | 55% | | | 46% | |
| | | | | | | | | | | | | | 1 | | | | | |
| | | | | | | | | | | | | | | | | | | |
Service Shares | | | | | | | | | | | | | | | |
For a share outstanding during the year ended December 31 | | 2018 | | | 2017 | | | 2016 | | | 2015 | | | 2014 | |
| | Net Asset Value, Beginning of Period | | $37.84 | | | $30.79 | | | $35.08 | | | $39.21 | | | $52.40 | |
| | Income/(Loss) from Investment Operations: | | | | | | | | | | | | | | | |
| | | Net investment income/(loss)(1) | | (0.03) | | | (0.07) | | | (0.03) | | | (0.06) | | | (0.07) | |
| | | Net realized and unrealized gain/(loss) | | 1.28 | | | 9.15 | | | 0.55 | | | 4.63 | | | 2.99 | |
| | Total from Investment Operations | | 1.25 | | | 9.08 | | | 0.52 | | | 4.57 | | | 2.92 | |
| | Less Dividends and Distributions: | | | | | | | | | | | | | | | |
| | | Dividends (from net investment income) | | — | | | — | | | — | | | — | | | (0.02) | |
| | | Distributions (from capital gains) | | (5.94) | | | (2.03) | | | (4.81) | | | (8.70) | | | (16.09) | |
| | Total Dividends and Distributions | | (5.94) | | | (2.03) | | | (4.81) | | | (8.70) | | | (16.11) | |
| | Net Asset Value, End of Period | | $33.15 | | | $37.84 | | | $30.79 | | | $35.08 | | | $39.21 | |
| | Total Return* | | 1.72% | | | 29.99% | | | 1.94% | | | 11.94% | | | 8.47% | |
| | Net Assets, End of Period (in thousands) | | $427,321 | | | $466,969 | | | $430,510 | | | $501,003 | | | $492,253 | |
| | Average Net Assets for the Period (in thousands) | | $487,559 | | | $457,168 | | | $464,943 | | | $501,868 | | | $493,575 | |
| | Ratios to Average Net Assets**: | | | | | | | | | | | | | | | |
| | | Ratio of Gross Expenses | | 0.96% | | | 1.06% | | | 0.97% | | | 0.94% | | | 0.82% | |
| | | Ratio of Net Expenses (After Waivers and Expense Offsets) | | 0.96% | | | 1.06% | | | 0.97% | | | 0.94% | | | 0.82% | |
| | | Ratio of Net Investment Income/(Loss) | | (0.08)% | | | (0.19)% | | | (0.09)% | | | (0.17)% | | | (0.17)% | |
| | Portfolio Turnover Rate | | 41% | | | 39% | | | 53% | | | 55% | | | 46% | |
| | | | | | | | | | | | | | | | | | | |
| |
* Total return includes adjustments in accordance with generally accepted accounting principles required at the year or period end and are not annualized for periods of less than one full year. Total return does not include fees, charges, or expenses imposed by the variable annuity and life insurance contracts for which Janus Aspen Series serves as an underlying investment vehicle. ** Annualized for periods of less than one full year. (1) Per share amounts are calculated based on average shares outstanding during the year or period. |
| | |
See Notes to Financial Statements. |
| |
Janus Aspen Series | 15 |
Janus Henderson VIT Forty Portfolio
Notes to Financial Statements
1. Organization and Significant Accounting Policies
Janus Henderson VIT Forty Portfolio (the “Portfolio”) is a series of Janus Aspen Series (the “Trust”), which is organized as a Delaware statutory trust and is registered under the Investment Company Act of 1940, as amended (the “1940 Act”), as an open-end management investment company, and therefore has applied the specialized accounting and reporting guidance in Financial Accounting Standards Board (“FASB”) Accounting Standards Codification (“ASC”) Topic 946. The Trust offers 11 portfolios, each of which offers multiple share classes, with differing investment objectives and policies. The Portfolio seeks long-term growth of capital. The Portfolio is classified as nondiversified, as defined in the 1940 Act.
The Portfolio currently offers two classes of shares: Institutional Shares and Service Shares. Each class represents an interest in the same portfolio of investments. Institutional Shares are offered only in connection with investment in and payments under variable insurance contracts as well as certain qualified retirement plans. Service Shares are offered only in connection with investment in and payments under variable insurance contracts as well as certain qualified retirement plans that require a fee from Portfolio assets to procure distribution and administrative services to contract owners and plan participants.
Shareholders, including other portfolios, participating insurance companies, as well as accounts, may from time to time own (beneficially or of record) a significant percentage of the Portfolio’s Shares and can be considered to “control” the Portfolio when that ownership exceeds 25% of the Portfolio’s assets (and which may differ from control as determined in accordance with accounting principles generally accepted in the United States of America).
The following accounting policies have been followed by the Portfolio and are in conformity with accounting principles generally accepted in the United States of America.
Investment Valuation
Securities held by the Portfolio are valued in accordance with policies and procedures established by and under the supervision of the Trustees (the “Valuation Procedures”). Equity securities traded on a domestic securities exchange are generally valued at the closing prices on the primary market or exchange on which they trade. If such price is lacking for the trading period immediately preceding the time of determination, such securities are valued at their current bid price. Equity securities that are traded on a foreign exchange are generally valued at the closing prices on such markets. In the event that there is no current trading volume on a particular security in such foreign exchange, the bid price from the primary exchange is generally used to value the security. Securities that are traded on the over-the-counter (“OTC”) markets are generally valued at their closing or latest bid prices as available. Foreign securities and currencies are converted to U.S. dollars using the applicable exchange rate in effect at the close of the New York Stock Exchange (“NYSE”). The Portfolio will determine the market value of individual securities held by it by using prices provided by one or more approved professional pricing services or, as needed, by obtaining market quotations from independent broker-dealers. Most debt securities are valued in accordance with the evaluated bid price supplied by the pricing service that is intended to reflect market value. The evaluated bid price supplied by the pricing service is an evaluation that may consider factors such as security prices, yields, maturities and ratings. Certain short-term securities maturing within 60 days or less may be evaluated and valued on an amortized cost basis provided that the amortized cost determined approximates market value. Securities for which market quotations or evaluated prices are not readily available or deemed unreliable are valued at fair value determined in good faith under the Valuation Procedures. Circumstances in which fair value pricing may be utilized include, but are not limited to: (i) a significant event that may affect the securities of a single issuer, such as a merger, bankruptcy, or significant issuer-specific development; (ii) an event that may affect an entire market, such as a natural disaster or significant governmental action; (iii) a nonsignificant event such as a market closing early or not opening, or a security trading halt; and (iv) pricing of a nonvalued security and a restricted or nonpublic security. Special valuation considerations may apply with respect to “odd-lot” fixed-income transactions which, due to their small size, may receive evaluated prices by pricing services which reflect a large block trade and not what actually could be obtained for the odd-lot position. The Portfolio uses systematic fair valuation models provided by independent third parties to value international equity securities in order to adjust for stale pricing, which may occur between the close of certain foreign exchanges and the close of the NYSE.
Valuation Inputs Summary
FASB ASC 820, Fair Value Measurements and Disclosures (“ASC 820”), defines fair value, establishes a framework for measuring fair value, and expands disclosure requirements regarding fair value measurements. This standard emphasizes that fair value is a market-based measurement that should be determined based on the assumptions that
Janus Henderson VIT Forty Portfolio
Notes to Financial Statements
market participants would use in pricing an asset or liability and establishes a hierarchy that prioritizes inputs to valuation techniques used to measure fair value. These inputs are summarized into three broad levels:
Level 1 – Unadjusted quoted prices in active markets the Portfolio has the ability to access for identical assets or liabilities.
Level 2 – Observable inputs other than unadjusted quoted prices included in Level 1 that are observable for the asset or liability either directly or indirectly. These inputs may include quoted prices for the identical instrument on an inactive market, prices for similar instruments, interest rates, prepayment speeds, credit risk, yield curves, default rates and similar data.
Assets or liabilities categorized as Level 2 in the hierarchy generally include: debt securities fair valued in accordance with the evaluated bid or ask prices supplied by a pricing service; securities traded on OTC markets and listed securities for which no sales are reported that are fair valued at the latest bid price (or yield equivalent thereof) obtained from one or more dealers transacting in a market for such securities or by a pricing service approved by the Portfolio’s Trustees; certain short-term debt securities with maturities of 60 days or less that are fair valued at amortized cost; and equity securities of foreign issuers whose fair value is determined by using systematic fair valuation models provided by independent third parties in order to adjust for stale pricing which may occur between the close of certain foreign exchanges and the close of the NYSE. Other securities that may be categorized as Level 2 in the hierarchy include, but are not limited to, preferred stocks, bank loans, swaps, investments in unregistered investment companies, options, and forward contracts.
Level 3 – Unobservable inputs for the asset or liability to the extent that relevant observable inputs are not available, representing the Portfolio’s own assumptions about the assumptions that a market participant would use in valuing the asset or liability, and that would be based on the best information available.
There have been no significant changes in valuation techniques used in valuing any such positions held by the Portfolio since the beginning of the fiscal year.
The inputs or methodology used for fair valuing securities are not necessarily an indication of the risk associated with investing in those securities. The summary of inputs used as of December 31, 2018 to fair value the Portfolio’s investments in securities and other financial instruments is included in the “Valuation Inputs Summary” in the Notes to Schedule of Investments and Other Information.
There were no transfers between Level 1, Level 2 and Level 3 of the fair value hierarchy during the year. The Portfolio recognizes transfers between the levels as of the beginning of the fiscal year.
Investment Transactions and Investment Income
Investment transactions are accounted for as of the date purchased or sold (trade date). Dividend income is recorded on the ex-dividend date. Certain dividends from foreign securities will be recorded as soon as the Portfolio is informed of the dividend, if such information is obtained subsequent to the ex-dividend date. Dividends from foreign securities may be subject to withholding taxes in foreign jurisdictions. Interest income is recorded on the accrual basis and includes amortization of premiums and accretion of discounts. Gains and losses are determined on the identified cost basis, which is the same basis used for federal income tax purposes. Income, as well as gains and losses, both realized and unrealized, are allocated daily to each class of shares based upon the ratio of net assets represented by each class as a percentage of total net assets.
Expenses
The Portfolio bears expenses incurred specifically on its behalf. Each class of shares bears a portion of general expenses, which are allocated daily to each class of shares based upon the ratio of net assets represented by each class as a percentage of total net assets. Expenses directly attributable to a specific class of shares are charged against the operations of such class.
Estimates
The preparation of financial statements in conformity with accounting principles generally accepted in the United States of America requires management to make estimates and assumptions that affect the reported amount of assets and liabilities and disclosure of contingent assets and liabilities at the date of the financial statements, and the reported amounts of income and expenses during the reporting period. Actual results could differ from those estimates.
Janus Henderson VIT Forty Portfolio
Notes to Financial Statements
Indemnifications
In the normal course of business, the Portfolio may enter into contracts that contain provisions for indemnification of other parties against certain potential liabilities. The Portfolio’s maximum exposure under these arrangements is unknown, and would involve future claims that may be made against the Portfolio that have not yet occurred. Currently, the risk of material loss from such claims is considered remote.
Dividends and Distributions
The Portfolio may make semiannual distributions of substantially all of its investment income and an annual distribution of its net realized capital gains (if any).
The Portfolio may make certain investments in real estate investment trusts (“REITs”) which pay dividends to their shareholders based upon funds available from operations. It is quite common for these dividends to exceed the REITs’ taxable earnings and profits, resulting in the excess portion of such dividends being designated as a return of capital. If the Portfolio distributes such amounts, such distributions could constitute a return of capital to shareholders for federal income tax purposes.
Federal Income Taxes
The Portfolio intends to continue to qualify as a regulated investment company and distribute all of its taxable income in accordance with the requirements of Subchapter M of the Internal Revenue Code. Management has analyzed the Portfolio’s tax positions taken for all open federal income tax years, generally a three-year period, and has concluded that no provision for federal income tax is required in the Portfolio’s financial statements. The Portfolio is not aware of any tax positions for which it is reasonably possible that the total amounts of unrecognized tax benefits will significantly change in the next twelve months.
On December 22, 2017, the Tax Cuts and Jobs Act was signed into law. Currently, Management does not believe the bill will have a material impact on the Portfolio’s intention to continue to qualify as a regulated investment company, which is generally not subject to U.S. federal income tax.
2. Other Investments and Strategies
Additional Investment Risk
The financial crisis in both the U.S. and global economies over the past several years has resulted, and may continue to result, in a significant decline in the value and liquidity of many securities of issuers worldwide in the equity and fixed-income/credit markets. In response to the crisis, the United States and certain foreign governments, along with the U.S. Federal Reserve and certain foreign central banks, took steps to support the financial markets. The withdrawal of this support, a failure of measures put in place to respond to the crisis, or investor perception that such efforts were not sufficient could each negatively affect financial markets generally, and the value and liquidity of specific securities. In addition, policy and legislative changes in the United States and in other countries continue to impact many aspects of financial regulation. The effect of these changes on the markets, and the practical implications for market participants, including the Portfolio, may not be fully known for some time. As a result, it may also be unusually difficult to identify both investment risks and opportunities, which could limit or preclude the Portfolio’s ability to achieve its investment objective. Therefore, it is important to understand that the value of your investment may fall, sometimes sharply, and you could lose money.
The enactment of the Dodd-Frank Wall Street Reform and Consumer Protection Act (the “Dodd-Frank Act”) of 2010 provided for widespread regulation of financial institutions, consumer financial products and services, broker-dealers, OTC derivatives, investment advisers, credit rating agencies, and mortgage lending, which expanded federal oversight in the financial sector, including the investment management industry. Many provisions of the Dodd-Frank Act remain pending and will be implemented through future rulemaking. Therefore, the ultimate impact of the Dodd-Frank Act and the regulations under the Dodd-Frank Act on the Portfolio and the investment management industry as a whole, is not yet certain.
A number of countries in the European Union (“EU”) have experienced, and may continue to experience, severe economic and financial difficulties. In particular, many EU nations are susceptible to economic risks associated with high levels of debt, notably due to investments in sovereign debt of countries such as Greece, Italy, Spain, Portugal, and Ireland. Many non-governmental issuers, and even certain governments, have defaulted on, or been forced to restructure, their debts. Many other issuers have faced difficulties obtaining credit or refinancing existing obligations. Financial institutions have in many cases required government or central bank support, have needed to raise capital,
Janus Henderson VIT Forty Portfolio
Notes to Financial Statements
and/or have been impaired in their ability to extend credit. As a result, financial markets in the EU experienced extreme volatility and declines in asset values and liquidity. Responses to these financial problems by European governments, central banks, and others, including austerity measures and reforms, may not work, may result in social unrest, and may limit future growth and economic recovery or have other unintended consequences. Further defaults or restructurings by governments and others of their debt could have additional adverse effects on economies, financial markets, and asset valuations around the world. Greece, Ireland, and Portugal have already received one or more "bailouts" from other Eurozone member states, and it is unclear how much additional funding they will require or if additional Eurozone member states will require bailouts in the future. The risk of investing in securities in the European markets may also be heightened due to the referendum in which the United Kingdom voted to exit the EU (known as “Brexit”). There is considerable uncertainty about how Brexit will be conducted, how negotiations of necessary treaties and trade agreements will proceed, or how financial markets will react. In addition, one or more other countries may also abandon the euro and/or withdraw from the EU, placing its currency and banking system in jeopardy.
Certain areas of the world have historically been prone to and economically sensitive to environmental events such as, but not limited to, hurricanes, earthquakes, typhoons, flooding, tidal waves, tsunamis, erupting volcanoes, wildfires or droughts, tornadoes, mudslides, or other weather-related phenomena. Such disasters, and the resulting physical or economic damage, could have a severe and negative impact on the Portfolio’s investment portfolio and, in the longer term, could impair the ability of issuers in which the Portfolio invests to conduct their businesses as they would under normal conditions. Adverse weather conditions may also have a particularly significant negative effect on issuers in the agricultural sector and on insurance companies that insure against the impact of natural disasters.
Real Estate Investing
The Portfolio may invest in equity and debt securities of real estate-related companies. Such companies may include those in the real estate industry or real estate-related industries. These securities may include common stocks, corporate bonds, preferred stocks, and other equity securities, including, but not limited to, mortgage-backed securities, real estate-backed securities, securities of REITs and similar REIT-like entities. A REIT is a trust that invests in real estate-related projects, such as properties, mortgage loans, and construction loans. REITs are generally categorized as equity, mortgage, or hybrid REITs. A REIT may be listed on an exchange or traded OTC.
3. Investment Advisory Agreements and Other Transactions with Affiliates
The Portfolio pays Janus Capital Management LLC (“Janus Capital”) an investment advisory fee which is calculated daily and paid monthly. The Portfolio’s "base" fee rate prior to any performance adjustment (expressed as an annual rate) is 0.64%.
The investment advisory fee rate is determined by calculating a base fee and applying a performance adjustment. The base fee rate is the same as the contractual investment advisory fee rate. The performance adjustment either increases or decreases the base fee depending on how well the Portfolio has performed relative to its benchmark index. The Portfolio's benchmark index used in the calculation is the Russell 1000® Growth Index.
The calculation of the performance adjustment applies as follows:
Investment Advisory Fee = Base Fee Rate +/- Performance Adjustment
The investment advisory fee rate paid to Janus Capital by the Portfolio consists of two components: (1) a base fee calculated by applying the contractual fixed rate of the advisory fee to the Portfolio’s average daily net assets during the previous month (“Base Fee Rate”), plus or minus (2) a performance-fee adjustment (“Performance Adjustment”) calculated by applying a variable rate of up to 0.15% (positive or negative) to the Portfolio’s average daily net assets based on the Portfolio’s relative performance compared to the cumulative investment record of its benchmark index over a 36-month performance measurement period or shorter time period, as applicable.
The Portfolio’s prospectuses and statement(s) of additional information contain additional information about performance-based fees. The amount shown as advisory fees on the Statement of Operations reflects the Base Fee Rate plus/minus any Performance Adjustment. For the year ended December 31, 2018, the performance adjusted investment advisory fee rate before any waivers and/or reimbursements of expenses is 0.62%.
Janus Services LLC (“Janus Services”), a wholly-owned subsidiary of Janus Capital, is the Portfolio’s transfer agent. Janus Services receives an administrative services fee at an annual rate of 0.05% of the average daily net assets of the Portfolio for arranging for the provision by participating insurance companies and qualified plan service providers of
Janus Henderson VIT Forty Portfolio
Notes to Financial Statements
administrative services, including recordkeeping, subaccounting, order processing, or other shareholder services provided on behalf of contract holders or plan participants investing in the Portfolio. Other shareholder services may include the provision of order confirmations, periodic account statements, forwarding prospectuses, shareholder reports, and other materials to existing investors, and answering inquiries regarding accounts. Janus Services expects to use this entire fee to compensate insurance companies and qualified plan service providers for providing these services to their customers who invest in the Portfolio. Any unused portion will be reimbursed to the applicable share class at least annually.
In addition, Janus Services provides or arranges for the provision of certain other internal administrative, recordkeeping, and shareholder relations services for the Portfolio. Janus Services is not compensated for these internal services related to the shares, except for out-of-pocket costs. These amounts are disclosed as “Other transfer agent fees and expenses” on the Statement of Operations.
Under a distribution and shareholder servicing plan (the “Plan”) adopted in accordance with Rule 12b-1 under the 1940 Act, the Service Shares may pay the Trust’s distributor, Janus Distributors LLC (“Janus Distributors”), a wholly-owned subsidiary of Janus Capital, a fee for the sale and distribution and/or shareholder servicing of the Service Shares at an annual rate of up to 0.25% of the average daily net assets of the Service Shares. Under the terms of the Plan, the Trust is authorized to make payments to Janus Distributors for remittance to insurance companies and qualified plan service providers as compensation for distribution and/or shareholder services performed by such entities. These amounts are disclosed as “12b-1 Distribution and shareholder servicing fees” on the Statement of Operations. Payments under the Plan are not tied exclusively to actual 12b-1 distribution and servicing fees, and the payments may exceed 12b-1 distribution and servicing fees actually incurred. If any of the Portfolio’s actual 12b-1 distribution and servicing fees incurred during a calendar year are less than the payments made during a calendar year, the Portfolio will be refunded the difference. Refunds, if any, are included in “12b-1 Distribution and shareholder servicing fees” in the Statement of Operations.
Janus Capital serves as administrator to the Portfolio pursuant to an administration agreement between Janus Capital and the Trust. Under the administration agreement, Janus Capital is obligated to provide or arrange for the provision of certain administration, compliance, and accounting services to the Portfolio, including providing office space for the Portfolio, and is reimbursed by the Portfolio for certain of its costs in providing these services (to the extent Janus Capital seeks reimbursement and such costs are not otherwise waived). In addition, employees of Janus Capital and/or its affiliates may serve as officers of the Trust. The Portfolio pays for some or all of the salaries, fees, and expenses of Janus Capital employees and Portfolio officers, with respect to certain specified administration functions they perform on behalf of the Portfolio. The Portfolio pays these costs based on out-of-pocket expenses incurred by Janus Capital, and these costs are separate and apart from advisory fees and other expenses paid in connection with the investment advisory services Janus Capital (or any subadvisor, as applicable) provides to the Portfolio. These amounts are disclosed as “Affiliated portfolio administration fees” on the Statement of Operations. In addition, some expenses related to compensation payable to the Portfolio’s Chief Compliance Officer and certain compliance staff, all of whom are employees of Janus Capital and/or its affiliates, are shared with the Portfolio. Total compensation of $34,180 was paid to the Chief Compliance Officer and certain compliance staff by the Trust during the year ended December 31, 2018. The Portfolio's portion is reported as part of “Other expenses” on the Statement of Operations.
Effective April 1, 2018, BNP Paribas Financial Services (“BPFS”) provides certain administrative services to the Portfolio, including services related to Portfolio accounting, calculation of the Portfolio’s daily NAV, and Portfolio audit, tax, and reporting obligations, pursuant to a sub-administration agreement with Janus Capital on behalf of the Portfolio. Janus Capital, as administrator, oversees the provision of these services by BPFS. As compensation for such services, Janus Capital pays BPFS a fee based on a percentage of the Portfolio’s assets, along with a flat fee, and is reimbursed by the Portfolio for amounts paid to BPFS (to the extent Janus Capital seeks reimbursement and such costs are not otherwise waived). These amounts are disclosed as "Other expenses" on the Statement of Operations.
The Board of Trustees has adopted a deferred compensation plan (the “Deferred Plan”) for independent Trustees to elect to defer receipt of all or a portion of the annual compensation they are entitled to receive from the Portfolio. All deferred fees are credited to an account established in the name of the Trustees. The amounts credited to the account then increase or decrease, as the case may be, in accordance with the performance of one or more of the Janus Henderson funds that are selected by the Trustees. The account balance continues to fluctuate in accordance with the performance of the selected fund or funds until final payment of all amounts are credited to the account. The fluctuation of the account balance is recorded by the Portfolio as unrealized appreciation/(depreciation) and is included as of
Janus Henderson VIT Forty Portfolio
Notes to Financial Statements
December 31, 2018 on the Statement of Assets and Liabilities in the asset, “Non-interested Trustees’ deferred compensation,” and liability, “Non-interested Trustees’ deferred compensation fees.” Additionally, the recorded unrealized appreciation/(depreciation) is included in “Unrealized net appreciation/(depreciation) of investments and non-interested Trustees’ deferred compensation” on the Statement of Assets and Liabilities. Deferred compensation expenses for the year ended December 31, 2018 are included in “Non-interested Trustees’ fees and expenses” on the Statement of Operations. Trustees are allowed to change their designation of mutual funds from time to time. Amounts will be deferred until distributed in accordance with the Deferred Plan. Deferred fees of $511,200 were paid by the Trust to the Trustees under the Deferred Plan during the year ended December 31, 2018.
Pursuant to the provisions of the 1940 Act and related rules, the Portfolio may participate in an affiliated or nonaffiliated cash sweep program. In the cash sweep program, uninvested cash balances of the Portfolio may be used to purchase shares of affiliated or nonaffiliated money market funds or cash management pooled investment vehicles. The Portfolio is eligible to participate in the cash sweep program (the “Investing Funds”). As adviser, Janus Capital has an inherent conflict of interest because of its fiduciary duties to the affiliated money market funds or cash management pooled investment vehicles and the Investing Funds. Janus Henderson Cash Liquidity Fund LLC is an affiliated unregistered cash management pooled investment vehicle that invests primarily in highly-rated short-term fixed-income securities. Janus Henderson Cash Liquidity Fund LLC currently maintains a NAV of $1.00 per share and distributes income daily in a manner consistent with a registered product compliant with Rule 2a-7 under the 1940 Act. There are no restrictions on the Portfolio's ability to withdraw investments from Janus Henderson Cash Liquidity Fund LLC at will, and there are no unfunded capital commitments due from the Portfolio to Janus Henderson Cash Liquidity Fund LLC. The units of Janus Henderson Cash Liquidity Fund LLC are not charged any management fee, sales charge or service fee.
Any purchases and sales, realized gains/losses and recorded dividends from affiliated investments during the year ended December 31, 2018 can be found in the “Schedules of Affiliated Investments” located in the Schedule of Investments.
The Portfolio is permitted to purchase or sell securities (“cross-trade”) between itself and other funds or accounts managed by Janus Capital in accordance with Rule 17a-7 under the Investment Company Act of 1940 (“Rule 17a-7”), when the transaction is consistent with the investment objectives and policies of the Portfolio and in accordance with the Internal Cross Trade Procedures adopted by the Trust’s Board of Trustees. These procedures have been designed to ensure that any cross-trade of securities by the Portfolio from or to another fund or account that is or could be considered an affiliate of the Portfolio under certain limited circumstances by virtue of having a common investment adviser, common Officer, or common Trustee complies with Rule 17a-7. Under these procedures, each cross-trade is effected at the current market price to save costs where allowed. During the year ended December 31, 2018, the Portfolio engaged in cross trades amounting to $612,075 in sales, resulting in a net realized gain of $232,052. The net realized gain is included within the “Net Realized Gain/(Loss) on Investments” section of the Portfolio’s Statement of Operations.
4. Federal Income Tax
The tax components of capital shown in the table below represent: (1) distribution requirements the Portfolio must satisfy under the income tax regulations; (2) losses or deductions the Portfolio may be able to offset against income and gains realized in future years; and (3) unrealized appreciation or depreciation of investments for federal income tax purposes.
Other book to tax differences primarily consist of deferred compensation. The Portfolio has elected to treat gains and losses on forward foreign currency contracts as capital gains and losses, if applicable. Other foreign currency gains and losses on debt instruments are treated as ordinary income for federal income tax purposes pursuant to Section 988 of the Internal Revenue Code.
| | | | | | | | |
| | | | Loss Deferrals | Other Book | Net Tax | |
Undistributed
Ordinary Income | Undistributed
Long-Term Gains | Accumulated
Capital Losses | Late-Year
Ordinary Loss | Post-October
Capital Loss | to Tax
Differences | Appreciation/
(Depreciation) | |
$ 96,656 | $ 69,329,188 | $ - | $ - | $ - | $ (14,726) | $172,936,454 | |
Janus Henderson VIT Forty Portfolio
Notes to Financial Statements
The aggregate cost of investments and the composition of unrealized appreciation and depreciation of investment securities for federal income tax purposes as of December 31, 2018 are noted below. The primary difference between book and tax appreciation or depreciation of investments are wash sale loss deferrals and investments in partnerships.
| | | | |
Federal Tax Cost | Unrealized
Appreciation | Unrealized
(Depreciation) | Net Tax Appreciation/
(Depreciation) |
$ 548,823,578 | $207,007,336 | $(34,070,882) | $ 172,936,454 |
| | | | |
Income and capital gains distributions are determined in accordance with income tax regulations that may differ from accounting principles generally accepted in the United States of America. These differences are due to differing treatments for items such as net short-term gains, deferral of wash sale losses, foreign currency transactions, net investment losses, and capital loss carryovers. Certain permanent differences such as tax returns of capital and net investment losses noted below have been reclassified to capital.
| | | | | |
For the year ended December 31, 2018 | |
Distributions | | |
From Ordinary Income | From Long-Term Capital Gains | Tax Return of Capital | Net Investment Loss | |
$ 9,774,498 | $ 105,016,412 | $ - | $ - | |
| | | | | |
For the year ended December 31, 2017 | |
Distributions | | |
From Ordinary Income | From Long-Term Capital Gains | Tax Return of Capital | Net Investment Loss | |
$ - | $ 40,664,422 | $ - | $ - | |
Permanent book to tax basis differences may result in reclassifications between the components of net assets. These differences have no impact on the results of operations or net assets. The following reclassifications have been made to the Portfolio:
| | | |
| | | |
Increase/(Decrease) to Capital | Increase/(Decrease) to Undistributed
Net Investment Income/Loss | Increase/(Decrease) to Undistributed
Net Realized Gain/Loss |
$ - | $ (37,582) | $ 37,582 |
| | | |
5. Capital Share Transactions
| | | | | | | |
| | | | | | | |
| | | Year ended December 31, 2018 | | Year ended December 31, 2017 |
| | | Shares | Amount | | Shares | Amount |
| | | | | | | |
Institutional Shares: | | | | | |
Shares sold | 809,869 | $33,052,337 | | 790,876 | $ 28,902,402 |
Reinvested dividends and distributions | 1,145,241 | 44,744,555 | | 427,548 | 15,738,032 |
Shares repurchased | (1,434,162) | (57,961,060) | | (1,424,785) | (53,165,152) |
Net Increase/(Decrease) | 520,948 | $19,835,832 | | (206,361) | $ (8,524,718) |
Service Shares: | | | | | |
Shares sold | 1,082,691 | $41,434,913 | | 1,169,490 | $ 40,949,527 |
Reinvested dividends and distributions | 1,900,851 | 70,046,355 | | 710,558 | 24,926,390 |
Shares repurchased | (2,434,969) | (92,751,165) | | (3,522,268) | (122,612,878) |
Net Increase/(Decrease) | 548,573 | $18,730,103 | | (1,642,220) | $(56,736,961) |
Janus Henderson VIT Forty Portfolio
Notes to Financial Statements
6. Purchases and Sales of Investment Securities
For the year ended December 31, 2018, the aggregate cost of purchases and proceeds from sales of investment securities (excluding any short-term securities, short-term options contracts, TBAs, and in-kind transactions, as applicable) was as follows:
| | | | |
Purchases of
Securities | Proceeds from Sales
of Securities | Purchases of Long-
Term U.S. Government
Obligations | Proceeds from Sales
of Long-Term U.S.
Government Obligations |
$321,513,082 | $ 388,537,831 | $ - | $ - |
7. Recent Accounting Pronouncements
The Securities and Exchange Commission adopted amendments to Regulation S-X for the presentation of distributable earnings and distributions to align with US Generally Accepted Accounting Principles (GAAP). The compliance date of the amendments to Regulation S-X was November 5, 2018. This report incorporates the amendments to Regulation S-X.
The FASB issued Accounting Standards Update No. 2017-08, Receivables – Nonrefundable Fees and Other Costs (Subtopic 310-20), Premium Amortization on Purchased Callable Debt Securities ("ASU 2017-08") to amend the amortization period for certain purchased callable debt securities held at a premium. The guidance requires certain premiums on callable debt securities to be amortized to the earliest call date. The amortization period for callable debt securities purchased at a discount will not be impacted. The amendments are effective for fiscal years, and interim periods within those fiscal years, beginning after December 15, 2018. Early adoption is permitted, including adoption in an interim period. Management is currently evaluating the impacts of ASU 2017-08 on the financial statements.
The FASB issued Accounting Standards Update 2018-13, Fair Value Measurement (Topic 820), in August 2018. The new guidance removes, modifies and enhances the disclosures to Topic 820. For public entities, the amendments are effective for financial statements issued for fiscal years beginning after December 15, 2019, and interim periods within those fiscal years. Management is currently evaluating the impact of this new guidance on the financial statements.
8. Subsequent Event
Management has evaluated whether any events or transactions occurred subsequent to December 31, 2018 and through the date of issuance of the Portfolio’s financial statements and determined that there were no material events or transactions that would require recognition or disclosure in the Portfolio’s financial statements.
Janus Henderson VIT Forty Portfolio
Report of Independent Registered Public Accounting Firm
To the Board of Trustees of Janus Aspen Series and Shareholders of Janus Henderson VIT Forty Portfolio:
Opinion on the Financial Statements
We have audited the accompanying statement of assets and liabilities, including the schedule of investments, of Janus Henderson VIT Forty Portfolio (one of the portfolios constituting Janus Aspen Series, referred to hereafter as the "Portfolio") as of December 31, 2018, the related statement of operations for the year ended December 31, 2018, the statements of changes in net assets for each of the two years in the period ended December 31, 2018, including the related notes, and the financial highlights for each of the five years in the period ended December 31, 2018 (collectively referred to as the “financial statements”). In our opinion, the financial statements present fairly, in all material respects, the financial position of the Portfolio as of December 31, 2018, the results of its operations for the year then ended, the changes in its net assets for each of the two years in the period ended December 31, 2018 and the financial highlights for each of the five years in the period ended December 31, 2018 in conformity with accounting principles generally accepted in the United States of America.
Basis for Opinion
These financial statements are the responsibility of the Portfolio’s management. Our responsibility is to express an opinion on the Portfolio’s financial statements based on our audits. We are a public accounting firm registered with the Public Company Accounting Oversight Board (United States) (PCAOB) and are required to be independent with respect to the Portfolio in accordance with the U.S. federal securities laws and the applicable rules and regulations of the Securities and Exchange Commission and the PCAOB.
We conducted our audits of these financial statements in accordance with the standards of the PCAOB. Those standards require that we plan and perform the audit to obtain reasonable assurance about whether the financial statements are free of material misstatement, whether due to error or fraud.
Our audits included performing procedures to assess the risks of material misstatement of the financial statements, whether due to error or fraud, and performing procedures that respond to those risks. Such procedures included examining, on a test basis, evidence regarding the amounts and disclosures in the financial statements. Our audits also included evaluating the accounting principles used and significant estimates made by management, as well as evaluating the overall presentation of the financial statements. Our procedures included confirmation of securities owned as of December 31, 2018 by correspondence with the custodian, transfer agent, and brokers; when replies were not received from brokers, we performed other auditing procedures. We believe that our audits provide a reasonable basis for our opinion.

Denver, Colorado
February 15, 2019
We have served as the auditor of one or more investment companies in Janus Henderson Funds since 1990.
Janus Henderson VIT Forty Portfolio
Additional Information (unaudited)
Proxy Voting Policies and Voting Record
A description of the policies and procedures that the Portfolio uses to determine how to vote proxies relating to its portfolio securities is available without charge: (i) upon request, by calling 1-800-525-1093; (ii) on the Portfolio’s website at janushenderson.com/proxyvoting; and (iii) on the SEC’s website at http://www.sec.gov. Additionally, information regarding the Portfolio’s proxy voting record for the most recent twelve-month period ended June 30 is also available, free of charge, through janushenderson.com/proxyvoting and from the SEC’s website at http://www.sec.gov.
Full Holdings
The Portfolio is required to disclose its complete holdings on Form N-Q within 60 days of the end of the first and third fiscal quarters, and in the annual report and semiannual report to Portfolio shareholders. These reports (i) are available on the SEC’s website at http://www.sec.gov; (ii) may be reviewed and copied at the SEC’s Public Reference Room in Washington, D.C. (information on the Public Reference Room may be obtained by calling 1-800-SEC-0330); and (iii) are available without charge, upon request, by calling a Janus Henderson representative at 1-877-335-2687 (toll free) . Portfolio holdings consisting of at least the names of the holdings are generally available on a monthly basis with a 30-day lag. Holdings are generally posted approximately two business days thereafter under Full Holdings for the Portfolio at janushenderson.com/vit.
APPROVAL OF ADVISORY AGREEMENTS DURING THE PERIOD
The Trustees of Janus Aspen Series, each of whom serves as an “independent” Trustee (the “Trustees”), oversee the management of each Portfolio of Janus Aspen Series (each, a “VIT Portfolio,” and collectively, the “VIT Portfolios”), as well as each Fund of Janus Investment Fund (together with the VIT Portfolios, the “Janus Henderson Funds,” and each, a “Janus Henderson Fund”). As required by law, the Trustees determine annually whether to continue the investment advisory agreement for each Janus Henderson Fund and the subadvisory agreement for each Janus Henderson Funds that utilizes a subadviser.
In connection with their most recent consideration of those agreements for each Janus Henderson Fund, the Trustees received and reviewed information provided by Janus Capital and each subadviser in response to requests of the Trustees and their independent legal counsel. They also received and reviewed information and analysis provided by, and in response to requests of, their independent fee consultant. Throughout their consideration of the agreements, the Trustees were advised by their independent legal counsel. The Trustees met with management to consider the agreements and the information provided, and also met separately in executive session with their independent legal counsel and their independent fee consultant.
At a meeting held on December 6, 2018, based on the Trustees’ evaluation of the information provided by Janus Capital, the subadvisers, and the independent fee consultant, as well as other information, the Trustees determined that the overall arrangements between each Janus Henderson Fund and Janus Capital and each subadviser, as applicable, were fair and reasonable in light of the nature, extent and quality of the services provided by Janus Capital, its affiliates and the subadvisers, the fees charged for those services, and other matters that the Trustees considered relevant in the exercise of their business judgment. At that meeting, the Trustees unanimously approved the continuation of the investment advisory agreement for each Janus Henderson Fund, and the subadvisory agreement for each subadvised Janus Henderson Fund, for the period from February 1, 2019 through February 1, 2020, subject to earlier termination as provided for in each agreement.
In considering the continuation of those agreements, the Trustees reviewed and analyzed various factors that they determined were relevant, including the factors described below, none of which by itself was considered dispositive. However, the material factors and conclusions that formed the basis for the Trustees’ determination to approve the continuation of the agreements are discussed separately below. Also included is a summary of the independent fee consultant’s conclusions and opinions that arose during, and were included as part of, the Trustees’ consideration of the agreements. “Management fees,” as used herein, refer to actual annual advisory fees (and, for the purposes of peer comparisons any administration fees excluding out of pocket costs), net of any waivers, paid by a fund as a percentage of average net assets.
Nature, Extent and Quality of Services
The Trustees reviewed the nature, extent and quality of the services provided by Janus Capital and the subadvisers to the Janus Henderson Funds, taking into account the investment objective, strategies and policies of each Janus Henderson Fund, and the knowledge the Trustees gained from their regular meetings with management on at least a
Janus Henderson VIT Forty Portfolio
Additional Information (unaudited)
quarterly basis and their ongoing review of information related to the Janus Henderson Funds. In addition, the Trustees reviewed the resources and key personnel of Janus Capital and each subadviser, particularly noting those employees who provide investment and risk management services to the Janus Henderson Funds. The Trustees also considered other services provided to the Janus Henderson Funds by Janus Capital or the subadvisers, such as managing the execution of portfolio transactions and the selection of broker-dealers for those transactions. The Trustees considered Janus Capital’s role as administrator to the Janus Henderson Funds, noting that Janus Capital does not receive a fee for its services but is reimbursed for its out-of-pocket costs. The Trustees considered the role of Janus Capital in monitoring adherence to the Janus Henderson Funds’ investment restrictions, providing support services for the Trustees and Trustee committees, and overseeing communications with fund shareholders and the activities of other service providers, including monitoring compliance with various policies and procedures of the Janus Henderson Funds and with applicable securities laws and regulations.
In this regard, the independent fee consultant noted that Janus Capital provides a number of different services for the Janus Henderson Funds and fund shareholders, ranging from investment management services to various other servicing functions, and that, in its view, Janus Capital is a capable provider of those services. The independent fee consultant also expressed the view that Janus Capital has developed a number of institutional competitive advantages that should enable it to provide superior investment and service performance over the long term.
The Trustees concluded that the nature, extent and quality of the services provided by Janus Capital and the subadviser to each Janus Henderson Fund that utilizes a subadviser were appropriate and consistent with the terms of the respective investment advisory and subadvisory agreements, and that, taking into account steps taken to address those Janus Henderson Funds whose performance lagged that of their peers for certain periods, the Janus Henderson Funds were likely to benefit from the continued provision of those services. They also concluded that Janus Capital and each subadviser had sufficient personnel, with the appropriate education and experience, to serve the Janus Henderson Funds effectively and had demonstrated its ability to attract well-qualified personnel.
Performance of the Funds
The Trustees considered the performance results of each Janus Henderson Fund over various time periods. They noted that they considered Janus Henderson Fund performance data throughout the year, including periodic meetings with each Janus Henderson Fund’s portfolio manager(s), and also reviewed information comparing each Janus Henderson Fund’s performance with the performance of comparable funds and peer groups identified by Broadridge Financial Solutions, Inc. (“Broadridge”), an independent data provider, and with the Janus Henderson Fund’s benchmark index. In this regard, the independent fee consultant found that the overall Janus Henderson Funds’ performance has been reasonable: for the 36 months ended September 30, 2018, approximately 48% of the Janus Henderson Funds were in the top two quartiles of performance, as reported by Morningstar, and for the 12 months ended September 30, 2018, approximately 56% of the Janus Henderson Funds were in the top two quartiles of performance, as reported by Morningstar.
The Trustees considered the performance of each Janus Henderson Fund, noting that performance may vary by share class, and noted the following with respect to the VIT Portfolios:
· For Janus Henderson Balanced Portfolio, the Trustees noted that the Fund’s performance was in the first Broadridge quartile for the 36 months ended May 31, 2018 and the first Broadridge quartile for the 12 months ended May 31, 2018.
· For Janus Henderson Enterprise Portfolio, the Trustees noted that the Fund’s performance was in the first Broadridge quartile for the 36 months ended May 31, 2018 and the second Broadridge quartile for the 12 months ended May 31, 2018.
· For Janus Henderson Flexible Bond Portfolio, the Trustees noted that the Fund’s performance was in the bottom Broadridge quartile for the 36 months ended May 31, 2018 and the bottom Broadridge quartile for the 12 months ended May 31, 2018. The Trustees noted the reasons for the Fund’s underperformance and the steps Janus Capital had taken or was taking to improve performance.
· For Janus Henderson Forty Portfolio, the Trustees noted that the Fund’s performance was in the third Broadridge quartile for the 36 months ended May 31, 2018 and the third Broadridge quartile for the 12 months ended May 31,
Janus Henderson VIT Forty Portfolio
Additional Information (unaudited)
2018. The Trustees noted the reasons for the Fund’s underperformance, while also noting that the Fund has a performance fee structure that results in lower management fees during periods of underperformance, and the steps Janus Capital had taken or was taking to improve performance.
· For Janus Henderson Global Research Portfolio, the Trustees noted that the Fund’s performance was in the bottom Broadridge quartile for the 36 months ended May 31, 2018 and the third Broadridge quartile for the 12 months ended May 31, 2018. The Trustees noted the reasons for the Fund’s underperformance, while also noting that the Fund has a performance fee structure that results in lower management fees during periods of underperformance, and the steps Janus Capital had taken or was taking to improve performance.
· For Janus Henderson Global Technology Portfolio, the Trustees noted that the Fund’s performance was in the first Broadridge quartile for the 36 months ended May 31, 2018 and the first Broadridge quartile for the 12 months ended May 31, 2018.
· For Janus Henderson Global Unconstrained Bond Portfolio, the Trustees noted that the Fund’s performance was in the bottom Broadridge quartile for the 36 months ended May 31, 2018 and the bottom Broadridge quartile for the 12 months ended May 31, 2018. The Trustees noted the reasons for the Fund’s underperformance and the steps Janus Capital had taken or was taking to improve performance.
· For Janus Henderson Mid Cap Value Portfolio, the Trustees noted that the Fund’s performance was in the second Broadridge quartile for the 36 months ended May 31, 2018 and the bottom Broadridge quartile for the 12 months ended May 31, 2018.
· For Janus Henderson Overseas Portfolio, the Trustees noted that the Fund’s performance was in the bottom Broadridge quartile for the 36 months ended May 31, 2018 and the second Broadridge quartile for the 12 months ended May 31, 2018. The Trustees noted the reasons for the Fund’s underperformance, while also noting that the Fund has a performance fee structure that results in lower management fees during periods of underperformance, the steps Janus Capital had taken or was taking to improve performance, and that the performance trend was improving.
· For Janus Henderson Research Portfolio, the Trustees noted that the Fund’s performance was in the third Broadridge quartile for the 36 months ended May 31, 2018 and the third Broadridge quartile for the 12 months ended May 31, 2018. The Trustees noted the reasons for the Fund’s underperformance, while also noting that the Fund has a performance fee structure that results in lower management fees during periods of underperformance, and the steps Janus Capital had taken or was taking to improve performance.
· For Janus Henderson U.S. Low Volatility Portfolio, the Trustees noted that the Fund’s performance was in the third Broadridge quartile for the 36 months ended May 31, 2018 and the bottom Broadridge quartile for the 12 months ended May 31, 2018. The Trustees noted the reasons for the Fund’s underperformance and the steps Janus Capital and Intech had taken or were taking to improve performance.
In consideration of each Janus Henderson Fund’s performance, the Trustees concluded that, taking into account the factors relevant to performance, as well as other considerations, including steps taken to improve performance, the Janus Henderson Fund’s performance warranted continuation of such Janus Henderson Fund’s investment advisory and subadvisory agreement(s).
Costs of Services Provided
The Trustees examined information regarding the fees and expenses of each Janus Henderson Fund in comparison to similar information for other comparable funds as provided by Broadridge, an independent data provider. They also reviewed an analysis of that information provided by their independent fee consultant and noted that the management fee rate (investment advisory and any administration fees, but excluding out-of-pocket costs) for many of the Janus Henderson Funds, net of waivers, was below the average management fee rate of the respective peer group of funds selected by Broadridge. The Trustees also examined information regarding the subadvisory fees charged for subadvisory services, as applicable, noting that all such fees were paid by Janus Capital out of its management fees collected from such Janus Henderson Fund. The Trustees also considered the total expenses for each share class of each Janus Henderson Fund compared to the average total expenses for its Broadridge Expense Group peers and to average total expenses for its Broadridge Expense Universe.
The independent fee consultant expressed the view that the management fees charged by Janus Capital to each of the Janus Henderson Funds under the current investment advisory and administration agreements are reasonable in relation to the services provided by Janus Capital. At the fund complex level, the independent fee consultant found: (1)
Janus Henderson VIT Forty Portfolio
Additional Information (unaudited)
the total expenses and management fees of the Janus Henderson Funds to be reasonable relative to other mutual funds; (2) total expenses, on average, were 10% under the average total expenses for the respective Broadridge Expense Group peers and 19% under the average total expenses for the respective Broadridge Expense Universes; (3) management fees for the Janus Henderson Funds, on average, were 8% under the average management fees for the respective Expense Groups and 10% under the average for the respective Expense Universes; and (4) Janus Henderson Fund expenses by function for each asset and share class category were reasonable relative to peer benchmarks.
The independent fee consultant concluded that, based on its strategic review of expenses at the complex, category and individual share class level, Janus Henderson Fund expenses were found to be reasonable relative to peer benchmarks. Further, for certain Janus Henderson Funds, the independent fee consultant also performed a systematic “focus list” analysis of expenses in the context of the performance or service delivered to investors in each Janus Henderson Fund. Based on this analysis, the independent fee consultant found that the combination of service quality/performance and expenses on these individual Janus Henderson Funds were reasonable in light of performance trends, performance histories, and existence of performance fees, breakpoints, and expense waivers on such “focus list” Funds.
The Trustees considered the methodology used by Janus Capital and each subadviser in determining compensation payable to portfolio managers, the competitive environment for investment management talent, and the competitive market for mutual funds in different distribution channels.
The Trustees also reviewed management fees charged by Janus Capital and each subadviser to comparable separate account clients and to comparable non-affiliated funds subadvised by Janus Capital or by a subadviser (for which Janus Capital or the subadviser provides only or primarily portfolio management services). Although in most instances comparable subadvisory and separate account fee rates for various investment strategies were lower than management fee rates for Janus Henderson Funds having a similar strategy, while subadviser fee rates charged to the Janus Henderson Funds were generally within a reasonable range of the fee rates that the subadviser charges to comparable separate account clients or non-affiliated funds. The Trustees considered that Janus Capital noted that, under the terms of the management agreements with the Janus Henderson Funds, Janus Capital performs significant additional services for the Janus Henderson Funds that it does not provide to those other clients, including administration services, oversight of the Janus Henderson Funds’ other service providers, trustee support, regulatory compliance and numerous other services, and that, in serving the Janus Henderson Funds, Janus Capital assumes many legal risks and other costs that it does not assume in servicing its other clients. Moreover, the Trustees noted that the independent fee consultant found that: (1) the management fees Janus Capital charges to the Janus Henderson Funds are reasonable in relation to the management fees Janus Capital charges to its institutional clients and to the fees Janus Capital charges to funds subadvised by Janus Capital; (2) these institutional and subadvised accounts have different service and infrastructure needs; (3) Janus Henderson mutual fund investors enjoy reasonable fees relative to the fees charged to Janus Henderson institutional and subadvised fund investors; (4) in three of five product categories, the Janus Henderson Funds receive proportionally better pricing than the industry in relation to Janus Henderson institutional clients; and (5) in six of seven strategies, Janus Capital has lower management fees than the management fees charged to funds subadvised by Janus Capital.
The Trustees considered the fees for each Janus Henderson Fund for its fiscal year ended in 2017, including the VIT Portfolios, and noted the following with regard to each VIT Portfolio’s total expenses, net of applicable fee waivers (the VIT Portfolio’s “total expenses”):
· For Janus Henderson Balanced Portfolio, the Trustees noted that, although the Fund’s total expenses exceeded the peer group average for one share class, overall the Fund’s total expenses were reasonable.
· For Janus Henderson Enterprise Portfolio, the Trustees noted that, although the Fund’s total expenses exceeded the peer group average for one share class, overall the Fund’s total expenses were reasonable.
· For Janus Henderson Flexible Bond Portfolio, the Trustees noted that, although the Fund’s total expenses exceeded the peer group average for one share class, overall the Fund’s total expenses were reasonable. The Trustees also noted that Janus Capital has contractually agreed to limit the Fund’s expenses, although this limit did not apply because the Fund’s total expenses were already below the applicable fee limit.
· For Janus Henderson Forty Portfolio, the Trustees noted that, although the Fund’s total expenses exceeded the peer group average for one share class, overall the Fund’s total expenses were reasonable.
Janus Henderson VIT Forty Portfolio
Additional Information (unaudited)
· For Janus Henderson Global Research Portfolio, the Trustees noted that the Fund’s total expenses were below the peer group average for both share classes.
· For Janus Henderson Global Technology Portfolio, the Trustees noted that the Fund’s total expenses were below the peer group average for both share classes.
· For Janus Henderson Global Unconstrained Bond Portfolio, the Trustees noted that, although the Fund’s total expenses exceeded the peer group average for both share classes, overall the Fund’s total expenses were reasonable. The Trustees also noted that Janus Capital has contractually agreed to limit the Fund’s expenses.
· For Janus Henderson Mid Cap Value Portfolio, the Trustees noted that the Fund’s total expenses were below the peer group average for both share classes.
· For Janus Henderson Overseas Portfolio, the Trustees noted that the Fund’s total expenses were below the peer group average for both share classes.
· For Janus Henderson Research Portfolio, the Trustees noted that the Fund’s total expenses were below the peer group average for both share classes.
· For Janus Henderson U.S. Low Volatility Portfolio, the Trustees noted that the Fund’s total expenses were below the peer group average for its sole share class.
The Trustees reviewed information on the overall profitability to Janus Capital and its affiliates of their relationship with the Janus Henderson Funds, and considered profitability data of other publicly traded fund managers. The Trustees recognized that profitability comparisons among fund managers are difficult because of the variation in the type of comparative information that is publicly available, and the profitability of any fund manager is affected by numerous factors, including the organizational structure of the particular fund manager, differences in complex size, differences in product mix, differences in types of business (mutual fund, institutional and other), differences in the methodology for allocating expenses, and the fund manager’s capital structure and cost of capital.
Additionally, the Trustees considered the estimated profitability to Janus Capital from the investment management services it provides to each Janus Henderson Fund. In their review, the Trustees considered whether Janus Capital and each subadviser receive adequate incentives and resources to manage the Janus Henderson Funds effectively. In reviewing profitability, the Trustees noted that the estimated profitability for an individual Janus Henderson Fund is necessarily a product of the allocation methodology utilized by Janus Capital to allocate its expenses as part of the estimated profitability calculation. In this regard, the Trustees noted that the independent fee consultant concluded that (1) the expense allocation methodology utilized by Janus Capital was reasonable and (2) the estimated profitability to Janus Capital from the investment management services it provided to each Janus Henderson Fund was reasonable. The Trustees also considered that the estimated profitability for an individual Janus Henderson Fund was influenced by a number of factors, including not only the allocation methodology selected, but also the presence of fee waivers and expense caps, and whether the Janus Henderson Fund’s investment management agreement contained breakpoints or a performance fee component. The Trustees determined, after taking into account these factors, among others, that Janus Capital’s estimated profitability with respect to each Janus Henderson Fund was not unreasonable in relation to the services provided, and that the variation in the range of such estimated profitability among the Janus Henderson Funds was not a material factor in the Board’s approval of the reasonableness of any Janus Henderson Fund’s investment management fees.
The Trustees concluded that the management fees payable by each Janus Henderson Fund to Janus Capital, as well as the fees paid by Janus Capital to the subadvisers of subadvised Janus Henderson Funds, were reasonable in relation to the nature, extent, and quality of the services provided, taking into account the fees charged by other advisers for managing comparable mutual funds with similar strategies, the fees Janus Capital and the subadvisers charge to other clients, and, as applicable, the impact of fund performance on management fees payable by the Janus Henderson Funds. The Trustees also concluded that each Janus Henderson Fund’s total expenses were reasonable, taking into account the size of the Janus Henderson Fund, the quality of services provided by Janus Capital and any subadviser, the investment performance of the Janus Henderson Fund, and any expense limitations agreed to or provided by Janus Capital.
Economies of Scale
The Trustees considered information about the potential for Janus Capital to realize economies of scale as the assets of the Janus Henderson Funds increase. They noted the independent fee consultant’s analysis of economies of scale
Janus Henderson VIT Forty Portfolio
Additional Information (unaudited)
in prior years. They also noted that, although many Janus Henderson Funds pay advisory fees at a base fixed rate as a percentage of net assets, without any breakpoints or performance fees, the independent fee consultant concluded that 74% of these Janus Henderson Funds’ share classes have contractual management fees (gross of waivers) below their Broadridge Expense Group averages. They also noted that for those Janus Henderson Funds whose expenses are being reduced by contractual expense limitations with Janus Capital, Janus Capital is subsidizing certain of these Janus Henderson Funds because they have not reached adequate scale. Moreover, as the assets of some of the Janus Henderson Funds have declined in the past few years, certain Janus Henderson Funds have benefited from having advisory fee rates that have remained constant rather than increasing as assets declined. In addition, performance fee structures have been implemented for various Janus Henderson Funds that have caused the effective rate of advisory fees payable by such a Janus Henderson Fund to vary depending on the investment performance of the Janus Henderson Fund relative to its benchmark index over the measurement period; and a few Janus Henderson Funds have fee schedules with breakpoints and reduced fee rates above certain asset levels. The Trustees also noted that the Janus Henderson Funds share directly in economies of scale through the lower charges of third-party service providers that are based in part on the combined scale of all of the Janus Henderson Funds.
The Trustees also considered information provided by the independent fee consultant, which concluded that, given the limitations of various analytical approaches to economies of scale it had considered in prior years, and their conflicting results, it is difficult to analytically confirm or deny the existence of economies of scale in the Janus Henderson complex. The independent consultant further concluded that (1) to the extent there were economies of scale at Janus Capital, Janus Capital’s general strategy of setting fixed management fees below peers appeared to share any such economies with investors even on smaller Janus Henderson Funds which have not yet achieved those economies and (2) by setting lower fixed fees from the start on these Janus Henderson Funds, Janus Capital appeared to be investing to increase the likelihood that these Janus Henderson Funds will grow to a level to achieve any scale economies that may exist. Further, the independent fee consultant expressed the view that Janus Henderson Fund investors are well-served by the performance fee structures in place on the Janus Henderson Funds in light of any economies of scale that may be present at Janus Capital.
Based on all of the information they reviewed, including past research and analysis conducted by the Trustees’ independent fee consultant, the Trustees concluded that the current fee structure of each Janus Henderson Fund was reasonable and that the current rates of fees do reflect a sharing between Janus Capital and the Janus Henderson Fund of any economies of scale that may be present at the current asset level of the Janus Henderson Fund.
Other Benefits to Janus Capital
The Trustees also considered benefits that accrue to Janus Capital and its affiliates and subadvisers to the Janus Henderson Funds from their relationships with the Janus Henderson Funds. They recognized that two affiliates of Janus Capital separately serve the Janus Henderson Funds as transfer agent and distributor, respectively, and the transfer agent receives compensation directly from the non-money market funds for services provided, and that such compensation contributes to the overall profitability of Janus Capital and its affiliates that results from their relationship with the Janus Henderson Funds. The Trustees also considered Janus Capital’s and each subadviser’s past and proposed use of commissions paid by the Janus Henderson Funds on portfolio brokerage transactions to obtain proprietary and third-party research products and services benefiting the Janus Henderson Fund and/or other clients of Janus Capital and/or Janus Capital, and/or a subadviser to a Janus Henderson Fund. The Trustees concluded that Janus Capital’s and the subadvisers’ use of these types of client commission arrangements to obtain proprietary and third-party research products and services was likely to benefit each Janus Henderson Fund. The Trustees also concluded that, other than the services provided by Janus Capital and its affiliates and subadvisers pursuant to the agreements and the fees to be paid by each Janus Henderson Fund therefor, the Janus Henderson Funds and Janus Capital and the subadvisers may potentially benefit from their relationship with each other in other ways. They concluded that Janus Capital and its affiliates share directly in economies of scale through the lower charges of third-party service providers that are based in part on the combined scale of the Janus Henderson Funds and other clients serviced by Janus Capital and its affiliates. They also concluded that Janus Capital and/or the subadvisers benefit from the receipt of research products and services acquired through commissions paid on portfolio transactions of the Janus Henderson Funds and that the Janus Henderson Funds benefit from Janus Capital’s and/or the subadvisers’ receipt of those products and services as well as research products and services acquired through commissions paid by certain other clients of Janus Capital and/or other clients of the subadvisers. They further concluded that the success of any Janus Henderson Fund could attract other business to Janus Capital, the subadvisers or other Janus Henderson funds,
Janus Henderson VIT Forty Portfolio
Additional Information (unaudited)
and that the success of Janus Capital and the subadvisers could enhance Janus Capital’s and the subadvisers’ ability to serve the Janus Henderson Funds.
Janus Henderson VIT Forty Portfolio
Useful Information About Your Portfolio Report (unaudited)
Management Commentary
The Management Commentary in this report includes valuable insight as well as statistical information to help you understand how your Portfolio’s performance and characteristics stack up against those of comparable indices.
If the Portfolio invests in foreign securities, this report may include information about country exposure. Country exposure is based primarily on the country of risk. A company may be allocated to a country based on other factors such as location of the company’s principal office, the location of the principal trading market for the company’s securities, or the country where a majority of the company’s revenues are derived.
Please keep in mind that the opinions expressed in the Management Commentary are just that: opinions. They are a reflection based on best judgment at the time this report was compiled, which was December 31, 2018. As the investing environment changes, so could opinions. These views are unique and are not necessarily shared by fellow employees or by Janus Henderson in general.
Performance Overviews
Performance overview graphs compare the performance of a hypothetical $10,000 investment in the Portfolio with one or more widely used market indices. When comparing the performance of the Portfolio with an index, keep in mind that market indices are not available for investment and do not reflect deduction of expenses.
Average annual total returns are quoted for a Portfolio with more than one year of performance history. Average annual total return is calculated by taking the growth or decline in value of an investment over a period of time, including reinvestment of dividends and distributions, then calculating the annual compounded percentage rate that would have produced the same result had the rate of growth been constant throughout the period. Average annual total return does not reflect the deduction of taxes that a shareholder would pay on Portfolio distributions or redemptions of Portfolio shares.
Cumulative total returns are quoted for a Portfolio with less than one year of performance history. Cumulative total return is the growth or decline in value of an investment over time, independent of the period of time involved. Cumulative total return does not reflect the deduction of taxes that a shareholder would pay on Portfolio distributions or redemptions of Portfolio shares.
Pursuant to federal securities rules, expense ratios shown in the performance chart reflect subsidized (if applicable) and unsubsidized ratios. The total annual fund operating expenses ratio is gross of any fee waivers, reflecting the Portfolio’s unsubsidized expense ratio. The net annual fund operating expenses ratio (if applicable) includes contractual waivers of Janus Capital and reflects the Portfolio’s subsidized expense ratio. Ratios may be higher or lower than those shown in the “Financial Highlights” in this report.
Schedule of Investments
Following the performance overview section is the Portfolio’s Schedule of Investments. This schedule reports the types of securities held in the Portfolio on the last day of the reporting period. Securities are usually listed by type (common stock, corporate bonds, U.S. Government obligations, etc.) and by industry classification (banking, communications, insurance, etc.). Holdings are subject to change without notice.
The value of each security is quoted as of the last day of the reporting period. The value of securities denominated in foreign currencies is converted into U.S. dollars.
If the Portfolio invests in foreign securities, it will also provide a summary of investments by country. This summary reports the Portfolio exposure to different countries by providing the percentage of securities invested in each country. The country of each security represents the country of risk. The Portfolio’s Schedule of Investments relies upon the industry group and country classifications published by Barclays and/or MSCI Inc.
Tables listing details of individual forward currency contracts, futures, written options, swaptions, and swaps follow the Portfolio’s Schedule of Investments (if applicable).
Statement of Assets and Liabilities
This statement is often referred to as the “balance sheet.” It lists the assets and liabilities of the Portfolio on the last day of the reporting period.
Janus Henderson VIT Forty Portfolio
Useful Information About Your Portfolio Report (unaudited)
The Portfolio’s assets are calculated by adding the value of the securities owned, the receivable for securities sold but not yet settled, the receivable for dividends declared but not yet received on securities owned, and the receivable for Portfolio shares sold to investors but not yet settled. The Portfolio’s liabilities include payables for securities purchased but not yet settled, Portfolio shares redeemed but not yet paid, and expenses owed but not yet paid. Additionally, there may be other assets and liabilities such as unrealized gain or loss on forward currency contracts.
The section entitled “Net Assets Consist of” breaks down the components of the Portfolio’s net assets. Because the Portfolio must distribute substantially all earnings, you will notice that a significant portion of net assets is shareholder capital.
The last section of this statement reports the net asset value (“NAV”) per share on the last day of the reporting period. The NAV is calculated by dividing the Portfolio’s net assets for each share class (assets minus liabilities) by the number of shares outstanding.
Statement of Operations
This statement details the Portfolio’s income, expenses, realized gains and losses on securities and currency transactions, and changes in unrealized appreciation or depreciation of Portfolio holdings.
The first section in this statement, entitled “Investment Income,” reports the dividends earned from securities and interest earned from interest-bearing securities in the Portfolio.
The next section reports the expenses incurred by the Portfolio, including the advisory fee paid to the investment adviser, transfer agent fees and expenses, and printing and postage for mailing statements, financial reports and prospectuses. Expense offsets and expense reimbursements, if any, are also shown.
The last section lists the amounts of realized gains or losses from investment and foreign currency transactions, and changes in unrealized appreciation or depreciation of investments and foreign currency-denominated assets and liabilities. The Portfolio will realize a gain (or loss) when it sells its position in a particular security. A change in unrealized gain (or loss) refers to the change in net appreciation or depreciation of the Portfolio during the reporting period. “Net Realized and Unrealized Gain/(Loss) on Investments” is affected both by changes in the market value of Portfolio holdings and by gains (or losses) realized during the reporting period.
Statements of Changes in Net Assets
These statements report the increase or decrease in the Portfolio’s net assets during the reporting period. Changes in the Portfolio’s net assets are attributable to investment operations, dividends and distributions to investors, and capital share transactions. This is important to investors because it shows exactly what caused the Portfolio’s net asset size to change during the period.
The first section summarizes the information from the Statement of Operations regarding changes in net assets due to the Portfolio’s investment operations. The Portfolio’s net assets may also change as a result of dividend and capital gains distributions to investors. If investors receive their dividends and/or distributions in cash, money is taken out of the Portfolio to pay the dividend and/or distribution. If investors reinvest their dividends and/or distributions, the Portfolio’s net assets will not be affected. If you compare the Portfolio’s “Net Decrease from Dividends and Distributions” to “Reinvested Dividends and Distributions,” you will notice that dividends and distributions have little effect on the Portfolio’s net assets. This is because the majority of the Portfolio’s investors reinvest their dividends and/or distributions.
The reinvestment of dividends and distributions is included under “Capital Share Transactions.” “Capital Shares” refers to the money investors contribute to the Portfolio through purchases or withdrawals via redemptions. The Portfolio’s net assets will increase and decrease in value as investors purchase and redeem shares from the Portfolio.
Financial Highlights
This schedule provides a per-share breakdown of the components that affect the Portfolio’s NAV for current and past reporting periods as well as total return, asset size, ratios, and portfolio turnover rate.
The first line in the table reflects the NAV per share at the beginning of the reporting period. The next line reports the net investment income/(loss) per share. Following is the per share total of net gains/(losses), realized and unrealized. Per share dividends and distributions to investors are then subtracted to arrive at the NAV per share at the end of the
Janus Henderson VIT Forty Portfolio
Useful Information About Your Portfolio Report (unaudited)
period. The next line reflects the total return for the period. Also included are ratios of expenses and net investment income to average net assets.
The Portfolio’s expenses may be reduced through expense offsets and expense reimbursements. The ratios shown reflect expenses before and after any such offsets and reimbursements.
The ratio of net investment income/(loss) summarizes the income earned less expenses, divided by the average net assets of the Portfolio during the reporting period. Do not confuse this ratio with the Portfolio’s yield. The net investment income ratio is not a true measure of the Portfolio’s yield because it does not take into account the dividends distributed to the Portfolio’s investors.
The next figure is the portfolio turnover rate, which measures the buying and selling activity in the Portfolio. Portfolio turnover is affected by market conditions, changes in the asset size of the Portfolio, fluctuating volume of shareholder purchase and redemption orders, the nature of the Portfolio’s investments, and the investment style and/or outlook of the portfolio manager(s) and/or investment personnel. A 100% rate implies that an amount equal to the value of the entire portfolio was replaced once during the fiscal year; a 50% rate means that an amount equal to the value of half the portfolio is traded in a year; and a 200% rate means that an amount equal to the value of the entire portfolio is traded every six months.
Janus Henderson VIT Forty Portfolio
Designation Requirements (unaudited)
For federal income tax purposes, the Portfolio designated the following for the year ended December 31, 2018:
| | |
| | |
Capital Gain Distributions | $105,016,382 |
Dividends Received Deduction Percentage | 56% |
Janus Henderson VIT Forty Portfolio
Trustees and Officers (unaudited)
The Portfolio’s Statement of Additional Information includes additional information about the Trustees and officers and is available, without charge, by calling 1-877-335-2687.
The following are the Trustees and officers of the Trust, together with a brief description of their principal occupations during the last five years (principal occupations for certain Trustees may include periods over five years).
Each Trustee has served in that capacity since he or she was originally elected or appointed. The Trustees do not serve a specified term of office. Each Trustee will hold office until the termination of the Trust or his or her earlier death, resignation, retirement, incapacity, or removal. Under the Portfolio’s Governance Procedures and Guidelines, the policy is for Trustees to retire no later than the end of the calendar year in which the Trustee turns 75. The Trustees review the Portfolio’s Governance Procedures and Guidelines from time to time and may make changes they deem appropriate. The Portfolio’s Nominating and Governance Committee will consider nominees for the position of Trustee recommended by shareholders. Shareholders may submit the name of a candidate for consideration by the Committee by submitting their recommendations to the Trust’s Secretary. Each Trustee is currently a Trustee of one other registered investment company advised by Janus Capital: Janus Investment Fund. Collectively, these two registered investment companies consist of 60 series or funds.
The Trust’s officers are elected annually by the Trustees for a one-year term. Certain officers also serve as officers of Janus Investment Fund. Certain officers of the Portfolio may also be officers and/or directors of Janus Capital. Except as otherwise disclosed, Portfolio officers receive no compensation from the Portfolio, except for the Portfolio’s Chief Compliance Officer, as authorized by the Trustees.
Janus Henderson VIT Forty Portfolio
Trustees and Officers (unaudited)
| | | | | | |
TRUSTEES |
Name, Address, and Age | Positions Held with the Trust | Length of Time Served | Principal Occupations During the Past Five Years | Number of Portfolios/Funds in Fund Complex Overseen by Trustee | Other Directorships Held by Trustee During the Past Five Years |
Independent Trustees |
William F. McCalpin
151 Detroit Street
Denver, CO 80206
DOB: 1957 | Chairman
Trustee | 1/08-Present
6/02-Present | Managing Partner, Impact Investments, Athena Capital Advisors LLC (independent registered investment advisor) (since 2016). Formerly, Managing Director, Holos Consulting LLC (provides consulting services to foundations and other nonprofit organizations) (2009-2016), Chief Executive Officer, Imprint Capital Advisors (impact investment firm) (2013-2015) and Executive Vice President and Chief Operating Officer of The Rockefeller Brothers Fund (a private family foundation) (1998-2006). | 60 | Director of Mutual Fund Directors Forum (a non-profit organization serving independent directors of U.S. mutual funds), Chairman of the Board and Trustee of The Investment Fund for Foundations Investment Program (TIP) (consisting of 2 funds), and Director of the F.B. Heron Foundation (a private grantmaking foundation). |
Janus Henderson VIT Forty Portfolio
Trustees and Officers (unaudited)
| | | | | | |
TRUSTEES |
Name, Address, and Age | Positions Held with the Trust | Length of Time Served | Principal Occupations During the Past Five Years | Number of Portfolios/Funds in Fund Complex Overseen by Trustee | Other Directorships Held by Trustee During the Past Five Years |
Independent Trustees |
Alan A. Brown
151 Detroit Street
Denver, CO 80206
DOB: 1962 | Trustee | 1/13-Present | Principal, Principal Curam Holdings (since 2018). Formery, Executive Vice President, Institutional Markets, of Black Creek Group (private equity real estate investment management firm) (2012-2018), Executive Vice President and Co-Head, Global Private Client Group (2007-2010), Executive Vice President, Mutual Funds (2005-2007), and Chief Marketing Officer (2001-2005) of Nuveen Investments, Inc. (asset management). | 60 | Director of WTTW (PBS affiliate) (since 2003). Formerly, Director of MotiveQuest LLC (strategic social market research company) (2003-2016); Director of Nuveen Global Investors LLC (2007-2011); Director of Communities in Schools (2004-2010); and Director of Mutual Fund Education Alliance (until 2010). |
Janus Henderson VIT Forty Portfolio
Trustees and Officers (unaudited)
| | | | | | |
TRUSTEES |
Name, Address, and Age | Positions Held with the Trust | Length of Time Served | Principal Occupations During the Past Five Years | Number of Portfolios/Funds in Fund Complex Overseen by Trustee | Other Directorships Held by Trustee During the Past Five Years |
Independent Trustees |
William D. Cvengros
151 Detroit Street
Denver, CO 80206
DOB: 1948 | Trustee | 1/11-Present | Chief Executive Officer of SJC Capital, LLC (a personal investment company and consulting firm) (since 2002). Formerly, Venture Partner for The Edgewater Funds (a middle market private equity firm) (2002-2004); Chief Executive Officer and President of PIMCO Advisors Holdings L.P. (a publicly traded investment management firm) (1994-2000); and Chief Investment Officer (1987-1994) and Vice Chairman and Director (1990-1994) of Pacific Life Insurance Company (a mutual life insurance and annuity company) (1987-1994). | 60 | Advisory Board Member, Innovate Partners Emerging Growth and Equity Fund I (early stage venture capital fund) (since 2014). Formerly, Managing Trustee of National Retirement Partners Liquidating Trust (2013-2016); Chairman, National Retirement Partners, Inc. (formerly a network of advisors to 401(k) plans) (2005-2013); Director of Prospect Acquisition Corp. (a special purpose acquisition corporation) (2007-2009); Director of RemedyTemp, Inc. (temporary help services company) (1996-2006); and Trustee of PIMCO Funds Multi-Manager Series (1990-2000) and Pacific Life Variable Life & Annuity Trusts (1987-1994). |
Janus Henderson VIT Forty Portfolio
Trustees and Officers (unaudited)
| | | | | | |
TRUSTEES |
Name, Address, and Age | Positions Held with the Trust | Length of Time Served | Principal Occupations During the Past Five Years | Number of Portfolios/Funds in Fund Complex Overseen by Trustee | Other Directorships Held by Trustee During the Past Five Years |
Independent Trustees |
Raudline Etienne
151 Detroit Street
Denver, CO 80206
DOB: 1965 | Trustee | 6/16-Present | Founder, Daraja Capital (advisory and investment firm) (since 2016), and Senior Advisor, Albright Stonebridge Group LLC (global strategy firm) (since 2016). Formerly, Senior Vice President (2011-2015), Albright Stonebridge Group LLC; and Deputy Comptroller and Chief Investment Officer, New York State Common Retirement Fund (public pension fund) (2008-2011). | 60 | Director of Brightwood Capital Advisors, LLC (since 2014). |
Janus Henderson VIT Forty Portfolio
Trustees and Officers (unaudited)
| | | | | | |
TRUSTEES |
Name, Address, and Age | Positions Held with the Trust | Length of Time Served | Principal Occupations During the Past Five Years | Number of Portfolios/Funds in Fund Complex Overseen by Trustee | Other Directorships Held by Trustee During the Past Five Years |
Independent Trustees |
Gary A. Poliner 151 Detroit Street Denver, CO 80206
DOB: 1953 | Trustee | 6/16-Present | Retired. Formerly, President (2010-2013) of Northwestern Mutual Life Insurance Company. | 60 | Director of MGIC Investment Corporation (private mortgage insurance) (since 2013) and West Bend Mutual Insurance Company (property/casualty insurance) (since 2013). Formerly, Trustee of Northwestern Mutual Life Insurance Company (2010-2013); and Director of Frank Russell Company (global asset management firm) (2008-2013). |
Janus Henderson VIT Forty Portfolio
Trustees and Officers (unaudited)
| | | | | | |
TRUSTEES |
Name, Address, and Age | Positions Held with the Trust | Length of Time Served | Principal Occupations During the Past Five Years | Number of Portfolios/Funds in Fund Complex Overseen by Trustee | Other Directorships Held by Trustee During the Past Five Years |
Independent Trustees |
James T. Rothe*
151 Detroit Street
Denver, CO 80206
DOB: 1943 | Trustee | 1/97-Present | Professor Emeritus of Business of the University of Colorado, Colorado Springs, CO (since 2004). Formerly, Co-founder and Managing Director of Roaring Fork Capital SBIC, L.P. (SBA SBIC fund focusing on private investment in public equity firms) (2004-2014), Professor of Business of the University of Colorado (2002-2004), and Distinguished Visiting Professor of Business (2001-2002) of Thunderbird (American Graduate School of International Management), Glendale, AZ. | 60 | Formerly, Director of Red Robin Gourmet Burgers, Inc. (RRGB) (2004-2014). |
*James T. Rothe retired from his role as Independent Trustee, effective December 31, 2018. | |
Janus Henderson VIT Forty Portfolio
Trustees and Officers (unaudited)
| | | | | | |
TRUSTEES |
Name, Address, and Age | Positions Held with the Trust | Length of Time Served | Principal Occupations During the Past Five Years | Number of Portfolios/Funds in Fund Complex Overseen by Trustee | Other Directorships Held by Trustee During the Past Five Years |
Independent Trustees |
William D. Stewart
151 Detroit Street
Denver, CO 80206
DOB: 1944 | Trustee | 6/84-Present | Retired. Formerly, President and founder of HPS Products and Corporate Vice President of MKS Instruments, Boulder, CO (a provider of advanced process control systems for the semiconductor industry) (1976-2012). | 60 | None |
Diane L. Wallace
151 Detroit Street
Denver, CO 80206
DOB: 1958 | Trustee | 6/17-Present | Retired. | 60 | Formerly, Independent Trustee, Henderson Global Funds (13 portfolios) (2015-2017); Independent Trustee, State Farm Associates' Funds Trust, State Farm Mutual Fund Trust, and State Farm Variable Product Trust (28 portfolios) (2013-2017); Chief Operating Officer, Senior Vice President-Operations, and Chief Financial Officer for Driehaus Capital Management, LLC (1988-2006); and Treasurer for Driehaus Mutual Funds (1996-2002). |
Janus Henderson VIT Forty Portfolio
Trustees and Officers (unaudited)
| | | | | | |
TRUSTEES |
Name, Address, and Age | Positions Held with the Trust | Length of Time Served | Principal Occupations During the Past Five Years | Number of Portfolios/Funds in Fund Complex Overseen by Trustee | Other Directorships Held by Trustee During the Past Five Years |
Independent Trustees |
Linda S. Wolf
151 Detroit Street
Denver, CO 80206
DOB: 1947 | Trustee | 11/05-Present | Retired. Formerly, Chairman and Chief Executive Officer of Leo Burnett (Worldwide) (advertising agency) (2001-2005). | 60 | Director of Chicago Community Trust (Regional Community Foundation), Chicago Council on Global Affairs, InnerWorkings (U.S. provider of print procurement solutions to corporate clients), Lurie Children’s Hospital (Chicago, IL), Shirley Ryan Ability Lab and Wrapports, LLC (digital communications company). Formerly, Director of Walmart (until 2017), Director of Chicago Convention & Tourism Bureau (until 2014) and The Field Museum of Natural History (Chicago, IL) (until 2014). |
Janus Henderson VIT Forty Portfolio
Trustees and Officers (unaudited)
| | | | |
OFFICERS |
Name, Address, and Age | Positions Held with the Trust | Term of Office* and Length of Time Served | Principal Occupations During the Past Five Years |
A. Douglas Rao
151 Detroit Street
Denver, CO 80206
DOB: 1974 | Executive Vice President and Co-Portfolio Manager Janus Henderson Forty Portfolio | 6/13-Present | Portfolio Manager for other Janus Henderson accounts. Formerly, Partner and Portfolio Manager for Chautauqua Capital Management (2012-2013) and Portfolio Manager for Marsico Capital Management, LLC (2007-2012). |
Nick Schommer
151 Detroit Street
Denver, CO 80206
DOB: 1978 | Executive Vice President and Co-Portfolio Manager
Janus Henderson Forty Portfolio | 1/16-Present | Portfolio Manager for other Janus Henderson accounts. Formerly, Associate Portfolio Manager at Thornburg Investment Management (2012-2013). |
Bruce L. Koepfgen
151 Detroit Street
Denver, CO 80206
DOB: 1952 | President and Chief Executive Officer | 7/14-Present | Head of North America at Janus Henderson Investors and Janus Capital Management LLC (since 2017); Executive Vice President and Director of Janus International Holding LLC (since 2011); Executive Vice President of Janus Distributors LLC (since 2011); Vice President and Director of INTECH Investment Management LLC (since 2011); Executive Vice President and Director of Perkins Investment Management LLC (since 2011); and Executive Vice President and Director of Janus Management Holdings Corporation (since 2011). Formerly, President of Janus Capital Group Inc. and Janus Capital Management LLC (2013-2017); Executive Vice President of Janus Services LLC (2011-2015), Janus Capital Group Inc. and Janus Capital Management LLC (2011-2013); and Chief Financial Officer of Janus Capital Group Inc., Janus Capital Management LLC, Janus Distributors LLC, Janus Management Holdings Corporation, and Janus Services LLC (2011-2013). |
* Officers are elected at least annually by the Trustees for a one-year term and may also be elected from time to time by the Trustees for an interim period. |
Janus Henderson VIT Forty Portfolio
Trustees and Officers (unaudited)
| | | | |
OFFICERS |
Name, Address, and Age | Positions Held with the Trust | Term of Office* and Length of Time Served | Principal Occupations During the Past Five Years |
Susan K. Wold
151 Detroit Street
Denver, CO 80206
DOB: 1960 | Vice President, Chief Compliance Officer, and Anti-Money Laundering Officer | 9/17-Present | Senior Vice President and Head of
Compliance, North America for Janus
Henderson (since September 2017);
Formerly, Vice President, Head of Global Corporate Compliance, and Chief
Compliance Officer for Janus Capital
Management LLC (May 2017-September
2017); Vice President, Compliance at Janus Capital Group Inc. and Janus Capital Management LLC (2005-2017). |
Jesper Nergaard
151 Detroit Street
Denver, CO 80206
DOB: 1962 | Chief Financial Officer
Vice President, Treasurer, and Principal Accounting Officer | 3/05-Present
2/05-Present | Vice President of Janus Capital and Janus Services LLC. |
Kathryn L. Santoro
151 Detroit Street
Denver, CO 80206
DOB: 1974 | Vice President, Chief Legal Counsel, and Secretary | 12/16-Present | Vice President of Janus Capital and Janus Services LLC (since 2016). Formerly, Vice President and Associate Counsel of Curian Capital, LLC and Curian Clearing LLC (2013-2016); and General Counsel and Secretary (2011-2012) and Vice President (2009-2012) of Old Mutual Capital, Inc. |
* Officers are elected at least annually by the Trustees for a one-year term and may also be elected from time to time by the Trustees for an interim period. |
Janus Henderson VIT Forty Portfolio
Notes
NotesPage1
Janus Henderson VIT Forty Portfolio
Notes
NotesPage2
Janus Henderson VIT Forty Portfolio
Notes
NotesPage3
Knowledge. Shared
At Janus Henderson, we believe in the sharing of expert insight for better investment and business decisions. We call this ethos Knowledge. Shared.
Learn more by visiting janushenderson.com.
| | | | | | | | | |
| | | | | |

| | | | |
This report is submitted for the general information of shareholders of the Portfolio. It is not an offer or solicitation for the Portfolio and is not authorized for distribution to prospective investors unless preceded or accompanied by an effective prospectus. |
Janus Henderson, Janus, Henderson, Perkins, Intech and Knowledge. Shared are trademarks of Janus Henderson Group plc or one of its subsidiaries. © Janus Henderson Group plc. Janus Henderson Distributors |
| | | | | 109-02-81115 02-19 |
| | | |
| | | |
| | | ANNUAL REPORT December 31, 2018 |
| | |
| | Janus Henderson VIT Global Research Portfolio |
| | |
| | Janus Aspen Series |
Beginning on January 1, 2021, as permitted by regulations adopted by the Securities and Exchange Commission, the insurance company that offers your variable life insurance contract or variable annuity contract, may determine that it will no longer send you paper copies of the Portfolio’s shareholder reports, unless you specifically request paper copies of the reports. Beginning on January 1, 2021, for shareholders who are not insurance contract holders, paper copies of the Portfolio’s shareholder reports will no longer be sent by mail unless you specifically request paper copies of the reports. Instead, the reports will be made available on a website, and your insurance company or plan sponsor, broker-dealer, or financial intermediary will notify you by mail each time a report is posted and provide you with a website link to access the report. Instructions for requesting paper copies will be provided by your insurance company or plan sponsor, broker-dealer, or financial intermediary. If you already elected to receive shareholder reports electronically, you will not be affected by this change and you need not take any action. You may elect to receive shareholder reports and other communications from the Portfolio electronically by contacting your insurance company or plan sponsor, broker-dealer, or other financial intermediary. You may elect to receive all future reports in paper free of charge by contacting your insurance company or plan sponsor, broker dealer or other financial intermediary. Your election to receive reports in paper will apply to all funds held in your account with your insurance company or plan sponsor, broker dealer or other financial intermediary. |
| | | |
| | | HIGHLIGHTS · Portfolio management perspective · Investment strategy behind your portfolio · Portfolio performance, characteristics
and holdings |
| | | |
| | | 
|
Table of Contents
Janus Henderson VIT Global Research Portfolio
| | |
Management Commentary and Schedule of Investments | 1 |
Notes to Schedule of Investments and Other Information | 12 |
Statement of Assets and Liabilities | 14 |
Statement of Operations | 15 |
Statements of Changes in Net Assets | 16 |
Financial Highlights | 17 |
Notes to Financial Statements | 18 |
Report of Independent Registered Public Accounting Firm | 29 |
Additional Information | 30 |
Useful Information About Your Portfolio Report | 37 |
Designation Requirements | 40 |
Trustees and Officers | 41 |
Janus Henderson VIT Global Research Portfolio (unaudited)
| | | | | | |
PORTFOLIO SNAPSHOT We believe that the best way to generate consistent excess returns is stock picking based on independent research. We focus the risks of the Portfolio on what we are good at – research and stock selection – and seek to avoid unnecessary risks – macro risks and other portfolio biases. Therefore, we let sector experts drive the process and pick their best ideas, and use a portfolio oversight team to monitor the risk of the Portfolio and keep it focused on stock selection. | | | | | Team-Based Approach Led by Carmel Wellso, Director of Research |
| | | |
PERFORMANCE OVERVIEW
Janus Henderson Global Research Portfolio’s Institutional Shares and Service Shares returned -6.87% and -7.08%, respectively, over the 12-month period ended December 31, 2018, while its primary benchmark, the MSCI World IndexSM, returned -8.71%. The Portfolio’s secondary benchmark, the MSCI All Country World IndexSM, returned -9.42%.
MARKET ENVIRONMENT
Global equity markets were volatile and lost ground during the year. While corporate earnings growth was solid, global trade tensions and the prospect of rising U.S. interest rates weighed on stocks. In the fourth quarter, markets fell sharply as trade tensions between the U.S. and China escalated and data suggested weaker international economic growth. The industrials and financials sectors suffered the steepest losses within the index.
PERFORMANCE DISCUSSION
Our six global sector teams employ a bottom-up, fundamental approach to identify what we consider the best global opportunities. Our analysts take a long-term view of companies with a focus on value creation and duration of growth, which lead to high returns on invested capital. The Portfolio directly captures the insights of our teams through their highest-conviction ideas. In building a diversified portfolio, we seek to minimize macroeconomic risks while generating superior performance over longer periods.
Contributing most to relative returns were the Portfolio’s selection of financials and industrial stocks. Underperformance was concentrated in technology.
Eli Lilly & Co. was our top contributor on an absolute basis. The stock climbed in the third quarter after the pharmaceutical giant reported quarterly results that beat consensus estimates and raised guidance for the year. In addition, Eli Lilly received regulatory approval for Emgality, a migraine prevention treatment, and in the fourth quarter, reported positive results from a mid-stage clinical trial for a drug that targets two hormones in diabetes patients. The drugs add to the company’s expanding roster of recently approved products, all of which are helping drive sales growth for the firm.
Amazon was another top contributor. The company strung together several quarters of strong earnings growth, helping to affirm its powerful, secular growth potential. Amazon is a longtime holding in our Portfolio and our views on the company remain the same: The company’s scale and distribution advantage have entrenched it as the dominant e-commerce platform, which should allow it to continue gaining consumer wallet share as shopping gravitates to online and mobile purchases. Meanwhile, we believe Amazon Web Services is revolutionizing the way companies utilize IT services, using its scale to offer a disruptive pricing model to businesses seeking IT functions in the cloud.
NRG Energy also made meaningful contributions to performance. We have long felt the market was overly focused on the volatility of the utility company’s earnings and failed to recognize its potential for increased cash flow generation as management undertook a plan to cut costs and shed unprofitable businesses. This year, earnings and free-cash-flow growth have improved as a result of that plan and the stock rose as the market came to appreciate NRG’s improved profile after rationalizing some of its businesses.
Flextronics (Flex) was another large detractor. The supply chain solutions company had been working on a solution to near-source manufacturing for Nike, but after delays on the project both sides walked away from it. The departure of the company’s CEO also weighed on the stock. After execution issues from the company, we sold the stock to pursue higher conviction ideas for the portfolio.
Janus Henderson VIT Global Research Portfolio (unaudited)
Shares in Synchrony Financial fell during the year. Cyclical financial stocks fell broadly due to concerns about the economic outlook. An announcement that Wal-Mart would not renew its relationship with the credit card provider also negatively affected the stock. The news of the Wal-Mart partnership does not change our view on the stock. We continue to favor the company for its private-label credit card business, where it has an estimated 40% market share. This business line, in our view, is quite stable given the preponderance of long-term contracts with clients. We also believe Synchrony offers a significant value proposition for retailers, because it can collect data on customers’ purchases and help retailers create advertising campaigns and promotions that will drive more store traffic and purchase volume.
Parker Hannifin also detracted. The stock fell early in the period after North American profit margins disappointed versus high expectations. We believe the main causes were product mix and inefficiencies caused by plant closures, a result of the integration of Clarcor, which Parker acquired in 2016. We believe these headwinds are temporary and set up for better incremental margins in 2019. Further, Parker is focused on reducing costs and optimizing performance, which, along with a lower U.S. corporate tax rate, should boost earnings.
OUTLOOK
We believe equity investors should be prepared for more volatility in the coming months. The business cycle is aging, a decades-low unemployment rate in the U.S. has started to put upward pressure on wages and the Federal Reserve continues to normalize monetary policy. In addition, geopolitical risks have created headwinds, from ongoing trade tensions between the U.S. and China to uncertainty about Brexit. While these factors do not signal that a recession is imminent, in our opinion, they do suggest that the global economy could deliver slower growth in 2019.
In such an environment, we believe stocks sensitive to economic growth or interest rate moves could be challenged. As a result, we continue to look for growth stories that we believe will persist irrespective of the business cycle, including innovation in health care and the shift to the digital economy. At the same time, market volatility has led to a significant re-rating in the valuations of stocks globally. As multiples improve, we will aim to take advantage of secular growth stories that previously looked expensive. Select emerging market stocks, for example, could benefit from the potential diversification of global supply chains while companies with ample free cash flows may decide to increase dividends or repurchase shares. In our experience, focusing on these types of fundamentals makes it easier to ride out periods of market volatility and often leads to better long-term results.
Thank you for your investment in Janus Henderson VIT Global Research Portfolio.
Janus Henderson VIT Global Research Portfolio (unaudited)
Portfolio At A Glance
December 31, 2018
| | | | | | | |
| | | | | | | |
| | | | | | | |
| | | | | | | |
| | 5 Top Performers - Holdings | | | | 5 Bottom Performers - Holdings | |
| | | | Contribution | | | Contribution |
| | Eli Lilly & Co | | 0.47% | | British American Tobacco PLC | -0.98% |
| | Amazon.com Inc | | 0.46% | | Flex Ltd | -0.54% |
| | NRG Energy Inc | | 0.44% | | Synchrony Financial | -0.45% |
| | salesforce.com inc | | 0.42% | | Parker-Hannifin Corp | -0.37% |
| | Mastercard Inc | | 0.36% | | Wells Fargo & Co | -0.36% |
| | | | | | | |
| | 5 Top Performers - Sectors* | | | | | |
| | | | Portfolio | | Portfolio Weighting | MSCI World Index |
| | | | Contribution | | (Average % of Equity) | Weighting |
| | Financials | | 1.19% | | 21.60% | 21.68% |
| | Industrials | | 0.73% | | 18.71% | 18.74% |
| | Healthcare | | 0.39% | | 12.56% | 12.61% |
| | Energy | | 0.07% | | 9.33% | 9.33% |
| | Other** | | 0.04% | | 0.53% | 0.01% |
| | | | | | | |
| | 2 Bottom Performers - Sectors* | | | | | |
| | | | Portfolio | | Portfolio Weighting | MSCI World Index |
| | | | Contribution | | (Average % of Equity) | Weighting |
| | Technology | | -0.40% | | 19.45% | 19.69% |
| | Consumer | | -0.09% | | 17.81% | 17.94% |
| | | | | | | |
| | Security contribution to performance is measured by using an algorithm that multiplies the daily performance of each security with the previous day’s ending weight in the portfolio and is gross of advisory fees. Fixed income securities and certain equity securities, such as private placements and some share classes of equity securities, are excluded. |
* | The sectors listed above reflect those covered by the six analyst teams who comprise the Janus Henderson Research Team. |
** | Not a GICS classified sector. | | | | | |
Janus Henderson VIT Global Research Portfolio (unaudited)
Portfolio At A Glance
December 31, 2018
| | |
5 Largest Equity Holdings - (% of Net Assets) |
Alphabet Inc - Class C | |
Interactive Media & Services | 3.2% |
Amazon.com Inc | |
Internet & Direct Marketing Retail | 2.5% |
Coca-Cola Co | |
Beverages | 2.3% |
JPMorgan Chase & Co | |
Banks | 1.9% |
Safran SA | |
Aerospace & Defense | 1.8% |
| | 11.7% |
| | | | | | |
Asset Allocation - (% of Net Assets) |
Common Stocks | | 99.7% |
Investment Companies | | 0.2% |
Other | | 0.1% |
| | | 100.0% |
Emerging markets comprised 6.2% of total net assets.
| | |
Top Country Allocations - Long Positions - (% of Investment Securities) |
As of December 31, 2018 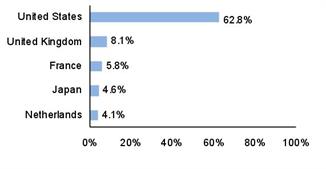
| As of December 31, 2017 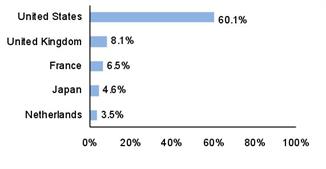
|
Janus Henderson VIT Global Research Portfolio (unaudited)
Performance
| |
See important disclosures on the next page. |
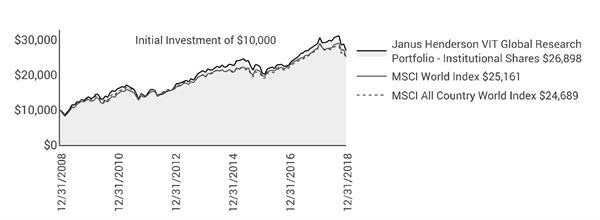
| | | | | | | | | | |
| | | | | | | | | |
| | | | | | | | | | Expense Ratios - |
Average Annual Total Return - for the periods ended December 31, 2018 | | | per the April 30, 2018 prospectuses |
| | One
Year | Five
Year | Ten
Year | Since
Inception* | | | Total Annual Fund
Operating Expenses |
Institutional Shares | | -6.87% | 4.86% | 10.40% | 7.78% | | | 0.64% |
Service Shares | | -7.08% | 4.60% | 10.13% | 7.50% | | | 0.89% |
MSCI World Index | | -8.71% | 4.56% | 9.67% | 6.50% | | | |
MSCI All Country World Index | | -9.42% | 4.26% | 9.46% | N/A**** | | | |
Morningstar Quartile - Institutional Shares | | 2nd | 2nd | 2nd | 1st | | | |
Morningstar Ranking - based on total returns for World Large Stock Funds | | 242/929 | 201/730 | 163/524 | 61/147 | | | |
Returns quoted are past performance and do not guarantee future results; current performance may be lower or higher. Investment returns and principal value will vary; there may be a gain or loss when shares are sold. For the most recent month-end performance call 800.668.0434 or visit janushenderson.com/VITperformance.
This Portfolio has a performance-based management fee that may adjust up or down based on the Portfolio’s performance.
Performance may be affected by risks that include those associated with non-diversification, portfolio turnover, short sales, potential conflicts of interest, foreign and emerging markets, initial public offerings (IPOs), high-yield and high-risk securities, undervalued, overlooked and smaller capitalization companies, real estate related securities including Real Estate Investment Trusts (REITs), derivatives, and commodity-linked investments. Each product has different risks. Please see the prospectus for more information about risks, holdings and other details.
Returns do not reflect the deduction of fees, charges or expenses of any insurance product. If applied, returns would have been lower.
Returns include reinvestment of all dividends and distributions and do not reflect the deduction of taxes that a shareholder would pay on Portfolio distributions or redemptions of Portfolio shares. The returns do not include adjustments in accordance with generally accepted accounting principles required at the period end for financial reporting purposes.
See Financial Highlights for actual expense ratios during the reporting period.
Performance for Service Shares prior to December 31, 1999 reflects the performance of Institutional Shares adjusted to reflect the expenses of Service Shares.
Janus Henderson VIT Global Research Portfolio (unaudited)
Performance
Ranking is for the share class shown only; other classes may have different performance characteristics.
© 2018 Morningstar, Inc. All Rights Reserved.
There is no assurance that the investment process will consistently lead to successful investing.
See Notes to Schedule of Investments and Other Information for index definitions.
Index performance does not reflect the expenses of managing a portfolio as an index is unmanaged and not available for direct investment.
See “Useful Information About Your Portfolio Report.”
*The Portfolio’s inception date – September 13, 1993
**Since inception return is not shown for the index because the index’s inception date differs significantly from the Portfolio’s inception date.
Janus Henderson VIT Global Research Portfolio (unaudited)
Expense Examples
As a shareholder of the Portfolio, you incur two types of costs: (1) transaction costs and (2) ongoing costs, including management fees; 12b-1 distribution and shareholder servicing fees (applicable to Service Shares only); transfer agent fees and expenses payable pursuant to the Transfer Agency Agreement; and other Portfolio expenses. This example is intended to help you understand your ongoing costs (in dollars) of investing in the Portfolio and to compare these costs with the ongoing costs of investing in other mutual funds. To do so, compare this 5% hypothetical example with the 5% hypothetical examples that appear in the shareholder reports of the other funds. The example is based upon an investment of $1,000 invested at the beginning of the period and held for the six-months indicated, unless noted otherwise in the table and footnotes below.
Actual Expenses
The information in the table under the heading “Actual” provides information about actual account values and actual expenses. You may use the information in these columns, together with the amount you invested, to estimate the expenses that you paid over the period. Simply divide your account value by $1,000 (for example, an $8,600 account value divided by $1,000 = 8.6), then multiply the result by the number in the appropriate column for your share class under the heading entitled “Expenses Paid During Period” to estimate the expenses you paid on your account during the period.
Hypothetical Example for Comparison Purposes
The information in the table under the heading “Hypothetical (5% return before expenses)” provides information about hypothetical account values and hypothetical expenses based upon the Portfolio’s actual expense ratio and an assumed rate of return of 5% per year before expenses, which is not the Portfolio’s actual return. The hypothetical account values and expenses may not be used to estimate the actual ending account balance or expenses you paid for the period. You may use this information to compare the ongoing costs of investing in the Portfolio and other funds. To do so, compare this 5% hypothetical example with the 5% hypothetical examples that appear in the shareholder reports of the other funds. Additionally, for an analysis of the fees associated with an investment in either share class or other similar funds, please visit www.finra.org/fundanalyzer.
Please note that the expenses shown in the table are meant to highlight your ongoing costs only and do not reflect any transaction costs, such as any charges at the separate account level or contract level. These fees are fully described in the Portfolio’s prospectuses. Therefore, the hypothetical examples are useful in comparing ongoing costs only, and will not help you determine the relative total costs of owning different funds. In addition, if these transaction costs were included, your costs would have been higher.
| | | | | | | | | | | |
| | | | | | | | | |
| | | | Actual | | Hypothetical
(5% return before expenses) | |
| Beginning
Account
Value
(7/1/18) | Ending
Account
Value
(12/31/18) | Expenses
Paid During
Period
(7/1/18 - 12/31/18)† | | Beginning
Account
Value
(7/1/18) | Ending
Account
Value
(12/31/18) | Expenses
Paid During
Period
(7/1/18 - 12/31/18)† | Net Annualized
Expense Ratio
(7/1/18 - 12/31/18) |
Institutional Shares | $1,000.00 | $908.00 | $3.03 | | $1,000.00 | $1,022.03 | $3.21 | 0.63% |
Service Shares | $1,000.00 | $907.00 | $4.23 | | $1,000.00 | $1,020.77 | $4.48 | 0.88% |
† | Expenses Paid During Period are equal to the Net Annualized Expense Ratio multiplied by the average account value over the period, multiplied by 184/365 (to reflect the one-half year period). Expenses in the examples include the effect of applicable fee waivers and/or expense reimbursements, if any. Had such waivers and/or reimbursements not been in effect, your expenses would have been higher. Please refer to the Notes to Financial Statements or the Portfolio’s prospectuses for more information regarding waivers and/or reimbursements. |
Janus Henderson VIT Global Research Portfolio
Schedule of Investments
December 31, 2018