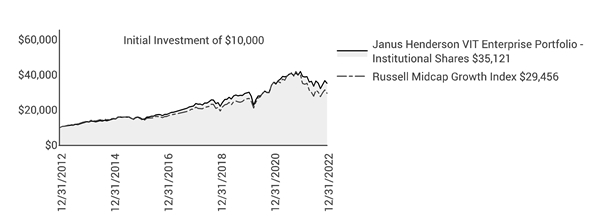
Mid-cap stocks declined in 2022, along with the broader equity market, as soaring inflation, rising interest rates, and recession fears led to market turbulence. Equities faced volatility early in 2022 as supply constraints, geopolitical uncertainty, and surging commodity prices weighed on investor sentiment. Expectations for more restrictive Federal Reserve (Fed) policy also triggered a sell-off in higher-valuation growth stocks. The Fed raised interest rates by 25 basis points (bps) in March but moved more aggressively with a 50 bps increase in May followed by a series of consecutive 75 bps rate hikes. The Fed opted for a 50 bps increase in December, raising hopes for a slower pace of monetary tightening in 2023. These hopes, along with some signs of moderating inflation, led markets to regain some ground in the fourth quarter. However, stocks still ended the year with broad-based declines due in part to signs of slowing growth and downward revisions to corporate earnings forecasts. The Russell Midcap Growth Index underperformed the broader mid-cap equity market for the 12-month period.
During this challenging period, we were reassured that the Portfolio performed more defensively, mitigating declines relative to the benchmark index. For several years, we have warned about imbalances in the mid-cap growth market as a focus on revenue growth often eclipsed concerns over profitability or valuation. We believed this dynamic was unsustainable, and we remained highly skeptical of stocks where we saw a disconnect between valuation and earnings growth. As interest rates started to rise in 2022, investors paid more attention to profitability, valuation, and balance sheet strength. This led to a sell-off in many speculative growth stocks, especially for companies with high debt levels or ongoing funding requirements that may be harder to meet in a tighter capital markets environment. Because of our disciplined investment approach, we have largely avoided such names which were among the largest detractors from index performance.
A renewed focus on fundamentals also benefited several of our long-term holdings. LPL Financial, a top contributor, provides a full-service, technology-enabled investment platform that helps financial advisors serve their clients and improve their practices. The company’s revenue growth continued to expand as it signed new advisors to its network. It benefited from higher interest rates due to the float income it earns on client accounts. We also benefited from our investment in W. R. Berkley, a property and casualty insurer with a strong competitive position and a healthy balance sheet. Berkley complements its property and casualty business with specialized insurance products that are less vulnerable to competitive price pressures.
Conversely, CarMax was a prominent detractor. This multichannel used car retailer saw its business slow as weaker discretionary consumer spending affected vehicle sales. Additionally, rising interest rates pressured returns from its automotive finance business. We held onto the stock as we continue to see long-term potential for the company’s multichannel strategy.
Catalent was another detractor. Catalent has become a leading provider of contract drug development and production services by producing therapies more cost-effectively than biopharmaceutical companies. Catalent
was tapped to produce several COVID-19 vaccines, a business that provided a revenue tailwind in recent years. Catalent had expected this tailwind to slow in 2022, but the drop-off in vaccine demand was steeper than expected due to a lower uptake of booster shots. As a result, Catalent issued weaker-than-expected guidance, leading to a sell-off in the stock. Given the continued strong growth trends for Catalent’s other businesses, we believe this decline was out of line with long-term fundamentals. We remain invested in Catalent due to its diversified market opportunities, strong competitive positioning, and innovations in areas such as gene therapy.
Please see the Derivative Instruments section in the “Notes to Financial Statements” for a discussion of derivatives used by the Janus Henderson VIT Enterprise Portfolio.
While we welcome signs of moderating price pressures, we expect that the Fed may need to raise rates further in 2023 to curb inflation. We are alert to risks that wage pressures or unforeseen supply-side shocks could complicate the inflation outlook and the Fed’s task in trying to achieve a soft landing. We recognize that it will take time for Fed rate hikes to work their way through the economy which could set the stage for slower-than-expected economic and earnings growth in 2023.
In this environment, we remain highly selective in our investments and continue to look for companies with robust balance sheets, experienced management teams, and healthy free cash flows that can help fund operations without relying on jittery capital markets. We continue to keep a close eye on valuations, as we favor companies whose stock prices are supported by demonstrated earnings growth. While we recognize the challenges of the near-term environment, we remain excited about growth opportunities that we have identified across a broad range of industries including companies that may capitalize on long-term trends such as deglobalization and investments in energy transition. We believe this environment will work with our strengths as bottom-up, diversified investment managers focused on providing our investors with positive long-term performance.
Thank you for your investment in Janus Henderson VIT Enterprise Portfolio.
Returns quoted are past performance and do not guarantee future results; current performance may be lower or higher. Investment returns and principal value will vary; there may be a gain or loss when shares are sold. For the most recent month-end performance call 800.668.0434 or visit janushenderson.com/VITperformance.
Performance may be affected by risks that include those associated with foreign and emerging markets, fixed income securities, high-yield and high-risk securities, undervalued, overlooked and smaller capitalization companies, real estate related securities including Real Estate Investment Trusts (REITs), Environmental, Social and Governance (ESG) factors, non-diversification, portfolio turnover, derivatives, short sales, initial public offerings (IPOs) and potential conflicts of interest. Each product has different risks. Please see the prospectus for more information about risks, holdings and other details.
Returns do not reflect the deduction of fees, charges or expenses of any insurance product or qualified plan. If applied, returns would have been lower.
Returns include reinvestment of all dividends and distributions and do not reflect the deduction of taxes that a shareholder would pay on Portfolio distributions or redemptions of Portfolio shares. The returns do not include adjustments in accordance with generally accepted accounting principles required at the period end for financial reporting purposes.
Performance for Service Shares prior to December 31, 1999 reflects the performance of Institutional Shares, adjusted to reflect the expenses of Service Shares.
Ranking is for the share class shown only; other classes may have different performance characteristics.
© 2022 Morningstar, Inc. All Rights Reserved.
There is no assurance that the investment process will consistently lead to successful investing.
See Notes to Schedule of Investments and Other Information for index definitions.
Index performance does not reflect the expenses of managing a portfolio as an index is unmanaged and not available for direct investment.
‡ As stated in the prospectus. See Financial Highlights for actual expense ratios during the reporting period.
As a shareholder of the Portfolio, you incur two types of costs: (1) transaction costs and (2) ongoing costs, including management fees; 12b-1 distribution and shareholder servicing fees (applicable to Service Shares only); transfer agent fees and expenses payable pursuant to the Transfer Agency Agreement; and other Portfolio expenses. This example is intended to help you understand your ongoing costs (in dollars) of investing in the Portfolio and to compare these costs with the ongoing costs of investing in other mutual funds. To do so, compare this 5% hypothetical example with the 5% hypothetical examples that appear in the shareholder reports of the other funds. The example is based upon an investment of $1,000 invested at the beginning of the period and held for the six-months indicated, unless noted otherwise in the table and footnotes below.
The information in the table under the heading “Actual” provides information about actual account values and actual expenses. You may use the information in these columns, together with the amount you invested, to estimate the expenses that you paid over the period. Simply divide your account value by $1,000 (for example, an $8,600 account value divided by $1,000 = 8.6), then multiply the result by the number in the appropriate column for your share class under the heading entitled “Expenses Paid During Period” to estimate the expenses you paid on your account during the period.
The information in the table under the heading “Hypothetical (5% return before expenses)” provides information about hypothetical account values and hypothetical expenses based upon the Portfolio’s actual expense ratio and an assumed rate of return of 5% per year before expenses, which is not the Portfolio’s actual return. The hypothetical account values and expenses may not be used to estimate the actual ending account balance or expenses you paid for the period. You may use this information to compare the ongoing costs of investing in the Portfolio and other funds. To do so, compare this 5% hypothetical example with the 5% hypothetical examples that appear in the shareholder reports of the other funds. Additionally, for an analysis of the fees associated with an investment in either share class or other similar funds, please visit www.finra.org/fundanalyzer.
Please note that the expenses shown in the table are meant to highlight your ongoing costs only and do not reflect any transaction costs, such as any charges at the separate account level or contract level. These fees are fully described in the Portfolio’s prospectuses. Therefore, the hypothetical examples are useful in comparing ongoing costs only, and will not help you determine the relative total costs of owning different funds. In addition, if these transaction costs were included, your costs would have been higher.
The following table, grouped by derivative type, provides information about the fair value and location of derivatives within the Statement of Assets and Liabilities as of December 31, 2022.
The following tables provide information about the effect of derivatives and hedging activities on the Portfolio’s Statement of Operations for the year ended December 31, 2022.
Please see the "Net Realized Gain/(Loss) on Investments" and "Change in Unrealized Net Appreciation/Depreciation" sections of the Portfolio’s Statement of Operations.
Janus Henderson VIT Enterprise Portfolio (the “Portfolio”) is a series of Janus Aspen Series (the “Trust”), which is organized as a Delaware statutory trust and is registered under the Investment Company Act of 1940, as amended (the “1940 Act”), as an open-end management investment company, and therefore has applied the specialized accounting and reporting guidance in Financial Accounting Standards Board (“FASB”) Accounting Standards Codification (“ASC”) Topic 946. The Trust offers 11 portfolios, each of which offers multiple share classes, with differing investment objectives and policies. The Portfolio seeks long-term growth of capital. The Portfolio is classified as diversified, as defined in the 1940 Act. Janus Henderson Investors US LLC is the investment adviser (the “Adviser”) to the Portfolio.
The Portfolio currently offers two classes of shares: Institutional Shares and Service Shares. Each class represents an interest in the same portfolio of investments. Institutional Shares are offered only in connection with investment in and payments under variable insurance contracts as well as certain qualified retirement plans. Service Shares are offered only in connection with investment in and payments under variable insurance contracts as well as certain qualified retirement plans that require a fee from Portfolio assets to procure distribution and administrative services to contract owners and plan participants.
Shareholders, including participating insurance companies, as well as accounts, may from time to time own (beneficially or of record) a significant percentage of the Portfolio’s Shares and can be considered to “control” the Portfolio when that ownership exceeds 25% of the Portfolio’s assets (and which may differ from control as determined in accordance with United States of America generally accepted accounting principles ("US GAAP")).
The following accounting policies have been followed by the Portfolio and are in conformity with US GAAP.
Portfolio holdings are valued in accordance with policies and procedures established by the Adviser pursuant to Rule 2a-5 under the 1940 Act and approved by and subject to the oversight of the Trustees (the “Valuation Procedures”). Equity securities traded on a domestic securities exchange are generally valued at readily available market quotations, which are (i) the official close prices or (ii) last sale prices on the primary market or exchange in which the securities trade. If such price is lacking for the trading period immediately preceding the time of determination, such securities are generally valued at their current bid price. Equity securities that are traded on a foreign exchange are generally valued at the closing prices on such markets. In the event that there is no current trading volume on a particular security in such foreign exchange, the bid price from the primary exchange is generally used to value the security. Foreign securities and currencies are converted to U.S. dollars using the current spot USD dollar exchange rate in effect at the close of the New York Stock Exchange (“NYSE”). The Portfolio will determine the market value of individual securities held by it by using prices provided by one or more approved professional pricing services or, as needed, by obtaining market quotations from independent broker-dealers. Most debt securities are valued in accordance with the evaluated bid price supplied by the Adviser-approved pricing service that is intended to reflect market value. The evaluated bid price supplied by the pricing service is an evaluation that may consider factors such as security prices, yields, maturities and ratings. Certain short-term securities maturing within 60 days or less may be evaluated and valued on an amortized cost basis provided that the amortized cost determined approximates market value. Securities for which market quotations or evaluated prices are not readily available or deemed unreliable are valued at fair value determined in good faith by the Adviser pursuant to the Valuation Procedures. Circumstances in which fair valuation may be utilized include, but are not limited to: (i) a significant event that may affect the securities of a single issuer, such as a merger, bankruptcy, or significant issuer-specific development; (ii) an event that may affect an entire market, such as a natural disaster or significant governmental action; (iii) a nonsignificant event such as a market closing early or not opening, or a security trading halt; and (iv) pricing of a nonvalued security and a restricted or nonpublic security. Special valuation considerations may apply with respect to “odd-lot” fixed-income transactions which, due to their small size, may receive evaluated prices by pricing services which reflect a large block trade and not what actually could be obtained for the odd-lot position. The valuation policies provide for the use of systematic fair valuation models provided by independent pricing services to value foreign equity securities in order to adjust for stale pricing, which may occur between the close of certain foreign exchanges and the close of the NYSE. The value of the securities of other mutual funds held by a Portfolio, if any, will be calculated using the NAV of such mutual funds.
FASB ASC 820, Fair Value Measurements and Disclosures (“ASC 820”), defines fair value, establishes a framework for measuring fair value, and expands disclosure requirements regarding fair value measurements. This standard
emphasizes that fair value is a market-based measurement that should be determined based on the assumptions that market participants would use in pricing an asset or liability and establishes a hierarchy that prioritizes inputs to valuation techniques used to measure fair value. These inputs are summarized into three broad levels:
Level 1 – Unadjusted quoted prices in active markets the Portfolio has the ability to access for identical assets or liabilities.
Level 2 – Observable inputs other than unadjusted quoted prices included in Level 1 that are observable for the asset or liability either directly or indirectly. These inputs may include quoted prices for the identical instrument on an inactive market, prices for similar instruments, interest rates, prepayment speeds, credit risk, yield curves, default rates and similar data.
Assets or liabilities categorized as Level 2 in the hierarchy generally include: debt securities fair valued in accordance with the evaluated bid or ask prices supplied by a pricing service; securities traded on OTC markets and listed securities for which no sales are reported that are fair valued at the latest bid price (or yield equivalent thereof) obtained from one or more dealers transacting in a market for such securities or by a pricing service approved by the Portfolio’s Trustees; certain short-term debt securities with maturities of 60 days or less that are fair valued at amortized cost; and equity securities of foreign issuers whose fair value is determined by using systematic fair valuation models provided by independent third parties in order to adjust for stale pricing which may occur between the close of certain foreign exchanges and the close of the NYSE. Other securities that may be categorized as Level 2 in the hierarchy include, but are not limited to, preferred stocks, bank loans, swaps, investments in unregistered investment companies, options, and forward contracts.
Level 3 – Unobservable inputs for the asset or liability to the extent that relevant observable inputs are not available, representing the Portfolio’s own assumptions about the assumptions that a market participant would use in valuing the asset or liability, and that would be based on the best information available.
There have been no significant changes in valuation techniques used in valuing any such positions held by the Portfolio since the beginning of the fiscal year.
The inputs or methodology used for fair valuing securities are not necessarily an indication of the risk associated with investing in those securities. The summary of inputs used as of December 31, 2022 to fair value the Portfolio’s investments in securities and other financial instruments is included in the “Valuation Inputs Summary” in the Notes to Schedule of Investments and Other Information.
The Portfolio bears expenses incurred specifically on its behalf. Each class of shares bears a portion of general expenses, which are allocated daily to each class of shares based upon the ratio of net assets represented by each class as a percentage of total net assets. Expenses directly attributable to a specific class of shares are charged against the operations of such class.
The preparation of financial statements in conformity with US GAAP requires management to make estimates and assumptions that affect the reported amount of assets and liabilities and disclosure of contingent assets and liabilities at the date of the financial statements, and the reported amounts of income and expenses during the reporting period. Actual results could differ from those estimates.
In the normal course of business, the Portfolio may enter into contracts that contain provisions for indemnification of other parties against certain potential liabilities. The Portfolio’s maximum exposure under these arrangements is unknown, and would involve future claims that may be made against the Portfolio that have not yet occurred. Currently, the risk of material loss from such claims is considered remote.
The Portfolio does not isolate that portion of the results of operations resulting from the effect of changes in foreign exchange rates on investments from the fluctuations arising from changes in market prices of securities held at the date of the financial statements. Net unrealized appreciation or depreciation of investments and foreign currency translations arise from changes in the value of assets and liabilities, including investments in securities held at the date of the financial statements, resulting from changes in the exchange rates and changes in market prices of securities held.
Currency gains and losses are also calculated on payables and receivables that are denominated in foreign currencies. The payables and receivables are generally related to foreign security transactions and income translations.
Foreign currency-denominated assets and forward currency contracts may involve more risks than domestic transactions, including currency risk, counterparty risk, political and economic risk, regulatory risk and equity risk. Risks may arise from unanticipated movements in the value of foreign currencies relative to the U.S. dollar.
The Portfolio may make semiannual distributions of substantially all of its investment income and an annual distribution of its net realized capital gains (if any).
The Portfolio may make certain investments in real estate investment trusts (“REITs”) which pay dividends to their shareholders based upon funds available from operations. It is quite common for these dividends to exceed the REITs’ taxable earnings and profits, resulting in the excess portion of such dividends being designated as a return of capital. If the Portfolio distributes such amounts, such distributions could constitute a return of capital to shareholders for federal income tax purposes.
The Portfolio intends to continue to qualify as a regulated investment company and distribute all of its taxable income in accordance with the requirements of Subchapter M of the Internal Revenue Code. Management has analyzed the Portfolio’s tax positions taken for all open federal income tax years, generally a three-year period, and has concluded that no provision for federal income tax is required in the Portfolio’s financial statements. The Portfolio is not aware of any tax positions for which it is reasonably possible that the total amounts of unrecognized tax benefits will significantly change in the next twelve months.
2. Derivative Instruments
The Portfolio may invest in various types of derivatives, which may at times result in significant derivative exposure. A derivative is a financial instrument whose performance is derived from the performance of another asset. The Portfolio may invest in derivative instruments including, but not limited to: futures contracts, put options, call options, options on futures contracts, options on foreign currencies, options on recovery locks, options on security and commodity indices, swaps, forward contracts, structured investments, and other equity-linked derivatives. Each derivative instrument that was held by the Portfolio during the year ended December 31, 2022 is discussed in further detail below. A summary of derivative activity by the Portfolio is reflected in the tables at the end of the Schedule of Investments.
The Portfolio may use derivative instruments for hedging purposes (to offset risks associated with an investment, currency exposure, or market conditions), to adjust currency exposure relative to a benchmark index, or for speculative purposes (to earn income and seek to enhance returns). When the Portfolio invests in a derivative for speculative purposes, the Portfolio will be fully exposed to the risks of loss of that derivative, which may sometimes be greater than the derivative’s cost. The Portfolio may not use any derivative to gain exposure to an asset or class of assets that it would be prohibited by its investment restrictions from purchasing directly. The Portfolio’s ability to use derivative instruments may also be limited by tax considerations.
Investments in derivatives in general are subject to market risks that may cause their prices to fluctuate over time. Investments in derivatives may not directly correlate with the price movements of the underlying instrument. As a result,
the use of derivatives may expose the Portfolio to additional risks that it would not be subject to if it invested directly in the securities underlying those derivatives. The use of derivatives may result in larger losses or smaller gains than otherwise would be the case. Derivatives can be volatile and may involve significant risks.
In pursuit of its investment objective, the Portfolio may seek to use derivatives to increase or decrease exposure to the following market risk factors:
Derivatives may generally be traded OTC or on an exchange. Derivatives traded OTC are agreements that are individually negotiated between parties and can be tailored to meet a purchaser’s needs. OTC derivatives are not guaranteed by a clearing agency and may be subject to increased credit risk.
In an effort to mitigate credit risk associated with derivatives traded OTC, the Portfolio may enter into collateral agreements with certain counterparties whereby, subject to certain minimum exposure requirements, the Portfolio may require the counterparty to post collateral if the Portfolio has a net aggregate unrealized gain on all OTC derivative contracts with a particular counterparty. Additionally, the Portfolio may deposit cash and/or treasuries as collateral with the counterparty and/or custodian daily (based on the daily valuation of the financial asset) if the Portfolio has a net aggregate unrealized loss on OTC derivative contracts with a particular counterparty. All liquid securities and restricted cash are considered to cover in an amount at all times equal to or greater than the Portfolio’s commitment with respect to certain exchange-traded derivatives, centrally cleared derivatives, forward foreign currency exchange contracts, short sales, and/or securities with extended settlement dates. There is no guarantee that counterparty exposure is reduced and these arrangements are dependent on the Adviser’s ability to establish and maintain appropriate systems and trading.
A forward foreign currency exchange contract (“forward currency contract”) is an obligation to buy or sell a specified currency at a future date at a negotiated rate (which may be U.S. dollars or a foreign currency). The Portfolio may enter into forward currency contracts for hedging purposes, including, but not limited to, reducing exposure to changes in foreign currency exchange rates on foreign portfolio holdings and locking in the U.S. dollar cost of firm purchase and sale commitments for securities denominated in or exposed to foreign currencies. The Portfolio may also invest in forward currency contracts for non-hedging purposes such as seeking to enhance returns. The Portfolio is subject to currency risk and counterparty risk in the normal course of pursuing its investment objective through its investments in forward currency contracts.
Forward currency contracts are valued by converting the foreign value to U.S. dollars by using the current spot U.S. dollar exchange rate and/or forward rate for that currency. Exchange and forward rates as of the close of the NYSE are used to value the forward currency contracts. The unrealized appreciation/(depreciation) for forward currency contracts is reported in the Statement of Assets and Liabilities as a receivable or payable and in the Statement of Operations for the change in unrealized net appreciation/depreciation (if applicable). The realized gain or loss arising from the difference between the U.S. dollar cost of the original contract and the value of the foreign currency in U.S. dollars upon closing a forward currency contract is reported on the Statement of Operations (if applicable).
During the year, the Portfolio entered into forward currency contracts with the obligation to purchase foreign currencies in the future at an agreed upon rate in order to decrease exposure to currency risk associated with foreign currency denominated securities held by the Portfolio.
During the year, the Portfolio entered into forward currency contracts with the obligation to sell foreign currencies in the future at an agreed upon rate in order to decrease exposure to currency risk associated with foreign currency denominated securities held by the Portfolio.
3. Other Investments and Strategies
The U.S. government and the Federal Reserve, as well as certain foreign governments and central banks, have taken extraordinary actions to support local and global economies and the financial markets in response to the COVID-19 pandemic. This and other government intervention into the economy and financial markets to address the COVID-19 pandemic may not work as intended, particularly if the efforts are perceived by investors as being unlikely to achieve the desired results. Government actions to mitigate the economic impact of the pandemic have resulted in a large expansion of government deficits and debt, the long term consequences of which are not known. The COVID-19 pandemic could adversely affect the value and liquidity of a Portfolio’s investments, impair a Portfolio’s ability to satisfy redemption requests, and negatively impact a Portfolio’s performance. In addition, the outbreak of COVID-19, and measures taken to mitigate its effects, could result in disruptions to the services provided to a Portfolio by its service providers.
Widespread disease, including pandemics and epidemics, and natural or environmental disasters, including those which may be attributable to global climate change, such as earthquakes, fires, floods, hurricanes, tsunamis and weather-related phenomena generally, have been and can be highly disruptive to economies and markets, adversely impacting individual companies, sectors, industries, markets, currencies, interest and inflation rates, credit ratings, investor sentiment, and other factors affecting the value of a Portfolio’s investments. Economies and financial markets throughout the world have become increasingly interconnected, which increases the likelihood that events or conditions in one region or country will adversely affect markets or issuers in other regions or countries, including the United States. These disruptions could prevent a Portfolio from executing advantageous investment decisions in a timely manner and negatively impact a Portfolio’s ability to achieve its investment objective(s). Any such event(s) could have a significant adverse impact on the value of a Portfolio. In addition, these disruptions could also impair the information technology and other operational systems upon which the Portfolio’s service providers, including the Adviser or the subadviser (as applicable), rely, and could otherwise disrupt the ability of employees of the Portfolio’s service providers to perform essential tasks on behalf of the Portfolio. Adverse weather conditions may also have a particularly significant negative effect on issuers in the agricultural sector and on insurance and reinsurance companies that insure or reinsure against the impact of natural disasters.
A number of countries in the European Union (the “EU”) have experienced, and may continue to experience, severe economic and financial difficulties. In particular, many EU nations are susceptible to economic risks associated with high
The Portfolio may invest in equity and debt securities of real estate-related companies. Such companies may include those in the real estate industry or real estate-related industries. These securities may include common stocks, corporate bonds, preferred stocks, and other equity securities, including, but not limited to, mortgage-backed securities, real estate-backed securities, securities of REITs and similar REIT-like entities. A REIT is a trust that invests in real estate-related projects, such as properties, mortgage loans, and construction loans. REITs are generally categorized as equity, mortgage, or hybrid REITs. A REIT may be listed on an exchange or traded OTC.
Portfolio transactions involving a counterparty are subject to the risk that the counterparty or a third party will not fulfill its obligation to the Portfolio (“counterparty risk”). Counterparty risk may arise because of the counterparty’s financial condition (i.e., financial difficulties, bankruptcy, or insolvency), market activities and developments, or other reasons, whether foreseen or not. A counterparty’s inability to fulfill its obligation may result in significant financial loss to the Portfolio. The Portfolio may be unable to recover its investment from the counterparty or may obtain a limited recovery, and/or recovery may be delayed. The extent of the Portfolio’s exposure to counterparty risk with respect to financial assets and liabilities approximates its carrying value. See the "Offsetting Assets and Liabilities" section of this Note for further details.
The Portfolio may be exposed to counterparty risk through participation in various programs, including, but not limited to, lending its securities to third parties, cash sweep arrangements whereby the Portfolio’s cash balance is invested in one or more types of cash management vehicles, as well as investments in, but not limited to, repurchase agreements, debt securities, and derivatives, including various types of swaps, futures and options. The Portfolio intends to enter into financial transactions with counterparties that the Adviser believes to be creditworthy at the time of the transaction. There is always the risk that the Adviser’s analysis of a counterparty’s creditworthiness is incorrect or may change due to market conditions. To the extent that the Portfolio focuses its transactions with a limited number of counterparties, it will have greater exposure to the risks associated with one or more counterparties.
Under procedures adopted by the Trustees, the Portfolio may seek to earn additional income by lending securities to certain qualified broker-dealers and institutions. JPMorgan Chase Bank, National Association acts as securities lending agent and a limited purpose custodian or subcustodian to receive and disburse cash balances and cash collateral, hold short-term investments, hold collateral, and perform other custodial functions in accordance with the Non-Custodial Securities Lending Agreement. For financial reporting purposes, the Portfolio does not offset financial instruments’ payables and receivables and related collateral on the Statement of Assets and Liabilities. The Portfolio may lend portfolio securities in an amount equal to up to 1/3 of its total assets as determined at the time of the loan origination. There is the risk of delay in recovering a loaned security or the risk of loss in collateral rights if the borrower fails financially. In addition, the Adviser makes efforts to balance the benefits and risks from granting such loans. All loans will be continuously secured by collateral which may consist of cash, U.S. Government securities, domestic and foreign short-term debt instruments, letters of credit, time deposits, repurchase agreements, money market mutual funds or other money market accounts, or such other collateral as permitted by the SEC. If the Portfolio is unable to recover a security on loan, the Portfolio may use the collateral to purchase replacement securities in the market. There is a risk that the value of the collateral could decrease below the cost of the replacement security by the time the replacement
investment is made, resulting in a loss to the Portfolio. In certain circumstances individual loan transactions could yield negative returns.
Upon receipt of cash collateral, the Adviser may invest it in affiliated or non-affiliated cash management vehicles, whether registered or unregistered entities, as permitted by the 1940 Act and rules promulgated thereunder. The Adviser currently intends to primarily invest the cash collateral in a cash management vehicle for which the Adviser serves as investment adviser, Janus Henderson Cash Collateral Fund LLC, or in time deposits. An investment in Janus Henderson Cash Collateral Fund LLC is generally subject to the same risks that shareholders experience when investing in similarly structured vehicles, such as the potential for significant fluctuations in assets as a result of the purchase and redemption activity of the securities lending program, a decline in the value of the collateral, and possible liquidity issues. Such risks may delay the return of the cash collateral and cause the Portfolio to violate its agreement to return the cash collateral to a borrower in a timely manner. As adviser to the Portfolio and Janus Henderson Cash Collateral Fund LLC, the Adviser has an inherent conflict of interest as a result of its fiduciary duties to both the Portfolio and Janus Henderson Cash Collateral Fund LLC. Additionally, the Adviser receives an investment advisory fee of 0.05% for managing Janus Henderson Cash Collateral Fund LLC, but it may not receive a fee for managing certain other affiliated cash management vehicles in which the Portfolio may invest, and therefore may have an incentive to allocate preferred investment opportunities to investment vehicles for which it is receiving a fee.
The value of the collateral must be at least 102% of the market value of the loaned securities that are denominated in U.S. dollars and 105% of the market value of the loaned securities that are not denominated in U.S. dollars. Loaned securities and related collateral are marked-to-market each business day based upon the market value of the loaned securities at the close of business, employing the most recent available pricing information. Collateral levels are then adjusted based on this mark-to-market evaluation. Additional required collateral, or excess collateral returned, is delivered on the next business day. Therefore, the value of the collateral held may be temporarily less than 102% or 105% value of the securities on loan. The cash collateral invested by the Adviser is disclosed in the Schedule of Investments (if applicable).
Income earned from the investment of the cash collateral, net of rebates paid to, or fees paid by, borrowers and less the fees paid to the lending agent are included as “Affiliated securities lending income, net” on the Statement of Operations. As of December 31, 2022, securities lending transactions accounted for as secured borrowings with an overnight and continuous contractual maturity are $6,793,465. Gross amounts of recognized liabilities for securities lending (collateral received) as of December 31, 2022 is $6,997,459, resulting in the net amount due to the counterparty of $203,994.
The Portfolio presents gross and net information about transactions that are either offset in the financial statements or subject to an enforceable master netting arrangement or similar agreement with a designated counterparty, regardless of whether the transactions are actually offset in the Statement of Assets and Liabilities.
In order to better define its contractual rights and to secure rights that will help the Portfolio mitigate its counterparty risk, the Portfolio has entered into an International Swaps and Derivatives Association, Inc. Master Agreement (“ISDA Master Agreement”) or similar agreement with its derivative contract counterparties. An ISDA Master Agreement is a bilateral agreement between the Portfolio and a counterparty that governs OTC derivatives and forward foreign currency exchange contracts and typically contains, among other things, collateral posting terms and netting provisions in the event of a default and/or termination event. Under an ISDA Master Agreement, in the event of a default and/or termination event, the Portfolio may offset with each counterparty certain derivative financial instruments’ payables and/or receivables with collateral held and/or posted and create one single net payment.
The Offsetting Assets and Liabilities tables located in the Schedule of Investments present gross amounts of recognized assets and/or liabilities and the net amounts after deducting collateral that has been pledged by counterparties or has been pledged to counterparties (if applicable). For corresponding information grouped by type of instrument, see the “Fair Value of Derivative Instruments (not accounted for as hedging instruments) as of December 31, 2022” table located in the Portfolio’s Schedule of Investments.
The Portfolio generally does not exchange collateral on its forward foreign currency contracts with its counterparties; however, all liquid securities and restricted cash are considered to cover in an amount at all times equal to or greater than the Portfolio’s commitment with respect to these contracts. Certain securities may be segregated at the Portfolio’s custodian. These segregated securities are denoted on the accompanying Schedule of Investments and are evaluated
daily to ensure their cover and/or market value equals or exceeds the Portfolio’s corresponding forward foreign currency exchange contract's obligation value.
4. Investment Advisory Agreements and Other Transactions with Affiliates
The Portfolio pays the Adviser an investment advisory fee which is calculated daily and paid monthly. The Portfolio’s contractual investment advisory fee rate (expressed as an annual rate) is 0.64% of its average daily net assets.
The Adviser serves as administrator to the Portfolio pursuant to an administration agreement between the Adviser and the Trust. Under the administration agreement, the Adviser is authorized to perform, or cause others to perform certain administration, compliance, and accounting services to the Portfolio, including providing office space for the Portfolio, and is reimbursed by the Portfolio for certain of its costs in providing these services (to the extent the Adviser seeks reimbursement and such costs are not otherwise waived). In addition, employees of the Adviser and/or its affiliates may serve as officers of the Trust. The Portfolio pays for some or all of the salaries, fees, and expenses of the Adviser employees and Portfolio officers, with respect to certain specified administration functions they perform on behalf of the Portfolio. The Portfolio pays these costs based on out-of-pocket expenses incurred by the Adviser, and these costs are separate and apart from advisory fees and other expenses paid in connection with the investment advisory services the Adviser (or any subadvisor, as applicable) provides to the Portfolio. These amounts are disclosed as “Affiliated portfolio administration fees” on the Statement of Operations. In addition, some expenses related to compensation payable to the Portfolio’s Chief Compliance Officer and certain compliance staff, all of whom are employees of the Adviser and/or its affiliates, are shared with the Portfolio. Total compensation of $48,451 was paid to the Chief Compliance Officer and certain compliance staff by the Trust during the year ended December 31, 2022. The Portfolio's portion is reported as part of “Other expenses” on the Statement of Operations.
Janus Henderson Services US LLC (the “Transfer Agent”), a wholly-owned subsidiary of the Adviser, is the Portfolio’s transfer agent. The Transfer Agent receives an administrative services fee at an annual rate of 0.05% of the average daily net assets of the Portfolio for arranging for the provision by participating insurance companies and qualified plan service providers of administrative services, including, but not limited to, recordkeeping, subaccounting, answering inquiries regarding accounts, order processing, transaction confirmations, the mailing of prospectuses and shareholder reports, and other shareholder services provided on behalf of contract holders or plan participants investing in the Portfolio. The Transfer Agent expects to use this entire fee to compensate insurance companies and qualified plan service providers for providing these services to their customers who invest in the Portfolio.
The Transfer Agent is not compensated for internal services related to the shares, except for out-of-pocket costs. These amounts are disclosed as “Other transfer agent fees and expenses” on the Statement of Operations.
Under a distribution and shareholder servicing plan (the “Plan”) adopted in accordance with Rule 12b-1 under the 1940 Act, the Service Shares may pay the Trust’s distributor, Janus Henderson Distributors US LLC (the “Distributor”), a wholly-owned subsidiary of the Adviser, a fee for the sale and distribution and/or shareholder servicing of the Service Shares at an annual rate of up to 0.25% of the average daily net assets of the Service Shares. Under the terms of the Plan, the Trust is authorized to make payments to the Distributor for remittance to insurance companies and qualified plan service providers as compensation for distribution and/or shareholder services performed by such entities. These amounts are disclosed as “12b-1 Distribution and shareholder servicing fees” on the Statement of Operations.
The Board of Trustees has adopted a deferred compensation plan (the “Deferred Plan”) for independent Trustees to elect to defer receipt of all or a portion of the annual compensation they are entitled to receive from the Portfolio. All deferred fees are credited to an account established in the name of the Trustees. The amounts credited to the account then increase or decrease, as the case may be, in accordance with the performance of one or more of the Janus Henderson funds that are selected by the Trustees. The account balance continues to fluctuate in accordance with the performance of the selected fund or funds until final payment of all amounts are credited to the account. The fluctuation of the account balance is recorded by the Portfolio as unrealized appreciation/(depreciation) and is included as of December 31, 2022 on the Statement of Assets and Liabilities in the asset, “Trustees’ deferred compensation,” and liability, “Trustees’ deferred compensation fees.” Additionally, the recorded unrealized appreciation/(depreciation) is included in “Total distributable earnings (loss)” on the Statement of Assets and Liabilities. Deferred compensation expenses for the year ended December 31, 2022 are included in “Trustees’ fees and expenses” on the Statement of Operations. Trustees are allowed to change their designation of mutual funds from time to time. Amounts will be deferred until distributed in accordance with the Deferred Plan. Deferred fees of $433,851 were paid by the Trust to the Trustees under the Deferred Plan during the year ended December 31, 2022.
Pursuant to the provisions of the 1940 Act and related rules, the Portfolio may participate in an affiliated or non-affiliated cash sweep program. In the cash sweep program, uninvested cash balances of the Portfolio may be used to purchase shares of affiliated or non-affiliated money market funds or cash management pooled investment vehicles that operate as money market funds. The Portfolio is eligible to participate in the cash sweep program (the “Investing Funds”). The Adviser has an inherent conflict of interest because of its fiduciary duties to the affiliated money market funds or cash management pooled investment vehicles and the Investing Funds. Janus Henderson Cash Liquidity Fund LLC (the “Sweep Vehicle”) is an affiliated unregistered cash management pooled investment vehicle that invests primarily in highly-rated short-term fixed-income securities. The Sweep Vehicle operates pursuant to the provisions of the 1940 Act that govern the operation of money market funds and prices its shares at NAV reflecting market-based values of its portfolio securities (i.e., a “floating” NAV) rounded to the fourth decimal place (e.g., $1.0000). The Sweep Vehicle is permitted to impose a liquidity fee (of up to 2%) on redemptions from the Sweep Vehicle or a redemption gate that temporarily suspends redemptions from the Sweep Vehicle for up to 10 business days during a 90 day period. There are no restrictions on the Portfolio's ability to withdraw investments from the Sweep Vehicle at will, and there are no unfunded capital commitments due from the Portfolio to the Sweep Vehicle. The Sweep Vehicle does not charge any management fee, sales charge or service fee.
Any purchases and sales, realized gains/losses and recorded dividends from affiliated investments during the year ended December 31, 2022 can be found in the “Schedules of Affiliated Investments” located in the Schedule of Investments.
The Portfolio is permitted to purchase or sell securities (“cross-trade”) between itself and other funds or accounts managed by the Adviser in accordance with Rule 17a-7 under the Investment Company Act of 1940 (“Rule 17a-7”), when the transaction is consistent with the investment objectives and policies of the Portfolio and in accordance with the Internal Cross Trade Procedures adopted by the Trust’s Board of Trustees. These procedures have been designed to ensure that any cross-trade of securities by the Portfolio from or to another fund or account that is or could be considered an affiliate of the Portfolio under certain limited circumstances by virtue of having a common investment adviser, common Officer, or common Trustee complies with Rule 17a-7. Under these procedures, each cross-trade is effected at the current market price to save costs where allowed. During the year ended December 31, 2022, the Portfolio engaged in cross trades amounting to $5,530,253 in purchases.
5. Federal Income Tax
The tax components of capital shown in the table below represent: (1) distribution requirements the Portfolio must satisfy under the income tax regulations; (2) losses or deductions the Portfolio may be able to offset against income and gains realized in future years; and (3) unrealized appreciation or depreciation of investments for federal income tax purposes.
Other book to tax differences primarily consist of deferred compensation, derivatives, and foreign currency contract adjustments. The Portfolio has elected to treat gains and losses on forward foreign currency contracts as capital gains and losses, if applicable. Other foreign currency gains and losses on debt instruments are treated as ordinary income for federal income tax purposes pursuant to Section 988 of the Internal Revenue Code.
The aggregate cost of investments and the composition of unrealized appreciation and depreciation of investment securities for federal income tax purposes as of December 31, 2022 are noted below. The primary difference between book and tax appreciation or depreciation of investments are wash sale loss deferrals and investments in partnerships.
Income and capital gains distributions are determined in accordance with income tax regulations that may differ from US GAAP. These differences are due to differing treatments for items such as net short-term gains, deferral of wash sale losses, foreign currency transactions, and capital loss carryovers. Certain permanent differences such as tax returns of capital and net investment losses noted below have been reclassified to capital.
Permanent book to tax basis differences may result in reclassifications between the components of net assets. These differences have no impact on the results of operations or net assets.
6. Capital Share Transactions
7. Purchases and Sales of Investment Securities
For the year ended December 31, 2022, the aggregate cost of purchases and proceeds from sales of investment securities (excluding any short-term securities, short-term options contracts, TBAs, and in-kind transactions, as applicable) was as follows:
8. Subsequent Event
Management has evaluated whether any events or transactions occurred subsequent to December 31, 2022 and through the date of issuance of the Portfolio’s financial statements and determined that there were no material events or transactions that would require recognition or disclosure in the Portfolio’s financial statements.
To the Board of Trustees of Janus Aspen Series and Shareholders of Janus Henderson VIT Enterprise Portfolio
We have audited the accompanying statement of assets and liabilities, including the schedule of investments, of Janus Henderson VIT Enterprise Portfolio (one of the portfolios constituting Janus Aspen Series, referred to hereafter as the "Portfolio") as of December 31, 2022, the related statement of operations for the year ended December 31, 2022, the statements of changes in net assets for each of the two years in the period ended December 31, 2022, including the related notes, and the financial highlights for each of the five years in the period ended December 31, 2022 (collectively referred to as the “financial statements”). In our opinion, the financial statements present fairly, in all material respects, the financial position of the Portfolio as of December 31, 2022, the results of its operations for the year then ended, the changes in its net assets for each of the two years in the period ended December 31, 2022 and the financial highlights for each of the five years in the period ended December 31, 2022 in conformity with accounting principles generally accepted in the United States of America.
These financial statements are the responsibility of the Portfolio’s management. Our responsibility is to express an opinion on the Portfolio’s financial statements based on our audits. We are a public accounting firm registered with the Public Company Accounting Oversight Board (United States) (PCAOB) and are required to be independent with respect to the Portfolio in accordance with the U.S. federal securities laws and the applicable rules and regulations of the Securities and Exchange Commission and the PCAOB.
We conducted our audits of these financial statements in accordance with the standards of the PCAOB. Those standards require that we plan and perform the audit to obtain reasonable assurance about whether the financial statements are free of material misstatement, whether due to error or fraud.
Our audits included performing procedures to assess the risks of material misstatement of the financial statements, whether due to error or fraud, and performing procedures that respond to those risks. Such procedures included examining, on a test basis, evidence regarding the amounts and disclosures in the financial statements. Our audits also included evaluating the accounting principles used and significant estimates made by management, as well as evaluating the overall presentation of the financial statements. Our procedures included confirmation of securities owned as of December 31, 2022 by correspondence with the custodian, transfer agent, and brokers; when replies were not received from brokers, we performed other auditing procedures. We believe that our audits provide a reasonable basis for our opinion.
We have served as the auditor of one or more investment companies in Janus Henderson Funds since 1990.
A description of the policies and procedures that the Portfolio uses to determine how to vote proxies relating to its portfolio securities is available without charge: (i) upon request, by calling 1-800-525-1093; (ii) on the Portfolio’s website at janushenderson.com/proxyvoting; and (iii) on the SEC’s website at http://www.sec.gov. Additionally, information regarding the Portfolio’s proxy voting record for the most recent twelve-month period ended June 30 is also available, free of charge, through janushenderson.com/proxyvoting and from the SEC’s website at http://www.sec.gov.
The Portfolio files its complete portfolio holdings (schedule of investments) with the SEC as an exhibit to Form N-PORT within 60 days of the end of the first and third fiscal quarters, and in the annual report and semiannual report to shareholders. The Portfolio’s Form N-PORT filings and annual and semiannual reports: (i) are available on the SEC’s website at http://www.sec.gov; and (ii) are available without charge, upon request, by calling a Janus Henderson representative at 1-877-335-2687 (toll free). Portfolio holdings consisting of at least the names of the holdings are generally available on a monthly basis with a 30-day lag under Full Holdings for the Portfolio at janushenderson.com/vit.
The Trustees of Janus Aspen Series, each of whom serves as an “independent” Trustee (the “Trustees”), oversee the management of each portfolio of Janus Aspen Series (each, a “VIT Portfolio,” and collectively, the “VIT Portfolios”), as well as each fund of Janus Investment Fund (each, a “Fund,” and collectively, the “Funds” and together with the VIT Portfolios, the “Janus Henderson Funds,” and each, a “Janus Henderson Fund”). As required by law, the Trustees determine annually whether to continue the investment advisory agreement for each Janus Henderson Fund.
In connection with their most recent consideration of those agreements for each Janus Henderson Fund, the Trustees received and reviewed information provided by Janus Henderson Investors US LLC (the “Adviser”) in response to requests of the Trustees and their independent legal counsel. They also received and reviewed information and analysis provided by, and in response to requests of, their independent fee consultant. Throughout their consideration of the agreements, the Trustees were advised by their independent legal counsel. The Trustees met with management to consider the agreements, and also met separately in executive session with their independent legal counsel and their independent fee consultant.
At meetings held on November 9-10, 2022 and December 13-14, 2022, the Trustees evaluated the information provided by the Adviser and the independent fee consultant, as well as other information provided by the Adviser and the independent fee consultant during the year. Following such evaluation, the Trustees determined that the overall arrangements between each Janus Henderson Fund and the Adviser were fair and reasonable in light of the nature, extent, and quality of the services provided by the Adviser and its affiliates, the fees charged for those services, and other matters that the Trustees considered relevant in the exercise of their business judgment, and unanimously approved the continuation of the investment advisory agreement for each Janus Henderson Fund for the period from February 1, 2023 through February 1, 2024, subject to earlier termination as provided for in each agreement.
In considering the continuation of those agreements, the Trustees reviewed and analyzed various factors that they determined were relevant, including the factors described below, none of which by itself was considered dispositive. However, the material factors and conclusions that formed the basis for the Trustees’ determination to approve the continuation of the agreements are discussed separately below. Also included is a summary of the independent fee consultant’s conclusions and opinions that arose during, and were included as part of, the Trustees’ consideration of the agreements. “Management fees,” as used herein, reflect actual annual advisory fees and, for the purpose of peer comparisons any administration fees (excluding out of pocket costs), net of any waivers, paid by a fund as a percentage of average net assets.
The Trustees reviewed the nature, extent, and quality of the services provided by the Adviser to the Janus Henderson Funds, taking into account the investment objective, strategies, and policies of each Janus Henderson Fund, and the knowledge the Trustees gained from their regular meetings with management on at least a quarterly basis and their ongoing review of information related to the Janus Henderson Funds. In addition, the Trustees reviewed the resources and key personnel of the Adviser, particularly noting those employees who provide investment and risk management services to the Janus Henderson Funds. The Trustees also considered other services provided to the Janus Henderson Funds by the Adviser, such as managing the execution of portfolio transactions and the selection of broker-dealers for
those transactions. The Trustees considered the Adviser’s role as administrator to the Janus Henderson Funds, noting that the Adviser generally does not receive a fee for its services as administrator, but is reimbursed for its out-of-pocket costs. The Trustees considered the role of the Adviser in monitoring adherence to the Janus Henderson Funds’ investment restrictions, providing support services for the Trustees and Trustee committees, and overseeing communications with Janus Henderson Fund shareholders and the activities of other service providers, including monitoring compliance with various policies and procedures of the Janus Henderson Funds and with applicable securities laws and regulations.
In this regard, the independent fee consultant noted that the Adviser provides a number of different services for the Janus Henderson Funds and their shareholders, ranging from investment management services to various other servicing functions, and that, in its view, the Adviser is a capable provider of those services. The independent fee consultant also provided its belief that the Adviser has developed a number of institutional competitive advantages that should enable it to provide superior investment and service performance over the long term.
The Trustees concluded that the nature, extent, and quality of the services provided by the Adviser to each Janus Henderson Fund were appropriate and consistent with the terms of the respective advisory agreements, and that, taking into account steps taken to address those Janus Henderson Funds whose performance lagged that of their peers for certain periods, the Janus Henderson Funds were likely to benefit from the continued provision of those services. They also concluded that the Adviser had sufficient personnel, with the appropriate education and experience, to serve the Janus Henderson Funds effectively and had demonstrated its ability to attract well-qualified personnel.
The Trustees considered the performance results of each Janus Henderson Fund over various time periods. They noted that they considered Janus Henderson Fund performance data throughout the year, including periodic meetings with each Janus Henderson Fund’s portfolio manager(s), and also reviewed information comparing each Janus Henderson Fund’s performance with the performance of comparable fund peer groups identified by Broadridge Financial Solutions, Inc. (“Broadridge”), an independent data provider, and with the Janus Henderson Fund’s benchmark index. In this regard, the independent fee consultant found that the overall Janus Henderson Funds’ performance has been reasonable, noting that: (i) for the 36 months ended May 31, 2022, approximately 38% of the Janus Henderson Funds were in the top two quartiles of their Broadridge peer groups; (ii) for the 36 months ended September 30, 2022, approximately 45% of the Janus Henderson Funds were in the top two quartiles of performance as reported by Morningstar, and (iii) for the 12 months ended September 30, 2022, approximately 55% of the Janus Henderson Funds were in the top two quartiles of performance as reported by Morningstar.
The Trustees considered the performance of each Janus Henderson Fund, noting that performance may vary by share class, and noted the following with respect to the VIT Portfolios:
In consideration of each Janus Henderson Fund’s performance, the Trustees concluded that, taking into account the factors relevant to performance, as well as other considerations, including steps taken to improve performance, as applicable, the Janus Henderson Fund’s performance warranted continuation of such Janus Henderson Fund’s investment advisory agreement.
The Trustees examined information regarding the fees and expenses of each Janus Henderson Fund in comparison to similar information for other comparable funds as provided by Broadridge, an independent data provider. They also reviewed an analysis of that information provided by their independent fee consultant. The independent fee consultant provided its belief that the management fees charged by the Adviser to each of the Janus Henderson Funds under the current investment advisory and administration agreements are reasonable in relation to the services provided by the Adviser. The independent fee consultant found: (1) the total expenses and management fees of the Janus Henderson Funds to be reasonable relative to other comparable mutual funds; (2) the total expenses, on average, were 6% under the average total expenses of the respective Broadridge peer group; and (3) the management fees for the Janus Henderson Funds, on average, were 5% under the average management fees for the respective Broadridge peer group. The Trustees also considered the total expenses for each share class of each Janus Henderson Fund compared to the average total expenses for its Broadridge Expense Group and to average total expenses for its Broadridge Expense Universe.
For Janus Henderson Funds with three or more years of performance history, the independent fee consultant also performed a systematic “focus list” analysis of expenses which assessed fund fees in the context of fund performance being delivered. Based on this analysis, the independent fee consultant found that the combination of service quality/performance and expenses on these individual Janus Henderson Funds was reasonable in light of performance trends, performance histories, changes in portfolio management, relative average net asset levels, and the existence of performance fees, breakpoints, and/or expense waivers on such Janus Henderson Funds.
The Trustees considered the methodology used by the Adviser in determining compensation payable to portfolio managers, the competitive environment for investment management talent, and the competitive market for mutual funds in different distribution channels.
The Trustees also reviewed management fees charged by the Adviser to comparable separate account clients and to comparable non-affiliated funds subadvised by the Adviser (for which the Adviser provides only or primarily portfolio management services). Although in most instances subadvisory and separate account fee rates for various investment strategies were lower than management fee rates for Janus Henderson Funds having a similar strategy, the Trustees considered that the Adviser noted that, under the terms of the management agreements with the Janus Henderson Funds, the Adviser performs significant additional services for the Janus Henderson Funds that it does not provide to those other clients, including administration services, oversight of the Janus Henderson Funds’ other service providers, Trustee support, regulatory compliance and numerous other services, and that, in serving the Janus Henderson Funds, the Adviser assumes many legal risks and other costs that it does not assume in servicing its other clients. Moreover, the Trustees noted that the independent fee consultant found that: (1) the management fees the Adviser charges to the Janus Henderson Funds are reasonable in relation to the management fees the Adviser charges to funds subadvised by the Adviser and to the fees the Adviser charges to its institutional separate account clients; (2) these subadvised and institutional separate accounts have different service and infrastructure needs and operate in markets very different from the retail fund market; (3) Janus Henderson mutual fund investors enjoy reasonable fees relative to the fees charged in these other markets; and (4) as part of its 2022 review, 9 of 11 Janus Henderson Funds have lower management fees than similar funds subadvised by the Adviser. The Trustees noted that for the two Janus Henderson Funds that did not, management fees for each were under the average of its 15(c) peer group.
The Trustees considered the fees for each Janus Henderson Fund for its fiscal year ended in 2021 (except for Janus Henderson Global Sustainable Equity Portfolio for which the period end was March 31, 2022) and noted the following with regard to each Janus Henderson Fund’s total expenses, net of applicable fee waivers (the VIT Portfolio’s “total expenses”) as reflected in the comparative information provided by Broadridge:
The Trustees reviewed information on the overall profitability to the Adviser and its affiliates from their relationships with the Janus Henderson Funds, and considered profitability data of other publicly traded mutual fund advisers. The Trustees recognized that profitability comparisons among fund managers are difficult because of the variation in the type of comparative information that is publicly available, and the profitability of any fund manager is affected by numerous factors, including the organizational structure of the particular fund manager, differences in complex size, difference in product mix, difference in types of business (mutual fund, institutional and other), differences in the types of funds and other accounts it manages, possible other lines of business, the methodology for allocating expenses and the fund manager’s capital structure and cost of capital.
Additionally, the Trustees considered the estimated profitability to the Adviser from the investment management services it provided to each Janus Henderson Fund. In their review, the Trustees considered whether the Adviser receive adequate incentives and resources to manage the Janus Henderson Funds effectively. In reviewing profitability, the Trustees noted that the estimated profitability for an individual Janus Henderson Fund is necessarily a product of the allocation methodology utilized by the Adviser to allocate its expenses as part of the estimated profitability calculation. In this regard, the Trustees noted that the independent fee consultant found as part of its 2022 review that (1) the expense allocation methodology and rationales utilized by the Adviser were reasonable and (2) no clear correlation exists between expense allocations and operating margins. The Trustees also considered that the estimated profitability for an individual Janus Henderson Fund was influenced by a number of factors, including not only the allocation methodology selected, but also the presence of fee waivers and expense caps, and whether the Janus Henderson Fund’s investment management agreement contained breakpoints or a performance fee component. The Trustees determined, after taking into account these factors, among others, that the Adviser’s estimated profitability with respect to each Janus Henderson Fund was not unreasonable in relation to the services provided, and that the variation in the range of such estimated profitability among the Janus Henderson Funds was not a material factor in the Board’s approval of the reasonableness of any Janus Henderson Fund’s investment management fees.
The Trustees concluded that the management fees payable by each Janus Henderson Fund to the Adviser were reasonable in relation to the nature, extent, and quality of the services provided, taking into account the fees charged by other advisers for managing comparable mutual funds with similar strategies, the fees the Adviser charges to other clients, and, as applicable, the impact of fund performance on management fees payable by the Janus Henderson Funds. The Trustees also concluded that each Janus Henderson Fund’s total expenses were reasonable, taking into account the size of the Janus Henderson Fund, the quality of services provided by the Adviser, the investment performance of the Janus Henderson Fund, and any expense limitations agreed to or provided by the Adviser.
The Trustees considered information about the potential for the Adviser to realize economies of scale as the assets of the Janus Henderson Funds increase. They noted that their independent fee consultant published a report to the Trustees in June 2022 which provided its research and analysis into economies of scale. They also noted that, although many Janus Henderson Funds pay advisory fees at a fixed base rate as a percentage of net assets, without any breakpoints or performance fees, their independent fee consultant concluded that 75% of these Janus Henderson Funds’ have contractual management fees (gross of waivers) below their Broadridge Expense Group averages. The Trustees also noted the following from the independent fee consultant’s report: (1) that 31% of Janus Henderson Funds had management fee breakpoints in place whereby investors pay lower management fees as fund AUM increases; (2) that 29% of Janus Henderson Funds have low flat-rate fees and performance fees where the Adviser is incentivized to invest in resources which drive Janus Henderson Fund performance; and (3) that 39% of Janus Henderson Funds have low flat-rate fees versus peers where investors pay low fixed fees when the Janus Henderson Fund is small/midsized and higher fees when the Janus Henderson Fund grows in assets. The Trustees also noted that the Janus Henderson Funds share directly in economies of scale through the significant investments made by the Adviser and its affiliates related to services provided to the Funds and the lower charges of third-party service providers that are based in part on the combined scale of all of the Janus Henderson Funds.
The Trustees also considered the independent fee consultant’s conclusion that, given the limitations of various analytical approaches to economies of scale and their conflicting results, it is difficult to analytically confirm or deny the existence of economies of scale in the Janus Henderson complex. In this regard, the independent consultant concluded that (1) to the extent there were economies of scale at the Adviser, the Adviser’s general strategy of setting
fixed management fees below peers appeared to share any such economies with investors even on smaller Janus Henderson Funds which have not yet achieved those economies and (2) by setting lower fixed fees from the start on these Janus Henderson Funds, the Adviser appeared to be investing to increase the likelihood that these Janus Henderson Funds will grow to a level to achieve any economies of scale that may exist. Further, the independent fee consultant provided its belief that Janus Henderson Fund investors are well-served by the fee levels and performance fee structures in place on the Janus Henderson Funds in light of any economies of scale that may be present at the Adviser.
Based on all of the information reviewed, including the recent and past research and analysis conducted by the Trustees’ independent fee consultant, the Trustees concluded that the current fee structure of each Janus Henderson Fund was reasonable and that the current rates of fees do reflect a sharing between the Adviser and the Janus Henderson Fund of any economies of scale that may be present at the current asset level of the Janus Henderson Fund.
The Trustees also considered benefits that accrue to the Adviser and its affiliates from their relationships with the Janus Henderson Funds. They recognized that two affiliates of the Adviser separately serve the Janus Henderson Funds as transfer agent and distributor, respectively, and the transfer agent receives compensation directly from the non-money market Janus Henderson Funds for services provided, and that such compensation contributes to the overall profitability of the Adviser and its affiliates that results from their relationship with the Janus Henderson Funds. The Trustees also considered the Adviser’s past and proposed use of commissions paid by the Janus Henderson Funds on portfolio brokerage transactions to obtain proprietary and third-party research products and services benefiting the Janus Henderson Fund and/or other clients of the Adviser and/or the Adviser. The Trustees concluded that the Adviser’s use of these types of client commission arrangements to obtain proprietary and third-party research products and services was consistent with regulatory requirements and guidelines and was likely to benefit each Janus Henderson Fund. The Trustees also concluded that, other than the services provided by the Adviser and its affiliates pursuant to the agreements and the fees to be paid by each Janus Henderson Fund therefor, the Janus Henderson Funds and the Adviser may potentially benefit from their relationship with each other in other ways. They concluded that the Adviser and its affiliates share directly in economies of scale through the lower charges of third-party service providers that are based in part on the combined scale of the Janus Henderson Funds and other clients serviced by the Adviser and its affiliates. They also concluded that the Adviser benefits from the receipt of research products and services acquired through commissions paid on portfolio transactions of the Janus Henderson Funds and that the Janus Henderson Funds benefit from the Adviser’s receipt of those products and services as well as research products and services acquired through commissions paid by other clients of the Adviser. They further concluded that the success of any Janus Henderson Fund could attract other business to the Adviser or other Janus Henderson Funds, and that the success of the Adviser could enhance the Adviser’s ability to serve the Janus Henderson Funds.
The Management Commentary in this report includes valuable insight as well as statistical information to help you understand how your Portfolio’s performance and characteristics stack up against those of comparable indices.
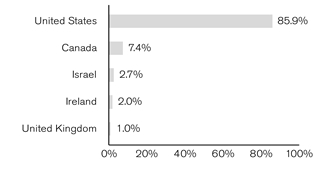
If the Portfolio invests in foreign securities, this report may include information about country exposure. Country exposure is based primarily on the country of risk. A company may be allocated to a country based on other factors such as location of the company’s principal office, the location of the principal trading market for the company’s securities, or the country where a majority of the company’s revenues are derived.
Please keep in mind that the opinions expressed in the Management Commentary are just that: opinions. They are a reflection based on best judgment at the time this report was compiled, which was December 31, 2022. As the investing environment changes, so could opinions. These views are unique and are not necessarily shared by fellow employees or by Janus Henderson in general.
Performance overview graphs compare the performance of a hypothetical $10,000 investment in the Portfolio with one or more widely used market indices. When comparing the performance of the Portfolio with an index, keep in mind that market indices are not available for investment and do not reflect deduction of expenses.
Average annual total returns are quoted for a Portfolio with more than one year of performance history. Average annual total return is calculated by taking the growth or decline in value of an investment over a period of time, including reinvestment of dividends and distributions, then calculating the annual compounded percentage rate that would have produced the same result had the rate of growth been constant throughout the period. Average annual total return does not reflect the deduction of taxes that a shareholder would pay on Portfolio distributions or redemptions of Portfolio shares.
Cumulative total returns are quoted for a Portfolio with less than one year of performance history. Cumulative total return is the growth or decline in value of an investment over time, independent of the period of time involved. Cumulative total return does not reflect the deduction of taxes that a shareholder would pay on Portfolio distributions or redemptions of Portfolio shares.
Pursuant to federal securities rules, expense ratios shown in the performance chart reflect subsidized (if applicable) and unsubsidized ratios. The total annual fund operating expenses ratio is gross of any fee waivers, reflecting the Portfolio’s unsubsidized expense ratio. The net annual fund operating expenses ratio (if applicable) includes contractual waivers of the Adviser and reflects the Portfolio’s subsidized expense ratio. Ratios may be higher or lower than those shown in the “Financial Highlights” in this report.
Following the performance overview section is the Portfolio’s Schedule of Investments. This schedule reports the types of securities held in the Portfolio on the last day of the reporting period. Securities are usually listed by type (common stock, corporate bonds, U.S. Government obligations, etc.) and by industry classification (banking, communications, insurance, etc.). Holdings are subject to change without notice.
The value of each security is quoted as of the last day of the reporting period. The value of securities denominated in foreign currencies is converted into U.S. dollars.
If the Portfolio invests in foreign securities, it will also provide a summary of investments by country. This summary reports the Portfolio exposure to different countries by providing the percentage of securities invested in each country. The country of each security represents the country of risk. The Portfolio’s Schedule of Investments relies upon the industry group and country classifications published by Bloomberg and/or MSCI Inc.
Tables listing details of individual forward currency contracts, futures, written options, swaptions, and swaps follow the Portfolio’s Schedule of Investments (if applicable).
This statement is often referred to as the “balance sheet.” It lists the assets and liabilities of the Portfolio on the last day of the reporting period.
The Portfolio’s assets are calculated by adding the value of the securities owned, the receivable for securities sold but not yet settled, the receivable for dividends declared but not yet received on securities owned, and the receivable for Portfolio shares sold to investors but not yet settled. The Portfolio’s liabilities include payables for securities purchased but not yet settled, Portfolio shares redeemed but not yet paid, and expenses owed but not yet paid. Additionally, there may be other assets and liabilities such as unrealized gain or loss on forward currency contracts.
The section entitled “Net Assets Consist of” breaks down the components of the Portfolio’s net assets. Because the Portfolio must distribute substantially all earnings, you will notice that a significant portion of net assets is shareholder capital.
The last section of this statement reports the net asset value (“NAV”) per share on the last day of the reporting period. The NAV is calculated by dividing the Portfolio’s net assets for each share class (assets minus liabilities) by the number of shares outstanding.
This statement details the Portfolio’s income, expenses, realized gains and losses on securities and currency transactions, and changes in unrealized appreciation or depreciation of Portfolio holdings.
The first section in this statement, entitled “Investment Income,” reports the dividends earned from securities and interest earned from interest-bearing securities in the Portfolio.
The next section reports the expenses incurred by the Portfolio, including the advisory fee paid to the investment adviser, transfer agent fees and expenses, and printing and postage for mailing statements, financial reports and prospectuses. Expense offsets and expense reimbursements, if any, are also shown.
The last section lists the amounts of realized gains or losses from investment and foreign currency transactions, and changes in unrealized appreciation or depreciation of investments and foreign currency-denominated assets and liabilities. The Portfolio will realize a gain (or loss) when it sells its position in a particular security. A change in unrealized gain (or loss) refers to the change in net appreciation or depreciation of the Portfolio during the reporting period. “Net Realized and Unrealized Gain/(Loss) on Investments” is affected both by changes in the market value of Portfolio holdings and by gains (or losses) realized during the reporting period.
These statements report the increase or decrease in the Portfolio’s net assets during the reporting period. Changes in the Portfolio’s net assets are attributable to investment operations, dividends and distributions to investors, and capital share transactions. This is important to investors because it shows exactly what caused the Portfolio’s net asset size to change during the period.
The first section summarizes the information from the Statement of Operations regarding changes in net assets due to the Portfolio’s investment operations. The Portfolio’s net assets may also change as a result of dividend and capital gains distributions to investors. If investors receive their dividends and/or distributions in cash, money is taken out of the Portfolio to pay the dividend and/or distribution. If investors reinvest their dividends and/or distributions, the Portfolio’s net assets will not be affected.
The reinvestment of dividends and distributions is included under “Capital Share Transactions.” “Capital Shares” refers to the money investors contribute to the Portfolio through purchases or withdrawals via redemptions. The Portfolio’s net assets will increase and decrease in value as investors purchase and redeem shares from the Portfolio.
This schedule provides a per-share breakdown of the components that affect the Portfolio’s NAV for current and past reporting periods as well as total return, asset size, ratios, and portfolio turnover rate.
The Portfolio’s expenses may be reduced through expense offsets and expense reimbursements. The ratios shown reflect expenses before and after any such offsets and reimbursements.
The ratio of net investment income/(loss) summarizes the income earned less expenses, divided by the average net assets of the Portfolio during the reporting period. Do not confuse this ratio with the Portfolio’s yield. The net investment income ratio is not a true measure of the Portfolio’s yield because it does not take into account the dividends distributed to the Portfolio’s investors.
The next figure is the portfolio turnover rate, which measures the buying and selling activity in the Portfolio. Portfolio turnover is affected by market conditions, changes in the asset size of the Portfolio, fluctuating volume of shareholder purchase and redemption orders, the nature of the Portfolio’s investments, and the investment style and/or outlook of the portfolio manager(s) and/or investment personnel. A 100% rate implies that an amount equal to the value of the entire portfolio was replaced once during the fiscal year; a 50% rate means that an amount equal to the value of half the portfolio is traded in a year; and a 200% rate means that an amount equal to the value of the entire portfolio is traded every six months.
For federal income tax purposes, the Portfolio designated the following for the year ended December 31, 2022:
The following are the Trustees and officers of the Trust, together with a brief description of their principal occupations during the last five years (principal occupations for certain Trustees may include periods over five years). The Portfolio’s Statement of Additional Information includes additional information about the Trustees and officers and is available, without charge, by calling 1-877-335-2687.
Each Trustee has served in that capacity since he or she was originally elected or appointed. The Trustees do not serve a specified term of office. Each Trustee will hold office until the termination of the Trust or his or her earlier death, resignation, retirement, incapacity, or removal. Under the Portfolio’s Governance Procedures and Guidelines, the policy is for Trustees to retire no later than the end of the calendar year in which the Trustee turns 75. The Trustees review the Portfolio’s Governance Procedures and Guidelines from time to time and may make changes they deem appropriate. The Portfolio’s Nominating and Governance Committee will consider nominees for the position of Trustee recommended by shareholders. Shareholders may submit the name of a candidate for consideration by the Committee by submitting their recommendations to the Trust’s Secretary. Each Trustee is currently a Trustee of one other registered investment company advised by the Adviser: Janus Investment Fund. Collectively, these two registered investment companies consist of 51 series or funds referred to herein as the Fund Complex.
The Trust’s officers are elected annually by the Trustees for a one-year term. Certain officers also serve as officers of Janus Investment Fund. Certain officers of the Portfolio may also be officers and/or directors of the Adviser. Except as otherwise disclosed, Portfolio officers receive no compensation from the Portfolio, except for the Portfolio’s Chief Compliance Officer, as authorized by the Trustees.
| | | | | | |
| | | |
| | | ANNUAL REPORT December 31, 2022 |
| | |
| | Janus Henderson VIT Flexible Bond Portfolio |
| | |
| | Janus Aspen Series |
| |
| | | HIGHLIGHTS · Portfolio management perspective · Investment strategy behind your portfolio · Portfolio performance, characteristics
and holdings | |
Table of Contents
Janus Henderson VIT Flexible Bond Portfolio
Janus Henderson VIT Flexible Bond Portfolio (unaudited)
| | | | | | |
| | | | 
Greg Wilensky co-portfolio manager | 
Michael Keough co-portfolio manager |
| | | |
PERFORMANCE OVERVIEW
For the 12-month period ended December 31, 2022, the Janus Henderson VIT Flexible Bond Portfolio’s Institutional Shares and Service Shares returned -13.66% and -13.90%, respectively, compared with -13.01% for the Portfolio’s benchmark, the Bloomberg U.S. Aggregate Bond Index.
INVESTMENT ENVIRONMENT
The period began amid high and rising inflation that was exacerbated by spiking energy and commodities prices following Russia’s invasion of Ukraine. Coupled with a tight labor market, unabating inflationary pressure finally provoked an overdue pivot from the Federal Reserve (Fed). The Fed sought to regain the credibility it had lost for erroneously viewing inflation as transitory by instituting an aggressive reduction in liquidity, both through rate hikes and a faster-than-expected decrease in the size of its balance sheet. In total, the Fed raised interest rates by 4.25% in 2022. Year-over-year headline inflation peaked in June at 9.1% – a 40-year high – before cooling prices in energy and goods initiated a downward trend that saw headline inflation drop to 6.5% by December.
In response to rampant inflation and a hawkish Fed, the yield curve rose, bond prices fell, and interest rates entered a period of high volatility. The yield on the 10-year U.S. Treasury touched a post-2008 high of 4.24% in October before recovering somewhat to close out December at 3.87%, up from 1.51% a year earlier. Around mid-year, concerns about an economic slowdown created by tighter monetary policy resulted in an inverted yield curve that persisted for the remainder of the year.
Corporate investment-grade credit spreads (the difference in yield over Treasuries) were volatile during the period. After beginning the year at historically tight levels of around 0.92%, spreads hit a post-COVID high of 1.64% but came back to 1.29% by year-end. Mortgage-backed securities (MBS) also experienced volatile spread levels but ultimately closed out the year 20 basis points wider at 0.51%. High-yield credit spreads also ended wider at 4.68%.
PERFORMANCE DISCUSSION
The Portfolio underperformed the Bloomberg U.S. Aggregate Bond Index. While we reduced the Portfolio’s spread-risk exposure to cycle lows, we generally maintained more spread risk versus the benchmark, and this detracted as spreads widened over the period.
As the year progressed and the possibility of an economic slowdown increased, we continued to improve the overall credit quality of the Portfolio. While we reduced our out-of-index exposure to corporate high-yield bonds to cycle lows, the sector detracted on an asset allocation basis. Security selection within investment-grade corporates further detracted, particularly within the Portfolio’s financial holdings. Despite relative underperformance, we continued to prefer financials over industrials within investment-grade corporates, given that financials underperformed and traded wide of industrials and wide of their historical spread relationship. Security selection within the Portfolio’s mortgage-backed securities (MBS) contributed.
As we reduced our exposure to corporates, we added to our overweight allocation to securitized sectors, particularly within MBS, as we believed spreads on securitized assets had widened to levels that better reflected the risk of an economic slowdown or recession. In contrast, corporate spreads continued to trade near their long-term averages and, in our opinion, were pricing in either a low probability of recession or an extremely shallow recession.
The Portfolio’s overall interest rate risk positioning contributed, helping to offset relative underperformance. Treasury rates rode the proverbial roller coaster during the period, and we actively managed duration amid the volatility. We ended the year marginally short duration versus the benchmark, and we reduced our Treasury curve flattener position, as the spread between 2-year and
Janus Henderson VIT Flexible Bond Portfolio (unaudited)
10-year Treasuries inverted to -0.55%. The Portfolio’s overall interest rate positioning continued to balance the opposing forces of high inflation and a hawkish Fed with the growing likelihood of a recession.
DERIVATIVES USAGE
Please see the Derivative Instruments section in the “Notes to Financial Statements” for a discussion of derivatives used by the Portfolio.
OUTLOOK
As the sun set on 2022, investors were glad to see the back of a challenging year. While negative double-digit returns were recorded in broad stock and bond indices, it’s important to note that most of the move down in asset prices in 2022 was due to inflation, tighter monetary policy, and higher interest rates. Importantly, we believe that 2023 likely will mark a shift in this narrative with an end to the Fed’s hiking cycle and the focus changing from how high rates need to go to what the negative effects of tighter monetary policy will be on the fundamentals of the U.S. economy. While a soft landing remains possible, we expect it to be difficult to pull off as further demand destruction from a weaker labor market will likely be required to bring inflation all the way down to the Fed’s 2% target.
Our Portfolio construction favors maintaining a conservative allocation to credit and spread risk. While we are concerned about fundamentals in 2023, opportunities exist to invest in higher-quality credit with attractive yields. Our focus is to take risk in the right places and be more exposed in those sectors that, in our view, are well positioned - and well priced - for an economic slowdown. To that end, with their higher average credit ratings and spreads trading wider than their 10-year averages, we favor an overweight allocation to short-duration securitized sectors relative to corporates. We stand ready to dynamically adjust our asset allocation to capitalize on the opportunities we expect in 2023.
Shifting to interest rates and duration, investors were best served in 2022 by being underweight duration due to higher interest rates and inflation. With most of the increase in rates behind us, we expect the backdrop in 2023 to be about declining inflation and slower growth. Portfolios may benefit from a timely shift to a duration overweight if the Treasury curve steepens and rates eventually fall as we anticipate.
We are more optimistic for fixed income in the year ahead, as we think bonds are well positioned to provide the income and diversification benefits in 2023 that investors have come to expect from their core fixed income allocation.
Thank you for your investment in Janus Henderson VIT Flexible Bond Portfolio.
Janus Henderson VIT Flexible Bond Portfolio (unaudited)
Portfolio At A Glance
December 31, 2022
| | | |
Fund Profile | | |
30-day SEC Yield* | Without
Reimbursement | With
Reimbursement |
Institutional Shares | 3.19% | 3.23% |
Service Shares | 2.92% | 2.96% |
Weighted Average Maturity | 7.9 Years |
Average Effective Duration** | 5.9 Years |
* Yield will fluctuate. | | |
** A theoretical measure of price volatility. | |
| | |
Ratings† Summary - (% of Total Investments) | |
AAA | 29.6% |
AA | 32.9% |
A | 4.3% |
BBB | 11.4% |
BB | 1.9% |
B | 0.1% |
Not Rated | 17.1% |
Other | 2.7% |
† Credit ratings provided by Standard & Poor's (S&P), an independent credit rating agency. Credit ratings range from AAA (highest) to D (lowest) based on S&P's measures. Further information on S&P's rating methodology may be found at www.standardandpoors.com. Other rating agencies may rate the same securities differently. Ratings are relative and subjective and are not absolute standards of quality. Credit quality does not remove market risk and is subject to change. "Not Rated" securities are not rated by S&P, but may be rated by other rating agencies and do not necessarily indicate low quality. "Other" includes cash equivalents, equity securities, and certain derivative instruments. |
Significant Areas of Investment - (% of Net Assets)
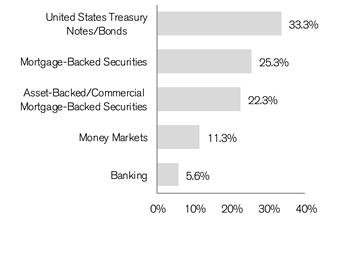
| | | | | | |
Asset Allocation - (% of Net Assets) | |
United States Treasury Notes/Bonds | | 33.3% | |
Mortgage-Backed Securities | | 25.3% | |
Asset-Backed/Commercial Mortgage-Backed Securities | | 22.3% | |
Corporate Bonds | | 15.7% | |
Investment Companies | | 11.3% | |
Investments Purchased with Cash Collateral from Securities Lending | | 3.5% | |
Other | | (11.4)% |
| | | 100.0% |
Janus Henderson VIT Flexible Bond Portfolio (unaudited)
Performance
| |
See important disclosures on the next page. |
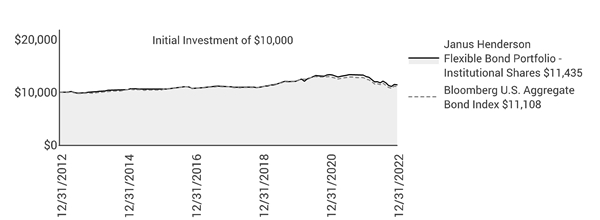
| | | | | | | | | | | |
| | | | | | | | | |
| | | | | | | | | |
Average Annual Total Return - for the periods ended December 31, 2022 | | | Prospectus Expense Ratios |
| | One
Year | Five
Year | Ten
Year | Since
Inception* | | | Total Annual Fund
Operating Expenses‡ | Net Annual Fund
Operating Expenses‡ |
Institutional Shares | | -13.66% | 0.50% | 1.35% | 5.32% | | | 0.59% | 0.57% |
Service Shares | | -13.90% | 0.25% | 1.10% | 5.08% | | | 0.84% | 0.82% |
Bloomberg U.S. Aggregate Bond Index | | -13.01% | 0.02% | 1.06% | 4.31% | | | | |
Morningstar Quartile - Institutional Shares | | 3rd | 1st | 2nd | 1st | | | | |
Morningstar Ranking - based on total returns for Intermediate Core - Plus Bond Funds | | 281/625 | 118/554 | 193/477 | 7/170 | | | | |
Returns quoted are past performance and do not guarantee future results; current performance may be lower or higher. Investment returns and principal value will vary; there may be a gain or loss when shares are sold. For the most recent month-end performance call 800.668.0434 or visit janushenderson.com/VITperformance.
Net expense ratios reflect the expense waiver, if any, contractually agreed to for at least a one-year period commencing on April 29, 2022. See Financial Highlights for actual expense ratios during the reporting period.
Performance may be affected by risks that include those associated with foreign and emerging markets, fixed income securities, high-yield and high-risk securities, undervalued, overlooked and smaller capitalization companies, real estate related securities including Real Estate Investment Trusts (REITs), Environmental, Social and Governance (ESG) factors, non-diversification, portfolio turnover, derivatives, short sales, initial public offerings (IPOs) and potential conflicts of interest. Each product has different risks. Please see the prospectus for more information about risks, holdings and other details.
Returns do not reflect the deduction of fees, charges or expenses of any insurance product or qualified plan. If applied, returns would have been lower.
Returns include reinvestment of all dividends and distributions and do not reflect the deduction of taxes that a shareholder would pay on Portfolio distributions or redemptions of Portfolio shares. The returns do not include adjustments in accordance with generally accepted accounting principles required at the period end for financial reporting purposes.
Performance for Service Shares prior to December 31, 1999 reflects the performance of Institutional Shares, adjusted to reflect the expenses of Service Shares.
Ranking is for the share class shown only; other classes may have different performance characteristics. When an expense waiver is in effect, it may have a material effect on the total return, and therefore the ranking for the period.
© 2022 Morningstar, Inc. All Rights Reserved.
There is no assurance that the investment process will consistently lead to successful investing.
Janus Henderson VIT Flexible Bond Portfolio (unaudited)
Performance
See Notes to Schedule of Investments and Other Information for index definitions.
Index performance does not reflect the expenses of managing a portfolio as an index is unmanaged and not available for direct investment.
See “Useful Information About Your Portfolio Report.”
*The Portfolio’s inception date – September 13, 1993
‡ As stated in the prospectus. See Financial Highlights for actual expense ratios during the reporting period.
Janus Henderson VIT Flexible Bond Portfolio (unaudited)
Expense Examples
As a shareholder of the Portfolio, you incur two types of costs: (1) transaction costs and (2) ongoing costs, including management fees; 12b-1 distribution and shareholder servicing fees (applicable to Service Shares only); transfer agent fees and expenses payable pursuant to the Transfer Agency Agreement; and other Portfolio expenses. This example is intended to help you understand your ongoing costs (in dollars) of investing in the Portfolio and to compare these costs with the ongoing costs of investing in other mutual funds. To do so, compare this 5% hypothetical example with the 5% hypothetical examples that appear in the shareholder reports of the other funds. The example is based upon an investment of $1,000 invested at the beginning of the period and held for the six-months indicated, unless noted otherwise in the table and footnotes below.
Actual Expenses
The information in the table under the heading “Actual” provides information about actual account values and actual expenses. You may use the information in these columns, together with the amount you invested, to estimate the expenses that you paid over the period. Simply divide your account value by $1,000 (for example, an $8,600 account value divided by $1,000 = 8.6), then multiply the result by the number in the appropriate column for your share class under the heading entitled “Expenses Paid During Period” to estimate the expenses you paid on your account during the period.
Hypothetical Example for Comparison Purposes
The information in the table under the heading “Hypothetical (5% return before expenses)” provides information about hypothetical account values and hypothetical expenses based upon the Portfolio’s actual expense ratio and an assumed rate of return of 5% per year before expenses, which is not the Portfolio’s actual return. The hypothetical account values and expenses may not be used to estimate the actual ending account balance or expenses you paid for the period. You may use this information to compare the ongoing costs of investing in the Portfolio and other funds. To do so, compare this 5% hypothetical example with the 5% hypothetical examples that appear in the shareholder reports of the other funds. Additionally, for an analysis of the fees associated with an investment in either share class or other similar funds, please visit www.finra.org/fundanalyzer.
Please note that the expenses shown in the table are meant to highlight your ongoing costs only and do not reflect any transaction costs, such as any charges at the separate account level or contract level. These fees are fully described in the Portfolio’s prospectuses. Therefore, the hypothetical examples are useful in comparing ongoing costs only, and will not help you determine the relative total costs of owning different funds. In addition, if these transaction costs were included, your costs would have been higher.
| | | | | | | | | | | |
| | | | | | | | |
| | | Actual | | Hypothetical
(5% return before expenses) | |
| Beginning
Account
Value
(7/1/22) | Ending
Account
Value
(12/31/22) | Expenses
Paid During
Period
(7/1/22 - 12/31/22)† | | Beginning
Account
Value
(7/1/22) | Ending
Account
Value
(12/31/22) | Expenses
Paid During
Period
(7/1/22 - 12/31/22)† | Net Annualized
Expense Ratio
(7/1/22 - 12/31/22) |
Institutional Shares | $1,000.00 | $968.30 | $2.83 | | $1,000.00 | $1,022.33 | $2.91 | 0.57% |
Service Shares | $1,000.00 | $967.60 | $4.07 | | $1,000.00 | $1,021.07 | $4.18 | 0.82% |
† | Expenses Paid During Period are equal to the Net Annualized Expense Ratio multiplied by the average account value over the period, multiplied by 184/365 (to reflect the one-half year period). Expenses in the examples include the effect of applicable fee waivers and/or expense reimbursements, if any. Had such waivers and/or reimbursements not been in effect, your expenses would have been higher. Please refer to the Notes to Financial Statements or the Portfolio’s prospectuses for more information regarding waivers and/or reimbursements. |
Janus Henderson VIT Flexible Bond Portfolio
Schedule of Investments
December 31, 2022
| | | | | | | | |
Shares or
Principal Amounts | | | Value | |
Asset-Backed/Commercial Mortgage-Backed Securities– 22.3% | | | |
| | 208 Park Avenue Mortgage Trust 2017-280P, | | | | | | |
| | ICE LIBOR USD 1 Month + 0.8800%, 5.1170%, 9/15/34 (144A)‡ | | $629,029 | | | $613,650 | |
| | ACC Auto Trust 2021-A A, 1.0800%, 4/15/27 (144A) | | 156,556 | | | 154,748 | |
| | ACC Auto Trust 2022-A A, 4.5800%, 7/15/26 (144A) | | 425,160 | | | 417,243 | |
| | ACM Auto Trust 2022-1A A, 3.2300%, 4/20/29 (144A) | | 174,250 | | | 173,395 | |
| | Affirm Asset Securitization Trust 2020-Z2 A, 1.9000%, 1/15/25 (144A) | | 80,494 | | | 78,496 | |
| | Affirm Asset Securitization Trust 2021-B A, 1.0300%, 8/17/26 (144A) | | 801,000 | | | 759,372 | |
| | Aimco 2020-11A AR, | | | | | | |
| | ICE LIBOR USD 3 Month + 1.1300%, 5.2091%, 10/17/34 (144A)‡ | | 330,000 | | | 321,225 | |
| | Angel Oak Mortgage Trust I LLC 2019-5, 2.5930%, 10/25/49 (144A)‡ | | 87,786 | | | 84,197 | |
| | Angel Oak Mortgage Trust I LLC 2019-6, | | | | | | |
| | ICE LIBOR USD 12 Month + 0.9500%, 2.6200%, 11/25/59 (144A)‡ | | 75,857 | | | 71,882 | |
| | Angel Oak Mortgage Trust I LLC 2020-2, | | | | | | |
| | ICE LIBOR USD 12 Month + 2.2000%, 2.5310%, 1/26/65 (144A)‡ | | 213,029 | | | 192,145 | |
| | Angel Oak Mortgage Trust I LLC 2020-3, | | | | | | |
| | ICE LIBOR USD 12 Month + 1.0000%, 2.4100%, 4/25/65 (144A)‡ | | 185,303 | | | 167,498 | |
| | Aqua Finance Trust 2021-A A, 1.5400%, 7/17/46 (144A) | | 367,934 | | | 330,414 | |
| | ARES CLO Ltd 2021-60A A, | | | | | | |
| | ICE LIBOR USD 3 Month + 1.1200%, 3.8603%, 7/18/34 (144A)‡ | | 278,000 | | | 270,410 | |
| | Arivo Acceptance Auto Loan Receivables 2022-1A A, 3.9300%, 5/15/28 (144A) | | 363,210 | | | 352,525 | |
| | Atalaya Equipment Leasing Fund I LP 2021-1A A2, 1.2300%, 5/15/26 (144A) | | 484,964 | | | 470,743 | |
| | Babson CLO Ltd 2018-3A A1, | | | | | | |
| | ICE LIBOR USD 3 Month + 0.9500%, 5.1926%, 7/20/29 (144A)‡ | | 524,001 | | | 519,869 | |
| | Babson CLO Ltd 2019-3A A1R, | | | | | | |
| | ICE LIBOR USD 3 Month + 1.0700%, 5.3126%, 4/20/31 (144A)‡ | | 1,208,000 | | | 1,190,810 | |
| | Babson CLO Ltd 2020-4A A, | | | | | | |
| | ICE LIBOR USD 3 Month + 1.2200%, 3.9299%, 1/20/32 (144A)‡ | | 385,415 | | | 379,283 | |
| | Bank 2018-BN12 A4, 4.2550%, 5/15/61‡ | | 260,123 | | | 247,960 | |
| | Barclays Commercial Mortgage Securities LLC 2015-SRCH, | | | | | | |
| | 4.1970%, 8/10/35 (144A) | | 1,447,000 | | | 1,346,843 | |
| | Barclays Commercial Mortgage Securities LLC 2017-DELC, | | | | | | |
| | ICE LIBOR USD 1 Month + 0.9750%, 5.2929%, 8/15/36 (144A)‡ | | 443,000 | | | 434,940 | |
| | BPR Trust 2022-OANA A, | | | | | | |
| | CME Term SOFR 1 Month + 1.8980%, 6.2336%, 4/15/37 (144A)‡ | | 2,104,000 | | | 2,071,832 | |
| | BX Commercial Mortgage Trust 2019-OC11, 3.6050%, 12/9/41 (144A) | | 309,000 | | | 254,064 | |
| | BX Commercial Mortgage Trust 2019-OC11, 3.8560%, 12/9/41 (144A) | | 614,000 | | | 507,291 | |
| | BX Commercial Mortgage Trust 2019-XL, | | | | | | |
| | CME Term SOFR 1 Month + 1.0345%, 5.3701%, 10/15/36 (144A)‡ | | 1,484,244 | | | 1,465,923 | |
| | BX Commercial Mortgage Trust 2019-XL, | | | | | | |
| | CME Term SOFR 1 Month + 1.1945%, 5.5301%, 10/15/36 (144A)‡ | | 444,550 | | | 436,373 | |
| | BX Commercial Mortgage Trust 2020-VKNG A, | | | | | | |
| | CME Term SOFR 1 Month + 1.0445%, 5.3801%, 10/15/37 (144A)‡ | | 188,443 | | | 183,984 | |
| | BX Commercial Mortgage Trust 2021-LBA AJV, | | | | | | |
| | ICE LIBOR USD 1 Month + 0.8000%, 5.1180%, 2/15/36 (144A)‡ | | 848,000 | | | 806,326 | |
| | BX Commercial Mortgage Trust 2021-LBA AV, | | | | | | |
| | ICE LIBOR USD 1 Month + 0.8000%, 5.1180%, 2/15/36 (144A)‡ | | 964,000 | | | 918,280 | |
| | BX Commercial Mortgage Trust 2021-VINO A, | | | | | | |
| | ICE LIBOR USD 1 Month + 0.6523%, 4.9703%, 5/15/38 (144A)‡ | | 268,000 | | | 258,125 | |
| | BX Commercial Mortgage Trust 2021-VOLT B, | | | | | | |
| | ICE LIBOR USD 1 Month + 0.9500%, 5.2679%, 9/15/36 (144A)‡ | | 1,043,000 | | | 986,512 | |
| | BX Commercial Mortgage Trust 2021-VOLT D, | | | | | | |
| | ICE LIBOR USD 1 Month + 1.6500%, 5.9679%, 9/15/36 (144A)‡ | | 1,096,000 | | | 1,025,708 | |
| | BX Commercial Mortgage Trust 2022-FOX2 A2, | | | | | | |
| | CME Term SOFR 1 Month + 0.7492%, 5.0848%, 4/15/39 (144A)‡ | | 1,226,000 | | | 1,128,943 | |
| | Carvana Auto Receivables Trust 2021-P4 A2, 0.8200%, 4/10/25 | | 351,306 | | | 346,790 | |
| | CBAM CLO Management 2019-11RA A1, | | | | | | |
| | ICE LIBOR USD 3 Month + 1.1800%, 5.4226%, 1/20/35 (144A)‡ | | 1,312,000 | | | 1,277,284 | |
| | CBAM CLO Management 2019-11RA B, | | | | | | |
| | ICE LIBOR USD 3 Month + 1.7500%, 5.9926%, 1/20/35 (144A)‡ | | 500,944 | | | 476,249 | |
| | | | | | | | |
| | |
See Notes to Schedule of Investments and Other Information and Notes to Financial Statements. |
| |
Janus Aspen Series | 7 |
Janus Henderson VIT Flexible Bond Portfolio
Schedule of Investments
December 31, 2022
| | | | | | | | |
Shares or
Principal Amounts | | | Value | |
Asset-Backed/Commercial Mortgage-Backed Securities– (continued) | | | |
| | Cedar Funding Ltd 2019-11A A1R, | | | | | | |
| | ICE LIBOR USD 3 Month + 1.0500%, 5.7863%, 5/29/32 (144A)‡ | | $777,000 | | | $761,954 | |
| | CF Hippolyta Issuer LLC 2021-1A A1, 1.5300%, 3/15/61 (144A) | | 1,143,968 | | | 986,789 | |
| | CF Hippolyta Issuer LLC 2021-1A B1, 1.9800%, 3/15/61 (144A) | | 419,709 | | | 344,506 | |
| | CF Hippolyta Issuer LLC 2022-1A A1, 5.9700%, 8/15/62 (144A) | | 1,244,285 | | | 1,206,110 | |
| | CF Hippolyta Issuer LLC 2022-1A A2, 6.1100%, 8/15/62 (144A) | | 3,025,359 | | | 2,866,042 | |
| | Chase Auto Credit Linked Notes 2021-2 B, 0.8890%, 12/26/28 (144A) | | 472,404 | | | 451,406 | |
| | Chase Mortgage Finance Corp 2021-CL1 M1, | | | | | | |
| | US 30 Day Average SOFR + 1.2000%, 5.1277%, 2/25/50 (144A)‡ | | 536,233 | | | 485,667 | |
| | CIFC Funding Ltd 2021-4A A, | | | | | | |
| | ICE LIBOR USD 3 Month + 1.0500%, 5.1291%, 7/15/33 (144A)‡ | | 1,057,088 | | | 1,040,505 | |
| | CIFC Funding Ltd 2021-7A B, | | | | | | |
| | ICE LIBOR USD 3 Month + 1.6000%, 5.9246%, 1/23/35 (144A)‡ | | 383,807 | | | 366,477 | |
| | CIM Trust 2021-NR1 A1, 2.5690%, 7/25/55 (144A)Ç | | 616,145 | | | 580,154 | |
| | Cold Storage Trust 2020-ICE5 A, | | | | | | |
| | ICE LIBOR USD 1 Month + 0.9000%, 5.2179%, 11/15/37 (144A)‡ | | 1,740,876 | | | 1,695,306 | |
| | Cold Storage Trust 2020-ICE5 B, | | | | | | |
| | ICE LIBOR USD 1 Month + 1.3000%, 5.6179%, 11/15/37 (144A)‡ | | 774,597 | | | 749,923 | |
| | Cold Storage Trust 2020-ICE5 C, | | | | | | |
| | ICE LIBOR USD 1 Month + 1.6500%, 5.9679%, 11/15/37 (144A)‡ | | 777,546 | | | 752,068 | |
| | COLT Funding LLC 2020-2, | | | | | | |
| | ICE LIBOR USD 12 Month + 1.5000%, 1.8530%, 3/25/65 (144A)‡ | | 17,665 | | | 17,185 | |
| | COLT Funding LLC 2020-3, | | | | | | |
| | ICE LIBOR USD 12 Month + 1.2000%, 1.5060%, 4/27/65 (144A)‡ | | 64,420 | | | 59,656 | |
| | Conn Funding II LP 2021-A A, 1.0500%, 5/15/26 (144A) | | 702 | | | 701 | |
| | Connecticut Avenue Securities Trust 2014-C04, | | | | | | |
| | ICE LIBOR USD 1 Month + 4.9000%, 9.2887%, 11/25/24‡ | | 39,129 | | | 40,236 | |
| | Connecticut Avenue Securities Trust 2015-C02 1M2, | | | | | | |
| | ICE LIBOR USD 1 Month + 4.0000%, 8.3887%, 5/25/25‡ | | 105,390 | | | 105,694 | |
| | Connecticut Avenue Securities Trust 2018-R07, | | | | | | |
| | ICE LIBOR USD 1 Month + 2.4000%, 6.7887%, 4/25/31 (144A)‡ | | 37,056 | | | 36,946 | |
| | Connecticut Avenue Securities Trust 2019-R02, | | | | | | |
| | ICE LIBOR USD 1 Month + 2.3000%, 6.6887%, 8/25/31 (144A)‡ | | 17,293 | | | 17,259 | |
| | Connecticut Avenue Securities Trust 2019-R03, | | | | | | |
| | ICE LIBOR USD 1 Month + 2.1500%, 6.5387%, 9/25/31 (144A)‡ | | 66,005 | | | 65,819 | |
| | Connecticut Avenue Securities Trust 2019-R07, | | | | | | |
| | ICE LIBOR USD 1 Month + 2.1000%, 6.4887%, 10/25/39 (144A)‡ | | 23,623 | | | 23,559 | |
| | Connecticut Avenue Securities Trust 2021-R02 2M2, | | | | | | |
| | US 30 Day Average SOFR + 2.0000%, 5.9277%, 11/25/41 (144A)‡ | | 1,922,000 | | | 1,788,708 | |
| | Connecticut Avenue Securities Trust 2021-R03 1M2, | | | | | | |
| | US 30 Day Average SOFR + 1.6500%, 5.5777%, 12/25/41 (144A)‡ | | 711,000 | | | 660,233 | |
| | Connecticut Avenue Securities Trust 2022-R01 1B1, | | | | | | |
| | US 30 Day Average SOFR + 3.1500%, 7.0777%, 12/25/41 (144A)‡ | | 2,186,000 | | | 2,051,782 | |
| | Connecticut Avenue Securities Trust 2022-R02 2M2, | | | | | | |
| | US 30 Day Average SOFR + 3.0000%, 6.9277%, 1/25/42 (144A)‡ | | 804,000 | | | 757,699 | |
| | Connecticut Avenue Securities Trust 2022-R03 1M1, | | | | | | |
| | US 30 Day Average SOFR + 2.1000%, 6.0277%, 3/25/42 (144A)‡ | | 1,423,477 | | | 1,415,498 | |
| | Connecticut Avenue Securities Trust 2022-R04 1M1, | | | | | | |
| | US 30 Day Average SOFR + 2.0000%, 5.9277%, 3/25/42 (144A)‡ | | 628,113 | | | 626,600 | |
| | Connecticut Avenue Securities Trust 2022-R06 1M1, | | | | | | |
| | US 30 Day Average SOFR + 2.7500%, 6.6777%, 5/25/42 (144A)‡ | | 422,334 | | | 426,188 | |
| | Connecticut Avenue Securities Trust 2022-R08 1M1, | | | | | | |
| | US 30 Day Average SOFR + 2.5500%, 6.4777%, 7/25/42 (144A)‡ | | 337,895 | | | 338,858 | |
| | Consumer Loan Underlying Bond Credit Trust 2019-P2 C, | | | | | | |
| | 4.4100%, 10/15/26 (144A) | | 253,758 | | | 252,203 | |
| | CP EF Asset Securitization I LLC 2002-1A A, 5.9600%, 4/15/30 (144A) | | 534,244 | | | 525,524 | |
| | Credit Suisse Commercial Mortgage Trust 2019-ICE4, | | | | | | |
| | ICE LIBOR USD 1 Month + 0.9800%, 5.2980%, 5/15/36 (144A)‡ | | 1,687,000 | | | 1,667,622 | |
| | Credit Suisse Commercial Mortgage Trust 2019-ICE4 C, | | | | | | |
| | ICE LIBOR USD 1 Month + 1.4300%, 5.7480%, 5/15/36 (144A)‡ | | 831,000 | | | 812,910 | |
| | |
See Notes to Schedule of Investments and Other Information and Notes to Financial Statements. |
| |
8 | DECEMBER 31, 2022 |
Janus Henderson VIT Flexible Bond Portfolio
Schedule of Investments
December 31, 2022
| | | | | | | | |
Shares or
Principal Amounts | | | Value | |
Asset-Backed/Commercial Mortgage-Backed Securities– (continued) | | | |
| | Credit Suisse Commercial Mortgage Trust 2021-WEHO A, | | | | | | |
| | ICE LIBOR USD 1 Month + 3.9693%, 8.2873%, 4/15/23 (144A)‡ | | $826,467 | | | $802,532 | |
| | Diamond Infrastructure Funding LLC 2021-1A A, 1.7600%, 4/15/49 (144A) | | 1,183,000 | | | 968,980 | |
| | Domino's Pizza Master Issuer LLC, 4.1160%, 7/25/48 (144A) | | 1,049,280 | | | 989,764 | |
| | Dryden Senior Loan Fund 2020-83A A, | | | | | | |
| | ICE LIBOR USD 3 Month + 1.2200%, 5.4137%, 1/18/32 (144A)‡ | | 374,404 | | | 368,305 | |
| | Elmwood CLO VIII Ltd 2019-2A AR, | | | | | | |
| | ICE LIBOR USD 3 Month + 1.1500%, 3.8599%, 4/20/34 (144A)‡ | | 419,000 | | | 409,088 | |
| | Exeter Automobile Receivables Trust 2019-1, 5.2000%, 1/15/26 (144A) | | 545,000 | | | 539,894 | |
| | Exeter Automobile Receivables Trust 2021-1A D, 1.0800%, 11/16/26 | | 580,000 | | | 540,486 | |
| | Extended Stay America Trust 2021-ESH B, | | | | | | |
| | ICE LIBOR USD 1 Month + 1.3800%, 5.6980%, 7/15/38 (144A)‡ | | 400,239 | | | 383,427 | |
| | Fannie Mae Connecticut Avenue Securities, | | | | | | |
| | ICE LIBOR USD 1 Month + 5.0000%, 9.3887%, 7/25/25‡ | | 196,662 | | | 203,966 | |
| | Fannie Mae REMICS, 3.0000%, 5/25/48 | | 947,459 | | | 854,773 | |
| | Fannie Mae REMICS, 3.0000%, 11/25/49 | | 934,885 | | | 829,960 | |
| | Flagstar Mortgage Trust 2021-13IN A2, 3.0000%, 12/30/51 (144A)‡ | | 3,478,952 | | | 2,903,436 | |
| | Freddie Mac Structured Agency Credit Risk Debt Notes 2019-DNA4 M2, | | | | | | |
| | ICE LIBOR USD 1 Month + 1.9500%, 6.3387%, 10/25/49 (144A)‡ | | 18,653 | | | 18,641 | |
| | Freddie Mac Structured Agency Credit Risk Debt Notes 2020-DNA6 M2, | | | | | | |
| | US 30 Day Average SOFR + 2.0000%, 5.9277%, 12/25/50 (144A)‡ | | 792,561 | | | 786,298 | |
| | Freddie Mac Structured Agency Credit Risk Debt Notes 2020-HQA4 M2, | | | | | | |
| | ICE LIBOR USD 1 Month + 3.1500%, 7.5387%, 9/25/50 (144A)‡ | | 4,086 | | | 4,086 | |
| | Freddie Mac Structured Agency Credit Risk Debt Notes 2020-HQA5 M2, | | | | | | |
| | US 30 Day Average SOFR + 2.6000%, 6.5277%, 11/25/50 (144A)‡ | | 884,554 | | | 873,798 | |
| | Freddie Mac Structured Agency Credit Risk Debt Notes 2021-DNA2 M2, | | | | | | |
| | US 30 Day Average SOFR + 2.3000%, 6.2277%, 8/25/33 (144A)‡ | | 442,000 | | | 437,096 | |
| | Freddie Mac Structured Agency Credit Risk Debt Notes 2021-HQA1 M2, | | | | | | |
| | US 30 Day Average SOFR + 2.2500%, 6.1777%, 8/25/33 (144A)‡ | | 476,000 | | | 438,476 | |
| | Freddie Mac Structured Agency Credit Risk Debt Notes 2022-DNA5 M1A, | | | | | | |
| | US 30 Day Average SOFR + 2.9500%, 6.8777%, 6/25/42 (144A)‡ | | 880,526 | | | 888,537 | |
| | Freddie Mac Structured Agency Credit Risk Debt Notes 2022-DNA6 M1A, | | | | | | |
| | US 30 Day Average SOFR + 2.1500%, 6.0777%, 9/25/42 (144A)‡ | | 196,123 | | | 195,438 | |
| | Freddie Mac Structured Agency Credit Risk Debt Notes 2022-HQA1 M1A, | | | | | | |
| | US 30 Day Average SOFR + 2.1000%, 6.0277%, 3/25/42 (144A)‡ | | 672,744 | | | 666,568 | |
| | FREED ABS Trust 2019-2 C, 4.8600%, 11/18/26 (144A) | | 206,167 | | | 205,949 | |
| | FREED ABS Trust 2022-3FP A, 4.5000%, 8/20/29 (144A) | | 389,575 | | | 388,094 | |
| | GCAT 2022-INV1 A1, 3.0000%, 12/25/51 (144A)‡ | | 2,744,044 | | | 2,260,113 | |
| | Great Wolf Trust, | | | | | | |
| | ICE LIBOR USD 1 Month + 1.0340%, 5.3520%, 12/15/36 (144A)‡ | | 293,000 | | | 284,337 | |
| | Great Wolf Trust, | | | | | | |
| | ICE LIBOR USD 1 Month + 1.3340%, 5.6520%, 12/15/36 (144A)‡ | | 328,000 | | | 315,314 | |
| | Great Wolf Trust, | | | | | | |
| | ICE LIBOR USD 1 Month + 1.6330%, 5.9510%, 12/15/36 (144A)‡ | | 365,000 | | | 350,164 | |
| | GS Mortgage Securities Trust 2018-GS10, 4.1550%, 7/10/51‡ | | 371,605 | | | 350,093 | |
| | GS Mortgage Securities Trust 2018-GS9, 3.9920%, 3/10/51‡ | | 618,450 | | | 581,774 | |
| | Highbridge Loan Management Ltd 2021-16A B, | | | | | | |
| | ICE LIBOR USD 3 Month + 1.7000%, 6.0246%, 1/23/35 (144A)‡ | | 380,629 | | | 361,793 | |
| | JP Morgan Chase Commercial Mortgage Sec Trust 2020-ACE A, | | | | | | |
| | 3.2865%, 1/10/37 (144A) | | 1,213,000 | | | 1,115,285 | |
| | JP Morgan Chase Commercial Mortgage Sec Trust 2020-ACE B, | | | | | | |
| | 3.6401%, 1/10/37 (144A) | | 830,000 | | | 761,004 | |
| | LAD Auto Receivables Trust 2021-1A A, 1.3000%, 8/17/26 (144A) | | 398,436 | | | 386,675 | |
| | LAD Auto Receivables Trust 2022-1A A, 5.2100%, 6/15/27 (144A) | | 963,723 | | | 947,862 | |
| | LCM LP 24A AR, ICE LIBOR USD 3 Month + 0.9800%, 5.2226%, 3/20/30 (144A)‡ | | 374,930 | | | 368,842 | |
| | Lendbuzz Securitization Trust 2021-1A A, 4.2200%, 5/17/27 (144A)‡ | | 927,941 | | | 891,432 | |
| | Life Financial Services Trust 2021-BMR A, | | | | | | |
| | ICE LIBOR USD 1 Month + 0.7000%, 5.0180%, 3/15/38 (144A)‡ | | 1,851,916 | | | 1,793,221 | |
| | Life Financial Services Trust 2021-BMR C, | | | | | | |
| | ICE LIBOR USD 1 Month + 1.1000%, 5.4180%, 3/15/38 (144A)‡ | | 1,034,085 | | | 982,860 | |
| | |
See Notes to Schedule of Investments and Other Information and Notes to Financial Statements. |
| |
Janus Aspen Series | 9 |
Janus Henderson VIT Flexible Bond Portfolio
Schedule of Investments
December 31, 2022
| | | | | | | | |
Shares or
Principal Amounts | | | Value | |
Asset-Backed/Commercial Mortgage-Backed Securities– (continued) | | | |
| | Life Financial Services Trust 2022-BMR2 A1, | | | | | | |
| | CME Term SOFR 1 Month + 1.2952%, 5.6309%, 5/15/39 (144A)‡ | | $1,237,000 | | | $1,206,361 | |
| | Madison Park Funding Ltd 2019-35A A1R, | | | | | | |
| | ICE LIBOR USD 3 Month + 0.9900%, 5.2326%, 4/20/32 (144A)‡ | | 1,050,000 | | | 1,031,936 | |
| | MED Trust 2021-MDLN C, | | | | | | |
| | ICE LIBOR USD 1 Month + 1.8000%, 6.1180%, 11/15/38 (144A)‡ | | 333,000 | | | 315,784 | |
| | MED Trust 2021-MDLN D, | | | | | | |
| | ICE LIBOR USD 1 Month + 2.0000%, 6.3180%, 11/15/38 (144A)‡ | | 338,000 | | | 319,967 | |
| | MED Trust 2021-MDLN E, | | | | | | |
| | ICE LIBOR USD 1 Month + 3.1500%, 7.4680%, 11/15/38 (144A)‡ | | 1,499,000 | | | 1,391,385 | |
| | MED Trust 2021-MDLN F, | | | | | | |
| | ICE LIBOR USD 1 Month + 4.0000%, 8.3180%, 11/15/38 (144A)‡ | | 943,000 | | | 868,427 | |
| | Mello Mortgage Capital Acceptance Trust 2021-INV2 A11, | | | | | | |
| | US 30 Day Average SOFR + 0.9500%, 4.4708%, 8/25/51 (144A)‡ | | 730,530 | | | 658,739 | |
| | Mello Mortgage Capital Acceptance Trust 2021-INV3 A11, | | | | | | |
| | US 30 Day Average SOFR + 0.9500%, 4.4708%, 10/25/51 (144A)‡ | | 946,577 | | | 854,610 | |
| | Mello Mortgage Capital Acceptance Trust 2021-INV4 A3, | | | | | | |
| | 2.5000%, 12/25/51 (144A)‡ | | 854,667 | | | 682,569 | |
| | Mello Mortgage Capital Acceptance Trust 2022-INV1 A2, | | | | | | |
| | 3.0000%, 3/25/52 (144A)‡ | | 1,881,449 | | | 1,542,873 | |
| | Mercury Financial Credit Card Master Trust 2021-1A A, | | | | | | |
| | 1.5400%, 3/20/26 (144A) | | 985,000 | | | 942,952 | |
| | MHC Commercial Mortgage Trust 2021-MHC A, | | | | | | |
| | ICE LIBOR USD 1 Month + 0.8010%, 5.1190%, 4/15/38 (144A)‡ | | 1,691,503 | | | 1,640,880 | |
| | MHC Commercial Mortgage Trust 2021-MHC C, | | | | | | |
| | ICE LIBOR USD 1 Month + 1.3510%, 5.6690%, 4/15/38 (144A)‡ | | 954,704 | | | 909,934 | |
| | Morgan Stanley Capital I Trust 2016-UB11, 2.7820%, 8/15/49 | | 594,000 | | | 537,581 | |
| | Morgan Stanley Capital I Trust 2015-UBS8, 3.8090%, 12/15/48 | | 447,000 | | | 425,033 | |
| | Morgan Stanley Capital I Trust 2018-H3, 4.1770%, 7/15/51 | | 590,372 | | | 556,174 | |
| | Morgan Stanley Capital I Trust 2018-H4, 4.3100%, 12/15/51 | | 883,008 | | | 836,360 | |
| | New Residential Mortgage Loan Trust 2018-2, | | | | | | |
| | ICE LIBOR USD 6 Month + 0.6800%, 4.5000%, 2/25/58 (144A)‡ | | 211,618 | | | 199,907 | |
| | NRZ Excess Spread Collateralized Notes 2020-PLS1 A, | | | | | | |
| | 3.8440%, 12/25/25 (144A) | | 212,403 | | | 193,579 | |
| | NRZ Excess Spread Collateralized Notes 2021-FHT1 A, 3.1040%, 7/25/26 (144A) | | 692,358 | | | 601,101 | |
| | Oak Street Investment Grade Net Lease Fund 2020-1A A1, | | | | | | |
| | 1.8500%, 11/20/50 (144A) | | 743,952 | | | 661,405 | |
| | Oasis Securitization 2022-1A A, 4.7500%, 5/15/34 (144A) | | 371,918 | | | 364,855 | |
| | Oceanview Mortgage Trust 2021-4 A11, | | | | | | |
| | US 30 Day Average SOFR + 0.8500%, 4.3708%, 10/25/51 (144A)‡ | | 1,040,805 | | | 932,440 | |
| | Oceanview Mortgage Trust 2021-5 AF, | | | | | | |
| | US 30 Day Average SOFR + 0.8500%, 4.3708%, 11/25/51 (144A)‡ | | 1,070,409 | | | 961,343 | |
| | Oceanview Mortgage Trust 2022-1 A1, 3.0000%, 12/25/51 (144A)‡ | | 1,111,798 | | | 927,874 | |
| | Oceanview Mortgage Trust 2022-2 A1, 3.0000%, 12/25/51 (144A)‡ | | 2,163,644 | | | 1,805,718 | |
| | Onslow Bay Financial LLC 2021-INV3 A3, 2.5000%, 10/25/51 (144A)‡ | | 1,008,522 | | | 806,285 | |
| | Onslow Bay Financial LLC 2022-INV1 A1, 3.0000%, 12/25/51 (144A)‡ | | 2,179,587 | | | 1,819,407 | |
| | Onslow Bay Financial LLC 2022-INV1 A18, 3.0000%, 12/25/51 (144A)‡ | | 924,561 | | | 731,738 | |
| | Pagaya AI Debt Selection Trust 2021-1 A, 1.1800%, 11/15/27 (144A) | | 667,107 | | | 656,980 | |
| | Pagaya AI Debt Selection Trust 2022-1 A, 2.0300%, 10/15/29 (144A) | | 539,640 | | | 514,580 | |
| | Preston Ridge Partners Mortgage Trust 2020-4 A1, 2.9510%, 10/25/25 (144A)Ç | | 510,269 | | | 478,736 | |
| | Preston Ridge Partners Mortgage Trust 2021-10 A1, 2.4870%, 10/25/26 (144A)Ç | | 1,080,718 | | | 971,769 | |
| | Preston Ridge Partners Mortgage Trust 2021-9 A1, 2.3630%, 10/25/26 (144A)Ç | | 2,035,067 | | | 1,843,333 | |
| | Preston Ridge Partners Mortgage Trust 2021-RPL2 A1, | | | | | | |
| | 1.4550%, 10/25/51 (144A)‡ | | 1,172,506 | | | 1,027,154 | |
| | Preston Ridge Partners Mortgage Trust 2022-2 A1, 5.0000%, 3/25/27 (144A)Ç | | 1,410,086 | | | 1,317,631 | |
| | Provident Funding Mortgage Trust 2021-INV1 A1, 2.5000%, 8/25/51 (144A)‡ | | 899,966 | | | 718,438 | |
| | Regatta XXIII Funding Ltd 2021-4A B, | | | | | | |
| | ICE LIBOR USD 3 Month + 1.7000%, 5.9426%, 1/20/35 (144A)‡ | | 393,948 | | | 375,382 | |
| | Santander Bank Auto Credit-Linked Notes 2021-1A B, 1.8330%, 12/15/31 (144A) | | 239,763 | | | 231,551 | |
| | Santander Bank Auto Credit-Linked Notes 2022-A B, 5.2810%, 5/15/32 (144A) | | 846,382 | | | 819,518 | |
| | |
See Notes to Schedule of Investments and Other Information and Notes to Financial Statements. |
| |
10 | DECEMBER 31, 2022 |
Janus Henderson VIT Flexible Bond Portfolio
Schedule of Investments
December 31, 2022
| | | | | | | | |
Shares or
Principal Amounts | | | Value | |
Asset-Backed/Commercial Mortgage-Backed Securities– (continued) | | | |
| | Santander Drive Auto Receivables Trust 2020-3 D, 1.6400%, 11/16/26 | | $1,414,000 | | | $1,355,754 | |
| | Santander Drive Auto Receivables Trust 2021-1 D, 1.1300%, 11/16/26 | | 2,418,000 | | | 2,283,735 | |
| | Sequoia Mortgage Trust 2013-5, 2.5000%, 5/25/43 (144A)‡ | | 102,210 | | | 88,219 | |
| | SMRT 2022-MINI A, CME Term SOFR 1 Month + 1.0000%, 5.3360%, 1/15/39 (144A)‡ | | 696,000 | | | 671,884 | |
| | Sound Point CLO Ltd 2019-1A AR, | | | | | | |
| | ICE LIBOR USD 3 Month + 1.0800%, 3.7899%, 1/20/32 (144A)‡ | | 1,208,000 | | | 1,182,253 | |
| | Spruce Hill Mortgage Loan Trust 2020-SH1 A1, | | | | | | |
| | ICE LIBOR USD 12 Month + 0.9500%, 2.5210%, 1/28/50 (144A)‡ | | 9,430 | | | 9,276 | |
| | Spruce Hill Mortgage Loan Trust 2020-SH1 A2, | | | | | | |
| | ICE LIBOR USD 12 Month + 1.0500%, 2.6240%, 1/28/50 (144A)‡ | | 39,661 | | | 38,917 | |
| | SREIT Trust 2021-MFP A, | | | | | | |
| | ICE LIBOR USD 1 Month + 0.7308%, 5.0487%, 11/15/38 (144A)‡ | | 151,000 | | | 145,207 | |
| | Tesla Auto Lease Trust 2021-B A3, 0.6000%, 9/22/25 (144A) | | 561,000 | | | 528,268 | |
| | Tesla Auto Lease Trust 2021-B B, 0.9100%, 9/22/25 (144A) | | 288,000 | | | 266,096 | |
| | Theorem Funding Trust 2021-1A A, 1.2100%, 12/15/27 (144A) | | 533,837 | | | 524,004 | |
| | TPI Re-Remic Trust 2022-FRR1 AK33, 0%, 7/25/46 (144A)◊ | | 565,000 | | | 543,196 | |
| | TPI Re-Remic Trust 2022-FRR1 AK34, 0%, 7/25/46 (144A)◊ | | 465,000 | | | 447,055 | |
| | TPI Re-Remic Trust 2022-FRR1 AK35, 0%, 8/25/46 (144A)◊ | | 631,000 | | | 602,952 | |
| | Tricolor Auto Securitization Trust 2022-1A A, 3.3000%, 2/18/25 (144A) | | 122,996 | | | 121,906 | |
| | UNIFY Auto Receivables Trust 2021-1A A4, 0.9800%, 7/15/26 (144A) | | 610,000 | | | 582,543 | |
| | United Wholesale Mortgage LLC 2021-INV1 A9, | | | | | | |
| | US 30 Day Average SOFR + 0.9000%, 4.4208%, 8/25/51 (144A)‡ | | 882,321 | | | 794,477 | |
| | United Wholesale Mortgage LLC 2021-INV4 A3, 2.5000%, 12/25/51 (144A)‡ | | 659,904 | | | 532,353 | |
| | Upstart Securitization Trust 2021-4 A, 0.8400%, 9/20/31 (144A) | | 363,724 | | | 351,996 | |
| | Upstart Securitization Trust 2021-5 A, 1.3100%, 11/20/31 (144A) | | 258,134 | | | 248,490 | |
| | Upstart Securitization Trust 2022-1 A, 3.1200%, 3/20/32 (144A) | | 1,048,960 | | | 1,006,962 | |
| | Upstart Securitization Trust 2022-2 A, 4.3700%, 5/20/32 (144A) | | 1,486,225 | | | 1,446,705 | |
| | Vantage Data Centers LLC 2020-1A A2, 1.6450%, 9/15/45 (144A) | | 982,000 | | | 864,438 | |
| | Vantage Data Centers LLC 2020-2A A2, 1.9920%, 9/15/45 (144A) | | 634,000 | | | 518,941 | |
| | VASA Trust 2021-VASA A, | | | | | | |
| | ICE LIBOR USD 1 Month + 0.9000%, 5.2180%, 7/15/39 (144A)‡ | | 605,000 | | | 559,859 | |
| | VCAT Asset Securitization LLC 2021-NPL1 A1, 2.2891%, 12/26/50 (144A) | | 151,787 | | | 143,093 | |
| | VMC Finance LLC 2021-HT1 A, | | | | | | |
| | ICE LIBOR USD 1 Month + 1.6500%, 5.9891%, 1/18/37 (144A)‡ | | 701,122 | | | 676,767 | |
| | Wells Fargo Commercial Mortgage Trust 2021-SAVE A, | | | | | | |
| | ICE LIBOR USD 1 Month + 1.1500%, 5.4680%, 2/15/40 (144A)‡ | | 435,421 | | | 406,819 | |
| | Westgate Resorts 2022-1A A, 1.7880%, 8/20/36 (144A) | | 366,223 | | | 349,148 | |
| | Westlake Automobile Receivable Trust 2020-1A D, 2.8000%, 6/16/25 (144A) | | 637,000 | | | 622,282 | |
| | Woodward Capital Management 2021-3 A21, | | | | | | |
| | US 30 Day Average SOFR + 0.8000%, 4.3208%, 7/25/51 (144A)‡ | | 710,695 | | | 636,865 | |
Total Asset-Backed/Commercial Mortgage-Backed Securities (cost $132,647,152) | | 123,380,229 | |
Corporate Bonds– 15.7% | | | |
Banking – 5.6% | | | |
| | American Express Co, SOFR + 2.2550%, 4.9890%, 5/26/33‡ | | 1,123,000 | | | 1,079,439 | |
| | Bank of America Corp, ICE LIBOR USD 3 Month + 1.5120%, 3.7050%, 4/24/28‡ | | 1,292,000 | | | 1,195,608 | |
| | Bank of America Corp, SOFR + 1.5800%, 4.3760%, 4/27/28‡ | | 1,809,000 | | | 1,729,988 | |
| | Bank of America Corp, SOFR + 1.9900%, 6.2040%, 11/10/28‡ | | 481,000 | | | 496,619 | |
| | Bank of America Corp, ICE LIBOR USD 3 Month + 3.7050%, 6.2500%‡,µ | | 1,613,000 | | | 1,549,062 | |
| | Bank of America Corp, ICE LIBOR USD 3 Month + 3.1350%, 5.2000%‡,µ | | 549,000 | | | 531,982 | |
| | Bank of Montreal, | | | | | | |
| | US Treasury Yield Curve Rate 5 Year + 1.4000%, 3.0880%, 1/10/37‡ | | 3,379,000 | | | 2,554,875 | |
| | BNP Paribas SA, SOFR + 1.2280%, 2.5910%, 1/20/28 (144A)‡ | | 800,000 | | | 703,602 | |
| | BNP Paribas SA, SOFR + 1.5610%, 3.1320%, 1/20/33 (144A)‡,# | | 672,000 | | | 530,587 | |
| | Citigroup Inc, ICE LIBOR USD 3 Month + 3.4660%, 5.3500%‡,µ | | 668,000 | | | 650,902 | |
| | Citigroup Inc, ICE LIBOR USD 3 Month + 3.9050%, 5.9500%‡,µ | | 877,000 | | | 789,914 | |
| | Citigroup Inc, ICE LIBOR USD 3 Month + 3.4230%, 6.3000%‡,µ | | 152,000 | | | 143,374 | |
| | Commonwealth Bank of Australia, 3.7840%, 3/14/32 (144A) | | 1,454,000 | | | 1,198,508 | |
| | Credit Suisse Group AG, SOFR + 5.0200%, 9.0160%, 11/15/33 (144A)‡ | | 1,542,000 | | | 1,578,803 | |
| | JPMorgan Chase & Co, SOFR + 1.7500%, 4.5650%, 6/14/30‡ | | 975,000 | | | 917,343 | |
| | |
See Notes to Schedule of Investments and Other Information and Notes to Financial Statements. |
| |
Janus Aspen Series | 11 |
Janus Henderson VIT Flexible Bond Portfolio
Schedule of Investments
December 31, 2022
| | | | | | | | |
Shares or
Principal Amounts | | | Value | |
Corporate Bonds– (continued) | | | |
Banking– (continued) | | | |
| | JPMorgan Chase & Co, SOFR + 2.5150%, 2.9560%, 5/13/31‡ | | $1,723,000 | | | $1,419,676 | |
| | JPMorgan Chase & Co, SOFR + 2.5800%, 5.7170%, 9/14/33‡ | | 642,000 | | | 626,626 | |
| | JPMorgan Chase & Co, SOFR + 3.3800%, 5.0000%‡,µ | | 548,000 | | | 501,382 | |
| | JPMorgan Chase & Co, SOFR + 3.1250%, 4.6000%‡,µ | | 579,000 | | | 510,244 | |
| | Mitsubishi UFJ Financial Group Inc, | | | | | | |
| | US Treasury Yield Curve Rate 1 Year + 1.7000%, 4.7880%, 7/18/25‡ | | 852,000 | | | 843,508 | |
| | Morgan Stanley, SOFR + 1.9900%, 2.1880%, 4/28/26‡ | | 1,856,000 | | | 1,724,716 | |
| | Morgan Stanley, SOFR + 0.8790%, 1.5930%, 5/4/27‡ | | 808,000 | | | 708,805 | |
| | Morgan Stanley, SOFR + 1.2900%, 2.9430%, 1/21/33‡ | | 2,545,000 | | | 2,058,850 | |
| | Morgan Stanley, SOFR + 1.3600%, 2.4840%, 9/16/36‡ | | 2,482,000 | | | 1,799,776 | |
| | SVB Financial Group, | | | | | | |
| | US Treasury Yield Curve Rate 5 Year + 3.0740%, 4.2500%‡,µ | | 2,508,000 | | | 1,645,370 | |
| | SVB Financial Group, | | | | | | |
| | US Treasury Yield Curve Rate 10 Year + 3.0640%, 4.1000%‡,#,µ | | 1,753,000 | | | 1,003,279 | |
| | SVB Financial Group, | | | | | | |
| | US Treasury Yield Curve Rate 5 Year + 3.2020%, 4.0000%‡,µ | | 324,000 | | | 213,846 | |
| | US Bancorp, SOFR + 2.1100%, 4.9670%, 7/22/33‡ | | 1,503,000 | | | 1,426,014 | |
| | Westpac Banking Corp, | | | | | | |
| | US Treasury Yield Curve Rate 5 Year + 1.7500%, 2.6680%, 11/15/35‡ | | 1,504,000 | | | 1,117,858 | |
| | | 31,250,556 | |
Brokerage – 0.2% | | | |
| | Pershing Square Holdings Ltd, 3.2500%, 10/1/31 (144A) | | 1,600,000 | | | 1,203,584 | |
Communications – 0% | | | |
| | Comcast Corp, 3.7500%, 4/1/40 | | 184,000 | | | 151,749 | |
Consumer Cyclical – 0% | | | |
| | GLP Capital LP / GLP Financing II Inc, 5.3000%, 1/15/29 | | 100,000 | | | 94,634 | |
Consumer Non-Cyclical – 2.6% | | | |
| | CSL Finance Ltd, 3.8500%, 4/27/27 (144A) | | 341,000 | | | 326,210 | |
| | GE Healthcare Holding LLC, 5.6500%, 11/15/27 (144A) | | 1,086,000 | | | 1,098,707 | |
| | GE Healthcare Holding LLC, 5.8570%, 3/15/30 (144A) | | 1,297,000 | | | 1,327,300 | |
| | GE Healthcare Holding LLC, 5.9050%, 11/22/32 (144A) | | 1,867,000 | | | 1,934,582 | |
| | Hasbro Inc, 3.9000%, 11/19/29 | | 4,008,000 | | | 3,561,847 | |
| | Hasbro Inc, 6.3500%, 3/15/40 | | 226,000 | | | 218,799 | |
| | Hasbro Inc, 5.1000%, 5/15/44 | | 929,000 | | | 790,856 | |
| | Illumina Inc, 5.7500%, 12/13/27 | | 1,679,000 | | | 1,699,913 | |
| | JBS USA LUX SA / JBS USA Food Co / JBS USA Finance Inc, | | | | | | |
| | 5.5000%, 1/15/30 (144A) | | 1,754,000 | | | 1,668,966 | |
| | JBS USA LUX SA / JBS USA Food Co / JBS USA Finance Inc, | | | | | | |
| | 3.6250%, 1/15/32 (144A) | | 649,000 | | | 525,690 | |
| | Pilgrim's Pride Corp, 3.5000%, 3/1/32 (144A) | | 1,362,000 | | | 1,065,765 | |
| | | 14,218,635 | |
Electric – 0.6% | | | |
| | CMS Energy Corp, | | | | | | |
| | US Treasury Yield Curve Rate 5 Year + 4.1160%, 4.7500%, 6/1/50‡ | | 1,351,000 | | | 1,168,560 | |
| | Duke Energy Corp, 4.3000%, 3/15/28 | | 899,000 | | | 865,039 | |
| | Southern California Edison Co, 5.8500%, 11/1/27 | | 1,171,000 | | | 1,205,295 | |
| | | 3,238,894 | |
Energy – 0.9% | | | |
| | Energy Transfer LP, 5.5500%, 2/15/28 | | 779,000 | | | 772,713 | |
| | Energy Transfer LP, 5.7500%, 2/15/33 | | 779,000 | | | 762,142 | |
| | Energy Transfer Operating LP, 4.9500%, 6/15/28 | | 172,000 | | | 166,321 | |
| | EQT Corp, 3.1250%, 5/15/26 (144A) | | 2,447,000 | | | 2,248,879 | |
| | EQT Corp, 5.7000%, 4/1/28 | | 403,000 | | | 400,835 | |
| | Hess Midstream Operations LP, 5.1250%, 6/15/28 (144A) | | 580,000 | | | 536,324 | |
| | | 4,887,214 | |
Finance Companies – 1.1% | | | |
| | AerCap Ireland Capital DAC / AerCap Global Aviation Trust, | | | | | | |
| | 4.6250%, 10/15/27 | | 1,382,000 | | | 1,283,551 | |
| | Ares Capital Corp, 2.8750%, 6/15/27 | | 1,106,000 | | | 937,360 | |
| | |
See Notes to Schedule of Investments and Other Information and Notes to Financial Statements. |
| |
12 | DECEMBER 31, 2022 |
Janus Henderson VIT Flexible Bond Portfolio
Schedule of Investments
December 31, 2022
| | | | | | | | |
Shares or
Principal Amounts | | | Value | |
Corporate Bonds– (continued) | | | |
Finance Companies– (continued) | | | |
| | Ares Capital Corp, 3.2000%, 11/15/31 | | $1,264,000 | | | $927,586 | |
| | OWL Rock Core Income Corp, 4.7000%, 2/8/27 | | 140,000 | | | 126,239 | |
| | OWL Rock Core Income Corp, 7.7500%, 9/16/27 (144A) | | 840,000 | | | 837,282 | |
| | Quicken Loans LLC, 3.6250%, 3/1/29 (144A) | | 852,000 | | | 675,157 | |
| | Quicken Loans LLC, 3.8750%, 3/1/31 (144A) | | 783,000 | | | 597,645 | |
| | Rocket Mortgage LLC / Rocket Mortgage Co-Issuer Inc, | | | | | | |
| | 4.0000%, 10/15/33 (144A) | | 731,000 | | | 545,955 | |
| | | 5,930,775 | |
Insurance – 1.5% | | | |
| | Athene Global Funding, 2.7170%, 1/7/29 (144A) | | 1,299,000 | | | 1,072,651 | |
| | Athene Global Funding, 2.6460%, 10/4/31 (144A) | | 2,486,000 | | | 1,899,191 | |
| | Brown & Brown Inc, 4.2000%, 3/17/32 | | 404,000 | | | 350,253 | |
| | Centene Corp, 4.2500%, 12/15/27 | | 3,107,000 | | | 2,913,941 | |
| | Centene Corp, 2.4500%, 7/15/28 | | 1,180,000 | | | 995,979 | |
| | Centene Corp, 3.0000%, 10/15/30 | | 1,023,000 | | | 838,603 | |
| | UnitedHealth Group Inc, 5.2500%, 2/15/28 | | 527,000 | | | 538,716 | |
| | | 8,609,334 | |
Real Estate Investment Trusts (REITs) – 0.4% | | | |
| | Agree LP, 2.9000%, 10/1/30 | | 1,220,000 | | | 990,380 | |
| | Sun Communities Operating LP, 2.7000%, 7/15/31 | | 1,501,000 | | | 1,184,770 | |
| | | 2,175,150 | |
Technology – 2.6% | | | |
| | Cadence Design Systems Inc, 4.3750%, 10/15/24 | | 3,327,000 | | | 3,299,919 | |
| | CoStar Group Inc, 2.8000%, 7/15/30 (144A) | | 1,018,000 | | | 831,390 | |
| | Marvell Technology Inc, 1.6500%, 4/15/26 | | 956,000 | | | 844,351 | |
| | Marvell Technology Inc, 4.8750%, 6/22/28 | | 1,296,000 | | | 1,235,239 | |
| | Microchip Technology Inc, 2.6700%, 9/1/23 | | 1,585,000 | | | 1,555,448 | |
| | Total System Services Inc, 4.8000%, 4/1/26 | | 2,881,000 | | | 2,803,170 | |
| | Trimble Inc, 4.7500%, 12/1/24 | | 2,018,000 | | | 1,994,842 | |
| | Trimble Inc, 4.9000%, 6/15/28 | | 838,000 | | | 803,492 | |
| | TSMC Arizona Corp, 3.8750%, 4/22/27 | | 876,000 | | | 842,111 | |
| | | 14,209,962 | |
Transportation – 0.2% | | | |
| | GXO Logistics Inc, 1.6500%, 7/15/26 | | 1,035,000 | | | 886,143 | |
Total Corporate Bonds (cost $98,401,526) | | 86,856,630 | |
Mortgage-Backed Securities– 25.3% | | | |
Fannie Mae: | | | |
| | 2.0000%, TBA, 15 Year Maturity | | 2,562,198 | | | 2,279,493 | |
| | 2.5000%, TBA, 15 Year Maturity | | 1,232,300 | | | 1,128,164 | |
| | 2.5000%, TBA, 30 Year Maturity | | 429,564 | | | 363,327 | |
| | 3.0000%, TBA, 30 Year Maturity | | 778,775 | | | 682,866 | |
| | 3.5000%, TBA, 30 Year Maturity | | 9,818,891 | | | 8,913,108 | |
| | 4.5000%, TBA, 30 Year Maturity | | 3,329,408 | | | 3,204,735 | |
| | 5.0000%, TBA, 30 Year Maturity | | 9,361,554 | | | 9,221,908 | |
| | 5.5000%, TBA, 30 Year Maturity | | 4,321,962 | | | 4,333,502 | |
| | | 30,127,103 | |
Fannie Mae Pool: | | | |
| | 3.0000%, 10/1/34 | | 96,260 | | | 90,740 | |
| | 2.5000%, 11/1/34 | | 146,106 | | | 134,479 | |
| | 3.0000%, 11/1/34 | | 23,162 | | | 21,834 | |
| | 3.0000%, 12/1/34 | | 24,452 | | | 23,049 | |
| | 6.0000%, 2/1/37 | | 66,724 | | | 69,838 | |
| | 4.5000%, 11/1/42 | | 45,801 | | | 45,334 | |
| | 3.0000%, 1/1/43 | | 19,711 | | | 17,853 | |
| | 3.0000%, 2/1/43 | | 20,874 | | | 18,907 | |
| | 3.0000%, 5/1/43 | | 146,097 | | | 132,305 | |
| | 5.0000%, 7/1/44 | | 334,427 | | | 338,363 | |
| | 4.5000%, 10/1/44 | | 104,691 | | | 104,443 | |
| | |
See Notes to Schedule of Investments and Other Information and Notes to Financial Statements. |
| |
Janus Aspen Series | 13 |
Janus Henderson VIT Flexible Bond Portfolio
Schedule of Investments
December 31, 2022
| | | | | | | | |
Shares or
Principal Amounts | | | Value | |
Mortgage-Backed Securities– (continued) | | | |
Fannie Mae Pool– (continued) | | | |
| | 4.5000%, 3/1/45 | | $160,225 | | | $159,846 | |
| | 4.5000%, 6/1/45 | | 80,759 | | | 79,877 | |
| | 3.5000%, 12/1/45 | | 111,021 | | | 102,823 | |
| | 4.5000%, 2/1/46 | | 158,066 | | | 156,454 | |
| | 3.5000%, 7/1/46 | | 563,712 | | | 527,208 | |
| | 3.0000%, 9/1/46 | | 428,729 | | | 388,255 | |
| | 3.0000%, 2/1/47 | | 5,429,166 | | | 4,916,627 | |
| | 3.5000%, 3/1/47 | | 97,563 | | | 90,359 | |
| | 3.5000%, 7/1/47 | | 86,439 | | | 80,056 | |
| | 3.5000%, 8/1/47 | | 156,435 | | | 144,644 | |
| | 4.0000%, 10/1/47 | | 236,457 | | | 225,594 | |
| | 3.5000%, 1/1/48 | | 125,718 | | | 117,361 | |
| | 4.0000%, 1/1/48 | | 891,140 | | | 863,657 | |
| | 3.0000%, 2/1/48 | | 91,497 | | | 83,195 | |
| | 4.0000%, 3/1/48 | | 266,574 | | | 257,762 | |
| | 5.0000%, 5/1/48 | | 80,171 | | | 80,107 | |
| | 4.5000%, 6/1/48 | | 240,961 | | | 235,921 | |
| | 3.5000%, 7/1/48 | | 2,201,009 | | | 2,035,417 | |
| | 4.0000%, 7/1/48 | | 291,293 | | | 277,670 | |
| | 4.0000%, 10/1/48 | | 109,494 | | | 105,072 | |
| | 4.0000%, 11/1/48 | | 338,499 | | | 322,668 | |
| | 4.0000%, 12/1/48 | | 54,009 | | | 51,483 | |
| | 4.0000%, 6/1/49 | | 43,620 | | | 41,490 | |
| | 4.5000%, 6/1/49 | | 22,685 | | | 22,188 | |
| | 3.0000%, 8/1/49 | | 169,181 | | | 150,217 | |
| | 4.5000%, 8/1/49 | | 31,103 | | | 30,422 | |
| | 3.0000%, 9/1/49 | | 45,179 | | | 40,789 | |
| | 4.0000%, 11/1/49 | | 703,949 | | | 671,025 | |
| | 4.0000%, 11/1/49 | | 62,969 | | | 60,324 | |
| | 3.5000%, 12/1/49 | | 1,799,022 | | | 1,663,424 | |
| | 4.5000%, 1/1/50 | | 575,307 | | | 563,273 | |
| | 4.5000%, 1/1/50 | | 43,562 | | | 42,609 | |
| | 4.0000%, 3/1/50 | | 1,030,775 | | | 989,145 | |
| | 4.0000%, 3/1/50 | | 559,175 | | | 533,023 | |
| | 4.0000%, 3/1/50 | | 213,375 | | | 203,395 | |
| | 2.5000%, 8/1/50 | | 159,107 | | | 137,205 | |
| | 4.0000%, 9/1/50 | | 1,185,935 | | | 1,128,038 | |
| | 4.0000%, 10/1/50 | | 1,134,336 | | | 1,086,688 | |
| | 4.5000%, 10/1/50 | | 706,699 | | | 691,915 | |
| | 4.0000%, 3/1/51 | | 2,904,258 | | | 2,762,473 | |
| | 4.0000%, 3/1/51 | | 56,020 | | | 53,285 | |
| | 4.0000%, 3/1/51 | | 27,303 | | | 26,026 | |
| | 4.0000%, 10/1/51 | | 413,403 | | | 393,221 | |
| | 3.0000%, 12/1/51 | | 1,657,420 | | | 1,471,530 | |
| | 2.5000%, 1/1/52 | | 960,033 | | | 821,621 | |
| | 2.5000%, 2/1/52 | | 4,660,939 | | | 3,984,248 | |
| | 2.5000%, 3/1/52 | | 2,001,136 | | | 1,709,197 | |
| | 2.5000%, 3/1/52 | | 1,926,249 | | | 1,646,590 | |
| | 2.5000%, 3/1/52 | | 710,022 | | | 607,159 | |
| | 2.5000%, 3/1/52 | | 164,054 | | | 140,032 | |
| | 2.5000%, 3/1/52 | | 161,451 | | | 137,898 | |
| | 2.5000%, 3/1/52 | | 139,166 | | | 118,962 | |
| | 2.5000%, 3/1/52 | | 55,740 | | | 47,705 | |
| | 3.0000%, 3/1/52 | | 780,422 | | | 690,812 | |
| | 3.5000%, 3/1/52 | | 1,016,007 | | | 934,322 | |
| | 3.0000%, 4/1/52 | | 657,454 | | | 583,606 | |
| | 3.0000%, 4/1/52 | | 577,466 | | | 510,983 | |
| | 3.5000%, 4/1/52 | | 569,708 | | | 520,983 | |
| | 3.5000%, 4/1/52 | | 388,222 | | | 357,888 | |
| | |
See Notes to Schedule of Investments and Other Information and Notes to Financial Statements. |
| |
14 | DECEMBER 31, 2022 |
Janus Henderson VIT Flexible Bond Portfolio
Schedule of Investments
December 31, 2022
| | | | | | | | |
Shares or
Principal Amounts | | | Value | |
Mortgage-Backed Securities– (continued) | | | |
Fannie Mae Pool– (continued) | | | |
| | 3.5000%, 4/1/52 | | $322,031 | | | $294,263 | |
| | 3.5000%, 4/1/52 | | 195,326 | | | 178,621 | |
| | 3.5000%, 4/1/52 | | 116,955 | | | 106,885 | |
| | 3.5000%, 4/1/52 | | 93,618 | | | 85,546 | |
| | 4.0000%, 4/1/52 | | 421,818 | | | 400,378 | |
| | 4.5000%, 4/1/52 | | 82,619 | | | 79,595 | |
| | 4.5000%, 4/1/52 | | 63,585 | | | 61,258 | |
| | 4.5000%, 4/1/52 | | 36,468 | | | 35,134 | |
| | 4.5000%, 4/1/52 | | 33,096 | | | 31,885 | |
| | 4.5000%, 4/1/52 | | 28,950 | | | 27,890 | |
| | 4.5000%, 4/1/52 | | 18,640 | | | 17,942 | |
| | 3.5000%, 5/1/52 | | 463,448 | | | 425,899 | |
| | 3.5000%, 5/1/52 | | 308,349 | | | 281,930 | |
| | 4.5000%, 5/1/52 | | 100,871 | | | 97,180 | |
| | 3.5000%, 6/1/52 | | 1,656,337 | | | 1,525,377 | |
| | 3.5000%, 6/1/52 | | 938,743 | | | 866,136 | |
| | 4.0000%, 6/1/52 | | 327,107 | | | 306,886 | |
| | 4.0000%, 6/1/52 | | 87,641 | | | 82,223 | |
| | 3.5000%, 7/1/52 | | 2,108,529 | | | 1,937,042 | |
| | 3.5000%, 7/1/52 | | 239,799 | | | 220,839 | |
| | 3.5000%, 7/1/52 | | 84,688 | | | 78,112 | |
| | 4.0000%, 7/1/52 | | 139,820 | | | 131,176 | |
| | 4.5000%, 7/1/52 | | 418,860 | | | 403,768 | |
| | 3.5000%, 8/1/52 | | 413,261 | | | 379,522 | |
| | 3.5000%, 8/1/52 | | 153,029 | | | 140,882 | |
| | 4.5000%, 8/1/52 | | 1,605,992 | | | 1,548,127 | |
| | 5.5000%, 9/1/52 | | 2,057,802 | | | 2,071,599 | |
| | 5.0000%, 10/1/52 | | 327,027 | | | 326,371 | |
| | 5.0000%, 10/1/52 | | 146,188 | | | 145,894 | |
| | 5.5000%, 10/1/52 | | 2,841,844 | | | 2,893,677 | |
| | 4.5000%, 11/1/52 | | 586,724 | | | 573,522 | |
| | 5.0000%, 11/1/52 | | 813,304 | | | 811,672 | |
| | 5.5000%, 11/1/52 | | 741,735 | | | 755,264 | |
| | 4.5000%, 12/1/52 | | 500,731 | | | 484,432 | |
| | 3.5000%, 8/1/56 | | 1,614,481 | | | 1,502,418 | |
| | 3.0000%, 2/1/57 | | 1,128,100 | | | 1,004,814 | |
| | 3.0000%, 6/1/57 | | 5,364 | | | 4,777 | |
| | | 58,191,848 | |
Freddie Mac Gold Pool: | | | |
| | 3.5000%, 1/1/47 | | 68,101 | | | 63,777 | |
Freddie Mac Pool: | | | |
| | 3.0000%, 5/1/31 | | 885,064 | | | 838,519 | |
| | 3.0000%, 9/1/32 | | 170,497 | | | 161,445 | |
| | 3.0000%, 10/1/32 | | 52,936 | | | 50,125 | |
| | 3.0000%, 1/1/33 | | 109,906 | | | 104,071 | |
| | 2.5000%, 12/1/33 | | 1,022,518 | | | 952,675 | |
| | 3.0000%, 10/1/34 | | 227,164 | | | 214,131 | |
| | 3.0000%, 10/1/34 | | 104,062 | | | 98,091 | |
| | 2.5000%, 11/1/34 | | 148,088 | | | 136,301 | |
| | 2.5000%, 11/1/34 | | 113,286 | | | 104,270 | |
| | 6.0000%, 4/1/40 | | 99,710 | | | 104,510 | |
| | 3.5000%, 7/1/42 | | 5,891 | | | 5,512 | |
| | 3.5000%, 8/1/42 | | 6,574 | | | 6,150 | |
| | 3.5000%, 8/1/42 | | 6,027 | | | 5,638 | |
| | 3.5000%, 2/1/43 | | 190,159 | | | 177,822 | |
| | 3.0000%, 3/1/43 | | 196,158 | | | 177,639 | |
| | 3.0000%, 6/1/43 | | 9,268 | | | 8,282 | |
| | 3.5000%, 2/1/44 | | 323,547 | | | 302,557 | |
| | 4.5000%, 5/1/44 | | 71,375 | | | 70,595 | |
| | |
See Notes to Schedule of Investments and Other Information and Notes to Financial Statements. |
| |
Janus Aspen Series | 15 |
Janus Henderson VIT Flexible Bond Portfolio
Schedule of Investments
December 31, 2022
| | | | | | | | |
Shares or
Principal Amounts | | | Value | |
Mortgage-Backed Securities– (continued) | | | |
Freddie Mac Pool– (continued) | | | |
| | 3.0000%, 1/1/45 | | $307,981 | | | $278,325 | |
| | 4.0000%, 2/1/46 | | 267,255 | | | 257,625 | |
| | 3.5000%, 7/1/46 | | 187,036 | | | 174,675 | |
| | 4.0000%, 3/1/47 | | 65,555 | | | 63,196 | |
| | 3.0000%, 4/1/47 | | 191,969 | | | 172,296 | |
| | 3.5000%, 2/1/48 | | 98,825 | | | 92,080 | |
| | 4.0000%, 4/1/48 | | 243,905 | | | 234,785 | |
| | 4.5000%, 7/1/48 | | 44,167 | | | 43,243 | |
| | 5.0000%, 9/1/48 | | 11,508 | | | 11,499 | |
| | 4.0000%, 11/1/48 | | 30,548 | | | 29,120 | |
| | 4.0000%, 12/1/48 | | 364,901 | | | 347,836 | |
| | 4.5000%, 6/1/49 | | 22,657 | | | 22,161 | |
| | 4.5000%, 7/1/49 | | 200,901 | | | 196,506 | |
| | 4.5000%, 7/1/49 | | 34,483 | | | 33,729 | |
| | 3.0000%, 8/1/49 | | 57,446 | | | 51,007 | |
| | 4.5000%, 8/1/49 | | 176,043 | | | 172,192 | |
| | 3.0000%, 12/1/49 | | 143,564 | | | 127,471 | |
| | 3.0000%, 12/1/49 | | 75,216 | | | 66,784 | |
| | 4.5000%, 1/1/50 | | 119,697 | | | 117,078 | |
| | 4.5000%, 1/1/50 | | 33,895 | | | 33,153 | |
| | 4.0000%, 3/1/50 | | 357,673 | | | 340,946 | |
| | 4.0000%, 6/1/50 | | 576,245 | | | 553,877 | |
| | 2.5000%, 8/1/50 | | 77,876 | | | 67,180 | |
| | 2.5000%, 8/1/50 | | 27,746 | | | 23,927 | |
| | 2.5000%, 9/1/50 | | 146,767 | | | 126,518 | |
| | 4.5000%, 9/1/50 | | 1,079,169 | | | 1,056,594 | |
| | 4.0000%, 10/1/50 | | 104,253 | | | 99,164 | |
| | 2.5000%, 11/1/51 | | 789,192 | | | 677,403 | |
| | 2.5000%, 1/1/52 | | 297,884 | | | 255,352 | |
| | 2.5000%, 1/1/52 | | 183,165 | | | 156,824 | |
| | 2.5000%, 2/1/52 | | 430,364 | | | 367,883 | |
| | 3.0000%, 2/1/52 | | 207,838 | | | 184,038 | |
| | 3.0000%, 2/1/52 | | 157,026 | | | 139,499 | |
| | 2.5000%, 3/1/52 | | 67,878 | | | 57,973 | |
| | 3.0000%, 3/1/52 | | 267,025 | | | 237,126 | |
| | 4.5000%, 3/1/52 | | 15,685 | | | 15,111 | |
| | 3.5000%, 4/1/52 | | 224,264 | | | 205,084 | |
| | 3.5000%, 4/1/52 | | 215,408 | | | 196,986 | |
| | 3.5000%, 4/1/52 | | 77,029 | | | 70,396 | |
| | 3.5000%, 4/1/52 | | 67,484 | | | 61,665 | |
| | 3.5000%, 6/1/52 | | 956,764 | | | 879,548 | |
| | 3.5000%, 7/1/52 | | 3,358,148 | | | 3,085,043 | |
| | 4.0000%, 7/1/52 | | 314,266 | | | 294,844 | |
| | 4.0000%, 8/1/52 | | 358,148 | | | 336,166 | |
| | 4.5000%, 8/1/52 | | 3,552,437 | | | 3,424,492 | |
| | 4.5000%, 8/1/52 | | 1,511,558 | | | 1,459,844 | |
| | 4.5000%, 8/1/52 | | 771,991 | | | 744,187 | |
| | 5.5000%, 9/1/52 | | 519,629 | | | 526,850 | |
| | 4.5000%, 10/1/52 | | 706,232 | | | 690,347 | |
| | 5.0000%, 10/1/52 | | 1,004,940 | | | 1,002,924 | |
| | 5.0000%, 10/1/52 | | 652,119 | | | 650,811 | |
| | 5.0000%, 10/1/52 | | 19,739 | | | 19,700 | |
| | 5.5000%, 11/1/52 | | 2,288,448 | | | 2,330,198 | |
| | | 26,381,594 | |
Ginnie Mae: | | | |
| | 2.5000%, TBA, 30 Year Maturity | | 5,481,176 | | | 4,734,355 | |
| | 3.5000%, TBA, 30 Year Maturity | | 3,957,668 | | | 3,629,265 | |
| | 4.0000%, TBA, 30 Year Maturity | | 4,413,896 | | | 4,172,244 | |
| | |
See Notes to Schedule of Investments and Other Information and Notes to Financial Statements. |
| |
16 | DECEMBER 31, 2022 |
Janus Henderson VIT Flexible Bond Portfolio
Schedule of Investments
December 31, 2022
| | | | | | | | |
Shares or
Principal Amounts | | | Value | |
Mortgage-Backed Securities– (continued) | | | |
Ginnie Mae– (continued) | | | |
| | 4.5000%, TBA, 30 Year Maturity | | $4,303,442 | | | $4,170,212 | |
| | | 16,706,076 | |
Ginnie Mae I Pool: | | | |
| | 4.0000%, 1/15/45 | | 1,042,435 | | | 1,010,805 | |
| | 4.5000%, 8/15/46 | | 1,240,108 | | | 1,216,944 | |
| | 4.0000%, 8/15/47 | | 39,779 | | | 38,235 | |
| | 4.0000%, 11/15/47 | | 40,686 | | | 39,107 | |
| | 4.0000%, 12/15/47 | | 115,688 | | | 111,199 | |
| | | 2,416,290 | |
Ginnie Mae II Pool: | | | |
| | 4.0000%, 8/20/47 | | 124,193 | | | 119,313 | |
| | 4.0000%, 8/20/47 | | 32,778 | | | 31,490 | |
| | 4.0000%, 8/20/47 | | 15,233 | | | 14,634 | |
| | 4.5000%, 2/20/48 | | 162,335 | | | 159,316 | |
| | 4.0000%, 5/20/48 | | 201,487 | | | 192,999 | |
| | 4.5000%, 5/20/48 | | 179,992 | | | 176,655 | |
| | 4.5000%, 5/20/48 | | 51,536 | | | 50,580 | |
| | 4.0000%, 6/20/48 | | 297,887 | | | 285,338 | |
| | 5.0000%, 8/20/48 | | 264,576 | | | 265,054 | |
| | 3.0000%, 7/20/51 | | 1,396,295 | | | 1,247,368 | |
| | 3.0000%, 8/20/51 | | 3,807,079 | | | 3,399,961 | |
| | | 5,942,708 | |
Total Mortgage-Backed Securities (cost $147,025,193) | | 139,829,396 | |
United States Treasury Notes/Bonds– 33.3% | | | |
| | 4.3750%, 10/31/24 | | 19,395,000 | | | 19,339,694 | |
| | 4.5000%, 11/15/25 | | 1,775,000 | | | 1,785,678 | |
| | 1.2500%, 11/30/26 | | 2,897,300 | | | 2,599,761 | |
| | 1.2500%, 12/31/26 | | 3,166,000 | | | 2,835,178 | |
| | 4.1250%, 9/30/27 | | 13,758,600 | | | 13,810,195 | |
| | 4.1250%, 10/31/27 | | 14,998,800 | | | 15,053,874 | |
| | 3.8750%, 11/30/27 | | 22,708,200 | | | 22,584,015 | |
| | 1.1250%, 8/31/28 | | 8,600,600 | | | 7,343,434 | |
| | 3.8750%, 11/30/29 | | 10,736,000 | | | 10,663,867 | |
| | 4.1250%, 11/15/32 | | 29,151,300 | | | 29,766,206 | |
| | 1.7500%, 8/15/41 | | 12,511,000 | | | 8,561,727 | |
| | 2.0000%, 11/15/41 | | 10,115,000 | | | 7,222,347 | |
| | 2.3750%, 2/15/42 | | 6,069,000 | | | 4,633,776 | |
| | 4.0000%, 11/15/42# | | 18,376,000 | | | 17,991,252 | |
| | 3.0000%, 8/15/52 | | 24,179,000 | | | 19,921,229 | |
Total United States Treasury Notes/Bonds (cost $193,785,269) | | 184,112,233 | |
Investment Companies– 11.3% | | | |
Money Markets – 11.3% | | | |
| | Janus Henderson Cash Liquidity Fund LLC, 4.2633%ºº,£((cost $62,109,427) | | 62,103,948 | | | 62,116,369 | |
Investments Purchased with Cash Collateral from Securities Lending– 3.5% | | | |
Investment Companies – 2.8% | | | |
| | Janus Henderson Cash Collateral Fund LLC, 4.1397%ºº,£ | | 15,117,312 | | | 15,117,312 | |
Time Deposits – 0.7% | | | |
| | Royal Bank of Canada, 4.3100%, 1/3/23 | | $3,898,765 | | | 3,898,765 | |
Total Investments Purchased with Cash Collateral from Securities Lending (cost $19,016,077) | | 19,016,077 | |
Total Investments (total cost $652,984,644) – 111.4% | | 615,310,934 | |
Liabilities, net of Cash, Receivables and Other Assets – (11.4)% | | (62,805,566) | |
Net Assets – 100% | | $552,505,368 | |
| | |
See Notes to Schedule of Investments and Other Information and Notes to Financial Statements. |
| |
Janus Aspen Series | 17 |
Janus Henderson VIT Flexible Bond Portfolio
Schedule of Investments
December 31, 2022
| | | | | | |
Summary of Investments by Country - (Long Positions) (unaudited) |
| |
| | | | | % of | |
| | | | | Investment | |
Country | | Value | | Securities | |
United States | | $603,127,737 | | 98.0 | % |
Australia | | 2,642,576 | | 0.4 | |
Canada | | 2,554,875 | | 0.4 | |
Switzerland | | 1,578,803 | | 0.3 | |
Ireland | | 1,283,551 | | 0.2 | |
France | | 1,234,189 | | 0.2 | |
Guernsey | | 1,203,584 | | 0.2 | |
Japan | | 843,508 | | 0.2 | |
Taiwan | | 842,111 | | 0.1 | |
| | | | | | |
| | | | | | |
Total | | $615,310,934 | | 100.0 | % |
| | |
See Notes to Schedule of Investments and Other Information and Notes to Financial Statements. |
| |
18 | DECEMBER 31, 2022 |
Janus Henderson VIT Flexible Bond Portfolio
Schedule of Investments
December 31, 2022
Schedules of Affiliated Investments – (% of Net Assets)
| | | | | | | | | | | |
| | Dividend Income | Realized Gain/(Loss) | Change in Unrealized Appreciation/ Depreciation | Value at 12/31/22 |
Investment Companies - 11.3% |
Money Markets - 11.3% | |
| | Janus Henderson Cash Liquidity Fund LLC, 4.2633%ºº | $ | 1,094,922 | $ | (90) | $ | 5,831 | $ | 62,116,369 |
Investments Purchased with Cash Collateral from Securities Lending - 2.8% |
Investment Companies - 2.8% | |
| | Janus Henderson Cash Collateral Fund LLC, 4.1397%ºº | | 38,111∆ | | - | | - | | 15,117,312 |
Total Affiliated Investments - 14.1% | $ | 1,133,033 | $ | (90) | $ | 5,831 | $ | 77,233,681 |
| | | | | | | | | | | |
| | Value at 12/31/21 | Purchases | Sales Proceeds | Value at 12/31/22 |
Investment Companies - 11.3% |
Money Markets - 11.3% | |
| | Janus Henderson Cash Liquidity Fund LLC, 4.2633%ºº | | 85,015,569 | | 364,286,902 | | (387,191,843) | | 62,116,369 |
Investments Purchased with Cash Collateral from Securities Lending - 2.8% |
Investment Companies - 2.8% | |
| | Janus Henderson Cash Collateral Fund LLC, 4.1397%ºº | | - | | 111,989,373 | | (96,872,061) | | 15,117,312 |
Schedule of Futures
| | | | | | | | | | | | | | | |
Description | | Number of Contracts | | Expiration Date | | Notional Amount | | Value and Unrealized Appreciation/(Depreciation) | | |
Futures Long: | | | | | | | | | | |
10 Year US Treasury Note | | 112 | | 3/31/23 | $ | 12,577,250 | $ | (118,125) | |
2 Year US Treasury Note | | 378 | | 4/5/23 | | 77,519,532 | | 44,297 | |
5 Year US Treasury Note | | 99 | | 4/5/23 | | 10,685,039 | | (17,375) | |
Ultra Long Term US Treasury Bond | | 50 | | 3/31/23 | | 6,715,625 | | (171,819) | |
Total - Futures Long | | | | | | | | (263,022) | |
Futures Short: | | | | | | | | | | |
Ultra 10-Year Treasury Note | | 43 | | 3/31/23 | | (5,086,094) | | 64,164 | |
Total | | | | | | | $ | (198,858) | | |
| | |
See Notes to Schedule of Investments and Other Information and Notes to Financial Statements. |
| |
Janus Aspen Series | 19 |
Janus Henderson VIT Flexible Bond Portfolio
Schedule of Investments
December 31, 2022
The following table, grouped by derivative type, provides information about the fair value and location of derivatives within the Statement of Assets and Liabilities as of December 31, 2022.
| | | | | | |
Fair Value of Derivative Instruments (not accounted for as hedging instruments) as of December 31, 2022 |
| | | | | |
| | | | | Interest Rate
Contracts |
Asset Derivatives: | | | |
*Futures contracts | | | $ 108,461 |
| | | | |
Liability Derivatives: | | | |
*Futures contracts | | | $ 307,319 |
| | | | |
*The fair value presented includes net cumulative unrealized appreciation (depreciation) on futures contracts and centrally cleared swaps. In the Statement of Assets and Liabilities, only current day's variation margin is reported in receivables or payables and the net cumulative unrealized appreciation (depreciation) is included in total distributable earnings (loss). |
The following tables provides information about the effect of derivatives and hedging activities on the Portfolio’s Statement of Operations for the year ended December 31, 2022.
| | | | | |
The effect of Derivative Instruments (not accounted for as hedging instruments) on the Statement of Operations for the year ended December 31, 2022 |
| | | | |
Amount of Realized Gain/(Loss) Recognized on Derivatives |
Derivative | | Interest Rate
Contracts |
Futures contracts | | $ (3,875,467) |
| | | | | |
| | | | | |
| | | | | |
Amount of Change in Unrealized Appreciation/Depreciation Recognized on Derivatives |
Derivative | | Interest Rate
Contracts |
Futures contracts | | $ (204,640) |
| | | | | |
Please see the "Net Realized Gain/(Loss) on Investments" and "Change in Unrealized Net Appreciation/Depreciation" sections of the Portfolio’s Statement of Operations.
| | |
Average Ending Monthly Value of Derivative Instruments During the Year Ended December 31, 2022 |
| |
| |
Futures contracts: | |
Average notional amount of contracts - long | $71,621,370 |
Average notional amount of contracts - short | 11,780,529 |
| | |
| |
| |
| |
| | |
See Notes to Schedule of Investments and Other Information and Notes to Financial Statements. |
| |
20 | DECEMBER 31, 2022 |
Janus Henderson VIT Flexible Bond Portfolio
Schedule of Investments
December 31, 2022
| | | | | | | | | | |
Offsetting of Financial Assets and Derivative Assets |
| |
| | | Gross Amounts | | | | | | |
| | | of Recognized | | Offsetting Asset | | Collateral | | |
Counterparty | | Assets | | or Liability(a) | | Pledged(b) | | Net Amount |
| | | | | | | | | |
JPMorgan Chase Bank, National Association | $ | 18,390,503 | $ | — | $ | (18,390,503) | $ | — |
| | | | | | | | | |
(a) | Represents the amount of assets or liabilities that could be offset with the same counterparty under master netting or similar agreements that management elects not to offset on the Statement of Assets and Liabilities. |
(b) | Collateral pledged is limited to the net outstanding amount due to/from an individual counterparty. The actual collateral amounts pledged may exceed these amounts and may fluctuate in value. |
| | |
See Notes to Schedule of Investments and Other Information and Notes to Financial Statements. |
| |
Janus Aspen Series | 21 |
Janus Henderson VIT Flexible Bond Portfolio
Notes to Schedule of Investments and Other Information
| | |
Bloomberg U.S. Aggregate Bond Index | Bloomberg U.S. Aggregate Bond Index is a broad-based measure of the investment grade, US dollar-denominated, fixed-rate taxable bond market. |
| | |
ICE | Intercontinental Exchange |
LIBOR | London Interbank Offered Rate |
LLC | Limited Liability Company |
LP | Limited Partnership |
SOFR | Secured Overnight Financing Rate |
TBA | (To Be Announced) Securities are purchased/sold on a forward commitment basis with an approximate principal amount and no defined maturity date. The actual principal and maturity date will be determined upon settlement when specific mortgage pools are assigned. |
| | |
144A | Securities sold under Rule 144A of the Securities Act of 1933, as amended, are subject to legal and/or contractual restrictions on resale and may not be publicly sold without registration under the 1933 Act. Unless otherwise noted, these securities have been determined to be liquid under guidelines established by the Board of Trustees. The total value of 144A securities as of the year ended December 31, 2022 is $135,690,638, which represents 24.6% of net assets. |
| | |
‡ | Variable or floating rate security. Rate shown is the current rate as of December 31, 2022. Certain variable rate securities are not based on a published reference rate and spread; they are determined by the issuer or agent and current market conditions. Reference rate is as of reset date and may vary by security, which may not indicate a reference rate and/or spread in their description. |
| | |
ºº | Rate shown is the 7-day yield as of December 31, 2022. |
| | |
# | Loaned security; a portion of the security is on loan at December 31, 2022. |
| | |
µ | Perpetual security. Perpetual securities have no stated maturity date, but they may be called/redeemed by the issuer. The date indicated, if any, represents the next call date. |
| | |
Ç | Step bond. The coupon rate will increase or decrease periodically based upon a predetermined schedule. The rate shown reflects the current rate. |
| | |
£ | The Portfolio may invest in certain securities that are considered affiliated companies. As defined by the Investment Company Act of 1940, as amended, an affiliated company is one in which the Portfolio owns 5% or more of the outstanding voting securities, or a company which is under common ownership or control. |
| | |
∆ | Net of income paid to the securities lending agent and rebates paid to the borrowing counterparties. |
Janus Henderson VIT Flexible Bond Portfolio
Notes to Schedule of Investments and Other Information
| | | | | | | | | | | | | | |
The following is a summary of the inputs that were used to value the Portfolio’s investments in securities and other financial instruments as of December 31, 2022. See Notes to Financial Statements for more information. |
| |
Valuation Inputs Summary |
| | | | | | | |
| | | | | Level 2 - | | Level 3 - |
| | | Level 1 - | | Other Significant | | Significant |
| | | Quoted Prices | | Observable Inputs | | Unobservable Inputs |
| | | | | | | |
Assets | | | | | | |
Investments In Securities: | | | | | | |
Asset-Backed/Commercial Mortgage-Backed Securities | $ | - | $ | 123,380,229 | $ | - |
Corporate Bonds | | - | | 86,856,630 | | - |
Mortgage-Backed Securities | | - | | 139,829,396 | | - |
United States Treasury Notes/Bonds | | - | | 184,112,233 | | - |
Investment Companies | | - | | 62,116,369 | | - |
Investments Purchased with Cash Collateral from Securities Lending | | - | | 19,016,077 | | - |
Total Investments in Securities | $ | - | $ | 615,310,934 | $ | - |
Other Financial Instruments(a): | | | | | | |
Futures Contracts | | 108,461 | | - | | - |
Total Assets | $ | 108,461 | $ | 615,310,934 | $ | - |
Liabilities | | | | | | |
Other Financial Instruments(a): | | | | | | |
Futures Contracts | $ | 307,319 | $ | - | $ | - |
| | | | | | | |
(a) | Other financial instruments may include forward foreign currency exchange contracts, futures, written options, written swaptions, and swap contracts. Forward foreign currency exchange contracts, futures contracts, and swap contracts are reported at their unrealized appreciation/(depreciation) at measurement date, which represents the change in the contract's value from trade date. Written options and written swaptions are reported at their market value at measurement date. |
Janus Henderson VIT Flexible Bond Portfolio
Statement of Assets and Liabilities
December 31, 2022
| | | | | | | |
| | | | | | |
Assets: | | | | |
| Unaffiliated investments, at value (cost $575,757,905)(1) | | $ | 538,077,253 | |
| Affiliated investments, at value (cost $77,226,739) | | | 77,233,681 | |
| Deposits with brokers for futures | | | 1,090,000 | |
| Variation margin receivable on futures contracts | | | 2,688 | |
| Trustees' deferred compensation | | | 17,913 | |
| Receivables: | | | | |
| | Interest | | | 2,867,249 | |
| | Portfolio shares sold | | | 570,133 | |
| | Dividends from affiliates | | | 226,093 | |
| Other assets | | | 30,501 | |
Total Assets | | | 620,115,511 | |
Liabilities: | | | | |
| Due to custodian | | | 125,896 | |
| Collateral for securities loaned (Note 3) | | | 19,016,077 | |
| Variation margin payable on futures contracts | | | 108,320 | |
| Payables: | | | — | |
| | TBA investments purchased | | | 47,691,367 | |
| | Advisory fees | | | 234,864 | |
| | Portfolio shares repurchased | | | 155,539 | |
| | 12b-1 Distribution and shareholder servicing fees | | | 101,717 | |
| | Professional fees | | | 51,163 | |
| | Transfer agent fees and expenses | | | 26,535 | |
| | Trustees' deferred compensation fees | | | 17,913 | |
| | Custodian fees | | | 1,778 | |
| | Affiliated portfolio administration fees payable | | | 1,264 | |
| | Trustees' fees and expenses | | | 575 | |
| | Accrued expenses and other payables | | | 77,135 | |
Total Liabilities | | | 67,610,143 | |
Net Assets | | $ | 552,505,368 | |
Net Assets Consist of: | | | | |
| Capital (par value and paid-in surplus) | | $ | 652,654,690 | |
| Total distributable earnings (loss) | | | (100,149,322) | |
Total Net Assets | | $ | 552,505,368 | |
Net Assets - Institutional Shares | | $ | 107,681,611 | |
| Shares Outstanding, $0.001 Par Value (unlimited shares authorized) | | | 10,832,422 | |
Net Asset Value Per Share | | $ | 9.94 | |
Net Assets - Service Shares | | $ | 444,823,757 | |
| Shares Outstanding, $0.001 Par Value (unlimited shares authorized) | | | 40,462,781 | |
Net Asset Value Per Share | | $ | 10.99 | |
| |
(1) Includes $18,390,503 of securities on loan. See Note 3 in Notes to Financial Statements. |
| | |
See Notes to Financial Statements. |
| |
24 | DECEMBER 31, 2022 |
Janus Henderson VIT Flexible Bond Portfolio
Statement of Operations
For the year ended December 31, 2022
| | | | | | |
| | | | | |
Investment Income: | | | |
| Interest | $ | 16,167,889 | |
| Dividends from affiliates | | 1,094,922 | |
| Affiliated securities lending income, net | | 38,111 | |
| Unaffiliated securities lending income, net | | 9,475 | |
| Other income | | 167,494 | |
Total Investment Income | | 17,477,891 | |
Expenses: | | | |
| Advisory fees | | 2,966,310 | |
| 12b-1 Distribution and shareholder servicing fees: | | | |
| | Service Shares | | 1,191,908 | |
| Transfer agent administrative fees and expenses: | | | |
| | Institutional Shares | | 57,686 | |
| | Service Shares | | 238,571 | |
| Other transfer agent fees and expenses: | | | |
| | Institutional Shares | | 2,742 | |
| | Service Shares | | 5,970 | |
| Professional fees | | 58,283 | |
| Shareholder reports expense | | 43,608 | |
| Registration fees | | 27,528 | |
| Affiliated portfolio administration fees | | 14,813 | |
| Trustees’ fees and expenses | | 14,356 | |
| Custodian fees | | 11,911 | |
| Other expenses | | 85,008 | |
Total Expenses | | 4,718,694 | |
Less: Excess Expense Reimbursement and Waivers | | (121,274) | |
Net Expenses | | 4,597,420 | |
Net Investment Income/(Loss) | | 12,880,471 | |
Net Realized Gain/(Loss) on Investments: | | | |
| Investments | | (58,694,269) | |
| Investments in affiliates | | (90) | |
| Futures contracts | | (3,875,467) | |
Total Net Realized Gain/(Loss) on Investments | | (62,569,826) | |
Change in Unrealized Net Appreciation/Depreciation: | | | |
| Investments and Trustees’ deferred compensation | | (42,493,302) | |
| Investments in affiliates | | 5,831 | |
| Futures contracts | | (204,640) | |
Total Change in Unrealized Net Appreciation/Depreciation | | (42,692,111) | |
Net Increase/(Decrease) in Net Assets Resulting from Operations | $ | (92,381,466) | |
| | | | | |
| | |
See Notes to Financial Statements. |
| |
Janus Aspen Series | 25 |
Janus Henderson VIT Flexible Bond Portfolio
Statements of Changes in Net Assets
| | | | | | | | | |
| | | | | | | | |
| | | Year ended
December 31, 2022 | | Year ended
December 31, 2021 | |
| | | | | | | | | |
Operations: | | | | | | |
| Net investment income/(loss) | $ | 12,880,471 | | $ | 9,910,247 | |
| Net realized gain/(loss) on investments | | (62,569,826) | | | 10,580,747 | |
| Change in unrealized net appreciation/depreciation | | (42,692,111) | | | (26,996,889) | |
Net Increase/(Decrease) in Net Assets Resulting from Operations | | (92,381,466) | | | (6,505,895) | |
Dividends and Distributions to Shareholders: | | | | | | |
| | Institutional Shares | | (4,991,883) | | | (6,673,456) | |
| | Service Shares | | (17,607,350) | | | (20,751,008) | |
Net Decrease from Dividends and Distributions to Shareholders | | (22,599,233) | | | (27,424,464) | |
Capital Share Transactions: | | | | | | |
| | Institutional Shares | | (5,769,476) | | | (1,854,945) | |
| | Service Shares | | (10,774,597) | | | 80,659,280 | |
Net Increase/(Decrease) from Capital Share Transactions | | (16,544,073) | | | 78,804,335 | |
Net Increase/(Decrease) in Net Assets | | (131,524,772) | | | 44,873,976 | |
Net Assets: | | | | | | |
| Beginning of period | | 684,030,140 | | | 639,156,164 | |
| End of period | $ | 552,505,368 | | $ | 684,030,140 | |
| | | | | | | | |
| | |
See Notes to Financial Statements. |
| |
26 | DECEMBER 31, 2022 |
Janus Henderson VIT Flexible Bond Portfolio
Financial Highlights
| | | | | | | | | | | | | | | | | | | |
Institutional Shares | | | | | | | | | | | | | | | |
For a share outstanding during the year ended December 31 | | 2022 | | | 2021 | | | 2020 | | | 2019 | | | 2018 | |
| Net Asset Value, Beginning of Period | | $12.05 | | | $12.75 | | | $11.88 | | | $11.21 | | | $11.69 | |
| Income/(Loss) from Investment Operations: | | | | | | | | | | | | | | | |
| | Net investment income/(loss)(1) | | 0.26 | | | 0.21 | | | 0.28 | | | 0.34 | | | 0.33 | |
| | Net realized and unrealized gain/(loss) | | (1.90) | | | (0.33) | | | 0.96 | | | 0.72 | | | (0.45) | |
| Total from Investment Operations | | (1.64) | | | (0.12) | | | 1.24 | | | 1.06 | | | (0.12) | |
| Less Dividends and Distributions: | | | | | | | | | | | | | | | |
| | Dividends (from net investment income) | | (0.27) | | | (0.25) | | | (0.37) | | | (0.39) | | | (0.36) | |
| | Distributions (from capital gains) | | (0.20) | | | (0.33) | | | — | | | — | | | — | |
| Total Dividends and Distributions | | (0.47) | | | (0.58) | | | (0.37) | | | (0.39) | | | (0.36) | |
| Net Asset Value, End of Period | | $9.94 | | | $12.05 | | | $12.75 | | | $11.88 | | | $11.21 | |
| Total Return* | | (13.66)% | | | (0.90)% | | | 10.48% | | | 9.57% | | | (1.00)% | |
| Net Assets, End of Period (in thousands) | | $107,682 | | | $136,115 | | | $145,792 | | | $162,620 | | | $240,427 | |
| Average Net Assets for the Period (in thousands) | | $115,525 | | | $137,695 | | | $156,575 | | | $208,624 | | | $266,429 | |
| Ratios to Average Net Assets**: | | | | | | | | | | | | | | | |
| | Ratio of Gross Expenses | | 0.60% | | | 0.59% | | | 0.60% | | | 0.60% | | | 0.61% | |
| | Ratio of Net Expenses (After Waivers and Expense Offsets) | | 0.57% | | | 0.58% | | | 0.59% | | | 0.60% | | | 0.61% | |
| | Ratio of Net Investment Income/(Loss) | | 2.37% | | | 1.72% | | | 2.28% | | | 2.89% | | | 2.88% | |
| Portfolio Turnover Rate(2) | | 182% | | | 160% | | | 139% | | | 177% | | | 238% | |
| | | | | | | | | | | | | | | | | | | |
| |
* Total return includes adjustments in accordance with generally accepted accounting principles required at the year or period end and are not annualized for periods of less than one full year. Total return does not include fees, charges, or expenses imposed by the variable annuity and life insurance contracts for which Janus Aspen Series serves as an underlying investment vehicle. ** Annualized for periods of less than one full year. (1) Per share amounts are calculated based on average shares outstanding during the year or period. (2) Portfolio Turnover Rate excludes TBA (to be announced) purchase and sales commitments. |
| | |
See Notes to Financial Statements. |
| |
Janus Aspen Series | 27 |
Janus Henderson VIT Flexible Bond Portfolio
Financial Highlights
| | | | | | | | | | | | | | | | | | | |
Service Shares | | | | | | | | | | | | | | | |
For a share outstanding during the year ended December 31 | | 2022 | | | 2021 | | | 2020 | | | 2019 | | | 2018 | |
| Net Asset Value, Beginning of Period | | $13.27 | | | $13.99 | | | $12.99 | | | $12.23 | | | $12.73 | |
| Income/(Loss) from Investment Operations: | | | | | | | | | | | | | | | |
| | Net investment income/(loss)(1) | | 0.25 | | | 0.20 | | | 0.28 | | | 0.34 | | | 0.33 | |
| | Net realized and unrealized gain/(loss) | | (2.09) | | | (0.37) | | | 1.05 | | | 0.79 | | | (0.50) | |
| Total from Investment Operations | | (1.84) | | | (0.17) | | | 1.33 | | | 1.13 | | | (0.17) | |
| Less Dividends and Distributions: | | | | | | | | | | | | | | | |
| | Dividends (from net investment income) | | (0.24) | | | (0.22) | | | (0.33) | | | (0.37) | | | (0.33) | |
| | Distributions (from capital gains) | | (0.20) | | | (0.33) | | | — | | | — | | | — | |
| Total Dividends and Distributions | | (0.44) | | | (0.55) | | | (0.33) | | | (0.37) | | | (0.33) | |
| Net Asset Value, End of Period | | $10.99 | | | $13.27 | | | $13.99 | | | $12.99 | | | $12.23 | |
| Total Return* | | (13.90)% | | | (1.18)% | | | 10.33% | | | 9.28% | | | (1.29)% | |
| Net Assets, End of Period (in thousands) | | $444,824 | | | $547,915 | | | $493,364 | | | $396,771 | | | $384,824 | |
| Average Net Assets for the Period (in thousands) | | $477,698 | | | $513,269 | | | $431,012 | | | $384,358 | | | $389,260 | |
| Ratios to Average Net Assets**: | | | | | | | | | | | | | | | |
| | Ratio of Gross Expenses | | 0.84% | | | 0.84% | | | 0.85% | | | 0.85% | | | 0.86% | |
| | Ratio of Net Expenses (After Waivers and Expense Offsets) | | 0.82% | | | 0.82% | | | 0.84% | | | 0.85% | | | 0.86% | |
| | Ratio of Net Investment Income/(Loss) | | 2.12% | | | 1.47% | | | 2.03% | | | 2.63% | | | 2.64% | |
| Portfolio Turnover Rate(2) | | 182% | | | 160% | | | 139% | | | 177% | | | 238% | |
| | | | | | | | | | | | | | | | | | | |
| |
* Total return includes adjustments in accordance with generally accepted accounting principles required at the year or period end and are not annualized for periods of less than one full year. Total return does not include fees, charges, or expenses imposed by the variable annuity and life insurance contracts for which Janus Aspen Series serves as an underlying investment vehicle. ** Annualized for periods of less than one full year. (1) Per share amounts are calculated based on average shares outstanding during the year or period. (2) Portfolio Turnover Rate excludes TBA (to be announced) purchase and sales commitments. |
| | |
See Notes to Financial Statements. |
| |
28 | DECEMBER 31, 2022 |
Janus Henderson VIT Flexible Bond Portfolio
Notes to Financial Statements
1. Organization and Significant Accounting Policies
Janus Henderson VIT Flexible Bond Portfolio (the “Portfolio”) is a series of Janus Aspen Series (the “Trust”), which is organized as a Delaware statutory trust and is registered under the Investment Company Act of 1940, as amended (the “1940 Act”), as an open-end management investment company, and therefore has applied the specialized accounting and reporting guidance in Financial Accounting Standards Board (“FASB”) Accounting Standards Codification (“ASC”) Topic 946. The Trust offers 11 portfolios, each of which offers multiple share classes, with differing investment objectives and policies. The Portfolio seeks to obtain maximum total return, consistent with preservation of capital. The Portfolio is classified as diversified, as defined in the 1940 Act. Janus Henderson Investors US LLC is the investment adviser (the “Adviser”) to the Portfolio.
The Portfolio currently offers two classes of shares: Institutional Shares and Service Shares. Each class represents an interest in the same portfolio of investments. Institutional Shares are offered only in connection with investment in and payments under variable insurance contracts as well as certain qualified retirement plans. Service Shares are offered only in connection with investment in and payments under variable insurance contracts as well as certain qualified retirement plans that require a fee from Portfolio assets to procure distribution and administrative services to contract owners and plan participants.
Shareholders, including participating insurance companies, as well as accounts, may from time to time own (beneficially or of record) a significant percentage of the Portfolio’s Shares and can be considered to “control” the Portfolio when that ownership exceeds 25% of the Portfolio’s assets (and which may differ from control as determined in accordance with United States of America generally accepted accounting principles ("US GAAP")).
The following accounting policies have been followed by the Portfolio and are in conformity with US GAAP.
Investment Valuation
Portfolio holdings are valued in accordance with policies and procedures established by the Adviser pursuant to Rule 2a-5 under the 1940 Act and approved by and subject to the oversight of the Trustees (the “Valuation Procedures”). Equity securities traded on a domestic securities exchange are generally valued at readily available market quotations, which are (i) the official close prices or (ii) last sale prices on the primary market or exchange in which the securities trade. If such price is lacking for the trading period immediately preceding the time of determination, such securities are generally valued at their current bid price. Equity securities that are traded on a foreign exchange are generally valued at the closing prices on such markets. In the event that there is no current trading volume on a particular security in such foreign exchange, the bid price from the primary exchange is generally used to value the security. Foreign securities and currencies are converted to U.S. dollars using the current spot USD dollar exchange rate in effect at the close of the New York Stock Exchange (“NYSE”). The Portfolio will determine the market value of individual securities held by it by using prices provided by one or more approved professional pricing services or, as needed, by obtaining market quotations from independent broker-dealers. Most debt securities are valued in accordance with the evaluated bid price supplied by the Adviser-approved pricing service that is intended to reflect market value. The evaluated bid price supplied by the pricing service is an evaluation that may consider factors such as security prices, yields, maturities and ratings. Certain short-term securities maturing within 60 days or less may be evaluated and valued on an amortized cost basis provided that the amortized cost determined approximates market value. Securities for which market quotations or evaluated prices are not readily available or deemed unreliable are valued at fair value determined in good faith by the Adviser pursuant to the Valuation Procedures. Circumstances in which fair valuation may be utilized include, but are not limited to: (i) a significant event that may affect the securities of a single issuer, such as a merger, bankruptcy, or significant issuer-specific development; (ii) an event that may affect an entire market, such as a natural disaster or significant governmental action; (iii) a nonsignificant event such as a market closing early or not opening, or a security trading halt; and (iv) pricing of a nonvalued security and a restricted or nonpublic security. Special valuation considerations may apply with respect to “odd-lot” fixed-income transactions which, due to their small size, may receive evaluated prices by pricing services which reflect a large block trade and not what actually could be obtained for the odd-lot position. The valuation policies provide for the use of systematic fair valuation models provided by independent pricing services to value foreign equity securities in order to adjust for stale pricing, which may occur between the close of certain foreign exchanges and the close of the NYSE. The value of the securities of other mutual funds held by a Portfolio, if any, will be calculated using the NAV of such mutual funds.
Janus Henderson VIT Flexible Bond Portfolio
Notes to Financial Statements
Valuation Inputs Summary
FASB ASC 820, Fair Value Measurements and Disclosures (“ASC 820”), defines fair value, establishes a framework for measuring fair value, and expands disclosure requirements regarding fair value measurements. This standard emphasizes that fair value is a market-based measurement that should be determined based on the assumptions that market participants would use in pricing an asset or liability and establishes a hierarchy that prioritizes inputs to valuation techniques used to measure fair value. These inputs are summarized into three broad levels:
Level 1 – Unadjusted quoted prices in active markets the Portfolio has the ability to access for identical assets or liabilities.
Level 2 – Observable inputs other than unadjusted quoted prices included in Level 1 that are observable for the asset or liability either directly or indirectly. These inputs may include quoted prices for the identical instrument on an inactive market, prices for similar instruments, interest rates, prepayment speeds, credit risk, yield curves, default rates and similar data.
Assets or liabilities categorized as Level 2 in the hierarchy generally include: debt securities fair valued in accordance with the evaluated bid or ask prices supplied by a pricing service; securities traded on OTC markets and listed securities for which no sales are reported that are fair valued at the latest bid price (or yield equivalent thereof) obtained from one or more dealers transacting in a market for such securities or by a pricing service approved by the Portfolio’s Trustees; certain short-term debt securities with maturities of 60 days or less that are fair valued at amortized cost; and equity securities of foreign issuers whose fair value is determined by using systematic fair valuation models provided by independent third parties in order to adjust for stale pricing which may occur between the close of certain foreign exchanges and the close of the NYSE. Other securities that may be categorized as Level 2 in the hierarchy include, but are not limited to, preferred stocks, bank loans, swaps, investments in unregistered investment companies, options, and forward contracts.
Level 3 – Unobservable inputs for the asset or liability to the extent that relevant observable inputs are not available, representing the Portfolio’s own assumptions about the assumptions that a market participant would use in valuing the asset or liability, and that would be based on the best information available.
There have been no significant changes in valuation techniques used in valuing any such positions held by the Portfolio since the beginning of the fiscal year.
The inputs or methodology used for fair valuing securities are not necessarily an indication of the risk associated with investing in those securities. The summary of inputs used as of December 31, 2022 to fair value the Portfolio’s investments in securities and other financial instruments is included in the “Valuation Inputs Summary” in the Notes to Schedule of Investments and Other Information.
Investment Transactions and Investment Income
Investment transactions are accounted for as of the date purchased or sold (trade date). Dividend income is recorded on the ex-dividend date. Certain dividends from foreign securities will be recorded as soon as the Portfolio is informed of the dividend, if such information is obtained subsequent to the ex-dividend date. Dividends from foreign securities may be subject to withholding taxes in foreign jurisdictions. Non-cash dividends, if any, are recorded on the ex-dividend date at fair value. Interest income is recorded daily on the accrual basis and includes amortization of premiums and accretion of discounts. The Portfolio classifies gains and losses on prepayments received as an adjustment to interest income. Debt securities may be placed in non-accrual status and related interest income may be reduced by stopping current accruals and writing off interest receivables when collection of all or a portion of interest has become doubtful. Gains and losses are determined on the identified cost basis, which is the same basis used for federal income tax purposes. Income, as well as gains and losses, both realized and unrealized, are allocated daily to each class of shares based upon the ratio of net assets represented by each class as a percentage of total net assets.
Expenses
The Portfolio bears expenses incurred specifically on its behalf. Each class of shares bears a portion of general expenses, which are allocated daily to each class of shares based upon the ratio of net assets represented by each class as a percentage of total net assets. Expenses directly attributable to a specific class of shares are charged against the operations of such class.
Janus Henderson VIT Flexible Bond Portfolio
Notes to Financial Statements
Estimates
The preparation of financial statements in conformity with US GAAP requires management to make estimates and assumptions that affect the reported amount of assets and liabilities and disclosure of contingent assets and liabilities at the date of the financial statements, and the reported amounts of income and expenses during the reporting period. Actual results could differ from those estimates.
Indemnifications
In the normal course of business, the Portfolio may enter into contracts that contain provisions for indemnification of other parties against certain potential liabilities. The Portfolio’s maximum exposure under these arrangements is unknown, and would involve future claims that may be made against the Portfolio that have not yet occurred. Currently, the risk of material loss from such claims is considered remote.
Dividends and Distributions
The Portfolio may make semiannual distributions of substantially all of its investment income and an annual distribution of its net realized capital gains (if any).
The Portfolio may make certain investments in real estate investment trusts (“REITs”) which pay dividends to their shareholders based upon funds available from operations. It is quite common for these dividends to exceed the REITs’ taxable earnings and profits, resulting in the excess portion of such dividends being designated as a return of capital. If the Portfolio distributes such amounts, such distributions could constitute a return of capital to shareholders for federal income tax purposes.
Federal Income Taxes
The Portfolio intends to continue to qualify as a regulated investment company and distribute all of its taxable income in accordance with the requirements of Subchapter M of the Internal Revenue Code. Management has analyzed the Portfolio’s tax positions taken for all open federal income tax years, generally a three-year period, and has concluded that no provision for federal income tax is required in the Portfolio’s financial statements. The Portfolio is not aware of any tax positions for which it is reasonably possible that the total amounts of unrecognized tax benefits will significantly change in the next twelve months.
2. Derivative Instruments
The Portfolio may invest in various types of derivatives, which may at times result in significant derivative exposure. A derivative is a financial instrument whose performance is derived from the performance of another asset. The Portfolio may invest in derivative instruments including, but not limited to: futures contracts, put options, call options, options on futures contracts, options on foreign currencies, options on recovery locks, options on security and commodity indices, swaps, forward contracts, structured investments, and other equity-linked derivatives. Each derivative instrument that was held by the Portfolio during the year ended December 31, 2022 is discussed in further detail below. A summary of derivative activity by the Portfolio is reflected in the tables at the end of the Schedule of Investments.
The Portfolio may use derivative instruments for hedging purposes (to offset risks associated with an investment, currency exposure, or market conditions), to adjust currency exposure relative to a benchmark index, or for speculative purposes (to earn income and seek to enhance returns). When the Portfolio invests in a derivative for speculative purposes, the Portfolio will be fully exposed to the risks of loss of that derivative, which may sometimes be greater than the derivative’s cost. The Portfolio may not use any derivative to gain exposure to an asset or class of assets that it would be prohibited by its investment restrictions from purchasing directly. The Portfolio’s ability to use derivative instruments may also be limited by tax considerations.
Investments in derivatives in general are subject to market risks that may cause their prices to fluctuate over time. Investments in derivatives may not directly correlate with the price movements of the underlying instrument. As a result, the use of derivatives may expose the Portfolio to additional risks that it would not be subject to if it invested directly in the securities underlying those derivatives. The use of derivatives may result in larger losses or smaller gains than otherwise would be the case. Derivatives can be volatile and may involve significant risks.
In pursuit of its investment objective, the Portfolio may seek to use derivatives to increase or decrease exposure to the following market risk factors:
· Commodity Risk – the risk related to the change in value of commodities or commodity-linked investments due to changes in the overall market movements, volatility of the underlying benchmark, changes in interest rates, or
Janus Henderson VIT Flexible Bond Portfolio
Notes to Financial Statements
other factors affecting a particular industry or commodity such as drought, floods, weather, livestock disease, embargoes, tariffs, and international economic, political, and regulatory developments.
· Counterparty Risk – the risk that the counterparty (the party on the other side of the transaction) on a derivative transaction will be unable to honor its financial obligation to the Portfolio.
· Credit Risk – the risk an issuer will be unable to make principal and interest payments when due, or will default on its obligations.
· Currency Risk – the risk that changes in the exchange rate between currencies will adversely affect the value (in U.S. dollar terms) of an investment.
· Equity Risk – the risk related to the change in value of equity securities as they relate to increases or decreases in the general market.
· Index Risk – if the derivative is linked to the performance of an index, it will be subject to the risks associated with changes in that index. If the index changes, the Portfolio could receive lower interest payments or experience a reduction in the value of the derivative to below what the Portfolio paid. Certain indexed securities, including inverse securities (which move in an opposite direction to the index), may create leverage, to the extent that they increase or decrease in value at a rate that is a multiple of the changes in the applicable index.
· Interest Rate Risk – the risk that the value of fixed-income securities will generally decline as prevailing interest rates rise, which may cause the Portfolio’s NAV to likewise decrease.
· Leverage Risk – the risk associated with certain types of leveraged investments or trading strategies pursuant to which relatively small market movements may result in large changes in the value of an investment. The Portfolio creates leverage by investing in instruments, including derivatives, where the investment loss can exceed the original amount invested. Certain investments or trading strategies, such as short sales, that involve leverage can result in losses that greatly exceed the amount originally invested.
· Liquidity Risk – the risk that certain securities may be difficult or impossible to sell at the time that the seller would like or at the price that the seller believes the security is currently worth.
Derivatives may generally be traded OTC or on an exchange. Derivatives traded OTC are agreements that are individually negotiated between parties and can be tailored to meet a purchaser’s needs. OTC derivatives are not guaranteed by a clearing agency and may be subject to increased credit risk.
In an effort to mitigate credit risk associated with derivatives traded OTC, the Portfolio may enter into collateral agreements with certain counterparties whereby, subject to certain minimum exposure requirements, the Portfolio may require the counterparty to post collateral if the Portfolio has a net aggregate unrealized gain on all OTC derivative contracts with a particular counterparty. Additionally, the Portfolio may deposit cash and/or treasuries as collateral with the counterparty and/or custodian daily (based on the daily valuation of the financial asset) if the Portfolio has a net aggregate unrealized loss on OTC derivative contracts with a particular counterparty. All liquid securities and restricted cash are considered to cover in an amount at all times equal to or greater than the Portfolio’s commitment with respect to certain exchange-traded derivatives, centrally cleared derivatives, forward foreign currency exchange contracts, short sales, and/or securities with extended settlement dates. There is no guarantee that counterparty exposure is reduced and these arrangements are dependent on the Adviser’s ability to establish and maintain appropriate systems and trading.
Futures Contracts
A futures contract is an exchange-traded agreement to take or make delivery of an underlying asset at a specific time in the future for a specific predetermined negotiated price. The Portfolio may enter into futures contracts to gain exposure to the stock market or other markets pending investment of cash balances or to meet liquidity needs. The Portfolio is subject to interest rate risk, equity risk, and currency risk in the normal course of pursuing its investment objective through its investments in futures contracts. The Portfolio may also use such derivative instruments to hedge or protect from adverse movements in securities prices, currency rates or interest rates. The use of futures contracts may involve risks such as the possibility of illiquid markets or imperfect correlation between the values of the contracts and the underlying securities, or that the counterparty will fail to perform its obligations.
Janus Henderson VIT Flexible Bond Portfolio
Notes to Financial Statements
Futures contracts are valued at the settlement price on valuation date on the exchange as reported by an approved vendor. Mini contracts, as defined in the description of the contract, shall be valued using the Actual Settlement Price or “ASET” price type as reported by an approved vendor. In the event that foreign futures trade when the foreign equity markets are closed, the last foreign futures trade price shall be used.
Futures contracts are marked-to-market daily, and the daily variation margin is recorded as a receivable or payable on the Statement of Assets and Liabilities (if applicable). The change in unrealized net appreciation/depreciation is reported on the Statement of Operations (if applicable). When a contract is closed, a realized gain or loss is reported on the Statement of Operations (if applicable), equal to the difference between the opening and closing value of the contract.
Securities held by the Portfolio that are designated as collateral for market value on futures contracts are noted on the Schedule of Investments (if applicable). Such collateral is in the possession of the Portfolio’s futures commission merchant.
With futures, there is minimal counterparty credit risk to the Portfolio since futures are exchange-traded and the exchange’s clearinghouse, as counterparty to all exchange-traded futures, guarantees the futures against default.
During the year, the Portfolio purchased interest rate futures to increase exposure to interest rate risk.
During the year, the Portfolio sold interest rate futures to decrease exposure to interest rate risk.
3. Other Investments and Strategies
Additional Investment Risk
The Portfolio may be invested in lower-rated debt securities that have a higher risk of default or loss of value since these securities may be sensitive to economic changes, political changes, or adverse developments specific to the issuer.
The U.S. government and the Federal Reserve, as well as certain foreign governments and central banks, have taken extraordinary actions to support local and global economies and the financial markets in response to the COVID-19 pandemic. This and other government intervention into the economy and financial markets to address the COVID-19 pandemic may not work as intended, particularly if the efforts are perceived by investors as being unlikely to achieve the desired results. Government actions to mitigate the economic impact of the pandemic have resulted in a large expansion of government deficits and debt, the long term consequences of which are not known. The COVID-19 pandemic could adversely affect the value and liquidity of a Portfolio’s investments, impair a Portfolio’s ability to satisfy redemption requests, and negatively impact a Portfolio’s performance. In addition, the outbreak of COVID-19, and measures taken to mitigate its effects, could result in disruptions to the services provided to a Portfolio by its service providers.
Widespread disease, including pandemics and epidemics, and natural or environmental disasters, including those which may be attributable to global climate change, such as earthquakes, fires, floods, hurricanes, tsunamis and weather-related phenomena generally, have been and can be highly disruptive to economies and markets, adversely impacting individual companies, sectors, industries, markets, currencies, interest and inflation rates, credit ratings, investor sentiment, and other factors affecting the value of a Portfolio’s investments. Economies and financial markets throughout the world have become increasingly interconnected, which increases the likelihood that events or conditions in one region or country will adversely affect markets or issuers in other regions or countries, including the United States. These disruptions could prevent a Portfolio from executing advantageous investment decisions in a timely manner and negatively impact a Portfolio’s ability to achieve its investment objective(s). Any such event(s) could have a significant adverse impact on the value of a Portfolio. In addition, these disruptions could also impair the information technology and other operational systems upon which the Portfolio’s service providers, including the Adviser or the subadviser (as applicable), rely, and could otherwise disrupt the ability of employees of the Portfolio’s service providers to perform essential tasks on behalf of the Portfolio. Adverse weather conditions may also have a particularly significant negative effect on issuers in the agricultural sector and on insurance and reinsurance companies that insure or reinsure against the impact of natural disasters.
A number of countries in the European Union (the “EU”) have experienced, and may continue to experience, severe economic and financial difficulties. In particular, many EU nations are susceptible to economic risks associated with high levels of debt. Many non-governmental issuers, and even certain governments, have defaulted on, or been forced to
Janus Henderson VIT Flexible Bond Portfolio
Notes to Financial Statements
restructure, their debts. Many other issuers have faced difficulties obtaining credit or refinancing existing obligations. Financial institutions have in many cases required government or central bank support, have needed to raise capital, and/or have been impaired in their ability to extend credit. As a result, financial markets in the EU have experienced extreme volatility and declines in asset values and liquidity. These difficulties may continue, worsen, or spread further within the EU. Responses to these financial problems by European governments, central banks, and others, including austerity measures and reforms, may not work, may result in social unrest, and may limit future growth and economic recovery or have other unintended consequences. Among other things, these developments have adversely affected the value and exchange rate of the euro and pound sterling, and may continue to significantly affect the economies of all EU countries, which in turn may have a material adverse effect on the Portfolio’s investments in such countries, other countries that depend on EU countries for significant amounts of trade or investment, or issuers with exposure to debt issued by certain EU countries.
LIBOR Replacement Risk
The Portfolio may invest in certain debt securities, derivatives or other financial instruments that utilize the London Interbank Offered Rate (“LIBOR”) or other interbank offered rates as a reference rate for various rate calculations. The U.K. Financial Conduct Authority has announced that it intends to stop compelling or inducing banks to submit rates for many LIBOR settings after December 31, 2021, and for certain other commonly used U.S. dollar LIBOR settings after June 30, 2023. The elimination of LIBOR or other reference rates and the transition process away from LIBOR could adversely impact (i) volatility and liquidity in markets that are tied to those reference rates, (ii) the market for, or value of, specific securities or payments linked to those reference rates, (iii) availability or terms of borrowing or refinancing, or (iv) the effectiveness of hedging strategies. For these and other reasons, the elimination of LIBOR or changes to other reference rates may adversely affect the Portfolio’s performance and/or net asset value. Alternatives to LIBOR are established or in development in most major currencies, including the Secured Overnight Financing Rate (“SOFR”) that is intended to replace the U.S. dollar LIBOR. The effect of the discontinuation of, LIBOR or other reference rates will depend on (1) existing fallback or termination provisions in individual contracts and (2) whether, how, and when industry participants develop and adopt new reference rates and fallbacks for both legacy and new products and instruments. Accordingly, it is difficult to predict the full impact of the transition away from LIBOR or other reference rates on the Portfolio until new reference rates and fallbacks for both legacy and new products, instruments and contracts are commercially accepted.
Mortgage- and Asset-Backed Securities
Mortgage- and asset-backed securities represent interests in “pools” of commercial or residential mortgages or other assets, including consumer and commercial loans or receivables. The Portfolio may purchase fixed or variable rate commercial or residential mortgage-backed securities issued by the Government National Mortgage Association (“Ginnie Mae”), the Federal National Mortgage Association (“Fannie Mae”), the Federal Home Loan Mortgage Corporation (“Freddie Mac”), or other governmental or government-related entities. Ginnie Mae’s guarantees are backed as to the timely payment of principal and interest by the full faith and credit of the U.S. Government. Fannie Mae and Freddie Mac securities are not backed by the full faith and credit of the U.S. Government. In September 2008, the Federal Housing Finance Agency (“FHFA”), an agency of the U.S. Government, placed Fannie Mae and Freddie Mac under conservatorship. Since that time, Fannie Mae and Freddie Mac have received capital support through U.S. Treasury preferred stock purchases and Treasury and Federal Reserve purchases of their mortgage-backed securities. The FHFA and the U.S. Treasury have imposed strict limits on the size of these entities’ mortgage portfolios. The FHFA has the power to cancel any contract entered into by Fannie Mae and Freddie Mac prior to FHFA’s appointment as conservator or receiver, including the guarantee obligations of Fannie Mae and Freddie Mac.
The Portfolio may also purchase other mortgage- and asset-backed securities through single- and multi-seller conduits, collateralized debt obligations, structured investment vehicles, and other similar securities. Asset-backed securities may be backed by various consumer obligations, including automobile loans, equipment leases, credit card receivables, or other collateral. In the event the underlying loans are not paid, the securities’ issuer could be forced to sell the assets and recognize losses on such assets, which could impact your return. Unlike traditional debt instruments, payments on these securities include both interest and a partial payment of principal. Mortgage- and asset-backed securities are subject to both extension risk, where borrowers pay off their debt obligations more slowly in times of rising interest rates, and prepayment risk, where borrowers pay off their debt obligations sooner than expected in times of declining interest rates. These risks may reduce the Portfolio’s returns. In addition, investments in mortgage- and asset-backed securities, including those comprised of subprime mortgages, may be subject to a higher degree of credit risk, valuation risk, extension risk (if interest rates rise), and liquidity risk than various other types of fixed-income securities.
Janus Henderson VIT Flexible Bond Portfolio
Notes to Financial Statements
Additionally, although mortgage-backed securities are generally supported by some form of government or private guarantee and/or insurance, there is no assurance that guarantors or insurers will meet their obligations.
Real Estate Investing
The Portfolio may invest in equity and debt securities of real estate-related companies. Such companies may include those in the real estate industry or real estate-related industries. These securities may include common stocks, corporate bonds, preferred stocks, and other equity securities, including, but not limited to, mortgage-backed securities, real estate-backed securities, securities of REITs and similar REIT-like entities. A REIT is a trust that invests in real estate-related projects, such as properties, mortgage loans, and construction loans. REITs are generally categorized as equity, mortgage, or hybrid REITs. A REIT may be listed on an exchange or traded OTC.
Sovereign Debt
The Portfolio may invest in U.S. and non-U.S. government debt securities (“sovereign debt”). Some investments in sovereign debt, such as U.S. sovereign debt, are considered low risk. However, investments in sovereign debt, especially the debt of less developed countries, can involve a high degree of risk, including the risk that the governmental entity that controls the repayment of sovereign debt may not be willing or able to repay the principal and/or to pay the interest on its sovereign debt in a timely manner. A sovereign debtor’s willingness or ability to satisfy its debt obligation may be affected by various factors including, but not limited to, its cash flow situation, the extent of its foreign currency reserves, the availability of foreign exchange when a payment is due, the relative size of its debt position in relation to its economy as a whole, the sovereign debtor’s policy toward international lenders, and local political constraints to which the governmental entity may be subject. Sovereign debtors may also be dependent on expected disbursements from foreign governments, multilateral agencies, and other entities. The failure of a sovereign debtor to implement economic reforms, achieve specified levels of economic performance, or repay principal or interest when due may result in the cancellation of third party commitments to lend funds to the sovereign debtor, which may further impair such debtor’s ability or willingness to timely service its debts. The Portfolio may be requested to participate in the rescheduling of such sovereign debt and to extend further loans to governmental entities, which may adversely affect the Portfolio’s holdings. In the event of default, there may be limited or no legal remedies for collecting sovereign debt and there may be no bankruptcy proceedings through which the Portfolio may collect all or part of the sovereign debt that a governmental entity has not repaid. In addition, to the extent the Portfolio invests in non-U.S. sovereign debt, it may be subject to currency risk.
TBA Commitments
The Portfolio may enter into “to be announced” or “TBA” commitments. TBAs are forward agreements for the purchase or sale of securities, including mortgage-backed securities, for a fixed price, with payment and delivery on an agreed upon future settlement date. The specific securities to be delivered are not identified at the trade date. However, delivered securities must meet specified terms, including issuer, rate, and mortgage terms. Although the particular TBA securities must meet industry-accepted “good delivery” standards, there can be no assurance that a security purchased on forward commitment basis will ultimately be issued or delivered by the counterparty. During the settlement period, the Portfolio will still bear the risk of any decline in the value of the security to be delivered. Because TBA commitments do not require the delivery of a specific security, the characteristics of the security delivered to the Portfolio may be less favorable than expected. If the counterparty to a transaction fails to deliver the security, the Portfolio could suffer a loss. To facilitate TBA commitments, the Portfolio will segregate or otherwise earmark liquid assets marked to market daily in an amount at least equal to such TBA commitments. Proposed rules of the Financial Industry Regulatory Authority (“FINRA”) include mandatory margin requirements for TBA commitments which, in some circumstances, will require the Portfolio to also post collateral. These collateral requirements may increase costs associated with the Portfolio’s participation in the TBA market.
When-Issued, Delayed Delivery and Forward Commitment Transactions
The Portfolio may purchase or sell securities on a when-issued, delayed delivery, or forward commitment basis. When purchasing a security on a when-issued, delayed delivery, or forward commitment basis, the Portfolio assumes the rights and risks of ownership of the security, including the risk of price and yield fluctuations, and takes such fluctuations into account when determining its net asset value. Typically, no income accrues on securities the Portfolio has committed to purchase prior to the time delivery of the securities is made. Because the Portfolio is not required to pay for the security until the delivery date, these risks are in addition to the risks associated with the Portfolio’s other investments. If the other party to a transaction fails to deliver the securities, the Portfolio could miss a favorable price or yield opportunity. If the Portfolio remains substantially fully invested at a time when when-issued, delayed delivery, or forward commitment
Janus Henderson VIT Flexible Bond Portfolio
Notes to Financial Statements
purchases are outstanding, the purchases may result in a form of leverage. If the Portfolio remains substantially fully invested at a time when when-issued, delayed delivery, or forward commitment purchases (including TBA commitments) are outstanding, the purchases may result in a form of leverage.
When the Portfolio has sold a security on a when-issued, delayed delivery, or forward commitment basis, the Portfolio does not participate in future gains or losses with respect to the security. If the other party to a transaction fails to pay for the securities, the Portfolio could suffer a loss. Additionally, when selling a security on a when-issued, delayed delivery, or forward commitment basis without owning the security, the Portfolio will incur a loss if the security’s price appreciates in value such that the security’s price is above the agreed upon price on the settlement date. The Portfolio may dispose of or renegotiate a transaction after it is entered into, and may purchase or sell when-issued, delayed delivery or forward commitment securities before the settlement date, which may result in a gain or loss.
Counterparties
Portfolio transactions involving a counterparty are subject to the risk that the counterparty or a third party will not fulfill its obligation to the Portfolio (“counterparty risk”). Counterparty risk may arise because of the counterparty’s financial condition (i.e., financial difficulties, bankruptcy, or insolvency), market activities and developments, or other reasons, whether foreseen or not. A counterparty’s inability to fulfill its obligation may result in significant financial loss to the Portfolio. The Portfolio may be unable to recover its investment from the counterparty or may obtain a limited recovery, and/or recovery may be delayed. The extent of the Portfolio’s exposure to counterparty risk with respect to financial assets and liabilities approximates its carrying value. See the "Offsetting Assets and Liabilities" section of this Note for further details.
The Portfolio may be exposed to counterparty risk through participation in various programs, including, but not limited to, lending its securities to third parties, cash sweep arrangements whereby the Portfolio’s cash balance is invested in one or more types of cash management vehicles, as well as investments in, but not limited to, repurchase agreements, debt securities, and derivatives, including various types of swaps, futures and options. The Portfolio intends to enter into financial transactions with counterparties that the Adviser believes to be creditworthy at the time of the transaction. There is always the risk that the Adviser’s analysis of a counterparty’s creditworthiness is incorrect or may change due to market conditions. To the extent that the Portfolio focuses its transactions with a limited number of counterparties, it will have greater exposure to the risks associated with one or more counterparties.
Securities Lending
Under procedures adopted by the Trustees, the Portfolio may seek to earn additional income by lending securities to certain qualified broker-dealers and institutions. JPMorgan Chase Bank, National Association acts as securities lending agent and a limited purpose custodian or subcustodian to receive and disburse cash balances and cash collateral, hold short-term investments, hold collateral, and perform other custodial functions in accordance with the Non-Custodial Securities Lending Agreement. For financial reporting purposes, the Portfolio does not offset financial instruments’ payables and receivables and related collateral on the Statement of Assets and Liabilities. The Portfolio may lend portfolio securities in an amount equal to up to 1/3 of its total assets as determined at the time of the loan origination. There is the risk of delay in recovering a loaned security or the risk of loss in collateral rights if the borrower fails financially. In addition, the Adviser makes efforts to balance the benefits and risks from granting such loans. All loans will be continuously secured by collateral which may consist of cash, U.S. Government securities, domestic and foreign short-term debt instruments, letters of credit, time deposits, repurchase agreements, money market mutual funds or other money market accounts, or such other collateral as permitted by the SEC. If the Portfolio is unable to recover a security on loan, the Portfolio may use the collateral to purchase replacement securities in the market. There is a risk that the value of the collateral could decrease below the cost of the replacement security by the time the replacement investment is made, resulting in a loss to the Portfolio. In certain circumstances individual loan transactions could yield negative returns.
Upon receipt of cash collateral, the Adviser may invest it in affiliated or non-affiliated cash management vehicles, whether registered or unregistered entities, as permitted by the 1940 Act and rules promulgated thereunder. The Adviser currently intends to primarily invest the cash collateral in a cash management vehicle for which the Adviser serves as investment adviser, Janus Henderson Cash Collateral Fund LLC, or in time deposits. An investment in Janus Henderson Cash Collateral Fund LLC is generally subject to the same risks that shareholders experience when investing in similarly structured vehicles, such as the potential for significant fluctuations in assets as a result of the purchase and redemption activity of the securities lending program, a decline in the value of the collateral, and possible liquidity issues. Such risks may delay the return of the cash collateral and cause the Portfolio to violate its agreement to
Janus Henderson VIT Flexible Bond Portfolio
Notes to Financial Statements
return the cash collateral to a borrower in a timely manner. As adviser to the Portfolio and Janus Henderson Cash Collateral Fund LLC, the Adviser has an inherent conflict of interest as a result of its fiduciary duties to both the Portfolio and Janus Henderson Cash Collateral Fund LLC. Additionally, the Adviser receives an investment advisory fee of 0.05% for managing Janus Henderson Cash Collateral Fund LLC, but it may not receive a fee for managing certain other affiliated cash management vehicles in which the Portfolio may invest, and therefore may have an incentive to allocate preferred investment opportunities to investment vehicles for which it is receiving a fee.
The value of the collateral must be at least 102% of the market value of the loaned securities that are denominated in U.S. dollars and 105% of the market value of the loaned securities that are not denominated in U.S. dollars. Loaned securities and related collateral are marked-to-market each business day based upon the market value of the loaned securities at the close of business, employing the most recent available pricing information. Collateral levels are then adjusted based on this mark-to-market evaluation. Additional required collateral, or excess collateral returned, is delivered on the next business day. Therefore, the value of the collateral held may be temporarily less than 102% or 105% value of the securities on loan. The cash collateral invested by the Adviser is disclosed in the Schedule of Investments (if applicable).
Income earned from the investment of the cash collateral, net of rebates paid to, or fees paid by, borrowers and less the fees paid to the lending agent are included as “Affiliated securities lending income, net” on the Statement of Operations. As of December 31, 2022, securities lending transactions accounted for as secured borrowings with an overnight and continuous contractual maturity are $18,390,503. Gross amounts of recognized liabilities for securities lending (collateral received) as of December 31, 2022 is $19,016,077, resulting in the net amount due to the counterparty of $625,574.
Offsetting Assets and Liabilities
The Portfolio presents gross and net information about transactions that are either offset in the financial statements or subject to an enforceable master netting arrangement or similar agreement with a designated counterparty, regardless of whether the transactions are actually offset in the Statement of Assets and Liabilities.
The Offsetting Assets and Liabilities table located in the Schedule of Investments presents gross amounts of recognized assets and/or liabilities and the net amounts after deducting collateral that has been pledged by counterparties or has been pledged to counterparties (if applicable). For corresponding information grouped by type of instrument, see the Portfolio's Schedule of Investments.
4. Investment Advisory Agreements and Other Transactions with Affiliates
The Portfolio pays the Adviser an investment advisory fee which is calculated daily and paid monthly. The following table reflects the Portfolio’s contractual investment advisory fee rate (expressed as an annual rate).
| | |
Average Daily Net Assets of the Portfolio | Contractual Investment Advisory Fee (%) |
First $300 Million | 0.55 |
Over $300 Million | 0.45 |
The Portfolio’s actual investment advisory fee rate for the reporting period was 0.50% of average annual net assets before any applicable waivers.
The Adviser has contractually agreed to waive the investment advisory fee and/or reimburse operating expenses to the extent that the Portfolio’s total annual fund operating expenses, excluding the 12b-1 distribution and shareholder servicing fees (applicable to Service Shares), transfer agent fees and expenses payable pursuant to the Transfer Agency Agreement, brokerage commissions, interest, dividends, taxes, acquired fund fees and expenses, and extraordinary expenses, exceed the annual rate of 0.52% of the Portfolio’s average daily net assets for at least a one-year period commencing April 29, 2022. If applicable, amounts waived and/or reimbursed to the Portfolio by the Adviser are disclosed as “Excess Expense Reimbursement and Waivers” on the Statement of Operations.
The Adviser serves as administrator to the Portfolio pursuant to an administration agreement between the Adviser and the Trust. Under the administration agreement, the Adviser is authorized to perform, or cause others to perform certain administration, compliance, and accounting services to the Portfolio, including providing office space for the Portfolio, and is reimbursed by the Portfolio for certain of its costs in providing these services (to the extent the Adviser seeks reimbursement and such costs are not otherwise waived). In addition, employees of the Adviser and/or its affiliates may
Janus Henderson VIT Flexible Bond Portfolio
Notes to Financial Statements
serve as officers of the Trust. The Portfolio pays for some or all of the salaries, fees, and expenses of the Adviser employees and Portfolio officers, with respect to certain specified administration functions they perform on behalf of the Portfolio. The Portfolio pays these costs based on out-of-pocket expenses incurred by the Adviser, and these costs are separate and apart from advisory fees and other expenses paid in connection with the investment advisory services the Adviser (or any subadvisor, as applicable) provides to the Portfolio. These amounts are disclosed as “Affiliated portfolio administration fees” on the Statement of Operations. In addition, some expenses related to compensation payable to the Portfolio’s Chief Compliance Officer and certain compliance staff, all of whom are employees of the Adviser and/or its affiliates, are shared with the Portfolio. Total compensation of $48,451 was paid to the Chief Compliance Officer and certain compliance staff by the Trust during the year ended December 31, 2022. The Portfolio's portion is reported as part of “Other expenses” on the Statement of Operations.
Janus Henderson Services US LLC (the “Transfer Agent”), a wholly-owned subsidiary of the Adviser, is the Portfolio’s transfer agent. The Transfer Agent receives an administrative services fee at an annual rate of 0.05% of the average daily net assets of the Portfolio for arranging for the provision by participating insurance companies and qualified plan service providers of administrative services, including, but not limited to, recordkeeping, subaccounting, answering inquiries regarding accounts, order processing, transaction confirmations, the mailing of prospectuses and shareholder reports, and other shareholder services provided on behalf of contract holders or plan participants investing in the Portfolio. The Transfer Agent expects to use this entire fee to compensate insurance companies and qualified plan service providers for providing these services to their customers who invest in the Portfolio.
The Transfer Agent is not compensated for internal services related to the shares, except for out-of-pocket costs. These amounts are disclosed as “Other transfer agent fees and expenses” on the Statement of Operations.
Under a distribution and shareholder servicing plan (the “Plan”) adopted in accordance with Rule 12b-1 under the 1940 Act, the Service Shares may pay the Trust’s distributor, Janus Henderson Distributors US LLC (the “Distributor”), a wholly-owned subsidiary of the Adviser, a fee for the sale and distribution and/or shareholder servicing of the Service Shares at an annual rate of up to 0.25% of the average daily net assets of the Service Shares. Under the terms of the Plan, the Trust is authorized to make payments to the Distributor for remittance to insurance companies and qualified plan service providers as compensation for distribution and/or shareholder services performed by such entities. These amounts are disclosed as “12b-1 Distribution and shareholder servicing fees” on the Statement of Operations.
The Board of Trustees has adopted a deferred compensation plan (the “Deferred Plan”) for independent Trustees to elect to defer receipt of all or a portion of the annual compensation they are entitled to receive from the Portfolio. All deferred fees are credited to an account established in the name of the Trustees. The amounts credited to the account then increase or decrease, as the case may be, in accordance with the performance of one or more of the Janus Henderson funds that are selected by the Trustees. The account balance continues to fluctuate in accordance with the performance of the selected fund or funds until final payment of all amounts are credited to the account. The fluctuation of the account balance is recorded by the Portfolio as unrealized appreciation/(depreciation) and is included as of December 31, 2022 on the Statement of Assets and Liabilities in the asset, “Trustees’ deferred compensation,” and liability, “Trustees’ deferred compensation fees.” Additionally, the recorded unrealized appreciation/(depreciation) is included in “Total distributable earnings (loss)” on the Statement of Assets and Liabilities. Deferred compensation expenses for the year ended December 31, 2022 are included in “Trustees’ fees and expenses” on the Statement of Operations. Trustees are allowed to change their designation of mutual funds from time to time. Amounts will be deferred until distributed in accordance with the Deferred Plan. Deferred fees of $433,851 were paid by the Trust to the Trustees under the Deferred Plan during the year ended December 31, 2022.
Pursuant to the provisions of the 1940 Act and related rules, the Portfolio may participate in an affiliated or non-affiliated cash sweep program. In the cash sweep program, uninvested cash balances of the Portfolio may be used to purchase shares of affiliated or non-affiliated money market funds or cash management pooled investment vehicles that operate as money market funds. The Portfolio is eligible to participate in the cash sweep program (the “Investing Funds”). The Adviser has an inherent conflict of interest because of its fiduciary duties to the affiliated money market funds or cash management pooled investment vehicles and the Investing Funds. Janus Henderson Cash Liquidity Fund LLC (the “Sweep Vehicle”) is an affiliated unregistered cash management pooled investment vehicle that invests primarily in highly-rated short-term fixed-income securities. The Sweep Vehicle operates pursuant to the provisions of the 1940 Act that govern the operation of money market funds and prices its shares at NAV reflecting market-based values of its portfolio securities (i.e., a “floating” NAV) rounded to the fourth decimal place (e.g., $1.0000). The Sweep Vehicle is permitted to impose a liquidity fee (of up to 2%) on redemptions from the Sweep Vehicle or a redemption
Janus Henderson VIT Flexible Bond Portfolio
Notes to Financial Statements
gate that temporarily suspends redemptions from the Sweep Vehicle for up to 10 business days during a 90 day period. There are no restrictions on the Portfolio's ability to withdraw investments from the Sweep Vehicle at will, and there are no unfunded capital commitments due from the Portfolio to the Sweep Vehicle. The Sweep Vehicle does not charge any management fee, sales charge or service fee.
Any purchases and sales, realized gains/losses and recorded dividends from affiliated investments during the year ended December 31, 2022 can be found in the “Schedules of Affiliated Investments” located in the Schedule of Investments.
The Portfolio is permitted to purchase or sell securities (“cross-trade”) between itself and other funds or accounts managed by the Adviser in accordance with Rule 17a-7 under the Investment Company Act of 1940 (“Rule 17a-7”), when the transaction is consistent with the investment objectives and policies of the Portfolio and in accordance with the Internal Cross Trade Procedures adopted by the Trust’s Board of Trustees. These procedures have been designed to ensure that any cross-trade of securities by the Portfolio from or to another fund or account that is or could be considered an affiliate of the Portfolio under certain limited circumstances by virtue of having a common investment adviser, common Officer, or common Trustee complies with Rule 17a-7. Under these procedures, each cross-trade is effected at the current market price to save costs where allowed. During the year ended December 31, 2022, the Portfolio engaged in cross trades amounting to $5,045,831 in sales, resulting in a net realized loss of $5,795. The net realized loss is included within the “Net Realized Gain/(Loss) on Investments” section of the Portfolio’s Statement of Operations.
5. Federal Income Tax
The tax components of capital shown in the table below represent: (1) distribution requirements the Portfolio must satisfy under the income tax regulations; (2) losses or deductions the Portfolio may be able to offset against income and gains realized in future years; and (3) unrealized appreciation or depreciation of investments for federal income tax purposes.
Other book to tax differences primarily consist of deferred compensation and derivatives. The Portfolio has elected to treat gains and losses on forward foreign currency contracts as capital gains and losses, if applicable. Other foreign currency gains and losses on debt instruments are treated as ordinary income for federal income tax purposes pursuant to Section 988 of the Internal Revenue Code.
| | | | | | | |
| | | | Other Book | Net Tax | |
Undistributed
Ordinary Income | Undistributed
Long-Term Gains | Accumulated
Capital Losses | Loss Deferrals | to Tax
Differences | Appreciation/
(Depreciation) | |
$ 2,278,724 | $ - | $ (63,940,042) | $ - | $ (17,914) | $(38,470,090) | |
Accumulated capital losses noted below represent net capital loss carryovers, as of December 31, 2022, that may be available to offset future realized capital gains and thereby reduce future taxable gains distributions. The following table shows these capital loss carryovers.
| | | | | | |
| | | | | |
Capital Loss Carryover Schedule | | |
For the year ended December 31, 2022 | | |
| No Expiration | | | |
| Short-Term | Long-Term | Accumulated
Capital Losses | | |
| $(45,100,328) | $(18,839,714) | $ (63,940,042) | | |
Janus Henderson VIT Flexible Bond Portfolio
Notes to Financial Statements
The aggregate cost of investments and the composition of unrealized appreciation and depreciation of investment securities for federal income tax purposes as of December 31, 2022 are noted below. The primary difference between book and tax appreciation or depreciation of investments are wash sale loss deferrals and investments in partnerships.
| | | | |
Federal Tax Cost | Unrealized
Appreciation | Unrealized
(Depreciation) | Net Tax Appreciation/
(Depreciation) |
$ 653,781,024 | $ 41,762 | $(38,511,852) | $ (38,470,090) |
Income and capital gains distributions are determined in accordance with income tax regulations that may differ from US GAAP. These differences are due to differing treatments for items such as net short-term gains, deferral of wash sale losses, and capital loss carryovers. Certain permanent differences such as tax returns of capital and net investment losses noted below have been reclassified to capital.
| | | | | |
For the year ended December 31, 2022 | |
Distributions | | |
From Ordinary Income | From Long-Term Capital Gains | Tax Return of Capital | Net Investment Loss | |
$ 13,321,465 | $ 9,277,768 | $ - | $ - | |
| | | | | |
For the year ended December 31, 2021 | |
Distributions | | |
From Ordinary Income | From Long-Term Capital Gains | Tax Return of Capital | Net Investment Loss | |
$ 15,543,824 | $ 11,880,640 | $ - | $ - | |
Permanent book to tax basis differences may result in reclassifications between the components of net assets. These differences have no impact on the results of operations or net assets.
6. Capital Share Transactions
| | | | | | | |
| | | | | | |
| | Year ended December 31, 2022 | | Year ended December 31, 2021 |
| | Shares | Amount | | Shares | Amount |
| | | | | | | |
Institutional Shares: | | | | | |
Shares sold | 1,620,210 | $ 16,866,364 | | 2,339,467 | $ 29,065,939 |
Reinvested dividends and distributions | 488,927 | 4,991,883 | | 552,020 | 6,673,456 |
Shares repurchased | (2,569,876) | (27,627,723) | | (3,029,983) | (37,594,340) |
Net Increase/(Decrease) | (460,739) | $ (5,769,476) | | (138,496) | $ (1,854,945) |
Service Shares: | | | | | |
Shares sold | 5,669,493 | $ 67,206,132 | | 11,479,167 | $155,187,351 |
Reinvested dividends and distributions | 1,559,781 | 17,607,350 | | 1,559,174 | 20,751,008 |
Shares repurchased | (8,042,278) | (95,588,079) | | (7,036,319) | (95,279,079) |
Net Increase/(Decrease) | (813,004) | $(10,774,597) | | 6,002,022 | $ 80,659,280 |
Janus Henderson VIT Flexible Bond Portfolio
Notes to Financial Statements
7. Purchases and Sales of Investment Securities
For the year ended December 31, 2022, the aggregate cost of purchases and proceeds from sales of investment securities (excluding any short-term securities, short-term options contracts, TBAs, and in-kind transactions, as applicable) was as follows:
| | | | |
Purchases of
Securities | Proceeds from Sales
of Securities | Purchases of Long-
Term U.S. Government
Obligations | Proceeds from Sales
of Long-Term U.S.
Government Obligations |
$269,178,851 | $ 290,604,524 | $ 693,783,410 | $ 686,077,697 |
8. Recent Accounting Pronouncements
The FASB issued Accounting Standards Update 2020-04 Reference Rate Reform: Facilitation of the Effects of Reference Rate Reform on Financial Reporting (“ASU 2020-04”) in March 2020. The new guidance in the ASU provides optional temporary financial reporting relief from the effect of certain types of contract modifications due to the planned discontinuation of the LIBOR or other interbank-offered based reference rates as of the end of 2021. For new and existing contracts, Portfolios may elect to apply the guidance as of March 12, 2020 through December 31, 2022. FASB has deferred the sunset date to December 31, 2024. Management is currently evaluating the impact, if any, of the ASU’s adoption to the Portfolio’s financial statements.
9. Subsequent Event
Management has evaluated whether any events or transactions occurred subsequent to December 31, 2022 and through the date of issuance of the Portfolio’s financial statements and determined that there were no material events or transactions that would require recognition or disclosure in the Portfolio’s financial statements.
Janus Henderson VIT Flexible Bond Portfolio
Report of Independent Registered Public Accounting Firm
To the Board of Trustees of Janus Aspen Series and Shareholders of Janus Henderson VIT Flexible Bond Portfolio
Opinion on the Financial Statements
We have audited the accompanying statement of assets and liabilities, including the schedule of investments, of Janus Henderson VIT Flexible Bond Portfolio (one of the portfolios constituting Janus Aspen Series, referred to hereafter as the "Portfolio") as of December 31, 2022, the related statement of operations for the year ended December 31, 2022, the statements of changes in net assets for each of the two years in the period ended December 31, 2022, including the related notes, and the financial highlights for each of the five years in the period ended December 31, 2022 (collectively referred to as the “financial statements”). In our opinion, the financial statements present fairly, in all material respects, the financial position of the Portfolio as of December 31, 2022, the results of its operations for the year then ended, the changes in its net assets for each of the two years in the period ended December 31, 2022 and the financial highlights for each of the five years in the period ended December 31, 2022 in conformity with accounting principles generally accepted in the United States of America.
Basis for Opinion
These financial statements are the responsibility of the Portfolio’s management. Our responsibility is to express an opinion on the Portfolio’s financial statements based on our audits. We are a public accounting firm registered with the Public Company Accounting Oversight Board (United States) (PCAOB) and are required to be independent with respect to the Portfolio in accordance with the U.S. federal securities laws and the applicable rules and regulations of the Securities and Exchange Commission and the PCAOB.
We conducted our audits of these financial statements in accordance with the standards of the PCAOB. Those standards require that we plan and perform the audit to obtain reasonable assurance about whether the financial statements are free of material misstatement, whether due to error or fraud.
Our audits included performing procedures to assess the risks of material misstatement of the financial statements, whether due to error or fraud, and performing procedures that respond to those risks. Such procedures included examining, on a test basis, evidence regarding the amounts and disclosures in the financial statements. Our audits also included evaluating the accounting principles used and significant estimates made by management, as well as evaluating the overall presentation of the financial statements. Our procedures included confirmation of securities owned as of December 31, 2022 by correspondence with the custodian, transfer agent, and brokers. We believe that our audits provide a reasonable basis for our opinion.

Denver, Colorado
February 15, 2023
We have served as the auditor of one or more investment companies in Janus Henderson Funds since 1990.
Janus Henderson VIT Flexible Bond Portfolio
Additional Information (unaudited)
Proxy Voting Policies and Voting Record
A description of the policies and procedures that the Portfolio uses to determine how to vote proxies relating to its portfolio securities is available without charge: (i) upon request, by calling 1-800-525-1093; (ii) on the Portfolio’s website at janushenderson.com/proxyvoting; and (iii) on the SEC’s website at http://www.sec.gov. Additionally, information regarding the Portfolio’s proxy voting record for the most recent twelve-month period ended June 30 is also available, free of charge, through janushenderson.com/proxyvoting and from the SEC’s website at http://www.sec.gov.
Full Holdings
The Portfolio files its complete portfolio holdings (schedule of investments) with the SEC as an exhibit to Form N-PORT within 60 days of the end of the first and third fiscal quarters, and in the annual report and semiannual report to shareholders. The Portfolio’s Form N-PORT filings and annual and semiannual reports: (i) are available on the SEC’s website at http://www.sec.gov; and (ii) are available without charge, upon request, by calling a Janus Henderson representative at 1-877-335-2687 (toll free). Portfolio holdings consisting of at least the names of the holdings are generally available on a monthly basis with a 30-day lag under Full Holdings for the Portfolio at janushenderson.com/vit.
APPROVAL OF ADVISORY AGREEMENTS DURING THE PERIOD
The Trustees of Janus Aspen Series, each of whom serves as an “independent” Trustee (the “Trustees”), oversee the management of each portfolio of Janus Aspen Series (each, a “VIT Portfolio,” and collectively, the “VIT Portfolios”), as well as each fund of Janus Investment Fund (each, a “Fund,” and collectively, the “Funds” and together with the VIT Portfolios, the “Janus Henderson Funds,” and each, a “Janus Henderson Fund”). As required by law, the Trustees determine annually whether to continue the investment advisory agreement for each Janus Henderson Fund.
In connection with their most recent consideration of those agreements for each Janus Henderson Fund, the Trustees received and reviewed information provided by Janus Henderson Investors US LLC (the “Adviser”) in response to requests of the Trustees and their independent legal counsel. They also received and reviewed information and analysis provided by, and in response to requests of, their independent fee consultant. Throughout their consideration of the agreements, the Trustees were advised by their independent legal counsel. The Trustees met with management to consider the agreements, and also met separately in executive session with their independent legal counsel and their independent fee consultant.
At meetings held on November 9-10, 2022 and December 13-14, 2022, the Trustees evaluated the information provided by the Adviser and the independent fee consultant, as well as other information provided by the Adviser and the independent fee consultant during the year. Following such evaluation, the Trustees determined that the overall arrangements between each Janus Henderson Fund and the Adviser were fair and reasonable in light of the nature, extent, and quality of the services provided by the Adviser and its affiliates, the fees charged for those services, and other matters that the Trustees considered relevant in the exercise of their business judgment, and unanimously approved the continuation of the investment advisory agreement for each Janus Henderson Fund for the period from February 1, 2023 through February 1, 2024, subject to earlier termination as provided for in each agreement.
In considering the continuation of those agreements, the Trustees reviewed and analyzed various factors that they determined were relevant, including the factors described below, none of which by itself was considered dispositive. However, the material factors and conclusions that formed the basis for the Trustees’ determination to approve the continuation of the agreements are discussed separately below. Also included is a summary of the independent fee consultant’s conclusions and opinions that arose during, and were included as part of, the Trustees’ consideration of the agreements. “Management fees,” as used herein, reflect actual annual advisory fees and, for the purpose of peer comparisons any administration fees (excluding out of pocket costs), net of any waivers, paid by a fund as a percentage of average net assets.
Nature, Extent and Quality of Services
The Trustees reviewed the nature, extent, and quality of the services provided by the Adviser to the Janus Henderson Funds, taking into account the investment objective, strategies, and policies of each Janus Henderson Fund, and the knowledge the Trustees gained from their regular meetings with management on at least a quarterly basis and their ongoing review of information related to the Janus Henderson Funds. In addition, the Trustees reviewed the resources and key personnel of the Adviser, particularly noting those employees who provide investment and risk management services to the Janus Henderson Funds. The Trustees also considered other services provided to the Janus Henderson Funds by the Adviser, such as managing the execution of portfolio transactions and the selection of broker-dealers for
Janus Henderson VIT Flexible Bond Portfolio
Additional Information (unaudited)
those transactions. The Trustees considered the Adviser’s role as administrator to the Janus Henderson Funds, noting that the Adviser generally does not receive a fee for its services as administrator, but is reimbursed for its out-of-pocket costs. The Trustees considered the role of the Adviser in monitoring adherence to the Janus Henderson Funds’ investment restrictions, providing support services for the Trustees and Trustee committees, and overseeing communications with Janus Henderson Fund shareholders and the activities of other service providers, including monitoring compliance with various policies and procedures of the Janus Henderson Funds and with applicable securities laws and regulations.
In this regard, the independent fee consultant noted that the Adviser provides a number of different services for the Janus Henderson Funds and their shareholders, ranging from investment management services to various other servicing functions, and that, in its view, the Adviser is a capable provider of those services. The independent fee consultant also provided its belief that the Adviser has developed a number of institutional competitive advantages that should enable it to provide superior investment and service performance over the long term.
The Trustees concluded that the nature, extent, and quality of the services provided by the Adviser to each Janus Henderson Fund were appropriate and consistent with the terms of the respective advisory agreements, and that, taking into account steps taken to address those Janus Henderson Funds whose performance lagged that of their peers for certain periods, the Janus Henderson Funds were likely to benefit from the continued provision of those services. They also concluded that the Adviser had sufficient personnel, with the appropriate education and experience, to serve the Janus Henderson Funds effectively and had demonstrated its ability to attract well-qualified personnel.
Performance of the Funds
The Trustees considered the performance results of each Janus Henderson Fund over various time periods. They noted that they considered Janus Henderson Fund performance data throughout the year, including periodic meetings with each Janus Henderson Fund’s portfolio manager(s), and also reviewed information comparing each Janus Henderson Fund’s performance with the performance of comparable fund peer groups identified by Broadridge Financial Solutions, Inc. (“Broadridge”), an independent data provider, and with the Janus Henderson Fund’s benchmark index. In this regard, the independent fee consultant found that the overall Janus Henderson Funds’ performance has been reasonable, noting that: (i) for the 36 months ended May 31, 2022, approximately 38% of the Janus Henderson Funds were in the top two quartiles of their Broadridge peer groups; (ii) for the 36 months ended September 30, 2022, approximately 45% of the Janus Henderson Funds were in the top two quartiles of performance as reported by Morningstar, and (iii) for the 12 months ended September 30, 2022, approximately 55% of the Janus Henderson Funds were in the top two quartiles of performance as reported by Morningstar.
The Trustees considered the performance of each Janus Henderson Fund, noting that performance may vary by share class, and noted the following with respect to the VIT Portfolios:
· For Janus Henderson Adaptive Risk Managed U.S. Equity Portfolio, the Trustees noted that the VIT Portfolio’s performance was in the bottom Broadridge quartile for the 36 months ended May 31, 2022 and the first Broadridge quartile for the 12 months ended May 31, 2022. The Trustees noted the reasons for the VIT Portfolio’s underperformance and the steps the Adviser had taken or was taking to improve performance, and that the performance trend was improving.
· For Janus Henderson Balanced Portfolio, the Trustees noted that the VIT Portfolio’s performance was in the first Broadridge quartile for the 36 months ended May 31, 2022 and the first Broadridge quartile for the 12 months ended May 31, 2022.
· For Janus Henderson Enterprise Portfolio, the Trustees noted that the VIT Portfolio’s performance was in the third Broadridge quartile for the 36 months ended May 31, 2022 and the first Broadridge quartile for the 12 months ended May 31, 2022 The Trustees noted the reasons for the VIT Portfolio’s underperformance and the steps the Adviser had taken or was taking to improve performance, and that the performance trend was improving.
· For Janus Henderson Flexible Bond Portfolio, the Trustees noted that the VIT Portfolio’s performance was in the first Broadridge quartile for the 36 months ended May 31, 2022 and the first Broadridge quartile for the 12 months ended May 31, 2022.
Janus Henderson VIT Flexible Bond Portfolio
Additional Information (unaudited)
· For Janus Henderson Forty Portfolio, the Trustees noted that the VIT Portfolio’s performance was in the second Broadridge quartile for the 36 months ended May 31, 2022 and the third Broadridge quartile for the 12 months ended May 31, 2022.
· For Janus Henderson Global Research Portfolio, the Trustees noted that the VIT Portfolio’s performance was in the first Broadridge quartile for the 36 months ended May 31, 2022 and the first Broadridge quartile for the 12 months ended May 31, 2022.
· For Janus Henderson Global Sustainable Equity Portfolio, the Trustees noted that the VIT Portfolio’s performance was in the bottom Broadridge quartile for the evaluated performance period ended May 31, 2022. The Trustees noted that 36 month-end performance was not yet available.
· For Janus Henderson Global Technology and Innovation Portfolio, the Trustees noted that the VIT Portfolio’s performance was in the second Broadridge quartile for the 36 months ended May 31, 2022 and the third Broadridge quartile for the 12 months ended May 31, 2022.
· For Janus Henderson Mid Cap Value Portfolio, the Trustees noted that the VIT Portfolio’s performance was in the bottom Broadridge quartile for the 36 months ended May 31, 2022 and the second Broadridge quartile for the 12 months ended May 31, 2022. The Trustees noted the reasons for the VIT Portfolio’s underperformance, while also noting that the VIT Portfolio has a performance fee structure that results in lower management fees during periods of underperformance, the steps the Adviser had taken or was taking to improve performance, and that the performance trend was improving.
· For Janus Henderson Overseas Portfolio, the Trustees noted that the VIT Portfolio’s performance was in the first Broadridge quartile for the 36 months ended May 31, 2022 and the first Broadridge quartile for the 12 months ended May 31, 2022.
· For Janus Henderson Research Portfolio, the Trustees noted that the VIT Portfolio’s performance was in the second Broadridge quartile for the 36 months ended May 31, 2022 and the second Broadridge quartile for the 12 months ended May 31, 2022.
In consideration of each Janus Henderson Fund’s performance, the Trustees concluded that, taking into account the factors relevant to performance, as well as other considerations, including steps taken to improve performance, as applicable, the Janus Henderson Fund’s performance warranted continuation of such Janus Henderson Fund’s investment advisory agreement.
Costs of Services Provided
The Trustees examined information regarding the fees and expenses of each Janus Henderson Fund in comparison to similar information for other comparable funds as provided by Broadridge, an independent data provider. They also reviewed an analysis of that information provided by their independent fee consultant. The independent fee consultant provided its belief that the management fees charged by the Adviser to each of the Janus Henderson Funds under the current investment advisory and administration agreements are reasonable in relation to the services provided by the Adviser. The independent fee consultant found: (1) the total expenses and management fees of the Janus Henderson Funds to be reasonable relative to other comparable mutual funds; (2) the total expenses, on average, were 6% under the average total expenses of the respective Broadridge peer group; and (3) the management fees for the Janus Henderson Funds, on average, were 5% under the average management fees for the respective Broadridge peer group. The Trustees also considered the total expenses for each share class of each Janus Henderson Fund compared to the average total expenses for its Broadridge Expense Group and to average total expenses for its Broadridge Expense Universe.
For Janus Henderson Funds with three or more years of performance history, the independent fee consultant also performed a systematic “focus list” analysis of expenses which assessed fund fees in the context of fund performance being delivered. Based on this analysis, the independent fee consultant found that the combination of service quality/performance and expenses on these individual Janus Henderson Funds was reasonable in light of performance trends, performance histories, changes in portfolio management, relative average net asset levels, and the existence of performance fees, breakpoints, and/or expense waivers on such Janus Henderson Funds.
Janus Henderson VIT Flexible Bond Portfolio
Additional Information (unaudited)
The Trustees considered the methodology used by the Adviser in determining compensation payable to portfolio managers, the competitive environment for investment management talent, and the competitive market for mutual funds in different distribution channels.
The Trustees also reviewed management fees charged by the Adviser to comparable separate account clients and to comparable non-affiliated funds subadvised by the Adviser (for which the Adviser provides only or primarily portfolio management services). Although in most instances subadvisory and separate account fee rates for various investment strategies were lower than management fee rates for Janus Henderson Funds having a similar strategy, the Trustees considered that the Adviser noted that, under the terms of the management agreements with the Janus Henderson Funds, the Adviser performs significant additional services for the Janus Henderson Funds that it does not provide to those other clients, including administration services, oversight of the Janus Henderson Funds’ other service providers, Trustee support, regulatory compliance and numerous other services, and that, in serving the Janus Henderson Funds, the Adviser assumes many legal risks and other costs that it does not assume in servicing its other clients. Moreover, the Trustees noted that the independent fee consultant found that: (1) the management fees the Adviser charges to the Janus Henderson Funds are reasonable in relation to the management fees the Adviser charges to funds subadvised by the Adviser and to the fees the Adviser charges to its institutional separate account clients; (2) these subadvised and institutional separate accounts have different service and infrastructure needs and operate in markets very different from the retail fund market; (3) Janus Henderson mutual fund investors enjoy reasonable fees relative to the fees charged in these other markets; and (4) as part of its 2022 review, 9 of 11 Janus Henderson Funds have lower management fees than similar funds subadvised by the Adviser. The Trustees noted that for the two Janus Henderson Funds that did not, management fees for each were under the average of its 15(c) peer group.
The Trustees considered the fees for each Janus Henderson Fund for its fiscal year ended in 2021 (except for Janus Henderson Global Sustainable Equity Portfolio for which the period end was March 31, 2022) and noted the following with regard to each Janus Henderson Fund’s total expenses, net of applicable fee waivers (the VIT Portfolio’s “total expenses”) as reflected in the comparative information provided by Broadridge:
· For Janus Henderson Adaptive Risk Management U.S. Equity Portfolio, the Trustees noted that the VIT Portfolio’s total expenses were below the peer group average for its sole share class.
· For Janus Henderson Balanced Portfolio, the Trustees noted that, although the VIT Portfolio’s total expenses exceeded the peer group average for one share class, overall the VIT Portfolio’s total expenses were reasonable.
· For Janus Henderson Enterprise Portfolio, the Trustees noted that, although the VIT Portfolio’s total expenses exceeded the peer group average for one share class, overall the VIT Portfolio’s total expenses were reasonable.
· For Janus Henderson Flexible Bond Portfolio, the Trustees noted that, although the VIT Portfolio’s total expenses exceeded the peer group for one share class, overall the VIT Portfolio’s total expenses were reasonable. The Trustees also noted that the Adviser has contractually agreed to limit the VIT Portfolio’s expenses.
· For Janus Henderson Forty Portfolio, the Trustees noted that, although the VIT Portfolio’s total expenses exceeded the peer group average for one share class, overall the VIT Portfolio’s total expenses were reasonable.
· For Janus Henderson Global Research Portfolio, the Trustees noted that, although the VIT Portfolio’s total expenses exceeded the peer group average for one share class, overall the VIT Portfolio’s total expenses were reasonable.
· For Janus Henderson Global Sustainable Equity Portfolio, the Trustees noted that the VIT Portfolio’s total expenses were below the peer group average for both share classes.
· For Janus Henderson Global Technology and Innovation Portfolio, the Trustees noted that the VIT Portfolio’s total expenses were below the peer group average for both share classes.
· For Janus Henderson Mid Cap Value Portfolio, the Trustees noted that, the VIT Portfolio’s total expenses were below the peer group average for both share classes.
· For Janus Henderson Overseas Portfolio, the Trustees noted that although the VIT Portfolio’s total expenses exceeded the peer group average for one share class, overall the VIT Portfolio’s total expenses were reasonable.
Janus Henderson VIT Flexible Bond Portfolio
Additional Information (unaudited)
· For Janus Henderson Research Portfolio, the Trustees noted that the VIT Portfolio’s total expenses were below the peer group average for both share classes.
The Trustees reviewed information on the overall profitability to the Adviser and its affiliates from their relationships with the Janus Henderson Funds, and considered profitability data of other publicly traded mutual fund advisers. The Trustees recognized that profitability comparisons among fund managers are difficult because of the variation in the type of comparative information that is publicly available, and the profitability of any fund manager is affected by numerous factors, including the organizational structure of the particular fund manager, differences in complex size, difference in product mix, difference in types of business (mutual fund, institutional and other), differences in the types of funds and other accounts it manages, possible other lines of business, the methodology for allocating expenses and the fund manager’s capital structure and cost of capital.
Additionally, the Trustees considered the estimated profitability to the Adviser from the investment management services it provided to each Janus Henderson Fund. In their review, the Trustees considered whether the Adviser receive adequate incentives and resources to manage the Janus Henderson Funds effectively. In reviewing profitability, the Trustees noted that the estimated profitability for an individual Janus Henderson Fund is necessarily a product of the allocation methodology utilized by the Adviser to allocate its expenses as part of the estimated profitability calculation. In this regard, the Trustees noted that the independent fee consultant found as part of its 2022 review that (1) the expense allocation methodology and rationales utilized by the Adviser were reasonable and (2) no clear correlation exists between expense allocations and operating margins. The Trustees also considered that the estimated profitability for an individual Janus Henderson Fund was influenced by a number of factors, including not only the allocation methodology selected, but also the presence of fee waivers and expense caps, and whether the Janus Henderson Fund’s investment management agreement contained breakpoints or a performance fee component. The Trustees determined, after taking into account these factors, among others, that the Adviser’s estimated profitability with respect to each Janus Henderson Fund was not unreasonable in relation to the services provided, and that the variation in the range of such estimated profitability among the Janus Henderson Funds was not a material factor in the Board’s approval of the reasonableness of any Janus Henderson Fund’s investment management fees.
The Trustees concluded that the management fees payable by each Janus Henderson Fund to the Adviser were reasonable in relation to the nature, extent, and quality of the services provided, taking into account the fees charged by other advisers for managing comparable mutual funds with similar strategies, the fees the Adviser charges to other clients, and, as applicable, the impact of fund performance on management fees payable by the Janus Henderson Funds. The Trustees also concluded that each Janus Henderson Fund’s total expenses were reasonable, taking into account the size of the Janus Henderson Fund, the quality of services provided by the Adviser, the investment performance of the Janus Henderson Fund, and any expense limitations agreed to or provided by the Adviser.
Economies of Scale
The Trustees considered information about the potential for the Adviser to realize economies of scale as the assets of the Janus Henderson Funds increase. They noted that their independent fee consultant published a report to the Trustees in June 2022 which provided its research and analysis into economies of scale. They also noted that, although many Janus Henderson Funds pay advisory fees at a fixed base rate as a percentage of net assets, without any breakpoints or performance fees, their independent fee consultant concluded that 75% of these Janus Henderson Funds’ have contractual management fees (gross of waivers) below their Broadridge Expense Group averages. The Trustees also noted the following from the independent fee consultant’s report: (1) that 31% of Janus Henderson Funds had management fee breakpoints in place whereby investors pay lower management fees as fund AUM increases; (2) that 29% of Janus Henderson Funds have low flat-rate fees and performance fees where the Adviser is incentivized to invest in resources which drive Janus Henderson Fund performance; and (3) that 39% of Janus Henderson Funds have low flat-rate fees versus peers where investors pay low fixed fees when the Janus Henderson Fund is small/midsized and higher fees when the Janus Henderson Fund grows in assets. The Trustees also noted that the Janus Henderson Funds share directly in economies of scale through the significant investments made by the Adviser and its affiliates related to services provided to the Funds and the lower charges of third-party service providers that are based in part on the combined scale of all of the Janus Henderson Funds.
The Trustees also considered the independent fee consultant’s conclusion that, given the limitations of various analytical approaches to economies of scale and their conflicting results, it is difficult to analytically confirm or deny the existence of economies of scale in the Janus Henderson complex. In this regard, the independent consultant concluded that (1) to the extent there were economies of scale at the Adviser, the Adviser’s general strategy of setting
Janus Henderson VIT Flexible Bond Portfolio
Additional Information (unaudited)
fixed management fees below peers appeared to share any such economies with investors even on smaller Janus Henderson Funds which have not yet achieved those economies and (2) by setting lower fixed fees from the start on these Janus Henderson Funds, the Adviser appeared to be investing to increase the likelihood that these Janus Henderson Funds will grow to a level to achieve any economies of scale that may exist. Further, the independent fee consultant provided its belief that Janus Henderson Fund investors are well-served by the fee levels and performance fee structures in place on the Janus Henderson Funds in light of any economies of scale that may be present at the Adviser.
Based on all of the information reviewed, including the recent and past research and analysis conducted by the Trustees’ independent fee consultant, the Trustees concluded that the current fee structure of each Janus Henderson Fund was reasonable and that the current rates of fees do reflect a sharing between the Adviser and the Janus Henderson Fund of any economies of scale that may be present at the current asset level of the Janus Henderson Fund.
Other Benefits to the Adviser
The Trustees also considered benefits that accrue to the Adviser and its affiliates from their relationships with the Janus Henderson Funds. They recognized that two affiliates of the Adviser separately serve the Janus Henderson Funds as transfer agent and distributor, respectively, and the transfer agent receives compensation directly from the non-money market Janus Henderson Funds for services provided, and that such compensation contributes to the overall profitability of the Adviser and its affiliates that results from their relationship with the Janus Henderson Funds. The Trustees also considered the Adviser’s past and proposed use of commissions paid by the Janus Henderson Funds on portfolio brokerage transactions to obtain proprietary and third-party research products and services benefiting the Janus Henderson Fund and/or other clients of the Adviser and/or the Adviser. The Trustees concluded that the Adviser’s use of these types of client commission arrangements to obtain proprietary and third-party research products and services was consistent with regulatory requirements and guidelines and was likely to benefit each Janus Henderson Fund. The Trustees also concluded that, other than the services provided by the Adviser and its affiliates pursuant to the agreements and the fees to be paid by each Janus Henderson Fund therefor, the Janus Henderson Funds and the Adviser may potentially benefit from their relationship with each other in other ways. They concluded that the Adviser and its affiliates share directly in economies of scale through the lower charges of third-party service providers that are based in part on the combined scale of the Janus Henderson Funds and other clients serviced by the Adviser and its affiliates. They also concluded that the Adviser benefits from the receipt of research products and services acquired through commissions paid on portfolio transactions of the Janus Henderson Funds and that the Janus Henderson Funds benefit from the Adviser’s receipt of those products and services as well as research products and services acquired through commissions paid by other clients of the Adviser. They further concluded that the success of any Janus Henderson Fund could attract other business to the Adviser or other Janus Henderson Funds, and that the success of the Adviser could enhance the Adviser’s ability to serve the Janus Henderson Funds.
Janus Henderson VIT Flexible Bond Portfolio
Useful Information About Your Portfolio Report (unaudited)
Management Commentary
The Management Commentary in this report includes valuable insight as well as statistical information to help you understand how your Portfolio’s performance and characteristics stack up against those of comparable indices.
If the Portfolio invests in foreign securities, this report may include information about country exposure. Country exposure is based primarily on the country of risk. A company may be allocated to a country based on other factors such as location of the company’s principal office, the location of the principal trading market for the company’s securities, or the country where a majority of the company’s revenues are derived.
Please keep in mind that the opinions expressed in the Management Commentary are just that: opinions. They are a reflection based on best judgment at the time this report was compiled, which was December 31, 2022. As the investing environment changes, so could opinions. These views are unique and are not necessarily shared by fellow employees or by Janus Henderson in general.
Performance Overviews
Performance overview graphs compare the performance of a hypothetical $10,000 investment in the Portfolio with one or more widely used market indices. When comparing the performance of the Portfolio with an index, keep in mind that market indices are not available for investment and do not reflect deduction of expenses.
Average annual total returns are quoted for a Portfolio with more than one year of performance history. Average annual total return is calculated by taking the growth or decline in value of an investment over a period of time, including reinvestment of dividends and distributions, then calculating the annual compounded percentage rate that would have produced the same result had the rate of growth been constant throughout the period. Average annual total return does not reflect the deduction of taxes that a shareholder would pay on Portfolio distributions or redemptions of Portfolio shares.
Cumulative total returns are quoted for a Portfolio with less than one year of performance history. Cumulative total return is the growth or decline in value of an investment over time, independent of the period of time involved. Cumulative total return does not reflect the deduction of taxes that a shareholder would pay on Portfolio distributions or redemptions of Portfolio shares.
Pursuant to federal securities rules, expense ratios shown in the performance chart reflect subsidized (if applicable) and unsubsidized ratios. The total annual fund operating expenses ratio is gross of any fee waivers, reflecting the Portfolio’s unsubsidized expense ratio. The net annual fund operating expenses ratio (if applicable) includes contractual waivers of the Adviser and reflects the Portfolio’s subsidized expense ratio. Ratios may be higher or lower than those shown in the “Financial Highlights” in this report.
Schedule of Investments
Following the performance overview section is the Portfolio’s Schedule of Investments. This schedule reports the types of securities held in the Portfolio on the last day of the reporting period. Securities are usually listed by type (common stock, corporate bonds, U.S. Government obligations, etc.) and by industry classification (banking, communications, insurance, etc.). Holdings are subject to change without notice.
The value of each security is quoted as of the last day of the reporting period. The value of securities denominated in foreign currencies is converted into U.S. dollars.
If the Portfolio invests in foreign securities, it will also provide a summary of investments by country. This summary reports the Portfolio exposure to different countries by providing the percentage of securities invested in each country. The country of each security represents the country of risk. The Portfolio’s Schedule of Investments relies upon the industry group and country classifications published by Bloomberg and/or MSCI Inc.
Tables listing details of individual forward currency contracts, futures, written options, swaptions, and swaps follow the Portfolio’s Schedule of Investments (if applicable).
Statement of Assets and Liabilities
This statement is often referred to as the “balance sheet.” It lists the assets and liabilities of the Portfolio on the last day of the reporting period.
Janus Henderson VIT Flexible Bond Portfolio
Useful Information About Your Portfolio Report (unaudited)
The Portfolio’s assets are calculated by adding the value of the securities owned, the receivable for securities sold but not yet settled, the receivable for dividends declared but not yet received on securities owned, and the receivable for Portfolio shares sold to investors but not yet settled. The Portfolio’s liabilities include payables for securities purchased but not yet settled, Portfolio shares redeemed but not yet paid, and expenses owed but not yet paid. Additionally, there may be other assets and liabilities such as unrealized gain or loss on forward currency contracts.
The section entitled “Net Assets Consist of” breaks down the components of the Portfolio’s net assets. Because the Portfolio must distribute substantially all earnings, you will notice that a significant portion of net assets is shareholder capital.
The last section of this statement reports the net asset value (“NAV”) per share on the last day of the reporting period. The NAV is calculated by dividing the Portfolio’s net assets for each share class (assets minus liabilities) by the number of shares outstanding.
Statement of Operations
This statement details the Portfolio’s income, expenses, realized gains and losses on securities and currency transactions, and changes in unrealized appreciation or depreciation of Portfolio holdings.
The first section in this statement, entitled “Investment Income,” reports the dividends earned from securities and interest earned from interest-bearing securities in the Portfolio.
The next section reports the expenses incurred by the Portfolio, including the advisory fee paid to the investment adviser, transfer agent fees and expenses, and printing and postage for mailing statements, financial reports and prospectuses. Expense offsets and expense reimbursements, if any, are also shown.
The last section lists the amounts of realized gains or losses from investment and foreign currency transactions, and changes in unrealized appreciation or depreciation of investments and foreign currency-denominated assets and liabilities. The Portfolio will realize a gain (or loss) when it sells its position in a particular security. A change in unrealized gain (or loss) refers to the change in net appreciation or depreciation of the Portfolio during the reporting period. “Net Realized and Unrealized Gain/(Loss) on Investments” is affected both by changes in the market value of Portfolio holdings and by gains (or losses) realized during the reporting period.
Statements of Changes in Net Assets
These statements report the increase or decrease in the Portfolio’s net assets during the reporting period. Changes in the Portfolio’s net assets are attributable to investment operations, dividends and distributions to investors, and capital share transactions. This is important to investors because it shows exactly what caused the Portfolio’s net asset size to change during the period.
The first section summarizes the information from the Statement of Operations regarding changes in net assets due to the Portfolio’s investment operations. The Portfolio’s net assets may also change as a result of dividend and capital gains distributions to investors. If investors receive their dividends and/or distributions in cash, money is taken out of the Portfolio to pay the dividend and/or distribution. If investors reinvest their dividends and/or distributions, the Portfolio’s net assets will not be affected.
The reinvestment of dividends and distributions is included under “Capital Share Transactions.” “Capital Shares” refers to the money investors contribute to the Portfolio through purchases or withdrawals via redemptions. The Portfolio’s net assets will increase and decrease in value as investors purchase and redeem shares from the Portfolio.
Financial Highlights
This schedule provides a per-share breakdown of the components that affect the Portfolio’s NAV for current and past reporting periods as well as total return, asset size, ratios, and portfolio turnover rate.
The first line in the table reflects the NAV per share at the beginning of the reporting period. The next line reports the net investment income/(loss) per share. Following is the per share total of net gains/(losses), realized and unrealized. Per share dividends and distributions to investors are then subtracted to arrive at the NAV per share at the end of the period. The next line reflects the total return for the period. The total return may include adjustments in accordance with generally accepted accounting principles required at the period end for financial reporting purposes. As a result, the total return may differ from the total return reflected for individual shareholder transactions. Also included are ratios of expenses and net investment income to average net assets.
Janus Henderson VIT Flexible Bond Portfolio
Useful Information About Your Portfolio Report (unaudited)
The Portfolio’s expenses may be reduced through expense offsets and expense reimbursements. The ratios shown reflect expenses before and after any such offsets and reimbursements.
The ratio of net investment income/(loss) summarizes the income earned less expenses, divided by the average net assets of the Portfolio during the reporting period. Do not confuse this ratio with the Portfolio’s yield. The net investment income ratio is not a true measure of the Portfolio’s yield because it does not take into account the dividends distributed to the Portfolio’s investors.
The next figure is the portfolio turnover rate, which measures the buying and selling activity in the Portfolio. Portfolio turnover is affected by market conditions, changes in the asset size of the Portfolio, fluctuating volume of shareholder purchase and redemption orders, the nature of the Portfolio’s investments, and the investment style and/or outlook of the portfolio manager(s) and/or investment personnel. A 100% rate implies that an amount equal to the value of the entire portfolio was replaced once during the fiscal year; a 50% rate means that an amount equal to the value of half the portfolio is traded in a year; and a 200% rate means that an amount equal to the value of the entire portfolio is traded every six months.
Janus Henderson VIT Flexible Bond Portfolio
Designation Requirements (unaudited)
For federal income tax purposes, the Portfolio designated the following for the year ended December 31, 2022:
| | |
| | |
Section 163(j) Interest Dividend | 89% |
Capital Gain Distributions | $9,277,768 |
Janus Henderson VIT Flexible Bond Portfolio
Trustees and Officers (unaudited)
The following are the Trustees and officers of the Trust, together with a brief description of their principal occupations during the last five years (principal occupations for certain Trustees may include periods over five years). The Portfolio’s Statement of Additional Information includes additional information about the Trustees and officers and is available, without charge, by calling 1-877-335-2687.
Each Trustee has served in that capacity since he or she was originally elected or appointed. The Trustees do not serve a specified term of office. Each Trustee will hold office until the termination of the Trust or his or her earlier death, resignation, retirement, incapacity, or removal. Under the Portfolio’s Governance Procedures and Guidelines, the policy is for Trustees to retire no later than the end of the calendar year in which the Trustee turns 75. The Trustees review the Portfolio’s Governance Procedures and Guidelines from time to time and may make changes they deem appropriate. The Portfolio’s Nominating and Governance Committee will consider nominees for the position of Trustee recommended by shareholders. Shareholders may submit the name of a candidate for consideration by the Committee by submitting their recommendations to the Trust’s Secretary. Each Trustee is currently a Trustee of one other registered investment company advised by the Adviser: Janus Investment Fund. Collectively, these two registered investment companies consist of 51 series or funds referred to herein as the Fund Complex.
The Trust’s officers are elected annually by the Trustees for a one-year term. Certain officers also serve as officers of Janus Investment Fund. Certain officers of the Portfolio may also be officers and/or directors of the Adviser. Except as otherwise disclosed, Portfolio officers receive no compensation from the Portfolio, except for the Portfolio’s Chief Compliance Officer, as authorized by the Trustees.
Janus Henderson VIT Flexible Bond Portfolio
Trustees and Officers (unaudited)
| | | | | | |
TRUSTEES |
Name, Address, and Age | Positions Held with the Trust | Length of Time Served | Principal Occupations During the Past Five Years | Number of Portfolios/Funds in Fund Complex Overseen by Trustee | Other Directorships Held by Trustee During the Past Five Years |
Independent Trustees | | | | |
Alan A. Brown
151 Detroit Street
Denver, CO 80206
DOB: 1962 | Chairman
Trustee | 5/22-Present
1/13-Present | Principal, Curam Holdings LLC (since 2018). Formerly, Executive Vice President, Institutional Markets, of Black Creek Group (private equity real estate investment management firm) (2012-2018), Executive Vice President and Co-Head, Global Private Client Group (2007-2010), Executive Vice President, Mutual Funds (2005-2007), and Chief Marketing Officer (2001-2005) of Nuveen Investments, Inc. (asset management). | 51 | Advisory Board Member of AEW Core Property Trust (open-end property fund) (since 2020), and Director of WTTW (PBS affiliate) (since 2003). Formerly, Director of MotiveQuest LLC (strategic social market research company) (2003-2016), Director of Nuveen Global Investors LLC (2007-2011), Director of Communities in Schools (2004-2010), and Director of Mutual Fund Education Alliance (until 2010). |
Cheryl D. Alston
151 Detroit Street
Denver, CO 80206
DOB: 1966 | Trustee | 8/22-Present | Executive Director and Chief Investment Officer, Employees’ Retirement Fund of the City of Dallas (since 2004). | 51 | Director of Blue Cross Blue Shield of Kansas City (a not-for-profit health insurance provider) (since 2016) and Director of Global Life Insurance (life and supplemental health insurance provider) (since 2017). Formerly, Director of Federal Home Loan Bank of Dallas (2017-2021). |
Janus Henderson VIT Flexible Bond Portfolio
Trustees and Officers (unaudited)
| | | | | | |
TRUSTEES |
Name, Address, and Age | Positions Held with the Trust | Length of Time Served | Principal Occupations During the Past Five Years | Number of Portfolios/Funds in Fund Complex Overseen by Trustee | Other Directorships Held by Trustee During the Past Five Years |
Independent Trustees | | | | |
William D. Cvengros
151 Detroit Street
Denver, CO 80206
DOB: 1948 | Trustee | 1/11-Present | Chief Executive Officer of SJC Capital, LLC (a personal investment company and consulting firm) (since 2002). Formerly, Chief Executive Officer and President of PIMCO Advisors Holdings L.P. (a publicly traded investment management firm) (1994-2000), and Chief Investment Officer (1987-1994) and Vice Chairman and Director (1990-1994) of Pacific Life Insurance Company (a mutual life insurance and annuity company) (1987-1994). | 51 | Member, Limited Partner Advisory Committee, Karmel Capital Fund III (since 2022), Member of the Investment Committee for the Orange Country Community Foundation (a grantmaking foundation) (since 2020), Advisory Board Member, RevOZ Fund LP and related funds (real estate investments for opportunity zones) (since 2020), and Advisory Board Member, Innovate Partners Emerging Growth and Equity Fund I (early stage venture capital fund) (since 2014). Formerly, Managing Trustee of National Retirement Partners Liquidating Trust (2013-2016), Chairman, National Retirement Partners, Inc. (formerly a network of advisors to 401(k) plans) (2005-2013), Director of Prospect Acquisition Corp. (a special purpose acquisition corporation) (2007-2009), Director of RemedyTemp, Inc. (temporary help services company) (1996-2006), and Trustee of PIMCO Funds Multi-Manager Series (1990-2000) and Pacific Life Variable Life & Annuity Trusts (1987-1994). |
Janus Henderson VIT Flexible Bond Portfolio
Trustees and Officers (unaudited)
| | | | | | |
TRUSTEES |
Name, Address, and Age | Positions Held with the Trust | Length of Time Served | Principal Occupations During the Past Five Years | Number of Portfolios/Funds in Fund Complex Overseen by Trustee | Other Directorships Held by Trustee During the Past Five Years |
Independent Trustees | | | | |
Raudline Etienne
151 Detroit Street
Denver, CO 80206
DOB: 1965 | Trustee | 6/16-Present | Founder, Daraja Capital (advisory and investment firm) (since 2016). Formerly, Senior Vice President and Senior Advisor, Albright Stonebridge Group LLC (global strategy firm) (2011-2021), and Deputy Comptroller and Chief Investment Officer, New York State Common Retirement Fund (public pension fund) (2008-2011). | 51 | Member of the Investment Committee for Cooper Union (private college) (since 2021), Board Member, Van Alen Institute (nonprofit architectural and design organization) (2019-2022). |
Janus Henderson VIT Flexible Bond Portfolio
Trustees and Officers (unaudited)
| | | | | | |
TRUSTEES |
Name, Address, and Age | Positions Held with the Trust | Length of Time Served | Principal Occupations During the Past Five Years | Number of Portfolios/Funds in Fund Complex Overseen by Trustee | Other Directorships Held by Trustee During the Past Five Years |
Independent Trustees | | | | |
Darrell B. Jackson
151 Detroit Street
Denver, CO 80206
DOB: 1958 | Trustee | 8/22-Present | President and Chief Executive Officer, The Efficace Group Inc. (since 2018). Formerly, President and Chief Executive Officer, Seaway Bank and Trust Company (community bank) (2014-2015), and Executive Vice President and Co-President, Wealth Management (2009-2014), and several senior positions, including Group Executive, Senior Vice President, and Vice President (1995-2009) of Northern Trust Company (financial services company) (1995-2014). | 51 | Director of Amalgamated Financial Corp (bank) (since August 2021), Director of YR Media (a not-for-profit production company) (since 2021), and Director of Gray-Bowen-Scott (transportation project consulting firm) (since April 2020). Formerly, Director of Delaware Place Bank (closely held commercial bank) (2016-2018) and Director of Seaway Bank and Trust Company (2014-2015). |
Janus Henderson VIT Flexible Bond Portfolio
Trustees and Officers (unaudited)
| | | | | | |
TRUSTEES |
Name, Address, and Age | Positions Held with the Trust | Length of Time Served | Principal Occupations During the Past Five Years | Number of Portfolios/Funds in Fund Complex Overseen by Trustee | Other Directorships Held by Trustee During the Past Five Years |
Independent Trustees | | | | |
William F. McCalpin
151 Detroit Street
Denver, CO 80206
DOB: 1957 | Trustee | 6/02-Present | Chief Executive Officer, muun chi LLC (organic food business) (since 2022) and Independent Consultant (since 2019). Formerly, Chief Operating Officer, muun chi LLC (2020-2022), Managing Partner, Impact Investments, Athena Capital Advisors LLC (independent registered investment advisor) (2016-2019), Managing Director, Holos Consulting LLC (provides consulting services to foundations and other nonprofit organizations) (2009-2016), Chief Executive Officer, Imprint Capital Advisors (impact investment firm) (2013-2015), and Executive Vice President and Chief Operating Officer of The Rockefeller Brothers Fund (a private family foundation) (1998-2006). | 51 | Chairman of the Board and Trustee of The Investment Fund for Foundations Investment Program (TIP) (consisting of 1 fund) (since 2008). Formerly, Director of the F.B. Heron Foundation (a private grantmaking foundation) (2006-2022), and Director of Mutual Fund Directors Forum (a non-profit organization serving independent directors of U.S. mutual funds) (2016-2021). |
Janus Henderson VIT Flexible Bond Portfolio
Trustees and Officers (unaudited)
| | | | | | |
TRUSTEES |
Name, Address, and Age | Positions Held with the Trust | Length of Time Served | Principal Occupations During the Past Five Years | Number of Portfolios/Funds in Fund Complex Overseen by Trustee | Other Directorships Held by Trustee During the Past Five Years |
Independent Trustees | | | | |
Gary A. Poliner
151 Detroit Street
Denver, CO 80206
DOB: 1953 | Trustee | 6/16-Present | Retired. Formerly, President (2010-2013) of Northwestern Mutual Life Insurance Company. | 51 | Director of MGIC Investment Corporation (private mortgage insurance) (since 2013). Formerly, Director, West Bend Mutual Insurance Company (property/casualty insurance) (2013-2021), Trustee of Northwestern Mutual Life Insurance Company (2010-2013) and Director of Frank Russell Company (global asset management firm) (2008-2013). |
Diane L. Wallace
151 Detroit Street
Denver, CO 80206
DOB: 1958 | Trustee | 6/17-Present | Retired. Formerly, Chief Operating Officer, Senior Vice President-Operations, and Chief Financial Officer for Driehaus Capital Management, LLC (1988-2006) and Treasurer for Driehaus Mutual Funds (1996-2002). | 51 | Formerly, Director of Family Service of Lake County (2019-2021), Independent Trustee, Henderson Global Funds (13 portfolios) (2015-2017), Independent Trustee, State Farm Associates' Funds Trust, State Farm Mutual Fund Trust, and State Farm Variable Product Trust (28 portfolios) (2013-2017). |
Janus Henderson VIT Flexible Bond Portfolio
Trustees and Officers (unaudited)
| | | | |
OFFICERS |
Name, Address, and Age | Positions Held with the Trust | Term of Office* and Length of Time Served | Principal Occupations During the Past Five Years |
Michael Keough
151 Detroit Street
Denver, CO 80206
DOB: 1978 | Executive Vice President and Co-Portfolio Manager Janus Henderson Flexible Bond Portfolio | 12/15-Present | Portfolio Manager for other Janus Henderson accounts. |
Greg Wilensky
151 Detroit Street
Denver, CO 80206
DOB: 1967 | Executive Vice President and Co-Portfolio Manager Janus Henderson Flexible Bond Portfolio | 2/20-Present | Head of U.S. Fixed Income of Janus Henderson Investors and Portfolio Manager for other Janus Henderson accounts. Formerly, Director and Lead Portfolio Manager of the U.S. Multi-Sector Fixed Income team at AllianceBernstein (2007-2019). |
Michelle Rosenberg
151 Detroit Street
Denver, CO 80206
DOB: 1973 | President and Chief Executive Officer | 9/22-Present | General Counsel and Corporate Secretary of Janus Henderson Investors (since 2018). Formerly, Interim President and Chief Executive Officer of the Trust and Janus Investment Fund (2022), Senior Vice President and Head of Legal, North America of Janus Henderson Investors (2017-2018) and Deputy General Counsel of Janus Henderson US (Holdings) Inc. (2015-2018). |
* Officers are elected at least annually by the Trustees for a one-year term and may also be elected from time to time by the Trustees for an interim period. |
| |
| |
| |
Janus Henderson VIT Flexible Bond Portfolio
Trustees and Officers (unaudited)
| | | | |
OFFICERS |
Name, Address, and Age | Positions Held with the Trust | Term of Office* and Length of Time Served | Principal Occupations During the Past Five Years |
Kristin Mariani
151 Detroit Street
Denver, CO 80206
DOB: 1966 | Vice President and Chief Compliance Officer | 7/20-Present | Head of Compliance, North America at Janus Henderson Investors (since September 2020), and Chief Compliance Officer at Janus Henderson Investors US LLC (since September 2017). Formerly, Anti-Money Laundering Officer for the Trust and Janus Investment Fund (July 2020-December 2022), Global Head of Investment Management Compliance at Janus Henderson Investors (February 2019-August 2020), Vice President, Head of Global Distribution Compliance and Chief Compliance Officer at Janus Henderson Distributors US LLC (May 2017-September 2017), Vice President, Compliance at Janus Henderson US (Holdings) Inc., Janus Henderson Investors US LLC, and Janus Henderson Distributors US LLC (2009-2017). |
Jesper Nergaard
151 Detroit Street
Denver, CO 80206
DOB: 1962 | Chief Financial Officer
Vice President, Treasurer, and Principal Accounting Officer | 3/05-Present
2/05-Present | Head of U.S. Fund Administration, Janus Henderson Investors and Janus Henderson Services US LLC. |
Abigail J. Murray
151 Detroit Street
Denver, CO 80206
DOB: 1975 | Vice President, Chief Legal Officer, and Secretary | 12/20-Present | Managing Counsel (since 2020). Formerly, Senior Counsel for Invesco Ltd. (2017-2020), and Vice President and Senior Counsel, ALPS Fund Services, Inc. and Assistant General Counsel, ALPS Advisors, Inc. (2015-2017). |
Ciaran Askin
151 Detroit Street
Denver, CO 80206
DOB: 1978 | Anti-Money Laundering Officer | 12/22-Present | Global Head of Financial Crime, Janus Henderson Investors (since 2022). Formerly, Global Head of Financial Crime for Invesco Ltd. (2017-2022). |
* Officers are elected at least annually by the Trustees for a one-year term and may also be elected from time to time by the Trustees for an interim period. |
| | | | | | | | |
| | | | | |

| | | | |
This report is submitted for the general information of shareholders of the Portfolio. It is not an offer or solicitation for the Portfolio and is not authorized for distribution to prospective investors unless preceded or accompanied by an effective prospectus. |
Janus Henderson is a trademark of Janus Henderson Group plc or one of its subsidiaries. © Janus Henderson Group plc Janus Henderson Distributors US LLC |
| | | | 109-02-81114 03-23 |
| | | |
| | | |
| | | ANNUAL REPORT December 31, 2022 |
| | |
| | Janus Henderson VIT Forty Portfolio |
| | |
| | Janus Aspen Series |
| |
| | | |
| | | HIGHLIGHTS · Portfolio management perspective · Investment strategy behind your portfolio · Portfolio performance, characteristics
and holdings |
Table of Contents
Janus Henderson VIT Forty Portfolio
Janus Henderson VIT Forty Portfolio (unaudited)
| | | | | | |
| | | 
Brian Recht co-portfolio manager | 
Doug Rao co-portfolio manager | 
Nick Schommer co-portfolio manager |
| | | |
PERFORMANCE OVERVIEW
For the 12-month period ended December 31, 2022, Janus Henderson VIT Forty Portfolio’s Institutional Shares and Service Shares returned -33.55% and -33.73%, respectively, versus a return of -29.14% for the Portfolio’s primary benchmark, the Russell 1000® Growth Index. The Portfolio’s secondary benchmark, the S&P 500® Index, returned -18.11% for the period.
INVESTMENT ENVIRONMENT
The period began with an improvement in the COVID-19 health situation, but investor mood soured rapidly as the Fed realized it was behind the curve in fighting inflation. High and rising inflation was then exacerbated by spiking energy and commodities prices following Russia’s invasion of Ukraine. This unabating inflationary pressure forced the Fed to pivot its policy with an aggressive reduction in liquidity, both through rate hikes and a faster-than-expected reduction in the size of its balance sheet. In total, the Fed raised interest rates by 425 basis points (bps) in 2022. In June, year-over-year headline inflation peaked before cooling energy and goods prices initiated a downward trend in prices.
PERFORMANCE DISCUSSION
The Portfolio underperformed both its primary benchmark, the Russell 1000 Growth Index, and its secondary benchmark, the S&P 500 Index, during the year ended December 31, 2022. Stock selection in the Portfolio detracted from performance relative to the primary benchmark during the period.
As part of our investment strategy, we seek companies that have built clear, sustainable, competitive moats around their businesses, which gives them the potential to grow market share within their respective industries over time. Important competitive advantages could include a strong brand, network effects from a product or service that would be hard for a competitor to replicate, a lower cost structure than competitors in the industry, a distribution advantage, or patent protection over valuable intellectual property. We think emphasizing these sustainable competitive advantages can be a meaningful driver of outperformance over longer time horizons.
Social media operator Snap was among the top detractors from relative performance. The company suffered earlier in the period, as it faced difficulty in measuring advertisers’ conversion rates due to Apple’s iOS privacy changes. Later, the company had a more difficult time than expected gaining market share amidst a weakening environment for advertising revenue. We exited our position in the stock during the period.
Medical device company Align, which designs, manufactures, and markets dentistry products such as Invisalign, was also among the top detractors. During the period, the company’s revenue slowed significantly. This slowing was likely due to a combination of the fact that demand for their clear aligner product was pulled forward during the pandemic more than previously expected and also that overall consumer spending on big-ticket items declined as the macroeconomic outlook grew more cloudy. We exited our position in the stock during the period.
Cloud-based customer engagement platform Twilio was also a detractor. At the onset of the COVID-19 pandemic, demand for Twilio’s core products grew swiftly as digital transformation efforts accelerated. However the stock suffered throughout 2022 from difficult year-over-year comparisons, lowered growth expectations, and weaker margins. High-growth stocks with expected cash flows far out into the future also generally fell during the period as interest rates rose significantly. We exited our position in the stock during the period.
Agriculture and industrial equipment manufacturer Deere & Company was among the top contributors. Deere reported strong volumes with a solid outlook for its 2023 order book during the period, as farmers continue to be supported by elevated agricultural commodity prices.
Janus Henderson VIT Forty Portfolio (unaudited)
Deere has also benefited from the market’s recognition that the company is transitioning from a cyclical, agricultural-based company to a technology-centric provider of precision agriculture products.
CoStar Group, a provider of real estate information, analytics, and online marketplaces was also among the top relative contributors. Apartment owners’ incentive to advertise using CoStar’s services increased as apartment inventory and vacancy rates have risen following a historically tight rental market. The company also benefitted from a subscription-based recurring revenue model and significant cash on its balance sheet.
TJX Companies, the parent company of retailers such as T.J. Maxx and Marshalls, was another contributor. As an off-price retailer, TJX benefited from a buildup of excess inventory at full-price sellers. This surplus allowed TJX to buy high-quality inventory at a discount and distribute it across its stores. TJX has also benefited from consumers searching for bargains in a weaker economic environment.
OUTLOOK
In general, 2022 was a difficult year for risk assets as the Fed realized it was behind the curve in fighting inflation and raised interest rates by 425 bps during the year. This significantly increased the discount rates used to value assets. While the Fed has substantially raised rates, it has also contended with stubbornly strong consumer and labor markets, complicating its task of reducing inflation. In recent years, consumer strength has been supported by multiple factors including stimulus, rising wages, strong housing and capital markets, and pent-up demand. Labor participation remains below pre-pandemic levels and unemployment sits near record lows, driving above-average wage inflation.
Though the Fed continues to maintain its hawkish stance, we are beginning to see evidence that could indicate an eventual slowdown in consumer spending. Higher rates are beginning to be felt on both the housing and investment portions of household balance sheets. Consumers are spending at a rate faster than income growth, which is unsustainable. Personal savings are being drawn down, and there has been an uptick in revolving (credit card) debt. We are also seeing corporations tighten their belts in anticipation of a weaker economy including recent layoffs in some white-collar industries. These forces could begin to push down inflation as their effects ripple through the economy. That said, there remains a great deal of uncertainty around quantifying the effects of an economic downturn and the impacts on corporate earnings in 2023.
Looking forward, we think the world has entered a new and changed investment environment where the previous decades of globalization have shifted toward de-globalization and reindustrialization. Supply-chain issues and national security concerns, brought to a head by the pandemic and recent geopolitical strife, have solidified these long-term themes. We think these factors will fuel an increase in onshore production and accompanying automation. Thus, we continue to invest in front of these themes around digitization and productivity while at the same time being mindful of diversifying across company valuations and growth rates. We are confident that we are positioned well for this changing environment.
Overall, we are increasingly excited about the opportunities we are seeing in growth equities. We believe there are competitively advantaged, materially higher-growth companies now trading at valuations similar to the overall benchmark. We are cognizant that we are entering a period of structurally higher rates and inflation, and we recognize that it may be more challenging for companies to expand valuation multiples and/or improve profit margins. Thus, we take comfort in owning a concentrated set of innovative companies with significant competitive advantages and the potential to drive sustainable revenue and cash flow growth.
Thank you for your investment in Janus Henderson VIT Forty Portfolio.
Janus Henderson VIT Forty Portfolio (unaudited)
Portfolio At A Glance
December 31, 2022
| | | | | | | | | | |
| | | | | | | | | |
| | | | | | | | | |
| | | | | | | | | |
| 5 Top Contributors - Holdings | 5 Top Detractors - Holdings |
| | Average
Weight | | Relative
Contribution | | | Average
Weight | | Relative
Contribution |
| Deere & Co | 3.59% | | 1.17% | | Snap Inc - Class A | 1.41% | | -1.84% |
| Mastercard Inc | 5.70% | | 0.84% | | Align Technology Inc | 1.50% | | -1.21% |
| TJX Cos Inc | 2.46% | | 0.65% | | Twilio Inc | 0.97% | | -0.99% |
| CoStar Group Inc | 2.50% | | 0.62% | | Rivian Automotive Inc - Class A | 0.59% | | -0.64% |
| UnitedHealth Group Inc | 2.77% | | 0.49% | | Match Group Inc | 1.29% | | -0.64% |
| | | | | | | |
| 5 Top Contributors - Sectors* | | | | | |
| | | Relative | | Portfolio | Russell 1000 Growth Index |
| | | Contribution | | Average Weight | Average Weight |
| Industrials | | 0.93% | | 6.31% | 6.83% |
| Consumer Discretionary | | 0.75% | | 17.16% | 16.96% |
| Other** | | 0.31% | | 2.24% | 0.00% |
| Real Estate | | 0.04% | | 3.05% | 1.71% |
| Utilities | | -0.01% | | 0.00% | 0.04% |
| | | | | | |
| | | | | | |
| 5 Top Detractors - Sectors* | | | | | |
| | | Relative | | Portfolio | Russell 1000 Growth Index |
| | | Contribution | | Average Weight | Average Weight |
| Communication Services | | -2.75% | | 10.83% | 8.94% |
| Information Technology | | -1.15% | | 38.36% | 44.69% |
| Health Care | | -1.00% | | 13.95% | 10.66% |
| Consumer Staples | | -0.61% | | 1.39% | 5.13% |
| Energy | | -0.39% | | 0.00% | 1.05% |
| | | | | | | |
| Relative contribution reflects how the portolio's holdings impacted return relative to the benchmark. Cash and securities not held in the portfolio are not shown. For equity portfolios, relative contribution compares the performance of a security in the portfolio to the benchmark's total return, factoring in the difference in weight of that security in the benchmark. Returns are calculated using daily returns and previous day ending weights rolled up by ticker, excluding fixed income securities, gross of advisory fees, may exclude certain derivatives and will differ from actual performance.
Performance attribution reflects returns gross of advisory fees and may differ from actual returns as they are based on end of day holdings. Attribution is calculated by geometrically linking daily returns for the portfolio and index. |
* | Based on sector classification according to the Global Industry Classification Standard (“GICS”) codes, which are the exclusive property and a service mark of MSCI Inc. and Standard & Poor’s. |
** | Not a GICS classified sector. |
Janus Henderson VIT Forty Portfolio (unaudited)
Portfolio At A Glance
December 31, 2022
| | |
5 Largest Equity Holdings - (% of Net Assets) |
Microsoft Corp | |
Software | 10.9% |
Mastercard Inc | |
Information Technology Services | 7.0% |
Apple Inc | |
Technology Hardware, Storage & Peripherals | 5.8% |
Workday Inc - Class A | |
Software | 4.6% |
Amazon.com Inc | |
Internet & Direct Marketing Retail | 4.5% |
| | 32.8% |
| | | | | | |
Asset Allocation - (% of Net Assets) | |
Common Stocks | | 97.8% | |
Investment Companies | | 2.6% | |
Other | | (0.4)% |
| | | 100.0% |
| | |
Top Country Allocations - Long Positions - (% of Investment Securities) |
As of December 31, 2022 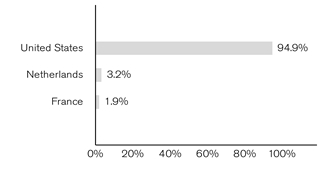
| As of December 31, 2021 
|
Janus Henderson VIT Forty Portfolio (unaudited)
Performance
| |
See important disclosures on the next page. |
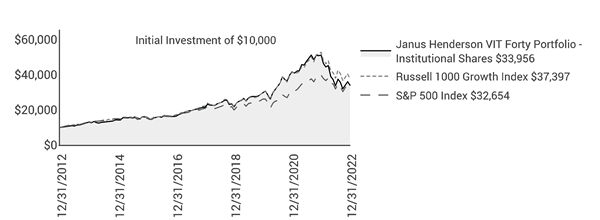
| | | | | | | | | | |
| | | | | | | | |
| | | | | | | | | |
Average Annual Total Return - for the periods ended December 31, 2022 | | | Prospectus Expense Ratios |
| | One
Year | Five
Year | Ten
Year | Since
Inception* | | | Total Annual Fund
Operating Expenses‡ |
Institutional Shares | | -33.55% | 9.75% | 13.00% | 11.11% | | | 0.77% |
Service Shares | | -33.73% | 9.48% | 12.72% | 10.80% | | | 1.02% |
Russell 1000 Growth Index | | -29.14% | 10.96% | 14.10% | 8.30% | | | |
S&P 500 Index | | -18.11% | 9.42% | 12.56% | 8.30% | | | |
Morningstar Quartile - Institutional Shares | | 3rd | 2nd | 1st | 1st | | | |
Morningstar Ranking - based on total returns for Large Growth Funds | | 883/1,246 | 295/1,126 | 237/1,036 | 8/513 | | | |
Returns quoted are past performance and do not guarantee future results; current performance may be lower or higher. Investment returns and principal value will vary; there may be a gain or loss when shares are sold. For the most recent month-end performance call 800.668.0434 or visit janushenderson.com/VITperformance.
This Portfolio has a performance-based management fee that may adjust up or down based on the Portfolio’s performance.
Performance may be affected by risks that include those associated with foreign and emerging markets, fixed income securities, high-yield and high-risk securities, undervalued, overlooked and smaller capitalization companies, real estate related securities including Real Estate Investment Trusts (REITs), Environmental, Social and Governance (ESG) factors, non-diversification, portfolio turnover, derivatives, short sales, initial public offerings (IPOs) and potential conflicts of interest. Each product has different risks. Please see the prospectus for more information about risks, holdings and other details.
Returns do not reflect the deduction of fees, charges or expenses of any insurance product or qualified plan. If applied, returns would have been lower.
Returns include reinvestment of all dividends and distributions and do not reflect the deduction of taxes that a shareholder would pay on Portfolio distributions or redemptions of Portfolio shares. The returns do not include adjustments in accordance with generally accepted accounting principles required at the period end for financial reporting purposes.
Performance for Service Shares prior to December 31, 1999 reflects the performance of Institutional Shares, adjusted to reflect the expenses of Service Shares.
Ranking is for the share class shown only; other classes may have different performance characteristics.
© 2022 Morningstar, Inc. All Rights Reserved.
There is no assurance that the investment process will consistently lead to successful investing.
See Notes to Schedule of Investments and Other Information for index definitions.
Janus Henderson VIT Forty Portfolio (unaudited)
Performance
Index performance does not reflect the expenses of managing a portfolio as an index is unmanaged and not available for direct investment.
See “Useful Information About Your Portfolio Report.”
*The Portfolio’s inception date – May 1 ,1997
‡ As stated in the prospectus. See Financial Highlights for actual expense ratios during the reporting period.
Janus Henderson VIT Forty Portfolio (unaudited)
Expense Examples
As a shareholder of the Portfolio, you incur two types of costs: (1) transaction costs and (2) ongoing costs, including management fees; 12b-1 distribution and shareholder servicing fees (applicable to Service Shares only); transfer agent fees and expenses payable pursuant to the Transfer Agency Agreement; and other Portfolio expenses. This example is intended to help you understand your ongoing costs (in dollars) of investing in the Portfolio and to compare these costs with the ongoing costs of investing in other mutual funds. To do so, compare this 5% hypothetical example with the 5% hypothetical examples that appear in the shareholder reports of the other funds. The example is based upon an investment of $1,000 invested at the beginning of the period and held for the six-months indicated, unless noted otherwise in the table and footnotes below.
Actual Expenses
The information in the table under the heading “Actual” provides information about actual account values and actual expenses. You may use the information in these columns, together with the amount you invested, to estimate the expenses that you paid over the period. Simply divide your account value by $1,000 (for example, an $8,600 account value divided by $1,000 = 8.6), then multiply the result by the number in the appropriate column for your share class under the heading entitled “Expenses Paid During Period” to estimate the expenses you paid on your account during the period.
Hypothetical Example for Comparison Purposes
The information in the table under the heading “Hypothetical (5% return before expenses)” provides information about hypothetical account values and hypothetical expenses based upon the Portfolio’s actual expense ratio and an assumed rate of return of 5% per year before expenses, which is not the Portfolio’s actual return. The hypothetical account values and expenses may not be used to estimate the actual ending account balance or expenses you paid for the period. You may use this information to compare the ongoing costs of investing in the Portfolio and other funds. To do so, compare this 5% hypothetical example with the 5% hypothetical examples that appear in the shareholder reports of the other funds. Additionally, for an analysis of the fees associated with an investment in either share class or other similar funds, please visit www.finra.org/fundanalyzer.
Please note that the expenses shown in the table are meant to highlight your ongoing costs only and do not reflect any transaction costs, such as any charges at the separate account level or contract level. These fees are fully described in the Portfolio’s prospectuses. Therefore, the hypothetical examples are useful in comparing ongoing costs only, and will not help you determine the relative total costs of owning different funds. In addition, if these transaction costs were included, your costs would have been higher.
| | | | | | | | | | | |
| | | | | | | | |
| | | Actual | | Hypothetical
(5% return before expenses) | |
| Beginning
Account
Value
(7/1/22) | Ending
Account
Value
(12/31/22) | Expenses
Paid During
Period
(7/1/22 - 12/31/22)† | | Beginning
Account
Value
(7/1/22) | Ending
Account
Value
(12/31/22) | Expenses
Paid During
Period
(7/1/22 - 12/31/22)† | Net Annualized
Expense Ratio
(7/1/22 - 12/31/22) |
Institutional Shares | $1,000.00 | $1,007.80 | $2.73 | | $1,000.00 | $1,022.48 | $2.75 | 0.54% |
Service Shares | $1,000.00 | $1,006.50 | $4.00 | | $1,000.00 | $1,021.22 | $4.02 | 0.79% |
† | Expenses Paid During Period are equal to the Net Annualized Expense Ratio multiplied by the average account value over the period, multiplied by 184/365 (to reflect the one-half year period). Expenses in the examples include the effect of applicable fee waivers and/or expense reimbursements, if any. Had such waivers and/or reimbursements not been in effect, your expenses would have been higher. Please refer to the Notes to Financial Statements or the Portfolio’s prospectuses for more information regarding waivers and/or reimbursements. |
Janus Henderson VIT Forty Portfolio
Schedule of Investments
December 31, 2022
| | | | | | | | |
Shares
| | | Value | |
Common Stocks– 97.8% | | | |
Aerospace & Defense – 1.7% | | | |
| | Howmet Aerospace Inc | | 351,314 | | | $13,845,285 | |
Automobiles – 0.4% | | | |
| | Rivian Automotive Inc - Class A* | | 166,092 | | | 3,061,076 | |
Banks – 1.8% | | | |
| | JPMorgan Chase & Co | | 105,628 | | | 14,164,715 | |
Biotechnology – 3.6% | | | |
| | AbbVie Inc | | 176,180 | | | 28,472,450 | |
Capital Markets – 5.2% | | | |
| | Blackstone Group Inc | | 302,720 | | | 22,458,797 | |
| | Charles Schwab Corp | | 222,083 | | | 18,490,631 | |
| | | 40,949,428 | |
Chemicals – 2.4% | | | |
| | Sherwin-Williams Co | | 79,047 | | | 18,760,224 | |
Equity Real Estate Investment Trusts (REITs) – 3.0% | | | |
| | American Tower Corp | | 114,440 | | | 24,245,258 | |
Health Care Equipment & Supplies – 1.0% | | | |
| | DexCom Inc* | | 69,139 | | | 7,829,300 | |
Health Care Providers & Services – 3.4% | | | |
| | UnitedHealth Group Inc | | 50,550 | | | 26,800,599 | |
Hotels, Restaurants & Leisure – 3.5% | | | |
| | Booking Holdings Inc* | | 10,072 | | | 20,297,900 | |
| | Caesars Entertainment Inc* | | 185,991 | | | 7,737,226 | |
| | | 28,035,126 | |
Household Products – 1.3% | | | |
| | Procter & Gamble Co | | 66,897 | | | 10,138,909 | |
Information Technology Services – 7.0% | | | |
| | Mastercard Inc | | 159,723 | | | 55,540,479 | |
Interactive Media & Services – 6.2% | | | |
| | Alphabet Inc - Class C* | | 219,929 | | | 19,514,300 | |
| | Match Group Inc* | | 93,845 | | | 3,893,629 | |
| | Meta Platforms Inc - Class A* | | 216,757 | | | 26,084,537 | |
| | | 49,492,466 | |
Internet & Direct Marketing Retail – 4.5% | | | |
| | Amazon.com Inc* | | 422,398 | | | 35,481,432 | |
Life Sciences Tools & Services – 3.0% | | | |
| | Danaher Corp | | 91,142 | | | 24,190,910 | |
Machinery – 4.0% | | | |
| | Deere & Co | | 74,557 | | | 31,967,059 | |
Metals & Mining – 1.2% | | | |
| | Freeport-McMoRan Inc | | 241,994 | | | 9,195,772 | |
Professional Services – 3.3% | | | |
| | CoStar Group Inc* | | 334,939 | | | 25,884,086 | |
Semiconductor & Semiconductor Equipment – 11.4% | | | |
| | Advanced Micro Devices Inc* | | 372,691 | | | 24,139,196 | |
| | Analog Devices Inc | | 48,951 | | | 8,029,433 | |
| | ASML Holding NV | | 45,961 | | | 25,113,090 | |
| | NVIDIA Corp | | 66,175 | | | 9,670,814 | |
| | Texas Instruments Inc | | 140,858 | | | 23,272,559 | |
| | | 90,225,092 | |
Software – 17.2% | | | |
| | Atlassian Corp - Class A* | | 100,487 | | | 12,930,667 | |
| | Microsoft Corp | | 361,707 | | | 86,744,573 | |
| | Workday Inc - Class A* | | 217,497 | | | 36,393,773 | |
| | | 136,069,013 | |
Specialty Retail – 3.5% | | | |
| | TJX Cos Inc | | 345,093 | | | 27,469,403 | |
Technology Hardware, Storage & Peripherals – 5.8% | | | |
| | Apple Inc | | 352,683 | | | 45,824,102 | |
| | |
See Notes to Schedule of Investments and Other Information and Notes to Financial Statements. |
| |
8 | DECEMBER 31, 2022 |
Janus Henderson VIT Forty Portfolio
Schedule of Investments
December 31, 2022
| | | | | | | | |
Shares
| | | Value | |
Common Stocks– (continued) | | | |
Textiles, Apparel & Luxury Goods – 3.4% | | | |
| | LVMH Moet Hennessy Louis Vuitton SE | | 20,831 | | | $15,130,420 | |
| | NIKE Inc - Class B | | 103,783 | | | 12,143,649 | |
| | | 27,274,069 | |
Total Common Stocks (cost $539,376,315) | | 774,916,253 | |
Investment Companies– 2.6% | | | |
Money Markets – 2.6% | | | |
| | Janus Henderson Cash Liquidity Fund LLC, 4.2633%ºº,£((cost $20,496,465) | | 20,494,619 | | | 20,498,718 | |
Total Investments (total cost $559,872,780) – 100.4% | | 795,414,971 | |
Liabilities, net of Cash, Receivables and Other Assets – (0.4)% | | (3,277,486) | |
Net Assets – 100% | | $792,137,485 | |
| | | | | | |
Summary of Investments by Country - (Long Positions) (unaudited) |
| |
| | | | | % of | |
| | | | | Investment | |
Country | | Value | | Securities | |
United States | | $755,171,461 | | 94.9 | % |
Netherlands | | 25,113,090 | | 3.2 | |
France | | 15,130,420 | | 1.9 | |
| | | | | | |
| | | | | | |
Total | | $795,414,971 | | 100.0 | % |
| | |
See Notes to Schedule of Investments and Other Information and Notes to Financial Statements. |
| |
Janus Aspen Series | 9 |
Janus Henderson VIT Forty Portfolio
Schedule of Investments
December 31, 2022
Schedules of Affiliated Investments – (% of Net Assets)
| | | | | | | | | | | |
| | Dividend Income | Realized Gain/(Loss) | Change in Unrealized Appreciation/ Depreciation | Value at 12/31/22 |
Investment Companies - 2.6% |
Money Markets - 2.6% | |
| | Janus Henderson Cash Liquidity Fund LLC, 4.2633%ºº | $ | 395,064 | $ | (1,531) | $ | 2,253 | $ | 20,498,718 |
Investments Purchased with Cash Collateral from Securities Lending - N/A |
Investment Companies - N/A | |
| | Janus Henderson Cash Collateral Fund LLC, 4.1397%ºº | | 39,300∆ | | - | | - | | - |
Total Affiliated Investments - 2.6% | $ | 434,364 | $ | (1,531) | $ | 2,253 | $ | 20,498,718 |
| | | | | | | | | | | |
| | Value at 12/31/21 | Purchases | Sales Proceeds | Value at 12/31/22 |
Investment Companies - 2.6% |
Money Markets - 2.6% | |
| | Janus Henderson Cash Liquidity Fund LLC, 4.2633%ºº | | 14,134,404 | | 264,680,092 | | (258,316,500) | | 20,498,718 |
Investments Purchased with Cash Collateral from Securities Lending - N/A |
Investment Companies - N/A | |
| | Janus Henderson Cash Collateral Fund LLC, 4.1397%ºº | | 1,025,066 | | 67,247,113 | | (68,272,179) | | - |
| | |
See Notes to Schedule of Investments and Other Information and Notes to Financial Statements. |
| |
10 | DECEMBER 31, 2022 |
Janus Henderson VIT Forty Portfolio
Notes to Schedule of Investments and Other Information
| | |
Russell 1000® Growth Index | Russell 1000® Growth Index reflects the performance of U.S. large-cap equities with higher price-to-book ratios and higher forecasted growth values. |
S&P 500® Index | S&P 500® Index reflects U.S. large-cap equity performance and represents broad U.S. equity market performance. |
| | |
LLC | Limited Liability Company |
| | |
* | Non-income producing security. |
| | |
ºº | Rate shown is the 7-day yield as of December 31, 2022. |
| | |
£ | The Portfolio may invest in certain securities that are considered affiliated companies. As defined by the Investment Company Act of 1940, as amended, an affiliated company is one in which the Portfolio owns 5% or more of the outstanding voting securities, or a company which is under common ownership or control. |
| | |
∆ | Net of income paid to the securities lending agent and rebates paid to the borrowing counterparties. |
| | | | | | | | | | | | | |
The following is a summary of the inputs that were used to value the Portfolio’s investments in securities and other financial instruments as of December 31, 2022. See Notes to Financial Statements for more information. |
| |
Valuation Inputs Summary |
| | | | | | | |
| | | | | Level 2 - | | Level 3 - |
| | | Level 1 - | | Other Significant | | Significant |
| | | Quoted Prices | | Observable Inputs | | Unobservable Inputs |
| | | | | | | |
Assets | | | | | | |
Investments In Securities: | | | | | | |
Common Stocks | | | | | | |
Textiles, Apparel & Luxury Goods | $ | 12,143,649 | $ | 15,130,420 | $ | - |
All Other | | 747,642,184 | | - | | - |
Investment Companies | | - | | 20,498,718 | | - |
Total Assets | $ | 759,785,833 | $ | 35,629,138 | $ | - |
| | | | | | | |
Janus Henderson VIT Forty Portfolio
Statement of Assets and Liabilities
December 31, 2022
| | | | | | | |
| | | | | | |
Assets: | | | | |
| Unaffiliated investments, at value (cost $539,376,315) | | $ | 774,916,253 | |
| Affiliated investments, at value (cost $20,496,465) | | | 20,498,718 | |
| Trustees' deferred compensation | | | 25,695 | |
| Receivables: | | | | |
| | Portfolio shares sold | | | 461,318 | |
| | Dividends | | | 290,780 | |
| | Dividends from affiliates | | | 95,423 | |
| | Foreign tax reclaims | | | 36,793 | |
| Other assets | | | 8,814 | |
Total Assets | | | 796,333,794 | |
Liabilities: | | | | |
| Payables: | | | — | |
| | Investments purchased | | | 3,334,274 | |
| | Advisory fees | | | 344,395 | |
| | Portfolio shares repurchased | | | 204,618 | |
| | 12b-1 Distribution and shareholder servicing fees | | | 109,843 | |
| | Professional fees | | | 42,042 | |
| | Transfer agent fees and expenses | | | 38,581 | |
| | Trustees' deferred compensation fees | | | 25,695 | |
| | Affiliated portfolio administration fees payable | | | 1,837 | |
| | Custodian fees | | | 1,183 | |
| | Trustees' fees and expenses | | | 488 | |
| | Accrued expenses and other payables | | | 93,353 | |
Total Liabilities | | | 4,196,309 | |
Net Assets | | $ | 792,137,485 | |
Net Assets Consist of: | | | | |
| Capital (par value and paid-in surplus) | | $ | 577,682,773 | |
| Total distributable earnings (loss) | | | 214,454,712 | |
Total Net Assets | | $ | 792,137,485 | |
Net Assets - Institutional Shares | | $ | 317,937,679 | |
| Shares Outstanding, $0.001 Par Value (unlimited shares authorized) | | | 9,382,631 | |
Net Asset Value Per Share | | $ | 33.89 | |
Net Assets - Service Shares | | $ | 474,199,806 | |
| Shares Outstanding, $0.001 Par Value (unlimited shares authorized) | | | 15,567,980 | |
Net Asset Value Per Share | | $ | 30.46 | |
| | |
See Notes to Financial Statements. |
| |
12 | DECEMBER 31, 2022 |
Janus Henderson VIT Forty Portfolio
Statement of Operations
For the year ended December 31, 2022
| | | | | | |
| | | | | |
Investment Income: | | | |
| Dividends | $ | 6,981,692 | |
| Dividends from affiliates | | 395,064 | |
| Affiliated securities lending income, net | | 39,300 | |
| Unaffiliated securities lending income, net | | 1,140 | |
| Foreign tax withheld | | (125,178) | |
Total Investment Income | | 7,292,018 | |
Expenses: | | | |
| Advisory fees | | 4,324,698 | |
| 12b-1 Distribution and shareholder servicing fees: | | | |
| | Service Shares | | 1,336,585 | |
| Transfer agent administrative fees and expenses: | | | |
| | Institutional Shares | | 186,838 | |
| | Service Shares | | 267,654 | |
| Other transfer agent fees and expenses: | | | |
| | Institutional Shares | | 8,429 | |
| | Service Shares | | 6,445 | |
| Professional fees | | 45,353 | |
| Registration fees | | 28,246 | |
| Affiliated portfolio administration fees | | 22,724 | |
| Trustees’ fees and expenses | | 20,747 | |
| Custodian fees | | 7,227 | |
| Shareholder reports expense | | 11 | |
| Other expenses | | 91,550 | |
Total Expenses | | 6,346,507 | |
Net Investment Income/(Loss) | | 945,511 | |
Net Realized Gain/(Loss) on Investments: | | | |
| Investments and foreign currency transactions | | (26,168,136) | |
| Investments in affiliates | | (1,531) | |
Total Net Realized Gain/(Loss) on Investments | | (26,169,667) | |
Change in Unrealized Net Appreciation/Depreciation: | | | |
| Investments, foreign currency translations and Trustees’ deferred compensation | | (384,911,408) | |
| Investments in affiliates | | 2,253 | |
Total Change in Unrealized Net Appreciation/Depreciation | | (384,909,155) | |
Net Increase/(Decrease) in Net Assets Resulting from Operations | $ | (410,133,311) | |
| | | | | |
| | |
See Notes to Financial Statements. |
| |
Janus Aspen Series | 13 |
Janus Henderson VIT Forty Portfolio
Statements of Changes in Net Assets
| | | | | | | | | |
| | | | | | | | |
| | | Year ended
December 31, 2022 | | Year ended
December 31, 2021 | |
| | | | | | | | | |
Operations: | | | | | | |
| Net investment income/(loss) | $ | 945,511 | | $ | (4,701,680) | |
| Net realized gain/(loss) on investments | | (26,169,667) | | | 149,827,984 | |
| Change in unrealized net appreciation/depreciation | | (384,909,155) | | | 94,109,183 | |
Net Increase/(Decrease) in Net Assets Resulting from Operations | | (410,133,311) | | | 239,235,487 | |
Dividends and Distributions to Shareholders: | | | | | | |
| | Institutional Shares | | (57,912,332) | | | (57,583,957) | |
| | Service Shares | | (88,064,766) | | | (86,533,730) | |
Net Decrease from Dividends and Distributions to Shareholders | | (145,977,098) | | | (144,117,687) | |
Capital Share Transactions: | | | | | | |
| | Institutional Shares | | 22,748,415 | | | 17,956,305 | |
| | Service Shares | | 82,752,521 | | | 33,063,766 | |
Net Increase/(Decrease) from Capital Share Transactions | | 105,500,936 | | | 51,020,071 | |
Net Increase/(Decrease) in Net Assets | | (450,609,473) | | | 146,137,871 | |
Net Assets: | | | | | | |
| Beginning of period | | 1,242,746,958 | | | 1,096,609,087 | |
| End of period | $ | 792,137,485 | | $ | 1,242,746,958 | |
| | | | | | | | |
| | |
See Notes to Financial Statements. |
| |
14 | DECEMBER 31, 2022 |
Janus Henderson VIT Forty Portfolio
Financial Highlights
| | | | | | | | | | | | | | | | | | | |
Institutional Shares | | | | | | | | | | | | | | | |
For a share outstanding during the year ended December 31 | | 2022 | | | 2021 | | | 2020 | | | 2019 | | | 2018 | |
| Net Asset Value, Beginning of Period | | $61.75 | | | $57.00 | | | $44.38 | | | $35.20 | | | $39.76 | |
| Income/(Loss) from Investment Operations: | | | | | | | | | | | | | | | |
| | Net investment income/(loss)(1) | | 0.10 | | | (0.15) | | | (0.01) | | | 0.09 | | | 0.07 | |
| | Net realized and unrealized gain/(loss) | | (20.82) | | | 12.39 | | | 16.29 | | | 12.55 | | | 1.31 | |
| Total from Investment Operations | | (20.72) | | | 12.24 | | | 16.28 | | | 12.64 | | | 1.38 | |
| Less Dividends and Distributions: | | | | | | | | | | | | | | | |
| | Dividends (from net investment income) | | (0.07) | | | — | | | (0.14) | | | (0.06) | | | — | |
| | Distributions (from capital gains) | | (7.07) | | | (7.49) | | | (3.52) | | | (3.40) | | | (5.94) | |
| Total Dividends and Distributions | | (7.14) | | | (7.49) | | | (3.66) | | | (3.46) | | | (5.94) | |
| Net Asset Value, End of Period | | $33.89 | | | $61.75 | | | $57.00 | | | $44.38 | | | $35.20 | |
| Total Return* | | (33.55)% | | | 22.90% | | | 39.40% | | | 37.16% | | | 1.98% | |
| Net Assets, End of Period (in thousands) | | $317,938 | | | $523,822 | | | $462,216 | | | $362,001 | | | $292,132 | |
| Average Net Assets for the Period (in thousands) | | $374,815 | | | $497,818 | | | $389,419 | | | $337,416 | | | $327,962 | |
| Ratios to Average Net Assets**: | | | | | | | | | | | | | | | |
| | Ratio of Gross Expenses | | 0.55% | | | 0.77% | | | 0.76% | | | 0.77% | | | 0.71% | |
| | Ratio of Net Expenses (After Waivers and Expense Offsets) | | 0.55% | | | 0.77% | | | 0.76% | | | 0.77% | | | 0.71% | |
| | Ratio of Net Investment Income/(Loss) | | 0.25% | | | (0.25)% | | | (0.02)% | | | 0.23% | | | 0.17% | |
| Portfolio Turnover Rate | | 39% | | | 31% | | | 41% | | | 35% | | | 41% | |
| | | | | | | | | | | | | | | | | | | |
| |
* Total return includes adjustments in accordance with generally accepted accounting principles required at the year or period end and are not annualized for periods of less than one full year. Total return does not include fees, charges, or expenses imposed by the variable annuity and life insurance contracts for which Janus Aspen Series serves as an underlying investment vehicle. ** Annualized for periods of less than one full year. (1) Per share amounts are calculated based on average shares outstanding during the year or period. |
| | |
See Notes to Financial Statements. |
| |
Janus Aspen Series | 15 |
Janus Henderson VIT Forty Portfolio
Financial Highlights
| | | | | | | | | | | | | | | | | | | |
Service Shares | | | | | | | | | | | | | | | |
For a share outstanding during the year ended December 31 | | 2022 | | | 2021 | | | 2020 | | | 2019 | | | 2018 | |
| Net Asset Value, Beginning of Period | | $56.64 | | | $52.96 | | | $41.53 | | | $33.15 | | | $37.84 | |
| Income/(Loss) from Investment Operations: | | | | | | | | | | | | | | | |
| | Net investment income/(loss)(1) | | —(2) | | | (0.28) | | | (0.12) | | | (0.01) | | | (0.03) | |
| | Net realized and unrealized gain/(loss) | | (19.09) | | | 11.45 | | | 15.15 | | | 11.80 | | | 1.28 | |
| Total from Investment Operations | | (19.09) | | | 11.17 | | | 15.03 | | | 11.79 | | | 1.25 | |
| Less Dividends and Distributions: | | | | | | | | | | | | | | | |
| | Dividends (from net investment income) | | (0.02) | | | — | | | (0.08) | | | (0.01) | | | — | |
| | Distributions (from capital gains) | | (7.07) | | | (7.49) | | | (3.52) | | | (3.40) | | | (5.94) | |
| Total Dividends and Distributions | | (7.09) | | | (7.49) | | | (3.60) | | | (3.41) | | | (5.94) | |
| Net Asset Value, End of Period | | $30.46 | | | $56.64 | | | $52.96 | | | $41.53 | | | $33.15 | |
| Total Return* | | (33.73)% | | | 22.60% | | | 39.03% | | | 36.85% | | | 1.72% | |
| Net Assets, End of Period (in thousands) | | $474,200 | | | $718,925 | | | $634,393 | | | $525,112 | | | $427,321 | |
| Average Net Assets for the Period (in thousands) | | $536,667 | | | $686,446 | | | $548,645 | | | $495,465 | | | $487,559 | |
| Ratios to Average Net Assets**: | | | | | | | | | | | | | | | |
| | Ratio of Gross Expenses | | 0.80% | | | 1.02% | | | 1.01% | | | 1.02% | | | 0.96% | |
| | Ratio of Net Expenses (After Waivers and Expense Offsets) | | 0.80% | | | 1.02% | | | 1.01% | | | 1.02% | | | 0.96% | |
| | Ratio of Net Investment Income/(Loss) | | 0.00%(3) | | | (0.50)% | | | (0.27)% | | | (0.02)% | | | (0.08)% | |
| Portfolio Turnover Rate | | 39% | | | 31% | | | 41% | | | 35% | | | 41% | |
| | | | | | | | | | | | | | | | | | | |
| |
* Total return includes adjustments in accordance with generally accepted accounting principles required at the year or period end and are not annualized for periods of less than one full year. Total return does not include fees, charges, or expenses imposed by the variable annuity and life insurance contracts for which Janus Aspen Series serves as an underlying investment vehicle. ** Annualized for periods of less than one full year. (1) Per share amounts are calculated based on average shares outstanding during the year or period. (2) Less than $0.005 on a per share basis. (3) Less than 0.005%. |
| | |
See Notes to Financial Statements. |
| |
16 | DECEMBER 31, 2022 |
Janus Henderson VIT Forty Portfolio
Notes to Financial Statements
1. Organization and Significant Accounting Policies
Janus Henderson VIT Forty Portfolio (the “Portfolio”) is a series of Janus Aspen Series (the “Trust”), which is organized as a Delaware statutory trust and is registered under the Investment Company Act of 1940, as amended (the “1940 Act”), as an open-end management investment company, and therefore has applied the specialized accounting and reporting guidance in Financial Accounting Standards Board (“FASB”) Accounting Standards Codification (“ASC”) Topic 946. The Trust offers 11 portfolios, each of which offers multiple share classes, with differing investment objectives and policies. The Portfolio seeks long-term growth of capital. The Portfolio is classified as nondiversified, as defined in the 1940 Act. Janus Henderson Investors US LLC is the investment adviser (the “Adviser”) to the Portfolio.
The Portfolio currently offers two classes of shares: Institutional Shares and Service Shares. Each class represents an interest in the same portfolio of investments. Institutional Shares are offered only in connection with investment in and payments under variable insurance contracts as well as certain qualified retirement plans. Service Shares are offered only in connection with investment in and payments under variable insurance contracts as well as certain qualified retirement plans that require a fee from Portfolio assets to procure distribution and administrative services to contract owners and plan participants.
Shareholders, including participating insurance companies, as well as accounts, may from time to time own (beneficially or of record) a significant percentage of the Portfolio’s Shares and can be considered to “control” the Portfolio when that ownership exceeds 25% of the Portfolio’s assets (and which may differ from control as determined in accordance with United States of America generally accepted accounting principles ("US GAAP")).
The following accounting policies have been followed by the Portfolio and are in conformity with US GAAP.
Investment Valuation
Portfolio holdings are valued in accordance with policies and procedures established by the Adviser pursuant to Rule 2a-5 under the 1940 Act and approved by and subject to the oversight of the Trustees (the “Valuation Procedures”). Equity securities traded on a domestic securities exchange are generally valued at readily available market quotations, which are (i) the official close prices or (ii) last sale prices on the primary market or exchange in which the securities trade. If such price is lacking for the trading period immediately preceding the time of determination, such securities are generally valued at their current bid price. Equity securities that are traded on a foreign exchange are generally valued at the closing prices on such markets. In the event that there is no current trading volume on a particular security in such foreign exchange, the bid price from the primary exchange is generally used to value the security. Foreign securities and currencies are converted to U.S. dollars using the current spot USD dollar exchange rate in effect at the close of the New York Stock Exchange (“NYSE”). The Portfolio will determine the market value of individual securities held by it by using prices provided by one or more approved professional pricing services or, as needed, by obtaining market quotations from independent broker-dealers. Most debt securities are valued in accordance with the evaluated bid price supplied by the Adviser-approved pricing service that is intended to reflect market value. The evaluated bid price supplied by the pricing service is an evaluation that may consider factors such as security prices, yields, maturities and ratings. Certain short-term securities maturing within 60 days or less may be evaluated and valued on an amortized cost basis provided that the amortized cost determined approximates market value. Securities for which market quotations or evaluated prices are not readily available or deemed unreliable are valued at fair value determined in good faith by the Adviser pursuant to the Valuation Procedures. Circumstances in which fair valuation may be utilized include, but are not limited to: (i) a significant event that may affect the securities of a single issuer, such as a merger, bankruptcy, or significant issuer-specific development; (ii) an event that may affect an entire market, such as a natural disaster or significant governmental action; (iii) a nonsignificant event such as a market closing early or not opening, or a security trading halt; and (iv) pricing of a nonvalued security and a restricted or nonpublic security. Special valuation considerations may apply with respect to “odd-lot” fixed-income transactions which, due to their small size, may receive evaluated prices by pricing services which reflect a large block trade and not what actually could be obtained for the odd-lot position. The valuation policies provide for the use of systematic fair valuation models provided by independent pricing services to value foreign equity securities in order to adjust for stale pricing, which may occur between the close of certain foreign exchanges and the close of the NYSE. The value of the securities of other mutual funds held by a Portfolio, if any, will be calculated using the NAV of such mutual funds.
Valuation Inputs Summary
FASB ASC 820, Fair Value Measurements and Disclosures (“ASC 820”), defines fair value, establishes a framework for measuring fair value, and expands disclosure requirements regarding fair value measurements. This standard
Janus Henderson VIT Forty Portfolio
Notes to Financial Statements
emphasizes that fair value is a market-based measurement that should be determined based on the assumptions that market participants would use in pricing an asset or liability and establishes a hierarchy that prioritizes inputs to valuation techniques used to measure fair value. These inputs are summarized into three broad levels:
Level 1 – Unadjusted quoted prices in active markets the Portfolio has the ability to access for identical assets or liabilities.
Level 2 – Observable inputs other than unadjusted quoted prices included in Level 1 that are observable for the asset or liability either directly or indirectly. These inputs may include quoted prices for the identical instrument on an inactive market, prices for similar instruments, interest rates, prepayment speeds, credit risk, yield curves, default rates and similar data.
Assets or liabilities categorized as Level 2 in the hierarchy generally include: debt securities fair valued in accordance with the evaluated bid or ask prices supplied by a pricing service; securities traded on OTC markets and listed securities for which no sales are reported that are fair valued at the latest bid price (or yield equivalent thereof) obtained from one or more dealers transacting in a market for such securities or by a pricing service approved by the Portfolio’s Trustees; certain short-term debt securities with maturities of 60 days or less that are fair valued at amortized cost; and equity securities of foreign issuers whose fair value is determined by using systematic fair valuation models provided by independent third parties in order to adjust for stale pricing which may occur between the close of certain foreign exchanges and the close of the NYSE. Other securities that may be categorized as Level 2 in the hierarchy include, but are not limited to, preferred stocks, bank loans, swaps, investments in unregistered investment companies, options, and forward contracts.
Level 3 – Unobservable inputs for the asset or liability to the extent that relevant observable inputs are not available, representing the Portfolio’s own assumptions about the assumptions that a market participant would use in valuing the asset or liability, and that would be based on the best information available.
There have been no significant changes in valuation techniques used in valuing any such positions held by the Portfolio since the beginning of the fiscal year.
The inputs or methodology used for fair valuing securities are not necessarily an indication of the risk associated with investing in those securities. The summary of inputs used as of December 31, 2022 to fair value the Portfolio’s investments in securities and other financial instruments is included in the “Valuation Inputs Summary” in the Notes to Schedule of Investments and Other Information.
Investment Transactions and Investment Income
Investment transactions are accounted for as of the date purchased or sold (trade date). Dividend income is recorded on the ex-dividend date. Certain dividends from foreign securities will be recorded as soon as the Portfolio is informed of the dividend, if such information is obtained subsequent to the ex-dividend date. Dividends from foreign securities may be subject to withholding taxes in foreign jurisdictions. Non-cash dividends, if any, are recorded on the ex-dividend date at fair value. Interest income is recorded daily on the accrual basis and includes amortization of premiums and accretion of discounts. The Portfolio classifies gains and losses on prepayments received as an adjustment to interest income. Debt securities may be placed in non-accrual status and related interest income may be reduced by stopping current accruals and writing off interest receivables when collection of all or a portion of interest has become doubtful. Gains and losses are determined on the identified cost basis, which is the same basis used for federal income tax purposes.
Expenses
The Portfolio bears expenses incurred specifically on its behalf. Each class of shares bears a portion of general expenses, which are allocated daily to each class of shares based upon the ratio of net assets represented by each class as a percentage of total net assets. Expenses directly attributable to a specific class of shares are charged against the operations of such class.
Estimates
The preparation of financial statements in conformity with US GAAP requires management to make estimates and assumptions that affect the reported amount of assets and liabilities and disclosure of contingent assets and liabilities at the date of the financial statements, and the reported amounts of income and expenses during the reporting period. Actual results could differ from those estimates.
Janus Henderson VIT Forty Portfolio
Notes to Financial Statements
Indemnifications
In the normal course of business, the Portfolio may enter into contracts that contain provisions for indemnification of other parties against certain potential liabilities. The Portfolio’s maximum exposure under these arrangements is unknown, and would involve future claims that may be made against the Portfolio that have not yet occurred. Currently, the risk of material loss from such claims is considered remote.
Foreign Currency Translations
The Portfolio does not isolate that portion of the results of operations resulting from the effect of changes in foreign exchange rates on investments from the fluctuations arising from changes in market prices of securities held at the date of the financial statements. Net unrealized appreciation or depreciation of investments and foreign currency translations arise from changes in the value of assets and liabilities, including investments in securities held at the date of the financial statements, resulting from changes in the exchange rates and changes in market prices of securities held.
Currency gains and losses are also calculated on payables and receivables that are denominated in foreign currencies. The payables and receivables are generally related to foreign security transactions and income translations.
Foreign currency-denominated assets and forward currency contracts may involve more risks than domestic transactions, including currency risk, counterparty risk, political and economic risk, regulatory risk and equity risk. Risks may arise from unanticipated movements in the value of foreign currencies relative to the U.S. dollar.
Dividends and Distributions
The Portfolio may make semiannual distributions of substantially all of its investment income and an annual distribution of its net realized capital gains (if any).
The Portfolio may make certain investments in real estate investment trusts (“REITs”) which pay dividends to their shareholders based upon funds available from operations. It is quite common for these dividends to exceed the REITs’ taxable earnings and profits, resulting in the excess portion of such dividends being designated as a return of capital. If the Portfolio distributes such amounts, such distributions could constitute a return of capital to shareholders for federal income tax purposes.
Federal Income Taxes
The Portfolio intends to continue to qualify as a regulated investment company and distribute all of its taxable income in accordance with the requirements of Subchapter M of the Internal Revenue Code. Management has analyzed the Portfolio’s tax positions taken for all open federal income tax years, generally a three-year period, and has concluded that no provision for federal income tax is required in the Portfolio’s financial statements. The Portfolio is not aware of any tax positions for which it is reasonably possible that the total amounts of unrecognized tax benefits will significantly change in the next twelve months.
2. Other Investments and Strategies
Additional Investment Risk
The U.S. government and the Federal Reserve, as well as certain foreign governments and central banks, have taken extraordinary actions to support local and global economies and the financial markets in response to the COVID-19 pandemic. This and other government intervention into the economy and financial markets to address the COVID-19 pandemic may not work as intended, particularly if the efforts are perceived by investors as being unlikely to achieve the desired results. Government actions to mitigate the economic impact of the pandemic have resulted in a large expansion of government deficits and debt, the long term consequences of which are not known. The COVID-19 pandemic could adversely affect the value and liquidity of a Portfolio’s investments, impair a Portfolio’s ability to satisfy redemption requests, and negatively impact a Portfolio’s performance. In addition, the outbreak of COVID-19, and measures taken to mitigate its effects, could result in disruptions to the services provided to a Portfolio by its service providers.
Widespread disease, including pandemics and epidemics, and natural or environmental disasters, including those which may be attributable to global climate change, such as earthquakes, fires, floods, hurricanes, tsunamis and weather-related phenomena generally, have been and can be highly disruptive to economies and markets, adversely impacting individual companies, sectors, industries, markets, currencies, interest and inflation rates, credit ratings, investor sentiment, and other factors affecting the value of a Portfolio’s investments. Economies and financial markets throughout the world have become increasingly interconnected, which increases the likelihood that events or conditions
Janus Henderson VIT Forty Portfolio
Notes to Financial Statements
in one region or country will adversely affect markets or issuers in other regions or countries, including the United States. These disruptions could prevent a Portfolio from executing advantageous investment decisions in a timely manner and negatively impact a Portfolio’s ability to achieve its investment objective(s). Any such event(s) could have a significant adverse impact on the value of a Portfolio. In addition, these disruptions could also impair the information technology and other operational systems upon which the Portfolio’s service providers, including the Adviser or the subadviser (as applicable), rely, and could otherwise disrupt the ability of employees of the Portfolio’s service providers to perform essential tasks on behalf of the Portfolio. Adverse weather conditions may also have a particularly significant negative effect on issuers in the agricultural sector and on insurance and reinsurance companies that insure or reinsure against the impact of natural disasters.
A number of countries in the European Union (the “EU”) have experienced, and may continue to experience, severe economic and financial difficulties. In particular, many EU nations are susceptible to economic risks associated with high levels of debt. Many non-governmental issuers, and even certain governments, have defaulted on, or been forced to restructure, their debts. Many other issuers have faced difficulties obtaining credit or refinancing existing obligations. Financial institutions have in many cases required government or central bank support, have needed to raise capital, and/or have been impaired in their ability to extend credit. As a result, financial markets in the EU have experienced extreme volatility and declines in asset values and liquidity. These difficulties may continue, worsen, or spread further within the EU. Responses to these financial problems by European governments, central banks, and others, including austerity measures and reforms, may not work, may result in social unrest, and may limit future growth and economic recovery or have other unintended consequences. Among other things, these developments have adversely affected the value and exchange rate of the euro and pound sterling, and may continue to significantly affect the economies of all EU countries, which in turn may have a material adverse effect on the Portfolio’s investments in such countries, other countries that depend on EU countries for significant amounts of trade or investment, or issuers with exposure to debt issued by certain EU countries.
Real Estate Investing
The Portfolio may invest in equity and debt securities of real estate-related companies. Such companies may include those in the real estate industry or real estate-related industries. These securities may include common stocks, corporate bonds, preferred stocks, and other equity securities, including, but not limited to, mortgage-backed securities, real estate-backed securities, securities of REITs and similar REIT-like entities. A REIT is a trust that invests in real estate-related projects, such as properties, mortgage loans, and construction loans. REITs are generally categorized as equity, mortgage, or hybrid REITs. A REIT may be listed on an exchange or traded OTC.
Counterparties
Portfolio transactions involving a counterparty are subject to the risk that the counterparty or a third party will not fulfill its obligation to the Portfolio (“counterparty risk”). Counterparty risk may arise because of the counterparty’s financial condition (i.e., financial difficulties, bankruptcy, or insolvency), market activities and developments, or other reasons, whether foreseen or not. A counterparty’s inability to fulfill its obligation may result in significant financial loss to the Portfolio. The Portfolio may be unable to recover its investment from the counterparty or may obtain a limited recovery, and/or recovery may be delayed. The extent of the Portfolio’s exposure to counterparty risk with respect to financial assets and liabilities approximates its carrying value.
The Portfolio may be exposed to counterparty risk through participation in various programs, including, but not limited to, lending its securities to third parties, cash sweep arrangements whereby the Portfolio’s cash balance is invested in one or more types of cash management vehicles, as well as investments in, but not limited to, repurchase agreements, debt securities, and derivatives, including various types of swaps, futures and options. The Portfolio intends to enter into financial transactions with counterparties that the Adviser believes to be creditworthy at the time of the transaction. There is always the risk that the Adviser’s analysis of a counterparty’s creditworthiness is incorrect or may change due to market conditions. To the extent that the Portfolio focuses its transactions with a limited number of counterparties, it will have greater exposure to the risks associated with one or more counterparties.
Securities Lending
Under procedures adopted by the Trustees, the Portfolio may seek to earn additional income by lending securities to certain qualified broker-dealers and institutions. JPMorgan Chase Bank, National Association acts as securities lending agent and a limited purpose custodian or subcustodian to receive and disburse cash balances and cash collateral, hold short-term investments, hold collateral, and perform other custodial functions in accordance with the Non-Custodial Securities Lending Agreement. For financial reporting purposes, the Portfolio does not offset financial instruments’
Janus Henderson VIT Forty Portfolio
Notes to Financial Statements
payables and receivables and related collateral on the Statement of Assets and Liabilities. The Portfolio may lend portfolio securities in an amount equal to up to 1/3 of its total assets as determined at the time of the loan origination. There is the risk of delay in recovering a loaned security or the risk of loss in collateral rights if the borrower fails financially. In addition, the Adviser makes efforts to balance the benefits and risks from granting such loans. All loans will be continuously secured by collateral which may consist of cash, U.S. Government securities, domestic and foreign short-term debt instruments, letters of credit, time deposits, repurchase agreements, money market mutual funds or other money market accounts, or such other collateral as permitted by the Securities and Exchange Commission (the "SEC"). If the Portfolio is unable to recover a security on loan, the Portfolio may use the collateral to purchase replacement securities in the market. There is a risk that the value of the collateral could decrease below the cost of the replacement security by the time the replacement investment is made, resulting in a loss to the Portfolio. In certain circumstances individual loan transactions could yield negative returns.
Upon receipt of cash collateral, the Adviser may invest it in affiliated or non-affiliated cash management vehicles, whether registered or unregistered entities, as permitted by the 1940 Act and rules promulgated thereunder. The Adviser currently intends to primarily invest the cash collateral in a cash management vehicle for which the Adviser serves as investment adviser, Janus Henderson Cash Collateral Fund LLC, or in time deposits. An investment in Janus Henderson Cash Collateral Fund LLC is generally subject to the same risks that shareholders experience when investing in similarly structured vehicles, such as the potential for significant fluctuations in assets as a result of the purchase and redemption activity of the securities lending program, a decline in the value of the collateral, and possible liquidity issues. Such risks may delay the return of the cash collateral and cause the Portfolio to violate its agreement to return the cash collateral to a borrower in a timely manner. As adviser to the Portfolio and Janus Henderson Cash Collateral Fund LLC, the Adviser has an inherent conflict of interest as a result of its fiduciary duties to both the Portfolio and Janus Henderson Cash Collateral Fund LLC. Additionally, the Adviser receives an investment advisory fee of 0.05% for managing Janus Henderson Cash Collateral Fund LLC, but it may not receive a fee for managing certain other affiliated cash management vehicles in which the Portfolio may invest, and therefore may have an incentive to allocate preferred investment opportunities to investment vehicles for which it is receiving a fee.
The value of the collateral must be at least 102% of the market value of the loaned securities that are denominated in U.S. dollars and 105% of the market value of the loaned securities that are not denominated in U.S. dollars. Loaned securities and related collateral are marked-to-market each business day based upon the market value of the loaned securities at the close of business, employing the most recent available pricing information. Collateral levels are then adjusted based on this mark-to-market evaluation. Additional required collateral, or excess collateral returned, is delivered on the next business day. Therefore, the value of the collateral held may be temporarily less than 102% or 105% value of the securities on loan. The cash collateral invested by the Adviser is disclosed in the Schedule of Investments (if applicable).
Income earned from the investment of the cash collateral, net of rebates paid to, or fees paid by, borrowers and less the fees paid to the lending agent are included as “Affiliated securities lending income, net” on the Statement of Operations.
There were no securities on loan as of December 31, 2022.
3. Investment Advisory Agreements and Other Transactions with Affiliates
The Portfolio pays the Adviser an investment advisory fee rate that may adjust up or down based on the Portfolio’s performance relative to its benchmark index.
The investment advisory fee rate paid to the Adviser by the Portfolio consists of two components: (1) a base fee calculated by applying the contractual fixed rate of the advisory fee to the Portfolio’s average daily net assets during the previous month (the “Base Fee Rate”), plus or minus (2) a performance-fee adjustment (the “Performance Adjustment”) calculated by applying a variable rate of up to 0.15% (positive or negative) to the Portfolio’s average daily net assets based on the Portfolio’s relative performance compared to the cumulative investment record of its benchmark index over a 36-month performance measurement period or shorter time period, as applicable. The investment advisory fee rate is calculated daily and paid monthly.
The investment performance of the Portfolio’s Service Shares for the performance measurement period is used to calculate the Performance Adjustment. The Portfolio’s Base Fee Rate prior to any performance adjustment (expressed as an annual rate) is 0.64%, and the Portfolio’s benchmark index used in the calculation is the Russell 1000® Growth Index.
Janus Henderson VIT Forty Portfolio
Notes to Financial Statements
No Performance Adjustment is applied unless the difference between the Portfolio’s investment performance and the cumulative investment record of the Portfolio’s benchmark index is 0.50% or greater (positive or negative) during the applicable performance measurement period. The Base Fee Rate is subject to an upward or downward Performance Adjustment for every full 0.50% increment by which the Portfolio outperforms or underperforms its benchmark index, up to the Portfolio’s full performance rate of ±8.50%. Because the Performance Adjustment is tied to a Portfolio’s relative performance compared to its benchmark index (and not its absolute performance), the Performance Adjustment could increase the Adviser’s fee even if the Portfolio’s Shares lose value during the performance measurement period and could decrease the Adviser’s fee even if the Portfolio’s Shares increase in value during the performance measurement period. For purposes of computing the Base Fee Rate and the Performance Adjustment, net assets are averaged over different periods (average daily net assets during the previous month for the Base Fee Rate, versus average daily net assets during the performance measurement period for the Performance Adjustment). Performance of the Portfolio is calculated net of expenses whereas the Portfolio’s benchmark index does not have any fees or expenses. Reinvestment of dividends and distributions is included in calculating both the performance of a Portfolio and the Portfolio’s benchmark index.
The Portfolio’s prospectuses and statement(s) of additional information contain additional information about performance-based fees. The amount shown as advisory fees on the Statement of Operations reflects the Base Fee Rate plus/minus any Performance Adjustment. For the year ended December 31, 2022, the performance adjusted investment advisory fee rate before any waivers and/or reimbursements of expenses is 0.48%.
The Adviser serves as administrator to the Portfolio pursuant to an administration agreement between the Adviser and the Trust. Under the administration agreement, the Adviser is authorized to perform, or cause others to perform certain administration, compliance, and accounting services to the Portfolio, including providing office space for the Portfolio, and is reimbursed by the Portfolio for certain of its costs in providing these services (to the extent the Adviser seeks reimbursement and such costs are not otherwise waived). In addition, employees of the Adviser and/or its affiliates may serve as officers of the Trust. The Portfolio pays for some or all of the salaries, fees, and expenses of the Adviser employees and Portfolio officers, with respect to certain specified administration functions they perform on behalf of the Portfolio. The Portfolio pays these costs based on out-of-pocket expenses incurred by the Adviser, and these costs are separate and apart from advisory fees and other expenses paid in connection with the investment advisory services the Adviser (or any subadvisor, as applicable) provides to the Portfolio. These amounts are disclosed as “Affiliated portfolio administration fees” on the Statement of Operations. In addition, some expenses related to compensation payable to the Portfolio’s Chief Compliance Officer and certain compliance staff, all of whom are employees of the Adviser and/or its affiliates, are shared with the Portfolio. Total compensation of $48,451 was paid to the Chief Compliance Officer and certain compliance staff by the Trust during the year ended December 31, 2022. The Portfolio's portion is reported as part of “Other expenses” on the Statement of Operations.
Janus Henderson Services US LLC (the “Transfer Agent”), a wholly-owned subsidiary of the Adviser, is the Portfolio’s transfer agent. The Transfer Agent receives an administrative services fee at an annual rate of 0.05% of the average daily net assets of the Portfolio for arranging for the provision by participating insurance companies and qualified plan service providers of administrative services, including, but not limited to, recordkeeping, subaccounting, answering inquiries regarding accounts, order processing, transaction confirmations, the mailing of prospectuses and shareholder reports, and other shareholder services provided on behalf of contract holders or plan participants investing in the Portfolio. The Transfer Agent expects to use this entire fee to compensate insurance companies and qualified plan service providers for providing these services to their customers who invest in the Portfolio.
The Transfer Agent is not compensated for internal services related to the shares, except for out-of-pocket costs. These amounts are disclosed as “Other transfer agent fees and expenses” on the Statement of Operations.
Under a distribution and shareholder servicing plan (the “Plan”) adopted in accordance with Rule 12b-1 under the 1940 Act, the Service Shares may pay the Trust’s distributor, Janus Henderson Distributors US LLC (the “Distributor”), a wholly-owned subsidiary of the Adviser, a fee for the sale and distribution and/or shareholder servicing of the Service Shares at an annual rate of up to 0.25% of the average daily net assets of the Service Shares. Under the terms of the Plan, the Trust is authorized to make payments to the Distributor for remittance to insurance companies and qualified plan service providers as compensation for distribution and/or shareholder services performed by such entities. These amounts are disclosed as “12b-1 Distribution and shareholder servicing fees” on the Statement of Operations.
Janus Henderson VIT Forty Portfolio
Notes to Financial Statements
The Board of Trustees has adopted a deferred compensation plan (the “Deferred Plan”) for independent Trustees to elect to defer receipt of all or a portion of the annual compensation they are entitled to receive from the Portfolio. All deferred fees are credited to an account established in the name of the Trustees. The amounts credited to the account then increase or decrease, as the case may be, in accordance with the performance of one or more of the Janus Henderson funds that are selected by the Trustees. The account balance continues to fluctuate in accordance with the performance of the selected fund or funds until final payment of all amounts are credited to the account. The fluctuation of the account balance is recorded by the Portfolio as unrealized appreciation/(depreciation) and is included as of December 31, 2022 on the Statement of Assets and Liabilities in the asset, “Trustees’ deferred compensation,” and liability, “Trustees’ deferred compensation fees.” Additionally, the recorded unrealized appreciation/(depreciation) is included in “Total distributable earnings (loss)” on the Statement of Assets and Liabilities. Deferred compensation expenses for the year ended December 31, 2022 are included in “Trustees’ fees and expenses” on the Statement of Operations. Trustees are allowed to change their designation of mutual funds from time to time. Amounts will be deferred until distributed in accordance with the Deferred Plan. Deferred fees of $433,851 were paid by the Trust to the Trustees under the Deferred Plan during the year ended December 31, 2022.
Pursuant to the provisions of the 1940 Act and related rules, the Portfolio may participate in an affiliated or non-affiliated cash sweep program. In the cash sweep program, uninvested cash balances of the Portfolio may be used to purchase shares of affiliated or non-affiliated money market funds or cash management pooled investment vehicles that operate as money market funds. The Portfolio is eligible to participate in the cash sweep program (the “Investing Funds”). The Adviser has an inherent conflict of interest because of its fiduciary duties to the affiliated money market funds or cash management pooled investment vehicles and the Investing Funds. Janus Henderson Cash Liquidity Fund LLC (the “Sweep Vehicle”) is an affiliated unregistered cash management pooled investment vehicle that invests primarily in highly-rated short-term fixed-income securities. The Sweep Vehicle operates pursuant to the provisions of the 1940 Act that govern the operation of money market funds and prices its shares at NAV reflecting market-based values of its portfolio securities (i.e., a “floating” NAV) rounded to the fourth decimal place (e.g., $1.0000). The Sweep Vehicle is permitted to impose a liquidity fee (of up to 2%) on redemptions from the Sweep Vehicle or a redemption gate that temporarily suspends redemptions from the Sweep Vehicle for up to 10 business days during a 90 day period. There are no restrictions on the Portfolio's ability to withdraw investments from the Sweep Vehicle at will, and there are no unfunded capital commitments due from the Portfolio to the Sweep Vehicle. The Sweep Vehicle does not charge any management fee, sales charge or service fee.
Any purchases and sales, realized gains/losses and recorded dividends from affiliated investments during the year ended December 31, 2022 can be found in the “Schedules of Affiliated Investments” located in the Schedule of Investments.
The Portfolio is permitted to purchase or sell securities (“cross-trade”) between itself and other funds or accounts managed by the Adviser in accordance with Rule 17a-7 under the Investment Company Act of 1940 (“Rule 17a-7”), when the transaction is consistent with the investment objectives and policies of the Portfolio and in accordance with the Internal Cross Trade Procedures adopted by the Trust’s Board of Trustees. These procedures have been designed to ensure that any cross-trade of securities by the Portfolio from or to another fund or account that is or could be considered an affiliate of the Portfolio under certain limited circumstances by virtue of having a common investment adviser, common Officer, or common Trustee complies with Rule 17a-7. Under these procedures, each cross-trade is effected at the current market price to save costs where allowed. During the year ended December 31, 2022, the Portfolio engaged in cross trades amounting to $140,182 in purchases.
Janus Henderson VIT Forty Portfolio
Notes to Financial Statements
4. Federal Income Tax
The tax components of capital shown in the table below represent: (1) distribution requirements the Portfolio must satisfy under the income tax regulations; (2) losses or deductions the Portfolio may be able to offset against income and gains realized in future years; and (3) unrealized appreciation or depreciation of investments for federal income tax purposes.
Other book to tax differences primarily consist of deferred compensation. The Portfolio has elected to treat gains and losses on forward foreign currency contracts as capital gains and losses, if applicable. Other foreign currency gains and losses on debt instruments are treated as ordinary income for federal income tax purposes pursuant to Section 988 of the Internal Revenue Code.
| | | | | | | |
| | | | Other Book | Net Tax | |
Undistributed
Ordinary Income | Undistributed
Long-Term Gains | Accumulated
Capital Losses | Loss Deferrals | to Tax
Differences | Appreciation/
(Depreciation) | |
$ - | $ - | $(25,343,416) | $ - | $ (25,700) | $ 239,823,828 | |
Accumulated capital losses noted below represent net capital loss carryovers, as of December 31, 2022, that may be available to offset future realized capital gains and thereby reduce future taxable gains distributions. The following table shows these capital loss carryovers.
| | | | | | |
| | | | | |
Capital Loss Carryover Schedule | | |
For the year ended December 31, 2022 | | |
| No Expiration | | | |
| Short-Term | Long-Term | Accumulated
Capital Losses | | |
| $(25,343,416) | $ - | $ (25,343,416) | | |
The aggregate cost of investments and the composition of unrealized appreciation and depreciation of investment securities for federal income tax purposes as of December 31, 2022 are noted below. The primary differences between book and tax appreciation or depreciation of investments are wash sale loss deferrals and investments in partnerships.
| | | | |
Federal Tax Cost | Unrealized
Appreciation | Unrealized
(Depreciation) | Net Tax Appreciation/
(Depreciation) |
$ 562,917,851 | $278,377,556 | $(38,553,728) | $ 239,823,828 |
Janus Henderson VIT Forty Portfolio
Notes to Financial Statements
Income and capital gains distributions are determined in accordance with income tax regulations that may differ from US GAAP. These differences are due to differing treatments for items such as net short-term gains, deferral of wash sale losses, foreign currency transactions, and capital loss carryovers. Certain permanent differences such as tax returns of capital and net investment losses noted below have been reclassified to capital.
| | | | | |
For the year ended December 31, 2022 | |
Distributions | | |
From Ordinary Income | From Long-Term Capital Gains | Tax Return of Capital | Net Investment Loss | |
$ 972,986 | $ 145,004,112 | $ - | $ - | |
| | | | | |
For the year ended December 31, 2021 | |
Distributions | | |
From Ordinary Income | From Long-Term Capital Gains | Tax Return of Capital | Net Investment Loss | |
$ 6,110,328 | $ 138,007,359 | $ - | $ 808,966 | |
Permanent book to tax basis differences may result in reclassifications between the components of net assets. These differences have no impact on the results of operations or net assets.
5. Capital Share Transactions
| | | | | | | |
| | | | | | |
| | Year ended December 31, 2022 | | Year ended December 31, 2021 |
| | Shares | Amount | | Shares | Amount |
| | | | | | | |
Institutional Shares: | | | | | |
Shares sold | 560,663 | $23,960,361 | | 616,212 | $ 36,999,487 |
Reinvested dividends and distributions | 1,704,072 | 57,912,332 | | 1,032,896 | 57,583,957 |
Shares repurchased | (1,365,258) | (59,124,278) | | (1,275,262) | (76,627,139) |
Net Increase/(Decrease) | 899,477 | $22,748,415 | | 373,846 | $ 17,956,305 |
Service Shares: | | | | | |
Shares sold | 2,072,198 | $74,331,303 | | 1,062,017 | $ 58,666,038 |
Reinvested dividends and distributions | 2,884,206 | 88,064,766 | | 1,689,782 | 86,533,730 |
Shares repurchased | (2,081,926) | (79,643,548) | | (2,037,017) | (112,136,002) |
Net Increase/(Decrease) | 2,874,478 | $82,752,521 | | 714,782 | $ 33,063,766 |
6. Purchases and Sales of Investment Securities
For the year ended December 31, 2022, the aggregate cost of purchases and proceeds from sales of investment securities (excluding any short-term securities, short-term options contracts, TBAs, and in-kind transactions, as applicable) was as follows:
| | | | |
Purchases of
Securities | Proceeds from Sales
of Securities | Purchases of Long-
Term U.S. Government
Obligations | Proceeds from Sales
of Long-Term U.S.
Government Obligations |
$355,981,246 | $ 398,885,866 | $ - | $ - |
7. Subsequent Event
Management has evaluated whether any events or transactions occurred subsequent to December 31, 2022 and through the date of issuance of the Portfolio’s financial statements and determined that there were no material events or transactions that would require recognition or disclosure in the Portfolio’s financial statements.
Janus Henderson VIT Forty Portfolio
Report of Independent Registered Public Accounting Firm
To the Board of Trustees of Janus Aspen Series and Shareholders of Janus Henderson VIT Forty Portfolio
Opinion on the Financial Statements
We have audited the accompanying statement of assets and liabilities, including the schedule of investments, of Janus Henderson VIT Forty Portfolio (one of the portfolios constituting Janus Aspen Series, referred to hereafter as the "Portfolio") as of December 31, 2022, the related statement of operations for the year ended December 31, 2022, the statements of changes in net assets for each of the two years in the period ended December 31, 2022, including the related notes, and the financial highlights for each of the five years in the period ended December 31, 2022 (collectively referred to as the “financial statements”). In our opinion, the financial statements present fairly, in all material respects, the financial position of the Portfolio as of December 31, 2022, the results of its operations for the year then ended, the changes in its net assets for each of the two years in the period ended December 31, 2022 and the financial highlights for each of the five years in the period ended December 31, 2022 in conformity with accounting principles generally accepted in the United States of America.
Basis for Opinion
These financial statements are the responsibility of the Portfolio’s management. Our responsibility is to express an opinion on the Portfolio’s financial statements based on our audits. We are a public accounting firm registered with the Public Company Accounting Oversight Board (United States) (PCAOB) and are required to be independent with respect to the Portfolio in accordance with the U.S. federal securities laws and the applicable rules and regulations of the Securities and Exchange Commission and the PCAOB.
We conducted our audits of these financial statements in accordance with the standards of the PCAOB. Those standards require that we plan and perform the audit to obtain reasonable assurance about whether the financial statements are free of material misstatement, whether due to error or fraud.
Our audits included performing procedures to assess the risks of material misstatement of the financial statements, whether due to error or fraud, and performing procedures that respond to those risks. Such procedures included examining, on a test basis, evidence regarding the amounts and disclosures in the financial statements. Our audits also included evaluating the accounting principles used and significant estimates made by management, as well as evaluating the overall presentation of the financial statements. Our procedures included confirmation of securities owned as of December 31, 2022 by correspondence with the custodian, investee company and brokers; when replies were not received from brokers, we performed other auditing procedures. We believe that our audits provide a reasonable basis for our opinion.

Denver, Colorado
February 15, 2023
We have served as the auditor of one or more investment companies in Janus Henderson Funds since 1990.
Janus Henderson VIT Forty Portfolio
Additional Information (unaudited)
Proxy Voting Policies and Voting Record
A description of the policies and procedures that the Portfolio uses to determine how to vote proxies relating to its portfolio securities is available without charge: (i) upon request, by calling 1-800-525-1093; (ii) on the Portfolio’s website at janushenderson.com/proxyvoting; and (iii) on the SEC’s website at http://www.sec.gov. Additionally, information regarding the Portfolio’s proxy voting record for the most recent twelve-month period ended June 30 is also available, free of charge, through janushenderson.com/proxyvoting and from the SEC’s website at http://www.sec.gov.
Full Holdings
The Portfolio files its complete portfolio holdings (schedule of investments) with the SEC as an exhibit to Form N-PORT within 60 days of the end of the first and third fiscal quarters, and in the annual report and semiannual report to shareholders. The Portfolio’s Form N-PORT filings and annual and semiannual reports: (i) are available on the SEC’s website at http://www.sec.gov; and (ii) are available without charge, upon request, by calling a Janus Henderson representative at 1-877-335-2687 (toll free). Portfolio holdings consisting of at least the names of the holdings are generally available on a monthly basis with a 30-day lag under Full Holdings for the Portfolio at janushenderson.com/vit.
APPROVAL OF ADVISORY AGREEMENTS DURING THE PERIOD
The Trustees of Janus Aspen Series, each of whom serves as an “independent” Trustee (the “Trustees”), oversee the management of each portfolio of Janus Aspen Series (each, a “VIT Portfolio,” and collectively, the “VIT Portfolios”), as well as each fund of Janus Investment Fund (each, a “Fund,” and collectively, the “Funds” and together with the VIT Portfolios, the “Janus Henderson Funds,” and each, a “Janus Henderson Fund”). As required by law, the Trustees determine annually whether to continue the investment advisory agreement for each Janus Henderson Fund.
In connection with their most recent consideration of those agreements for each Janus Henderson Fund, the Trustees received and reviewed information provided by Janus Henderson Investors US LLC (the “Adviser”) in response to requests of the Trustees and their independent legal counsel. They also received and reviewed information and analysis provided by, and in response to requests of, their independent fee consultant. Throughout their consideration of the agreements, the Trustees were advised by their independent legal counsel. The Trustees met with management to consider the agreements, and also met separately in executive session with their independent legal counsel and their independent fee consultant.
At meetings held on November 9-10, 2022 and December 13-14, 2022, the Trustees evaluated the information provided by the Adviser and the independent fee consultant, as well as other information provided by the Adviser and the independent fee consultant during the year. Following such evaluation, the Trustees determined that the overall arrangements between each Janus Henderson Fund and the Adviser were fair and reasonable in light of the nature, extent, and quality of the services provided by the Adviser and its affiliates, the fees charged for those services, and other matters that the Trustees considered relevant in the exercise of their business judgment, and unanimously approved the continuation of the investment advisory agreement for each Janus Henderson Fund for the period from February 1, 2023 through February 1, 2024, subject to earlier termination as provided for in each agreement.
In considering the continuation of those agreements, the Trustees reviewed and analyzed various factors that they determined were relevant, including the factors described below, none of which by itself was considered dispositive. However, the material factors and conclusions that formed the basis for the Trustees’ determination to approve the continuation of the agreements are discussed separately below. Also included is a summary of the independent fee consultant’s conclusions and opinions that arose during, and were included as part of, the Trustees’ consideration of the agreements. “Management fees,” as used herein, reflect actual annual advisory fees and, for the purpose of peer comparisons any administration fees (excluding out of pocket costs), net of any waivers, paid by a fund as a percentage of average net assets.
Nature, Extent and Quality of Services
The Trustees reviewed the nature, extent, and quality of the services provided by the Adviser to the Janus Henderson Funds, taking into account the investment objective, strategies, and policies of each Janus Henderson Fund, and the knowledge the Trustees gained from their regular meetings with management on at least a quarterly basis and their ongoing review of information related to the Janus Henderson Funds. In addition, the Trustees reviewed the resources and key personnel of the Adviser, particularly noting those employees who provide investment and risk management services to the Janus Henderson Funds. The Trustees also considered other services provided to the Janus Henderson Funds by the Adviser, such as managing the execution of portfolio transactions and the selection of broker-dealers for
Janus Henderson VIT Forty Portfolio
Additional Information (unaudited)
those transactions. The Trustees considered the Adviser’s role as administrator to the Janus Henderson Funds, noting that the Adviser generally does not receive a fee for its services as administrator, but is reimbursed for its out-of-pocket costs. The Trustees considered the role of the Adviser in monitoring adherence to the Janus Henderson Funds’ investment restrictions, providing support services for the Trustees and Trustee committees, and overseeing communications with Janus Henderson Fund shareholders and the activities of other service providers, including monitoring compliance with various policies and procedures of the Janus Henderson Funds and with applicable securities laws and regulations.
In this regard, the independent fee consultant noted that the Adviser provides a number of different services for the Janus Henderson Funds and their shareholders, ranging from investment management services to various other servicing functions, and that, in its view, the Adviser is a capable provider of those services. The independent fee consultant also provided its belief that the Adviser has developed a number of institutional competitive advantages that should enable it to provide superior investment and service performance over the long term.
The Trustees concluded that the nature, extent, and quality of the services provided by the Adviser to each Janus Henderson Fund were appropriate and consistent with the terms of the respective advisory agreements, and that, taking into account steps taken to address those Janus Henderson Funds whose performance lagged that of their peers for certain periods, the Janus Henderson Funds were likely to benefit from the continued provision of those services. They also concluded that the Adviser had sufficient personnel, with the appropriate education and experience, to serve the Janus Henderson Funds effectively and had demonstrated its ability to attract well-qualified personnel.
Performance of the Funds
The Trustees considered the performance results of each Janus Henderson Fund over various time periods. They noted that they considered Janus Henderson Fund performance data throughout the year, including periodic meetings with each Janus Henderson Fund’s portfolio manager(s), and also reviewed information comparing each Janus Henderson Fund’s performance with the performance of comparable fund peer groups identified by Broadridge Financial Solutions, Inc. (“Broadridge”), an independent data provider, and with the Janus Henderson Fund’s benchmark index. In this regard, the independent fee consultant found that the overall Janus Henderson Funds’ performance has been reasonable, noting that: (i) for the 36 months ended May 31, 2022, approximately 38% of the Janus Henderson Funds were in the top two quartiles of their Broadridge peer groups; (ii) for the 36 months ended September 30, 2022, approximately 45% of the Janus Henderson Funds were in the top two quartiles of performance as reported by Morningstar, and (iii) for the 12 months ended September 30, 2022, approximately 55% of the Janus Henderson Funds were in the top two quartiles of performance as reported by Morningstar.
The Trustees considered the performance of each Janus Henderson Fund, noting that performance may vary by share class, and noted the following with respect to the VIT Portfolios:
· For Janus Henderson Adaptive Risk Managed U.S. Equity Portfolio, the Trustees noted that the VIT Portfolio’s performance was in the bottom Broadridge quartile for the 36 months ended May 31, 2022 and the first Broadridge quartile for the 12 months ended May 31, 2022. The Trustees noted the reasons for the VIT Portfolio’s underperformance and the steps the Adviser had taken or was taking to improve performance, and that the performance trend was improving.
· For Janus Henderson Balanced Portfolio, the Trustees noted that the VIT Portfolio’s performance was in the first Broadridge quartile for the 36 months ended May 31, 2022 and the first Broadridge quartile for the 12 months ended May 31, 2022.
· For Janus Henderson Enterprise Portfolio, the Trustees noted that the VIT Portfolio’s performance was in the third Broadridge quartile for the 36 months ended May 31, 2022 and the first Broadridge quartile for the 12 months ended May 31, 2022 The Trustees noted the reasons for the VIT Portfolio’s underperformance and the steps the Adviser had taken or was taking to improve performance, and that the performance trend was improving.
· For Janus Henderson Flexible Bond Portfolio, the Trustees noted that the VIT Portfolio’s performance was in the first Broadridge quartile for the 36 months ended May 31, 2022 and the first Broadridge quartile for the 12 months ended May 31, 2022.
Janus Henderson VIT Forty Portfolio
Additional Information (unaudited)
· For Janus Henderson Forty Portfolio, the Trustees noted that the VIT Portfolio’s performance was in the second Broadridge quartile for the 36 months ended May 31, 2022 and the third Broadridge quartile for the 12 months ended May 31, 2022.
· For Janus Henderson Global Research Portfolio, the Trustees noted that the VIT Portfolio’s performance was in the first Broadridge quartile for the 36 months ended May 31, 2022 and the first Broadridge quartile for the 12 months ended May 31, 2022.
· For Janus Henderson Global Sustainable Equity Portfolio, the Trustees noted that the VIT Portfolio’s performance was in the bottom Broadridge quartile for the evaluated performance period ended May 31, 2022. The Trustees noted that 36 month-end performance was not yet available.
· For Janus Henderson Global Technology and Innovation Portfolio, the Trustees noted that the VIT Portfolio’s performance was in the second Broadridge quartile for the 36 months ended May 31, 2022 and the third Broadridge quartile for the 12 months ended May 31, 2022.
· For Janus Henderson Mid Cap Value Portfolio, the Trustees noted that the VIT Portfolio’s performance was in the bottom Broadridge quartile for the 36 months ended May 31, 2022 and the second Broadridge quartile for the 12 months ended May 31, 2022. The Trustees noted the reasons for the VIT Portfolio’s underperformance, while also noting that the VIT Portfolio has a performance fee structure that results in lower management fees during periods of underperformance, the steps the Adviser had taken or was taking to improve performance, and that the performance trend was improving.
· For Janus Henderson Overseas Portfolio, the Trustees noted that the VIT Portfolio’s performance was in the first Broadridge quartile for the 36 months ended May 31, 2022 and the first Broadridge quartile for the 12 months ended May 31, 2022.
· For Janus Henderson Research Portfolio, the Trustees noted that the VIT Portfolio’s performance was in the second Broadridge quartile for the 36 months ended May 31, 2022 and the second Broadridge quartile for the 12 months ended May 31, 2022.
In consideration of each Janus Henderson Fund’s performance, the Trustees concluded that, taking into account the factors relevant to performance, as well as other considerations, including steps taken to improve performance, as applicable, the Janus Henderson Fund’s performance warranted continuation of such Janus Henderson Fund’s investment advisory agreement.
Costs of Services Provided
The Trustees examined information regarding the fees and expenses of each Janus Henderson Fund in comparison to similar information for other comparable funds as provided by Broadridge, an independent data provider. They also reviewed an analysis of that information provided by their independent fee consultant. The independent fee consultant provided its belief that the management fees charged by the Adviser to each of the Janus Henderson Funds under the current investment advisory and administration agreements are reasonable in relation to the services provided by the Adviser. The independent fee consultant found: (1) the total expenses and management fees of the Janus Henderson Funds to be reasonable relative to other comparable mutual funds; (2) the total expenses, on average, were 6% under the average total expenses of the respective Broadridge peer group; and (3) the management fees for the Janus Henderson Funds, on average, were 5% under the average management fees for the respective Broadridge peer group. The Trustees also considered the total expenses for each share class of each Janus Henderson Fund compared to the average total expenses for its Broadridge Expense Group and to average total expenses for its Broadridge Expense Universe.
For Janus Henderson Funds with three or more years of performance history, the independent fee consultant also performed a systematic “focus list” analysis of expenses which assessed fund fees in the context of fund performance being delivered. Based on this analysis, the independent fee consultant found that the combination of service quality/performance and expenses on these individual Janus Henderson Funds was reasonable in light of performance trends, performance histories, changes in portfolio management, relative average net asset levels, and the existence of performance fees, breakpoints, and/or expense waivers on such Janus Henderson Funds.
Janus Henderson VIT Forty Portfolio
Additional Information (unaudited)
The Trustees considered the methodology used by the Adviser in determining compensation payable to portfolio managers, the competitive environment for investment management talent, and the competitive market for mutual funds in different distribution channels.
The Trustees also reviewed management fees charged by the Adviser to comparable separate account clients and to comparable non-affiliated funds subadvised by the Adviser (for which the Adviser provides only or primarily portfolio management services). Although in most instances subadvisory and separate account fee rates for various investment strategies were lower than management fee rates for Janus Henderson Funds having a similar strategy, the Trustees considered that the Adviser noted that, under the terms of the management agreements with the Janus Henderson Funds, the Adviser performs significant additional services for the Janus Henderson Funds that it does not provide to those other clients, including administration services, oversight of the Janus Henderson Funds’ other service providers, Trustee support, regulatory compliance and numerous other services, and that, in serving the Janus Henderson Funds, the Adviser assumes many legal risks and other costs that it does not assume in servicing its other clients. Moreover, the Trustees noted that the independent fee consultant found that: (1) the management fees the Adviser charges to the Janus Henderson Funds are reasonable in relation to the management fees the Adviser charges to funds subadvised by the Adviser and to the fees the Adviser charges to its institutional separate account clients; (2) these subadvised and institutional separate accounts have different service and infrastructure needs and operate in markets very different from the retail fund market; (3) Janus Henderson mutual fund investors enjoy reasonable fees relative to the fees charged in these other markets; and (4) as part of its 2022 review, 9 of 11 Janus Henderson Funds have lower management fees than similar funds subadvised by the Adviser. The Trustees noted that for the two Janus Henderson Funds that did not, management fees for each were under the average of its 15(c) peer group.
The Trustees considered the fees for each Janus Henderson Fund for its fiscal year ended in 2021 (except for Janus Henderson Global Sustainable Equity Portfolio for which the period end was March 31, 2022) and noted the following with regard to each Janus Henderson Fund’s total expenses, net of applicable fee waivers (the VIT Portfolio’s “total expenses”) as reflected in the comparative information provided by Broadridge:
· For Janus Henderson Adaptive Risk Management U.S. Equity Portfolio, the Trustees noted that the VIT Portfolio’s total expenses were below the peer group average for its sole share class.
· For Janus Henderson Balanced Portfolio, the Trustees noted that, although the VIT Portfolio’s total expenses exceeded the peer group average for one share class, overall the VIT Portfolio’s total expenses were reasonable.
· For Janus Henderson Enterprise Portfolio, the Trustees noted that, although the VIT Portfolio’s total expenses exceeded the peer group average for one share class, overall the VIT Portfolio’s total expenses were reasonable.
· For Janus Henderson Flexible Bond Portfolio, the Trustees noted that, although the VIT Portfolio’s total expenses exceeded the peer group for one share class, overall the VIT Portfolio’s total expenses were reasonable. The Trustees also noted that the Adviser has contractually agreed to limit the VIT Portfolio’s expenses.
· For Janus Henderson Forty Portfolio, the Trustees noted that, although the VIT Portfolio’s total expenses exceeded the peer group average for one share class, overall the VIT Portfolio’s total expenses were reasonable.
· For Janus Henderson Global Research Portfolio, the Trustees noted that, although the VIT Portfolio’s total expenses exceeded the peer group average for one share class, overall the VIT Portfolio’s total expenses were reasonable.
· For Janus Henderson Global Sustainable Equity Portfolio, the Trustees noted that the VIT Portfolio’s total expenses were below the peer group average for both share classes.
· For Janus Henderson Global Technology and Innovation Portfolio, the Trustees noted that the VIT Portfolio’s total expenses were below the peer group average for both share classes.
· For Janus Henderson Mid Cap Value Portfolio, the Trustees noted that, the VIT Portfolio’s total expenses were below the peer group average for both share classes.
· For Janus Henderson Overseas Portfolio, the Trustees noted that although the VIT Portfolio’s total expenses exceeded the peer group average for one share class, overall the VIT Portfolio’s total expenses were reasonable.
Janus Henderson VIT Forty Portfolio
Additional Information (unaudited)
· For Janus Henderson Research Portfolio, the Trustees noted that the VIT Portfolio’s total expenses were below the peer group average for both share classes.
The Trustees reviewed information on the overall profitability to the Adviser and its affiliates from their relationships with the Janus Henderson Funds, and considered profitability data of other publicly traded mutual fund advisers. The Trustees recognized that profitability comparisons among fund managers are difficult because of the variation in the type of comparative information that is publicly available, and the profitability of any fund manager is affected by numerous factors, including the organizational structure of the particular fund manager, differences in complex size, difference in product mix, difference in types of business (mutual fund, institutional and other), differences in the types of funds and other accounts it manages, possible other lines of business, the methodology for allocating expenses and the fund manager’s capital structure and cost of capital.
Additionally, the Trustees considered the estimated profitability to the Adviser from the investment management services it provided to each Janus Henderson Fund. In their review, the Trustees considered whether the Adviser receive adequate incentives and resources to manage the Janus Henderson Funds effectively. In reviewing profitability, the Trustees noted that the estimated profitability for an individual Janus Henderson Fund is necessarily a product of the allocation methodology utilized by the Adviser to allocate its expenses as part of the estimated profitability calculation. In this regard, the Trustees noted that the independent fee consultant found as part of its 2022 review that (1) the expense allocation methodology and rationales utilized by the Adviser were reasonable and (2) no clear correlation exists between expense allocations and operating margins. The Trustees also considered that the estimated profitability for an individual Janus Henderson Fund was influenced by a number of factors, including not only the allocation methodology selected, but also the presence of fee waivers and expense caps, and whether the Janus Henderson Fund’s investment management agreement contained breakpoints or a performance fee component. The Trustees determined, after taking into account these factors, among others, that the Adviser’s estimated profitability with respect to each Janus Henderson Fund was not unreasonable in relation to the services provided, and that the variation in the range of such estimated profitability among the Janus Henderson Funds was not a material factor in the Board’s approval of the reasonableness of any Janus Henderson Fund’s investment management fees.
The Trustees concluded that the management fees payable by each Janus Henderson Fund to the Adviser were reasonable in relation to the nature, extent, and quality of the services provided, taking into account the fees charged by other advisers for managing comparable mutual funds with similar strategies, the fees the Adviser charges to other clients, and, as applicable, the impact of fund performance on management fees payable by the Janus Henderson Funds. The Trustees also concluded that each Janus Henderson Fund’s total expenses were reasonable, taking into account the size of the Janus Henderson Fund, the quality of services provided by the Adviser, the investment performance of the Janus Henderson Fund, and any expense limitations agreed to or provided by the Adviser.
Economies of Scale
The Trustees considered information about the potential for the Adviser to realize economies of scale as the assets of the Janus Henderson Funds increase. They noted that their independent fee consultant published a report to the Trustees in June 2022 which provided its research and analysis into economies of scale. They also noted that, although many Janus Henderson Funds pay advisory fees at a fixed base rate as a percentage of net assets, without any breakpoints or performance fees, their independent fee consultant concluded that 75% of these Janus Henderson Funds’ have contractual management fees (gross of waivers) below their Broadridge Expense Group averages. The Trustees also noted the following from the independent fee consultant’s report: (1) that 31% of Janus Henderson Funds had management fee breakpoints in place whereby investors pay lower management fees as fund AUM increases; (2) that 29% of Janus Henderson Funds have low flat-rate fees and performance fees where the Adviser is incentivized to invest in resources which drive Janus Henderson Fund performance; and (3) that 39% of Janus Henderson Funds have low flat-rate fees versus peers where investors pay low fixed fees when the Janus Henderson Fund is small/midsized and higher fees when the Janus Henderson Fund grows in assets. The Trustees also noted that the Janus Henderson Funds share directly in economies of scale through the significant investments made by the Adviser and its affiliates related to services provided to the Funds and the lower charges of third-party service providers that are based in part on the combined scale of all of the Janus Henderson Funds.
The Trustees also considered the independent fee consultant’s conclusion that, given the limitations of various analytical approaches to economies of scale and their conflicting results, it is difficult to analytically confirm or deny the existence of economies of scale in the Janus Henderson complex. In this regard, the independent consultant concluded that (1) to the extent there were economies of scale at the Adviser, the Adviser’s general strategy of setting
Janus Henderson VIT Forty Portfolio
Additional Information (unaudited)
fixed management fees below peers appeared to share any such economies with investors even on smaller Janus Henderson Funds which have not yet achieved those economies and (2) by setting lower fixed fees from the start on these Janus Henderson Funds, the Adviser appeared to be investing to increase the likelihood that these Janus Henderson Funds will grow to a level to achieve any economies of scale that may exist. Further, the independent fee consultant provided its belief that Janus Henderson Fund investors are well-served by the fee levels and performance fee structures in place on the Janus Henderson Funds in light of any economies of scale that may be present at the Adviser.
Based on all of the information reviewed, including the recent and past research and analysis conducted by the Trustees’ independent fee consultant, the Trustees concluded that the current fee structure of each Janus Henderson Fund was reasonable and that the current rates of fees do reflect a sharing between the Adviser and the Janus Henderson Fund of any economies of scale that may be present at the current asset level of the Janus Henderson Fund.
Other Benefits to the Adviser
The Trustees also considered benefits that accrue to the Adviser and its affiliates from their relationships with the Janus Henderson Funds. They recognized that two affiliates of the Adviser separately serve the Janus Henderson Funds as transfer agent and distributor, respectively, and the transfer agent receives compensation directly from the non-money market Janus Henderson Funds for services provided, and that such compensation contributes to the overall profitability of the Adviser and its affiliates that results from their relationship with the Janus Henderson Funds. The Trustees also considered the Adviser’s past and proposed use of commissions paid by the Janus Henderson Funds on portfolio brokerage transactions to obtain proprietary and third-party research products and services benefiting the Janus Henderson Fund and/or other clients of the Adviser and/or the Adviser. The Trustees concluded that the Adviser’s use of these types of client commission arrangements to obtain proprietary and third-party research products and services was consistent with regulatory requirements and guidelines and was likely to benefit each Janus Henderson Fund. The Trustees also concluded that, other than the services provided by the Adviser and its affiliates pursuant to the agreements and the fees to be paid by each Janus Henderson Fund therefor, the Janus Henderson Funds and the Adviser may potentially benefit from their relationship with each other in other ways. They concluded that the Adviser and its affiliates share directly in economies of scale through the lower charges of third-party service providers that are based in part on the combined scale of the Janus Henderson Funds and other clients serviced by the Adviser and its affiliates. They also concluded that the Adviser benefits from the receipt of research products and services acquired through commissions paid on portfolio transactions of the Janus Henderson Funds and that the Janus Henderson Funds benefit from the Adviser’s receipt of those products and services as well as research products and services acquired through commissions paid by other clients of the Adviser. They further concluded that the success of any Janus Henderson Fund could attract other business to the Adviser or other Janus Henderson Funds, and that the success of the Adviser could enhance the Adviser’s ability to serve the Janus Henderson Funds.
Janus Henderson VIT Forty Portfolio
Useful Information About Your Portfolio Report (unaudited)
Management Commentary
The Management Commentary in this report includes valuable insight as well as statistical information to help you understand how your Portfolio’s performance and characteristics stack up against those of comparable indices.
If the Portfolio invests in foreign securities, this report may include information about country exposure. Country exposure is based primarily on the country of risk. A company may be allocated to a country based on other factors such as location of the company’s principal office, the location of the principal trading market for the company’s securities, or the country where a majority of the company’s revenues are derived.
Please keep in mind that the opinions expressed in the Management Commentary are just that: opinions. They are a reflection based on best judgment at the time this report was compiled, which was December 31, 2022. As the investing environment changes, so could opinions. These views are unique and are not necessarily shared by fellow employees or by Janus Henderson in general.
Performance Overviews
Performance overview graphs compare the performance of a hypothetical $10,000 investment in the Portfolio with one or more widely used market indices. When comparing the performance of the Portfolio with an index, keep in mind that market indices are not available for investment and do not reflect deduction of expenses.
Average annual total returns are quoted for a Portfolio with more than one year of performance history. Average annual total return is calculated by taking the growth or decline in value of an investment over a period of time, including reinvestment of dividends and distributions, then calculating the annual compounded percentage rate that would have produced the same result had the rate of growth been constant throughout the period. Average annual total return does not reflect the deduction of taxes that a shareholder would pay on Portfolio distributions or redemptions of Portfolio shares.
Cumulative total returns are quoted for a Portfolio with less than one year of performance history. Cumulative total return is the growth or decline in value of an investment over time, independent of the period of time involved. Cumulative total return does not reflect the deduction of taxes that a shareholder would pay on Portfolio distributions or redemptions of Portfolio shares.
Pursuant to federal securities rules, expense ratios shown in the performance chart reflect subsidized (if applicable) and unsubsidized ratios. The total annual fund operating expenses ratio is gross of any fee waivers, reflecting the Portfolio’s unsubsidized expense ratio. The net annual fund operating expenses ratio (if applicable) includes contractual waivers of the Adviser and reflects the Portfolio’s subsidized expense ratio. Ratios may be higher or lower than those shown in the “Financial Highlights” in this report.
Schedule of Investments
Following the performance overview section is the Portfolio’s Schedule of Investments. This schedule reports the types of securities held in the Portfolio on the last day of the reporting period. Securities are usually listed by type (common stock, corporate bonds, U.S. Government obligations, etc.) and by industry classification (banking, communications, insurance, etc.). Holdings are subject to change without notice.
The value of each security is quoted as of the last day of the reporting period. The value of securities denominated in foreign currencies is converted into U.S. dollars.
If the Portfolio invests in foreign securities, it will also provide a summary of investments by country. This summary reports the Portfolio exposure to different countries by providing the percentage of securities invested in each country. The country of each security represents the country of risk. The Portfolio’s Schedule of Investments relies upon the industry group and country classifications published by Bloomberg and/or MSCI Inc.
Tables listing details of individual forward currency contracts, futures, written options, swaptions, and swaps follow the Portfolio’s Schedule of Investments (if applicable).
Statement of Assets and Liabilities
This statement is often referred to as the “balance sheet.” It lists the assets and liabilities of the Portfolio on the last day of the reporting period.
Janus Henderson VIT Forty Portfolio
Useful Information About Your Portfolio Report (unaudited)
The Portfolio’s assets are calculated by adding the value of the securities owned, the receivable for securities sold but not yet settled, the receivable for dividends declared but not yet received on securities owned, and the receivable for Portfolio shares sold to investors but not yet settled. The Portfolio’s liabilities include payables for securities purchased but not yet settled, Portfolio shares redeemed but not yet paid, and expenses owed but not yet paid. Additionally, there may be other assets and liabilities such as unrealized gain or loss on forward currency contracts.
The section entitled “Net Assets Consist of” breaks down the components of the Portfolio’s net assets. Because the Portfolio must distribute substantially all earnings, you will notice that a significant portion of net assets is shareholder capital.
The last section of this statement reports the net asset value (“NAV”) per share on the last day of the reporting period. The NAV is calculated by dividing the Portfolio’s net assets for each share class (assets minus liabilities) by the number of shares outstanding.
Statement of Operations
This statement details the Portfolio’s income, expenses, realized gains and losses on securities and currency transactions, and changes in unrealized appreciation or depreciation of Portfolio holdings.
The first section in this statement, entitled “Investment Income,” reports the dividends earned from securities and interest earned from interest-bearing securities in the Portfolio.
The next section reports the expenses incurred by the Portfolio, including the advisory fee paid to the investment adviser, transfer agent fees and expenses, and printing and postage for mailing statements, financial reports and prospectuses. Expense offsets and expense reimbursements, if any, are also shown.
The last section lists the amounts of realized gains or losses from investment and foreign currency transactions, and changes in unrealized appreciation or depreciation of investments and foreign currency-denominated assets and liabilities. The Portfolio will realize a gain (or loss) when it sells its position in a particular security. A change in unrealized gain (or loss) refers to the change in net appreciation or depreciation of the Portfolio during the reporting period. “Net Realized and Unrealized Gain/(Loss) on Investments” is affected both by changes in the market value of Portfolio holdings and by gains (or losses) realized during the reporting period.
Statements of Changes in Net Assets
These statements report the increase or decrease in the Portfolio’s net assets during the reporting period. Changes in the Portfolio’s net assets are attributable to investment operations, dividends and distributions to investors, and capital share transactions. This is important to investors because it shows exactly what caused the Portfolio’s net asset size to change during the period.
The first section summarizes the information from the Statement of Operations regarding changes in net assets due to the Portfolio’s investment operations. The Portfolio’s net assets may also change as a result of dividend and capital gains distributions to investors. If investors receive their dividends and/or distributions in cash, money is taken out of the Portfolio to pay the dividend and/or distribution. If investors reinvest their dividends and/or distributions, the Portfolio’s net assets will not be affected.
The reinvestment of dividends and distributions is included under “Capital Share Transactions.” “Capital Shares” refers to the money investors contribute to the Portfolio through purchases or withdrawals via redemptions. The Portfolio’s net assets will increase and decrease in value as investors purchase and redeem shares from the Portfolio.
Financial Highlights
This schedule provides a per-share breakdown of the components that affect the Portfolio’s NAV for current and past reporting periods as well as total return, asset size, ratios, and portfolio turnover rate.
The first line in the table reflects the NAV per share at the beginning of the reporting period. The next line reports the net investment income/(loss) per share. Following is the per share total of net gains/(losses), realized and unrealized. Per share dividends and distributions to investors are then subtracted to arrive at the NAV per share at the end of the period. The next line reflects the total return for the period. The total return may include adjustments in accordance with generally accepted accounting principles required at the period end for financial reporting purposes. As a result, the total return may differ from the total return reflected for individual shareholder transactions. Also included are ratios of expenses and net investment income to average net assets.
Janus Henderson VIT Forty Portfolio
Useful Information About Your Portfolio Report (unaudited)
The Portfolio’s expenses may be reduced through expense offsets and expense reimbursements. The ratios shown reflect expenses before and after any such offsets and reimbursements.
The ratio of net investment income/(loss) summarizes the income earned less expenses, divided by the average net assets of the Portfolio during the reporting period. Do not confuse this ratio with the Portfolio’s yield. The net investment income ratio is not a true measure of the Portfolio’s yield because it does not take into account the dividends distributed to the Portfolio’s investors.
The next figure is the portfolio turnover rate, which measures the buying and selling activity in the Portfolio. Portfolio turnover is affected by market conditions, changes in the asset size of the Portfolio, fluctuating volume of shareholder purchase and redemption orders, the nature of the Portfolio’s investments, and the investment style and/or outlook of the portfolio manager(s) and/or investment personnel. A 100% rate implies that an amount equal to the value of the entire portfolio was replaced once during the fiscal year; a 50% rate means that an amount equal to the value of half the portfolio is traded in a year; and a 200% rate means that an amount equal to the value of the entire portfolio is traded every six months.
Janus Henderson VIT Forty Portfolio
Designation Requirements (unaudited)
For federal income tax purposes, the Portfolio designated the following for the year ended December 31, 2022:
| | |
| | |
Capital Gain Distributions | $150,299,830 |
Dividends Received Deduction Percentage | 100% |
Janus Henderson VIT Forty Portfolio
Trustees and Officers (unaudited)
The following are the Trustees and officers of the Trust, together with a brief description of their principal occupations during the last five years (principal occupations for certain Trustees may include periods over five years). The Portfolio’s Statement of Additional Information includes additional information about the Trustees and officers and is available, without charge, by calling 1-877-335-2687.
Each Trustee has served in that capacity since he or she was originally elected or appointed. The Trustees do not serve a specified term of office. Each Trustee will hold office until the termination of the Trust or his or her earlier death, resignation, retirement, incapacity, or removal. Under the Portfolio’s Governance Procedures and Guidelines, the policy is for Trustees to retire no later than the end of the calendar year in which the Trustee turns 75. The Trustees review the Portfolio’s Governance Procedures and Guidelines from time to time and may make changes they deem appropriate. The Portfolio’s Nominating and Governance Committee will consider nominees for the position of Trustee recommended by shareholders. Shareholders may submit the name of a candidate for consideration by the Committee by submitting their recommendations to the Trust’s Secretary. Each Trustee is currently a Trustee of one other registered investment company advised by the Adviser: Janus Investment Fund. Collectively, these two registered investment companies consist of 51 series or funds referred to herein as the Fund Complex.
The Trust’s officers are elected annually by the Trustees for a one-year term. Certain officers also serve as officers of Janus Investment Fund. Certain officers of the Portfolio may also be officers and/or directors of the Adviser. Except as otherwise disclosed, Portfolio officers receive no compensation from the Portfolio, except for the Portfolio’s Chief Compliance Officer, as authorized by the Trustees.
Janus Henderson VIT Forty Portfolio
Trustees and Officers (unaudited)
| | | | | | |
TRUSTEES |
Name, Address, and Age | Positions Held with the Trust | Length of Time Served | Principal Occupations During the Past Five Years | Number of Portfolios/Funds in Fund Complex Overseen by Trustee | Other Directorships Held by Trustee During the Past Five Years |
Independent Trustees | | | | |
Alan A. Brown
151 Detroit Street
Denver, CO 80206
DOB: 1962 | Chairman
Trustee | 5/22-Present
1/13-Present | Principal, Curam Holdings LLC (since 2018). Formerly, Executive Vice President, Institutional Markets, of Black Creek Group (private equity real estate investment management firm) (2012-2018), Executive Vice President and Co-Head, Global Private Client Group (2007-2010), Executive Vice President, Mutual Funds (2005-2007), and Chief Marketing Officer (2001-2005) of Nuveen Investments, Inc. (asset management). | 51 | Advisory Board Member of AEW Core Property Trust (open-end property fund) (since 2020), and Director of WTTW (PBS affiliate) (since 2003). Formerly, Director of MotiveQuest LLC (strategic social market research company) (2003-2016), Director of Nuveen Global Investors LLC (2007-2011), Director of Communities in Schools (2004-2010), and Director of Mutual Fund Education Alliance (until 2010). |
Cheryl D. Alston
151 Detroit Street
Denver, CO 80206
DOB: 1966 | Trustee | 8/22-Present | Executive Director and Chief Investment Officer, Employees’ Retirement Fund of the City of Dallas (since 2004). | 51 | Director of Blue Cross Blue Shield of Kansas City (a not-for-profit health insurance provider) (since 2016) and Director of Global Life Insurance (life and supplemental health insurance provider) (since 2017). Formerly, Director of Federal Home Loan Bank of Dallas (2017-2021). |
Janus Henderson VIT Forty Portfolio
Trustees and Officers (unaudited)
| | | | | | |
TRUSTEES |
Name, Address, and Age | Positions Held with the Trust | Length of Time Served | Principal Occupations During the Past Five Years | Number of Portfolios/Funds in Fund Complex Overseen by Trustee | Other Directorships Held by Trustee During the Past Five Years |
Independent Trustees | | | | |
William D. Cvengros
151 Detroit Street
Denver, CO 80206
DOB: 1948 | Trustee | 1/11-Present | Chief Executive Officer of SJC Capital, LLC (a personal investment company and consulting firm) (since 2002). Formerly, Chief Executive Officer and President of PIMCO Advisors Holdings L.P. (a publicly traded investment management firm) (1994-2000), and Chief Investment Officer (1987-1994) and Vice Chairman and Director (1990-1994) of Pacific Life Insurance Company (a mutual life insurance and annuity company) (1987-1994). | 51 | Member, Limited Partner Advisory Committee, Karmel Capital Fund III (since 2022), Member of the Investment Committee for the Orange Country Community Foundation (a grantmaking foundation) (since 2020), Advisory Board Member, RevOZ Fund LP and related funds (real estate investments for opportunity zones) (since 2020), and Advisory Board Member, Innovate Partners Emerging Growth and Equity Fund I (early stage venture capital fund) (since 2014). Formerly, Managing Trustee of National Retirement Partners Liquidating Trust (2013-2016), Chairman, National Retirement Partners, Inc. (formerly a network of advisors to 401(k) plans) (2005-2013), Director of Prospect Acquisition Corp. (a special purpose acquisition corporation) (2007-2009), Director of RemedyTemp, Inc. (temporary help services company) (1996-2006), and Trustee of PIMCO Funds Multi-Manager Series (1990-2000) and Pacific Life Variable Life & Annuity Trusts (1987-1994). |
Janus Henderson VIT Forty Portfolio
Trustees and Officers (unaudited)
| | | | | | |
TRUSTEES |
Name, Address, and Age | Positions Held with the Trust | Length of Time Served | Principal Occupations During the Past Five Years | Number of Portfolios/Funds in Fund Complex Overseen by Trustee | Other Directorships Held by Trustee During the Past Five Years |
Independent Trustees | | | | |
Raudline Etienne
151 Detroit Street
Denver, CO 80206
DOB: 1965 | Trustee | 6/16-Present | Founder, Daraja Capital (advisory and investment firm) (since 2016). Formerly, Senior Vice President and Senior Advisor, Albright Stonebridge Group LLC (global strategy firm) (2011-2021), and Deputy Comptroller and Chief Investment Officer, New York State Common Retirement Fund (public pension fund) (2008-2011). | 51 | Member of the Investment Committee for Cooper Union (private college) (since 2021), Board Member, Van Alen Institute (nonprofit architectural and design organization) (2019-2022). |
Janus Henderson VIT Forty Portfolio
Trustees and Officers (unaudited)
| | | | | | |
TRUSTEES |
Name, Address, and Age | Positions Held with the Trust | Length of Time Served | Principal Occupations During the Past Five Years | Number of Portfolios/Funds in Fund Complex Overseen by Trustee | Other Directorships Held by Trustee During the Past Five Years |
Independent Trustees | | | | |
Darrell B. Jackson
151 Detroit Street
Denver, CO 80206
DOB: 1958 | Trustee | 8/22-Present | President and Chief Executive Officer, The Efficace Group Inc. (since 2018). Formerly, President and Chief Executive Officer, Seaway Bank and Trust Company (community bank) (2014-2015), and Executive Vice President and Co-President, Wealth Management (2009-2014), and several senior positions, including Group Executive, Senior Vice President, and Vice President (1995-2009) of Northern Trust Company (financial services company) (1995-2014). | 51 | Director of Amalgamated Financial Corp (bank) (since August 2021), Director of YR Media (a not-for-profit production company) (since 2021), and Director of Gray-Bowen-Scott (transportation project consulting firm) (since April 2020). Formerly, Director of Delaware Place Bank (closely held commercial bank) (2016-2018) and Director of Seaway Bank and Trust Company (2014-2015). |
Janus Henderson VIT Forty Portfolio
Trustees and Officers (unaudited)
| | | | | | |
TRUSTEES |
Name, Address, and Age | Positions Held with the Trust | Length of Time Served | Principal Occupations During the Past Five Years | Number of Portfolios/Funds in Fund Complex Overseen by Trustee | Other Directorships Held by Trustee During the Past Five Years |
Independent Trustees | | | | |
William F. McCalpin
151 Detroit Street
Denver, CO 80206
DOB: 1957 | Trustee | 6/02-Present | Chief Executive Officer, muun chi LLC (organic food business) (since 2022) and Independent Consultant (since 2019). Formerly, Chief Operating Officer, muun chi LLC (2020-2022), Managing Partner, Impact Investments, Athena Capital Advisors LLC (independent registered investment advisor) (2016-2019), Managing Director, Holos Consulting LLC (provides consulting services to foundations and other nonprofit organizations) (2009-2016), Chief Executive Officer, Imprint Capital Advisors (impact investment firm) (2013-2015), and Executive Vice President and Chief Operating Officer of The Rockefeller Brothers Fund (a private family foundation) (1998-2006). | 51 | Chairman of the Board and Trustee of The Investment Fund for Foundations Investment Program (TIP) (consisting of 1 fund) (since 2008). Formerly, Director of the F.B. Heron Foundation (a private grantmaking foundation) (2006-2022), and Director of Mutual Fund Directors Forum (a non-profit organization serving independent directors of U.S. mutual funds) (2016-2021). |
Janus Henderson VIT Forty Portfolio
Trustees and Officers (unaudited)
| | | | | | |
TRUSTEES |
Name, Address, and Age | Positions Held with the Trust | Length of Time Served | Principal Occupations During the Past Five Years | Number of Portfolios/Funds in Fund Complex Overseen by Trustee | Other Directorships Held by Trustee During the Past Five Years |
Independent Trustees | | | | |
Gary A. Poliner
151 Detroit Street
Denver, CO 80206
DOB: 1953 | Trustee | 6/16-Present | Retired. Formerly, President (2010-2013) of Northwestern Mutual Life Insurance Company. | 51 | Director of MGIC Investment Corporation (private mortgage insurance) (since 2013). Formerly, Director, West Bend Mutual Insurance Company (property/casualty insurance) (2013-2021), Trustee of Northwestern Mutual Life Insurance Company (2010-2013) and Director of Frank Russell Company (global asset management firm) (2008-2013). |
Diane L. Wallace
151 Detroit Street
Denver, CO 80206
DOB: 1958 | Trustee | 6/17-Present | Retired. Formerly, Chief Operating Officer, Senior Vice President-Operations, and Chief Financial Officer for Driehaus Capital Management, LLC (1988-2006) and Treasurer for Driehaus Mutual Funds (1996-2002). | 51 | Formerly, Director of Family Service of Lake County (2019-2021), Independent Trustee, Henderson Global Funds (13 portfolios) (2015-2017), Independent Trustee, State Farm Associates' Funds Trust, State Farm Mutual Fund Trust, and State Farm Variable Product Trust (28 portfolios) (2013-2017). |
Janus Henderson VIT Forty Portfolio
Trustees and Officers (unaudited)
| | | | |
OFFICERS |
Name, Address, and Age | Positions Held with the Trust | Term of Office* and Length of Time Served | Principal Occupations During the Past Five Years |
A. Douglas Rao 151 Detroit Street Denver, CO 80206 DOB: 1974 | Executive Vice President and Co-Portfolio Manager Janus Henderson Forty Portfolio | 6/13-Present | Portfolio Manager for other Janus Henderson accounts. |
Brian Recht
151 Detroit Street
Denver, CO 80206
DOB: 1987 | Executive Vice President and Co-Portfolio Manager
Janus Henderson Forty Portfolio | 3/22-Present | Portfolio Manager for other Janus Henderson accounts and Analyst for the Adviser. |
Nick Schommer
151 Detroit Street
Denver, CO 80206
DOB: 1978 | Executive Vice President and Co-Portfolio Manager
Janus Henderson Forty Portfolio | 1/16-Present | Portfolio Manager for other Janus Henderson accounts. |
Michelle Rosenberg
151 Detroit Street
Denver, CO 80206
DOB: 1973 | President and Chief Executive Officer | 9/22-Present | General Counsel and Corporate Secretary of Janus Henderson Investors (since 2018). Formerly, Interim President and Chief Executive Officer of the Trust and Janus Investment Fund (2022), Senior Vice President and Head of Legal, North America of Janus Henderson Investors (2017-2018) and Deputy General Counsel of Janus Henderson US (Holdings) Inc. (2015-2018). |
* Officers are elected at least annually by the Trustees for a one-year term and may also be elected from time to time by the Trustees for an interim period. |
Janus Henderson VIT Forty Portfolio
Trustees and Officers (unaudited)
| | | | |
OFFICERS |
Name, Address, and Age | Positions Held with the Trust | Term of Office* and Length of Time Served | Principal Occupations During the Past Five Years |
Kristin Mariani
151 Detroit Street
Denver, CO 80206
DOB: 1966 | Vice President and Chief Compliance Officer | 7/20-Present | Head of Compliance, North America at Janus Henderson Investors (since September 2020), and Chief Compliance Officer at Janus Henderson Investors US LLC (since September 2017). Formerly, Anti-Money Laundering Officer for the Trust and Janus Investment Fund (July 2020-December 2022), Global Head of Investment Management Compliance at Janus Henderson Investors (February 2019-August 2020), Vice President, Head of Global Distribution Compliance and Chief Compliance Officer at Janus Henderson Distributors US LLC (May 2017-September 2017), Vice President, Compliance at Janus Henderson US (Holdings) Inc., Janus Henderson Investors US LLC, and Janus Henderson Distributors US LLC (2009-2017). |
Jesper Nergaard
151 Detroit Street
Denver, CO 80206
DOB: 1962 | Chief Financial Officer
Vice President, Treasurer, and Principal Accounting Officer | 3/05-Present
2/05-Present | Head of U.S. Fund Administration, Janus Henderson Investors and Janus Henderson Services US LLC. |
Abigail J. Murray
151 Detroit Street
Denver, CO 80206
DOB: 1975 | Vice President, Chief Legal Officer, and Secretary | 12/20-Present | Managing Counsel (since 2020). Formerly, Senior Counsel for Invesco Ltd. (2017-2020), and Vice President and Senior Counsel, ALPS Fund Services, Inc. and Assistant General Counsel, ALPS Advisors, Inc. (2015-2017). |
Ciaran Askin
151 Detroit Street
Denver, CO 80206
DOB: 1978 | Anti-Money Laundering Officer | 12/22-Present | Global Head of Financial Crime, Janus Henderson Investors (since 2022). Formerly, Global Head of Financial Crime for Invesco Ltd. (2017-2022). |
* Officers are elected at least annually by the Trustees for a one-year term and may also be elected from time to time by the Trustees for an interim period. |
| | | | | | | | |
| | | | | |

| | | | |
This report is submitted for the general information of shareholders of the Portfolio. It is not an offer or solicitation for the Portfolio and is not authorized for distribution to prospective investors unless preceded or accompanied by an effective prospectus. |
Janus Henderson is a trademark of Janus Henderson Group plc or one of its subsidiaries. © Janus Henderson Group plc Janus Henderson Distributors US LLC |
| | | | 109-02-81115 03-23 |
| | | |
| | | |
| | | ANNUAL REPORT December 31, 2022 |
| | |
| | Janus Henderson VIT Global Research Portfolio |
| | |
| | Janus Aspen Series |
| |
| | | |
| | | HIGHLIGHTS · Portfolio management perspective · Investment strategy behind your portfolio · Portfolio performance, characteristics
and holdings |
Table of Contents
Janus Henderson VIT Global Research Portfolio
Janus Henderson VIT Global Research Portfolio (unaudited)
| | | | | | |
| | | | | Team-Based Approach Led by Matthew Peron, Director of Research |
| | | |
PERFORMANCE SUMMARY
For the 12-month period ending December 31, 2022, the Janus Henderson Global Research Portfolio’s Institutional Shares and Service Shares returned -19.41% and -19.61%, respectively, while its primary benchmark, the MSCI World IndexSM, returned -18.14%. The Portfolio’s secondary benchmark, the MSCI All Country World IndexSM, returned -18.36%.
MARKET ENVIRONMENT
Stocks declined over the 12-month period as soaring inflation, rising interest rates, and recession fears led to market turbulence. Stocks started out the year with volatility as worsening price pressures raised expectations for more restrictive central bank policies. Volatility increased sharply late in the first quarter after Russia’s invasion of Ukraine sent commodity prices soaring while raising concerns about supply disruptions. Market volatility continued as record-high inflation in many countries led to synchronized and often aggressive policy tightening. Concerns about a looming European energy crisis, as Russia reduced gas supplies, added to negative sentiment in the third quarter, further pressuring equity performance. Global equities regained some ground in the fourth quarter as signs of moderating inflation raised hopes for a slower pace of policy tightening in 2023. Investors also revised their worst fears over a potential European energy crisis and the global economic outlook.
PERFORMANCE DISCUSSION
Our global sector teams employ a bottom-up, fundamental approach to identify what we consider the best global opportunities. Our analysts take a long-term view of companies with a focus on value creation and duration of growth, which we believe may lead to high returns on invested capital. The Portfolio directly captures the insights of our teams through their highest-conviction ideas. In building a diversified Portfolio, we seek to minimize macroeconomic risks while generating strong performance over longer periods.
Top detractors among individual holdings included semiconductor equipment supplier ASML Holding and graphics chipmaker Nvidia. These stocks faced headwinds due to fears of an industry-wide decline in semiconductor sales in 2023. New U.S. government restrictions on the export of high-end data center chips to China also pressured Nvidia’s shares. Despite near-term business headwinds, we believe these are high-quality businesses with durable growth drivers, strong management teams, robust margins, and healthy free-cash-flow generation. ASML has benefited from a higher degree of earnings visibility relative to some of its competitors, supported by a large order backlog. Nvidia made new product announcements across gaming, data center, automotive, software, and services.
Streaming entertainment company Netflix was another detractor. Netflix’s stock declined in the first quarter on concerns over slowing subscriber growth, which in part reflected a delay in local language content spend in Eastern Europe and Southeast Asia. The company also issued weak guidance for the first quarter of 2022. Given our concerns over its subscriber growth trends, we liquidated our position in Netflix and reallocated assets from the sale into what we believe are more compelling investment ideas.
On a positive note, several investments benefited from a sharp rise in commodity prices in the aftermath of Russia's invasion of Ukraine. Oil refiner Marathon Petroleum reported strong profits and revenue growth that exceeded analyst estimates, supported by tight refining capacity and strong demand for oil products. Marathon Petroleum also continued to demonstrate a strong commitment to enhancing shareholder value through its share repurchase program. Oil producer ConocoPhillips, another contributor, reported strong financial results aided by favorable pricing. Like Marathon Petroleum, it continued to return cash to shareholders.
Janus Henderson VIT Global Research Portfolio (unaudited)
Higher commodity prices provided an earnings tailwind for Canada-based Teck Resources, a cost-disciplined producer of steelmaking coal, copper, and zinc. Teck Resources is also shifting its operations to sustainable metals, such as copper, that are essential to the green energy transition. While global copper demand is rising, copper production is growing more costly and difficult as stores of easily accessible ore are depleted. Given these dynamics, we expect copper prices to rise over the long term, benefiting cost-advantaged producers such as Teck Resources.
OUTLOOK
We have seen signs that higher interest rates are starting to impact the economy, and we believe we could see further reductions to corporate earnings. While we anticipate slower growth next year, we have been reassured by the resilience of the U.S. economy and the general health of consumer and corporate balance sheets. China’s more pro-growth policies and relaxation of COVID-19 restrictions could also have positive implications for the global economy.
As the market searches for a bottom, we believe investors will seek out companies with high-quality earnings growth, well-capitalized balance sheets, reasonable valuations, and sustainable, organic growth prospects. In our view, such companies will prove resilient not only in the near term, but as we leave behind the era of ultra-low interest rates. Going forward, we believe we could see higher structural inflation and tighter monetary policy. We also believe this environment will reward judicious allocators of capital, but penalize companies with high degrees of leverage. Just as this environment will help to distinguish high-quality companies, we believe it will also work to our advantage as active investment managers. We continue to pay close attention to the price we pay for growth, as we look for opportunities to take advantage of trends such as e-commerce, cloud computing, and healthcare innovation.
Thank you for your investment in Janus Henderson VIT Global Research Portfolio.
Actively managed portfolios may fail to produce the intended results. No investment strategy can ensure a profit or eliminate the risk of loss.
Diversification neither assures a profit nor eliminates the risk of experiencing investment losses.
Quantitative Tightening (QT) is a government monetary policy occasionally used to decrease the money supply by either selling government securities or letting them mature and removing them from its cash balances.
Janus Henderson VIT Global Research Portfolio (unaudited)
Portfolio At A Glance
December 31, 2022
| | | | | | | | | | |
| | | | | | | | | |
| | | | | | | | | |
| | | | | | | | | |
| 5 Top Contributors - Holdings | 5 Top Detractors - Holdings |
| | Average
Weight | | Relative
Contribution | | | Average
Weight | | Relative
Contribution |
| Marathon Petroleum Corp | 1.17% | | 0.68% | | ASML Holding NV | 2.35% | | -0.32% |
| ConocoPhillips | 1.16% | | 0.52% | | NVIDIA Corp | 1.42% | | -0.30% |
| Canadian Natural Resources Ltd | 1.30% | | 0.48% | | Netflix Inc | 0.21% | | -0.28% |
| Teck Resources Ltd | 1.09% | | 0.47% | | Marvell Technology Inc | 0.59% | | -0.27% |
| Tesla Inc | 0.46% | | 0.34% | | Uber Technologies Inc | 0.73% | | -0.24% |
| | | | | | | |
| 3 Top Contributors - Sectors* | | | | | |
| | | Relative | | Portfolio | MSCI World Index |
| | | Contribution | | Average Weight | Average Weight |
| Energy | | 0.63% | | 8.05% | 7.91% |
| Healthcare | | 0.21% | | 13.78% | 13.52% |
| Financials | | 0.08% | | 18.27% | 18.25% |
| | | | | | |
| | | | | | |
| 5 Top Detractors - Sectors* | | | | | |
| | | Relative | | Portfolio | MSCI World Index |
| | | Contribution | | Average Weight | Average Weight |
| Communications | | -0.85% | | 8.51% | 8.86% |
| Consumer | | -0.55% | | 15.72% | 15.72% |
| Technology | | -0.53% | | 18.25% | 18.66% |
| Industrials | | -0.11% | | 17.19% | 17.01% |
| Other** | | -0.01% | | 0.23% | 0.06% |
| | | | | | | |
| Relative contribution reflects how the portolio's holdings impacted return relative to the benchmark. Cash and securities not held in the portfolio are not shown. For equity portfolios, relative contribution compares the performance of a security in the portfolio to the benchmark's total return, factoring in the difference in weight of that security in the benchmark. Returns are calculated using daily returns and previous day ending weights rolled up by ticker, excluding fixed income securities, gross of advisory fees, may exclude certain derivatives and will differ from actual performance.
Performance attribution reflects returns gross of advisory fees and may differ from actual returns as they are based on end of day holdings. Attribution is calculated by geometrically linking daily returns for the portfolio and index. |
* | The sectors listed above reflect those covered by the six analyst teams who comprise the Janus Henderson Research Team. |
** | Not a GICS classified sector. |
Janus Henderson VIT Global Research Portfolio (unaudited)
Portfolio At A Glance
December 31, 2022
| | |
5 Largest Equity Holdings - (% of Net Assets) |
Microsoft Corp | |
Software | 4.6% |
Apple Inc | |
Technology Hardware, Storage & Peripherals | 4.0% |
Alphabet Inc - Class C | |
Interactive Media & Services | 2.6% |
Ferguson PLC | |
Trading Companies & Distributors | 2.3% |
ASML Holding NV | |
Semiconductor & Semiconductor Equipment | 2.2% |
| | 15.7% |
| | | | | | |
Asset Allocation - (% of Net Assets) | |
Common Stocks | | 98.9% | |
Preferred Stocks | | 0.8% | |
Private Placements | | 0.2% | |
Investment Companies | | 0.1% | |
Other | | 0.0% |
| | | 100.0% |
| | |
Top Country Allocations - Long Positions - (% of Investment Securities) |
As of December 31, 2022 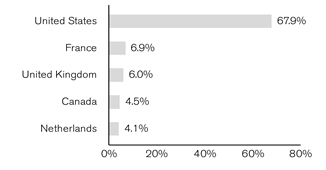
| As of December 31, 2021 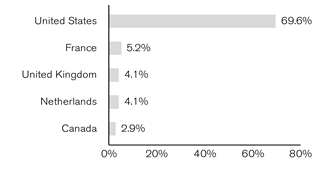
|
Janus Henderson VIT Global Research Portfolio (unaudited)
Performance
| |
See important disclosures on the next page. |

| | | | | | | | | | |
| | | | | | | | |
| | | | | | | | | |
Average Annual Total Return - for the periods ended December 31, 2022 | | | Prospectus Expense Ratios |
| | One
Year | Five
Year | Ten
Year | Since
Inception* | | | Total Annual Fund
Operating Expenses‡ |
Institutional Shares | | -19.41% | 6.55% | 9.15% | 8.11% | | | 0.77% |
Service Shares | | -19.61% | 6.29% | 8.88% | 7.83% | | | 1.02% |
MSCI World Index | | -18.14% | 6.14% | 8.85% | 7.00% | | | |
MSCI All Country World Index | | -18.36% | 5.23% | 7.98% | N/A** | | | |
Morningstar Quartile - Institutional Shares | | 1st | 2nd | 2nd | 2nd | | | |
Morningstar Ranking - based on total returns for World Large Stock Funds | | 44/368 | 112/298 | 107/242 | 50/86 | | | |
Returns quoted are past performance and do not guarantee future results; current performance may be lower or higher. Investment returns and principal value will vary; there may be a gain or loss when shares are sold. For the most recent month-end performance call 800.668.0434 or visit janushenderson.com/VITperformance.
This Portfolio has a performance-based management fee that may adjust up or down based on the Portfolio’s performance.
Performance may be affected by risks that include those associated with foreign and emerging markets, fixed income securities, high-yield and high-risk securities, undervalued, overlooked and smaller capitalization companies, real estate related securities including Real Estate Investment Trusts (REITs), Environmental, Social and Governance (ESG) factors, non-diversification, portfolio turnover, derivatives, short sales, initial public offerings (IPOs) and potential conflicts of interest. Each product has different risks. Please see the prospectus for more information about risks, holdings and other details.
Returns do not reflect the deduction of fees, charges or expenses of any insurance product or qualified plan. If applied, returns would have been lower.
Returns include reinvestment of all dividends and distributions and do not reflect the deduction of taxes that a shareholder would pay on Portfolio distributions or redemptions of Portfolio shares. The returns do not include adjustments in accordance with generally accepted accounting principles required at the period end for financial reporting purposes.
Performance for Service Shares prior to December 31, 1999 reflects the performance of Institutional Shares adjusted to reflect the expenses of Service Shares.
Ranking is for the share class shown only; other classes may have different performance characteristics.
© 2022 Morningstar, Inc. All Rights Reserved.
There is no assurance that the investment process will consistently lead to successful investing.
See Notes to Schedule of Investments and Other Information for index definitions.
Index performance does not reflect the expenses of managing a portfolio as an index is unmanaged and not available for direct investment.
Janus Henderson VIT Global Research Portfolio (unaudited)
Performance
See “Useful Information About Your Portfolio Report.”
*The Portfolio’s inception date – September 13, 1993
**Since inception return is not shown for the index because the index’s inception date differs significantly from the Portfolio’s inception date.
‡ As stated in the prospectus. See Financial Highlights for actual expense ratios during the reporting period.
Janus Henderson VIT Global Research Portfolio (unaudited)
Expense Examples
As a shareholder of the Portfolio, you incur two types of costs: (1) transaction costs and (2) ongoing costs, including management fees; 12b-1 distribution and shareholder servicing fees (applicable to Service Shares only); transfer agent fees and expenses payable pursuant to the Transfer Agency Agreement; and other Portfolio expenses. This example is intended to help you understand your ongoing costs (in dollars) of investing in the Portfolio and to compare these costs with the ongoing costs of investing in other mutual funds. To do so, compare this 5% hypothetical example with the 5% hypothetical examples that appear in the shareholder reports of the other funds. The example is based upon an investment of $1,000 invested at the beginning of the period and held for the six-months indicated, unless noted otherwise in the table and footnotes below.
Actual Expenses
The information in the table under the heading “Actual” provides information about actual account values and actual expenses. You may use the information in these columns, together with the amount you invested, to estimate the expenses that you paid over the period. Simply divide your account value by $1,000 (for example, an $8,600 account value divided by $1,000 = 8.6), then multiply the result by the number in the appropriate column for your share class under the heading entitled “Expenses Paid During Period” to estimate the expenses you paid on your account during the period.
Hypothetical Example for Comparison Purposes
The information in the table under the heading “Hypothetical (5% return before expenses)” provides information about hypothetical account values and hypothetical expenses based upon the Portfolio’s actual expense ratio and an assumed rate of return of 5% per year before expenses, which is not the Portfolio’s actual return. The hypothetical account values and expenses may not be used to estimate the actual ending account balance or expenses you paid for the period. You may use this information to compare the ongoing costs of investing in the Portfolio and other funds. To do so, compare this 5% hypothetical example with the 5% hypothetical examples that appear in the shareholder reports of the other funds. Additionally, for an analysis of the fees associated with an investment in either share class or other similar funds, please visit www.finra.org/fundanalyzer.
Please note that the expenses shown in the table are meant to highlight your ongoing costs only and do not reflect any transaction costs, such as any charges at the separate account level or contract level. These fees are fully described in the Portfolio’s prospectuses. Therefore, the hypothetical examples are useful in comparing ongoing costs only, and will not help you determine the relative total costs of owning different funds. In addition, if these transaction costs were included, your costs would have been higher.
| | | | | | | | | | | |
| | | | | | | | |
| | | Actual | | Hypothetical
(5% return before expenses) | |
| Beginning
Account
Value
(7/1/22) | Ending
Account
Value
(12/31/22) | Expenses
Paid During
Period
(7/1/22 - 12/31/22)† | | Beginning
Account
Value
(7/1/22) | Ending
Account
Value
(12/31/22) | Expenses
Paid During
Period
(7/1/22 - 12/31/22)† | Net Annualized
Expense Ratio
(7/1/22 - 12/31/22) |
Institutional Shares | $1,000.00 | $1,040.60 | $3.29 | | $1,000.00 | $1,021.98 | $3.26 | 0.64% |
Service Shares | $1,000.00 | $1,039.30 | $4.63 | | $1,000.00 | $1,020.67 | $4.58 | 0.90% |
† | Expenses Paid During Period are equal to the Net Annualized Expense Ratio multiplied by the average account value over the period, multiplied by 184/365 (to reflect the one-half year period). Expenses in the examples include the effect of applicable fee waivers and/or expense reimbursements, if any. Had such waivers and/or reimbursements not been in effect, your expenses would have been higher. Please refer to the Notes to Financial Statements or the Portfolio’s prospectuses for more information regarding waivers and/or reimbursements. |
Janus Henderson VIT Global Research Portfolio
Schedule of Investments
December 31, 2022
| | | | | | | | |
Shares
| | | Value | |
Common Stocks– 98.9% | | | |
Aerospace & Defense – 2.0% | | | |
| | Airbus SE | | 72,857 | | | $8,661,629 | |
| | General Dynamics Corp | | 20,770 | | | 5,153,245 | |
| | | 13,814,874 | |
Air Freight & Logistics – 1.7% | | | |
| | United Parcel Service Inc | | 65,887 | | | 11,453,796 | |
Airlines – 0.4% | | | |
| | Ryanair Holdings PLC (ADR)* | | 38,588 | | | 2,884,839 | |
Automobiles – 0.4% | | | |
| | Tesla Inc* | | 20,733 | | | 2,553,891 | |
Banks – 6.1% | | | |
| | Bank of America Corp | | 220,092 | | | 7,289,447 | |
| | BNP Paribas SA | | 104,986 | | | 5,973,622 | |
| | HDFC Bank Ltd | | 144,828 | | | 2,851,158 | |
| | JPMorgan Chase & Co | | 111,429 | | | 14,942,629 | |
| | Natwest Group PLC | | 1,550,460 | | | 4,948,229 | |
| | Toronto-Dominion Bank/The | | 86,746 | | | 5,617,537 | |
| | | 41,622,622 | |
Beverages – 3.8% | | | |
| | Constellation Brands Inc | | 56,836 | | | 13,171,743 | |
| | Pernod Ricard SA | | 65,927 | | | 12,956,738 | |
| | | 26,128,481 | |
Biotechnology – 3.6% | | | |
| | AbbVie Inc | | 61,291 | | | 9,905,239 | |
| | Ascendis Pharma A/S (ADR)* | | 15,530 | | | 1,896,679 | |
| | Horizon Therapeutics PLC* | | 35,423 | | | 4,031,137 | |
| | Sarepta Therapeutics Inc* | | 24,178 | | | 3,132,985 | |
| | Vertex Pharmaceuticals Inc* | | 19,857 | | | 5,734,304 | |
| | | 24,700,344 | |
Capital Markets – 3.9% | | | |
| | Blackstone Group Inc | | 53,451 | | | 3,965,530 | |
| | Charles Schwab Corp | | 84,861 | | | 7,065,527 | |
| | London Stock Exchange Group PLC | | 23,899 | | | 2,061,664 | |
| | LPL Financial Holdings Inc | | 21,580 | | | 4,664,949 | |
| | Morgan Stanley | | 72,960 | | | 6,203,059 | |
| | State Street Corp | | 35,307 | | | 2,738,764 | |
| | | 26,699,493 | |
Chemicals – 1.4% | | | |
| | Linde PLC | | 29,194 | | | 9,522,499 | |
Consumer Finance – 0.9% | | | |
| | Capital One Financial Corp | | 43,866 | | | 4,077,783 | |
| | OneMain Holdings Inc | | 59,115 | | | 1,969,121 | |
| | | 6,046,904 | |
Diversified Financial Services – 0.8% | | | |
| | Apollo Global Management Inc | | 82,622 | | | 5,270,457 | |
Electric Utilities – 0.5% | | | |
| | NextEra Energy Inc | | 40,836 | | | 3,413,890 | |
Electronic Equipment, Instruments & Components – 1.1% | | | |
| | Hexagon AB - Class B | | 729,327 | | | 7,670,739 | |
Entertainment – 1.9% | | | |
| | Liberty Media Corp-Liberty Formula One* | | 122,994 | | | 7,352,581 | |
| | Nintendo Co Ltd | | 137,200 | | | 5,746,209 | |
| | | 13,098,790 | |
Equity Real Estate Investment Trusts (REITs) – 0.8% | | | |
| | American Tower Corp | | 26,063 | | | 5,521,707 | |
Health Care Equipment & Supplies – 1.5% | | | |
| | Abbott Laboratories | | 25,212 | | | 2,768,025 | |
| | Boston Scientific Corp* | | 92,751 | | | 4,291,589 | |
| | Dentsply Sirona Inc | | 48,513 | | | 1,544,654 | |
| | |
See Notes to Schedule of Investments and Other Information and Notes to Financial Statements. |
| |
8 | DECEMBER 31, 2022 |
Janus Henderson VIT Global Research Portfolio
Schedule of Investments
December 31, 2022
| | | | | | | | |
Shares
| | | Value | |
Common Stocks– (continued) | | | |
Health Care Equipment & Supplies– (continued) | | | |
| | Edwards Lifesciences Corp* | | 25,560 | | | $1,907,032 | |
| | | 10,511,300 | |
Health Care Providers & Services – 1.8% | | | |
| | Centene Corp* | | 53,006 | | | 4,347,022 | |
| | Humana Inc | | 10,027 | | | 5,135,729 | |
| | UnitedHealth Group Inc | | 4,873 | | | 2,583,567 | |
| | | 12,066,318 | |
Hotels, Restaurants & Leisure – 3.5% | | | |
| | Booking Holdings Inc* | | 3,794 | | | 7,645,972 | |
| | Entain PLC | | 380,278 | | | 6,095,958 | |
| | McDonald's Corp | | 38,909 | | | 10,253,689 | |
| | | 23,995,619 | |
Independent Power and Renewable Electricity Producers – 1.6% | | | |
| | RWE AG | | 51,801 | | | 2,303,096 | |
| | Vistra Energy Corp | | 359,685 | | | 8,344,692 | |
| | | 10,647,788 | |
Information Technology Services – 4.2% | | | |
| | Fidelity National Information Services Inc | | 38,838 | | | 2,635,158 | |
| | Global Payments Inc | | 27,855 | | | 2,766,559 | |
| | Mastercard Inc | | 34,814 | | | 12,105,872 | |
| | Visa Inc | | 53,256 | | | 11,064,467 | |
| | | 28,572,056 | |
Insurance – 3.0% | | | |
| | AIA Group Ltd | | 471,000 | | | 5,189,308 | |
| | Aon PLC - Class A | | 15,534 | | | 4,662,375 | |
| | Beazley PLC | | 228,519 | | | 1,869,979 | |
| | Intact Financial Corp | | 14,943 | | | 2,151,381 | |
| | Progressive Corp/The | | 52,059 | | | 6,752,573 | |
| | | 20,625,616 | |
Interactive Media & Services – 2.9% | | | |
| | Alphabet Inc - Class C* | | 203,413 | | | 18,048,835 | |
| | Tencent Holdings Ltd | | 35,100 | | | 1,491,913 | |
| | | 19,540,748 | |
Internet & Direct Marketing Retail – 2.5% | | | |
| | Amazon.com Inc* | | 165,212 | | | 13,877,808 | |
| | JD.Com Inc - Class A | | 114,559 | | | 3,220,479 | |
| | | 17,098,287 | |
Life Sciences Tools & Services – 1.3% | | | |
| | Danaher Corp | | 12,216 | | | 3,242,371 | |
| | Thermo Fisher Scientific Inc | | 10,310 | | | 5,677,614 | |
| | | 8,919,985 | |
Machinery – 4.5% | | | |
| | Alstom SA | | 247,943 | | | 6,086,719 | |
| | Atlas Copco AB - Class A | | 688,510 | | | 8,156,011 | |
| | Deere & Co | | 21,814 | | | 9,352,971 | |
| | Parker-Hannifin Corp | | 24,547 | | | 7,143,177 | |
| | | 30,738,878 | |
Metals & Mining – 2.7% | | | |
| | Freeport-McMoRan Inc | | 143,187 | | | 5,441,106 | |
| | Rio Tinto PLC | | 74,823 | | | 5,248,930 | |
| | Teck Resources Ltd | | 206,814 | | | 7,817,013 | |
| | | 18,507,049 | |
Oil, Gas & Consumable Fuels – 6.4% | | | |
| | Canadian Natural Resources Ltd | | 145,275 | | | 8,068,568 | |
| | Cheniere Energy Inc | | 18,831 | | | 2,823,897 | |
| | ConocoPhillips | | 70,872 | | | 8,362,896 | |
| | EOG Resources Inc | | 51,284 | | | 6,642,304 | |
| | Marathon Petroleum Corp | | 72,005 | | | 8,380,662 | |
| | |
See Notes to Schedule of Investments and Other Information and Notes to Financial Statements. |
| |
Janus Aspen Series | 9 |
Janus Henderson VIT Global Research Portfolio
Schedule of Investments
December 31, 2022
| | | | | | | | |
Shares
| | | Value | |
Common Stocks– (continued) | | | |
Oil, Gas & Consumable Fuels– (continued) | | | |
| | Suncor Energy Inc | | 188,665 | | | $5,985,494 | |
| | Total SE | | 57,381 | | | 3,580,934 | |
| | | 43,844,755 | |
Personal Products – 1.9% | | | |
| | Unilever PLC | | 254,299 | | | 12,759,263 | |
Pharmaceuticals – 6.2% | | | |
| | AstraZeneca PLC | | 82,978 | | | 11,258,994 | |
| | Catalent Inc* | | 30,328 | | | 1,365,063 | |
| | Eli Lilly & Co | | 8,768 | | | 3,207,685 | |
| | Merck & Co Inc | | 74,774 | | | 8,296,175 | |
| | Novartis AG | | 74,049 | | | 6,709,270 | |
| | Organon & Co | | 58,696 | | | 1,639,379 | |
| | Roche Holding AG | | 17,467 | | | 5,490,696 | |
| | Sanofi | | 46,012 | | | 4,451,516 | |
| | | 42,418,778 | |
Road & Rail – 1.1% | | | |
| | Full Truck Alliance Co (ADR)* | | 387,738 | | | 3,101,904 | |
| | Uber Technologies Inc* | | 169,085 | | | 4,181,472 | |
| | | 7,283,376 | |
Semiconductor & Semiconductor Equipment – 6.0% | | | |
| | Advanced Micro Devices Inc* | | 50,710 | | | 3,284,487 | |
| | ASML Holding NV | | 28,039 | | | 15,175,433 | |
| | Lam Research Corp | | 6,973 | | | 2,930,752 | |
| | Marvell Technology Inc | | 72,620 | | | 2,689,845 | |
| | NVIDIA Corp | | 45,512 | | | 6,651,124 | |
| | Taiwan Semiconductor Manufacturing Co Ltd | | 422,000 | | | 6,151,202 | |
| | Texas Instruments Inc | | 23,967 | | | 3,959,828 | |
| | | 40,842,671 | |
Software – 7.0% | | | |
| | Atlassian Corp - Class A* | | 7,155 | | | 920,705 | |
| | Autodesk Inc* | | 11,200 | | | 2,092,944 | |
| | Constellation Software Inc/Canada | | 735 | | | 1,147,703 | |
| | Microsoft Corp | | 130,749 | | | 31,356,225 | |
| | ServiceNow Inc* | | 3,907 | | | 1,516,971 | |
| | Synopsys Inc* | | 17,406 | | | 5,557,562 | |
| | Workday Inc - Class A* | | 29,872 | | | 4,998,482 | |
| | | 47,590,592 | |
Specialty Retail – 1.2% | | | |
| | O'Reilly Automotive Inc* | | 9,848 | | | 8,312,007 | |
Technology Hardware, Storage & Peripherals – 4.0% | | | |
| | Apple Inc | | 207,532 | | | 26,964,633 | |
Textiles, Apparel & Luxury Goods – 2.1% | | | |
| | LVMH Moet Hennessy Louis Vuitton SE | | 7,054 | | | 5,123,613 | |
| | Moncler SpA | | 49,764 | | | 2,648,594 | |
| | NIKE Inc - Class B | | 53,756 | | | 6,289,990 | |
| | | 14,062,197 | |
Trading Companies & Distributors – 2.3% | | | |
| | Ferguson PLC | | 121,765 | | | 15,380,898 | |
Wireless Telecommunication Services – 1.9% | | | |
| | T-Mobile US Inc* | | 93,866 | | | 13,141,240 | |
Total Common Stocks (cost $507,629,155) | | 674,227,380 | |
Preferred Stocks– 0.8% | | | |
Automobiles – 0.8% | | | |
| | Dr Ing hc F Porsche AG((cost $4,440,776) | | 55,272 | | | 5,606,890 | |
Private Placements– 0.2% | | | |
Health Care Providers & Services – 0.2% | | | |
| | API Holdings Private Ltd*,¢,§((cost $2,347,416) | | 3,231,470 | | | 1,185,282 | |
| | |
See Notes to Schedule of Investments and Other Information and Notes to Financial Statements. |
| |
10 | DECEMBER 31, 2022 |
Janus Henderson VIT Global Research Portfolio
Schedule of Investments
December 31, 2022
| | | | | | | | |
Shares
| | | Value | |
Investment Companies– 0.1% | | | |
Money Markets – 0.1% | | | |
| | Janus Henderson Cash Liquidity Fund LLC, 4.2633%ºº,£((cost $558,126) | | 558,015 | | | $558,126 | |
Total Investments (total cost $514,975,473) – 100.0% | | 681,577,678 | |
Cash, Receivables and Other Assets, net of Liabilities – 0% | | 124,092 | |
Net Assets – 100% | | $681,701,770 | |
| | | | | | |
Summary of Investments by Country - (Long Positions) (unaudited) |
| |
| | | | | % of | |
| | | | | Investment | |
Country | | Value | | Securities | |
United States | | $462,709,993 | | 67.9 | % |
France | | 46,834,771 | | 6.9 | |
United Kingdom | | 41,006,253 | | 6.0 | |
Canada | | 30,787,696 | | 4.5 | |
Netherlands | | 27,934,696 | | 4.1 | |
Sweden | | 15,826,750 | | 2.3 | |
Switzerland | | 12,199,966 | | 1.8 | |
Germany | | 7,909,986 | | 1.2 | |
China | | 7,814,296 | | 1.1 | |
Taiwan | | 6,151,202 | | 0.9 | |
Japan | | 5,746,209 | | 0.8 | |
Hong Kong | | 5,189,308 | | 0.8 | |
India | | 4,036,440 | | 0.6 | |
Ireland | | 2,884,839 | | 0.4 | |
Italy | | 2,648,594 | | 0.4 | |
Denmark | | 1,896,679 | | 0.3 | |
| | | | | | |
| | | | | | |
Total | | $681,577,678 | | 100.0 | % |
| | |
See Notes to Schedule of Investments and Other Information and Notes to Financial Statements. |
| |
Janus Aspen Series | 11 |
Janus Henderson VIT Global Research Portfolio
Schedule of Investments
December 31, 2022
Schedules of Affiliated Investments – (% of Net Assets)
| | | | | | | | | | | |
| | Dividend Income | Realized Gain/(Loss) | Change in Unrealized Appreciation/ Depreciation | Value at 12/31/22 |
Investment Companies - 0.1% |
Money Markets - 0.1% | |
| | Janus Henderson Cash Liquidity Fund LLC, 4.2633%ºº | $ | 12,027 | $ | 155 | $ | - | $ | 558,126 |
Investments Purchased with Cash Collateral from Securities Lending - N/A |
Investment Companies - N/A | |
| | Janus Henderson Cash Collateral Fund LLC, 4.1397%ºº | | 4,378∆ | | - | | - | | - |
Total Affiliated Investments - 0.1% | $ | 16,405 | $ | 155 | $ | - | $ | 558,126 |
| | | | | | | | | | | |
| | Value at 12/31/21 | Purchases | Sales Proceeds | Value at 12/31/22 |
Investment Companies - 0.1% |
Money Markets - 0.1% | |
| | Janus Henderson Cash Liquidity Fund LLC, 4.2633%ºº | | 963,925 | | 60,431,515 | | (60,837,469) | | 558,126 |
Investments Purchased with Cash Collateral from Securities Lending - N/A |
Investment Companies - N/A | |
| | Janus Henderson Cash Collateral Fund LLC, 4.1397%ºº | | - | | 48,976,868 | | (48,976,868) | | - |
| | |
See Notes to Schedule of Investments and Other Information and Notes to Financial Statements. |
| |
12 | DECEMBER 31, 2022 |
Janus Henderson VIT Global Research Portfolio
Notes to Schedule of Investments and Other Information
| | |
MSCI All Country World IndexSM | MSCI All Country World IndexSM reflects the equity market performance of global developed and emerging markets. |
MSCI World IndexSM | MSCI World IndexSM reflects the equity market performance of global developed markets. |
| | |
ADR | American Depositary Receipt |
LLC | Limited Liability Company |
PLC | Public Limited Company |
| | |
* | Non-income producing security. |
| | |
ºº | Rate shown is the 7-day yield as of December 31, 2022. |
| | |
¢ | Security is valued using significant unobservable inputs. The total value of Level 3 securities as of the year ended December 31, 2022 is $1,185,282, which represents 0.2% of net assets. |
| | |
£ | The Portfolio may invest in certain securities that are considered affiliated companies. As defined by the Investment Company Act of 1940, as amended, an affiliated company is one in which the Portfolio owns 5% or more of the outstanding voting securities, or a company which is under common ownership or control. |
| | |
∆ | Net of income paid to the securities lending agent and rebates paid to the borrowing counterparties. |
| | | | | | | | | | | |
§ | Schedule of Restricted Securities (as of December 31, 2022) |
| | | | | | | | Value as a | |
| | Acquisition | | | | | | % of Net | |
| | Date | | Cost | | Value | | Assets | |
API Holdings Private Ltd | 9/27/21 | $ | 2,347,416 | $ | 1,185,282 | | 0.2 | % |
| | | | | | | | | |
| | | | | | | | | |
The Portfolio has registration rights for certain restricted securities held as of December 31, 2022. The issuer incurs all registration costs. | |
Janus Henderson VIT Global Research Portfolio
Notes to Schedule of Investments and Other Information
| | | | | | | | | | | | | |
The following is a summary of the inputs that were used to value the Portfolio’s investments in securities and other financial instruments as of December 31, 2022. See Notes to Financial Statements for more information. |
| |
Valuation Inputs Summary |
| | | | | | | |
| | | | | Level 2 - | | Level 3 - |
| | | Level 1 - | | Other Significant | | Significant |
| | | Quoted Prices | | Observable Inputs | | Unobservable Inputs |
| | | | | | | |
Assets | | | | | | |
Investments In Securities: | | | | | | |
Common Stocks | | | | | | |
Aerospace & Defense | $ | 5,153,245 | $ | 8,661,629 | $ | - |
Banks | | 27,849,613 | | 13,773,009 | | - |
Beverages | | 13,171,743 | | 12,956,738 | | - |
Capital Markets | | 24,637,829 | | 2,061,664 | | - |
Electronic Equipment, Instruments & Components | | - | | 7,670,739 | | - |
Entertainment | | 7,352,581 | | 5,746,209 | | - |
Hotels, Restaurants & Leisure | | 17,899,661 | | 6,095,958 | | - |
Independent Power and Renewable Electricity Producers | | 8,344,692 | | 2,303,096 | | - |
Insurance | | 13,566,329 | | 7,059,287 | | - |
Interactive Media & Services | | 18,048,835 | | 1,491,913 | | - |
Internet & Direct Marketing Retail | | 13,877,808 | | 3,220,479 | | - |
Machinery | | 16,496,148 | | 14,242,730 | | - |
Metals & Mining | | 13,258,119 | | 5,248,930 | | - |
Oil, Gas & Consumable Fuels | | 40,263,821 | | 3,580,934 | | - |
Personal Products | | - | | 12,759,263 | | - |
Pharmaceuticals | | 14,508,302 | | 27,910,476 | | - |
Semiconductor & Semiconductor Equipment | | 19,516,036 | | 21,326,635 | | - |
Textiles, Apparel & Luxury Goods | | 6,289,990 | | 7,772,207 | | - |
Trading Companies & Distributors | | - | | 15,380,898 | | - |
All Other | | 234,729,834 | | - | | - |
Preferred Stocks | | - | | 5,606,890 | | - |
Private Placements | | - | | - | | 1,185,282 |
Investment Companies | | - | | 558,126 | | - |
Total Assets | $ | 494,964,586 | $ | 185,427,810 | $ | 1,185,282 |
| | | | | | | |
Janus Henderson VIT Global Research Portfolio
Statement of Assets and Liabilities
December 31, 2022
| | | | | | | |
| | | | | | |
Assets: | | | | |
| Unaffiliated investments, at value (cost $514,417,347) | | $ | 681,019,552 | |
| Affiliated investments, at value (cost $558,126) | | | 558,126 | |
| Trustees' deferred compensation | | | 22,126 | |
| Receivables: | | | | |
| | Dividends | | | 470,996 | |
| | Foreign tax reclaims | | | 422,482 | |
| | Portfolio shares sold | | | 32,105 | |
| | Investments sold | | | 3,067 | |
| | Dividends from affiliates | | | 2,397 | |
| Other assets | | | 7,655 | |
Total Assets | | | 682,538,506 | |
Liabilities: | | | | |
| Foreign cash due to custodian (cost $1,678) | | | 1,678 | |
| Payables: | | | — | |
| | Advisory fees | | | 369,459 | |
| | Portfolio shares repurchased | | | 223,043 | |
| | Professional fees | | | 48,144 | |
| | 12b-1 Distribution and shareholder servicing fees | | | 46,075 | |
| | Transfer agent fees and expenses | | | 33,195 | |
| | Trustees' deferred compensation fees | | | 22,126 | |
| | Custodian fees | | | 3,601 | |
| | Foreign tax liability | | | 1,818 | |
| | Affiliated portfolio administration fees payable | | | 1,573 | |
| | Trustees' fees and expenses | | | 356 | |
| | Accrued expenses and other payables | | | 85,668 | |
Total Liabilities | | | 836,736 | |
Net Assets | | $ | 681,701,770 | |
Net Assets Consist of: | | | | |
| Capital (par value and paid-in surplus) | | $ | 492,578,064 | |
| Total distributable earnings (loss) (includes $1,818 of foreign capital gains tax) | | | 189,123,706 | |
Total Net Assets | | $ | 681,701,770 | |
Net Assets - Institutional Shares | | $ | 482,188,373 | |
| Shares Outstanding, $0.001 Par Value (unlimited shares authorized) | | | 9,639,052 | |
Net Asset Value Per Share | | $ | 50.02 | |
Net Assets - Service Shares | | $ | 199,513,397 | |
| Shares Outstanding, $0.001 Par Value (unlimited shares authorized) | | | 4,121,262 | |
Net Asset Value Per Share | | $ | 48.41 | |
| | |
See Notes to Financial Statements. |
| |
Janus Aspen Series | 15 |
Janus Henderson VIT Global Research Portfolio
Statement of Operations
For the year ended December 31, 2022
| | | | | | |
| | | | | |
Investment Income: | | | |
| Dividends | $ | 12,601,844 | |
| Dividends from affiliates | | 12,027 | |
| Affiliated securities lending income, net | | 4,378 | |
| Unaffiliated securities lending income, net | | 1,211 | |
| Other income | | 1,327 | |
| Foreign tax withheld | | (585,822) | |
Total Investment Income | | 12,034,965 | |
Expenses: | | | |
| Advisory fees | | 4,099,295 | |
| 12b-1 Distribution and shareholder servicing fees: | | | |
| | Service Shares | | 536,438 | |
| Transfer agent administrative fees and expenses: | | | |
| | Institutional Shares | | 264,150 | |
| | Service Shares | | 107,395 | |
| Other transfer agent fees and expenses: | | | |
| | Institutional Shares | | 11,839 | |
| | Service Shares | | 2,653 | |
| Professional fees | | 56,736 | |
| Custodian fees | | 38,827 | |
| Shareholder reports expense | | 38,028 | |
| Registration fees | | 28,865 | |
| Affiliated portfolio administration fees | | 18,577 | |
| Trustees’ fees and expenses | | 17,088 | |
| Other expenses | | 83,646 | |
Total Expenses | | 5,303,537 | |
Net Investment Income/(Loss) | | 6,731,428 | |
Net Realized Gain/(Loss) on Investments: | | | |
| Investments and foreign currency transactions | | 20,100,166 | |
| Investments in affiliates | | 155 | |
Total Net Realized Gain/(Loss) on Investments | | 20,100,321 | |
Change in Unrealized Net Appreciation/Depreciation: | | | |
| Investments, foreign currency translations and Trustees’ deferred compensation (net of decrease in deferred foreign taxes of $4) | | (202,069,524) | |
Total Change in Unrealized Net Appreciation/Depreciation | | (202,069,524) | |
Net Increase/(Decrease) in Net Assets Resulting from Operations | $ | (175,237,775) | |
| | | | | |
| | |
See Notes to Financial Statements. |
| |
16 | DECEMBER 31, 2022 |
Janus Henderson VIT Global Research Portfolio
Statements of Changes in Net Assets
| | | | | | | | | |
| | | | | | | | |
| | | Year ended
December 31, 2022 | | Year ended
December 31, 2021 | |
| | | | | | | | | |
Operations: | | | | | | |
| Net investment income/(loss) | $ | 6,731,428 | | $ | 4,422,329 | |
| Net realized gain/(loss) on investments | | 20,100,321 | | | 82,488,846 | |
| Change in unrealized net appreciation/depreciation | | (202,069,524) | | | 58,401,316 | |
Net Increase/(Decrease) in Net Assets Resulting from Operations | | (175,237,775) | | | 145,312,491 | |
Dividends and Distributions to Shareholders: | | | | | | |
| | Institutional Shares | | (63,786,707) | | | (32,926,296) | |
| | Service Shares | | (26,449,252) | | | (12,748,040) | |
Net Decrease from Dividends and Distributions to Shareholders | | (90,235,959) | | | (45,674,336) | |
Capital Share Transactions: | | | | | | |
| | Institutional Shares | | 16,928,478 | | | (19,091,566) | |
| | Service Shares | | 17,471,980 | | | (4,426,458) | |
Net Increase/(Decrease) from Capital Share Transactions | | 34,400,458 | | | (23,518,024) | |
Net Increase/(Decrease) in Net Assets | | (231,073,276) | | | 76,120,131 | |
Net Assets: | | | | | | |
| Beginning of period | | 912,775,046 | | | 836,654,915 | |
| End of period | $ | 681,701,770 | | $ | 912,775,046 | |
| | | | | | | | |
| | |
See Notes to Financial Statements. |
| |
Janus Aspen Series | 17 |
Janus Henderson VIT Global Research Portfolio
Financial Highlights
| | | | | | | | | | | | | | | | | | | |
Institutional Shares | | | | | | | | | | | | | | | |
For a share outstanding during the year ended December 31 | | 2022 | | | 2021 | | | 2020 | | | 2019 | | | 2018 | |
| Net Asset Value, Beginning of Period | | $71.28 | | | $63.62 | | | $56.59 | | | $47.13 | | | $51.20 | |
| Income/(Loss) from Investment Operations: | | | | | | | | | | | | | | | |
| | Net investment income/(loss)(1) | | 0.53 | | | 0.39 | | | 0.39 | | | 0.60 | | | 0.62 | |
| | Net realized and unrealized gain/(loss) | | (14.52) | | | 10.90 | | | 10.04 | | | 12.67 | | | (4.09) | |
| Total from Investment Operations | | (13.99) | | | 11.29 | | | 10.43 | | | 13.27 | | | (3.47) | |
| Less Dividends and Distributions: | | | | | | | | | | | | | | | |
| | Dividends (from net investment income) | | (0.60) | | | (0.36) | | | (0.41) | | | (0.54) | | | (0.60) | |
| | Distributions (from capital gains) | | (6.67) | | | (3.27) | | | (2.99) | | | (3.27) | | | — | |
| Total Dividends and Distributions | | (7.27) | | | (3.63) | | | (3.40) | | | (3.81) | | | (0.60) | |
| Net Asset Value, End of Period | | $50.02 | | | $71.28 | | | $63.62 | | | $56.59 | | | $47.13 | |
| Total Return* | | (19.41)% | | | 18.09% | | | 20.06% | | | 29.04% | | | (6.87)% | |
| Net Assets, End of Period (in thousands) | | $482,188 | | | $653,853 | | | $600,868 | | | $539,915 | | | $463,402 | |
| Average Net Assets for the Period (in thousands) | | $529,234 | | | $636,425 | | | $516,468 | | | $511,859 | | | $533,418 | |
| Ratios to Average Net Assets**: | | | | | | | | | | | | | | | |
| | Ratio of Gross Expenses | | 0.64% | | | 0.77% | | | 0.84% | | | 0.79% | | | 0.60% | |
| | Ratio of Net Expenses (After Waivers and Expense Offsets) | | 0.64% | | | 0.77% | | | 0.84% | | | 0.79% | | | 0.60% | |
| | Ratio of Net Investment Income/(Loss) | | 0.98% | | | 0.57% | | | 0.72% | | | 1.13% | | | 1.19% | |
| Portfolio Turnover Rate | | 32% | | | 20% | | | 33% | | | 36% | | | 36% | |
| | | | | | | | | | | | | | | | | | | |
| |
* Total return includes adjustments in accordance with generally accepted accounting principles required at the year or period end and are not annualized for periods of less than one full year. Total return does not include fees, charges, or expenses imposed by the variable annuity and life insurance contracts for which Janus Aspen Series serves as an underlying investment vehicle. ** Annualized for periods of less than one full year. (1) Per share amounts are calculated based on average shares outstanding during the year or period. |
| | |
See Notes to Financial Statements. |
| |
18 | DECEMBER 31, 2022 |
Janus Henderson VIT Global Research Portfolio
Financial Highlights
| | | | | | | | | | | | | | | | | | | |
Service Shares | | | | | | | | | | | | | | | |
For a share outstanding during the year ended December 31 | | 2022 | | | 2021 | | | 2020 | | | 2019 | | | 2018 | |
| Net Asset Value, Beginning of Period | | $69.31 | | | $62.00 | | | $55.27 | | | $46.15 | | | $50.17 | |
| Income/(Loss) from Investment Operations: | | | | | | | | | | | | | | | |
| | Net investment income/(loss)(1) | | 0.38 | | | 0.21 | | | 0.25 | | | 0.45 | | | 0.48 | |
| | Net realized and unrealized gain/(loss) | | (14.11) | | | 10.62 | | | 9.77 | | | 12.39 | | | (4.00) | |
| Total from Investment Operations | | (13.73) | | | 10.83 | | | 10.02 | | | 12.84 | | | (3.52) | |
| Less Dividends and Distributions: | | | | | | | | | | | | | | | |
| | Dividends (from net investment income) | | (0.50) | | | (0.25) | | | (0.30) | | | (0.45) | | | (0.50) | |
| | Distributions (from capital gains) | | (6.67) | | | (3.27) | | | (2.99) | | | (3.27) | | | — | |
| Total Dividends and Distributions | | (7.17) | | | (3.52) | | | (3.29) | | | (3.72) | | | (0.50) | |
| Net Asset Value, End of Period | | $48.41 | | | $69.31 | | | $62.00 | | | $55.27 | | | $46.15 | |
| Total Return* | | (19.61)% | | | 17.80% | | | 19.76% | | | 28.71% | | | (7.08)% | |
| Net Assets, End of Period (in thousands) | | $199,513 | | | $258,922 | | | $235,787 | | | $214,425 | | | $180,168 | |
| Average Net Assets for the Period (in thousands) | | $215,111 | | | $248,792 | | | $206,127 | | | $198,883 | | | $206,497 | |
| Ratios to Average Net Assets**: | | | | | | | | | | | | | | | |
| | Ratio of Gross Expenses | | 0.89% | | | 1.02% | | | 1.09% | | | 1.04% | | | 0.85% | |
| | Ratio of Net Expenses (After Waivers and Expense Offsets) | | 0.89% | | | 1.02% | | | 1.09% | | | 1.04% | | | 0.85% | |
| | Ratio of Net Investment Income/(Loss) | | 0.73% | | | 0.32% | | | 0.47% | | | 0.88% | | | 0.94% | |
| Portfolio Turnover Rate | | 32% | | | 20% | | | 33% | | | 36% | | | 36% | |
| | | | | | | | | | | | | | | | | | | |
| |
* Total return includes adjustments in accordance with generally accepted accounting principles required at the year or period end and are not annualized for periods of less than one full year. Total return does not include fees, charges, or expenses imposed by the variable annuity and life insurance contracts for which Janus Aspen Series serves as an underlying investment vehicle. ** Annualized for periods of less than one full year. (1) Per share amounts are calculated based on average shares outstanding during the year or period. |
| | |
See Notes to Financial Statements. |
| |
Janus Aspen Series | 19 |
Janus Henderson VIT Global Research Portfolio
Notes to Financial Statements
1. Organization and Significant Accounting Policies
Janus Henderson VIT Global Research Portfolio (the “Portfolio”) is a series of Janus Aspen Series (the “Trust”), which is organized as a Delaware statutory trust and is registered under the Investment Company Act of 1940, as amended (the “1940 Act”), as an open-end management investment company, and therefore has applied the specialized accounting and reporting guidance in Financial Accounting Standards Board (“FASB”) Accounting Standards Codification (“ASC”) Topic 946. The Trust offers 11 portfolios, each of which offers multiple share classes, with differing investment objectives and policies. The Portfolio seeks long-term growth of capital. The Portfolio is classified as diversified, as defined in the 1940 Act. Janus Henderson Investors US LLC is the investment adviser (the “Adviser”) to the Portfolio.
The Portfolio currently offers two classes of shares: Institutional Shares and Service Shares. Each class represents an interest in the same portfolio of investments. Institutional Shares are offered only in connection with investment in and payments under variable insurance contracts as well as certain qualified retirement plans. Service Shares are offered only in connection with investment in and payments under variable insurance contracts as well as certain qualified retirement plans that require a fee from Portfolio assets to procure distribution and administrative services to contract owners and plan participants.
Shareholders, including participating insurance companies, as well as accounts, may from time to time own (beneficially or of record) a significant percentage of the Portfolio’s Shares and can be considered to “control” the Portfolio when that ownership exceeds 25% of the Portfolio’s assets (and which may differ from control as determined in accordance with United States of America generally accepted accounting principles ("US GAAP")).
The following accounting policies have been followed by the Portfolio and are in conformity with US GAAP.
Investment Valuation
Portfolio holdings are valued in accordance with policies and procedures established by the Adviser pursuant to Rule 2a-5 under the 1940 Act and approved by and subject to the oversight of the Trustees (the “Valuation Procedures”). Equity securities traded on a domestic securities exchange are generally valued at readily available market quotations, which are (i) the official close prices or (ii) last sale prices on the primary market or exchange in which the securities trade. If such price is lacking for the trading period immediately preceding the time of determination, such securities are generally valued at their current bid price. Equity securities that are traded on a foreign exchange are generally valued at the closing prices on such markets. In the event that there is no current trading volume on a particular security in such foreign exchange, the bid price from the primary exchange is generally used to value the security. Foreign securities and currencies are converted to U.S. dollars using the current spot USD dollar exchange rate in effect at the close of the New York Stock Exchange (“NYSE”). The Portfolio will determine the market value of individual securities held by it by using prices provided by one or more approved professional pricing services or, as needed, by obtaining market quotations from independent broker-dealers. Most debt securities are valued in accordance with the evaluated bid price supplied by the Adviser-approved pricing service that is intended to reflect market value. The evaluated bid price supplied by the pricing service is an evaluation that may consider factors such as security prices, yields, maturities and ratings. Certain short-term securities maturing within 60 days or less may be evaluated and valued on an amortized cost basis provided that the amortized cost determined approximates market value. Securities for which market quotations or evaluated prices are not readily available or deemed unreliable are valued at fair value determined in good faith by the Adviser pursuant to the Valuation Procedures. Circumstances in which fair valuation may be utilized include, but are not limited to: (i) a significant event that may affect the securities of a single issuer, such as a merger, bankruptcy, or significant issuer-specific development; (ii) an event that may affect an entire market, such as a natural disaster or significant governmental action; (iii) a nonsignificant event such as a market closing early or not opening, or a security trading halt; and (iv) pricing of a nonvalued security and a restricted or nonpublic security. Special valuation considerations may apply with respect to “odd-lot” fixed-income transactions which, due to their small size, may receive evaluated prices by pricing services which reflect a large block trade and not what actually could be obtained for the odd-lot position. The valuation policies provide for the use of systematic fair valuation models provided by independent pricing services to value foreign equity securities in order to adjust for stale pricing, which may occur between the close of certain foreign exchanges and the close of the NYSE. The value of the securities of other mutual funds held by a Portfolio, if any, will be calculated using the NAV of such mutual funds.
Valuation Inputs Summary
FASB ASC 820, Fair Value Measurements and Disclosures (“ASC 820”), defines fair value, establishes a framework for measuring fair value, and expands disclosure requirements regarding fair value measurements. This standard
Janus Henderson VIT Global Research Portfolio
Notes to Financial Statements
emphasizes that fair value is a market-based measurement that should be determined based on the assumptions that market participants would use in pricing an asset or liability and establishes a hierarchy that prioritizes inputs to valuation techniques used to measure fair value. These inputs are summarized into three broad levels:
Level 1 – Unadjusted quoted prices in active markets the Portfolio has the ability to access for identical assets or liabilities.
Level 2 – Observable inputs other than unadjusted quoted prices included in Level 1 that are observable for the asset or liability either directly or indirectly. These inputs may include quoted prices for the identical instrument on an inactive market, prices for similar instruments, interest rates, prepayment speeds, credit risk, yield curves, default rates and similar data.
Assets or liabilities categorized as Level 2 in the hierarchy generally include: debt securities fair valued in accordance with the evaluated bid or ask prices supplied by a pricing service; securities traded on OTC markets and listed securities for which no sales are reported that are fair valued at the latest bid price (or yield equivalent thereof) obtained from one or more dealers transacting in a market for such securities or by a pricing service approved by the Portfolio’s Trustees; certain short-term debt securities with maturities of 60 days or less that are fair valued at amortized cost; and equity securities of foreign issuers whose fair value is determined by using systematic fair valuation models provided by independent third parties in order to adjust for stale pricing which may occur between the close of certain foreign exchanges and the close of the NYSE. Other securities that may be categorized as Level 2 in the hierarchy include, but are not limited to, preferred stocks, bank loans, swaps, investments in unregistered investment companies, options, and forward contracts.
Level 3 – Unobservable inputs for the asset or liability to the extent that relevant observable inputs are not available, representing the Portfolio’s own assumptions about the assumptions that a market participant would use in valuing the asset or liability, and that would be based on the best information available.
There have been no significant changes in valuation techniques used in valuing any such positions held by the Portfolio since the beginning of the fiscal year.
The inputs or methodology used for fair valuing securities are not necessarily an indication of the risk associated with investing in those securities. The summary of inputs used as of December 31, 2022 to fair value the Portfolio’s investments in securities and other financial instruments is included in the “Valuation Inputs Summary” in the Notes to Schedule of Investments and Other Information.
The Portfolio did not hold a significant amount of Level 3 securities as of December 31, 2022.
Investment Transactions and Investment Income
Investment transactions are accounted for as of the date purchased or sold (trade date). Dividend income is recorded on the ex-dividend date. Certain dividends from foreign securities will be recorded as soon as the Portfolio is informed of the dividend, if such information is obtained subsequent to the ex-dividend date. Dividends from foreign securities may be subject to withholding taxes in foreign jurisdictions. Non-cash dividends, if any, are recorded on the ex-dividend date at fair value. Interest income is recorded daily on the accrual basis and includes amortization of premiums and accretion of discounts. The Portfolio classifies gains and losses on prepayments received as an adjustment to interest income. Debt securities may be placed in non-accrual status and related interest income may be reduced by stopping current accruals and writing off interest receivables when collection of all or a portion of interest has become doubtful. Gains and losses are determined on the identified cost basis, which is the same basis used for federal income tax purposes. Income, as well as gains and losses, both realized and unrealized, are allocated daily to each class of shares based upon the ratio of net assets represented by each class as a percentage of total net assets.
Expenses
The Portfolio bears expenses incurred specifically on its behalf. Each class of shares bears a portion of general expenses, which are allocated daily to each class of shares based upon the ratio of net assets represented by each class as a percentage of total net assets. Expenses directly attributable to a specific class of shares are charged against the operations of such class.
Estimates
The preparation of financial statements in conformity with US GAAP requires management to make estimates and assumptions that affect the reported amount of assets and liabilities and disclosure of contingent assets and liabilities
Janus Henderson VIT Global Research Portfolio
Notes to Financial Statements
at the date of the financial statements, and the reported amounts of income and expenses during the reporting period. Actual results could differ from those estimates.
Indemnifications
In the normal course of business, the Portfolio may enter into contracts that contain provisions for indemnification of other parties against certain potential liabilities. The Portfolio’s maximum exposure under these arrangements is unknown, and would involve future claims that may be made against the Portfolio that have not yet occurred. Currently, the risk of material loss from such claims is considered remote.
Foreign Currency Translations
The Portfolio does not isolate that portion of the results of operations resulting from the effect of changes in foreign exchange rates on investments from the fluctuations arising from changes in market prices of securities held at the date of the financial statements. Net unrealized appreciation or depreciation of investments and foreign currency translations arise from changes in the value of assets and liabilities, including investments in securities held at the date of the financial statements, resulting from changes in the exchange rates and changes in market prices of securities held.
Currency gains and losses are also calculated on payables and receivables that are denominated in foreign currencies. The payables and receivables are generally related to foreign security transactions and income translations.
Foreign currency-denominated assets and forward currency contracts may involve more risks than domestic transactions, including currency risk, counterparty risk, political and economic risk, regulatory risk and equity risk. Risks may arise from unanticipated movements in the value of foreign currencies relative to the U.S. dollar.
Dividends and Distributions
The Portfolio may make semiannual distributions of substantially all of its investment income and an annual distribution of its net realized capital gains (if any).
The Portfolio may make certain investments in real estate investment trusts (“REITs”) which pay dividends to their shareholders based upon funds available from operations. It is quite common for these dividends to exceed the REITs’ taxable earnings and profits, resulting in the excess portion of such dividends being designated as a return of capital. If the Portfolio distributes such amounts, such distributions could constitute a return of capital to shareholders for federal income tax purposes.
Federal Income Taxes
The Portfolio intends to continue to qualify as a regulated investment company and distribute all of its taxable income in accordance with the requirements of Subchapter M of the Internal Revenue Code. Management has analyzed the Portfolio’s tax positions taken for all open federal income tax years, generally a three-year period, and has concluded that no provision for federal income tax is required in the Portfolio’s financial statements. The Portfolio is not aware of any tax positions for which it is reasonably possible that the total amounts of unrecognized tax benefits will significantly change in the next twelve months.
2. Other Investments and Strategies
Additional Investment Risk
The U.S. government and the Federal Reserve, as well as certain foreign governments and central banks, have taken extraordinary actions to support local and global economies and the financial markets in response to the COVID-19 pandemic. This and other government intervention into the economy and financial markets to address the COVID-19 pandemic may not work as intended, particularly if the efforts are perceived by investors as being unlikely to achieve the desired results. Government actions to mitigate the economic impact of the pandemic have resulted in a large expansion of government deficits and debt, the long term consequences of which are not known. The COVID-19 pandemic could adversely affect the value and liquidity of a Portfolio’s investments, impair a Portfolio’s ability to satisfy redemption requests, and negatively impact a Portfolio’s performance. In addition, the outbreak of COVID-19, and measures taken to mitigate its effects, could result in disruptions to the services provided to a Portfolio by its service providers.
Widespread disease, including pandemics and epidemics, and natural or environmental disasters, including those which may be attributable to global climate change, such as earthquakes, fires, floods, hurricanes, tsunamis and weather-related phenomena generally, have been and can be highly disruptive to economies and markets, adversely impacting
Janus Henderson VIT Global Research Portfolio
Notes to Financial Statements
individual companies, sectors, industries, markets, currencies, interest and inflation rates, credit ratings, investor sentiment, and other factors affecting the value of a Portfolio’s investments. Economies and financial markets throughout the world have become increasingly interconnected, which increases the likelihood that events or conditions in one region or country will adversely affect markets or issuers in other regions or countries, including the United States. These disruptions could prevent a Portfolio from executing advantageous investment decisions in a timely manner and negatively impact a Portfolio’s ability to achieve its investment objective(s). Any such event(s) could have a significant adverse impact on the value of a Portfolio. In addition, these disruptions could also impair the information technology and other operational systems upon which the Portfolio’s service providers, including the Adviser or the subadviser (as applicable), rely, and could otherwise disrupt the ability of employees of the Portfolio’s service providers to perform essential tasks on behalf of the Portfolio. Adverse weather conditions may also have a particularly significant negative effect on issuers in the agricultural sector and on insurance and reinsurance companies that insure or reinsure against the impact of natural disasters.
A number of countries in the European Union (the “EU”) have experienced, and may continue to experience, severe economic and financial difficulties. In particular, many EU nations are susceptible to economic risks associated with high levels of debt. Many non-governmental issuers, and even certain governments, have defaulted on, or been forced to restructure, their debts. Many other issuers have faced difficulties obtaining credit or refinancing existing obligations. Financial institutions have in many cases required government or central bank support, have needed to raise capital, and/or have been impaired in their ability to extend credit. As a result, financial markets in the EU have experienced extreme volatility and declines in asset values and liquidity. These difficulties may continue, worsen, or spread further within the EU. Responses to these financial problems by European governments, central banks, and others, including austerity measures and reforms, may not work, may result in social unrest, and may limit future growth and economic recovery or have other unintended consequences. Among other things, these developments have adversely affected the value and exchange rate of the euro and pound sterling, and may continue to significantly affect the economies of all EU countries, which in turn may have a material adverse effect on the Portfolio’s investments in such countries, other countries that depend on EU countries for significant amounts of trade or investment, or issuers with exposure to debt issued by certain EU countries.
Real Estate Investing
The Portfolio may invest in equity and debt securities of real estate-related companies. Such companies may include those in the real estate industry or real estate-related industries. These securities may include common stocks, corporate bonds, preferred stocks, and other equity securities, including, but not limited to, mortgage-backed securities, real estate-backed securities, securities of REITs and similar REIT-like entities. A REIT is a trust that invests in real estate-related projects, such as properties, mortgage loans, and construction loans. REITs are generally categorized as equity, mortgage, or hybrid REITs. A REIT may be listed on an exchange or traded OTC.
Restricted Security Transactions
Restricted securities held by the Portfolio may not be sold except in exempt transactions or in a public offering registered under the Securities Act of 1933, as amended. The risk of investing in such securities is generally greater than the risk of investing in the securities of widely held, publicly traded companies. Lack of a secondary market and resale restrictions may result in the inability of the Portfolio to sell a security at a fair price and may substantially delay the sale of the security. In addition, these securities may exhibit greater price volatility than securities for which secondary markets exist.
Counterparties
Portfolio transactions involving a counterparty are subject to the risk that the counterparty or a third party will not fulfill its obligation to the Portfolio (“counterparty risk”). Counterparty risk may arise because of the counterparty’s financial condition (i.e., financial difficulties, bankruptcy, or insolvency), market activities and developments, or other reasons, whether foreseen or not. A counterparty’s inability to fulfill its obligation may result in significant financial loss to the Portfolio. The Portfolio may be unable to recover its investment from the counterparty or may obtain a limited recovery, and/or recovery may be delayed. The extent of the Portfolio’s exposure to counterparty risk with respect to financial assets and liabilities approximates its carrying value.
The Portfolio may be exposed to counterparty risk through participation in various programs, including, but not limited to, lending its securities to third parties, cash sweep arrangements whereby the Portfolio’s cash balance is invested in one or more types of cash management vehicles, as well as investments in, but not limited to, repurchase agreements, debt securities, and derivatives, including various types of swaps, futures and options. The Portfolio intends to enter into
Janus Henderson VIT Global Research Portfolio
Notes to Financial Statements
financial transactions with counterparties that the Adviser believes to be creditworthy at the time of the transaction. There is always the risk that the Adviser’s analysis of a counterparty’s creditworthiness is incorrect or may change due to market conditions. To the extent that the Portfolio focuses its transactions with a limited number of counterparties, it will have greater exposure to the risks associated with one or more counterparties.
Securities Lending
Under procedures adopted by the Trustees, the Portfolio may seek to earn additional income by lending securities to certain qualified broker-dealers and institutions. JPMorgan Chase Bank, National Association acts as securities lending agent and a limited purpose custodian or subcustodian to receive and disburse cash balances and cash collateral, hold short-term investments, hold collateral, and perform other custodial functions in accordance with the Non-Custodial Securities Lending Agreement. For financial reporting purposes, the Portfolio does not offset financial instruments’ payables and receivables and related collateral on the Statement of Assets and Liabilities. The Portfolio may lend portfolio securities in an amount equal to up to 1/3 of its total assets as determined at the time of the loan origination. There is the risk of delay in recovering a loaned security or the risk of loss in collateral rights if the borrower fails financially. In addition, the Adviser makes efforts to balance the benefits and risks from granting such loans. All loans will be continuously secured by collateral which may consist of cash, U.S. Government securities, domestic and foreign short-term debt instruments, letters of credit, time deposits, repurchase agreements, money market mutual funds or other money market accounts, or such other collateral as permitted by the Securities and Exchange Commission (the "SEC"). If the Portfolio is unable to recover a security on loan, the Portfolio may use the collateral to purchase replacement securities in the market. There is a risk that the value of the collateral could decrease below the cost of the replacement security by the time the replacement investment is made, resulting in a loss to the Portfolio. In certain circumstances individual loan transactions could yield negative returns.
Upon receipt of cash collateral, the Adviser may invest it in affiliated or non-affiliated cash management vehicles, whether registered or unregistered entities, as permitted by the 1940 Act and rules promulgated thereunder. The Adviser currently intends to primarily invest the cash collateral in a cash management vehicle for which the Adviser serves as investment adviser, Janus Henderson Cash Collateral Fund LLC, or in time deposits. An investment in Janus Henderson Cash Collateral Fund LLC is generally subject to the same risks that shareholders experience when investing in similarly structured vehicles, such as the potential for significant fluctuations in assets as a result of the purchase and redemption activity of the securities lending program, a decline in the value of the collateral, and possible liquidity issues. Such risks may delay the return of the cash collateral and cause the Portfolio to violate its agreement to return the cash collateral to a borrower in a timely manner. As adviser to the Portfolio and Janus Henderson Cash Collateral Fund LLC, the Adviser has an inherent conflict of interest as a result of its fiduciary duties to both the Portfolio and Janus Henderson Cash Collateral Fund LLC. Additionally, the Adviser receives an investment advisory fee of 0.05% for managing Janus Henderson Cash Collateral Fund LLC, but it may not receive a fee for managing certain other affiliated cash management vehicles in which the Portfolio may invest, and therefore may have an incentive to allocate preferred investment opportunities to investment vehicles for which it is receiving a fee.
The value of the collateral must be at least 102% of the market value of the loaned securities that are denominated in U.S. dollars and 105% of the market value of the loaned securities that are not denominated in U.S. dollars. Loaned securities and related collateral are marked-to-market each business day based upon the market value of the loaned securities at the close of business, employing the most recent available pricing information. Collateral levels are then adjusted based on this mark-to-market evaluation. Additional required collateral, or excess collateral returned, is delivered on the next business day. Therefore, the value of the collateral held may be temporarily less than 102% or 105% value of the securities on loan. The cash collateral invested by the Adviser is disclosed in the Schedule of Investments (if applicable).
Income earned from the investment of the cash collateral, net of rebates paid to, or fees paid by, borrowers and less the fees paid to the lending agent are included as “Affiliated securities lending income, net” on the Statement of Operations.
There were no securities on loan as of December 31, 2022.
3. Investment Advisory Agreements and Other Transactions with Affiliates
The Portfolio pays the Adviser an investment advisory fee rate that may adjust up or down based on the Portfolio’s performance relative to its benchmark index.
Janus Henderson VIT Global Research Portfolio
Notes to Financial Statements
The investment advisory fee rate paid to the Adviser by the Portfolio consists of two components: (1) a base fee calculated by applying the contractual fixed rate of the advisory fee to the Portfolio’s average daily net assets during the previous month (the “Base Fee Rate”), plus or minus (2) a performance-fee adjustment (the “Performance Adjustment”) calculated by applying a variable rate of up to 0.15% (positive or negative) to the Portfolio’s average daily net assets based on the Portfolio’s relative performance compared to the cumulative investment record of its benchmark index over a 36-month performance measurement period or shorter time period, as applicable. The investment advisory fee rate is calculated daily and paid monthly.
The investment performance of the Portfolio’s Service Shares for the performance measurement period is used to calculate the Performance Adjustment. The Portfolio’s Base Fee Rate prior to any performance adjustment (expressed as an annual rate) is 0.60%, and the Portfolio’s benchmark index used in the calculation is the MSCI World IndexSM.
No Performance Adjustment is applied unless the difference between the Portfolio’s investment performance and the cumulative investment record of the Portfolio’s benchmark index is 0.50% or greater (positive or negative) during the applicable performance measurement period. The Base Fee Rate is subject to an upward or downward Performance Adjustment for every full 0.50% increment by which the Portfolio outperforms or underperforms its benchmark index, up to the Portfolio’s full performance rate of ±6.00%. Because the Performance Adjustment is tied to a Portfolio’s relative performance compared to its benchmark index (and not its absolute performance), the Performance Adjustment could increase the Adviser’s fee even if the Portfolio’s Shares lose value during the performance measurement period and could decrease the Adviser’s fee even if the Portfolio’s Shares increase in value during the performance measurement period. For purposes of computing the Base Fee Rate and the Performance Adjustment, net assets are averaged over different periods (average daily net assets during the previous month for the Base Fee Rate, versus average daily net assets during the performance measurement period for the Performance Adjustment). Performance of the Portfolio is calculated net of expenses whereas the Portfolio’s benchmark index does not have any fees or expenses. Reinvestment of dividends and distributions is included in calculating both the performance of a Portfolio and the Portfolio’s benchmark index.
The Portfolio’s prospectuses and statement(s) of additional information contain additional information about performance-based fees. The amount shown as advisory fees on the Statement of Operations reflects the Base Fee Rate plus/minus any Performance Adjustment. For the year ended December 31, 2022, the performance adjusted investment advisory fee rate before any waivers and/or reimbursements of expenses is 0.55%.
The Adviser serves as administrator to the Portfolio pursuant to an administration agreement between the Adviser and the Trust. Under the administration agreement, the Adviser is authorized to perform, or cause others to perform certain administration, compliance, and accounting services to the Portfolio, including providing office space for the Portfolio, and is reimbursed by the Portfolio for certain of its costs in providing these services (to the extent the Adviser seeks reimbursement and such costs are not otherwise waived). In addition, employees of the Adviser and/or its affiliates may serve as officers of the Trust. The Portfolio pays for some or all of the salaries, fees, and expenses of the Adviser employees and Portfolio officers, with respect to certain specified administration functions they perform on behalf of the Portfolio. The Portfolio pays these costs based on out-of-pocket expenses incurred by the Adviser, and these costs are separate and apart from advisory fees and other expenses paid in connection with the investment advisory services the Adviser (or any subadvisor, as applicable) provides to the Portfolio. These amounts are disclosed as “Affiliated portfolio administration fees” on the Statement of Operations. In addition, some expenses related to compensation payable to the Portfolio’s Chief Compliance Officer and certain compliance staff, all of whom are employees of the Adviser and/or its affiliates, are shared with the Portfolio. Total compensation of $48,451 was paid to the Chief Compliance Officer and certain compliance staff by the Trust during the year ended December 31, 2022. The Portfolio's portion is reported as part of “Other expenses” on the Statement of Operations.
Janus Henderson Services US LLC (the “Transfer Agent”), a wholly-owned subsidiary of the Adviser, is the Portfolio’s transfer agent. The Transfer Agent receives an administrative services fee at an annual rate of 0.05% of the average daily net assets of the Portfolio for arranging for the provision by participating insurance companies and qualified plan service providers of administrative services, including, but not limited to, recordkeeping, subaccounting, answering inquiries regarding accounts, order processing, transaction confirmations, the mailing of prospectuses and shareholder reports, and other shareholder services provided on behalf of contract holders or plan participants investing in the Portfolio. The Transfer Agent expects to use this entire fee to compensate insurance companies and qualified plan service providers for providing these services to their customers who invest in the Portfolio.
Janus Henderson VIT Global Research Portfolio
Notes to Financial Statements
The Transfer Agent is not compensated for internal services related to the shares, except for out-of-pocket costs. These amounts are disclosed as “Other transfer agent fees and expenses” on the Statement of Operations.
Under a distribution and shareholder servicing plan (the “Plan”) adopted in accordance with Rule 12b-1 under the 1940 Act, the Service Shares may pay the Trust’s distributor, Janus Henderson Distributors US LLC (the “Distributor”), a wholly-owned subsidiary of the Adviser, a fee for the sale and distribution and/or shareholder servicing of the Service Shares at an annual rate of up to 0.25% of the average daily net assets of the Service Shares. Under the terms of the Plan, the Trust is authorized to make payments to the Distributor for remittance to insurance companies and qualified plan service providers as compensation for distribution and/or shareholder services performed by such entities. These amounts are disclosed as “12b-1 Distribution and shareholder servicing fees” on the Statement of Operations.
The Board of Trustees has adopted a deferred compensation plan (the “Deferred Plan”) for independent Trustees to elect to defer receipt of all or a portion of the annual compensation they are entitled to receive from the Portfolio. All deferred fees are credited to an account established in the name of the Trustees. The amounts credited to the account then increase or decrease, as the case may be, in accordance with the performance of one or more of the Janus Henderson funds that are selected by the Trustees. The account balance continues to fluctuate in accordance with the performance of the selected fund or funds until final payment of all amounts are credited to the account. The fluctuation of the account balance is recorded by the Portfolio as unrealized appreciation/(depreciation) and is included as of December 31, 2022 on the Statement of Assets and Liabilities in the asset, “Trustees’ deferred compensation,” and liability, “Trustees’ deferred compensation fees.” Additionally, the recorded unrealized appreciation/(depreciation) is included in “Total distributable earnings (loss)” on the Statement of Assets and Liabilities. Deferred compensation expenses for the year ended December 31, 2022 are included in “Trustees’ fees and expenses” on the Statement of Operations. Trustees are allowed to change their designation of mutual funds from time to time. Amounts will be deferred until distributed in accordance with the Deferred Plan. Deferred fees of $433,851 were paid by the Trust to the Trustees under the Deferred Plan during the year ended December 31, 2022.
Pursuant to the provisions of the 1940 Act and related rules, the Portfolio may participate in an affiliated or non-affiliated cash sweep program. In the cash sweep program, uninvested cash balances of the Portfolio may be used to purchase shares of affiliated or non-affiliated money market funds or cash management pooled investment vehicles that operate as money market funds. The Portfolio is eligible to participate in the cash sweep program (the “Investing Funds”). The Adviser has an inherent conflict of interest because of its fiduciary duties to the affiliated money market funds or cash management pooled investment vehicles and the Investing Funds. Janus Henderson Cash Liquidity Fund LLC (the “Sweep Vehicle”) is an affiliated unregistered cash management pooled investment vehicle that invests primarily in highly-rated short-term fixed-income securities. The Sweep Vehicle operates pursuant to the provisions of the 1940 Act that govern the operation of money market funds and prices its shares at NAV reflecting market-based values of its portfolio securities (i.e., a “floating” NAV) rounded to the fourth decimal place (e.g., $1.0000). The Sweep Vehicle is permitted to impose a liquidity fee (of up to 2%) on redemptions from the Sweep Vehicle or a redemption gate that temporarily suspends redemptions from the Sweep Vehicle for up to 10 business days during a 90 day period. There are no restrictions on the Portfolio's ability to withdraw investments from the Sweep Vehicle at will, and there are no unfunded capital commitments due from the Portfolio to the Sweep Vehicle. The Sweep Vehicle does not charge any management fee, sales charge or service fee.
Any purchases and sales, realized gains/losses and recorded dividends from affiliated investments during the year ended December 31, 2022 can be found in the “Schedules of Affiliated Investments” located in the Schedule of Investments.
The Portfolio is permitted to purchase or sell securities (“cross-trade”) between itself and other funds or accounts managed by the Adviser in accordance with Rule 17a-7 under the Investment Company Act of 1940 (“Rule 17a-7”), when the transaction is consistent with the investment objectives and policies of the Portfolio and in accordance with the Internal Cross Trade Procedures adopted by the Trust’s Board of Trustees. These procedures have been designed to ensure that any cross-trade of securities by the Portfolio from or to another fund or account that is or could be considered an affiliate of the Portfolio under certain limited circumstances by virtue of having a common investment adviser, common Officer, or common Trustee complies with Rule 17a-7. Under these procedures, each cross-trade is effected at the current market price to save costs where allowed. During the year ended December 31, 2022, the Portfolio engaged in cross trades amounting to $949,005 in purchases.
Janus Henderson VIT Global Research Portfolio
Notes to Financial Statements
4. Federal Income Tax
The tax components of capital shown in the table below represent: (1) distribution requirements the Portfolio must satisfy under the income tax regulations; (2) losses or deductions the Portfolio may be able to offset against income and gains realized in future years; and (3) unrealized appreciation or depreciation of investments for federal income tax purposes (reduced by foreign tax liability).
Other book to tax differences primarily consist of deferred compensation. The Portfolio has elected to treat gains and losses on forward foreign currency contracts as capital gains and losses, if applicable. Other foreign currency gains and losses on debt instruments are treated as ordinary income for federal income tax purposes pursuant to Section 988 of the Internal Revenue Code.
| | | | | | | |
| | | | Other Book | Net Tax | |
Undistributed
Ordinary Income | Undistributed
Long-Term Gains | Accumulated
Capital Losses | Loss Deferrals | to Tax
Differences | Appreciation/
(Depreciation) | |
$ 1,515,665 | $ 20,990,124 | $ - | $ - | $ (36,233) | $ 166,654,150 | |
The aggregate cost of investments and the composition of unrealized appreciation and depreciation of investment securities for federal income tax purposes as of December 31, 2022 are noted below. The primary difference between book and tax appreciation or depreciation of investments are wash sale loss deferrals and investments in partnerships.
| | | | |
Federal Tax Cost | Unrealized
Appreciation | Unrealized
(Depreciation) | Net Tax Appreciation/
(Depreciation) |
$ 516,275,821 | $200,426,740 | $(33,770,772) | $ 166,655,968 |
Income and capital gains distributions are determined in accordance with income tax regulations that may differ from US GAAP. These differences are due to differing treatments for items such as net short-term gains, deferral of wash sale losses, foreign currency transactions, and capital loss carryovers. Certain permanent differences such as tax returns of capital and net investment losses noted below have been reclassified to capital.
| | | | | |
For the year ended December 31, 2022 | |
Distributions | | |
From Ordinary Income | From Long-Term Capital Gains | Tax Return of Capital | Net Investment Loss | |
$ 11,701,203 | $ 78,534,756 | $ - | $ - | |
| | | | | |
For the year ended December 31, 2021 | |
Distributions | | |
From Ordinary Income | From Long-Term Capital Gains | Tax Return of Capital | Net Investment Loss | |
$ 4,199,243 | $ 41,475,093 | $ - | $ - | |
Permanent book to tax basis differences may result in reclassifications between the components of net assets. These differences have no impact on the results of operations or net assets.
Janus Henderson VIT Global Research Portfolio
Notes to Financial Statements
5. Capital Share Transactions
| | | | | | | |
| | | | | | |
| | Year ended December 31, 2022 | | Year ended December 31, 2021 |
| | Shares | Amount | | Shares | Amount |
| | | | | | | |
Institutional Shares: | | | | | |
Shares sold | 161,352 | $ 9,671,194 | | 312,608 | $ 21,172,671 |
Reinvested dividends and distributions | 1,295,052 | 63,786,707 | | 488,320 | 32,926,296 |
Shares repurchased | (989,945) | (56,529,423) | | (1,072,453) | (73,190,533) |
Net Increase/(Decrease) | 466,459 | $16,928,478 | | (271,525) | $(19,091,566) |
Service Shares: | | | | | |
Shares sold | 263,433 | $14,579,709 | | 233,267 | $ 15,614,302 |
Reinvested dividends and distributions | 554,610 | 26,449,252 | | 194,479 | 12,748,040 |
Shares repurchased | (432,505) | (23,556,981) | | (495,053) | (32,788,800) |
Net Increase/(Decrease) | 385,538 | $17,471,980 | | (67,307) | $ (4,426,458) |
6. Purchases and Sales of Investment Securities
For the year ended December 31, 2022, the aggregate cost of purchases and proceeds from sales of investment securities (excluding any short-term securities, short-term options contracts, TBAs, and in-kind transactions, as applicable) was as follows:
| | | | |
Purchases of
Securities | Proceeds from Sales
of Securities | Purchases of Long-
Term U.S. Government
Obligations | Proceeds from Sales
of Long-Term U.S.
Government Obligations |
$237,133,572 | $ 285,177,136 | $ - | $ - |
7. Subsequent Event
Management has evaluated whether any events or transactions occurred subsequent to December 31, 2022 and through the date of issuance of the Portfolio’s financial statements and determined that there were no material events or transactions that would require recognition or disclosure in the Portfolio’s financial statements.
Janus Henderson VIT Global Research Portfolio
Report of Independent Registered Public Accounting Firm
To the Board of Trustees of Janus Aspen Series and Shareholders of Janus Henderson VIT Global Research Portfolio
Opinion on the Financial Statements
We have audited the accompanying statement of assets and liabilities, including the schedule of investments, of Janus Henderson VIT Global Research Portfolio (one of the portfolios constituting Janus Aspen Series, referred to hereafter as the "Portfolio") as of December 31, 2022, the related statement of operations for the year ended December 31, 2022, the statements of changes in net assets for each of the two years in the period ended December 31, 2022, including the related notes, and the financial highlights for each of the five years in the period ended December 31, 2022 (collectively referred to as the “financial statements”). In our opinion, the financial statements present fairly, in all material respects, the financial position of the Portfolio as of December 31, 2022, the results of its operations for the year then ended, the changes in its net assets for each of the two years in the period ended December 31, 2022 and the financial highlights for each of the five years in the period ended December 31, 2022 in conformity with accounting principles generally accepted in the United States of America.
Basis for Opinion
These financial statements are the responsibility of the Portfolio’s management. Our responsibility is to express an opinion on the Portfolio’s financial statements based on our audits. We are a public accounting firm registered with the Public Company Accounting Oversight Board (United States) (PCAOB) and are required to be independent with respect to the Portfolio in accordance with the U.S. federal securities laws and the applicable rules and regulations of the Securities and Exchange Commission and the PCAOB.
We conducted our audits of these financial statements in accordance with the standards of the PCAOB. Those standards require that we plan and perform the audit to obtain reasonable assurance about whether the financial statements are free of material misstatement, whether due to error or fraud.
Our audits included performing procedures to assess the risks of material misstatement of the financial statements, whether due to error or fraud, and performing procedures that respond to those risks. Such procedures included examining, on a test basis, evidence regarding the amounts and disclosures in the financial statements. Our audits also included evaluating the accounting principles used and significant estimates made by management, as well as evaluating the overall presentation of the financial statements. Our procedures included confirmation of securities owned as of December 31, 2022 by correspondence with the custodian, investee company and brokers. We believe that our audits provide a reasonable basis for our opinion.

Denver, Colorado
February 15, 2023
We have served as the auditor of one or more investment companies in Janus Henderson Funds since 1990.
Janus Henderson VIT Global Research Portfolio
Additional Information (unaudited)
Proxy Voting Policies and Voting Record
A description of the policies and procedures that the Portfolio uses to determine how to vote proxies relating to its portfolio securities is available without charge: (i) upon request, by calling 1-800-525-1093; (ii) on the Portfolio’s website at janushenderson.com/proxyvoting; and (iii) on the SEC’s website at http://www.sec.gov. Additionally, information regarding the Portfolio’s proxy voting record for the most recent twelve-month period ended June 30 is also available, free of charge, through janushenderson.com/proxyvoting and from the SEC’s website at http://www.sec.gov.
Full Holdings
The Portfolio files its complete portfolio holdings (schedule of investments) with the SEC as an exhibit to Form N-PORT within 60 days of the end of the first and third fiscal quarters, and in the annual report and semiannual report to shareholders. The Portfolio’s Form N-PORT filings and annual and semiannual reports: (i) are available on the SEC’s website at http://www.sec.gov; and (ii) are available without charge, upon request, by calling a Janus Henderson representative at 1-877-335-2687 (toll free). Portfolio holdings consisting of at least the names of the holdings are generally available on a monthly basis with a 30-day lag under Full Holdings for the Portfolio at janushenderson.com/vit.
APPROVAL OF ADVISORY AGREEMENTS DURING THE PERIOD
The Trustees of Janus Aspen Series, each of whom serves as an “independent” Trustee (the “Trustees”), oversee the management of each portfolio of Janus Aspen Series (each, a “VIT Portfolio,” and collectively, the “VIT Portfolios”), as well as each fund of Janus Investment Fund (each, a “Fund,” and collectively, the “Funds” and together with the VIT Portfolios, the “Janus Henderson Funds,” and each, a “Janus Henderson Fund”). As required by law, the Trustees determine annually whether to continue the investment advisory agreement for each Janus Henderson Fund.
In connection with their most recent consideration of those agreements for each Janus Henderson Fund, the Trustees received and reviewed information provided by Janus Henderson Investors US LLC (the “Adviser”) in response to requests of the Trustees and their independent legal counsel. They also received and reviewed information and analysis provided by, and in response to requests of, their independent fee consultant. Throughout their consideration of the agreements, the Trustees were advised by their independent legal counsel. The Trustees met with management to consider the agreements, and also met separately in executive session with their independent legal counsel and their independent fee consultant.
At meetings held on November 9-10, 2022 and December 13-14, 2022, the Trustees evaluated the information provided by the Adviser and the independent fee consultant, as well as other information provided by the Adviser and the independent fee consultant during the year. Following such evaluation, the Trustees determined that the overall arrangements between each Janus Henderson Fund and the Adviser were fair and reasonable in light of the nature, extent, and quality of the services provided by the Adviser and its affiliates, the fees charged for those services, and other matters that the Trustees considered relevant in the exercise of their business judgment, and unanimously approved the continuation of the investment advisory agreement for each Janus Henderson Fund for the period from February 1, 2023 through February 1, 2024, subject to earlier termination as provided for in each agreement.
In considering the continuation of those agreements, the Trustees reviewed and analyzed various factors that they determined were relevant, including the factors described below, none of which by itself was considered dispositive. However, the material factors and conclusions that formed the basis for the Trustees’ determination to approve the continuation of the agreements are discussed separately below. Also included is a summary of the independent fee consultant’s conclusions and opinions that arose during, and were included as part of, the Trustees’ consideration of the agreements. “Management fees,” as used herein, reflect actual annual advisory fees and, for the purpose of peer comparisons any administration fees (excluding out of pocket costs), net of any waivers, paid by a fund as a percentage of average net assets.
Nature, Extent and Quality of Services
The Trustees reviewed the nature, extent, and quality of the services provided by the Adviser to the Janus Henderson Funds, taking into account the investment objective, strategies, and policies of each Janus Henderson Fund, and the knowledge the Trustees gained from their regular meetings with management on at least a quarterly basis and their ongoing review of information related to the Janus Henderson Funds. In addition, the Trustees reviewed the resources and key personnel of the Adviser, particularly noting those employees who provide investment and risk management services to the Janus Henderson Funds. The Trustees also considered other services provided to the Janus Henderson Funds by the Adviser, such as managing the execution of portfolio transactions and the selection of broker-dealers for
Janus Henderson VIT Global Research Portfolio
Additional Information (unaudited)
those transactions. The Trustees considered the Adviser’s role as administrator to the Janus Henderson Funds, noting that the Adviser generally does not receive a fee for its services as administrator, but is reimbursed for its out-of-pocket costs. The Trustees considered the role of the Adviser in monitoring adherence to the Janus Henderson Funds’ investment restrictions, providing support services for the Trustees and Trustee committees, and overseeing communications with Janus Henderson Fund shareholders and the activities of other service providers, including monitoring compliance with various policies and procedures of the Janus Henderson Funds and with applicable securities laws and regulations.
In this regard, the independent fee consultant noted that the Adviser provides a number of different services for the Janus Henderson Funds and their shareholders, ranging from investment management services to various other servicing functions, and that, in its view, the Adviser is a capable provider of those services. The independent fee consultant also provided its belief that the Adviser has developed a number of institutional competitive advantages that should enable it to provide superior investment and service performance over the long term.
The Trustees concluded that the nature, extent, and quality of the services provided by the Adviser to each Janus Henderson Fund were appropriate and consistent with the terms of the respective advisory agreements, and that, taking into account steps taken to address those Janus Henderson Funds whose performance lagged that of their peers for certain periods, the Janus Henderson Funds were likely to benefit from the continued provision of those services. They also concluded that the Adviser had sufficient personnel, with the appropriate education and experience, to serve the Janus Henderson Funds effectively and had demonstrated its ability to attract well-qualified personnel.
Performance of the Funds
The Trustees considered the performance results of each Janus Henderson Fund over various time periods. They noted that they considered Janus Henderson Fund performance data throughout the year, including periodic meetings with each Janus Henderson Fund’s portfolio manager(s), and also reviewed information comparing each Janus Henderson Fund’s performance with the performance of comparable fund peer groups identified by Broadridge Financial Solutions, Inc. (“Broadridge”), an independent data provider, and with the Janus Henderson Fund’s benchmark index. In this regard, the independent fee consultant found that the overall Janus Henderson Funds’ performance has been reasonable, noting that: (i) for the 36 months ended May 31, 2022, approximately 38% of the Janus Henderson Funds were in the top two quartiles of their Broadridge peer groups; (ii) for the 36 months ended September 30, 2022, approximately 45% of the Janus Henderson Funds were in the top two quartiles of performance as reported by Morningstar, and (iii) for the 12 months ended September 30, 2022, approximately 55% of the Janus Henderson Funds were in the top two quartiles of performance as reported by Morningstar.
The Trustees considered the performance of each Janus Henderson Fund, noting that performance may vary by share class, and noted the following with respect to the VIT Portfolios:
· For Janus Henderson Adaptive Risk Managed U.S. Equity Portfolio, the Trustees noted that the VIT Portfolio’s performance was in the bottom Broadridge quartile for the 36 months ended May 31, 2022 and the first Broadridge quartile for the 12 months ended May 31, 2022. The Trustees noted the reasons for the VIT Portfolio’s underperformance and the steps the Adviser had taken or was taking to improve performance, and that the performance trend was improving.
· For Janus Henderson Balanced Portfolio, the Trustees noted that the VIT Portfolio’s performance was in the first Broadridge quartile for the 36 months ended May 31, 2022 and the first Broadridge quartile for the 12 months ended May 31, 2022.
· For Janus Henderson Enterprise Portfolio, the Trustees noted that the VIT Portfolio’s performance was in the third Broadridge quartile for the 36 months ended May 31, 2022 and the first Broadridge quartile for the 12 months ended May 31, 2022 The Trustees noted the reasons for the VIT Portfolio’s underperformance and the steps the Adviser had taken or was taking to improve performance, and that the performance trend was improving.
· For Janus Henderson Flexible Bond Portfolio, the Trustees noted that the VIT Portfolio’s performance was in the first Broadridge quartile for the 36 months ended May 31, 2022 and the first Broadridge quartile for the 12 months ended May 31, 2022.
Janus Henderson VIT Global Research Portfolio
Additional Information (unaudited)
· For Janus Henderson Forty Portfolio, the Trustees noted that the VIT Portfolio’s performance was in the second Broadridge quartile for the 36 months ended May 31, 2022 and the third Broadridge quartile for the 12 months ended May 31, 2022.
· For Janus Henderson Global Research Portfolio, the Trustees noted that the VIT Portfolio’s performance was in the first Broadridge quartile for the 36 months ended May 31, 2022 and the first Broadridge quartile for the 12 months ended May 31, 2022.
· For Janus Henderson Global Sustainable Equity Portfolio, the Trustees noted that the VIT Portfolio’s performance was in the bottom Broadridge quartile for the evaluated performance period ended May 31, 2022. The Trustees noted that 36 month-end performance was not yet available.
· For Janus Henderson Global Technology and Innovation Portfolio, the Trustees noted that the VIT Portfolio’s performance was in the second Broadridge quartile for the 36 months ended May 31, 2022 and the third Broadridge quartile for the 12 months ended May 31, 2022.
· For Janus Henderson Mid Cap Value Portfolio, the Trustees noted that the VIT Portfolio’s performance was in the bottom Broadridge quartile for the 36 months ended May 31, 2022 and the second Broadridge quartile for the 12 months ended May 31, 2022. The Trustees noted the reasons for the VIT Portfolio’s underperformance, while also noting that the VIT Portfolio has a performance fee structure that results in lower management fees during periods of underperformance, the steps the Adviser had taken or was taking to improve performance, and that the performance trend was improving.
· For Janus Henderson Overseas Portfolio, the Trustees noted that the VIT Portfolio’s performance was in the first Broadridge quartile for the 36 months ended May 31, 2022 and the first Broadridge quartile for the 12 months ended May 31, 2022.
· For Janus Henderson Research Portfolio, the Trustees noted that the VIT Portfolio’s performance was in the second Broadridge quartile for the 36 months ended May 31, 2022 and the second Broadridge quartile for the 12 months ended May 31, 2022.
In consideration of each Janus Henderson Fund’s performance, the Trustees concluded that, taking into account the factors relevant to performance, as well as other considerations, including steps taken to improve performance, as applicable, the Janus Henderson Fund’s performance warranted continuation of such Janus Henderson Fund’s investment advisory agreement.
Costs of Services Provided
The Trustees examined information regarding the fees and expenses of each Janus Henderson Fund in comparison to similar information for other comparable funds as provided by Broadridge, an independent data provider. They also reviewed an analysis of that information provided by their independent fee consultant. The independent fee consultant provided its belief that the management fees charged by the Adviser to each of the Janus Henderson Funds under the current investment advisory and administration agreements are reasonable in relation to the services provided by the Adviser. The independent fee consultant found: (1) the total expenses and management fees of the Janus Henderson Funds to be reasonable relative to other comparable mutual funds; (2) the total expenses, on average, were 6% under the average total expenses of the respective Broadridge peer group; and (3) the management fees for the Janus Henderson Funds, on average, were 5% under the average management fees for the respective Broadridge peer group. The Trustees also considered the total expenses for each share class of each Janus Henderson Fund compared to the average total expenses for its Broadridge Expense Group and to average total expenses for its Broadridge Expense Universe.
For Janus Henderson Funds with three or more years of performance history, the independent fee consultant also performed a systematic “focus list” analysis of expenses which assessed fund fees in the context of fund performance being delivered. Based on this analysis, the independent fee consultant found that the combination of service quality/performance and expenses on these individual Janus Henderson Funds was reasonable in light of performance trends, performance histories, changes in portfolio management, relative average net asset levels, and the existence of performance fees, breakpoints, and/or expense waivers on such Janus Henderson Funds.
Janus Henderson VIT Global Research Portfolio
Additional Information (unaudited)
The Trustees considered the methodology used by the Adviser in determining compensation payable to portfolio managers, the competitive environment for investment management talent, and the competitive market for mutual funds in different distribution channels.
The Trustees also reviewed management fees charged by the Adviser to comparable separate account clients and to comparable non-affiliated funds subadvised by the Adviser (for which the Adviser provides only or primarily portfolio management services). Although in most instances subadvisory and separate account fee rates for various investment strategies were lower than management fee rates for Janus Henderson Funds having a similar strategy, the Trustees considered that the Adviser noted that, under the terms of the management agreements with the Janus Henderson Funds, the Adviser performs significant additional services for the Janus Henderson Funds that it does not provide to those other clients, including administration services, oversight of the Janus Henderson Funds’ other service providers, Trustee support, regulatory compliance and numerous other services, and that, in serving the Janus Henderson Funds, the Adviser assumes many legal risks and other costs that it does not assume in servicing its other clients. Moreover, the Trustees noted that the independent fee consultant found that: (1) the management fees the Adviser charges to the Janus Henderson Funds are reasonable in relation to the management fees the Adviser charges to funds subadvised by the Adviser and to the fees the Adviser charges to its institutional separate account clients; (2) these subadvised and institutional separate accounts have different service and infrastructure needs and operate in markets very different from the retail fund market; (3) Janus Henderson mutual fund investors enjoy reasonable fees relative to the fees charged in these other markets; and (4) as part of its 2022 review, 9 of 11 Janus Henderson Funds have lower management fees than similar funds subadvised by the Adviser. The Trustees noted that for the two Janus Henderson Funds that did not, management fees for each were under the average of its 15(c) peer group.
The Trustees considered the fees for each Janus Henderson Fund for its fiscal year ended in 2021 (except for Janus Henderson Global Sustainable Equity Portfolio for which the period end was March 31, 2022) and noted the following with regard to each Janus Henderson Fund’s total expenses, net of applicable fee waivers (the VIT Portfolio’s “total expenses”) as reflected in the comparative information provided by Broadridge:
· For Janus Henderson Adaptive Risk Management U.S. Equity Portfolio, the Trustees noted that the VIT Portfolio’s total expenses were below the peer group average for its sole share class.
· For Janus Henderson Balanced Portfolio, the Trustees noted that, although the VIT Portfolio’s total expenses exceeded the peer group average for one share class, overall the VIT Portfolio’s total expenses were reasonable.
· For Janus Henderson Enterprise Portfolio, the Trustees noted that, although the VIT Portfolio’s total expenses exceeded the peer group average for one share class, overall the VIT Portfolio’s total expenses were reasonable.
· For Janus Henderson Flexible Bond Portfolio, the Trustees noted that, although the VIT Portfolio’s total expenses exceeded the peer group for one share class, overall the VIT Portfolio’s total expenses were reasonable. The Trustees also noted that the Adviser has contractually agreed to limit the VIT Portfolio’s expenses.
· For Janus Henderson Forty Portfolio, the Trustees noted that, although the VIT Portfolio’s total expenses exceeded the peer group average for one share class, overall the VIT Portfolio’s total expenses were reasonable.
· For Janus Henderson Global Research Portfolio, the Trustees noted that, although the VIT Portfolio’s total expenses exceeded the peer group average for one share class, overall the VIT Portfolio’s total expenses were reasonable.
· For Janus Henderson Global Sustainable Equity Portfolio, the Trustees noted that the VIT Portfolio’s total expenses were below the peer group average for both share classes.
· For Janus Henderson Global Technology and Innovation Portfolio, the Trustees noted that the VIT Portfolio’s total expenses were below the peer group average for both share classes.
· For Janus Henderson Mid Cap Value Portfolio, the Trustees noted that, the VIT Portfolio’s total expenses were below the peer group average for both share classes.
· For Janus Henderson Overseas Portfolio, the Trustees noted that although the VIT Portfolio’s total expenses exceeded the peer group average for one share class, overall the VIT Portfolio’s total expenses were reasonable.
Janus Henderson VIT Global Research Portfolio
Additional Information (unaudited)
· For Janus Henderson Research Portfolio, the Trustees noted that the VIT Portfolio’s total expenses were below the peer group average for both share classes.
The Trustees reviewed information on the overall profitability to the Adviser and its affiliates from their relationships with the Janus Henderson Funds, and considered profitability data of other publicly traded mutual fund advisers. The Trustees recognized that profitability comparisons among fund managers are difficult because of the variation in the type of comparative information that is publicly available, and the profitability of any fund manager is affected by numerous factors, including the organizational structure of the particular fund manager, differences in complex size, difference in product mix, difference in types of business (mutual fund, institutional and other), differences in the types of funds and other accounts it manages, possible other lines of business, the methodology for allocating expenses and the fund manager’s capital structure and cost of capital.
Additionally, the Trustees considered the estimated profitability to the Adviser from the investment management services it provided to each Janus Henderson Fund. In their review, the Trustees considered whether the Adviser receive adequate incentives and resources to manage the Janus Henderson Funds effectively. In reviewing profitability, the Trustees noted that the estimated profitability for an individual Janus Henderson Fund is necessarily a product of the allocation methodology utilized by the Adviser to allocate its expenses as part of the estimated profitability calculation. In this regard, the Trustees noted that the independent fee consultant found as part of its 2022 review that (1) the expense allocation methodology and rationales utilized by the Adviser were reasonable and (2) no clear correlation exists between expense allocations and operating margins. The Trustees also considered that the estimated profitability for an individual Janus Henderson Fund was influenced by a number of factors, including not only the allocation methodology selected, but also the presence of fee waivers and expense caps, and whether the Janus Henderson Fund’s investment management agreement contained breakpoints or a performance fee component. The Trustees determined, after taking into account these factors, among others, that the Adviser’s estimated profitability with respect to each Janus Henderson Fund was not unreasonable in relation to the services provided, and that the variation in the range of such estimated profitability among the Janus Henderson Funds was not a material factor in the Board’s approval of the reasonableness of any Janus Henderson Fund’s investment management fees.
The Trustees concluded that the management fees payable by each Janus Henderson Fund to the Adviser were reasonable in relation to the nature, extent, and quality of the services provided, taking into account the fees charged by other advisers for managing comparable mutual funds with similar strategies, the fees the Adviser charges to other clients, and, as applicable, the impact of fund performance on management fees payable by the Janus Henderson Funds. The Trustees also concluded that each Janus Henderson Fund’s total expenses were reasonable, taking into account the size of the Janus Henderson Fund, the quality of services provided by the Adviser, the investment performance of the Janus Henderson Fund, and any expense limitations agreed to or provided by the Adviser.
Economies of Scale
The Trustees considered information about the potential for the Adviser to realize economies of scale as the assets of the Janus Henderson Funds increase. They noted that their independent fee consultant published a report to the Trustees in June 2022 which provided its research and analysis into economies of scale. They also noted that, although many Janus Henderson Funds pay advisory fees at a fixed base rate as a percentage of net assets, without any breakpoints or performance fees, their independent fee consultant concluded that 75% of these Janus Henderson Funds’ have contractual management fees (gross of waivers) below their Broadridge Expense Group averages. The Trustees also noted the following from the independent fee consultant’s report: (1) that 31% of Janus Henderson Funds had management fee breakpoints in place whereby investors pay lower management fees as fund AUM increases; (2) that 29% of Janus Henderson Funds have low flat-rate fees and performance fees where the Adviser is incentivized to invest in resources which drive Janus Henderson Fund performance; and (3) that 39% of Janus Henderson Funds have low flat-rate fees versus peers where investors pay low fixed fees when the Janus Henderson Fund is small/midsized and higher fees when the Janus Henderson Fund grows in assets. The Trustees also noted that the Janus Henderson Funds share directly in economies of scale through the significant investments made by the Adviser and its affiliates related to services provided to the Funds and the lower charges of third-party service providers that are based in part on the combined scale of all of the Janus Henderson Funds.
The Trustees also considered the independent fee consultant’s conclusion that, given the limitations of various analytical approaches to economies of scale and their conflicting results, it is difficult to analytically confirm or deny the existence of economies of scale in the Janus Henderson complex. In this regard, the independent consultant concluded that (1) to the extent there were economies of scale at the Adviser, the Adviser’s general strategy of setting
Janus Henderson VIT Global Research Portfolio
Additional Information (unaudited)
fixed management fees below peers appeared to share any such economies with investors even on smaller Janus Henderson Funds which have not yet achieved those economies and (2) by setting lower fixed fees from the start on these Janus Henderson Funds, the Adviser appeared to be investing to increase the likelihood that these Janus Henderson Funds will grow to a level to achieve any economies of scale that may exist. Further, the independent fee consultant provided its belief that Janus Henderson Fund investors are well-served by the fee levels and performance fee structures in place on the Janus Henderson Funds in light of any economies of scale that may be present at the Adviser.
Based on all of the information reviewed, including the recent and past research and analysis conducted by the Trustees’ independent fee consultant, the Trustees concluded that the current fee structure of each Janus Henderson Fund was reasonable and that the current rates of fees do reflect a sharing between the Adviser and the Janus Henderson Fund of any economies of scale that may be present at the current asset level of the Janus Henderson Fund.
Other Benefits to the Adviser
The Trustees also considered benefits that accrue to the Adviser and its affiliates from their relationships with the Janus Henderson Funds. They recognized that two affiliates of the Adviser separately serve the Janus Henderson Funds as transfer agent and distributor, respectively, and the transfer agent receives compensation directly from the non-money market Janus Henderson Funds for services provided, and that such compensation contributes to the overall profitability of the Adviser and its affiliates that results from their relationship with the Janus Henderson Funds. The Trustees also considered the Adviser’s past and proposed use of commissions paid by the Janus Henderson Funds on portfolio brokerage transactions to obtain proprietary and third-party research products and services benefiting the Janus Henderson Fund and/or other clients of the Adviser and/or the Adviser. The Trustees concluded that the Adviser’s use of these types of client commission arrangements to obtain proprietary and third-party research products and services was consistent with regulatory requirements and guidelines and was likely to benefit each Janus Henderson Fund. The Trustees also concluded that, other than the services provided by the Adviser and its affiliates pursuant to the agreements and the fees to be paid by each Janus Henderson Fund therefor, the Janus Henderson Funds and the Adviser may potentially benefit from their relationship with each other in other ways. They concluded that the Adviser and its affiliates share directly in economies of scale through the lower charges of third-party service providers that are based in part on the combined scale of the Janus Henderson Funds and other clients serviced by the Adviser and its affiliates. They also concluded that the Adviser benefits from the receipt of research products and services acquired through commissions paid on portfolio transactions of the Janus Henderson Funds and that the Janus Henderson Funds benefit from the Adviser’s receipt of those products and services as well as research products and services acquired through commissions paid by other clients of the Adviser. They further concluded that the success of any Janus Henderson Fund could attract other business to the Adviser or other Janus Henderson Funds, and that the success of the Adviser could enhance the Adviser’s ability to serve the Janus Henderson Funds.
Janus Henderson VIT Global Research Portfolio
Useful Information About Your Portfolio Report (unaudited)
Management Commentary
The Management Commentary in this report includes valuable insight as well as statistical information to help you understand how your Portfolio’s performance and characteristics stack up against those of comparable indices.
If the Portfolio invests in foreign securities, this report may include information about country exposure. Country exposure is based primarily on the country of risk. A company may be allocated to a country based on other factors such as location of the company’s principal office, the location of the principal trading market for the company’s securities, or the country where a majority of the company’s revenues are derived.
Please keep in mind that the opinions expressed in the Management Commentary are just that: opinions. They are a reflection based on best judgment at the time this report was compiled, which was December 31, 2022. As the investing environment changes, so could opinions. These views are unique and are not necessarily shared by fellow employees or by Janus Henderson in general.
Performance Overviews
Performance overview graphs compare the performance of a hypothetical $10,000 investment in the Portfolio with one or more widely used market indices. When comparing the performance of the Portfolio with an index, keep in mind that market indices are not available for investment and do not reflect deduction of expenses.
Average annual total returns are quoted for a Portfolio with more than one year of performance history. Average annual total return is calculated by taking the growth or decline in value of an investment over a period of time, including reinvestment of dividends and distributions, then calculating the annual compounded percentage rate that would have produced the same result had the rate of growth been constant throughout the period. Average annual total return does not reflect the deduction of taxes that a shareholder would pay on Portfolio distributions or redemptions of Portfolio shares.
Cumulative total returns are quoted for a Portfolio with less than one year of performance history. Cumulative total return is the growth or decline in value of an investment over time, independent of the period of time involved. Cumulative total return does not reflect the deduction of taxes that a shareholder would pay on Portfolio distributions or redemptions of Portfolio shares.
Pursuant to federal securities rules, expense ratios shown in the performance chart reflect subsidized (if applicable) and unsubsidized ratios. The total annual fund operating expenses ratio is gross of any fee waivers, reflecting the Portfolio’s unsubsidized expense ratio. The net annual fund operating expenses ratio (if applicable) includes contractual waivers of the Adviser and reflects the Portfolio’s subsidized expense ratio. Ratios may be higher or lower than those shown in the “Financial Highlights” in this report.
Schedule of Investments
Following the performance overview section is the Portfolio’s Schedule of Investments. This schedule reports the types of securities held in the Portfolio on the last day of the reporting period. Securities are usually listed by type (common stock, corporate bonds, U.S. Government obligations, etc.) and by industry classification (banking, communications, insurance, etc.). Holdings are subject to change without notice.
The value of each security is quoted as of the last day of the reporting period. The value of securities denominated in foreign currencies is converted into U.S. dollars.
If the Portfolio invests in foreign securities, it will also provide a summary of investments by country. This summary reports the Portfolio exposure to different countries by providing the percentage of securities invested in each country. The country of each security represents the country of risk. The Portfolio’s Schedule of Investments relies upon the industry group and country classifications published by Bloomberg and/or MSCI Inc.
Tables listing details of individual forward currency contracts, futures, written options, swaptions, and swaps follow the Portfolio’s Schedule of Investments (if applicable).
Statement of Assets and Liabilities
This statement is often referred to as the “balance sheet.” It lists the assets and liabilities of the Portfolio on the last day of the reporting period.
Janus Henderson VIT Global Research Portfolio
Useful Information About Your Portfolio Report (unaudited)
The Portfolio’s assets are calculated by adding the value of the securities owned, the receivable for securities sold but not yet settled, the receivable for dividends declared but not yet received on securities owned, and the receivable for Portfolio shares sold to investors but not yet settled. The Portfolio’s liabilities include payables for securities purchased but not yet settled, Portfolio shares redeemed but not yet paid, and expenses owed but not yet paid. Additionally, there may be other assets and liabilities such as unrealized gain or loss on forward currency contracts.
The section entitled “Net Assets Consist of” breaks down the components of the Portfolio’s net assets. Because the Portfolio must distribute substantially all earnings, you will notice that a significant portion of net assets is shareholder capital.
The last section of this statement reports the net asset value (“NAV”) per share on the last day of the reporting period. The NAV is calculated by dividing the Portfolio’s net assets for each share class (assets minus liabilities) by the number of shares outstanding.
Statement of Operations
This statement details the Portfolio’s income, expenses, realized gains and losses on securities and currency transactions, and changes in unrealized appreciation or depreciation of Portfolio holdings.
The first section in this statement, entitled “Investment Income,” reports the dividends earned from securities and interest earned from interest-bearing securities in the Portfolio.
The next section reports the expenses incurred by the Portfolio, including the advisory fee paid to the investment adviser, transfer agent fees and expenses, and printing and postage for mailing statements, financial reports and prospectuses. Expense offsets and expense reimbursements, if any, are also shown.
The last section lists the amounts of realized gains or losses from investment and foreign currency transactions, and changes in unrealized appreciation or depreciation of investments and foreign currency-denominated assets and liabilities. The Portfolio will realize a gain (or loss) when it sells its position in a particular security. A change in unrealized gain (or loss) refers to the change in net appreciation or depreciation of the Portfolio during the reporting period. “Net Realized and Unrealized Gain/(Loss) on Investments” is affected both by changes in the market value of Portfolio holdings and by gains (or losses) realized during the reporting period.
Statements of Changes in Net Assets
These statements report the increase or decrease in the Portfolio’s net assets during the reporting period. Changes in the Portfolio’s net assets are attributable to investment operations, dividends and distributions to investors, and capital share transactions. This is important to investors because it shows exactly what caused the Portfolio’s net asset size to change during the period.
The first section summarizes the information from the Statement of Operations regarding changes in net assets due to the Portfolio’s investment operations. The Portfolio’s net assets may also change as a result of dividend and capital gains distributions to investors. If investors receive their dividends and/or distributions in cash, money is taken out of the Portfolio to pay the dividend and/or distribution. If investors reinvest their dividends and/or distributions, the Portfolio’s net assets will not be affected.
The reinvestment of dividends and distributions is included under “Capital Share Transactions.” “Capital Shares” refers to the money investors contribute to the Portfolio through purchases or withdrawals via redemptions. The Portfolio’s net assets will increase and decrease in value as investors purchase and redeem shares from the Portfolio.
Financial Highlights
This schedule provides a per-share breakdown of the components that affect the Portfolio’s NAV for current and past reporting periods as well as total return, asset size, ratios, and portfolio turnover rate.
The first line in the table reflects the NAV per share at the beginning of the reporting period. The next line reports the net investment income/(loss) per share. Following is the per share total of net gains/(losses), realized and unrealized. Per share dividends and distributions to investors are then subtracted to arrive at the NAV per share at the end of the period. The next line reflects the total return for the period. The total return may include adjustments in accordance with generally accepted accounting principles required at the period end for financial reporting purposes. As a result, the total return may differ from the total return reflected for individual shareholder transactions. Also included are ratios of expenses and net investment income to average net assets.
Janus Henderson VIT Global Research Portfolio
Useful Information About Your Portfolio Report (unaudited)
The Portfolio’s expenses may be reduced through expense offsets and expense reimbursements. The ratios shown reflect expenses before and after any such offsets and reimbursements.
The ratio of net investment income/(loss) summarizes the income earned less expenses, divided by the average net assets of the Portfolio during the reporting period. Do not confuse this ratio with the Portfolio’s yield. The net investment income ratio is not a true measure of the Portfolio’s yield because it does not take into account the dividends distributed to the Portfolio’s investors.
The next figure is the portfolio turnover rate, which measures the buying and selling activity in the Portfolio. Portfolio turnover is affected by market conditions, changes in the asset size of the Portfolio, fluctuating volume of shareholder purchase and redemption orders, the nature of the Portfolio’s investments, and the investment style and/or outlook of the portfolio manager(s) and/or investment personnel. A 100% rate implies that an amount equal to the value of the entire portfolio was replaced once during the fiscal year; a 50% rate means that an amount equal to the value of half the portfolio is traded in a year; and a 200% rate means that an amount equal to the value of the entire portfolio is traded every six months.
Janus Henderson VIT Global Research Portfolio
Designation Requirements (unaudited)
For federal income tax purposes, the Portfolio designated the following for the year ended December 31, 2022:
| | |
| | |
Capital Gain Distributions | $78,534,756 |
Dividends Received Deduction Percentage | 54% |
Janus Henderson VIT Global Research Portfolio
Trustees and Officers (unaudited)
The following are the Trustees and officers of the Trust, together with a brief description of their principal occupations during the last five years (principal occupations for certain Trustees may include periods over five years). The Portfolio’s Statement of Additional Information includes additional information about the Trustees and officers and is available, without charge, by calling 1-877-335-2687.
Each Trustee has served in that capacity since he or she was originally elected or appointed. The Trustees do not serve a specified term of office. Each Trustee will hold office until the termination of the Trust or his or her earlier death, resignation, retirement, incapacity, or removal. Under the Portfolio’s Governance Procedures and Guidelines, the policy is for Trustees to retire no later than the end of the calendar year in which the Trustee turns 75. The Trustees review the Portfolio’s Governance Procedures and Guidelines from time to time and may make changes they deem appropriate. The Portfolio’s Nominating and Governance Committee will consider nominees for the position of Trustee recommended by shareholders. Shareholders may submit the name of a candidate for consideration by the Committee by submitting their recommendations to the Trust’s Secretary. Each Trustee is currently a Trustee of one other registered investment company advised by the Adviser: Janus Investment Fund. Collectively, these two registered investment companies consist of 51 series or funds referred to herein as the Fund Complex.
The Trust’s officers are elected annually by the Trustees for a one-year term. Certain officers also serve as officers of Janus Investment Fund. Certain officers of the Portfolio may also be officers and/or directors of the Adviser. Except as otherwise disclosed, Portfolio officers receive no compensation from the Portfolio, except for the Portfolio’s Chief Compliance Officer, as authorized by the Trustees.
Janus Henderson VIT Global Research Portfolio
Trustees and Officers (unaudited)
| | | | | | |
TRUSTEES |
Name, Address, and Age | Positions Held with the Trust | Length of Time Served | Principal Occupations During the Past Five Years | Number of Portfolios/Funds in Fund Complex Overseen by Trustee | Other Directorships Held by Trustee During the Past Five Years |
Independent Trustees | | | | |
Alan A. Brown
151 Detroit Street
Denver, CO 80206
DOB: 1962 | Chairman
Trustee | 5/22-Present
1/13-Present | Principal, Curam Holdings LLC (since 2018). Formerly, Executive Vice President, Institutional Markets, of Black Creek Group (private equity real estate investment management firm) (2012-2018), Executive Vice President and Co-Head, Global Private Client Group (2007-2010), Executive Vice President, Mutual Funds (2005-2007), and Chief Marketing Officer (2001-2005) of Nuveen Investments, Inc. (asset management). | 51 | Advisory Board Member of AEW Core Property Trust (open-end property fund) (since 2020), and Director of WTTW (PBS affiliate) (since 2003). Formerly, Director of MotiveQuest LLC (strategic social market research company) (2003-2016), Director of Nuveen Global Investors LLC (2007-2011), Director of Communities in Schools (2004-2010), and Director of Mutual Fund Education Alliance (until 2010). |
Cheryl D. Alston
151 Detroit Street
Denver, CO 80206
DOB: 1966 | Trustee | 8/22-Present | Executive Director and Chief Investment Officer, Employees’ Retirement Fund of the City of Dallas (since 2004). | 51 | Director of Blue Cross Blue Shield of Kansas City (a not-for-profit health insurance provider) (since 2016) and Director of Global Life Insurance (life and supplemental health insurance provider) (since 2017). Formerly, Director of Federal Home Loan Bank of Dallas (2017-2021). |
Janus Henderson VIT Global Research Portfolio
Trustees and Officers (unaudited)
| | | | | | |
TRUSTEES |
Name, Address, and Age | Positions Held with the Trust | Length of Time Served | Principal Occupations During the Past Five Years | Number of Portfolios/Funds in Fund Complex Overseen by Trustee | Other Directorships Held by Trustee During the Past Five Years |
Independent Trustees | | | | |
William D. Cvengros
151 Detroit Street
Denver, CO 80206
DOB: 1948 | Trustee | 1/11-Present | Chief Executive Officer of SJC Capital, LLC (a personal investment company and consulting firm) (since 2002). Formerly, Chief Executive Officer and President of PIMCO Advisors Holdings L.P. (a publicly traded investment management firm) (1994-2000), and Chief Investment Officer (1987-1994) and Vice Chairman and Director (1990-1994) of Pacific Life Insurance Company (a mutual life insurance and annuity company) (1987-1994). | 51 | Member, Limited Partner Advisory Committee, Karmel Capital Fund III (since 2022), Member of the Investment Committee for the Orange Country Community Foundation (a grantmaking foundation) (since 2020), Advisory Board Member, RevOZ Fund LP and related funds (real estate investments for opportunity zones) (since 2020), and Advisory Board Member, Innovate Partners Emerging Growth and Equity Fund I (early stage venture capital fund) (since 2014). Formerly, Managing Trustee of National Retirement Partners Liquidating Trust (2013-2016), Chairman, National Retirement Partners, Inc. (formerly a network of advisors to 401(k) plans) (2005-2013), Director of Prospect Acquisition Corp. (a special purpose acquisition corporation) (2007-2009), Director of RemedyTemp, Inc. (temporary help services company) (1996-2006), and Trustee of PIMCO Funds Multi-Manager Series (1990-2000) and Pacific Life Variable Life & Annuity Trusts (1987-1994). |
Janus Henderson VIT Global Research Portfolio
Trustees and Officers (unaudited)
| | | | | | |
TRUSTEES |
Name, Address, and Age | Positions Held with the Trust | Length of Time Served | Principal Occupations During the Past Five Years | Number of Portfolios/Funds in Fund Complex Overseen by Trustee | Other Directorships Held by Trustee During the Past Five Years |
Independent Trustees | | | | |
Raudline Etienne
151 Detroit Street
Denver, CO 80206
DOB: 1965 | Trustee | 6/16-Present | Founder, Daraja Capital (advisory and investment firm) (since 2016). Formerly, Senior Vice President and Senior Advisor, Albright Stonebridge Group LLC (global strategy firm) (2011-2021), and Deputy Comptroller and Chief Investment Officer, New York State Common Retirement Fund (public pension fund) (2008-2011). | 51 | Member of the Investment Committee for Cooper Union (private college) (since 2021), Board Member, Van Alen Institute (nonprofit architectural and design organization) (2019-2022). |
Janus Henderson VIT Global Research Portfolio
Trustees and Officers (unaudited)
| | | | | | |
TRUSTEES |
Name, Address, and Age | Positions Held with the Trust | Length of Time Served | Principal Occupations During the Past Five Years | Number of Portfolios/Funds in Fund Complex Overseen by Trustee | Other Directorships Held by Trustee During the Past Five Years |
Independent Trustees | | | | |
Darrell B. Jackson
151 Detroit Street
Denver, CO 80206
DOB: 1958 | Trustee | 8/22-Present | President and Chief Executive Officer, The Efficace Group Inc. (since 2018). Formerly, President and Chief Executive Officer, Seaway Bank and Trust Company (community bank) (2014-2015), and Executive Vice President and Co-President, Wealth Management (2009-2014), and several senior positions, including Group Executive, Senior Vice President, and Vice President (1995-2009) of Northern Trust Company (financial services company) (1995-2014). | 51 | Director of Amalgamated Financial Corp (bank) (since August 2021), Director of YR Media (a not-for-profit production company) (since 2021), and Director of Gray-Bowen-Scott (transportation project consulting firm) (since April 2020). Formerly, Director of Delaware Place Bank (closely held commercial bank) (2016-2018) and Director of Seaway Bank and Trust Company (2014-2015). |
Janus Henderson VIT Global Research Portfolio
Trustees and Officers (unaudited)
| | | | | | |
TRUSTEES |
Name, Address, and Age | Positions Held with the Trust | Length of Time Served | Principal Occupations During the Past Five Years | Number of Portfolios/Funds in Fund Complex Overseen by Trustee | Other Directorships Held by Trustee During the Past Five Years |
Independent Trustees | | | | |
William F. McCalpin
151 Detroit Street
Denver, CO 80206
DOB: 1957 | Trustee | 6/02-Present | Chief Executive Officer, muun chi LLC (organic food business) (since 2022) and Independent Consultant (since 2019). Formerly, Chief Operating Officer, muun chi LLC (2020-2022), Managing Partner, Impact Investments, Athena Capital Advisors LLC (independent registered investment advisor) (2016-2019), Managing Director, Holos Consulting LLC (provides consulting services to foundations and other nonprofit organizations) (2009-2016), Chief Executive Officer, Imprint Capital Advisors (impact investment firm) (2013-2015), and Executive Vice President and Chief Operating Officer of The Rockefeller Brothers Fund (a private family foundation) (1998-2006). | 51 | Chairman of the Board and Trustee of The Investment Fund for Foundations Investment Program (TIP) (consisting of 1 fund) (since 2008). Formerly, Director of the F.B. Heron Foundation (a private grantmaking foundation) (2006-2022), and Director of Mutual Fund Directors Forum (a non-profit organization serving independent directors of U.S. mutual funds) (2016-2021). |
Janus Henderson VIT Global Research Portfolio
Trustees and Officers (unaudited)
| | | | | | |
TRUSTEES |
Name, Address, and Age | Positions Held with the Trust | Length of Time Served | Principal Occupations During the Past Five Years | Number of Portfolios/Funds in Fund Complex Overseen by Trustee | Other Directorships Held by Trustee During the Past Five Years |
Independent Trustees | | | | |
Gary A. Poliner
151 Detroit Street
Denver, CO 80206
DOB: 1953 | Trustee | 6/16-Present | Retired. Formerly, President (2010-2013) of Northwestern Mutual Life Insurance Company. | 51 | Director of MGIC Investment Corporation (private mortgage insurance) (since 2013). Formerly, Director, West Bend Mutual Insurance Company (property/casualty insurance) (2013-2021), Trustee of Northwestern Mutual Life Insurance Company (2010-2013) and Director of Frank Russell Company (global asset management firm) (2008-2013). |
Diane L. Wallace
151 Detroit Street
Denver, CO 80206
DOB: 1958 | Trustee | 6/17-Present | Retired. Formerly, Chief Operating Officer, Senior Vice President-Operations, and Chief Financial Officer for Driehaus Capital Management, LLC (1988-2006) and Treasurer for Driehaus Mutual Funds (1996-2002). | 51 | Formerly, Director of Family Service of Lake County (2019-2021), Independent Trustee, Henderson Global Funds (13 portfolios) (2015-2017), Independent Trustee, State Farm Associates' Funds Trust, State Farm Mutual Fund Trust, and State Farm Variable Product Trust (28 portfolios) (2013-2017). |
Janus Henderson VIT Global Research Portfolio
Trustees and Officers (unaudited)
| | | | |
OFFICERS |
Name, Address, and Age | Positions Held with the Trust | Term of Office* and Length of Time Served | Principal Occupations During the Past Five Years |
Matthew Peron
151 Detroit Street
Denver, CO 80206
DOB: 1968 | Executive Vice President Janus Henderson Global Research Portfolio | 4/20-Present | Director of Research of the Adviser and Portfolio Manager for other Janus Henderson accounts. Formerly, Chief Investment Officer for City National Rochdale (2018-2020), Executive Vice President and Managing Director of Global Equity at Northern Trust (2005-2018). |
Michelle Rosenberg
151 Detroit Street
Denver, CO 80206
DOB: 1973 | President and Chief Executive Officer | 9/22-Present | General Counsel and Corporate Secretary of Janus Henderson Investors (since 2018). Formerly, Interim President and Chief Executive Officer of the Trust and Janus Investment Fund (2022), Senior Vice President and Head of Legal, North America of Janus Henderson Investors (2017-2018) and Deputy General Counsel of Janus Henderson US (Holdings) Inc. (2015-2018). |
Kristin Mariani
151 Detroit Street
Denver, CO 80206
DOB: 1966 | Vice President and Chief Compliance Officer | 7/20-Present | Head of Compliance, North America at Janus Henderson Investors (since September 2020), and Chief Compliance Officer at Janus Henderson Investors US LLC (since September 2017). Formerly, Anti-Money Laundering Officer for the Trust and Janus Investment Fund (July 2020-December 2022), Global Head of Investment Management Compliance at Janus Henderson Investors (February 2019-August 2020), Vice President, Head of Global Distribution Compliance and Chief Compliance Officer at Janus Henderson Distributors US LLC (May 2017-September 2017), Vice President, Compliance at Janus Henderson US (Holdings) Inc., Janus Henderson Investors US LLC, and Janus Henderson Distributors US LLC (2009-2017). |
* Officers are elected at least annually by the Trustees for a one-year term and may also be elected from time to time by the Trustees for an interim period. |
Janus Henderson VIT Global Research Portfolio
Trustees and Officers (unaudited)
| | | | |
OFFICERS |
Name, Address, and Age | Positions Held with the Trust | Term of Office* and Length of Time Served | Principal Occupations During the Past Five Years |
Jesper Nergaard
151 Detroit Street
Denver, CO 80206
DOB: 1962 | Chief Financial Officer
Vice President, Treasurer, and Principal Accounting Officer | 3/05-Present
2/05-Present | Head of U.S. Fund Administration, Janus Henderson Investors and Janus Henderson Services US LLC. |
Abigail J. Murray
151 Detroit Street
Denver, CO 80206
DOB: 1975 | Vice President, Chief Legal Officer, and Secretary | 12/20-Present | Managing Counsel (since 2020). Formerly, Senior Counsel for Invesco Ltd. (2017-2020), and Vice President and Senior Counsel, ALPS Fund Services, Inc. and Assistant General Counsel, ALPS Advisors, Inc. (2015-2017). |
Ciaran Askin
151 Detroit Street
Denver, CO 80206
DOB: 1978 | Anti-Money Laundering Officer | 12/22-Present | Global Head of Financial Crime, Janus Henderson Investors (since 2022). Formerly, Global Head of Financial Crime for Invesco Ltd. (2017-2022). |
* Officers are elected at least annually by the Trustees for a one-year term and may also be elected from time to time by the Trustees for an interim period. |
Janus Henderson VIT Global Research Portfolio
Notes
NotesPage1
| | | | | | | | |
| | | | | |

| | | | |
This report is submitted for the general information of shareholders of the Portfolio. It is not an offer or solicitation for the Portfolio and is not authorized for distribution to prospective investors unless preceded or accompanied by an effective prospectus. |
Janus Henderson is a trademark of Janus Henderson Group plc or one of its subsidiaries. © Janus Henderson Group plc Janus Henderson Distributors US LLC |
| | | | 109-02-81112 03-23 |
| | | |
| | | |
| | | ANNUAL REPORT December 31, 2022 |
| | |
| | Janus Henderson VIT Global Sustainable Equity Portfolio |
| | |
| | Janus Aspen Series |
| |
| | | |
| | | HIGHLIGHTS · Portfolio management perspective · Investment strategy behind your portfolio · Portfolio performance, characteristics
and holdings |
Table of Contents
Janus Henderson VIT Global Sustainable Equity Portfolio
Janus Henderson VIT Global Sustainable Equity Portfolio (unaudited)
| | | | | | |
| | | | 
Aaron Scully co-portfolio manager | 
Hamish Chamberlayne co-portfolio manager |
| | | |
PERFORMANCE OVERVIEW
For the period from the inception date of January 26 to December 31, 2022, the Janus Henderson Global Sustainable Equity Portfolio Service Shares and Institutional Shares returned -14.44% and -14.46, respectively, compared to -11.26% for the Portfolio’s benchmark, the MSCI IndexSM.
MARKET ENVIRONMENT
Equities slumped in 2022 as valuations came under heavy pressure due to recession fears and aggressive central bank tightening.
From the beginning of the year, investor sentiment was poor. In January, spikes in inflation, mainly through COVID-19 supply disruptions, proved less transitory than policymakers anticipated, and central banks signaled their first sets of interest rate hikes since the start of the pandemic. Russia’s invasion of Ukraine caused further supply chain chaos, pushing energy prices higher and feeding multi-decade-high inflation. After starting the year at 0.25% to 0.50%, the Federal Reserve’s (Fed) policy rate ended the year at 4.25% to 4.50%.
As well as weighing on equity valuations, central banks’ rapid rate hikes spurred fears of a severe global recession. Economic data increasingly pointed to slowing or negative growth with the outlook clouded further by China’s commitment to its Zero-COVID policy. Stocks held up better in the second half of 2022, with markets rallying strongly in the fourth quarter on hopes of less frequent interest rate hikes and a softer economic landing. In such a volatile environment, markets rotated out of growth and into defensive names, inflation beneficiaries, and cheaper stocks. Energy was by far the best-performing sector while every other sector except utilities and healthcare ended the period lower. Several high-profile stocks recorded large drawdowns and weighed on performance in the information technology (IT) and growth sectors in general.
Government legislation was galvanized by the war in Ukraine, extreme weather, and fragile global supply chains. As a result, global events provided further tailwinds to sustainability trends such as reshoring and energy transition. In August, U.S. Congress passed the U.S. Inflation Reduction Act of 2022 to re-develop the country’s manufacturing infrastructure and promote cleaner energy by investing in domestic generation. The bill also incentivizes homeowners to improve energy efficiency and buy electric vehicles manufactured solely in North America. Similarly, the European Union (EU) boosted several aspects of its Green Deal and “Fit for 55” plan with higher targets for renewable energy use, emission reductions, and recycling.
PERFORMANCE DISCUSSION
Given the economic conditions for growth stocks over the period, keeping up with market returns was difficult. The Portfolio’s sector allocation was detrimental, led by zero exposure to the energy sector (due to the Portfolio’s fossil fuel exclusions) and an overweight position in the IT sector. This more than offset the benefit from our underweight allocations to the consumer discretionary and communication services sectors. The Portfolio’s stock selection detracted to a milder degree. Selection in financials was a major positive as was our lack of exposure to some of the large growth stocks – such as Tesla, Amazon, Apple, Alphabet, Meta, and PayPal – that posted heavy losses in 2022.
At the individual stock level, the biggest detractors over the period were software provider Atlassian, integrated circuit manufacturing services provider Taiwan Semiconductor Manufacturing Co. (TSMC), and real estate financing firm Walker & Dunlop.
In the first half of the period, Atlassian drifted lower along with other IT shares despite continuing to report earnings that were above estimates. The shares fell more sharply in October, however, when Atlassian cut forward guidance for the first time since its initial public offering.
Janus Henderson VIT Global Sustainable Equity Portfolio (unaudited)
Management attributed the weakness to fewer free accounts upgrading to paid and to hiring freezes slowing growth from existing customers. Despite this, our long-term thesis is unchanged, and the firm’s growth rate has remained high in absolute terms.
TSMC posted strong earnings throughout the period, but its shares fell with other technology firms on supply-chain concerns and slowing global growth. TSMC was adversely affected by growing tensions between the U.S. and China that are especially relevant to high-tech sectors such as semiconductors. Later in the year, we exited our position in TSMC as part of our move to reduce the Portfolio’s overweight allocation to semiconductors. Regarding TSMC itself, we felt the market had priced in too little risk regarding Chinese policy toward Taiwan and the escalating U.S./China trade tensions in high-tech industries. We also expected TSMC’s returns on capital to decline as it invests in new manufacturing capacity in the U.S. and Europe.
Walker & Dunlop underperformed as rising interest rates weighed on sentiment toward commercial real estate. Markets also reacted badly to the company’s third-quarter results that showed lower transaction volumes and weaker pricing. Given Walker & Dunlop’s expertise in helping clients comply with government regulations, we remain happy with the longer-term prospects. The firm also plays a key role in programs concerning affordable housing, green lending, healthcare, senior living, and student properties.
The Portfolio’s largest individual contributors over the period all were insurers. All three companies – Humana, Aon, and Progressive – continued to show strong fundamentals, and all benefited from the outperformance of the insurance industry as a whole.
Humana posted earnings in April 2022 that exceeded expectations and raised its guidance. Management reiterated membership, revenue, and profit expectations for 2022, envisaging further membership growth in 2023. In September, Humana revised its three-year growth estimate to the upper range of the previously given guidance as utilization improved and unit costs moderated. During the year, Humana also announced a joint venture to develop additional primary care clinics, further cementing its position as one of the largest senior-focused primary care providers in the U.S. Humana is a pioneer in integrated care and has found a valuable niche by tailoring its offerings to government-sponsored programs. The company is exposed to growth in an aging population, and we have liked its ability to drive better outcomes.
Aon uses big-data analytics to help clients manage complex and emerging risks such as climate change, cyber-attacks, and risks associated with the retirement and healthcare needs of an aging population. The company posted strong results throughout 2022. In February, it posted strong earnings with year-on-year organic sales growth of 10% and better-than-expected margins. In response, Aon management announced a bigger dividend as well as a share buyback. As geopolitical and climate risks continue to grow, Aon can participate in several long-term growth opportunities while helping to make the world a safer place.
Progressive, an auto insurer that views itself as more of a data-science company, continued to show better underwriting performance than its peers over the period. The company also made progress in its nascent home insurance segment where it bought out its joint venture partner. Progressive’s data-led approach encourages safer driving habits and allows the firm to offer lower premiums. We have felt the company could continue to grow in 2023, thanks to its compelling pricing and the potential for headwinds like labor shortages and higher repair costs to ease.
Elsewhere, we sold our position in a multinational computer software company after it made an expensive-looking acquisition. We also sold positions in a Software as a Service provider and an automated tax compliance software company after both companies were acquired and closed a small position in a health and hospice provider. We initiated new positions in a telecommunications company; a provider of enterprise cloud applications for finance, HR, and planning; and a factory automation equipment manufacturer.
OUTLOOK
As we look ahead to 2023, many of the macro concerns that dominated markets in 2022 are still present. Despite these headwinds, we remain constructive on the outlook for sustainable equities. Valuation levels are generally much lower than 12 to 18 months ago; nevertheless, we continue to see opportunities for strong earnings growth.
The events of the last year have reinforced many of the secular trends on which we are focused. High energy prices and concerns over economic security and further climactic extremes have galvanized government regulation surrounding decarbonization and clean-technology
Janus Henderson VIT Global Sustainable Equity Portfolio (unaudited)
investment. Bills such as the U.S. Inflation Reduction Act of 2022 should provide multi-year growth opportunities for our companies aligned with the trends of digitalization, electrification, and reshoring.
Thank you for investing in the Janus Henderson VIT Global Sustainable Equity Portfolio.
Janus Henderson VIT Global Sustainable Equity Portfolio (unaudited)
Portfolio At A Glance
December 31, 2022
| | | | | | | | | | |
| | | | | | | | | |
| | | | | | | | | |
| | | | | | | | | |
| 5 Top Contributors - Holdings | 5 Top Detractors - Holdings |
| | Average
Weight | | Relative
Contribution | | | Average
Weight | | Relative
Contribution |
| Humana Inc | 2.34% | | 0.74% | | Atlassian Corp - Class A | 1.60% | | -0.96% |
| Aon PLC - Class A | 3.10% | | 0.60% | | Taiwan Semiconductor Manufacturing Co., Ltd. Sponsored ADR | 2.03% | | -0.91% |
| Progressive Corp/The | 2.41% | | 0.59% | | Walker & Dunlop, Inc. | 2.08% | | -0.60% |
| Wabtec Corp | 2.77% | | 0.56% | | Knorr-Bremse AG | 1.12% | | -0.53% |
| Intact Financial Corp | 2.93% | | 0.53% | | NVIDIA Corporation | 2.91% | | -0.52% |
| | | | | | | |
| 5 Top Contributors - Sectors* | | | | | |
| | | Relative | | Portfolio | MSCI World Index |
| | | Contribution | | Average Weight | Average Weight |
| Financials | | 1.74% | | 14.96% | 13.74% |
| Communication Services | | 1.46% | | 2.67% | 7.35% |
| Consumer Discretionary | | 0.43% | | 6.08% | 11.04% |
| Utilities | | 0.35% | | 5.60% | 3.06% |
| Other** | | 0.22% | | 2.97% | 0.00% |
| | | | | | |
| | | | | | |
| 5 Top Detractors - Sectors* | | | | | |
| | | Relative | | Portfolio | MSCI World Index |
| | | Contribution | | Average Weight | Average Weight |
| Information Technology | | -3.14% | | 38.63% | 21.51% |
| Energy | | -1.53% | | 0.00% | 4.98% |
| Health Care | | -1.19% | | 6.65% | 13.54% |
| Consumer Staples | | -0.64% | | 0.51% | 7.54% |
| Industrials | | -0.30% | | 16.46% | 10.11% |
| | | | | | | |
| Relative contribution reflects how the portolio's holdings impacted return relative to the benchmark. Cash and securities not held in the portfolio are not shown. For equity portfolios, relative contribution compares the performance of a security in the portfolio to the benchmark's total return, factoring in the difference in weight of that security in the benchmark. Returns are calculated using daily returns and previous day ending weights rolled up by ticker, excluding fixed income securities, gross of advisory fees, may exclude certain derivatives and will differ from actual performance.
Performance attribution reflects returns gross of advisory fees and may differ from actual returns as they are based on end of day holdings. Attribution is calculated by geometrically linking daily returns for the portfolio and index. |
* | Based on sector classification according to the Global Industry Classification Standard (“GICS”) codes, which are the exclusive property and a service mark of MSCI Inc. and Standard & Poor’s. |
** | Not a GICS classified sector. |
Janus Henderson VIT Global Sustainable Equity Portfolio (unaudited)
Portfolio At A Glance
December 31, 2022
| | |
5 Largest Equity Holdings - (% of Net Assets) |
Microsoft Corp | |
Software | 5.8% |
Wabtec Corp | |
Machinery | 3.3% |
Aon PLC - Class A | |
Insurance | 3.2% |
Humana Inc | |
Health Care Providers & Services | 3.0% |
Intact Financial Corp | |
Insurance | 2.9% |
| | 18.2% |
| | | | | | |
Asset Allocation - (% of Net Assets) | |
Common Stocks | | 98.5% | |
Investment Companies | | 3.1% | |
Other | | (1.6)% |
| | | 100.0% |
| | |
Top Country Allocations - Long Positions - (% of Investment Securities) |
As of December 31, 2022 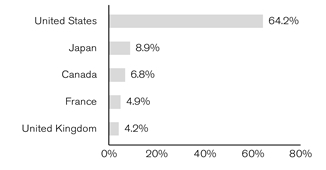
| |
Janus Henderson VIT Global Sustainable Equity Portfolio (unaudited)
Performance

| | | | | | | | |
| | | | | | |
| | | | | | |
Cumulative Total Return - for the periods ended December 31, 2022 | | | Prospectus Expense Ratios |
| | Since
Inception* | | | Total Annual Fund
Operating Expenses‡ | Net Annual Fund
Operating Expenses‡ |
Institutional Shares | | -14.46% | | | 3.10% | 0.92% |
Service Shares | | -14.44% | | | 4.15% | 1.18% |
MSCI World Index | | -11.26% | | | | |
Returns quoted are past performance and do not guarantee future results; current performance may be lower or higher. Investment returns and principal value will vary; there may be a gain or loss when shares are sold. For the most recent month-end performance call 800.668.0434 or visit janushenderson.com/VITperformance.
Net expense ratios reflect the expense waiver, if any, contractually agreed to until at least April 30, 2023. See Financial Highlights for actual expense ratios during the reporting period.
Performance may be affected by risks that include those associated with foreign and emerging markets, fixed income securities, high-yield and high-risk securities, undervalued, overlooked and smaller capitalization companies, real estate related securities including Real Estate Investment Trusts (REITs), Environmental, Social and Governance (ESG) factors, non-diversification, portfolio turnover, derivatives, short sales, initial public offerings (IPOs) and potential conflicts of interest. Each product has different risks. Please see the prospectus for more information about risks, holdings and other details.
Returns do not reflect the deduction of fees, charges or expenses of any insurance product or qualified plan. If applied, returns would have been lower.
Returns include reinvestment of all dividends and distributions and do not reflect the deduction of taxes that a shareholder would pay on Portfolio distributions or redemptions of Portfolio shares. The returns do not include adjustments in accordance with generally accepted accounting principles required at the period end for financial reporting purposes.
© 2022 Morningstar, Inc. All Rights Reserved.
There is no assurance that the investment process will consistently lead to successful investing.
See Notes to Schedule of Investments and Other Information for index definitions.
Index performance does not reflect the expenses of managing a portfolio as an index is unmanaged and not available for direct investment.
See “Useful Information About Your Portfolio Report.”
*The Portfolio’s inception date – January 26, 2022
‡ As stated in the prospectus. See Financial Highlights for actual expense ratios during the reporting period.
Janus Henderson VIT Global Sustainable Equity Portfolio (unaudited)
Expense Examples
As a shareholder of the Portfolio, you incur two types of costs: (1) transaction costs and (2) ongoing costs, including management fees; 12b-1 distribution and shareholder servicing fees (applicable to Service Shares only); transfer agent fees and expenses payable pursuant to the Transfer Agency Agreement; and other Portfolio expenses. This example is intended to help you understand your ongoing costs (in dollars) of investing in the Portfolio and to compare these costs with the ongoing costs of investing in other mutual funds. To do so, compare this 5% hypothetical example with the 5% hypothetical examples that appear in the shareholder reports of the other funds. The example is based upon an investment of $1,000 invested at the beginning of the period and held for the six-months indicated, unless noted otherwise in the table and footnotes below.
Actual Expenses
The information in the table under the heading “Actual” provides information about actual account values and actual expenses. You may use the information in these columns, together with the amount you invested, to estimate the expenses that you paid over the period. Simply divide your account value by $1,000 (for example, an $8,600 account value divided by $1,000 = 8.6), then multiply the result by the number in the appropriate column for your share class under the heading entitled “Expenses Paid During Period” to estimate the expenses you paid on your account during the period.
Hypothetical Example for Comparison Purposes
The information in the table under the heading “Hypothetical (5% return before expenses)” provides information about hypothetical account values and hypothetical expenses based upon the Portfolio’s actual expense ratio and an assumed rate of return of 5% per year before expenses, which is not the Portfolio’s actual return. The hypothetical account values and expenses may not be used to estimate the actual ending account balance or expenses you paid for the period. You may use this information to compare the ongoing costs of investing in the Portfolio and other funds. To do so, compare this 5% hypothetical example with the 5% hypothetical examples that appear in the shareholder reports of the other funds. Additionally, for an analysis of the fees associated with an investment in either share class or other similar funds, please visit www.finra.org/fundanalyzer.
Please note that the expenses shown in the table are meant to highlight your ongoing costs only and do not reflect any transaction costs, such as any charges at the separate account level or contract level. These fees are fully described in the Portfolio’s prospectuses. Therefore, the hypothetical examples are useful in comparing ongoing costs only, and will not help you determine the relative total costs of owning different funds. In addition, if these transaction costs were included, your costs would have been higher.
| | | | | | | | | | | |
| | | | | | | | |
| | | Actual | | Hypothetical
(5% return before expenses) | |
| Beginning
Account
Value
(7/1/22) | Ending
Account
Value
(12/31/22) | Expenses
Paid During
Period
(7/1/22 - 12/31/22)† | | Beginning
Account
Value
(7/1/22) | Ending
Account
Value
(12/31/22) | Expenses
Paid During
Period
(7/1/22 - 12/31/22)† | Net Annualized
Expense Ratio
(7/1/22 - 12/31/22) |
Institutional Shares | $1,000.00 | $1,024.40 | $4.75 | | $1,000.00 | $1,020.52 | $4.74 | 0.93% |
Service Shares | $1,000.00 | $1,024.60 | $4.85 | | $1,000.00 | $1,020.42 | $4.84 | 0.95% |
† | Expenses Paid During Period are equal to the Net Annualized Expense Ratio multiplied by the average account value over the period, multiplied by 184/365 (to reflect the one-half year period). Expenses in the examples include the effect of applicable fee waivers and/or expense reimbursements, if any. Had such waivers and/or reimbursements not been in effect, your expenses would have been higher. Please refer to the Notes to Financial Statements or the Portfolio’s prospectuses for more information regarding waivers and/or reimbursements. |
Janus Henderson VIT Global Sustainable Equity Portfolio
Schedule of Investments
December 31, 2022
| | | | | | | | |
Shares
| | | Value | |
Common Stocks– 98.5% | | | |
Auto Components – 1.8% | | | |
| | Aptiv PLC* | | 844 | | | $78,602 | |
Building Products – 1.0% | | | |
| | Advanced Drainage Systems Inc | | 545 | | | 44,674 | |
Containers & Packaging – 2.0% | | | |
| | DS Smith PLC | | 23,186 | | | 90,099 | |
Electric Utilities – 2.2% | | | |
| | SSE PLC | | 4,659 | | | 96,076 | |
Electrical Equipment – 6.0% | | | |
| | Legrand SA | | 1,345 | | | 108,281 | |
| | Nidec Corp | | 900 | | | 46,876 | |
| | Schneider Electric SE | | 785 | | | 110,386 | |
| | | 265,543 | |
Electronic Equipment, Instruments & Components – 8.6% | | | |
| | IPG Photonics Corp* | | 729 | | | 69,014 | |
| | Keyence Corp | | 200 | | | 78,313 | |
| | Murata Manufacturing Co Ltd | | 1,100 | | | 55,195 | |
| | Shimadzu Corp | | 2,400 | | | 68,464 | |
| | TE Connectivity Ltd | | 931 | | | 106,879 | |
| | | 377,865 | |
Entertainment – 1.9% | | | |
| | Nintendo Co Ltd | | 2,000 | | | 83,764 | |
Equity Real Estate Investment Trusts (REITs) – 3.5% | | | |
| | Crown Castle International Corp | | 398 | | | 53,985 | |
| | Equinix Inc | | 69 | | | 45,197 | |
| | Prologis Inc | | 483 | | | 54,449 | |
| | | 153,631 | |
Food Products – 0.5% | | | |
| | McCormick & Co Inc/MD | | 267 | | | 22,132 | |
Health Care Equipment & Supplies – 0.3% | | | |
| | Nanosonics Ltd* | | 4,673 | | | 13,621 | |
Health Care Providers & Services – 5.1% | | | |
| | Encompass Health Corp | | 1,586 | | | 94,859 | |
| | Humana Inc | | 257 | | | 131,633 | |
| | | 226,492 | |
Independent Power and Renewable Electricity Producers – 4.0% | | | |
| | Boralex Inc - Class A | | 3,594 | | | 106,243 | |
| | Innergex Renewable Energy Inc | | 5,816 | | | 69,596 | |
| | | 175,839 | |
Information Technology Services – 2.5% | | | |
| | Mastercard Inc | | 317 | | | 110,230 | |
Insurance – 14.0% | | | |
| | AIA Group Ltd | | 10,600 | | | 116,787 | |
| | Aon PLC - Class A | | 470 | | | 141,066 | |
| | Intact Financial Corp | | 889 | | | 127,992 | |
| | Marsh & McLennan Cos Inc | | 661 | | | 109,382 | |
| | Progressive Corp/The | | 940 | | | 121,927 | |
| | | 617,154 | |
Leisure Products – 1.5% | | | |
| | Shimano Inc | | 400 | | | 63,741 | |
Life Sciences Tools & Services – 2.4% | | | |
| | ICON PLC* | | 537 | | | 104,312 | |
Machinery – 9.0% | | | |
| | Evoqua Water Technologies Corp* | | 2,197 | | | 87,001 | |
| | Knorr-Bremse AG | | 1,222 | | | 66,766 | |
| | Wabtec Corp | | 1,438 | | | 143,527 | |
| | Xylem Inc/NY | | 878 | | | 97,080 | |
| | | 394,374 | |
Professional Services – 1.7% | | | |
| | Wolters Kluwer NV | | 721 | | | 75,304 | |
| | |
See Notes to Schedule of Investments and Other Information and Notes to Financial Statements. |
| |
8 | DECEMBER 31, 2022 |
Janus Henderson VIT Global Sustainable Equity Portfolio
Schedule of Investments
December 31, 2022
| | | | | | | | |
Shares
| | | Value | |
Common Stocks– (continued) | | | |
Semiconductor & Semiconductor Equipment – 10.6% | | | |
| | ASML Holding NV | | 142 | | | $76,854 | |
| | Lam Research Corp | | 167 | | | 70,190 | |
| | Microchip Technology Inc | | 1,763 | | | 123,851 | |
| | NVIDIA Corp | | 566 | | | 82,715 | |
| | Texas Instruments Inc | | 681 | | | 112,515 | |
| | | 466,125 | |
Software – 12.8% | | | |
| | Atlassian Corp - Class A* | | 384 | | | 49,413 | |
| | Autodesk Inc* | | 635 | | | 118,662 | |
| | Bill.com Holdings Inc* | | 224 | | | 24,407 | |
| | Cadence Design Systems Inc* | | 296 | | | 47,549 | |
| | Linklogis Inc - Class B (144A)* | | 21,000 | | | 10,830 | |
| | Microsoft Corp | | 1,074 | | | 257,567 | |
| | Workday Inc - Class A* | | 323 | | | 54,048 | |
| | | 562,476 | |
Specialty Retail – 1.3% | | | |
| | Home Depot Inc | | 184 | | | 58,118 | |
Textiles, Apparel & Luxury Goods – 1.9% | | | |
| | adidas AG | | 242 | | | 33,031 | |
| | NIKE Inc - Class B | | 442 | | | 51,718 | |
| | | 84,749 | |
Thrifts & Mortgage Finance – 1.6% | | | |
| | Walker & Dunlop Inc | | 918 | | | 72,045 | |
Wireless Telecommunication Services – 2.3% | | | |
| | T-Mobile US Inc* | | 733 | | | 102,620 | |
Total Common Stocks (cost $4,924,767) | | 4,339,586 | |
Investment Companies– 3.1% | | | |
Money Markets – 3.1% | | | |
| | Janus Henderson Cash Liquidity Fund LLC, 4.2633%ºº,£((cost $133,715) | | 133,702 | | | 133,729 | |
Total Investments (total cost $5,058,482) – 101.6% | | 4,473,315 | |
Liabilities, net of Cash, Receivables and Other Assets – (1.6)% | | (68,831) | |
Net Assets – 100% | | $4,404,484 | |
| | | | | | |
Summary of Investments by Country - (Long Positions) (unaudited) |
| |
| | | | | % of | |
| | | | | Investment | |
Country | | Value | | Securities | |
United States | | $2,870,784 | | 64.2 | % |
Japan | | 396,353 | | 8.9 | |
Canada | | 303,831 | | 6.8 | |
France | | 218,667 | | 4.9 | |
United Kingdom | | 186,175 | | 4.2 | |
Netherlands | | 152,158 | | 3.4 | |
Hong Kong | | 116,787 | | 2.6 | |
Ireland | | 104,312 | | 2.3 | |
Germany | | 99,797 | | 2.2 | |
Australia | | 13,621 | | 0.3 | |
China | | 10,830 | | 0.2 | |
| | |
See Notes to Schedule of Investments and Other Information and Notes to Financial Statements. |
| |
Janus Aspen Series | 9 |
Janus Henderson VIT Global Sustainable Equity Portfolio
Schedule of Investments
December 31, 2022
Schedules of Affiliated Investments – (% of Net Assets)
| | | | | | | | | | | |
| | Dividend Income | Realized Gain/(Loss) | Change in Unrealized Appreciation/ Depreciation | Value at 12/31/22 |
Investment Companies - 3.1% |
Money Markets - 3.1% | |
| | Janus Henderson Cash Liquidity Fund LLC, 4.2633%ºº | $ | 2,885 | $ | 4 | $ | 14 | $ | 133,729 |
| |
| | | | | | | | | | | |
| | Value at 1/26/22 | Purchases | Sales Proceeds | Value at 12/31/22 |
Investment Companies - 3.1% |
Money Markets - 3.1% | |
| | Janus Henderson Cash Liquidity Fund LLC, 4.2633%ºº | | - | | 5,525,740 | | (5,392,029) | | 133,729 |
| | |
See Notes to Schedule of Investments and Other Information and Notes to Financial Statements. |
| |
10 | DECEMBER 31, 2022 |
Janus Henderson VIT Global Sustainable Equity Portfolio
Notes to Schedule of Investments and Other Information
| | |
MSCI World IndexSM | MSCI World IndexSM reflects the equity market performance of global developed markets. |
| | |
LLC | Limited Liability Company |
PLC | Public Limited Company |
| | |
144A | Securities sold under Rule 144A of the Securities Act of 1933, as amended, are subject to legal and/or contractual restrictions on resale and may not be publicly sold without registration under the 1933 Act. Unless otherwise noted, these securities have been determined to be liquid under guidelines established by the Board of Trustees. The total value of 144A securities as of the period ended December 31, 2022 is $10,830, which represents 0.2% of net assets. |
| | |
* | Non-income producing security. |
| | |
ºº | Rate shown is the 7-day yield as of December 31, 2022. |
| | |
£ | The Portfolio may invest in certain securities that are considered affiliated companies. As defined by the Investment Company Act of 1940, as amended, an affiliated company is one in which the Portfolio owns 5% or more of the outstanding voting securities, or a company which is under common ownership or control. |
| | | | | | | | | | | | | |
The following is a summary of the inputs that were used to value the Portfolio’s investments in securities and other financial instruments as of December 31, 2022. See Notes to Financial Statements for more information. |
| |
Valuation Inputs Summary |
| | | | | | | |
| | | | | Level 2 - | | Level 3 - |
| | | Level 1 - | | Other Significant | | Significant |
| | | Quoted Prices | | Observable Inputs | | Unobservable Inputs |
| | | | | | | |
Assets | | | | | | |
Investments In Securities: | | | | | | |
Common Stocks | | | | | | |
Containers & Packaging | $ | - | $ | 90,099 | $ | - |
Electric Utilities | | - | | 96,076 | | - |
Electrical Equipment | | - | | 265,543 | | - |
Electronic Equipment, Instruments & Components | | 175,893 | | 201,972 | | - |
Entertainment | | - | | 83,764 | | - |
Health Care Equipment & Supplies | | - | | 13,621 | | - |
Insurance | | 500,367 | | 116,787 | | - |
Leisure Products | | - | | 63,741 | | - |
Machinery | | 327,608 | | 66,766 | | - |
Professional Services | | - | | 75,304 | | - |
Semiconductor & Semiconductor Equipment | | 389,271 | | 76,854 | | - |
Software | | 551,646 | | 10,830 | | - |
Textiles, Apparel & Luxury Goods | | 51,718 | | 33,031 | | - |
All Other | | 1,148,695 | | - | | - |
Investment Companies | | - | | 133,729 | | - |
Total Assets | $ | 3,145,198 | $ | 1,328,117 | $ | - |
| | | | | | | |
Janus Henderson VIT Global Sustainable Equity Portfolio
Statement of Assets and Liabilities
December 31, 2022
| | | | | | | |
| | | | | | |
Assets: | | | | |
| Unaffiliated investments, at value (cost $4,924,767) | | $ | 4,339,586 | |
| Affiliated investments, at value (cost $133,715) | | | 133,729 | |
| Cash denominated in foreign currency (cost $1,862) | | | 1,862 | |
| Receivables: | | | | |
| | Due from adviser | | | 7,754 | |
| | Dividends | | | 3,530 | |
| | Dividends from affiliates | | | 621 | |
| | Foreign tax reclaims | | | 271 | |
| Other assets | | | 44 | |
Total Assets | | | 4,487,397 | |
Liabilities: | | | | |
| Payables: | | | — | |
| | Professional fees | | | 42,329 | |
| | Investments purchased | | | 3,769 | |
| | Advisory fees | | | 3,050 | |
| | 12b-1 Distribution and shareholder servicing fees | | | 523 | |
| | Transfer agent fees and expenses | | | 426 | |
| | Custodian fees | | | 49 | |
| | Affiliated portfolio administration fees payable | | | 10 | |
| | Accrued expenses and other payables | | | 32,757 | |
Total Liabilities | | | 82,913 | |
Net Assets | | $ | 4,404,484 | |
Net Assets Consist of: | | | | |
| Capital (par value and paid-in surplus) | | $ | 5,151,179 | |
| Total distributable earnings (loss) | | | (746,695) | |
Total Net Assets | | $ | 4,404,484 | |
Net Assets - Institutional Shares | | $ | 2,139,569 | |
| Shares Outstanding, $0.001 Par Value (unlimited shares authorized) | | | 251,590 | |
Net Asset Value Per Share | | $ | 8.50 | |
Net Assets - Service Shares | | $ | 2,264,915 | |
| Shares Outstanding, $0.001 Par Value (unlimited shares authorized) | | | 266,107 | |
Net Asset Value Per Share | | $ | 8.51 | |
| | |
See Notes to Financial Statements. |
| |
12 | DECEMBER 31, 2022 |
Janus Henderson VIT Global Sustainable Equity Portfolio
Statement of Operations
For the period ended December 31, 2022(1)
| | | | | | |
| | | | | |
Investment Income: | | | |
| Dividends | $ | 59,311 | |
| Dividends from affiliates | | 2,885 | |
| Other income | | 1,156 | |
| Foreign tax withheld | | (4,069) | |
Total Investment Income | | 59,283 | |
Expenses: | | | |
| Advisory fees | | 32,021 | |
| 12b-1 Distribution and shareholder servicing fees: | | | |
| | Service Shares | | 598 | |
| Transfer agent administrative fees and expenses: | | | |
| | Institutional Shares | | 1,056 | |
| | Service Shares | | 1,079 | |
| Other transfer agent fees and expenses: | | | |
| | Institutional Shares | | 449 | |
| | Service Shares | | 445 | |
| Registration fees | | 76,240 | |
| Professional fees | | 46,185 | |
| Non-affiliated portfolio administration fees | | 39,332 | |
| Shareholder reports expense | | 6,719 | |
| Custodian fees | | 3,316 | |
| Affiliated portfolio administration fees | | 107 | |
| Trustees’ fees and expenses | | 106 | |
| Other expenses | | 847 | |
Total Expenses | | 208,500 | |
Less: Excess Expense Reimbursement and Waivers | | (168,582) | |
Net Expenses | | 39,918 | |
Net Investment Income/(Loss) | | 19,365 | |
Net Realized Gain/(Loss) on Investments: | | | |
| Investments and foreign currency transactions | | (156,606) | |
| Investments in affiliates | | 4 | |
Total Net Realized Gain/(Loss) on Investments | | (156,602) | |
Change in Unrealized Net Appreciation/Depreciation: | | | |
| Investments, foreign currency translations and Trustees’ deferred compensation | | (585,222) | |
| Investments in affiliates | | 14 | |
Total Change in Unrealized Net Appreciation/Depreciation | | (585,208) | |
Net Increase/(Decrease) in Net Assets Resulting from Operations | $ | (722,445) | |
| | | | | |
| |
(1) Period from January 26, 2022 (inception date) through December 31, 2022. |
| | |
See Notes to Financial Statements. |
| |
Janus Aspen Series | 13 |
Janus Henderson VIT Global Sustainable Equity Portfolio
Statements of Changes in Net Assets
| | | | | | |
| | | | | |
| | | Period ended
December 31, 2022(1) | |
| | | | | | |
Operations: | | | |
| Net investment income/(loss) | $ | 19,365 | |
| Net realized gain/(loss) on investments | | (156,602) | |
| Change in unrealized net appreciation/depreciation | | (585,208) | |
Net Increase/(Decrease) in Net Assets Resulting from Operations | | (722,445) | |
Dividends and Distributions to Shareholders: | | | |
| | Institutional Shares | | (13,979) | |
| | Service Shares | | (12,468) | |
Net Decrease from Dividends and Distributions to Shareholders | | (26,447) | |
Capital Share Transactions: | | | |
| | Institutional Shares | | 2,513,980 | |
| | Service Shares | | 2,639,396 | |
Net Increase/(Decrease) from Capital Share Transactions | | 5,153,376 | |
Net Increase/(Decrease) in Net Assets | | 4,404,484 | |
Net Assets: | | | |
| Beginning of period | | — | |
| End of period | $ | 4,404,484 | |
| | | | | |
| |
(1) Period from January 26, 2022 (inception date) through December 31, 2022. |
| | |
See Notes to Financial Statements. |
| |
14 | DECEMBER 31, 2022 |
Janus Henderson VIT Global Sustainable Equity Portfolio
Financial Highlights
| | | | | | | |
Institutional Shares | | | |
For a share outstanding during the period ended December 31 | | 2022(1) | |
| Net Asset Value, Beginning of Period | | $10.00 | |
| Income/(Loss) from Investment Operations: | | | |
| | Net investment income/(loss)(2) | | 0.04 | |
| | Net realized and unrealized gain/(loss) | | (1.48) | |
| Total from Investment Operations | | (1.44) | |
| Less Dividends and Distributions: | | | |
| | Dividends (from net investment income) | | (0.06) | |
| Total Dividends and Distributions | | (0.06) | |
| Net Asset Value, End of Period | | $8.50 | |
| Total Return* | | (14.46)% | |
| Net Assets, End of Period (in thousands) | | $2,140 | |
| Average Net Assets for the Period (in thousands) | | $2,254 | |
| Ratios to Average Net Assets**: | | | |
| | Ratio of Gross Expenses | | 4.91% | |
| | Ratio of Net Expenses (After Waivers and Expense Offsets) | | 0.93% | |
| | Ratio of Net Investment Income/(Loss) | | 0.47% | |
| Portfolio Turnover Rate | | 15% | |
| | | | | | | |
| |
* Total return includes adjustments in accordance with generally accepted accounting principles required at the year or period end and are not annualized for periods of less than one full year. Total return does not include fees, charges, or expenses imposed by the variable annuity and life insurance contracts for which Janus Aspen Series serves as an underlying investment vehicle. ** Annualized for periods of less than one full year. (1) Period from January 26, 2022 (inception date) through December 31, 2022. (2) Per share amounts are calculated based on average shares outstanding during the year or period. |
| | |
See Notes to Financial Statements. |
| |
Janus Aspen Series | 15 |
Janus Henderson VIT Global Sustainable Equity Portfolio
Financial Highlights
| | | | | | | |
Service Shares | | | |
For a share outstanding during the period ended December 31 | | 2022(1) | |
| Net Asset Value, Beginning of Period | | $10.00 | |
| Income/(Loss) from Investment Operations: | | | |
| | Net investment income/(loss)(2) | | 0.04 | |
| | Net realized and unrealized gain/(loss) | | (1.48) | |
| Total from Investment Operations | | (1.44) | |
| Less Dividends and Distributions: | | | |
| | Dividends (from net investment income) | | (0.05) | |
| Total Dividends and Distributions | | (0.05) | |
| Net Asset Value, End of Period | | $8.51 | |
| Total Return* | | (14.44)% | |
| Net Assets, End of Period (in thousands) | | $2,265 | |
| Average Net Assets for the Period (in thousands) | | $2,303 | |
| Ratios to Average Net Assets**: | | | |
| | Ratio of Gross Expenses | | 4.91% | |
| | Ratio of Net Expenses (After Waivers and Expense Offsets) | | 0.95% | |
| | Ratio of Net Investment Income/(Loss) | | 0.44% | |
| Portfolio Turnover Rate | | 15% | |
| | | | | | | |
| |
* Total return includes adjustments in accordance with generally accepted accounting principles required at the year or period end and are not annualized for periods of less than one full year. Total return does not include fees, charges, or expenses imposed by the variable annuity and life insurance contracts for which Janus Aspen Series serves as an underlying investment vehicle. ** Annualized for periods of less than one full year. (1) Period from January 26, 2022 (inception date) through December 31, 2022. (2) Per share amounts are calculated based on average shares outstanding during the year or period. |
| | |
See Notes to Financial Statements. |
| |
16 | DECEMBER 31, 2022 |
Janus Henderson VIT Global Sustainable Equity Portfolio
Notes to Financial Statements
1. Organization and Significant Accounting Policies
Janus Henderson VIT Global Sustainable Equity Portfolio (the “Portfolio”) is a series of Janus Aspen Series (the “Trust”), which is organized as a Delaware statutory trust and is registered under the Investment Company Act of 1940, as amended (the “1940 Act”), as an open-end management investment company, and therefore has applied the specialized accounting and reporting guidance in Financial Accounting Standards Board (“FASB”) Accounting Standards Codification (“ASC”) Topic 946. The Trust offers 11 portfolios, each of which offers multiple share classes, with differing investment objectives and policies. The Portfolio seeks long-term growth of capital. The Portfolio is classified as diversified, as defined in the 1940 Act. Janus Henderson Investors US LLC is the investment adviser (the “Adviser”) to the Portfolio.
The Portfolio currently offers two classes of shares: Institutional Shares and Service Shares. Each class represents an interest in the same portfolio of investments. Institutional Shares are offered only in connection with investment in and payments under variable insurance contracts as well as certain qualified retirement plans. Service Shares are offered only in connection with investment in and payments under variable insurance contracts as well as certain qualified retirement plans that require a fee from Portfolio assets to procure distribution and administrative services to contract owners and plan participants.
Shareholders, including participating insurance companies, as well as accounts, may from time to time own (beneficially or of record) a significant percentage of the Portfolio’s Shares and can be considered to “control” the Portfolio when that ownership exceeds 25% of the Portfolio’s assets (and which may differ from control as determined in accordance with United States of America generally accepted accounting principles ("US GAAP")).
The following accounting policies have been followed by the Portfolio and are in conformity with US GAAP.
Investment Valuation
Portfolio holdings are valued in accordance with policies and procedures established by the Adviser pursuant to Rule 2a-5 under the 1940 Act and approved by and subject to the oversight of the Trustees (the “Valuation Procedures”). Equity securities traded on a domestic securities exchange are generally valued at readily available market quotations, which are (i) the official close prices or (ii) last sale prices on the primary market or exchange in which the securities trade. If such price is lacking for the trading period immediately preceding the time of determination, such securities are generally valued at their current bid price. Equity securities that are traded on a foreign exchange are generally valued at the closing prices on such markets. In the event that there is no current trading volume on a particular security in such foreign exchange, the bid price from the primary exchange is generally used to value the security. Foreign securities and currencies are converted to U.S. dollars using the current spot USD dollar exchange rate in effect at the close of the New York Stock Exchange (“NYSE”). The Portfolio will determine the market value of individual securities held by it by using prices provided by one or more approved professional pricing services or, as needed, by obtaining market quotations from independent broker-dealers. Most debt securities are valued in accordance with the evaluated bid price supplied by the Adviser-approved pricing service that is intended to reflect market value. The evaluated bid price supplied by the pricing service is an evaluation that may consider factors such as security prices, yields, maturities and ratings. Certain short-term securities maturing within 60 days or less may be evaluated and valued on an amortized cost basis provided that the amortized cost determined approximates market value. Securities for which market quotations or evaluated prices are not readily available or deemed unreliable are valued at fair value determined in good faith by the Adviser pursuant to the Valuation Procedures. Circumstances in which fair valuation may be utilized include, but are not limited to: (i) a significant event that may affect the securities of a single issuer, such as a merger, bankruptcy, or significant issuer-specific development; (ii) an event that may affect an entire market, such as a natural disaster or significant governmental action; (iii) a nonsignificant event such as a market closing early or not opening, or a security trading halt; and (iv) pricing of a nonvalued security and a restricted or nonpublic security. Special valuation considerations may apply with respect to “odd-lot” fixed-income transactions which, due to their small size, may receive evaluated prices by pricing services which reflect a large block trade and not what actually could be obtained for the odd-lot position. The valuation policies provide for the use of systematic fair valuation models provided by independent pricing services to value foreign equity securities in order to adjust for stale pricing, which may occur between the close of certain foreign exchanges and the close of the NYSE. The value of the securities of other mutual funds held by a Portfolio, if any, will be calculated using the NAV of such mutual funds.
Janus Henderson VIT Global Sustainable Equity Portfolio
Notes to Financial Statements
Valuation Inputs Summary
FASB ASC 820, Fair Value Measurements and Disclosures (“ASC 820”), defines fair value, establishes a framework for measuring fair value, and expands disclosure requirements regarding fair value measurements. This standard emphasizes that fair value is a market-based measurement that should be determined based on the assumptions that market participants would use in pricing an asset or liability and establishes a hierarchy that prioritizes inputs to valuation techniques used to measure fair value. These inputs are summarized into three broad levels:
Level 1 – Unadjusted quoted prices in active markets the Portfolio has the ability to access for identical assets or liabilities.
Level 2 – Observable inputs other than unadjusted quoted prices included in Level 1 that are observable for the asset or liability either directly or indirectly. These inputs may include quoted prices for the identical instrument on an inactive market, prices for similar instruments, interest rates, prepayment speeds, credit risk, yield curves, default rates and similar data.
Assets or liabilities categorized as Level 2 in the hierarchy generally include: debt securities fair valued in accordance with the evaluated bid or ask prices supplied by a pricing service; securities traded on OTC markets and listed securities for which no sales are reported that are fair valued at the latest bid price (or yield equivalent thereof) obtained from one or more dealers transacting in a market for such securities or by a pricing service approved by the Portfolio’s Trustees; certain short-term debt securities with maturities of 60 days or less that are fair valued at amortized cost; and equity securities of foreign issuers whose fair value is determined by using systematic fair valuation models provided by independent third parties in order to adjust for stale pricing which may occur between the close of certain foreign exchanges and the close of the NYSE. Other securities that may be categorized as Level 2 in the hierarchy include, but are not limited to, preferred stocks, bank loans, swaps, investments in unregistered investment companies, options, and forward contracts.
Level 3 – Unobservable inputs for the asset or liability to the extent that relevant observable inputs are not available, representing the Portfolio’s own assumptions about the assumptions that a market participant would use in valuing the asset or liability, and that would be based on the best information available.
There have been no significant changes in valuation techniques used in valuing any such positions held by the Portfolio since the beginning of the fiscal period.
The inputs or methodology used for fair valuing securities are not necessarily an indication of the risk associated with investing in those securities. The summary of inputs used as of December 31, 2022 to fair value the Portfolio’s investments in securities and other financial instruments is included in the “Valuation Inputs Summary” in the Notes to Schedule of Investments and Other Information.
Investment Transactions and Investment Income
Investment transactions are accounted for as of the date purchased or sold (trade date). Dividend income is recorded on the ex-dividend date. Certain dividends from foreign securities will be recorded as soon as the Portfolio is informed of the dividend, if such information is obtained subsequent to the ex-dividend date. Dividends from foreign securities may be subject to withholding taxes in foreign jurisdictions. Non-cash dividends, if any, are recorded on the ex-dividend date at fair value. Interest income is recorded daily on the accrual basis and includes amortization of premiums and accretion of discounts. The Portfolio classifies gains and losses on prepayments received as an adjustment to interest income. Debt securities may be placed in non-accrual status and related interest income may be reduced by stopping current accruals and writing off interest receivables when collection of all or a portion of interest has become doubtful. Gains and losses are determined on the identified cost basis, which is the same basis used for federal income tax purposes. Income, as well as gains and losses, both realized and unrealized, are allocated daily to each class of shares based upon the ratio of net assets represented by each class as a percentage of total net assets.
Expenses
The Portfolio bears expenses incurred specifically on its behalf. Each class of shares bears a portion of general expenses, which are allocated daily to each class of shares based upon the ratio of net assets represented by each class as a percentage of total net assets. Expenses directly attributable to a specific class of shares are charged against the operations of such class.
Janus Henderson VIT Global Sustainable Equity Portfolio
Notes to Financial Statements
Estimates
The preparation of financial statements in conformity with US GAAP requires management to make estimates and assumptions that affect the reported amount of assets and liabilities and disclosure of contingent assets and liabilities at the date of the financial statements, and the reported amounts of income and expenses during the reporting period. Actual results could differ from those estimates.
Indemnifications
In the normal course of business, the Portfolio may enter into contracts that contain provisions for indemnification of other parties against certain potential liabilities. The Portfolio’s maximum exposure under these arrangements is unknown, and would involve future claims that may be made against the Portfolio that have not yet occurred. Currently, the risk of material loss from such claims is considered remote.
Foreign Currency Translations
The Portfolio does not isolate that portion of the results of operations resulting from the effect of changes in foreign exchange rates on investments from the fluctuations arising from changes in market prices of securities held at the date of the financial statements. Net unrealized appreciation or depreciation of investments and foreign currency translations arise from changes in the value of assets and liabilities, including investments in securities held at the date of the financial statements, resulting from changes in the exchange rates and changes in market prices of securities held.
Currency gains and losses are also calculated on payables and receivables that are denominated in foreign currencies. The payables and receivables are generally related to foreign security transactions and income translations.
Foreign currency-denominated assets and forward currency contracts may involve more risks than domestic transactions, including currency risk, counterparty risk, political and economic risk, regulatory risk and equity risk. Risks may arise from unanticipated movements in the value of foreign currencies relative to the U.S. dollar.
Dividends and Distributions
The Portfolio may make semiannual distributions of substantially all of its investment income and an annual distribution of its net realized capital gains (if any).
The Portfolio may make certain investments in real estate investment trusts (“REITs”) which pay dividends to their shareholders based upon funds available from operations. It is quite common for these dividends to exceed the REITs’ taxable earnings and profits, resulting in the excess portion of such dividends being designated as a return of capital. If the Portfolio distributes such amounts, such distributions could constitute a return of capital to shareholders for federal income tax purposes.
Federal Income Taxes
The Portfolio intends to continue to qualify as a regulated investment company and distribute all of its taxable income in accordance with the requirements of Subchapter M of the Internal Revenue Code. Management has analyzed the Portfolio’s tax positions taken for all open federal income tax years, generally a three-year period, and has concluded that no provision for federal income tax is required in the Portfolio’s financial statements. The Portfolio is not aware of any tax positions for which it is reasonably possible that the total amounts of unrecognized tax benefits will significantly change in the next twelve months.
2. Other Investments and Strategies
Additional Investment Risk
The U.S. government and the Federal Reserve, as well as certain foreign governments and central banks, have taken extraordinary actions to support local and global economies and the financial markets in response to the COVID-19 pandemic. This and other government intervention into the economy and financial markets to address the COVID-19 pandemic may not work as intended, particularly if the efforts are perceived by investors as being unlikely to achieve the desired results. Government actions to mitigate the economic impact of the pandemic have resulted in a large expansion of government deficits and debt, the long term consequences of which are not known. The COVID-19 pandemic could adversely affect the value and liquidity of a Portfolio’s investments, impair a Portfolio’s ability to satisfy redemption requests, and negatively impact a Portfolio’s performance. In addition, the outbreak of COVID-19, and measures taken to mitigate its effects, could result in disruptions to the services provided to a Portfolio by its service providers.
Janus Henderson VIT Global Sustainable Equity Portfolio
Notes to Financial Statements
Widespread disease, including pandemics and epidemics, and natural or environmental disasters, including those which may be attributable to global climate change, such as earthquakes, fires, floods, hurricanes, tsunamis and weather-related phenomena generally, have been and can be highly disruptive to economies and markets, adversely impacting individual companies, sectors, industries, markets, currencies, interest and inflation rates, credit ratings, investor sentiment, and other factors affecting the value of a Portfolio’s investments. Economies and financial markets throughout the world have become increasingly interconnected, which increases the likelihood that events or conditions in one region or country will adversely affect markets or issuers in other regions or countries, including the United States. These disruptions could prevent a Portfolio from executing advantageous investment decisions in a timely manner and negatively impact a Portfolio’s ability to achieve its investment objective(s). Any such event(s) could have a significant adverse impact on the value of a Portfolio. In addition, these disruptions could also impair the information technology and other operational systems upon which the Portfolio’s service providers, including the Adviser or the subadviser (as applicable), rely, and could otherwise disrupt the ability of employees of the Portfolio’s service providers to perform essential tasks on behalf of the Portfolio. Adverse weather conditions may also have a particularly significant negative effect on issuers in the agricultural sector and on insurance and reinsurance companies that insure or reinsure against the impact of natural disasters.
A number of countries in the European Union (the “EU”) have experienced, and may continue to experience, severe economic and financial difficulties. In particular, many EU nations are susceptible to economic risks associated with high levels of debt. Many non-governmental issuers, and even certain governments, have defaulted on, or been forced to restructure, their debts. Many other issuers have faced difficulties obtaining credit or refinancing existing obligations. Financial institutions have in many cases required government or central bank support, have needed to raise capital, and/or have been impaired in their ability to extend credit. As a result, financial markets in the EU have experienced extreme volatility and declines in asset values and liquidity. These difficulties may continue, worsen, or spread further within the EU. Responses to these financial problems by European governments, central banks, and others, including austerity measures and reforms, may not work, may result in social unrest, and may limit future growth and economic recovery or have other unintended consequences. Among other things, these developments have adversely affected the value and exchange rate of the euro and pound sterling, and may continue to significantly affect the economies of all EU countries, which in turn may have a material adverse effect on the Portfolio’s investments in such countries, other countries that depend on EU countries for significant amounts of trade or investment, or issuers with exposure to debt issued by certain EU countries.
Real Estate Investing
The Portfolio may invest in equity and debt securities of real estate-related companies. Such companies may include those in the real estate industry or real estate-related industries. These securities may include common stocks, corporate bonds, preferred stocks, and other equity securities, including, but not limited to, mortgage-backed securities, real estate-backed securities, securities of REITs and similar REIT-like entities. A REIT is a trust that invests in real estate-related projects, such as properties, mortgage loans, and construction loans. REITs are generally categorized as equity, mortgage, or hybrid REITs. A REIT may be listed on an exchange or traded OTC.
3. Investment Advisory Agreements and Other Transactions with Affiliates
The Portfolio pays the Adviser an investment advisory fee which is calculated daily and paid monthly. The following table reflects the Portfolio’s contractual investment advisory fee rate (expressed as an annual rate).
| | |
Average Daily Net Assets of the Portfolio | Contractual Investment Advisory Fee (%) |
First $2 Billion | 0.75 |
Over $2 Billion | 0.70 |
The Portfolio’s actual investment advisory fee rate for the reporting period was 0.75% of average annual net assets before any applicable waivers.
The Adviser has contractually agreed to waive the investment advisory fee and/or reimburse operating expenses to the extent that the Portfolio’s total annual fund operating expenses, excluding the fees payable pursuant to a Rule 12b-1 plan, shareholder servicing fees, such as transfer agency fees, brokerage commissions, interest, dividends, taxes, acquired fund fees and expenses, and extraordinary expenses, exceed 0.85% of the Portfolio’s average daily net assets. The Adviser has agreed to continue the waiver until at least April 30, 2023. If applicable, amounts waived and/or
Janus Henderson VIT Global Sustainable Equity Portfolio
Notes to Financial Statements
reimbursed to the Portfolio by the Adviser are disclosed as “Excess Expense Reimbursement and Waivers” on the Statement of Operations.
For a period of three years subsequent to the Portfolio’s commencement of operations, or until the Portfolio’s assets meet the first breakpoint in the investment advisory fee schedule, whichever occurs first, the Adviser may recover from the Portfolio fees and expenses previously waived or reimbursed, if the Portfolio’s expense ratio, including recovered expenses, falls below the expense limit. If applicable, this amount is disclosed as “Recoupment expense” on the Statement of Operations. During the period ended December 31, 2022, the Adviser reimbursed the Portfolio $168,582 of fees and expense that are eligible for recoupment. As of December 31, 2022, the aggregate amount of recoupment that may potentially be made to the Adviser is $168,582. The recoupment of such reimbursements expires at the latest January 26, 2025.
The Adviser serves as administrator to the Portfolio pursuant to an administration agreement between the Adviser and the Trust. Under the administration agreement, the Adviser is authorized to perform, or cause others to perform certain administration, compliance, and accounting services to the Portfolio, including providing office space for the Portfolio, and is reimbursed by the Portfolio for certain of its costs in providing these services (to the extent the Adviser seeks reimbursement and such costs are not otherwise waived). In addition, employees of the Adviser and/or its affiliates may serve as officers of the Trust. The Portfolio pays for some or all of the salaries, fees, and expenses of the Adviser employees and Portfolio officers, with respect to certain specified administration functions they perform on behalf of the Portfolio. The Portfolio pays these costs based on out-of-pocket expenses incurred by the Adviser, and these costs are separate and apart from advisory fees and other expenses paid in connection with the investment advisory services the Adviser (or any subadvisor, as applicable) provides to the Portfolio. These amounts are disclosed as “Affiliated portfolio administration fees” on the Statement of Operations. In addition, some expenses related to compensation payable to the Portfolio’s Chief Compliance Officer and certain compliance staff, all of whom are employees of the Adviser and/or its affiliates, are shared with the Portfolio. Total compensation of $48,451 was paid to the Chief Compliance Officer and certain compliance staff by the Trust during the period ended December 31, 2022. The Portfolio's portion is reported as part of “Other expenses” on the Statement of Operations.
Janus Henderson Services US LLC (the “Transfer Agent”), a wholly-owned subsidiary of the Adviser, is the Portfolio’s transfer agent. The Transfer Agent receives an administrative services fee at an annual rate of 0.05% of the average daily net assets of the Portfolio for arranging for the provision by participating insurance companies and qualified plan service providers of administrative services, including, but not limited to, recordkeeping, subaccounting, answering inquiries regarding accounts, order processing, transaction confirmations, the mailing of prospectuses and shareholder reports, and other shareholder services provided on behalf of contract holders or plan participants investing in the Portfolio. The Transfer Agent expects to use this entire fee to compensate insurance companies and qualified plan service providers for providing these services to their customers who invest in the Portfolio.
The Transfer Agent is not compensated for internal services related to the shares, except for out-of-pocket costs. These amounts are disclosed as “Other transfer agent fees and expenses” on the Statement of Operations.
Under a distribution and shareholder servicing plan (the “Plan”) adopted in accordance with Rule 12b-1 under the 1940 Act, the Service Shares may pay the Trust’s distributor, Janus Henderson Distributors US LLC (the “Distributor”), a wholly-owned subsidiary of the Adviser, a fee for the sale and distribution and/or shareholder servicing of the Service Shares at an annual rate of up to 0.25% of the average daily net assets of the Service Shares. Under the terms of the Plan, the Trust is authorized to make payments to the Distributor for remittance to insurance companies and qualified plan service providers as compensation for distribution and/or shareholder services performed by such entities. These amounts are disclosed as “12b-1 Distribution and shareholder servicing fees” on the Statement of Operations.
The Board of Trustees has adopted a deferred compensation plan (the “Deferred Plan”) for independent Trustees to elect to defer receipt of all or a portion of the annual compensation they are entitled to receive from the Portfolio. All deferred fees are credited to an account established in the name of the Trustees. The amounts credited to the account then increase or decrease, as the case may be, in accordance with the performance of one or more of the Janus Henderson funds that are selected by the Trustees. The account balance continues to fluctuate in accordance with the performance of the selected fund or funds until final payment of all amounts are credited to the account. The fluctuation of the account balance is recorded by the Portfolio as unrealized appreciation/(depreciation) and is included as of December 31, 2022 on the Statement of Assets and Liabilities in the asset, “Trustees’ deferred compensation,” and liability, “Trustees’ deferred compensation fees.” Additionally, the recorded unrealized appreciation/(depreciation) is
Janus Henderson VIT Global Sustainable Equity Portfolio
Notes to Financial Statements
included in “Total distributable earnings (loss)” on the Statement of Assets and Liabilities. Deferred compensation expenses for the period ended December 31, 2022 are included in “Trustees’ fees and expenses” on the Statement of Operations. Trustees are allowed to change their designation of mutual funds from time to time. Amounts will be deferred until distributed in accordance with the Deferred Plan. Deferred fees of $433,851 were paid by the Trust to the Trustees under the Deferred Plan during the period ended December 31, 2022.
Pursuant to the provisions of the 1940 Act and related rules, the Portfolio may participate in an affiliated or non-affiliated cash sweep program. In the cash sweep program, uninvested cash balances of the Portfolio may be used to purchase shares of affiliated or non-affiliated money market funds or cash management pooled investment vehicles that operate as money market funds. The Portfolio is eligible to participate in the cash sweep program (the “Investing Funds”). The Adviser has an inherent conflict of interest because of its fiduciary duties to the affiliated money market funds or cash management pooled investment vehicles and the Investing Funds. Janus Henderson Cash Liquidity Fund LLC (the “Sweep Vehicle”) is an affiliated unregistered cash management pooled investment vehicle that invests primarily in highly-rated short-term fixed-income securities. The Sweep Vehicle operates pursuant to the provisions of the 1940 Act that govern the operation of money market funds and prices its shares at NAV reflecting market-based values of its portfolio securities (i.e., a “floating” NAV) rounded to the fourth decimal place (e.g., $1.0000). The Sweep Vehicle is permitted to impose a liquidity fee (of up to 2%) on redemptions from the Sweep Vehicle or a redemption gate that temporarily suspends redemptions from the Sweep Vehicle for up to 10 business days during a 90 day period. There are no restrictions on the Portfolio's ability to withdraw investments from the Sweep Vehicle at will, and there are no unfunded capital commitments due from the Portfolio to the Sweep Vehicle. The Sweep Vehicle does not charge any management fee, sales charge or service fee.
Any purchases and sales, realized gains/losses and recorded dividends from affiliated investments during the period ended December 31, 2022 can be found in the “Schedules of Affiliated Investments” located in the Schedule of Investments.
As of December 31, 2022, shares of the Portfolio were owned by affiliates of the Adviser, and/or other funds advised by the Adviser, as indicated in the table below:
| | | | | | |
Class | % of Class Owned | | % of Portfolio Owned | | |
Institutional Shares | 100 | % | 49 | % | |
Service Shares | 94 | | 49 | | |
| | | | | | |
4. Federal Income Tax
The tax components of capital shown in the table below represent: (1) distribution requirements the Portfolio must satisfy under the income tax regulations; (2) losses or deductions the Portfolio may be able to offset against income and gains realized in future years; and (3) unrealized appreciation or depreciation of investments for federal income tax purposes.
Other book to tax differences primarily consist of deferred compensation. The Portfolio has elected to treat gains and losses on forward foreign currency contracts as capital gains and losses, if applicable. Other foreign currency gains and losses on debt instruments are treated as ordinary income for federal income tax purposes pursuant to Section 988 of the Internal Revenue Code.
| | | | | | | |
| | | | Other Book | Net Tax | |
Undistributed
Ordinary Income | Undistributed
Long-Term Gains | Accumulated
Capital Losses | Loss Deferrals | to Tax
Differences | Appreciation/
(Depreciation) | |
$ - | $ - | $ (161,227) | $ - | $ (41) | $ (585,427) | |
Accumulated capital losses noted below represent net capital loss carryovers, as of December 31, 2022, that may be available to offset future realized capital gains and thereby reduce future taxable gains distributions. The following table shows these capital loss carryovers.
Janus Henderson VIT Global Sustainable Equity Portfolio
Notes to Financial Statements
| | | | | | |
Capital Loss Carryover Schedule | | |
For the year ended December 31, 2022 | | |
| No Expiration | | | |
| Short-Term | Long-Term | Accumulated
Capital Losses | | |
| $ (161,227) | $ - | $ (161,227) | | |
The aggregate cost of investments and the composition of unrealized appreciation and depreciation of investment securities for federal income tax purposes as of December 31, 2022 are noted below. The primary difference between book and tax appreciation or depreciation of investments are wash sale loss deferrals.
| | | | |
Federal Tax Cost | Unrealized
Appreciation | Unrealized
(Depreciation) | Net Tax Appreciation/
(Depreciation) |
$ 5,058,742 | $ 157,054 | $ (742,481) | $ (585,427) |
Income and capital gains distributions are determined in accordance with income tax regulations that may differ from US GAAP. These differences are due to differing treatments for items such as net short-term gains, deferral of wash sale losses, foreign currency transactions, and capital loss carryovers. Certain permanent differences such as tax returns of capital and net investment losses noted below have been reclassified to capital.
| | | | | |
For the period ended December 31, 2022 | |
Distributions | | |
From Ordinary Income | From Long-Term Capital Gains | Tax Return of Capital | Net Investment Loss | |
$ 26,447 | $ - | $ - | $ - | |
Permanent book to tax basis differences may result in reclassifications between the components of net assets. These differences have no impact on the results of operations or net assets.
5. Capital Share Transactions
| | | | |
| | | |
| | Period ended December 31, 2022(1) |
| | Shares | Amount |
| | | | |
Institutional Shares: | | |
Shares sold | 250,000 | $2,500,001 |
Reinvested dividends and distributions | 1,590 | 13,979 |
Shares repurchased | - | - |
Net Increase/(Decrease) | 251,590 | $2,513,980 |
Service Shares: | | |
Shares sold | 269,110 | $2,665,640 |
Reinvested dividends and distributions | 1,418 | 12,468 |
Shares repurchased | (4,421) | (38,712) |
Net Increase/(Decrease) | 266,107 | $2,639,396 |
(1) | Period from January 26, 2022 (inception date) through December 31, 2022. |
Janus Henderson VIT Global Sustainable Equity Portfolio
Notes to Financial Statements
6. Purchases and Sales of Investment Securities
For the period ended December 31, 2022, the aggregate cost of purchases and proceeds from sales of investment securities (excluding any short-term securities, short-term options contracts, TBAs, and in-kind transactions, as applicable) was as follows:
| | | | |
Purchases of
Securities | Proceeds from Sales
of Securities | Purchases of Long-
Term U.S. Government
Obligations | Proceeds from Sales
of Long-Term U.S.
Government Obligations |
$ 5,717,130 | $ 630,854 | $ - | $ - |
7. Subsequent Event
Management has evaluated whether any events or transactions occurred subsequent to December 31, 2022 and through the date of issuance of the Portfolio’s financial statements and determined that there were no material events or transactions that would require recognition or disclosure in the Portfolio’s financial statements.
Janus Henderson VIT Global Sustainable Equity Portfolio
Report of Independent Registered Public Accounting Firm
To the Board of Trustees of Janus Aspen Series and Shareholders of Janus Henderson VIT Global Sustainable Equity Portfolio
Opinion on the Financial Statements
We have audited the accompanying statement of assets and liabilities, including the schedule of investments, of Janus Henderson VIT Global Sustainable Equity Portfolio (one of the portfolios constituting Janus Aspen Series, referred to hereafter as the "Portfolio") as of December 31, 2022, and the related statements of operations and changes in net assets, including the related notes, and the financial highlights for the period January 26, 2022 (commencement of operations) through December 31, 2022 (collectively referred to as the “financial statements”). In our opinion, the financial statements present fairly, in all material respects, the financial position of the Portfolio as of December 31, 2022, and the results of its operations, changes in its net assets and the financial highlights for the period January 26, 2022 (commencement of operations) through December 31, 2022 in conformity with accounting principles generally accepted in the United States of America.
Basis for Opinion
These financial statements are the responsibility of the Portfolio’s management. Our responsibility is to express an opinion on the Portfolio’s financial statements based on our audit. We are a public accounting firm registered with the Public Company Accounting Oversight Board (United States) (PCAOB) and are required to be independent with respect to the Portfolio in accordance with the U.S. federal securities laws and the applicable rules and regulations of the Securities and Exchange Commission and the PCAOB.
We conducted our audit of these financial statements in accordance with the standards of the PCAOB. Those standards require that we plan and perform the audit to obtain reasonable assurance about whether the financial statements are free of material misstatement, whether due to error or fraud.
Our audit included performing procedures to assess the risks of material misstatement of the financial statements, whether due to error or fraud, and performing procedures that respond to those risks. Such procedures included examining, on a test basis, evidence regarding the amounts and disclosures in the financial statements. Our audit also included evaluating the accounting principles used and significant estimates made by management, as well as evaluating the overall presentation of the financial statements. Our procedures included confirmation of securities owned as of December 31, 2022 by correspondence with the custodian and brokers; when replies were not received from brokers, we performed other auditing procedures. We believe that our audit provides a reasonable basis for our opinion.

Denver, Colorado
February 15, 2023
We have served as the auditor of one or more investment companies in Janus Henderson Funds since 1990.
Janus Henderson VIT Global Sustainable Equity Portfolio
Additional Information (unaudited)
Proxy Voting Policies and Voting Record
A description of the policies and procedures that the Portfolio uses to determine how to vote proxies relating to its portfolio securities is available without charge: (i) upon request, by calling 1-800-525-1093; (ii) on the Portfolio’s website at janushenderson.com/proxyvoting; and (iii) on the SEC’s website at http://www.sec.gov. Additionally, information regarding the Portfolio’s proxy voting record for the most recent twelve-month period ended June 30 is also available, free of charge, through janushenderson.com/proxyvoting and from the SEC’s website at http://www.sec.gov.
Full Holdings
The Portfolio files its complete portfolio holdings (schedule of investments) with the SEC as an exhibit to Form N-PORT within 60 days of the end of the first and third fiscal quarters, and in the annual report and semiannual report to shareholders. The Portfolio’s Form N-PORT filings and annual and semiannual reports: (i) are available on the SEC’s website at http://www.sec.gov; and (ii) are available without charge, upon request, by calling a Janus Henderson representative at 1-877-335-2687 (toll free). Portfolio holdings consisting of at least the names of the holdings are generally available on a monthly basis with a 30-day lag under Full Holdings for the Portfolio at janushenderson.com/vit.
APPROVAL OF ADVISORY AGREEMENTS DURING THE PERIOD
The Trustees of Janus Aspen Series, each of whom serves as an “independent” Trustee (the “Trustees”), oversee the management of each portfolio of Janus Aspen Series (each, a “VIT Portfolio,” and collectively, the “VIT Portfolios”), as well as each fund of Janus Investment Fund (each, a “Fund,” and collectively, the “Funds” and together with the VIT Portfolios, the “Janus Henderson Funds,” and each, a “Janus Henderson Fund”). As required by law, the Trustees determine annually whether to continue the investment advisory agreement for each Janus Henderson Fund.
In connection with their most recent consideration of those agreements for each Janus Henderson Fund, the Trustees received and reviewed information provided by Janus Henderson Investors US LLC (the “Adviser”) in response to requests of the Trustees and their independent legal counsel. They also received and reviewed information and analysis provided by, and in response to requests of, their independent fee consultant. Throughout their consideration of the agreements, the Trustees were advised by their independent legal counsel. The Trustees met with management to consider the agreements, and also met separately in executive session with their independent legal counsel and their independent fee consultant.
At meetings held on November 9-10, 2022 and December 13-14, 2022, the Trustees evaluated the information provided by the Adviser and the independent fee consultant, as well as other information provided by the Adviser and the independent fee consultant during the year. Following such evaluation, the Trustees determined that the overall arrangements between each Janus Henderson Fund and the Adviser were fair and reasonable in light of the nature, extent, and quality of the services provided by the Adviser and its affiliates, the fees charged for those services, and other matters that the Trustees considered relevant in the exercise of their business judgment, and unanimously approved the continuation of the investment advisory agreement for each Janus Henderson Fund for the period from February 1, 2023 through February 1, 2024, subject to earlier termination as provided for in each agreement.
In considering the continuation of those agreements, the Trustees reviewed and analyzed various factors that they determined were relevant, including the factors described below, none of which by itself was considered dispositive. However, the material factors and conclusions that formed the basis for the Trustees’ determination to approve the continuation of the agreements are discussed separately below. Also included is a summary of the independent fee consultant’s conclusions and opinions that arose during, and were included as part of, the Trustees’ consideration of the agreements. “Management fees,” as used herein, reflect actual annual advisory fees and, for the purpose of peer comparisons any administration fees (excluding out of pocket costs), net of any waivers, paid by a fund as a percentage of average net assets.
Nature, Extent and Quality of Services
The Trustees reviewed the nature, extent, and quality of the services provided by the Adviser to the Janus Henderson Funds, taking into account the investment objective, strategies, and policies of each Janus Henderson Fund, and the knowledge the Trustees gained from their regular meetings with management on at least a quarterly basis and their ongoing review of information related to the Janus Henderson Funds. In addition, the Trustees reviewed the resources and key personnel of the Adviser, particularly noting those employees who provide investment and risk management services to the Janus Henderson Funds. The Trustees also considered other services provided to the Janus Henderson Funds by the Adviser, such as managing the execution of portfolio transactions and the selection of broker-dealers for
Janus Henderson VIT Global Sustainable Equity Portfolio
Additional Information (unaudited)
those transactions. The Trustees considered the Adviser’s role as administrator to the Janus Henderson Funds, noting that the Adviser generally does not receive a fee for its services as administrator, but is reimbursed for its out-of-pocket costs. The Trustees considered the role of the Adviser in monitoring adherence to the Janus Henderson Funds’ investment restrictions, providing support services for the Trustees and Trustee committees, and overseeing communications with Janus Henderson Fund shareholders and the activities of other service providers, including monitoring compliance with various policies and procedures of the Janus Henderson Funds and with applicable securities laws and regulations.
In this regard, the independent fee consultant noted that the Adviser provides a number of different services for the Janus Henderson Funds and their shareholders, ranging from investment management services to various other servicing functions, and that, in its view, the Adviser is a capable provider of those services. The independent fee consultant also provided its belief that the Adviser has developed a number of institutional competitive advantages that should enable it to provide superior investment and service performance over the long term.
The Trustees concluded that the nature, extent, and quality of the services provided by the Adviser to each Janus Henderson Fund were appropriate and consistent with the terms of the respective advisory agreements, and that, taking into account steps taken to address those Janus Henderson Funds whose performance lagged that of their peers for certain periods, the Janus Henderson Funds were likely to benefit from the continued provision of those services. They also concluded that the Adviser had sufficient personnel, with the appropriate education and experience, to serve the Janus Henderson Funds effectively and had demonstrated its ability to attract well-qualified personnel.
Performance of the Funds
The Trustees considered the performance results of each Janus Henderson Fund over various time periods. They noted that they considered Janus Henderson Fund performance data throughout the year, including periodic meetings with each Janus Henderson Fund’s portfolio manager(s), and also reviewed information comparing each Janus Henderson Fund’s performance with the performance of comparable fund peer groups identified by Broadridge Financial Solutions, Inc. (“Broadridge”), an independent data provider, and with the Janus Henderson Fund’s benchmark index. In this regard, the independent fee consultant found that the overall Janus Henderson Funds’ performance has been reasonable, noting that: (i) for the 36 months ended May 31, 2022, approximately 38% of the Janus Henderson Funds were in the top two quartiles of their Broadridge peer groups; (ii) for the 36 months ended September 30, 2022, approximately 45% of the Janus Henderson Funds were in the top two quartiles of performance as reported by Morningstar, and (iii) for the 12 months ended September 30, 2022, approximately 55% of the Janus Henderson Funds were in the top two quartiles of performance as reported by Morningstar.
The Trustees considered the performance of each Janus Henderson Fund, noting that performance may vary by share class, and noted the following with respect to the VIT Portfolios:
· For Janus Henderson Adaptive Risk Managed U.S. Equity Portfolio, the Trustees noted that the VIT Portfolio’s performance was in the bottom Broadridge quartile for the 36 months ended May 31, 2022 and the first Broadridge quartile for the 12 months ended May 31, 2022. The Trustees noted the reasons for the VIT Portfolio’s underperformance and the steps the Adviser had taken or was taking to improve performance, and that the performance trend was improving.
· For Janus Henderson Balanced Portfolio, the Trustees noted that the VIT Portfolio’s performance was in the first Broadridge quartile for the 36 months ended May 31, 2022 and the first Broadridge quartile for the 12 months ended May 31, 2022.
· For Janus Henderson Enterprise Portfolio, the Trustees noted that the VIT Portfolio’s performance was in the third Broadridge quartile for the 36 months ended May 31, 2022 and the first Broadridge quartile for the 12 months ended May 31, 2022 The Trustees noted the reasons for the VIT Portfolio’s underperformance and the steps the Adviser had taken or was taking to improve performance, and that the performance trend was improving.
· For Janus Henderson Flexible Bond Portfolio, the Trustees noted that the VIT Portfolio’s performance was in the first Broadridge quartile for the 36 months ended May 31, 2022 and the first Broadridge quartile for the 12 months ended May 31, 2022.
Janus Henderson VIT Global Sustainable Equity Portfolio
Additional Information (unaudited)
· For Janus Henderson Forty Portfolio, the Trustees noted that the VIT Portfolio’s performance was in the second Broadridge quartile for the 36 months ended May 31, 2022 and the third Broadridge quartile for the 12 months ended May 31, 2022.
· For Janus Henderson Global Research Portfolio, the Trustees noted that the VIT Portfolio’s performance was in the first Broadridge quartile for the 36 months ended May 31, 2022 and the first Broadridge quartile for the 12 months ended May 31, 2022.
· For Janus Henderson Global Sustainable Equity Portfolio, the Trustees noted that the VIT Portfolio’s performance was in the bottom Broadridge quartile for the evaluated performance period ended May 31, 2022. The Trustees noted that 36 month-end performance was not yet available.
· For Janus Henderson Global Technology and Innovation Portfolio, the Trustees noted that the VIT Portfolio’s performance was in the second Broadridge quartile for the 36 months ended May 31, 2022 and the third Broadridge quartile for the 12 months ended May 31, 2022.
· For Janus Henderson Mid Cap Value Portfolio, the Trustees noted that the VIT Portfolio’s performance was in the bottom Broadridge quartile for the 36 months ended May 31, 2022 and the second Broadridge quartile for the 12 months ended May 31, 2022. The Trustees noted the reasons for the VIT Portfolio’s underperformance, while also noting that the VIT Portfolio has a performance fee structure that results in lower management fees during periods of underperformance, the steps the Adviser had taken or was taking to improve performance, and that the performance trend was improving.
· For Janus Henderson Overseas Portfolio, the Trustees noted that the VIT Portfolio’s performance was in the first Broadridge quartile for the 36 months ended May 31, 2022 and the first Broadridge quartile for the 12 months ended May 31, 2022.
· For Janus Henderson Research Portfolio, the Trustees noted that the VIT Portfolio’s performance was in the second Broadridge quartile for the 36 months ended May 31, 2022 and the second Broadridge quartile for the 12 months ended May 31, 2022.
In consideration of each Janus Henderson Fund’s performance, the Trustees concluded that, taking into account the factors relevant to performance, as well as other considerations, including steps taken to improve performance, as applicable, the Janus Henderson Fund’s performance warranted continuation of such Janus Henderson Fund’s investment advisory agreement.
Costs of Services Provided
The Trustees examined information regarding the fees and expenses of each Janus Henderson Fund in comparison to similar information for other comparable funds as provided by Broadridge, an independent data provider. They also reviewed an analysis of that information provided by their independent fee consultant. The independent fee consultant provided its belief that the management fees charged by the Adviser to each of the Janus Henderson Funds under the current investment advisory and administration agreements are reasonable in relation to the services provided by the Adviser. The independent fee consultant found: (1) the total expenses and management fees of the Janus Henderson Funds to be reasonable relative to other comparable mutual funds; (2) the total expenses, on average, were 6% under the average total expenses of the respective Broadridge peer group; and (3) the management fees for the Janus Henderson Funds, on average, were 5% under the average management fees for the respective Broadridge peer group. The Trustees also considered the total expenses for each share class of each Janus Henderson Fund compared to the average total expenses for its Broadridge Expense Group and to average total expenses for its Broadridge Expense Universe.
For Janus Henderson Funds with three or more years of performance history, the independent fee consultant also performed a systematic “focus list” analysis of expenses which assessed fund fees in the context of fund performance being delivered. Based on this analysis, the independent fee consultant found that the combination of service quality/performance and expenses on these individual Janus Henderson Funds was reasonable in light of performance trends, performance histories, changes in portfolio management, relative average net asset levels, and the existence of performance fees, breakpoints, and/or expense waivers on such Janus Henderson Funds.
Janus Henderson VIT Global Sustainable Equity Portfolio
Additional Information (unaudited)
The Trustees considered the methodology used by the Adviser in determining compensation payable to portfolio managers, the competitive environment for investment management talent, and the competitive market for mutual funds in different distribution channels.
The Trustees also reviewed management fees charged by the Adviser to comparable separate account clients and to comparable non-affiliated funds subadvised by the Adviser (for which the Adviser provides only or primarily portfolio management services). Although in most instances subadvisory and separate account fee rates for various investment strategies were lower than management fee rates for Janus Henderson Funds having a similar strategy, the Trustees considered that the Adviser noted that, under the terms of the management agreements with the Janus Henderson Funds, the Adviser performs significant additional services for the Janus Henderson Funds that it does not provide to those other clients, including administration services, oversight of the Janus Henderson Funds’ other service providers, Trustee support, regulatory compliance and numerous other services, and that, in serving the Janus Henderson Funds, the Adviser assumes many legal risks and other costs that it does not assume in servicing its other clients. Moreover, the Trustees noted that the independent fee consultant found that: (1) the management fees the Adviser charges to the Janus Henderson Funds are reasonable in relation to the management fees the Adviser charges to funds subadvised by the Adviser and to the fees the Adviser charges to its institutional separate account clients; (2) these subadvised and institutional separate accounts have different service and infrastructure needs and operate in markets very different from the retail fund market; (3) Janus Henderson mutual fund investors enjoy reasonable fees relative to the fees charged in these other markets; and (4) as part of its 2022 review, 9 of 11 Janus Henderson Funds have lower management fees than similar funds subadvised by the Adviser. The Trustees noted that for the two Janus Henderson Funds that did not, management fees for each were under the average of its 15(c) peer group.
The Trustees considered the fees for each Janus Henderson Fund for its fiscal year ended in 2021 (except for Janus Henderson Global Sustainable Equity Portfolio for which the period end was March 31, 2022) and noted the following with regard to each Janus Henderson Fund’s total expenses, net of applicable fee waivers (the VIT Portfolio’s “total expenses”) as reflected in the comparative information provided by Broadridge:
· For Janus Henderson Adaptive Risk Management U.S. Equity Portfolio, the Trustees noted that the VIT Portfolio’s total expenses were below the peer group average for its sole share class.
· For Janus Henderson Balanced Portfolio, the Trustees noted that, although the VIT Portfolio’s total expenses exceeded the peer group average for one share class, overall the VIT Portfolio’s total expenses were reasonable.
· For Janus Henderson Enterprise Portfolio, the Trustees noted that, although the VIT Portfolio’s total expenses exceeded the peer group average for one share class, overall the VIT Portfolio’s total expenses were reasonable.
· For Janus Henderson Flexible Bond Portfolio, the Trustees noted that, although the VIT Portfolio’s total expenses exceeded the peer group for one share class, overall the VIT Portfolio’s total expenses were reasonable. The Trustees also noted that the Adviser has contractually agreed to limit the VIT Portfolio’s expenses.
· For Janus Henderson Forty Portfolio, the Trustees noted that, although the VIT Portfolio’s total expenses exceeded the peer group average for one share class, overall the VIT Portfolio’s total expenses were reasonable.
· For Janus Henderson Global Research Portfolio, the Trustees noted that, although the VIT Portfolio’s total expenses exceeded the peer group average for one share class, overall the VIT Portfolio’s total expenses were reasonable.
· For Janus Henderson Global Sustainable Equity Portfolio, the Trustees noted that the VIT Portfolio’s total expenses were below the peer group average for both share classes.
· For Janus Henderson Global Technology and Innovation Portfolio, the Trustees noted that the VIT Portfolio’s total expenses were below the peer group average for both share classes.
· For Janus Henderson Mid Cap Value Portfolio, the Trustees noted that, the VIT Portfolio’s total expenses were below the peer group average for both share classes.
· For Janus Henderson Overseas Portfolio, the Trustees noted that although the VIT Portfolio’s total expenses exceeded the peer group average for one share class, overall the VIT Portfolio’s total expenses were reasonable.
Janus Henderson VIT Global Sustainable Equity Portfolio
Additional Information (unaudited)
· For Janus Henderson Research Portfolio, the Trustees noted that the VIT Portfolio’s total expenses were below the peer group average for both share classes.
The Trustees reviewed information on the overall profitability to the Adviser and its affiliates from their relationships with the Janus Henderson Funds, and considered profitability data of other publicly traded mutual fund advisers. The Trustees recognized that profitability comparisons among fund managers are difficult because of the variation in the type of comparative information that is publicly available, and the profitability of any fund manager is affected by numerous factors, including the organizational structure of the particular fund manager, differences in complex size, difference in product mix, difference in types of business (mutual fund, institutional and other), differences in the types of funds and other accounts it manages, possible other lines of business, the methodology for allocating expenses and the fund manager’s capital structure and cost of capital.
Additionally, the Trustees considered the estimated profitability to the Adviser from the investment management services it provided to each Janus Henderson Fund. In their review, the Trustees considered whether the Adviser receive adequate incentives and resources to manage the Janus Henderson Funds effectively. In reviewing profitability, the Trustees noted that the estimated profitability for an individual Janus Henderson Fund is necessarily a product of the allocation methodology utilized by the Adviser to allocate its expenses as part of the estimated profitability calculation. In this regard, the Trustees noted that the independent fee consultant found as part of its 2022 review that (1) the expense allocation methodology and rationales utilized by the Adviser were reasonable and (2) no clear correlation exists between expense allocations and operating margins. The Trustees also considered that the estimated profitability for an individual Janus Henderson Fund was influenced by a number of factors, including not only the allocation methodology selected, but also the presence of fee waivers and expense caps, and whether the Janus Henderson Fund’s investment management agreement contained breakpoints or a performance fee component. The Trustees determined, after taking into account these factors, among others, that the Adviser’s estimated profitability with respect to each Janus Henderson Fund was not unreasonable in relation to the services provided, and that the variation in the range of such estimated profitability among the Janus Henderson Funds was not a material factor in the Board’s approval of the reasonableness of any Janus Henderson Fund’s investment management fees.
The Trustees concluded that the management fees payable by each Janus Henderson Fund to the Adviser were reasonable in relation to the nature, extent, and quality of the services provided, taking into account the fees charged by other advisers for managing comparable mutual funds with similar strategies, the fees the Adviser charges to other clients, and, as applicable, the impact of fund performance on management fees payable by the Janus Henderson Funds. The Trustees also concluded that each Janus Henderson Fund’s total expenses were reasonable, taking into account the size of the Janus Henderson Fund, the quality of services provided by the Adviser, the investment performance of the Janus Henderson Fund, and any expense limitations agreed to or provided by the Adviser.
Economies of Scale
The Trustees considered information about the potential for the Adviser to realize economies of scale as the assets of the Janus Henderson Funds increase. They noted that their independent fee consultant published a report to the Trustees in June 2022 which provided its research and analysis into economies of scale. They also noted that, although many Janus Henderson Funds pay advisory fees at a fixed base rate as a percentage of net assets, without any breakpoints or performance fees, their independent fee consultant concluded that 75% of these Janus Henderson Funds’ have contractual management fees (gross of waivers) below their Broadridge Expense Group averages. The Trustees also noted the following from the independent fee consultant’s report: (1) that 31% of Janus Henderson Funds had management fee breakpoints in place whereby investors pay lower management fees as fund AUM increases; (2) that 29% of Janus Henderson Funds have low flat-rate fees and performance fees where the Adviser is incentivized to invest in resources which drive Janus Henderson Fund performance; and (3) that 39% of Janus Henderson Funds have low flat-rate fees versus peers where investors pay low fixed fees when the Janus Henderson Fund is small/midsized and higher fees when the Janus Henderson Fund grows in assets. The Trustees also noted that the Janus Henderson Funds share directly in economies of scale through the significant investments made by the Adviser and its affiliates related to services provided to the Funds and the lower charges of third-party service providers that are based in part on the combined scale of all of the Janus Henderson Funds.
The Trustees also considered the independent fee consultant’s conclusion that, given the limitations of various analytical approaches to economies of scale and their conflicting results, it is difficult to analytically confirm or deny the existence of economies of scale in the Janus Henderson complex. In this regard, the independent consultant concluded that (1) to the extent there were economies of scale at the Adviser, the Adviser’s general strategy of setting
Janus Henderson VIT Global Sustainable Equity Portfolio
Additional Information (unaudited)
fixed management fees below peers appeared to share any such economies with investors even on smaller Janus Henderson Funds which have not yet achieved those economies and (2) by setting lower fixed fees from the start on these Janus Henderson Funds, the Adviser appeared to be investing to increase the likelihood that these Janus Henderson Funds will grow to a level to achieve any economies of scale that may exist. Further, the independent fee consultant provided its belief that Janus Henderson Fund investors are well-served by the fee levels and performance fee structures in place on the Janus Henderson Funds in light of any economies of scale that may be present at the Adviser.
Based on all of the information reviewed, including the recent and past research and analysis conducted by the Trustees’ independent fee consultant, the Trustees concluded that the current fee structure of each Janus Henderson Fund was reasonable and that the current rates of fees do reflect a sharing between the Adviser and the Janus Henderson Fund of any economies of scale that may be present at the current asset level of the Janus Henderson Fund.
Other Benefits to the Adviser
The Trustees also considered benefits that accrue to the Adviser and its affiliates from their relationships with the Janus Henderson Funds. They recognized that two affiliates of the Adviser separately serve the Janus Henderson Funds as transfer agent and distributor, respectively, and the transfer agent receives compensation directly from the non-money market Janus Henderson Funds for services provided, and that such compensation contributes to the overall profitability of the Adviser and its affiliates that results from their relationship with the Janus Henderson Funds. The Trustees also considered the Adviser’s past and proposed use of commissions paid by the Janus Henderson Funds on portfolio brokerage transactions to obtain proprietary and third-party research products and services benefiting the Janus Henderson Fund and/or other clients of the Adviser and/or the Adviser. The Trustees concluded that the Adviser’s use of these types of client commission arrangements to obtain proprietary and third-party research products and services was consistent with regulatory requirements and guidelines and was likely to benefit each Janus Henderson Fund. The Trustees also concluded that, other than the services provided by the Adviser and its affiliates pursuant to the agreements and the fees to be paid by each Janus Henderson Fund therefor, the Janus Henderson Funds and the Adviser may potentially benefit from their relationship with each other in other ways. They concluded that the Adviser and its affiliates share directly in economies of scale through the lower charges of third-party service providers that are based in part on the combined scale of the Janus Henderson Funds and other clients serviced by the Adviser and its affiliates. They also concluded that the Adviser benefits from the receipt of research products and services acquired through commissions paid on portfolio transactions of the Janus Henderson Funds and that the Janus Henderson Funds benefit from the Adviser’s receipt of those products and services as well as research products and services acquired through commissions paid by other clients of the Adviser. They further concluded that the success of any Janus Henderson Fund could attract other business to the Adviser or other Janus Henderson Funds, and that the success of the Adviser could enhance the Adviser’s ability to serve the Janus Henderson Funds.
Janus Henderson VIT Global Sustainable Equity Portfolio
Useful Information About Your Portfolio Report (unaudited)
Management Commentary
The Management Commentary in this report includes valuable insight as well as statistical information to help you understand how your Portfolio’s performance and characteristics stack up against those of comparable indices.
If the Portfolio invests in foreign securities, this report may include information about country exposure. Country exposure is based primarily on the country of risk. A company may be allocated to a country based on other factors such as location of the company’s principal office, the location of the principal trading market for the company’s securities, or the country where a majority of the company’s revenues are derived.
Please keep in mind that the opinions expressed in the Management Commentary are just that: opinions. They are a reflection based on best judgment at the time this report was compiled, which was December 31, 2022. As the investing environment changes, so could opinions. These views are unique and are not necessarily shared by fellow employees or by Janus Henderson in general.
Performance Overviews
Performance overview graphs compare the performance of a hypothetical $10,000 investment in the Portfolio with one or more widely used market indices. When comparing the performance of the Portfolio with an index, keep in mind that market indices are not available for investment and do not reflect deduction of expenses.
Average annual total returns are quoted for a Portfolio with more than one year of performance history. Average annual total return is calculated by taking the growth or decline in value of an investment over a period of time, including reinvestment of dividends and distributions, then calculating the annual compounded percentage rate that would have produced the same result had the rate of growth been constant throughout the period. Average annual total return does not reflect the deduction of taxes that a shareholder would pay on Portfolio distributions or redemptions of Portfolio shares.
Cumulative total returns are quoted for a Portfolio with less than one year of performance history. Cumulative total return is the growth or decline in value of an investment over time, independent of the period of time involved. Cumulative total return does not reflect the deduction of taxes that a shareholder would pay on Portfolio distributions or redemptions of Portfolio shares.
Pursuant to federal securities rules, expense ratios shown in the performance chart reflect subsidized (if applicable) and unsubsidized ratios. The total annual fund operating expenses ratio is gross of any fee waivers, reflecting the Portfolio’s unsubsidized expense ratio. The net annual fund operating expenses ratio (if applicable) includes contractual waivers of the Adviser and reflects the Portfolio’s subsidized expense ratio. Ratios may be higher or lower than those shown in the “Financial Highlights” in this report.
Schedule of Investments
Following the performance overview section is the Portfolio’s Schedule of Investments. This schedule reports the types of securities held in the Portfolio on the last day of the reporting period. Securities are usually listed by type (common stock, corporate bonds, U.S. Government obligations, etc.) and by industry classification (banking, communications, insurance, etc.). Holdings are subject to change without notice.
The value of each security is quoted as of the last day of the reporting period. The value of securities denominated in foreign currencies is converted into U.S. dollars.
If the Portfolio invests in foreign securities, it will also provide a summary of investments by country. This summary reports the Portfolio exposure to different countries by providing the percentage of securities invested in each country. The country of each security represents the country of risk. The Portfolio’s Schedule of Investments relies upon the industry group and country classifications published by Bloomberg and/or MSCI Inc.
Tables listing details of individual forward currency contracts, futures, written options, swaptions, and swaps follow the Portfolio’s Schedule of Investments (if applicable).
Statement of Assets and Liabilities
This statement is often referred to as the “balance sheet.” It lists the assets and liabilities of the Portfolio on the last day of the reporting period.
Janus Henderson VIT Global Sustainable Equity Portfolio
Useful Information About Your Portfolio Report (unaudited)
The Portfolio’s assets are calculated by adding the value of the securities owned, the receivable for securities sold but not yet settled, the receivable for dividends declared but not yet received on securities owned, and the receivable for Portfolio shares sold to investors but not yet settled. The Portfolio’s liabilities include payables for securities purchased but not yet settled, Portfolio shares redeemed but not yet paid, and expenses owed but not yet paid. Additionally, there may be other assets and liabilities such as unrealized gain or loss on forward currency contracts.
The section entitled “Net Assets Consist of” breaks down the components of the Portfolio’s net assets. Because the Portfolio must distribute substantially all earnings, you will notice that a significant portion of net assets is shareholder capital.
The last section of this statement reports the net asset value (“NAV”) per share on the last day of the reporting period. The NAV is calculated by dividing the Portfolio’s net assets for each share class (assets minus liabilities) by the number of shares outstanding.
Statement of Operations
This statement details the Portfolio’s income, expenses, realized gains and losses on securities and currency transactions, and changes in unrealized appreciation or depreciation of Portfolio holdings.
The first section in this statement, entitled “Investment Income,” reports the dividends earned from securities and interest earned from interest-bearing securities in the Portfolio.
The next section reports the expenses incurred by the Portfolio, including the advisory fee paid to the investment adviser, transfer agent fees and expenses, and printing and postage for mailing statements, financial reports and prospectuses. Expense offsets and expense reimbursements, if any, are also shown.
The last section lists the amounts of realized gains or losses from investment and foreign currency transactions, and changes in unrealized appreciation or depreciation of investments and foreign currency-denominated assets and liabilities. The Portfolio will realize a gain (or loss) when it sells its position in a particular security. A change in unrealized gain (or loss) refers to the change in net appreciation or depreciation of the Portfolio during the reporting period. “Net Realized and Unrealized Gain/(Loss) on Investments” is affected both by changes in the market value of Portfolio holdings and by gains (or losses) realized during the reporting period.
Statements of Changes in Net Assets
These statements report the increase or decrease in the Portfolio’s net assets during the reporting period. Changes in the Portfolio’s net assets are attributable to investment operations, dividends and distributions to investors, and capital share transactions. This is important to investors because it shows exactly what caused the Portfolio’s net asset size to change during the period.
The first section summarizes the information from the Statement of Operations regarding changes in net assets due to the Portfolio’s investment operations. The Portfolio’s net assets may also change as a result of dividend and capital gains distributions to investors. If investors receive their dividends and/or distributions in cash, money is taken out of the Portfolio to pay the dividend and/or distribution. If investors reinvest their dividends and/or distributions, the Portfolio’s net assets will not be affected.
The reinvestment of dividends and distributions is included under “Capital Share Transactions.” “Capital Shares” refers to the money investors contribute to the Portfolio through purchases or withdrawals via redemptions. The Portfolio’s net assets will increase and decrease in value as investors purchase and redeem shares from the Portfolio.
Financial Highlights
This schedule provides a per-share breakdown of the components that affect the Portfolio’s NAV for current and past reporting periods as well as total return, asset size, ratios, and portfolio turnover rate.
The first line in the table reflects the NAV per share at the beginning of the reporting period. The next line reports the net investment income/(loss) per share. Following is the per share total of net gains/(losses), realized and unrealized. Per share dividends and distributions to investors are then subtracted to arrive at the NAV per share at the end of the period. The next line reflects the total return for the period. The total return may include adjustments in accordance with generally accepted accounting principles required at the period end for financial reporting purposes. As a result, the total return may differ from the total return reflected for individual shareholder transactions. Also included are ratios of expenses and net investment income to average net assets.
Janus Henderson VIT Global Sustainable Equity Portfolio
Useful Information About Your Portfolio Report (unaudited)
The Portfolio’s expenses may be reduced through expense offsets and expense reimbursements. The ratios shown reflect expenses before and after any such offsets and reimbursements.
The ratio of net investment income/(loss) summarizes the income earned less expenses, divided by the average net assets of the Portfolio during the reporting period. Do not confuse this ratio with the Portfolio’s yield. The net investment income ratio is not a true measure of the Portfolio’s yield because it does not take into account the dividends distributed to the Portfolio’s investors.
The next figure is the portfolio turnover rate, which measures the buying and selling activity in the Portfolio. Portfolio turnover is affected by market conditions, changes in the asset size of the Portfolio, fluctuating volume of shareholder purchase and redemption orders, the nature of the Portfolio’s investments, and the investment style and/or outlook of the portfolio manager(s) and/or investment personnel. A 100% rate implies that an amount equal to the value of the entire portfolio was replaced once during the fiscal year; a 50% rate means that an amount equal to the value of half the portfolio is traded in a year; and a 200% rate means that an amount equal to the value of the entire portfolio is traded every six months.
Janus Henderson VIT Global Sustainable Equity Portfolio
Designation Requirements (unaudited)
For federal income tax purposes, the Portfolio designated the following for the period ended December 31, 2022:
| | |
| | |
Dividends Received Deduction Percentage | 82% |
| | |
Janus Henderson VIT Global Sustainable Equity Portfolio
Trustees and Officers (unaudited)
The following are the Trustees and officers of the Trust, together with a brief description of their principal occupations during the last five years (principal occupations for certain Trustees may include periods over five years). The Portfolio’s Statement of Additional Information includes additional information about the Trustees and officers and is available, without charge, by calling 1-877-335-2687.
Each Trustee has served in that capacity since he or she was originally elected or appointed. The Trustees do not serve a specified term of office. Each Trustee will hold office until the termination of the Trust or his or her earlier death, resignation, retirement, incapacity, or removal. Under the Portfolio’s Governance Procedures and Guidelines, the policy is for Trustees to retire no later than the end of the calendar year in which the Trustee turns 75. The Trustees review the Portfolio’s Governance Procedures and Guidelines from time to time and may make changes they deem appropriate. The Portfolio’s Nominating and Governance Committee will consider nominees for the position of Trustee recommended by shareholders. Shareholders may submit the name of a candidate for consideration by the Committee by submitting their recommendations to the Trust’s Secretary. Each Trustee is currently a Trustee of one other registered investment company advised by the Adviser: Janus Investment Fund. Collectively, these two registered investment companies consist of 51 series or funds referred to herein as the Fund Complex.
The Trust’s officers are elected annually by the Trustees for a one-year term. Certain officers also serve as officers of Janus Investment Fund. Certain officers of the Portfolio may also be officers and/or directors of the Adviser. Except as otherwise disclosed, Portfolio officers receive no compensation from the Portfolio, except for the Portfolio’s Chief Compliance Officer, as authorized by the Trustees.
Janus Henderson VIT Global Sustainable Equity Portfolio
Trustees and Officers (unaudited)
| | | | | | |
TRUSTEES |
Name, Address, and Age | Positions Held with the Trust | Length of Time Served | Principal Occupations During the Past Five Years | Number of Portfolios/Funds in Fund Complex Overseen by Trustee | Other Directorships Held by Trustee During the Past Five Years |
Independent Trustees | | | | |
Alan A. Brown
151 Detroit Street
Denver, CO 80206
DOB: 1962 | Chairman
Trustee | 5/22-Present
1/13-Present | Principal, Curam Holdings LLC (since 2018). Formerly, Executive Vice President, Institutional Markets, of Black Creek Group (private equity real estate investment management firm) (2012-2018), Executive Vice President and Co-Head, Global Private Client Group (2007-2010), Executive Vice President, Mutual Funds (2005-2007), and Chief Marketing Officer (2001-2005) of Nuveen Investments, Inc. (asset management). | 51 | Advisory Board Member of AEW Core Property Trust (open-end property fund) (since 2020), and Director of WTTW (PBS affiliate) (since 2003). Formerly, Director of MotiveQuest LLC (strategic social market research company) (2003-2016), Director of Nuveen Global Investors LLC (2007-2011), Director of Communities in Schools (2004-2010), and Director of Mutual Fund Education Alliance (until 2010). |
Cheryl D. Alston
151 Detroit Street
Denver, CO 80206
DOB: 1966 | Trustee | 8/22-Present | Executive Director and Chief Investment Officer, Employees’ Retirement Fund of the City of Dallas (since 2004). | 51 | Director of Blue Cross Blue Shield of Kansas City (a not-for-profit health insurance provider) (since 2016) and Director of Global Life Insurance (life and supplemental health insurance provider) (since 2017). Formerly, Director of Federal Home Loan Bank of Dallas (2017-2021). |
Janus Henderson VIT Global Sustainable Equity Portfolio
Trustees and Officers (unaudited)
| | | | | | |
TRUSTEES |
Name, Address, and Age | Positions Held with the Trust | Length of Time Served | Principal Occupations During the Past Five Years | Number of Portfolios/Funds in Fund Complex Overseen by Trustee | Other Directorships Held by Trustee During the Past Five Years |
Independent Trustees | | | | |
William D. Cvengros
151 Detroit Street
Denver, CO 80206
DOB: 1948 | Trustee | 1/11-Present | Chief Executive Officer of SJC Capital, LLC (a personal investment company and consulting firm) (since 2002). Formerly, Chief Executive Officer and President of PIMCO Advisors Holdings L.P. (a publicly traded investment management firm) (1994-2000), and Chief Investment Officer (1987-1994) and Vice Chairman and Director (1990-1994) of Pacific Life Insurance Company (a mutual life insurance and annuity company) (1987-1994). | 51 | Member, Limited Partner Advisory Committee, Karmel Capital Fund III (since 2022), Member of the Investment Committee for the Orange Country Community Foundation (a grantmaking foundation) (since 2020), Advisory Board Member, RevOZ Fund LP and related funds (real estate investments for opportunity zones) (since 2020), and Advisory Board Member, Innovate Partners Emerging Growth and Equity Fund I (early stage venture capital fund) (since 2014). Formerly, Managing Trustee of National Retirement Partners Liquidating Trust (2013-2016), Chairman, National Retirement Partners, Inc. (formerly a network of advisors to 401(k) plans) (2005-2013), Director of Prospect Acquisition Corp. (a special purpose acquisition corporation) (2007-2009), Director of RemedyTemp, Inc. (temporary help services company) (1996-2006), and Trustee of PIMCO Funds Multi-Manager Series (1990-2000) and Pacific Life Variable Life & Annuity Trusts (1987-1994). |
Janus Henderson VIT Global Sustainable Equity Portfolio
Trustees and Officers (unaudited)
| | | | | | |
TRUSTEES |
Name, Address, and Age | Positions Held with the Trust | Length of Time Served | Principal Occupations During the Past Five Years | Number of Portfolios/Funds in Fund Complex Overseen by Trustee | Other Directorships Held by Trustee During the Past Five Years |
Independent Trustees | | | | |
Raudline Etienne
151 Detroit Street
Denver, CO 80206
DOB: 1965 | Trustee | 6/16-Present | Founder, Daraja Capital (advisory and investment firm) (since 2016). Formerly, Senior Vice President and Senior Advisor, Albright Stonebridge Group LLC (global strategy firm) (2011-2021), and Deputy Comptroller and Chief Investment Officer, New York State Common Retirement Fund (public pension fund) (2008-2011). | 51 | Member of the Investment Committee for Cooper Union (private college) (since 2021), Board Member, Van Alen Institute (nonprofit architectural and design organization) (2019-2022). |
Janus Henderson VIT Global Sustainable Equity Portfolio
Trustees and Officers (unaudited)
| | | | | | |
TRUSTEES |
Name, Address, and Age | Positions Held with the Trust | Length of Time Served | Principal Occupations During the Past Five Years | Number of Portfolios/Funds in Fund Complex Overseen by Trustee | Other Directorships Held by Trustee During the Past Five Years |
Independent Trustees | | | | |
Darrell B. Jackson
151 Detroit Street
Denver, CO 80206
DOB: 1958 | Trustee | 8/22-Present | President and Chief Executive Officer, The Efficace Group Inc. (since 2018). Formerly, President and Chief Executive Officer, Seaway Bank and Trust Company (community bank) (2014-2015), and Executive Vice President and Co-President, Wealth Management (2009-2014), and several senior positions, including Group Executive, Senior Vice President, and Vice President (1995-2009) of Northern Trust Company (financial services company) (1995-2014). | 51 | Director of Amalgamated Financial Corp (bank) (since August 2021), Director of YR Media (a not-for-profit production company) (since 2021), and Director of Gray-Bowen-Scott (transportation project consulting firm) (since April 2020). Formerly, Director of Delaware Place Bank (closely held commercial bank) (2016-2018) and Director of Seaway Bank and Trust Company (2014-2015). |
Janus Henderson VIT Global Sustainable Equity Portfolio
Trustees and Officers (unaudited)
| | | | | | |
TRUSTEES |
Name, Address, and Age | Positions Held with the Trust | Length of Time Served | Principal Occupations During the Past Five Years | Number of Portfolios/Funds in Fund Complex Overseen by Trustee | Other Directorships Held by Trustee During the Past Five Years |
Independent Trustees | | | | |
William F. McCalpin
151 Detroit Street
Denver, CO 80206
DOB: 1957 | Trustee | 6/02-Present | Chief Executive Officer, muun chi LLC (organic food business) (since 2022) and Independent Consultant (since 2019). Formerly, Chief Operating Officer, muun chi LLC (2020-2022), Managing Partner, Impact Investments, Athena Capital Advisors LLC (independent registered investment advisor) (2016-2019), Managing Director, Holos Consulting LLC (provides consulting services to foundations and other nonprofit organizations) (2009-2016), Chief Executive Officer, Imprint Capital Advisors (impact investment firm) (2013-2015), and Executive Vice President and Chief Operating Officer of The Rockefeller Brothers Fund (a private family foundation) (1998-2006). | 51 | Chairman of the Board and Trustee of The Investment Fund for Foundations Investment Program (TIP) (consisting of 1 fund) (since 2008). Formerly, Director of the F.B. Heron Foundation (a private grantmaking foundation) (2006-2022), and Director of Mutual Fund Directors Forum (a non-profit organization serving independent directors of U.S. mutual funds) (2016-2021). |
Janus Henderson VIT Global Sustainable Equity Portfolio
Trustees and Officers (unaudited)
| | | | | | |
TRUSTEES |
Name, Address, and Age | Positions Held with the Trust | Length of Time Served | Principal Occupations During the Past Five Years | Number of Portfolios/Funds in Fund Complex Overseen by Trustee | Other Directorships Held by Trustee During the Past Five Years |
Independent Trustees | | | | |
Gary A. Poliner
151 Detroit Street
Denver, CO 80206
DOB: 1953 | Trustee | 6/16-Present | Retired. Formerly, President (2010-2013) of Northwestern Mutual Life Insurance Company. | 51 | Director of MGIC Investment Corporation (private mortgage insurance) (since 2013). Formerly, Director, West Bend Mutual Insurance Company (property/casualty insurance) (2013-2021), Trustee of Northwestern Mutual Life Insurance Company (2010-2013) and Director of Frank Russell Company (global asset management firm) (2008-2013). |
Diane L. Wallace
151 Detroit Street
Denver, CO 80206
DOB: 1958 | Trustee | 6/17-Present | Retired. Formerly, Chief Operating Officer, Senior Vice President-Operations, and Chief Financial Officer for Driehaus Capital Management, LLC (1988-2006) and Treasurer for Driehaus Mutual Funds (1996-2002). | 51 | Formerly, Director of Family Service of Lake County (2019-2021), Independent Trustee, Henderson Global Funds (13 portfolios) (2015-2017), Independent Trustee, State Farm Associates' Funds Trust, State Farm Mutual Fund Trust, and State Farm Variable Product Trust (28 portfolios) (2013-2017). |
Janus Henderson VIT Global Sustainable Equity Portfolio
Trustees and Officers (unaudited)
| | | | |
OFFICERS |
Name, Address, and Age | Positions Held with the Trust | Term of Office* and Length of Time Served | Principal Occupations During the Past Five Years |
Hamish Chamberlayne
151 Detroit Street
Denver, CO 80206
DOB: 1980 | Executive Vice President and Co-Portfolio Manager Janus Henderson Global Sustainable Equity Portfolio | 1/22-Present | Head of Global Sustainable Equities of Janus Henderson Investors and Portfolio Manager for other Janus Henderson accounts. |
Aaron Scully
151 Detroit Street
Denver, CO 80206
DOB: 1976 | Executive Vice President and Co-Portfolio Manager Janus Henderson Global Sustainable Equity Portfolio | 1/22-Present | Portfolio Manager for other Janus Henderson accounts. |
Michelle Rosenberg
151 Detroit Street
Denver, CO 80206
DOB: 1973 | President and Chief Executive Officer | 9/22-Present | General Counsel and Corporate Secretary of Janus Henderson Investors (since 2018). Formerly, Interim President and Chief Executive Officer of the Trust and Janus Investment Fund (2022), Senior Vice President and Head of Legal, North America of Janus Henderson Investors (2017-2018) and Deputy General Counsel of Janus Henderson US (Holdings) Inc. (2015-2018). |
* Officers are elected at least annually by the Trustees for a one-year term and may also be elected from time to time by the Trustees for an interim period. |
Janus Henderson VIT Global Sustainable Equity Portfolio
Trustees and Officers (unaudited)
| | | | |
OFFICERS |
Name, Address, and Age | Positions Held with the Trust | Term of Office* and Length of Time Served | Principal Occupations During the Past Five Years |
Kristin Mariani
151 Detroit Street
Denver, CO 80206
DOB: 1966 | Vice President and Chief Compliance Officer | 7/20-Present | Head of Compliance, North America at Janus Henderson Investors (since September 2020), and Chief Compliance Officer at Janus Henderson Investors US LLC (since September 2017). Formerly, Anti-Money Laundering Officer for the Trust and Janus Investment Fund (July 2020-December 2022), Global Head of Investment Management Compliance at Janus Henderson Investors (February 2019-August 2020), Vice President, Head of Global Distribution Compliance and Chief Compliance Officer at Janus Henderson Distributors US LLC (May 2017-September 2017), Vice President, Compliance at Janus Henderson US (Holdings) Inc., Janus Henderson Investors US LLC, and Janus Henderson Distributors US LLC (2009-2017). |
Jesper Nergaard
151 Detroit Street
Denver, CO 80206
DOB: 1962 | Chief Financial Officer
Vice President, Treasurer, and Principal Accounting Officer | 3/05-Present
2/05-Present | Head of U.S. Fund Administration, Janus Henderson Investors and Janus Henderson Services US LLC. |
Abigail J. Murray
151 Detroit Street
Denver, CO 80206
DOB: 1975 | Vice President, Chief Legal Officer, and Secretary | 12/20-Present | Managing Counsel (since 2020). Formerly, Senior Counsel for Invesco Ltd. (2017-2020), and Vice President and Senior Counsel, ALPS Fund Services, Inc. and Assistant General Counsel, ALPS Advisors, Inc. (2015-2017). |
Ciaran Askin
151 Detroit Street
Denver, CO 80206
DOB: 1978 | Anti-Money Laundering Officer | 12/22-Present | Global Head of Financial Crime, Janus Henderson Investors (since 2022). Formerly, Global Head of Financial Crime for Invesco Ltd. (2017-2022). |
* Officers are elected at least annually by the Trustees for a one-year term and may also be elected from time to time by the Trustees for an interim period. |
Janus Henderson VIT Global Sustainable Equity Portfolio
Notes
NotesPage1
| | | | | | | | |
| | | | | |

| | | | |
This report is submitted for the general information of shareholders of the Portfolio. It is not an offer or solicitation for the Portfolio and is not authorized for distribution to prospective investors unless preceded or accompanied by an effective prospectus. |
Janus Henderson is a trademark of Janus Henderson Group plc or one of its subsidiaries. © Janus Henderson Group plc Janus Henderson Distributors US LLC |
| | | | 109-02-93095 03-23 |
| | | | | | |
| | | |
| | | ANNUAL REPORT December 31, 2022 |
| | |
| | Janus Henderson VIT Global Technology and Innovation Portfolio |
| | |
| | Janus Aspen Series |
| |
| | | HIGHLIGHTS · Portfolio management perspective · Investment strategy behind your portfolio · Portfolio performance, characteristics
and holdings | |
Table of Contents
Janus Henderson VIT Global Technology and Innovation Portfolio
Janus Henderson VIT Global Technology and Innovation Portfolio (unaudited)
| | | | | | |
| | | | 
Jonathan Cofsky co-portfolio manager | 
Denny Fish co-portfolio manager |
| | | |
PERFORMANCE OVERVIEW
For the 12 months ended December 31, 2022, Janus Henderson VIT Global Technology and Innovation Portfolio’s Institutional Shares and Service Shares returned -36.95% and -37.12%, respectively. By comparison, the Portfolio’s primary and secondary benchmarks, the S&P 500® Index and the MSCI All Country World Information Technology IndexSM, returned -18.11% and -31.07%, respectively.
INVESTMENT ENVIRONMENT
During the period, macro drivers buffeted the sector as investors assessed headwinds including inflation, rising rates, a potentially slowing economy, and what these mean for corporate fundamentals and stock prices. Many of the stocks aligned with the secular themes we favor remained under pressure as rising rates reduce the future value of their cash flows. Also, cyclical-growth tech stocks – another segment that we believe has the potential to deliver attractive risk-adjusted returns – were held down by the possibility of a weakening economy.
PERFORMANCE DISCUSSION
A leading detractor was Amazon.com. The size of the company makes vulnerability to the economic cycle unavoidable. Aggravating the situation was the wave of investment undertaken during the pandemic. Its current round of investment, in our view, exceeds what marketplace conditions would merit, especially as the economy enters a downturn.
Another detractor that has been affected by the slowing economy is Atlassian. The company provides project management tools for software developers, and the expectation of additional tech layoffs forced management to reduce forward guidance. Other headwinds for the company are its European exposure and the impact its transition to the cloud has on revenue recognition.
A leading relative contributor was real estate information and analytics provider CoStar. The stock had been pressured by investor trepidation toward the company’s initiative into the residential space. Consensus has since grown more comfortable with management’s ability to develop this business.
A relative contributor within the semiconductor (semi) capital equipment space was KLA. The stock rebounded from previous weakness, as investors sought exposure to the capital equipment required to fabricate the chips used across a range of industrial and consumer applications.
OUTLOOK
We expect macro developments to remain a factor until greater visibility emerges on the future path of inflation and its effect on interest rates. A higher cost of capital is a headwind for cyclically exposed tech companies, as it restrains both big-ticket corporate investments and aggregate consumption across the economy.
A softening economy can be regenerative, as it exposes weaker businesses and creates the conditions for competitively advantaged companies to emerge on the other side in an even stronger position. We expect this dynamic to play out in internet-related ecosystems as higher-quality platforms expand their reach by proving their services’ value to customers.
Another area where a slowing economy could represent opportunity is cloud computing. Also, semiconductor companies tend to price in an eventual recovery relatively early, as investors anticipate a recovery in demand.
Digital advertising may not enjoy the same fate. While we expect a flagging economy to weigh on corporate ad
Janus Henderson VIT Global Technology and Innovation Portfolio (unaudited)
budgets in the near term, major online ad platforms also face structural privacy-related issues.
Thank you for your investment in the Janus Henderson VIT Global Technology and Innovation Portfolio.
Janus Henderson VIT Global Technology and Innovation Portfolio (unaudited)
Portfolio At A Glance
December 31, 2022
| | | | | | | | | | |
| | | | | | | | | |
| | | | | | | | | |
| | | | | | | | | |
| 5 Top Contributors - Holdings | 5 Top Detractors - Holdings |
| | Average
Weight | | Relative
Contribution | | | Average
Weight | | Relative
Contribution |
| CoStar Group Inc | 2.66% | | 0.68% | | Atlassian Corp - Class A | 2.42% | | -0.89% |
| Mastercard Inc | 5.06% | | 0.56% | | Amazon.com Inc | 4.61% | | -0.77% |
| KLA Corp | 2.55% | | 0.43% | | Sea Ltd (ADR) | 0.62% | | -0.64% |
| Axon Enterprise Inc | 0.68% | | 0.31% | | Twilio Inc | 0.62% | | -0.50% |
| Analog Devices Inc | 2.06% | | 0.29% | | Visa Inc | 0.15% | | -0.49% |
| | | | | | | |
| 2 Top Contributors - Sectors* | | | | | |
| | | Relative | | Portfolio | MSCI All Country World Information Technology Index |
| | | Contribution | | Average Weight | Average Weight |
| Other** | | 0.67% | | 2.86% | 0.00% |
| Industrials | | 0.65% | | 4.13% | 0.00% |
| | | | | | |
| | | | | | |
| 5 Top Detractors - Sectors* | | | | | |
| | | Relative | | Portfolio | MSCI All Country World Information Technology Index |
| | | Contribution | | Average Weight | Average Weight |
| Information Technology | | -3.50% | | 78.12% | 100.00% |
| Communication Services | | -1.82% | | 6.86% | 0.00% |
| Consumer Discretionary | | -1.67% | | 6.96% | 0.00% |
| Financials | | -0.07% | | 0.32% | 0.00% |
| Real Estate | | -0.05% | | 0.75% | 0.00% |
| | | | | | | |
| Relative contribution reflects how the portolio's holdings impacted return relative to the benchmark. Cash and securities not held in the portfolio are not shown. For equity portfolios, relative contribution compares the performance of a security in the portfolio to the benchmark's total return, factoring in the difference in weight of that security in the benchmark. Returns are calculated using daily returns and previous day ending weights rolled up by ticker, excluding fixed income securities, gross of advisory fees, may exclude certain derivatives and will differ from actual performance.
Performance attribution reflects returns gross of advisory fees and may differ from actual returns as they are based on end of day holdings. Attribution is calculated by geometrically linking daily returns for the portfolio and index. |
* | Based on sector classification according to the Global Industry Classification Standard (“GICS”) codes, which are the exclusive property and a service mark of MSCI Inc. and Standard & Poor’s. |
** | Not a GICS classified sector. |
Janus Henderson VIT Global Technology and Innovation Portfolio (unaudited)
Portfolio At A Glance
December 31, 2022
| | |
5 Largest Equity Holdings - (% of Net Assets) |
Microsoft Corp | |
Software | 12.7% |
ASML Holding NV | |
Semiconductor & Semiconductor Equipment | 7.6% |
Mastercard Inc | |
Information Technology Services | 5.5% |
Workday Inc - Class A | |
Software | 4.3% |
CoStar Group Inc | |
Professional Services | 3.8% |
| | 33.9% |
| | | | | | |
Asset Allocation - (% of Net Assets) | |
Common Stocks | | 96.4% | |
Investment Companies | | 2.6% | |
Private Placements | | 1.0% | |
Warrants | | 0.0% | |
Other | | 0.0% |
| | | 100.0% |
| | |
Top Country Allocations - Long Positions - (% of Investment Securities) |
As of December 31, 2022 
| As of December 31, 2021 
|
Janus Henderson VIT Global Technology and Innovation Portfolio (unaudited)
Performance
| |
See important disclosures on the next page. |
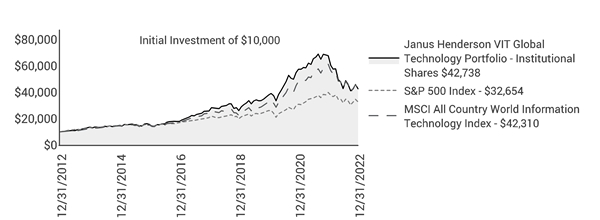
| | | | | | | | | | |
| | | | | | | | |
| | | | | | | | | |
Average Annual Total Return - for the periods ended December 31, 2022 | | | Prospectus Expense Ratios |
| | One
Year | Five
Year | Ten
Year | Since
Inception* | | | Total Annual Fund
Operating Expenses‡ |
Institutional Shares | | -36.95% | 10.57% | 15.63% | 4.53% | | | 0.73% |
Service Shares | | -37.12% | 10.28% | 15.34% | 4.27% | | | 0.97% |
S&P 500 Index | | -18.11% | 9.42% | 12.56% | 6.32% | | | |
MSCI All Country World Information Technology Index | | -31.07% | 12.08% | 15.52% | 4.20%** | | | |
Morningstar Quartile - Institutional Shares | | 3rd | 2nd | 2nd | 2nd | | | |
Morningstar Ranking - based on total returns for Technology Funds | | 146/268 | 70/199 | 64/177 | 49/110 | | | |
Returns quoted are past performance and do not guarantee future results; current performance may be lower or higher. Investment returns and principal value will vary; there may be a gain or loss when shares are sold. For the most recent month-end performance call 800.668.0434 or visit janushenderson.com/VITperformance.
Performance may be affected by risks that include those associated with foreign and emerging markets, fixed income securities, high-yield and high-risk securities, undervalued, overlooked and smaller capitalization companies, real estate related securities including Real Estate Investment Trusts (REITs), Environmental, Social and Governance (ESG) factors, non-diversification, portfolio turnover, derivatives, short sales, initial public offerings (IPOs) and potential conflicts of interest. Each product has different risks. Please see the prospectus for more information about risks, holdings and other details.
Returns do not reflect the deduction of fees, charges or expenses of any insurance product or qualified plan. If applied, returns would have been lower.
Returns include reinvestment of all dividends and distributions and do not reflect the deduction of taxes that a shareholder would pay on Portfolio distributions or redemptions of Portfolio shares. The returns do not include adjustments in accordance with generally accepted accounting principles required at the period end for financial reporting purposes.
Net dividends reinvested are the dividends that remain to be reinvested after foreign tax obligations have been met. Such obligations vary from country to country.
Ranking is for the share class shown only; other classes may have different performance characteristics. When an expense waiver is in effect, it may have a material effect on the total return, and therefore the ranking for the period.
© 2022 Morningstar, Inc. All Rights Reserved.
There is no assurance that the investment process will consistently lead to successful investing.
See Notes to Schedule of Investments and Other Information for index definitions.
Index performance does not reflect the expenses of managing a portfolio as an index is unmanaged and not available for direct investment.
Janus Henderson VIT Global Technology and Innovation Portfolio (unaudited)
Performance
See “Useful Information About Your Portfolio Report.”
*The Portfolio’s inception date – January 18, 2000
** The MSCI All Country World Information Technology Index since inception returns are calculated from January 31, 2000.
‡ As stated in the prospectus. See Financial Highlights for actual expense ratios during the reporting period.
Janus Henderson VIT Global Technology and Innovation Portfolio (unaudited)
Expense Examples
As a shareholder of the Portfolio, you incur two types of costs: (1) transaction costs and (2) ongoing costs, including management fees; 12b-1 distribution and shareholder servicing fees (applicable to Service Shares only); transfer agent fees and expenses payable pursuant to the Transfer Agency Agreement; and other Portfolio expenses. This example is intended to help you understand your ongoing costs (in dollars) of investing in the Portfolio and to compare these costs with the ongoing costs of investing in other mutual funds. To do so, compare this 5% hypothetical example with the 5% hypothetical examples that appear in the shareholder reports of the other funds. The example is based upon an investment of $1,000 invested at the beginning of the period and held for the six-months indicated, unless noted otherwise in the table and footnotes below.
Actual Expenses
The information in the table under the heading “Actual” provides information about actual account values and actual expenses. You may use the information in these columns, together with the amount you invested, to estimate the expenses that you paid over the period. Simply divide your account value by $1,000 (for example, an $8,600 account value divided by $1,000 = 8.6), then multiply the result by the number in the appropriate column for your share class under the heading entitled “Expenses Paid During Period” to estimate the expenses you paid on your account during the period.
Hypothetical Example for Comparison Purposes
The information in the table under the heading “Hypothetical (5% return before expenses)” provides information about hypothetical account values and hypothetical expenses based upon the Portfolio’s actual expense ratio and an assumed rate of return of 5% per year before expenses, which is not the Portfolio’s actual return. The hypothetical account values and expenses may not be used to estimate the actual ending account balance or expenses you paid for the period. You may use this information to compare the ongoing costs of investing in the Portfolio and other funds. To do so, compare this 5% hypothetical example with the 5% hypothetical examples that appear in the shareholder reports of the other funds. Additionally, for an analysis of the fees associated with an investment in either share class or other similar funds, please visit www.finra.org/fundanalyzer.
Please note that the expenses shown in the table are meant to highlight your ongoing costs only and do not reflect any transaction costs, such as any charges at the separate account level or contract level. These fees are fully described in the Portfolio’s prospectuses. Therefore, the hypothetical examples are useful in comparing ongoing costs only, and will not help you determine the relative total costs of owning different funds. In addition, if these transaction costs were included, your costs would have been higher.
| | | | | | | | | | | |
| | | | | | | | |
| | | Actual | | Hypothetical
(5% return before expenses) | |
| Beginning
Account
Value
(7/1/22) | Ending
Account
Value
(12/31/22) | Expenses
Paid During
Period
(7/1/22 - 12/31/22)† | | Beginning
Account
Value
(7/1/22) | Ending
Account
Value
(12/31/22) | Expenses
Paid During
Period
(7/1/22 - 12/31/22)† | Net Annualized
Expense Ratio
(7/1/22 - 12/31/22) |
Institutional Shares | $1,000.00 | $998.10 | $3.73 | | $1,000.00 | $1,021.48 | $3.77 | 0.74% |
Service Shares | $1,000.00 | $996.20 | $4.93 | | $1,000.00 | $1,020.27 | $4.99 | 0.98% |
† | Expenses Paid During Period are equal to the Net Annualized Expense Ratio multiplied by the average account value over the period, multiplied by 184/365 (to reflect the one-half year period). Expenses in the examples include the effect of applicable fee waivers and/or expense reimbursements, if any. Had such waivers and/or reimbursements not been in effect, your expenses would have been higher. Please refer to the Notes to Financial Statements or the Portfolio’s prospectuses for more information regarding waivers and/or reimbursements. |
Janus Henderson VIT Global Technology and Innovation Portfolio
Schedule of Investments
December 31, 2022
| | | | | | | | |
Shares
| | | Value | |
Common Stocks– 96.4% | | | |
Aerospace & Defense – 1.1% | | | |
| | Axon Enterprise Inc* | | 38,936 | | | $6,460,650 | |
Electronic Equipment, Instruments & Components – 1.2% | | | |
| | Amphenol Corp | | 67,265 | | | 5,121,557 | |
| | E Ink Holdings Inc | | 280,000 | | | 1,465,423 | |
| | | 6,586,980 | |
Equity Real Estate Investment Trusts (REITs) – 0.4% | | | |
| | Equinix Inc | | 3,418 | | | 2,238,893 | |
Information Technology Services – 9.2% | | | |
| | Adyen NV (144A)* | | 2,478 | | | 3,428,609 | |
| | Marqeta Inc - Class A* | | 338,524 | | | 2,068,382 | |
| | Mastercard Inc | | 90,725 | | | 31,547,804 | |
| | MongoDB Inc* | | 6,248 | | | 1,229,856 | |
| | Okta Inc* | | 32,957 | | | 2,251,952 | |
| | Snowflake Inc - Class A* | | 42,696 | | | 6,128,584 | |
| | Square Inc* | | 31,344 | | | 1,969,657 | |
| | Wix.com Ltd* | | 46,872 | | | 3,601,176 | |
| | | 52,226,020 | |
Interactive Media & Services – 4.0% | | | |
| | Alphabet Inc - Class C* | | 169,936 | | | 15,078,421 | |
| | Meta Platforms Inc - Class A* | | 66,314 | | | 7,980,227 | |
| | | 23,058,648 | |
Internet & Direct Marketing Retail – 3.8% | | | |
| | Amazon.com Inc* | | 155,695 | | | 13,078,380 | |
| | MercadoLibre Inc* | | 10,315 | | | 8,728,966 | |
| | | 21,807,346 | |
Professional Services – 3.8% | | | |
| | CoStar Group Inc* | | 277,981 | | | 21,482,372 | |
Road & Rail – 0.2% | | | |
| | Grab Holdings Ltd - Class A* | | 432,265 | | | 1,391,893 | |
Semiconductor & Semiconductor Equipment – 32.1% | | | |
| | Advanced Micro Devices Inc* | | 237,653 | | | 15,392,785 | |
| | Analog Devices Inc | | 92,815 | | | 15,224,444 | |
| | Applied Materials Inc | | 77,191 | | | 7,516,860 | |
| | ASML Holding NV | | 80,194 | | | 43,403,068 | |
| | KLA Corp | | 54,646 | | | 20,603,181 | |
| | Lam Research Corp | | 45,295 | | | 19,037,488 | |
| | Marvell Technology Inc | | 255,686 | | | 9,470,609 | |
| | NVIDIA Corp | | 107,256 | | | 15,674,392 | |
| | NXP Semiconductors NV | | 29,312 | | | 4,632,175 | |
| | ON Semiconductor Corp* | | 47,521 | | | 2,963,885 | |
| | Taiwan Semiconductor Manufacturing Co Ltd | | 859,000 | | | 12,521,049 | |
| | Texas Instruments Inc | | 98,737 | | | 16,313,327 | |
| | | 182,753,263 | |
Software – 35.6% | | | |
| | Atlassian Corp - Class A* | | 120,460 | | | 15,500,793 | |
| | Cadence Design Systems Inc* | | 68,844 | | | 11,059,100 | |
| | CCC Intelligent Solutions Holdings Inc* | | 712,625 | | | 6,199,837 | |
| | Ceridian HCM Holding Inc* | | 85,652 | | | 5,494,576 | |
| | Constellation Software Inc/Canada | | 8,863 | | | 13,839,583 | |
| | Dynatrace Inc* | | 161,730 | | | 6,194,259 | |
| | HubSpot Inc* | | 9,241 | | | 2,671,850 | |
| | Microsoft Corp | | 302,034 | | | 72,433,794 | |
| | Nice Ltd (ADR)* | | 33,162 | | | 6,377,053 | |
| | Olo Inc - Class A* | | 197,362 | | | 1,233,513 | |
| | Pagerduty Inc* | | 110,756 | | | 2,941,679 | |
| | Paylocity Holding Corp* | | 17,755 | | | 3,449,086 | |
| | Procore Technologies Inc* | | 107,852 | | | 5,088,457 | |
| | ServiceNow Inc* | | 24,564 | | | 9,537,464 | |
| | Synopsys Inc* | | 15,353 | | | 4,902,059 | |
| | |
See Notes to Schedule of Investments and Other Information and Notes to Financial Statements. |
| |
8 | DECEMBER 31, 2022 |
Janus Henderson VIT Global Technology and Innovation Portfolio
Schedule of Investments
December 31, 2022
| | | | | | | | |
Shares
| | | Value | |
Common Stocks– (continued) | | | |
Software– (continued) | | | |
| | Tyler Technologies Inc* | | 35,755 | | | $11,527,770 | |
| | Workday Inc - Class A* | | 146,366 | | | 24,491,423 | |
| | | 202,942,296 | |
Technology Hardware, Storage & Peripherals – 3.5% | | | |
| | Apple Inc | | 154,689 | | | 20,098,742 | |
Wireless Telecommunication Services – 1.5% | | | |
| | T-Mobile US Inc* | | 61,118 | | | 8,556,520 | |
Total Common Stocks (cost $436,604,230) | | 549,603,623 | |
Private Placements– 1.0% | | | |
Professional Services – 0.2% | | | |
| | Apartment List Inc*,¢,§ | | 485,075 | | | 1,081,717 | |
Software – 0.8% | | | |
| | Magic Leap Inc - Class A private equity common shares*,¢,§ | | 3,260 | | | 0 | |
| | Via Transportation Inc - Preferred shares*,¢,§ | | 86,990 | | | 3,839,739 | |
| | Via Transportation Inc - private equity common shares*,¢,§ | | 10,455 | | | 461,484 | |
| | | 4,301,223 | |
Total Private Placements (cost $7,734,745) | | 5,382,940 | |
Warrants– 0% | | | |
Road & Rail – 0% | | | |
| | Grab Holdings Ltd, expires 12/1/26*((cost $141,055) | | 44,659 | | | 23,995 | |
Investment Companies– 2.6% | | | |
Money Markets – 2.6% | | | |
| | Janus Henderson Cash Liquidity Fund LLC, 4.2633%ºº,£((cost $14,942,613) | | 14,941,120 | | | 14,944,109 | |
Total Investments (total cost $459,422,643) – 100.0% | | 569,954,667 | |
Cash, Receivables and Other Assets, net of Liabilities – 0% | | 185,133 | |
Net Assets – 100% | | $570,139,800 | |
| | | | | | |
Summary of Investments by Country - (Long Positions) (unaudited) |
| |
| | | | | % of | |
| | | | | Investment | |
Country | | Value | | Securities | |
United States | | $475,173,852 | | 83.4 | % |
Netherlands | | 46,831,677 | | 8.2 | |
Taiwan | | 13,986,472 | | 2.5 | |
Canada | | 13,839,583 | | 2.4 | |
Israel | | 9,978,229 | | 1.8 | |
Argentina | | 8,728,966 | | 1.5 | |
Singapore | | 1,415,888 | | 0.2 | |
| | | | | | |
| | | | | | |
Total | | $569,954,667 | | 100.0 | % |
| | |
See Notes to Schedule of Investments and Other Information and Notes to Financial Statements. |
| |
Janus Aspen Series | 9 |
Janus Henderson VIT Global Technology and Innovation Portfolio
Schedule of Investments
December 31, 2022
Schedules of Affiliated Investments – (% of Net Assets)
| | | | | | | | | | | |
| | Dividend Income | Realized Gain/(Loss) | Change in Unrealized Appreciation/ Depreciation | Value at 12/31/22 |
Investment Companies - 2.6% |
Money Markets - 2.6% | |
| | Janus Henderson Cash Liquidity Fund LLC, 4.2633%ºº | $ | 422,614 | $ | 665 | $ | 1,496 | $ | 14,944,109 |
Investments Purchased with Cash Collateral from Securities Lending - N/A |
Investment Companies - N/A | |
| | Janus Henderson Cash Collateral Fund LLC, 4.1397%ºº | | 19,627∆ | | - | | - | | - |
Total Affiliated Investments - 2.6% | $ | 442,241 | $ | 665 | $ | 1,496 | $ | 14,944,109 |
| | | | | | | | | | | |
| | Value at 12/31/21 | Purchases | Sales Proceeds | Value at 12/31/22 |
Investment Companies - 2.6% |
Money Markets - 2.6% | |
| | Janus Henderson Cash Liquidity Fund LLC, 4.2633%ºº | | 16,336,249 | | 161,043,864 | | (162,438,165) | | 14,944,109 |
Investments Purchased with Cash Collateral from Securities Lending - N/A |
Investment Companies - N/A | |
| | Janus Henderson Cash Collateral Fund LLC, 4.1397%ºº | | 7,875,534 | | 33,536,362 | | (41,411,896) | | - |
| | |
See Notes to Schedule of Investments and Other Information and Notes to Financial Statements. |
| |
10 | DECEMBER 31, 2022 |
Janus Henderson VIT Global Technology and Innovation Portfolio
Notes to Schedule of Investments and Other Information
| | |
MSCI All Country World Information Technology IndexSM | MSCI All Country World Information Technology IndexSM reflects the performance of information technology stocks from developed and emerging markets. |
S&P 500® Index | S&P 500® Index reflects U.S. large-cap equity performance and represents broad U.S. equity market performance. |
| | |
ADR | American Depositary Receipt |
LLC | Limited Liability Company |
| | |
144A | Securities sold under Rule 144A of the Securities Act of 1933, as amended, are subject to legal and/or contractual restrictions on resale and may not be publicly sold without registration under the 1933 Act. Unless otherwise noted, these securities have been determined to be liquid under guidelines established by the Board of Trustees. The total value of 144A securities as of the year ended December 31, 2022 is $3,428,609, which represents 0.6% of net assets. |
* | Non-income producing security. |
ºº | Rate shown is the 7-day yield as of December 31, 2022. |
¢ | Security is valued using significant unobservable inputs. The total value of Level 3 securities as of the year ended December 31, 2022 is $5,382,940, which represents 0.94% of net assets. |
£ | The Portfolio may invest in certain securities that are considered affiliated companies. As defined by the Investment Company Act of 1940, as amended, an affiliated company is one in which the Portfolio owns 5% or more of the outstanding voting securities, or a company which is under common ownership or control. |
∆ | Net of income paid to the securities lending agent and rebates paid to the borrowing counterparties. |
| | | | | | | | | | | |
§ | Schedule of Restricted Securities (as of December 31, 2022) |
| | | | | | | | Value as a | |
| | Acquisition | | | | | | % of Net | |
| | Date | | Cost | | Value | | Assets | |
Apartment List Inc | 11/2/20 | $ | 1,771,979 | $ | 1,081,717 | | 0.19 | % |
Magic Leap Inc - Class A private equity common shares | 10/5/17 | | 1,585,170 | | 0 | | 0.00 | |
Via Transportation Inc - Preferred shares | 11/4/21 | | 3,925,258 | | 3,839,739 | | 0.67 | |
Via Transportation Inc - private equity common shares | 12/2/21 | | 452,338 | | 461,484 | | 0.08 | |
Total | | $ | 7,734,745 | $ | 5,382,940 | | 0.94 | % |
| | | | | | | | | |
The Portfolio has registration rights for certain restricted securities held as of December 31, 2022. The issuer incurs all registration costs. | |
Janus Henderson VIT Global Technology and Innovation Portfolio
Notes to Schedule of Investments and Other Information
| | | | | | | | | | | | | |
The following is a summary of the inputs that were used to value the Portfolio’s investments in securities and other financial instruments as of December 31, 2022. See Notes to Financial Statements for more information. |
| |
Valuation Inputs Summary |
| | | | | | | |
| | | | | Level 2 - | | Level 3 - |
| | | Level 1 - | | Other Significant | | Significant |
| | | Quoted Prices | | Observable Inputs | | Unobservable Inputs |
| | | | | | | |
Assets | | | | | | |
Investments In Securities: | | | | | | |
Common Stocks | | | | | | |
Electronic Equipment, Instruments & Components | $ | 5,121,557 | $ | 1,465,423 | $ | - |
Information Technology Services | | 48,797,411 | | 3,428,609 | | - |
Semiconductor & Semiconductor Equipment | | 126,829,146 | | 55,924,117 | | - |
All Other | | 308,037,360 | | - | | - |
Private Placements | | - | | - | | 5,382,940 |
Warrants | | 23,995 | | - | | - |
Investment Companies | | - | | 14,944,109 | | - |
Total Assets | $ | 488,809,469 | $ | 75,762,258 | $ | 5,382,940 |
| | | | | | | |
Janus Henderson VIT Global Technology and Innovation Portfolio
Statement of Assets and Liabilities
December 31, 2022
| | | | | | | |
| | | | | | |
Assets: | | | | |
| Unaffiliated investments, at value (cost $444,480,030) | | $ | 555,010,558 | |
| Affiliated investments, at value (cost $14,942,613) | | | 14,944,109 | |
| Trustees' deferred compensation | | | 18,483 | |
| Receivables: | | | | |
| | Portfolio shares sold | | | 650,822 | |
| | Dividends | | | 170,586 | |
| | Dividends from affiliates | | | 89,625 | |
| | Foreign tax reclaims | | | 694 | |
| Other assets | | | 6,227 | |
Total Assets | | | 570,891,104 | |
Liabilities: | | | | |
| Payables: | | | — | |
| | Advisory fees | | | 340,744 | |
| | Portfolio shares repurchased | | | 139,343 | |
| | 12b-1 Distribution and shareholder servicing fees | | | 125,083 | |
| | Professional fees | | | 49,408 | |
| | Transfer agent fees and expenses | | | 27,870 | |
| | Trustees' deferred compensation fees | | | 18,483 | |
| | Custodian fees | | | 2,015 | |
| | Affiliated portfolio administration fees payable | | | 1,331 | |
| | Trustees' fees and expenses | | | 277 | |
| | Accrued expenses and other payables | | | 46,750 | |
Total Liabilities | | | 751,304 | |
Net Assets | | $ | 570,139,800 | |
Net Assets Consist of: | | | | |
| Capital (par value and paid-in surplus) | | $ | 513,309,049 | |
| Total distributable earnings (loss) | | | 56,830,751 | |
Total Net Assets | | $ | 570,139,800 | |
Net Assets - Institutional Shares | | $ | 34,566,488 | |
| Shares Outstanding, $0.001 Par Value (unlimited shares authorized) | | | 3,343,988 | |
Net Asset Value Per Share | | $ | 10.34 | |
Net Assets - Service Shares | | $ | 535,573,312 | |
| Shares Outstanding, $0.001 Par Value (unlimited shares authorized) | | | 51,446,024 | |
Net Asset Value Per Share | | $ | 10.41 | |
| | |
See Notes to Financial Statements. |
| |
Janus Aspen Series | 13 |
Janus Henderson VIT Global Technology and Innovation Portfolio
Statement of Operations
For the year ended December 31, 2022
| | | | | | |
| | | | | |
Investment Income: | | | |
| Dividends | $ | 3,614,730 | |
| Dividends from affiliates | | 422,614 | |
| Affiliated securities lending income, net | | 19,627 | |
| Unaffiliated securities lending income, net | | 735 | |
| Other income | | 84 | |
| Foreign tax withheld | | (198,292) | |
Total Investment Income | | 3,859,498 | |
Expenses: | | | |
| Advisory fees | | 4,209,296 | |
| 12b-1 Distribution and shareholder servicing fees: | | | |
| | Service Shares | | 1,537,863 | |
| Transfer agent administrative fees and expenses: | | | |
| | Institutional Shares | | 20,646 | |
| | Service Shares | | 308,205 | |
| Other transfer agent fees and expenses: | | | |
| | Institutional Shares | | 966 | |
| | Service Shares | | 7,628 | |
| Professional fees | | 56,442 | |
| Custodian fees | | 16,967 | |
| Affiliated portfolio administration fees | | 16,442 | |
| Trustees’ fees and expenses | | 14,931 | |
| Shareholder reports expense | | 1,248 | |
| Registration fees | | 293 | |
| Other expenses | | 79,650 | |
Total Expenses | | 6,270,577 | |
Net Investment Income/(Loss) | | (2,411,079) | |
Net Realized Gain/(Loss) on Investments: | | | |
| Investments and foreign currency transactions | | (59,566,653) | |
| Investments in affiliates | | 665 | |
Total Net Realized Gain/(Loss) on Investments | | (59,565,988) | |
Change in Unrealized Net Appreciation/Depreciation: | | | |
| Investments, foreign currency translations and Trustees’ deferred compensation | | (280,125,098) | �� |
| Investments in affiliates | | 1,496 | |
Total Change in Unrealized Net Appreciation/Depreciation | | (280,123,602) | |
Net Increase/(Decrease) in Net Assets Resulting from Operations | $ | (342,100,669) | |
| | | | | |
| | |
See Notes to Financial Statements. |
| |
14 | DECEMBER 31, 2022 |
Janus Henderson VIT Global Technology and Innovation Portfolio
Statements of Changes in Net Assets
| | | | | | | | | |
| | | | | | | | |
| | | Year ended
December 31, 2022 | | Year ended
December 31, 2021 | |
| | | | | | | | | |
Operations: | | | | | | |
| Net investment income/(loss) | $ | (2,411,079) | | $ | (4,206,315) | |
| Net realized gain/(loss) on investments | | (59,565,988) | | | 123,414,165 | |
| Change in unrealized net appreciation/depreciation | | (280,123,602) | | | 20,265,234 | |
Net Increase/(Decrease) in Net Assets Resulting from Operations | | (342,100,669) | | | 139,473,084 | |
Dividends and Distributions to Shareholders: | | | | | | |
| | Institutional Shares | | (7,665,574) | | | (7,520,075) | |
| | Service Shares | | (112,948,823) | | | (107,940,768) | |
Net Decrease from Dividends and Distributions to Shareholders | | (120,614,397) | | | (115,460,843) | |
Capital Share Transactions: | | | | | | |
| | Institutional Shares | | 4,973,863 | | | 6,607,340 | |
| | Service Shares | | 90,429,122 | | | 122,969,787 | |
Net Increase/(Decrease) from Capital Share Transactions | | 95,402,985 | | | 129,577,127 | |
Net Increase/(Decrease) in Net Assets | | (367,312,081) | | | 153,589,368 | |
Net Assets: | | | | | | |
| Beginning of period | | 937,451,881 | | | 783,862,513 | |
| End of period | $ | 570,139,800 | | $ | 937,451,881 | |
| | | | | | | | |
| | |
See Notes to Financial Statements. |
| |
Janus Aspen Series | 15 |
Janus Henderson VIT Global Technology and Innovation Portfolio
Financial Highlights
| | | | | | | | | | | | | | | | | | | |
Institutional Shares | | | | | | | | | | | | | | | |
For a share outstanding during the year ended December 31 | | 2022 | | | 2021 | | | 2020 | | | 2019 | | | 2018 | |
| Net Asset Value, Beginning of Period | | $20.75 | | | $20.34 | | | $14.88 | | | $11.06 | | | $11.40 | |
| Income/(Loss) from Investment Operations: | | | | | | | | | | | | | | | |
| | Net investment income/(loss)(1) | | (0.02) | | | (0.05) | | | (0.01) | | | 0.02 | | | 0.01 | |
| | Net realized and unrealized gain/(loss) | | (7.60) | | | 3.47 | | | 7.04 | | | 4.81 | | | 0.20 | |
| Total from Investment Operations | | (7.62) | | | 3.42 | | | 7.03 | | | 4.83 | | | 0.21 | |
| Less Dividends and Distributions: | | | | | | | | | | | | | | | |
| | Dividends (from net investment income) | | — | | | (0.05) | | | — | | | — | | | — | |
| | Distributions (from capital gains) | | (2.79) | | | (2.96) | | | (1.57) | | | (1.01) | | | (0.55) | |
| Total Dividends and Distributions | | (2.79) | | | (3.01) | | | (1.57) | | | (1.01) | | | (0.55) | |
| Net Asset Value, End of Period | | $10.34 | | | $20.75 | | | $20.34 | | | $14.88 | | | $11.06 | |
| Total Return* | | (36.95)% | | | 18.01% | | | 51.20% | | | 45.17% | | | 1.19% | |
| Net Assets, End of Period (in thousands) | | $34,566 | | | $59,208 | | | $51,009 | | | $34,515 | | | $24,240 | |
| Average Net Assets for the Period (in thousands) | | $41,432 | | | $56,037 | | | $39,592 | | | $30,035 | | | $27,658 | |
| Ratios to Average Net Assets**: | | | | | | | | | | | | | | | |
| | Ratio of Gross Expenses | | 0.72% | | | 0.72% | | | 0.75% | | | 0.75% | | | 0.76% | |
| | Ratio of Net Expenses (After Waivers and Expense Offsets) | | 0.72% | | | 0.72% | | | 0.75% | | | 0.75% | | | 0.76% | |
| | Ratio of Net Investment Income/(Loss) | | (0.14)% | | | (0.25)% | | | (0.07)% | | | 0.11% | | | 0.09% | |
| Portfolio Turnover Rate | | 43% | | | 47% | | | 44% | | | 30% | | | 32% | |
| | | | | | | | | | | | | | | | | | | |
| |
* Total return includes adjustments in accordance with generally accepted accounting principles required at the year or period end and are not annualized for periods of less than one full year. Total return does not include fees, charges, or expenses imposed by the variable annuity and life insurance contracts for which Janus Aspen Series serves as an underlying investment vehicle. ** Annualized for periods of less than one full year. (1) Per share amounts are calculated based on average shares outstanding during the year or period. |
| | |
See Notes to Financial Statements. |
| |
16 | DECEMBER 31, 2022 |
Janus Henderson VIT Global Technology and Innovation Portfolio
Financial Highlights
| | | | | | | | | | | | | | | | | | | |
Service Shares | | | | | | | | | | | | | | | |
For a share outstanding during the year ended December 31 | | 2022 | | | 2021 | | | 2020 | | | 2019 | | | 2018 | |
| Net Asset Value, Beginning of Period | | $20.91 | | | $20.51 | | | $15.03 | | | $11.19 | | | $11.56 | |
| Income/(Loss) from Investment Operations: | | | | | | | | | | | | | | | |
| | Net investment income/(loss)(1) | | (0.05) | | | (0.10) | | | (0.05) | | | (0.02) | | | (0.02) | |
| | Net realized and unrealized gain/(loss) | | (7.66) | | | 3.49 | | | 7.10 | | | 4.87 | | | 0.20 | |
| Total from Investment Operations | | (7.71) | | | 3.39 | | | 7.05 | | | 4.85 | | | 0.18 | |
| Less Dividends and Distributions: | | | | | | | | | | | | | | | |
| | Dividends (from net investment income) | | — | | | (0.03) | | | — | | | — | | | — | |
| | Distributions (from capital gains) | | (2.79) | | | (2.96) | | | (1.57) | | | (1.01) | | | (0.55) | |
| Total Dividends and Distributions | | (2.79) | | | (2.99) | | | (1.57) | | | (1.01) | | | (0.55) | |
| Net Asset Value, End of Period | | $10.41 | | | $20.91 | | | $20.51 | | | $15.03 | | | $11.19 | |
| Total Return* | | (37.12)% | | | 17.69% | | | 50.80% | | | 44.82% | | | 0.91% | |
| Net Assets, End of Period (in thousands) | | $535,573 | | | $878,244 | | | $732,854 | | | $508,622 | | | $370,831 | |
| Average Net Assets for the Period (in thousands) | | $618,321 | | | $822,224 | | | $577,972 | | | $449,847 | | | $416,626 | |
| Ratios to Average Net Assets**: | | | | | | | | | | | | | | | |
| | Ratio of Gross Expenses | | 0.97% | | | 0.97% | | | 0.99% | | | 0.99% | | | 1.00% | |
| | Ratio of Net Expenses (After Waivers and Expense Offsets) | | 0.97% | | | 0.97% | | | 0.99% | | | 0.99% | | | 1.00% | |
| | Ratio of Net Investment Income/(Loss) | | (0.38)% | | | (0.49)% | | | (0.32)% | | | (0.13)% | | | (0.16)% | |
| Portfolio Turnover Rate | | 43% | | | 47% | | | 44% | | | 30% | | | 32% | |
| | | | | | | | | | | | | | | | | | | |
| |
* Total return includes adjustments in accordance with generally accepted accounting principles required at the year or period end and are not annualized for periods of less than one full year. Total return does not include fees, charges, or expenses imposed by the variable annuity and life insurance contracts for which Janus Aspen Series serves as an underlying investment vehicle. ** Annualized for periods of less than one full year. (1) Per share amounts are calculated based on average shares outstanding during the year or period. |
| | |
See Notes to Financial Statements. |
| |
Janus Aspen Series | 17 |
Janus Henderson VIT Global Technology and Innovation Portfolio
Notes to Financial Statements
1. Organization and Significant Accounting Policies
Janus Henderson VIT Global Technology and Innovation Portfolio (the “Portfolio”) is a series of Janus Aspen Series (the “Trust”), which is organized as a Delaware statutory trust and is registered under the Investment Company Act of 1940, as amended (the “1940 Act”), as an open-end management investment company, and therefore has applied the specialized accounting and reporting guidance in Financial Accounting Standards Board (“FASB”) Accounting Standards Codification (“ASC”) Topic 946. The Trust offers 11 portfolios, each of which offers multiple share classes, with differing investment objectives and policies. The Portfolio seeks long-term growth of capital. The Portfolio is classified as diversified, as defined in the 1940 Act. Janus Henderson Investors US LLC is the investment adviser (the “Adviser”) to the Portfolio.
The Portfolio currently offers two classes of shares: Institutional Shares and Service Shares. Each class represents an interest in the same portfolio of investments. Institutional Shares are offered only in connection with investment in and payments under variable insurance contracts as well as certain qualified retirement plans. Service Shares are offered only in connection with investment in and payments under variable insurance contracts as well as certain qualified retirement plans that require a fee from Portfolio assets to procure distribution and administrative services to contract owners and plan participants.
Shareholders, including participating insurance companies, as well as accounts, may from time to time own (beneficially or of record) a significant percentage of the Portfolio’s Shares and can be considered to “control” the Portfolio when that ownership exceeds 25% of the Portfolio’s assets (and which may differ from control as determined in accordance with United States of America generally accepted accounting principles ("US GAAP")).
The following accounting policies have been followed by the Portfolio and are in conformity with US GAAP.
Investment Valuation
Portfolio holdings are valued in accordance with policies and procedures established by the Adviser pursuant to Rule 2a-5 under the 1940 Act and approved by and subject to the oversight of the Trustees (the “Valuation Procedures”). Equity securities traded on a domestic securities exchange are generally valued at readily available market quotations, which are (i) the official close prices or (ii) last sale prices on the primary market or exchange in which the securities trade. If such price is lacking for the trading period immediately preceding the time of determination, such securities are generally valued at their current bid price. Equity securities that are traded on a foreign exchange are generally valued at the closing prices on such markets. In the event that there is no current trading volume on a particular security in such foreign exchange, the bid price from the primary exchange is generally used to value the security. Foreign securities and currencies are converted to U.S. dollars using the current spot USD dollar exchange rate in effect at the close of the New York Stock Exchange (“NYSE”). The Portfolio will determine the market value of individual securities held by it by using prices provided by one or more approved professional pricing services or, as needed, by obtaining market quotations from independent broker-dealers. Most debt securities are valued in accordance with the evaluated bid price supplied by the Adviser-approved pricing service that is intended to reflect market value. The evaluated bid price supplied by the pricing service is an evaluation that may consider factors such as security prices, yields, maturities and ratings. Certain short-term securities maturing within 60 days or less may be evaluated and valued on an amortized cost basis provided that the amortized cost determined approximates market value. Securities for which market quotations or evaluated prices are not readily available or deemed unreliable are valued at fair value determined in good faith by the Adviser pursuant to the Valuation Procedures. Circumstances in which fair valuation may be utilized include, but are not limited to: (i) a significant event that may affect the securities of a single issuer, such as a merger, bankruptcy, or significant issuer-specific development; (ii) an event that may affect an entire market, such as a natural disaster or significant governmental action; (iii) a nonsignificant event such as a market closing early or not opening, or a security trading halt; and (iv) pricing of a nonvalued security and a restricted or nonpublic security. Special valuation considerations may apply with respect to “odd-lot” fixed-income transactions which, due to their small size, may receive evaluated prices by pricing services which reflect a large block trade and not what actually could be obtained for the odd-lot position. The valuation policies provide for the use of systematic fair valuation models provided by independent pricing services to value foreign equity securities in order to adjust for stale pricing, which may occur between the close of certain foreign exchanges and the close of the NYSE. The value of the securities of other mutual funds held by a Portfolio, if any, will be calculated using the NAV of such mutual funds.
Janus Henderson VIT Global Technology and Innovation Portfolio
Notes to Financial Statements
Valuation Inputs Summary
FASB ASC 820, Fair Value Measurements and Disclosures (“ASC 820”), defines fair value, establishes a framework for measuring fair value, and expands disclosure requirements regarding fair value measurements. This standard emphasizes that fair value is a market-based measurement that should be determined based on the assumptions that market participants would use in pricing an asset or liability and establishes a hierarchy that prioritizes inputs to valuation techniques used to measure fair value. These inputs are summarized into three broad levels:
Level 1 – Unadjusted quoted prices in active markets the Portfolio has the ability to access for identical assets or liabilities.
Level 2 – Observable inputs other than unadjusted quoted prices included in Level 1 that are observable for the asset or liability either directly or indirectly. These inputs may include quoted prices for the identical instrument on an inactive market, prices for similar instruments, interest rates, prepayment speeds, credit risk, yield curves, default rates and similar data.
Assets or liabilities categorized as Level 2 in the hierarchy generally include: debt securities fair valued in accordance with the evaluated bid or ask prices supplied by a pricing service; securities traded on OTC markets and listed securities for which no sales are reported that are fair valued at the latest bid price (or yield equivalent thereof) obtained from one or more dealers transacting in a market for such securities or by a pricing service approved by the Portfolio’s Trustees; certain short-term debt securities with maturities of 60 days or less that are fair valued at amortized cost; and equity securities of foreign issuers whose fair value is determined by using systematic fair valuation models provided by independent third parties in order to adjust for stale pricing which may occur between the close of certain foreign exchanges and the close of the NYSE. Other securities that may be categorized as Level 2 in the hierarchy include, but are not limited to, preferred stocks, bank loans, swaps, investments in unregistered investment companies, options, and forward contracts.
Level 3 – Unobservable inputs for the asset or liability to the extent that relevant observable inputs are not available, representing the Portfolio’s own assumptions about the assumptions that a market participant would use in valuing the asset or liability, and that would be based on the best information available.
There have been no significant changes in valuation techniques used in valuing any such positions held by the Portfolio since the beginning of the fiscal year.
The inputs or methodology used for fair valuing securities are not necessarily an indication of the risk associated with investing in those securities. The summary of inputs used as of December 31, 2022 to fair value the Portfolio’s investments in securities and other financial instruments is included in the “Valuation Inputs Summary” in the Notes to Schedule of Investments and Other Information.
The Portfolio did not hold a significant amount of Level 3 securities as of December 31, 2022.
Investment Transactions and Investment Income
Investment transactions are accounted for as of the date purchased or sold (trade date). Dividend income is recorded on the ex-dividend date. Certain dividends from foreign securities will be recorded as soon as the Portfolio is informed of the dividend, if such information is obtained subsequent to the ex-dividend date. Dividends from foreign securities may be subject to withholding taxes in foreign jurisdictions. Non-cash dividends, if any, are recorded on the ex-dividend date at fair value. Interest income is recorded daily on the accrual basis and includes amortization of premiums and accretion of discounts. The Portfolio classifies gains and losses on prepayments received as an adjustment to interest income. Debt securities may be placed in non-accrual status and related interest income may be reduced by stopping current accruals and writing off interest receivables when collection of all or a portion of interest has become doubtful. Gains and losses are determined on the identified cost basis, which is the same basis used for federal income tax purposes. Income, as well as gains and losses, both realized and unrealized, are allocated daily to each class of shares based upon the ratio of net assets represented by each class as a percentage of total net assets.
Expenses
The Portfolio bears expenses incurred specifically on its behalf. Each class of shares bears a portion of general expenses, which are allocated daily to each class of shares based upon the ratio of net assets represented by each class as a percentage of total net assets. Expenses directly attributable to a specific class of shares are charged against the operations of such class.
Janus Henderson VIT Global Technology and Innovation Portfolio
Notes to Financial Statements
Estimates
The preparation of financial statements in conformity with US GAAP requires management to make estimates and assumptions that affect the reported amount of assets and liabilities and disclosure of contingent assets and liabilities at the date of the financial statements, and the reported amounts of income and expenses during the reporting period. Actual results could differ from those estimates.
Indemnifications
In the normal course of business, the Portfolio may enter into contracts that contain provisions for indemnification of other parties against certain potential liabilities. The Portfolio’s maximum exposure under these arrangements is unknown, and would involve future claims that may be made against the Portfolio that have not yet occurred. Currently, the risk of material loss from such claims is considered remote.
Foreign Currency Translations
The Portfolio does not isolate that portion of the results of operations resulting from the effect of changes in foreign exchange rates on investments from the fluctuations arising from changes in market prices of securities held at the date of the financial statements. Net unrealized appreciation or depreciation of investments and foreign currency translations arise from changes in the value of assets and liabilities, including investments in securities held at the date of the financial statements, resulting from changes in the exchange rates and changes in market prices of securities held.
Currency gains and losses are also calculated on payables and receivables that are denominated in foreign currencies. The payables and receivables are generally related to foreign security transactions and income translations.
Foreign currency-denominated assets and forward currency contracts may involve more risks than domestic transactions, including currency risk, counterparty risk, political and economic risk, regulatory risk and equity risk. Risks may arise from unanticipated movements in the value of foreign currencies relative to the U.S. dollar.
Dividends and Distributions
The Portfolio may make semiannual distributions of substantially all of its investment income and an annual distribution of its net realized capital gains (if any).
The Portfolio may make certain investments in real estate investment trusts (“REITs”) which pay dividends to their shareholders based upon funds available from operations. It is quite common for these dividends to exceed the REITs’ taxable earnings and profits, resulting in the excess portion of such dividends being designated as a return of capital. If the Portfolio distributes such amounts, such distributions could constitute a return of capital to shareholders for federal income tax purposes.
Federal Income Taxes
The Portfolio intends to continue to qualify as a regulated investment company and distribute all of its taxable income in accordance with the requirements of Subchapter M of the Internal Revenue Code. Management has analyzed the Portfolio’s tax positions taken for all open federal income tax years, generally a three-year period, and has concluded that no provision for federal income tax is required in the Portfolio’s financial statements. The Portfolio is not aware of any tax positions for which it is reasonably possible that the total amounts of unrecognized tax benefits will significantly change in the next twelve months.
2. Other Investments and Strategies
Additional Investment Risk
The U.S. government and the Federal Reserve, as well as certain foreign governments and central banks, have taken extraordinary actions to support local and global economies and the financial markets in response to the COVID-19 pandemic. This and other government intervention into the economy and financial markets to address the COVID-19 pandemic may not work as intended, particularly if the efforts are perceived by investors as being unlikely to achieve the desired results. Government actions to mitigate the economic impact of the pandemic have resulted in a large expansion of government deficits and debt, the long term consequences of which are not known. The COVID-19 pandemic could adversely affect the value and liquidity of a Portfolio’s investments, impair a Portfolio’s ability to satisfy redemption requests, and negatively impact a Portfolio’s performance. In addition, the outbreak of COVID-19, and measures taken to mitigate its effects, could result in disruptions to the services provided to a Portfolio by its service providers.
Janus Henderson VIT Global Technology and Innovation Portfolio
Notes to Financial Statements
Widespread disease, including pandemics and epidemics, and natural or environmental disasters, including those which may be attributable to global climate change, such as earthquakes, fires, floods, hurricanes, tsunamis and weather-related phenomena generally, have been and can be highly disruptive to economies and markets, adversely impacting individual companies, sectors, industries, markets, currencies, interest and inflation rates, credit ratings, investor sentiment, and other factors affecting the value of a Portfolio’s investments. Economies and financial markets throughout the world have become increasingly interconnected, which increases the likelihood that events or conditions in one region or country will adversely affect markets or issuers in other regions or countries, including the United States. These disruptions could prevent a Portfolio from executing advantageous investment decisions in a timely manner and negatively impact a Portfolio’s ability to achieve its investment objective(s). Any such event(s) could have a significant adverse impact on the value of a Portfolio. In addition, these disruptions could also impair the information technology and other operational systems upon which the Portfolio’s service providers, including the Adviser or the subadviser (as applicable), rely, and could otherwise disrupt the ability of employees of the Portfolio’s service providers to perform essential tasks on behalf of the Portfolio. Adverse weather conditions may also have a particularly significant negative effect on issuers in the agricultural sector and on insurance and reinsurance companies that insure or reinsure against the impact of natural disasters.
A number of countries in the European Union (the “EU”) have experienced, and may continue to experience, severe economic and financial difficulties. In particular, many EU nations are susceptible to economic risks associated with high levels of debt. Many non-governmental issuers, and even certain governments, have defaulted on, or been forced to restructure, their debts. Many other issuers have faced difficulties obtaining credit or refinancing existing obligations. Financial institutions have in many cases required government or central bank support, have needed to raise capital, and/or have been impaired in their ability to extend credit. As a result, financial markets in the EU have experienced extreme volatility and declines in asset values and liquidity. These difficulties may continue, worsen, or spread further within the EU. Responses to these financial problems by European governments, central banks, and others, including austerity measures and reforms, may not work, may result in social unrest, and may limit future growth and economic recovery or have other unintended consequences. Among other things, these developments have adversely affected the value and exchange rate of the euro and pound sterling, and may continue to significantly affect the economies of all EU countries, which in turn may have a material adverse effect on the Portfolio’s investments in such countries, other countries that depend on EU countries for significant amounts of trade or investment, or issuers with exposure to debt issued by certain EU countries.
Real Estate Investing
The Portfolio may invest in equity and debt securities of real estate-related companies. Such companies may include those in the real estate industry or real estate-related industries. These securities may include common stocks, corporate bonds, preferred stocks, and other equity securities, including, but not limited to, mortgage-backed securities, real estate-backed securities, securities of REITs and similar REIT-like entities. A REIT is a trust that invests in real estate-related projects, such as properties, mortgage loans, and construction loans. REITs are generally categorized as equity, mortgage, or hybrid REITs. A REIT may be listed on an exchange or traded OTC.
Restricted Security Transactions
Restricted securities held by the Portfolio may not be sold except in exempt transactions or in a public offering registered under the Securities Act of 1933, as amended. The risk of investing in such securities is generally greater than the risk of investing in the securities of widely held, publicly traded companies. Lack of a secondary market and resale restrictions may result in the inability of the Portfolio to sell a security at a fair price and may substantially delay the sale of the security. In addition, these securities may exhibit greater price volatility than securities for which secondary markets exist.
Counterparties
Portfolio transactions involving a counterparty are subject to the risk that the counterparty or a third party will not fulfill its obligation to the Portfolio (“counterparty risk”). Counterparty risk may arise because of the counterparty’s financial condition (i.e., financial difficulties, bankruptcy, or insolvency), market activities and developments, or other reasons, whether foreseen or not. A counterparty’s inability to fulfill its obligation may result in significant financial loss to the Portfolio. The Portfolio may be unable to recover its investment from the counterparty or may obtain a limited recovery, and/or recovery may be delayed. The extent of the Portfolio’s exposure to counterparty risk with respect to financial assets and liabilities approximates its carrying value. See the "Offsetting Assets and Liabilities" section of this Note for further details.
Janus Henderson VIT Global Technology and Innovation Portfolio
Notes to Financial Statements
The Portfolio may be exposed to counterparty risk through participation in various programs, including, but not limited to, lending its securities to third parties, cash sweep arrangements whereby the Portfolio’s cash balance is invested in one or more types of cash management vehicles, as well as investments in, but not limited to, repurchase agreements, debt securities, and derivatives, including various types of swaps, futures and options. The Portfolio intends to enter into financial transactions with counterparties that the Adviser believes to be creditworthy at the time of the transaction. There is always the risk that the Adviser’s analysis of a counterparty’s creditworthiness is incorrect or may change due to market conditions. To the extent that the Portfolio focuses its transactions with a limited number of counterparties, it will have greater exposure to the risks associated with one or more counterparties.
Securities Lending
Under procedures adopted by the Trustees, the Portfolio may seek to earn additional income by lending securities to certain qualified broker-dealers and institutions. JPMorgan Chase Bank, National Association acts as securities lending agent and a limited purpose custodian or subcustodian to receive and disburse cash balances and cash collateral, hold short-term investments, hold collateral, and perform other custodial functions in accordance with the Non-Custodial Securities Lending Agreement. For financial reporting purposes, the Portfolio does not offset financial instruments’ payables and receivables and related collateral on the Statement of Assets and Liabilities. The Portfolio may lend portfolio securities in an amount equal to up to 1/3 of its total assets as determined at the time of the loan origination. There is the risk of delay in recovering a loaned security or the risk of loss in collateral rights if the borrower fails financially. In addition, the Adviser makes efforts to balance the benefits and risks from granting such loans. All loans will be continuously secured by collateral which may consist of cash, U.S. Government securities, domestic and foreign short-term debt instruments, letters of credit, time deposits, repurchase agreements, money market mutual funds or other money market accounts, or such other collateral as permitted by the Securities and Exchange Commission (the "SEC"). If the Portfolio is unable to recover a security on loan, the Portfolio may use the collateral to purchase replacement securities in the market. There is a risk that the value of the collateral could decrease below the cost of the replacement security by the time the replacement investment is made, resulting in a loss to the Portfolio. In certain circumstances individual loan transactions could yield negative returns.
Upon receipt of cash collateral, the Adviser may invest it in affiliated or non-affiliated cash management vehicles, whether registered or unregistered entities, as permitted by the 1940 Act and rules promulgated thereunder. The Adviser currently intends to primarily invest the cash collateral in a cash management vehicle for which the Adviser serves as investment adviser, Janus Henderson Cash Collateral Fund LLC, or in time deposits. An investment in Janus Henderson Cash Collateral Fund LLC is generally subject to the same risks that shareholders experience when investing in similarly structured vehicles, such as the potential for significant fluctuations in assets as a result of the purchase and redemption activity of the securities lending program, a decline in the value of the collateral, and possible liquidity issues. Such risks may delay the return of the cash collateral and cause the Portfolio to violate its agreement to return the cash collateral to a borrower in a timely manner. As adviser to the Portfolio and Janus Henderson Cash Collateral Fund LLC, the Adviser has an inherent conflict of interest as a result of its fiduciary duties to both the Portfolio and Janus Henderson Cash Collateral Fund LLC. Additionally, the Adviser receives an investment advisory fee of 0.05% for managing Janus Henderson Cash Collateral Fund LLC, but it may not receive a fee for managing certain other affiliated cash management vehicles in which the Portfolio may invest, and therefore may have an incentive to allocate preferred investment opportunities to investment vehicles for which it is receiving a fee.
The value of the collateral must be at least 102% of the market value of the loaned securities that are denominated in U.S. dollars and 105% of the market value of the loaned securities that are not denominated in U.S. dollars. Loaned securities and related collateral are marked-to-market each business day based upon the market value of the loaned securities at the close of business, employing the most recent available pricing information. Collateral levels are then adjusted based on this mark-to-market evaluation. Additional required collateral, or excess collateral returned, is delivered on the next business day. Therefore, the value of the collateral held may be temporarily less than 102% or 105% value of the securities on loan. The cash collateral invested by the Adviser is disclosed in the Schedule of Investments (if applicable).
Income earned from the investment of the cash collateral, net of rebates paid to, or fees paid by, borrowers and less the fees paid to the lending agent are included as “Affiliated securities lending income, net” on the Statement of Operations.
There were no securities on loan as of December 31, 2022.
Janus Henderson VIT Global Technology and Innovation Portfolio
Notes to Financial Statements
3. Investment Advisory Agreements and Other Transactions with Affiliates
The Portfolio pays the Adviser an investment advisory fee which is calculated daily and paid monthly. The Portfolio’s contractual investment advisory fee rate (expressed as an annual rate) is 0.64% of its average daily net assets.
The Adviser has contractually agreed to waive the investment advisory fee and/or reimburse operating expenses to the extent that the Portfolio’s total annual fund operating expenses, excluding the 12b-1 distribution and shareholder servicing fees (applicable to Service Shares), transfer agent fees and expenses payable pursuant to the Transfer Agency Agreement, brokerage commissions, interest, dividends, taxes, acquired fund fees and expenses, and extraordinary expenses, exceed the annual rate of 0.95% of the Portfolio’s average daily net assets for at least a one-year period commencing April 29, 2022. If applicable, amounts waived and/or reimbursed to the Portfolio by the Adviser are disclosed as “Excess Expense Reimbursement and Waivers” on the Statement of Operations.
The Adviser serves as administrator to the Portfolio pursuant to an administration agreement between the Adviser and the Trust. Under the administration agreement, the Adviser is authorized to perform, or cause others to perform certain administration, compliance, and accounting services to the Portfolio, including providing office space for the Portfolio, and is reimbursed by the Portfolio for certain of its costs in providing these services (to the extent the Adviser seeks reimbursement and such costs are not otherwise waived). In addition, employees of the Adviser and/or its affiliates may serve as officers of the Trust. The Portfolio pays for some or all of the salaries, fees, and expenses of the Adviser employees and Portfolio officers, with respect to certain specified administration functions they perform on behalf of the Portfolio. The Portfolio pays these costs based on out-of-pocket expenses incurred by the Adviser, and these costs are separate and apart from advisory fees and other expenses paid in connection with the investment advisory services the Adviser (or any subadvisor, as applicable) provides to the Portfolio. These amounts are disclosed as “Affiliated portfolio administration fees” on the Statement of Operations. In addition, some expenses related to compensation payable to the Portfolio’s Chief Compliance Officer and certain compliance staff, all of whom are employees of the Adviser and/or its affiliates, are shared with the Portfolio. Total compensation of $48,451 was paid to the Chief Compliance Officer and certain compliance staff by the Trust during the year ended December 31, 2022. The Portfolio's portion is reported as part of “Other expenses” on the Statement of Operations.
Janus Henderson Services US LLC (the “Transfer Agent”), a wholly-owned subsidiary of the Adviser, is the Portfolio’s transfer agent. The Transfer Agent receives an administrative services fee at an annual rate of 0.05% of the average daily net assets of the Portfolio for arranging for the provision by participating insurance companies and qualified plan service providers of administrative services, including, but not limited to, recordkeeping, subaccounting, answering inquiries regarding accounts, order processing, transaction confirmations, the mailing of prospectuses and shareholder reports, and other shareholder services provided on behalf of contract holders or plan participants investing in the Portfolio. The Transfer Agent expects to use this entire fee to compensate insurance companies and qualified plan service providers for providing these services to their customers who invest in the Portfolio.
The Transfer Agent is not compensated for internal services related to the shares, except for out-of-pocket costs. These amounts are disclosed as “Other transfer agent fees and expenses” on the Statement of Operations.
Under a distribution and shareholder servicing plan (the “Plan”) adopted in accordance with Rule 12b-1 under the 1940 Act, the Service Shares may pay the Trust’s distributor, Janus Henderson Distributors US LLC (the “Distributor”), a wholly-owned subsidiary of the Adviser, a fee for the sale and distribution and/or shareholder servicing of the Service Shares at an annual rate of up to 0.25% of the average daily net assets of the Service Shares. Under the terms of the Plan, the Trust is authorized to make payments to the Distributor for remittance to insurance companies and qualified plan service providers as compensation for distribution and/or shareholder services performed by such entities. These amounts are disclosed as “12b-1 Distribution and shareholder servicing fees” on the Statement of Operations.
The Board of Trustees has adopted a deferred compensation plan (the “Deferred Plan”) for independent Trustees to elect to defer receipt of all or a portion of the annual compensation they are entitled to receive from the Portfolio. All deferred fees are credited to an account established in the name of the Trustees. The amounts credited to the account then increase or decrease, as the case may be, in accordance with the performance of one or more of the Janus Henderson funds that are selected by the Trustees. The account balance continues to fluctuate in accordance with the performance of the selected fund or funds until final payment of all amounts are credited to the account. The fluctuation of the account balance is recorded by the Portfolio as unrealized appreciation/(depreciation) and is included as of December 31, 2022 on the Statement of Assets and Liabilities in the asset, “Trustees’ deferred compensation,” and liability, “Trustees’ deferred compensation fees.” Additionally, the recorded unrealized appreciation/(depreciation) is
Janus Henderson VIT Global Technology and Innovation Portfolio
Notes to Financial Statements
included in “Total distributable earnings (loss)” on the Statement of Assets and Liabilities. Deferred compensation expenses for the year ended December 31, 2022 are included in “Trustees’ fees and expenses” on the Statement of Operations. Trustees are allowed to change their designation of mutual funds from time to time. Amounts will be deferred until distributed in accordance with the Deferred Plan. Deferred fees of $433,851 were paid by the Trust to the Trustees under the Deferred Plan during the year ended December 31, 2022.
Pursuant to the provisions of the 1940 Act and related rules, the Portfolio may participate in an affiliated or non-affiliated cash sweep program. In the cash sweep program, uninvested cash balances of the Portfolio may be used to purchase shares of affiliated or non-affiliated money market funds or cash management pooled investment vehicles that operate as money market funds. The Portfolio is eligible to participate in the cash sweep program (the “Investing Funds”). The Adviser has an inherent conflict of interest because of its fiduciary duties to the affiliated money market funds or cash management pooled investment vehicles and the Investing Funds. Janus Henderson Cash Liquidity Fund LLC (the “Sweep Vehicle”) is an affiliated unregistered cash management pooled investment vehicle that invests primarily in highly-rated short-term fixed-income securities. The Sweep Vehicle operates pursuant to the provisions of the 1940 Act that govern the operation of money market funds and prices its shares at NAV reflecting market-based values of its portfolio securities (i.e., a “floating” NAV) rounded to the fourth decimal place (e.g., $1.0000). The Sweep Vehicle is permitted to impose a liquidity fee (of up to 2%) on redemptions from the Sweep Vehicle or a redemption gate that temporarily suspends redemptions from the Sweep Vehicle for up to 10 business days during a 90 day period. There are no restrictions on the Portfolio's ability to withdraw investments from the Sweep Vehicle at will, and there are no unfunded capital commitments due from the Portfolio to the Sweep Vehicle. The Sweep Vehicle does not charge any management fee, sales charge or service fee.
Any purchases and sales, realized gains/losses and recorded dividends from affiliated investments during the year ended December 31, 2022 can be found in the “Schedules of Affiliated Investments” located in the Schedule of Investments.
4. Federal Income Tax
The tax components of capital shown in the table below represent: (1) distribution requirements the Portfolio must satisfy under the income tax regulations; (2) losses or deductions the Portfolio may be able to offset against income and gains realized in future years; and (3) unrealized appreciation or depreciation of investments for federal income tax purposes.
Other book to tax differences primarily consist of deferred compensation. The Portfolio has elected to treat gains and losses on forward foreign currency contracts as capital gains and losses, if applicable. Other foreign currency gains and losses on debt instruments are treated as ordinary income for federal income tax purposes pursuant to Section 988 of the Internal Revenue Code.
| | | | | | | |
| | | | Other Book | Net Tax | |
Undistributed
Ordinary Income | Undistributed
Long-Term Gains | Accumulated
Capital Losses | Loss Deferrals | to Tax
Differences | Appreciation/
(Depreciation) | |
$ - | $ - | $ (58,160,952) | $ - | $ (18,293) | $115,009,996 | |
Accumulated capital losses noted below represent net capital loss carryovers, as of December 31, 2022, that may be available to offset future realized capital gains and thereby reduce future taxable gains distributions. The following table shows these capital loss carryovers.
| | | | | | |
| | | | | |
Capital Loss Carryover Schedule | | |
For the year ended December 31, 2022 | | |
| No Expiration | | | |
| Short-Term | Long-Term | Accumulated
Capital Losses | | |
| $(58,160,952) | $ - | $ (58,160,952) | | |
Janus Henderson VIT Global Technology and Innovation Portfolio
Notes to Financial Statements
The aggregate cost of investments and the composition of unrealized appreciation and depreciation of investment securities for federal income tax purposes as of December 31, 2022 are noted below. The primary differences between book and tax appreciation or depreciation of investments are wash sale loss deferrals and investments in partnerships.
| | | | |
Federal Tax Cost | Unrealized
Appreciation | Unrealized
(Depreciation) | Net Tax Appreciation/
(Depreciation) |
$ 462,324,253 | $164,077,113 | $(49,067,117) | $ 115,009,996 |
Income and capital gains distributions are determined in accordance with income tax regulations that may differ from US GAAP. These differences are due to differing treatments for items such as net short-term gains, deferral of wash sale losses, foreign currency transactions, and capital loss carryovers. Certain permanent differences such as tax returns of capital and net investment losses noted below have been reclassified to capital.
| | | | | |
For the year ended December 31, 2022 | |
Distributions | | |
From Ordinary Income | From Long-Term Capital Gains | Tax Return of Capital | Net Investment Loss | |
$ - | $ 120,614,397 | $ - | $ 2,402,787 | |
| | | | | |
For the year ended December 31, 2021 | |
Distributions | | |
From Ordinary Income | From Long-Term Capital Gains | Tax Return of Capital | Net Investment Loss | |
$ 5,920,850 | $ 109,539,993 | $ - | $ 4,573,398 | |
Permanent book to tax basis differences may result in reclassifications between the components of net assets. These differences have no impact on the results of operations or net assets.
5. Capital Share Transactions
| | | | | | | |
| | | | | | |
| | Year ended December 31, 2022 | | Year ended December 31, 2021 |
| | Shares | Amount | | Shares | Amount |
| | | | | | | |
Institutional Shares: | | | | | |
Shares sold | 740,195 | $ 9,660,917 | | 648,301 | $ 13,535,458 |
Reinvested dividends and distributions | 729,360 | 7,665,574 | | 392,488 | 7,520,075 |
Shares repurchased | (978,994) | (12,352,628) | | (695,151) | (14,448,193) |
Net Increase/(Decrease) | 490,561 | $ 4,973,863 | | 345,638 | $ 6,607,340 |
Service Shares: | | | | | |
Shares sold | 8,436,579 | $113,407,136 | | 7,348,585 | $154,522,960 |
Reinvested dividends and distributions | 10,655,549 | 112,948,823 | | 5,584,106 | 107,940,768 |
Shares repurchased | (9,644,885) | (135,926,837) | | (6,674,085) | (139,493,941) |
Net Increase/(Decrease) | 9,447,243 | $ 90,429,122 | | 6,258,606 | $122,969,787 |
Janus Henderson VIT Global Technology and Innovation Portfolio
Notes to Financial Statements
6. Purchases and Sales of Investment Securities
For the year ended December 31, 2022, the aggregate cost of purchases and proceeds from sales of investment securities (excluding any short-term securities, short-term options contracts, TBAs, and in-kind transactions, as applicable) was as follows:
| | | | |
Purchases of
Securities | Proceeds from Sales
of Securities | Purchases of Long-
Term U.S. Government
Obligations | Proceeds from Sales
of Long-Term U.S.
Government Obligations |
$285,196,685 | $ 315,072,281 | $ - | $ - |
7. Subsequent Event
Management has evaluated whether any events or transactions occurred subsequent to December 31, 2022 and through the date of issuance of the Portfolio’s financial statements and determined that there were no material events or transactions that would require recognition or disclosure in the Portfolio’s financial statements.
Janus Henderson VIT Global Technology and Innovation Portfolio
Report of Independent Registered Public Accounting Firm
To the Board of Trustees of Janus Aspen Series and Shareholders of Janus Henderson VIT Global Technology and Innovation Portfolio
Opinion on the Financial Statements
We have audited the accompanying statement of assets and liabilities, including the schedule of investments, of Janus Henderson VIT Global Technology and Innovation Portfolio (one of the portfolios constituting Janus Aspen Series, referred to hereafter as the "Portfolio") as of December 31, 2022, the related statement of operations for the year ended December 31, 2022, the statements of changes in net assets for each of the two years in the period ended December 31, 2022, including the related notes, and the financial highlights for each of the five years in the period ended December 31, 2022 (collectively referred to as the “financial statements”). In our opinion, the financial statements present fairly, in all material respects, the financial position of the Portfolio as of December 31, 2022, the results of its operations for the year then ended, the changes in its net assets for each of the two years in the period ended December 31, 2022 and the financial highlights for each of the five years in the period ended December 31, 2022 in conformity with accounting principles generally accepted in the United States of America.
Basis for Opinion
These financial statements are the responsibility of the Portfolio’s management. Our responsibility is to express an opinion on the Portfolio’s financial statements based on our audits. We are a public accounting firm registered with the Public Company Accounting Oversight Board (United States) (PCAOB) and are required to be independent with respect to the Portfolio in accordance with the U.S. federal securities laws and the applicable rules and regulations of the Securities and Exchange Commission and the PCAOB.
We conducted our audits of these financial statements in accordance with the standards of the PCAOB. Those standards require that we plan and perform the audit to obtain reasonable assurance about whether the financial statements are free of material misstatement, whether due to error or fraud.
Our audits included performing procedures to assess the risks of material misstatement of the financial statements, whether due to error or fraud, and performing procedures that respond to those risks. Such procedures included examining, on a test basis, evidence regarding the amounts and disclosures in the financial statements. Our audits also included evaluating the accounting principles used and significant estimates made by management, as well as evaluating the overall presentation of the financial statements. Our procedures included confirmation of securities owned as of December 31, 2022 by correspondence with the custodian and investee companies. We believe that our audits provide a reasonable basis for our opinion.

Denver, Colorado
February 15, 2023
We have served as the auditor of one or more investment companies in Janus Henderson Funds since 1990.
Janus Henderson VIT Global Technology and Innovation Portfolio
Additional Information (unaudited)
Proxy Voting Policies and Voting Record
A description of the policies and procedures that the Portfolio uses to determine how to vote proxies relating to its portfolio securities is available without charge: (i) upon request, by calling 1-800-525-1093; (ii) on the Portfolio’s website at janushenderson.com/proxyvoting; and (iii) on the SEC’s website at http://www.sec.gov. Additionally, information regarding the Portfolio’s proxy voting record for the most recent twelve-month period ended June 30 is also available, free of charge, through janushenderson.com/proxyvoting and from the SEC’s website at http://www.sec.gov.
Full Holdings
The Portfolio files its complete portfolio holdings (schedule of investments) with the SEC as an exhibit to Form N-PORT within 60 days of the end of the first and third fiscal quarters, and in the annual report and semiannual report to shareholders. The Portfolio’s Form N-PORT filings and annual and semiannual reports: (i) are available on the SEC’s website at http://www.sec.gov; and (ii) are available without charge, upon request, by calling a Janus Henderson representative at 1-877-335-2687 (toll free). Portfolio holdings consisting of at least the names of the holdings are generally available on a monthly basis with a 30-day lag under Full Holdings for the Portfolio at janushenderson.com/vit.
APPROVAL OF ADVISORY AGREEMENTS DURING THE PERIOD
The Trustees of Janus Aspen Series, each of whom serves as an “independent” Trustee (the “Trustees”), oversee the management of each portfolio of Janus Aspen Series (each, a “VIT Portfolio,” and collectively, the “VIT Portfolios”), as well as each fund of Janus Investment Fund (each, a “Fund,” and collectively, the “Funds” and together with the VIT Portfolios, the “Janus Henderson Funds,” and each, a “Janus Henderson Fund”). As required by law, the Trustees determine annually whether to continue the investment advisory agreement for each Janus Henderson Fund.
In connection with their most recent consideration of those agreements for each Janus Henderson Fund, the Trustees received and reviewed information provided by Janus Henderson Investors US LLC (the “Adviser”) in response to requests of the Trustees and their independent legal counsel. They also received and reviewed information and analysis provided by, and in response to requests of, their independent fee consultant. Throughout their consideration of the agreements, the Trustees were advised by their independent legal counsel. The Trustees met with management to consider the agreements, and also met separately in executive session with their independent legal counsel and their independent fee consultant.
At meetings held on November 9-10, 2022 and December 13-14, 2022, the Trustees evaluated the information provided by the Adviser and the independent fee consultant, as well as other information provided by the Adviser and the independent fee consultant during the year. Following such evaluation, the Trustees determined that the overall arrangements between each Janus Henderson Fund and the Adviser were fair and reasonable in light of the nature, extent, and quality of the services provided by the Adviser and its affiliates, the fees charged for those services, and other matters that the Trustees considered relevant in the exercise of their business judgment, and unanimously approved the continuation of the investment advisory agreement for each Janus Henderson Fund for the period from February 1, 2023 through February 1, 2024, subject to earlier termination as provided for in each agreement.
In considering the continuation of those agreements, the Trustees reviewed and analyzed various factors that they determined were relevant, including the factors described below, none of which by itself was considered dispositive. However, the material factors and conclusions that formed the basis for the Trustees’ determination to approve the continuation of the agreements are discussed separately below. Also included is a summary of the independent fee consultant’s conclusions and opinions that arose during, and were included as part of, the Trustees’ consideration of the agreements. “Management fees,” as used herein, reflect actual annual advisory fees and, for the purpose of peer comparisons any administration fees (excluding out of pocket costs), net of any waivers, paid by a fund as a percentage of average net assets.
Nature, Extent and Quality of Services
The Trustees reviewed the nature, extent, and quality of the services provided by the Adviser to the Janus Henderson Funds, taking into account the investment objective, strategies, and policies of each Janus Henderson Fund, and the knowledge the Trustees gained from their regular meetings with management on at least a quarterly basis and their ongoing review of information related to the Janus Henderson Funds. In addition, the Trustees reviewed the resources and key personnel of the Adviser, particularly noting those employees who provide investment and risk management services to the Janus Henderson Funds. The Trustees also considered other services provided to the Janus Henderson Funds by the Adviser, such as managing the execution of portfolio transactions and the selection of broker-dealers for
Janus Henderson VIT Global Technology and Innovation Portfolio
Additional Information (unaudited)
those transactions. The Trustees considered the Adviser’s role as administrator to the Janus Henderson Funds, noting that the Adviser generally does not receive a fee for its services as administrator, but is reimbursed for its out-of-pocket costs. The Trustees considered the role of the Adviser in monitoring adherence to the Janus Henderson Funds’ investment restrictions, providing support services for the Trustees and Trustee committees, and overseeing communications with Janus Henderson Fund shareholders and the activities of other service providers, including monitoring compliance with various policies and procedures of the Janus Henderson Funds and with applicable securities laws and regulations.
In this regard, the independent fee consultant noted that the Adviser provides a number of different services for the Janus Henderson Funds and their shareholders, ranging from investment management services to various other servicing functions, and that, in its view, the Adviser is a capable provider of those services. The independent fee consultant also provided its belief that the Adviser has developed a number of institutional competitive advantages that should enable it to provide superior investment and service performance over the long term.
The Trustees concluded that the nature, extent, and quality of the services provided by the Adviser to each Janus Henderson Fund were appropriate and consistent with the terms of the respective advisory agreements, and that, taking into account steps taken to address those Janus Henderson Funds whose performance lagged that of their peers for certain periods, the Janus Henderson Funds were likely to benefit from the continued provision of those services. They also concluded that the Adviser had sufficient personnel, with the appropriate education and experience, to serve the Janus Henderson Funds effectively and had demonstrated its ability to attract well-qualified personnel.
Performance of the Funds
The Trustees considered the performance results of each Janus Henderson Fund over various time periods. They noted that they considered Janus Henderson Fund performance data throughout the year, including periodic meetings with each Janus Henderson Fund’s portfolio manager(s), and also reviewed information comparing each Janus Henderson Fund’s performance with the performance of comparable fund peer groups identified by Broadridge Financial Solutions, Inc. (“Broadridge”), an independent data provider, and with the Janus Henderson Fund’s benchmark index. In this regard, the independent fee consultant found that the overall Janus Henderson Funds’ performance has been reasonable, noting that: (i) for the 36 months ended May 31, 2022, approximately 38% of the Janus Henderson Funds were in the top two quartiles of their Broadridge peer groups; (ii) for the 36 months ended September 30, 2022, approximately 45% of the Janus Henderson Funds were in the top two quartiles of performance as reported by Morningstar, and (iii) for the 12 months ended September 30, 2022, approximately 55% of the Janus Henderson Funds were in the top two quartiles of performance as reported by Morningstar.
The Trustees considered the performance of each Janus Henderson Fund, noting that performance may vary by share class, and noted the following with respect to the VIT Portfolios:
· For Janus Henderson Adaptive Risk Managed U.S. Equity Portfolio, the Trustees noted that the VIT Portfolio’s performance was in the bottom Broadridge quartile for the 36 months ended May 31, 2022 and the first Broadridge quartile for the 12 months ended May 31, 2022. The Trustees noted the reasons for the VIT Portfolio’s underperformance and the steps the Adviser had taken or was taking to improve performance, and that the performance trend was improving.
· For Janus Henderson Balanced Portfolio, the Trustees noted that the VIT Portfolio’s performance was in the first Broadridge quartile for the 36 months ended May 31, 2022 and the first Broadridge quartile for the 12 months ended May 31, 2022.
· For Janus Henderson Enterprise Portfolio, the Trustees noted that the VIT Portfolio’s performance was in the third Broadridge quartile for the 36 months ended May 31, 2022 and the first Broadridge quartile for the 12 months ended May 31, 2022 The Trustees noted the reasons for the VIT Portfolio’s underperformance and the steps the Adviser had taken or was taking to improve performance, and that the performance trend was improving.
· For Janus Henderson Flexible Bond Portfolio, the Trustees noted that the VIT Portfolio’s performance was in the first Broadridge quartile for the 36 months ended May 31, 2022 and the first Broadridge quartile for the 12 months ended May 31, 2022.
Janus Henderson VIT Global Technology and Innovation Portfolio
Additional Information (unaudited)
· For Janus Henderson Forty Portfolio, the Trustees noted that the VIT Portfolio’s performance was in the second Broadridge quartile for the 36 months ended May 31, 2022 and the third Broadridge quartile for the 12 months ended May 31, 2022.
· For Janus Henderson Global Research Portfolio, the Trustees noted that the VIT Portfolio’s performance was in the first Broadridge quartile for the 36 months ended May 31, 2022 and the first Broadridge quartile for the 12 months ended May 31, 2022.
· For Janus Henderson Global Sustainable Equity Portfolio, the Trustees noted that the VIT Portfolio’s performance was in the bottom Broadridge quartile for the evaluated performance period ended May 31, 2022. The Trustees noted that 36 month-end performance was not yet available.
· For Janus Henderson Global Technology and Innovation Portfolio, the Trustees noted that the VIT Portfolio’s performance was in the second Broadridge quartile for the 36 months ended May 31, 2022 and the third Broadridge quartile for the 12 months ended May 31, 2022.
· For Janus Henderson Mid Cap Value Portfolio, the Trustees noted that the VIT Portfolio’s performance was in the bottom Broadridge quartile for the 36 months ended May 31, 2022 and the second Broadridge quartile for the 12 months ended May 31, 2022. The Trustees noted the reasons for the VIT Portfolio’s underperformance, while also noting that the VIT Portfolio has a performance fee structure that results in lower management fees during periods of underperformance, the steps the Adviser had taken or was taking to improve performance, and that the performance trend was improving.
· For Janus Henderson Overseas Portfolio, the Trustees noted that the VIT Portfolio’s performance was in the first Broadridge quartile for the 36 months ended May 31, 2022 and the first Broadridge quartile for the 12 months ended May 31, 2022.
· For Janus Henderson Research Portfolio, the Trustees noted that the VIT Portfolio’s performance was in the second Broadridge quartile for the 36 months ended May 31, 2022 and the second Broadridge quartile for the 12 months ended May 31, 2022.
In consideration of each Janus Henderson Fund’s performance, the Trustees concluded that, taking into account the factors relevant to performance, as well as other considerations, including steps taken to improve performance, as applicable, the Janus Henderson Fund’s performance warranted continuation of such Janus Henderson Fund’s investment advisory agreement.
Costs of Services Provided
The Trustees examined information regarding the fees and expenses of each Janus Henderson Fund in comparison to similar information for other comparable funds as provided by Broadridge, an independent data provider. They also reviewed an analysis of that information provided by their independent fee consultant. The independent fee consultant provided its belief that the management fees charged by the Adviser to each of the Janus Henderson Funds under the current investment advisory and administration agreements are reasonable in relation to the services provided by the Adviser. The independent fee consultant found: (1) the total expenses and management fees of the Janus Henderson Funds to be reasonable relative to other comparable mutual funds; (2) the total expenses, on average, were 6% under the average total expenses of the respective Broadridge peer group; and (3) the management fees for the Janus Henderson Funds, on average, were 5% under the average management fees for the respective Broadridge peer group. The Trustees also considered the total expenses for each share class of each Janus Henderson Fund compared to the average total expenses for its Broadridge Expense Group and to average total expenses for its Broadridge Expense Universe.
For Janus Henderson Funds with three or more years of performance history, the independent fee consultant also performed a systematic “focus list” analysis of expenses which assessed fund fees in the context of fund performance being delivered. Based on this analysis, the independent fee consultant found that the combination of service quality/performance and expenses on these individual Janus Henderson Funds was reasonable in light of performance trends, performance histories, changes in portfolio management, relative average net asset levels, and the existence of performance fees, breakpoints, and/or expense waivers on such Janus Henderson Funds.
Janus Henderson VIT Global Technology and Innovation Portfolio
Additional Information (unaudited)
The Trustees considered the methodology used by the Adviser in determining compensation payable to portfolio managers, the competitive environment for investment management talent, and the competitive market for mutual funds in different distribution channels.
The Trustees also reviewed management fees charged by the Adviser to comparable separate account clients and to comparable non-affiliated funds subadvised by the Adviser (for which the Adviser provides only or primarily portfolio management services). Although in most instances subadvisory and separate account fee rates for various investment strategies were lower than management fee rates for Janus Henderson Funds having a similar strategy, the Trustees considered that the Adviser noted that, under the terms of the management agreements with the Janus Henderson Funds, the Adviser performs significant additional services for the Janus Henderson Funds that it does not provide to those other clients, including administration services, oversight of the Janus Henderson Funds’ other service providers, Trustee support, regulatory compliance and numerous other services, and that, in serving the Janus Henderson Funds, the Adviser assumes many legal risks and other costs that it does not assume in servicing its other clients. Moreover, the Trustees noted that the independent fee consultant found that: (1) the management fees the Adviser charges to the Janus Henderson Funds are reasonable in relation to the management fees the Adviser charges to funds subadvised by the Adviser and to the fees the Adviser charges to its institutional separate account clients; (2) these subadvised and institutional separate accounts have different service and infrastructure needs and operate in markets very different from the retail fund market; (3) Janus Henderson mutual fund investors enjoy reasonable fees relative to the fees charged in these other markets; and (4) as part of its 2022 review, 9 of 11 Janus Henderson Funds have lower management fees than similar funds subadvised by the Adviser. The Trustees noted that for the two Janus Henderson Funds that did not, management fees for each were under the average of its 15(c) peer group.
The Trustees considered the fees for each Janus Henderson Fund for its fiscal year ended in 2021 (except for Janus Henderson Global Sustainable Equity Portfolio for which the period end was March 31, 2022) and noted the following with regard to each Janus Henderson Fund’s total expenses, net of applicable fee waivers (the VIT Portfolio’s “total expenses”) as reflected in the comparative information provided by Broadridge:
· For Janus Henderson Adaptive Risk Management U.S. Equity Portfolio, the Trustees noted that the VIT Portfolio’s total expenses were below the peer group average for its sole share class.
· For Janus Henderson Balanced Portfolio, the Trustees noted that, although the VIT Portfolio’s total expenses exceeded the peer group average for one share class, overall the VIT Portfolio’s total expenses were reasonable.
· For Janus Henderson Enterprise Portfolio, the Trustees noted that, although the VIT Portfolio’s total expenses exceeded the peer group average for one share class, overall the VIT Portfolio’s total expenses were reasonable.
· For Janus Henderson Flexible Bond Portfolio, the Trustees noted that, although the VIT Portfolio’s total expenses exceeded the peer group for one share class, overall the VIT Portfolio’s total expenses were reasonable. The Trustees also noted that the Adviser has contractually agreed to limit the VIT Portfolio’s expenses.
· For Janus Henderson Forty Portfolio, the Trustees noted that, although the VIT Portfolio’s total expenses exceeded the peer group average for one share class, overall the VIT Portfolio’s total expenses were reasonable.
· For Janus Henderson Global Research Portfolio, the Trustees noted that, although the VIT Portfolio’s total expenses exceeded the peer group average for one share class, overall the VIT Portfolio’s total expenses were reasonable.
· For Janus Henderson Global Sustainable Equity Portfolio, the Trustees noted that the VIT Portfolio’s total expenses were below the peer group average for both share classes.
· For Janus Henderson Global Technology and Innovation Portfolio, the Trustees noted that the VIT Portfolio’s total expenses were below the peer group average for both share classes.
· For Janus Henderson Mid Cap Value Portfolio, the Trustees noted that, the VIT Portfolio’s total expenses were below the peer group average for both share classes.
· For Janus Henderson Overseas Portfolio, the Trustees noted that although the VIT Portfolio’s total expenses exceeded the peer group average for one share class, overall the VIT Portfolio’s total expenses were reasonable.
Janus Henderson VIT Global Technology and Innovation Portfolio
Additional Information (unaudited)
· For Janus Henderson Research Portfolio, the Trustees noted that the VIT Portfolio’s total expenses were below the peer group average for both share classes.
The Trustees reviewed information on the overall profitability to the Adviser and its affiliates from their relationships with the Janus Henderson Funds, and considered profitability data of other publicly traded mutual fund advisers. The Trustees recognized that profitability comparisons among fund managers are difficult because of the variation in the type of comparative information that is publicly available, and the profitability of any fund manager is affected by numerous factors, including the organizational structure of the particular fund manager, differences in complex size, difference in product mix, difference in types of business (mutual fund, institutional and other), differences in the types of funds and other accounts it manages, possible other lines of business, the methodology for allocating expenses and the fund manager’s capital structure and cost of capital.
Additionally, the Trustees considered the estimated profitability to the Adviser from the investment management services it provided to each Janus Henderson Fund. In their review, the Trustees considered whether the Adviser receive adequate incentives and resources to manage the Janus Henderson Funds effectively. In reviewing profitability, the Trustees noted that the estimated profitability for an individual Janus Henderson Fund is necessarily a product of the allocation methodology utilized by the Adviser to allocate its expenses as part of the estimated profitability calculation. In this regard, the Trustees noted that the independent fee consultant found as part of its 2022 review that (1) the expense allocation methodology and rationales utilized by the Adviser were reasonable and (2) no clear correlation exists between expense allocations and operating margins. The Trustees also considered that the estimated profitability for an individual Janus Henderson Fund was influenced by a number of factors, including not only the allocation methodology selected, but also the presence of fee waivers and expense caps, and whether the Janus Henderson Fund’s investment management agreement contained breakpoints or a performance fee component. The Trustees determined, after taking into account these factors, among others, that the Adviser’s estimated profitability with respect to each Janus Henderson Fund was not unreasonable in relation to the services provided, and that the variation in the range of such estimated profitability among the Janus Henderson Funds was not a material factor in the Board’s approval of the reasonableness of any Janus Henderson Fund’s investment management fees.
The Trustees concluded that the management fees payable by each Janus Henderson Fund to the Adviser were reasonable in relation to the nature, extent, and quality of the services provided, taking into account the fees charged by other advisers for managing comparable mutual funds with similar strategies, the fees the Adviser charges to other clients, and, as applicable, the impact of fund performance on management fees payable by the Janus Henderson Funds. The Trustees also concluded that each Janus Henderson Fund’s total expenses were reasonable, taking into account the size of the Janus Henderson Fund, the quality of services provided by the Adviser, the investment performance of the Janus Henderson Fund, and any expense limitations agreed to or provided by the Adviser.
Economies of Scale
The Trustees considered information about the potential for the Adviser to realize economies of scale as the assets of the Janus Henderson Funds increase. They noted that their independent fee consultant published a report to the Trustees in June 2022 which provided its research and analysis into economies of scale. They also noted that, although many Janus Henderson Funds pay advisory fees at a fixed base rate as a percentage of net assets, without any breakpoints or performance fees, their independent fee consultant concluded that 75% of these Janus Henderson Funds’ have contractual management fees (gross of waivers) below their Broadridge Expense Group averages. The Trustees also noted the following from the independent fee consultant’s report: (1) that 31% of Janus Henderson Funds had management fee breakpoints in place whereby investors pay lower management fees as fund AUM increases; (2) that 29% of Janus Henderson Funds have low flat-rate fees and performance fees where the Adviser is incentivized to invest in resources which drive Janus Henderson Fund performance; and (3) that 39% of Janus Henderson Funds have low flat-rate fees versus peers where investors pay low fixed fees when the Janus Henderson Fund is small/midsized and higher fees when the Janus Henderson Fund grows in assets. The Trustees also noted that the Janus Henderson Funds share directly in economies of scale through the significant investments made by the Adviser and its affiliates related to services provided to the Funds and the lower charges of third-party service providers that are based in part on the combined scale of all of the Janus Henderson Funds.
The Trustees also considered the independent fee consultant’s conclusion that, given the limitations of various analytical approaches to economies of scale and their conflicting results, it is difficult to analytically confirm or deny the existence of economies of scale in the Janus Henderson complex. In this regard, the independent consultant concluded that (1) to the extent there were economies of scale at the Adviser, the Adviser’s general strategy of setting
Janus Henderson VIT Global Technology and Innovation Portfolio
Additional Information (unaudited)
fixed management fees below peers appeared to share any such economies with investors even on smaller Janus Henderson Funds which have not yet achieved those economies and (2) by setting lower fixed fees from the start on these Janus Henderson Funds, the Adviser appeared to be investing to increase the likelihood that these Janus Henderson Funds will grow to a level to achieve any economies of scale that may exist. Further, the independent fee consultant provided its belief that Janus Henderson Fund investors are well-served by the fee levels and performance fee structures in place on the Janus Henderson Funds in light of any economies of scale that may be present at the Adviser.
Based on all of the information reviewed, including the recent and past research and analysis conducted by the Trustees’ independent fee consultant, the Trustees concluded that the current fee structure of each Janus Henderson Fund was reasonable and that the current rates of fees do reflect a sharing between the Adviser and the Janus Henderson Fund of any economies of scale that may be present at the current asset level of the Janus Henderson Fund.
Other Benefits to the Adviser
The Trustees also considered benefits that accrue to the Adviser and its affiliates from their relationships with the Janus Henderson Funds. They recognized that two affiliates of the Adviser separately serve the Janus Henderson Funds as transfer agent and distributor, respectively, and the transfer agent receives compensation directly from the non-money market Janus Henderson Funds for services provided, and that such compensation contributes to the overall profitability of the Adviser and its affiliates that results from their relationship with the Janus Henderson Funds. The Trustees also considered the Adviser’s past and proposed use of commissions paid by the Janus Henderson Funds on portfolio brokerage transactions to obtain proprietary and third-party research products and services benefiting the Janus Henderson Fund and/or other clients of the Adviser and/or the Adviser. The Trustees concluded that the Adviser’s use of these types of client commission arrangements to obtain proprietary and third-party research products and services was consistent with regulatory requirements and guidelines and was likely to benefit each Janus Henderson Fund. The Trustees also concluded that, other than the services provided by the Adviser and its affiliates pursuant to the agreements and the fees to be paid by each Janus Henderson Fund therefor, the Janus Henderson Funds and the Adviser may potentially benefit from their relationship with each other in other ways. They concluded that the Adviser and its affiliates share directly in economies of scale through the lower charges of third-party service providers that are based in part on the combined scale of the Janus Henderson Funds and other clients serviced by the Adviser and its affiliates. They also concluded that the Adviser benefits from the receipt of research products and services acquired through commissions paid on portfolio transactions of the Janus Henderson Funds and that the Janus Henderson Funds benefit from the Adviser’s receipt of those products and services as well as research products and services acquired through commissions paid by other clients of the Adviser. They further concluded that the success of any Janus Henderson Fund could attract other business to the Adviser or other Janus Henderson Funds, and that the success of the Adviser could enhance the Adviser’s ability to serve the Janus Henderson Funds.
Janus Henderson VIT Global Technology and Innovation Portfolio
Useful Information About Your Portfolio Report (unaudited)
Management Commentary
The Management Commentary in this report includes valuable insight as well as statistical information to help you understand how your Portfolio’s performance and characteristics stack up against those of comparable indices.
If the Portfolio invests in foreign securities, this report may include information about country exposure. Country exposure is based primarily on the country of risk. A company may be allocated to a country based on other factors such as location of the company’s principal office, the location of the principal trading market for the company’s securities, or the country where a majority of the company’s revenues are derived.
Please keep in mind that the opinions expressed in the Management Commentary are just that: opinions. They are a reflection based on best judgment at the time this report was compiled, which was December 31, 2022. As the investing environment changes, so could opinions. These views are unique and are not necessarily shared by fellow employees or by Janus Henderson in general.
Performance Overviews
Performance overview graphs compare the performance of a hypothetical $10,000 investment in the Portfolio with one or more widely used market indices. When comparing the performance of the Portfolio with an index, keep in mind that market indices are not available for investment and do not reflect deduction of expenses.
Average annual total returns are quoted for a Portfolio with more than one year of performance history. Average annual total return is calculated by taking the growth or decline in value of an investment over a period of time, including reinvestment of dividends and distributions, then calculating the annual compounded percentage rate that would have produced the same result had the rate of growth been constant throughout the period. Average annual total return does not reflect the deduction of taxes that a shareholder would pay on Portfolio distributions or redemptions of Portfolio shares.
Cumulative total returns are quoted for a Portfolio with less than one year of performance history. Cumulative total return is the growth or decline in value of an investment over time, independent of the period of time involved. Cumulative total return does not reflect the deduction of taxes that a shareholder would pay on Portfolio distributions or redemptions of Portfolio shares.
Pursuant to federal securities rules, expense ratios shown in the performance chart reflect subsidized (if applicable) and unsubsidized ratios. The total annual fund operating expenses ratio is gross of any fee waivers, reflecting the Portfolio’s unsubsidized expense ratio. The net annual fund operating expenses ratio (if applicable) includes contractual waivers of the Adviser and reflects the Portfolio’s subsidized expense ratio. Ratios may be higher or lower than those shown in the “Financial Highlights” in this report.
Schedule of Investments
Following the performance overview section is the Portfolio’s Schedule of Investments. This schedule reports the types of securities held in the Portfolio on the last day of the reporting period. Securities are usually listed by type (common stock, corporate bonds, U.S. Government obligations, etc.) and by industry classification (banking, communications, insurance, etc.). Holdings are subject to change without notice.
The value of each security is quoted as of the last day of the reporting period. The value of securities denominated in foreign currencies is converted into U.S. dollars.
If the Portfolio invests in foreign securities, it will also provide a summary of investments by country. This summary reports the Portfolio exposure to different countries by providing the percentage of securities invested in each country. The country of each security represents the country of risk. The Portfolio’s Schedule of Investments relies upon the industry group and country classifications published by Bloomberg and/or MSCI Inc.
Tables listing details of individual forward currency contracts, futures, written options, swaptions, and swaps follow the Portfolio’s Schedule of Investments (if applicable).
Statement of Assets and Liabilities
This statement is often referred to as the “balance sheet.” It lists the assets and liabilities of the Portfolio on the last day of the reporting period.
Janus Henderson VIT Global Technology and Innovation Portfolio
Useful Information About Your Portfolio Report (unaudited)
The Portfolio’s assets are calculated by adding the value of the securities owned, the receivable for securities sold but not yet settled, the receivable for dividends declared but not yet received on securities owned, and the receivable for Portfolio shares sold to investors but not yet settled. The Portfolio’s liabilities include payables for securities purchased but not yet settled, Portfolio shares redeemed but not yet paid, and expenses owed but not yet paid. Additionally, there may be other assets and liabilities such as unrealized gain or loss on forward currency contracts.
The section entitled “Net Assets Consist of” breaks down the components of the Portfolio’s net assets. Because the Portfolio must distribute substantially all earnings, you will notice that a significant portion of net assets is shareholder capital.
The last section of this statement reports the net asset value (“NAV”) per share on the last day of the reporting period. The NAV is calculated by dividing the Portfolio’s net assets for each share class (assets minus liabilities) by the number of shares outstanding.
Statement of Operations
This statement details the Portfolio’s income, expenses, realized gains and losses on securities and currency transactions, and changes in unrealized appreciation or depreciation of Portfolio holdings.
The first section in this statement, entitled “Investment Income,” reports the dividends earned from securities and interest earned from interest-bearing securities in the Portfolio.
The next section reports the expenses incurred by the Portfolio, including the advisory fee paid to the investment adviser, transfer agent fees and expenses, and printing and postage for mailing statements, financial reports and prospectuses. Expense offsets and expense reimbursements, if any, are also shown.
The last section lists the amounts of realized gains or losses from investment and foreign currency transactions, and changes in unrealized appreciation or depreciation of investments and foreign currency-denominated assets and liabilities. The Portfolio will realize a gain (or loss) when it sells its position in a particular security. A change in unrealized gain (or loss) refers to the change in net appreciation or depreciation of the Portfolio during the reporting period. “Net Realized and Unrealized Gain/(Loss) on Investments” is affected both by changes in the market value of Portfolio holdings and by gains (or losses) realized during the reporting period.
Statements of Changes in Net Assets
These statements report the increase or decrease in the Portfolio’s net assets during the reporting period. Changes in the Portfolio’s net assets are attributable to investment operations, dividends and distributions to investors, and capital share transactions. This is important to investors because it shows exactly what caused the Portfolio’s net asset size to change during the period.
The first section summarizes the information from the Statement of Operations regarding changes in net assets due to the Portfolio’s investment operations. The Portfolio’s net assets may also change as a result of dividend and capital gains distributions to investors. If investors receive their dividends and/or distributions in cash, money is taken out of the Portfolio to pay the dividend and/or distribution. If investors reinvest their dividends and/or distributions, the Portfolio’s net assets will not be affected.
The reinvestment of dividends and distributions is included under “Capital Share Transactions.” “Capital Shares” refers to the money investors contribute to the Portfolio through purchases or withdrawals via redemptions. The Portfolio’s net assets will increase and decrease in value as investors purchase and redeem shares from the Portfolio.
Financial Highlights
This schedule provides a per-share breakdown of the components that affect the Portfolio’s NAV for current and past reporting periods as well as total return, asset size, ratios, and portfolio turnover rate.
The first line in the table reflects the NAV per share at the beginning of the reporting period. The next line reports the net investment income/(loss) per share. Following is the per share total of net gains/(losses), realized and unrealized. Per share dividends and distributions to investors are then subtracted to arrive at the NAV per share at the end of the period. The next line reflects the total return for the period. The total return may include adjustments in accordance with generally accepted accounting principles required at the period end for financial reporting purposes. As a result, the total return may differ from the total return reflected for individual shareholder transactions. Also included are ratios of expenses and net investment income to average net assets.
Janus Henderson VIT Global Technology and Innovation Portfolio
Useful Information About Your Portfolio Report (unaudited)
The Portfolio’s expenses may be reduced through expense offsets and expense reimbursements. The ratios shown reflect expenses before and after any such offsets and reimbursements.
The ratio of net investment income/(loss) summarizes the income earned less expenses, divided by the average net assets of the Portfolio during the reporting period. Do not confuse this ratio with the Portfolio’s yield. The net investment income ratio is not a true measure of the Portfolio’s yield because it does not take into account the dividends distributed to the Portfolio’s investors.
The next figure is the portfolio turnover rate, which measures the buying and selling activity in the Portfolio. Portfolio turnover is affected by market conditions, changes in the asset size of the Portfolio, fluctuating volume of shareholder purchase and redemption orders, the nature of the Portfolio’s investments, and the investment style and/or outlook of the portfolio manager(s) and/or investment personnel. A 100% rate implies that an amount equal to the value of the entire portfolio was replaced once during the fiscal year; a 50% rate means that an amount equal to the value of half the portfolio is traded in a year; and a 200% rate means that an amount equal to the value of the entire portfolio is traded every six months.
Janus Henderson VIT Global Technology and Innovation Portfolio
Designation Requirements (unaudited)
For federal income tax purposes, the Portfolio designated the following for the year ended December 31, 2022:
| | |
| | |
Capital Gain Distributions | $127,993,979 |
Janus Henderson VIT Global Technology and Innovation Portfolio
Trustees and Officers (unaudited)
The following are the Trustees and officers of the Trust, together with a brief description of their principal occupations during the last five years (principal occupations for certain Trustees may include periods over five years). The Portfolio’s Statement of Additional Information includes additional information about the Trustees and officers and is available, without charge, by calling 1-877-335-2687.
Each Trustee has served in that capacity since he or she was originally elected or appointed. The Trustees do not serve a specified term of office. Each Trustee will hold office until the termination of the Trust or his or her earlier death, resignation, retirement, incapacity, or removal. Under the Portfolio’s Governance Procedures and Guidelines, the policy is for Trustees to retire no later than the end of the calendar year in which the Trustee turns 75. The Trustees review the Portfolio’s Governance Procedures and Guidelines from time to time and may make changes they deem appropriate. The Portfolio’s Nominating and Governance Committee will consider nominees for the position of Trustee recommended by shareholders. Shareholders may submit the name of a candidate for consideration by the Committee by submitting their recommendations to the Trust’s Secretary. Each Trustee is currently a Trustee of one other registered investment company advised by the Adviser: Janus Investment Fund. Collectively, these two registered investment companies consist of 51 series or funds referred to herein as the Fund Complex.
The Trust’s officers are elected annually by the Trustees for a one-year term. Certain officers also serve as officers of Janus Investment Fund. Certain officers of the Portfolio may also be officers and/or directors of the Adviser. Except as otherwise disclosed, Portfolio officers receive no compensation from the Portfolio, except for the Portfolio’s Chief Compliance Officer, as authorized by the Trustees.
Janus Henderson VIT Global Technology and Innovation Portfolio
Trustees and Officers (unaudited)
| | | | | | |
TRUSTEES |
Name, Address, and Age | Positions Held with the Trust | Length of Time Served | Principal Occupations During the Past Five Years | Number of Portfolios/Funds in Fund Complex Overseen by Trustee | Other Directorships Held by Trustee During the Past Five Years |
Independent Trustees | | | | |
Alan A. Brown
151 Detroit Street
Denver, CO 80206
DOB: 1962 | Chairman
Trustee | 5/22-Present
1/13-Present | Principal, Curam Holdings LLC (since 2018). Formerly, Executive Vice President, Institutional Markets, of Black Creek Group (private equity real estate investment management firm) (2012-2018), Executive Vice President and Co-Head, Global Private Client Group (2007-2010), Executive Vice President, Mutual Funds (2005-2007), and Chief Marketing Officer (2001-2005) of Nuveen Investments, Inc. (asset management). | 51 | Advisory Board Member of AEW Core Property Trust (open-end property fund) (since 2020), and Director of WTTW (PBS affiliate) (since 2003). Formerly, Director of MotiveQuest LLC (strategic social market research company) (2003-2016), Director of Nuveen Global Investors LLC (2007-2011), Director of Communities in Schools (2004-2010), and Director of Mutual Fund Education Alliance (until 2010). |
Cheryl D. Alston
151 Detroit Street
Denver, CO 80206
DOB: 1966 | Trustee | 8/22-Present | Executive Director and Chief Investment Officer, Employees’ Retirement Fund of the City of Dallas (since 2004). | 51 | Director of Blue Cross Blue Shield of Kansas City (a not-for-profit health insurance provider) (since 2016) and Director of Global Life Insurance (life and supplemental health insurance provider) (since 2017). Formerly, Director of Federal Home Loan Bank of Dallas (2017-2021). |
Janus Henderson VIT Global Technology and Innovation Portfolio
Trustees and Officers (unaudited)
| | | | | | |
TRUSTEES |
Name, Address, and Age | Positions Held with the Trust | Length of Time Served | Principal Occupations During the Past Five Years | Number of Portfolios/Funds in Fund Complex Overseen by Trustee | Other Directorships Held by Trustee During the Past Five Years |
Independent Trustees | | | | |
William D. Cvengros
151 Detroit Street
Denver, CO 80206
DOB: 1948 | Trustee | 1/11-Present | Chief Executive Officer of SJC Capital, LLC (a personal investment company and consulting firm) (since 2002). Formerly, Chief Executive Officer and President of PIMCO Advisors Holdings L.P. (a publicly traded investment management firm) (1994-2000), and Chief Investment Officer (1987-1994) and Vice Chairman and Director (1990-1994) of Pacific Life Insurance Company (a mutual life insurance and annuity company) (1987-1994). | 51 | Member, Limited Partner Advisory Committee, Karmel Capital Fund III (since 2022), Member of the Investment Committee for the Orange Country Community Foundation (a grantmaking foundation) (since 2020), Advisory Board Member, RevOZ Fund LP and related funds (real estate investments for opportunity zones) (since 2020), and Advisory Board Member, Innovate Partners Emerging Growth and Equity Fund I (early stage venture capital fund) (since 2014). Formerly, Managing Trustee of National Retirement Partners Liquidating Trust (2013-2016), Chairman, National Retirement Partners, Inc. (formerly a network of advisors to 401(k) plans) (2005-2013), Director of Prospect Acquisition Corp. (a special purpose acquisition corporation) (2007-2009), Director of RemedyTemp, Inc. (temporary help services company) (1996-2006), and Trustee of PIMCO Funds Multi-Manager Series (1990-2000) and Pacific Life Variable Life & Annuity Trusts (1987-1994). |
Janus Henderson VIT Global Technology and Innovation Portfolio
Trustees and Officers (unaudited)
| | | | | | |
TRUSTEES |
Name, Address, and Age | Positions Held with the Trust | Length of Time Served | Principal Occupations During the Past Five Years | Number of Portfolios/Funds in Fund Complex Overseen by Trustee | Other Directorships Held by Trustee During the Past Five Years |
Independent Trustees | | | | |
Raudline Etienne
151 Detroit Street
Denver, CO 80206
DOB: 1965 | Trustee | 6/16-Present | Founder, Daraja Capital (advisory and investment firm) (since 2016). Formerly, Senior Vice President and Senior Advisor, Albright Stonebridge Group LLC (global strategy firm) (2011-2021), and Deputy Comptroller and Chief Investment Officer, New York State Common Retirement Fund (public pension fund) (2008-2011). | 51 | Member of the Investment Committee for Cooper Union (private college) (since 2021), Board Member, Van Alen Institute (nonprofit architectural and design organization) (2019-2022). |
Janus Henderson VIT Global Technology and Innovation Portfolio
Trustees and Officers (unaudited)
| | | | | | |
TRUSTEES |
Name, Address, and Age | Positions Held with the Trust | Length of Time Served | Principal Occupations During the Past Five Years | Number of Portfolios/Funds in Fund Complex Overseen by Trustee | Other Directorships Held by Trustee During the Past Five Years |
Independent Trustees | | | | |
Darrell B. Jackson
151 Detroit Street
Denver, CO 80206
DOB: 1958 | Trustee | 8/22-Present | President and Chief Executive Officer, The Efficace Group Inc. (since 2018). Formerly, President and Chief Executive Officer, Seaway Bank and Trust Company (community bank) (2014-2015), and Executive Vice President and Co-President, Wealth Management (2009-2014), and several senior positions, including Group Executive, Senior Vice President, and Vice President (1995-2009) of Northern Trust Company (financial services company) (1995-2014). | 51 | Director of Amalgamated Financial Corp (bank) (since August 2021), Director of YR Media (a not-for-profit production company) (since 2021), and Director of Gray-Bowen-Scott (transportation project consulting firm) (since April 2020). Formerly, Director of Delaware Place Bank (closely held commercial bank) (2016-2018) and Director of Seaway Bank and Trust Company (2014-2015). |
Janus Henderson VIT Global Technology and Innovation Portfolio
Trustees and Officers (unaudited)
| | | | | | |
TRUSTEES |
Name, Address, and Age | Positions Held with the Trust | Length of Time Served | Principal Occupations During the Past Five Years | Number of Portfolios/Funds in Fund Complex Overseen by Trustee | Other Directorships Held by Trustee During the Past Five Years |
Independent Trustees | | | | |
William F. McCalpin
151 Detroit Street
Denver, CO 80206
DOB: 1957 | Trustee | 6/02-Present | Chief Executive Officer, muun chi LLC (organic food business) (since 2022) and Independent Consultant (since 2019). Formerly, Chief Operating Officer, muun chi LLC (2020-2022), Managing Partner, Impact Investments, Athena Capital Advisors LLC (independent registered investment advisor) (2016-2019), Managing Director, Holos Consulting LLC (provides consulting services to foundations and other nonprofit organizations) (2009-2016), Chief Executive Officer, Imprint Capital Advisors (impact investment firm) (2013-2015), and Executive Vice President and Chief Operating Officer of The Rockefeller Brothers Fund (a private family foundation) (1998-2006). | 51 | Chairman of the Board and Trustee of The Investment Fund for Foundations Investment Program (TIP) (consisting of 1 fund) (since 2008). Formerly, Director of the F.B. Heron Foundation (a private grantmaking foundation) (2006-2022), and Director of Mutual Fund Directors Forum (a non-profit organization serving independent directors of U.S. mutual funds) (2016-2021). |
Janus Henderson VIT Global Technology and Innovation Portfolio
Trustees and Officers (unaudited)
| | | | | | |
TRUSTEES |
Name, Address, and Age | Positions Held with the Trust | Length of Time Served | Principal Occupations During the Past Five Years | Number of Portfolios/Funds in Fund Complex Overseen by Trustee | Other Directorships Held by Trustee During the Past Five Years |
Independent Trustees | | | | |
Gary A. Poliner
151 Detroit Street
Denver, CO 80206
DOB: 1953 | Trustee | 6/16-Present | Retired. Formerly, President (2010-2013) of Northwestern Mutual Life Insurance Company. | 51 | Director of MGIC Investment Corporation (private mortgage insurance) (since 2013). Formerly, Director, West Bend Mutual Insurance Company (property/casualty insurance) (2013-2021), Trustee of Northwestern Mutual Life Insurance Company (2010-2013) and Director of Frank Russell Company (global asset management firm) (2008-2013). |
Diane L. Wallace
151 Detroit Street
Denver, CO 80206
DOB: 1958 | Trustee | 6/17-Present | Retired. Formerly, Chief Operating Officer, Senior Vice President-Operations, and Chief Financial Officer for Driehaus Capital Management, LLC (1988-2006) and Treasurer for Driehaus Mutual Funds (1996-2002). | 51 | Formerly, Director of Family Service of Lake County (2019-2021), Independent Trustee, Henderson Global Funds (13 portfolios) (2015-2017), Independent Trustee, State Farm Associates' Funds Trust, State Farm Mutual Fund Trust, and State Farm Variable Product Trust (28 portfolios) (2013-2017). |
Janus Henderson VIT Global Technology and Innovation Portfolio
Trustees and Officers (unaudited)
| | | | |
OFFICERS |
Name, Address, and Age | Positions Held with the Trust | Term of Office* and Length of Time Served | Principal Occupations During the Past Five Years |
Jonathan Cofsky
151 Detroit Street Denver, CO 80206 DOB: 1983 | Executive Vice President and Portfolio Manager Janus Henderson Global Technology and Innovation Portfolio | 3/22-Present | Portfolio Manager for other Janus Henderson accounts and Analyst for the Adviser. |
Denny Fish 151 Detroit Street Denver, CO 80206 DOB: 1971 | Executive Vice President and Portfolio Manager Janus Henderson Global Technology and Innovation Portfolio | 1/16-Present | Head of Technology Sector Research Team of Janus Henderson Investors and Portfolio Manager for other Janus Henderson accounts. |
Michelle Rosenberg
151 Detroit Street
Denver, CO 80206
DOB: 1973 | President and Chief Executive Officer | 9/22-Present | General Counsel and Corporate Secretary of Janus Henderson Investors (since 2018). Formerly, Interim President and Chief Executive Officer of the Trust and Janus Investment Fund (2022), Senior Vice President and Head of Legal, North America of Janus Henderson Investors (2017-2018) and Deputy General Counsel of Janus Henderson US (Holdings) Inc. (2015-2018). |
* Officers are elected at least annually by the Trustees for a one-year term and may also be elected from time to time by the Trustees for an interim period. |
Janus Henderson VIT Global Technology and Innovation Portfolio
Trustees and Officers (unaudited)
| | | | |
OFFICERS |
Name, Address, and Age | Positions Held with the Trust | Term of Office* and Length of Time Served | Principal Occupations During the Past Five Years |
Kristin Mariani 151 Detroit Street Denver, CO 80206 DOB: 1966 | Vice President and Chief Compliance Officer | 7/20-Present | Head of Compliance, North America at Janus Henderson Investors (since September 2020), and Chief Compliance Officer at Janus Henderson Investors US LLC (since September 2017). Formerly, Anti-Money Laundering Officer for the Trust and Janus Investment Fund (July 2020-December 2022), Global Head of Investment Management Compliance at Janus Henderson Investors (February 2019-August 2020), Vice President, Head of Global Distribution Compliance and Chief Compliance Officer at Janus Henderson Distributors US LLC (May 2017-September 2017), Vice President, Compliance at Janus Henderson US (Holdings) Inc., Janus Henderson Investors US LLC, and Janus Henderson Distributors US LLC (2009-2017). |
Jesper Nergaard 151 Detroit Street Denver, CO 80206 DOB: 1962 | Chief Financial Officer Vice President, Treasurer, and Principal Accounting Officer | 3/05-Present 2/05-Present | Head of U.S. Fund Administration, Janus Henderson Investors and Janus Henderson Services US LLC. |
Abigail J. Murray 151 Detroit Street Denver, CO 80206 DOB: 1975 | Vice President, Chief Legal Officer, and Secretary | 12/20-Present | Managing Counsel (since 2020). Formerly, Senior Counsel for Invesco Ltd. (2017-2020), and Vice President and Senior Counsel, ALPS Fund Services, Inc. and Assistant General Counsel, ALPS Advisors, Inc. (2015-2017). |
Ciaran Askin
151 Detroit Street Denver, CO 80206 DOB: 1978 | Anti-Money Laundering Officer | 12/22-Present | Global Head of Financial Crime, Janus Henderson Investors (since 2022). Formerly, Global Head of Financial Crime for Invesco Ltd. (2017-2022). |
* Officers are elected at least annually by the Trustees for a one-year term and may also be elected from time to time by the Trustees for an interim period. |
Janus Henderson VIT Global Technology and Innovation Portfolio
Notes
NotesPage1
Janus Henderson VIT Global Technology and Innovation Portfolio
Notes
NotesPage2
Janus Henderson VIT Global Technology and Innovation Portfolio
Notes
NotesPage3
| | | | | | | | |
| | | | | |

| | | | |
This report is submitted for the general information of shareholders of the Portfolio. It is not an offer or solicitation for the Portfolio and is not authorized for distribution to prospective investors unless preceded or accompanied by an effective prospectus. |
Janus Henderson is a trademark of Janus Henderson Group plc or one of its subsidiaries. © Janus Henderson Group plc Janus Henderson Distributors US LLC |
| | | | 109-02-81119 03-23 |
| | | | | | |
| | | |
| | | ANNUAL REPORT December 31, 2022 |
| | |
| | Janus Henderson VIT Mid Cap Value Portfolio |
| | |
| | Janus Aspen Series |
| |
| | | HIGHLIGHTS · Portfolio management perspective · Investment strategy behind your portfolio · Portfolio performance, characteristics
and holdings | |
Table of Contents
Janus Henderson VIT Mid Cap Value Portfolio
Janus Henderson VIT Mid Cap Value Portfolio (unaudited)
| | | | | | |
| | | | 
Kevin Preloger co-portfolio manager | 
Justin Tugman co-portfolio manager |
| | | |
PERFORMANCE
For the 12-month period ended December 31, 2022, the Janus Henderson VIT Mid Cap Value Portfolio’s institutional shares and service shares returned -5.56% and -5.77%, respectively, outperforming the Portfolio’s benchmark, the Russell Midcap® Value Index, which returned -12.03%. Stock selection drove relative outperformance, especially in the financials, real estate, and health care sectors. Stock selection in the energy and information technology sectors detracted from relative performance.
INVESTMENT ENVIRONMENT
Mid-cap stocks declined along with the rest of the U.S. equity market in 2022, as soaring inflation, rising interest rates, and recession fears led to market turbulence. Equities faced volatility early in 2022 as supply constraints, geopolitical uncertainty, and surging commodity prices weighed on investor sentiment, especially in the aftermath of the Russian invasion of Ukraine. Expectations for more restrictive Federal Reserve (Fed) policy also triggered a sell-off in higher-valuation growth stocks. The Fed raised interest rates by 25 basis points (bps) in March but moved more aggressively with a 50 bps increase in May followed by a series of consecutive 75 bps rate hikes between June and November. The Fed opted for a 50 bps increase in December, raising hopes for a slower pace of monetary tightening in 2023. These hopes, along with some signs of moderating inflation, led markets to regain some ground in the fourth quarter. While some areas of the market have seen downward pressure on earnings and forward estimates, many cyclically exposed companies continued to post strong earnings results during the fourth quarter, defying forecasts that earnings were at risk for downside surprises. However, stocks still ended the year with broad-based declines due in part to signs of slowing growth and downward revisions to corporate earnings forecasts. Value stocks outperformed growth as a higher interest rate environment fueled a market rotation away from more speculative, high-valuation stocks. Investors were also more selective and rewarded companies with resilient earnings, high-quality balance sheets, and strong free cash flow that reduced the need for capital markets funding.
PERFORMANCE DISCUSSION
We were pleased to see many of our investments with the higher quality characteristics that we always seek rewarded during the year, as companies with strong balance sheets and positive earnings outperformed lower-quality companies. First Horizon National was a standout performer in the financials sector. The stock surged higher on news that the Memphis-based bank is being acquired by Toronto-Dominion Bank for a sizable premium. This merger is expected to close in early 2023.
Cardinal Health was a top contributor in the healthcare sector. Cardinal provides cost-effective pharmaceutical distribution and other services to hospitals and healthcare providers, a business that has historically delivered stable returns that were especially attractive to investors in a less certain economic environment.
A strong demand and pricing environment supported several our commodities-related investments. These included cost-advantaged oil and natural gas producers such as Coterra Energy, another top contributor to relative performance.
On a negative note, economic concerns pressured several consumer discretionary holdings including sportswear and casual apparel company Hanesbrands which saw sales slow as inflation squeezed consumer budgets and large retailers had excess inventory. We exited the stock given concerns over consumer spending and margin pressure.
In the information technology sector, our overweight exposure to semiconductor companies hindered relative performance as worries over slowing global chip demand led to a sell-off in semiconductor-related stocks. Teradyne, a provider of semiconductor testing equipment,
Janus Henderson VIT Mid Cap Value Portfolio (unaudited)
was among our detractors, as the company issued cautious guidance due to supply shortages and higher materials costs. A clouded outlook for semiconductor-related capital spending also hurt stock performance for MKSI Instruments which makes instrumentation tools used in chip production. We exited our position in MKSI given the clouded outlook.
The portfolio ended the period overweight in the health care, industrials, materials, communication services, energy, information technology, and consumer staples sectors. It was underweight in the utilities, financials, real estate, and consumer discretionary sectors.
OUTLOOK
We believe valuations now appear more attractive than they did at the start of 2022, presenting us with many compelling investment opportunities. This is particularly the case for smaller market-cap stocks that have underperformed large-cap stocks for six straight years. Given this market backdrop, we are finding potential opportunities among the lower end of the midcap capitalization spectrum. In addition, we recognize the potential for continued market volatility as past Fed rate hikes are absorbed into an already slowing economy. Future rate hikes may set the stage for even slower economic growth as the Fed continues to combat inflation. A slower-growing economy presents a heightened risk for downward earnings revisions in 2023. We see a heightened risk of slower consumer spending if layoffs increase and households deplete the savings they built during the pandemic. As always, we look to be opportunistic and capitalize on market volatility while adhering to our defensive value approach. Investors should be prepared for a wide variety of outcomes as the Fed will not prematurely declare a win over inflation. In such uncertain times, defense is best, and we believe our continued emphasis on owning companies with strong balance sheets, consistent free cash flow, and earnings will be important to generating strong investment performance.
Thank you for your investment in the Janus Henderson VIT Mid Cap Value Portfolio.
Janus Henderson VIT Mid Cap Value Portfolio (unaudited)
Portfolio At A Glance
December 31, 2022
| | | | | | | | | | |
| | | | | | | | | |
| | | | | | | | | |
| | | | | | | | | |
| 5 Top Contributors - Holdings | 5 Top Detractors - Holdings |
| | Average
Weight | | Relative
Contribution | | | Average
Weight | | Relative
Contribution |
| Coterra Energy Inc | 2.32% | | 0.77% | | Hanesbrands Inc | 0.83% | | -0.46% |
| First Horizon National Corp | 1.16% | | 0.77% | | Teradyne Inc | 1.13% | | -0.44% |
| Cardinal Health Inc | 1.60% | | 0.70% | | Equity LifeStyle Properties Inc | 2.49% | | -0.39% |
| Lamb Weston Holdings Inc | 1.54% | | 0.68% | | MKS Instruments Inc | 0.58% | | -0.38% |
| Burlington Stores Inc | 0.74% | | 0.60% | | F5 Networks Inc | 1.08% | | -0.37% |
| | | | | | | |
| 5 Top Contributors - Sectors* | | | | | |
| | | Relative | | Portfolio | Russell Midcap Value Index |
| | | Contribution | | Average Weight | Average Weight |
| Financials | | 2.47% | | 15.12% | 17.34% |
| Real Estate | | 1.29% | | 8.46% | 11.33% |
| Health Care | | 1.26% | | 10.91% | 7.45% |
| Consumer Discretionary | | 1.19% | | 7.22% | 9.72% |
| Consumer Staples | | 0.88% | | 4.39% | 4.38% |
| | | | | | |
| | | | | | |
| 5 Top Detractors - Sectors* | | | | | |
| | | Relative | | Portfolio | Russell Midcap Value Index |
| | | Contribution | | Average Weight | Average Weight |
| Energy | | -0.74% | | 6.01% | 6.23% |
| Information Technology | | -0.60% | | 9.47% | 9.28% |
| Utilities | | -0.59% | | 5.06% | 8.31% |
| Communication Services | | 0.15% | | 5.04% | 3.51% |
| Other** | | 0.55% | | 2.66% | 0.00% |
| | | | | | | |
| Relative contribution reflects how the portolio's holdings impacted return relative to the benchmark. Cash and securities not held in the portfolio are not shown. For equity portfolios, relative contribution compares the performance of a security in the portfolio to the benchmark's total return, factoring in the difference in weight of that security in the benchmark. Returns are calculated using daily returns and previous day ending weights rolled up by ticker, excluding fixed income securities, gross of advisory fees, may exclude certain derivatives and will differ from actual performance.
Performance attribution reflects returns gross of advisory fees and may differ from actual returns as they are based on end of day holdings. Attribution is calculated by geometrically linking daily returns for the portfolio and index. |
* | Based on sector classification according to the Global Industry Classification Standard (“GICS”) codes, which are the exclusive property and a service mark of MSCI Inc. and Standard & Poor’s. |
** | Not a GICS classified sector. |
Janus Henderson VIT Mid Cap Value Portfolio (unaudited)
Portfolio At A Glance
December 31, 2022
| | |
5 Largest Equity Holdings - (% of Net Assets) |
Laboratory Corp of America Holdings | |
Health Care Providers & Services | 2.6% |
Hartford Financial Services Group Inc | |
Insurance | 2.5% |
Baker Hughes Co | |
Energy Equipment & Services | 2.4% |
Burlington Stores Inc | |
Specialty Retail | 2.3% |
Entergy Corp | |
Electric Utilities | 2.1% |
| | 11.9% |
| | | | | | |
Asset Allocation - (% of Net Assets) | |
Common Stocks | | 98.2% | |
Repurchase Agreements | | 1.7% | |
Other | | 0.1% |
| | | 100.0% |
| | |
Top Country Allocations - Long Positions - (% of Investment Securities) |
As of December 31, 2022 
| As of December 31, 2021 
|
Janus Henderson VIT Mid Cap Value Portfolio (unaudited)
Performance
| |
See important disclosures on the next page. |

| | | | | | | | | | |
| | | | | | | | |
| | | | | | | | | |
Average Annual Total Return - for the periods ended December 31, 2022 | | | Prospectus Expense Ratios |
| | One
Year | Five
Year | Ten
Year | Since
Inception | | | Total Annual Fund
Operating Expenses‡ |
Institutional Shares | | -5.56% | 4.75% | 8.52% | 9.54%# | | | 0.67% |
Service Shares | | -5.77% | 4.49% | 8.25% | 9.10%* | | | 0.92% |
Russell Midcap Value Index | | -12.03% | 5.72% | 10.11% | 10.37%** | | | |
Morningstar Quartile - Service Shares | | 2nd | 4th | 4th | 3rd | | | |
Morningstar Ranking - based on total returns for Mid-Cap Value Funds | | 119/411 | 299/393 | 281/335 | 141/229 | | | |
Returns quoted are past performance and do not guarantee future results; current performance may be lower or higher. Investment returns and principal value will vary; there may be a gain or loss when shares are sold. For the most recent month-end performance call 800.668.0434 or visit janushenderson.com/VITperformance.
Net expense ratios reflect the expense waiver, if any, contractually agreed to for at least a one-year period commencing on April 29, 2022. See Financial Highlights for actual expense ratios during the reporting period.
This Portfolio has a performance-based management fee that may adjust up or down based on the Portfolio’s performance.
Performance may be affected by risks that include those associated with foreign and emerging markets, fixed income securities, high-yield and high-risk securities, undervalued, overlooked and smaller capitalization companies, real estate related securities including Real Estate Investment Trusts (REITs), Environmental, Social and Governance (ESG) factors, non-diversification, portfolio turnover, derivatives, short sales, initial public offerings (IPOs) and potential conflicts of interest. Each product has different risks. Please see the prospectus for more information about risks, holdings and other details.
Returns do not reflect the deduction of fees, charges or expenses of any insurance product or qualified plan. If applied, returns would have been lower.
Returns include reinvestment of all dividends and distributions and do not reflect the deduction of taxes that a shareholder would pay on Portfolio distributions or redemptions of Portfolio shares. The returns do not include adjustments in accordance with generally accepted accounting principles required at the period end for financial reporting purposes.
Ranking is for the share class shown only; other classes may have different performance characteristics. When an expense waiver is in effect, it may have a material effect on the total return, and therefore the ranking for the period.
© 2022 Morningstar, Inc. All Rights Reserved.
There is no assurance that the investment process will consistently lead to successful investing.
See Notes to Schedule of Investments and Other Information for index definitions.
Janus Henderson VIT Mid Cap Value Portfolio (unaudited)
Performance
Index performance does not reflect the expenses of managing a portfolio as an index is unmanaged and not available for direct investment.
See “Useful Information About Your Portfolio Report.”
#Institutional Shares inception date – May 1, 2003
*Service Shares inception date – December 31, 2002
**The Russell Midcap Value Index’s since inception returns are calculated from December 31, 2002.
‡ As stated in the prospectus. See Financial Highlights for actual expense ratios during the reporting period.
Janus Henderson VIT Mid Cap Value Portfolio (unaudited)
Expense Examples
As a shareholder of the Portfolio, you incur two types of costs: (1) transaction costs and (2) ongoing costs, including management fees; 12b-1 distribution and shareholder servicing fees (applicable to Service Shares only); transfer agent fees and expenses payable pursuant to the Transfer Agency Agreement; and other Portfolio expenses. This example is intended to help you understand your ongoing costs (in dollars) of investing in the Portfolio and to compare these costs with the ongoing costs of investing in other mutual funds. To do so, compare this 5% hypothetical example with the 5% hypothetical examples that appear in the shareholder reports of the other funds. The example is based upon an investment of $1,000 invested at the beginning of the period and held for the six-months indicated, unless noted otherwise in the table and footnotes below.
Actual Expenses
The information in the table under the heading “Actual” provides information about actual account values and actual expenses. You may use the information in these columns, together with the amount you invested, to estimate the expenses that you paid over the period. Simply divide your account value by $1,000 (for example, an $8,600 account value divided by $1,000 = 8.6), then multiply the result by the number in the appropriate column for your share class under the heading entitled “Expenses Paid During Period” to estimate the expenses you paid on your account during the period.
Hypothetical Example for Comparison Purposes
The information in the table under the heading “Hypothetical (5% return before expenses)” provides information about hypothetical account values and hypothetical expenses based upon the Portfolio’s actual expense ratio and an assumed rate of return of 5% per year before expenses, which is not the Portfolio’s actual return. The hypothetical account values and expenses may not be used to estimate the actual ending account balance or expenses you paid for the period. You may use this information to compare the ongoing costs of investing in the Portfolio and other funds. To do so, compare this 5% hypothetical example with the 5% hypothetical examples that appear in the shareholder reports of the other funds. Additionally, for an analysis of the fees associated with an investment in either share class or other similar funds, please visit www.finra.org/fundanalyzer.
Please note that the expenses shown in the table are meant to highlight your ongoing costs only and do not reflect any transaction costs, such as any charges at the separate account level or contract level. These fees are fully described in the Portfolio’s prospectuses. Therefore, the hypothetical examples are useful in comparing ongoing costs only, and will not help you determine the relative total costs of owning different funds. In addition, if these transaction costs were included, your costs would have been higher.
| | | | | | | | | | | |
| | | | | | | | |
| | | Actual | | Hypothetical
(5% return before expenses) | |
| Beginning
Account
Value
(7/1/22) | Ending
Account
Value
(12/31/22) | Expenses
Paid During
Period
(7/1/22 - 12/31/22)† | | Beginning
Account
Value
(7/1/22) | Ending
Account
Value
(12/31/22) | Expenses
Paid During
Period
(7/1/22 - 12/31/22)† | Net Annualized
Expense Ratio
(7/1/22 - 12/31/22) |
Institutional Shares | $1,000.00 | $1,076.60 | $3.45 | | $1,000.00 | $1,021.88 | $3.36 | 0.66% |
Service Shares | $1,000.00 | $1,074.90 | $4.76 | | $1,000.00 | $1,020.62 | $4.63 | 0.91% |
† | Expenses Paid During Period are equal to the Net Annualized Expense Ratio multiplied by the average account value over the period, multiplied by 184/365 (to reflect the one-half year period). Expenses in the examples include the effect of applicable fee waivers and/or expense reimbursements, if any. Had such waivers and/or reimbursements not been in effect, your expenses would have been higher. Please refer to the Notes to Financial Statements or the Portfolio’s prospectuses for more information regarding waivers and/or reimbursements. |
Janus Henderson VIT Mid Cap Value Portfolio
Schedule of Investments
December 31, 2022
| | | | | | | | |
Shares or
Principal Amounts | | | Value | |
Common Stocks– 98.2% | | | |
Aerospace & Defense – 3.1% | | | |
| | BWX Technologies Inc | | 30,365 | | | $1,763,599 | |
| | L3Harris Technologies Inc | | 9,076 | | | 1,889,714 | |
| | | 3,653,313 | |
Auto Components – 1.9% | | | |
| | Aptiv PLC* | | 12,529 | | | 1,166,826 | |
| | Autoliv Inc | | 14,276 | | | 1,093,256 | |
| | | 2,260,082 | |
Banks – 6.1% | | | |
| | Citizens Financial Group Inc | | 42,197 | | | 1,661,296 | |
| | Regions Financial Corp | | 70,007 | | | 1,509,351 | |
| | SVB Financial Group* | | 2,624 | | | 603,887 | |
| | Synovus Financial Corp | | 39,276 | | | 1,474,814 | |
| | Webster Financial Corp | | 24,301 | | | 1,150,409 | |
| | Zions Bancorp NA | | 16,295 | | | 801,062 | |
| | | 7,200,819 | |
Building Products – 3.0% | | | |
| | Armstrong World Industries Inc | | 12,762 | | | 875,346 | |
| | Carlisle Cos Inc | | 5,920 | | | 1,395,048 | |
| | Fortune Brands Home & Security Inc | | 20,136 | | | 1,149,967 | |
| | Masterbrand Inc* | | 20,136 | | | 152,027 | |
| | | 3,572,388 | |
Capital Markets – 2.6% | | | |
| | Jefferies Financial Group Inc | | 26,982 | | | 924,943 | |
| | State Street Corp | | 27,309 | | | 2,118,359 | |
| | | 3,043,302 | |
Chemicals – 4.8% | | | |
| | Axalta Coating Systems Ltd* | | 49,278 | | | 1,255,111 | |
| | Corteva Inc | | 34,067 | | | 2,002,458 | |
| | FMC Corp | | 12,215 | | | 1,524,432 | |
| | Westlake Chemical Corp | | 8,897 | | | 912,298 | |
| | | 5,694,299 | |
Commercial Services & Supplies – 1.7% | | | |
| | Waste Connections Inc | | 15,286 | | | 2,026,312 | |
Construction Materials – 1.2% | | | |
| | Martin Marietta Materials Inc | | 4,169 | | | 1,408,997 | |
Containers & Packaging – 2.0% | | | |
| | Graphic Packaging Holding Co | | 67,207 | | | 1,495,356 | |
| | Sonoco Products Co | | 13,093 | | | 794,876 | |
| | | 2,290,232 | |
Electric Utilities – 4.0% | | | |
| | Alliant Energy Corp | | 40,269 | | | 2,223,252 | |
| | Entergy Corp | | 21,896 | | | 2,463,300 | |
| | | 4,686,552 | |
Electrical Equipment – 3.3% | | | |
| | Acuity Brands Inc | | 9,095 | | | 1,506,223 | |
| | AMETEK Inc | | 16,788 | | | 2,345,619 | |
| | | 3,851,842 | |
Electronic Equipment, Instruments & Components – 2.4% | | | |
| | Insight Enterprises Inc* | | 3,615 | | | 362,476 | |
| | Vontier Corp | | 77,045 | | | 1,489,280 | |
| | Zebra Technologies Corp* | | 3,900 | | | 999,999 | |
| | | 2,851,755 | |
Energy Equipment & Services – 2.4% | | | |
| | Baker Hughes Co | | 95,731 | | | 2,826,937 | |
Entertainment – 3.1% | | | |
| | Activision Blizzard Inc | | 23,477 | | | 1,797,164 | |
| | Take-Two Interactive Software Inc* | | 17,332 | | | 1,804,781 | |
| | | 3,601,945 | |
| | |
See Notes to Schedule of Investments and Other Information and Notes to Financial Statements. |
| |
8 | DECEMBER 31, 2022 |
Janus Henderson VIT Mid Cap Value Portfolio
Schedule of Investments
December 31, 2022
| | | | | | | | |
Shares or
Principal Amounts | | | Value | |
Common Stocks– (continued) | | | |
Equity Real Estate Investment Trusts (REITs) – 8.6% | | | |
| | Alexandria Real Estate Equities Inc | | 12,320 | | | $1,794,655 | |
| | Apple Hospitality Inc | | 113,215 | | | 1,786,533 | |
| | Equity LifeStyle Properties Inc | | 37,757 | | | 2,439,102 | |
| | Lamar Advertising Co | | 19,453 | | | 1,836,363 | |
| | STAG Industrial Inc | | 30,705 | | | 992,079 | |
| | Weyerhaeuser Co | | 41,296 | | | 1,280,176 | |
| | | 10,128,908 | |
Food & Staples Retailing – 2.0% | | | |
| | Casey's General Stores Inc | | 10,234 | | | 2,295,998 | |
Food Products – 2.3% | | | |
| | Kellogg Co | | 17,766 | | | 1,265,650 | |
| | Lamb Weston Holdings Inc | | 16,626 | | | 1,485,699 | |
| | | 2,751,349 | |
Health Care Equipment & Supplies – 2.8% | | | |
| | Envista Holdings Corp* | | 35,454 | | | 1,193,736 | |
| | Globus Medical Inc* | | 27,741 | | | 2,060,324 | |
| | | 3,254,060 | |
Health Care Providers & Services – 7.0% | | | |
| | Cardinal Health Inc | | 22,882 | | | 1,758,939 | |
| | Henry Schein Inc* | | 28,114 | | | 2,245,465 | |
| | Humana Inc | | 2,149 | | | 1,100,696 | |
| | Laboratory Corp of America Holdings | | 13,061 | | | 3,075,604 | |
| | | 8,180,704 | |
Information Technology Services – 2.0% | | | |
| | Fidelity National Information Services Inc | | 26,320 | | | 1,785,812 | |
| | Global Payments Inc | | 5,813 | | | 577,347 | |
| | | 2,363,159 | |
Insurance – 6.7% | | | |
| | Globe Life Inc | | 16,786 | | | 2,023,552 | |
| | Hartford Financial Services Group Inc | | 38,227 | | | 2,898,754 | |
| | Reinsurance Group of America Inc | | 8,849 | | | 1,257,355 | |
| | RenaissanceRe Holdings Ltd | | 9,054 | | | 1,668,019 | |
| | | 7,847,680 | |
Life Sciences Tools & Services – 1.4% | | | |
| | Agilent Technologies Inc | | 7,174 | | | 1,073,589 | |
| | Charles River Laboratories International Inc* | | 2,427 | | | 528,843 | |
| | | 1,602,432 | |
Machinery – 2.0% | | | |
| | Lincoln Electric Holdings Inc | | 11,692 | | | 1,689,377 | |
| | Oshkosh Corp | | 6,851 | | | 604,190 | |
| | | 2,293,567 | |
Media – 1.3% | | | |
| | Fox Corp - Class B | | 54,984 | | | 1,564,295 | |
Metals & Mining – 1.2% | | | |
| | Freeport-McMoRan Inc | | 38,379 | | | 1,458,402 | |
Multi-Utilities – 0.7% | | | |
| | DTE Energy Co | | 7,242 | | | 851,152 | |
Oil, Gas & Consumable Fuels – 3.4% | | | |
| | Cabot Oil & Gas Corp | | 89,437 | | | 2,197,467 | |
| | Pioneer Natural Resources Co | | 7,901 | | | 1,804,509 | |
| | | 4,001,976 | |
Road & Rail – 1.5% | | | |
| | Canadian Pacific Railway Ltd | | 15,253 | | | 1,137,721 | |
| | Landstar System Inc | | 3,794 | | | 618,043 | |
| | | 1,755,764 | |
Semiconductor & Semiconductor Equipment – 3.1% | | | |
| | Lam Research Corp | | 1,577 | | | 662,813 | |
| | Microchip Technology Inc | | 22,813 | | | 1,602,613 | |
| | |
See Notes to Schedule of Investments and Other Information and Notes to Financial Statements. |
| |
Janus Aspen Series | 9 |
Janus Henderson VIT Mid Cap Value Portfolio
Schedule of Investments
December 31, 2022
| | | | | | | | |
Shares or
Principal Amounts | | | Value | |
Common Stocks– (continued) | | | |
Semiconductor & Semiconductor Equipment– (continued) | | | |
| | Teradyne Inc | | 15,497 | | | $1,353,663 | |
| | | 3,619,089 | |
Software – 1.7% | | | |
| | Black Knight Inc* | | 17,047 | | | 1,052,652 | |
| | Nice Ltd (ADR)* | | 4,755 | | | 914,387 | |
| | | 1,967,039 | |
Specialty Retail – 6.1% | | | |
| | AutoZone Inc* | | 656 | | | 1,617,814 | |
| | Bath & Body Works Inc | | 30,301 | | | 1,276,884 | |
| | Burlington Stores Inc* | | 13,318 | | | 2,700,358 | |
| | O'Reilly Automotive Inc* | | 1,922 | | | 1,622,226 | |
| | | 7,217,282 | |
Trading Companies & Distributors – 2.8% | | | |
| | GATX Corp | | 13,007 | | | 1,383,164 | |
| | MSC Industrial Direct Co Inc | | 23,530 | | | 1,922,401 | |
| | | 3,305,565 | |
Total Common Stocks (cost $91,605,985) | | 115,427,196 | |
Repurchase Agreements– 1.7% | | | |
| | ING Financial Markets LLC, Joint repurchase agreement, 4.2600%, dated 12/30/22, maturing 1/3/23 to be repurchased at $2,000,947 collateralized by $2,348,223 in U.S. Treasuries 0.2500% - 5.3750%, 6/15/24 - 5/15/52 with a value of $2,040,966((cost $2,000,000) | | $2,000,000 | | | 2,000,000 | |
Total Investments (total cost $93,605,985) – 99.9% | | 117,427,196 | |
Cash, Receivables and Other Assets, net of Liabilities – 0.1% | | 147,825 | |
Net Assets – 100% | | $117,575,021 | |
| | | | | | |
Summary of Investments by Country - (Long Positions) (unaudited) |
| |
| | | | | % of | |
| | | | | Investment | |
Country | | Value | | Securities | |
United States | | $114,281,832 | | 97.3 | % |
Canada | | 1,137,721 | | 1.0 | |
Sweden | | 1,093,256 | | 0.9 | |
Israel | | 914,387 | | 0.8 | |
| | | | | | |
| | | | | | |
Total | | $117,427,196 | | 100.0 | % |
| | | | | | | | | | |
Offsetting of Financial Assets and Derivative Assets |
| |
| | | Gross Amounts | | | | | | |
| | | of Recognized | | Offsetting Asset | | Collateral | | |
Counterparty | | Assets | | or Liability(a) | | Pledged(b) | | Net Amount |
| | | | | | | | | |
ING Financial Markets LLC | $ | 2,000,000 | $ | — | $ | (2,000,000) | $ | — |
| | | | | | | | | |
(a) | Represents the amount of assets or liabilities that could be offset with the same counterparty under master netting or similar agreements that management elects not to offset on the Statement of Assets and Liabilities. |
(b) | Collateral pledged is limited to the net outstanding amount due to/from an individual counterparty. The actual collateral amounts pledged may exceed these amounts and may fluctuate in value. |
| | |
See Notes to Schedule of Investments and Other Information and Notes to Financial Statements. |
| |
10 | DECEMBER 31, 2022 |
Janus Henderson VIT Mid Cap Value Portfolio
Notes to Schedule of Investments and Other Information
| | |
Russell Midcap® Value Index | Russell Midcap® Value Index reflects the performance of U.S. mid-cap equities with lower price-to-book ratios and lower forecasted growth values. |
| | |
ADR | American Depositary Receipt |
LLC | Limited Liability Company |
PLC | Public Limited Company |
| | |
* | Non-income producing security. |
| | | | | | | | | | | | | |
The following is a summary of the inputs that were used to value the Portfolio’s investments in securities and other financial instruments as of December 31, 2022. See Notes to Financial Statements for more information. |
| |
Valuation Inputs Summary |
| | | | | | | |
| | | | | Level 2 - | | Level 3 - |
| | | Level 1 - | | Other Significant | | Significant |
| | | Quoted Prices | | Observable Inputs | | Unobservable Inputs |
| | | | | | | |
Assets | | | | | | |
Investments In Securities: | | | | | | |
Common Stocks | $ | 115,427,196 | $ | - | $ | - |
Repurchase Agreements | | - | | 2,000,000 | | - |
Total Assets | $ | 115,427,196 | $ | 2,000,000 | $ | - |
| | | | | | | |
Janus Henderson VIT Mid Cap Value Portfolio
Statement of Assets and Liabilities
December 31, 2022
| | | | | | | |
| | | | | | |
Assets: | | | | |
| Investments, at value (cost $91,605,985) | | $ | 115,427,196 | |
| Repurchase agreements, at value (cost $2,000,000) | | | 2,000,000 | |
| Cash | | | 195,177 | |
| Trustees' deferred compensation | | | 3,817 | |
| Receivables: | | | | |
| | Dividends | | | 167,175 | |
| | Portfolio shares sold | | | 74,731 | |
| | Interest | | | 947 | |
| Other assets | | | 1,261 | |
Total Assets | | | 117,870,304 | |
Liabilities: | | | | |
| Payables: | | | — | |
| | Portfolio shares repurchased | | | 140,895 | |
| | Advisory fees | | | 54,352 | |
| | Professional fees | | | 40,374 | |
| | 12b-1 Distribution and shareholder servicing fees | | | 15,193 | |
| | Transfer agent fees and expenses | | | 5,847 | |
| | Trustees' deferred compensation fees | | | 3,817 | |
| | Custodian fees | | | 504 | |
| | Affiliated portfolio administration fees payable | | | 269 | |
| | Trustees' fees and expenses | | | 63 | |
| | Accrued expenses and other payables | | | 33,969 | |
Total Liabilities | | | 295,283 | |
Net Assets | | $ | 117,575,021 | |
Net Assets Consist of: | | | | |
| Capital (par value and paid-in surplus) | | $ | 90,397,170 | |
| Total distributable earnings (loss) | | | 27,177,851 | |
Total Net Assets | | $ | 117,575,021 | |
Net Assets - Institutional Shares | | $ | 51,231,214 | |
| Shares Outstanding, $0.001 Par Value (unlimited shares authorized) | | 3,131,028 | |
Net Asset Value Per Share | | $ | 16.36 | |
Net Assets - Service Shares | | $ | 66,343,807 | |
| Shares Outstanding, $0.001 Par Value (unlimited shares authorized) | | 4,240,870 | |
Net Asset Value Per Share | | $ | 15.64 | |
| | |
See Notes to Financial Statements. |
| |
12 | DECEMBER 31, 2022 |
Janus Henderson VIT Mid Cap Value Portfolio
Statement of Operations
For the year ended December 31, 2022
| | | | | | |
| | | | | |
Investment Income: |
| Dividends | $ | 2,112,703 | |
| Interest | | 45,051 | |
| Foreign tax withheld | | (3,569) | |
Total Investment Income | | 2,154,185 | |
Expenses: | | | |
| Advisory fees | | 600,193 | |
| 12b-1 Distribution and shareholder servicing fees: |
| | Service Shares | | 175,470 | |
| Transfer agent administrative fees and expenses: | | |
| | Institutional Shares | | 25,340 | |
| | Service Shares | | 35,114 | |
| Other transfer agent fees and expenses: | | | |
| | Institutional Shares | | 1,420 | |
| | Service Shares | | 1,284 | |
| Non-affiliated portfolio administration fees | | 47,436 | |
| Professional fees | | 41,554 | |
| Registration fees | | 23,366 | |
| Shareholder reports expense | | 18,721 | |
| Affiliated portfolio administration fees | | 3,023 | |
| Custodian fees | | 3,001 | |
| Trustees’ fees and expenses | | 2,833 | |
| Other expenses | | 3,122 | |
Total Expenses | | 981,877 | |
Net Investment Income/(Loss) | | 1,172,308 | |
Net Realized Gain/(Loss) on Investments: | |
| Investments | | 3,262,487 | |
Total Net Realized Gain/(Loss) on Investments | 3,262,487 | |
Change in Unrealized Net Appreciation/Depreciation: |
| Investments and Trustees’ deferred compensation | | (11,525,356) | |
Total Change in Unrealized Net Appreciation/Depreciation | (11,525,356) | |
Net Increase/(Decrease) in Net Assets Resulting from Operations | $ | (7,090,561) | |
| | | | | |
| | |
See Notes to Financial Statements. |
| |
Janus Aspen Series | 13 |
Janus Henderson VIT Mid Cap Value Portfolio
Statements of Changes in Net Assets
| | | | | | | | | |
| | | | | | | | |
| | | Year ended
December 31, 2022 | | Year ended
December 31, 2021 | |
| | | | | | | | | |
Operations: | | | | | | |
| Net investment income/(loss) | $ | 1,172,308 | | $ | 998,826 | |
| Net realized gain/(loss) on investments | | 3,262,487 | | | 12,968,913 | |
| Change in unrealized net appreciation/depreciation | (11,525,356) | | | 8,552,472 | |
Net Increase/(Decrease) in Net Assets Resulting from Operations | (7,090,561) | | | 22,520,211 | |
Dividends and Distributions to Shareholders: | | | | | | |
| | Institutional Shares | | (4,575,481) | | | (248,276) | |
| | Service Shares | | (6,360,632) | | | (228,918) | |
Net Decrease from Dividends and Distributions to Shareholders | (10,936,113) | | | (477,194) | |
Capital Share Transactions: | | | | | | |
| | Institutional Shares | | (118,995) | | | 710,776 | |
| | Service Shares | | (1,250,483) | | | (2,287,624) | |
Net Increase/(Decrease) from Capital Share Transactions | (1,369,478) | | | (1,576,848) | |
Net Increase/(Decrease) in Net Assets | | (19,396,152) | | | 20,466,169 | |
Net Assets: | | | | | | |
| Beginning of period | | 136,971,173 | | | 116,505,004 | |
| End of period | $ | 117,575,021 | | $ | 136,971,173 | |
| | | | | | | | |
| | |
See Notes to Financial Statements. |
| |
14 | DECEMBER 31, 2022 |
Janus Henderson VIT Mid Cap Value Portfolio
Financial Highlights
| | | | | | | | | | | | | | | | | | | |
Institutional Shares | | | | | | | | | | | | | | | |
For a share outstanding during the year ended December 31 | | 2022 | | | 2021 | | | 2020 | | | 2019 | | | 2018 | |
| Net Asset Value, Beginning of Period | | $19.12 | | | $16.04 | | | $16.73 | | | $14.08 | | | $18.02 | |
| Income/(Loss) from Investment Operations: | | | | | | | | | | | | | | | |
| | Net investment income/(loss)(1) | | 0.18 | | | 0.16 | | | 0.18 | | | 0.21 | | | 0.17 | |
| | Net realized and unrealized gain/(loss) | | (1.34) | | | 3.00 | | | (0.41) | | | 3.90 | | | (2.40) | |
| Total from Investment Operations | | (1.16) | | | 3.16 | | | (0.23) | | | 4.11 | | | (2.23) | |
| Less Dividends and Distributions: | | | | | | | | | | | | | | | |
| | Dividends (from net investment income) | | (0.23) | | | (0.08) | | | (0.18) | | | (0.19) | | | (0.18) | |
| | Distributions (from capital gains) | | (1.37) | | | — | | | (0.28) | | | (1.27) | | | (1.53) | |
| Total Dividends and Distributions | | (1.60) | | | (0.08) | | | (0.46) | | | (1.46) | | | (1.71) | |
| Net Asset Value, End of Period | | $16.36 | | | $19.12 | | | $16.04 | | | $16.73 | | | $14.08 | |
| Total Return* | | (5.56)% | | | 19.73% | | | (0.92)% | | | 30.35% | | | (13.63)% | |
| Net Assets, End of Period (in thousands) | | $51,231 | | | $58,536 | | | $48,538 | | | $45,771 | | | $36,265 | |
| Average Net Assets for the Period (in thousands) | | $50,719 | | | $54,542 | | | $40,480 | | | $41,788 | | | $42,219 | |
| Ratios to Average Net Assets**: | | | | | | | | | | | | | | | |
| | Ratio of Gross Expenses | | 0.67% | | | 0.67% | | | 0.81% | | | 0.81% | | | 0.81% | |
| | Ratio of Net Expenses (After Waivers and Expense Offsets) | | 0.67% | | | 0.67% | | | 0.81% | | | 0.81% | | | 0.81% | |
| | Ratio of Net Investment Income/(Loss) | | 1.12% | | | 0.90% | | | 1.24% | | | 1.32% | | | 1.03% | |
| Portfolio Turnover Rate | | 48% | | | 63% | | | 44% | | | 43% | | | 42% | |
| | | | | | | | | | | | | | | | | | | |
| |
* Total return includes adjustments in accordance with generally accepted accounting principles required at the year or period end and are not annualized for periods of less than one full year. Total return does not include fees, charges, or expenses imposed by the variable annuity and life insurance contracts for which Janus Aspen Series serves as an underlying investment vehicle. ** Annualized for periods of less than one full year. (1) Per share amounts are calculated based on average shares outstanding during the year or period. |
| | |
See Notes to Financial Statements. |
| |
Janus Aspen Series | 15 |
Janus Henderson VIT Mid Cap Value Portfolio
Financial Highlights
| | | | | | | | | | | | | | | | | | | |
Service Shares | | | | | | | | | | | | | | | |
For a share outstanding during the year ended December 31 | | 2022 | | | 2021 | | | 2020 | | | 2019 | | | 2018 | |
| Net Asset Value, Beginning of Period | | $18.36 | | | $15.42 | | | $16.12 | | | $13.62 | | | $17.49 | |
| Income/(Loss) from Investment Operations: | | | | | | | | | | | | | | | |
| | Net investment income/(loss)(1) | | 0.14 | | | 0.12 | | | 0.13 | | | 0.16 | | | 0.13 | |
| | Net realized and unrealized gain/(loss) | | (1.30) | | | 2.87 | | | (0.40) | | | 3.77 | | | (2.32) | |
| Total from Investment Operations | | (1.16) | | | 2.99 | | | (0.27) | | | 3.93 | | | (2.19) | |
| Less Dividends and Distributions: | | | | | | | | | | | | | | | |
| | Dividends (from net investment income) | | (0.19) | | | (0.05) | | | (0.15) | | | (0.16) | | | (0.15) | |
| | Distributions (from capital gains) | | (1.37) | | | — | | | (0.28) | | | (1.27) | | | (1.53) | |
| Total Dividends and Distributions | | (1.56) | | | (0.05) | | | (0.43) | | | (1.43) | | | (1.68) | |
| Net Asset Value, End of Period | | $15.64 | | | $18.36 | | | $15.42 | | | $16.12 | | | $13.62 | |
| Total Return* | | (5.77)% | | | 19.42% | | | (1.21)% | | | 30.05% | | | (13.82)% | |
| Net Assets, End of Period (in thousands) | | $66,344 | | | $78,435 | | | $67,967 | | | $72,167 | | | $62,334 | |
| Average Net Assets for the Period (in thousands) | | $70,295 | | | $74,166 | | | $62,469 | | | $68,198 | | | $72,480 | |
| Ratios to Average Net Assets**: | | | | | | | | | | | | | | | |
| | Ratio of Gross Expenses | | 0.91% | | | 0.92% | | | 1.06% | | | 1.05% | | | 1.06% | |
| | Ratio of Net Expenses (After Waivers and Expense Offsets) | | 0.91% | | | 0.92% | | | 1.06% | | | 1.05% | | | 1.06% | |
| | Ratio of Net Investment Income/(Loss) | | 0.86% | | | 0.68% | | | 0.97% | | | 1.06% | | | 0.78% | |
| Portfolio Turnover Rate | | 48% | | | 63% | | | 44% | | | 43% | | | 42% | |
| | | | | | | | | | | | | | | | | | | |
| |
* Total return includes adjustments in accordance with generally accepted accounting principles required at the year or period end and are not annualized for periods of less than one full year. Total return does not include fees, charges, or expenses imposed by the variable annuity and life insurance contracts for which Janus Aspen Series serves as an underlying investment vehicle. ** Annualized for periods of less than one full year. (1) Per share amounts are calculated based on average shares outstanding during the year or period. |
| | |
See Notes to Financial Statements. |
| |
16 | DECEMBER 31, 2022 |
Janus Henderson VIT Mid Cap Value Portfolio
Notes to Financial Statements
1. Organization and Significant Accounting Policies
Janus Henderson VIT Mid Cap Value Portfolio (the “Portfolio”) is a series of Janus Aspen Series (the “Trust”), which is organized as a Delaware statutory trust and is registered under the Investment Company Act of 1940, as amended (the “1940 Act”), as an open-end management investment company, and therefore has applied the specialized accounting and reporting guidance in Financial Accounting Standards Board (“FASB”) Accounting Standards Codification (“ASC”) Topic 946. The Trust offers 11 portfolios, each of which offers multiple share classes, with differing investment objectives and policies. The Portfolio seeks capital appreciation. The Portfolio is classified as diversified, as defined in the 1940 Act. Janus Henderson Investors US LLC is the investment adviser (the “Adviser”) to the Portfolio.
The Portfolio currently offers two classes of shares: Institutional Shares and Service Shares. Each class represents an interest in the same portfolio of investments. Institutional Shares are offered only in connection with investment in and payments under variable insurance contracts as well as certain qualified retirement plans. Service Shares are offered only in connection with investment in and payments under variable insurance contracts as well as certain qualified retirement plans that require a fee from Portfolio assets to procure distribution and administrative services to contract owners and plan participants.
Shareholders, including participating insurance companies, as well as accounts, may from time to time own (beneficially or of record) a significant percentage of the Portfolio’s Shares and can be considered to “control” the Portfolio when that ownership exceeds 25% of the Portfolio’s assets (and which may differ from control as determined in accordance with United States of America generally accepted accounting principles ("US GAAP")).
The following accounting policies have been followed by the Portfolio and are in conformity with US GAAP.
Investment Valuation
Portfolio holdings are valued in accordance with policies and procedures established by the Adviser pursuant to Rule 2a-5 under the 1940 Act and approved by and subject to the oversight of the Trustees (the “Valuation Procedures”). Equity securities traded on a domestic securities exchange are generally valued at readily available market quotations, which are (i) the official close prices or (ii) last sale prices on the primary market or exchange in which the securities trade. If such price is lacking for the trading period immediately preceding the time of determination, such securities are generally valued at their current bid price. Equity securities that are traded on a foreign exchange are generally valued at the closing prices on such markets. In the event that there is no current trading volume on a particular security in such foreign exchange, the bid price from the primary exchange is generally used to value the security. Foreign securities and currencies are converted to U.S. dollars using the current spot USD dollar exchange rate in effect at the close of the New York Stock Exchange (“NYSE”). The Portfolio will determine the market value of individual securities held by it by using prices provided by one or more approved professional pricing services or, as needed, by obtaining market quotations from independent broker-dealers. Most debt securities are valued in accordance with the evaluated bid price supplied by the Adviser-approved pricing service that is intended to reflect market value. The evaluated bid price supplied by the pricing service is an evaluation that may consider factors such as security prices, yields, maturities and ratings. Certain short-term securities maturing within 60 days or less may be evaluated and valued on an amortized cost basis provided that the amortized cost determined approximates market value. Securities for which market quotations or evaluated prices are not readily available or deemed unreliable are valued at fair value determined in good faith by the Adviser pursuant to the Valuation Procedures. Circumstances in which fair valuation may be utilized include, but are not limited to: (i) a significant event that may affect the securities of a single issuer, such as a merger, bankruptcy, or significant issuer-specific development; (ii) an event that may affect an entire market, such as a natural disaster or significant governmental action; (iii) a nonsignificant event such as a market closing early or not opening, or a security trading halt; and (iv) pricing of a nonvalued security and a restricted or nonpublic security. Special valuation considerations may apply with respect to “odd-lot” fixed-income transactions which, due to their small size, may receive evaluated prices by pricing services which reflect a large block trade and not what actually could be obtained for the odd-lot position. The valuation policies provide for the use of systematic fair valuation models provided by independent pricing services to value foreign equity securities in order to adjust for stale pricing, which may occur between the close of certain foreign exchanges and the close of the NYSE. The value of the securities of other mutual funds held by a Portfolio, if any, will be calculated using the NAV of such mutual funds.
Valuation Inputs Summary
FASB ASC 820, Fair Value Measurements and Disclosures (“ASC 820”), defines fair value, establishes a framework for measuring fair value, and expands disclosure requirements regarding fair value measurements. This standard
Janus Henderson VIT Mid Cap Value Portfolio
Notes to Financial Statements
emphasizes that fair value is a market-based measurement that should be determined based on the assumptions that market participants would use in pricing an asset or liability and establishes a hierarchy that prioritizes inputs to valuation techniques used to measure fair value. These inputs are summarized into three broad levels:
Level 1 – Unadjusted quoted prices in active markets the Portfolio has the ability to access for identical assets or liabilities.
Level 2 – Observable inputs other than unadjusted quoted prices included in Level 1 that are observable for the asset or liability either directly or indirectly. These inputs may include quoted prices for the identical instrument on an inactive market, prices for similar instruments, interest rates, prepayment speeds, credit risk, yield curves, default rates and similar data.
Assets or liabilities categorized as Level 2 in the hierarchy generally include: debt securities fair valued in accordance with the evaluated bid or ask prices supplied by a pricing service; securities traded on OTC markets and listed securities for which no sales are reported that are fair valued at the latest bid price (or yield equivalent thereof) obtained from one or more dealers transacting in a market for such securities or by a pricing service approved by the Portfolio’s Trustees; certain short-term debt securities with maturities of 60 days or less that are fair valued at amortized cost; and equity securities of foreign issuers whose fair value is determined by using systematic fair valuation models provided by independent third parties in order to adjust for stale pricing which may occur between the close of certain foreign exchanges and the close of the NYSE. Other securities that may be categorized as Level 2 in the hierarchy include, but are not limited to, preferred stocks, bank loans, swaps, investments in unregistered investment companies, options, and forward contracts.
Level 3 – Unobservable inputs for the asset or liability to the extent that relevant observable inputs are not available, representing the Portfolio’s own assumptions about the assumptions that a market participant would use in valuing the asset or liability, and that would be based on the best information available.
There have been no significant changes in valuation techniques used in valuing any such positions held by the Portfolio since the beginning of the fiscal year.
The inputs or methodology used for fair valuing securities are not necessarily an indication of the risk associated with investing in those securities. The summary of inputs used as of December 31, 2022 to fair value the Portfolio’s investments in securities and other financial instruments is included in the “Valuation Inputs Summary” in the Notes to Schedule of Investments and Other Information.
Investment Transactions and Investment Income
Investment transactions are accounted for as of the date purchased or sold (trade date). Dividend income is recorded on the ex-dividend date. Certain dividends from foreign securities will be recorded as soon as the Portfolio is informed of the dividend, if such information is obtained subsequent to the ex-dividend date. Dividends from foreign securities may be subject to withholding taxes in foreign jurisdictions. Non-cash dividends, if any, are recorded on the ex-dividend date at fair value. Interest income is recorded daily on the accrual basis and includes amortization of premiums and accretion of discounts. The Portfolio classifies gains and losses on prepayments received as an adjustment to interest income. Debt securities may be placed in non-accrual status and related interest income may be reduced by stopping current accruals and writing off interest receivables when collection of all or a portion of interest has become doubtful. Gains and losses are determined on the identified cost basis, which is the same basis used for federal income tax purposes. Income, as well as gains and losses, both realized and unrealized, are allocated daily to each class of shares based upon the ratio of net assets represented by each class as a percentage of total net assets.
Expenses
The Portfolio bears expenses incurred specifically on its behalf. Each class of shares bears a portion of general expenses, which are allocated daily to each class of shares based upon the ratio of net assets represented by each class as a percentage of total net assets. Expenses directly attributable to a specific class of shares are charged against the operations of such class.
Estimates
The preparation of financial statements in conformity with US GAAP requires management to make estimates and assumptions that affect the reported amount of assets and liabilities and disclosure of contingent assets and liabilities at the date of the financial statements, and the reported amounts of income and expenses during the reporting period. Actual results could differ from those estimates.
Janus Henderson VIT Mid Cap Value Portfolio
Notes to Financial Statements
Indemnifications
In the normal course of business, the Portfolio may enter into contracts that contain provisions for indemnification of other parties against certain potential liabilities. The Portfolio’s maximum exposure under these arrangements is unknown, and would involve future claims that may be made against the Portfolio that have not yet occurred. Currently, the risk of material loss from such claims is considered remote.
Dividends and Distributions
The Portfolio may make semiannual distributions of substantially all of its investment income and an annual distribution of its net realized capital gains (if any).
The Portfolio may make certain investments in real estate investment trusts (“REITs”) which pay dividends to their shareholders based upon funds available from operations. It is quite common for these dividends to exceed the REITs’ taxable earnings and profits, resulting in the excess portion of such dividends being designated as a return of capital. If the Portfolio distributes such amounts, such distributions could constitute a return of capital to shareholders for federal income tax purposes.
Federal Income Taxes
The Portfolio intends to continue to qualify as a regulated investment company and distribute all of its taxable income in accordance with the requirements of Subchapter M of the Internal Revenue Code. Management has analyzed the Portfolio’s tax positions taken for all open federal income tax years, generally a three-year period, and has concluded that no provision for federal income tax is required in the Portfolio’s financial statements. The Portfolio is not aware of any tax positions for which it is reasonably possible that the total amounts of unrecognized tax benefits will significantly change in the next twelve months.
2. Other Investments and Strategies
Additional Investment Risk
The U.S. government and the Federal Reserve, as well as certain foreign governments and central banks, have taken extraordinary actions to support local and global economies and the financial markets in response to the COVID-19 pandemic. This and other government intervention into the economy and financial markets to address the COVID-19 pandemic may not work as intended, particularly if the efforts are perceived by investors as being unlikely to achieve the desired results. Government actions to mitigate the economic impact of the pandemic have resulted in a large expansion of government deficits and debt, the long term consequences of which are not known. The COVID-19 pandemic could adversely affect the value and liquidity of a Portfolio’s investments, impair a Portfolio’s ability to satisfy redemption requests, and negatively impact a Portfolio’s performance. In addition, the outbreak of COVID-19, and measures taken to mitigate its effects, could result in disruptions to the services provided to a Portfolio by its service providers.
Widespread disease, including pandemics and epidemics, and natural or environmental disasters, including those which may be attributable to global climate change, such as earthquakes, fires, floods, hurricanes, tsunamis and weather-related phenomena generally, have been and can be highly disruptive to economies and markets, adversely impacting individual companies, sectors, industries, markets, currencies, interest and inflation rates, credit ratings, investor sentiment, and other factors affecting the value of a Portfolio’s investments. Economies and financial markets throughout the world have become increasingly interconnected, which increases the likelihood that events or conditions in one region or country will adversely affect markets or issuers in other regions or countries, including the United States. These disruptions could prevent a Portfolio from executing advantageous investment decisions in a timely manner and negatively impact a Portfolio’s ability to achieve its investment objective(s). Any such event(s) could have a significant adverse impact on the value of a Portfolio. In addition, these disruptions could also impair the information technology and other operational systems upon which the Portfolio’s service providers, including the Adviser or the subadviser (as applicable), rely, and could otherwise disrupt the ability of employees of the Portfolio’s service providers to perform essential tasks on behalf of the Portfolio. Adverse weather conditions may also have a particularly significant negative effect on issuers in the agricultural sector and on insurance and reinsurance companies that insure or reinsure against the impact of natural disasters.
A number of countries in the European Union (the “EU”) have experienced, and may continue to experience, severe economic and financial difficulties. In particular, many EU nations are susceptible to economic risks associated with high levels of debt. Many non-governmental issuers, and even certain governments, have defaulted on, or been forced to restructure, their debts. Many other issuers have faced difficulties obtaining credit or refinancing existing obligations.
Janus Henderson VIT Mid Cap Value Portfolio
Notes to Financial Statements
Financial institutions have in many cases required government or central bank support, have needed to raise capital, and/or have been impaired in their ability to extend credit. As a result, financial markets in the EU have experienced extreme volatility and declines in asset values and liquidity. These difficulties may continue, worsen, or spread further within the EU. Responses to these financial problems by European governments, central banks, and others, including austerity measures and reforms, may not work, may result in social unrest, and may limit future growth and economic recovery or have other unintended consequences. Among other things, these developments have adversely affected the value and exchange rate of the euro and pound sterling, and may continue to significantly affect the economies of all EU countries, which in turn may have a material adverse effect on the Portfolio’s investments in such countries, other countries that depend on EU countries for significant amounts of trade or investment, or issuers with exposure to debt issued by certain EU countries.
Real Estate Investing
The Portfolio may invest in equity and debt securities of real estate-related companies. Such companies may include those in the real estate industry or real estate-related industries. These securities may include common stocks, corporate bonds, preferred stocks, and other equity securities, including, but not limited to, mortgage-backed securities, real estate-backed securities, securities of REITs and similar REIT-like entities. A REIT is a trust that invests in real estate-related projects, such as properties, mortgage loans, and construction loans. REITs are generally categorized as equity, mortgage, or hybrid REITs. A REIT may be listed on an exchange or traded OTC.
Repurchase Agreements
The Portfolio and other funds advised by the Adviser or its affiliates may transfer daily uninvested cash balances into one or more joint trading accounts. Assets in the joint trading accounts are invested in money market instruments and the proceeds are allocated to the participating funds on a pro rata basis.
Repurchase agreements held by the Portfolio are fully collateralized, and such collateral is in the possession of the Portfolio’s custodian or, for tri-party agreements, the custodian designated by the agreement. The collateral is evaluated daily to ensure its market value exceeds the current market value of the repurchase agreements, including accrued interest. In the event of default on the obligation to repurchase, the Portfolio has the right to liquidate the collateral and apply the proceeds in satisfaction of the obligation. In the event of default or bankruptcy by the other party to the agreement, realization and/or retention of the collateral or proceeds may be subject to legal proceedings.
Counterparties
Portfolio transactions involving a counterparty are subject to the risk that the counterparty or a third party will not fulfill its obligation to the Portfolio (“counterparty risk”). Counterparty risk may arise because of the counterparty’s financial condition (i.e., financial difficulties, bankruptcy, or insolvency), market activities and developments, or other reasons, whether foreseen or not. A counterparty’s inability to fulfill its obligation may result in significant financial loss to the Portfolio. The Portfolio may be unable to recover its investment from the counterparty or may obtain a limited recovery, and/or recovery may be delayed. The extent of the Portfolio’s exposure to counterparty risk with respect to financial assets and liabilities approximates its carrying value. See the "Offsetting Assets and Liabilities" section of this Note for further details.
The Portfolio may be exposed to counterparty risk through participation in various programs, including, but not limited to, lending its securities to third parties, cash sweep arrangements whereby the Portfolio’s cash balance is invested in one or more types of cash management vehicles, as well as investments in, but not limited to, repurchase agreements, debt securities, and derivatives, including various types of swaps, futures and options. The Portfolio intends to enter into financial transactions with counterparties that the Adviser believes to be creditworthy at the time of the transaction. There is always the risk that the Adviser’s analysis of a counterparty’s creditworthiness is incorrect or may change due to market conditions. To the extent that the Portfolio focuses its transactions with a limited number of counterparties, it will have greater exposure to the risks associated with one or more counterparties.
Offsetting Assets and Liabilities
The Portfolio presents gross and net information about transactions that are either offset in the financial statements or subject to an enforceable master netting arrangement or similar agreement with a designated counterparty, regardless of whether the transactions are actually offset in the Statement of Assets and Liabilities.
The Offsetting Assets and Liabilities table located in the Schedule of Investments presents gross amounts of recognized assets and/or liabilities and the net amounts after deducting collateral that has been pledged by
Janus Henderson VIT Mid Cap Value Portfolio
Notes to Financial Statements
counterparties or has been pledged to counterparties (if applicable). For corresponding information grouped by type of instrument, see the Portfolio's Schedule of Investments.
All repurchase agreements are transacted under legally enforceable master repurchase agreements that give the Portfolio, in the event of default by the counterparty, the right to liquidate securities held and to offset receivables and payables with the counterparty. For financial reporting purposes, the Portfolio does not offset financial instruments' payables and receivables and related collateral on the Statement of Assets and Liabilities. Repurchase agreements held by the Portfolio are fully collateralized, and such collateral is in the possession of the Portfolio’s custodian or, for tri-party agreements, the custodian designated by the agreement. The collateral is evaluated daily to ensure its market value exceeds the current market value of the repurchase agreements, including accrued interest.
3. Investment Advisory Agreements and Other Transactions with Affiliates
The Portfolio pays the Adviser an investment advisory fee rate that may adjust up or down based on the Portfolio’s performance relative to its benchmark index.
The investment advisory fee rate paid to the Adviser by the Portfolio consists of two components: (1) a base fee calculated by applying the contractual fixed rate of the advisory fee to the Portfolio’s average daily net assets during the previous month (the “Base Fee Rate”), plus or minus (2) a performance-fee adjustment (the “Performance Adjustment”) calculated by applying a variable rate of up to 0.15% (positive or negative) to the Portfolio’s average daily net assets based on the Portfolio’s relative performance compared to the cumulative investment record of its benchmark index over a 36-month performance measurement period or shorter time period, as applicable. The investment advisory fee rate is calculated daily and paid monthly.
The investment performance of the Portfolio’s Service Shares for the performance measurement period is used to calculate the Performance Adjustment. The Portfolio’s Base Fee Rate prior to any performance adjustment (expressed as an annual rate) is 0.64%, and the Portfolio’s benchmark index used in the calculation is the Russell Midcap® Value Index.
No Performance Adjustment is applied unless the difference between the Portfolio’s investment performance and the cumulative investment record of the Portfolio’s benchmark index is 0.50% or greater (positive or negative) during the applicable performance measurement period. The Base Fee Rate is subject to an upward or downward Performance Adjustment for every full 0.50% increment by which the Portfolio outperforms or underperforms its benchmark index, up to the Portfolio’s full performance rate of ±4.00%. Because the Performance Adjustment is tied to a Portfolio’s relative performance compared to its benchmark index (and not its absolute performance), the Performance Adjustment could increase the Adviser’s fee even if the Portfolio’s Shares lose value during the performance measurement period and could decrease the Adviser’s fee even if the Portfolio’s Shares increase in value during the performance measurement period. For purposes of computing the Base Fee Rate and the Performance Adjustment, net assets are averaged over different periods (average daily net assets during the previous month for the Base Fee Rate, versus average daily net assets during the performance measurement period for the Performance Adjustment). Performance of the Portfolio is calculated net of expenses whereas the Portfolio’s benchmark index does not have any fees or expenses. Reinvestment of dividends and distributions is included in calculating both the performance of a Portfolio and the Portfolio’s benchmark index.
The Portfolio’s prospectuses and statement(s) of additional information contain additional information about performance-based fees. The amount shown as advisory fees on the Statement of Operations reflects the Base Fee Rate plus/minus any Performance Adjustment. For the year ended December 31, 2022, the performance adjusted investment advisory fee rate before any waivers and/or reimbursements of expenses is 0.50%.
The Adviser has contractually agreed to waive the investment advisory fee and/or reimburse operating expenses to the extent that the Portfolio’s total annual fund operating expenses, excluding any performance adjustments to management fees, the 12b-1 distribution and shareholder servicing fees (applicable to Service Shares), transfer agent fees and expenses payable pursuant to the Transfer Agency Agreement, brokerage commissions, interest, dividends, taxes, acquired fund fees and expenses, and extraordinary expenses, exceed the annual rate of 0.77% of the Portfolio’s average daily net assets for at least a one-year period commencing April 29, 2022. If applicable, amounts waived and/or reimbursed to the Portfolio by the Adviser are disclosed as “Excess Expense Reimbursement and Waivers” on the Statement of Operations.
Janus Henderson VIT Mid Cap Value Portfolio
Notes to Financial Statements
The Adviser serves as administrator to the Portfolio pursuant to an administration agreement between the Adviser and the Trust. Under the administration agreement, the Adviser is authorized to perform, or cause others to perform certain administration, compliance, and accounting services to the Portfolio, including providing office space for the Portfolio, and is reimbursed by the Portfolio for certain of its costs in providing these services (to the extent the Adviser seeks reimbursement and such costs are not otherwise waived). In addition, employees of the Adviser and/or its affiliates may serve as officers of the Trust. The Portfolio pays for some or all of the salaries, fees, and expenses of the Adviser employees and Portfolio officers, with respect to certain specified administration functions they perform on behalf of the Portfolio. The Portfolio pays these costs based on out-of-pocket expenses incurred by the Adviser, and these costs are separate and apart from advisory fees and other expenses paid in connection with the investment advisory services the Adviser (or any subadvisor, as applicable) provides to the Portfolio. These amounts are disclosed as “Affiliated portfolio administration fees” on the Statement of Operations. In addition, some expenses related to compensation payable to the Portfolio’s Chief Compliance Officer and certain compliance staff, all of whom are employees of the Adviser and/or its affiliates, are shared with the Portfolio. Total compensation of $48,451 was paid to the Chief Compliance Officer and certain compliance staff by the Trust during the year ended December 31, 2022. The Portfolio's portion is reported as part of “Other expenses” on the Statement of Operations.
Janus Henderson Services US LLC (the “Transfer Agent”), a wholly-owned subsidiary of the Adviser, is the Portfolio’s transfer agent. The Transfer Agent receives an administrative services fee at an annual rate of 0.05% of the average daily net assets of the Portfolio for arranging for the provision by participating insurance companies and qualified plan service providers of administrative services, including, but not limited to, recordkeeping, subaccounting, answering inquiries regarding accounts, order processing, transaction confirmations, the mailing of prospectuses and shareholder reports, and other shareholder services provided on behalf of contract holders or plan participants investing in the Portfolio. The Transfer Agent expects to use this entire fee to compensate insurance companies and qualified plan service providers for providing these services to their customers who invest in the Portfolio.
The Transfer Agent is not compensated for internal services related to the shares, except for out-of-pocket costs. These amounts are disclosed as “Other transfer agent fees and expenses” on the Statement of Operations.
Under a distribution and shareholder servicing plan (the “Plan”) adopted in accordance with Rule 12b-1 under the 1940 Act, the Service Shares may pay the Trust’s distributor, Janus Henderson Distributors US LLC (the “Distributor”), a wholly-owned subsidiary of the Adviser, a fee for the sale and distribution and/or shareholder servicing of the Service Shares at an annual rate of up to 0.25% of the average daily net assets of the Service Shares. Under the terms of the Plan, the Trust is authorized to make payments to the Distributor for remittance to insurance companies and qualified plan service providers as compensation for distribution and/or shareholder services performed by such entities. These amounts are disclosed as “12b-1 Distribution and shareholder servicing fees” on the Statement of Operations.
The Board of Trustees has adopted a deferred compensation plan (the “Deferred Plan”) for independent Trustees to elect to defer receipt of all or a portion of the annual compensation they are entitled to receive from the Portfolio. All deferred fees are credited to an account established in the name of the Trustees. The amounts credited to the account then increase or decrease, as the case may be, in accordance with the performance of one or more of the Janus Henderson funds that are selected by the Trustees. The account balance continues to fluctuate in accordance with the performance of the selected fund or funds until final payment of all amounts are credited to the account. The fluctuation of the account balance is recorded by the Portfolio as unrealized appreciation/(depreciation) and is included as of December 31, 2022 on the Statement of Assets and Liabilities in the asset, “Trustees’ deferred compensation,” and liability, “Trustees’ deferred compensation fees.” Additionally, the recorded unrealized appreciation/(depreciation) is included in “Total distributable earnings (loss)” on the Statement of Assets and Liabilities. Deferred compensation expenses for the year ended December 31, 2022 are included in “Trustees’ fees and expenses” on the Statement of Operations. Trustees are allowed to change their designation of mutual funds from time to time. Amounts will be deferred until distributed in accordance with the Deferred Plan. Deferred fees of $433,851 were paid by the Trust to the Trustees under the Deferred Plan during the year ended December 31, 2022.
The Portfolio is permitted to purchase or sell securities (“cross-trade”) between itself and other funds or accounts managed by the Adviser in accordance with Rule 17a-7 under the Investment Company Act of 1940 (“Rule 17a-7”), when the transaction is consistent with the investment objectives and policies of the Portfolio and in accordance with the Internal Cross Trade Procedures adopted by the Trust’s Board of Trustees. These procedures have been designed to ensure that any cross-trade of securities by the Portfolio from or to another fund or account that is or could be considered an affiliate of the Portfolio under certain limited circumstances by virtue of having a common investment
Janus Henderson VIT Mid Cap Value Portfolio
Notes to Financial Statements
adviser, common Officer, or common Trustee complies with Rule 17a-7. Under these procedures, each cross-trade is effected at the current market price to save costs where allowed. During the year ended December 31, 2022, the Portfolio engaged in cross trades amounting to $548,232 in purchases and $115,122 in sales, resulting in a net realized gain of $64,553. The net realized gain is included within the “Net Realized Gain/(Loss) on Investments” section of the Portfolio’s Statement of Operations.
4. Federal Income Tax
The tax components of capital shown in the table below represent: (1) distribution requirements the Portfolio must satisfy under the income tax regulations; (2) losses or deductions the Portfolio may be able to offset against income and gains realized in future years; and (3) unrealized appreciation or depreciation of investments for federal income tax purposes.
Other book to tax differences primarily consist of deferred compensation. The Portfolio has elected to treat gains and losses on forward foreign currency contracts as capital gains and losses, if applicable. Other foreign currency gains and losses on debt instruments are treated as ordinary income for federal income tax purposes pursuant to Section 988 of the Internal Revenue Code.
| | | | | | | |
| | | | Other Book | Net Tax | |
Undistributed
Ordinary Income | Undistributed
Long-Term Gains | Accumulated
Capital Losses | Loss Deferrals | to Tax
Differences | Appreciation/
(Depreciation) | |
$ 230,625 | $ 3,326,174 | $ - | $ - | $ (3,357) | $ 23,624,409 | |
The aggregate cost of investments and the composition of unrealized appreciation and depreciation of investment securities for federal income tax purposes as of December 31, 2022 are noted below. The primary difference between book and tax appreciation or depreciation of investments are wash sale loss deferrals.
| | | | |
Federal Tax Cost | Unrealized
Appreciation | Unrealized
(Depreciation) | Net Tax Appreciation/
(Depreciation) |
$93,802,787 | $27,951,758 | $ (4,327,349) | $ 23,624,409 |
Income and capital gains distributions are determined in accordance with income tax regulations that may differ from US GAAP. These differences are due to differing treatments for items such as net short-term gains, deferral of wash sale losses, foreign currency transactions, and capital loss carryovers. Certain permanent differences such as tax returns of capital and net investment losses noted below have been reclassified to capital.
| | | | | |
For the year ended December 31, 2022 | |
Distributions | | |
From Ordinary Income | From Long-Term Capital Gains | Tax Return of Capital | Net Investment Loss | |
$ 1,478,951 | $ 9,457,162 | $ - | $ - | |
| | | | | |
For the year ended December 31, 2021 | |
Distributions | | |
From Ordinary Income | From Long-Term Capital Gains | Tax Return of Capital | Net Investment Loss | |
$ 477,194 | $ - | $ - | $ - | |
Permanent book to tax basis differences may result in reclassifications between the components of net assets. These differences have no impact on the results of operations or net assets.
Janus Henderson VIT Mid Cap Value Portfolio
Notes to Financial Statements
5. Capital Share Transactions
| | | | | | | |
| | | | | | |
| | Year ended December 31, 2022 | | Year ended December 31, 2021 |
| | Shares | Amount | | Shares | Amount |
| | | | | | | |
Institutional Shares: | | | | | |
Shares sold | 805,107 | $13,798,789 | | 714,567 | $12,784,490 |
Reinvested dividends and distributions | 294,998 | 4,575,481 | | 13,398 | 248,276 |
Shares repurchased | (1,031,082) | (18,493,265) | | (692,363) | (12,321,990) |
Net Increase/(Decrease) | 69,023 | $ (118,995) | | 35,602 | $ 710,776 |
Service Shares: | | | | | |
Shares sold | 340,897 | $ 5,558,864 | | 496,689 | $ 8,637,228 |
Reinvested dividends and distributions | 429,092 | 6,360,632 | | 12,864 | 228,918 |
Shares repurchased | (800,547) | (13,169,979) | | (645,292) | (11,153,770) |
Net Increase/(Decrease) | (30,558) | $(1,250,483) | | (135,739) | $(2,287,624) |
6. Purchases and Sales of Investment Securities
For the year ended December 31, 2022, the aggregate cost of purchases and proceeds from sales of investment securities (excluding any short-term securities, short-term options contracts, TBAs, and in-kind transactions, as applicable) was as follows:
| | | | |
Purchases of
Securities | Proceeds from Sales
of Securities | Purchases of Long-
Term U.S. Government
Obligations | Proceeds from Sales
of Long-Term U.S.
Government Obligations |
$56,408,099 | $ 66,373,170 | $ - | $ - |
7. Subsequent Event
Management has evaluated whether any events or transactions occurred subsequent to December 31, 2022 and through the date of issuance of the Portfolio’s financial statements and determined that there were no material events or transactions that would require recognition or disclosure in the Portfolio’s financial statements.
Janus Henderson VIT Mid Cap Value Portfolio
Report of Independent Registered Public Accounting Firm
To the Board of Trustees of Janus Aspen Series and Shareholders of Janus Henderson VIT Mid Cap Value Portfolio
Opinion on the Financial Statements
We have audited the accompanying statement of assets and liabilities, including the schedule of investments, of Janus Henderson VIT Mid Cap Value Portfolio (one of the portfolios constituting Janus Aspen Series, referred to hereafter as the "Portfolio") as of December 31, 2022, the related statement of operations for the year ended December 31, 2022, the statements of changes in net assets for each of the two years in the period ended December 31, 2022, including the related notes, and the financial highlights for each of the five years in the period ended December 31, 2022 (collectively referred to as the “financial statements”). In our opinion, the financial statements present fairly, in all material respects, the financial position of the Portfolio as of December 31, 2022, the results of its operations for the year then ended, the changes in its net assets for each of the two years in the period ended December 31, 2022 and the financial highlights for each of the five years in the period ended December 31, 2022 in conformity with accounting principles generally accepted in the United States of America.
Basis for Opinion
These financial statements are the responsibility of the Portfolio’s management. Our responsibility is to express an opinion on the Portfolio’s financial statements based on our audits. We are a public accounting firm registered with the Public Company Accounting Oversight Board (United States) (PCAOB) and are required to be independent with respect to the Portfolio in accordance with the U.S. federal securities laws and the applicable rules and regulations of the Securities and Exchange Commission and the PCAOB.
We conducted our audits of these financial statements in accordance with the standards of the PCAOB. Those standards require that we plan and perform the audit to obtain reasonable assurance about whether the financial statements are free of material misstatement, whether due to error or fraud.
Our audits included performing procedures to assess the risks of material misstatement of the financial statements, whether due to error or fraud, and performing procedures that respond to those risks. Such procedures included examining, on a test basis, evidence regarding the amounts and disclosures in the financial statements. Our audits also included evaluating the accounting principles used and significant estimates made by management, as well as evaluating the overall presentation of the financial statements. Our procedures included confirmation of securities owned as of December 31, 2022 by correspondence with the custodian and brokers. We believe that our audits provide a reasonable basis for our opinion.

Denver, Colorado
February 15, 2023
We have served as the auditor of one or more investment companies in Janus Henderson Funds since 1990.
Janus Henderson VIT Mid Cap Value Portfolio
Additional Information (unaudited)
Proxy Voting Policies and Voting Record
A description of the policies and procedures that the Portfolio uses to determine how to vote proxies relating to its portfolio securities is available without charge: (i) upon request, by calling 1-800-525-1093; (ii) on the Portfolio’s website at janushenderson.com/proxyvoting; and (iii) on the SEC’s website at http://www.sec.gov. Additionally, information regarding the Portfolio’s proxy voting record for the most recent twelve-month period ended June 30 is also available, free of charge, through janushenderson.com/proxyvoting and from the SEC’s website at http://www.sec.gov.
Full Holdings
The Portfolio files its complete portfolio holdings (schedule of investments) with the SEC as an exhibit to Form N-PORT within 60 days of the end of the first and third fiscal quarters, and in the annual report and semiannual report to shareholders. The Portfolio’s Form N-PORT filings and annual and semiannual reports: (i) are available on the SEC’s website at http://www.sec.gov; and (ii) are available without charge, upon request, by calling a Janus Henderson representative at 1-877-335-2687 (toll free). Portfolio holdings consisting of at least the names of the holdings are generally available on a monthly basis with a 30-day lag under Full Holdings for the Portfolio at janushenderson.com/vit.
APPROVAL OF ADVISORY AGREEMENTS DURING THE PERIOD
The Trustees of Janus Aspen Series, each of whom serves as an “independent” Trustee (the “Trustees”), oversee the management of each portfolio of Janus Aspen Series (each, a “VIT Portfolio,” and collectively, the “VIT Portfolios”), as well as each fund of Janus Investment Fund (each, a “Fund,” and collectively, the “Funds” and together with the VIT Portfolios, the “Janus Henderson Funds,” and each, a “Janus Henderson Fund”). As required by law, the Trustees determine annually whether to continue the investment advisory agreement for each Janus Henderson Fund.
In connection with their most recent consideration of those agreements for each Janus Henderson Fund, the Trustees received and reviewed information provided by Janus Henderson Investors US LLC (the “Adviser”) in response to requests of the Trustees and their independent legal counsel. They also received and reviewed information and analysis provided by, and in response to requests of, their independent fee consultant. Throughout their consideration of the agreements, the Trustees were advised by their independent legal counsel. The Trustees met with management to consider the agreements, and also met separately in executive session with their independent legal counsel and their independent fee consultant.
At meetings held on November 9-10, 2022 and December 13-14, 2022, the Trustees evaluated the information provided by the Adviser and the independent fee consultant, as well as other information provided by the Adviser and the independent fee consultant during the year. Following such evaluation, the Trustees determined that the overall arrangements between each Janus Henderson Fund and the Adviser were fair and reasonable in light of the nature, extent, and quality of the services provided by the Adviser and its affiliates, the fees charged for those services, and other matters that the Trustees considered relevant in the exercise of their business judgment, and unanimously approved the continuation of the investment advisory agreement for each Janus Henderson Fund for the period from February 1, 2023 through February 1, 2024, subject to earlier termination as provided for in each agreement.
In considering the continuation of those agreements, the Trustees reviewed and analyzed various factors that they determined were relevant, including the factors described below, none of which by itself was considered dispositive. However, the material factors and conclusions that formed the basis for the Trustees’ determination to approve the continuation of the agreements are discussed separately below. Also included is a summary of the independent fee consultant’s conclusions and opinions that arose during, and were included as part of, the Trustees’ consideration of the agreements. “Management fees,” as used herein, reflect actual annual advisory fees and, for the purpose of peer comparisons any administration fees (excluding out of pocket costs), net of any waivers, paid by a fund as a percentage of average net assets.
Nature, Extent and Quality of Services
The Trustees reviewed the nature, extent, and quality of the services provided by the Adviser to the Janus Henderson Funds, taking into account the investment objective, strategies, and policies of each Janus Henderson Fund, and the knowledge the Trustees gained from their regular meetings with management on at least a quarterly basis and their ongoing review of information related to the Janus Henderson Funds. In addition, the Trustees reviewed the resources and key personnel of the Adviser, particularly noting those employees who provide investment and risk management services to the Janus Henderson Funds. The Trustees also considered other services provided to the Janus Henderson Funds by the Adviser, such as managing the execution of portfolio transactions and the selection of broker-dealers for
Janus Henderson VIT Mid Cap Value Portfolio
Additional Information (unaudited)
those transactions. The Trustees considered the Adviser’s role as administrator to the Janus Henderson Funds, noting that the Adviser generally does not receive a fee for its services as administrator, but is reimbursed for its out-of-pocket costs. The Trustees considered the role of the Adviser in monitoring adherence to the Janus Henderson Funds’ investment restrictions, providing support services for the Trustees and Trustee committees, and overseeing communications with Janus Henderson Fund shareholders and the activities of other service providers, including monitoring compliance with various policies and procedures of the Janus Henderson Funds and with applicable securities laws and regulations.
In this regard, the independent fee consultant noted that the Adviser provides a number of different services for the Janus Henderson Funds and their shareholders, ranging from investment management services to various other servicing functions, and that, in its view, the Adviser is a capable provider of those services. The independent fee consultant also provided its belief that the Adviser has developed a number of institutional competitive advantages that should enable it to provide superior investment and service performance over the long term.
The Trustees concluded that the nature, extent, and quality of the services provided by the Adviser to each Janus Henderson Fund were appropriate and consistent with the terms of the respective advisory agreements, and that, taking into account steps taken to address those Janus Henderson Funds whose performance lagged that of their peers for certain periods, the Janus Henderson Funds were likely to benefit from the continued provision of those services. They also concluded that the Adviser had sufficient personnel, with the appropriate education and experience, to serve the Janus Henderson Funds effectively and had demonstrated its ability to attract well-qualified personnel.
Performance of the Funds
The Trustees considered the performance results of each Janus Henderson Fund over various time periods. They noted that they considered Janus Henderson Fund performance data throughout the year, including periodic meetings with each Janus Henderson Fund’s portfolio manager(s), and also reviewed information comparing each Janus Henderson Fund’s performance with the performance of comparable fund peer groups identified by Broadridge Financial Solutions, Inc. (“Broadridge”), an independent data provider, and with the Janus Henderson Fund’s benchmark index. In this regard, the independent fee consultant found that the overall Janus Henderson Funds’ performance has been reasonable, noting that: (i) for the 36 months ended May 31, 2022, approximately 38% of the Janus Henderson Funds were in the top two quartiles of their Broadridge peer groups; (ii) for the 36 months ended September 30, 2022, approximately 45% of the Janus Henderson Funds were in the top two quartiles of performance as reported by Morningstar, and (iii) for the 12 months ended September 30, 2022, approximately 55% of the Janus Henderson Funds were in the top two quartiles of performance as reported by Morningstar.
The Trustees considered the performance of each Janus Henderson Fund, noting that performance may vary by share class, and noted the following with respect to the VIT Portfolios:
· For Janus Henderson Adaptive Risk Managed U.S. Equity Portfolio, the Trustees noted that the VIT Portfolio’s performance was in the bottom Broadridge quartile for the 36 months ended May 31, 2022 and the first Broadridge quartile for the 12 months ended May 31, 2022. The Trustees noted the reasons for the VIT Portfolio’s underperformance and the steps the Adviser had taken or was taking to improve performance, and that the performance trend was improving.
· For Janus Henderson Balanced Portfolio, the Trustees noted that the VIT Portfolio’s performance was in the first Broadridge quartile for the 36 months ended May 31, 2022 and the first Broadridge quartile for the 12 months ended May 31, 2022.
· For Janus Henderson Enterprise Portfolio, the Trustees noted that the VIT Portfolio’s performance was in the third Broadridge quartile for the 36 months ended May 31, 2022 and the first Broadridge quartile for the 12 months ended May 31, 2022 The Trustees noted the reasons for the VIT Portfolio’s underperformance and the steps the Adviser had taken or was taking to improve performance, and that the performance trend was improving.
· For Janus Henderson Flexible Bond Portfolio, the Trustees noted that the VIT Portfolio’s performance was in the first Broadridge quartile for the 36 months ended May 31, 2022 and the first Broadridge quartile for the 12 months ended May 31, 2022.
Janus Henderson VIT Mid Cap Value Portfolio
Additional Information (unaudited)
· For Janus Henderson Forty Portfolio, the Trustees noted that the VIT Portfolio’s performance was in the second Broadridge quartile for the 36 months ended May 31, 2022 and the third Broadridge quartile for the 12 months ended May 31, 2022.
· For Janus Henderson Global Research Portfolio, the Trustees noted that the VIT Portfolio’s performance was in the first Broadridge quartile for the 36 months ended May 31, 2022 and the first Broadridge quartile for the 12 months ended May 31, 2022.
· For Janus Henderson Global Sustainable Equity Portfolio, the Trustees noted that the VIT Portfolio’s performance was in the bottom Broadridge quartile for the evaluated performance period ended May 31, 2022. The Trustees noted that 36 month-end performance was not yet available.
· For Janus Henderson Global Technology and Innovation Portfolio, the Trustees noted that the VIT Portfolio’s performance was in the second Broadridge quartile for the 36 months ended May 31, 2022 and the third Broadridge quartile for the 12 months ended May 31, 2022.
· For Janus Henderson Mid Cap Value Portfolio, the Trustees noted that the VIT Portfolio’s performance was in the bottom Broadridge quartile for the 36 months ended May 31, 2022 and the second Broadridge quartile for the 12 months ended May 31, 2022. The Trustees noted the reasons for the VIT Portfolio’s underperformance, while also noting that the VIT Portfolio has a performance fee structure that results in lower management fees during periods of underperformance, the steps the Adviser had taken or was taking to improve performance, and that the performance trend was improving.
· For Janus Henderson Overseas Portfolio, the Trustees noted that the VIT Portfolio’s performance was in the first Broadridge quartile for the 36 months ended May 31, 2022 and the first Broadridge quartile for the 12 months ended May 31, 2022.
· For Janus Henderson Research Portfolio, the Trustees noted that the VIT Portfolio’s performance was in the second Broadridge quartile for the 36 months ended May 31, 2022 and the second Broadridge quartile for the 12 months ended May 31, 2022.
In consideration of each Janus Henderson Fund’s performance, the Trustees concluded that, taking into account the factors relevant to performance, as well as other considerations, including steps taken to improve performance, as applicable, the Janus Henderson Fund’s performance warranted continuation of such Janus Henderson Fund’s investment advisory agreement.
Costs of Services Provided
The Trustees examined information regarding the fees and expenses of each Janus Henderson Fund in comparison to similar information for other comparable funds as provided by Broadridge, an independent data provider. They also reviewed an analysis of that information provided by their independent fee consultant. The independent fee consultant provided its belief that the management fees charged by the Adviser to each of the Janus Henderson Funds under the current investment advisory and administration agreements are reasonable in relation to the services provided by the Adviser. The independent fee consultant found: (1) the total expenses and management fees of the Janus Henderson Funds to be reasonable relative to other comparable mutual funds; (2) the total expenses, on average, were 6% under the average total expenses of the respective Broadridge peer group; and (3) the management fees for the Janus Henderson Funds, on average, were 5% under the average management fees for the respective Broadridge peer group. The Trustees also considered the total expenses for each share class of each Janus Henderson Fund compared to the average total expenses for its Broadridge Expense Group and to average total expenses for its Broadridge Expense Universe.
For Janus Henderson Funds with three or more years of performance history, the independent fee consultant also performed a systematic “focus list” analysis of expenses which assessed fund fees in the context of fund performance being delivered. Based on this analysis, the independent fee consultant found that the combination of service quality/performance and expenses on these individual Janus Henderson Funds was reasonable in light of performance trends, performance histories, changes in portfolio management, relative average net asset levels, and the existence of performance fees, breakpoints, and/or expense waivers on such Janus Henderson Funds.
Janus Henderson VIT Mid Cap Value Portfolio
Additional Information (unaudited)
The Trustees considered the methodology used by the Adviser in determining compensation payable to portfolio managers, the competitive environment for investment management talent, and the competitive market for mutual funds in different distribution channels.
The Trustees also reviewed management fees charged by the Adviser to comparable separate account clients and to comparable non-affiliated funds subadvised by the Adviser (for which the Adviser provides only or primarily portfolio management services). Although in most instances subadvisory and separate account fee rates for various investment strategies were lower than management fee rates for Janus Henderson Funds having a similar strategy, the Trustees considered that the Adviser noted that, under the terms of the management agreements with the Janus Henderson Funds, the Adviser performs significant additional services for the Janus Henderson Funds that it does not provide to those other clients, including administration services, oversight of the Janus Henderson Funds’ other service providers, Trustee support, regulatory compliance and numerous other services, and that, in serving the Janus Henderson Funds, the Adviser assumes many legal risks and other costs that it does not assume in servicing its other clients. Moreover, the Trustees noted that the independent fee consultant found that: (1) the management fees the Adviser charges to the Janus Henderson Funds are reasonable in relation to the management fees the Adviser charges to funds subadvised by the Adviser and to the fees the Adviser charges to its institutional separate account clients; (2) these subadvised and institutional separate accounts have different service and infrastructure needs and operate in markets very different from the retail fund market; (3) Janus Henderson mutual fund investors enjoy reasonable fees relative to the fees charged in these other markets; and (4) as part of its 2022 review, 9 of 11 Janus Henderson Funds have lower management fees than similar funds subadvised by the Adviser. The Trustees noted that for the two Janus Henderson Funds that did not, management fees for each were under the average of its 15(c) peer group.
The Trustees considered the fees for each Janus Henderson Fund for its fiscal year ended in 2021 (except for Janus Henderson Global Sustainable Equity Portfolio for which the period end was March 31, 2022) and noted the following with regard to each Janus Henderson Fund’s total expenses, net of applicable fee waivers (the VIT Portfolio’s “total expenses”) as reflected in the comparative information provided by Broadridge:
· For Janus Henderson Adaptive Risk Management U.S. Equity Portfolio, the Trustees noted that the VIT Portfolio’s total expenses were below the peer group average for its sole share class.
· For Janus Henderson Balanced Portfolio, the Trustees noted that, although the VIT Portfolio’s total expenses exceeded the peer group average for one share class, overall the VIT Portfolio’s total expenses were reasonable.
· For Janus Henderson Enterprise Portfolio, the Trustees noted that, although the VIT Portfolio’s total expenses exceeded the peer group average for one share class, overall the VIT Portfolio’s total expenses were reasonable.
· For Janus Henderson Flexible Bond Portfolio, the Trustees noted that, although the VIT Portfolio’s total expenses exceeded the peer group for one share class, overall the VIT Portfolio’s total expenses were reasonable. The Trustees also noted that the Adviser has contractually agreed to limit the VIT Portfolio’s expenses.
· For Janus Henderson Forty Portfolio, the Trustees noted that, although the VIT Portfolio’s total expenses exceeded the peer group average for one share class, overall the VIT Portfolio’s total expenses were reasonable.
· For Janus Henderson Global Research Portfolio, the Trustees noted that, although the VIT Portfolio’s total expenses exceeded the peer group average for one share class, overall the VIT Portfolio’s total expenses were reasonable.
· For Janus Henderson Global Sustainable Equity Portfolio, the Trustees noted that the VIT Portfolio’s total expenses were below the peer group average for both share classes.
· For Janus Henderson Global Technology and Innovation Portfolio, the Trustees noted that the VIT Portfolio’s total expenses were below the peer group average for both share classes.
· For Janus Henderson Mid Cap Value Portfolio, the Trustees noted that, the VIT Portfolio’s total expenses were below the peer group average for both share classes.
· For Janus Henderson Overseas Portfolio, the Trustees noted that although the VIT Portfolio’s total expenses exceeded the peer group average for one share class, overall the VIT Portfolio’s total expenses were reasonable.
Janus Henderson VIT Mid Cap Value Portfolio
Additional Information (unaudited)
· For Janus Henderson Research Portfolio, the Trustees noted that the VIT Portfolio’s total expenses were below the peer group average for both share classes.
The Trustees reviewed information on the overall profitability to the Adviser and its affiliates from their relationships with the Janus Henderson Funds, and considered profitability data of other publicly traded mutual fund advisers. The Trustees recognized that profitability comparisons among fund managers are difficult because of the variation in the type of comparative information that is publicly available, and the profitability of any fund manager is affected by numerous factors, including the organizational structure of the particular fund manager, differences in complex size, difference in product mix, difference in types of business (mutual fund, institutional and other), differences in the types of funds and other accounts it manages, possible other lines of business, the methodology for allocating expenses and the fund manager’s capital structure and cost of capital.
Additionally, the Trustees considered the estimated profitability to the Adviser from the investment management services it provided to each Janus Henderson Fund. In their review, the Trustees considered whether the Adviser receive adequate incentives and resources to manage the Janus Henderson Funds effectively. In reviewing profitability, the Trustees noted that the estimated profitability for an individual Janus Henderson Fund is necessarily a product of the allocation methodology utilized by the Adviser to allocate its expenses as part of the estimated profitability calculation. In this regard, the Trustees noted that the independent fee consultant found as part of its 2022 review that (1) the expense allocation methodology and rationales utilized by the Adviser were reasonable and (2) no clear correlation exists between expense allocations and operating margins. The Trustees also considered that the estimated profitability for an individual Janus Henderson Fund was influenced by a number of factors, including not only the allocation methodology selected, but also the presence of fee waivers and expense caps, and whether the Janus Henderson Fund’s investment management agreement contained breakpoints or a performance fee component. The Trustees determined, after taking into account these factors, among others, that the Adviser’s estimated profitability with respect to each Janus Henderson Fund was not unreasonable in relation to the services provided, and that the variation in the range of such estimated profitability among the Janus Henderson Funds was not a material factor in the Board’s approval of the reasonableness of any Janus Henderson Fund’s investment management fees.
The Trustees concluded that the management fees payable by each Janus Henderson Fund to the Adviser were reasonable in relation to the nature, extent, and quality of the services provided, taking into account the fees charged by other advisers for managing comparable mutual funds with similar strategies, the fees the Adviser charges to other clients, and, as applicable, the impact of fund performance on management fees payable by the Janus Henderson Funds. The Trustees also concluded that each Janus Henderson Fund’s total expenses were reasonable, taking into account the size of the Janus Henderson Fund, the quality of services provided by the Adviser, the investment performance of the Janus Henderson Fund, and any expense limitations agreed to or provided by the Adviser.
Economies of Scale
The Trustees considered information about the potential for the Adviser to realize economies of scale as the assets of the Janus Henderson Funds increase. They noted that their independent fee consultant published a report to the Trustees in June 2022 which provided its research and analysis into economies of scale. They also noted that, although many Janus Henderson Funds pay advisory fees at a fixed base rate as a percentage of net assets, without any breakpoints or performance fees, their independent fee consultant concluded that 75% of these Janus Henderson Funds’ have contractual management fees (gross of waivers) below their Broadridge Expense Group averages. The Trustees also noted the following from the independent fee consultant’s report: (1) that 31% of Janus Henderson Funds had management fee breakpoints in place whereby investors pay lower management fees as fund AUM increases; (2) that 29% of Janus Henderson Funds have low flat-rate fees and performance fees where the Adviser is incentivized to invest in resources which drive Janus Henderson Fund performance; and (3) that 39% of Janus Henderson Funds have low flat-rate fees versus peers where investors pay low fixed fees when the Janus Henderson Fund is small/midsized and higher fees when the Janus Henderson Fund grows in assets. The Trustees also noted that the Janus Henderson Funds share directly in economies of scale through the significant investments made by the Adviser and its affiliates related to services provided to the Funds and the lower charges of third-party service providers that are based in part on the combined scale of all of the Janus Henderson Funds.
The Trustees also considered the independent fee consultant’s conclusion that, given the limitations of various analytical approaches to economies of scale and their conflicting results, it is difficult to analytically confirm or deny the existence of economies of scale in the Janus Henderson complex. In this regard, the independent consultant concluded that (1) to the extent there were economies of scale at the Adviser, the Adviser’s general strategy of setting
Janus Henderson VIT Mid Cap Value Portfolio
Additional Information (unaudited)
fixed management fees below peers appeared to share any such economies with investors even on smaller Janus Henderson Funds which have not yet achieved those economies and (2) by setting lower fixed fees from the start on these Janus Henderson Funds, the Adviser appeared to be investing to increase the likelihood that these Janus Henderson Funds will grow to a level to achieve any economies of scale that may exist. Further, the independent fee consultant provided its belief that Janus Henderson Fund investors are well-served by the fee levels and performance fee structures in place on the Janus Henderson Funds in light of any economies of scale that may be present at the Adviser.
Based on all of the information reviewed, including the recent and past research and analysis conducted by the Trustees’ independent fee consultant, the Trustees concluded that the current fee structure of each Janus Henderson Fund was reasonable and that the current rates of fees do reflect a sharing between the Adviser and the Janus Henderson Fund of any economies of scale that may be present at the current asset level of the Janus Henderson Fund.
Other Benefits to the Adviser
The Trustees also considered benefits that accrue to the Adviser and its affiliates from their relationships with the Janus Henderson Funds. They recognized that two affiliates of the Adviser separately serve the Janus Henderson Funds as transfer agent and distributor, respectively, and the transfer agent receives compensation directly from the non-money market Janus Henderson Funds for services provided, and that such compensation contributes to the overall profitability of the Adviser and its affiliates that results from their relationship with the Janus Henderson Funds. The Trustees also considered the Adviser’s past and proposed use of commissions paid by the Janus Henderson Funds on portfolio brokerage transactions to obtain proprietary and third-party research products and services benefiting the Janus Henderson Fund and/or other clients of the Adviser and/or the Adviser. The Trustees concluded that the Adviser’s use of these types of client commission arrangements to obtain proprietary and third-party research products and services was consistent with regulatory requirements and guidelines and was likely to benefit each Janus Henderson Fund. The Trustees also concluded that, other than the services provided by the Adviser and its affiliates pursuant to the agreements and the fees to be paid by each Janus Henderson Fund therefor, the Janus Henderson Funds and the Adviser may potentially benefit from their relationship with each other in other ways. They concluded that the Adviser and its affiliates share directly in economies of scale through the lower charges of third-party service providers that are based in part on the combined scale of the Janus Henderson Funds and other clients serviced by the Adviser and its affiliates. They also concluded that the Adviser benefits from the receipt of research products and services acquired through commissions paid on portfolio transactions of the Janus Henderson Funds and that the Janus Henderson Funds benefit from the Adviser’s receipt of those products and services as well as research products and services acquired through commissions paid by other clients of the Adviser. They further concluded that the success of any Janus Henderson Fund could attract other business to the Adviser or other Janus Henderson Funds, and that the success of the Adviser could enhance the Adviser’s ability to serve the Janus Henderson Funds.
Janus Henderson VIT Mid Cap Value Portfolio
Useful Information About Your Portfolio Report (unaudited)
Management Commentary
The Management Commentary in this report includes valuable insight as well as statistical information to help you understand how your Portfolio’s performance and characteristics stack up against those of comparable indices.
If the Portfolio invests in foreign securities, this report may include information about country exposure. Country exposure is based primarily on the country of risk. A company may be allocated to a country based on other factors such as location of the company’s principal office, the location of the principal trading market for the company’s securities, or the country where a majority of the company’s revenues are derived.
Please keep in mind that the opinions expressed in the Management Commentary are just that: opinions. They are a reflection based on best judgment at the time this report was compiled, which was December 31, 2022. As the investing environment changes, so could opinions. These views are unique and are not necessarily shared by fellow employees or by Janus Henderson in general.
Performance Overviews
Performance overview graphs compare the performance of a hypothetical $10,000 investment in the Portfolio with one or more widely used market indices. When comparing the performance of the Portfolio with an index, keep in mind that market indices are not available for investment and do not reflect deduction of expenses.
Average annual total returns are quoted for a Portfolio with more than one year of performance history. Average annual total return is calculated by taking the growth or decline in value of an investment over a period of time, including reinvestment of dividends and distributions, then calculating the annual compounded percentage rate that would have produced the same result had the rate of growth been constant throughout the period. Average annual total return does not reflect the deduction of taxes that a shareholder would pay on Portfolio distributions or redemptions of Portfolio shares.
Cumulative total returns are quoted for a Portfolio with less than one year of performance history. Cumulative total return is the growth or decline in value of an investment over time, independent of the period of time involved. Cumulative total return does not reflect the deduction of taxes that a shareholder would pay on Portfolio distributions or redemptions of Portfolio shares.
Pursuant to federal securities rules, expense ratios shown in the performance chart reflect subsidized (if applicable) and unsubsidized ratios. The total annual fund operating expenses ratio is gross of any fee waivers, reflecting the Portfolio’s unsubsidized expense ratio. The net annual fund operating expenses ratio (if applicable) includes contractual waivers of the Adviser and reflects the Portfolio’s subsidized expense ratio. Ratios may be higher or lower than those shown in the “Financial Highlights” in this report.
Schedule of Investments
Following the performance overview section is the Portfolio’s Schedule of Investments. This schedule reports the types of securities held in the Portfolio on the last day of the reporting period. Securities are usually listed by type (common stock, corporate bonds, U.S. Government obligations, etc.) and by industry classification (banking, communications, insurance, etc.). Holdings are subject to change without notice.
The value of each security is quoted as of the last day of the reporting period. The value of securities denominated in foreign currencies is converted into U.S. dollars.
If the Portfolio invests in foreign securities, it will also provide a summary of investments by country. This summary reports the Portfolio exposure to different countries by providing the percentage of securities invested in each country. The country of each security represents the country of risk. The Portfolio’s Schedule of Investments relies upon the industry group and country classifications published by Bloomberg and/or MSCI Inc.
Tables listing details of individual forward currency contracts, futures, written options, swaptions, and swaps follow the Portfolio’s Schedule of Investments (if applicable).
Statement of Assets and Liabilities
This statement is often referred to as the “balance sheet.” It lists the assets and liabilities of the Portfolio on the last day of the reporting period.
Janus Henderson VIT Mid Cap Value Portfolio
Useful Information About Your Portfolio Report (unaudited)
The Portfolio’s assets are calculated by adding the value of the securities owned, the receivable for securities sold but not yet settled, the receivable for dividends declared but not yet received on securities owned, and the receivable for Portfolio shares sold to investors but not yet settled. The Portfolio’s liabilities include payables for securities purchased but not yet settled, Portfolio shares redeemed but not yet paid, and expenses owed but not yet paid. Additionally, there may be other assets and liabilities such as unrealized gain or loss on forward currency contracts.
The section entitled “Net Assets Consist of” breaks down the components of the Portfolio’s net assets. Because the Portfolio must distribute substantially all earnings, you will notice that a significant portion of net assets is shareholder capital.
The last section of this statement reports the net asset value (“NAV”) per share on the last day of the reporting period. The NAV is calculated by dividing the Portfolio’s net assets for each share class (assets minus liabilities) by the number of shares outstanding.
Statement of Operations
This statement details the Portfolio’s income, expenses, realized gains and losses on securities and currency transactions, and changes in unrealized appreciation or depreciation of Portfolio holdings.
The first section in this statement, entitled “Investment Income,” reports the dividends earned from securities and interest earned from interest-bearing securities in the Portfolio.
The next section reports the expenses incurred by the Portfolio, including the advisory fee paid to the investment adviser, transfer agent fees and expenses, and printing and postage for mailing statements, financial reports and prospectuses. Expense offsets and expense reimbursements, if any, are also shown.
The last section lists the amounts of realized gains or losses from investment and foreign currency transactions, and changes in unrealized appreciation or depreciation of investments and foreign currency-denominated assets and liabilities. The Portfolio will realize a gain (or loss) when it sells its position in a particular security. A change in unrealized gain (or loss) refers to the change in net appreciation or depreciation of the Portfolio during the reporting period. “Net Realized and Unrealized Gain/(Loss) on Investments” is affected both by changes in the market value of Portfolio holdings and by gains (or losses) realized during the reporting period.
Statements of Changes in Net Assets
These statements report the increase or decrease in the Portfolio’s net assets during the reporting period. Changes in the Portfolio’s net assets are attributable to investment operations, dividends and distributions to investors, and capital share transactions. This is important to investors because it shows exactly what caused the Portfolio’s net asset size to change during the period.
The first section summarizes the information from the Statement of Operations regarding changes in net assets due to the Portfolio’s investment operations. The Portfolio’s net assets may also change as a result of dividend and capital gains distributions to investors. If investors receive their dividends and/or distributions in cash, money is taken out of the Portfolio to pay the dividend and/or distribution. If investors reinvest their dividends and/or distributions, the Portfolio’s net assets will not be affected.
The reinvestment of dividends and distributions is included under “Capital Share Transactions.” “Capital Shares” refers to the money investors contribute to the Portfolio through purchases or withdrawals via redemptions. The Portfolio’s net assets will increase and decrease in value as investors purchase and redeem shares from the Portfolio.
Financial Highlights
This schedule provides a per-share breakdown of the components that affect the Portfolio’s NAV for current and past reporting periods as well as total return, asset size, ratios, and portfolio turnover rate.
The first line in the table reflects the NAV per share at the beginning of the reporting period. The next line reports the net investment income/(loss) per share. Following is the per share total of net gains/(losses), realized and unrealized. Per share dividends and distributions to investors are then subtracted to arrive at the NAV per share at the end of the period. The next line reflects the total return for the period. The total return may include adjustments in accordance with generally accepted accounting principles required at the period end for financial reporting purposes. As a result, the total return may differ from the total return reflected for individual shareholder transactions. Also included are ratios of expenses and net investment income to average net assets.
Janus Henderson VIT Mid Cap Value Portfolio
Useful Information About Your Portfolio Report (unaudited)
The Portfolio’s expenses may be reduced through expense offsets and expense reimbursements. The ratios shown reflect expenses before and after any such offsets and reimbursements.
The ratio of net investment income/(loss) summarizes the income earned less expenses, divided by the average net assets of the Portfolio during the reporting period. Do not confuse this ratio with the Portfolio’s yield. The net investment income ratio is not a true measure of the Portfolio’s yield because it does not take into account the dividends distributed to the Portfolio’s investors.
The next figure is the portfolio turnover rate, which measures the buying and selling activity in the Portfolio. Portfolio turnover is affected by market conditions, changes in the asset size of the Portfolio, fluctuating volume of shareholder purchase and redemption orders, the nature of the Portfolio’s investments, and the investment style and/or outlook of the portfolio manager(s) and/or investment personnel. A 100% rate implies that an amount equal to the value of the entire portfolio was replaced once during the fiscal year; a 50% rate means that an amount equal to the value of half the portfolio is traded in a year; and a 200% rate means that an amount equal to the value of the entire portfolio is traded every six months.
Janus Henderson VIT Mid Cap Value Portfolio
Designation Requirements (unaudited)
For federal income tax purposes, the Portfolio designated the following for the year ended December 31, 2022:
| | |
| | |
Section 163(j) Interest Dividend | 2% |
Capital Gain Distributions | $9,457,162 |
Dividends Received Deduction Percentage | 80% |
Janus Henderson VIT Mid Cap Value Portfolio
Trustees and Officers (unaudited)
The following are the Trustees and officers of the Trust, together with a brief description of their principal occupations during the last five years (principal occupations for certain Trustees may include periods over five years). The Portfolio’s Statement of Additional Information includes additional information about the Trustees and officers and is available, without charge, by calling 1-877-335-2687.
Each Trustee has served in that capacity since he or she was originally elected or appointed. The Trustees do not serve a specified term of office. Each Trustee will hold office until the termination of the Trust or his or her earlier death, resignation, retirement, incapacity, or removal. Under the Portfolio’s Governance Procedures and Guidelines, the policy is for Trustees to retire no later than the end of the calendar year in which the Trustee turns 75. The Trustees review the Portfolio’s Governance Procedures and Guidelines from time to time and may make changes they deem appropriate. The Portfolio’s Nominating and Governance Committee will consider nominees for the position of Trustee recommended by shareholders. Shareholders may submit the name of a candidate for consideration by the Committee by submitting their recommendations to the Trust’s Secretary. Each Trustee is currently a Trustee of one other registered investment company advised by the Adviser: Janus Investment Fund. Collectively, these two registered investment companies consist of 51 series or funds referred to herein as the Fund Complex.
The Trust’s officers are elected annually by the Trustees for a one-year term. Certain officers also serve as officers of Janus Investment Fund. Certain officers of the Portfolio may also be officers and/or directors of the Adviser. Except as otherwise disclosed, Portfolio officers receive no compensation from the Portfolio, except for the Portfolio’s Chief Compliance Officer, as authorized by the Trustees.
Janus Henderson VIT Mid Cap Value Portfolio
Trustees and Officers (unaudited)
| | | | | | |
TRUSTEES |
Name, Address, and Age | Positions Held with the Trust | Length of Time Served | Principal Occupations During the Past Five Years | Number of Portfolios/Funds in Fund Complex Overseen by Trustee | Other Directorships Held by Trustee During the Past Five Years |
Independent Trustees | | | | |
Alan A. Brown
151 Detroit Street
Denver, CO 80206
DOB: 1962 | Chairman
Trustee | 5/22-Present
1/13-Present | Principal, Curam Holdings LLC (since 2018). Formerly, Executive Vice President, Institutional Markets, of Black Creek Group (private equity real estate investment management firm) (2012-2018), Executive Vice President and Co-Head, Global Private Client Group (2007-2010), Executive Vice President, Mutual Funds (2005-2007), and Chief Marketing Officer (2001-2005) of Nuveen Investments, Inc. (asset management). | 51 | Advisory Board Member of AEW Core Property Trust (open-end property fund) (since 2020), and Director of WTTW (PBS affiliate) (since 2003). Formerly, Director of MotiveQuest LLC (strategic social market research company) (2003-2016), Director of Nuveen Global Investors LLC (2007-2011), Director of Communities in Schools (2004-2010), and Director of Mutual Fund Education Alliance (until 2010). |
Cheryl D. Alston
151 Detroit Street
Denver, CO 80206
DOB: 1966 | Trustee | 8/22-Present | Executive Director and Chief Investment Officer, Employees’ Retirement Fund of the City of Dallas (since 2004). | 51 | Director of Blue Cross Blue Shield of Kansas City (a not-for-profit health insurance provider) (since 2016) and Director of Global Life Insurance (life and supplemental health insurance provider) (since 2017). Formerly, Director of Federal Home Loan Bank of Dallas (2017-2021). |
Janus Henderson VIT Mid Cap Value Portfolio
Trustees and Officers (unaudited)
| | | | | | |
TRUSTEES |
Name, Address, and Age | Positions Held with the Trust | Length of Time Served | Principal Occupations During the Past Five Years | Number of Portfolios/Funds in Fund Complex Overseen by Trustee | Other Directorships Held by Trustee During the Past Five Years |
Independent Trustees | | | | |
William D. Cvengros
151 Detroit Street
Denver, CO 80206
DOB: 1948 | Trustee | 1/11-Present | Chief Executive Officer of SJC Capital, LLC (a personal investment company and consulting firm) (since 2002). Formerly, Chief Executive Officer and President of PIMCO Advisors Holdings L.P. (a publicly traded investment management firm) (1994-2000), and Chief Investment Officer (1987-1994) and Vice Chairman and Director (1990-1994) of Pacific Life Insurance Company (a mutual life insurance and annuity company) (1987-1994). | 51 | Member, Limited Partner Advisory Committee, Karmel Capital Fund III (since 2022), Member of the Investment Committee for the Orange Country Community Foundation (a grantmaking foundation) (since 2020), Advisory Board Member, RevOZ Fund LP and related funds (real estate investments for opportunity zones) (since 2020), and Advisory Board Member, Innovate Partners Emerging Growth and Equity Fund I (early stage venture capital fund) (since 2014). Formerly, Managing Trustee of National Retirement Partners Liquidating Trust (2013-2016), Chairman, National Retirement Partners, Inc. (formerly a network of advisors to 401(k) plans) (2005-2013), Director of Prospect Acquisition Corp. (a special purpose acquisition corporation) (2007-2009), Director of RemedyTemp, Inc. (temporary help services company) (1996-2006), and Trustee of PIMCO Funds Multi-Manager Series (1990-2000) and Pacific Life Variable Life & Annuity Trusts (1987-1994). |
Janus Henderson VIT Mid Cap Value Portfolio
Trustees and Officers (unaudited)
| | | | | | |
TRUSTEES |
Name, Address, and Age | Positions Held with the Trust | Length of Time Served | Principal Occupations During the Past Five Years | Number of Portfolios/Funds in Fund Complex Overseen by Trustee | Other Directorships Held by Trustee During the Past Five Years |
Independent Trustees | | | | |
Raudline Etienne
151 Detroit Street
Denver, CO 80206
DOB: 1965 | Trustee | 6/16-Present | Founder, Daraja Capital (advisory and investment firm) (since 2016). Formerly, Senior Vice President and Senior Advisor, Albright Stonebridge Group LLC (global strategy firm) (2011-2021), and Deputy Comptroller and Chief Investment Officer, New York State Common Retirement Fund (public pension fund) (2008-2011). | 51 | Member of the Investment Committee for Cooper Union (private college) (since 2021), Board Member, Van Alen Institute (nonprofit architectural and design organization) (2019-2022). |
Janus Henderson VIT Mid Cap Value Portfolio
Trustees and Officers (unaudited)
| | | | | | |
TRUSTEES |
Name, Address, and Age | Positions Held with the Trust | Length of Time Served | Principal Occupations During the Past Five Years | Number of Portfolios/Funds in Fund Complex Overseen by Trustee | Other Directorships Held by Trustee During the Past Five Years |
Independent Trustees | | | | |
Darrell B. Jackson
151 Detroit Street
Denver, CO 80206
DOB: 1958 | Trustee | 8/22-Present | President and Chief Executive Officer, The Efficace Group Inc. (since 2018). Formerly, President and Chief Executive Officer, Seaway Bank and Trust Company (community bank) (2014-2015), and Executive Vice President and Co-President, Wealth Management (2009-2014), and several senior positions, including Group Executive, Senior Vice President, and Vice President (1995-2009) of Northern Trust Company (financial services company) (1995-2014). | 51 | Director of Amalgamated Financial Corp (bank) (since August 2021), Director of YR Media (a not-for-profit production company) (since 2021), and Director of Gray-Bowen-Scott (transportation project consulting firm) (since April 2020). Formerly, Director of Delaware Place Bank (closely held commercial bank) (2016-2018) and Director of Seaway Bank and Trust Company (2014-2015). |
Janus Henderson VIT Mid Cap Value Portfolio
Trustees and Officers (unaudited)
| | | | | | |
TRUSTEES |
Name, Address, and Age | Positions Held with the Trust | Length of Time Served | Principal Occupations During the Past Five Years | Number of Portfolios/Funds in Fund Complex Overseen by Trustee | Other Directorships Held by Trustee During the Past Five Years |
Independent Trustees | | | | |
William F. McCalpin
151 Detroit Street
Denver, CO 80206
DOB: 1957 | Trustee | 6/02-Present | Chief Executive Officer, muun chi LLC (organic food business) (since 2022) and Independent Consultant (since 2019). Formerly, Chief Operating Officer, muun chi LLC (2020-2022), Managing Partner, Impact Investments, Athena Capital Advisors LLC (independent registered investment advisor) (2016-2019), Managing Director, Holos Consulting LLC (provides consulting services to foundations and other nonprofit organizations) (2009-2016), Chief Executive Officer, Imprint Capital Advisors (impact investment firm) (2013-2015), and Executive Vice President and Chief Operating Officer of The Rockefeller Brothers Fund (a private family foundation) (1998-2006). | 51 | Chairman of the Board and Trustee of The Investment Fund for Foundations Investment Program (TIP) (consisting of 1 fund) (since 2008). Formerly, Director of the F.B. Heron Foundation (a private grantmaking foundation) (2006-2022), and Director of Mutual Fund Directors Forum (a non-profit organization serving independent directors of U.S. mutual funds) (2016-2021). |
Janus Henderson VIT Mid Cap Value Portfolio
Trustees and Officers (unaudited)
| | | | | | |
TRUSTEES |
Name, Address, and Age | Positions Held with the Trust | Length of Time Served | Principal Occupations During the Past Five Years | Number of Portfolios/Funds in Fund Complex Overseen by Trustee | Other Directorships Held by Trustee During the Past Five Years |
Independent Trustees | | | | |
Gary A. Poliner
151 Detroit Street
Denver, CO 80206
DOB: 1953 | Trustee | 6/16-Present | Retired. Formerly, President (2010-2013) of Northwestern Mutual Life Insurance Company. | 51 | Director of MGIC Investment Corporation (private mortgage insurance) (since 2013). Formerly, Director, West Bend Mutual Insurance Company (property/casualty insurance) (2013-2021), Trustee of Northwestern Mutual Life Insurance Company (2010-2013) and Director of Frank Russell Company (global asset management firm) (2008-2013). |
Diane L. Wallace
151 Detroit Street
Denver, CO 80206
DOB: 1958 | Trustee | 6/17-Present | Retired. Formerly, Chief Operating Officer, Senior Vice President-Operations, and Chief Financial Officer for Driehaus Capital Management, LLC (1988-2006) and Treasurer for Driehaus Mutual Funds (1996-2002). | 51 | Formerly, Director of Family Service of Lake County (2019-2021), Independent Trustee, Henderson Global Funds (13 portfolios) (2015-2017), Independent Trustee, State Farm Associates' Funds Trust, State Farm Mutual Fund Trust, and State Farm Variable Product Trust (28 portfolios) (2013-2017). |
Janus Henderson VIT Mid Cap Value Portfolio
Trustees and Officers (unaudited)
| | | | |
OFFICERS |
Name, Address, and Age | Positions Held with the Trust | Term of Office* and Length of Time Served | Principal Occupations During the Past Five Years |
Justin Tugman
151 Detroit Street
Denver, CO 80206
DOB: 1973 | Executive Vice President and Co-Portfolio Manager Mid Cap Value Portfolio | 3/15-Present | Portfolio Manager for other Janus Henderson accounts. |
Kevin Preloger
151 Detroit Street
Denver, CO 80206
DOB: 1975 | Executive Vice President and Co-Portfolio Manager Mid Cap Value Portfolio | 4/13-Present | Portfolio Manager for other Janus Henderson accounts. |
Michelle Rosenberg
151 Detroit Street
Denver, CO 80206
DOB: 1973 | President and Chief Executive Officer | 9/22-Present | General Counsel and Corporate Secretary of Janus Henderson Investors (since 2018). Formerly, Interim President and Chief Executive Officer of the Trust and Janus Investment Fund (2022), Senior Vice President and Head of Legal, North America of Janus Henderson Investors (2017-2018) and Deputy General Counsel of Janus Henderson US (Holdings) Inc. (2015-2018). |
* Officers are elected at least annually by the Trustees for a one-year term and may also be elected from time to time by the Trustees for an interim period. |
Janus Henderson VIT Mid Cap Value Portfolio
Trustees and Officers (unaudited)
| | | | |
OFFICERS |
Name, Address, and Age | Positions Held with the Trust | Term of Office* and Length of Time Served | Principal Occupations During the Past Five Years |
Kristin Mariani
151 Detroit Street
Denver, CO 80206
DOB: 1966 | Vice President and Chief Compliance Officer | 7/20-Present | Head of Compliance, North America at Janus Henderson Investors (since September 2020), and Chief Compliance Officer at Janus Henderson Investors US LLC (since September 2017). Formerly, Anti-Money Laundering Officer for the Trust and Janus Investment Fund (July 2020-December 2022), Global Head of Investment Management Compliance at Janus Henderson Investors (February 2019-August 2020), Vice President, Head of Global Distribution Compliance and Chief Compliance Officer at Janus Henderson Distributors US LLC (May 2017-September 2017), Vice President, Compliance at Janus Henderson US (Holdings) Inc., Janus Henderson Investors US LLC, and Janus Henderson Distributors US LLC (2009-2017). |
Jesper Nergaard
151 Detroit Street
Denver, CO 80206
DOB: 1962 | Chief Financial Officer
Vice President, Treasurer, and Principal Accounting Officer | 3/05-Present
2/05-Present | Head of U.S. Fund Administration, Janus Henderson Investors and Janus Henderson Services US LLC. |
Abigail J. Murray
151 Detroit Street
Denver, CO 80206
DOB: 1975 | Vice President, Chief Legal Officer, and Secretary | 12/20-Present | Managing Counsel (since 2020). Formerly, Senior Counsel for Invesco Ltd. (2017-2020), and Vice President and Senior Counsel, ALPS Fund Services, Inc. and Assistant General Counsel, ALPS Advisors, Inc. (2015-2017). |
Ciaran Askin
151 Detroit Street
Denver, CO 80206
DOB: 1978 | Anti-Money Laundering Officer | 12/22-Present | Global Head of Financial Crime, Janus Henderson Investors (since 2022). Formerly, Global Head of Financial Crime for Invesco Ltd. (2017-2022). |
* Officers are elected at least annually by the Trustees for a one-year term and may also be elected from time to time by the Trustees for an interim period. |
Janus Henderson VIT Mid Cap Value Portfolio
Notes
NotesPage1
| | | | | | | | |
| | | | | |

| | | | |
This report is submitted for the general information of shareholders of the Portfolio. It is not an offer or solicitation for the Portfolio and is not authorized for distribution to prospective investors unless preceded or accompanied by an effective prospectus. |
Janus Henderson is a trademark of Janus Henderson Group plc or one of its subsidiaries. © Janus Henderson Group plc Janus Henderson Distributors US LLC |
| | | | 109-02-81122 03-23 |
| | | | | | |
| | | |
| | | ANNUAL REPORT December 31, 2022 |
| | |
| | Janus Henderson VIT Overseas Portfolio |
| | |
| | Janus Aspen Series |
| |
| | | HIGHLIGHTS · Portfolio management perspective · Investment strategy behind your portfolio · Portfolio performance, characteristics
and holdings | |
Table of Contents
Janus Henderson VIT Overseas Portfolio
Janus Henderson VIT Overseas Portfolio (unaudited)
| | | | | | |
| | | | 
Julian McManus co-portfolio manager | 
George Maris co-portfolio manager |
| | | |
PERFORMANCE OVERVIEW
For the 12-month period ended December 31, 2022, the Janus Henderson VIT Overseas Portfolio’s Institutional Shares and Service Shares returned -8.60% and -8.84%, respectively. The Portfolio’s benchmark, the MSCI All Country World ex-USA IndexSM, returned -16.00% during the period.
MARKET ENVIRONMENT
Stocks declined over the 12-month period as soaring inflation, rising interest rates, and recession fears led to market turbulence. Stocks started out the year with volatility as worsening price pressures raised expectations for more restrictive central bank policies. Volatility increased further late in the first quarter after Russia’s invasion of Ukraine sent commodity prices soaring while raising concerns about supply disruptions. Market volatility continued as record-high inflation in many countries led to synchronized and often aggressive policy tightening. Concerns about a looming European energy crisis, as Russia reduced gas supplies, added to negative sentiment in the third quarter, further pressuring equity performance. Global equities regained some ground in the fourth quarter as signs of moderating inflation raised hopes for a slower pace of policy tightening in 2023. Investors also revised their worst fears over a potential European energy crisis and the global economic outlook. Despite this rally, stocks still ended the year with notable declines.
PERFORMANCE DISCUSSION
The Portfolio’s relative performance was primarily driven by stock selection, and in particular from investments in several undervalued materials producers that enjoyed higher commodity prices. These included Teck Resources and Canadian Natural Resources. Common themes among these companies were strong earnings and excess cash flows, which they distributed to shareholders in the form of higher dividends or used to repurchase stock or pay down debt – strategies we believe demonstrate a commitment to maximizing shareholder value. Teck Resources is also shifting more of its operations to sustainable metals, such as copper, that are essential to the green energy transition. While global copper demand is rising, copper production is growing more costly and difficult as stores of easily accessible ore are depleted. Given these dynamics, we expect copper prices to rise over the long term, benefiting cost-advantaged producers such as Teck Resources.
Global pharmaceutical firm AstraZeneca was another strong performer for the year, supported by clinical positive trial results for its cancer drug Enhertu. In clinical trials, this drug showed additional efficacy in treating breast cancer tumors with low levels of HER2. We believe this could potentially expand the scope of approval for the drug and result in higher revenues. AstraZeneca’s strong pipeline, improving operating leverage, and attractive valuation continue to warrant capital allocation.
Another individual contributor to the Portfolio’s relative performance included luggage company Samsonite International. Our thesis for the Hong Kong-listed luggage maker remained firmly on track during the year, as its stock advanced thanks to margin expansion combined with a strong sales recovery in the Americas and Europe. Cost reductions that were initially planned under a new management team before COVID-19 are finally evident, as travel and luggage sales return to pre-pandemic levels in many parts of the world. During the pandemic-related slowdown in travel, we felt confident that Samsonite’s strong brand and share of voice would enable it to emerge in an even stronger competitive position. We are optimistic that as China relaxes its zero-tolerance COVID-19 policy, travel in China will also recover, further benefiting Samsonite revenues.
On a negative note, relative performance was hindered by our investment in Ferguson, a distributor of plumbing and HVAC supplies. The stock faced headwinds early in 2022 due to technical factors related to the shift of its primary listing from the U.K. to the U.S. Concerns about rising
Janus Henderson VIT Overseas Portfolio (unaudited)
interest rates, supply chain issues, and slowing residential construction also pressured the stock. On a positive note, Ferguson benefited from continued strong business trends in industrial and infrastructure construction. This helped the company report better-than-expected third-quarter results, leading to some recovery in the stock in the fourth quarter. While we reduced our position over the period, we remain invested in Ferguson due to its strong competitive position and attractive valuation relative to peers.
Entain was another detractor, as the stock faced headwinds due to uncertainty over potential U.K. gambling regulations. We believed these concerns were exaggerated, and we remain impressed by Entain’s competitive positioning and proprietary online gaming technology. For these reasons, we used the pullback in the stock price to add to our position.
Chip manufacturer Taiwan Semiconductor Manufacturing Company (TSMC) was another detractor. The stock declined in response to forecasts of an industry-wide decline in semiconductor sales in 2023. While we reduced our position given near-term business headwinds, we continue to see TSMC as a high-quality business with durable growth drivers, a strong management team, robust margins, and healthy free-cash-flow generation.
OUTLOOK
We think central banks will need to be steadfast on rates to ensure inflation is under control. We have yet to see the full economic impact of recent rate hikes, and we recognize the potential for reduced corporate earnings as companies adjust to slower economic growth and higher costs of capital. At the same time, we see positive developments, such as more growth-oriented policies in China, that may mitigate the severity of any global economic downturn.
Even beyond this cycle, we think we are entering a period different from the era of low inflation and ultra-low interest rates we experienced over the past decade. We believe demographic shifts and trends, such as deglobalization, will likely keep upward pressure on inflation, leading to an extended period of higher interest rates and elevated capital costs. While such an environment may be difficult for some companies to navigate, we think it will ultimately enable well-managed, well-capitalized, profitable companies to differentiate themselves while strengthening their competitive positioning. In our view, this environment will reward active, fundamentally driven stock selection. We remain committed to our bottom-up process as we seek out companies that we believe have future free cash flows that are underestimated by the market. We think this strategy will help the Portfolio weather near-term market volatility as it pursues long-term capital appreciation.
Thank you for your continued investment in Janus Henderson VIT Overseas Portfolio.
Quantitative Tightening (QT) is a government monetary policy occasionally used to decrease the money supply by either selling government securities or letting them mature and removing them from its cash balances.
Janus Henderson VIT Overseas Portfolio (unaudited)
Portfolio At A Glance
December 31, 2022
| | | | | | | | | | |
| | | | | | | | | |
| | | | | | | | | |
| | | | | | | | | |
| 5 Top Contributors - Holdings | 5 Top Detractors - Holdings |
| | Average
Weight | | Relative
Contribution | | | Average
Weight | | Relative
Contribution |
| Teck Resources Ltd | 4.18% | | 1.95% | | Ferguson PLC | 4.35% | | -0.89% |
| Canadian Natural Resources Ltd | 3.88% | | 1.89% | | Entain PLC | 2.78% | | -0.46% |
| AstraZeneca PLC | 4.37% | | 1.14% | | Taiwan Semiconductor Manufacturing Co Ltd | 3.87% | | -0.38% |
| Samsonite International SA | 2.64% | | 0.96% | | Erste Group Bank AG | 2.29% | | -0.37% |
| Beazley PLC | 2.15% | | 0.90% | | Hexagon AB - Class B | 1.44% | | -0.36% |
| | | | | | | |
| 5 Top Contributors - Sectors* | | | | | |
| | | Relative | | Portfolio | MSCI All Country World ex-USA Index |
| | | Contribution | | Average Weight | Average Weight |
| Materials | | 2.41% | | 8.09% | 8.38% |
| Health Care | | 1.89% | | 11.52% | 9.48% |
| Consumer Discretionary | | 1.77% | | 12.79% | 11.38% |
| Energy | | 1.69% | | 6.19% | 5.89% |
| Financials | | 0.87% | | 20.74% | 20.47% |
| | | | | | |
| | | | | | |
| 5 Top Detractors - Sectors* | | | | | |
| | | Relative | | Portfolio | MSCI All Country World ex-USA Index |
| | | Contribution | | Average Weight | Average Weight |
| Industrials | | -0.89% | | 11.13% | 12.18% |
| Consumer Staples | | -0.18% | | 9.08% | 8.81% |
| Utilities | | -0.16% | | 0.00% | 3.30% |
| Communication Services | | -0.07% | | 7.28% | 6.14% |
| Real Estate | | 0.12% | | 0.00% | 2.40% |
| | | | | | | |
| Relative contribution reflects how the portolio's holdings impacted return relative to the benchmark. Cash and securities not held in the portfolio are not shown. For equity portfolios, relative contribution compares the performance of a security in the portfolio to the benchmark's total return, factoring in the difference in weight of that security in the benchmark. Returns are calculated using daily returns and previous day ending weights rolled up by ticker, excluding fixed income securities, gross of advisory fees, may exclude certain derivatives and will differ from actual performance.
Performance attribution reflects returns gross of advisory fees and may differ from actual returns as they are based on end of day holdings. Attribution is calculated by geometrically linking daily returns for the portfolio and index. |
* | Based on sector classification according to the Global Industry Classification Standard (“GICS”) codes, which are the exclusive property and a service mark of MSCI Inc. and Standard & Poor’s. |
Janus Henderson VIT Overseas Portfolio (unaudited)
Portfolio At A Glance
December 31, 2022
| | |
5 Largest Equity Holdings - (% of Net Assets) |
Dai-ichi Life Holdings Inc | |
Insurance | 4.1% |
BNP Paribas SA | |
Banks | 4.0% |
Teck Resources Ltd | |
Metals & Mining | 3.8% |
AstraZeneca PLC | |
Pharmaceuticals | 3.8% |
AIA Group Ltd | |
Insurance | 3.7% |
| | 19.4% |
| | | | | | |
Asset Allocation - (% of Net Assets) | |
Common Stocks | | 97.3% | |
Investment Companies | | 1.8% | |
Preferred Stocks | | 0.9% | |
Other | | 0.0% |
| | | 100.0% |
Emerging markets comprised 15.0% of total net assets.
| | |
Top Country Allocations - Long Positions - (% of Investment Securities) |
As of December 31, 2022 
| As of December 31, 2021 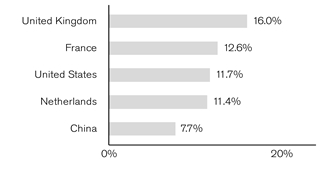
|
Janus Henderson VIT Overseas Portfolio (unaudited)
Performance
| |
See important disclosures on the next page. |
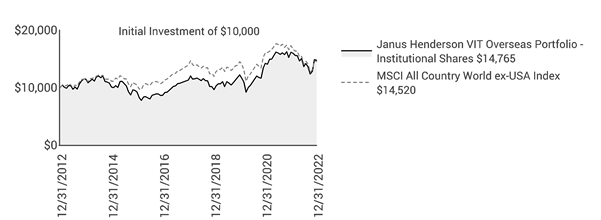
| | | | | | | | | | |
| | | | | | | | |
| | | | | | | | | |
Average Annual Total Return - for the periods ended December 31, 2022 | | | Prospectus Expense Ratios |
| | One
Year | Five
Year | Ten
Year | Since
Inception* | | | Total Annual Fund
Operating Expenses‡ |
Institutional Shares | | -8.60% | 5.46% | 3.97% | 8.22% | | | 0.87% |
Service Shares | | -8.84% | 5.20% | 3.72% | 8.04% | | | 1.12% |
MSCI All Country World ex-USA Index | | -16.00% | 0.88% | 3.80% | N/A** | | | |
Morningstar Quartile - Institutional Shares | | 1st | 1st | 3rd | 1st | | | |
Morningstar Ranking - based on total returns for Foreign Large Blend Funds | | 21/745 | 7/660 | 348/536 | 7/119 | | | |
Returns quoted are past performance and do not guarantee future results; current performance may be lower or higher. Investment returns and principal value will vary; there may be a gain or loss when shares are sold. For the most recent month-end performance call 800.668.0434 or visit janushenderson.com/VITperformance.
This Portfolio has a performance-based management fee that may adjust up or down based on the Portfolio’s performance.
Performance may be affected by risks that include those associated with foreign and emerging markets, fixed income securities, high-yield and high-risk securities, undervalued, overlooked and smaller capitalization companies, real estate related securities including Real Estate Investment Trusts (REITs), Environmental, Social and Governance (ESG) factors, non-diversification, portfolio turnover, derivatives, short sales, initial public offerings (IPOs) and potential conflicts of interest. Each product has different risks. Please see the prospectus for more information about risks, holdings and other details.
Returns do not reflect the deduction of fees, charges or expenses of any insurance product or qualified plan. If applied, returns would have been lower.
Returns include reinvestment of all dividends and distributions and do not reflect the deduction of taxes that a shareholder would pay on Portfolio distributions or redemptions of Portfolio shares. The returns do not include adjustments in accordance with generally accepted accounting principles required at the period end for financial reporting purposes.
Net dividends reinvested are the dividends that remain to be reinvested after foreign tax obligations have been met. Such obligations vary from country to country.
Performance for Service Shares prior to December 31, 1999 reflects the performance of Institutional Shares, adjusted to reflect the expenses of Service Shares.
Ranking is for the share class shown only; other classes may have different performance characteristics.
© 2022 Morningstar, Inc. All Rights Reserved.
There is no assurance that the investment process will consistently lead to successful investing.
See Notes to Schedule of Investments and Other Information for index definitions.
Janus Henderson VIT Overseas Portfolio (unaudited)
Performance
Index performance does not reflect the expenses of managing a portfolio as an index is unmanaged and not available for direct investment.
See “Useful Information About Your Portfolio Report.”
*The Portfolio’s inception date – May 2, 1994
**Since inception return is not shown for the index because the index’s inception date differs significantly from the Portfolio’s inception date.
‡ As stated in the prospectus. See Financial Highlights for actual expense ratios during the reporting period.
Janus Henderson VIT Overseas Portfolio (unaudited)
Expense Examples
As a shareholder of the Portfolio, you incur two types of costs: (1) transaction costs and (2) ongoing costs, including management fees; 12b-1 distribution and shareholder servicing fees (applicable to Service Shares only); transfer agent fees and expenses payable pursuant to the Transfer Agency Agreement; and other Portfolio expenses. This example is intended to help you understand your ongoing costs (in dollars) of investing in the Portfolio and to compare these costs with the ongoing costs of investing in other mutual funds. To do so, compare this 5% hypothetical example with the 5% hypothetical examples that appear in the shareholder reports of the other funds. The example is based upon an investment of $1,000 invested at the beginning of the period and held for the six-months indicated, unless noted otherwise in the table and footnotes below.
Actual Expenses
The information in the table under the heading “Actual” provides information about actual account values and actual expenses. You may use the information in these columns, together with the amount you invested, to estimate the expenses that you paid over the period. Simply divide your account value by $1,000 (for example, an $8,600 account value divided by $1,000 = 8.6), then multiply the result by the number in the appropriate column for your share class under the heading entitled “Expenses Paid During Period” to estimate the expenses you paid on your account during the period.
Hypothetical Example for Comparison Purposes
The information in the table under the heading “Hypothetical (5% return before expenses)” provides information about hypothetical account values and hypothetical expenses based upon the Portfolio’s actual expense ratio and an assumed rate of return of 5% per year before expenses, which is not the Portfolio’s actual return. The hypothetical account values and expenses may not be used to estimate the actual ending account balance or expenses you paid for the period. You may use this information to compare the ongoing costs of investing in the Portfolio and other funds. To do so, compare this 5% hypothetical example with the 5% hypothetical examples that appear in the shareholder reports of the other funds. Additionally, for an analysis of the fees associated with an investment in either share class or other similar funds, please visit www.finra.org/fundanalyzer.
Please note that the expenses shown in the table are meant to highlight your ongoing costs only and do not reflect any transaction costs, such as any charges at the separate account level or contract level. These fees are fully described in the Portfolio’s prospectuses. Therefore, the hypothetical examples are useful in comparing ongoing costs only, and will not help you determine the relative total costs of owning different funds. In addition, if these transaction costs were included, your costs would have been higher.
| | | | | | | | | | | |
| | | | | | | | |
| | | Actual | | Hypothetical
(5% return before expenses) | |
| Beginning
Account
Value
(7/1/22) | Ending
Account
Value
(12/31/22) | Expenses
Paid During
Period
(7/1/22 - 12/31/22)† | | Beginning
Account
Value
(7/1/22) | Ending
Account
Value
(12/31/22) | Expenses
Paid During
Period
(7/1/22 - 12/31/22)† | Net Annualized
Expense Ratio
(7/1/22 - 12/31/22) |
Institutional Shares | $1,000.00 | $1,083.30 | $4.78 | | $1,000.00 | $1,020.62 | $4.63 | 0.91% |
Service Shares | $1,000.00 | $1,082.00 | $6.09 | | $1,000.00 | $1,019.36 | $5.90 | 1.16% |
† | Expenses Paid During Period are equal to the Net Annualized Expense Ratio multiplied by the average account value over the period, multiplied by 184/365 (to reflect the one-half year period). Expenses in the examples include the effect of applicable fee waivers and/or expense reimbursements, if any. Had such waivers and/or reimbursements not been in effect, your expenses would have been higher. Please refer to the Notes to Financial Statements or the Portfolio’s prospectuses for more information regarding waivers and/or reimbursements. |
Janus Henderson VIT Overseas Portfolio
Schedule of Investments
December 31, 2022
| | | | | | | | |
Shares
| | | Value | |
Common Stocks– 97.3% | | | |
Aerospace & Defense – 2.4% | | | |
| | Airbus SE | | 130,327 | | | $15,493,970 | |
Banks – 10.8% | | | |
| | BNP Paribas SA | | 459,020 | | | 26,117,882 | |
| | Erste Group Bank AG | | 580,623 | | | 18,512,038 | |
| | Natwest Group PLC | | 5,832,426 | | | 18,613,946 | |
| | Permanent TSB Group Holdings PLC* | | 3,507,426 | | | 6,810,360 | |
| | | 70,054,226 | |
Beverages – 6.8% | | | |
| | Diageo PLC | | 496,879 | | | 21,937,155 | |
| | Heineken NV | | 230,530 | | | 21,655,565 | |
| | | 43,592,720 | |
Biotechnology – 1.9% | | | |
| | Argenx SE (ADR)* | | 15,378 | | | 5,825,648 | |
| | Ascendis Pharma A/S (ADR)* | | 54,034 | | | 6,599,172 | |
| | | 12,424,820 | |
Diversified Telecommunication Services – 2.9% | | | |
| | Deutsche Telekom AG | | 950,420 | | | 18,954,824 | |
Electronic Equipment, Instruments & Components – 4.1% | | | |
| | E Ink Holdings Inc | | 735,000 | | | 3,846,735 | |
| | Hexagon AB - Class B | | 591,759 | | | 6,223,860 | |
| | Keyence Corp | | 41,900 | | | 16,406,547 | |
| | | 26,477,142 | |
Entertainment – 3.8% | | | |
| | Liberty Media Corp-Liberty Formula One* | | 259,484 | | | 15,511,954 | |
| | Nintendo Co Ltd | | 222,100 | | | 9,301,989 | |
| | | 24,813,943 | |
Health Care Equipment & Supplies – 1.0% | | | |
| | Hoya Corp | | 64,300 | | | 6,222,307 | |
Hotels, Restaurants & Leisure – 6.4% | | | |
| | Entain PLC | | 1,069,059 | | | 17,137,302 | |
| | Yum China Holdings Inc | | 431,850 | | | 24,102,656 | |
| | | 41,239,958 | |
Insurance – 10.5% | | | |
| | AIA Group Ltd | | 2,197,000 | | | 24,205,753 | |
| | Beazley PLC | | 2,142,960 | | | 17,535,913 | |
| | Dai-ichi Life Holdings Inc | | 1,162,400 | | | 26,400,384 | |
| | | 68,142,050 | |
Internet & Direct Marketing Retail – 3.5% | | | |
| | JD.Com Inc - Class A | | 806,178 | | | 22,663,248 | |
Metals & Mining – 7.4% | | | |
| | Freeport-McMoRan Inc | | 232,076 | | | 8,818,888 | |
| | Hindustan Zinc Ltd | | 3,692,019 | | | 14,322,519 | |
| | Teck Resources Ltd | | 649,680 | | | 24,556,157 | |
| | | 47,697,564 | |
Oil, Gas & Consumable Fuels – 5.9% | | | |
| | Canadian Natural Resources Ltd | | 373,715 | | | 20,752,394 | |
| | Total SE | | 275,636 | | | 17,201,414 | |
| | | 37,953,808 | |
Personal Products – 3.1% | | | |
| | Unilever PLC | | 398,548 | | | 20,102,065 | |
Pharmaceuticals – 10.4% | | | |
| | AstraZeneca PLC | | 180,095 | | | 24,436,459 | |
| | Bayer AG | | 113,348 | | | 5,851,605 | |
| | Novartis AG | | 176,842 | | | 16,022,912 | |
| | Sanofi | | 175,094 | | | 16,939,793 | |
| | Takeda Pharmaceutical Co Ltd | | 133,074 | | | 4,157,081 | |
| | | 67,407,850 | |
| | |
See Notes to Schedule of Investments and Other Information and Notes to Financial Statements. |
| |
8 | DECEMBER 31, 2022 |
Janus Henderson VIT Overseas Portfolio
Schedule of Investments
December 31, 2022
| | | | | | | | |
Shares
| | | Value | |
Common Stocks– (continued) | | | |
Road & Rail – 2.9% | | | |
| | Central Japan Railway Co | | 93,200 | | | $11,467,449 | |
| | Full Truck Alliance Co (ADR)* | | 888,730 | | | 7,109,840 | |
| | | 18,577,289 | |
Semiconductor & Semiconductor Equipment – 6.7% | | | |
| | ASML Holding NV | | 34,068 | | | 18,438,483 | |
| | SK Hynix Inc | | 85,891 | | | 5,170,349 | |
| | Taiwan Semiconductor Manufacturing Co Ltd | | 1,357,000 | | | 19,780,051 | |
| | | 43,388,883 | |
Textiles, Apparel & Luxury Goods – 4.7% | | | |
| | LVMH Moet Hennessy Louis Vuitton SE | | 17,051 | | | 12,384,849 | |
| | Samsonite International SA (144A)* | | 6,917,700 | | | 18,089,822 | |
| | | 30,474,671 | |
Trading Companies & Distributors – 2.1% | | | |
| | Ferguson PLC | | 107,039 | | | 13,520,765 | |
Total Common Stocks (cost $516,601,464) | | 629,202,103 | |
Preferred Stocks– 0.9% | | | |
Automobiles – 0.9% | | | |
| | Dr Ing hc F Porsche AG((cost $4,596,603) | | 57,233 | | | 5,805,818 | |
Investment Companies– 1.8% | | | |
Money Markets – 1.8% | | | |
| | Janus Henderson Cash Liquidity Fund LLC, 4.2633%ºº,£((cost $11,743,738) | | 11,741,970 | | | 11,744,318 | |
Total Investments (total cost $532,941,805) – 100.0% | | 646,752,239 | |
Cash, Receivables and Other Assets, net of Liabilities – 0% | | 32,185 | |
Net Assets – 100% | | $646,784,424 | |
| | | | | | |
Summary of Investments by Country - (Long Positions) (unaudited) |
| |
| | | | | % of | |
| | | | | Investment | |
Country | | Value | | Securities | |
United Kingdom | | $119,762,840 | | 18.5 | % |
France | | 88,137,908 | | 13.6 | |
Japan | | 73,955,757 | | 11.4 | |
China | | 53,875,744 | | 8.3 | |
United States | | 49,595,925 | | 7.7 | |
Canada | | 45,308,551 | | 7.0 | |
Hong Kong | | 42,295,575 | | 6.5 | |
Netherlands | | 40,094,048 | | 6.2 | |
Germany | | 30,612,247 | | 4.7 | |
Taiwan | | 23,626,786 | | 3.7 | |
Austria | | 18,512,038 | | 2.9 | |
Switzerland | | 16,022,912 | | 2.5 | |
India | | 14,322,519 | | 2.2 | |
Ireland | | 6,810,360 | | 1.1 | |
Denmark | | 6,599,172 | | 1.0 | |
Sweden | | 6,223,860 | | 1.0 | |
Belgium | | 5,825,648 | | 0.9 | |
South Korea | | 5,170,349 | | 0.8 | |
| | | | | | |
| | | | | | |
Total | | $646,752,239 | | 100.0 | % |
| | |
See Notes to Schedule of Investments and Other Information and Notes to Financial Statements. |
| |
Janus Aspen Series | 9 |
Janus Henderson VIT Overseas Portfolio
Schedule of Investments
December 31, 2022
Schedules of Affiliated Investments – (% of Net Assets)
| | | | | | | | | | | |
| | Dividend Income | Realized Gain/(Loss) | Change in Unrealized Appreciation/ Depreciation | Value at 12/31/22 |
Investment Companies - 1.8% |
Money Markets - 1.8% | |
| | Janus Henderson Cash Liquidity Fund LLC, 4.2633%ºº | $ | 143,754 | $ | (1,699) | $ | 580 | $ | 11,744,318 |
Investments Purchased with Cash Collateral from Securities Lending - N/A |
Investment Companies - N/A | |
| | Janus Henderson Cash Collateral Fund LLC, 4.1397%ºº | | 142,014∆ | | - | | - | | - |
Total Affiliated Investments - 1.8% | $ | 285,768 | $ | (1,699) | $ | 580 | $ | 11,744,318 |
| | | | | | | | | | | |
| | Value at 12/31/21 | Purchases | Sales Proceeds | Value at 12/31/22 |
Investment Companies - 1.8% |
Money Markets - 1.8% | |
| | Janus Henderson Cash Liquidity Fund LLC, 4.2633%ºº | | 7,432,227 | | 140,333,046 | | (136,019,836) | | 11,744,318 |
Investments Purchased with Cash Collateral from Securities Lending - N/A |
Investment Companies - N/A | |
| | Janus Henderson Cash Collateral Fund LLC, 4.1397%ºº | | - | | 122,766,056 | | (122,766,056) | | - |
| | |
See Notes to Schedule of Investments and Other Information and Notes to Financial Statements. |
| |
10 | DECEMBER 31, 2022 |
Janus Henderson VIT Overseas Portfolio
Notes to Schedule of Investments and Other Information
| | |
MSCI All Country World
ex-USA IndexSM | MSCI All Country World ex-USA IndexSM reflects the equity market performance of global developed and emerging markets, excluding the U.S. |
| | |
| | |
ADR | American Depositary Receipt |
LLC | Limited Liability Company |
PLC | Public Limited Company |
| | |
144A | Securities sold under Rule 144A of the Securities Act of 1933, as amended, are subject to legal and/or contractual restrictions on resale and may not be publicly sold without registration under the 1933 Act. Unless otherwise noted, these securities have been determined to be liquid under guidelines established by the Board of Trustees. The total value of 144A securities as of the year ended December 31, 2022 is $18,089,822, which represents 2.8% of net assets. |
| | |
* | Non-income producing security. |
| | |
ºº | Rate shown is the 7-day yield as of December 31, 2022. |
| | |
£ | The Portfolio may invest in certain securities that are considered affiliated companies. As defined by the Investment Company Act of 1940, as amended, an affiliated company is one in which the Portfolio owns 5% or more of the outstanding voting securities, or a company which is under common ownership or control. |
| | |
∆ | Net of income paid to the securities lending agent and rebates paid to the borrowing counterparties. |
| | | | | | | | | | | | | |
The following is a summary of the inputs that were used to value the Portfolio’s investments in securities and other financial instruments as of December 31, 2022. See Notes to Financial Statements for more information. |
| |
Valuation Inputs Summary |
| | | | | | | |
| | | | | Level 2 - | | Level 3 - |
| | | Level 1 - | | Other Significant | | Significant |
| | | Quoted Prices | | Observable Inputs | | Unobservable Inputs |
| | | | | | | |
Assets | | | | | | |
Investments In Securities: | | | | | | |
Common Stocks | | | | | | |
Biotechnology | $ | 12,424,820 | $ | - | $ | - |
Entertainment | | 15,511,954 | | 9,301,989 | | - |
Metals & Mining | | 33,375,045 | | 14,322,519 | | - |
Oil, Gas & Consumable Fuels | | 20,752,394 | | 17,201,414 | | - |
Road & Rail | | 7,109,840 | | 11,467,449 | | - |
All Other | | - | | 487,734,679 | | - |
Preferred Stocks | | - | | 5,805,818 | | - |
Investment Companies | | - | | 11,744,318 | | - |
Total Assets | $ | 89,174,053 | $ | 557,578,186 | $ | - |
| | | | | | | |
Janus Henderson VIT Overseas Portfolio
Statement of Assets and Liabilities
December 31, 2022
| | | | | | | |
| | | | | | |
Assets: | | | | |
| Unaffiliated investments, at value (cost $521,198,067) | | $ | 635,007,921 | |
| Affiliated investments, at value (cost $11,743,738) | | | 11,744,318 | |
| Cash denominated in foreign currency (cost $150,220) | | | 150,220 | |
| Trustees' deferred compensation | | | 20,997 | |
| Receivables: | | | | |
| | Foreign tax reclaims | | | 819,560 | |
| | Dividends | | | 430,639 | |
| | Dividends from affiliates | | | 29,047 | |
| | Portfolio shares sold | | | 18,725 | |
| Other assets | | | 6,564 | |
Total Assets | | | 648,227,991 | |
Liabilities: | | | | |
| Payables: | | | — | |
| | Advisory fees | | | 459,201 | |
| | Portfolio shares repurchased | | | 331,419 | |
| | Investments purchased | | | 308,242 | |
| | 12b-1 Distribution and shareholder servicing fees | | | 114,223 | |
| | Professional fees | | | 50,183 | |
| | Transfer agent fees and expenses | | | 30,789 | |
| | Trustees' deferred compensation fees | | | 20,997 | |
| | Custodian fees | | | 9,762 | |
| | Affiliated portfolio administration fees payable | | | 1,471 | |
| | Trustees' fees and expenses | | | 156 | |
| | Accrued expenses and other payables | | | 117,124 | |
Total Liabilities | | | 1,443,567 | |
Net Assets | | $ | 646,784,424 | |
Net Assets Consist of: | | | | |
| Capital (par value and paid-in surplus) | | $ | 754,347,492 | |
| Total distributable earnings (loss) | | | (107,563,068) | |
Total Net Assets | | $ | 646,784,424 | |
Net Assets - Institutional Shares | | $ | 144,544,061 | |
| Shares Outstanding, $0.001 Par Value (unlimited shares authorized) | | | 3,752,599 | |
Net Asset Value Per Share | | $ | 38.52 | |
Net Assets - Service Shares | | $ | 502,240,363 | |
| Shares Outstanding, $0.001 Par Value (unlimited shares authorized) | | | 13,663,500 | |
Net Asset Value Per Share | | $ | 36.76 | |
| | |
See Notes to Financial Statements. |
| |
12 | DECEMBER 31, 2022 |
Janus Henderson VIT Overseas Portfolio
Statement of Operations
For the year ended December 31, 2022
| | | | | | |
| | | | | |
Investment Income: | | | |
| Dividends | $ | 20,127,845 | |
| Dividends from affiliates | | 143,754 | |
| Affiliated securities lending income, net | | 142,014 | |
| Unaffiliated securities lending income, net | | 8,611 | |
| Other income | | 4,051 | |
| Foreign tax withheld | | (2,248,221) | |
Total Investment Income | | 18,178,054 | |
Expenses: | | | |
| Advisory fees | | 5,147,426 | |
| 12b-1 Distribution and shareholder servicing fees: | | | |
| | Service Shares | | 1,251,265 | |
| Transfer agent administrative fees and expenses: | | | |
| | Institutional Shares | | 73,472 | |
| | Service Shares | | 250,456 | |
| Other transfer agent fees and expenses: | | | |
| | Institutional Shares | | 3,328 | |
| | Service Shares | | 6,200 | |
| Custodian fees | | 71,696 | |
| Professional fees | | 54,242 | |
| Registration fees | | 27,065 | |
| Affiliated portfolio administration fees | | 16,196 | |
| Trustees’ fees and expenses | | 14,844 | |
| Shareholder reports expense | | 4,334 | |
| Other expenses | | 77,183 | |
Total Expenses | | 6,997,707 | |
Net Investment Income/(Loss) | | 11,180,347 | |
Net Realized Gain/(Loss) on Investments: | | | |
| Investments and foreign currency transactions | | 15,281,034 | |
| Investments in affiliates | | (1,699) | |
Total Net Realized Gain/(Loss) on Investments | | 15,279,335 | |
Change in Unrealized Net Appreciation/Depreciation: | | | |
| Investments, foreign currency translations and Trustees’ deferred compensation | | (91,249,920) | |
| Investments in affiliates | | 580 | |
Total Change in Unrealized Net Appreciation/Depreciation | | (91,249,340) | |
Net Increase/(Decrease) in Net Assets Resulting from Operations | $ | (64,789,658) | |
| | | | | |
| | |
See Notes to Financial Statements. |
| |
Janus Aspen Series | 13 |
Janus Henderson VIT Overseas Portfolio
Statements of Changes in Net Assets
| | | | | | | | | |
| | | | | | | | |
| | | Year ended
December 31, 2022 | | Year ended
December 31, 2021 | |
| | | | | | | | | |
Operations: | | | | | | |
| Net investment income/(loss) | $ | 11,180,347 | | $ | 8,774,069 | |
| Net realized gain/(loss) on investments | | 15,279,335 | | | 76,508,640 | |
| Change in unrealized net appreciation/depreciation | | (91,249,340) | | | 6,019,858 | |
Net Increase/(Decrease) in Net Assets Resulting from Operations | | (64,789,658) | | | 91,302,567 | |
Dividends and Distributions to Shareholders: | | | | | | |
| | Institutional Shares | | (2,571,849) | | | (1,925,877) | |
| | Service Shares | | (8,483,696) | | | (5,828,741) | |
Net Decrease from Dividends and Distributions to Shareholders | | (11,055,545) | | | (7,754,618) | |
Capital Share Transactions: | | | | | | |
| | Institutional Shares | | (8,401,371) | | | (8,149,662) | |
| | Service Shares | | (9,629,286) | | | (34,092,164) | |
Net Increase/(Decrease) from Capital Share Transactions | | (18,030,657) | | | (42,241,826) | |
Net Increase/(Decrease) in Net Assets | | (93,875,860) | | | 41,306,123 | |
Net Assets: | | | | | | |
| Beginning of period | | 740,660,284 | | | 699,354,161 | |
| End of period | $ | 646,784,424 | | $ | 740,660,284 | |
| | | | | | | | |
| | |
See Notes to Financial Statements. |
| |
14 | DECEMBER 31, 2022 |
Janus Henderson VIT Overseas Portfolio
Financial Highlights
| | | | | | | | | | | | | | | | | | | |
Institutional Shares | | | | | | | | | | | | | | | |
For a share outstanding during the year ended December 31 | | 2022 | | | 2021 | | | 2020 | | | 2019 | | | 2018 | |
| Net Asset Value, Beginning of Period | | $42.92 | | | $38.21 | | | $33.29 | | | $26.71 | | | $31.98 | |
| Income/(Loss) from Investment Operations: | | | | | | | | | | | | | | | |
| | Net investment income/(loss)(1) | | 0.74 | | | 0.58 | | | 0.36 | | | 0.60 | | | 0.53 | |
| | Net realized and unrealized gain/(loss) | | (4.46) | | | 4.62 | | | 4.99 | | | 6.56 | | | (5.25) | |
| Total from Investment Operations | | (3.72) | | | 5.20 | | | 5.35 | | | 7.16 | | | (4.72) | |
| Less Dividends and Distributions: | | | | | | | | | | | | | | | |
| | Dividends (from net investment income) | | (0.68) | | | (0.49) | | | (0.43) | | | (0.58) | | | (0.55) | |
| Total Dividends and Distributions | | (0.68) | | | (0.49) | | | (0.43) | | | (0.58) | | | (0.55) | |
| Net Asset Value, End of Period | | $38.52 | | | $42.92 | | | $38.21 | | | $33.29 | | | $26.71 | |
| Total Return* | | (8.63)% | | | 13.61% | | | 16.30% | | | 27.02% | | | (14.94)% | |
| Net Assets, End of Period (in thousands) | | $144,544 | | | $170,166 | | | $159,005 | | | $165,881 | | | $143,912 | |
| Average Net Assets for the Period (in thousands) | | $147,074 | | | $168,216 | | | $138,082 | | | $154,209 | | | $172,398 | |
| Ratios to Average Net Assets**: | | | | | | | | | | | | | | | |
| | Ratio of Gross Expenses | | 0.89% | | | 0.87% | | | 0.83% | | | 0.75% | | | 0.60% | |
| | Ratio of Net Expenses (After Waivers and Expense Offsets) | | 0.89% | | | 0.87% | | | 0.83% | | | 0.75% | | | 0.60% | |
| | Ratio of Net Investment Income/(Loss) | | 1.91% | | | 1.38% | | | 1.15% | | | 2.00% | | | 1.71% | |
| Portfolio Turnover Rate | | 36% | | | 21% | | | 21% | | | 23% | | | 25% | |
| | | | | | | | | | | | | | | | | | | |
| |
* Total return includes adjustments in accordance with generally accepted accounting principles required at the year or period end and are not annualized for periods of less than one full year. Total return does not include fees, charges, or expenses imposed by the variable annuity and life insurance contracts for which Janus Aspen Series serves as an underlying investment vehicle. ** Annualized for periods of less than one full year. (1) Per share amounts are calculated based on average shares outstanding during the year or period. |
| | |
See Notes to Financial Statements. |
| |
Janus Aspen Series | 15 |
Janus Henderson VIT Overseas Portfolio
Financial Highlights
| | | | | | | | | | | | | | | | | | | |
Service Shares | | | | | | | | | | | | | | | |
For a share outstanding during the year ended December 31 | | 2022 | | | 2021 | | | 2020 | | | 2019 | | | 2018 | |
| Net Asset Value, Beginning of Period | | $41.02 | | | $36.57 | | | $31.90 | | | $25.63 | | | $30.74 | |
| Income/(Loss) from Investment Operations: | | | | | | | | | | | | | | | |
| | Net investment income/(loss)(1) | | 0.61 | | | 0.46 | | | 0.27 | | | 0.50 | | | 0.44 | |
| | Net realized and unrealized gain/(loss) | | (4.25) | | | 4.41 | | | 4.77 | | | 6.30 | | | (5.05) | |
| Total from Investment Operations | | (3.64) | | | 4.87 | | | 5.04 | | | 6.80 | | | (4.61) | |
| Less Dividends and Distributions: | | | | | | | | | | | | | | | |
| | Dividends (from net investment income) | | (0.62) | | | (0.42) | | | (0.37) | | | (0.53) | | | (0.50) | |
| Total Dividends and Distributions | | (0.62) | | | (0.42) | | | (0.37) | | | (0.53) | | | (0.50) | |
| Net Asset Value, End of Period | | $36.76 | | | $41.02 | | | $36.57 | | | $31.90 | | | $25.63 | |
| Total Return* | | (8.84)% | | | 13.32% | | | 15.99% | | | 26.76% | | | (15.17)% | |
| Net Assets, End of Period (in thousands) | | $502,240 | | | $570,494 | | | $540,349 | | | $535,223 | | | $483,432 | |
| Average Net Assets for the Period (in thousands) | | $501,246 | | | $567,812 | | | $468,995 | | | $508,303 | | | $587,476 | |
| Ratios to Average Net Assets**: | | | | | | | | | | | | | | | |
| | Ratio of Gross Expenses | | 1.14% | | | 1.12% | | | 1.08% | | | 0.99% | | | 0.85% | |
| | Ratio of Net Expenses (After Waivers and Expense Offsets) | | 1.14% | | | 1.12% | | | 1.08% | | | 0.99% | | | 0.85% | |
| | Ratio of Net Investment Income/(Loss) | | 1.67% | | | 1.14% | | | 0.92% | | | 1.76% | | | 1.46% | |
| Portfolio Turnover Rate | | 36% | | | 21% | | | 21% | | | 23% | | | 25% | |
| | | | | | | | | | | | | | | | | | | |
| |
* Total return includes adjustments in accordance with generally accepted accounting principles required at the year or period end and are not annualized for periods of less than one full year. Total return does not include fees, charges, or expenses imposed by the variable annuity and life insurance contracts for which Janus Aspen Series serves as an underlying investment vehicle. ** Annualized for periods of less than one full year. (1) Per share amounts are calculated based on average shares outstanding during the year or period. |
| | |
See Notes to Financial Statements. |
| |
16 | DECEMBER 31, 2022 |
Janus Henderson VIT Overseas Portfolio
Notes to Financial Statements
1. Organization and Significant Accounting Policies
Janus Henderson VIT Overseas Portfolio (the “Portfolio”) is a series of Janus Aspen Series (the “Trust”), which is organized as a Delaware statutory trust and is registered under the Investment Company Act of 1940, as amended (the “1940 Act”), as an open-end management investment company, and therefore has applied the specialized accounting and reporting guidance in Financial Accounting Standards Board (“FASB”) Accounting Standards Codification (“ASC”) Topic 946. The Trust offers 11 portfolios, each of which offers multiple share classes, with differing investment objectives and policies. The Portfolio seeks long-term growth of capital. The Portfolio is classified as diversified, as defined in the 1940 Act. Janus Henderson Investors US LLC is the investment adviser (the “Adviser”) to the Portfolio.
The Portfolio currently offers two classes of shares: Institutional Shares and Service Shares. Each class represents an interest in the same portfolio of investments. Institutional Shares are offered only in connection with investment in and payments under variable insurance contracts as well as certain qualified retirement plans. Service Shares are offered only in connection with investment in and payments under variable insurance contracts as well as certain qualified retirement plans that require a fee from Portfolio assets to procure distribution and administrative services to contract owners and plan participants.
Shareholders, including participating insurance companies, as well as accounts, may from time to time own (beneficially or of record) a significant percentage of the Portfolio’s Shares and can be considered to “control” the Portfolio when that ownership exceeds 25% of the Portfolio’s assets (and which may differ from control as determined in accordance with United States of America generally accepted accounting principles ("US GAAP")).
The following accounting policies have been followed by the Portfolio and are in conformity with US GAAP.
Investment Valuation
Portfolio holdings are valued in accordance with policies and procedures established by the Adviser pursuant to Rule 2a-5 under the 1940 Act and approved by and subject to the oversight of the Trustees (the “Valuation Procedures”). Equity securities traded on a domestic securities exchange are generally valued at readily available market quotations, which are (i) the official close prices or (ii) last sale prices on the primary market or exchange in which the securities trade. If such price is lacking for the trading period immediately preceding the time of determination, such securities are generally valued at their current bid price. Equity securities that are traded on a foreign exchange are generally valued at the closing prices on such markets. In the event that there is no current trading volume on a particular security in such foreign exchange, the bid price from the primary exchange is generally used to value the security. Foreign securities and currencies are converted to U.S. dollars using the current spot USD dollar exchange rate in effect at the close of the New York Stock Exchange (“NYSE”). The Portfolio will determine the market value of individual securities held by it by using prices provided by one or more approved professional pricing services or, as needed, by obtaining market quotations from independent broker-dealers. Most debt securities are valued in accordance with the evaluated bid price supplied by the Adviser-approved pricing service that is intended to reflect market value. The evaluated bid price supplied by the pricing service is an evaluation that may consider factors such as security prices, yields, maturities and ratings. Certain short-term securities maturing within 60 days or less may be evaluated and valued on an amortized cost basis provided that the amortized cost determined approximates market value. Securities for which market quotations or evaluated prices are not readily available or deemed unreliable are valued at fair value determined in good faith by the Adviser pursuant to the Valuation Procedures. Circumstances in which fair valuation may be utilized include, but are not limited to: (i) a significant event that may affect the securities of a single issuer, such as a merger, bankruptcy, or significant issuer-specific development; (ii) an event that may affect an entire market, such as a natural disaster or significant governmental action; (iii) a nonsignificant event such as a market closing early or not opening, or a security trading halt; and (iv) pricing of a nonvalued security and a restricted or nonpublic security. Special valuation considerations may apply with respect to “odd-lot” fixed-income transactions which, due to their small size, may receive evaluated prices by pricing services which reflect a large block trade and not what actually could be obtained for the odd-lot position. The valuation policies provide for the use of systematic fair valuation models provided by independent pricing services to value foreign equity securities in order to adjust for stale pricing, which may occur between the close of certain foreign exchanges and the close of the NYSE. The value of the securities of other mutual funds held by a Portfolio, if any, will be calculated using the NAV of such mutual funds.
Valuation Inputs Summary
FASB ASC 820, Fair Value Measurements and Disclosures (“ASC 820”), defines fair value, establishes a framework for measuring fair value, and expands disclosure requirements regarding fair value measurements. This standard
Janus Henderson VIT Overseas Portfolio
Notes to Financial Statements
emphasizes that fair value is a market-based measurement that should be determined based on the assumptions that market participants would use in pricing an asset or liability and establishes a hierarchy that prioritizes inputs to valuation techniques used to measure fair value. These inputs are summarized into three broad levels:
Level 1 – Unadjusted quoted prices in active markets the Portfolio has the ability to access for identical assets or liabilities.
Level 2 – Observable inputs other than unadjusted quoted prices included in Level 1 that are observable for the asset or liability either directly or indirectly. These inputs may include quoted prices for the identical instrument on an inactive market, prices for similar instruments, interest rates, prepayment speeds, credit risk, yield curves, default rates and similar data.
Assets or liabilities categorized as Level 2 in the hierarchy generally include: debt securities fair valued in accordance with the evaluated bid or ask prices supplied by a pricing service; securities traded on OTC markets and listed securities for which no sales are reported that are fair valued at the latest bid price (or yield equivalent thereof) obtained from one or more dealers transacting in a market for such securities or by a pricing service approved by the Portfolio’s Trustees; certain short-term debt securities with maturities of 60 days or less that are fair valued at amortized cost; and equity securities of foreign issuers whose fair value is determined by using systematic fair valuation models provided by independent third parties in order to adjust for stale pricing which may occur between the close of certain foreign exchanges and the close of the NYSE. Other securities that may be categorized as Level 2 in the hierarchy include, but are not limited to, preferred stocks, bank loans, swaps, investments in unregistered investment companies, options, and forward contracts.
Level 3 – Unobservable inputs for the asset or liability to the extent that relevant observable inputs are not available, representing the Portfolio’s own assumptions about the assumptions that a market participant would use in valuing the asset or liability, and that would be based on the best information available.
There have been no significant changes in valuation techniques used in valuing any such positions held by the Portfolio since the beginning of the fiscal year.
The inputs or methodology used for fair valuing securities are not necessarily an indication of the risk associated with investing in those securities. The summary of inputs used as of December 31, 2022 to fair value the Portfolio’s investments in securities and other financial instruments is included in the “Valuation Inputs Summary” in the Notes to Schedule of Investments and Other Information.
Investment Transactions and Investment Income
Investment transactions are accounted for as of the date purchased or sold (trade date). Dividend income is recorded on the ex-dividend date. Certain dividends from foreign securities will be recorded as soon as the Portfolio is informed of the dividend, if such information is obtained subsequent to the ex-dividend date. Dividends from foreign securities may be subject to withholding taxes in foreign jurisdictions. Non-cash dividends, if any, are recorded on the ex-dividend date at fair value. Interest income is recorded daily on the accrual basis and includes amortization of premiums and accretion of discounts. The Portfolio classifies gains and losses on prepayments received as an adjustment to interest income. Debt securities may be placed in non-accrual status and related interest income may be reduced by stopping current accruals and writing off interest receivables when collection of all or a portion of interest has become doubtful. Gains and losses are determined on the identified cost basis, which is the same basis used for federal income tax purposes. Income, as well as gains and losses, both realized and unrealized, are allocated daily to each class of shares based upon the ratio of net assets represented by each class as a percentage of total net assets.
Expenses
The Portfolio bears expenses incurred specifically on its behalf. Each class of shares bears a portion of general expenses, which are allocated daily to each class of shares based upon the ratio of net assets represented by each class as a percentage of total net assets. Expenses directly attributable to a specific class of shares are charged against the operations of such class.
Estimates
The preparation of financial statements in conformity with US GAAP requires management to make estimates and assumptions that affect the reported amount of assets and liabilities and disclosure of contingent assets and liabilities at the date of the financial statements, and the reported amounts of income and expenses during the reporting period. Actual results could differ from those estimates.
Janus Henderson VIT Overseas Portfolio
Notes to Financial Statements
Indemnifications
In the normal course of business, the Portfolio may enter into contracts that contain provisions for indemnification of other parties against certain potential liabilities. The Portfolio’s maximum exposure under these arrangements is unknown, and would involve future claims that may be made against the Portfolio that have not yet occurred. Currently, the risk of material loss from such claims is considered remote.
Foreign Currency Translations
The Portfolio does not isolate that portion of the results of operations resulting from the effect of changes in foreign exchange rates on investments from the fluctuations arising from changes in market prices of securities held at the date of the financial statements. Net unrealized appreciation or depreciation of investments and foreign currency translations arise from changes in the value of assets and liabilities, including investments in securities held at the date of the financial statements, resulting from changes in the exchange rates and changes in market prices of securities held.
Currency gains and losses are also calculated on payables and receivables that are denominated in foreign currencies. The payables and receivables are generally related to foreign security transactions and income translations.
Foreign currency-denominated assets and forward currency contracts may involve more risks than domestic transactions, including currency risk, counterparty risk, political and economic risk, regulatory risk and equity risk. Risks may arise from unanticipated movements in the value of foreign currencies relative to the U.S. dollar.
Dividends and Distributions
The Portfolio may make semiannual distributions of substantially all of its investment income and an annual distribution of its net realized capital gains (if any).
The Portfolio may make certain investments in real estate investment trusts (“REITs”) which pay dividends to their shareholders based upon funds available from operations. It is quite common for these dividends to exceed the REITs’ taxable earnings and profits, resulting in the excess portion of such dividends being designated as a return of capital. If the Portfolio distributes such amounts, such distributions could constitute a return of capital to shareholders for federal income tax purposes.
Federal Income Taxes
The Portfolio intends to continue to qualify as a regulated investment company and distribute all of its taxable income in accordance with the requirements of Subchapter M of the Internal Revenue Code. Management has analyzed the Portfolio’s tax positions taken for all open federal income tax years, generally a three-year period, and has concluded that no provision for federal income tax is required in the Portfolio’s financial statements. The Portfolio is not aware of any tax positions for which it is reasonably possible that the total amounts of unrecognized tax benefits will significantly change in the next twelve months.
2. Other Investments and Strategies
Additional Investment Risk
The U.S. government and the Federal Reserve, as well as certain foreign governments and central banks, have taken extraordinary actions to support local and global economies and the financial markets in response to the COVID-19 pandemic. This and other government intervention into the economy and financial markets to address the COVID-19 pandemic may not work as intended, particularly if the efforts are perceived by investors as being unlikely to achieve the desired results. Government actions to mitigate the economic impact of the pandemic have resulted in a large expansion of government deficits and debt, the long term consequences of which are not known. The COVID-19 pandemic could adversely affect the value and liquidity of a Portfolio’s investments, impair a Portfolio’s ability to satisfy redemption requests, and negatively impact a Portfolio’s performance. In addition, the outbreak of COVID-19, and measures taken to mitigate its effects, could result in disruptions to the services provided to a Portfolio by its service providers.
Widespread disease, including pandemics and epidemics, and natural or environmental disasters, including those which may be attributable to global climate change, such as earthquakes, fires, floods, hurricanes, tsunamis and weather-related phenomena generally, have been and can be highly disruptive to economies and markets, adversely impacting individual companies, sectors, industries, markets, currencies, interest and inflation rates, credit ratings, investor sentiment, and other factors affecting the value of a Portfolio’s investments. Economies and financial markets throughout the world have become increasingly interconnected, which increases the likelihood that events or conditions
Janus Henderson VIT Overseas Portfolio
Notes to Financial Statements
in one region or country will adversely affect markets or issuers in other regions or countries, including the United States. These disruptions could prevent a Portfolio from executing advantageous investment decisions in a timely manner and negatively impact a Portfolio’s ability to achieve its investment objective(s). Any such event(s) could have a significant adverse impact on the value of a Portfolio. In addition, these disruptions could also impair the information technology and other operational systems upon which the Portfolio’s service providers, including the Adviser or the subadviser (as applicable), rely, and could otherwise disrupt the ability of employees of the Portfolio’s service providers to perform essential tasks on behalf of the Portfolio. Adverse weather conditions may also have a particularly significant negative effect on issuers in the agricultural sector and on insurance and reinsurance companies that insure or reinsure against the impact of natural disasters.
A number of countries in the European Union (the “EU”) have experienced, and may continue to experience, severe economic and financial difficulties. In particular, many EU nations are susceptible to economic risks associated with high levels of debt. Many non-governmental issuers, and even certain governments, have defaulted on, or been forced to restructure, their debts. Many other issuers have faced difficulties obtaining credit or refinancing existing obligations. Financial institutions have in many cases required government or central bank support, have needed to raise capital, and/or have been impaired in their ability to extend credit. As a result, financial markets in the EU have experienced extreme volatility and declines in asset values and liquidity. These difficulties may continue, worsen, or spread further within the EU. Responses to these financial problems by European governments, central banks, and others, including austerity measures and reforms, may not work, may result in social unrest, and may limit future growth and economic recovery or have other unintended consequences. Among other things, these developments have adversely affected the value and exchange rate of the euro and pound sterling, and may continue to significantly affect the economies of all EU countries, which in turn may have a material adverse effect on the Portfolio’s investments in such countries, other countries that depend on EU countries for significant amounts of trade or investment, or issuers with exposure to debt issued by certain EU countries.
Emerging Market Investing
Within the parameters of its specific investment policies, the Portfolio may invest in securities of issuers or companies from or with exposure to one or more “developing countries” or “emerging market countries.” Such countries include but are not limited to countries included in the MSCI Emerging Markets IndexSM. Emerging market countries in which the Portfolio may invest include frontier market countries, the economies of which are less developed than other emerging market countries. To the extent that the Portfolio invests a significant amount of its assets in one or more of these countries, its returns and net asset value may be affected to a large degree by events and economic conditions in such countries. The risks of foreign investing are heightened when investing in emerging markets, which may result in the price of investments in emerging markets experiencing sudden and sharp price swings. In many developing markets, there is less government supervision and regulation of stock exchanges, brokers, and listed companies, making these investments potentially more volatile in price and less liquid than investments in developed securities markets, resulting in greater risk to investors. Similarly, issuers in such markets may not be subject to regulatory, accounting, auditing, and financial reporting and recordkeeping standards comparable to those to which U.S. companies are subject. There is a risk in developing countries that a current or future economic or political crisis could lead to price controls, forced mergers of companies, expropriation or confiscatory taxation, imposition or enforcement of foreign ownership limits, seizure, nationalization, sanctions or imposition of restrictions by various governmental entities on investment and trading, or creation of government monopolies, any of which may have a detrimental effect on the Portfolio’s investments. In addition, the Portfolio’s investments may be denominated in foreign currencies and therefore, changes in the value of a country’s currency compared to the U.S. dollar may affect the value of the Portfolio’s investments. To the extent that the Portfolio invests a significant portion of its assets in the securities of issuers in or companies of a single country or region, it is more likely to be impacted by events or conditions affecting that country or region, which could have a negative impact on the Portfolio’s performance. Developing countries may also experience a higher level of exposure and vulnerability to the adverse effects of climate change. This can be attributed to both the geographic location of emerging market countries and/or a country’s lack of access to technology or resources to adjust and adapt to its effects. An increased occurrence and severity of natural disasters and extreme weather events such as droughts and decreased crop yields, heat waves, flooding and rising sea levels, and increased spread of disease, could cause harmful effects to the performance of affected economies. Additionally, foreign and emerging market risks, including, but not limited to, price controls, expropriation or confiscatory taxation, imposition or enforcement of foreign ownership limits, nationalization, and restrictions on repatriation of assets may be heightened to the extent the Portfolio invests in Chinese local market securities.
Janus Henderson VIT Overseas Portfolio
Notes to Financial Statements
Counterparties
Portfolio transactions involving a counterparty are subject to the risk that the counterparty or a third party will not fulfill its obligation to the Portfolio (“counterparty risk”). Counterparty risk may arise because of the counterparty’s financial condition (i.e., financial difficulties, bankruptcy, or insolvency), market activities and developments, or other reasons, whether foreseen or not. A counterparty’s inability to fulfill its obligation may result in significant financial loss to the Portfolio. The Portfolio may be unable to recover its investment from the counterparty or may obtain a limited recovery, and/or recovery may be delayed. The extent of the Portfolio’s exposure to counterparty risk with respect to financial assets and liabilities approximates its carrying value. See the "Offsetting Assets and Liabilities" section of this Note for further details.
The Portfolio may be exposed to counterparty risk through participation in various programs, including, but not limited to, lending its securities to third parties, cash sweep arrangements whereby the Portfolio’s cash balance is invested in one or more types of cash management vehicles, as well as investments in, but not limited to, repurchase agreements, debt securities, and derivatives, including various types of swaps, futures and options. The Portfolio intends to enter into financial transactions with counterparties that the Adviser believes to be creditworthy at the time of the transaction. There is always the risk that the Adviser’s analysis of a counterparty’s creditworthiness is incorrect or may change due to market conditions. To the extent that the Portfolio focuses its transactions with a limited number of counterparties, it will have greater exposure to the risks associated with one or more counterparties.
Securities Lending
Under procedures adopted by the Trustees, the Portfolio may seek to earn additional income by lending securities to certain qualified broker-dealers and institutions. JPMorgan Chase Bank, National Association acts as securities lending agent and a limited purpose custodian or subcustodian to receive and disburse cash balances and cash collateral, hold short-term investments, hold collateral, and perform other custodial functions in accordance with the Non-Custodial Securities Lending Agreement. For financial reporting purposes, the Portfolio does not offset financial instruments’ payables and receivables and related collateral on the Statement of Assets and Liabilities. The Portfolio may lend portfolio securities in an amount equal to up to 1/3 of its total assets as determined at the time of the loan origination. There is the risk of delay in recovering a loaned security or the risk of loss in collateral rights if the borrower fails financially. In addition, the Adviser makes efforts to balance the benefits and risks from granting such loans. All loans will be continuously secured by collateral which may consist of cash, U.S. Government securities, domestic and foreign short-term debt instruments, letters of credit, time deposits, repurchase agreements, money market mutual funds or other money market accounts, or such other collateral as permitted by the Securities and Exchange Commission (the "SEC"). If the Portfolio is unable to recover a security on loan, the Portfolio may use the collateral to purchase replacement securities in the market. There is a risk that the value of the collateral could decrease below the cost of the replacement security by the time the replacement investment is made, resulting in a loss to the Portfolio. In certain circumstances individual loan transactions could yield negative returns.
Upon receipt of cash collateral, the Adviser may invest it in affiliated or non-affiliated cash management vehicles, whether registered or unregistered entities, as permitted by the 1940 Act and rules promulgated thereunder. The Adviser currently intends to primarily invest the cash collateral in a cash management vehicle for which the Adviser serves as investment adviser, Janus Henderson Cash Collateral Fund LLC, or in time deposits. An investment in Janus Henderson Cash Collateral Fund LLC is generally subject to the same risks that shareholders experience when investing in similarly structured vehicles, such as the potential for significant fluctuations in assets as a result of the purchase and redemption activity of the securities lending program, a decline in the value of the collateral, and possible liquidity issues. Such risks may delay the return of the cash collateral and cause the Portfolio to violate its agreement to return the cash collateral to a borrower in a timely manner. As adviser to the Portfolio and Janus Henderson Cash Collateral Fund LLC, the Adviser has an inherent conflict of interest as a result of its fiduciary duties to both the Portfolio and Janus Henderson Cash Collateral Fund LLC. Additionally, the Adviser receives an investment advisory fee of 0.05% for managing Janus Henderson Cash Collateral Fund LLC, but it may not receive a fee for managing certain other affiliated cash management vehicles in which the Portfolio may invest, and therefore may have an incentive to allocate preferred investment opportunities to investment vehicles for which it is receiving a fee.
The value of the collateral must be at least 102% of the market value of the loaned securities that are denominated in U.S. dollars and 105% of the market value of the loaned securities that are not denominated in U.S. dollars. Loaned securities and related collateral are marked-to-market each business day based upon the market value of the loaned securities at the close of business, employing the most recent available pricing information. Collateral levels are then
Janus Henderson VIT Overseas Portfolio
Notes to Financial Statements
adjusted based on this mark-to-market evaluation. Additional required collateral, or excess collateral returned, is delivered on the next business day. Therefore, the value of the collateral held may be temporarily less than 102% or 105% value of the securities on loan. The cash collateral invested by the Adviser is disclosed in the Schedule of Investments (if applicable).
Income earned from the investment of the cash collateral, net of rebates paid to, or fees paid by, borrowers and less the fees paid to the lending agent are included as “Affiliated securities lending income, net” on the Statement of Operations.
There were no securities on loan as of December 31, 2022.
3. Investment Advisory Agreements and Other Transactions with Affiliates
The Portfolio pay the Adviser an investment advisory fee rate that may adjust up or down based on the Portfolio’s performance relative to its benchmark index.
The investment advisory fee rate paid to the Adviser by the Portfolio consists of two components: (1) a base fee calculated by applying the contractual fixed rate of the advisory fee to the Portfolio’s average daily net assets during the previous month (the “Base Fee Rate”), plus or minus (2) a performance-fee adjustment (the “Performance Adjustment”) calculated by applying a variable rate of up to 0.15% (positive or negative) to the Portfolio’s average daily net assets based on the Portfolio’s relative performance compared to the cumulative investment record of its benchmark index over a 36-month performance measurement period or shorter time period, as applicable. The investment advisory fee rate is calculated daily and paid monthly.
The investment performance of the Portfolio’s Service Shares for the performance measurement period is used to calculate the Performance Adjustment. The Portfolio’s Base Fee Rate prior to any performance adjustment (expressed as an annual rate) is 0.64%, and the Portfolio’s benchmark index used in the calculation is the MSCI All Country World ex-USA IndexSM.
No Performance Adjustment is applied unless the difference between the Portfolio’s investment performance and the cumulative investment record of the Portfolio’s benchmark index is 0.50% or greater (positive or negative) during the applicable performance measurement period. The Base Fee Rate is subject to an upward or downward Performance Adjustment for every full 0.50% increment by which the Portfolio outperforms or underperforms its benchmark index, up to the Portfolio’s full performance rate of ±7.00%. Because the Performance Adjustment is tied to a Portfolio’s relative performance compared to its benchmark index (and not its absolute performance), the Performance Adjustment could increase the Adviser’s fee even if the Portfolio’s Shares lose value during the performance measurement period and could decrease the Adviser’s fee even if the Portfolio’s Shares increase in value during the performance measurement period. For purposes of computing the Base Fee Rate and the Performance Adjustment, net assets are averaged over different periods (average daily net assets during the previous month for the Base Fee Rate, versus average daily net assets during the performance measurement period for the Performance Adjustment). Performance of the Portfolio is calculated net of expenses whereas the Portfolio’s benchmark index does not have any fees or expenses. Reinvestment of dividends and distributions is included in calculating both the performance of a Portfolio and the Portfolio’s benchmark index.
The Portfolio’s prospectuses and statement(s) of additional information contain additional information about performance-based fees. The amount shown as advisory fees on the Statement of Operations reflects the Base Fee Rate plus/minus any Performance Adjustment. For the year ended December 31, 2022, the performance adjusted investment advisory fee rate before any waivers and/or reimbursements of expenses is 0.79%.
The Adviser serves as administrator to the Portfolio pursuant to an administration agreement between the Adviser and the Trust. Under the administration agreement, the Adviser is authorized to perform, or cause others to perform certain administration, compliance, and accounting services to the Portfolio, including providing office space for the Portfolio, and is reimbursed by the Portfolio for certain of its costs in providing these services (to the extent the Adviser seeks reimbursement and such costs are not otherwise waived). In addition, employees of the Adviser and/or its affiliates may serve as officers of the Trust. The Portfolio pays for some or all of the salaries, fees, and expenses of the Adviser employees and Portfolio officers, with respect to certain specified administration functions they perform on behalf of the Portfolio. The Portfolio pays these costs based on out-of-pocket expenses incurred by the Adviser, and these costs are separate and apart from advisory fees and other expenses paid in connection with the investment advisory services the Adviser (or any subadvisor, as applicable) provides to the Portfolio. These amounts are disclosed as “Affiliated portfolio administration fees” on the Statement of Operations. In addition, some expenses related to compensation payable to the
Janus Henderson VIT Overseas Portfolio
Notes to Financial Statements
Portfolio’s Chief Compliance Officer and certain compliance staff, all of whom are employees of the Adviser and/or its affiliates, are shared with the Portfolio. Total compensation of $48,451 was paid to the Chief Compliance Officer and certain compliance staff by the Trust during the year ended December 31, 2022. The Portfolio's portion is reported as part of “Other expenses” on the Statement of Operations.
Janus Henderson Services US LLC (the “Transfer Agent”), a wholly-owned subsidiary of the Adviser, is the Portfolio’s transfer agent. The Transfer Agent receives an administrative services fee at an annual rate of 0.05% of the average daily net assets of the Portfolio for arranging for the provision by participating insurance companies and qualified plan service providers of administrative services, including, but not limited to, recordkeeping, subaccounting, answering inquiries regarding accounts, order processing, transaction confirmations, the mailing of prospectuses and shareholder reports, and other shareholder services provided on behalf of contract holders or plan participants investing in the Portfolio. The Transfer Agent expects to use this entire fee to compensate insurance companies and qualified plan service providers for providing these services to their customers who invest in the Portfolio.
The Transfer Agent is not compensated for internal services related to the shares, except for out-of-pocket costs. These amounts are disclosed as “Other transfer agent fees and expenses” on the Statement of Operations.
Under a distribution and shareholder servicing plan (the “Plan”) adopted in accordance with Rule 12b-1 under the 1940 Act, the Service Shares may pay the Trust’s distributor, Janus Henderson Distributors US LLC (the “Distributor”), a wholly-owned subsidiary of the Adviser, a fee for the sale and distribution and/or shareholder servicing of the Service Shares at an annual rate of up to 0.25% of the average daily net assets of the Service Shares. Under the terms of the Plan, the Trust is authorized to make payments to the Distributor for remittance to insurance companies and qualified plan service providers as compensation for distribution and/or shareholder services performed by such entities. These amounts are disclosed as “12b-1 Distribution and shareholder servicing fees” on the Statement of Operations.
The Board of Trustees has adopted a deferred compensation plan (the “Deferred Plan”) for independent Trustees to elect to defer receipt of all or a portion of the annual compensation they are entitled to receive from the Portfolio. All deferred fees are credited to an account established in the name of the Trustees. The amounts credited to the account then increase or decrease, as the case may be, in accordance with the performance of one or more of the Janus Henderson funds that are selected by the Trustees. The account balance continues to fluctuate in accordance with the performance of the selected fund or funds until final payment of all amounts are credited to the account. The fluctuation of the account balance is recorded by the Portfolio as unrealized appreciation/(depreciation) and is included as of December 31, 2022 on the Statement of Assets and Liabilities in the asset, “Trustees’ deferred compensation,” and liability, “Trustees’ deferred compensation fees.” Additionally, the recorded unrealized appreciation/(depreciation) is included in “Total distributable earnings (loss)” on the Statement of Assets and Liabilities. Deferred compensation expenses for the year ended December 31, 2022 are included in “Trustees’ fees and expenses” on the Statement of Operations. Trustees are allowed to change their designation of mutual funds from time to time. Amounts will be deferred until distributed in accordance with the Deferred Plan. Deferred fees of $433,851 were paid by the Trust to the Trustees under the Deferred Plan during the year ended December 31, 2022.
Pursuant to the provisions of the 1940 Act and related rules, the Portfolio may participate in an affiliated or non-affiliated cash sweep program. In the cash sweep program, uninvested cash balances of the Portfolio may be used to purchase shares of affiliated or non-affiliated money market funds or cash management pooled investment vehicles that operate as money market funds. The Portfolio is eligible to participate in the cash sweep program (the “Investing Funds”). The Adviser has an inherent conflict of interest because of its fiduciary duties to the affiliated money market funds or cash management pooled investment vehicles and the Investing Funds. Janus Henderson Cash Liquidity Fund LLC (the “Sweep Vehicle”) is an affiliated unregistered cash management pooled investment vehicle that invests primarily in highly-rated short-term fixed-income securities. The Sweep Vehicle operates pursuant to the provisions of the 1940 Act that govern the operation of money market funds and prices its shares at NAV reflecting market-based values of its portfolio securities (i.e., a “floating” NAV) rounded to the fourth decimal place (e.g., $1.0000). The Sweep Vehicle is permitted to impose a liquidity fee (of up to 2%) on redemptions from the Sweep Vehicle or a redemption gate that temporarily suspends redemptions from the Sweep Vehicle for up to 10 business days during a 90 day period. There are no restrictions on the Portfolio's ability to withdraw investments from the Sweep Vehicle at will, and there are no unfunded capital commitments due from the Portfolio to the Sweep Vehicle. The Sweep Vehicle does not charge any management fee, sales charge or service fee.
Janus Henderson VIT Overseas Portfolio
Notes to Financial Statements
Any purchases and sales, realized gains/losses and recorded dividends from affiliated investments during the year ended December 31, 2022 can be found in the “Schedules of Affiliated Investments” located in the Schedule of Investments.
4. Federal Income Tax
The tax components of capital shown in the table below represent: (1) distribution requirements the Portfolio must satisfy under the income tax regulations; (2) losses or deductions the Portfolio may be able to offset against income and gains realized in future years; and (3) unrealized appreciation or depreciation of investments for federal income tax purposes (reduced by foreign tax liability).
Other book to tax differences primarily consist of deferred compensation. The Portfolio has elected to treat gains and losses on forward foreign currency contracts as capital gains and losses, if applicable. Other foreign currency gains and losses on debt instruments are treated as ordinary income for federal income tax purposes pursuant to Section 988 of the Internal Revenue Code.
| | | | | | | |
| | | | Other Book | Net Tax | |
Undistributed
Ordinary Income | Undistributed
Long-Term Gains | Accumulated
Capital Losses | Loss Deferrals | to Tax
Differences | Appreciation/
(Depreciation) | |
$ 2,014,984 | $ - | $(221,851,535) | $ - | $ (74,813) | $112,348,296 | |
Accumulated capital losses noted below represent net capital loss carryovers, as of December 31, 2022, that may be available to offset future realized capital gains and thereby reduce future taxable gains distributions. The following table shows these capital loss carryovers.
| | | | | | |
| | | | | |
Capital Loss Carryover Schedule | | |
For the year ended December 31, 2022 | | |
| No Expiration | | | |
| Short-Term | Long-Term | Accumulated
Capital Losses | | |
| $(58,436,969) | $(163,414,566) | $ (221,851,535) | | |
During the year ended December 31, 2022, capital loss carryovers of $13,737,997 were utilized by the Portfolio.
The aggregate cost of investments and the composition of unrealized appreciation and depreciation of investment securities for federal income tax purposes as of December 31, 2022 are noted below. The primary difference between book and tax appreciation or depreciation of investments are wash sale loss deferrals and investments in partnerships.
| | | | |
Federal Tax Cost | Unrealized
Appreciation | Unrealized
(Depreciation) | Net Tax Appreciation/
(Depreciation) |
$ 534,489,258 | $135,286,728 | $(23,023,747) | $ 112,262,981 |
Janus Henderson VIT Overseas Portfolio
Notes to Financial Statements
Income and capital gains distributions are determined in accordance with income tax regulations that may differ from US GAAP. These differences are due to differing treatments for items such as net short-term gains, deferral of wash sale losses, foreign currency transactions, and capital loss carryovers. Certain permanent differences such as tax returns of capital and net investment losses noted below have been reclassified to capital.
| | | | | |
For the year ended December 31, 2022 | |
Distributions | | |
From Ordinary Income | From Long-Term Capital Gains | Tax Return of Capital | Net Investment Loss | |
$ 11,055,545 | $ - | $ - | $ - | |
| | | | | |
For the year ended December 31, 2021 | |
Distributions | | |
From Ordinary Income | From Long-Term Capital Gains | Tax Return of Capital | Net Investment Loss | |
$ 7,754,618 | $ - | $ - | $ - | |
Permanent book to tax basis differences may result in reclassifications between the components of net assets. These differences have no impact on the results of operations or net assets.
5. Capital Share Transactions
| | | | | | | |
| | | | | | |
| | Year ended December 31, 2022 | | Year ended December 31, 2021 |
| | Shares | Amount | | Shares | Amount |
| | | | | | | |
Institutional Shares: | | | | | |
Shares sold | 320,989 | $12,280,717 | | 363,203 | $ 15,114,342 |
Reinvested dividends and distributions | 67,848 | 2,571,849 | | 45,156 | 1,925,877 |
Shares repurchased | (601,297) | (23,253,937) | | (604,659) | (25,189,881) |
Net Increase/(Decrease) | (212,460) | $ (8,401,371) | | (196,300) | $ (8,149,662) |
Service Shares: | | | | | |
Shares sold | 1,365,030 | $49,728,351 | | 1,115,065 | $ 44,799,979 |
Reinvested dividends and distributions | 234,363 | 8,483,696 | | 142,890 | 5,828,741 |
Shares repurchased | (1,842,484) | (67,841,333) | | (2,126,505) | (84,720,884) |
Net Increase/(Decrease) | (243,091) | $ (9,629,286) | | (868,550) | $(34,092,164) |
6. Purchases and Sales of Investment Securities
For the year ended December 31, 2022, the aggregate cost of purchases and proceeds from sales of investment securities (excluding any short-term securities, short-term options contracts, TBAs, and in-kind transactions, as applicable) was as follows:
| | | | |
Purchases of
Securities | Proceeds from Sales
of Securities | Purchases of Long-
Term U.S. Government
Obligations | Proceeds from Sales
of Long-Term U.S.
Government Obligations |
$233,628,637 | $ 254,624,118 | $ - | $ - |
7. Subsequent Event
Management has evaluated whether any events or transactions occurred subsequent to December 31, 2022 and through the date of issuance of the Portfolio’s financial statements and determined that there were no material events or transactions that would require recognition or disclosure in the Portfolio’s financial statements.
Janus Henderson VIT Overseas Portfolio
Report of Independent Registered Public Accounting Firm
To the Board of Trustees of Janus Aspen Series and Shareholders of Janus Henderson VIT Overseas Portfolio
Opinion on the Financial Statements
We have audited the accompanying statement of assets and liabilities, including the schedule of investments, of Janus Henderson VIT Overseas Portfolio (one of the portfolios constituting Janus Aspen Series, referred to hereafter as the "Portfolio") as of December 31, 2022, the related statement of operations for the year ended December 31, 2022, the statements of changes in net assets for each of the two years in the period ended December 31, 2022, including the related notes, and the financial highlights for each of the five years in the period ended December 31, 2022 (collectively referred to as the “financial statements”). In our opinion, the financial statements present fairly, in all material respects, the financial position of the Portfolio as of December 31, 2022, the results of its operations for the year then ended, the changes in its net assets for each of the two years in the period ended December 31, 2022 and the financial highlights for each of the five years in the period ended December 31, 2022 in conformity with accounting principles generally accepted in the United States of America.
Basis for Opinion
These financial statements are the responsibility of the Portfolio’s management. Our responsibility is to express an opinion on the Portfolio’s financial statements based on our audits. We are a public accounting firm registered with the Public Company Accounting Oversight Board (United States) (PCAOB) and are required to be independent with respect to the Portfolio in accordance with the U.S. federal securities laws and the applicable rules and regulations of the Securities and Exchange Commission and the PCAOB.
We conducted our audits of these financial statements in accordance with the standards of the PCAOB. Those standards require that we plan and perform the audit to obtain reasonable assurance about whether the financial statements are free of material misstatement, whether due to error or fraud.
Our audits included performing procedures to assess the risks of material misstatement of the financial statements, whether due to error or fraud, and performing procedures that respond to those risks. Such procedures included examining, on a test basis, evidence regarding the amounts and disclosures in the financial statements. Our audits also included evaluating the accounting principles used and significant estimates made by management, as well as evaluating the overall presentation of the financial statements. Our procedures included confirmation of securities owned as of December 31, 2022 by correspondence with the custodian and brokers; when replies were not received from brokers, we performed other auditing procedures. We believe that our audits provide a reasonable basis for our opinion.

Denver, Colorado
February 15, 2023
We have served as the auditor of one or more investment companies in Janus Henderson Funds since 1990.
Janus Henderson VIT Overseas Portfolio
Additional Information (unaudited)
Proxy Voting Policies and Voting Record
A description of the policies and procedures that the Portfolio uses to determine how to vote proxies relating to its portfolio securities is available without charge: (i) upon request, by calling 1-800-525-1093; (ii) on the Portfolio’s website at janushenderson.com/proxyvoting; and (iii) on the SEC’s website at http://www.sec.gov. Additionally, information regarding the Portfolio’s proxy voting record for the most recent twelve-month period ended June 30 is also available, free of charge, through janushenderson.com/proxyvoting and from the SEC’s website at http://www.sec.gov.
Full Holdings
The Portfolio files its complete portfolio holdings (schedule of investments) with the SEC as an exhibit to Form N-PORT within 60 days of the end of the first and third fiscal quarters, and in the annual report and semiannual report to shareholders. The Portfolio’s Form N-PORT filings and annual and semiannual reports: (i) are available on the SEC’s website at http://www.sec.gov; and (ii) are available without charge, upon request, by calling a Janus Henderson representative at 1-877-335-2687 (toll free). Portfolio holdings consisting of at least the names of the holdings are generally available on a monthly basis with a 30-day lag under Full Holdings for the Portfolio at janushenderson.com/vit.
APPROVAL OF ADVISORY AGREEMENTS DURING THE PERIOD
The Trustees of Janus Aspen Series, each of whom serves as an “independent” Trustee (the “Trustees”), oversee the management of each portfolio of Janus Aspen Series (each, a “VIT Portfolio,” and collectively, the “VIT Portfolios”), as well as each fund of Janus Investment Fund (each, a “Fund,” and collectively, the “Funds” and together with the VIT Portfolios, the “Janus Henderson Funds,” and each, a “Janus Henderson Fund”). As required by law, the Trustees determine annually whether to continue the investment advisory agreement for each Janus Henderson Fund.
In connection with their most recent consideration of those agreements for each Janus Henderson Fund, the Trustees received and reviewed information provided by Janus Henderson Investors US LLC (the “Adviser”) in response to requests of the Trustees and their independent legal counsel. They also received and reviewed information and analysis provided by, and in response to requests of, their independent fee consultant. Throughout their consideration of the agreements, the Trustees were advised by their independent legal counsel. The Trustees met with management to consider the agreements, and also met separately in executive session with their independent legal counsel and their independent fee consultant.
At meetings held on November 9-10, 2022 and December 13-14, 2022, the Trustees evaluated the information provided by the Adviser and the independent fee consultant, as well as other information provided by the Adviser and the independent fee consultant during the year. Following such evaluation, the Trustees determined that the overall arrangements between each Janus Henderson Fund and the Adviser were fair and reasonable in light of the nature, extent, and quality of the services provided by the Adviser and its affiliates, the fees charged for those services, and other matters that the Trustees considered relevant in the exercise of their business judgment, and unanimously approved the continuation of the investment advisory agreement for each Janus Henderson Fund for the period from February 1, 2023 through February 1, 2024, subject to earlier termination as provided for in each agreement.
In considering the continuation of those agreements, the Trustees reviewed and analyzed various factors that they determined were relevant, including the factors described below, none of which by itself was considered dispositive. However, the material factors and conclusions that formed the basis for the Trustees’ determination to approve the continuation of the agreements are discussed separately below. Also included is a summary of the independent fee consultant’s conclusions and opinions that arose during, and were included as part of, the Trustees’ consideration of the agreements. “Management fees,” as used herein, reflect actual annual advisory fees and, for the purpose of peer comparisons any administration fees (excluding out of pocket costs), net of any waivers, paid by a fund as a percentage of average net assets.
Nature, Extent and Quality of Services
The Trustees reviewed the nature, extent, and quality of the services provided by the Adviser to the Janus Henderson Funds, taking into account the investment objective, strategies, and policies of each Janus Henderson Fund, and the knowledge the Trustees gained from their regular meetings with management on at least a quarterly basis and their ongoing review of information related to the Janus Henderson Funds. In addition, the Trustees reviewed the resources and key personnel of the Adviser, particularly noting those employees who provide investment and risk management services to the Janus Henderson Funds. The Trustees also considered other services provided to the Janus Henderson Funds by the Adviser, such as managing the execution of portfolio transactions and the selection of broker-dealers for
Janus Henderson VIT Overseas Portfolio
Additional Information (unaudited)
those transactions. The Trustees considered the Adviser’s role as administrator to the Janus Henderson Funds, noting that the Adviser generally does not receive a fee for its services as administrator, but is reimbursed for its out-of-pocket costs. The Trustees considered the role of the Adviser in monitoring adherence to the Janus Henderson Funds’ investment restrictions, providing support services for the Trustees and Trustee committees, and overseeing communications with Janus Henderson Fund shareholders and the activities of other service providers, including monitoring compliance with various policies and procedures of the Janus Henderson Funds and with applicable securities laws and regulations.
In this regard, the independent fee consultant noted that the Adviser provides a number of different services for the Janus Henderson Funds and their shareholders, ranging from investment management services to various other servicing functions, and that, in its view, the Adviser is a capable provider of those services. The independent fee consultant also provided its belief that the Adviser has developed a number of institutional competitive advantages that should enable it to provide superior investment and service performance over the long term.
The Trustees concluded that the nature, extent, and quality of the services provided by the Adviser to each Janus Henderson Fund were appropriate and consistent with the terms of the respective advisory agreements, and that, taking into account steps taken to address those Janus Henderson Funds whose performance lagged that of their peers for certain periods, the Janus Henderson Funds were likely to benefit from the continued provision of those services. They also concluded that the Adviser had sufficient personnel, with the appropriate education and experience, to serve the Janus Henderson Funds effectively and had demonstrated its ability to attract well-qualified personnel.
Performance of the Funds
The Trustees considered the performance results of each Janus Henderson Fund over various time periods. They noted that they considered Janus Henderson Fund performance data throughout the year, including periodic meetings with each Janus Henderson Fund’s portfolio manager(s), and also reviewed information comparing each Janus Henderson Fund’s performance with the performance of comparable fund peer groups identified by Broadridge Financial Solutions, Inc. (“Broadridge”), an independent data provider, and with the Janus Henderson Fund’s benchmark index. In this regard, the independent fee consultant found that the overall Janus Henderson Funds’ performance has been reasonable, noting that: (i) for the 36 months ended May 31, 2022, approximately 38% of the Janus Henderson Funds were in the top two quartiles of their Broadridge peer groups; (ii) for the 36 months ended September 30, 2022, approximately 45% of the Janus Henderson Funds were in the top two quartiles of performance as reported by Morningstar, and (iii) for the 12 months ended September 30, 2022, approximately 55% of the Janus Henderson Funds were in the top two quartiles of performance as reported by Morningstar.
The Trustees considered the performance of each Janus Henderson Fund, noting that performance may vary by share class, and noted the following with respect to the VIT Portfolios:
· For Janus Henderson Adaptive Risk Managed U.S. Equity Portfolio, the Trustees noted that the VIT Portfolio’s performance was in the bottom Broadridge quartile for the 36 months ended May 31, 2022 and the first Broadridge quartile for the 12 months ended May 31, 2022. The Trustees noted the reasons for the VIT Portfolio’s underperformance and the steps the Adviser had taken or was taking to improve performance, and that the performance trend was improving.
· For Janus Henderson Balanced Portfolio, the Trustees noted that the VIT Portfolio’s performance was in the first Broadridge quartile for the 36 months ended May 31, 2022 and the first Broadridge quartile for the 12 months ended May 31, 2022.
· For Janus Henderson Enterprise Portfolio, the Trustees noted that the VIT Portfolio’s performance was in the third Broadridge quartile for the 36 months ended May 31, 2022 and the first Broadridge quartile for the 12 months ended May 31, 2022 The Trustees noted the reasons for the VIT Portfolio’s underperformance and the steps the Adviser had taken or was taking to improve performance, and that the performance trend was improving.
· For Janus Henderson Flexible Bond Portfolio, the Trustees noted that the VIT Portfolio’s performance was in the first Broadridge quartile for the 36 months ended May 31, 2022 and the first Broadridge quartile for the 12 months ended May 31, 2022.
Janus Henderson VIT Overseas Portfolio
Additional Information (unaudited)
· For Janus Henderson Forty Portfolio, the Trustees noted that the VIT Portfolio’s performance was in the second Broadridge quartile for the 36 months ended May 31, 2022 and the third Broadridge quartile for the 12 months ended May 31, 2022.
· For Janus Henderson Global Research Portfolio, the Trustees noted that the VIT Portfolio’s performance was in the first Broadridge quartile for the 36 months ended May 31, 2022 and the first Broadridge quartile for the 12 months ended May 31, 2022.
· For Janus Henderson Global Sustainable Equity Portfolio, the Trustees noted that the VIT Portfolio’s performance was in the bottom Broadridge quartile for the evaluated performance period ended May 31, 2022. The Trustees noted that 36 month-end performance was not yet available.
· For Janus Henderson Global Technology and Innovation Portfolio, the Trustees noted that the VIT Portfolio’s performance was in the second Broadridge quartile for the 36 months ended May 31, 2022 and the third Broadridge quartile for the 12 months ended May 31, 2022.
· For Janus Henderson Mid Cap Value Portfolio, the Trustees noted that the VIT Portfolio’s performance was in the bottom Broadridge quartile for the 36 months ended May 31, 2022 and the second Broadridge quartile for the 12 months ended May 31, 2022. The Trustees noted the reasons for the VIT Portfolio’s underperformance, while also noting that the VIT Portfolio has a performance fee structure that results in lower management fees during periods of underperformance, the steps the Adviser had taken or was taking to improve performance, and that the performance trend was improving.
· For Janus Henderson Overseas Portfolio, the Trustees noted that the VIT Portfolio’s performance was in the first Broadridge quartile for the 36 months ended May 31, 2022 and the first Broadridge quartile for the 12 months ended May 31, 2022.
· For Janus Henderson Research Portfolio, the Trustees noted that the VIT Portfolio’s performance was in the second Broadridge quartile for the 36 months ended May 31, 2022 and the second Broadridge quartile for the 12 months ended May 31, 2022.
In consideration of each Janus Henderson Fund’s performance, the Trustees concluded that, taking into account the factors relevant to performance, as well as other considerations, including steps taken to improve performance, as applicable, the Janus Henderson Fund’s performance warranted continuation of such Janus Henderson Fund’s investment advisory agreement.
Costs of Services Provided
The Trustees examined information regarding the fees and expenses of each Janus Henderson Fund in comparison to similar information for other comparable funds as provided by Broadridge, an independent data provider. They also reviewed an analysis of that information provided by their independent fee consultant. The independent fee consultant provided its belief that the management fees charged by the Adviser to each of the Janus Henderson Funds under the current investment advisory and administration agreements are reasonable in relation to the services provided by the Adviser. The independent fee consultant found: (1) the total expenses and management fees of the Janus Henderson Funds to be reasonable relative to other comparable mutual funds; (2) the total expenses, on average, were 6% under the average total expenses of the respective Broadridge peer group; and (3) the management fees for the Janus Henderson Funds, on average, were 5% under the average management fees for the respective Broadridge peer group. The Trustees also considered the total expenses for each share class of each Janus Henderson Fund compared to the average total expenses for its Broadridge Expense Group and to average total expenses for its Broadridge Expense Universe.
For Janus Henderson Funds with three or more years of performance history, the independent fee consultant also performed a systematic “focus list” analysis of expenses which assessed fund fees in the context of fund performance being delivered. Based on this analysis, the independent fee consultant found that the combination of service quality/performance and expenses on these individual Janus Henderson Funds was reasonable in light of performance trends, performance histories, changes in portfolio management, relative average net asset levels, and the existence of performance fees, breakpoints, and/or expense waivers on such Janus Henderson Funds.
Janus Henderson VIT Overseas Portfolio
Additional Information (unaudited)
The Trustees considered the methodology used by the Adviser in determining compensation payable to portfolio managers, the competitive environment for investment management talent, and the competitive market for mutual funds in different distribution channels.
The Trustees also reviewed management fees charged by the Adviser to comparable separate account clients and to comparable non-affiliated funds subadvised by the Adviser (for which the Adviser provides only or primarily portfolio management services). Although in most instances subadvisory and separate account fee rates for various investment strategies were lower than management fee rates for Janus Henderson Funds having a similar strategy, the Trustees considered that the Adviser noted that, under the terms of the management agreements with the Janus Henderson Funds, the Adviser performs significant additional services for the Janus Henderson Funds that it does not provide to those other clients, including administration services, oversight of the Janus Henderson Funds’ other service providers, Trustee support, regulatory compliance and numerous other services, and that, in serving the Janus Henderson Funds, the Adviser assumes many legal risks and other costs that it does not assume in servicing its other clients. Moreover, the Trustees noted that the independent fee consultant found that: (1) the management fees the Adviser charges to the Janus Henderson Funds are reasonable in relation to the management fees the Adviser charges to funds subadvised by the Adviser and to the fees the Adviser charges to its institutional separate account clients; (2) these subadvised and institutional separate accounts have different service and infrastructure needs and operate in markets very different from the retail fund market; (3) Janus Henderson mutual fund investors enjoy reasonable fees relative to the fees charged in these other markets; and (4) as part of its 2022 review, 9 of 11 Janus Henderson Funds have lower management fees than similar funds subadvised by the Adviser. The Trustees noted that for the two Janus Henderson Funds that did not, management fees for each were under the average of its 15(c) peer group.
The Trustees considered the fees for each Janus Henderson Fund for its fiscal year ended in 2021 (except for Janus Henderson Global Sustainable Equity Portfolio for which the period end was March 31, 2022) and noted the following with regard to each Janus Henderson Fund’s total expenses, net of applicable fee waivers (the VIT Portfolio’s “total expenses”) as reflected in the comparative information provided by Broadridge:
· For Janus Henderson Adaptive Risk Management U.S. Equity Portfolio, the Trustees noted that the VIT Portfolio’s total expenses were below the peer group average for its sole share class.
· For Janus Henderson Balanced Portfolio, the Trustees noted that, although the VIT Portfolio’s total expenses exceeded the peer group average for one share class, overall the VIT Portfolio’s total expenses were reasonable.
· For Janus Henderson Enterprise Portfolio, the Trustees noted that, although the VIT Portfolio’s total expenses exceeded the peer group average for one share class, overall the VIT Portfolio’s total expenses were reasonable.
· For Janus Henderson Flexible Bond Portfolio, the Trustees noted that, although the VIT Portfolio’s total expenses exceeded the peer group for one share class, overall the VIT Portfolio’s total expenses were reasonable. The Trustees also noted that the Adviser has contractually agreed to limit the VIT Portfolio’s expenses.
· For Janus Henderson Forty Portfolio, the Trustees noted that, although the VIT Portfolio’s total expenses exceeded the peer group average for one share class, overall the VIT Portfolio’s total expenses were reasonable.
· For Janus Henderson Global Research Portfolio, the Trustees noted that, although the VIT Portfolio’s total expenses exceeded the peer group average for one share class, overall the VIT Portfolio’s total expenses were reasonable.
· For Janus Henderson Global Sustainable Equity Portfolio, the Trustees noted that the VIT Portfolio’s total expenses were below the peer group average for both share classes.
· For Janus Henderson Global Technology and Innovation Portfolio, the Trustees noted that the VIT Portfolio’s total expenses were below the peer group average for both share classes.
· For Janus Henderson Mid Cap Value Portfolio, the Trustees noted that, the VIT Portfolio’s total expenses were below the peer group average for both share classes.
· For Janus Henderson Overseas Portfolio, the Trustees noted that although the VIT Portfolio’s total expenses exceeded the peer group average for one share class, overall the VIT Portfolio’s total expenses were reasonable.
Janus Henderson VIT Overseas Portfolio
Additional Information (unaudited)
· For Janus Henderson Research Portfolio, the Trustees noted that the VIT Portfolio’s total expenses were below the peer group average for both share classes.
The Trustees reviewed information on the overall profitability to the Adviser and its affiliates from their relationships with the Janus Henderson Funds, and considered profitability data of other publicly traded mutual fund advisers. The Trustees recognized that profitability comparisons among fund managers are difficult because of the variation in the type of comparative information that is publicly available, and the profitability of any fund manager is affected by numerous factors, including the organizational structure of the particular fund manager, differences in complex size, difference in product mix, difference in types of business (mutual fund, institutional and other), differences in the types of funds and other accounts it manages, possible other lines of business, the methodology for allocating expenses and the fund manager’s capital structure and cost of capital.
Additionally, the Trustees considered the estimated profitability to the Adviser from the investment management services it provided to each Janus Henderson Fund. In their review, the Trustees considered whether the Adviser receive adequate incentives and resources to manage the Janus Henderson Funds effectively. In reviewing profitability, the Trustees noted that the estimated profitability for an individual Janus Henderson Fund is necessarily a product of the allocation methodology utilized by the Adviser to allocate its expenses as part of the estimated profitability calculation. In this regard, the Trustees noted that the independent fee consultant found as part of its 2022 review that (1) the expense allocation methodology and rationales utilized by the Adviser were reasonable and (2) no clear correlation exists between expense allocations and operating margins. The Trustees also considered that the estimated profitability for an individual Janus Henderson Fund was influenced by a number of factors, including not only the allocation methodology selected, but also the presence of fee waivers and expense caps, and whether the Janus Henderson Fund’s investment management agreement contained breakpoints or a performance fee component. The Trustees determined, after taking into account these factors, among others, that the Adviser’s estimated profitability with respect to each Janus Henderson Fund was not unreasonable in relation to the services provided, and that the variation in the range of such estimated profitability among the Janus Henderson Funds was not a material factor in the Board’s approval of the reasonableness of any Janus Henderson Fund’s investment management fees.
The Trustees concluded that the management fees payable by each Janus Henderson Fund to the Adviser were reasonable in relation to the nature, extent, and quality of the services provided, taking into account the fees charged by other advisers for managing comparable mutual funds with similar strategies, the fees the Adviser charges to other clients, and, as applicable, the impact of fund performance on management fees payable by the Janus Henderson Funds. The Trustees also concluded that each Janus Henderson Fund’s total expenses were reasonable, taking into account the size of the Janus Henderson Fund, the quality of services provided by the Adviser, the investment performance of the Janus Henderson Fund, and any expense limitations agreed to or provided by the Adviser.
Economies of Scale
The Trustees considered information about the potential for the Adviser to realize economies of scale as the assets of the Janus Henderson Funds increase. They noted that their independent fee consultant published a report to the Trustees in June 2022 which provided its research and analysis into economies of scale. They also noted that, although many Janus Henderson Funds pay advisory fees at a fixed base rate as a percentage of net assets, without any breakpoints or performance fees, their independent fee consultant concluded that 75% of these Janus Henderson Funds’ have contractual management fees (gross of waivers) below their Broadridge Expense Group averages. The Trustees also noted the following from the independent fee consultant’s report: (1) that 31% of Janus Henderson Funds had management fee breakpoints in place whereby investors pay lower management fees as fund AUM increases; (2) that 29% of Janus Henderson Funds have low flat-rate fees and performance fees where the Adviser is incentivized to invest in resources which drive Janus Henderson Fund performance; and (3) that 39% of Janus Henderson Funds have low flat-rate fees versus peers where investors pay low fixed fees when the Janus Henderson Fund is small/midsized and higher fees when the Janus Henderson Fund grows in assets. The Trustees also noted that the Janus Henderson Funds share directly in economies of scale through the significant investments made by the Adviser and its affiliates related to services provided to the Funds and the lower charges of third-party service providers that are based in part on the combined scale of all of the Janus Henderson Funds.
The Trustees also considered the independent fee consultant’s conclusion that, given the limitations of various analytical approaches to economies of scale and their conflicting results, it is difficult to analytically confirm or deny the existence of economies of scale in the Janus Henderson complex. In this regard, the independent consultant concluded that (1) to the extent there were economies of scale at the Adviser, the Adviser’s general strategy of setting
Janus Henderson VIT Overseas Portfolio
Additional Information (unaudited)
fixed management fees below peers appeared to share any such economies with investors even on smaller Janus Henderson Funds which have not yet achieved those economies and (2) by setting lower fixed fees from the start on these Janus Henderson Funds, the Adviser appeared to be investing to increase the likelihood that these Janus Henderson Funds will grow to a level to achieve any economies of scale that may exist. Further, the independent fee consultant provided its belief that Janus Henderson Fund investors are well-served by the fee levels and performance fee structures in place on the Janus Henderson Funds in light of any economies of scale that may be present at the Adviser.
Based on all of the information reviewed, including the recent and past research and analysis conducted by the Trustees’ independent fee consultant, the Trustees concluded that the current fee structure of each Janus Henderson Fund was reasonable and that the current rates of fees do reflect a sharing between the Adviser and the Janus Henderson Fund of any economies of scale that may be present at the current asset level of the Janus Henderson Fund.
Other Benefits to the Adviser
The Trustees also considered benefits that accrue to the Adviser and its affiliates from their relationships with the Janus Henderson Funds. They recognized that two affiliates of the Adviser separately serve the Janus Henderson Funds as transfer agent and distributor, respectively, and the transfer agent receives compensation directly from the non-money market Janus Henderson Funds for services provided, and that such compensation contributes to the overall profitability of the Adviser and its affiliates that results from their relationship with the Janus Henderson Funds. The Trustees also considered the Adviser’s past and proposed use of commissions paid by the Janus Henderson Funds on portfolio brokerage transactions to obtain proprietary and third-party research products and services benefiting the Janus Henderson Fund and/or other clients of the Adviser and/or the Adviser. The Trustees concluded that the Adviser’s use of these types of client commission arrangements to obtain proprietary and third-party research products and services was consistent with regulatory requirements and guidelines and was likely to benefit each Janus Henderson Fund. The Trustees also concluded that, other than the services provided by the Adviser and its affiliates pursuant to the agreements and the fees to be paid by each Janus Henderson Fund therefor, the Janus Henderson Funds and the Adviser may potentially benefit from their relationship with each other in other ways. They concluded that the Adviser and its affiliates share directly in economies of scale through the lower charges of third-party service providers that are based in part on the combined scale of the Janus Henderson Funds and other clients serviced by the Adviser and its affiliates. They also concluded that the Adviser benefits from the receipt of research products and services acquired through commissions paid on portfolio transactions of the Janus Henderson Funds and that the Janus Henderson Funds benefit from the Adviser’s receipt of those products and services as well as research products and services acquired through commissions paid by other clients of the Adviser. They further concluded that the success of any Janus Henderson Fund could attract other business to the Adviser or other Janus Henderson Funds, and that the success of the Adviser could enhance the Adviser’s ability to serve the Janus Henderson Funds.
Janus Henderson VIT Overseas Portfolio
Useful Information About Your Portfolio Report (unaudited)
Management Commentary
The Management Commentary in this report includes valuable insight as well as statistical information to help you understand how your Portfolio’s performance and characteristics stack up against those of comparable indices.
If the Portfolio invests in foreign securities, this report may include information about country exposure. Country exposure is based primarily on the country of risk. A company may be allocated to a country based on other factors such as location of the company’s principal office, the location of the principal trading market for the company’s securities, or the country where a majority of the company’s revenues are derived.
Please keep in mind that the opinions expressed in the Management Commentary are just that: opinions. They are a reflection based on best judgment at the time this report was compiled, which was December 31, 2022. As the investing environment changes, so could opinions. These views are unique and are not necessarily shared by fellow employees or by Janus Henderson in general.
Performance Overviews
Performance overview graphs compare the performance of a hypothetical $10,000 investment in the Portfolio with one or more widely used market indices. When comparing the performance of the Portfolio with an index, keep in mind that market indices are not available for investment and do not reflect deduction of expenses.
Average annual total returns are quoted for a Portfolio with more than one year of performance history. Average annual total return is calculated by taking the growth or decline in value of an investment over a period of time, including reinvestment of dividends and distributions, then calculating the annual compounded percentage rate that would have produced the same result had the rate of growth been constant throughout the period. Average annual total return does not reflect the deduction of taxes that a shareholder would pay on Portfolio distributions or redemptions of Portfolio shares.
Cumulative total returns are quoted for a Portfolio with less than one year of performance history. Cumulative total return is the growth or decline in value of an investment over time, independent of the period of time involved. Cumulative total return does not reflect the deduction of taxes that a shareholder would pay on Portfolio distributions or redemptions of Portfolio shares.
Pursuant to federal securities rules, expense ratios shown in the performance chart reflect subsidized (if applicable) and unsubsidized ratios. The total annual fund operating expenses ratio is gross of any fee waivers, reflecting the Portfolio’s unsubsidized expense ratio. The net annual fund operating expenses ratio (if applicable) includes contractual waivers of the Adviser and reflects the Portfolio’s subsidized expense ratio. Ratios may be higher or lower than those shown in the “Financial Highlights” in this report.
Schedule of Investments
Following the performance overview section is the Portfolio’s Schedule of Investments. This schedule reports the types of securities held in the Portfolio on the last day of the reporting period. Securities are usually listed by type (common stock, corporate bonds, U.S. Government obligations, etc.) and by industry classification (banking, communications, insurance, etc.). Holdings are subject to change without notice.
The value of each security is quoted as of the last day of the reporting period. The value of securities denominated in foreign currencies is converted into U.S. dollars.
If the Portfolio invests in foreign securities, it will also provide a summary of investments by country. This summary reports the Portfolio exposure to different countries by providing the percentage of securities invested in each country. The country of each security represents the country of risk. The Portfolio’s Schedule of Investments relies upon the industry group and country classifications published by Bloomberg and/or MSCI Inc.
Tables listing details of individual forward currency contracts, futures, written options, swaptions, and swaps follow the Portfolio’s Schedule of Investments (if applicable).
Statement of Assets and Liabilities
This statement is often referred to as the “balance sheet.” It lists the assets and liabilities of the Portfolio on the last day of the reporting period.
Janus Henderson VIT Overseas Portfolio
Useful Information About Your Portfolio Report (unaudited)
The Portfolio’s assets are calculated by adding the value of the securities owned, the receivable for securities sold but not yet settled, the receivable for dividends declared but not yet received on securities owned, and the receivable for Portfolio shares sold to investors but not yet settled. The Portfolio’s liabilities include payables for securities purchased but not yet settled, Portfolio shares redeemed but not yet paid, and expenses owed but not yet paid. Additionally, there may be other assets and liabilities such as unrealized gain or loss on forward currency contracts.
The section entitled “Net Assets Consist of” breaks down the components of the Portfolio’s net assets. Because the Portfolio must distribute substantially all earnings, you will notice that a significant portion of net assets is shareholder capital.
The last section of this statement reports the net asset value (“NAV”) per share on the last day of the reporting period. The NAV is calculated by dividing the Portfolio’s net assets for each share class (assets minus liabilities) by the number of shares outstanding.
Statement of Operations
This statement details the Portfolio’s income, expenses, realized gains and losses on securities and currency transactions, and changes in unrealized appreciation or depreciation of Portfolio holdings.
The first section in this statement, entitled “Investment Income,” reports the dividends earned from securities and interest earned from interest-bearing securities in the Portfolio.
The next section reports the expenses incurred by the Portfolio, including the advisory fee paid to the investment adviser, transfer agent fees and expenses, and printing and postage for mailing statements, financial reports and prospectuses. Expense offsets and expense reimbursements, if any, are also shown.
The last section lists the amounts of realized gains or losses from investment and foreign currency transactions, and changes in unrealized appreciation or depreciation of investments and foreign currency-denominated assets and liabilities. The Portfolio will realize a gain (or loss) when it sells its position in a particular security. A change in unrealized gain (or loss) refers to the change in net appreciation or depreciation of the Portfolio during the reporting period. “Net Realized and Unrealized Gain/(Loss) on Investments” is affected both by changes in the market value of Portfolio holdings and by gains (or losses) realized during the reporting period.
Statements of Changes in Net Assets
These statements report the increase or decrease in the Portfolio’s net assets during the reporting period. Changes in the Portfolio’s net assets are attributable to investment operations, dividends and distributions to investors, and capital share transactions. This is important to investors because it shows exactly what caused the Portfolio’s net asset size to change during the period.
The first section summarizes the information from the Statement of Operations regarding changes in net assets due to the Portfolio’s investment operations. The Portfolio’s net assets may also change as a result of dividend and capital gains distributions to investors. If investors receive their dividends and/or distributions in cash, money is taken out of the Portfolio to pay the dividend and/or distribution. If investors reinvest their dividends and/or distributions, the Portfolio’s net assets will not be affected.
The reinvestment of dividends and distributions is included under “Capital Share Transactions.” “Capital Shares” refers to the money investors contribute to the Portfolio through purchases or withdrawals via redemptions. The Portfolio’s net assets will increase and decrease in value as investors purchase and redeem shares from the Portfolio.
Financial Highlights
This schedule provides a per-share breakdown of the components that affect the Portfolio’s NAV for current and past reporting periods as well as total return, asset size, ratios, and portfolio turnover rate.
The first line in the table reflects the NAV per share at the beginning of the reporting period. The next line reports the net investment income/(loss) per share. Following is the per share total of net gains/(losses), realized and unrealized. Per share dividends and distributions to investors are then subtracted to arrive at the NAV per share at the end of the period. The next line reflects the total return for the period. The total return may include adjustments in accordance with generally accepted accounting principles required at the period end for financial reporting purposes. As a result, the total return may differ from the total return reflected for individual shareholder transactions. Also included are ratios of expenses and net investment income to average net assets.
Janus Henderson VIT Overseas Portfolio
Useful Information About Your Portfolio Report (unaudited)
The Portfolio’s expenses may be reduced through expense offsets and expense reimbursements. The ratios shown reflect expenses before and after any such offsets and reimbursements.
The ratio of net investment income/(loss) summarizes the income earned less expenses, divided by the average net assets of the Portfolio during the reporting period. Do not confuse this ratio with the Portfolio’s yield. The net investment income ratio is not a true measure of the Portfolio’s yield because it does not take into account the dividends distributed to the Portfolio’s investors.
The next figure is the portfolio turnover rate, which measures the buying and selling activity in the Portfolio. Portfolio turnover is affected by market conditions, changes in the asset size of the Portfolio, fluctuating volume of shareholder purchase and redemption orders, the nature of the Portfolio’s investments, and the investment style and/or outlook of the portfolio manager(s) and/or investment personnel. A 100% rate implies that an amount equal to the value of the entire portfolio was replaced once during the fiscal year; a 50% rate means that an amount equal to the value of half the portfolio is traded in a year; and a 200% rate means that an amount equal to the value of the entire portfolio is traded every six months.
Janus Henderson VIT Overseas Portfolio
Designation Requirements (unaudited)
For federal income tax purposes, the Portfolio designated the following for the year ended December 31, 2022:
| | |
| | |
Foreign Taxes Paid | $2,133,390 |
Foreign Source Income | $14,711,192 |
Dividends Received Deduction Percentage | 1% |
Janus Henderson VIT Overseas Portfolio
Trustees and Officers (unaudited)
The following are the Trustees and officers of the Trust, together with a brief description of their principal occupations during the last five years (principal occupations for certain Trustees may include periods over five years). The Portfolio’s Statement of Additional Information includes additional information about the Trustees and officers and is available, without charge, by calling 1-877-335-2687.
Each Trustee has served in that capacity since he or she was originally elected or appointed. The Trustees do not serve a specified term of office. Each Trustee will hold office until the termination of the Trust or his or her earlier death, resignation, retirement, incapacity, or removal. Under the Portfolio’s Governance Procedures and Guidelines, the policy is for Trustees to retire no later than the end of the calendar year in which the Trustee turns 75. The Trustees review the Portfolio’s Governance Procedures and Guidelines from time to time and may make changes they deem appropriate. The Portfolio’s Nominating and Governance Committee will consider nominees for the position of Trustee recommended by shareholders. Shareholders may submit the name of a candidate for consideration by the Committee by submitting their recommendations to the Trust’s Secretary. Each Trustee is currently a Trustee of one other registered investment company advised by the Adviser: Janus Investment Fund. Collectively, these two registered investment companies consist of 51 series or funds referred to herein as the Fund Complex.
The Trust’s officers are elected annually by the Trustees for a one-year term. Certain officers also serve as officers of Janus Investment Fund. Certain officers of the Portfolio may also be officers and/or directors of the Adviser. Except as otherwise disclosed, Portfolio officers receive no compensation from the Portfolio, except for the Portfolio’s Chief Compliance Officer, as authorized by the Trustees.
Janus Henderson VIT Overseas Portfolio
Trustees and Officers (unaudited)
| | | | | | |
TRUSTEES |
Name, Address, and Age | Positions Held with the Trust | Length of Time Served | Principal Occupations During the Past Five Years | Number of Portfolios/Funds in Fund Complex Overseen by Trustee | Other Directorships Held by Trustee During the Past Five Years |
Independent Trustees | | | | |
Alan A. Brown
151 Detroit Street
Denver, CO 80206
DOB: 1962 | Chairman
Trustee | 5/22-Present
1/13-Present | Principal, Curam Holdings LLC (since 2018). Formerly, Executive Vice President, Institutional Markets, of Black Creek Group (private equity real estate investment management firm) (2012-2018), Executive Vice President and Co-Head, Global Private Client Group (2007-2010), Executive Vice President, Mutual Funds (2005-2007), and Chief Marketing Officer (2001-2005) of Nuveen Investments, Inc. (asset management). | 51 | Advisory Board Member of AEW Core Property Trust (open-end property fund) (since 2020), and Director of WTTW (PBS affiliate) (since 2003). Formerly, Director of MotiveQuest LLC (strategic social market research company) (2003-2016), Director of Nuveen Global Investors LLC (2007-2011), Director of Communities in Schools (2004-2010), and Director of Mutual Fund Education Alliance (until 2010). |
Cheryl D. Alston
151 Detroit Street
Denver, CO 80206
DOB: 1966 | Trustee | 8/22-Present | Executive Director and Chief Investment Officer, Employees’ Retirement Fund of the City of Dallas (since 2004). | 51 | Director of Blue Cross Blue Shield of Kansas City (a not-for-profit health insurance provider) (since 2016) and Director of Global Life Insurance (life and supplemental health insurance provider) (since 2017). Formerly, Director of Federal Home Loan Bank of Dallas (2017-2021). |
Janus Henderson VIT Overseas Portfolio
Trustees and Officers (unaudited)
| | | | | | |
TRUSTEES |
Name, Address, and Age | Positions Held with the Trust | Length of Time Served | Principal Occupations During the Past Five Years | Number of Portfolios/Funds in Fund Complex Overseen by Trustee | Other Directorships Held by Trustee During the Past Five Years |
Independent Trustees | | | | |
William D. Cvengros
151 Detroit Street
Denver, CO 80206
DOB: 1948 | Trustee | 1/11-Present | Chief Executive Officer of SJC Capital, LLC (a personal investment company and consulting firm) (since 2002). Formerly, Chief Executive Officer and President of PIMCO Advisors Holdings L.P. (a publicly traded investment management firm) (1994-2000), and Chief Investment Officer (1987-1994) and Vice Chairman and Director (1990-1994) of Pacific Life Insurance Company (a mutual life insurance and annuity company) (1987-1994). | 51 | Member, Limited Partner Advisory Committee, Karmel Capital Fund III (since 2022), Member of the Investment Committee for the Orange Country Community Foundation (a grantmaking foundation) (since 2020), Advisory Board Member, RevOZ Fund LP and related funds (real estate investments for opportunity zones) (since 2020), and Advisory Board Member, Innovate Partners Emerging Growth and Equity Fund I (early stage venture capital fund) (since 2014). Formerly, Managing Trustee of National Retirement Partners Liquidating Trust (2013-2016), Chairman, National Retirement Partners, Inc. (formerly a network of advisors to 401(k) plans) (2005-2013), Director of Prospect Acquisition Corp. (a special purpose acquisition corporation) (2007-2009), Director of RemedyTemp, Inc. (temporary help services company) (1996-2006), and Trustee of PIMCO Funds Multi-Manager Series (1990-2000) and Pacific Life Variable Life & Annuity Trusts (1987-1994). |
Janus Henderson VIT Overseas Portfolio
Trustees and Officers (unaudited)
| | | | | | |
TRUSTEES |
Name, Address, and Age | Positions Held with the Trust | Length of Time Served | Principal Occupations During the Past Five Years | Number of Portfolios/Funds in Fund Complex Overseen by Trustee | Other Directorships Held by Trustee During the Past Five Years |
Independent Trustees | | | | |
Raudline Etienne
151 Detroit Street
Denver, CO 80206
DOB: 1965 | Trustee | 6/16-Present | Founder, Daraja Capital (advisory and investment firm) (since 2016). Formerly, Senior Vice President and Senior Advisor, Albright Stonebridge Group LLC (global strategy firm) (2011-2021), and Deputy Comptroller and Chief Investment Officer, New York State Common Retirement Fund (public pension fund) (2008-2011). | 51 | Member of the Investment Committee for Cooper Union (private college) (since 2021), Board Member, Van Alen Institute (nonprofit architectural and design organization) (2019-2022). |
Janus Henderson VIT Overseas Portfolio
Trustees and Officers (unaudited)
| | | | | | |
TRUSTEES |
Name, Address, and Age | Positions Held with the Trust | Length of Time Served | Principal Occupations During the Past Five Years | Number of Portfolios/Funds in Fund Complex Overseen by Trustee | Other Directorships Held by Trustee During the Past Five Years |
Independent Trustees | | | | |
Darrell B. Jackson
151 Detroit Street
Denver, CO 80206
DOB: 1958 | Trustee | 8/22-Present | President and Chief Executive Officer, The Efficace Group Inc. (since 2018). Formerly, President and Chief Executive Officer, Seaway Bank and Trust Company (community bank) (2014-2015), and Executive Vice President and Co-President, Wealth Management (2009-2014), and several senior positions, including Group Executive, Senior Vice President, and Vice President (1995-2009) of Northern Trust Company (financial services company) (1995-2014). | 51 | Director of Amalgamated Financial Corp (bank) (since August 2021), Director of YR Media (a not-for-profit production company) (since 2021), and Director of Gray-Bowen-Scott (transportation project consulting firm) (since April 2020). Formerly, Director of Delaware Place Bank (closely held commercial bank) (2016-2018) and Director of Seaway Bank and Trust Company (2014-2015). |
Janus Henderson VIT Overseas Portfolio
Trustees and Officers (unaudited)
| | | | | | |
TRUSTEES |
Name, Address, and Age | Positions Held with the Trust | Length of Time Served | Principal Occupations During the Past Five Years | Number of Portfolios/Funds in Fund Complex Overseen by Trustee | Other Directorships Held by Trustee During the Past Five Years |
Independent Trustees | | | | |
William F. McCalpin
151 Detroit Street
Denver, CO 80206
DOB: 1957 | Trustee | 6/02-Present | Chief Executive Officer, muun chi LLC (organic food business) (since 2022) and Independent Consultant (since 2019). Formerly, Chief Operating Officer, muun chi LLC (2020-2022), Managing Partner, Impact Investments, Athena Capital Advisors LLC (independent registered investment advisor) (2016-2019), Managing Director, Holos Consulting LLC (provides consulting services to foundations and other nonprofit organizations) (2009-2016), Chief Executive Officer, Imprint Capital Advisors (impact investment firm) (2013-2015), and Executive Vice President and Chief Operating Officer of The Rockefeller Brothers Fund (a private family foundation) (1998-2006). | 51 | Chairman of the Board and Trustee of The Investment Fund for Foundations Investment Program (TIP) (consisting of 1 fund) (since 2008). Formerly, Director of the F.B. Heron Foundation (a private grantmaking foundation) (2006-2022), and Director of Mutual Fund Directors Forum (a non-profit organization serving independent directors of U.S. mutual funds) (2016-2021). |
Janus Henderson VIT Overseas Portfolio
Trustees and Officers (unaudited)
| | | | | | |
TRUSTEES |
Name, Address, and Age | Positions Held with the Trust | Length of Time Served | Principal Occupations During the Past Five Years | Number of Portfolios/Funds in Fund Complex Overseen by Trustee | Other Directorships Held by Trustee During the Past Five Years |
Independent Trustees | | | | |
Gary A. Poliner
151 Detroit Street
Denver, CO 80206
DOB: 1953 | Trustee | 6/16-Present | Retired. Formerly, President (2010-2013) of Northwestern Mutual Life Insurance Company. | 51 | Director of MGIC Investment Corporation (private mortgage insurance) (since 2013). Formerly, Director, West Bend Mutual Insurance Company (property/casualty insurance) (2013-2021), Trustee of Northwestern Mutual Life Insurance Company (2010-2013) and Director of Frank Russell Company (global asset management firm) (2008-2013). |
Diane L. Wallace
151 Detroit Street
Denver, CO 80206
DOB: 1958 | Trustee | 6/17-Present | Retired. Formerly, Chief Operating Officer, Senior Vice President-Operations, and Chief Financial Officer for Driehaus Capital Management, LLC (1988-2006) and Treasurer for Driehaus Mutual Funds (1996-2002). | 51 | Formerly, Director of Family Service of Lake County (2019-2021), Independent Trustee, Henderson Global Funds (13 portfolios) (2015-2017), Independent Trustee, State Farm Associates' Funds Trust, State Farm Mutual Fund Trust, and State Farm Variable Product Trust (28 portfolios) (2013-2017). |
Janus Henderson VIT Overseas Portfolio
Trustees and Officers (unaudited)
| | | | |
OFFICERS |
Name, Address, and Age | Positions Held with the Trust | Term of Office* and Length of Time Served | Principal Occupations During the Past Five Years |
George P. Maris
151 Detroit Street
Denver, CO 80206
DOB: 1968 | Executive Vice President and Lead Portfolio Manager Janus Henderson Overseas Portfolio | 1/16-Present | Co-Head of Equities - Americas of Janus Henderson Investors and Portfolio Manager for other Janus Henderson accounts. |
Julian McManus
151 Detroit Street
Denver, CO 80206
DOB: 1970 | Executive Vice President and Co-Portfolio Manager Janus Henderson Overseas Portfolio | 1/18-Present | Portfolio Manager for other Janus Henderson accounts and Analyst for the Adviser. |
Michelle Rosenberg
151 Detroit Street
Denver, CO 80206
DOB: 1973 | President and Chief Executive Officer | 9/22-Present | General Counsel and Corporate Secretary of Janus Henderson Investors (since 2018). Formerly, Interim President and Chief Executive Officer of the Trust and Janus Investment Fund (2022), Senior Vice President and Head of Legal, North America of Janus Henderson Investors (2017-2018) and Deputy General Counsel of Janus Henderson US (Holdings) Inc. (2015-2018). |
* Officers are elected at least annually by the Trustees for a one-year term and may also be elected from time to time by the Trustees for an interim period. |
| | | | |
| |
Janus Henderson VIT Overseas Portfolio
Trustees and Officers (unaudited)
| | | | |
OFFICERS |
Name, Address, and Age | Positions Held with the Trust | Term of Office* and Length of Time Served | Principal Occupations During the Past Five Years |
Kristin Mariani
151 Detroit Street
Denver, CO 80206
DOB: 1966 | Vice President and Chief Compliance Officer | 7/20-Present | Head of Compliance, North America at Janus Henderson Investors (since September 2020), and Chief Compliance Officer at Janus Henderson Investors US LLC (since September 2017). Formerly, Anti-Money Laundering Officer for the Trust and Janus Investment Fund (July 2020-December 2022), Global Head of Investment Management Compliance at Janus Henderson Investors (February 2019-August 2020), Vice President, Head of Global Distribution Compliance and Chief Compliance Officer at Janus Henderson Distributors US LLC (May 2017-September 2017), Vice President, Compliance at Janus Henderson US (Holdings) Inc., Janus Henderson Investors US LLC, and Janus Henderson Distributors US LLC (2009-2017). |
Jesper Nergaard
151 Detroit Street
Denver, CO 80206
DOB: 1962 | Chief Financial Officer
Vice President, Treasurer, and Principal Accounting Officer | 3/05-Present
2/05-Present | Head of U.S. Fund Administration, Janus Henderson Investors and Janus Henderson Services US LLC. |
Abigail J. Murray
151 Detroit Street
Denver, CO 80206
DOB: 1975 | Vice President, Chief Legal Officer, and Secretary | 12/20-Present | Managing Counsel (since 2020). Formerly, Senior Counsel for Invesco Ltd. (2017-2020), and Vice President and Senior Counsel, ALPS Fund Services, Inc. and Assistant General Counsel, ALPS Advisors, Inc. (2015-2017). |
Ciaran Askin
151 Detroit Street
Denver, CO 80206
DOB: 1978 | Anti-Money Laundering Officer | 12/22-Present | Global Head of Financial Crime, Janus Henderson Investors (since 2022). Formerly, Global Head of Financial Crime for Invesco Ltd. (2017-2022). |
* Officers are elected at least annually by the Trustees for a one-year term and may also be elected from time to time by the Trustees for an interim period. |
| | | | | | | | |
| | | | | |

| | | | |
This report is submitted for the general information of shareholders of the Portfolio. It is not an offer or solicitation for the Portfolio and is not authorized for distribution to prospective investors unless preceded or accompanied by an effective prospectus. |
Janus Henderson is a trademark of Janus Henderson Group plc or one of its subsidiaries. © Janus Henderson Group plc Janus Henderson Distributors US LLC |
| | | | 109-02-81120 03-23 |
| | | |
| | | |
| | | ANNUAL REPORT December 31, 2022 |
| | |
| | Janus Henderson VIT Research Portfolio |
| | |
| | Janus Aspen Series |
| |
| | | |
| | | HIGHLIGHTS · Portfolio management perspective · Investment strategy behind your portfolio · Portfolio performance, characteristics
and holdings |
Table of Contents
Janus Henderson VIT Research Portfolio
Janus Henderson VIT Research Portfolio (unaudited)
| | | | | | |
| | | | | Team-Based Approach Led by Matthew Peron, Director of Research |
| | | |
PERFORMANCE OVERVIEW
For the 12-month period ending December 31, 2022, the Janus Henderson VIT Research Portfolio’s Institutional Shares and Service Shares returned -29.89% and -30.06%, respectively. The Portfolio’s primary benchmark, the Russell 1000® Growth Index, returned -29.14%, and its secondary benchmark, the S&P 500® Index, returned -18.11%. Another benchmark we use to measure performance, the Core Growth Index, returned -23.77%. The Core Growth Index is an internally calculated benchmark combining returns from the Russell 1000 Growth Index (50%) and S&P 500 Index (50%).
INVESTMENT ENVIRONMENT
Stocks declined over the 12-month period as soaring inflation, rising interest rates, and recession fears led to market turbulence. Stocks started out the year with volatility, as worsening price pressures raised expectations for more restrictive central bank policies. Volatility increased sharply late in the first quarter after Russia’s invasion of Ukraine sent commodity prices soaring while raising concerns about supply disruptions. Market volatility continued into the second half of the year, as record-high inflation in many countries led to synchronized and often aggressive policy tightening. Concerns about a looming European energy crisis, as Russia reduced gas supplies, added to negative sentiment in the third quarter, further pressuring equity performance. Global equities regained some ground in the fourth quarter as signs of moderating inflation raised hopes for a slower pace of policy tightening in 2023. Despite this fourth-quarter rally, most market indices ended the period with double-digit declines.
PERFORMANCE DISCUSSION
Our sector teams employ a bottom-up, fundamental approach to identify what we consider the best investment opportunities. Our analysts take a long-term view of companies with a focus on value creation and duration of growth, which we believe may lead to high returns on invested capital. The Portfolio directly captures the insights of our teams through their highest-conviction ideas. In building a diversified Portfolio, we seek to minimize macroeconomic risks while generating strong performance over longer periods.
During this challenging investment period, rising interest rates drove a shift away from more growth-oriented stocks, leading to a sell-off in information technology stocks. These included Atlassian, a provider of business collaboration software. The stock declined after Atlassian reported slower subscription growth for its cloud and data center businesses. It also reduced guidance, as it warned that macroeconomic headwinds may slow enterprise capital spending and hiring in 2023. Despite some near-term uncertainty, we held on to the stock but will continue to monitor its fundamentals and capital allocation going forward.
Graphics chipmaker Nvidia was another detractor, as the stock fell in response to forecasts of an industry-wide decline in semiconductor sales in 2023. Nvidia also faced concerns over new U.S. government restrictions on the export of high-end data center chips to China. However, we remain constructive on its long-term prospects given its leadership in secular growth markets such as artificial intelligence, gaming, and autonomous driving.
Electric vehicle (EV) manufacturer Rivian Automotive was another detractor. Despite solid execution, the company’s lack of profitability pressured the stock in a risk-averse environment. On a positive note, its orders growth and backlog have remained strong, and it reported improving supply chain conditions by year-end. We continue to own the stock given its foothold in the growing EV market, where government subsidies in many markets may help drive wider adoption.
On a positive note, an underweight position in electric vehicle manufacturer Tesla aided relative performance. The stock faced headwinds in the first half of 2023, as COVID-related factory disruptions in China slowed
Janus Henderson VIT Research Portfolio (unaudited)
production. The stock declined further in the fourth quarter after Tesla reported disappointing quarterly performance, including weaker-than-expected revenue growth. Tesla also reduced planned production in China as economic headwinds and increased competition impacted demand.
Relative performance also benefited from an overweight position in Deckers Outdoor, maker of high-performance footwear and apparel under brands such as UGG, HOKA, and Teva. The stock rose as the company delivered solid revenue growth and healthy guidance. Investors also responded favorably to the company’s $100 million stock repurchase plan.
An investment in global pharmaceutical company AstraZeneca also lifted relative performance. The company has benefited from strong sales trends for Tagrisso, a treatment for non-small cell lung cancer, and Farxiga, a therapy for type 2 diabetes. It also received positive clinical trial results for its breast cancer drug Enhertu, which could expand the scope of approval for the drug and result in higher revenues for AstraZeneca.
OUTLOOK
We have seen signs that higher interest rates are starting to impact the economy, and we believe we could see further reductions to corporate earnings. While we anticipate slower growth next year, we have been reassured by the resilience of the U.S. economy and the general health of consumer and corporate balance sheets. China’s more pro-growth policies and relaxation of COVID-19 restrictions could also have positive implications for the global economy.
As the market searches for a bottom, we believe investors will seek out companies with high-quality earnings growth, well-capitalized balance sheets, reasonable valuations, and sustainable, organic growth prospects. In our view, such companies will prove resilient not only in the near term, but as we leave behind the era of ultra-low interest rates. Going forward, we believe we could see higher structural inflation and tighter monetary policy. We also believe this environment will reward judicious allocators of capital but penalize companies with high degrees of leverage. Just as this environment will help to distinguish high-quality companies, we believe it will also work to our advantage as active investment managers. We continue to pay close attention to the price we pay for growth, as we look for opportunities to take advantage of trends such as e-commerce, cloud computing, and healthcare innovation.
Thank you for your investment in Janus Henderson VIT Research Portfolio.
Actively managed portfolios may fail to produce the intended results. No investment strategy can ensure a profit or eliminate the risk of loss.
Quantitative Tightening (QT) is a government monetary policy occasionally used to decrease the money supply by either selling government securities or letting them mature and removing them from its cash balances.
Janus Henderson VIT Research Portfolio (unaudited)
Portfolio At A Glance
December 31, 2022
| | | | | | | | | | |
| | | | | | | | | |
| | | | | | | | | |
| | | | | | | | | |
| 5 Top Contributors - Holdings | 5 Top Detractors - Holdings |
| | Average
Weight | | Relative
Contribution | | | Average
Weight | | Relative
Contribution |
| Tesla Inc | 0.61% | | 0.94% | | Atlassian Corp - Class A | 1.49% | | -0.63% |
| Deckers Outdoor Corp | 0.92% | | 0.48% | | NVIDIA Corp | 4.28% | | -0.58% |
| EOG Resources Inc | 1.09% | | 0.40% | | Rivian Automotive Inc - Class A | 0.47% | | -0.42% |
| AstraZeneca PLC (ADR) | 1.01% | | 0.38% | | Align Technology Inc | 0.57% | | -0.37% |
| Howmet Aerospace Inc | 0.89% | | 0.33% | | Advanced Micro Devices Inc | 1.54% | | -0.29% |
| | | | | | | |
| 5 Top Contributors - Sectors* | | | | | |
| | | Relative | | Portfolio | Russell 1000 Growth Index |
| | | Contribution | | Average Weight | Average Weight |
| Industrials | | 0.73% | | 10.71% | 11.02% |
| Financials | | 0.71% | | 8.41% | 8.20% |
| Healthcare | | 0.45% | | 10.98% | 10.66% |
| Other** | | 0.06% | | 0.16% | 0.00% |
| Energy | | 0.05% | | 1.09% | 1.09% |
| | | | | | |
| | | | | | |
| 2 Top Detractors - Sectors* | | | | | |
| | | Relative | | Portfolio | Russell 1000 Growth Index |
| | | Contribution | | Average Weight | Average Weight |
| Technology | | -1.99% | | 38.74% | 39.58% |
| Consumer | | -0.41% | | 18.72% | 18.60% |
| | | | | | | |
| Relative contribution reflects how the portolio's holdings impacted return relative to the benchmark. Cash and securities not held in the portfolio are not shown. For equity portfolios, relative contribution compares the performance of a security in the portfolio to the benchmark's total return, factoring in the difference in weight of that security in the benchmark. Returns are calculated using daily returns and previous day ending weights rolled up by ticker, excluding fixed income securities, gross of advisory fees, may exclude certain derivatives and will differ from actual performance.
Performance attribution reflects returns gross of advisory fees and may differ from actual returns as they are based on end of day holdings. Attribution is calculated by geometrically linking daily returns for the portfolio and index. |
* | The sectors listed above reflect those covered by the six analyst teams who comprise the Janus Henderson Research Team. |
** | Not a GICS classified sector. |
Janus Henderson VIT Research Portfolio (unaudited)
Portfolio At A Glance
December 31, 2022
| | |
5 Largest Equity Holdings - (% of Net Assets) |
Microsoft Corp | |
Software | 11.0% |
Apple Inc | |
Technology Hardware, Storage & Peripherals | 6.5% |
Alphabet Inc - Class C | |
Interactive Media & Services | 5.5% |
Amazon.com Inc | |
Internet & Direct Marketing Retail | 4.4% |
NVIDIA Corp | |
Semiconductor & Semiconductor Equipment | 3.3% |
| | 30.7% |
| | | | | | |
Asset Allocation - (% of Net Assets) | |
Common Stocks | | 99.9% | |
Other | | 0.1% |
| | | 100.0% |
| | |
Top Country Allocations - Long Positions - (% of Investment Securities) |
As of December 31, 2022 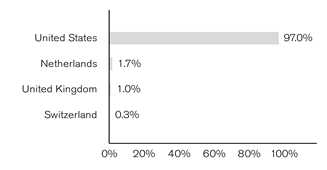
| As of December 31, 2021 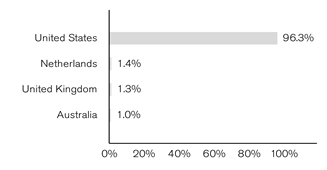
|
Janus Henderson VIT Research Portfolio (unaudited)
Performance
| |
See important disclosures on the next page. |
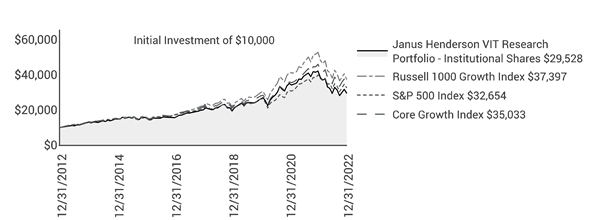
| | | | | | | | | | |
| | | | | | | | |
| | | | | | | | | |
Average Annual Total Return - for the periods ended December 31, 2022 | | | Prospectus Expense Ratios |
| | One
Year | Five
Year | Ten
Year | Since
Inception* | | | Total Annual Fund
Operating Expenses‡ |
Institutional Shares | | -29.89% | 8.17% | 11.44% | 8.42% | | | 0.60% |
Service Shares | | -30.06% | 7.90% | 11.16% | 8.13% | | | 0.85% |
Russell 1000 Growth Index | | -29.14% | 10.96% | 14.10% | 9.68% | | | |
S&P 500 Index | | -18.11% | 9.42% | 12.56% | 9.59% | | | |
Core Growth Index | | -23.77% | 10.24% | 13.36% | 9.67% | | | |
Morningstar Quartile - Institutional Shares | | 3rd | 3rd | 3rd | 3rd | | | |
Morningstar Ranking - based on total returns for Large Growth Funds | | 543/1,246 | 615/1,126 | 655/1,036 | 251/372 | | | |
Returns quoted are past performance and do not guarantee future results; current performance may be lower or higher. Investment returns and principal value will vary; there may be a gain or loss when shares are sold. For the most recent month-end performance call 800.668.0434 or visit janushenderson.com/VITperformance.
This Portfolio has a performance-based management fee that may adjust up or down based on the Portfolio’s performance.
Performance may be affected by risks that include those associated with foreign and emerging markets, fixed income securities, high-yield and high-risk securities, undervalued, overlooked and smaller capitalization companies, real estate related securities including Real Estate Investment Trusts (REITs), Environmental, Social and Governance (ESG) factors, non-diversification, portfolio turnover, derivatives, short sales, initial public offerings (IPOs) and potential conflicts of interest. Each product has different risks. Please see the prospectus for more information about risks, holdings and other details.
Returns do not reflect the deduction of fees, charges or expenses of any insurance product or qualified plan. If applied, returns would have been lower.
Returns include reinvestment of all dividends and distributions and do not reflect the deduction of taxes that a shareholder would pay on Portfolio distributions or redemptions of Portfolio shares. The returns do not include adjustments in accordance with generally accepted accounting principles required at the period end for financial reporting purposes.
Performance for Service Shares prior to December 31, 1999 reflects the performance of Institutional Shares, adjusted to reflect the expenses of Service Shares.
Ranking is for the share class shown only; other classes may have different performance characteristics.
© 2022 Morningstar, Inc. All Rights Reserved.
There is no assurance that the investment process will consistently lead to successful investing.
See Notes to Schedule of Investments and Other Information for index definitions.
Janus Henderson VIT Research Portfolio (unaudited)
Performance
Index performance does not reflect the expenses of managing a portfolio as an index is unmanaged and not available for direct investment.
See “Useful Information About Your Portfolio Report.”
*The Portfolio’s inception date – September 13, 1993
‡ As stated in the prospectus. See Financial Highlights for actual expense ratios during the reporting period.
Janus Henderson VIT Research Portfolio (unaudited)
Expense Examples
As a shareholder of the Portfolio, you incur two types of costs: (1) transaction costs and (2) ongoing costs, including management fees; 12b-1 distribution and shareholder servicing fees (applicable to Service Shares only); transfer agent fees and expenses payable pursuant to the Transfer Agency Agreement; and other Portfolio expenses. This example is intended to help you understand your ongoing costs (in dollars) of investing in the Portfolio and to compare these costs with the ongoing costs of investing in other mutual funds. To do so, compare this 5% hypothetical example with the 5% hypothetical examples that appear in the shareholder reports of the other funds. The example is based upon an investment of $1,000 invested at the beginning of the period and held for the six-months indicated, unless noted otherwise in the table and footnotes below.
Actual Expenses
The information in the table under the heading “Actual” provides information about actual account values and actual expenses. You may use the information in these columns, together with the amount you invested, to estimate the expenses that you paid over the period. Simply divide your account value by $1,000 (for example, an $8,600 account value divided by $1,000 = 8.6), then multiply the result by the number in the appropriate column for your share class under the heading entitled “Expenses Paid During Period” to estimate the expenses you paid on your account during the period.
Hypothetical Example for Comparison Purposes
The information in the table under the heading “Hypothetical (5% return before expenses)” provides information about hypothetical account values and hypothetical expenses based upon the Portfolio’s actual expense ratio and an assumed rate of return of 5% per year before expenses, which is not the Portfolio’s actual return. The hypothetical account values and expenses may not be used to estimate the actual ending account balance or expenses you paid for the period. You may use this information to compare the ongoing costs of investing in the Portfolio and other funds. To do so, compare this 5% hypothetical example with the 5% hypothetical examples that appear in the shareholder reports of the other funds. Additionally, for an analysis of the fees associated with an investment in either share class or other similar funds, please visit www.finra.org/fundanalyzer.
Please note that the expenses shown in the table are meant to highlight your ongoing costs only and do not reflect any transaction costs, such as any charges at the separate account level or contract level. These fees are fully described in the Portfolio’s prospectuses. Therefore, the hypothetical examples are useful in comparing ongoing costs only, and will not help you determine the relative total costs of owning different funds. In addition, if these transaction costs were included, your costs would have been higher.
| | | | | | | | | | | |
| | | | | | | | |
| | | Actual | | Hypothetical
(5% return before expenses) | |
| Beginning
Account
Value
(7/1/22) | Ending
Account
Value
(12/31/22) | Expenses
Paid During
Period
(7/1/22 - 12/31/22)† | | Beginning
Account
Value
(7/1/22) | Ending
Account
Value
(12/31/22) | Expenses
Paid During
Period
(7/1/22 - 12/31/22)† | Net Annualized
Expense Ratio
(7/1/22 - 12/31/22) |
Institutional Shares | $1,000.00 | $1,006.80 | $2.83 | | $1,000.00 | $1,022.38 | $2.85 | 0.56% |
Service Shares | $1,000.00 | $1,005.70 | $4.09 | | $1,000.00 | $1,021.12 | $4.13 | 0.81% |
† | Expenses Paid During Period are equal to the Net Annualized Expense Ratio multiplied by the average account value over the period, multiplied by 184/365 (to reflect the one-half year period). Expenses in the examples include the effect of applicable fee waivers and/or expense reimbursements, if any. Had such waivers and/or reimbursements not been in effect, your expenses would have been higher. Please refer to the Notes to Financial Statements or the Portfolio’s prospectuses for more information regarding waivers and/or reimbursements. |
Janus Henderson VIT Research Portfolio
Schedule of Investments
December 31, 2022
| | | | | | | | |
Shares
| | | Value | |
Common Stocks– 99.9% | | | |
Aerospace & Defense – 2.2% | | | |
| | General Dynamics Corp | | 20,204 | | | $5,012,814 | |
| | Howmet Aerospace Inc | | 123,349 | | | 4,861,184 | |
| | | 9,873,998 | |
Air Freight & Logistics – 2.5% | | | |
| | United Parcel Service Inc | | 65,966 | | | 11,467,529 | |
Automobiles – 0.8% | | | |
| | Rivian Automotive Inc - Class A* | | 74,114 | | | 1,365,921 | |
| | Tesla Inc* | | 18,452 | | | 2,272,917 | |
| | | 3,638,838 | |
Beverages – 1.6% | | | |
| | Constellation Brands Inc | | 30,394 | | | 7,043,809 | |
Biotechnology – 5.0% | | | |
| | AbbVie Inc | | 69,724 | | | 11,268,096 | |
| | Horizon Therapeutics PLC* | | 17,725 | | | 2,017,105 | |
| | Regeneron Pharmaceuticals Inc* | | 2,096 | | | 1,512,243 | |
| | Sarepta Therapeutics Inc* | | 20,007 | | | 2,592,507 | |
| | United Therapeutics Corp* | | 8,440 | | | 2,347,080 | |
| | Vertex Pharmaceuticals Inc* | | 9,432 | | | 2,723,773 | |
| | | 22,460,804 | |
Capital Markets – 1.5% | | | |
| | Blackstone Group Inc | | 31,575 | | | 2,342,549 | |
| | Charles Schwab Corp | | 33,551 | | | 2,793,456 | |
| | LPL Financial Holdings Inc | | 6,848 | | | 1,480,332 | |
| | | 6,616,337 | |
Chemicals – 0.8% | | | |
| | Sherwin-Williams Co | | 15,888 | | | 3,770,699 | |
Diversified Financial Services – 0.6% | | | |
| | Apollo Global Management Inc | | 40,799 | | | 2,602,568 | |
Entertainment – 1.1% | | | |
| | Liberty Media Corp-Liberty Formula One* | | 81,851 | | | 4,893,053 | |
Equity Real Estate Investment Trusts (REITs) – 0.8% | | | |
| | American Tower Corp | | 17,638 | | | 3,736,787 | |
Health Care Equipment & Supplies – 1.0% | | | |
| | Abbott Laboratories | | 18,076 | | | 1,984,564 | |
| | Edwards Lifesciences Corp* | | 31,256 | | | 2,332,010 | |
| | | 4,316,574 | |
Health Care Providers & Services – 3.2% | | | |
| | Centene Corp* | | 15,571 | | | 1,276,978 | |
| | UnitedHealth Group Inc | | 25,239 | | | 13,381,213 | |
| | | 14,658,191 | |
Hotels, Restaurants & Leisure – 3.6% | | | |
| | Booking Holdings Inc* | | 5,394 | | | 10,870,420 | |
| | Caesars Entertainment Inc* | | 53,031 | | | 2,206,090 | |
| | Chipotle Mexican Grill Inc* | | 2,273 | | | 3,153,765 | |
| | | 16,230,275 | |
Household Products – 1.9% | | | |
| | Procter & Gamble Co | | 56,120 | | | 8,505,547 | |
Industrial Conglomerates – 0.5% | | | |
| | Honeywell International Inc | | 10,848 | | | 2,324,726 | |
Information Technology Services – 6.4% | | | |
| | Fidelity National Information Services Inc | | 16,100 | | | 1,092,385 | |
| | Global Payments Inc | | 10,546 | | | 1,047,429 | |
| | Mastercard Inc | | 37,904 | | | 13,180,358 | |
| | Snowflake Inc - Class A* | | 9,447 | | | 1,356,022 | |
| | Visa Inc | | 59,061 | | | 12,270,513 | |
| | | 28,946,707 | |
Insurance – 0.6% | | | |
| | Aon PLC - Class A | | 8,427 | | | 2,529,280 | |
| | |
See Notes to Schedule of Investments and Other Information and Notes to Financial Statements. |
| |
8 | DECEMBER 31, 2022 |
Janus Henderson VIT Research Portfolio
Schedule of Investments
December 31, 2022
| | | | | | | | |
Shares
| | | Value | |
Common Stocks– (continued) | | | |
Interactive Media & Services – 5.5% | | | |
| | Alphabet Inc - Class C* | | 278,007 | | | $24,667,561 | |
Internet & Direct Marketing Retail – 4.4% | | | |
| | Amazon.com Inc* | | 238,254 | | | 20,013,336 | |
Life Sciences Tools & Services – 1.0% | | | |
| | Danaher Corp | | 6,526 | | | 1,732,131 | |
| | Illumina Inc* | | 5,369 | | | 1,085,612 | |
| | Thermo Fisher Scientific Inc | | 3,476 | | | 1,914,198 | |
| | | 4,731,941 | |
Machinery – 2.6% | | | |
| | Deere & Co | | 18,606 | | | 7,977,509 | |
| | Ingersoll Rand Inc | | 72,899 | | | 3,808,973 | |
| | | 11,786,482 | |
Oil, Gas & Consumable Fuels – 1.7% | | | |
| | EOG Resources Inc | | 57,960 | | | 7,506,979 | |
Personal Products – 0.1% | | | |
| | Olaplex Holdings Inc* | | 110,266 | | | 574,486 | |
Pharmaceuticals – 3.5% | | | |
| | AstraZeneca PLC (ADR) | | 65,510 | | | 4,441,578 | |
| | Eli Lilly & Co | | 15,795 | | | 5,778,443 | |
| | Merck & Co Inc | | 36,235 | | | 4,020,273 | |
| | Novartis AG (ADR) | | 16,507 | | | 1,497,515 | |
| | | 15,737,809 | |
Professional Services – 1.2% | | | |
| | CoStar Group Inc* | | 68,970 | | | 5,330,002 | |
Road & Rail – 1.5% | | | |
| | JB Hunt Transport Services Inc | | 23,507 | | | 4,098,681 | |
| | Uber Technologies Inc* | | 106,162 | | | 2,625,386 | |
| | | 6,724,067 | |
Semiconductor & Semiconductor Equipment – 10.7% | | | |
| | Advanced Micro Devices Inc* | | 90,639 | | | 5,870,688 | |
| | ASML Holding NV | | 13,867 | | | 7,576,929 | |
| | KLA Corp | | 11,287 | | | 4,255,538 | |
| | Lam Research Corp | | 16,205 | | | 6,810,962 | |
| | Marvell Technology Inc | | 29,941 | | | 1,109,015 | |
| | NVIDIA Corp | | 100,896 | | | 14,744,941 | |
| | ON Semiconductor Corp* | | 34,242 | | | 2,135,674 | |
| | Teradyne Inc | | 30,238 | | | 2,641,289 | |
| | Texas Instruments Inc | | 20,977 | | | 3,465,820 | |
| | | 48,610,856 | |
Software – 18.6% | | | |
| | Adobe Inc* | | 15,608 | | | 5,252,560 | |
| | Atlassian Corp - Class A* | | 40,157 | | | 5,167,403 | |
| | Autodesk Inc* | | 11,216 | | | 2,095,934 | |
| | Cadence Design Systems Inc* | | 31,075 | | | 4,991,888 | |
| | Microsoft Corp | | 206,736 | | | 49,579,428 | |
| | ServiceNow Inc* | | 9,434 | | | 3,662,939 | |
| | Synopsys Inc* | | 15,822 | | | 5,051,806 | |
| | Tyler Technologies Inc* | | 6,316 | | | 2,036,342 | |
| | Workday Inc - Class A* | | 37,284 | | | 6,238,732 | |
| | | 84,077,032 | |
Specialty Retail – 3.4% | | | |
| | O'Reilly Automotive Inc* | | 8,800 | | | 7,427,464 | |
| | TJX Cos Inc | | 100,664 | | | 8,012,854 | |
| | | 15,440,318 | |
Technology Hardware, Storage & Peripherals – 6.5% | | | |
| | Apple Inc | | 226,499 | | | 29,429,015 | |
Textiles, Apparel & Luxury Goods – 2.6% | | | |
| | Deckers Outdoor Corp* | | 14,873 | | | 5,936,707 | |
| | |
See Notes to Schedule of Investments and Other Information and Notes to Financial Statements. |
| |
Janus Aspen Series | 9 |
Janus Henderson VIT Research Portfolio
Schedule of Investments
December 31, 2022
| | | | | | | | |
Shares
| | | Value | |
Common Stocks– (continued) | | | |
Textiles, Apparel & Luxury Goods– (continued) | | | |
| | NIKE Inc - Class B | | 51,227 | | | $5,994,071 | |
| | | 11,930,778 | |
Trading Companies & Distributors – 0.9% | | | |
| | Ferguson PLC | | 33,851 | | | 4,298,061 | |
Wireless Telecommunication Services – 1.6% | | | |
| | T-Mobile US Inc* | | 53,189 | | | 7,446,460 | |
Total Investments (total cost $311,782,915) – 99.9% | | 451,920,905 | |
Cash, Receivables and Other Assets, net of Liabilities – 0.1% | | 392,655 | |
Net Assets – 100% | | $452,313,560 | |
| | | | | | |
Summary of Investments by Country - (Long Positions) (unaudited) |
| |
| | | | | % of | |
| | | | | Investment | |
Country | | Value | | Securities | |
United States | | $438,404,883 | | 97.0 | % |
Netherlands | | 7,576,929 | | 1.7 | |
United Kingdom | | 4,441,578 | | 1.0 | |
Switzerland | | 1,497,515 | | 0.3 | |
| | | | | | |
| | | | | | |
Total | | $451,920,905 | | 100.0 | % |
| | |
See Notes to Schedule of Investments and Other Information and Notes to Financial Statements. |
| |
10 | DECEMBER 31, 2022 |
Janus Henderson VIT Research Portfolio
Schedule of Investments
December 31, 2022
Schedules of Affiliated Investments – (% of Net Assets)
| | | | | | | | | | | |
| | Dividend Income | Realized Gain/(Loss) | Change in Unrealized Appreciation/ Depreciation | Value at 12/31/22 |
Investment Companies - N/A |
Money Markets - N/A | |
| | Janus Henderson Cash Liquidity Fund LLC, 4.2633%ºº | $ | 10,947 | $ | 63 | $ | - | $ | - |
Investments Purchased with Cash Collateral from Securities Lending - N/A |
Investment Companies - N/A | |
| | Janus Henderson Cash Collateral Fund LLC, 4.1397%ºº | | 22,574∆ | | - | | - | | - |
Total Affiliated Investments - N/A | $ | 33,521 | $ | 63 | $ | - | $ | - |
| | | | | | | | | | | |
| | Value at 12/31/21 | Purchases | Sales Proceeds | Value at 12/31/22 |
Investment Companies - N/A |
Money Markets - N/A | |
| | Janus Henderson Cash Liquidity Fund LLC, 4.2633%ºº | | 1,878,692 | | 33,618,355 | | (35,497,110) | | - |
Investments Purchased with Cash Collateral from Securities Lending - N/A |
Investment Companies - N/A | |
| | Janus Henderson Cash Collateral Fund LLC, 4.1397%ºº | | 1,920,280 | | 26,664,609 | | (28,584,889) | | - |
| | |
See Notes to Schedule of Investments and Other Information and Notes to Financial Statements. |
| |
Janus Aspen Series | 11 |
Janus Henderson VIT Research Portfolio
Notes to Schedule of Investments and Other Information
| | |
Russell 1000® Growth Index | Russell 1000® Growth Index reflects the performance of U.S. large-cap equities with higher price-to-book ratios and higher forecasted growth values. |
Core Growth Index | Core Growth Index is an internally calculated, hypothetical combination of total returns from the Russell 1000® Growth Index (50%) and the S&P 500® Index (50%). |
S&P 500® Index | S&P 500® Index reflects U.S. large-cap equity performance and represents broad U.S. equity market performance. |
| | |
ADR | American Depositary Receipt |
LLC | Limited Liability Company |
PLC | Public Limited Company |
| | |
* | Non-income producing security. |
| | |
ºº | Rate shown is the 7-day yield as of December 31, 2022. |
| | |
∆ | Net of income paid to the securities lending agent and rebates paid to the borrowing counterparties. |
| | | | | | | | | | | | | |
The following is a summary of the inputs that were used to value the Portfolio’s investments in securities and other financial instruments as of December 31, 2022. See Notes to Financial Statements for more information. |
| |
Valuation Inputs Summary |
| | | | | | | |
| | | | | Level 2 - | | Level 3 - |
| | | Level 1 - | | Other Significant | | Significant |
| | | Quoted Prices | | Observable Inputs | | Unobservable Inputs |
| | | | | | | |
Assets | | | | | | |
Investments In Securities: | | | | | | |
Common Stocks | $ | 451,920,905 | $ | - | $ | - |
| | | | | | | |
Janus Henderson VIT Research Portfolio
Statement of Assets and Liabilities
December 31, 2022
| | | | | | | |
| | | | | | |
Assets: | | | | |
| Investments, at value (cost $311,782,915) | | $ | 451,920,905 | |
| Cash denominated in foreign currency (cost $681) | | | 681 | |
| Trustees' deferred compensation | | | 14,681 | |
| Receivables: | | | | |
| | Investments sold | | | 883,486 | |
| | Dividends | | | 135,991 | |
| | Portfolio shares sold | | | 8,544 | |
| | Foreign tax reclaims | | | 1,931 | |
| | Dividends from affiliates | | | 753 | |
| Other assets | | | 5,033 | |
Total Assets | | | 452,972,005 | |
Liabilities: | | | | |
| Due to custodian | | | 155,567 | |
| Payables: | | | — | |
| | Advisory fees | | | 196,241 | |
| | Portfolio shares repurchased | | | 141,770 | |
| | Professional fees | | | 46,459 | |
| | 12b-1 Distribution and shareholder servicing fees | | | 27,347 | |
| | Transfer agent fees and expenses | | | 22,340 | |
| | Trustees' deferred compensation fees | | | 14,681 | |
| | Affiliated portfolio administration fees payable | | | 1,054 | |
| | Custodian fees | | | 443 | |
| | Trustees' fees and expenses | | | 322 | |
| | Accrued expenses and other payables | | | 52,221 | |
Total Liabilities | | | 658,445 | |
Net Assets | | $ | 452,313,560 | |
Net Assets Consist of: | | | | |
| Capital (par value and paid-in surplus) | | $ | 315,453,171 | |
| Total distributable earnings (loss) | | | 136,860,389 | |
Total Net Assets | | $ | 452,313,560 | |
Net Assets - Institutional Shares(1) | | $ | 334,876,647 | |
| Shares Outstanding, $0.001 Par Value (unlimited shares authorized) | | 10,602,752 | |
Net Asset Value Per Share(1) | | $ | 31.58 | |
Net Assets - Service Shares(1) | | $ | 117,436,913 | |
| Shares Outstanding, $0.001 Par Value (unlimited shares authorized) | | 3,892,079 | |
Net Asset Value Per Share(1) | | $ | 30.17 | |
| |
(1) The net asset values and per share information have been revised to correct an error (see Note 7 in the Notes to Financial Statements). |
| | |
See Notes to Financial Statements. |
| |
Janus Aspen Series | 13 |
Janus Henderson VIT Research Portfolio
Statement of Operations
For the year ended December 31, 2022
| | | | | | |
| | | | | |
Investment Income: | | | |
| Dividends | $ | 4,183,141 | |
| Affiliated securities lending income, net | | 22,574 | |
| Dividends from affiliates | | 10,947 | |
| Unaffiliated securities lending income, net | | 865 | |
| Other income | | 91 | |
| Foreign tax withheld | | (15,476) | |
Total Investment Income | | 4,202,142 | |
Expenses: | | | |
| Advisory fees | | 2,471,248 | |
| 12b-1 Distribution and shareholder servicing fees: | | | |
| | Service Shares | | 340,197 | |
| Transfer agent administrative fees and expenses: | | | |
| | Institutional Shares | | 194,239 | |
| | Service Shares | | 68,164 | |
| Other transfer agent fees and expenses: | | | |
| | Institutional Shares | | 8,928 | |
| | Service Shares | | 1,780 | |
| Professional fees | | 48,414 | |
| Registration fees | | 28,886 | |
| Shareholder reports expense | | 22,116 | |
| Affiliated portfolio administration fees | | 13,120 | |
| Trustees’ fees and expenses | | 12,058 | |
| Custodian fees | | 9,491 | |
| Other expenses | | 71,297 | |
Total Expenses | | 3,289,938 | |
Net Investment Income/(Loss) | | 912,204 | |
Net Realized Gain/(Loss) on Investments: | | | |
| Investments and foreign currency transactions | | (7,477,356) | |
| Investments in affiliates | | 63 | |
Total Net Realized Gain/(Loss) on Investments | | (7,477,293) | |
Change in Unrealized Net Appreciation/Depreciation: | | | |
| Investments, foreign currency translations and Trustees’ deferred compensation | | (199,308,093) | |
Total Change in Unrealized Net Appreciation/Depreciation | | (199,308,093) | |
Net Increase/(Decrease) in Net Assets Resulting from Operations | $ | (205,873,182) | |
| | | | | |
| | |
See Notes to Financial Statements. |
| |
14 | DECEMBER 31, 2022 |
Janus Henderson VIT Research Portfolio
Statements of Changes in Net Assets
| | | | | | | | | |
| | | | | | | | |
| | | Year ended
December 31, 2022 | | Year ended
December 31, 2021 | |
| | | | | | | | | |
Operations: | | | | | | |
| Net investment income/(loss) | $ | 912,204 | | $ | (520,721) | |
| Net realized gain/(loss) on investments | | (7,477,293) | | | 95,600,133 | |
| Change in unrealized net appreciation/depreciation | | (199,308,093) | | | 29,592,907 | |
Net Increase/(Decrease) in Net Assets Resulting from Operations | | (205,873,182) | | | 124,672,319 | |
Dividends and Distributions to Shareholders: | | | | | | |
| | Institutional Shares | | (70,400,164) | | | (25,510,438) | |
| | Service Shares | | (25,045,507) | | | (9,384,084) | |
Net Decrease from Dividends and Distributions to Shareholders | | (95,445,671) | | | (34,894,522) | |
Capital Share Transactions: | | | | | | |
| | Institutional Shares | | 37,409,779 | | | (21,249,949) | |
| | Service Shares | | 11,902,394 | | | (10,930,490) | |
Net Increase/(Decrease) from Capital Share Transactions | | 49,312,173 | | | (32,180,439) | |
Net Increase/(Decrease) in Net Assets | | (252,006,680) | | | 57,597,358 | |
Net Assets: | | | | | | |
| Beginning of period | | 704,320,240 | | | 646,722,882 | |
| End of period | $ | 452,313,560 | | $ | 704,320,240 | |
| | | | | | | | |
| | |
See Notes to Financial Statements. |
| |
Janus Aspen Series | 15 |
Janus Henderson VIT Research Portfolio
Financial Highlights
| | | | | | | | | | | | | | | | | | | |
Institutional Shares | | | | | | | | | | | | | | | |
For a share outstanding during the year ended December 31 | | 2022 | | | 2021 | | | 2020 | | | 2019 | | | 2018 | |
| Net Asset Value, Beginning of Period | | $56.31 | | | $49.35 | | | $40.79 | | | $33.70 | | | $36.51 | |
| Income/(Loss) from Investment Operations: | | | | | | | | | | | | | | | |
| | Net investment income/(loss)(1) | | 0.09 | | | (0.01) | | | 0.14 | | | 0.21 | | | 0.19 | |
| | Net realized and unrealized gain/(loss) | | (16.93)(2) | | | 9.73 | | | 12.20 | | | 11.26 | | | (0.94) | |
| Total from Investment Operations | | (16.84)(2) | | | 9.72 | | | 12.34 | | | 11.47 | | | (0.75) | |
| Less Dividends and Distributions: | | | | | | | | | | | | | | | |
| | Dividends (from net investment income) | | (0.06) | | | (0.05) | | | (0.18) | | | (0.18) | | | (0.21) | |
| | Distributions (from capital gains) | | (7.83) | | | (2.71) | | | (3.60) | | | (4.20) | | | (1.85) | |
| Total Dividends and Distributions | | (7.89) | | | (2.76) | | | (3.78) | | | (4.38) | | | (2.06) | |
| Net Asset Value, End of Period | | $31.58(2) | | | $56.31 | | | $49.35 | | | $40.79 | | | $33.70 | |
| Total Return* | | (29.89)%(2) | | | 20.33% | | | 32.95% | | | 35.52% | | | (2.58)% | |
| Net Assets, End of Period (in thousands) | | $334,877(2) | | | $519,679 | | | $474,525 | | | $398,888 | | | $328,803 | |
| Average Net Assets for the Period (in thousands) | | $389,504 | | | $496,858 | | | $414,413 | | | $374,004 | | | $380,194 | |
| Ratios to Average Net Assets**: | | | | | | | | | | | | | | | |
| | Ratio of Gross Expenses | | 0.56% | | | 0.60% | | | 0.60% | | | 0.59% | | | 0.58% | |
| | Ratio of Net Expenses (After Waivers and Expense Offsets) | | 0.56% | | | 0.60% | | | 0.60% | | | 0.59% | | | 0.58% | |
| | Ratio of Net Investment Income/(Loss) | | 0.24% | | | (0.01)% | | | 0.33% | | | 0.55% | | | 0.50% | |
| Portfolio Turnover Rate | | 30% | | | 33% | | | 33% | | | 38% | | | 47% | |
| | | | | | | | | | | | | | | | | | | |
| |
* Total return includes adjustments in accordance with generally accepted accounting principles required at the year or period end and are not annualized for periods of less than one full year. Total return does not include fees, charges, or expenses imposed by the variable annuity and life insurance contracts for which Janus Aspen Series serves as an underlying investment vehicle. ** Annualized for periods of less than one full year. (1) Per share amounts are calculated based on average shares outstanding during the year or period. (2) The net asset values, total return, and per share information has been revised to correct an error (see Note 7 in the Notes to Financial Statements). |
| | |
See Notes to Financial Statements. |
| |
16 | DECEMBER 31, 2022 |
Janus Henderson VIT Research Portfolio
Financial Highlights
| | | | | | | | | | | | | | | | | | | |
Service Shares | | | | | | | | | | | | | | | |
For a share outstanding during the year ended December 31 | | 2022 | | | 2021 | | | 2020 | | | 2019 | | | 2018 | |
| Net Asset Value, Beginning of Period | | $54.34 | | | $47.78 | | | $39.64 | | | $32.87 | | | $35.68 | |
| Income/(Loss) from Investment Operations: | | | | | | | | | | | | | | | |
| | Net investment income/(loss)(1) | | —(2) | | | (0.13) | | | 0.03 | | | 0.11 | | | 0.09 | |
| | Net realized and unrealized gain/(loss) | | (16.34)(3) | | | 9.41 | | | 11.80 | | | 10.98 | | | (0.92) | |
| Total from Investment Operations | | (16.34)(3) | | | 9.28 | | | 11.83 | | | 11.09 | | | (0.83) | |
| Less Dividends and Distributions: | | | | | | | | | | | | | | | |
| | Dividends (from net investment income) | | — | | | (0.01) | | | (0.09) | | | (0.12) | | | (0.13) | |
| | Distributions (from capital gains) | | (7.83) | | | (2.71) | | | (3.60) | | | (4.20) | | | (1.85) | |
| Total Dividends and Distributions | | (7.83) | | | (2.72) | | | (3.69) | | | (4.32) | | | (1.98) | |
| Net Asset Value, End of Period | | $30.17(3) | | | $54.34 | | | $47.78 | | | $39.64 | | | $32.87 | |
| Total Return* | | (30.06)%(3) | | | 20.05% | | | 32.58% | | | 35.22% | | | (2.84)% | |
| Net Assets, End of Period (in thousands) | | $117,437(3) | | | $184,641 | | | $172,198 | | | $150,614 | | | $126,817 | |
| Average Net Assets for the Period (in thousands) | | $136,703 | | | $178,748 | | | $151,973 | | | $141,550 | | | $148,101 | |
| Ratios to Average Net Assets**: | | | | | | | | | | | | | | | |
| | Ratio of Gross Expenses | | 0.81% | | | 0.85% | | | 0.85% | | | 0.84% | | | 0.83% | |
| | Ratio of Net Expenses (After Waivers and Expense Offsets) | | 0.81% | | | 0.85% | | | 0.85% | | | 0.84% | | | 0.83% | |
| | Ratio of Net Investment Income/(Loss) | | (0.01)% | | | (0.26)% | | | 0.08% | | | 0.30% | | | 0.25% | |
| Portfolio Turnover Rate | | 30% | | | 33% | | | 33% | | | 38% | | | 47% | |
| | | | | | | | | | | | | | | | | | | |
| |
* Total return includes adjustments in accordance with generally accepted accounting principles required at the year or period end and are not annualized for periods of less than one full year. Total return does not include fees, charges, or expenses imposed by the variable annuity and life insurance contracts for which Janus Aspen Series serves as an underlying investment vehicle. ** Annualized for periods of less than one full year. (1) Per share amounts are calculated based on average shares outstanding during the year or period. (2) Less than $0.005 on a per share basis. (3) The net asset values, total return, and per share information has been revised to correct an error (see Note 7 in the Notes to Financial Statements). |
| | |
See Notes to Financial Statements. |
| |
Janus Aspen Series | 17 |
Janus Henderson VIT Research Portfolio
Notes to Financial Statements
1. Organization and Significant Accounting Policies
Janus Henderson VIT Research Portfolio (the “Portfolio”) is a series of Janus Aspen Series (the “Trust”), which is organized as a Delaware statutory trust and is registered under the Investment Company Act of 1940, as amended (the “1940 Act”), as an open-end management investment company, and therefore has applied the specialized accounting and reporting guidance in Financial Accounting Standards Board (“FASB”) Accounting Standards Codification (“ASC”) Topic 946. The Trust offers 11 portfolios, each of which offers multiple share classes, with differing investment objectives and policies. The Portfolio seeks long-term growth of capital. The Portfolio is classified as diversified, as defined in the 1940 Act. Janus Henderson Investors US LLC is the investment adviser (the “Adviser”) to the Portfolio.
The Portfolio currently offers two classes of shares: Institutional Shares and Service Shares. Each class represents an interest in the same portfolio of investments. Institutional Shares are offered only in connection with investment in and payments under variable insurance contracts as well as certain qualified retirement plans. Service Shares are offered only in connection with investment in and payments under variable insurance contracts as well as certain qualified retirement plans that require a fee from Portfolio assets to procure distribution and administrative services to contract owners and plan participants.
Shareholders, including participating insurance companies, as well as accounts, may from time to time own (beneficially or of record) a significant percentage of the Portfolio’s Shares and can be considered to “control” the Portfolio when that ownership exceeds 25% of the Portfolio’s assets (and which may differ from control as determined in accordance with United States of America generally accepted accounting principles ("US GAAP")).
The following accounting policies have been followed by the Portfolio and are in conformity with US GAAP.
Investment Valuation
Portfolio holdings are valued in accordance with policies and procedures established by the Adviser pursuant to Rule 2a-5 under the 1940 Act and approved by and subject to the oversight of the Trustees (the “Valuation Procedures”). Equity securities traded on a domestic securities exchange are generally valued at readily available market quotations, which are (i) the official close prices or (ii) last sale prices on the primary market or exchange in which the securities trade. If such price is lacking for the trading period immediately preceding the time of determination, such securities are generally valued at their current bid price. Equity securities that are traded on a foreign exchange are generally valued at the closing prices on such markets. In the event that there is no current trading volume on a particular security in such foreign exchange, the bid price from the primary exchange is generally used to value the security. Foreign securities and currencies are converted to U.S. dollars using the current spot USD dollar exchange rate in effect at the close of the New York Stock Exchange (“NYSE”). The Portfolio will determine the market value of individual securities held by it by using prices provided by one or more approved professional pricing services or, as needed, by obtaining market quotations from independent broker-dealers. Most debt securities are valued in accordance with the evaluated bid price supplied by the Adviser-approved pricing service that is intended to reflect market value. The evaluated bid price supplied by the pricing service is an evaluation that may consider factors such as security prices, yields, maturities and ratings. Certain short-term securities maturing within 60 days or less may be evaluated and valued on an amortized cost basis provided that the amortized cost determined approximates market value. Securities for which market quotations or evaluated prices are not readily available or deemed unreliable are valued at fair value determined in good faith by the Adviser pursuant to the Valuation Procedures. Circumstances in which fair valuation may be utilized include, but are not limited to: (i) a significant event that may affect the securities of a single issuer, such as a merger, bankruptcy, or significant issuer-specific development; (ii) an event that may affect an entire market, such as a natural disaster or significant governmental action; (iii) a nonsignificant event such as a market closing early or not opening, or a security trading halt; and (iv) pricing of a nonvalued security and a restricted or nonpublic security. Special valuation considerations may apply with respect to “odd-lot” fixed-income transactions which, due to their small size, may receive evaluated prices by pricing services which reflect a large block trade and not what actually could be obtained for the odd-lot position. The valuation policies provide for the use of systematic fair valuation models provided by independent pricing services to value foreign equity securities in order to adjust for stale pricing, which may occur between the close of certain foreign exchanges and the close of the NYSE. The value of the securities of other mutual funds held by a Portfolio, if any, will be calculated using the NAV of such mutual funds.
Valuation Inputs Summary
FASB ASC 820, Fair Value Measurements and Disclosures (“ASC 820”), defines fair value, establishes a framework for measuring fair value, and expands disclosure requirements regarding fair value measurements. This standard
Janus Henderson VIT Research Portfolio
Notes to Financial Statements
emphasizes that fair value is a market-based measurement that should be determined based on the assumptions that market participants would use in pricing an asset or liability and establishes a hierarchy that prioritizes inputs to valuation techniques used to measure fair value. These inputs are summarized into three broad levels:
Level 1 – Unadjusted quoted prices in active markets the Portfolio has the ability to access for identical assets or liabilities.
Level 2 – Observable inputs other than unadjusted quoted prices included in Level 1 that are observable for the asset or liability either directly or indirectly. These inputs may include quoted prices for the identical instrument on an inactive market, prices for similar instruments, interest rates, prepayment speeds, credit risk, yield curves, default rates and similar data.
Assets or liabilities categorized as Level 2 in the hierarchy generally include: debt securities fair valued in accordance with the evaluated bid or ask prices supplied by a pricing service; securities traded on OTC markets and listed securities for which no sales are reported that are fair valued at the latest bid price (or yield equivalent thereof) obtained from one or more dealers transacting in a market for such securities or by a pricing service approved by the Portfolio’s Trustees; certain short-term debt securities with maturities of 60 days or less that are fair valued at amortized cost; and equity securities of foreign issuers whose fair value is determined by using systematic fair valuation models provided by independent third parties in order to adjust for stale pricing which may occur between the close of certain foreign exchanges and the close of the NYSE. Other securities that may be categorized as Level 2 in the hierarchy include, but are not limited to, preferred stocks, bank loans, swaps, investments in unregistered investment companies, options, and forward contracts.
Level 3 – Unobservable inputs for the asset or liability to the extent that relevant observable inputs are not available, representing the Portfolio’s own assumptions about the assumptions that a market participant would use in valuing the asset or liability, and that would be based on the best information available.
There have been no significant changes in valuation techniques used in valuing any such positions held by the Portfolio since the beginning of the fiscal year.
The inputs or methodology used for fair valuing securities are not necessarily an indication of the risk associated with investing in those securities. The summary of inputs used as of December 31, 2022 to fair value the Portfolio’s investments in securities and other financial instruments is included in the “Valuation Inputs Summary” in the Notes to Schedule of Investments and Other Information.
Investment Transactions and Investment Income
Investment transactions are accounted for as of the date purchased or sold (trade date). Dividend income is recorded on the ex-dividend date. Certain dividends from foreign securities will be recorded as soon as the Portfolio is informed of the dividend, if such information is obtained subsequent to the ex-dividend date. Dividends from foreign securities may be subject to withholding taxes in foreign jurisdictions. Non-cash dividends, if any, are recorded on the ex-dividend date at fair value. Interest income is recorded daily on the accrual basis and includes amortization of premiums and accretion of discounts. The Portfolio classifies gains and losses on prepayments received as an adjustment to interest income. Debt securities may be placed in non-accrual status and related interest income may be reduced by stopping current accruals and writing off interest receivables when collection of all or a portion of interest has become doubtful. Gains and losses are determined on the identified cost basis, which is the same basis used for federal income tax purposes. Income, as well as gains and losses, both realized and unrealized, are allocated daily to each class of shares based upon the ratio of net assets represented by each class as a percentage of total net assets.
Expenses
The Portfolio bears expenses incurred specifically on its behalf. Each class of shares bears a portion of general expenses, which are allocated daily to each class of shares based upon the ratio of net assets represented by each class as a percentage of total net assets. Expenses directly attributable to a specific class of shares are charged against the operations of such class.
Estimates
The preparation of financial statements in conformity with US GAAP requires management to make estimates and assumptions that affect the reported amount of assets and liabilities and disclosure of contingent assets and liabilities at the date of the financial statements, and the reported amounts of income and expenses during the reporting period. Actual results could differ from those estimates.
Janus Henderson VIT Research Portfolio
Notes to Financial Statements
Indemnifications
In the normal course of business, the Portfolio may enter into contracts that contain provisions for indemnification of other parties against certain potential liabilities. The Portfolio’s maximum exposure under these arrangements is unknown, and would involve future claims that may be made against the Portfolio that have not yet occurred. Currently, the risk of material loss from such claims is considered remote.
Foreign Currency Translations
The Portfolio does not isolate that portion of the results of operations resulting from the effect of changes in foreign exchange rates on investments from the fluctuations arising from changes in market prices of securities held at the date of the financial statements. Net unrealized appreciation or depreciation of investments and foreign currency translations arise from changes in the value of assets and liabilities, including investments in securities held at the date of the financial statements, resulting from changes in the exchange rates and changes in market prices of securities held.
Currency gains and losses are also calculated on payables and receivables that are denominated in foreign currencies. The payables and receivables are generally related to foreign security transactions and income translations.
Foreign currency-denominated assets and forward currency contracts may involve more risks than domestic transactions, including currency risk, counterparty risk, political and economic risk, regulatory risk and equity risk. Risks may arise from unanticipated movements in the value of foreign currencies relative to the U.S. dollar.
Dividends and Distributions
The Portfolio may make semiannual distributions of substantially all of its investment income and an annual distribution of its net realized capital gains (if any).
The Portfolio may make certain investments in real estate investment trusts (“REITs”) which pay dividends to their shareholders based upon funds available from operations. It is quite common for these dividends to exceed the REITs’ taxable earnings and profits, resulting in the excess portion of such dividends being designated as a return of capital. If the Portfolio distributes such amounts, such distributions could constitute a return of capital to shareholders for federal income tax purposes.
Federal Income Taxes
The Portfolio intends to continue to qualify as a regulated investment company and distribute all of its taxable income in accordance with the requirements of Subchapter M of the Internal Revenue Code. Management has analyzed the Portfolio’s tax positions taken for all open federal income tax years, generally a three-year period, and has concluded that no provision for federal income tax is required in the Portfolio’s financial statements. The Portfolio is not aware of any tax positions for which it is reasonably possible that the total amounts of unrecognized tax benefits will significantly change in the next twelve months.
2. Other Investments and Strategies
Additional Investment Risk
The U.S. government and the Federal Reserve, as well as certain foreign governments and central banks, have taken extraordinary actions to support local and global economies and the financial markets in response to the COVID-19 pandemic. This and other government intervention into the economy and financial markets to address the COVID-19 pandemic may not work as intended, particularly if the efforts are perceived by investors as being unlikely to achieve the desired results. Government actions to mitigate the economic impact of the pandemic have resulted in a large expansion of government deficits and debt, the long term consequences of which are not known. The COVID-19 pandemic could adversely affect the value and liquidity of a Portfolio’s investments, impair a Portfolio’s ability to satisfy redemption requests, and negatively impact a Portfolio’s performance. In addition, the outbreak of COVID-19, and measures taken to mitigate its effects, could result in disruptions to the services provided to a Portfolio by its service providers.
Widespread disease, including pandemics and epidemics, and natural or environmental disasters, including those which may be attributable to global climate change, such as earthquakes, fires, floods, hurricanes, tsunamis and weather-related phenomena generally, have been and can be highly disruptive to economies and markets, adversely impacting individual companies, sectors, industries, markets, currencies, interest and inflation rates, credit ratings, investor sentiment, and other factors affecting the value of a Portfolio’s investments. Economies and financial markets throughout the world have become increasingly interconnected, which increases the likelihood that events or conditions
Janus Henderson VIT Research Portfolio
Notes to Financial Statements
in one region or country will adversely affect markets or issuers in other regions or countries, including the United States. These disruptions could prevent a Portfolio from executing advantageous investment decisions in a timely manner and negatively impact a Portfolio’s ability to achieve its investment objective(s). Any such event(s) could have a significant adverse impact on the value of a Portfolio. In addition, these disruptions could also impair the information technology and other operational systems upon which the Portfolio’s service providers, including the Adviser or the subadviser (as applicable), rely, and could otherwise disrupt the ability of employees of the Portfolio’s service providers to perform essential tasks on behalf of the Portfolio. Adverse weather conditions may also have a particularly significant negative effect on issuers in the agricultural sector and on insurance and reinsurance companies that insure or reinsure against the impact of natural disasters.
A number of countries in the European Union (the “EU”) have experienced, and may continue to experience, severe economic and financial difficulties. In particular, many EU nations are susceptible to economic risks associated with high levels of debt. Many non-governmental issuers, and even certain governments, have defaulted on, or been forced to restructure, their debts. Many other issuers have faced difficulties obtaining credit or refinancing existing obligations. Financial institutions have in many cases required government or central bank support, have needed to raise capital, and/or have been impaired in their ability to extend credit. As a result, financial markets in the EU have experienced extreme volatility and declines in asset values and liquidity. These difficulties may continue, worsen, or spread further within the EU. Responses to these financial problems by European governments, central banks, and others, including austerity measures and reforms, may not work, may result in social unrest, and may limit future growth and economic recovery or have other unintended consequences. Among other things, these developments have adversely affected the value and exchange rate of the euro and pound sterling, and may continue to significantly affect the economies of all EU countries, which in turn may have a material adverse effect on the Portfolio’s investments in such countries, other countries that depend on EU countries for significant amounts of trade or investment, or issuers with exposure to debt issued by certain EU countries.
Real Estate Investing
The Portfolio may invest in equity and debt securities of real estate-related companies. Such companies may include those in the real estate industry or real estate-related industries. These securities may include common stocks, corporate bonds, preferred stocks, and other equity securities, including, but not limited to, mortgage-backed securities, real estate-backed securities, securities of REITs and similar REIT-like entities. A REIT is a trust that invests in real estate-related projects, such as properties, mortgage loans, and construction loans. REITs are generally categorized as equity, mortgage, or hybrid REITs. A REIT may be listed on an exchange or traded OTC.
Counterparties
Portfolio transactions involving a counterparty are subject to the risk that the counterparty or a third party will not fulfill its obligation to the Portfolio (“counterparty risk”). Counterparty risk may arise because of the counterparty’s financial condition (i.e., financial difficulties, bankruptcy, or insolvency), market activities and developments, or other reasons, whether foreseen or not. A counterparty’s inability to fulfill its obligation may result in significant financial loss to the Portfolio. The Portfolio may be unable to recover its investment from the counterparty or may obtain a limited recovery, and/or recovery may be delayed. The extent of the Portfolio’s exposure to counterparty risk with respect to financial assets and liabilities approximates its carrying value. See the "Offsetting Assets and Liabilities" section of this Note for further details.
The Portfolio may be exposed to counterparty risk through participation in various programs, including, but not limited to, lending its securities to third parties, cash sweep arrangements whereby the Portfolio’s cash balance is invested in one or more types of cash management vehicles, as well as investments in, but not limited to, repurchase agreements, debt securities, and derivatives, including various types of swaps, futures and options. The Portfolio intends to enter into financial transactions with counterparties that the Adviser believes to be creditworthy at the time of the transaction. There is always the risk that the Adviser’s analysis of a counterparty’s creditworthiness is incorrect or may change due to market conditions. To the extent that the Portfolio focuses its transactions with a limited number of counterparties, it will have greater exposure to the risks associated with one or more counterparties.
Janus Henderson VIT Research Portfolio
Notes to Financial Statements
Securities Lending
Under procedures adopted by the Trustees, the Portfolio may seek to earn additional income by lending securities to certain qualified broker-dealers and institutions. JPMorgan Chase Bank, National Association acts as securities lending agent and a limited purpose custodian or subcustodian to receive and disburse cash balances and cash collateral, hold short-term investments, hold collateral, and perform other custodial functions in accordance with the Non-Custodial Securities Lending Agreement. For financial reporting purposes, the Portfolio does not offset financial instruments’ payables and receivables and related collateral on the Statement of Assets and Liabilities. The Portfolio may lend portfolio securities in an amount equal to up to 1/3 of its total assets as determined at the time of the loan origination. There is the risk of delay in recovering a loaned security or the risk of loss in collateral rights if the borrower fails financially. In addition, the Adviser makes efforts to balance the benefits and risks from granting such loans. All loans will be continuously secured by collateral which may consist of cash, U.S. Government securities, domestic and foreign short-term debt instruments, letters of credit, time deposits, repurchase agreements, money market mutual funds or other money market accounts, or such other collateral as permitted by the Securities and Exchange Commission (the "SEC"). If the Portfolio is unable to recover a security on loan, the Portfolio may use the collateral to purchase replacement securities in the market. There is a risk that the value of the collateral could decrease below the cost of the replacement security by the time the replacement investment is made, resulting in a loss to the Portfolio. In certain circumstances individual loan transactions could yield negative returns.
Upon receipt of cash collateral, the Adviser may invest it in affiliated or non-affiliated cash management vehicles, whether registered or unregistered entities, as permitted by the 1940 Act and rules promulgated thereunder. The Adviser currently intends to primarily invest the cash collateral in a cash management vehicle for which the Adviser serves as investment adviser, Janus Henderson Cash Collateral Fund LLC, or in time deposits. An investment in Janus Henderson Cash Collateral Fund LLC is generally subject to the same risks that shareholders experience when investing in similarly structured vehicles, such as the potential for significant fluctuations in assets as a result of the purchase and redemption activity of the securities lending program, a decline in the value of the collateral, and possible liquidity issues. Such risks may delay the return of the cash collateral and cause the Portfolio to violate its agreement to return the cash collateral to a borrower in a timely manner. As adviser to the Portfolio and Janus Henderson Cash Collateral Fund LLC, the Adviser has an inherent conflict of interest as a result of its fiduciary duties to both the Portfolio and Janus Henderson Cash Collateral Fund LLC. Additionally, the Adviser receives an investment advisory fee of 0.05% for managing Janus Henderson Cash Collateral Fund LLC, but it may not receive a fee for managing certain other affiliated cash management vehicles in which the Portfolio may invest, and therefore may have an incentive to allocate preferred investment opportunities to investment vehicles for which it is receiving a fee.
The value of the collateral must be at least 102% of the market value of the loaned securities that are denominated in U.S. dollars and 105% of the market value of the loaned securities that are not denominated in U.S. dollars. Loaned securities and related collateral are marked-to-market each business day based upon the market value of the loaned securities at the close of business, employing the most recent available pricing information. Collateral levels are then adjusted based on this mark-to-market evaluation. Additional required collateral, or excess collateral returned, is delivered on the next business day. Therefore, the value of the collateral held may be temporarily less than 102% or 105% value of the securities on loan. The cash collateral invested by the Adviser is disclosed in the Schedule of Investments (if applicable).
Income earned from the investment of the cash collateral, net of rebates paid to, or fees paid by, borrowers and less the fees paid to the lending agent are included as “Affiliated securities lending income, net” on the Statement of Operations.
There were no securities on loan as of December 31, 2022.
3. Investment Advisory Agreements and Other Transactions with Affiliates
The Portfolio pays the Adviser an investment advisory fee rate that may adjust up or down based on the Portfolio’s performance relative to its benchmark index.
The investment advisory fee rate paid to the Adviser by the Portfolio consists of two components: (1) a base fee calculated by applying the contractual fixed rate of the advisory fee to the Portfolio’s average daily net assets during the previous month (the “Base Fee Rate”), plus or minus (2) a performance-fee adjustment (the “Performance Adjustment”) calculated by applying a variable rate of up to 0.15% (positive or negative) to the Portfolio’s average daily net assets based on the Portfolio’s relative performance compared to the cumulative investment record of its benchmark index
Janus Henderson VIT Research Portfolio
Notes to Financial Statements
over a 36-month performance measurement period or shorter time period, as applicable. The investment advisory fee rate is calculated daily and paid monthly.
The investment performance of the Portfolio’s Service Shares for the performance measurement period is used to calculate the Performance Adjustment. The Portfolio’s Base Fee Rate prior to any performance adjustment (expressed as an annual rate) is 0.64%, and the Portfolio’s benchmark index used in the calculation is the Russell 1000 Growth Index®. Effective May 1, 2020, the Core Growth Index was eliminated from the Performance Adjustment calculation for the Portfolio.
No Performance Adjustment is applied unless the difference between the Portfolio’s investment performance and the cumulative investment record of the Portfolio’s benchmark index is 0.50% or greater (positive or negative) during the applicable performance measurement period. The Base Fee Rate is subject to an upward or downward Performance Adjustment for every full 0.50% increment by which the Portfolio outperforms or underperforms its benchmark index, up to the Portfolio’s full performance rate of ±5.00%. Because the Performance Adjustment is tied to a Portfolio’s relative performance compared to its benchmark index (and not its absolute performance), the Performance Adjustment could increase the Adviser’s fee even if the Portfolio’s Shares lose value during the performance measurement period and could decrease the Adviser’s fee even if the Portfolio’s Shares increase in value during the performance measurement period. For purposes of computing the Base Fee Rate and the Performance Adjustment, net assets are averaged over different periods (average daily net assets during the previous month for the Base Fee Rate, versus average daily net assets during the performance measurement period for the Performance Adjustment). Performance of the Portfolio is calculated net of expenses whereas the Portfolio’s benchmark index does not have any fees or expenses. Reinvestment of dividends and distributions is included in calculating both the performance of a Portfolio and the Portfolio’s benchmark index.
The Portfolio’s prospectuses and statement(s) of additional information contain additional information about performance-based fees. The amount shown as advisory fees on the Statement of Operations reflects the Base Fee Rate plus/minus any Performance Adjustment. For the year ended December 31, 2022, the performance adjusted investment advisory fee rate before any waivers and/or reimbursements of expenses is 0.47%.
The Adviser serves as administrator to the Portfolio pursuant to an administration agreement between the Adviser and the Trust. Under the administration agreement, the Adviser is authorized to perform, or cause others to perform certain administration, compliance, and accounting services to the Portfolio, including providing office space for the Portfolio, and is reimbursed by the Portfolio for certain of its costs in providing these services (to the extent the Adviser seeks reimbursement and such costs are not otherwise waived). In addition, employees of the Adviser and/or its affiliates may serve as officers of the Trust. The Portfolio pays for some or all of the salaries, fees, and expenses of the Adviser employees and Portfolio officers, with respect to certain specified administration functions they perform on behalf of the Portfolio. The Portfolio pays these costs based on out-of-pocket expenses incurred by the Adviser, and these costs are separate and apart from advisory fees and other expenses paid in connection with the investment advisory services the Adviser (or any subadvisor, as applicable) provides to the Portfolio. These amounts are disclosed as “Affiliated portfolio administration fees” on the Statement of Operations. In addition, some expenses related to compensation payable to the Portfolio’s Chief Compliance Officer and certain compliance staff, all of whom are employees of the Adviser and/or its affiliates, are shared with the Portfolio. Total compensation of $48,451 was paid to the Chief Compliance Officer and certain compliance staff by the Trust during the year ended December 31, 2022. The Portfolio's portion is reported as part of “Other expenses” on the Statement of Operations.
Janus Henderson Services US LLC (the “Transfer Agent”), a wholly-owned subsidiary of the Adviser, is the Portfolio’s transfer agent. The Transfer Agent receives an administrative services fee at an annual rate of 0.05% of the average daily net assets of the Portfolio for arranging for the provision by participating insurance companies and qualified plan service providers of administrative services, including, but not limited to, recordkeeping, subaccounting, answering inquiries regarding accounts, order processing, transaction confirmations, the mailing of prospectuses and shareholder reports, and other shareholder services provided on behalf of contract holders or plan participants investing in the Portfolio. The Transfer Agent expects to use this entire fee to compensate insurance companies and qualified plan service providers for providing these services to their customers who invest in the Portfolio.
The Transfer Agent is not compensated for internal services related to the shares, except for out-of-pocket costs. These amounts are disclosed as “Other transfer agent fees and expenses” on the Statement of Operations.
Janus Henderson VIT Research Portfolio
Notes to Financial Statements
Under a distribution and shareholder servicing plan (the “Plan”) adopted in accordance with Rule 12b-1 under the 1940 Act, the Service Shares may pay the Trust’s distributor, Janus Henderson Distributors US LLC (the “Distributor”), a wholly-owned subsidiary of the Adviser, a fee for the sale and distribution and/or shareholder servicing of the Service Shares at an annual rate of up to 0.25% of the average daily net assets of the Service Shares. Under the terms of the Plan, the Trust is authorized to make payments to the Distributor for remittance to insurance companies and qualified plan service providers as compensation for distribution and/or shareholder services performed by such entities. These amounts are disclosed as “12b-1 Distribution and shareholder servicing fees” on the Statement of Operations.
The Board of Trustees has adopted a deferred compensation plan (the “Deferred Plan”) for independent Trustees to elect to defer receipt of all or a portion of the annual compensation they are entitled to receive from the Portfolio. All deferred fees are credited to an account established in the name of the Trustees. The amounts credited to the account then increase or decrease, as the case may be, in accordance with the performance of one or more of the Janus Henderson funds that are selected by the Trustees. The account balance continues to fluctuate in accordance with the performance of the selected fund or funds until final payment of all amounts are credited to the account. The fluctuation of the account balance is recorded by the Portfolio as unrealized appreciation/(depreciation) and is included as of December 31, 2022 on the Statement of Assets and Liabilities in the asset, “Trustees’ deferred compensation,” and liability, “Trustees’ deferred compensation fees.” Additionally, the recorded unrealized appreciation/(depreciation) is included in “Total distributable earnings (loss)” on the Statement of Assets and Liabilities. Deferred compensation expenses for the year ended December 31, 2022 are included in “Trustees’ fees and expenses” on the Statement of Operations. Trustees are allowed to change their designation of mutual funds from time to time. Amounts will be deferred until distributed in accordance with the Deferred Plan. Deferred fees of $433,851 were paid by the Trust to the Trustees under the Deferred Plan during the year ended December 31, 2022.
Pursuant to the provisions of the 1940 Act and related rules, the Portfolio may participate in an affiliated or non-affiliated cash sweep program. In the cash sweep program, uninvested cash balances of the Portfolio may be used to purchase shares of affiliated or non-affiliated money market funds or cash management pooled investment vehicles that operate as money market funds. The Portfolio is eligible to participate in the cash sweep program (the “Investing Funds”). The Adviser has an inherent conflict of interest because of its fiduciary duties to the affiliated money market funds or cash management pooled investment vehicles and the Investing Funds. Janus Henderson Cash Liquidity Fund LLC (the “Sweep Vehicle”) is an affiliated unregistered cash management pooled investment vehicle that invests primarily in highly-rated short-term fixed-income securities. The Sweep Vehicle operates pursuant to the provisions of the 1940 Act that govern the operation of money market funds and prices its shares at NAV reflecting market-based values of its portfolio securities (i.e., a “floating” NAV) rounded to the fourth decimal place (e.g., $1.0000). The Sweep Vehicle is permitted to impose a liquidity fee (of up to 2%) on redemptions from the Sweep Vehicle or a redemption gate that temporarily suspends redemptions from the Sweep Vehicle for up to 10 business days during a 90 day period. There are no restrictions on the Portfolio's ability to withdraw investments from the Sweep Vehicle at will, and there are no unfunded capital commitments due from the Portfolio to the Sweep Vehicle. The Sweep Vehicle does not charge any management fee, sales charge or service fee.
Any purchases and sales, realized gains/losses and recorded dividends from affiliated investments during the year ended December 31, 2022 can be found in the “Schedules of Affiliated Investments” located in the Schedule of Investments.
The Portfolio is permitted to purchase or sell securities (“cross-trade”) between itself and other funds or accounts managed by the Adviser in accordance with Rule 17a-7 under the Investment Company Act of 1940 (“Rule 17a-7”), when the transaction is consistent with the investment objectives and policies of the Portfolio and in accordance with the Internal Cross Trade Procedures adopted by the Trust’s Board of Trustees. These procedures have been designed to ensure that any cross-trade of securities by the Portfolio from or to another fund or account that is or could be considered an affiliate of the Portfolio under certain limited circumstances by virtue of having a common investment adviser, common Officer, or common Trustee complies with Rule 17a-7. Under these procedures, each cross-trade is effected at the current market price to save costs where allowed. During the year ended December 31, 2022, the Portfolio engaged in cross trades amounting to $599,908 in purchases and $2,738,049 in sales, resulting in a net realized gain of $220,899. The net realized gain is included within the “Net Realized Gain/(Loss) on Investments” section of the Portfolio’s Statement of Operations.
Janus Henderson VIT Research Portfolio
Notes to Financial Statements
4. Federal Income Tax
The tax components of capital shown in the table below represent: (1) distribution requirements the Portfolio must satisfy under the income tax regulations; (2) losses or deductions the Portfolio may be able to offset against income and gains realized in future years; and (3) unrealized appreciation or depreciation of investments for federal income tax purposes.
Other book to tax differences primarily consist of deferred compensation. The Portfolio has elected to treat gains and losses on forward foreign currency contracts as capital gains and losses, if applicable. Other foreign currency gains and losses on debt instruments are treated as ordinary income for federal income tax purposes pursuant to Section 988 of the Internal Revenue Code.
| | | | | | | |
| | | | Other Book | Net Tax | |
Undistributed
Ordinary Income | Undistributed
Long-Term Gains | Accumulated
Capital Losses | Loss Deferrals | to Tax
Differences | Appreciation/
(Depreciation) | |
$ 299,073 | $ - | $ (7,617,272) | $ - | $ (12,827) | $144,191,415 | |
Accumulated capital losses noted below represent net capital loss carryovers, as of December 31, 2022, that may be available to offset future realized capital gains and thereby reduce future taxable gains distributions. The following table shows these capital loss carryovers.
| | | | | | |
| | | | | |
Capital Loss Carryover Schedule | | |
For the year ended December 31, 2022 | | |
| No Expiration | | | |
| Short-Term | Long-Term | Accumulated
Capital Losses | | |
| $(7,617,272) | $ - | $ (7,617,272) | | |
The aggregate cost of investments and the composition of unrealized appreciation and depreciation of investment securities for federal income tax purposes as of December 31, 2022 are noted below. The primary difference between book and tax appreciation or depreciation of investments are wash sale loss deferrals, investments in partnerships and straddle loss deferrals.
| | | | |
Federal Tax Cost | Unrealized
Appreciation | Unrealized
(Depreciation) | Net Tax Appreciation/
(Depreciation) |
$ 313,075,273 | $171,620,920 | $(27,429,505) | $ 144,191,415 |
Income and capital gains distributions are determined in accordance with income tax regulations that may differ from US GAAP. These differences are due to differing treatments for items such as net short-term gains, deferral of wash sale losses, foreign currency transactions, and capital loss carryovers. Certain permanent differences such as tax returns of capital and net investment losses noted below have been reclassified to capital.
| | | | | |
For the year ended December 31, 2022 | |
Distributions | | |
From Ordinary Income | From Long-Term Capital Gains | Tax Return of Capital | Net Investment Loss | |
$ 3,510,683 | $ 91,934,988 | $ - | $ - | |
Janus Henderson VIT Research Portfolio
Notes to Financial Statements
| | | | | |
For the year ended December 31, 2021 | |
Distributions | | |
From Ordinary Income | From Long-Term Capital Gains | Tax Return of Capital | Net Investment Loss | |
$ 523,535 | $ 34,370,987 | $ - | $ - | |
Permanent book to tax basis differences may result in reclassifications between the components of net assets. These differences have no impact on the results of operations or net assets.
5. Capital Share Transactions
| | | | | | | |
| | | | | | |
| | Year ended December 31, 2022 | | Year ended December 31, 2021 |
| | Shares | Amount | | Shares | Amount |
| | | | | | | |
Institutional Shares: | | | | | |
Shares sold | 144,237 | $ 5,476,747 | | 151,828 | $ 7,960,660 |
Reinvested dividends and distributions | 2,228,505 | 70,400,164 | | 503,363 | 25,510,438 |
Shares repurchased | (999,614) | (38,467,132) | | (1,041,978) | (54,721,047) |
Net Increase/(Decrease) | 1,373,128 | $37,409,779 | | (386,787) | $(21,249,949) |
Service Shares: | | | | | |
Shares sold | 225,334 | $ 7,953,370 | | 129,269 | $ 6,465,528 |
Reinvested dividends and distributions | 830,421 | 25,045,507 | | 191,590 | 9,384,084 |
Shares repurchased | (561,806) | (21,096,483) | | (526,614) | (26,780,102) |
Net Increase/(Decrease) | 493,949 | $11,902,394 | | (205,755) | $(10,930,490) |
6. Purchases and Sales of Investment Securities
For the year ended December 31, 2022, the aggregate cost of purchases and proceeds from sales of investment securities (excluding any short-term securities, short-term options contracts, TBAs, and in-kind transactions, as applicable) was as follows:
| | | | |
Purchases of
Securities | Proceeds from Sales
of Securities | Purchases of Long-
Term U.S. Government
Obligations | Proceeds from Sales
of Long-Term U.S.
Government Obligations |
$157,917,382 | $ 201,550,285 | $ - | $ - |
7. Revision to Previously Issued Financial Statements
Subsequent to the issuance of the financial statements for the year ended December 31, 2022, management identified an error in a financial statement adjustment resulting in a misallocation between share class net assets. The impact of the error was not material to the December 31, 2022 financial statements. The error did not impact the Fund’s net assets or net investment income.
As a result, the Fund has revised its Statement of Assets and Liabilities as of December 31, 2022, and its Financial Highlights for the year ended December 31, 2022.
Janus Henderson VIT Research Portfolio
Notes to Financial Statements
The following summarizes the impact of the revision and excludes balances that were not revised:
Statement of Assets and Liabilities:
| | | | |
| | For the year ended, December 31, 2022 |
| | As Reported | Adjustment | As Revised |
Net Assets - Institutional Shares | $336,291,001 | $(1,414,354) | $334,876,647 |
Net Asset Value Per Share - Institutional Shares | $31.72 | $(0.14) | $31.58 |
Net Assets - Service Shares | $116,022,559 | $1,414,354 | $117,436,913 |
Net Asset Value Per Share - Service Shares | $29.81 | $0.36 | $30.17 |
Financial Highlights – Institutional Shares:
| | | | |
| | For the year ended, December 31, 2022 |
| | As Reported | Adjustment | As Revised |
Net realized and unrealized gain/(loss) | $(16.79) | $(0.14) | $(16.93) |
Total from Investment Operations | $(16.70) | $(0.14) | $(16.84) |
Net Asset Value, End of Period | $31.72 | $(0.14) | $31.58 |
Total Return | (29.58)% | (0.31)% | (29.89)% |
Net Assets, End of Period (in thousands) | $336,291 | $(1,414) | $334,877 |
Financial Highlights – Service Shares:
| | | | |
| | For the year ended, December 31, 2022 |
| | As Reported | Adjustment | As Revised |
Net realized and unrealized gain/(loss) | $(16.70) | $0.36 | $(16.34) |
Total from Investment Operations | $(16.70) | $0.36 | $(16.34) |
Net Asset Value, End of Period | $29.81 | $0.36 | $30.17 |
Total Return | (30.90)% | 0.84% | (30.06)% |
Net Assets, End of Period (in thousands) | $116,023 | $1,414 | $117,437 |
8. Subsequent Event
Management has evaluated whether any events or transactions occurred subsequent to December 31, 2022 and through the date of issuance of the Portfolio’s financial statements and determined that there were no material events or transactions that would require recognition or disclosure in the Portfolio’s financial statements.
Janus Henderson VIT Research Portfolio
Report of Independent Registered Public Accounting Firm
To the Board of Trustees of Janus Aspen Series and Shareholders of Janus Henderson VIT Research Portfolio
Opinion on the Financial Statements
We have audited the accompanying statement of assets and liabilities, including the schedule of investments, of Janus Henderson VIT Research Portfolio (one of the portfolios constituting Janus Aspen Series, referred to hereafter as the "Portfolio") as of December 31, 2022, the related statement of operations for the year ended December 31, 2022, the statements of changes in net assets for each of the two years in the period ended December 31, 2022, including the related notes, and the financial highlights for each of the five years in the period ended December 31, 2022 (collectively referred to as the “financial statements”). In our opinion, the financial statements present fairly, in all material respects, the financial position of the Portfolio as of December 31, 2022, the results of its operations for the year then ended, the changes in its net assets for each of the two years in the period ended December 31, 2022 and the financial highlights for each of the five years in the period ended December 31, 2022 in conformity with accounting principles generally accepted in the United States of America.
Basis for Opinion
These financial statements are the responsibility of the Portfolio’s management. Our responsibility is to express an opinion on the Portfolio’s financial statements based on our audits. We are a public accounting firm registered with the Public Company Accounting Oversight Board (United States) (PCAOB) and are required to be independent with respect to the Portfolio in accordance with the U.S. federal securities laws and the applicable rules and regulations of the Securities and Exchange Commission and the PCAOB.
We conducted our audits of these financial statements in accordance with the standards of the PCAOB. Those standards require that we plan and perform the audit to obtain reasonable assurance about whether the financial statements are free of material misstatement, whether due to error or fraud.
Our audits included performing procedures to assess the risks of material misstatement of the financial statements, whether due to error or fraud, and performing procedures that respond to those risks. Such procedures included examining, on a test basis, evidence regarding the amounts and disclosures in the financial statements. Our audits also included evaluating the accounting principles used and significant estimates made by management, as well as evaluating the overall presentation of the financial statements. Our procedures included confirmation of securities owned as of December 31, 2022 by correspondence with the custodian and brokers; when replies were not received from brokers, we performed other auditing procedures. We believe that our audits provide a reasonable basis for our opinion.

Denver, Colorado
February 15, 2023, except for the effects of the revision discussed in Note 7 to the financial statements, as to which the date is April 19, 2023
We have served as the auditor of one or more investment companies in Janus Henderson Funds since 1990.
Janus Henderson VIT Research Portfolio
Additional Information (unaudited)
Proxy Voting Policies and Voting Record
A description of the policies and procedures that the Portfolio uses to determine how to vote proxies relating to its portfolio securities is available without charge: (i) upon request, by calling 1-800-525-1093; (ii) on the Portfolio’s website at janushenderson.com/proxyvoting; and (iii) on the SEC’s website at http://www.sec.gov. Additionally, information regarding the Portfolio’s proxy voting record for the most recent twelve-month period ended June 30 is also available, free of charge, through janushenderson.com/proxyvoting and from the SEC’s website at http://www.sec.gov.
Full Holdings
The Portfolio files its complete portfolio holdings (schedule of investments) with the SEC as an exhibit to Form N-PORT within 60 days of the end of the first and third fiscal quarters, and in the annual report and semiannual report to shareholders. The Portfolio’s Form N-PORT filings and annual and semiannual reports: (i) are available on the SEC’s website at http://www.sec.gov; and (ii) are available without charge, upon request, by calling a Janus Henderson representative at 1-877-335-2687 (toll free). Portfolio holdings consisting of at least the names of the holdings are generally available on a monthly basis with a 30-day lag under Full Holdings for the Portfolio at janushenderson.com/vit.
APPROVAL OF ADVISORY AGREEMENTS DURING THE PERIOD
The Trustees of Janus Aspen Series, each of whom serves as an “independent” Trustee (the “Trustees”), oversee the management of each portfolio of Janus Aspen Series (each, a “VIT Portfolio,” and collectively, the “VIT Portfolios”), as well as each fund of Janus Investment Fund (each, a “Fund,” and collectively, the “Funds” and together with the VIT Portfolios, the “Janus Henderson Funds,” and each, a “Janus Henderson Fund”). As required by law, the Trustees determine annually whether to continue the investment advisory agreement for each Janus Henderson Fund.
In connection with their most recent consideration of those agreements for each Janus Henderson Fund, the Trustees received and reviewed information provided by Janus Henderson Investors US LLC (the “Adviser”) in response to requests of the Trustees and their independent legal counsel. They also received and reviewed information and analysis provided by, and in response to requests of, their independent fee consultant. Throughout their consideration of the agreements, the Trustees were advised by their independent legal counsel. The Trustees met with management to consider the agreements, and also met separately in executive session with their independent legal counsel and their independent fee consultant.
At meetings held on November 9-10, 2022 and December 13-14, 2022, the Trustees evaluated the information provided by the Adviser and the independent fee consultant, as well as other information provided by the Adviser and the independent fee consultant during the year. Following such evaluation, the Trustees determined that the overall arrangements between each Janus Henderson Fund and the Adviser were fair and reasonable in light of the nature, extent, and quality of the services provided by the Adviser and its affiliates, the fees charged for those services, and other matters that the Trustees considered relevant in the exercise of their business judgment, and unanimously approved the continuation of the investment advisory agreement for each Janus Henderson Fund for the period from February 1, 2023 through February 1, 2024, subject to earlier termination as provided for in each agreement.
In considering the continuation of those agreements, the Trustees reviewed and analyzed various factors that they determined were relevant, including the factors described below, none of which by itself was considered dispositive. However, the material factors and conclusions that formed the basis for the Trustees’ determination to approve the continuation of the agreements are discussed separately below. Also included is a summary of the independent fee consultant’s conclusions and opinions that arose during, and were included as part of, the Trustees’ consideration of the agreements. “Management fees,” as used herein, reflect actual annual advisory fees and, for the purpose of peer comparisons any administration fees (excluding out of pocket costs), net of any waivers, paid by a fund as a percentage of average net assets.
Nature, Extent and Quality of Services
The Trustees reviewed the nature, extent, and quality of the services provided by the Adviser to the Janus Henderson Funds, taking into account the investment objective, strategies, and policies of each Janus Henderson Fund, and the knowledge the Trustees gained from their regular meetings with management on at least a quarterly basis and their ongoing review of information related to the Janus Henderson Funds. In addition, the Trustees reviewed the resources and key personnel of the Adviser, particularly noting those employees who provide investment and risk management services to the Janus Henderson Funds. The Trustees also considered other services provided to the Janus Henderson Funds by the Adviser, such as managing the execution of portfolio transactions and the selection of broker-dealers for
Janus Henderson VIT Research Portfolio
Additional Information (unaudited)
those transactions. The Trustees considered the Adviser’s role as administrator to the Janus Henderson Funds, noting that the Adviser generally does not receive a fee for its services as administrator, but is reimbursed for its out-of-pocket costs. The Trustees considered the role of the Adviser in monitoring adherence to the Janus Henderson Funds’ investment restrictions, providing support services for the Trustees and Trustee committees, and overseeing communications with Janus Henderson Fund shareholders and the activities of other service providers, including monitoring compliance with various policies and procedures of the Janus Henderson Funds and with applicable securities laws and regulations.
In this regard, the independent fee consultant noted that the Adviser provides a number of different services for the Janus Henderson Funds and their shareholders, ranging from investment management services to various other servicing functions, and that, in its view, the Adviser is a capable provider of those services. The independent fee consultant also provided its belief that the Adviser has developed a number of institutional competitive advantages that should enable it to provide superior investment and service performance over the long term.
The Trustees concluded that the nature, extent, and quality of the services provided by the Adviser to each Janus Henderson Fund were appropriate and consistent with the terms of the respective advisory agreements, and that, taking into account steps taken to address those Janus Henderson Funds whose performance lagged that of their peers for certain periods, the Janus Henderson Funds were likely to benefit from the continued provision of those services. They also concluded that the Adviser had sufficient personnel, with the appropriate education and experience, to serve the Janus Henderson Funds effectively and had demonstrated its ability to attract well-qualified personnel.
Performance of the Funds
The Trustees considered the performance results of each Janus Henderson Fund over various time periods. They noted that they considered Janus Henderson Fund performance data throughout the year, including periodic meetings with each Janus Henderson Fund’s portfolio manager(s), and also reviewed information comparing each Janus Henderson Fund’s performance with the performance of comparable fund peer groups identified by Broadridge Financial Solutions, Inc. (“Broadridge”), an independent data provider, and with the Janus Henderson Fund’s benchmark index. In this regard, the independent fee consultant found that the overall Janus Henderson Funds’ performance has been reasonable, noting that: (i) for the 36 months ended May 31, 2022, approximately 38% of the Janus Henderson Funds were in the top two quartiles of their Broadridge peer groups; (ii) for the 36 months ended September 30, 2022, approximately 45% of the Janus Henderson Funds were in the top two quartiles of performance as reported by Morningstar, and (iii) for the 12 months ended September 30, 2022, approximately 55% of the Janus Henderson Funds were in the top two quartiles of performance as reported by Morningstar.
The Trustees considered the performance of each Janus Henderson Fund, noting that performance may vary by share class, and noted the following with respect to the VIT Portfolios:
· For Janus Henderson Adaptive Risk Managed U.S. Equity Portfolio, the Trustees noted that the VIT Portfolio’s performance was in the bottom Broadridge quartile for the 36 months ended May 31, 2022 and the first Broadridge quartile for the 12 months ended May 31, 2022. The Trustees noted the reasons for the VIT Portfolio’s underperformance and the steps the Adviser had taken or was taking to improve performance, and that the performance trend was improving.
· For Janus Henderson Balanced Portfolio, the Trustees noted that the VIT Portfolio’s performance was in the first Broadridge quartile for the 36 months ended May 31, 2022 and the first Broadridge quartile for the 12 months ended May 31, 2022.
· For Janus Henderson Enterprise Portfolio, the Trustees noted that the VIT Portfolio’s performance was in the third Broadridge quartile for the 36 months ended May 31, 2022 and the first Broadridge quartile for the 12 months ended May 31, 2022 The Trustees noted the reasons for the VIT Portfolio’s underperformance and the steps the Adviser had taken or was taking to improve performance, and that the performance trend was improving.
· For Janus Henderson Flexible Bond Portfolio, the Trustees noted that the VIT Portfolio’s performance was in the first Broadridge quartile for the 36 months ended May 31, 2022 and the first Broadridge quartile for the 12 months ended May 31, 2022.
Janus Henderson VIT Research Portfolio
Additional Information (unaudited)
· For Janus Henderson Forty Portfolio, the Trustees noted that the VIT Portfolio’s performance was in the second Broadridge quartile for the 36 months ended May 31, 2022 and the third Broadridge quartile for the 12 months ended May 31, 2022.
· For Janus Henderson Global Research Portfolio, the Trustees noted that the VIT Portfolio’s performance was in the first Broadridge quartile for the 36 months ended May 31, 2022 and the first Broadridge quartile for the 12 months ended May 31, 2022.
· For Janus Henderson Global Sustainable Equity Portfolio, the Trustees noted that the VIT Portfolio’s performance was in the bottom Broadridge quartile for the evaluated performance period ended May 31, 2022. The Trustees noted that 36 month-end performance was not yet available.
· For Janus Henderson Global Technology and Innovation Portfolio, the Trustees noted that the VIT Portfolio’s performance was in the second Broadridge quartile for the 36 months ended May 31, 2022 and the third Broadridge quartile for the 12 months ended May 31, 2022.
· For Janus Henderson Mid Cap Value Portfolio, the Trustees noted that the VIT Portfolio’s performance was in the bottom Broadridge quartile for the 36 months ended May 31, 2022 and the second Broadridge quartile for the 12 months ended May 31, 2022. The Trustees noted the reasons for the VIT Portfolio’s underperformance, while also noting that the VIT Portfolio has a performance fee structure that results in lower management fees during periods of underperformance, the steps the Adviser had taken or was taking to improve performance, and that the performance trend was improving.
· For Janus Henderson Overseas Portfolio, the Trustees noted that the VIT Portfolio’s performance was in the first Broadridge quartile for the 36 months ended May 31, 2022 and the first Broadridge quartile for the 12 months ended May 31, 2022.
· For Janus Henderson Research Portfolio, the Trustees noted that the VIT Portfolio’s performance was in the second Broadridge quartile for the 36 months ended May 31, 2022 and the second Broadridge quartile for the 12 months ended May 31, 2022.
In consideration of each Janus Henderson Fund’s performance, the Trustees concluded that, taking into account the factors relevant to performance, as well as other considerations, including steps taken to improve performance, as applicable, the Janus Henderson Fund’s performance warranted continuation of such Janus Henderson Fund’s investment advisory agreement.
Costs of Services Provided
The Trustees examined information regarding the fees and expenses of each Janus Henderson Fund in comparison to similar information for other comparable funds as provided by Broadridge, an independent data provider. They also reviewed an analysis of that information provided by their independent fee consultant. The independent fee consultant provided its belief that the management fees charged by the Adviser to each of the Janus Henderson Funds under the current investment advisory and administration agreements are reasonable in relation to the services provided by the Adviser. The independent fee consultant found: (1) the total expenses and management fees of the Janus Henderson Funds to be reasonable relative to other comparable mutual funds; (2) the total expenses, on average, were 6% under the average total expenses of the respective Broadridge peer group; and (3) the management fees for the Janus Henderson Funds, on average, were 5% under the average management fees for the respective Broadridge peer group. The Trustees also considered the total expenses for each share class of each Janus Henderson Fund compared to the average total expenses for its Broadridge Expense Group and to average total expenses for its Broadridge Expense Universe.
For Janus Henderson Funds with three or more years of performance history, the independent fee consultant also performed a systematic “focus list” analysis of expenses which assessed fund fees in the context of fund performance being delivered. Based on this analysis, the independent fee consultant found that the combination of service quality/performance and expenses on these individual Janus Henderson Funds was reasonable in light of performance trends, performance histories, changes in portfolio management, relative average net asset levels, and the existence of performance fees, breakpoints, and/or expense waivers on such Janus Henderson Funds.
Janus Henderson VIT Research Portfolio
Additional Information (unaudited)
The Trustees considered the methodology used by the Adviser in determining compensation payable to portfolio managers, the competitive environment for investment management talent, and the competitive market for mutual funds in different distribution channels.
The Trustees also reviewed management fees charged by the Adviser to comparable separate account clients and to comparable non-affiliated funds subadvised by the Adviser (for which the Adviser provides only or primarily portfolio management services). Although in most instances subadvisory and separate account fee rates for various investment strategies were lower than management fee rates for Janus Henderson Funds having a similar strategy, the Trustees considered that the Adviser noted that, under the terms of the management agreements with the Janus Henderson Funds, the Adviser performs significant additional services for the Janus Henderson Funds that it does not provide to those other clients, including administration services, oversight of the Janus Henderson Funds’ other service providers, Trustee support, regulatory compliance and numerous other services, and that, in serving the Janus Henderson Funds, the Adviser assumes many legal risks and other costs that it does not assume in servicing its other clients. Moreover, the Trustees noted that the independent fee consultant found that: (1) the management fees the Adviser charges to the Janus Henderson Funds are reasonable in relation to the management fees the Adviser charges to funds subadvised by the Adviser and to the fees the Adviser charges to its institutional separate account clients; (2) these subadvised and institutional separate accounts have different service and infrastructure needs and operate in markets very different from the retail fund market; (3) Janus Henderson mutual fund investors enjoy reasonable fees relative to the fees charged in these other markets; and (4) as part of its 2022 review, 9 of 11 Janus Henderson Funds have lower management fees than similar funds subadvised by the Adviser. The Trustees noted that for the two Janus Henderson Funds that did not, management fees for each were under the average of its 15(c) peer group.
The Trustees considered the fees for each Janus Henderson Fund for its fiscal year ended in 2021 (except for Janus Henderson Global Sustainable Equity Portfolio for which the period end was March 31, 2022) and noted the following with regard to each Janus Henderson Fund’s total expenses, net of applicable fee waivers (the VIT Portfolio’s “total expenses”) as reflected in the comparative information provided by Broadridge:
· For Janus Henderson Adaptive Risk Management U.S. Equity Portfolio, the Trustees noted that the VIT Portfolio’s total expenses were below the peer group average for its sole share class.
· For Janus Henderson Balanced Portfolio, the Trustees noted that, although the VIT Portfolio’s total expenses exceeded the peer group average for one share class, overall the VIT Portfolio’s total expenses were reasonable.
· For Janus Henderson Enterprise Portfolio, the Trustees noted that, although the VIT Portfolio’s total expenses exceeded the peer group average for one share class, overall the VIT Portfolio’s total expenses were reasonable.
· For Janus Henderson Flexible Bond Portfolio, the Trustees noted that, although the VIT Portfolio’s total expenses exceeded the peer group for one share class, overall the VIT Portfolio’s total expenses were reasonable. The Trustees also noted that the Adviser has contractually agreed to limit the VIT Portfolio’s expenses.
· For Janus Henderson Forty Portfolio, the Trustees noted that, although the VIT Portfolio’s total expenses exceeded the peer group average for one share class, overall the VIT Portfolio’s total expenses were reasonable.
· For Janus Henderson Global Research Portfolio, the Trustees noted that, although the VIT Portfolio’s total expenses exceeded the peer group average for one share class, overall the VIT Portfolio’s total expenses were reasonable.
· For Janus Henderson Global Sustainable Equity Portfolio, the Trustees noted that the VIT Portfolio’s total expenses were below the peer group average for both share classes.
· For Janus Henderson Global Technology and Innovation Portfolio, the Trustees noted that the VIT Portfolio’s total expenses were below the peer group average for both share classes.
· For Janus Henderson Mid Cap Value Portfolio, the Trustees noted that, the VIT Portfolio’s total expenses were below the peer group average for both share classes.
· For Janus Henderson Overseas Portfolio, the Trustees noted that although the VIT Portfolio’s total expenses exceeded the peer group average for one share class, overall the VIT Portfolio’s total expenses were reasonable.
Janus Henderson VIT Research Portfolio
Additional Information (unaudited)
· For Janus Henderson Research Portfolio, the Trustees noted that the VIT Portfolio’s total expenses were below the peer group average for both share classes.
The Trustees reviewed information on the overall profitability to the Adviser and its affiliates from their relationships with the Janus Henderson Funds, and considered profitability data of other publicly traded mutual fund advisers. The Trustees recognized that profitability comparisons among fund managers are difficult because of the variation in the type of comparative information that is publicly available, and the profitability of any fund manager is affected by numerous factors, including the organizational structure of the particular fund manager, differences in complex size, difference in product mix, difference in types of business (mutual fund, institutional and other), differences in the types of funds and other accounts it manages, possible other lines of business, the methodology for allocating expenses and the fund manager’s capital structure and cost of capital.
Additionally, the Trustees considered the estimated profitability to the Adviser from the investment management services it provided to each Janus Henderson Fund. In their review, the Trustees considered whether the Adviser receive adequate incentives and resources to manage the Janus Henderson Funds effectively. In reviewing profitability, the Trustees noted that the estimated profitability for an individual Janus Henderson Fund is necessarily a product of the allocation methodology utilized by the Adviser to allocate its expenses as part of the estimated profitability calculation. In this regard, the Trustees noted that the independent fee consultant found as part of its 2022 review that (1) the expense allocation methodology and rationales utilized by the Adviser were reasonable and (2) no clear correlation exists between expense allocations and operating margins. The Trustees also considered that the estimated profitability for an individual Janus Henderson Fund was influenced by a number of factors, including not only the allocation methodology selected, but also the presence of fee waivers and expense caps, and whether the Janus Henderson Fund’s investment management agreement contained breakpoints or a performance fee component. The Trustees determined, after taking into account these factors, among others, that the Adviser’s estimated profitability with respect to each Janus Henderson Fund was not unreasonable in relation to the services provided, and that the variation in the range of such estimated profitability among the Janus Henderson Funds was not a material factor in the Board’s approval of the reasonableness of any Janus Henderson Fund’s investment management fees.
The Trustees concluded that the management fees payable by each Janus Henderson Fund to the Adviser were reasonable in relation to the nature, extent, and quality of the services provided, taking into account the fees charged by other advisers for managing comparable mutual funds with similar strategies, the fees the Adviser charges to other clients, and, as applicable, the impact of fund performance on management fees payable by the Janus Henderson Funds. The Trustees also concluded that each Janus Henderson Fund’s total expenses were reasonable, taking into account the size of the Janus Henderson Fund, the quality of services provided by the Adviser, the investment performance of the Janus Henderson Fund, and any expense limitations agreed to or provided by the Adviser.
Economies of Scale
The Trustees considered information about the potential for the Adviser to realize economies of scale as the assets of the Janus Henderson Funds increase. They noted that their independent fee consultant published a report to the Trustees in June 2022 which provided its research and analysis into economies of scale. They also noted that, although many Janus Henderson Funds pay advisory fees at a fixed base rate as a percentage of net assets, without any breakpoints or performance fees, their independent fee consultant concluded that 75% of these Janus Henderson Funds’ have contractual management fees (gross of waivers) below their Broadridge Expense Group averages. The Trustees also noted the following from the independent fee consultant’s report: (1) that 31% of Janus Henderson Funds had management fee breakpoints in place whereby investors pay lower management fees as fund AUM increases; (2) that 29% of Janus Henderson Funds have low flat-rate fees and performance fees where the Adviser is incentivized to invest in resources which drive Janus Henderson Fund performance; and (3) that 39% of Janus Henderson Funds have low flat-rate fees versus peers where investors pay low fixed fees when the Janus Henderson Fund is small/midsized and higher fees when the Janus Henderson Fund grows in assets. The Trustees also noted that the Janus Henderson Funds share directly in economies of scale through the significant investments made by the Adviser and its affiliates related to services provided to the Funds and the lower charges of third-party service providers that are based in part on the combined scale of all of the Janus Henderson Funds.
The Trustees also considered the independent fee consultant’s conclusion that, given the limitations of various analytical approaches to economies of scale and their conflicting results, it is difficult to analytically confirm or deny the existence of economies of scale in the Janus Henderson complex. In this regard, the independent consultant concluded that (1) to the extent there were economies of scale at the Adviser, the Adviser’s general strategy of setting
Janus Henderson VIT Research Portfolio
Additional Information (unaudited)
fixed management fees below peers appeared to share any such economies with investors even on smaller Janus Henderson Funds which have not yet achieved those economies and (2) by setting lower fixed fees from the start on these Janus Henderson Funds, the Adviser appeared to be investing to increase the likelihood that these Janus Henderson Funds will grow to a level to achieve any economies of scale that may exist. Further, the independent fee consultant provided its belief that Janus Henderson Fund investors are well-served by the fee levels and performance fee structures in place on the Janus Henderson Funds in light of any economies of scale that may be present at the Adviser.
Based on all of the information reviewed, including the recent and past research and analysis conducted by the Trustees’ independent fee consultant, the Trustees concluded that the current fee structure of each Janus Henderson Fund was reasonable and that the current rates of fees do reflect a sharing between the Adviser and the Janus Henderson Fund of any economies of scale that may be present at the current asset level of the Janus Henderson Fund.
Other Benefits to the Adviser
The Trustees also considered benefits that accrue to the Adviser and its affiliates from their relationships with the Janus Henderson Funds. They recognized that two affiliates of the Adviser separately serve the Janus Henderson Funds as transfer agent and distributor, respectively, and the transfer agent receives compensation directly from the non-money market Janus Henderson Funds for services provided, and that such compensation contributes to the overall profitability of the Adviser and its affiliates that results from their relationship with the Janus Henderson Funds. The Trustees also considered the Adviser’s past and proposed use of commissions paid by the Janus Henderson Funds on portfolio brokerage transactions to obtain proprietary and third-party research products and services benefiting the Janus Henderson Fund and/or other clients of the Adviser and/or the Adviser. The Trustees concluded that the Adviser’s use of these types of client commission arrangements to obtain proprietary and third-party research products and services was consistent with regulatory requirements and guidelines and was likely to benefit each Janus Henderson Fund. The Trustees also concluded that, other than the services provided by the Adviser and its affiliates pursuant to the agreements and the fees to be paid by each Janus Henderson Fund therefor, the Janus Henderson Funds and the Adviser may potentially benefit from their relationship with each other in other ways. They concluded that the Adviser and its affiliates share directly in economies of scale through the lower charges of third-party service providers that are based in part on the combined scale of the Janus Henderson Funds and other clients serviced by the Adviser and its affiliates. They also concluded that the Adviser benefits from the receipt of research products and services acquired through commissions paid on portfolio transactions of the Janus Henderson Funds and that the Janus Henderson Funds benefit from the Adviser’s receipt of those products and services as well as research products and services acquired through commissions paid by other clients of the Adviser. They further concluded that the success of any Janus Henderson Fund could attract other business to the Adviser or other Janus Henderson Funds, and that the success of the Adviser could enhance the Adviser’s ability to serve the Janus Henderson Funds.
Janus Henderson VIT Research Portfolio
Useful Information About Your Portfolio Report (unaudited)
Management Commentary
The Management Commentary in this report includes valuable insight as well as statistical information to help you understand how your Portfolio’s performance and characteristics stack up against those of comparable indices.
If the Portfolio invests in foreign securities, this report may include information about country exposure. Country exposure is based primarily on the country of risk. A company may be allocated to a country based on other factors such as location of the company’s principal office, the location of the principal trading market for the company’s securities, or the country where a majority of the company’s revenues are derived.
Please keep in mind that the opinions expressed in the Management Commentary are just that: opinions. They are a reflection based on best judgment at the time this report was compiled, which was December 31, 2022. As the investing environment changes, so could opinions. These views are unique and are not necessarily shared by fellow employees or by Janus Henderson in general.
Performance Overviews
Performance overview graphs compare the performance of a hypothetical $10,000 investment in the Portfolio with one or more widely used market indices. When comparing the performance of the Portfolio with an index, keep in mind that market indices are not available for investment and do not reflect deduction of expenses.
Average annual total returns are quoted for a Portfolio with more than one year of performance history. Average annual total return is calculated by taking the growth or decline in value of an investment over a period of time, including reinvestment of dividends and distributions, then calculating the annual compounded percentage rate that would have produced the same result had the rate of growth been constant throughout the period. Average annual total return does not reflect the deduction of taxes that a shareholder would pay on Portfolio distributions or redemptions of Portfolio shares.
Cumulative total returns are quoted for a Portfolio with less than one year of performance history. Cumulative total return is the growth or decline in value of an investment over time, independent of the period of time involved. Cumulative total return does not reflect the deduction of taxes that a shareholder would pay on Portfolio distributions or redemptions of Portfolio shares.
Pursuant to federal securities rules, expense ratios shown in the performance chart reflect subsidized (if applicable) and unsubsidized ratios. The total annual fund operating expenses ratio is gross of any fee waivers, reflecting the Portfolio’s unsubsidized expense ratio. The net annual fund operating expenses ratio (if applicable) includes contractual waivers of the Adviser and reflects the Portfolio’s subsidized expense ratio. Ratios may be higher or lower than those shown in the “Financial Highlights” in this report.
Schedule of Investments
Following the performance overview section is the Portfolio’s Schedule of Investments. This schedule reports the types of securities held in the Portfolio on the last day of the reporting period. Securities are usually listed by type (common stock, corporate bonds, U.S. Government obligations, etc.) and by industry classification (banking, communications, insurance, etc.). Holdings are subject to change without notice.
The value of each security is quoted as of the last day of the reporting period. The value of securities denominated in foreign currencies is converted into U.S. dollars.
If the Portfolio invests in foreign securities, it will also provide a summary of investments by country. This summary reports the Portfolio exposure to different countries by providing the percentage of securities invested in each country. The country of each security represents the country of risk. The Portfolio’s Schedule of Investments relies upon the industry group and country classifications published by Bloomberg and/or MSCI Inc.
Tables listing details of individual forward currency contracts, futures, written options, swaptions, and swaps follow the Portfolio’s Schedule of Investments (if applicable).
Statement of Assets and Liabilities
This statement is often referred to as the “balance sheet.” It lists the assets and liabilities of the Portfolio on the last day of the reporting period.
Janus Henderson VIT Research Portfolio
Useful Information About Your Portfolio Report (unaudited)
The Portfolio’s assets are calculated by adding the value of the securities owned, the receivable for securities sold but not yet settled, the receivable for dividends declared but not yet received on securities owned, and the receivable for Portfolio shares sold to investors but not yet settled. The Portfolio’s liabilities include payables for securities purchased but not yet settled, Portfolio shares redeemed but not yet paid, and expenses owed but not yet paid. Additionally, there may be other assets and liabilities such as unrealized gain or loss on forward currency contracts.
The section entitled “Net Assets Consist of” breaks down the components of the Portfolio’s net assets. Because the Portfolio must distribute substantially all earnings, you will notice that a significant portion of net assets is shareholder capital.
The last section of this statement reports the net asset value (“NAV”) per share on the last day of the reporting period. The NAV is calculated by dividing the Portfolio’s net assets for each share class (assets minus liabilities) by the number of shares outstanding.
Statement of Operations
This statement details the Portfolio’s income, expenses, realized gains and losses on securities and currency transactions, and changes in unrealized appreciation or depreciation of Portfolio holdings.
The first section in this statement, entitled “Investment Income,” reports the dividends earned from securities and interest earned from interest-bearing securities in the Portfolio.
The next section reports the expenses incurred by the Portfolio, including the advisory fee paid to the investment adviser, transfer agent fees and expenses, and printing and postage for mailing statements, financial reports and prospectuses. Expense offsets and expense reimbursements, if any, are also shown.
The last section lists the amounts of realized gains or losses from investment and foreign currency transactions, and changes in unrealized appreciation or depreciation of investments and foreign currency-denominated assets and liabilities. The Portfolio will realize a gain (or loss) when it sells its position in a particular security. A change in unrealized gain (or loss) refers to the change in net appreciation or depreciation of the Portfolio during the reporting period. “Net Realized and Unrealized Gain/(Loss) on Investments” is affected both by changes in the market value of Portfolio holdings and by gains (or losses) realized during the reporting period.
Statements of Changes in Net Assets
These statements report the increase or decrease in the Portfolio’s net assets during the reporting period. Changes in the Portfolio’s net assets are attributable to investment operations, dividends and distributions to investors, and capital share transactions. This is important to investors because it shows exactly what caused the Portfolio’s net asset size to change during the period.
The first section summarizes the information from the Statement of Operations regarding changes in net assets due to the Portfolio’s investment operations. The Portfolio’s net assets may also change as a result of dividend and capital gains distributions to investors. If investors receive their dividends and/or distributions in cash, money is taken out of the Portfolio to pay the dividend and/or distribution. If investors reinvest their dividends and/or distributions, the Portfolio’s net assets will not be affected.
The reinvestment of dividends and distributions is included under “Capital Share Transactions.” “Capital Shares” refers to the money investors contribute to the Portfolio through purchases or withdrawals via redemptions. The Portfolio’s net assets will increase and decrease in value as investors purchase and redeem shares from the Portfolio.
Financial Highlights
This schedule provides a per-share breakdown of the components that affect the Portfolio’s NAV for current and past reporting periods as well as total return, asset size, ratios, and portfolio turnover rate.
The first line in the table reflects the NAV per share at the beginning of the reporting period. The next line reports the net investment income/(loss) per share. Following is the per share total of net gains/(losses), realized and unrealized. Per share dividends and distributions to investors are then subtracted to arrive at the NAV per share at the end of the period. The next line reflects the total return for the period. The total return may include adjustments in accordance with generally accepted accounting principles required at the period end for financial reporting purposes. As a result, the total return may differ from the total return reflected for individual shareholder transactions. Also included are ratios of expenses and net investment income to average net assets.
Janus Henderson VIT Research Portfolio
Useful Information About Your Portfolio Report (unaudited)
The Portfolio’s expenses may be reduced through expense offsets and expense reimbursements. The ratios shown reflect expenses before and after any such offsets and reimbursements.
The ratio of net investment income/(loss) summarizes the income earned less expenses, divided by the average net assets of the Portfolio during the reporting period. Do not confuse this ratio with the Portfolio’s yield. The net investment income ratio is not a true measure of the Portfolio’s yield because it does not take into account the dividends distributed to the Portfolio’s investors.
The next figure is the portfolio turnover rate, which measures the buying and selling activity in the Portfolio. Portfolio turnover is affected by market conditions, changes in the asset size of the Portfolio, fluctuating volume of shareholder purchase and redemption orders, the nature of the Portfolio’s investments, and the investment style and/or outlook of the portfolio manager(s) and/or investment personnel. A 100% rate implies that an amount equal to the value of the entire portfolio was replaced once during the fiscal year; a 50% rate means that an amount equal to the value of half the portfolio is traded in a year; and a 200% rate means that an amount equal to the value of the entire portfolio is traded every six months.
Janus Henderson VIT Research Portfolio
Designation Requirements (unaudited)
For federal income tax purposes, the Portfolio designated the following for the year ended December 31, 2022:
| | |
| | |
Capital Gain Distributions | $95,410,096 |
Dividends Received Deduction Percentage | 26% |
Janus Henderson VIT Research Portfolio
Trustees and Officers (unaudited)
The following are the Trustees and officers of the Trust, together with a brief description of their principal occupations during the last five years (principal occupations for certain Trustees may include periods over five years). The Portfolio’s Statement of Additional Information includes additional information about the Trustees and officers and is available, without charge, by calling 1-877-335-2687.
Each Trustee has served in that capacity since he or she was originally elected or appointed. The Trustees do not serve a specified term of office. Each Trustee will hold office until the termination of the Trust or his or her earlier death, resignation, retirement, incapacity, or removal. Under the Portfolio’s Governance Procedures and Guidelines, the policy is for Trustees to retire no later than the end of the calendar year in which the Trustee turns 75. The Trustees review the Portfolio’s Governance Procedures and Guidelines from time to time and may make changes they deem appropriate. The Portfolio’s Nominating and Governance Committee will consider nominees for the position of Trustee recommended by shareholders. Shareholders may submit the name of a candidate for consideration by the Committee by submitting their recommendations to the Trust’s Secretary. Each Trustee is currently a Trustee of one other registered investment company advised by the Adviser: Janus Investment Fund. Collectively, these two registered investment companies consist of 51 series or funds referred to herein as the Fund Complex.
The Trust’s officers are elected annually by the Trustees for a one-year term. Certain officers also serve as officers of Janus Investment Fund. Certain officers of the Portfolio may also be officers and/or directors of the Adviser. Except as otherwise disclosed, Portfolio officers receive no compensation from the Portfolio, except for the Portfolio’s Chief Compliance Officer, as authorized by the Trustees.
Janus Henderson VIT Research Portfolio
Trustees and Officers (unaudited)
| | | | | | |
TRUSTEES |
Name, Address, and Age | Positions Held with the Trust | Length of Time Served | Principal Occupations During the Past Five Years | Number of Portfolios/Funds in Fund Complex Overseen by Trustee | Other Directorships Held by Trustee During the Past Five Years |
Independent Trustees | | | | |
Alan A. Brown
151 Detroit Street
Denver, CO 80206
DOB: 1962 | Chairman
Trustee | 5/22-Present
1/13-Present | Principal, Curam Holdings LLC (since 2018). Formerly, Executive Vice President, Institutional Markets, of Black Creek Group (private equity real estate investment management firm) (2012-2018), Executive Vice President and Co-Head, Global Private Client Group (2007-2010), Executive Vice President, Mutual Funds (2005-2007), and Chief Marketing Officer (2001-2005) of Nuveen Investments, Inc. (asset management). | 51 | Advisory Board Member of AEW Core Property Trust (open-end property fund) (since 2020), and Director of WTTW (PBS affiliate) (since 2003). Formerly, Director of MotiveQuest LLC (strategic social market research company) (2003-2016), Director of Nuveen Global Investors LLC (2007-2011), Director of Communities in Schools (2004-2010), and Director of Mutual Fund Education Alliance (until 2010). |
Cheryl D. Alston
151 Detroit Street
Denver, CO 80206
DOB: 1966 | Trustee | 8/22-Present | Executive Director and Chief Investment Officer, Employees’ Retirement Fund of the City of Dallas (since 2004). | 51 | Director of Blue Cross Blue Shield of Kansas City (a not-for-profit health insurance provider) (since 2016) and Director of Global Life Insurance (life and supplemental health insurance provider) (since 2017). Formerly, Director of Federal Home Loan Bank of Dallas (2017-2021). |
Janus Henderson VIT Research Portfolio
Trustees and Officers (unaudited)
| | | | | | |
TRUSTEES |
Name, Address, and Age | Positions Held with the Trust | Length of Time Served | Principal Occupations During the Past Five Years | Number of Portfolios/Funds in Fund Complex Overseen by Trustee | Other Directorships Held by Trustee During the Past Five Years |
Independent Trustees | | | | |
William D. Cvengros
151 Detroit Street
Denver, CO 80206
DOB: 1948 | Trustee | 1/11-Present | Chief Executive Officer of SJC Capital, LLC (a personal investment company and consulting firm) (since 2002). Formerly, Chief Executive Officer and President of PIMCO Advisors Holdings L.P. (a publicly traded investment management firm) (1994-2000), and Chief Investment Officer (1987-1994) and Vice Chairman and Director (1990-1994) of Pacific Life Insurance Company (a mutual life insurance and annuity company) (1987-1994). | 51 | Member, Limited Partner Advisory Committee, Karmel Capital Fund III (since 2022), Member of the Investment Committee for the Orange Country Community Foundation (a grantmaking foundation) (since 2020), Advisory Board Member, RevOZ Fund LP and related funds (real estate investments for opportunity zones) (since 2020), and Advisory Board Member, Innovate Partners Emerging Growth and Equity Fund I (early stage venture capital fund) (since 2014). Formerly, Managing Trustee of National Retirement Partners Liquidating Trust (2013-2016), Chairman, National Retirement Partners, Inc. (formerly a network of advisors to 401(k) plans) (2005-2013), Director of Prospect Acquisition Corp. (a special purpose acquisition corporation) (2007-2009), Director of RemedyTemp, Inc. (temporary help services company) (1996-2006), and Trustee of PIMCO Funds Multi-Manager Series (1990-2000) and Pacific Life Variable Life & Annuity Trusts (1987-1994). |
Janus Henderson VIT Research Portfolio
Trustees and Officers (unaudited)
| | | | | | |
TRUSTEES |
Name, Address, and Age | Positions Held with the Trust | Length of Time Served | Principal Occupations During the Past Five Years | Number of Portfolios/Funds in Fund Complex Overseen by Trustee | Other Directorships Held by Trustee During the Past Five Years |
Independent Trustees | | | | |
Raudline Etienne
151 Detroit Street
Denver, CO 80206
DOB: 1965 | Trustee | 6/16-Present | Founder, Daraja Capital (advisory and investment firm) (since 2016). Formerly, Senior Vice President and Senior Advisor, Albright Stonebridge Group LLC (global strategy firm) (2011-2021), and Deputy Comptroller and Chief Investment Officer, New York State Common Retirement Fund (public pension fund) (2008-2011). | 51 | Member of the Investment Committee for Cooper Union (private college) (since 2021), Board Member, Van Alen Institute (nonprofit architectural and design organization) (2019-2022). |
Janus Henderson VIT Research Portfolio
Trustees and Officers (unaudited)
| | | | | | |
TRUSTEES |
Name, Address, and Age | Positions Held with the Trust | Length of Time Served | Principal Occupations During the Past Five Years | Number of Portfolios/Funds in Fund Complex Overseen by Trustee | Other Directorships Held by Trustee During the Past Five Years |
Independent Trustees | | | | |
Darrell B. Jackson
151 Detroit Street
Denver, CO 80206
DOB: 1958 | Trustee | 8/22-Present | President and Chief Executive Officer, The Efficace Group Inc. (since 2018). Formerly, President and Chief Executive Officer, Seaway Bank and Trust Company (community bank) (2014-2015), and Executive Vice President and Co-President, Wealth Management (2009-2014), and several senior positions, including Group Executive, Senior Vice President, and Vice President (1995-2009) of Northern Trust Company (financial services company) (1995-2014). | 51 | Director of Amalgamated Financial Corp (bank) (since August 2021), Director of YR Media (a not-for-profit production company) (since 2021), and Director of Gray-Bowen-Scott (transportation project consulting firm) (since April 2020). Formerly, Director of Delaware Place Bank (closely held commercial bank) (2016-2018) and Director of Seaway Bank and Trust Company (2014-2015). |
Janus Henderson VIT Research Portfolio
Trustees and Officers (unaudited)
| | | | | | |
TRUSTEES |
Name, Address, and Age | Positions Held with the Trust | Length of Time Served | Principal Occupations During the Past Five Years | Number of Portfolios/Funds in Fund Complex Overseen by Trustee | Other Directorships Held by Trustee During the Past Five Years |
Independent Trustees | | | | |
William F. McCalpin
151 Detroit Street
Denver, CO 80206
DOB: 1957 | Trustee | 6/02-Present | Chief Executive Officer, muun chi LLC (organic food business) (since 2022) and Independent Consultant (since 2019). Formerly, Chief Operating Officer, muun chi LLC (2020-2022), Managing Partner, Impact Investments, Athena Capital Advisors LLC (independent registered investment advisor) (2016-2019), Managing Director, Holos Consulting LLC (provides consulting services to foundations and other nonprofit organizations) (2009-2016), Chief Executive Officer, Imprint Capital Advisors (impact investment firm) (2013-2015), and Executive Vice President and Chief Operating Officer of The Rockefeller Brothers Fund (a private family foundation) (1998-2006). | 51 | Chairman of the Board and Trustee of The Investment Fund for Foundations Investment Program (TIP) (consisting of 1 fund) (since 2008). Formerly, Director of the F.B. Heron Foundation (a private grantmaking foundation) (2006-2022), and Director of Mutual Fund Directors Forum (a non-profit organization serving independent directors of U.S. mutual funds) (2016-2021). |
Janus Henderson VIT Research Portfolio
Trustees and Officers (unaudited)
| | | | | | |
TRUSTEES |
Name, Address, and Age | Positions Held with the Trust | Length of Time Served | Principal Occupations During the Past Five Years | Number of Portfolios/Funds in Fund Complex Overseen by Trustee | Other Directorships Held by Trustee During the Past Five Years |
Independent Trustees | | | | |
Gary A. Poliner
151 Detroit Street
Denver, CO 80206
DOB: 1953 | Trustee | 6/16-Present | Retired. Formerly, President (2010-2013) of Northwestern Mutual Life Insurance Company. | 51 | Director of MGIC Investment Corporation (private mortgage insurance) (since 2013). Formerly, Director, West Bend Mutual Insurance Company (property/casualty insurance) (2013-2021), Trustee of Northwestern Mutual Life Insurance Company (2010-2013) and Director of Frank Russell Company (global asset management firm) (2008-2013). |
Diane L. Wallace
151 Detroit Street
Denver, CO 80206
DOB: 1958 | Trustee | 6/17-Present | Retired. Formerly, Chief Operating Officer, Senior Vice President-Operations, and Chief Financial Officer for Driehaus Capital Management, LLC (1988-2006) and Treasurer for Driehaus Mutual Funds (1996-2002). | 51 | Formerly, Director of Family Service of Lake County (2019-2021), Independent Trustee, Henderson Global Funds (13 portfolios) (2015-2017), Independent Trustee, State Farm Associates' Funds Trust, State Farm Mutual Fund Trust, and State Farm Variable Product Trust (28 portfolios) (2013-2017). |
Janus Henderson VIT Research Portfolio
Trustees and Officers (unaudited)
| | | | |
OFFICERS |
Name, Address, and Age | Positions Held with the Trust | Term of Office* and Length of Time Served | Principal Occupations During the Past Five Years |
Matthew Peron
151 Detroit Street
Denver, CO 80206
DOB: 1968 | Executive Vice President Janus Henderson Research Portfolio | 4/20-Present | Director of Research of the Adviser and Portfolio Manager for other Janus Henderson accounts. Formerly, Chief Investment Officer for City National Rochdale (2018-2020), Executive Vice President and Managing Director of Global Equity at Northern Trust (2005-2018). |
Michelle Rosenberg
151 Detroit Street
Denver, CO 80206
DOB: 1973 | President and Chief Executive Officer | 9/22-Present | General Counsel and Corporate Secretary of Janus Henderson Investors (since 2018). Formerly, Interim President and Chief Executive Officer of the Trust and Janus Investment Fund (2022), Senior Vice President and Head of Legal, North America of Janus Henderson Investors (2017-2018) and Deputy General Counsel of Janus Henderson US (Holdings) Inc. (2015-2018). |
Kristin Mariani
151 Detroit Street
Denver, CO 80206
DOB: 1966 | Vice President and Chief Compliance Officer | 7/20-Present | Head of Compliance, North America at Janus Henderson Investors (since September 2020), and Chief Compliance Officer at Janus Henderson Investors US LLC (since September 2017). Formerly, Anti-Money Laundering Officer for the Trust and Janus Investment Fund (July 2020-December 2022), Global Head of Investment Management Compliance at Janus Henderson Investors (February 2019-August 2020), Vice President, Head of Global Distribution Compliance and Chief Compliance Officer at Janus Henderson Distributors US LLC (May 2017-September 2017), Vice President, Compliance at Janus Henderson US (Holdings) Inc., Janus Henderson Investors US LLC, and Janus Henderson Distributors US LLC (2009-2017). |
* Officers are elected at least annually by the Trustees for a one-year term and may also be elected from time to time by the Trustees for an interim period. |
Janus Henderson VIT Research Portfolio
Trustees and Officers (unaudited)
| | | | |
OFFICERS |
Name, Address, and Age | Positions Held with the Trust | Term of Office* and Length of Time Served | Principal Occupations During the Past Five Years |
Jesper Nergaard
151 Detroit Street
Denver, CO 80206
DOB: 1962 | Chief Financial Officer
Vice President, Treasurer, and Principal Accounting Officer | 3/05-Present
2/05-Present | Head of U.S. Fund Administration, Janus Henderson Investors and Janus Henderson Services US LLC. |
Abigail J. Murray
151 Detroit Street
Denver, CO 80206
DOB: 1975 | Vice President, Chief Legal Officer, and Secretary | 12/20-Present | Managing Counsel (since 2020). Formerly, Senior Counsel for Invesco Ltd. (2017-2020), and Vice President and Senior Counsel, ALPS Fund Services, Inc. and Assistant General Counsel, ALPS Advisors, Inc. (2015-2017). |
Ciaran Askin
151 Detroit Street
Denver, CO 80206
DOB: 1978 | Anti-Money Laundering Officer | 12/22-Present | Global Head of Financial Crime, Janus Henderson Investors (since 2022). Formerly, Global Head of Financial Crime for Invesco Ltd. (2017-2022). |
* Officers are elected at least annually by the Trustees for a one-year term and may also be elected from time to time by the Trustees for an interim period. |
Janus Henderson VIT Research Portfolio
Notes
NotesPage1
Janus Henderson VIT Research Portfolio
Notes
NotesPage2
Janus Henderson VIT Research Portfolio
Notes
NotesPage3
| | | | | | | | |
| | | | | |

| | | | |
This report is submitted for the general information of shareholders of the Portfolio. It is not an offer or solicitation for the Portfolio and is not authorized for distribution to prospective investors unless preceded or accompanied by an effective prospectus. |
Janus Henderson is a trademark of Janus Henderson Group plc or one of its subsidiaries. © Janus Henderson Group plc Janus Henderson Distributors US LLC |
| | | | 109-02-93078 03-23 |
Item 2 - Code of Ethics
As of the end of the period covered by this Form N-CSR, the Registrant has adopted a Code of Ethics (as defined in Item 2(b) of Form N-CSR), which is posted on the Registrant's website: janushenderson.com. Registrant intends to post any amendments to, or waivers from (as defined in Item 2 of Form N-CSR), such code on janushenderson.com within five business days following the date of such amendment or waiver.
Item 3 - Audit Committee Financial Expert
The Registrant's Board of Trustees has determined that the following members of the Board's Audit Committee are "audit committee financial experts," as defined in Item 3 to Form N-CSR: William D. Cvengros, Gary A. Poliner, and Diane Wallace who are each "independent" under the standards set forth in Item 3 to Form N-CSR.
Item 4 - Principal Accountant Fees and Services
(a) Audit Fees
The aggregate fees billed for each of the last two fiscal years for professional services rendered by the principal accountant for the audit of the Funds' annual financial statements or services that are normally provided by the accountant in connection with statutory and regulatory filings or engagements for those fiscal years were $449,363 in fiscal 2022 and $387,613 in fiscal 2021.
(b) Audit-Related Fees
The aggregate fees billed in each of the last two fiscal years for assurance and related services by the principal accountant that are reasonably related to the performance of the audit of the Funds' financial statements and are not reported under paragraph (a) of this Item were $0 in fiscal 2022 and $0 in fiscal 2021.
The nature of the services comprising the fees disclosed under this category includes agreed upon procedures.
(c) Tax Fees
The aggregate fees billed in each of the last two fiscal years for professional services rendered by the principal accountant for tax compliance, tax advice, and tax planning were $62,356 in fiscal 2022 and $59,104 in fiscal 2021.
The nature of the services comprising the fees disclosed under this category includes tax compliance, tax planning, tax advice, and corporate actions review.
(d) All Other Fees
The aggregate fees billed in each of the last two fiscal years for products and services provided by the principal accountant, other than the services reported in paragraphs (a) through (c) of this Item were $0 in fiscal 2022 and $0 in fiscal 2021.
(e) (1) The registrant's Audit Committee Charter requires the registrant's Audit Committee to pre-approve any engagement of the principal accountant (i) to provide audit or non-audit services to the registrant or (ii) to provide non-audit services to the registrant's investment adviser or any entity controlling, controlled by, or under common control with the investment adviser that provides ongoing services to the registrant, if the engagement relates directly to the operations and financial reporting of the registrant, except for those non-audit services that were subject to the pre-approval exception under Rule 2-01 of Regulation S-X. The Chairman of the Audit Committee or, if the Chairman is unavailable, another member of the Audit Committee who is an independent Trustee, may grant the pre-approval. All
such delegated pre-approvals must be presented to the Audit Committee no later than the next Audit Committee meeting.
(2) No services described in paragraphs (b) through (d) of this Item were approved by the Registrant’s audit committee pursuant to paragraph (c)(7)(i)(C) of Rule 2-01 of Regulation S-X.
(f) Not applicable as less than 50%
(g) The aggregate non-audit fees billed by the registrant's accountant for services rendered to the registrant, and rendered to the registrant's investment adviser (not including any sub-adviser whose role is primarily portfolio management and is subcontracted with or overseen by another investment adviser), and any entity controlling, controlled by, or under common control with the adviser that provides ongoing services to the registrant for each of the last two fiscal years of the registrant were $62,356 in fiscal 2022 and $59,104 in fiscal 2021.
(h) The registrant's audit committee of the board of trustees has considered whether the provision of non-audit services that were rendered to the registrant's investment adviser (not including any subadviser whose role is primarily portfolio management and is subcontracted with or overseen by another investment adviser), and any entity controlling, controlled by, or under common control with the investment adviser that provides ongoing services to the registrant that were not pre-approved pursuant to paragraph (c)(7)(ii) of Rule 2-01 of Regulation S-X is compatible with maintaining the principal accountant's independence.
(i) Not applicable.
(j) Not applicable.
Item 5 - Audit Committee of Listed Registrants
Not applicable.
Item 6 - Investments
(a) Schedule of Investments is contained in the Reports to Shareholders included under Item 1 of this Form N-CSR.
(b) Not applicable.
Item 7 - Disclosure of Proxy Voting Policies and Procedures for Closed-End Management Investment Companies
Not applicable to this Registrant.
Item 8 - Portfolio Managers of Closed-End Management Investment Companies
Not applicable to this Registrant.
Item 9 - Purchases of Equity Securities by Closed-End Management Investment Company and Affiliated Purchasers
Not applicable to this Registrant.
Item 10 - Submission of Matters to a Vote of Security Holders
There have been no material changes to the procedures by which shareholders may recommend nominees to the Registrant's Board of Trustees.
Item 11 - Controls and Procedures
(a) The Registrant's Principal Executive Officer and Principal Financial Officer have evaluated the Registrant's disclosure controls and procedures (as defined in Rule 30a-3(c) under the Investment Company Act of 1940,
as amended) within 90 days of this filing and have concluded that the Registrant's disclosure controls and procedures were effective, as of that date.
(b) There have been no changes in the Registrant's internal control over financial reporting (as defined in Rule 30a-3(d) under the Investment Company Act of 1940, as amended) that occurred during the period covered by this report that have materially affected, or are reasonably likely to materially affect, the Registrant's internal control over financial reporting.
Item 12 - Disclosure of Securities Lending Activities for Closed-End Management Investment Companies
(a) Not applicable.
(b) Not applicable.
Item 13 - Exhibits
(a)(1) Not applicable because the Registrant has posted its Code of Ethics (as defined in Item 2(b) of Form N-CSR) on its website pursuant to paragraph (f)(2) of Item 2 of Form N-CSR.
(a)(2) Separate certifications for the Registrant's Principal Executive Officer and Principal Financial Officer, as required under Rule 30a-2(a) under the Investment Company Act of 1940, as amended, are attached as Ex-99CERT.
(b) A certification for the Registrant's Principal Executive Officer and Principal Financial Officer, as required by Rule 30a-2(b) under the Investment Company Act of 1940, as amended, is attached as Ex99.906CERT.
Signatures
Pursuant to the requirements of the Securities Exchange Act of 1934, as amended, and the Investment Company Act of 1940, as amended, the Registrant has duly caused this report to be signed on its behalf by the undersigned, thereunto duly authorized.
Janus Aspen Series
By: /s/ Michelle Rosenberg
Michelle Rosenberg, President and Chief Executive Officer of Janus Aspen Series
(Principal Executive Officer)
Date: April 19, 2023
Pursuant to the requirements of the Securities Exchange Act of 1934, as amended, and the Investment Company Act of 1940, as amended, this report has been signed below by the following persons on behalf of the Registrant and in the capacities and on the dates indicated.
By: /s/ Michelle Rosenberg
Michelle Rosenberg, President and Chief Executive Officer of Janus Aspen Series
(Principal Executive Officer)
Date: April 19, 2023
By: /s/ Jesper Nergaard
Jesper Nergaard, Vice President, Chief Financial Officer, Treasurer and Principal Accounting Officer of Janus Aspen Series
(Principal Accounting Officer and Principal Financial Officer)
Date: April 19, 2023