UNITED STATES
SECURITIES AND EXCHANGE COMMISSION
Washington, D.C. 20549
FORM N-CSR
CERTIFIED SHAREHOLDER REPORT OF REGISTERED MANAGEMENT INVESTMENT COMPANIES
Investment Company Act file number
(Exact name of registrant as specified in charter)
610 Market Street
Philadelphia, PA 19106
Registrant's telephone number, including area code:
Date of reporting period:
Item 1. Report to Stockholders.
(a) The registrant’s annual report transmitted to shareholders pursuant to Rule 30e-1 under the Investment Company Act of 1940 is as follows:
Delaware Minnesota High-Yield Municipal Bond Fund
Class A: DVMHX
Annual shareholder report | August 31, 2024
This annual shareholder report contains important information about Delaware Minnesota High-Yield Municipal Bond Fund (Fund) for the period of September 1, 2023, to August 31, 2024. You can find additional information about the Fund at delawarefunds.com/literature. You can also request this information by contacting us at 800 523-1918, weekdays from 8:30am to 6:00pm ET.
This report describes changes to the Fund that occurred during the reporting period.
What were the Fund's costs for the last 12 months?
(Based on a hypothetical $10,000 investment)
| Class | Costs of a $10,000 investment | Costs paid as a percentage of a $10,000 investment |
| Class A | $89 | 0.85% |
Management’s discussion of Fund performance
Performance highlights
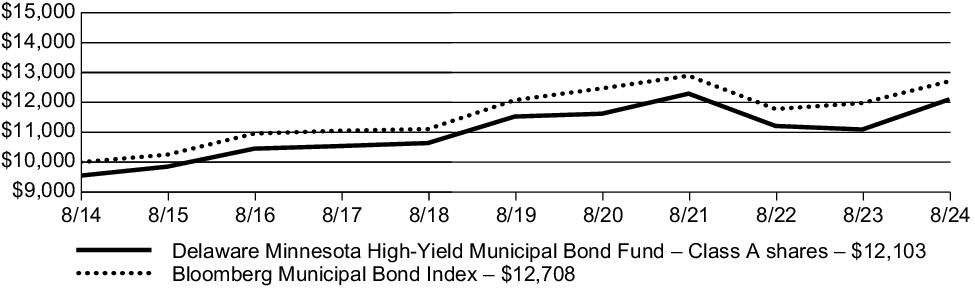
Delaware Minnesota High-Yield Municipal Bond Fund (Class A) returned 9.10% (excluding sales charge) for the 12 months ended August 31, 2024. During the same period, the Bloomberg Municipal Bond Index, the Fund's broad-based securities market index, returned 6.09%.
Top contributors to performance:
Municipal yields fell over the fiscal year against a backdrop of slowing inflation and anticipation that the US Federal Reserve (Fed) would eventually cut rates. As a result, the longer end of the curve outperformed.
Lower-investment-grade and below-investment-grade segments drove performance. The catalyst was a strong technical backdrop of diminutive high yield issuance coupled with inflows to municipal mutual funds, particularly high yield funds.
Key contributors to performance included:
Overweight to the long bond (22+ years) segment of the curve
Overweight to BBB-rated credit
Significant out-of-benchmark allocation to below-investment-grade securities
Top detractors from performance:
The front end of the curve – which is, by its nature, shorter in duration – detracted from performance over the fiscal year, as this maturity segment lagged relative to the intermediate and long ends of the curve.
Key detractors from performance included:
Modest out-of-benchmark allocation to the front end (0-1 year) of the curve
Allocation to pre-refunded bonds, predominantly on the front end of the curve
Fund performance
The following graph compares the initial and subsequent account values at the end of each of the most recently completed 10 fiscal years of the Class. It also assumes a $10,000 initial investment at the beginning of the first full fiscal year in a broad-based securities market index for the same period and the deduction of the maximum applicable sales charge for Class A shares.
Growth of $10,000 investment
For the period August 31, 2014, through August 31, 2024
| Average annual total returns (as of August 31, 2024) | 1 year | 5 year | 10 year |
| Delaware Minnesota High-Yield Municipal Bond Fund (Class A) – including sales charge | 4.25 | % | 0.04 | % | 1.93 | % |
| Delaware Minnesota High-Yield Municipal Bond Fund (Class A) – excluding sales charge | 9.10 | % | 0.97 | % | 2.40 | % |
| Bloomberg Municipal Bond Index | 6.09 | % | 1.02 | % | 2.43 | % |
Keep in mind that the Fund's past performance is not a good predictor of how the Fund will perform in the future.
Visit delawarefunds.com/performance for the most recent performance information. The graph and table do not reflect the deduction of taxes that a shareholder would pay on Fund distributions or redemption of Fund shares. Performance results reflect any expense caps in effect during these periods. All results shown assume reinvestment of distributions.
Fund statistics (as of August 31, 2024)
| Fund net assets | $223,706,331 |
| Total number of portfolio holdings | 226 |
| Total advisory fees paid | $823,966 |
| Portfolio turnover rate | 19% |
Fund holdings (as of August 31, 2024)
The tables below show the investment makeup of the Fund, with each category representing a percentage of the total net assets of the Fund.
| Healthcare Revenue Bonds | 38.07% |
| Education Revenue Bonds | 26.71% |
| Local General Obligation Bonds | 10.63% |
| Transportation Revenue Bonds | 6.43% |
| Special Tax Revenue Bonds | 3.49% |
| State General Obligation Bonds | 3.28% |
Industrial Development Revenue/Pollution Control
Revenue Bonds | 3.26% |
| Housing Revenue Bonds | 2.97% |
| Lease Revenue Bonds | 1.40% |
| Electric Revenue Bonds | 1.20% |
| Pre-Refunded Bonds | 0.57% |
| |
| |
| |
State and territory allocation
| Minnesota | 93.33% |
| Puerto Rico | 4.68% |
For the fiscal year ended August 31, 2024, the Fund introduced a new fee waiver for Class A shares of 0.84% (excluding certain items).
This is a summary of certain changes to the Fund since the beginning of the reporting period. For more complete information, you may review the Fund's next prospectus, which we expect to be available by December 31, 2024, at delawarefunds.com/literature or upon request at 800 523-1918, weekdays from 8:30am to 6:00pm ET.
Availability of additional information
You can find additional information about the Fund, such as the prospectus, financial information, holdings, and proxy voting information, at delawarefunds.com/literature. You can also request this information by contacting us at 800 523-1918, weekdays from 8:30am to 6:00pm ET.
Householding
In order to reduce expenses, we will deliver a single copy of prospectuses, proxies, financial reports, and other communication to shareholders with the same residential address, provided they have the same last name or we reasonably believe them to be members of the same family. Unless we are notified otherwise, we will continue to send recipients only one copy of these materials for as long as they remain a shareholder of the Fund. If you would like to receive individual mailings, please call 800 523-1918 and we will begin sending you separate copies of these materials within 30 days after receiving your request.
For more information, please scan the QR code at left to navigate to additional hosted material at delawarefunds.com/literature.
Delaware Minnesota High-Yield Municipal Bond Fund
Class C: DVMMX
Annual shareholder report | August 31, 2024
This annual shareholder report contains important information about Delaware Minnesota High-Yield Municipal Bond Fund (Fund) for the period of September 1, 2023, to August 31, 2024. You can find additional information about the Fund at delawarefunds.com/literature. You can also request this information by contacting us at 800 523-1918, weekdays from 8:30am to 6:00pm ET.
This report describes changes to the Fund that occurred during the reporting period.
What were the Fund's costs for the last 12 months?
(Based on a hypothetical $10,000 investment)
| Class | Costs of a $10,000 investment | Costs paid as a percentage of a $10,000 investment |
| Class C | $167 | 1.60% |
Management’s discussion of Fund performance
Performance highlights
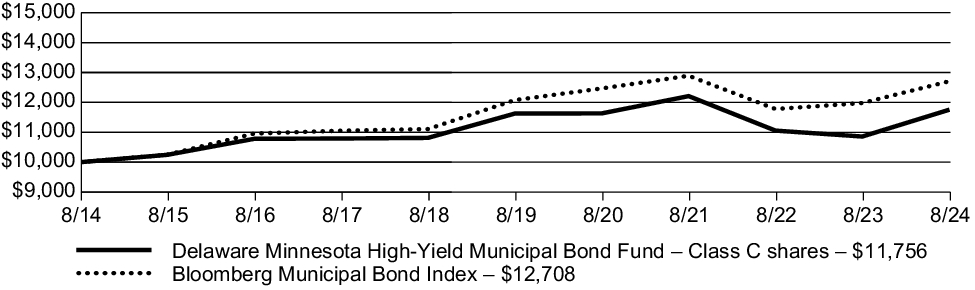
Delaware Minnesota High-Yield Municipal Bond Fund (Class C) returned 8.28% (excluding sales charge) for the 12 months ended August 31, 2024. During the same period, the Bloomberg Municipal Bond Index, the Fund's broad-based securities market index, returned 6.09%.
Top contributors to performance:
Municipal yields fell over the fiscal year against a backdrop of slowing inflation and anticipation that the US Federal Reserve (Fed) would eventually cut rates. As a result, the longer end of the curve outperformed.
Lower-investment-grade and below-investment-grade segments drove performance. The catalyst was a strong technical backdrop of diminutive high yield issuance coupled with inflows to municipal mutual funds, particularly high yield funds.
Key contributors to performance included:
Overweight to the long bond (22+ years) segment of the curve
Overweight to BBB-rated credit
Significant out-of-benchmark allocation to below-investment-grade securities
Top detractors from performance:
The front end of the curve – which is, by its nature, shorter in duration – detracted from performance over the fiscal year, as this maturity segment lagged relative to the intermediate and long ends of the curve.
Key detractors from performance included:
Modest out-of-benchmark allocation to the front end (0-1 year) of the curve
Allocation to pre-refunded bonds, predominantly on the front end of the curve
Fund performance
The following graph compares the initial and subsequent account values at the end of each of the most recently completed 10 fiscal years of the Class. It also assumes a $10,000 initial investment at the beginning of the first full fiscal year in a broad-based securities market index for the same period.
Growth of $10,000 investment
For the period August 31, 2014, through August 31, 2024
| Average annual total returns (as of August 31, 2024) | 1 year | 5 year | 10 year |
| Delaware Minnesota High-Yield Municipal Bond Fund (Class C) – including sales charge | 7.28 | % | 0.21 | % | 1.63 | % |
| Delaware Minnesota High-Yield Municipal Bond Fund (Class C) – excluding sales charge | 8.28 | % | 0.21 | % | 1.63 | % |
| Bloomberg Municipal Bond Index | 6.09 | % | 1.02 | % | 2.43 | % |
Keep in mind that the Fund's past performance is not a good predictor of how the Fund will perform in the future.
Visit delawarefunds.com/performance for the most recent performance information. The graph and table do not reflect the deduction of taxes that a shareholder would pay on Fund distributions or redemption of Fund shares. Performance results reflect any expense caps in effect during these periods. All results shown assume reinvestment of distributions.
Fund statistics (as of August 31, 2024)
| Fund net assets | $223,706,331 |
| Total number of portfolio holdings | 226 |
| Total advisory fees paid | $823,966 |
| Portfolio turnover rate | 19% |
Fund holdings (as of August 31, 2024)
The tables below show the investment makeup of the Fund, with each category representing a percentage of the total net assets of the Fund.
| Healthcare Revenue Bonds | 38.07% |
| Education Revenue Bonds | 26.71% |
| Local General Obligation Bonds | 10.63% |
| Transportation Revenue Bonds | 6.43% |
| Special Tax Revenue Bonds | 3.49% |
| State General Obligation Bonds | 3.28% |
Industrial Development Revenue/Pollution Control
Revenue Bonds | 3.26% |
| Housing Revenue Bonds | 2.97% |
| Lease Revenue Bonds | 1.40% |
| Electric Revenue Bonds | 1.20% |
| Pre-Refunded Bonds | 0.57% |
| |
| |
| |
State and territory allocation
| Minnesota | 93.33% |
| Puerto Rico | 4.68% |
For the fiscal year ended August 31, 2024, the Fund introduced a new fee waiver for Class C shares of 1.59% (excluding certain items).
This is a summary of certain changes to the Fund since the beginning of the reporting period. For more complete information, you may review the Fund's next prospectus, which we expect to be available by December 31, 2024, at delawarefunds.com/literature or upon request at 800 523-1918, weekdays from 8:30am to 6:00pm ET.
Availability of additional information
You can find additional information about the Fund, such as the prospectus, financial information, holdings, and proxy voting information, at delawarefunds.com/literature. You can also request this information by contacting us at 800 523-1918, weekdays from 8:30am to 6:00pm ET.
Householding
In order to reduce expenses, we will deliver a single copy of prospectuses, proxies, financial reports, and other communication to shareholders with the same residential address, provided they have the same last name or we reasonably believe them to be members of the same family. Unless we are notified otherwise, we will continue to send recipients only one copy of these materials for as long as they remain a shareholder of the Fund. If you would like to receive individual mailings, please call 800 523-1918 and we will begin sending you separate copies of these materials within 30 days after receiving your request.
For more information, please scan the QR code at left to navigate to additional hosted material at delawarefunds.com/literature.
Delaware Minnesota High-Yield Municipal Bond Fund
Institutional Class: DMHIX
Annual shareholder report | August 31, 2024
This annual shareholder report contains important information about Delaware Minnesota High-Yield Municipal Bond Fund (Fund) for the period of September 1, 2023, to August 31, 2024. You can find additional information about the Fund at delawarefunds.com/literature. You can also request this information by contacting us at 800 523-1918, weekdays from 8:30am to 6:00pm ET.
This report describes changes to the Fund that occurred during the reporting period.
What were the Fund's costs for the last 12 months?
(Based on a hypothetical $10,000 investment)
| Class | Costs of a $10,000 investment | Costs paid as a percentage of a $10,000 investment |
| Institutional Class | $63 | 0.60% |
Management’s discussion of Fund performance
Performance highlights
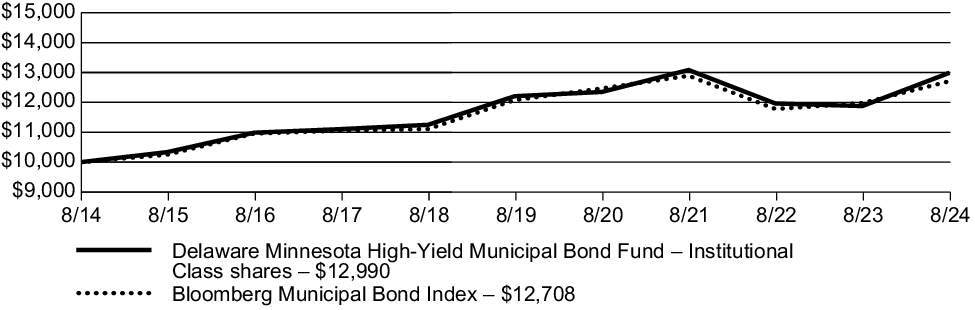
Delaware Minnesota High-Yield Municipal Bond Fund (Institutional Class) returned 9.38% (excluding sales charge) for the 12 months ended August 31, 2024. During the same period, the Bloomberg Municipal Bond Index, the Fund's broad-based securities market index, returned 6.09%.
Top contributors to performance:
Municipal yields fell over the fiscal year against a backdrop of slowing inflation and anticipation that the US Federal Reserve (Fed) would eventually cut rates. As a result, the longer end of the curve outperformed.
Lower-investment-grade and below-investment-grade segments drove performance. The catalyst was a strong technical backdrop of diminutive high yield issuance coupled with inflows to municipal mutual funds, particularly high yield funds.
Key contributors to performance included:
Overweight to the long bond (22+ years) segment of the curve
Overweight to BBB-rated credit
Significant out-of-benchmark allocation to below-investment-grade securities
Top detractors from performance:
The front end of the curve – which is, by its nature, shorter in duration – detracted from performance over the fiscal year, as this maturity segment lagged relative to the intermediate and long ends of the curve.
Key detractors from performance included:
Modest out-of-benchmark allocation to the front end (0-1 year) of the curve
Allocation to pre-refunded bonds, predominantly on the front end of the curve
Fund performance
The following graph compares the initial and subsequent account values at the end of each of the most recently completed 10 fiscal years of the Class. It also assumes a $10,000 initial investment at the beginning of the first full fiscal year in a broad-based securities market index for the same period.
Growth of $10,000 investment
For the period August 31, 2014, through August 31, 2024
| Average annual total returns (as of August 31, 2024) | 1 year | 5 year | 10 year |
| Delaware Minnesota High-Yield Municipal Bond Fund (Institutional Class) – including sales charge | 9.38 | % | 1.24 | % | 2.65 | % |
| Delaware Minnesota High-Yield Municipal Bond Fund (Institutional Class) – excluding sales charge | 9.38 | % | 1.24 | % | 2.65 | % |
| Bloomberg Municipal Bond Index | 6.09 | % | 1.02 | % | 2.43 | % |
Keep in mind that the Fund's past performance is not a good predictor of how the Fund will perform in the future.
Visit delawarefunds.com/performance for the most recent performance information. The graph and table do not reflect the deduction of taxes that a shareholder would pay on Fund distributions or redemption of Fund shares. Performance results reflect any expense caps in effect during these periods. All results shown assume reinvestment of distributions.
Fund statistics (as of August 31, 2024)
| Fund net assets | $223,706,331 |
| Total number of portfolio holdings | 226 |
| Total advisory fees paid | $823,966 |
| Portfolio turnover rate | 19% |
Fund holdings (as of August 31, 2024)
The tables below show the investment makeup of the Fund, with each category representing a percentage of the total net assets of the Fund.
| Healthcare Revenue Bonds | 38.07% |
| Education Revenue Bonds | 26.71% |
| Local General Obligation Bonds | 10.63% |
| Transportation Revenue Bonds | 6.43% |
| Special Tax Revenue Bonds | 3.49% |
| State General Obligation Bonds | 3.28% |
Industrial Development Revenue/Pollution Control
Revenue Bonds | 3.26% |
| Housing Revenue Bonds | 2.97% |
| Lease Revenue Bonds | 1.40% |
| Electric Revenue Bonds | 1.20% |
| Pre-Refunded Bonds | 0.57% |
| |
| |
| |
State and territory allocation
| Minnesota | 93.33% |
| Puerto Rico | 4.68% |
For the fiscal year ended August 31, 2024, the Fund introduced a new fee waiver for Institutional Class shares of 0.59% (excluding certain items).
This is a summary of certain changes to the Fund since the beginning of the reporting period. For more complete information, you may review the Fund's next prospectus, which we expect to be available by December 31, 2024, at delawarefunds.com/literature or upon request at 800 523-1918, weekdays from 8:30am to 6:00pm ET.
Availability of additional information
You can find additional information about the Fund, such as the prospectus, financial information, holdings, and proxy voting information, at delawarefunds.com/literature. You can also request this information by contacting us at 800 523-1918, weekdays from 8:30am to 6:00pm ET.
Householding
In order to reduce expenses, we will deliver a single copy of prospectuses, proxies, financial reports, and other communication to shareholders with the same residential address, provided they have the same last name or we reasonably believe them to be members of the same family. Unless we are notified otherwise, we will continue to send recipients only one copy of these materials for as long as they remain a shareholder of the Fund. If you would like to receive individual mailings, please call 800 523-1918 and we will begin sending you separate copies of these materials within 30 days after receiving your request.
For more information, please scan the QR code at left to navigate to additional hosted material at delawarefunds.com/literature.
Delaware National High-Yield Municipal Bond Fund
Class A: CXHYX
Annual shareholder report | August 31, 2024
This annual shareholder report contains important information about Delaware National High-Yield Municipal Bond Fund (Fund) for the period of September 1, 2023, to August 31, 2024. You can find additional information about the Fund at delawarefunds.com/literature. You can also request this information by contacting us at 800 523-1918, weekdays from 8:30am to 6:00pm ET.
What were the Fund's costs for the last 12 months?
(Based on a hypothetical $10,000 investment)
| Class | Costs of a $10,000 investment | Costs paid as a percentage of a $10,000 investment |
| Class A | $90 | 0.85% |
Management’s discussion of Fund performance
Performance highlights
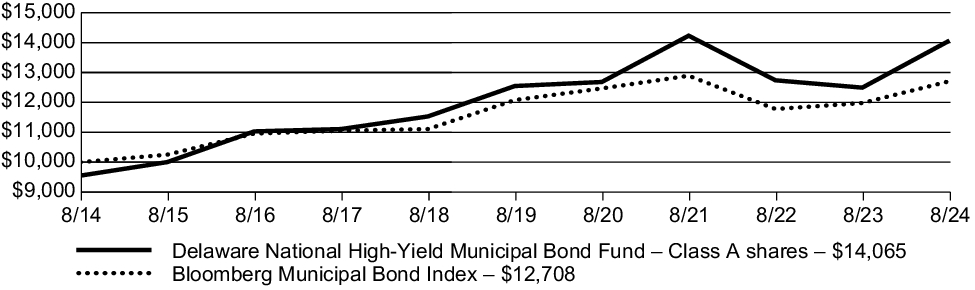
Delaware National High-Yield Municipal Bond Fund (Class A) returned 12.58% (excluding sales charge) for the 12 months ended August 31, 2024. During the same period, the Bloomberg Municipal Bond Index, the Fund's broad-based securities market index, returned 6.09%.
Top contributors to performance:
Municipal yields fell over the fiscal year against a backdrop of slowing inflation and anticipation that the US Federal Reserve (Fed) would eventually cut rates. As a result, the longer end of the curve outperformed.
Lower-investment-grade and below-investment-grade segments drove performance. The catalyst was a strong technical backdrop of diminutive high yield issuance coupled with inflows to municipal mutual funds, particularly high yield funds.
Key contributors to performance included:
Overweight to the long bond (22+ years) segment of the curve
Overweight to BBB-rated credit
Meaningful out-of-benchmark allocation to below-investment-grade securities
Top detractors from performance:
The front end of the curve – which is, by its nature, shorter in duration – detracted from performance over the fiscal year, as this maturity segment lagged relative to the intermediate and long ends of the curve.
Key detractors from performance included:
Modest out-of-benchmark allocation to the front end (0-1 year) of the curve
Allocation to pre-refunded bonds, predominantly on the front end of the curve
Fund performance
The following graph compares the initial and subsequent account values at the end of each of the most recently completed 10 fiscal years of the Class. It also assumes a $10,000 initial investment at the beginning of the first full fiscal year in a broad-based securities market index for the same period and the deduction of the maximum applicable sales charge for Class A shares.
Growth of $10,000 investment
For the period August 31, 2014, through August 31, 2024
| Average annual total returns (as of August 31, 2024) | 1 year | 5 year | 10 year |
| Delaware National High-Yield Municipal Bond Fund (Class A) – including sales charge | 7.47 | % | 1.35 | % | 3.47 | % |
| Delaware National High-Yield Municipal Bond Fund (Class A) – excluding sales charge | 12.58 | % | 2.29 | % | 3.94 | % |
| Bloomberg Municipal Bond Index | 6.09 | % | 1.02 | % | 2.43 | % |
Keep in mind that the Fund's past performance is not a good predictor of how the Fund will perform in the future.
Visit delawarefunds.com/performance for the most recent performance information. The graph and table do not reflect the deduction of taxes that a shareholder would pay on Fund distributions or redemption of Fund shares. Performance results reflect any expense caps in effect during these periods. All results shown assume reinvestment of distributions.
Fund statistics (as of August 31, 2024)
| Fund net assets | $3,340,888,050 |
| Total number of portfolio holdings | 778 |
| Total advisory fees paid | $13,174,903 |
| Portfolio turnover rate | 19% |
Fund holdings (as of August 31, 2024)
The tables below show the investment makeup of the Fund, with each category representing a percentage of the total net assets of the Fund.
Industrial Development Revenue/Pollution Control
Revenue Bonds | 22.65% |
| Education Revenue Bonds | 19.78% |
| Special Tax Revenue Bonds | 14.05% |
| Healthcare Revenue Bonds | 13.16% |
| Transportation Revenue Bonds | 9.00% |
| State General Obligation Bonds | 5.06% |
| Local General Obligation Bonds | 3.90% |
| Housing Revenue Bonds | 3.21% |
| Lease Revenue Bonds | 2.71% |
| Electric Revenue Bonds | 1.82% |
| |
| |
| |
State and territory allocation
| Puerto Rico | 13.79% |
| California | 12.17% |
| New York | 10.29% |
| Texas | 6.58% |
| Florida | 6.30% |
| Illinois | 5.74% |
| Wisconsin | 3.64% |
| Virginia | 3.48% |
| Arizona | 3.44% |
| Pennsylvania | 2.97% |
Availability of additional information
You can find additional information about the Fund, such as the prospectus, financial information, holdings, and proxy voting information, at delawarefunds.com/literature. You can also request this information by contacting us at 800 523-1918, weekdays from 8:30am to 6:00pm ET.
Householding
In order to reduce expenses, we will deliver a single copy of prospectuses, proxies, financial reports, and other communication to shareholders with the same residential address, provided they have the same last name or we reasonably believe them to be members of the same family. Unless we are notified otherwise, we will continue to send recipients only one copy of these materials for as long as they remain a shareholder of the Fund. If you would like to receive individual mailings, please call 800 523-1918 and we will begin sending you separate copies of these materials within 30 days after receiving your request.
For more information, please scan the QR code at left to navigate to additional hosted material at delawarefunds.com/literature.
Delaware National High-Yield Municipal Bond Fund
Class C: DVHCX
Annual shareholder report | August 31, 2024
This annual shareholder report contains important information about Delaware National High-Yield Municipal Bond Fund (Fund) for the period of September 1, 2023, to August 31, 2024. You can find additional information about the Fund at delawarefunds.com/literature. You can also request this information by contacting us at 800 523-1918, weekdays from 8:30am to 6:00pm ET.
What were the Fund's costs for the last 12 months?
(Based on a hypothetical $10,000 investment)
| Class | Costs of a $10,000 investment | Costs paid as a percentage of a $10,000 investment |
| Class C | $169 | 1.60% |
Management’s discussion of Fund performance
Performance highlights
Delaware National High-Yield Municipal Bond Fund (Class C) returned 11.71% (excluding sales charge) for the 12 months ended August 31, 2024. During the same period, the Bloomberg Municipal Bond Index, the Fund's broad-based securities market index, returned 6.09%.
Top contributors to performance:
Municipal yields fell over the fiscal year against a backdrop of slowing inflation and anticipation that the US Federal Reserve (Fed) would eventually cut rates. As a result, the longer end of the curve outperformed.
Lower-investment-grade and below-investment-grade segments drove performance. The catalyst was a strong technical backdrop of diminutive high yield issuance coupled with inflows to municipal mutual funds, particularly high yield funds.
Key contributors to performance included:
Overweight to the long bond (22+ years) segment of the curve
Overweight to BBB-rated credit
Meaningful out-of-benchmark allocation to below-investment-grade securities
Top detractors from performance:
The front end of the curve – which is, by its nature, shorter in duration – detracted from performance over the fiscal year, as this maturity segment lagged relative to the intermediate and long ends of the curve.
Key detractors from performance included:
Modest out-of-benchmark allocation to the front end (0-1 year) of the curve
Allocation to pre-refunded bonds, predominantly on the front end of the curve
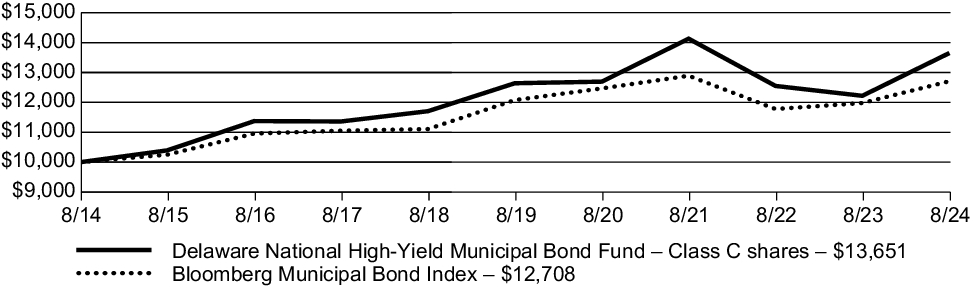
Fund performance
The following graph compares the initial and subsequent account values at the end of each of the most recently completed 10 fiscal years of the Class. It also assumes a $10,000 initial investment at the beginning of the first full fiscal year in a broad-based securities market index for the same period.
Growth of $10,000 investment
For the period August 31, 2014, through August 31, 2024
| Average annual total returns (as of August 31, 2024) | 1 year | 5 year | 10 year |
| Delaware National High-Yield Municipal Bond Fund (Class C) – including sales charge | 10.71 | % | 1.54 | % | 3.16 | % |
| Delaware National High-Yield Municipal Bond Fund (Class C) – excluding sales charge | 11.71 | % | 1.54 | % | 3.16 | % |
| Bloomberg Municipal Bond Index | 6.09 | % | 1.02 | % | 2.43 | % |
Keep in mind that the Fund's past performance is not a good predictor of how the Fund will perform in the future.
Visit delawarefunds.com/performance for the most recent performance information. The graph and table do not reflect the deduction of taxes that a shareholder would pay on Fund distributions or redemption of Fund shares. Performance results reflect any expense caps in effect during these periods. All results shown assume reinvestment of distributions.
Fund statistics (as of August 31, 2024)
| Fund net assets | $3,340,888,050 |
| Total number of portfolio holdings | 778 |
| Total advisory fees paid | $13,174,903 |
| Portfolio turnover rate | 19% |
Fund holdings (as of August 31, 2024)
The tables below show the investment makeup of the Fund, with each category representing a percentage of the total net assets of the Fund.
Industrial Development Revenue/Pollution Control
Revenue Bonds | 22.65% |
| Education Revenue Bonds | 19.78% |
| Special Tax Revenue Bonds | 14.05% |
| Healthcare Revenue Bonds | 13.16% |
| Transportation Revenue Bonds | 9.00% |
| State General Obligation Bonds | 5.06% |
| Local General Obligation Bonds | 3.90% |
| Housing Revenue Bonds | 3.21% |
| Lease Revenue Bonds | 2.71% |
| Electric Revenue Bonds | 1.82% |
| |
| |
| |
State and territory allocation
| Puerto Rico | 13.79% |
| California | 12.17% |
| New York | 10.29% |
| Texas | 6.58% |
| Florida | 6.30% |
| Illinois | 5.74% |
| Wisconsin | 3.64% |
| Virginia | 3.48% |
| Arizona | 3.44% |
| Pennsylvania | 2.97% |
Availability of additional information
You can find additional information about the Fund, such as the prospectus, financial information, holdings, and proxy voting information, at delawarefunds.com/literature. You can also request this information by contacting us at 800 523-1918, weekdays from 8:30am to 6:00pm ET.
Householding
In order to reduce expenses, we will deliver a single copy of prospectuses, proxies, financial reports, and other communication to shareholders with the same residential address, provided they have the same last name or we reasonably believe them to be members of the same family. Unless we are notified otherwise, we will continue to send recipients only one copy of these materials for as long as they remain a shareholder of the Fund. If you would like to receive individual mailings, please call 800 523-1918 and we will begin sending you separate copies of these materials within 30 days after receiving your request.
For more information, please scan the QR code at left to navigate to additional hosted material at delawarefunds.com/literature.
Delaware National High-Yield Municipal Bond Fund
Institutional Class: DVHIX
Annual shareholder report | August 31, 2024
This annual shareholder report contains important information about Delaware National High-Yield Municipal Bond Fund (Fund) for the period of September 1, 2023, to August 31, 2024. You can find additional information about the Fund at delawarefunds.com/literature. You can also request this information by contacting us at 800 523-1918, weekdays from 8:30am to 6:00pm ET.
What were the Fund's costs for the last 12 months?
(Based on a hypothetical $10,000 investment)
| Class | Costs of a $10,000 investment | Costs paid as a percentage of a $10,000 investment |
| Institutional Class | $64 | 0.60% |
Management’s discussion of Fund performance
Performance highlights
Delaware National High-Yield Municipal Bond Fund (Institutional Class) returned 12.78% (excluding sales charge) for the 12 months ended August 31, 2024. During the same period, the Bloomberg Municipal Bond Index, the Fund's broad-based securities market index, returned 6.09%.
Top contributors to performance:
Municipal yields fell over the fiscal year against a backdrop of slowing inflation and anticipation that the US Federal Reserve (Fed) would eventually cut rates. As a result, the longer end of the curve outperformed.
Lower-investment-grade and below-investment-grade segments drove performance. The catalyst was a strong technical backdrop of diminutive high yield issuance coupled with inflows to municipal mutual funds, particularly high yield funds.
Key contributors to performance included:
Overweight to the long bond (22+ years) segment of the curve
Overweight to BBB-rated credit
Meaningful out-of-benchmark allocation to below-investment-grade securities
Top detractors from performance:
The front end of the curve – which is, by its nature, shorter in duration – detracted from performance over the fiscal year, as this maturity segment lagged relative to the intermediate and long ends of the curve.
Key detractors from performance included:
Modest out-of-benchmark allocation to the front end (0-1 year) of the curve
Allocation to pre-refunded bonds, predominantly on the front end of the curve
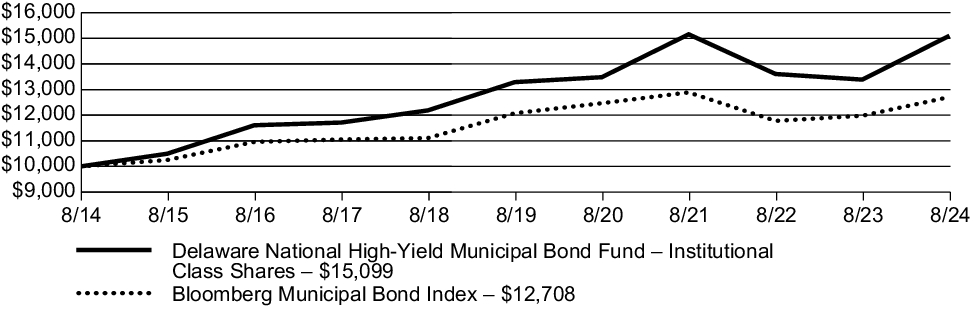
Fund performance
The following graph compares the initial and subsequent account values at the end of each of the most recently completed 10 fiscal years of the Class. It also assumes a $10,000 initial investment at the beginning of the first full fiscal year in a broad-based securities market index for the same period.
Growth of $10,000 investment
For the period August 31, 2014, through August 31, 2024
| Average annual total returns (as of August 31, 2024) | 1 year | 5 year | 10 year |
| Delaware National High-Yield Municipal Bond Fund (Institutional Class) – including sales charge | 12.78 | % | 2.56 | % | 4.21 | % |
| Delaware National High-Yield Municipal Bond Fund (Institutional Class) – excluding sales charge | 12.78 | % | 2.56 | % | 4.21 | % |
| Bloomberg Municipal Bond Index | 6.09 | % | 1.02 | % | 2.43 | % |
Keep in mind that the Fund's past performance is not a good predictor of how the Fund will perform in the future.
Visit delawarefunds.com/performance for the most recent performance information. The graph and table do not reflect the deduction of taxes that a shareholder would pay on Fund distributions or redemption of Fund shares. Performance results reflect any expense caps in effect during these periods. All results shown assume reinvestment of distributions.
Fund statistics (as of August 31, 2024)
| Fund net assets | $3,340,888,050 |
| Total number of portfolio holdings | 778 |
| Total advisory fees paid | $13,174,903 |
| Portfolio turnover rate | 19% |
Fund holdings (as of August 31, 2024)
The tables below show the investment makeup of the Fund, with each category representing a percentage of the total net assets of the Fund.
Industrial Development Revenue/Pollution Control
Revenue Bonds | 22.65% |
| Education Revenue Bonds | 19.78% |
| Special Tax Revenue Bonds | 14.05% |
| Healthcare Revenue Bonds | 13.16% |
| Transportation Revenue Bonds | 9.00% |
| State General Obligation Bonds | 5.06% |
| Local General Obligation Bonds | 3.90% |
| Housing Revenue Bonds | 3.21% |
| Lease Revenue Bonds | 2.71% |
| Electric Revenue Bonds | 1.82% |
| |
| |
| |
State and territory allocation
| Puerto Rico | 13.79% |
| California | 12.17% |
| New York | 10.29% |
| Texas | 6.58% |
| Florida | 6.30% |
| Illinois | 5.74% |
| Wisconsin | 3.64% |
| Virginia | 3.48% |
| Arizona | 3.44% |
| Pennsylvania | 2.97% |
Availability of additional information
You can find additional information about the Fund, such as the prospectus, financial information, holdings, and proxy voting information, at delawarefunds.com/literature. You can also request this information by contacting us at 800 523-1918, weekdays from 8:30am to 6:00pm ET.
Householding
In order to reduce expenses, we will deliver a single copy of prospectuses, proxies, financial reports, and other communication to shareholders with the same residential address, provided they have the same last name or we reasonably believe them to be members of the same family. Unless we are notified otherwise, we will continue to send recipients only one copy of these materials for as long as they remain a shareholder of the Fund. If you would like to receive individual mailings, please call 800 523-1918 and we will begin sending you separate copies of these materials within 30 days after receiving your request.
For more information, please scan the QR code at left to navigate to additional hosted material at delawarefunds.com/literature.
Delaware Tax-Free California Fund
Class A: DVTAX
Annual shareholder report | August 31, 2024
This annual shareholder report contains important information about Delaware Tax-Free California Fund (Fund) for the period of September 1, 2023, to August 31, 2024. You can find additional information about the Fund at delawarefunds.com/literature. You can also request this information by contacting us at 800 523-1918, weekdays from 8:30am to 6:00pm ET.
What were the Fund's costs for the last 12 months?
(Based on a hypothetical $10,000 investment)
| Class | Costs of a $10,000 investment | Costs paid as a percentage of a $10,000 investment |
| Class A | $84 | 0.80% |
Management’s discussion of Fund performance
Performance highlights
Delaware Tax-Free California Fund (Class A) returned 9.98% (excluding sales charge) for the 12 months ended August 31, 2024. During the same period, the Bloomberg Municipal Bond Index, the Fund's broad-based securities market index, returned 6.09%.
Top contributors to performance:
Municipal yields fell over the fiscal year against a backdrop of slowing inflation and anticipation that the US Federal Reserve (Fed) would eventually cut rates. As a result, the longer end of the curve outperformed.
Lower-investment-grade and below-investment-grade segments drove performance. The catalyst was a strong technical backdrop of diminutive high yield issuance coupled with inflows to municipal mutual funds, particularly high yield funds
Key contributors to performance included:
Overweight to the long bond (22+ years) segment of the curve
Overweight to BBB-rated credit
Meaningful out-of-benchmark allocation to below-investment-grade securities
Top detractors from performance:
The front end of the curve – which is, by its nature, shorter in duration – detracted from performance over the fiscal year, as this maturity segment lagged relative to the intermediate and long ends of the curve.
Key detractors from performance included:
Modest out-of-benchmark allocation to the front end (0-1 year) of the curve
Allocation to pre-refunded bonds, predominantly on the front end of the curve
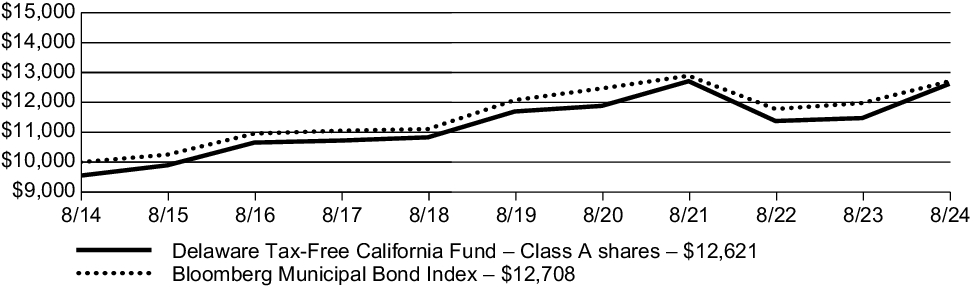
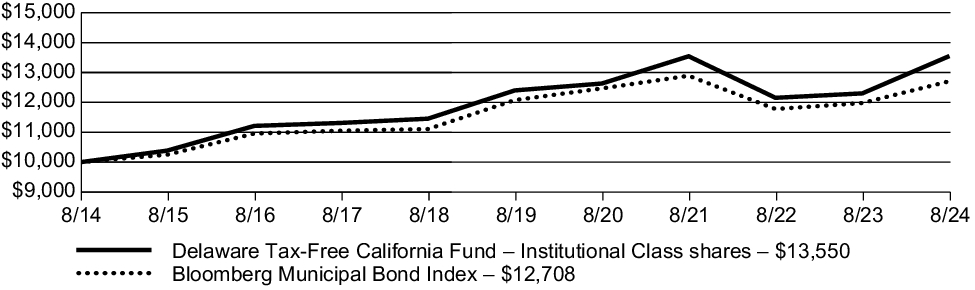
Fund performance
The following graph compares the initial and subsequent account values at the end of each of the most recently completed 10 fiscal years of the Class. It also assumes a $10,000 initial investment at the beginning of the first full fiscal year in a broad-based securities market index for the same period and the deduction of the maximum applicable sales charge for Class A shares.
Growth of $10,000 investment
For the period August 31, 2014, through August 31, 2024
| Average annual total returns (as of August 31, 2024) | 1 year | 5 year | 10 year |
| Delaware Tax-Free California Fund (Class A) – including sales charge | 5.06 | % | 0.59 | % | 2.36 | % |
| Delaware Tax-Free California Fund (Class A) – excluding sales charge | 9.98 | % | 1.52 | % | 2.83 | % |
| Bloomberg Municipal Bond Index | 6.09 | % | 1.02 | % | 2.43 | % |
Keep in mind that the Fund's past performance is not a good predictor of how the Fund will perform in the future.
Visit delawarefunds.com/performance for the most recent performance information. The graph and table do not reflect the deduction of taxes that a shareholder would pay on Fund distributions or redemption of Fund shares. Performance results reflect any expense caps in effect during these periods. All results shown assume reinvestment of distributions.
Fund statistics (as of August 31, 2024)
| Fund net assets | $287,208,829 |
| Total number of portfolio holdings | 237 |
| Total advisory fees paid | $849,479 |
| Portfolio turnover rate | 25% |
Fund holdings (as of August 31, 2024)
The tables below show the investment makeup of the Fund, with each category representing a percentage of the total net assets of the Fund.
| Education Revenue Bonds | 18.26% |
| Healthcare Revenue Bonds | 14.74% |
| Transportation Revenue Bonds | 12.16% |
| Special Tax Revenue Bonds | 11.60% |
Industrial Development Revenue/Pollution Control
Revenue Bonds | 11.05% |
| State General Obligation Bonds | 9.63% |
| Lease Revenue Bonds | 5.45% |
| Electric Revenue Bonds | 5.37% |
| Local General Obligation Bonds | 3.02% |
| Housing Revenue Bonds | 2.65% |
| |
| |
| |
State and territory allocation
| California | 83.70% |
| Puerto Rico | 12.70% |
| Guam | 1.20% |
| US Virgin Islands | 0.19% |
Availability of additional information
You can find additional information about the Fund, such as the prospectus, financial information, holdings, and proxy voting information, at delawarefunds.com/literature. You can also request this information by contacting us at 800 523-1918, weekdays from 8:30am to 6:00pm ET.
Householding
In order to reduce expenses, we will deliver a single copy of prospectuses, proxies, financial reports, and other communication to shareholders with the same residential address, provided they have the same last name or we reasonably believe them to be members of the same family. Unless we are notified otherwise, we will continue to send recipients only one copy of these materials for as long as they remain a shareholder of the Fund. If you would like to receive individual mailings, please call 800 523-1918 and we will begin sending you separate copies of these materials within 30 days after receiving your request.
For more information, please scan the QR code at left to navigate to additional hosted material at delawarefunds.com/literature.
Delaware Tax-Free California Fund
Class C: DVFTX
Annual shareholder report | August 31, 2024
This annual shareholder report contains important information about Delaware Tax-Free California Fund (Fund) for the period of September 1, 2023, to August 31, 2024. You can find additional information about the Fund at delawarefunds.com/literature. You can also request this information by contacting us at 800 523-1918, weekdays from 8:30am to 6:00pm ET.
What were the Fund's costs for the last 12 months?
(Based on a hypothetical $10,000 investment)
| Class | Costs of a $10,000 investment | Costs paid as a percentage of a $10,000 investment |
| Class C | $162 | 1.55% |
Management’s discussion of Fund performance
Performance highlights
Delaware Tax-Free California Fund (Class C) returned 9.05% (excluding sales charge) for the 12 months ended August 31, 2024. During the same period, the Bloomberg Municipal Bond Index, the Fund's broad-based securities market index, returned 6.09%.
Top contributors to performance:
Municipal yields fell over the fiscal year against a backdrop of slowing inflation and anticipation that the US Federal Reserve (Fed) would eventually cut rates. As a result, the longer end of the curve outperformed.
Lower-investment-grade and below-investment-grade segments drove performance. The catalyst was a strong technical backdrop of diminutive high yield issuance coupled with inflows to municipal mutual funds, particularly high yield funds
Key contributors to performance included:
Overweight to the long bond (22+ years) segment of the curve
Overweight to BBB-rated credit
Meaningful out-of-benchmark allocation to below-investment-grade securities
Top detractors from performance:
The front end of the curve – which is, by its nature, shorter in duration – detracted from performance over the fiscal year, as this maturity segment lagged relative to the intermediate and long ends of the curve.
Key detractors from performance included:
Modest out-of-benchmark allocation to the front end (0-1 year) of the curve
Allocation to pre-refunded bonds, predominantly on the front end of the curve
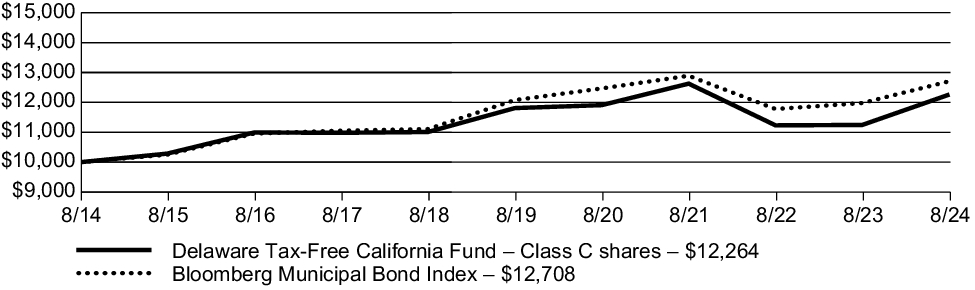
Fund performance
The following graph compares the initial and subsequent account values at the end of each of the most recently completed 10 fiscal years of the Class. It also assumes a $10,000 initial investment at the beginning of the first full fiscal year in a broad-based securities market index for the same period.
Growth of $10,000 investment
For the period August 31, 2014, through August 31, 2024
| Average annual total returns (as of August 31, 2024) | 1 year | 5 year | 10 year |
| Delaware Tax-Free California Fund (Class C) – including sales charge | 8.05 | % | 0.74 | % | 2.06 | % |
| Delaware Tax-Free California Fund (Class C) – excluding sales charge | 9.05 | % | 0.74 | % | 2.06 | % |
| Bloomberg Municipal Bond Index | 6.09 | % | 1.02 | % | 2.43 | % |
Keep in mind that the Fund's past performance is not a good predictor of how the Fund will perform in the future.
Visit delawarefunds.com/performance for the most recent performance information. The graph and table do not reflect the deduction of taxes that a shareholder would pay on Fund distributions or redemption of Fund shares. Performance results reflect any expense caps in effect during these periods. All results shown assume reinvestment of distributions.
Fund statistics (as of August 31, 2024)
| Fund net assets | $287,208,829 |
| Total number of portfolio holdings | 237 |
| Total advisory fees paid | $849,479 |
| Portfolio turnover rate | 25% |
Fund holdings (as of August 31, 2024)
The tables below show the investment makeup of the Fund, with each category representing a percentage of the total net assets of the Fund.
| Education Revenue Bonds | 18.26% |
| Healthcare Revenue Bonds | 14.74% |
| Transportation Revenue Bonds | 12.16% |
| Special Tax Revenue Bonds | 11.60% |
Industrial Development Revenue/Pollution Control
Revenue Bonds | 11.05% |
| State General Obligation Bonds | 9.63% |
| Lease Revenue Bonds | 5.45% |
| Electric Revenue Bonds | 5.37% |
| Local General Obligation Bonds | 3.02% |
| Housing Revenue Bonds | 2.65% |
| |
| |
| |
State and territory allocation
| California | 83.70% |
| Puerto Rico | 12.70% |
| Guam | 1.20% |
| US Virgin Islands | 0.19% |
Availability of additional information
You can find additional information about the Fund, such as the prospectus, financial information, holdings, and proxy voting information, at delawarefunds.com/literature. You can also request this information by contacting us at 800 523-1918, weekdays from 8:30am to 6:00pm ET.
Householding
In order to reduce expenses, we will deliver a single copy of prospectuses, proxies, financial reports, and other communication to shareholders with the same residential address, provided they have the same last name or we reasonably believe them to be members of the same family. Unless we are notified otherwise, we will continue to send recipients only one copy of these materials for as long as they remain a shareholder of the Fund. If you would like to receive individual mailings, please call 800 523-1918 and we will begin sending you separate copies of these materials within 30 days after receiving your request.
For more information, please scan the QR code at left to navigate to additional hosted material at delawarefunds.com/literature.
Delaware Tax-Free California Fund
Institutional Class: DCTIX
Annual shareholder report | August 31, 2024
This annual shareholder report contains important information about Delaware Tax-Free California Fund (Fund) for the period of September 1, 2023, to August 31, 2024. You can find additional information about the Fund at delawarefunds.com/literature. You can also request this information by contacting us at 800 523-1918, weekdays from 8:30am to 6:00pm ET.
What were the Fund's costs for the last 12 months?
(Based on a hypothetical $10,000 investment)
| Class | Costs of a $10,000 investment | Costs paid as a percentage of a $10,000 investment |
| Institutional Class | $58 | 0.55% |
Management’s discussion of Fund performance
Performance highlights
Delaware Tax-Free California Fund (Institutional Class) returned 10.15% (excluding sales charge) for the 12 months ended August 31, 2024. During the same period, the Bloomberg Municipal Bond Index, the Fund's broad-based securities market index, returned 6.09%.
Top contributors to performance:
Municipal yields fell over the fiscal year against a backdrop of slowing inflation and anticipation that the US Federal Reserve (Fed) would eventually cut rates. As a result, the longer end of the curve outperformed.
Lower-investment-grade and below-investment-grade segments drove performance. The catalyst was a strong technical backdrop of diminutive high yield issuance coupled with inflows to municipal mutual funds, particularly high yield funds
Key contributors to performance included:
Overweight to the long bond (22+ years) segment of the curve
Overweight to BBB-rated credit
Meaningful out-of-benchmark allocation to below-investment-grade securities
Top detractors from performance:
The front end of the curve – which is, by its nature, shorter in duration – detracted from performance over the fiscal year, as this maturity segment lagged relative to the intermediate and long ends of the curve.
Key detractors from performance included:
Modest out-of-benchmark allocation to the front end (0-1 year) of the curve
Allocation to pre-refunded bonds, predominantly on the front end of the curve
Fund performance
The following graph compares the initial and subsequent account values at the end of each of the most recently completed 10 fiscal years of the Class. It also assumes a $10,000 initial investment at the beginning of the first full fiscal year in a broad-based securities market index for the same period.
Growth of $10,000 investment
For the period August 31, 2014, through August 31, 2024
| Average annual total returns (as of August 31, 2024) | 1 year | 5 year | 10 year |
| Delaware Tax-Free California Fund (Institutional Class) – including sales charge | 10.15 | % | 1.77 | % | 3.08 | % |
| Delaware Tax-Free California Fund (Institutional Class) – excluding sales charge | 10.15 | % | 1.77 | % | 3.08 | % |
| Bloomberg Municipal Bond Index | 6.09 | % | 1.02 | % | 2.43 | % |
Keep in mind that the Fund's past performance is not a good predictor of how the Fund will perform in the future.
Visit delawarefunds.com/performance for the most recent performance information. The graph and table do not reflect the deduction of taxes that a shareholder would pay on Fund distributions or redemption of Fund shares. Performance results reflect any expense caps in effect during these periods. All results shown assume reinvestment of distributions.
Fund statistics (as of August 31, 2024)
| Fund net assets | $287,208,829 |
| Total number of portfolio holdings | 237 |
| Total advisory fees paid | $849,479 |
| Portfolio turnover rate | 25% |
Fund holdings (as of August 31, 2024)
The tables below show the investment makeup of the Fund, with each category representing a percentage of the total net assets of the Fund.
| Education Revenue Bonds | 18.26% |
| Healthcare Revenue Bonds | 14.74% |
| Transportation Revenue Bonds | 12.16% |
| Special Tax Revenue Bonds | 11.60% |
Industrial Development Revenue/Pollution Control
Revenue Bonds | 11.05% |
| State General Obligation Bonds | 9.63% |
| Lease Revenue Bonds | 5.45% |
| Electric Revenue Bonds | 5.37% |
| Local General Obligation Bonds | 3.02% |
| Housing Revenue Bonds | 2.65% |
| |
| |
| |
State and territory allocation
| California | 83.70% |
| Puerto Rico | 12.70% |
| Guam | 1.20% |
| US Virgin Islands | 0.19% |
Availability of additional information
You can find additional information about the Fund, such as the prospectus, financial information, holdings, and proxy voting information, at delawarefunds.com/literature. You can also request this information by contacting us at 800 523-1918, weekdays from 8:30am to 6:00pm ET.
Householding
In order to reduce expenses, we will deliver a single copy of prospectuses, proxies, financial reports, and other communication to shareholders with the same residential address, provided they have the same last name or we reasonably believe them to be members of the same family. Unless we are notified otherwise, we will continue to send recipients only one copy of these materials for as long as they remain a shareholder of the Fund. If you would like to receive individual mailings, please call 800 523-1918 and we will begin sending you separate copies of these materials within 30 days after receiving your request.
For more information, please scan the QR code at left to navigate to additional hosted material at delawarefunds.com/literature.
Delaware Tax-Free Idaho Fund
Class A: VIDAX
Annual shareholder report | August 31, 2024
This annual shareholder report contains important information about Delaware Tax-Free Idaho Fund (Fund) for the period of September 1, 2023, to August 31, 2024. You can find additional information about the Fund at delawarefunds.com/literature. You can also request this information by contacting us at 800 523-1918, weekdays from 8:30am to 6:00pm ET.
What were the Fund's costs for the last 12 months?
(Based on a hypothetical $10,000 investment)
| Class | Costs of a $10,000 investment | Costs paid as a percentage of a $10,000 investment |
| Class A | $90 | 0.86% |
Management’s discussion of Fund performance
Performance highlights
Delaware Tax-Free Idaho Fund (Class A) returned 9.19% (excluding sales charge) for the 12 months ended August 31, 2024. During the same period, the Bloomberg Municipal Bond Index, the Fund's broad-based securities market index, returned 6.09%.
Top contributors to performance:
Municipal yields fell over the fiscal year against a backdrop of slowing inflation and anticipation that the US Federal Reserve (Fed) would eventually cut rates. As a result, the longer end of the curve outperformed.
Lower-investment-grade and below-investment-grade segments drove performance. The catalyst was a strong technical backdrop of diminutive high yield issuance coupled with inflows to municipal mutual funds, particularly high yield funds.
Key contributors to performance included:
Overweight to the long bond (22+ years) segment of the curve
Overweight to BBB-rated credit
Meaningful out-of-benchmark allocation to below-investment-grade securities
Top detractors from performance:
The front end of the curve – which is, by its nature, shorter in duration – detracted from performance over the fiscal year, as this maturity segment lagged relative to the intermediate and long ends of the curve.
Key detractors from performance included:
Modest out-of-benchmark allocation to the front end (0-1 year) of the curve
Allocation to pre-refunded bonds, predominantly on the front end of the curve
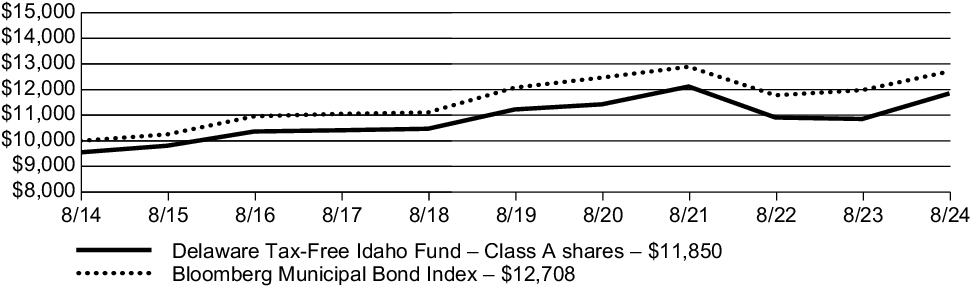
Fund performance
The following graph compares the initial and subsequent account values at the end of each of the most recently completed 10 fiscal years of the Class. It also assumes a $10,000 initial investment at the beginning of the first full fiscal year in a broad-based securities market index for the same period and the deduction of the maximum applicable sales charge for Class A shares.
Growth of $10,000 investment
For the period August 31, 2014, through August 31, 2024
| Average annual total returns (as of August 31, 2024) | 1 year | 5 year | 10 year |
| Delaware Tax-Free Idaho Fund (Class A) – including sales charge | 4.31 | % | 0.15 | % | 1.71 | % |
| Delaware Tax-Free Idaho Fund (Class A) – excluding sales charge | 9.19 | % | 1.07 | % | 2.18 | % |
| Bloomberg Municipal Bond Index | 6.09 | % | 1.02 | % | 2.43 | % |
Keep in mind that the Fund's past performance is not a good predictor of how the Fund will perform in the future.
Visit delawarefunds.com/performance for the most recent performance information. The graph and table do not reflect the deduction of taxes that a shareholder would pay on Fund distributions or redemption of Fund shares. Performance results reflect any expense caps in effect during these periods. All results shown assume reinvestment of distributions.
Fund statistics (as of August 31, 2024)
| Fund net assets | $130,657,875 |
| Total number of portfolio holdings | 110 |
| Total advisory fees paid | $476,040 |
| Portfolio turnover rate | 14% |
Fund holdings (as of August 31, 2024)
The tables below show the investment makeup of the Fund, with each category representing a percentage of the total net assets of the Fund.
| Education Revenue Bonds | 22.67% |
| Special Tax Revenue Bonds | 22.61% |
| Healthcare Revenue Bonds | 12.93% |
| Local General Obligation Bonds | 8.49% |
| Housing Revenue Bonds | 6.80% |
| Lease Revenue Bonds | 6.70% |
| Transportation Revenue Bonds | 6.29% |
| Electric Revenue Bonds | 4.62% |
Industrial Development Revenue/Pollution Control
Revenue Bonds | 4.07% |
| Water & Sewer Revenue Bonds | 2.18% |
| |
| |
| |
State and territory allocation
| Idaho | 82.58% |
| Puerto Rico | 16.19% |
| Guam | 0.54% |
Availability of additional information
You can find additional information about the Fund, such as the prospectus, financial information, holdings, and proxy voting information, at delawarefunds.com/literature. You can also request this information by contacting us at 800 523-1918, weekdays from 8:30am to 6:00pm ET.
Householding
In order to reduce expenses, we will deliver a single copy of prospectuses, proxies, financial reports, and other communication to shareholders with the same residential address, provided they have the same last name or we reasonably believe them to be members of the same family. Unless we are notified otherwise, we will continue to send recipients only one copy of these materials for as long as they remain a shareholder of the Fund. If you would like to receive individual mailings, please call 800 523-1918 and we will begin sending you separate copies of these materials within 30 days after receiving your request.
For more information, please scan the QR code at left to navigate to additional hosted material at delawarefunds.com/literature.
Delaware Tax-Free Idaho Fund
Class C: DVICX
Annual shareholder report | August 31, 2024
This annual shareholder report contains important information about Delaware Tax-Free Idaho Fund (Fund) for the period of September 1, 2023, to August 31, 2024. You can find additional information about the Fund at delawarefunds.com/literature. You can also request this information by contacting us at 800 523-1918, weekdays from 8:30am to 6:00pm ET.
What were the Fund's costs for the last 12 months?
(Based on a hypothetical $10,000 investment)
| Class | Costs of a $10,000 investment | Costs paid as a percentage of a $10,000 investment |
| Class C | $168 | 1.61% |
Management’s discussion of Fund performance
Performance highlights
Delaware Tax-Free Idaho Fund (Class C) returned 8.38% (excluding sales charge) for the 12 months ended August 31, 2024. During the same period, the Bloomberg Municipal Bond Index, the Fund's broad-based securities market index, returned 6.09%.
Top contributors to performance:
Municipal yields fell over the fiscal year against a backdrop of slowing inflation and anticipation that the US Federal Reserve (Fed) would eventually cut rates. As a result, the longer end of the curve outperformed.
Lower-investment-grade and below-investment-grade segments drove performance. The catalyst was a strong technical backdrop of diminutive high yield issuance coupled with inflows to municipal mutual funds, particularly high yield funds.
Key contributors to performance included:
Overweight to the long bond (22+ years) segment of the curve
Overweight to BBB-rated credit
Meaningful out-of-benchmark allocation to below-investment-grade securities
Top detractors from performance:
The front end of the curve – which is, by its nature, shorter in duration – detracted from performance over the fiscal year, as this maturity segment lagged relative to the intermediate and long ends of the curve.
Key detractors from performance included:
Modest out-of-benchmark allocation to the front end (0-1 year) of the curve
Allocation to pre-refunded bonds, predominantly on the front end of the curve
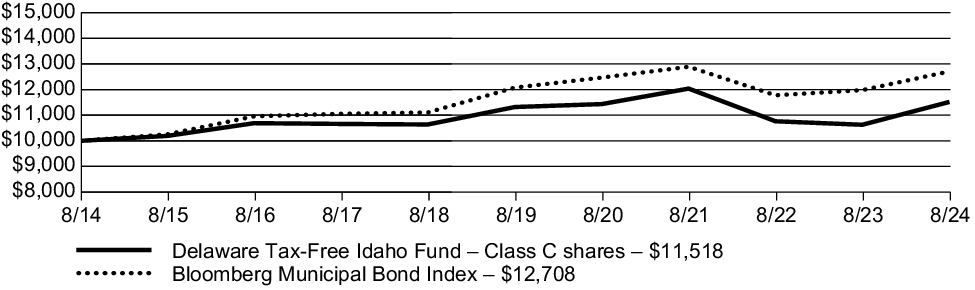
Fund performance
The following graph compares the initial and subsequent account values at the end of each of the most recently completed 10 fiscal years of the Class. It also assumes a $10,000 initial investment at the beginning of the first full fiscal year in a broad-based securities market index for the same period.
Growth of $10,000 investment
For the period August 31, 2014, through August 31, 2024
| Average annual total returns (as of August 31, 2024) | 1 year | 5 year | 10 year |
| Delaware Tax-Free Idaho Fund (Class C) – including sales charge | 7.38 | % | 0.34 | % | 1.42 | % |
| Delaware Tax-Free Idaho Fund (Class C) – excluding sales charge | 8.38 | % | 0.34 | % | 1.42 | % |
| Bloomberg Municipal Bond Index | 6.09 | % | 1.02 | % | 2.43 | % |
Keep in mind that the Fund's past performance is not a good predictor of how the Fund will perform in the future.
Visit delawarefunds.com/performance for the most recent performance information. The graph and table do not reflect the deduction of taxes that a shareholder would pay on Fund distributions or redemption of Fund shares. Performance results reflect any expense caps in effect during these periods. All results shown assume reinvestment of distributions.
Fund statistics (as of August 31, 2024)
| Fund net assets | $130,657,875 |
| Total number of portfolio holdings | 110 |
| Total advisory fees paid | $476,040 |
| Portfolio turnover rate | 14% |
Fund holdings (as of August 31, 2024)
The tables below show the investment makeup of the Fund, with each category representing a percentage of the total net assets of the Fund.
| Education Revenue Bonds | 22.67% |
| Special Tax Revenue Bonds | 22.61% |
| Healthcare Revenue Bonds | 12.93% |
| Local General Obligation Bonds | 8.49% |
| Housing Revenue Bonds | 6.80% |
| Lease Revenue Bonds | 6.70% |
| Transportation Revenue Bonds | 6.29% |
| Electric Revenue Bonds | 4.62% |
Industrial Development Revenue/Pollution Control
Revenue Bonds | 4.07% |
| Water & Sewer Revenue Bonds | 2.18% |
| |
| |
| |
State and territory allocation
| Idaho | 82.58% |
| Puerto Rico | 16.19% |
| Guam | 0.54% |
Availability of additional information
You can find additional information about the Fund, such as the prospectus, financial information, holdings, and proxy voting information, at delawarefunds.com/literature. You can also request this information by contacting us at 800 523-1918, weekdays from 8:30am to 6:00pm ET.
Householding
In order to reduce expenses, we will deliver a single copy of prospectuses, proxies, financial reports, and other communication to shareholders with the same residential address, provided they have the same last name or we reasonably believe them to be members of the same family. Unless we are notified otherwise, we will continue to send recipients only one copy of these materials for as long as they remain a shareholder of the Fund. If you would like to receive individual mailings, please call 800 523-1918 and we will begin sending you separate copies of these materials within 30 days after receiving your request.
For more information, please scan the QR code at left to navigate to additional hosted material at delawarefunds.com/literature.
Delaware Tax-Free Idaho Fund
Institutional Class: DTIDX
Annual shareholder report | August 31, 2024
This annual shareholder report contains important information about Delaware Tax-Free Idaho Fund (Fund) for the period of September 1, 2023, to August 31, 2024. You can find additional information about the Fund at delawarefunds.com/literature. You can also request this information by contacting us at 800 523-1918, weekdays from 8:30am to 6:00pm ET.
What were the Fund's costs for the last 12 months?
(Based on a hypothetical $10,000 investment)
| Class | Costs of a $10,000 investment | Costs paid as a percentage of a $10,000 investment |
| Institutional Class | $64 | 0.61% |
Management’s discussion of Fund performance
Performance highlights
Delaware Tax-Free Idaho Fund (Institutional Class) returned 9.35% (excluding sales charge) for the 12 months ended August 31, 2024. During the same period, the Bloomberg Municipal Bond Index, the Fund's broad-based securities market index, returned 6.09%.
Top contributors to performance:
Municipal yields fell over the fiscal year against a backdrop of slowing inflation and anticipation that the US Federal Reserve (Fed) would eventually cut rates. As a result, the longer end of the curve outperformed.
Lower-investment-grade and below-investment-grade segments drove performance. The catalyst was a strong technical backdrop of diminutive high yield issuance coupled with inflows to municipal mutual funds, particularly high yield funds.
Key contributors to performance included:
Overweight to the long bond (22+ years) segment of the curve
Overweight to BBB-rated credit
Meaningful out-of-benchmark allocation to below-investment-grade securities
Top detractors from performance:
The front end of the curve – which is, by its nature, shorter in duration – detracted from performance over the fiscal year, as this maturity segment lagged relative to the intermediate and long ends of the curve.
Key detractors from performance included:
Modest out-of-benchmark allocation to the front end (0-1 year) of the curve
Allocation to pre-refunded bonds, predominantly on the front end of the curve
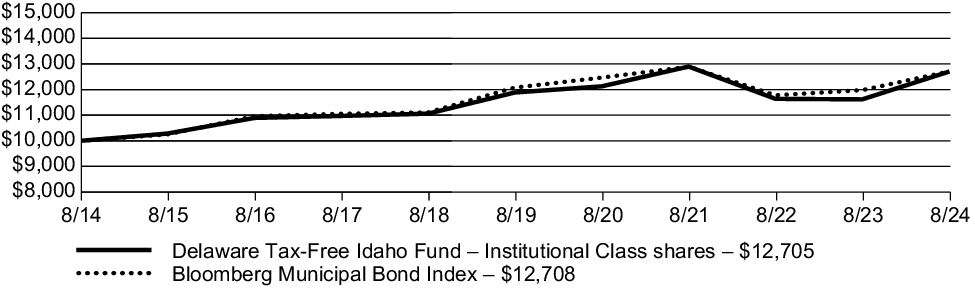
Fund performance
The following graph compares the initial and subsequent account values at the end of each of the most recently completed 10 fiscal years of the Class. It also assumes a $10,000 initial investment at the beginning of the first full fiscal year in a broad-based securities market index for the same period.
Growth of $10,000 investment
For the period August 31, 2014, through August 31, 2024
| Average annual total returns (as of August 31, 2024) | 1 year | 5 year | 10 year |
| Delaware Tax-Free Idaho Fund (Institutional Class) – including sales charge | 9.35 | % | 1.33 | % | 2.42 | % |
| Delaware Tax-Free Idaho Fund (Institutional Class) – excluding sales charge | 9.35 | % | 1.33 | % | 2.42 | % |
| Bloomberg Municipal Bond Index | 6.09 | % | 1.02 | % | 2.43 | % |
Keep in mind that the Fund's past performance is not a good predictor of how the Fund will perform in the future.
Visit delawarefunds.com/performance for the most recent performance information. The graph and table do not reflect the deduction of taxes that a shareholder would pay on Fund distributions or redemption of Fund shares. Performance results reflect any expense caps in effect during these periods. All results shown assume reinvestment of distributions.
Fund statistics (as of August 31, 2024)
| Fund net assets | $130,657,875 |
| Total number of portfolio holdings | 110 |
| Total advisory fees paid | $476,040 |
| Portfolio turnover rate | 14% |
Fund holdings (as of August 31, 2024)
The tables below show the investment makeup of the Fund, with each category representing a percentage of the total net assets of the Fund.
| Education Revenue Bonds | 22.67% |
| Special Tax Revenue Bonds | 22.61% |
| Healthcare Revenue Bonds | 12.93% |
| Local General Obligation Bonds | 8.49% |
| Housing Revenue Bonds | 6.80% |
| Lease Revenue Bonds | 6.70% |
| Transportation Revenue Bonds | 6.29% |
| Electric Revenue Bonds | 4.62% |
Industrial Development Revenue/Pollution Control
Revenue Bonds | 4.07% |
| Water & Sewer Revenue Bonds | 2.18% |
| |
| |
| |
State and territory allocation
| Idaho | 82.58% |
| Puerto Rico | 16.19% |
| Guam | 0.54% |
Availability of additional information
You can find additional information about the Fund, such as the prospectus, financial information, holdings, and proxy voting information, at delawarefunds.com/literature. You can also request this information by contacting us at 800 523-1918, weekdays from 8:30am to 6:00pm ET.
Householding
In order to reduce expenses, we will deliver a single copy of prospectuses, proxies, financial reports, and other communication to shareholders with the same residential address, provided they have the same last name or we reasonably believe them to be members of the same family. Unless we are notified otherwise, we will continue to send recipients only one copy of these materials for as long as they remain a shareholder of the Fund. If you would like to receive individual mailings, please call 800 523-1918 and we will begin sending you separate copies of these materials within 30 days after receiving your request.
For more information, please scan the QR code at left to navigate to additional hosted material at delawarefunds.com/literature.
Delaware Tax-Free New York Fund
Class A: FTNYX
Annual shareholder report | August 31, 2024
This annual shareholder report contains important information about Delaware Tax-Free New York Fund (Fund) for the period of September 1, 2023, to August 31, 2024. You can find additional information about the Fund at delawarefunds.com/literature. You can also request this information by contacting us at 800 523-1918, weekdays from 8:30am to 6:00pm ET.
What were the Fund's costs for the last 12 months?
(Based on a hypothetical $10,000 investment)
| Class | Costs of a $10,000 investment | Costs paid as a percentage of a $10,000 investment |
| Class A | $84 | 0.80% |
Management’s discussion of Fund performance
Performance highlights
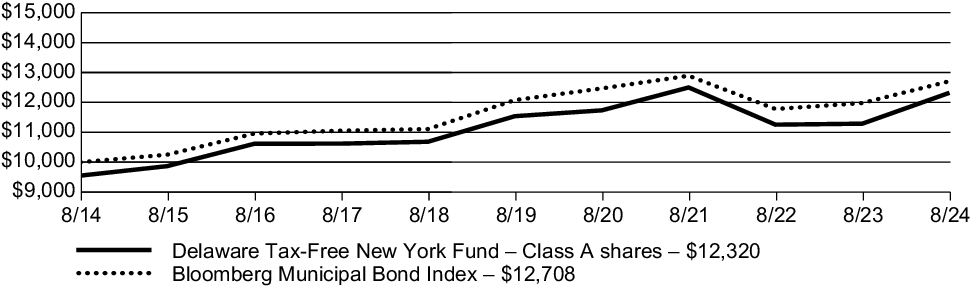
Delaware Tax-Free New York Fund (Class A) returned 9.14% (excluding sales charge) for the 12 months ended August 31, 2024. During the same period, the Bloomberg Municipal Bond Index, the Fund's broad-based securities market index, returned 6.09%.
Top contributors to performance:
Municipal yields fell over the fiscal year against a backdrop of slowing inflation and anticipation that the US Federal Reserve (Fed) would eventually cut rates. As a result, the longer end of the curve outperformed.
Lower-investment-grade and below-investment-grade segments drove performance. The catalyst was a strong technical backdrop of diminutive high yield issuance coupled with inflows to municipal mutual funds, particularly high yield funds.
Key contributors to performance included:
Overweight to the long bond (22+ years) segment of the curve
Overweight to BBB-rated credit
Meaningful out-of-benchmark allocation to below-investment-grade securities
Top detractors from performance:
The front end of the curve – which is, by its nature, shorter in duration – detracted from performance over the fiscal year, as this maturity segment lagged relative to the intermediate and long ends of the curve.
Key detractors from performance included:
Modest out-of-benchmark allocation to the front end (0-1 year) of the curve
Allocation to pre-refunded bonds, predominantly on the front end of the curve
Fund performance
The following graph compares the initial and subsequent account values at the end of each of the most recently completed 10 fiscal years of the Class. It also assumes a $10,000 initial investment at the beginning of the first full fiscal year in a broad-based securities market index for the same period and the deduction of the maximum applicable sales charge for Class A shares.
Growth of $10,000 investment
For the period August 31, 2014, through August 31, 2024
| Average annual total returns (as of August 31, 2024) | 1 year | 5 year | 10 year |
| Delaware Tax-Free New York Fund (Class A) – including sales charge | 4.25 | % | 0.37 | % | 2.11 | % |
| Delaware Tax-Free New York Fund (Class A) – excluding sales charge | 9.14 | % | 1.30 | % | 2.58 | % |
| Bloomberg Municipal Bond Index | 6.09 | % | 1.02 | % | 2.43 | % |
Keep in mind that the Fund's past performance is not a good predictor of how the Fund will perform in the future.
Visit delawarefunds.com/performance for the most recent performance information. The graph and table do not reflect the deduction of taxes that a shareholder would pay on Fund distributions or redemption of Fund shares. Performance results reflect any expense caps in effect during these periods. All results shown assume reinvestment of distributions.
Fund statistics (as of August 31, 2024)
| Fund net assets | $264,476,608 |
| Total number of portfolio holdings | 188 |
| Total advisory fees paid | $866,053 |
| Portfolio turnover rate | 21% |
Fund holdings (as of August 31, 2024)
The tables below show the investment makeup of the Fund, with each category representing a percentage of the total net assets of the Fund.
| Special Tax Revenue Bonds | 24.94% |
| Education Revenue Bonds | 17.07% |
| Transportation Revenue Bonds | 14.36% |
Industrial Development Revenue/Pollution Control
Revenue Bonds | 9.00% |
| Healthcare Revenue Bonds | 7.45% |
| Electric Revenue Bonds | 6.20% |
| Lease Revenue Bonds | 5.19% |
| Water & Sewer Revenue Bonds | 4.85% |
| Local General Obligation Bonds | 2.93% |
| Housing Revenue Bonds | 2.66% |
| |
| |
| |
State and territory allocation
| New York | 81.00% |
| Puerto Rico | 14.73% |
| Guam | 0.55% |
| US Virgin Islands | 0.20% |
Availability of additional information
You can find additional information about the Fund, such as the prospectus, financial information, holdings, and proxy voting information, at delawarefunds.com/literature. You can also request this information by contacting us at 800 523-1918, weekdays from 8:30am to 6:00pm ET.
Householding
In order to reduce expenses, we will deliver a single copy of prospectuses, proxies, financial reports, and other communication to shareholders with the same residential address, provided they have the same last name or we reasonably believe them to be members of the same family. Unless we are notified otherwise, we will continue to send recipients only one copy of these materials for as long as they remain a shareholder of the Fund. If you would like to receive individual mailings, please call 800 523-1918 and we will begin sending you separate copies of these materials within 30 days after receiving your request.
For more information, please scan the QR code at left to navigate to additional hosted material at delawarefunds.com/literature.
Delaware Tax-Free New York Fund
Class C: DVFNX
Annual shareholder report | August 31, 2024
This annual shareholder report contains important information about Delaware Tax-Free New York Fund (Fund) for the period of September 1, 2023, to August 31, 2024. You can find additional information about the Fund at delawarefunds.com/literature. You can also request this information by contacting us at 800 523-1918, weekdays from 8:30am to 6:00pm ET.
What were the Fund's costs for the last 12 months?
(Based on a hypothetical $10,000 investment)
| Class | Costs of a $10,000 investment | Costs paid as a percentage of a $10,000 investment |
| Class C | $161 | 1.55% |
Management’s discussion of Fund performance
Performance highlights
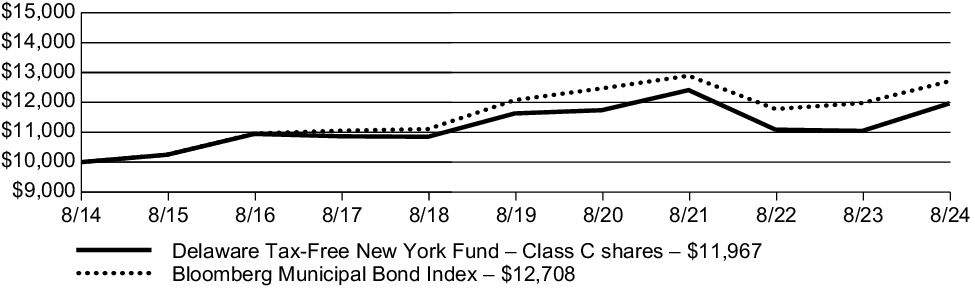
Delaware Tax-Free New York Fund (Class C) returned 8.34% (excluding sales charge) for the 12 months ended August 31, 2024. During the same period, the Bloomberg Municipal Bond Index, the Fund's broad-based securities market index, returned 6.09%.
Top contributors to performance:
Municipal yields fell over the fiscal year against a backdrop of slowing inflation and anticipation that the US Federal Reserve (Fed) would eventually cut rates. As a result, the longer end of the curve outperformed.
Lower-investment-grade and below-investment-grade segments drove performance. The catalyst was a strong technical backdrop of diminutive high yield issuance coupled with inflows to municipal mutual funds, particularly high yield funds.
Key contributors to performance included:
Overweight to the long bond (22+ years) segment of the curve
Overweight to BBB-rated credit
Meaningful out-of-benchmark allocation to below-investment-grade securities
Top detractors from performance:
The front end of the curve – which is, by its nature, shorter in duration – detracted from performance over the fiscal year, as this maturity segment lagged relative to the intermediate and long ends of the curve.
Key detractors from performance included:
Modest out-of-benchmark allocation to the front end (0-1 year) of the curve
Allocation to pre-refunded bonds, predominantly on the front end of the curve
Fund performance
The following graph compares the initial and subsequent account values at the end of each of the most recently completed 10 fiscal years of the Class. It also assumes a $10,000 initial investment at the beginning of the first full fiscal year in a broad-based securities market index for the same period.
Growth of $10,000 investment
For the period August 31, 2014, through August 31, 2024
| Average annual total returns (as of August 31, 2024) | 1 year | 5 year | 10 year |
| Delaware Tax-Free New York Fund (Class C) – including sales charge | 7.34 | % | 0.56 | % | 1.81 | % |
| Delaware Tax-Free New York Fund (Class C) – excluding sales charge | 8.34 | % | 0.56 | % | 1.81 | % |
| Bloomberg Municipal Bond Index | 6.09 | % | 1.02 | % | 2.43 | % |
Keep in mind that the Fund's past performance is not a good predictor of how the Fund will perform in the future.
Visit delawarefunds.com/performance for the most recent performance information. The graph and table do not reflect the deduction of taxes that a shareholder would pay on Fund distributions or redemption of Fund shares. Performance results reflect any expense caps in effect during these periods. All results shown assume reinvestment of distributions.
Fund statistics (as of August 31, 2024)
| Fund net assets | $264,476,608 |
| Total number of portfolio holdings | 188 |
| Total advisory fees paid | $866,053 |
| Portfolio turnover rate | 21% |
Fund holdings (as of August 31, 2024)
The tables below show the investment makeup of the Fund, with each category representing a percentage of the total net assets of the Fund.
| Special Tax Revenue Bonds | 24.94% |
| Education Revenue Bonds | 17.07% |
| Transportation Revenue Bonds | 14.36% |
Industrial Development Revenue/Pollution Control
Revenue Bonds | 9.00% |
| Healthcare Revenue Bonds | 7.45% |
| Electric Revenue Bonds | 6.20% |
| Lease Revenue Bonds | 5.19% |
| Water & Sewer Revenue Bonds | 4.85% |
| Local General Obligation Bonds | 2.93% |
| Housing Revenue Bonds | 2.66% |
| |
| |
| |
State and territory allocation
| New York | 81.00% |
| Puerto Rico | 14.73% |
| Guam | 0.55% |
| US Virgin Islands | 0.20% |
Availability of additional information
You can find additional information about the Fund, such as the prospectus, financial information, holdings, and proxy voting information, at delawarefunds.com/literature. You can also request this information by contacting us at 800 523-1918, weekdays from 8:30am to 6:00pm ET.
Householding
In order to reduce expenses, we will deliver a single copy of prospectuses, proxies, financial reports, and other communication to shareholders with the same residential address, provided they have the same last name or we reasonably believe them to be members of the same family. Unless we are notified otherwise, we will continue to send recipients only one copy of these materials for as long as they remain a shareholder of the Fund. If you would like to receive individual mailings, please call 800 523-1918 and we will begin sending you separate copies of these materials within 30 days after receiving your request.
For more information, please scan the QR code at left to navigate to additional hosted material at delawarefunds.com/literature.
Delaware Tax-Free New York Fund
Institutional Class: DTNIX
Annual shareholder report | August 31, 2024
This annual shareholder report contains important information about Delaware Tax-Free New York Fund (Fund) for the period of September 1, 2023, to August 31, 2024. You can find additional information about the Fund at delawarefunds.com/literature. You can also request this information by contacting us at 800 523-1918, weekdays from 8:30am to 6:00pm ET.
What were the Fund's costs for the last 12 months?
(Based on a hypothetical $10,000 investment)
| Class | Costs of a $10,000 investment | Costs paid as a percentage of a $10,000 investment |
| Institutional Class | $58 | 0.55% |
Management’s discussion of Fund performance
Performance highlights
Delaware Tax-Free New York Fund (Institutional Class) returned 9.52% (excluding sales charge) for the 12 months ended August 31, 2024. During the same period, the Bloomberg Municipal Bond Index, the Fund's broad-based securities market index, returned 6.09%.
Top contributors to performance:
Municipal yields fell over the fiscal year against a backdrop of slowing inflation and anticipation that the US Federal Reserve (Fed) would eventually cut rates. As a result, the longer end of the curve outperformed.
Lower-investment-grade and below-investment-grade segments drove performance. The catalyst was a strong technical backdrop of diminutive high yield issuance coupled with inflows to municipal mutual funds, particularly high yield funds.
Key contributors to performance included:
Overweight to the long bond (22+ years) segment of the curve
Overweight to BBB-rated credit
Meaningful out-of-benchmark allocation to below-investment-grade securities
Top detractors from performance:
The front end of the curve – which is, by its nature, shorter in duration – detracted from performance over the fiscal year, as this maturity segment lagged relative to the intermediate and long ends of the curve.
Key detractors from performance included:
Modest out-of-benchmark allocation to the front end (0-1 year) of the curve
Allocation to pre-refunded bonds, predominantly on the front end of the curve
Fund performance
The following graph compares the initial and subsequent account values at the end of each of the most recently completed 10 fiscal years of the Class. It also assumes a $10,000 initial investment at the beginning of the first full fiscal year in a broad-based securities market index for the same period.
Growth of $10,000 investment
For the period August 31, 2014, through August 31, 2024
| Average annual total returns (as of August 31, 2024) | 1 year | 5 year | 10 year |
| Delaware Tax-Free New York Fund (Institutional Class) – including sales charge | 9.52 | % | 1.58 | % | 2.84 | % |
| Delaware Tax-Free New York Fund (Institutional Class) – excluding sales charge | 9.52 | % | 1.58 | % | 2.84 | % |
| Bloomberg Municipal Bond Index | 6.09 | % | 1.02 | % | 2.43 | % |
Keep in mind that the Fund's past performance is not a good predictor of how the Fund will perform in the future.
Visit delawarefunds.com/performance for the most recent performance information. The graph and table do not reflect the deduction of taxes that a shareholder would pay on Fund distributions or redemption of Fund shares. Performance results reflect any expense caps in effect during these periods. All results shown assume reinvestment of distributions.
Fund statistics (as of August 31, 2024)
| Fund net assets | $264,476,608 |
| Total number of portfolio holdings | 188 |
| Total advisory fees paid | $866,053 |
| Portfolio turnover rate | 21% |
Fund holdings (as of August 31, 2024)
The tables below show the investment makeup of the Fund, with each category representing a percentage of the total net assets of the Fund.
| Special Tax Revenue Bonds | 24.94% |
| Education Revenue Bonds | 17.07% |
| Transportation Revenue Bonds | 14.36% |
Industrial Development Revenue/Pollution Control
Revenue Bonds | 9.00% |
| Healthcare Revenue Bonds | 7.45% |
| Electric Revenue Bonds | 6.20% |
| Lease Revenue Bonds | 5.19% |
| Water & Sewer Revenue Bonds | 4.85% |
| Local General Obligation Bonds | 2.93% |
| Housing Revenue Bonds | 2.66% |
| |
| |
| |
State and territory allocation
| New York | 81.00% |
| Puerto Rico | 14.73% |
| Guam | 0.55% |
| US Virgin Islands | 0.20% |
Availability of additional information
You can find additional information about the Fund, such as the prospectus, financial information, holdings, and proxy voting information, at delawarefunds.com/literature. You can also request this information by contacting us at 800 523-1918, weekdays from 8:30am to 6:00pm ET.
Householding
In order to reduce expenses, we will deliver a single copy of prospectuses, proxies, financial reports, and other communication to shareholders with the same residential address, provided they have the same last name or we reasonably believe them to be members of the same family. Unless we are notified otherwise, we will continue to send recipients only one copy of these materials for as long as they remain a shareholder of the Fund. If you would like to receive individual mailings, please call 800 523-1918 and we will begin sending you separate copies of these materials within 30 days after receiving your request.
For more information, please scan the QR code at left to navigate to additional hosted material at delawarefunds.com/literature.
Item 2. Code of Ethics.
| | (a) | The registrant has adopted a code of ethics that applies to the registrant’s principal executive officer, principal financial officer, principal accounting officer or controller, or persons performing similar functions, regardless of whether these individuals are employed by the registrant or a third party. A copy of the registrant’s Code of Business Ethics has been posted on the Delaware Funds by Macquarie® Internet Web site at www.delawarefunds.com. Any amendments to the Code of Business Ethics, and information on any waiver from its provisions granted by the registrant, will also be posted on this Web site within five business days of such amendment or waiver and will remain on the Web site for at least 12 months. |
Item 3. Audit Committee Financial Expert.
The registrant’s Board of Trustees has determined that certain members of the registrant’s Audit Committee are audit committee financial experts, as defined below. For purposes of this item, an “audit committee financial expert” is a person who has the following attributes:
a. An understanding of generally accepted accounting principles and financial statements;
b. The ability to assess the general application of such principles in connection with the accounting for estimates, accruals, and reserves;
c. Experience preparing, auditing, analyzing, or evaluating financial statements that present a breadth and level of complexity of accounting issues that are generally comparable to the breadth and complexity of issues that can reasonably be expected to be raised by the registrant’s financial statements, or experience actively supervising one or more persons engaged in such activities;
d. An understanding of internal controls and procedures for financial reporting; and
e. An understanding of audit committee functions.
An “audit committee financial expert” shall have acquired such attributes through:
a. Education and experience as a principal financial officer, principal accounting officer, controller, public accountant, or auditor or experience in one or more positions that involve the performance of similar functions;
b. Experience actively supervising a principal financial officer, principal accounting officer, controller, public accountant, auditor, or person performing similar functions;
c. Experience overseeing or assessing the performance of companies or public accountants with respect to the preparation, auditing, or evaluation of financial statements; or
d. Other relevant experience.
The registrant’s Board of Trustees has also determined that each member of the registrant’s Audit Committee is independent. In order to be “independent” for purposes of this item, the Audit Committee member may not, other than in his or her capacity as a member of the Board of Trustees or any committee thereof, (i) accept directly or indirectly any consulting, advisory or other compensatory fee from the issuer; or (ii) be an “interested person” of the registrant as defined in Section 2(a)(19) of the Investment Company Act of 1940.
The names of the audit committee financial experts on the registrant’s Audit Committee are set forth below:
H. Jeffrey Dobbs
Frances Sevilla-Sacasa, Chair
Christianna Wood
Item 4. Principal Accountant Fees and Services.
Audit Fees
| | (a) | The aggregate fees billed for each of the last two fiscal years for professional services rendered by the principal accountant for the audit of the registrant’s annual financial statements or services that are normally provided by the accountant in connection with statutory and regulatory filings or engagements for those fiscal years are $216,500 for 2024 and $194,944 for 2023. |
Audit-Related Fees
| | (b) | The aggregate fees billed in each of the last two fiscal years for assurance and related services by the principal accountant that are reasonably related to the performance of the audit of the registrant’s financial statements and are not reported under paragraph (a) of this Item are $1,362,878 for 2024 and $1,362,878 for 2023. |
Tax Fees
| | (c) | The aggregate fees billed in each of the last two fiscal years for professional services rendered by the principal accountant for tax compliance, tax advice, and tax planning are $28,985 for 2024 and $26,485 for 2023. |
All Other Fees
| | (d) | The aggregate fees billed in each of the last two fiscal years for products and services provided by the principal accountant, other than the services reported in paragraphs (a) through (c) of this Item are $0 for 2024 and $0 for 2023. |
| | (e)(1) | The registrant’s Audit Committee has established pre-approval policies and procedures as permitted by Rule 2-01(c)(7)(i)(B) of Regulation S-X (the “Pre-Approval Policy”) with respect to services provided by the registrant’s independent auditors. Pursuant to the Pre-Approval Policy, the Audit Committee has pre-approved the services set forth in the table below with respect to the registrant up to the specified fee limits. Certain fee limits are based on aggregate fees to the registrant and other registrants within the Delaware Funds by Macquarie. |
| | |
Service | | Range of Fees |
| Audit Services | | |
| |
| Statutory audits or financial audits for new Funds | | up to $50,000 per Fund |
| |
| Services associated with SEC registration statements (e.g., Form N-1A, Form N-14, etc.), periodic reports and other documents filed with the SEC or other documents issued in connection with securities offerings (e.g., comfort letters for closed-end Fund offerings, consents), and assistance in responding to SEC comment letters | | up to $10,000 per Fund |
| |
| Consultations by Fund management as to the accounting or disclosure treatment of transactions or events and/or the actual or potential impact of final or proposed rules, standards or interpretations by the SEC, FASB, or other regulatory or standard-setting bodies (Note: Under SEC rules, some consultations may be considered “audit-related services” rather than “audit services”) | | up to $25,000 in the aggregate |
| |
| Audit-Related Services | | |
| |
| Consultations by Fund management as to the accounting or disclosure treatment of transactions or events and /or the actual or potential impact of final or proposed rules, standards or interpretations by the SEC, FASB, or other regulatory or standard-setting bodies (Note: Under SEC rules, some consultations may be considered “audit services” rather than “audit-related services”) | | up to $25,000 in the aggregate |
| |
| Tax Services | | |
| |
| U.S. federal, state and local and international tax planning and advice (e.g., consulting on statutory, regulatory or administrative developments, evaluation of Funds’ tax compliance function, etc.) | | up to $25,000 in the aggregate |
| |
| U.S. federal, state and local tax compliance (e.g., excise distribution reviews, etc.) | | up to $5,000 per Fund |
| |
| Review of federal, state, local and international income, franchise and other tax returns | | up to $5,000 per Fund |
Under the Pre-Approval Policy, the Audit Committee has also pre-approved the services set forth in the table below with respect to the registrant’s investment adviser and other entities controlling, controlled by or under common control with the investment adviser that provide ongoing services to the registrant (the “Control Affiliates”) up to the specified fee limit. This fee limit is based on aggregate fees to the investment adviser and its Control Affiliates.
| | |
Service | | Range of Fees |
| Non-Audit Services | | |
| |
| Services associated with periodic reports and other documents filed with the SEC and assistance in responding to SEC comment letters | | up to $10,000 in the aggregate |
The Pre-Approval Policy requires the registrant’s independent auditors to report to the Audit Committee at each of its regular meetings regarding all services initiated since the last such report was rendered, including those services authorized by the Pre-Approval Policy.
| (e)(2) | The percentage of services described in each of paragraphs (b) through (d) of this Item that were approved by the audit committee pursuant to paragraph (c)(7)(i)(C) of Rule 2-01 of Regulation S-X are as follows: |
(b) 0%
(c) 0%
(d) 0%
| | (g) | The aggregate non-audit fees billed by the registrant’s accountant for services rendered to the registrant, and rendered to the registrant’s investment adviser (not including any sub-adviser whose role is primarily portfolio management and is subcontracted with or overseen by another investment adviser), and any entity controlling, controlled by, or under common control with the adviser that provides ongoing services to the registrant for each of the last two fiscal years of the registrant was $17,300,000 for 2024 and $24,428,000 for 2023. |
| | (h) | The audit committee of the registrant’s board of trustees has considered whether the provision of non-audit services that were rendered to the registrant’s investment adviser (not including any sub-adviser whose role is primarily portfolio management and is subcontracted with or overseen by another investment adviser), and any entity controlling, controlled by, or under common control with the investment adviser that provides ongoing services to the registrant that were not pre-approved pursuant to paragraph (c)(7)(ii) of Rule 2-01 of Regulation S-X is compatible with maintaining the principal accountant’s independence. |
Item 5. Audit Committee of Listed Registrants.
Not applicable.
Item 6. Investments.
| (a) | Schedule of Investments in securities of unaffiliated issuers as of the close of the reporting period is included as part of the Financial Statements filed under Item 7 of this form. |
Item 7. Financial Statements and Financial Highlights for Open-End Management Investment Companies.
| (a) | An open-end management investment company registered on Form N-1A [17 CFR 239.15A and 17 CFR 274.11A] must file its most recent annual or semi-annual financial statements required, and for the periods specified, by Regulation S-X. |
The annual financial statements are attached herewith.
| | (b) | An open-end management investment company registered on Form N-1A [17 CFR 239.15A and 17 CFR 274.11A] must file the information required by Item 13 of Form N-1A. |
The Financial Highlights are attached herewith.
Fixed income mutual funds
Delaware Minnesota High-Yield Municipal Bond Fund
Delaware Tax-Free Minnesota Fund
Financial statements and other information
For the year ended August 31, 2024
This report and the financial statements contained herein are submitted for the general information of the shareholders of the Funds. This report is not authorized for distribution to prospective investors in the Funds, unless preceded or accompanied by an effective prospectus.
Form N-PORT and proxy voting information
Each Fund files its complete schedule of portfolio holdings with the Securities and Exchange Commission (SEC) for the first and third quarters of each fiscal year on Form N-PORT. Each Fund’s Form N-PORT, as well as a description of the policies and procedures that the Funds use to determine how to vote proxies (if any) relating to portfolio securities, are available without charge (i) upon request, by calling 800 523-1918; and (ii) on the SEC’s website at sec.gov. In addition, a description of the policies and procedures that the Funds use to determine how to vote proxies (if any) relating to portfolio securities and the Schedule of Investments included in the Funds’ most recent Form N-PORT are available without charge on the Funds’ website at delawarefunds.com/literature.
Information (if any) regarding how the Funds voted proxies relating to portfolio securities during the most recently disclosed 12-month period ended June 30 is available without charge (i) through the Funds' website at delawarefunds.com/proxy; and (ii) on the SEC’s website at sec.gov.
Schedules of investments
| Delaware Minnesota High-Yield Municipal Bond Fund | August 31, 2024 |
| | | Principal
amount° | Value (US $) |
| Municipal Bonds — 98.01% |
| Education Revenue Bonds — 26.71% |
| City of Bethel, Minnesota Charter School Lease Revenue | | | |
| (Spectrum High School Project) | | | |
| Series A 4.00% 7/1/32 | | 840,000 | $ 837,724 |
| Series A 4.00% 7/1/37 | | 850,000 | 814,478 |
| Series A 4.25% 7/1/47 | | 750,000 | 684,375 |
| Series A 4.375% 7/1/52 | | 250,000 | 226,990 |
City of Brooklyn Park, Minnesota Charter School Lease
Revenue | | | |
(Prairie Seeds Academy Project)
Series A 5.00% 3/1/39 | | 1,270,000 | 1,246,886 |
City of Cologne, Minnesota Charter School Lease
Revenue | | | |
| (Cologne Academy Project) | | | |
| Series A 5.00% 7/1/29 | | 270,000 | 270,105 |
| Series A 5.00% 7/1/34 | | 350,000 | 350,081 |
| Series A 5.00% 7/1/45 | | 360,000 | 358,589 |
| City of Deephaven, Minnesota Charter School Revenue | | | |
(Eagle Ridge Academy Project)
Series A 5.50% 7/1/50 | | 1,000,000 | 1,005,130 |
City of Forest Lake, Minnesota Charter School Lease
Revenue | | | |
| (Lakes International Language Academy Project) | | | |
| Series A 4.50% 8/1/26 | | 245,000 | 245,051 |
| Series A 5.375% 8/1/50 | | 975,000 | 991,117 |
| Series A 5.75% 8/1/44 | | 585,000 | 585,351 |
City of Ham Lake, Minnesota Charter School Lease
Revenue | | | |
| (DaVinci Academy Project) | | | |
| Series A 5.00% 7/1/36 | | 235,000 | 230,768 |
| Series A 5.00% 7/1/47 | | 710,000 | 647,761 |
(Parnassus Preparatory School Project)
Series A 5.00% 11/1/47 | | 650,000 | 651,378 |
| City of Hugo, Minnesota Charter School Lease Revenue | | | |
| (Noble Academy Project) | | | |
| Series A 5.00% 7/1/34 | | 1,000,000 | 1,000,410 |
| Series A 5.00% 7/1/44 | | 495,000 | 494,995 |
City of Minneapolis, Minnesota Charter School Lease
Revenue | | | |
(Cyber Village Academy Project)
Series A 5.50% 6/1/57 | | 1,400,000 | 1,338,582 |
| (Hiawatha Academies Project) | | | |
| Series A 144A 5.375% 7/1/42 # | | 690,000 | 691,470 |
Schedules of investments
Delaware Minnesota High-Yield Municipal Bond Fund
| | | Principal
amount° | Value (US $) |
| Municipal Bonds (continued) |
| Education Revenue Bonds (continued) |
City of Minneapolis, Minnesota Charter School Lease
Revenue | | | |
| (Hiawatha Academies Project) |
| Series A 144A 5.50% 7/1/52 # | | 1,130,000 | $ 1,123,525 |
| Series A 144A 5.50% 7/1/57 # | | 880,000 | 869,378 |
| City of Minneapolis, Minnesota Student Housing Revenue | | | |
| (Riverton Community Housing Project) | | | |
| 144A 4.75% 8/1/43 # | | 750,000 | 731,678 |
| 144A 5.00% 8/1/53 # | | 570,000 | 570,074 |
| 5.25% 8/1/39 | | 800,000 | 800,320 |
City of Otsego, Minnesota Charter School Lease
Revenue | | | |
(Kaleidoscope Charter School Project)
Series A 5.00% 9/1/44 | | 1,435,000 | 1,346,963 |
City of St. Cloud, Minnesota Charter School Lease
Revenue | | | |
(Stride Academy Project)
Series A 5.00% 4/1/46 | | 750,000 | 639,712 |
City of St. Paul, Minnesota Housing & Redevelopment
Authority Charter School Lease Revenue | | | |
(Academia Cesar Chavez School Project)
Series A 5.25% 7/1/50 | | 1,750,000 | 1,595,667 |
(Great River School Project)
Series A 144A 5.50% 7/1/52 # | | 265,000 | 267,528 |
| (Hmong College Preparatory Academy Project) | | | |
| Series A 5.00% 9/1/43 | | 1,000,000 | 1,011,860 |
| Series A 5.00% 9/1/55 | | 1,000,000 | 995,310 |
| Series A 5.75% 9/1/46 | | 500,000 | 508,550 |
| Series A 6.00% 9/1/51 | | 3,500,000 | 3,568,285 |
(Nova Classical Academy Project)
Series A 4.125% 9/1/47 | | 1,250,000 | 1,128,425 |
(Twin Cities Academy Project)
Series A 5.375% 7/1/50 | | 1,500,000 | 1,503,900 |
City of St. Paul, Minnesota Housing & Redevelopment
Authority Health Care Facilities Revenue | | | |
(Great River School Project)
Series A 144A 4.75% 7/1/29 # | | 300,000 | 303,141 |
(Nova Classical Academy Project)
Series A 4.00% 9/1/36 | | 1,620,000 | 1,570,379 |
City of St. Paul, Minnesota Housing & Redevelopment
Authority Revenue | | | |
(Hmong College Preparatory Academy Project)
Series A 5.00% 9/1/40 | | 715,000 | 726,090 |
| | | Principal
amount° | Value (US $) |
| Municipal Bonds (continued) |
| Education Revenue Bonds (continued) |
City of Woodbury, Minnesota Charter School Lease
Revenue | | | |
(MSA Building Company)
Series A 4.00% 12/1/50 | | 450,000 | $ 374,243 |
| (Woodbury Leadership Academy Project) | | | |
| 4.00% 7/1/41 | | 890,000 | 752,450 |
| Series A 4.00% 7/1/51 | | 1,140,000 | 875,201 |
| Series A 4.00% 7/1/56 | | 575,000 | 428,093 |
| Duluth Housing & Redevelopment Authority Revenue | | | |
| (Duluth Public Schools Academy Project) | | | |
| Series A 5.00% 11/1/38 | | 700,000 | 664,503 |
| Series A 5.00% 11/1/48 | | 1,700,000 | 1,500,199 |
| Minnesota Higher Education Facilities Authority Revenue | | | |
| (Bethel University) | | | |
| 5.00% 5/1/37 | | 1,250,000 | 1,215,638 |
| 5.00% 5/1/47 | | 3,000,000 | 2,734,380 |
(Carleton College)
4.00% 3/1/47 | | 1,500,000 | 1,483,695 |
(Green Bonds)
Series A 5.00% 10/1/32 | | 500,000 | 550,815 |
(Gustavus Adolphus College)
5.00% 10/1/47 | | 2,350,000 | 2,388,023 |
| (Macalester College) | | | |
| 3.00% 3/1/40 | | 365,000 | 324,485 |
| 3.00% 3/1/43 | | 325,000 | 274,066 |
| 4.00% 3/1/48 | | 600,000 | 582,486 |
| (Minneapolis College of Art & Design) | | | |
| 4.00% 5/1/25 | | 200,000 | 200,020 |
| 4.00% 5/1/26 | | 100,000 | 100,007 |
| (St. Catherine University) | | | |
| 5.00% 10/1/52 | | 750,000 | 751,928 |
| Series A 4.00% 10/1/38 | | 920,000 | 882,823 |
| Series A 5.00% 10/1/45 | | 1,670,000 | 1,684,596 |
(St. Olaf College)
4.00% 10/1/46 | | 935,000 | 904,070 |
| (Trustees of the Hamline University of Minnesota) | | | |
| Series B 5.00% 10/1/37 | | 300,000 | 303,810 |
| Series B 5.00% 10/1/39 | | 1,000,000 | 1,008,090 |
| Series B 5.00% 10/1/47 | | 1,055,000 | 1,057,669 |
| (University of St. Thomas) | | | |
| 4.00% 10/1/37 | | 300,000 | 305,028 |
| 4.00% 10/1/44 | | 100,000 | 96,796 |
Schedules of investments
Delaware Minnesota High-Yield Municipal Bond Fund
| | | Principal
amount° | Value (US $) |
| Municipal Bonds (continued) |
| Education Revenue Bonds (continued) |
| Minnesota Higher Education Facilities Authority Revenue | | | |
| (University of St. Thomas) |
| 5.00% 10/1/34 | | 450,000 | $ 485,235 |
| 5.00% 10/1/40 | | 915,000 | 966,999 |
| Series A 4.125% 10/1/53 | | 1,325,000 | 1,305,377 |
| Series A 5.00% 10/1/49 | | 1,250,000 | 1,338,837 |
| Minnesota Office of Higher Education Revenue | | | |
(Senior Supplemental Student Loan Program)
4.00% 11/1/42 (AMT) | | 250,000 | 241,460 |
St. Paul, Minnesota Independent School District No.
625 Revenue | | | |
| Series A 5.00% 2/1/43 | | 1,000,000 | 1,118,770 |
| University of Minnesota Revenue | | | |
| Series A 5.00% 9/1/42 | | 900,000 | 927,414 |
| | 59,759,232 |
| Electric Revenue Bonds — 1.20% |
| Hutchinson Utilities Commission Revenue | | | |
| Series A 5.00% 12/1/26 | | 360,000 | 360,508 |
| Puerto Rico Electric Power Authority Revenue | | | |
| Series A 5.05% 7/1/42 ‡ | | 165,000 | 89,100 |
| Series AAA 5.25% 7/1/25 ‡ | | 95,000 | 51,300 |
| Series CCC 5.25% 7/1/27 ‡ | | 650,000 | 351,000 |
| Series WW 5.00% 7/1/28 ‡ | | 585,000 | 315,900 |
| Series XX 4.75% 7/1/26 ‡ | | 105,000 | 56,700 |
| Series XX 5.25% 7/1/40 ‡ | | 295,000 | 159,300 |
| Series XX 5.75% 7/1/36 ‡ | | 370,000 | 199,800 |
| Series ZZ 4.75% 7/1/27 ‡ | | 85,000 | 45,900 |
| Series ZZ 5.25% 7/1/25 ‡ | | 130,000 | 69,875 |
| Southern Minnesota Municipal Power Agency Revenue | | | |
| Series A 5.00% 1/1/46 | | 400,000 | 407,136 |
Western Minnesota Municipal Power Agency Supply
Revenue | | | |
(Red Rock Hydroelectric Project)
Series A 5.00% 1/1/49 | | 555,000 | 573,270 |
| | 2,679,789 |
| Healthcare Revenue Bonds — 38.07% |
City of Anoka, Minnesota Healthcare & Housing Facilities
Revenue | | | |
(The Homestead at Anoka Project)
5.125% 11/1/49 | | 400,000 | 366,436 |
| | | Principal
amount° | Value (US $) |
| Municipal Bonds (continued) |
| Healthcare Revenue Bonds (continued) |
| City of Apple Valley, Minnesota Senior Housing Revenue | | | |
| (PHS Senior Housing, Inc. Orchard Path Project) | | | |
| 4.50% 9/1/53 | | 840,000 | $ 795,732 |
| 5.00% 9/1/43 | | 1,000,000 | 1,003,550 |
| 5.00% 9/1/58 | | 1,175,000 | 1,176,234 |
| City of Apple Valley, Minnesota Senior Living Revenue | | | |
| (Senior Living LLC Project) | | | |
| Fourth Tier Series D 7.00% 1/1/37 | | 490,000 | 312,890 |
| Fourth Tier Series D 7.25% 1/1/52 | | 1,495,000 | 841,864 |
| Second Tier Series B 5.00% 1/1/47 | | 535,000 | 320,738 |
City of Bethel, Minnesota Housing & Health Care
Facilities Revenue | | | |
(Benedictine Health System – St. Peter Communities Project)
Series A 5.50% 12/1/48 | | 1,280,000 | 1,239,923 |
| (Ecumen Obligated Group) | | | |
| Series A 6.125% 3/1/44 | | 1,100,000 | 1,134,716 |
| Series A 6.125% 3/1/49 | | 300,000 | 303,981 |
| City of Bethel, Minnesota Senior Housing Revenue | | | |
(The Lodge at the Lakes at Stillwater Project)
5.25% 6/1/58 | | 1,475,000 | 1,305,906 |
City of Brooklyn Center, Minnesota Multifamily Housing
Revenue | | | |
(Sanctuary at Brooklyn Center Project)
Series A 5.50% 11/1/35 ‡ | | 639,031 | 383,419 |
| City of Center, Minnesota Health Care Facilities Revenue | | | |
(Hazelden Betty Ford Foundation Project)
4.50% 11/1/34 | | 1,000,000 | 1,000,810 |
City of Chatfield, Minnesota Healthcare & Housing
Facilities Revenue | | | |
| (Chosen Valley Care Center Project) | | | |
| 4.00% 9/1/39 | | 250,000 | 213,645 |
| 5.00% 9/1/52 | | 1,500,000 | 1,299,585 |
City of Crookston, Minnesota Health Care Facilities
Revenue | | | |
(Riverview Health Project)
5.00% 5/1/51 | | 1,025,000 | 628,571 |
City of Glencoe, Minnesota Health Care Facilities
Revenue | | | |
(Glencoe Regional Health Services Project)
4.00% 4/1/31 | | 185,000 | 182,258 |
Schedules of investments
Delaware Minnesota High-Yield Municipal Bond Fund
| | | Principal
amount° | Value (US $) |
| Municipal Bonds (continued) |
| Healthcare Revenue Bonds (continued) |
City of Hayward, Minnesota Health Care Facilities
Revenue | | | |
(American Baptist Homes Midwest Obligated Group)
5.375% 8/1/34 | | 750,000 | $ 666,833 |
(St. John's Lutheran Home of Albert Lea Project)
Series A 5.375% 10/1/44 | | 90,000 | 54,900 |
City of Maple Grove, Minnesota Health Care Facilities
Revenue | | | |
| (Maple Grove Hospital Corporation) | | | |
| 4.00% 5/1/37 | | 1,625,000 | 1,546,675 |
| 5.00% 5/1/29 | | 500,000 | 517,075 |
(North Memorial Health Care)
4.00% 9/1/35 | | 300,000 | 291,243 |
City of Maple Plain, Minnesota Senior Housing & Health
Care Revenue | | | |
(Haven Homes Incorporate Project)
5.00% 7/1/49 | | 1,000,000 | 958,760 |
City of Minneapolis, Minnesota Health Care System
Revenue | | | |
(Allina Health System)
4.00% 11/15/40 | | 1,000,000 | 991,620 |
| (Fairview Health Services) | | | |
| Series A 4.00% 11/15/48 | | 2,855,000 | 2,596,594 |
| Series A 5.00% 11/15/32 | | 1,250,000 | 1,262,775 |
| Series A 5.00% 11/15/33 | | 1,400,000 | 1,457,064 |
| Series A 5.00% 11/15/44 | | 1,000,000 | 1,000,890 |
| Series A 5.00% 11/15/49 | | 1,000,000 | 1,010,000 |
City of Minneapolis, Minnesota Senior Housing &
Healthcare Revenue | | | |
(Ecumen-Abiitan Mill City Project)
5.375% 11/1/50 | | 1,700,000 | 1,616,343 |
| City of Morris, Minnesota Health Care Facilities Revenue | | | |
| (Farmington Health Services) | | | |
| 4.10% 8/1/44 | | 500,000 | 395,360 |
| 4.20% 8/1/49 | | 1,500,000 | 1,153,110 |
City of Rochester, Minnesota Health Care & Housing
Revenue | | | |
(The Homestead at Rochester Project)
Series A 6.875% 12/1/48 | | 1,200,000 | 1,200,192 |
| | | Principal
amount° | Value (US $) |
| Municipal Bonds (continued) |
| Healthcare Revenue Bonds (continued) |
City of Rochester, Minnesota Health Care Facilities
Revenue | | | |
| (Mayo Clinic) | | | |
| 4.00% 11/15/39 | | 3,500,000 | $ 3,635,275 |
| 5.00% 11/15/57 | | 5,175,000 | 5,562,245 |
| Series B 5.00% 11/15/33 | | 500,000 | 587,945 |
City of Sartell, Minnesota Health Care & Housing
Facilities Revenue | | | |
| (Country Manor Campus LLC Project) | | | |
| 5.30% 9/1/37 | | 600,000 | 600,126 |
| Series A 5.00% 9/1/32 | | 1,000,000 | 1,009,950 |
| Series A 5.00% 9/1/35 | | 350,000 | 352,607 |
City of Sauk Rapids, Minnesota Health Care Housing
Facilities Revenue | | | |
(Good Shepherd Lutheran Home)
5.125% 1/1/39 | | 825,000 | 738,631 |
City of Shakopee, Minnesota Health Care Facilities
Revenue | | | |
| (St. Francis Regional Medical Center) | | | |
| 4.00% 9/1/31 | | 130,000 | 127,154 |
| 5.00% 9/1/34 | | 105,000 | 105,037 |
| City of St. Cloud, Minnesota Health Care Revenue | | | |
| (Centracare Health System Project) | | | |
| 4.00% 5/1/49 | | 2,250,000 | 2,118,442 |
| Series A 5.00% 5/1/46 | | 2,630,000 | 2,656,353 |
City of St. Joseph, Minnesota Senior Housing &
Healthcare Revenue | | | |
(Woodcrest Country Manor Project)
5.00% 7/1/55 | | 1,000,000 | 896,170 |
City of St. Paul, Minnesota Housing & Redevelopment
Authority Health Care Facilities Revenue | | | |
(Episcopal Homes Obligated Group)
Series A 4.00% 11/1/42 | | 700,000 | 603,491 |
| (Fairview Health Services) | | | |
| Series A 4.00% 11/15/43 | | 1,550,000 | 1,432,743 |
| Series A 5.00% 11/15/47 | | 2,360,000 | 2,394,786 |
| (HealthPartners Obligated Group Project) | | | |
| Series A 5.00% 7/1/30 | | 1,000,000 | 1,011,730 |
| Series A 5.00% 7/1/33 | | 1,000,000 | 1,010,290 |
(Marian Center Project)
Series A 5.375% 5/1/43 | | 1,000,000 | 918,740 |
Schedules of investments
Delaware Minnesota High-Yield Municipal Bond Fund
| | | Principal
amount° | Value (US $) |
| Municipal Bonds (continued) |
| Healthcare Revenue Bonds (continued) |
City of St. Paul, Minnesota Housing & Redevelopment
Authority Revenue | | | |
(Amherst H. Wilder Foundation Project)
Series A 5.00% 12/1/36 | | 1,000,000 | $ 1,053,010 |
City of St. Paul, Minnesota Housing & Redevelopment
Authority Senior Housing & Health Care Revenue | | | |
(Episcopal Homes Project)
5.125% 5/1/48 | | 2,000,000 | 1,757,280 |
City of Victoria, Minnesota Health Care Facilities
Revenue | | | |
(Augustana Emerald Care Project)
5.00% 8/1/39 | | 1,500,000 | 1,333,095 |
| City of Wayzata, Minnesota Senior Housing Revenue | | | |
| (Folkestone Senior Living Community) | | | |
| 3.75% 8/1/37 | | 500,000 | 482,575 |
| 4.00% 8/1/38 | | 500,000 | 490,560 |
| 4.00% 8/1/39 | | 400,000 | 389,456 |
| 4.00% 8/1/44 | | 700,000 | 656,012 |
| 5.00% 8/1/35 | | 150,000 | 152,671 |
| 5.00% 8/1/54 | | 1,250,000 | 1,257,175 |
City of West St. Paul, Minnesota Rochester Health Care
& Housing Revenue | | | |
(Walker Westwood Ridge Campus Project)
5.00% 11/1/49 | | 1,500,000 | 1,437,750 |
Dakota County Community Development Agency Senior
Housing Revenue | | | |
(Walker Highview Hills Project)
Series A 144A 5.00% 8/1/51 # | | 1,995,000 | 1,945,903 |
Deephaven, Minnesota Housing & Healthcare Facility
Revenue | | | |
| (St. Therese Senior Living Project) | | | |
| Series A 5.00% 4/1/38 | | 335,000 | 314,833 |
| Series A 5.00% 4/1/40 | | 315,000 | 289,973 |
| Series A 5.00% 4/1/48 | | 185,000 | 159,100 |
| Duluth Economic Development Authority Revenue | | | |
| (Benedictine Health System) | | | |
| Series A 4.00% 7/1/31 | | 1,500,000 | 1,431,585 |
| Series A 4.00% 7/1/41 | | 930,000 | 780,800 |
| (Essentia Health Obligated Group) | | | |
| Series A 4.25% 2/15/43 | | 400,000 | 391,600 |
| Series A 5.00% 2/15/53 | | 1,590,000 | 1,617,205 |
| Series A 5.00% 2/15/58 | | 6,940,000 | 7,053,330 |
| | | Principal
amount° | Value (US $) |
| Municipal Bonds (continued) |
| Healthcare Revenue Bonds (continued) |
| Duluth Economic Development Authority Revenue | | | |
| (Essentia Health Obligated Group) |
| Series A 5.25% 2/15/58 | | 2,000,000 | $ 2,053,620 |
| (St. Luke’s Hospital of Duluth Obligated Group) | | | |
| Series A 4.00% 6/15/33 | | 380,000 | 398,594 |
| Series A 4.00% 6/15/38 | | 400,000 | 412,752 |
| Series B 5.25% 6/15/52 | | 1,000,000 | 1,081,610 |
Minnesota Agricultural & Economic Development Board
Healthcare Facilities Revenue | | | |
| (Health Partners Obligated Group) | | | |
| 4.00% 1/1/49 | | 2,050,000 | 1,983,457 |
| 5.25% 1/1/54 | | 1,150,000 | 1,257,168 |
| | 85,172,521 |
| Housing Revenue Bonds — 2.97% |
| City of Bethel, Minnesota Senior Housing Revenue | | | |
(Birchwood Landing at the Lakes at Stillwater Project)
5.00% 5/1/54 | | 1,000,000 | 932,720 |
| City of Stillwater, Minnesota Multifamily Housing Revenue | | | |
(Orleans Homes Project)
5.50% 2/1/42 (AMT) | | 750,000 | 734,340 |
Minnesota Housing Finance Agency Residential Housing
Finance Revenue | | | |
(Social Bonds)
Series F 2.40% 7/1/46 | | 1,250,000 | 869,975 |
| Minnesota Housing Finance Agency Revenue | | | |
| Series A1 4.90% 8/1/66 | | 350,000 | 352,884 |
| Series D 5.50% 7/1/53 | | 970,000 | 1,036,600 |
| Series I 2.20% 1/1/51 | | 635,000 | 407,683 |
| Series O 4.45% 7/1/38 | | 1,000,000 | 1,029,850 |
Northwest Multi-County Housing & Redevelopment
Authority Revenue | | | |
(Pooled Housing Program)
5.50% 7/1/45 | | 1,275,000 | 1,275,000 |
| | 6,639,052 |
| Industrial Development Revenue/Pollution ControlRevenue Bonds — 3.26% |
| City of Cottonwood, Minnesota Revenue | | | |
(Extreme Holdings LLC Project)
Series A 144A 5.00% 12/1/50 (AMT) # | | 1,210,000 | 1,021,482 |
Schedules of investments
Delaware Minnesota High-Yield Municipal Bond Fund
| | | Principal
amount° | Value (US $) |
| Municipal Bonds (continued) |
| Industrial Development Revenue/Pollution ControlRevenue Bonds (continued) |
| Minnesota Municipal Gas Agency Revenue | | | |
(Minnesota Community Energy)
Sub-Series A 4.00% 12/1/52 • | | 1,000,000 | $ 1,010,140 |
St. Paul, Minnesota Port Authority Solid Waste Disposal
Revenue | | | |
(Gerdau St. Paul Steel Mill Project)
Series 7 144A 4.50% 10/1/37 (AMT) # | | 5,350,000 | 5,266,647 |
| | 7,298,269 |
| Lease Revenue Bonds — 1.40% |
Chaska, Minnesota Economic Development Authority
Revenue | | | |
(Minnesota Lease Obligation)
Series A 4.125% 2/1/54 | | 1,250,000 | 1,208,050 |
City of New London, Economic Development Authority
Revenue | | | |
| (SWWC Service Cooperative Lease With Option to Purchase Project) | | | |
| 5.00% 2/1/38 | | 880,000 | 895,954 |
| Series A 4.50% 2/1/33 | | 345,000 | 351,317 |
| Hibbing Independent School District No. 701 Revenue | | | |
| Series A 3.00% 3/1/41 | | 500,000 | 434,405 |
| Minnesota Housing Finance Agency Revenue | | | |
(State Appropriation)
5.00% 8/1/31 | | 250,000 | 250,380 |
| | 3,140,106 |
| Local General Obligation Bonds — 10.63% |
| Anoka-Hennepin Independent School District No. 11 | | | |
| (Minnesota School District Credit Enhancement Program) | | | |
| Series A 3.00% 2/1/43 | | 500,000 | 428,030 |
| Series A 3.00% 2/1/45 | | 750,000 | 623,700 |
| Cass Lake-Bena Independent School District No. 115 | | | |
| (Minnesota School District Credit Enhancement Program) | | | |
| Series A 4.00% 2/1/41 | | 375,000 | 380,175 |
| Series A 4.00% 2/1/42 | | 925,000 | 935,878 |
| Series A 4.00% 2/1/43 | | 800,000 | 808,136 |
| City of Blaine, Minnesota | | | |
| Series A 4.00% 2/1/39 | | 1,165,000 | 1,222,225 |
| | | Principal
amount° | Value (US $) |
| Municipal Bonds (continued) |
| Local General Obligation Bonds (continued) |
| City of Minneapolis, Minnesota | | | |
| (Green Bonds) | | | |
| 3.00% 12/1/37 | | 1,300,000 | $ 1,195,610 |
| 3.00% 12/1/38 | | 1,970,000 | 1,777,984 |
| 3.00% 12/1/42 | | 1,000,000 | 857,670 |
| City of Rosemount, Minnesota | | | |
| Series A 4.00% 2/1/53 | | 2,930,000 | 2,812,624 |
| City of Virginia, Minnesota | | | |
| Series A 4.00% 2/1/38 (AGM) | | 1,000,000 | 1,009,180 |
Dilworth Glyndon Felton Independent School
District No. 2164 | | | |
| Series A 3.00% 2/1/41 | | 225,000 | 194,983 |
| Elk River Independent School District No. 728 | | | |
| Series A 3.00% 2/1/40 | | 530,000 | 471,811 |
| Gibbon, Minnesota Independent School District No. 2365 | | | |
| Series A 4.125% 2/1/52 | | 1,250,000 | 1,232,400 |
Goodridge, Minnesota Independent School District No.
561 | | | |
| Series A 4.00% 2/1/37 | | 1,170,000 | 1,217,607 |
| Metropolitan Council General Obligation Wastewater | | | |
| (Minneapolis-St. Paul Metropolitan Area) | | | |
| Series C 4.00% 3/1/41 | | 600,000 | 613,530 |
| Series C 4.00% 3/1/43 | | 575,000 | 582,044 |
| Ramsey County, Minnesota | | | |
| Series B 4.00% 2/1/42 | | 500,000 | 515,400 |
| Rice County, Minnesota | | | |
(State Credit Enhancement Program)
Series A-1 4.00% 2/1/52 | | 1,500,000 | 1,446,195 |
Rosemount-Apple Valley-Eagan Independent School
District No. 196 | | | |
| Series A 4.00% 2/1/44 | | 1,070,000 | 1,056,069 |
| St. Peter Independent School District No. 508, Minnesota | | | |
| Series A 4.00% 2/1/44 | | 150,000 | 149,268 |
| Series A 4.00% 2/1/45 | | 325,000 | 322,277 |
| Series A 5.00% 2/1/42 | | 420,000 | 453,583 |
| Stillwater Independent School District No. 834 | | | |
(Minnesota School District Credit Enhancement Program)
Series A 4.00% 2/1/41 | | 435,000 | 442,382 |
| Washington County, Minnesota | | | |
| Series A 5.00% 2/1/43 | | 1,000,000 | 1,122,180 |
Schedules of investments
Delaware Minnesota High-Yield Municipal Bond Fund
| | | Principal
amount° | Value (US $) |
| Municipal Bonds (continued) |
| Local General Obligation Bonds (continued) |
| Westonka Independent School District No. 277 | | | |
(Minnesota School District Credit Enhancement Program)
Series A 4.00% 2/1/44 | | 1,035,000 | $ 1,028,386 |
| White Bear Lake Independent School District No. 624 | | | |
| Series A 3.00% 2/1/42 | | 1,000,000 | 873,330 |
| | 23,772,657 |
| Pre-Refunded Bonds — 0.57% |
City of St. Paul, Minnesota Housing & Redevelopment
Authority Hospital Facility Revenue | | | |
| (Healtheast Care System Project) | | | |
| Series A 5.00% 11/15/29-25 § | | 275,000 | 282,043 |
| Series A 5.00% 11/15/30-25 § | | 205,000 | 210,250 |
| Duluth Independent School District No. 709 | | | |
| Series A 4.20% 3/1/34-27 § | | 750,000 | 776,137 |
| | 1,268,430 |
| Special Tax Revenue Bonds — 3.49% |
| City of Minneapolis, Minnesota Tax Increment Revenue | | | |
(Village of St. Anthony Falls Project)
4.00% 3/1/27 | | 650,000 | 650,078 |
| Commonwealth of Puerto Rico Revenue | | | |
| (Subordinate) | | | |
| 1.724% 11/1/51 • | | 138,275 | 88,669 |
| 3.029% 11/1/43 • | | 1,634,344 | 1,035,766 |
| Puerto Rico Sales Tax Financing Revenue | | | |
| (Restructured) | | | |
| Series A-1 4.75% 7/1/53 | | 1,505,000 | 1,493,697 |
| Series A-1 5.398% 7/1/51 ^ | | 6,809,000 | 1,670,997 |
| Series A-2 4.536% 7/1/53 | | 3,000,000 | 2,877,750 |
| | 7,816,957 |
| State General Obligation Bonds — 3.28% |
| Commonwealth of Puerto Rico Revenue | | | |
| (Restructured) | | | |
| Series A-1 4.00% 7/1/37 | | 1,070,000 | 1,046,813 |
| Series A-1 4.00% 7/1/46 | | 1,000,000 | 928,530 |
| Minnesota State | | | |
| Series A 4.00% 9/1/38 | | 550,000 | 579,447 |
| Series A 5.00% 8/1/40 | | 750,000 | 822,278 |
| Series A 5.00% 8/1/41 | | 1,000,000 | 1,122,890 |
| | | Principal
amount° | Value (US $) |
| Municipal Bonds (continued) |
| State General Obligation Bonds (continued) |
| Minnesota State | | | |
| Series A 5.00% 8/1/44 | | 2,500,000 | $ 2,834,925 |
| | 7,334,883 |
| Transportation Revenue Bonds — 6.43% |
Minneapolis-St. Paul Metropolitan Airports Commission
Revenue | | | |
| (Private Activity) | | | |
| Series A 4.00% 1/1/54 | | 1,500,000 | 1,441,515 |
| Series B 5.00% 1/1/32 (AMT) | | 330,000 | 350,246 |
| Series B 5.00% 1/1/39 (AMT) | | 500,000 | 521,160 |
| Series B 5.00% 1/1/49 (AMT) | | 600,000 | 612,780 |
| Series B 5.25% 1/1/42 (AMT) | | 2,910,000 | 3,211,709 |
| Series B 5.25% 1/1/47 (AMT) | | 500,000 | 534,805 |
| Series B 5.25% 1/1/49 (AMT) | | 1,000,000 | 1,083,280 |
(Senior)
Series C 5.00% 1/1/46 | | 185,000 | 189,599 |
| (Subordinate) | | | |
| Series A 5.00% 1/1/44 | | 4,000,000 | 4,215,760 |
| Series B 5.00% 1/1/44 (AMT) | | 2,150,000 | 2,213,317 |
| | 14,374,171 |
| Total Municipal Bonds (cost $224,162,982) | 219,256,067 |
|
|
|
| Short-Term Investments — 0.89% |
| Variable Rate Demand Note — 0.89%¤ |
City of Minneapolis, Minnesota Health Care System
Revenue | | | |
(Fairview Health Services) Series C 3.80% 11/15/48
(LOC - Wells Fargo Bank, N.A.) | | 2,000,000 | 2,000,000 |
| Total Short-Term Investments (cost $2,000,000) | 2,000,000 |
Total Value of Securities—98.90%
(cost $226,162,982) | | | $221,256,067 |
| ° | Principal amount shown is stated in USD unless noted that the security is denominated in another currency. |
| # | Security exempt from registration under Rule 144A of the Securities Act of 1933, as amended. At August 31, 2024, the aggregate value of Rule 144A securities was $12,790,826, which represents 5.72% of the Fund’s net assets. See Note 10 in “Notes to financial statements.” |
| ‡ | Non-income producing security. Security is currently in default. |
Schedules of investments
Delaware Minnesota High-Yield Municipal Bond Fund
| • | Variable rate investment. Rates reset periodically. Rate shown reflects the rate in effect at August 31, 2024. For securities based on a published reference rate and spread, the reference rate and spread are indicated in their descriptions. The reference rate descriptions (i.e. SOFR01M, SOFR03M, etc.) used in this report are identical for different securities, but the underlying reference rates may differ due to the timing of the reset period. Certain variable rate securities are not based on a published reference rate and spread but are determined by the issuer or agent and are based on current market conditions, or for mortgage-backed securities, are impacted by the individual mortgages which are paying off over time. These securities do not indicate a reference rate and spread in their descriptions. |
| § | Pre-refunded bonds. Municipal bonds that are generally backed or secured by US Treasury bonds. For pre-refunded bonds, the stated maturity is followed by the year in which the bond will be pre-refunded. See Note 10 in “Notes to financial statements.” |
| ^ | Zero-coupon security. The rate shown is the effective yield at the time of purchase. |
| ¤ | Tax-exempt obligations that contain a floating or variable interest rate adjustment formula and an unconditional right of demand to receive payment of the unpaid principal balance plus accrued interest upon a short notice period (generally up to 30 days) prior to specified dates either from the issuer or by drawing on a bank letter of credit, a guarantee, or insurance issued with respect to such instrument. Each rate shown is as of August 31, 2024. |
| Summary of abbreviations: |
| AGM – Insured by Assured Guaranty Municipal Corporation |
| AMT – Subject to Alternative Minimum Tax |
| LLC – Limited Liability Corporation |
| LOC – Letter of Credit |
| N.A. – National Association |
| SOFR01M – Secured Overnight Financing Rate 1 Month |
| SOFR03M – Secured Overnight Financing Rate 3 Month |
| USD – US Dollar |
See accompanying notes, which are an integral part of the financial statements.
Schedules of investments
| Delaware Tax-Free Minnesota Fund | August 31, 2024 |
| | | Principal
amount° | Value (US $) |
| Municipal Bonds — 98.24% |
| Education Revenue Bonds — 19.95% |
| City of Bethel, Minnesota Charter School Lease Revenue | | | |
| (Spectrum High School Project) | | | |
| Series A 4.00% 7/1/32 | | 425,000 | $ 423,848 |
| Series A 4.25% 7/1/47 | | 1,550,000 | 1,414,375 |
| Series A 4.375% 7/1/52 | | 1,250,000 | 1,134,950 |
City of Brooklyn Park, Minnesota Charter School Lease
Revenue | | | |
| (Prairie Seeds Academy Project) | | | |
| Series A 5.00% 3/1/34 | | 2,395,000 | 2,394,760 |
| Series A 5.00% 3/1/39 | | 385,000 | 377,993 |
City of Cologne, Minnesota Charter School Lease
Revenue | | | |
| (Cologne Academy Project) | | | |
| Series A 5.00% 7/1/29 | | 305,000 | 305,119 |
| Series A 5.00% 7/1/34 | | 150,000 | 150,035 |
| Series A 5.00% 7/1/45 | | 1,705,000 | 1,698,316 |
| City of Deephaven, Minnesota Charter School Revenue | | | |
| (Eagle Ridge Academy Project) | | | |
| Series A 5.25% 7/1/40 | | 500,000 | 503,345 |
| Series A 5.50% 7/1/50 | | 2,000,000 | 2,010,260 |
City of Forest Lake, Minnesota Charter School Lease
Revenue | | | |
| (Lakes International Language Academy Project) | | | |
| Series A 5.25% 8/1/43 | | 400,000 | 408,300 |
| Series A 5.375% 8/1/50 | | 2,290,000 | 2,327,854 |
| Series A 5.50% 8/1/36 | | 1,000,000 | 1,000,810 |
| Series A 5.75% 8/1/44 | | 1,895,000 | 1,896,137 |
City of Ham Lake, Minnesota Charter School Lease
Revenue | | | |
| (DaVinci Academy Project) | | | |
| Series A 5.00% 7/1/36 | | 765,000 | 751,222 |
| Series A 5.00% 7/1/47 | | 2,290,000 | 2,089,259 |
| City of Hugo, Minnesota Charter School Lease Revenue | | | |
(Noble Academy Project)
Series A 5.00% 7/1/44 | | 2,545,000 | 2,544,975 |
City of Minneapolis, Minnesota Charter School Lease
Revenue | | | |
| (Cyber Village Academy Project) | | | |
| Series A 5.25% 6/1/42 | | 1,000,000 | 970,710 |
| Series A 5.50% 6/1/57 | | 500,000 | 478,065 |
| (Hiawatha Academies Project) | | | |
| Series A 144A 5.00% 7/1/32 # | | 800,000 | 822,368 |
Schedules of investments
Delaware Tax-Free Minnesota Fund
| | | Principal
amount° | Value (US $) |
| Municipal Bonds (continued) |
| Education Revenue Bonds (continued) |
City of Minneapolis, Minnesota Charter School Lease
Revenue | | | |
| (Hiawatha Academies Project) |
| Series A 144A 5.375% 7/1/42 # | | 880,000 | $ 881,874 |
| Series A 144A 5.50% 7/1/52 # | | 1,440,000 | 1,431,749 |
| Series A 144A 5.50% 7/1/57 # | | 1,120,000 | 1,106,482 |
| City of Minneapolis, Minnesota Student Housing Revenue | | | |
| (Riverton Community Housing Project) | | | |
| 5.25% 8/1/39 | | 250,000 | 250,100 |
| 5.50% 8/1/49 | | 3,250,000 | 3,250,877 |
City of Otsego, Minnesota Charter School Lease
Revenue | | | |
| (Kaleidoscope Charter School) | | | |
| Series A 5.00% 9/1/34 | | 520,000 | 519,959 |
| Series A 5.00% 9/1/44 | | 1,565,000 | 1,468,987 |
City of St. Cloud, Minnesota Charter School Lease
Revenue | | | |
(Stride Academy Project)
Series A 5.00% 4/1/46 | | 875,000 | 746,331 |
City of St. Paul, Minnesota Housing & Redevelopment
Authority Charter School Lease Revenue | | | |
(Academia Cesar Chavez School Project)
Series A 5.25% 7/1/50 | | 3,110,000 | 2,835,729 |
(Great River School Project)
Series A 144A 5.50% 7/1/52 # | | 735,000 | 742,012 |
| (Hmong College Preparatory Academy Project) | | | |
| Series A 5.00% 9/1/55 | | 1,000,000 | 995,310 |
| Series A 5.75% 9/1/46 | | 1,000,000 | 1,017,100 |
(Nova Classical Academy Project)
Series A 4.125% 9/1/47 | | 1,750,000 | 1,579,795 |
(Twin Cities Academy Project)
Series A 5.30% 7/1/45 | | 1,700,000 | 1,704,369 |
City of St. Paul, Minnesota Housing & Redevelopment
Authority Health Care Facilities Revenue | | | |
| (Great River School Project) | | | |
| Series A 144A 4.75% 7/1/29 # | | 100,000 | 101,047 |
| Series A 144A 5.25% 7/1/33 # | | 140,000 | 143,346 |
(Nova Classical Academy Project)
Series A 4.00% 9/1/36 | | 150,000 | 145,405 |
| | | Principal
amount° | Value (US $) |
| Municipal Bonds (continued) |
| Education Revenue Bonds (continued) |
City of St. Paul, Minnesota Housing & Redevelopment
Authority Revenue | | | |
(Hmong College Preparatory Academy Project)
Series A 5.00% 9/1/40 | | 375,000 | $ 380,816 |
City of Woodbury, Minnesota Charter School Lease
Revenue | | | |
(Woodbury Leadership Academy Project)
Series A 4.00% 7/1/51 | | 1,500,000 | 1,151,580 |
| Duluth Housing & Redevelopment Authority Revenue | | | |
| (Duluth Public Schools Academy Project) | | | |
| Series A 5.00% 11/1/38 | | 400,000 | 379,716 |
| Series A 5.00% 11/1/48 | | 3,355,000 | 2,960,687 |
| Minnesota Higher Education Facilities Authority Revenue | | | |
(Bethel University)
5.00% 5/1/37 | | 1,500,000 | 1,458,765 |
| (Carleton College) | | | |
| 4.00% 3/1/35 | | 1,000,000 | 1,012,770 |
| 4.00% 3/1/36 | | 415,000 | 419,399 |
| 4.00% 3/1/47 | | 3,775,000 | 3,733,966 |
| 5.00% 3/1/53 | | 2,900,000 | 3,096,591 |
(College of St. Benedict)
Series 8-K 4.00% 3/1/43 | | 1,000,000 | 911,020 |
| (College of St. Scholastica) | | | |
| 4.00% 12/1/33 | | 500,000 | 489,470 |
| 4.00% 12/1/34 | | 500,000 | 486,515 |
| 4.00% 12/1/40 | | 1,200,000 | 1,094,448 |
(Gustavus Adolphus College)
5.00% 10/1/47 | | 6,850,000 | 6,960,833 |
(Macalester College)
4.00% 3/1/42 | | 735,000 | 736,691 |
| (St. Catherine University) | | | |
| 5.00% 10/1/52 | | 2,250,000 | 2,255,782 |
| Series A 4.00% 10/1/36 | | 925,000 | 900,691 |
| Series A 5.00% 10/1/32 | | 715,000 | 744,687 |
| Series A 5.00% 10/1/45 | | 4,155,000 | 4,191,315 |
| (St. John's University) | | | |
| Series 8-I 5.00% 10/1/32 | | 500,000 | 509,390 |
| Series 8-I 5.00% 10/1/33 | | 250,000 | 254,660 |
| (St. Olaf College) | | | |
| 3.00% 10/1/38 | | 1,000,000 | 904,950 |
| 3.00% 10/1/41 | | 1,000,000 | 875,060 |
| 4.00% 10/1/46 | | 565,000 | 546,310 |
Schedules of investments
Delaware Tax-Free Minnesota Fund
| | | Principal
amount° | Value (US $) |
| Municipal Bonds (continued) |
| Education Revenue Bonds (continued) |
| Minnesota Higher Education Facilities Authority Revenue | | | |
| (St. Olaf College) |
| 4.00% 10/1/50 | | 700,000 | $ 662,683 |
| Series 8-G 5.00% 12/1/32 | | 795,000 | 814,008 |
| (Trustees of the Hamline University of Minnesota) | | | |
| Series B 5.00% 10/1/37 | | 955,000 | 967,128 |
| Series B 5.00% 10/1/38 | | 1,000,000 | 1,010,810 |
| Series B 5.00% 10/1/39 | | 940,000 | 947,605 |
| Series B 5.00% 10/1/40 | | 625,000 | 629,325 |
| Series B 5.00% 10/1/47 | | 1,060,000 | 1,062,682 |
| (University of St. Thomas) | | | |
| 4.00% 10/1/44 | | 545,000 | 527,538 |
| 5.00% 10/1/33 | | 750,000 | 811,943 |
| 5.00% 10/1/34 | | 800,000 | 862,640 |
| 5.00% 10/1/40 | | 1,595,000 | 1,685,644 |
| Series 7-U 4.00% 4/1/26 | | 1,000,000 | 1,000,520 |
| Series A 4.00% 10/1/34 | | 400,000 | 405,616 |
| Series A 4.00% 10/1/36 | | 500,000 | 504,980 |
| Series A 4.125% 10/1/53 | | 1,000,000 | 985,190 |
| Series A 5.00% 10/1/49 | | 2,475,000 | 2,650,898 |
(University of St. Thomas) (Green Bonds)
Series A 5.00% 10/1/35 | | 1,720,000 | 1,885,412 |
| Minnesota Office of Higher Education Revenue | | | |
| (Senior Supplemental Student Loan Program) | | | |
| 2.65% 11/1/38 (AMT) | | 645,000 | 574,972 |
| 4.00% 11/1/42 (AMT) | | 1,500,000 | 1,448,760 |
| St. Paul, Minnesota Independent School District No. 625 | | | |
| Series A 5.00% 2/1/43 | | 2,100,000 | 2,349,417 |
| University of Minnesota Revenue | | | |
| Series A 5.00% 4/1/34 | | 2,115,000 | 2,187,693 |
| Series A 5.00% 9/1/42 | | 2,100,000 | 2,163,966 |
| Series A 5.00% 11/1/42 | | 2,000,000 | 2,172,620 |
| Series A 5.00% 1/1/43 | | 1,250,000 | 1,410,050 |
| Series A 5.00% 1/1/44 | | 1,000,000 | 1,123,840 |
| | 109,925,225 |
| Electric Revenue Bonds — 6.20% |
| Central Minnesota Municipal Power Agency Revenue | | | |
(Brookings SouthEast Twin Cities Transmission Project)
3.00% 1/1/38 (AGM) | | 300,000 | 271,269 |
| | | Principal
amount° | Value (US $) |
| Municipal Bonds (continued) |
| Electric Revenue Bonds (continued) |
| City of Chaska, Minnesota Electric Revenue | | | |
| (Generating Facilities) | | | |
| Series A 5.00% 10/1/28 | | 250,000 | $ 256,163 |
| Series A 5.00% 10/1/30 | | 1,150,000 | 1,177,611 |
| City of Rochester, Minnesota Electric Utility Revenue | | | |
| Series A 5.00% 12/1/47 | | 3,660,000 | 3,751,170 |
City of St. Paul, Minnesota Housing & Redevelopment
Authority Revenue | | | |
| Series A 4.00% 10/1/30 | | 1,910,000 | 1,963,270 |
| Series A 4.00% 10/1/33 | | 365,000 | 370,968 |
| Minnesota Municipal Power Agency Electric Revenue | | | |
| 5.00% 10/1/30 | | 500,000 | 500,810 |
| 5.00% 10/1/33 | | 1,205,000 | 1,206,807 |
| 5.00% 10/1/47 | | 2,000,000 | 2,044,100 |
| Series A 5.00% 10/1/30 | | 1,300,000 | 1,302,106 |
| Series A 5.00% 10/1/34 | | 750,000 | 751,103 |
| Series A 5.00% 10/1/35 | | 1,525,000 | 1,527,150 |
| Puerto Rico Electric Power Authority Revenue | | | |
| Series A 5.05% 7/1/42 ‡ | | 430,000 | 232,200 |
| Series AAA 5.25% 7/1/25 ‡ | | 250,000 | 135,000 |
| Series CCC 5.25% 7/1/27 ‡ | | 1,875,000 | 1,012,500 |
| Series WW 5.25% 7/1/33 ‡ | | 1,250,000 | 675,000 |
| Series XX 4.75% 7/1/26 ‡ | | 260,000 | 140,400 |
| Series XX 5.75% 7/1/36 ‡ | | 925,000 | 499,500 |
| Series ZZ 4.75% 7/1/27 ‡ | | 210,000 | 113,400 |
| Series ZZ 5.25% 7/1/25 ‡ | | 350,000 | 188,125 |
Sauk Centre Public Utilities Commission Electric
Revenue | | | |
| Series A 4.50% 12/1/53 (AGM) | | 875,000 | 878,080 |
| Southern Minnesota Municipal Power Agency Revenue | | | |
| Series A 5.00% 1/1/42 | | 3,815,000 | 3,995,717 |
| Series A 5.00% 1/1/46 | | 3,685,000 | 3,750,740 |
(Capital Appreciation)
Series A 4.438% 1/1/25 (NATL) ^ | | 5,000,000 | 4,938,550 |
Western Minnesota Municipal Power Agency Supply
Revenue | | | |
| Series A 5.00% 1/1/30 | | 1,000,000 | 1,119,430 |
(Red Rock Hydroelectric Project)
Series A 5.00% 1/1/49 | | 1,300,000 | 1,342,796 |
| | 34,143,965 |
Schedules of investments
Delaware Tax-Free Minnesota Fund
| | | Principal
amount° | Value (US $) |
| Municipal Bonds (continued) |
| Healthcare Revenue Bonds — 32.29% |
City of Anoka, Minnesota Healthcare & Housing Facilities
Revenue | | | |
| (The Homestead at Anoka Project) | | | |
| 5.125% 11/1/49 | | 1,100,000 | $ 1,007,699 |
| 5.375% 11/1/34 | | 590,000 | 590,018 |
| City of Apple Valley, Minnesota Senior Housing Revenue | | | |
| (PHS Apple Valley Senior Housing Orchard Path Phase II Project) | | | |
| 4.00% 9/1/51 | | 500,000 | 438,450 |
| 4.00% 9/1/61 | | 700,000 | 580,482 |
| (PHS Senior Housing, Inc. Orchard Path Project) | | | |
| 4.50% 9/1/53 | | 1,000,000 | 947,300 |
| 5.00% 9/1/58 | | 1,605,000 | 1,606,685 |
| City of Apple Valley, Minnesota Senior Living Revenue | | | |
| (Senior Living LLC Project) | | | |
| Fourth Tier Series D 7.00% 1/1/37 | | 1,585,000 | 1,012,102 |
| Fourth Tier Series D 7.25% 1/1/52 | | 2,580,000 | 1,452,849 |
| Second Tier Series B 5.00% 1/1/47 | | 1,640,000 | 983,196 |
| Second Tier Series B 5.25% 1/1/37 | | 480,000 | 353,861 |
| Third Tier Series C 4.25% 1/1/27 | | 285,000 | 249,364 |
| Third Tier Series C 5.00% 1/1/32 | | 400,000 | 285,820 |
City of Bethel, Minnesota Housing & Health Care
Facilities Revenue | | | |
(Benedictine Health System – St. Peter Communities Project)
Series A 5.50% 12/1/48 | | 2,600,000 | 2,518,594 |
(Ecumen Obligated Group)
Series A 6.125% 3/1/49 | | 1,100,000 | 1,114,597 |
| City of Bethel, Minnesota Senior Housing Revenue | | | |
| (The Lodge at the Lakes at Stillwater Project) | | | |
| 5.00% 6/1/38 | | 700,000 | 676,970 |
| 5.00% 6/1/48 | | 1,000,000 | 888,050 |
| 5.00% 6/1/53 | | 2,450,000 | 2,119,078 |
| City of Center, Minnesota Health Care Facilities Revenue | | | |
| (Hazelden Betty Ford Foundation Project) | | | |
| 4.00% 11/1/34 | | 500,000 | 501,595 |
| 4.00% 11/1/41 | | 2,000,000 | 1,913,540 |
| 4.50% 11/1/34 | | 1,700,000 | 1,701,377 |
| 5.00% 11/1/24 | | 600,000 | 601,440 |
| 5.00% 11/1/26 | | 500,000 | 501,080 |
| | | Principal
amount° | Value (US $) |
| Municipal Bonds (continued) |
| Healthcare Revenue Bonds (continued) |
City of Chatfield, Minnesota Healthcare & Housing
Facilities Revenue | | | |
| (Chosen Valley Care Center Project) | | | |
| 4.00% 9/1/34 | | 100,000 | $ 91,396 |
| 4.00% 9/1/39 | | 100,000 | 85,458 |
| 5.00% 9/1/44 | | 500,000 | 456,880 |
City of Crookston, Minnesota Health Care Facilities
Revenue | | | |
| (Riverview Health Project) | | | |
| 5.00% 5/1/38 | | 500,000 | 358,805 |
| 5.00% 5/1/44 | | 1,500,000 | 987,660 |
| 5.00% 5/1/51 | | 1,585,000 | 971,985 |
City of Glencoe, Minnesota Health Care Facilities
Revenue | | | |
| (Glencoe Regional Health Services Project) | | | |
| 4.00% 4/1/25 | | 660,000 | 658,990 |
| 4.00% 4/1/26 | | 270,000 | 269,997 |
| 4.00% 4/1/31 | | 60,000 | 59,111 |
City of Hayward, Minnesota Health Care Facilities
Revenue | | | |
| (American Baptist Homes Midwest Obligated Group) | | | |
| 5.375% 8/1/34 | | 660,000 | 586,813 |
| 5.75% 2/1/44 | | 500,000 | 412,560 |
(St. John's Lutheran Home of Albert Lea Project)
Series A 5.375% 10/1/44 | | 400,000 | 244,000 |
City of Maple Grove, Minnesota Health Care Facilities
Revenue | | | |
| (Maple Grove Hospital Corporation) | | | |
| 4.00% 5/1/37 | | 2,500,000 | 2,379,500 |
| 5.00% 5/1/27 | | 1,400,000 | 1,452,136 |
| 5.00% 5/1/28 | | 1,000,000 | 1,035,480 |
| 5.00% 5/1/29 | | 1,000,000 | 1,034,150 |
| 5.00% 5/1/30 | | 850,000 | 877,506 |
| 5.00% 5/1/32 | | 825,000 | 847,910 |
| (North Memorial Health Care) | | | |
| 4.00% 9/1/35 | | 350,000 | 339,783 |
| 5.00% 9/1/31 | | 1,320,000 | 1,332,778 |
| 5.00% 9/1/32 | | 1,000,000 | 1,009,210 |
City of Maple Plain, Minnesota Senior Housing & Health
Care Revenue | | | |
(Haven Homes Project)
5.00% 7/1/54 | | 3,500,000 | 3,288,425 |
Schedules of investments
Delaware Tax-Free Minnesota Fund
| | | Principal
amount° | Value (US $) |
| Municipal Bonds (continued) |
| Healthcare Revenue Bonds (continued) |
City of Minneapolis, Minnesota Health Care System
Revenue | | | |
| (Allina Health System) | | | |
| 4.00% 11/15/38 | | 2,000,000 | $ 2,012,220 |
| 4.00% 11/15/40 | | 3,750,000 | 3,718,575 |
| (Fairview Health Services) | | | |
| Series A 4.00% 11/15/48 | | 6,790,000 | 6,175,437 |
| Series A 5.00% 11/15/32 | | 750,000 | 757,665 |
| Series A 5.00% 11/15/33 | | 860,000 | 895,054 |
| Series A 5.00% 11/15/35 | | 500,000 | 518,080 |
| Series A 5.00% 11/15/44 | | 1,000,000 | 1,000,890 |
| Series A 5.00% 11/15/49 | | 6,115,000 | 6,176,150 |
City of Minneapolis, Minnesota Senior Housing &
Healthcare Revenue | | | |
| (Ecumen-Abiitan Mill City Project) | | | |
| 5.00% 11/1/35 | | 1,030,000 | 988,213 |
| 5.25% 11/1/45 | | 1,950,000 | 1,840,469 |
| 5.375% 11/1/50 | | 655,000 | 622,767 |
City of Rochester, Minnesota Health Care & Housing
Revenue | | | |
(The Homestead at Rochester Project)
Series A 6.875% 12/1/48 | | 3,520,000 | 3,520,563 |
City of Rochester, Minnesota Health Care Facilities
Revenue | | | |
| (Mayo Clinic) | | | |
| 4.00% 11/15/39 | | 11,450,000 | 11,892,542 |
| 5.00% 11/15/57 | | 7,250,000 | 7,792,518 |
| Series B 5.00% 11/15/33 | | 1,900,000 | 2,234,191 |
City of Sartell, Minnesota Health Care & Housing
Facilities Revenue | | | |
(Country Manor Campus LLC Project)
5.30% 9/1/37 | | 1,200,000 | 1,200,252 |
City of Sauk Rapids, Minnesota Health Care Housing
Facilities Revenue | | | |
(Good Shepherd Lutheran Home)
5.125% 1/1/39 | | 1,950,000 | 1,745,855 |
City of Shakopee, Minnesota Health Care Facilities
Revenue | | | |
| (St. Francis Regional Medical Center) | | | |
| 4.00% 9/1/31 | | 915,000 | 894,971 |
| 5.00% 9/1/24 | | 575,000 | 575,000 |
| 5.00% 9/1/26 | | 575,000 | 575,477 |
| | | Principal
amount° | Value (US $) |
| Municipal Bonds (continued) |
| Healthcare Revenue Bonds (continued) |
City of Shakopee, Minnesota Health Care Facilities
Revenue | | | |
| (St. Francis Regional Medical Center) |
| 5.00% 9/1/27 | | 405,000 | $ 405,284 |
| 5.00% 9/1/28 | | 425,000 | 425,234 |
| 5.00% 9/1/29 | | 425,000 | 425,229 |
| 5.00% 9/1/34 | | 895,000 | 895,313 |
| City of St. Cloud, Minnesota Health Care Revenue | | | |
| (Centracare Health System Project) | | | |
| 4.00% 5/1/49 | | 7,315,000 | 6,887,292 |
| Series A 4.00% 5/1/37 | | 2,005,000 | 2,005,020 |
| Series A 5.00% 5/1/46 | | 3,510,000 | 3,545,170 |
City of St. Paul, Minnesota Housing & Redevelopment
Authority Health Care Facilities Revenue | | | |
(Episcopal Homes Project)
5.00% 5/1/33 | | 400,000 | 390,364 |
| (Fairview Health Services) | | | |
| Series A 4.00% 11/15/43 | | 2,450,000 | 2,264,657 |
| Series A 5.00% 11/15/47 | | 5,035,000 | 5,109,216 |
| (HealthPartners Obligated Group Project) | | | |
| Series A 5.00% 7/1/30 | | 2,200,000 | 2,225,806 |
| Series A 5.00% 7/1/33 | | 4,265,000 | 4,308,887 |
(Marian Center Project)
Series A 5.375% 5/1/43 | | 500,000 | 459,370 |
City of St. Paul, Minnesota Housing & Redevelopment
Authority Multifamily Housing Revenue | | | |
(Marian Center Project)
Series A 5.30% 11/1/30 | | 420,000 | 418,005 |
City of St. Paul, Minnesota Housing & Redevelopment
Authority Revenue | | | |
| (Amherst H. Wilder Foundation Project) | | | |
| Series A 5.00% 12/1/30 | | 300,000 | 318,456 |
| Series A 5.00% 12/1/36 | | 750,000 | 789,758 |
City of St. Paul, Minnesota Housing & Redevelopment
Authority Senior Housing & Health Care Revenue | | | |
(Episcopal Homes Project)
5.125% 5/1/48 | | 4,000,000 | 3,514,560 |
| City of Wayzata, Minnesota Senior Housing Revenue | | | |
(Folkestone Senior Living Community)
5.00% 8/1/54 | | 275,000 | 276,579 |
Schedules of investments
Delaware Tax-Free Minnesota Fund
| | | Principal
amount° | Value (US $) |
| Municipal Bonds (continued) |
| Healthcare Revenue Bonds (continued) |
City of West St. Paul, Minnesota Housing & Health Care
Facilities Revenue | | | |
| (Walker Westwood Ridge Campus Project) | | | |
| 4.50% 11/1/40 | | 250,000 | $ 236,770 |
| 4.75% 11/1/52 | | 750,000 | 683,835 |
Dakota County Community Development Agency Senior
Housing Revenue | | | |
| (Walker Highview Hills Project) | | | |
| Series A 144A 5.00% 8/1/36 # | | 630,000 | 630,189 |
| Series A 144A 5.00% 8/1/46 # | | 1,500,000 | 1,486,125 |
| Series A 144A 5.00% 8/1/51 # | | 880,000 | 858,343 |
Deephaven, Minnesota Housing & Healthcare Facility
Revenue | | | |
| (St. Therese Senior Living Project) | | | |
| Series A 5.00% 4/1/38 | | 730,000 | 686,054 |
| Series A 5.00% 4/1/40 | | 705,000 | 648,988 |
| Series A 5.00% 4/1/48 | | 315,000 | 270,900 |
| Duluth Economic Development Authority Revenue | | | |
(Benedictine Health System)
Series A 4.00% 7/1/31 | | 1,625,000 | 1,550,884 |
| (Essentia Health Obligated Group) | | | |
| Series A 4.25% 2/15/43 | | 1,600,000 | 1,566,400 |
| Series A 5.00% 2/15/37 | | 750,000 | 777,472 |
| Series A 5.00% 2/15/53 | | 8,710,000 | 8,859,028 |
| Series A 5.00% 2/15/58 | | 11,100,000 | 11,281,263 |
| Series A 5.25% 2/15/58 | | 8,000,000 | 8,214,480 |
(St. Luke’s Hospital of Duluth Obligated Group)
Series A 3.00% 6/15/44 | | 650,000 | 557,193 |
Minnesota Agricultural & Economic Development Board
Healthcare Facilities Revenue | | | |
| (Health Partners Obligated Group) | | | |
| 4.00% 1/1/49 | | 5,450,000 | 5,273,093 |
| 5.25% 1/1/54 | | 1,500,000 | 1,639,785 |
Woodbury, Minnesota Housing & Redevelopment
Authority Revenue | | | |
(St. Therese of Woodbury)
5.125% 12/1/44 | | 2,105,000 | 2,031,557 |
| | 177,878,128 |
| Housing Revenue Bonds — 1.98% |
| Minnesota Housing Finance Agency Revenue | | | |
| Series A1 4.90% 8/1/66 | | 500,000 | 504,120 |
| | | Principal
amount° | Value (US $) |
| Municipal Bonds (continued) |
| Housing Revenue Bonds (continued) |
| Minnesota Housing Finance Agency Revenue | | | |
| Series D 5.50% 7/1/53 | | 1,915,000 | $ 2,046,484 |
| Series F 2.40% 7/1/46 | | 390,000 | 271,432 |
| Series F 4.20% 7/1/38 | | 350,000 | 358,544 |
| Series F 4.50% 1/1/43 | | 1,405,000 | 1,421,424 |
| Series I 2.00% 7/1/40 | | 905,000 | 647,346 |
| Series I 2.20% 1/1/51 | | 1,195,000 | 767,214 |
| Series O 4.45% 7/1/38 | | 2,000,000 | 2,059,700 |
| Series O 4.65% 7/1/41 | | 650,000 | 669,617 |
Northwest Multi-County Housing & Redevelopment
Authority Revenue | | | |
(Pooled Housing Program)
5.50% 7/1/45 | | 2,175,000 | 2,175,000 |
| | 10,920,881 |
| Industrial Development Revenue/Pollution ControlRevenue Bonds — 3.57% |
| City of Cottonwood, Minnesota Revenue | | | |
(Extreme Holdings LLC Project)
Series A 144A 5.00% 12/1/50 (AMT) # | | 1,000,000 | 844,200 |
| Minnesota Municipal Gas Agency Revenue | | | |
| (Minnesota Community Energy) | | | |
| Sub-Series A 4.00% 12/1/27 | | 1,300,000 | 1,335,048 |
| Sub-Series A 4.00% 12/1/52 • | | 7,500,000 | 7,576,050 |
St. Paul, Minnesota Port Authority Solid Waste Disposal
Revenue | | | |
(Gerdau St. Paul Steel Mill Project)
Series 7 144A 4.50% 10/1/37 (AMT) # | | 10,050,000 | 9,893,421 |
| | 19,648,719 |
| Lease Revenue Bonds — 1.88% |
| Chaska, Minnesota Economic Development Authority | | | |
| Series A 4.125% 2/1/54 | | 3,750,000 | 3,624,150 |
City of New London, Economic Development Authority
Revenue | | | |
(SWWC Service Cooperative Lease with Option to Purchase Project)
5.125% 2/1/43 | | 1,250,000 | 1,271,625 |
(SWWC Service Cooperative Lease With Option to Purchase Project)
Series A 4.50% 2/1/33 | | 250,000 | 254,578 |
| Hibbing Independent School District No. 701 Revenue | | | |
| Series A 3.00% 3/1/41 | | 1,500,000 | 1,303,215 |
Schedules of investments
Delaware Tax-Free Minnesota Fund
| | | Principal
amount° | Value (US $) |
| Municipal Bonds (continued) |
| Lease Revenue Bonds (continued) |
| Minnesota Housing Finance Agency Revenue | | | |
| (State Appropriation Housing Infrastructure) | | | |
| Series A 4.00% 8/1/33 | | 655,000 | $ 680,944 |
| Series C 5.00% 8/1/34 | | 1,565,000 | 1,567,097 |
| Series C 5.00% 8/1/35 | | 1,645,000 | 1,647,040 |
| | 10,348,649 |
| Local General Obligation Bonds — 18.18% |
| Anoka-Hennepin Independent School District No. 11 | | | |
| (Minnesota School District Credit Enhancement Program) | | | |
| Series A 3.00% 2/1/43 | | 750,000 | 642,045 |
| Series A 3.00% 2/1/45 | | 3,100,000 | 2,577,960 |
| Brainerd, Minnesota Independent School District No. 181 | | | |
| (School Building) | | | |
| Series A 4.00% 2/1/38 | | 1,500,000 | 1,514,880 |
| Series A 4.00% 2/1/42 | | 3,500,000 | 3,482,045 |
| Cass Lake-Bena Independent School District No. 115 | | | |
| (Minnesota School District Credit Enhancement Program) | | | |
| Series A 4.00% 2/1/41 | | 1,045,000 | 1,059,421 |
| Series A 4.00% 2/1/42 | | 2,580,000 | 2,610,341 |
| Series A 4.00% 2/1/43 | | 2,200,000 | 2,222,374 |
| City of Blaine, Minnesota | | | |
| Series A 4.00% 2/1/35 | | 980,000 | 1,055,627 |
| Series A 4.00% 2/1/38 | | 1,020,000 | 1,079,160 |
| Series A 4.00% 2/1/40 | | 600,000 | 623,256 |
| Series A 5.00% 2/1/34 | | 500,000 | 582,580 |
| City of Brooklyn Center, Minnesota | | | |
| Series A 4.00% 2/1/34 | | 500,000 | 544,140 |
| Series A 4.00% 2/1/35 | | 1,290,000 | 1,400,566 |
| City of Chanhassen, Minnesota | | | |
| Series A 4.00% 2/1/54 | | 2,000,000 | 1,990,480 |
| City of Corcoran, Minnesota | | | |
| Series A 4.00% 2/1/53 (BAM) | | 2,000,000 | 1,935,940 |
| City of Cottage Grove, Minnesota | | | |
| Series A 3.00% 2/1/35 | | 500,000 | 481,155 |
| City of Duluth, Minnesota | | | |
(DECC Improvement)
Series A 5.00% 2/1/34 | | 1,000,000 | 1,026,210 |
| City of Maple Grove, Minnesota | | | |
| Series A 4.00% 2/1/35 | | 1,210,000 | 1,268,479 |
| | | Principal
amount° | Value (US $) |
| Municipal Bonds (continued) |
| Local General Obligation Bonds (continued) |
| City of Minneapolis, Minnesota | | | |
| (Green Bonds) | | | |
| 3.00% 12/1/37 | | 3,500,000 | $ 3,218,950 |
| 3.00% 12/1/38 | | 2,975,000 | 2,685,027 |
| 3.00% 12/1/40 | | 1,875,000 | 1,639,050 |
| 3.00% 12/1/42 | | 4,000,000 | 3,430,680 |
| City of Rosemount, Minnesota | | | |
| Series A 4.00% 2/1/53 | | 7,605,000 | 7,300,344 |
Clinton-Graceville-Beardsley Independent School District
No. 2888 | | | |
| Series A 5.00% 2/1/35 | | 1,135,000 | 1,282,664 |
| Series A 5.00% 2/1/37 | | 1,260,000 | 1,417,235 |
Dilworth Glyndon Felton Independent School
District No. 2164 | | | |
| Series A 3.00% 2/1/37 | | 1,000,000 | 928,900 |
| Series A 3.00% 2/1/41 | | 1,000,000 | 866,590 |
| Elk River Independent School District No. 728 | | | |
| Series A 3.00% 2/1/40 | | 1,970,000 | 1,753,714 |
| Gibbon, Minnesota Independent School District No. 2365 | | | |
| Series A 4.125% 2/1/52 | | 1,000,000 | 985,920 |
| Series A 5.00% 2/1/48 | | 1,850,000 | 1,984,606 |
Goodridge, Minnesota Independent School District No.
561 | | | |
| Series A 4.00% 2/1/38 | | 1,215,000 | 1,253,989 |
| Hennepin County, Minnesota | | | |
| Series A 5.00% 12/1/36 | | 2,855,000 | 3,199,028 |
| Lakeville Independent School District No. 194 | | | |
| (Lakeville area schools) | | | |
| Series A 4.00% 2/1/34 | | 800,000 | 862,368 |
| Series A 4.00% 2/1/35 | | 1,060,000 | 1,134,677 |
| Martin County West Independent School District No. 2448 | | | |
(Minnesota School District Credit Enhancement Program)
Series A 5.00% 2/1/41 | | 1,000,000 | 1,132,220 |
| Metropolitan Council General Obligation Wastewater | | | |
| (Minneapolis-St. Paul Metropolitan Area) | | | |
| Series C 4.00% 3/1/41 | | 1,400,000 | 1,431,570 |
| Series C 4.00% 3/1/43 | | 1,425,000 | 1,442,456 |
| Minneapolis Special School District No. 1 | | | |
(School Building)
Series B 4.00% 2/1/39 | | 1,960,000 | 1,997,710 |
Schedules of investments
Delaware Tax-Free Minnesota Fund
| | | Principal
amount° | Value (US $) |
| Municipal Bonds (continued) |
| Local General Obligation Bonds (continued) |
Mounds View, Minnesota Independent School District
No. 621 | | | |
| Series A 4.00% 2/1/39 | | 1,850,000 | $ 1,930,475 |
(Minnesota School District Credit Enhancement Program)
Series A 4.00% 2/1/43 | | 3,000,000 | 3,008,070 |
North St. Paul-Maplewood-Oakdale Independent School
District No. 622 | | | |
| Series A 3.00% 2/1/42 | | 1,000,000 | 860,690 |
| Ramsey County, Minnesota | | | |
| Series B 4.00% 2/1/42 | | 1,000,000 | 1,030,800 |
Redwood Area Schools Independent School District No.
2897 | | | |
| 4.00% 2/1/42 | | 2,210,000 | 2,233,492 |
| 4.00% 2/1/43 | | 1,130,000 | 1,141,492 |
| Rice County, Minnesota | | | |
| (State Credit Enhancement Program) | | | |
| Series A 5.00% 2/1/44 | | 580,000 | 638,423 |
| Series A-1 4.00% 2/1/52 | | 3,500,000 | 3,374,455 |
Rosemount-Apple Valley-Eagan Independent School
District No. 196 | | | |
| Series A 4.00% 2/1/44 | | 2,930,000 | 2,891,851 |
| St. Peter Independent School District No. 508, Minnesota | | | |
| Series A 4.00% 2/1/44 | | 350,000 | 348,292 |
| Series A 4.00% 2/1/45 | | 850,000 | 842,877 |
| Series A 5.00% 2/1/42 | | 1,050,000 | 1,133,958 |
| Stillwater Independent School District No. 834 | | | |
| (Minnesota School District Credit Enhancement Program) | | | |
| Series A 4.00% 2/1/41 | | 1,000,000 | 1,016,970 |
| Series A 4.00% 2/1/44 | | 1,745,000 | 1,724,584 |
| Virginia Independent School District No. 706 | | | |
| Series A 3.00% 2/1/40 | | 2,295,000 | 2,050,651 |
| Washington County, Minnesota | | | |
| Series A 5.00% 2/1/44 | | 1,515,000 | 1,691,164 |
Washington County, Minnesota General Obligation
Capital Improvrment Plan Bond | | | |
| Series A 5.00% 2/1/43 | | 1,035,000 | 1,161,456 |
| Westonka Independent School District No. 277 | | | |
(Minnesota School District Credit Enhancement Program)
Series A 4.00% 2/1/44 | | 2,675,000 | 2,657,907 |
| | | Principal
amount° | Value (US $) |
| Municipal Bonds (continued) |
| Local General Obligation Bonds (continued) |
| White Bear Lake Independent School District No. 624 | | | |
| Series A 3.00% 2/1/42 | | 5,000,000 | $ 4,366,650 |
| | 100,148,614 |
| Pre-Refunded Bond — 0.15% |
City of St. Paul, Minnesota Housing & Redevelopment
Authority Hospital Facility Revenue | | | |
(Healtheast Care System Project)
Series A 5.00% 11/15/30-25 § | | 790,000 | 810,232 |
| | 810,232 |
| Special Tax Revenue Bonds — 3.06% |
| City of St. Paul Minnesota Sales & Use Tax Revenue | | | |
(Neighborhood and Economic Development Projects)
Series C 5.00% 11/1/42 | | 2,000,000 | 2,239,680 |
| Commonwealth of Puerto Rico Revenue | | | |
| (Subordinate) | | | |
| 1.724% 11/1/51 • | | 124,595 | 79,897 |
| 2.66% 11/1/43 • | | 1,472,650 | 933,291 |
| Puerto Rico Sales Tax Financing Revenue | | | |
| (Restructured) | | | |
| Series A-1 4.55% 7/1/40 | | 830,000 | 831,975 |
| Series A-1 4.75% 7/1/53 | | 5,295,000 | 5,255,235 |
| Series A-1 5.48% 7/1/46 ^ | | 3,280,000 | 1,105,983 |
| Series A-1 5.504% 7/1/51 ^ | | 24,614,000 | 6,040,522 |
| Series A-2 4.536% 7/1/53 | | 378,000 | 362,597 |
| | 16,849,180 |
| State General Obligation Bonds — 3.27% |
| Commonwealth of Puerto Rico Revenue | | | |
(Restructured)
Series A-1 4.00% 7/1/46 | | 2,000,000 | 1,857,060 |
| Minnesota State | | | |
| Series A 4.00% 9/1/38 | | 625,000 | 658,463 |
| Series A 5.00% 8/1/30 | | 1,250,000 | 1,363,963 |
| Series A 5.00% 9/1/31 | | 1,000,000 | 1,152,830 |
| Series A 5.00% 8/1/37 | | 2,925,000 | 3,134,605 |
| Series A 5.00% 8/1/39 | | 1,250,000 | 1,350,375 |
| Series A 5.00% 8/1/44 | | 7,500,000 | 8,504,775 |
| | 18,022,071 |
Schedules of investments
Delaware Tax-Free Minnesota Fund
| | | Principal
amount° | Value (US $) |
| Municipal Bonds (continued) |
| Transportation Revenue Bonds — 7.71% |
Minneapolis-St. Paul Metropolitan Airports Commission
Revenue | | | |
| (Private Activity) | | | |
| Series A 4.00% 1/1/54 | | 3,500,000 | $ 3,363,535 |
| Series B 5.00% 1/1/32 (AMT) | | 880,000 | 933,988 |
| Series B 5.00% 1/1/38 (AMT) | | 350,000 | 366,755 |
| Series B 5.00% 1/1/39 (AMT) | | 3,715,000 | 3,915,319 |
| Series B 5.00% 1/1/49 (AMT) | | 6,600,000 | 6,740,580 |
| Series B 5.25% 1/1/42 (AMT) | | 6,000,000 | 6,622,080 |
| Series B 5.25% 1/1/47 (AMT) | | 2,000,000 | 2,139,220 |
| Series B 5.25% 1/1/49 (AMT) | | 4,000,000 | 4,333,120 |
| (Senior) | | | |
| Series C 5.00% 1/1/41 | | 600,000 | 618,816 |
| Series C 5.00% 1/1/46 | | 1,595,000 | 1,634,652 |
| (Subordinate) | | | |
| Series A 5.00% 1/1/44 | | 1,200,000 | 1,264,728 |
| Series B 5.00% 1/1/35 (AMT) | | 1,205,000 | 1,303,689 |
| Series B 5.00% 1/1/44 (AMT) | | 9,000,000 | 9,265,050 |
| | 42,501,532 |
| Total Municipal Bonds (cost $545,997,937) | 541,197,196 |
|
|
|
| Short-Term Investments — 0.85% |
| Variable Rate Demand Note — 0.85%¤ |
City of Minneapolis, Minnesota Health Care System
Revenue | | | |
(Fairview Health Services) Series C 3.80% 11/15/48
(LOC - Wells Fargo Bank, N.A.) | | 4,670,000 | 4,670,000 |
| Total Short-Term Investments (cost $4,670,000) | 4,670,000 |
Total Value of Securities—99.09%
(cost $550,667,937) | | | $545,867,196 |
| ° | Principal amount shown is stated in USD unless noted that the security is denominated in another currency. |
| # | Security exempt from registration under Rule 144A of the Securities Act of 1933, as amended. At August 31, 2024, the aggregate value of Rule 144A securities was $18,941,156, which represents 3.44% of the Fund’s net assets. See Note 10 in “Notes to financial statements.” |
| ‡ | Non-income producing security. Security is currently in default. |
| ^ | Zero-coupon security. The rate shown is the effective yield at the time of purchase. |
| • | Variable rate investment. Rates reset periodically. Rate shown reflects the rate in effect at August 31, 2024. For securities based on a published reference rate and spread, the reference rate and spread are indicated in their descriptions. The reference rate descriptions (i.e. SOFR01M, SOFR03M, etc.) used in this report are identical for different securities, but the underlying reference rates may differ due to the timing of the reset period. Certain variable rate securities are not based on a published reference rate and spread but are determined by the issuer or agent and are based on current market conditions, or for mortgage-backed securities, are impacted by the individual mortgages which are paying off over time. These securities do not indicate a reference rate and spread in their descriptions. |
| § | Pre-refunded bonds. Municipal bonds that are generally backed or secured by US Treasury bonds. For pre-refunded bonds, the stated maturity is followed by the year in which the bond will be pre-refunded. See Note 10 in “Notes to financial statements.” |
| ¤ | Tax-exempt obligations that contain a floating or variable interest rate adjustment formula and an unconditional right of demand to receive payment of the unpaid principal balance plus accrued interest upon a short notice period (generally up to 30 days) prior to specified dates either from the issuer or by drawing on a bank letter of credit, a guarantee, or insurance issued with respect to such instrument. Each rate shown is as of August 31, 2024. |
| Summary of abbreviations: |
| AGM – Insured by Assured Guaranty Municipal Corporation |
| AMT – Subject to Alternative Minimum Tax |
| BAM – Insured by Build America Mutual Assurance |
| LLC – Limited Liability Corporation |
| LOC – Letter of Credit |
| N.A. – National Association |
| NATL – Insured by National Public Finance Guarantee Corporation |
| SOFR01M – Secured Overnight Financing Rate 1 Month |
| SOFR03M – Secured Overnight Financing Rate 3 Month |
| USD – US Dollar |
See accompanying notes, which are an integral part of the financial statements.
Statements of assets and liabilities
August 31, 2024
| | Delaware Minnesota
High-Yield Municipal
Bond Fund | | Delaware Tax-Free Minnesota Fund |
| Assets: | | | |
| Investments, at value* | $221,256,067 | | $545,867,196 |
| Cash | 328,358 | | 1,049,631 |
| Interest receivable | 2,589,084 | | 5,681,029 |
| Receivable for fund shares sold | 153,782 | | 1,051,793 |
| Prepaid expenses | 48,352 | | 48,078 |
| Other assets | 1,586 | | 4,704 |
| Total Assets | 224,377,229 | | 553,702,431 |
| Liabilities: | | | |
| Payable for fund shares redeemed | 396,272 | | 926,002 |
| Investment management fees payable to affiliates | 132,266 | | 247,415 |
| Other accrued expenses | 96,789 | | 173,601 |
| Distribution fees payable to affiliates | 25,473 | | 69,597 |
| Distribution payable | 20,098 | | 261,319 |
| Payable for securities purchased | — | | 1,132,360 |
| Total Liabilities | 670,898 | | 2,810,294 |
| Total Net Assets | $223,706,331 | | $550,892,137 |
|
| Net Assets Consist of: | | | |
| Paid-in capital | $237,535,727 | | $587,691,755 |
| Total distributable earnings (loss) | (13,829,396) | | (36,799,618) |
| Total Net Assets | $223,706,331 | | $550,892,137 |
| | Delaware Minnesota
High-Yield Municipal
Bond Fund | Delaware Tax-Free Minnesota Fund |
|
| Net Asset Value | | |
|
| Class A: | | |
| Net assets | $89,654,776 | $298,903,887 |
| Shares of beneficial interest outstanding, unlimited authorization, no par | 8,829,848 | 26,395,322 |
| Net asset value per share | $10.15 | $11.32 |
| Sales charge | 4.50% | 4.50% |
Offering price per share, equal to net asset value per
share / (1 - sales charge) | $10.63 | $11.85 |
|
| Class C: | | |
| Net assets | $7,784,918 | $7,211,652 |
| Shares of beneficial interest outstanding, unlimited authorization, no par | 765,254 | 634,723 |
| Net asset value per share | $10.17 | $11.36 |
|
| Institutional Class: | | |
| Net assets | $126,266,637 | $244,776,598 |
| Shares of beneficial interest outstanding, unlimited authorization, no par | 12,439,434 | 21,619,573 |
| Net asset value per share | $10.15 | $11.32 |
*Investments, at cost | $226,162,982 | $550,667,937 |
See accompanying notes, which are an integral part of the financial statements.
Statements of operations
Year ended August 31, 2024
| | Delaware Minnesota
High-Yield Municipal
Bond Fund | | Delaware Tax-Free Minnesota Fund |
| Investment Income: | | | |
| Interest | $9,480,085 | | $21,624,848 |
|
| Expenses: | | | |
| Management fees | 1,136,916 | | 2,726,861 |
| Distribution expenses — Class A | 217,857 | | 681,006 |
| Distribution expenses — Class C | 79,264 | | 76,806 |
| Dividend disbursing and transfer agent fees and expenses | 139,230 | | 364,560 |
| Registration fees | 70,685 | | 158,942 |
| Accounting and administration expenses | 52,066 | | 98,624 |
| Audit and tax fees | 45,921 | | 45,921 |
| Legal fees | 45,841 | | 70,946 |
| Reports and statements to shareholders expenses | 23,601 | | 7,685 |
| Trustees’ fees | 9,090 | | 21,769 |
| Custodian fees | 2,061 | | 4,631 |
| Other | 26,600 | | 73,353 |
| | 1,849,132 | | 4,331,104 |
| Less expenses waived | (312,950) | | (668,238) |
| Less expenses paid indirectly | (2,088) | | (4,825) |
| Total operating expenses | 1,534,094 | | 3,658,041 |
| Net Investment Income (Loss) | 7,945,991 | | 17,966,807 |
|
| Net Realized and Unrealized Gain (Loss): | | | |
| Net realized gain (loss) on investments | (1,363,722) | | (6,427,395) |
| Net change in unrealized appreciation (depreciation) on investments | 11,467,299 | | 23,417,616 |
| Net Realized and Unrealized Gain (Loss) | 10,103,577 | | 16,990,221 |
| Net Increase (Decrease) in Net Assets Resulting from Operations | $18,049,568 | | $34,957,028 |
See accompanying notes, which are an integral part of the financial statements.
Statements of changes in net assets
Delaware Minnesota High-Yield Municipal Bond Fund
| | Year ended |
| | 8/31/24 | | 8/31/23 |
| Increase (Decrease) in Net Assets from Operations: | | | |
| Net investment income (loss) | $7,945,991 | | $7,200,116 |
| Net realized gain (loss) | (1,363,722) | | (5,129,123) |
| Net change in unrealized appreciation (depreciation) | 11,467,299 | | (4,535,253) |
| Net increase (decrease) in net assets resulting from operations | 18,049,568 | | (2,464,260) |
|
| Dividends and Distributions to Shareholders from: | | | |
| Distributable earnings: | | | |
| Class A | (3,194,673) | | (3,179,809) |
| Class C | (230,935) | | (250,269) |
| Institutional Class | (4,363,949) | | (3,687,208) |
| | (7,789,557) | | (7,117,286) |
|
| Capital Share Transactions (See Note 6): | | | |
| Proceeds from shares sold: | | | |
| Class A | 15,122,276 | | 24,733,272 |
| Class C | 1,940,025 | | 1,407,398 |
| Institutional Class | 54,181,125 | | 56,284,847 |
|
| Net asset value of shares issued upon reinvestment of dividends and distributions: | | | |
| Class A | 3,061,377 | | 3,072,064 |
| Class C | 227,746 | | 247,254 |
| Institutional Class | 4,266,884 | | 3,631,762 |
| | 78,799,433 | | 89,376,597 |
Statements of changes in net assets
Delaware Minnesota High-Yield Municipal Bond Fund
| | Year ended |
| | 8/31/24 | | 8/31/23 |
| Capital Share Transactions (continued): | | | |
| Cost of shares redeemed: | | | |
| Class A | $(24,031,125) | | $(31,088,176) |
| Class C | (2,943,296) | | (4,514,906) |
| Institutional Class | (42,527,198) | | (57,410,992) |
| | (69,501,619) | | (93,014,074) |
| Increase (decrease) in net assets derived from capital share transactions | 9,297,814 | | (3,637,477) |
| Net Increase (Decrease) in Net Assets | 19,557,825 | | (13,219,023) |
|
| Net Assets: | | | |
| Beginning of year | 204,148,506 | | 217,367,529 |
| End of year | $223,706,331 | | $204,148,506 |
See accompanying notes, which are an integral part of the financial statements.
Statements of changes in net assets
Delaware Tax-Free Minnesota Fund
| | Year ended |
| | 8/31/24 | | 8/31/23 |
| Increase (Decrease) in Net Assets from Operations: | | | |
| Net investment income (loss) | $17,966,807 | | $15,096,090 |
| Net realized gain (loss) | (6,427,395) | | (15,001,894) |
| Net change in unrealized appreciation (depreciation) | 23,417,616 | | (5,140,655) |
| Net increase (decrease) in net assets resulting from operations | 34,957,028 | | (5,046,459) |
|
| Dividends and Distributions to Shareholders from: | | | |
| Distributable earnings: | | | |
| Class A | (9,134,176) | | (8,698,787) |
| Class C | (200,016) | | (227,836) |
| Institutional Class | (7,803,517) | | (6,535,249) |
| | (17,137,709) | | (15,461,872) |
|
| Capital Share Transactions (See Note 6): | | | |
| Proceeds from shares sold: | | | |
| Class A | 47,026,880 | | 68,439,065 |
| Class C | 704,505 | | 1,456,957 |
| Institutional Class | 90,735,046 | | 131,692,831 |
|
| Net assets from reorganization:1 | | | |
| Class A | 36,670,677 | | — |
| Class C | 1,357,835 | | — |
| Institutional Class | 16,874,887 | | — |
|
| Net asset value of shares issued upon reinvestment of dividends and distributions: | | | |
| Class A | 8,454,365 | | 8,076,183 |
| Class C | 198,529 | | 226,411 |
| Institutional Class | 5,604,128 | | 4,268,668 |
| | 207,626,852 | | 214,160,115 |
Statements of changes in net assets
Delaware Tax-Free Minnesota Fund
| | Year ended |
| | 8/31/24 | | 8/31/23 |
| Capital Share Transactions (continued): | | | |
| Cost of shares redeemed: | | | |
| Class A | $(79,562,609) | | $(105,517,160) |
| Class C | (3,932,930) | | (5,517,111) |
| Institutional Class | (79,810,817) | | (135,208,517) |
| | (163,306,356) | | (246,242,788) |
| Increase (decrease) in net assets derived from capital share transactions | 44,320,496 | | (32,082,673) |
| Net Increase (Decrease) in Net Assets | 62,139,815 | | (52,591,004) |
|
| Net Assets: | | | |
| Beginning of year | 488,752,322 | | 541,343,326 |
| End of year | $550,892,137 | | $488,752,322 |
| 1 | See Note 7 in “Notes to financial statements.” |
See accompanying notes, which are an integral part of the financial statements.
This page intentionally left blank.
Financial highlights
Delaware Minnesota High-Yield Municipal Bond Fund Class A
Selected data for each share of the Fund outstanding throughout each period were as follows:
| |
| |
Net asset value, beginning of period
|
| |
| Income (loss) from investment operations: |
Net investment income1
|
Net realized and unrealized gain (loss)
|
Total from investment operations
|
| |
| Less dividends and distributions from: |
Net investment income
|
Total dividends and distributions
|
| |
Net asset value, end of period
|
| |
Total return2
|
| |
| Ratios and supplemental data: |
Net assets, end of period (000 omitted)
|
Ratio of expenses to average net assets
|
Ratio of expenses to average net assets prior to fees waived
|
Ratio of net investment income to average net assets
|
Ratio of net investment income to average net assets prior to fees waived
|
Portfolio turnover
|
| 1 | Calculated using average shares outstanding. |
| 2 | Total return is based on the change in net asset value of a share during the period and assumes reinvestment of dividends and distributions at net asset value and does not reflect the impact of a sales charge. Total return during the period presented reflects waivers by the manager and/or distributor (as applicable). Performance would have been lower had the waivers not been in effect. |
See accompanying notes, which are an integral part of the financial statements.
| Year ended |
| 8/31/24 | | 8/31/23 | | 8/31/22 | | 8/31/21 | | 8/31/20 |
| $9.65 | | $10.08 | | $11.34 | | $11.00 | | $11.21 |
| |
| | | | | | | | | |
| 0.37 | | 0.32 | | 0.27 | | 0.28 | | 0.29 |
| 0.49 | | (0.43) | | (1.26) | | 0.34 | | (0.21) |
| 0.86 | | (0.11) | | (0.99) | | 0.62 | | 0.08 |
| |
| | | | | | | | | |
| (0.36) | | (0.32) | | (0.27) | | (0.28) | | (0.29) |
| (0.36) | | (0.32) | | (0.27) | | (0.28) | | (0.29) |
| |
| $10.15 | | $9.65 | | $10.08 | | $11.34 | | $11.00 |
| |
| 9.10% | | (1.06%) | | (8.79%) | | 5.71% | | 0.81% |
| |
| | | | | | | | | |
| $89,655 | | $91,116 | | $98,592 | | $112,606 | | $103,913 |
| 0.85% | | 0.87% | | 0.88% | | 0.89% | | 0.89% |
| 1.00% | | 0.99% | | 0.98% | | 0.97% | | 0.97% |
| 3.74% | | 3.33% | | 2.58% | | 2.52% | | 2.69% |
| 3.59% | | 3.21% | | 2.48% | | 2.44% | | 2.61% |
| 19% | | 36% | | 23% | | 3% | | 18% |
Financial highlights
Delaware Minnesota High-Yield Municipal Bond Fund Class C
Selected data for each share of the Fund outstanding throughout each period were as follows:
| |
| |
Net asset value, beginning of period
|
| |
| Income (loss) from investment operations: |
Net investment income1
|
Net realized and unrealized gain (loss)
|
Total from investment operations
|
| |
| Less dividends and distributions from: |
Net investment income
|
Total dividends and distributions
|
| |
Net asset value, end of period
|
| |
Total return3
|
| |
| Ratios and supplemental data: |
Net assets, end of period (000 omitted)
|
Ratio of expenses to average net assets
|
Ratio of expenses to average net assets prior to fees waived
|
Ratio of net investment income to average net assets
|
Ratio of net investment income to average net assets prior to fees waived
|
Portfolio turnover
|
| 1 | Calculated using average shares outstanding. |
| 2 | Amount is less than $0.005 per share. |
| 3 | Total return is based on the change in net asset value of a share during the period and assumes reinvestment of dividends and distributions at net asset value and does not reflect the impact of a sales charge. Total return during the period presented reflects waivers by the manager and/or distributor (as applicable). Performance would have been lower had the waivers not been in effect. |
See accompanying notes, which are an integral part of the financial statements.
| Year ended |
| 8/31/24 | | 8/31/23 | | 8/31/22 | | 8/31/21 | | 8/31/20 |
| $9.67 | | $10.10 | | $11.36 | | $11.02 | | $11.23 |
| |
| | | | | | | | | |
| 0.30 | | 0.25 | | 0.19 | | 0.20 | | 0.21 |
| 0.49 | | (0.43) | | (1.26) | | 0.34 | | (0.21) |
| 0.79 | | (0.18) | | (1.07) | | 0.54 | | —2 |
| |
| | | | | | | | | |
| (0.29) | | (0.25) | | (0.19) | | (0.20) | | (0.21) |
| (0.29) | | (0.25) | | (0.19) | | (0.20) | | (0.21) |
| |
| $10.17 | | $9.67 | | $10.10 | | $11.36 | | $11.02 |
| |
| 8.28% | | (1.79%) | | (9.46%) | | 4.92% | | 0.05% |
| |
| | | | | | | | | |
| $7,785 | | $8,163 | | $11,476 | | $14,317 | | $19,376 |
| 1.60% | | 1.62% | | 1.63% | | 1.64% | | 1.64% |
| 1.75% | | 1.74% | | 1.73% | | 1.72% | | 1.72% |
| 2.99% | | 2.58% | | 1.82% | | 1.77% | | 1.94% |
| 2.84% | | 2.46% | | 1.73% | | 1.69% | | 1.86% |
| 19% | | 36% | | 23% | | 3% | | 18% |
Financial highlights
Delaware Minnesota High-Yield Municipal Bond Fund Institutional Class
Selected data for each share of the Fund outstanding throughout each period were as follows:
| |
| |
Net asset value, beginning of period
|
| |
| Income (loss) from investment operations: |
Net investment income1
|
Net realized and unrealized gain (loss)
|
Total from investment operations
|
| |
| Less dividends and distributions from: |
Net investment income
|
Total dividends and distributions
|
| |
Net asset value, end of period
|
| |
Total return2
|
| |
| Ratios and supplemental data: |
Net assets, end of period (000 omitted)
|
Ratio of expenses to average net assets
|
Ratio of expenses to average net assets prior to fees waived
|
Ratio of net investment income to average net assets
|
Ratio of net investment income to average net assets prior to fees waived
|
Portfolio turnover
|
| 1 | Calculated using average shares outstanding. |
| 2 | Total return is based on the change in net asset value of a share during the period and assumes reinvestment of dividends and distributions at net asset value. Total return during the period presented reflects waivers by the manager. Performance would have been lower had the waivers not been in effect. |
See accompanying notes, which are an integral part of the financial statements.
| Year ended |
| 8/31/24 | | 8/31/23 | | 8/31/22 | | 8/31/21 | | 8/31/20 |
| $9.65 | | $10.07 | | $11.33 | | $11.00 | | $11.20 |
| |
| | | | | | | | | |
| 0.39 | | 0.35 | | 0.30 | | 0.31 | | 0.32 |
| 0.49 | | (0.42) | | (1.26) | | 0.33 | | (0.20) |
| 0.88 | | (0.07) | | (0.96) | | 0.64 | | 0.12 |
| |
| | | | | | | | | |
| (0.38) | | (0.35) | | (0.30) | | (0.31) | | (0.32) |
| (0.38) | | (0.35) | | (0.30) | | (0.31) | | (0.32) |
| |
| $10.15 | | $9.65 | | $10.07 | | $11.33 | | $11.00 |
| |
| 9.38% | | (0.71%) | | (8.58%) | | 5.89% | | 1.15% |
| |
| | | | | | | | | |
| $126,266 | | $104,870 | | $107,300 | | $102,787 | | $75,325 |
| 0.60% | | 0.62% | | 0.63% | | 0.64% | | 0.64% |
| 0.75% | | 0.74% | | 0.73% | | 0.72% | | 0.72% |
| 3.99% | | 3.58% | | 2.83% | | 2.77% | | 2.94% |
| 3.84% | | 3.46% | | 2.73% | | 2.69% | | 2.86% |
| 19% | | 36% | | 23% | | 3% | | 18% |
Financial highlights
Delaware Tax-Free Minnesota Fund Class A
Selected data for each share of the Fund outstanding throughout each period were as follows:
| |
| |
Net asset value, beginning of period
|
| |
| Income (loss) from investment operations: |
Net investment income1
|
Net realized and unrealized gain (loss)
|
Total from investment operations
|
| |
| Less dividends and distributions from: |
Net investment income
|
Net realized gain
|
Total dividends and distributions
|
| |
Net asset value, end of period
|
| |
Total return2
|
| |
| Ratios and supplemental data: |
Net assets, end of period (000 omitted)
|
Ratio of expenses to average net assets
|
Ratio of expenses to average net assets prior to fees waived
|
Ratio of net investment income to average net assets
|
Ratio of net investment income to average net assets prior to fees waived
|
Portfolio turnover
|
| 1 | Calculated using average shares outstanding. |
| 2 | Total return is based on the change in net asset value of a share during the period and assumes reinvestment of dividends and distributions at net asset value and does not reflect the impact of a sales charge. Total return during the period presented reflects waivers by the manager and/or distributor (as applicable). Performance would have been lower had the waivers not been in effect. |
See accompanying notes, which are an integral part of the financial statements.
| Year ended |
| 8/31/24 | | 8/31/23 | | 8/31/22 | | 8/31/21 | | 8/31/20 |
| $10.93 | | $11.36 | | $12.70 | | $12.49 | | $12.68 |
| |
| | | | | | | | | |
| 0.39 | | 0.32 | | 0.27 | | 0.29 | | 0.31 |
| 0.37 | | (0.42) | | (1.34) | | 0.21 | | (0.16) |
| 0.76 | | (0.10) | | (1.07) | | 0.50 | | 0.15 |
| |
| | | | | | | | | |
| (0.37) | | (0.33) | | (0.27) | | (0.29) | | (0.31) |
| — | | — | | — | | — | | (0.03) |
| (0.37) | | (0.33) | | (0.27) | | (0.29) | | (0.34) |
| |
| $11.32 | | $10.93 | | $11.36 | | $12.70 | | $12.49 |
| |
| 7.10% | | (0.89%) | | (8.51%) | | 4.05% | | 1.30% |
| |
| | | | | | | | | |
| $298,904 | | $276,596 | | $317,184 | | $375,799 | | $373,691 |
| 0.83% | | 0.84% | | 0.85% | | 0.85% | | 0.85% |
| 0.97% | | 0.98% | | 0.93% | | 0.93% | | 0.93% |
| 3.52% | | 2.89% | | 2.25% | | 2.30% | | 2.53% |
| 3.38% | | 2.75% | | 2.17% | | 2.22% | | 2.45% |
| 27% | | 35% | | 24% | | 3% | | 15% |
Financial highlights
Delaware Tax-Free Minnesota Fund Class C
Selected data for each share of the Fund outstanding throughout each period were as follows:
| |
| |
Net asset value, beginning of period
|
| |
| Income (loss) from investment operations: |
Net investment income1
|
Net realized and unrealized gain (loss)
|
Total from investment operations
|
| |
| Less dividends and distributions from: |
Net investment income
|
Net realized gain
|
Total dividends and distributions
|
| |
Net asset value, end of period
|
| |
Total return2
|
| |
| Ratios and supplemental data: |
Net assets, end of period (000 omitted)
|
Ratio of expenses to average net assets
|
Ratio of expenses to average net assets prior to fees waived
|
Ratio of net investment income to average net assets
|
Ratio of net investment income to average net assets prior to fees waived
|
Portfolio turnover
|
| 1 | Calculated using average shares outstanding. |
| 2 | Total return is based on the change in net asset value of a share during the period and assumes reinvestment of dividends and distributions at net asset value and does not reflect the impact of a sales charge. Total return during the period presented reflects waivers by the manager and/or distributor (as applicable). Performance would have been lower had the waivers not been in effect. |
See accompanying notes, which are an integral part of the financial statements.
| Year ended |
| 8/31/24 | | 8/31/23 | | 8/31/22 | | 8/31/21 | | 8/31/20 |
| $10.96 | | $11.40 | | $12.75 | | $12.53 | | $12.72 |
| |
| | | | | | | | | |
| 0.31 | | 0.24 | | 0.18 | | 0.20 | | 0.22 |
| 0.38 | | (0.43) | | (1.35) | | 0.22 | | (0.16) |
| 0.69 | | (0.19) | | (1.17) | | 0.42 | | 0.06 |
| |
| | | | | | | | | |
| (0.29) | | (0.25) | | (0.18) | | (0.20) | | (0.22) |
| — | | — | | — | | — | | (0.03) |
| (0.29) | | (0.25) | | (0.18) | | (0.20) | | (0.25) |
| |
| $11.36 | | $10.96 | | $11.40 | | $12.75 | | $12.53 |
| |
| 6.39% | | (1.71%) | | (9.23%) | | 3.35% | | 0.54% |
| |
| | | | | | | | | |
| $7,212 | | $8,592 | | $12,837 | | $17,096 | | $25,219 |
| 1.58% | | 1.59% | | 1.60% | | 1.60% | | 1.60% |
| 1.72% | | 1.73% | | 1.68% | | 1.68% | | 1.68% |
| 2.77% | | 2.14% | | 1.50% | | 1.55% | | 1.78% |
| 2.63% | | 2.00% | | 1.42% | | 1.47% | | 1.70% |
| 27% | | 35% | | 24% | | 3% | | 15% |
Financial highlights
Delaware Tax-Free Minnesota Fund Institutional Class
Selected data for each share of the Fund outstanding throughout each period were as follows:
| |
| |
Net asset value, beginning of period
|
| |
| Income (loss) from investment operations: |
Net investment income1
|
Net realized and unrealized gain (loss)
|
Total from investment operations
|
| |
| Less dividends and distributions from: |
Net investment income
|
Net realized gain
|
Total dividends and distributions
|
| |
Net asset value, end of period
|
| |
Total return2
|
| |
| Ratios and supplemental data: |
Net assets, end of period (000 omitted)
|
Ratio of expenses to average net assets
|
Ratio of expenses to average net assets prior to fees waived
|
Ratio of net investment income to average net assets
|
Ratio of net investment income to average net assets prior to fees waived
|
Portfolio turnover
|
| 1 | Calculated using average shares outstanding. |
| 2 | Total return is based on the change in net asset value of a share during the period and assumes reinvestment of dividends and distributions at net asset value. Total return during the period presented reflects waivers by the manager. Performance would have been lower had the waivers not been in effect. |
See accompanying notes, which are an integral part of the financial statements.
| Year ended |
| 8/31/24 | | 8/31/23 | | 8/31/22 | | 8/31/21 | | 8/31/20 |
| $10.93 | | $11.36 | | $12.70 | | $12.49 | | $12.68 |
| |
| | | | | | | | | |
| 0.42 | | 0.35 | | 0.30 | | 0.32 | | 0.34 |
| 0.37 | | (0.42) | | (1.34) | | 0.21 | | (0.16) |
| 0.79 | | (0.07) | | (1.04) | | 0.53 | | 0.18 |
| |
| | | | | | | | | |
| (0.40) | | (0.36) | | (0.30) | | (0.32) | | (0.34) |
| — | | — | | — | | — | | (0.03) |
| (0.40) | | (0.36) | | (0.30) | | (0.32) | | (0.37) |
| |
| $11.32 | | $10.93 | | $11.36 | | $12.70 | | $12.49 |
| |
| 7.37% | | (0.64%) | | (8.28%) | | 4.31% | | 1.55% |
| |
| | | | | | | | | |
| $244,776 | | $203,564 | | $211,322 | | $218,886 | | $181,242 |
| 0.58% | | 0.59% | | 0.60% | | 0.60% | | 0.60% |
| 0.72% | | 0.73% | | 0.68% | | 0.68% | | 0.68% |
| 3.77% | | 3.14% | | 2.50% | | 2.55% | | 2.78% |
| 3.63% | | 3.00% | | 2.42% | | 2.47% | | 2.70% |
| 27% | | 35% | | 24% | | 3% | | 15% |
Notes to financial statements
| Delaware Funds by Macquarie® Minnesota municipal bond funds | August 31, 2024 |
Voyageur Mutual Funds is organized as a Delaware statutory trust and offers five series: Delaware Minnesota High-Yield Municipal Bond Fund, Delaware National High-Yield Municipal Bond Fund, Delaware Tax-Free California Fund, Delaware Tax-Free Idaho Fund, and Delaware Tax-Free New York Fund. Voyageur Tax Free Funds is organized as a Delaware statutory trust and offers Delaware Tax-Free Minnesota Fund. Voyageur Mutual Funds and Voyageur Tax Free Funds, are each referred to as a Trust, or collectively, as the Trusts. These financial statements and the related notes pertain to Delaware Minnesota High-Yield Municipal Bond Fund and Delaware Tax-Free Minnesota Fund (each, a Fund, or collectively, the Funds). Each Trust is an open-end investment company. Each Fund is considered diversified under the Investment Company Act of 1940, as amended (1940 Act), and offers Class A, Class C, and Institutional Class shares. Class A shares are sold with a maximum front-end sales charge of 4.50%. There is no front-end sales charge when you purchase $250,000 or more of Class A shares. However, if Delaware Distributors, L.P. (DDLP) paid your financial intermediary a commission on your purchase of $250,000 or more of Class A shares, you will have to pay a limited contingent deferred sales charge (Limited CDSC) of 1.00% if you redeem these shares within the first 18 months after your purchase, unless a specific waiver of the Limited CDSC applies. Class C shares have no upfront sales charge, but are sold with a contingent deferred sales charge (CDSC) of 1.00%, which will be incurred if redeemed during the first 12 months. Institutional Class shares are not subject to a sales charge and are offered for sale exclusively to certain eligible investors.
1. Significant Accounting Policies
Each Fund follows accounting and reporting guidance under Financial Accounting Standards Board (FASB) Accounting Standards Codification Topic 946, Financial Services — Investment Companies. The following accounting policies are in accordance with US generally accepted accounting principles (US GAAP) and are consistently followed by the Funds.
Security Valuation — Fixed income securities are generally priced based upon valuations provided by an independent pricing service or broker in accordance with methodologies included within Delaware Management Company (DMC)'s Pricing Policy (the Policy). Fixed income security valuations are then reviewed by DMC as part of its duties as each Fund’s valuation designee (Valuation Designee) and, to the extent required by the Policy and applicable regulation, fair valued consistent with the Policy. To the extent current market prices are not available, the pricing service may take into account developments related to the specific security, as well as transactions in comparable securities. Valuations for fixed income securities utilize matrix systems, which reflect such factors as security prices, yields, maturities, and ratings, and are supplemented by dealer and exchange quotations. Investments for which market quotations are not readily available are valued at fair value as determined in good faith pursuant to Rule 2a-5 under the 1940 Act (Rule 2a-5). As a general principle, the fair value of a security or other asset is the price that would be received to sell an asset or paid to transfer a liability in an orderly transaction between market participants at the measurement date. Pursuant to Rule 2a-5, the Board of Trustees (Board) has designated DMC as the Valuation Designee for
each Fund to perform the fair value determination relating to all applicable Fund investments. DMC has established a Pricing Committee to assist with its designated responsibilities as Valuation Designee, and DMC may carry out its designated responsibilities as Valuation Designee through the Pricing Committee and other teams and committees, which operate under policies and procedures approved by the Board and subject to the Board's oversight. Fair value pricing may be used more frequently for securities traded primarily in non-US markets. In considering whether fair valuation is required and in determining fair values, the Valuation Designee may, among other things, consider significant events (which may be considered to include changes in the value of US securities or securities indexes) that occur after the close of the relevant market and before the close of the New York Stock Exchange. The Valuation Designee may utilize modeling tools provided by third-party vendors to determine fair values of non-US securities.
Federal Income Taxes — No provision for federal income taxes has been made as each Fund intends to continue to qualify for federal income tax purposes as a regulated investment company under Subchapter M of the Internal Revenue Code of 1986, as amended, and make the requisite distributions to shareholders. Each Fund evaluates tax positions taken or expected to be taken in the course of preparing each Fund’s tax returns to determine whether the tax positions are “more-likely-than-not” of being sustained by the applicable tax authority. Tax positions not deemed to meet the “more-likely-than-not” threshold are recorded as a tax benefit or expense in the current year. Management has analyzed each Fund’s tax positions taken or expected to be taken on each Fund’s federal income tax returns through the year ended August 31, 2024, and for all open tax years (years ended August 31, 2021–August 31, 2023), and has concluded that no provision for federal income tax is required in each Fund’s financial statements. If applicable, each Fund recognizes interest accrued on unrecognized tax benefits in interest expense and penalties in “Other” on the “Statements of operations.” During the year ended August 31, 2024, the Funds did not incur any interest or tax penalties.
Class Accounting — Investment income and common expenses are allocated to the various classes of each Fund on the basis of “settled shares” of each class in relation to the net assets of each Fund. Realized and unrealized gain (loss) on investments are allocated to the various classes of each Fund on the basis of daily net assets of each class. Distribution expenses relating to a specific class are charged directly to that class.
Use of Estimates — The preparation of financial statements in conformity with US GAAP requires management to make estimates and assumptions that affect the fair value of investments, the reported amounts of assets and liabilities and disclosure of contingent assets and liabilities at the date of the financial statements, and the reported amounts of revenues and expenses during the reporting period. Actual results could differ from those estimates and the differences could be material.
Other — Expenses directly attributable to a Fund are charged directly to each Fund. Other expenses common to various funds within the Delaware Funds by Macquarie® (Delaware Funds) are generally allocated among such funds on the basis of average net assets. Management fees
Notes to financial statements
Delaware Funds by Macquarie® Minnesota municipal bond funds
1. Significant Accounting Policies (continued)
and certain other expenses are paid monthly. Security transactions are recorded on the date the securities are purchased or sold (trade date) for financial reporting purposes. Costs used in calculating realized gains and losses on the sale of investment securities are those of the specific securities sold. Interest income is recorded on an accrual basis. Discounts and premiums on debt securities are accreted or amortized to interest income, respectively, over the lives of the respective securities using the effective interest method. Premiums on callable debt securities are amortized to interest income to the earliest call date using the effective interest method. Each Fund declares dividends daily from net investment income and pays the dividends monthly and declares and pays distributions from net realized gain on investments, if any, at least annually. Each Fund may distribute more frequently, if necessary for tax purposes. Dividends and distributions, if any, are recorded on the ex-dividend date.
Each Fund receives earnings credits from its custodian when positive cash balances are maintained, which may be used to offset custody fees. The expenses paid under this arrangement are included on the “Statements of operations” under “Custodian fees” with the corresponding expenses offset included under “Less expenses paid indirectly.” For the year ended August 31, 2024, each Fund earned the following amounts under this arrangement:
| Fund | | Custody credits |
| Delaware Minnesota High-Yield Municipal Bond Fund | | $2,052 |
| Delaware Tax-Free Minnesota Fund | | 4,618 |
Each Fund receives earnings credits from its transfer agent when positive cash balances are maintained, which may be used to offset transfer agent fees. If the amount earned is greater than $1, the expenses paid under this arrangement are included on the “Statements of operations” under “Dividend disbursing and transfer agent fees and expenses” with the corresponding expenses offset included under “Less expenses paid indirectly.” For the year ended August 31, 2024, each Fund earned the following amounts under this arrangement:
| Fund | | Earnings Credits |
| Delaware Minnesota High-Yield Municipal Bond Fund | | $36 |
| Delaware Tax-Free Minnesota Fund | | 207 |
2. Investment Management, Administration Agreements, and Other Transactions with Affiliates
In accordance with the terms of its respective investment management agreement, each Fund pays DMC, a series of Macquarie Investment Management Business Trust (MIMBT) and the investment managers, an annual fee which is calculated daily and paid monthly based on each Fund's average daily net assets as follows:
| | Delaware Minnesota
High-Yield Municipal
Bond Fund | | Delaware Tax-Free
Minnesota Fund |
| On the first $500 million | 0.5500% | | 0.5500% |
| On the next $500 million | 0.5000% | | 0.5000% |
| On the next $1.5 billion | 0.4500% | | 0.4500% |
| In excess of $2.5 billion | 0.4250% | | 0.4250% |
DMC has contractually agreed to waive all or a portion of its investment advisory fees and/or pay/reimburse expenses (excluding any distribution and service (12b-1) fees, acquired fund fees and expenses, taxes, interest, inverse floater program expenses, short sale dividend and interest expenses, brokerage fees, certain insurance costs, and nonroutine expenses or costs, including, but not limited to, those relating to reorganizations, litigation, conducting shareholder meetings, and liquidations), in order to prevent total annual fund operating expenses from exceeding the following percentages of each Fund’s average daily net assets from September 1, 2023 (except as noted) through December 30, 2024 (except as noted). These waivers and reimbursements may only be terminated by agreement of DMC and the Funds. The waivers and reimbursements are accrued daily and received monthly.
| Fund | | Operating expense
limitation as
a percentage
of average
daily net assets |
| Delaware Minnesota High-Yield Municipal Bond Fund | | 0.59%* |
| Delaware Tax-Free Minnesota Fund | | 0.56%** |
| * | Effective December 29, 2023. Prior to December 29, 2023, the expense limitation for Delaware Minnesota High-Yield Municipal Bond Fund was 0.61%. |
| ** | From June 7, 2024 to December 29, 2025. Prior to June 7, 2024, the expense limitation for Delaware Tax-Free Minnesota Fund was 0.59%. |
After consideration of class specific expenses, including 12b-1 fees, the class level operating expense limitation as a percentage of average daily net assets from September 1, 2023 (except
Notes to financial statements
Delaware Funds by Macquarie® Minnesota municipal bond funds
2. Investment Management, Administration Agreements, and Other Transactions with Affiliates (continued)
as noted) through December 30, 2024 (except as noted), unless terminated by agreement of DMC and the Funds, is as follows:
| | | Operating expense limitation as a percentage of average daily net assets |
| Fund | | Class A | | Class C | | Institutional Class |
| Delaware Minnesota High-Yield Municipal Bond Fund | | 0.84%* | | 1.59%* | | 0.59%* |
| Delaware Tax-Free Minnesota Fund | | 0.81%** | | 1.56%** | | 0.56%** |
| * | Effective December 29, 2023. Prior to December 29, 2023, the expense limitation for Delaware Minnesota High-Yield Municipal Bond Fund were as follows for Class A, Class C, and Institutional Class, respectively: 0.86%, 1.61%, and 0.61%. |
| ** | From June 7, 2024 to December 29, 2025. Prior to June 7, 2024, the expense limitation for Delaware Tax-Free Minnesota Fund were as follows for Class A, Class C, and Institutional Class, respectively: 0.84%, 1.59%, and 0.59%. |
Delaware Investments Fund Services Company (DIFSC), an affiliate of DMC, provides fund accounting and financial administrative oversight services to each Fund. For these services, effective October 1, 2023, DIFSC’s fees are calculated daily and paid monthly, based on the aggregate daily net assets of all funds within the Delaware Funds at the following annual rates: 0.0050% of the first $60 billion; 0.00475% of the next $30 billion; and 0.0015% of aggregate average daily net assets in excess of $90 billion (Total Fee). Prior to October 1, 2023, DIFSC’s annual rates were: 0.00475% of the first $35 billion; 0.0040% of the next $10 billion; 0.0025% of the next $45 billion; and 0.0015% of aggregate average daily net assets in excess of $90 billion. Each fund in the Delaware Funds pays a minimum of $4,000, which, in aggregate, is subtracted from the Total Fee. Each fund then pays its portion of the remainder of the Total Fee on a relative net asset value (NAV) basis. These amounts are included on the “Statements of operations” under “Accounting and administration expenses.” For the year ended August 31, 2024, each Fund paid for these services as follows:
| Fund | | Fees |
| Delaware Minnesota High-Yield Municipal Bond Fund | | $12,801 |
| Delaware Tax-Free Minnesota Fund | | 25,151 |
DIFSC is also the transfer agent and dividend disbursing agent of each Fund. For these services, DIFSC’s fees are calculated daily and paid monthly, based on the aggregate daily net assets of the retail funds within the Delaware Funds at the following annual rates: 0.014% of the first $20 billion; 0.011% of the next $5 billion; 0.007% of the next $5 billion; 0.004% of the next $20 billion; 0.002% of the next $25 billion; and 0.0015% of average daily net assets in excess of $75 billion. The fees payable to DIFSC under the shareholder services agreement described
above are allocated among all retail funds in the Delaware Funds on a relative NAV basis. These amounts are included on the “Statements of operations” under “Dividend disbursing and transfer agent fees and expenses.” For the year ended August 31, 2024, each Fund paid for these services as follows:
| Fund | | Fees |
| Delaware Minnesota High-Yield Municipal Bond Fund | | $13,517 |
| Delaware Tax-Free Minnesota Fund | | 32,485 |
Pursuant to a sub-transfer agency agreement between DIFSC and BNY Mellon Investment Servicing (US) Inc. (BNYIS), BNYIS provides certain sub-transfer agency services to each Fund. Sub-transfer agency fees are paid by each Fund and are also included on the “Statements of operations” under “Dividend disbursing and transfer agent fees and expenses.” The fees are calculated daily and paid as invoices on a monthly or quarterly basis.
Pursuant to a distribution agreement and distribution plan, each Fund pays DDLP, the distributor and an affiliate of DMC, an annual 12b-1 fee of 0.25%, and 1.00% of the average daily net assets of the Class A, and Class C shares, respectively. The fees are calculated daily and paid monthly. Institutional Class shares do not pay a 12b-1 fee.
As provided in the investment management agreement, each Fund bears a portion of the cost of certain resources shared with DMC, including the cost of internal personnel of DMC and/or its affiliates that provide legal and regulatory reporting services to the Funds. These amounts are included on the “Statements of operations” under “Legal fees.” For the year ended August 31, 2024, each Fund paid for internal legal and regulatory reporting services provided by DMC and/or its affiliates’ employees as follows:
| Fund | | Fees |
| Delaware Minnesota High-Yield Municipal Bond Fund | | $6,012 |
| Delaware Tax-Free Minnesota Fund | | 15,493 |
For the year ended August 31, 2024, DDLP earned commissions on sales of Class A shares for each Fund as follows:
| Fund | | Class A |
| Delaware Minnesota High-Yield Municipal Bond Fund | | $5,700 |
| Delaware Tax-Free Minnesota Fund | | 5,598 |
For the year ended August 31, 2024, DDLP received gross CDSC commissions on redemptions of each Fund’s Class A and Class C shares, and these commissions were entirely used to offset upfront commissions previously paid by DDLP to broker/dealers on sales of those shares. The amounts received were as follows:
| Fund | | Class A | | Class C |
| Delaware Minnesota High-Yield Municipal Bond Fund | | $3,448 | | $103 |
| Delaware Tax-Free Minnesota Fund | | 7,113 | | 623 |
Notes to financial statements
Delaware Funds by Macquarie® Minnesota municipal bond funds
2. Investment Management, Administration Agreements, and Other Transactions with Affiliates (continued)
Trustees’ fees include expenses accrued by each Fund for each Trustee’s retainer and meeting fees. Certain officers of DMC, DIFSC, and DDLP are officers and/or Trustees of the Trusts. These officers and Trustees are paid no compensation by the Funds.
3. Investments
For the year ended August 31, 2024, each Fund made purchases and sales of investment securities other than short-term investments and US government securities as follows:
| Fund | | Purchases | | Sales |
| Delaware Minnesota High-Yield Municipal Bond Fund | | $46,198,217 | | $39,067,749 |
| Delaware Tax-Free Minnesota Fund | | 133,187,939 | | 144,293,724 |
The tax cost of investments includes adjustments to net unrealized appreciation (depreciation) which may not necessarily be the final tax cost basis adjustments but which approximate the tax basis unrealized gains and losses that may be realized and distributed to shareholders. At August 31, 2024, the cost and unrealized appreciation (depreciation) of investments for federal income tax purposes for each Fund were as follows:
| Fund | | Cost of
investments | | Aggregate
unrealized
appreciation
of investments | | Aggregate
unrealized
depreciation
of investments | | Net unrealized
appreciation
(depreciation)
of investments |
| Delaware Minnesota High-Yield Municipal Bond Fund | | $225,976,166 | | $3,464,094 | | $(8,184,193) | | $(4,720,099) |
| Delaware Tax-Free Minnesota Fund | | 550,741,508 | | 9,658,309 | | (14,532,621) | | (4,874,312) |
US GAAP defines fair value as the price that each Fund would receive to sell an asset or pay to transfer a liability in an orderly transaction between market participants at the measurement date under current market conditions. A three-level hierarchy for fair value measurements has been established based upon the transparency of inputs to the valuation of an asset or liability. Inputs may be observable or unobservable and refer broadly to the assumptions that market participants would use in pricing the asset or liability. Observable inputs reflect the assumptions market participants would use in pricing the asset or liability based on market data obtained from sources independent of the reporting entity. Unobservable inputs reflect the reporting entity’s own assumptions about the assumptions that market participants would use in pricing the asset or liability based on the best information available under the circumstances. Each Fund’s
investment in its entirety is assigned a level based upon the observability of the inputs which are significant to the overall valuation. The three-level hierarchy of inputs is summarized as follows:
Level 1 − Inputs are quoted prices in active markets for identical investments. (Examples: equity securities, open-end investment companies, futures contracts, and exchange-traded options contracts)
Level 2 − Other observable inputs, including, but not limited to: quoted prices for similar assets or liabilities in markets that are active, quoted prices for identical or similar assets or liabilities in markets that are not active, inputs other than quoted prices that are observable for the assets or liabilities (such as interest rates, yield curves, volatilities, prepayment speeds, loss severities, credit risks, and default rates) or other market-corroborated inputs. (Examples: debt securities, government securities, swap contracts, forward foreign currency exchange contracts, foreign securities utilizing international fair value pricing, broker-quoted securities, and fair valued securities)
Level 3 − Significant unobservable inputs, including each Fund’s own assumptions used to determine the fair value of investments. (Examples: broker-quoted securities and fair valued securities)
Level 3 investments are valued using significant unobservable inputs. Each Fund may also use an income-based valuation approach in which the anticipated future cash flows of the investment are discounted to calculate fair value. Discounts may also be applied due to the nature or duration of any restrictions on the disposition of the investments. Valuations may also be based upon current market prices of securities that are comparable in coupon, rating, maturity, and industry. The derived value of a Level 3 investment may not represent the value which is received upon disposition and this could impact the results of operations.
The following tables summarize the valuation of each Fund’s investments by fair value hierarchy levels as of August 31, 2024:
| | Delaware Minnesota High-Yield Municipal Bond Fund |
| | Level 2 |
| Securities | |
| Assets: | |
| Municipal Bonds | $219,256,067 |
| Short-Term Investments | 2,000,000 |
| Total Value of Securities | $221,256,067 |
Notes to financial statements
Delaware Funds by Macquarie® Minnesota municipal bond funds
3. Investments (continued)
| | Delaware Tax-Free Minnesota Fund |
| | Level 2 |
| Securities | |
| Assets: | |
| Municipal Bonds | $541,197,196 |
| Short-Term Investments | 4,670,000 |
| Total Value of Securities | $545,867,196 |
During the year ended August 31, 2024, there were no transfers into or out of Level 3 investments. Each Fund’s policy is to recognize transfers into or out of Level 3 investments based on fair value at the beginning of the reporting year.
A reconciliation of Level 3 investments is presented when a Fund has a significant amount of Level 3 investments at the beginning or end of the year in relation to that Fund’s net assets. As of August 31, 2024, there were no Level 3 investments in either of the Funds.
4. Dividend and Distribution Information
Income and long-term capital gain distributions are determined in accordance with federal income tax regulations, which may differ from US GAAP. Additionally, distributions from net short-term gains on sales of investment securities are treated as ordinary income for federal income tax purposes. The tax character of dividends and distributions paid during the years ended August 31, 2024 and 2023 were as follows:
| | | Tax-exempt
income | | Ordinary
income | Total | |
| Year ended August 31, 2024: | | | | | | |
Delaware Minnesota High-Yield Municipal
Bond Fund | | $7,787,024 | | $2,533 | $7,789,557 | |
| Delaware Tax-Free Minnesota Fund | | 17,128,634 | | 9,075 | 17,137,709 | |
| |
| Year ended August 31, 2023: | | | | | | |
Delaware Minnesota High-Yield Municipal
Bond Fund | | 7,115,273 | | 2,013 | 7,117,286 | |
| Delaware Tax-Free Minnesota Fund | | 15,458,644 | | 3,228 | 15,461,872 | |
5. Components of Net Assets on a Tax Basis
As of August 31, 2024, the components of net assets on a tax basis were as follows:
| | Delaware Minnesota
High-Yield Municipal
Bond Fund | | Delaware Tax-Free
Minnesota Fund |
| Shares of beneficial interest | $237,535,727 | | $587,691,755 |
| Undistributed tax-exempt income | 20,098 | | 67,312 |
| Distributions payable | (20,098) | | (261,319) |
| Capital loss carryforwards | (9,109,297) | | (31,731,299)* |
| Unrealized appreciation (depreciation) of investments | (4,720,099) | | (4,874,312) |
| Net assets | $223,706,331 | | $550,892,137 |
| * | A portion of the Fund’s capital loss carryforward is subject to limitations under the Internal Revenue Code and related regulations. |
The differences between book basis and tax basis components of net assets are primarily attributable to tax treatment of market discount and premium on debt instruments and tax deferral of losses on wash sales, as applicable.
For financial reporting purposes, capital accounts are adjusted to reflect the tax character of permanent book/tax differences. Reclassifications are primarily due to reorganization-related adjustments. Results of operations and net assets were not affected by these reclassifications. For the year ended August 31, 2024, the Fund recorded the following reclassifications:
| | Paid-in capital | | Total distributable earnings (loss) |
| Delaware Tax-Free Minnesota Fund | $4,619,780 | | (4,619,780) |
For federal income tax purposes, capital loss carryforwards may be carried forward and applied against future capital gains. At August 31, 2024, each Fund has capital loss carryforwards available to offset future realized capital gains as follows:
| | Loss carryforward character | | |
| | Short-term | | Long-term | | Total |
Delaware Minnesota
High-Yield Municipal
Bond Fund | $ 4,099,222 | | $5,010,075 | | $ 9,109,297 |
Notes to financial statements
Delaware Funds by Macquarie® Minnesota municipal bond funds
5. Components of Net Assets on a Tax Basis (continued)
| | Loss carryforward character | | |
| | Short-term | | Long-term | | Total |
Delaware Tax-Free
Minnesota Fund | $8,300,927 | | $23,430,372 | | $31,731,299 |
6. Capital Shares
Transactions in capital shares were as follows:
| | Delaware Minnesota
High-Yield Municipal
Bond Fund | | Delaware Tax-Free
Minnesota Fund |
| | Year ended | | Year ended |
| | 8/31/24 | | 8/31/23 | | 8/31/24 | | 8/31/23 |
| Shares sold: |
| Class A | 1,542,323 | | 2,520,760 | | 4,345,639 | | 6,212,711 |
| Class C | 197,442 | | 142,713 | | 65,090 | | 131,667 |
| Institutional Class | 5,531,303 | | 5,729,835 | | 8,256,343 | | 11,868,644 |
|
| Shares from reorganization:1 |
| Class A | — | | — | | 3,288,850 | | — |
| Class C | — | | — | | 121,344 | | — |
| Institutional Class | — | | — | | 1,513,443 | | — |
|
| Shares issued upon reinvestment of dividends and distributions: |
| Class A | 312,191 | | 314,143 | | 764,922 | | 728,413 |
| Class C | 23,190 | | 25,248 | | 17,935 | | 20,362 |
| Institutional Class | 434,308 | | 371,678 | | 506,450 | | 385,083 |
| | 8,040,757 | | 9,104,377 | | 18,880,016 | | 19,346,880 |
|
| Shares redeemed: |
| Class A | (2,467,241) | | (3,176,663) | | (7,314,948) | | (9,555,213) |
| Class C | (299,722) | | (460,254) | | (353,286) | | (494,878) |
| Institutional Class | (4,397,921) | | (5,882,046) | | (7,288,776) | | (12,230,968) |
| | (7,164,884) | | (9,518,963) | | (14,957,010) | | (22,281,059) |
| Net increase (decrease) | 875,873 | | (414,586) | | 3,923,006 | | (2,934,179) |
Certain shareholders may exchange shares of one class for shares of another class in the same Fund. These exchange transactions are included in shares sold and shares redeemed in the table on the previous page and on the “Statements of changes in net assets.” For the years ended August 31, 2024 and 2023, each Fund had the following exchange transactions:
| | Exchange Redemptions | | Exchange Subscriptions | | |
| | Class A
Shares | | Class C
Shares | | Institutional
Class
Shares | | Class A
Shares | | Institutional
Class
Shares | | Value |
| |
| Delaware Minnesota High-Yield Municipal Bond Fund | |
| Year ended | |
| 8/31/24 | 913 | | 7,216 | | — | | 7,237 | | 914 | | $81,746 |
| 8/31/23 | 226 | | 13,236 | | 39 | | 13,317 | | 226 | | 133,068 |
| |
| Delaware Tax-Free Minnesota Fund | |
| Year ended | |
| 8/31/24 | 117,787 | | 26,975 | | 2,262 | | 29,356 | | 117,844 | | 1,645,622 |
| 8/31/23 | 133,658 | | 29,308 | | 1,304 | | 20,971 | | 143,436 | | 1,824,634 |
7. Reorganization
On January 16, 2024, the Board approved a proposal to reorganize Delaware Tax-Free Minnesota Intermediate Fund (the “Acquired Fund”), a series of Voyageur Intermediate Tax Free Funds, with and into Delaware Tax-Free Minnesota Fund (the “Acquiring Fund”), a series of Voyageur Tax Free Funds (the “Trust”) (the “Reorganization”). Acquired Fund shareholders approved the Reorganization on April 30, 2024. Pursuant to an Agreement and Plan of Reorganization (the “Plan”): (i) all of the property, and assets of the Acquired Fund were acquired by the Acquiring Fund and (ii) the Trust, on behalf of the Acquiring Fund, assumed the liabilities of the Acquired Fund, in exchange for shares of the Acquiring Fund. In accordance with the Plan, the Acquired Fund liquidated and dissolved following the Reorganization. In approving the Reorganization, the Board considered various factors, including that the Acquiring Fund and the Acquired Fund share substantially similar investment objectives, principal investment strategies and principal risks, and identical fundamental investment restrictions and that the Acquiring Fund's overall total expense ratio is expected to be equal to the corresponding Acquired Fund's total expense ratio following the Reorganization taking into account applicable expense limitation arrangements. The Reorganization was accomplished by a tax-free exchange of shares on June 7, 2024. For financial reporting purposes, assets received and shares issued by the Acquiring Fund were recorded at fair value; however, the cost basis of the investments received from the Acquired Fund was carried forward to align ongoing reporting of the Acquiring Fund’s realized and unrealized gains and losses with amounts distributable to shareholders for tax purposes.
Notes to financial statements
Delaware Funds by Macquarie® Minnesota municipal bond funds
7. Reorganization (continued)
The share transaction information associated with the Reorganization were as follows:
| | Acquired
Fund
Net Assets | | Acquired
Fund Shares
Outstanding | | Shares
Converted
to Acquiring
Fund | | Acquiring
Fund
Net Assets | | Conversion
Ratio |
| Class A | $36,670,677 | | 3,652,458 | | 3,288,850 | | $263,737,066 | | 0.9004 |
| Class C | 1,357,835 | | 134,974 | | 121,344 | | 6,657,955 | | 0.8990 |
| Institutional Class | 16,874,887 | | 1,680,766 | | 1,513,443 | | 216,560,383 | | 0.9004 |
The net assets of the Acquired Fund before the Reorganization were $54,922,004. The Acquired Fund net assets and shares outstanding presented on the table above do not include the shareholders that did not participate in the Reorganization. The net assets of the Acquiring Fund immediately following the Reorganization were $541,858,803.
Assuming the Reorganization had been completed on September 1, 2023, the Acquiring Fund's pro forma results of operations for the year ended August 31, 2024, would have been as follows:
| Net investment income | $19,427,043 |
| Net realized loss on investments | (7,107,416) |
| Net change in unrealized appreciation (depreciation) | 24,932,554 |
| Net increase in net assets resulting from operations | $37,252,181 |
Because the combined investment portfolios have been managed as a single integrated portfolio since the Reorganization was completed, it is not practical to separate the amounts of revenue and earnings of the Acquired Fund that have been included in the Acquiring Fund’s “Statements of operations” since the Reorganization was consummated on June 7, 2024.
8. Line of Credit
Each Fund, along with certain other funds in the Delaware Funds (Participants), was a participant in a $355,000,000 revolving line of credit (Agreement) intended to be used for temporary or emergency purposes as an additional source of liquidity to fund redemptions of investor shares. Under the Agreement, the Participants were charged an annual commitment fee of 0.15%, which was allocated across the Participants based on a weighted average of the respective net assets of each Participant. The Participants were permitted to borrow up to a maximum of one-third of their net assets under the Agreement. Each Participant was individually, and not jointly, liable for its particular advances, if any, under the line of credit. The line of credit available under the Agreement expired on October 30, 2023.
On October 30, 2023, each Fund, along with the other Participants, entered into an amendment to the Agreement for a $335,000,000 revolving line of credit to be used as described above. It operates in substantially the same manner as the original Agreement. Under the amendment to the Agreement, the Participants are charged an annual commitment fee of 0.15%, which is
allocated across the Participants based on a weighted average of the respective net assets of each Participant. The line of credit available under the Agreement expires on October 28, 2024.
Each Fund had no amounts outstanding as of August 31, 2024, or at any time during the year then ended.
9. Securities Lending
Each Fund, along with other funds in the Delaware Funds, may lend its securities pursuant to a security lending agreement (Lending Agreement) with The Bank of New York Mellon (BNY). At the time a security is loaned, the borrower must post collateral equal to the required percentage of the market value of the loaned security, including any accrued interest. The required percentage is: (1) 102% with respect to US securities and foreign securities that are denominated and payable in US dollars; and (2) 105% with respect to foreign securities. With respect to each loan, if on any business day the aggregate market value of securities collateral plus cash collateral held is less than the aggregate market value of the securities which are the subject of such loan, the borrower will be notified to provide additional collateral by the end of the following business day, which, together with the collateral already held, will be not less than the applicable initial collateral requirements for such security loan. If the aggregate market value of securities collateral and cash collateral held with respect to a security loan exceeds the applicable initial collateral requirement, upon the request of the borrower, BNY must return enough collateral to the borrower by the end of the following business day to reduce the value of the remaining collateral to the applicable initial collateral requirement for such security loan. As a result of the foregoing, the value of the collateral held with respect to a loaned security on any particular day, may be more or less than the value of the security on loan. The collateral percentage with respect to the market value of the loaned security is determined by the security lending agent.
Cash collateral received by each Fund of the Trust is generally invested in a series of individual separate accounts, each corresponding to a fund. The investment guidelines permit each separate account to hold certain securities that would be considered eligible securities for a money market fund. Cash collateral received is generally invested in government securities; certain obligations issued by government sponsored enterprises; repurchase agreements collateralized by US Treasury securities; obligations issued by the central government of any Organization for Economic Cooperation and Development (OECD) country or its agencies, instrumentalities, or establishments; obligations of supranational organizations; commercial paper, notes, bonds, and other debt obligations; certificates of deposit, time deposits, and other bank obligations; certain money market funds; and asset-backed securities. Each Fund can also accept US government securities and letters of credit (non-cash collateral) in connection with securities loans.
In the event of default or bankruptcy by the lending agent, realization and/or retention of the collateral may be subject to legal proceedings. In the event the borrower fails to return loaned securities and the collateral received is insufficient to cover the value of the loaned securities and
Notes to financial statements
Delaware Funds by Macquarie® Minnesota municipal bond funds
9. Securities Lending (continued)
provided such collateral shortfall is not the result of investment losses, the lending agent has agreed to pay the amount of the shortfall to each Fund or, at the discretion of the lending agent, replace the loaned securities. Each Fund continues to record dividends or interest, as applicable, on the securities loaned and is subject to changes in value of the securities loaned that may occur during the term of the loan. Each Fund has the right under the Lending Agreement to recover the securities from the borrower on demand. With respect to security loans collateralized by non-cash collateral, each Fund receives loan premiums paid by the borrower. With respect to security loans collateralized by cash collateral, the earnings from the collateral investments are shared among each Fund, the security lending agent, and the borrower. Each Fund records security lending income net of allocations to the security lending agent and the borrower.
Each Fund may incur investment losses as a result of investing securities lending collateral. This could occur if an investment in each collateral investment account defaulted or became impaired. Under those circumstances, the value of each Fund’s cash collateral account may be less than the amount each Fund would be required to return to the borrowers of the securities and each Fund would be required to make up for this shortfall.
During the year ended August 31, 2024, each Fund had no securities out on loan.
10. Geographic, Credit and Market Risks
The impact of COVID-19, and other infectious illness outbreaks that may arise in the future, could adversely affect the economies of many nations or the entire global economy, individual issuers and capital markets in ways that cannot necessarily be foreseen.
When interest rates rise, fixed income securities (i.e. debt obligations) generally will decline in value. These declines in value are greater for fixed income securities with longer maturities or durations. Interest rate changes are influenced by a number of factors, such as government policy, monetary policy, inflation expectations, and the supply and demand of bonds. A fund may be subject to a greater risk of rising interest rates when interest rates are low or inflation rates are high or rising.
The Funds concentrate their investments in securities issued by municipalities, mainly in Minnesota, and are subject to geographic concentration risk. In addition, the Funds have the flexibility to invest in issuers in US territories and possessions such as the Commonwealth of Puerto Rico, the US Virgin Islands, and Guam, whose bonds are also free of federal and individual state income taxes.
Each Fund invests in certain obligations that may have liquidity protection designed to ensure that the receipt of payments due on the underlying security is timely. Such protection may be provided through guarantees, insurance policies, or letters of credit obtained by the issuer or sponsor through third parties, through various means of structuring the transaction, or through a combination of such approaches. Each Fund will not pay any additional fees for such credit support, although the existence of credit support may increase the price of a security.
From time to time, each Fund may invest in industrial development bonds (IDBs) or pollution control revenue (PCR) bonds that are issued by a conduit authority on behalf of a corporation that is either foreign owned or has international affiliates or operations. While the bonds may be issued to finance a facility located in the US, the bonds may be secured by a payment obligation or guaranty of the corporation. To the extent each Fund invests in such securities, that Fund may be exposed to risks associated with international investments. The risk of international investments not ordinarily associated with US investments includes fluctuation in currency values, differences in accounting principles, and/or economic or political instability in other nations.
Each Fund may invest in advance refunded bonds, escrow secured bonds, or defeased bonds. Under current federal tax laws and regulations, state and local government borrowers are permitted to refinance outstanding bonds by issuing new bonds. The issuer refinances the outstanding debt to either reduce interest costs or to remove or alter restrictive covenants imposed by the bonds being refinanced. A refunding transaction where the municipal securities are being refunded within 90 days from the issuance of the refunding issue is known as a “current refunding.” “Advance refunded bonds’’ are bonds in which the refunded bond issue remains outstanding for more than 90 days following the issuance of the refunding issue. In an advance refunding, the issuer will use the proceeds of a new bond issue to purchase high grade interest-bearing debt securities, which are then deposited in an irrevocable escrow account held by an escrow agent to secure all future payments of principal and interest and bond premium of the advance refunded bond. Bonds are “escrowed to maturity” when the proceeds of the refunding issue are deposited in an escrow account for investment sufficient to pay all of the principal and interest on the original interest payment and maturity dates.
Bonds are considered “pre-refunded” when the refunding issuer’s proceeds are escrowed only until a permitted call date or dates on the refunded issue with the refunded issue being redeemed at the time, including any required premium. Bonds become “defeased” when the rights and interests of the bondholders and of their lien on the pledged revenues or other security under the terms of the bond contract are substituted with an alternative source of revenues (the escrow securities) sufficient to meet payments of principal and interest to maturity or to the first call dates. Escrowed secured bonds will often receive a rating of AAA from Moody’s, S&P, and/or Fitch Ratings due to the strong credit quality of the escrow securities and the irrevocable nature of the escrow deposit agreement.
Each Fund may invest up to 15% of its net assets in illiquid securities, which may include securities with contractual restrictions on resale, securities exempt from registration under Rule 144A promulgated under the Securities Act of 1933, as amended, and other securities which may not be readily marketable. The relative illiquidity of these securities may impair each Fund from disposing of them in a timely manner and at a fair price when it is necessary or desirable to do so. While maintaining oversight, the Board has delegated to DMC the day-to-day functions of determining whether individual securities are liquid for purposes of each Fund’s limitation on investments in illiquid securities. Securities eligible for resale pursuant to Rule 144A,
Notes to financial statements
Delaware Funds by Macquarie® Minnesota municipal bond funds
10. Geographic, Credit and Market Risks (continued)
which are determined to be liquid, are not subject to each Fund’s 15% limit on investments in illiquid securities. Rule 144A securities have been identified on the “Schedules of investments.”
11. Contractual Obligations
Each Fund enters into contracts in the normal course of business that contain a variety of indemnifications. Each Fund’s maximum exposure under these arrangements is unknown. However, each Fund has not had prior claims or losses pursuant to these contracts. Management has reviewed each Fund’s existing contracts and expects the risk of loss to be remote.
12. Subsequent Events
On October 28, 2024, each Fund, along with the other Participants, entered into an amendment to the Agreement for a $335,000,000 revolving line of credit to be used as described in Note 8. It operates in substantially the same manner as the original Agreement. Under the amendment to the Agreement, the Participants are charged an annual commitment fee of 0.15%, which is allocated across the Participants based on a weighted average of the respective net assets of each Participant. The line of credit available under the Agreement expires on October 27, 2025.
MIMBT, of which DMC is a series, entered into a settlement agreement on September 19, 2024 with the U.S. Securities and Exchange Commission (SEC) consenting to an order (Settlement Order) relating to a legacy investment strategy, the Absolute Return Mortgage-Backed Securities Strategy (ARMBS Strategy). MIMBT no longer offers the ARMBS Strategy. MIMBT agreed to the Settlement Order without admitting or denying the SEC's findings. The Settlement Order does not impact MIMBT's ability to continue to provide services to the Funds.
Management has determined that no other material events or transactions occurred subsequent to August 31, 2024, that would require recognition or disclosure in the Funds' financial statements.
Report of independent registered public accounting firm
To the Board of Trustees of Voyageur Mutual Funds and Voyageur Tax Free Funds and Shareholders of Delaware Minnesota High-Yield Municipal Bond Fund and Delaware Tax-Free Minnesota Fund
Opinions on the Financial Statements
We have audited the accompanying statements of assets and liabilities, including the schedules of investments, of Delaware Minnesota High-Yield Municipal Bond Fund (one of the funds constituting Voyageur Mutual Funds) and Delaware Tax-Free Minnesota Fund (constituting Voyageur Tax Free Funds) (hereafter collectively referred to as the “Funds”) as of August 31, 2024, the related statements of operations for the year ended August 31, 2024, the statements of changes in net assets for each of the two years in the period ended August 31, 2024, including the related notes, and the financial highlights for each of the five years in the period ended August 31, 2024 (collectively referred to as the “financial statements”). In our opinion, the financial statements present fairly, in all material respects, the financial position of each of the Funds as of August 31, 2024, the results of each of their operations for the year then ended, the changes in each of their net assets for each of the two years in the period ended August 31, 2024 and each of the financial highlights for each of the five years in the period ended August 31, 2024 in conformity with accounting principles generally accepted in the United States of America.
Basis for Opinions
These financial statements are the responsibility of the Funds’ management. Our responsibility is to express an opinion on the Funds’ financial statements based on our audits. We are a public accounting firm registered with the Public Company Accounting Oversight Board (United States) (PCAOB) and are required to be independent with respect to the Funds in accordance with the U.S. federal securities laws and the applicable rules and regulations of the Securities and Exchange Commission and the PCAOB.
We conducted our audits of these financial statements in accordance with the standards of the PCAOB. Those standards require that we plan and perform the audit to obtain reasonable assurance about whether the financial statements are free of material misstatement, whether due to error or fraud.
Our audits included performing procedures to assess the risks of material misstatement of the financial statements, whether due to error or fraud, and performing procedures that respond to those risks. Such procedures included examining, on a test basis, evidence regarding the amounts and disclosures in the financial statements. Our audits also included evaluating the accounting principles used and significant estimates made by management, as well as evaluating the overall presentation of the financial statements. Our procedures included confirmation of securities owned as of August 31, 2024 by correspondence with the custodian and brokers; when replies were not received from brokers, we performed other auditing procedures. We believe that our audits provide a reasonable basis for our opinions.
/s/PricewaterhouseCoopers LLP
Philadelphia, Pennsylvania
October 30, 2024
We have served as the auditor of one or more Macquarie investment companies since 2010.
Other Fund information (Unaudited)
Delaware Funds by Macquarie® Minnesota municipal bond funds
Tax Information
The information set forth below is for each Fund’s fiscal year as required by federal income tax laws. Shareholders, however, must report distributions on a calendar year basis for income tax purposes, which may include distributions for portions of two fiscal years of each Fund. Accordingly, the information needed by shareholders for income tax purposes will be sent to them in January of each year. Please consult your tax advisor for proper treatment of this information.
All disclosures are based on financial information available as of the date of this report and, accordingly are subject to change. For any and all items requiring reporting, it is the intention of each Fund to report the maximum amount permitted under the Internal Revenue Code and the regulations thereunder.
For the year ended August 31, 2024, each Fund reports distributions paid during the year as follows:
| | (A)
Tax-Exempt
Distributions
(Tax Basis) | (B)
Ordinary Income
Distributions
(Tax Basis) | Total
Distributions
(Tax Basis) |
| Delaware Minnesota High-Yield Municipal Bond Fund | 99.97% | 0.03% | 100.00% |
| Delaware Tax-Free Minnesota Fund | 99.95% | 0.05% | 100.00% |
(A) and (B) are based on a percentage of each Fund’s total distributions.
Changes in and Disagreements with Accountants for Open-End Management Investment Companies
Not applicable.
Proxy Disclosures for Open-End Management Investment Companies
Not applicable.
Remuneration Paid to Directors, Officers, and Others of Open-End Management Investment Companies
The aggregate remuneration paid to directors, officers and others is disclosed within the financial statements.
Statement Regarding Basis of Approval for Investment Advisory Contract
Board Consideration of Investment Management Agreements at a Meeting Held on
August 13-15, 2024
At a meeting held on August 13-15, 2024 (the “Annual Contract Renewal Meeting”), the Board of Trustees (the “Board”), including a majority of Trustees each of whom is not an “interested person” as defined under the Investment Company Act of 1940 (the “Independent Trustees”), approved the renewal of the Delaware Tax-Free Minnesota Fund and Delaware Minnesota High-Yield Municipal Bond Fund (each, a “Fund” and together, the “Funds”) Investment Management Agreements with Delaware Management Company (“DMC”).
Prior to the Annual Contract Renewal Meeting, including at a Board meeting held in May 2024, the Trustees conferred extensively among themselves and with representatives of DMC about these matters. Also, the Board was assisted by the Equity Investments Committee and the Fixed Income Multi-Asset Sub-Advised Funds Investments Committee (each an “Investment Committee” and together, the “Investment Committees”), with each Investment Committee assisting the full Board in reviewing investment performance and other matters throughout the year. The Independent Trustees were also assisted in their evaluation of the Investment Management Agreements by independent legal counsel, from whom they received separate legal advice and with whom they met separately.
In providing information to the Board, DMC was guided by a detailed set of requests for information submitted to them by independent legal counsel on behalf of the Independent Trustees at the start of the Board’s annual contract renewal process earlier in 2024. Prior to the Annual Contract Renewal Meeting, and in response to the requests, the Board received and reviewed materials specifically relating to the renewal of the Investment Management Agreements. In considering and approving the Investment Management Agreements, the Trustees considered the information they believed relevant, including but not limited to the information discussed below. The Board considered not only the specific information presented in connection with the Annual Contract Renewal Meeting and the review process for the Investment Management Agreements, but also the knowledge gained over time through interaction with DMC about various topics. In this regard, the Board reviewed reports of DMC at each of its quarterly meetings, which included information about, among other things, Fund performance, investment strategies, and expenses. In addition, the Investment Committees confer with portfolio managers at various times throughout the year. In considering information relating to the approval of the Funds’ Investment Management Agreements, the Independent Trustees also received information from an independent fund consultant, JDL Consultants, LLC (“JDL”).
The Board did not identify any particular information or consideration that was all-important or controlling, and each individual Trustee may have attributed different weights to various factors.
After its deliberations, the Board, including the Independent Trustees, unanimously approved the continuation of the Investment Management Agreements for a one-year term. The following
Other Fund information (Unaudited)
Delaware Funds by Macquarie® Minnesota municipal bond funds
Board Consideration of Investment Management Agreements at a Meeting Held on
August 13-15, 2024
summarizes a number of important, but not necessarily all of the, factors considered by the Board in support of its approval.
Nature, extent, and quality of services. The Board received and considered various information regarding the nature, extent, and quality of the advisory services provided to the Funds by DMC under its Investment Management Agreements and the experience of the officers and employees of DMC who provide these services, including each Fund’s portfolio managers. The Board met with DMC’s senior management and investment personnel. The Board reviewed the materials provided by the Funds’ portfolio management team discussing its performance, investment strategies and outlook, as well as DMC with respect to comparing Fund performance to the performance of a comparable group of mutual funds, relevant benchmarks, and performance metrics, as applicable. The Board’s review included consideration of DMC’s investment oversight and research and analysis capabilities, and its ability to attract and retain skilled investment professionals. The Board also considered information regarding DMC’s programs for risk management, including investment, operational, liquidity, derivatives (as applicable), valuation and compliance risks and its plans for enhancing those programs (including through the allocation of additional resources and enhancements to existing processes and testing). The Board received information with respect to the cybersecurity program and business continuity plans of DMC and its affiliates, as well as information from Macquarie Group Ltd. (“Macquarie”), the parent company of DMC, regarding Macquarie’s commitment to the U.S. mutual fund business.
In addition, the Board considered certain non-advisory services that DMC and its affiliates provide to the fund complex. Among other things, these services include third party service provider oversight, transfer agency, internal audit, pricing and valuation, portfolio trading, and legal and compliance functions. The Board noted DMC’s responsibility for overseeing: the preparation of the Funds’ prospectus, summary prospectus, statement of additional information, and shareholder reports; responsibility for other periodic filings with regulators; organizing Board meetings and preparing materials for such Board meetings; and furnishing analytical and other support to assist the Board.
The Board took into account the benefits to shareholders of investing in a Fund that is part of a family of funds managed by an affiliate of Macquarie, and the resources available to DMC as part of Macquarie’s global asset management business.
The Board also received and considered information about the nature and extent of services offered and fee rates charged by DMC to other types of clients with investment strategies similar to those of the Funds. In this regard, the Board received information about the significantly greater scope of services, and compliance, reporting and other legal and regulatory obligations and risks of managing registered investment companies compared with those associated with managing assets of other types of clients, including third-party sub-advised fund clients, unregistered funds and separately managed accounts.
The Board concluded that, overall, it was satisfied with the nature, extent and quality of services provided (and expected to be provided) to the Funds by DMC.
Investment performance. The Board received and considered information with respect to the investment performance of the Funds, including performance reports and discussions with portfolio managers at meetings of the Board’s Investment Committees throughout the year as well as reports provided by Broadridge Financial Solutions, Inc., an independent investment company data provider (“Broadridge”), furnished for the Annual Contract Renewal Meeting. The Broadridge reports prepared for each Fund’s institutional share class showed its investment performance in comparison to the institutional share class of a group of similar funds (the “Performance Universe”). The Board received a description of the methodology used to select the peer funds in the Performance Universe. Comparative annualized performance for each Fund was shown for the past 1-, 3-, 5- and 10-year or since inception periods, as applicable, ended December 31, 2023.
Delaware Tax-Free Minnesota Fund. The Performance Universe for the Fund consisted of the Fund and all retail and institutional Minnesota municipal debt funds, regardless of asset size or primary channel of distribution. The Board noted that the Broadridge report comparison showed that the Fund’s total return for the 1-year period was in the third quartile of its Performance Universe, for the 3- and 5-year periods was in the second quartile of its Performance Universe and for the 10-year period was in the first quartile of its Performance Universe. The Broadridge report comparison showed that the Fund’s total return for the 1-year period was below the median of its Performance Universe and for the 3-, 5- and 10-year periods was above the median of its Performance Universe. The Board also noted that the Fund underperformed its benchmark index for the 1-, 3-, 5- and 10-year periods. The Board noted that the Fund was generally performing in line with its Performance Universe during the periods under review. The Board also noted the explanations from DMC concerning the reasons for the Fund’s relative performance versus its benchmark index for the various periods and any actions that DMC has taken to address performance concerns.
Delaware Minnesota High-Yield Municipal Bond Fund. The Performance Universe for the Fund consisted of the Fund and all retail and institutional Minnesota municipal debt funds, regardless of asset size or primary channel of distribution. The Board noted that the Broadridge report comparison showed that the Fund’s total return for the 1-, 3-, 5- and 10-year periods was in the first quartile of its Performance Universe. The Broadridge report comparison showed that the Fund’s total return for the 1-, 3-, 5-, and 10-year periods was above the median of its Performance Universe. The Board also noted that the Fund underperformed its benchmark index for the 1-, 3- and 5-year periods and was approximately equal to its benchmark index for the 10-year period. The Board noted that the Fund was generally outperforming its Performance Universe during the periods under review. The Board noted the explanations from DMC concerning the reasons for the Fund’s relative performance versus its benchmark index for the various periods and any actions that DMC has taken to address performance concerns.
Comparative expenses. The Board received and considered expense data for the Funds. DMC provided the Board with information on pricing levels and fee structures for each Fund as of its most recently completed fiscal year. The Broadridge total expenses (reflecting any applicable
Other Fund information (Unaudited)
Delaware Funds by Macquarie® Minnesota municipal bond funds
Board Consideration of Investment Management Agreements at a Meeting Held on
August 13-15, 2024
fee waivers and/or expense reimbursements), for comparative consistency, were shown by Broadridge for Institutional Class shares, including 12b 1 and non-12b 1 service fees (as applicable). The Board also considered the comparative analysis of contractual management fees and actual total expense ratios of each Fund versus contractual management fees and actual total expense ratios of a group of peer funds as selected by Broadridge (the “Expense Group”). Each Fund’s total expenses were also compared with those of its Expense Universe, which is comprised of the Fund, its Expense Group and all other similar with an institutional share class (i.e., funds without 12b-1 fees and non-12b-1 service fees) with assets equal to or greater than $100 million, excluding outliers (the “Expense Universe”). In reviewing comparative costs, each Fund’s contractual management fee and the actual management fee incurred by each Fund were compared with the contractual management fees (assuming all funds in the Expense Group were similar in size to each Fund) and actual management fees, taking into account any applicable breakpoints and fee waivers and/or expense reimbursements, with a Fund’s Expense Universe.
The Board also received and considered information regarding the Fund’s net operating expense ratios and their various components, including actual management fees, custodian and other non-management fees, and Rule 12b-1 and non-Rule 12b-1 shareholder service fees.
Delaware Tax-Free Minnesota Fund. The expense comparisons for the Fund showed that its actual management fee was below the median of its Expense Universe and its actual total expenses were above its Expense Group average. It was noted that consistent with DMC’s waiver methodology, its advisory fee waivers, if any, were at the fund level and not class level.
Delaware Minnesota High-Yield Municipal Bond Fund. The expense comparisons for the Fund showed that its actual management fee was below the median of its Expense Universe and its actual total expenses were above its Expense Group average. It was noted that consistent with DMC’s waiver methodology, its advisory fee waivers, if any, were at the fund level and not class level.
Based on its consideration of the factors and information it deemed relevant, including those described here, the Board determined that the compensation payable to DMC under the Investment Management Agreements was reasonable.
Economies of scale. The Board received and considered information about the potential for DMC to realize economies of scale in the provision of management services to the Funds, the difficulties of calculating economies of scale at an individual Fund level, and the extent to which potential scale benefits are shared with shareholders, including the extent to which any economies of scale are reflected in the level of management fees charged. DMC discussed its advisory fee pricing and structure for the complex, including the current breakpoints. The Board considered the continuation and/or implementation of contractual fee waivers and/or expense reimbursements, as applicable. The Board considered whether the reorganization of assets from another Fund within the complex were expected to have economic benefits due to the increased assets under management represented by the combined Funds. The Board noted that each
Fund may also benefit from economies of scale through initial fee setting, fee waivers and expense reimbursements, as well as DMC’s investment in its business, including investments in business infrastructure, technology and cybersecurity.
Management profitability. The Board received and considered the Investment Management Profitability Analysis that addressed the overall profitability of DMC’s business in providing management and other services to each Fund and the complex as a whole, including the methodology used by DMC in allocating costs for the purpose of determining profitability. The Board also reviewed a report prepared by JDL regarding DMC’s profitability as compared to certain peer fund complexes and the Independent Trustees discussed DMC’s profitability in such context with representatives from JDL. The Board recognized that calculating and comparing profitability at the individual fund level is difficult; that DMC’s profit, if any, can vary significantly depending on the particular fund; and that DMC’s support for, and commitment to, a fund are not solely dependent on the profits realized as to that fund.
Based on its review, the Board determined that DMC’s profitability was not excessive in light of the nature, extent and quality of the services provided to each Fund.
Ancillary benefits. The Board received and considered information regarding the extent to which DMC and its affiliates might derive ancillary benefits from fund operations, including the potential for procuring additional business as a result of the prestige and visibility associated with its role as investment manager to the complex; the benefits from allocation of fund brokerage to improve trading efficiencies; the portfolio transactions executed through “soft dollar” arrangements; and the fees that various affiliates received for serving as transfer agent and for overseeing fund accounting and financial administration services to the complex. The Board considered that it receives periodic reports from DMC that include a representation that any soft dollar arrangements are consistent with regulatory requirements. The Board received information from DMC regarding its view of the performance of its affiliates in providing transfer agent and fund accounting and financial administration oversight services and the organizational structure employed to provide these services pursuant to their contracts with the Funds.
Based on its consideration of the factors and information it deemed relevant, including the costs of providing investment management and other services to the Funds and the ongoing commitment of DMC and its affiliates to the Funds, the Board did not find that any ancillary benefits received by DMC and its affiliates were unreasonable.
Conclusion. Based on its review, consideration and evaluation of all factors it believed relevant, including the above-described factors and conclusions, the Board, including all of the Independent Trustees, unanimously approved the continuation of DMC’s Investment Management Agreements for an additional one-year period
Contact information
Shareholder assistance by phone
800 523-1918, weekdays from 8:30am to
6:00pm ET
For securities dealers and financial
institutions representatives only
800 362-7500
Regular mail
Delaware Funds by Macquarie
P.O. Box 534437
Pittsburgh, PA 15253-4437
Overnight courier service
Delaware Funds by Macquarie
Attention: 534437
500 Ross Street, 154-0520
Pittsburgh, PA 15262
Macquarie Asset Management • 610 Market Street • Philadelphia, PA 19106-2354
Macquarie Asset Management (MAM) is the asset management division of Macquarie Group. MAM is an integrated asset manager across public and private markets offering a diverse range of capabilities, including real assets, real estate, credit, equities, and multi-asset solutions.
The Funds are advised by Delaware Management Company, a series of MIMBT, a US registered investment adviser, and distributed by Delaware Distributors, L.P. (DDLP), an affiliate of MIMBT and Macquarie Group Limited.
Other than Macquarie Bank Limited ABN 46 008 583 542 (“Macquarie Bank”), any Macquarie Group entity noted in this document is not an authorized deposit-taking institution for the purposes of the Banking Act 1959 (Commonwealth of Australia). The obligations of these other Macquarie Group entities do not represent deposits or other liabilities of Macquarie Bank. Macquarie Bank does not guarantee or otherwise provide assurance in respect of the obligations of these other Macquarie Group entities. In addition, if this document relates to an investment, (a) the investor is subject to investment risk including possible delays in repayment and loss of income and principal invested and (b) none of Macquarie Bank or any other Macquarie Group entity guarantees any particular rate of return on or the performance of the investment, nor do they guarantee repayment of capital in respect of the investment.
The Funds are governed by US laws and regulations.
This page is not part of the Financial statements and other information.
Fixed income mutual funds
Delaware National High-Yield Municipal Bond Fund
Delaware Tax-Free USA Fund
Delaware Tax-Free USA Intermediate Fund
Financial statements and other information
For the year ended August 31, 2024
This report and the financial statements contained herein are submitted for the general information of the shareholders of the Funds. This report is not authorized for distribution to prospective investors in the Funds unless preceded or accompanied by an effective prospectus.
Form N-PORT and proxy voting information
Each Fund files its complete schedule of portfolio holdings with the Securities and Exchange Commission (SEC) for the first and third quarters of each fiscal year on Form N-PORT. Each Fund’s Form N-PORT, as well as a description of the policies and procedures that the Funds use to determine how to vote proxies (if any) relating to portfolio securities, are available without charge (i) upon request, by calling 800 523-1918; and (ii) on the SEC’s website at sec.gov. In addition, a description of the policies and procedures that the Funds use to determine how to vote proxies (if any) relating to portfolio securities and the Schedule of Investments included in the Funds’ most recent Form N-PORT are available without charge on the Funds’ website at delawarefunds.com/literature.
Information (if any) regarding how the Funds voted proxies relating to portfolio securities during the most recently disclosed 12-month period ended June 30 is available without charge (i) through the Funds’ website at delawarefunds.com/proxy; and (ii) on the SEC’s website at sec.gov.
Schedules of investments
| Delaware National High-Yield Municipal Bond Fund | August 31, 2024 |
| | | Principal
amount° | Value (US $) |
| Municipal Bonds — 98.37% |
| Education Revenue Bonds — 19.78% |
| Albany, New York Capital Resource Revenue | | | |
| (KIPP Capital Region Public Charter Schools Project) | | | |
| 4.75% 6/1/54 | | 1,275,000 | $ 1,277,423 |
| 5.00% 6/1/64 | | 1,600,000 | 1,615,840 |
| Arizona Industrial Development Authority Revenue | | | |
| (Academies of Math & Science Projects) | | | |
| 144A 5.25% 7/1/43 # | | 255,000 | 260,998 |
| 144A 5.375% 7/1/53 # | | 965,000 | 982,843 |
| 144A 5.50% 7/1/58 # | | 1,115,000 | 1,141,002 |
(ACCEL Schools Project)
Series A 144A 5.25% 8/1/48 # | | 3,200,000 | 3,089,984 |
| (American Charter Schools Foundation Project) | | | |
| 144A 6.00% 7/1/37 # | | 1,105,000 | 1,145,498 |
| 144A 6.00% 7/1/47 # | | 8,995,000 | 9,228,690 |
(Basis Schools Projects)
Series A 144A 5.125% 7/1/37 # | | 750,000 | 758,190 |
| (Benjamin Franklin Charter School Projects) | | | |
| Series A 144A 5.25% 7/1/53 # | | 1,000,000 | 1,005,770 |
| Series A 144A 5.50% 7/1/58 # | | 1,385,000 | 1,402,492 |
(Empower College Prep Project)
144A 6.00% 7/1/49 # | | 1,000,000 | 1,016,200 |
(Kaizen Education Foundation Project)
144A 5.80% 7/1/52 # | | 4,000,000 | 4,063,280 |
(Leman Academy Of Excellence of Projects)
Series A 4.50% 7/1/54 | | 5,000,000 | 4,533,150 |
(Odyssey Preparatory Academy Project)
144A 5.00% 7/1/54 # | | 5,000,000 | 4,718,950 |
(Pinecrest Academy Nevada-Horizon, Inspirada)
Series A 144A 5.75% 7/15/48 # | | 2,500,000 | 2,538,625 |
(Social Bonds)
Series A 5.25% 11/1/53 | | 2,250,000 | 2,409,480 |
| Arlington, Texas Higher Education Finance Revenue | | | |
| (Basis Texas Charter Schools) | | | |
| 144A 4.50% 6/15/44 # | | 830,000 | 809,756 |
| 144A 4.75% 6/15/49 # | | 915,000 | 910,974 |
| 144A 4.875% 6/15/54 # | | 1,050,000 | 1,051,134 |
| 144A 4.875% 6/15/59 # | | 1,000,000 | 999,090 |
| 144A 5.00% 6/15/64 # | | 1,200,000 | 1,200,516 |
| (Cypress Christian School) | | | |
| 144A 6.00% 6/1/53 # | | 5,000,000 | 5,158,650 |
| 144A 6.25% 6/1/63 # | | 5,250,000 | 5,459,843 |
Schedules of investments
Delaware National High-Yield Municipal Bond Fund
| | | Principal
amount° | Value (US $) |
| Municipal Bonds (continued) |
| Education Revenue Bonds (continued) |
| Arlington, Texas Higher Education Finance Revenue | | | |
| (Great Hearts America - Texas) | | | |
| Series A 5.00% 8/15/49 | | 900,000 | $ 903,087 |
| Series A 5.00% 8/15/54 | | 1,200,000 | 1,201,164 |
(KIPP Texas, Inc.)
3.00% 8/15/49 (PSF) | | 4,000,000 | 3,107,680 |
| (Newman International Academy) | | | |
| Series A 4.00% 8/15/31 | | 200,000 | 189,952 |
| Series A 5.00% 8/15/41 | | 600,000 | 566,544 |
| Build NYC, New York Resource Revenue | | | |
| (East Harlem Scholars Academy Charter School Project) | | | |
| 144A 5.75% 6/1/52 # | | 2,125,000 | 2,231,080 |
| 144A 5.75% 6/1/62 # | | 1,000,000 | 1,044,360 |
| (Inwood Academy for Leadership Charter School Project) | | | |
| Series A 144A 5.125% 5/1/38 # | | 575,000 | 587,161 |
| Series A 144A 5.50% 5/1/48 # | | 1,500,000 | 1,527,705 |
| (KIPP NYC Public School Facilities - Canal West Project) | | | |
| 5.25% 7/1/52 | | 1,265,000 | 1,319,812 |
| 5.25% 7/1/62 | | 6,355,000 | 6,592,614 |
(Metropolitan College Of New York Project)
5.00% 11/1/39 | | 1,000,000 | 600,000 |
| (New Dawn Charter Schools Project) | | | |
| 144A 5.625% 2/1/39 # | | 1,290,000 | 1,294,683 |
| 144A 5.75% 2/1/49 # | | 2,700,000 | 2,699,838 |
California Community College Financing Authority
Student Housing Revenue | | | |
(Napa Valley College Project)
Series A 144A 5.75% 7/1/60 # | | 14,090,000 | 14,445,350 |
| California Educational Facilities Authority Revenue | | | |
| (Stanford University) | | | |
| Series V-1 5.00% 5/1/49 | | 33,445,000 | 41,540,697 |
| Series V-2 2.25% 4/1/51 | | 4,975,000 | 3,251,610 |
| Series V-2 5.00% 4/1/51 | | 7,455,000 | 9,255,532 |
| California Enterprise Development Authority Revenue | | | |
(Heights Christian Schools Project)
Series A 144A 6.375% 6/1/63 # | | 10,000,000 | 10,149,000 |
| California Municipal Finance Authority Revenue | | | |
(California Baptist University)
Series A 144A 5.50% 11/1/45 # | | 4,000,000 | 4,036,360 |
| | | Principal
amount° | Value (US $) |
| Municipal Bonds (continued) |
| Education Revenue Bonds (continued) |
| California Municipal Finance Authority Revenue | | | |
(Julian Charter School Project)
Series A 144A 5.625% 3/1/45 # | | 5,760,000 | $ 5,559,725 |
| (Palmdale Aerospace Academy Project) | | | |
| Series A 144A 5.00% 7/1/41 # | | 1,000,000 | 1,003,560 |
| Series A 144A 5.00% 7/1/46 # | | 2,145,000 | 2,139,187 |
| (Westside Neighborhood School Project) | | | |
| 144A 5.50% 6/15/39 # | | 600,000 | 643,992 |
| 144A 5.90% 6/15/44 # | | 775,000 | 835,496 |
| 144A 6.375% 6/15/64 # | | 3,300,000 | 3,575,385 |
California Public Finance Authority Educational
Revenue | | | |
(Crossroads Christian School Project)
144A 5.00% 1/1/56 # | | 2,000,000 | 1,785,780 |
| California School Finance Authority Revenue | | | |
| Series A 144A 5.75% 6/1/53 # | | 2,000,000 | 2,034,420 |
| Series A 144A 6.00% 6/1/63 # | | 3,035,000 | 3,103,803 |
(Encore Education Obligated Group)
Series A 144A 5.00% 6/1/52 # | | 1,000,000 | 822,580 |
(Escuela Popular Project)
144A 6.50% 7/1/50 # | | 910,000 | 932,723 |
(Harbor Springs Obligated Group)
Series A 144A 5.625% 7/1/63 # | | 1,500,000 | 1,564,995 |
| (Hawking Steam Charter School Project) | | | |
| 144A 5.375% 7/1/56 # | | 995,000 | 1,022,770 |
| Series A 144A 5.00% 7/1/42 # | | 860,000 | 881,792 |
| Series A 144A 5.50% 7/1/62 # | | 1,000,000 | 1,030,640 |
(John Adams Academies - Obligated Group)
Series A 144A 5.125% 7/1/62 # | | 1,680,000 | 1,645,493 |
| (Lighthouse Community Public Schools - Obligated Group) | | | |
| Series A 144A 6.25% 6/1/42 # | | 1,000,000 | 1,051,690 |
| Series A 144A 6.375% 6/1/52 # | | 1,240,000 | 1,296,197 |
| Series A 144A 6.50% 6/1/62 # | | 2,300,000 | 2,406,352 |
| (New Designs Charter School) | | | |
| Series A 144A 5.00% 6/1/54 # | | 650,000 | 654,010 |
| Series A 144A 5.00% 6/1/64 # | | 1,600,000 | 1,600,768 |
(Rocketship Public Schools - Obligated Group)
Series G 144A 5.00% 6/1/47 # | | 1,425,000 | 1,407,715 |
| (Sonoma County Junior College District Project) | | | |
| Series A 144A 4.00% 11/1/41 # | | 2,980,000 | 2,792,826 |
| Series A 144A 4.00% 11/1/55 # | | 2,500,000 | 2,145,825 |
Schedules of investments
Delaware National High-Yield Municipal Bond Fund
| | | Principal
amount° | Value (US $) |
| Municipal Bonds (continued) |
| Education Revenue Bonds (continued) |
| California School Finance Authority Revenue | | | |
| (View Park Elementary & Middle Schools) | | | |
| Series A 5.625% 10/1/34 | | 830,000 | $ 830,241 |
| Series A 5.875% 10/1/44 | | 4,175,000 | 4,176,127 |
| Series A 6.00% 10/1/49 | | 1,720,000 | 1,720,482 |
(View Park High School)
Series A 144A 7.125% 10/1/48 # | | 3,230,000 | 3,233,295 |
California Statewide Communities Development
Authority Revenue | | | |
(Lancer Educational Student Housing Project)
Series A 144A 5.00% 6/1/46 # | | 1,500,000 | 1,507,335 |
Camden County, New Jersey Improvement Authority
Revenue | | | |
(KIPP Cooper Norcross Academy - 2022 Project)
6.00% 6/15/62 | | 3,750,000 | 4,034,812 |
Capital Trust Agency Educational Facilities Housing,
Florida Revenue | | | |
(Lutz Preparatory School Project)
Series A 4.00% 6/1/41 | | 330,000 | 314,774 |
(Pineapple Cove Classical Academy Inc. Project)
Series A 144A 5.375% 7/1/54 # | | 6,000,000 | 5,813,280 |
(The Pepin Academies Inc. Project)
Series A 5.75% 7/1/55 | | 3,625,000 | 3,609,086 |
| Capital Trust Authority, Florida Revenue | | | |
| (KIPP Miami North Campus Project) | | | |
| Series A 144A 5.625% 6/15/44 # | | 410,000 | 428,471 |
| Series A 144A 6.00% 6/15/54 # | | 655,000 | 688,556 |
| Series A 144A 6.125% 6/15/60 # | | 800,000 | 842,088 |
| (Mason Classical Academy Project) | | | |
| Series A 144A 5.00% 6/1/54 # | | 2,900,000 | 2,931,320 |
| Series A 144A 5.00% 6/1/64 # | | 4,250,000 | 4,271,292 |
| Capital Trust Student Housing, Florida Revenue | | | |
(University Bridge, LLC Student Housing Project)
Series A 144A 5.25% 12/1/58 # | | 8,000,000 | 8,022,320 |
Chester County, Pennsylvania Economic
Development Authority Lease Revenue | | | |
(Chester Community Charter School Project)
Series A 144A 5.625% 8/15/48 # | | 12,000,000 | 12,050,880 |
Chester County, Pennsylvania Industrial Development
Authority Student Housing Revenue | | | |
(West Chester University of Pennsylvania)
Series A 5.00% 8/1/30 | | 1,925,000 | 1,925,693 |
| | | Principal
amount° | Value (US $) |
| Municipal Bonds (continued) |
| Education Revenue Bonds (continued) |
Chicago, Illinois Board of Education Dedicated Capital
Improvement Tax Revenue | | | |
| 5.00% 4/1/41 | | 2,000,000 | $ 2,145,440 |
| 5.00% 4/1/45 | | 1,665,000 | 1,772,392 |
| 5.75% 4/1/48 | | 5,150,000 | 5,735,452 |
| City of Burbank, Illinois Revenue | | | |
(Intercultural Montessori Language)
144A 6.25% 9/1/45 # | | 4,000,000 | 4,014,440 |
City of Homewood, Alabama Educational Building
Authority Revenue | | | |
| (CHF - Horizon II, L.L.C. Student Housing & Parking Project at Samford University) | | | |
| Series 2024C 5.00% 10/1/56 | | 1,200,000 | 1,226,136 |
| Series 2024C 5.50% 10/1/54 | | 1,750,000 | 1,875,842 |
City of St. Paul, Minnesota Housing & Redevelopment
Authority Charter School Lease Revenue | | | |
(Academia Cesar Chavez School Project)
Series A 5.25% 7/1/50 | | 2,560,000 | 2,334,234 |
| Clifton, Texas Higher Education Finance Revenue | | | |
| (Valor Education) | | | |
| Series A 144A 5.00% 6/15/34 # | | 325,000 | 324,477 |
| Series A 144A 5.75% 6/15/44 # | | 600,000 | 604,284 |
| Series A 144A 6.00% 6/15/54 # | | 830,000 | 834,490 |
| Series A 144A 6.25% 6/15/53 # | | 3,710,000 | 3,785,461 |
Cobb County, Georgia Development Authority Charter
School Revenue | | | |
| (Northwest Classical Academy Project) | | | |
| Series A 144A 6.375% 6/15/58 # | | 1,205,000 | 1,232,426 |
| Series A 144A 6.40% 6/15/53 # | | 1,850,000 | 1,905,074 |
Colorado Educational & Cultural Facilities Authority
Revenue | | | |
| (Ascent Classical Academy Charter Schools) | | | |
| Series A 144A 5.50% 4/1/44 # | | 2,000,000 | 2,084,540 |
| Series A 144A 5.75% 4/1/59 # | | 2,250,000 | 2,333,070 |
| Series A 144A 5.80% 4/1/54 # | | 2,800,000 | 2,928,716 |
(Community Leadership Academy, Inc. Second Campus Project)
7.45% 8/1/48 | | 2,500,000 | 2,504,200 |
| (Global Village Academy - Northglenn Project) | | | |
| 144A 5.00% 12/1/50 # | | 1,000,000 | 910,250 |
| 144A 5.00% 12/1/55 # | | 3,440,000 | 3,071,886 |
Schedules of investments
Delaware National High-Yield Municipal Bond Fund
| | | Principal
amount° | Value (US $) |
| Municipal Bonds (continued) |
| Education Revenue Bonds (continued) |
Colorado Educational & Cultural Facilities Authority
Revenue | | | |
(Loveland Classical Schools Project)
144A 5.00% 7/1/46 # | | 3,000,000 | $ 3,012,240 |
(Skyview Academy Project)
144A 5.375% 7/1/44 # | | 500,000 | 500,175 |
County of Pima, Arizona Industrial Development
Authority Education Revenue | | | |
(American Leadership Academy Project)
144A 4.00% 6/15/57 # | | 500,000 | 404,020 |
| District of Columbia Revenue | | | |
| (Rocketship DC Obligated Group) | | | |
| Series A 5.75% 6/1/54 | | 1,000,000 | 1,038,340 |
| Series A 6.00% 6/1/58 | | 1,600,000 | 1,683,952 |
| Florida Development Finance Revenue | | | |
| (Cornerstone Charter Academy Project) | | | |
| 144A 5.125% 10/1/52 # | | 4,110,000 | 4,110,699 |
| 144A 5.25% 10/1/56 # | | 3,800,000 | 3,813,224 |
| (Mater Academy Projects) | | | |
| Series A 4.00% 6/15/52 | | 1,145,000 | 1,012,569 |
| Series A 5.00% 6/15/56 | | 1,630,000 | 1,638,150 |
| (Renaissance Charter School Projects) | | | |
| Series A 144A 6.00% 6/15/35 # | | 2,000,000 | 2,021,580 |
| Series A 144A 6.125% 6/15/44 # | | 5,300,000 | 5,303,392 |
| Series C 144A 5.00% 9/15/50 # | | 2,000,000 | 1,839,100 |
| (SFP - Tampa I - The Henry Project) | | | |
| Series A-1 144A 5.00% 6/1/44 # | | 1,600,000 | 1,640,832 |
| Series A-1 144A 5.25% 6/1/54 # | | 3,000,000 | 3,080,340 |
| Series A-1 144A 5.25% 6/1/59 # | | 2,500,000 | 2,557,225 |
Hawaii State Department of Budget & Finance
Revenue | | | |
(Hawaii Pacific University Project)
144A 5.125% 7/1/43 # | | 1,500,000 | 1,488,255 |
| Idaho Housing & Finance Association Revenue | | | |
| Series A 5.00% 6/1/50 | | 1,000,000 | 1,000,540 |
(Compass Public Charter School Project)
Series A 144A 5.00% 7/1/54 # | | 860,000 | 810,438 |
(Idaho Arts Charter School)
144A 5.00% 12/1/36 # | | 595,000 | 595,827 |
| (North Star Charter School) | | | |
| Series A 6.75% 7/1/48 | | 529,150 | 541,003 |
| Series B 144A 4.88% 7/1/49 #, ^ | | 2,888,155 | 538,583 |
| | | Principal
amount° | Value (US $) |
| Municipal Bonds (continued) |
| Education Revenue Bonds (continued) |
| Idaho Housing & Finance Association Revenue | | | |
(Sage International School of Middleton Project)
Series A 5.00% 5/1/63 | | 1,150,000 | $ 1,162,087 |
| Illinois Finance Authority Charter School Revenue | | | |
(Chicago International Charter School Project)
5.00% 12/1/47 | | 2,965,000 | 2,977,275 |
| Illinois Finance Authority Educational Facility Revenue | | | |
| (Rogers Park Montessori) | | | |
| 6.00% 2/1/34 | | 675,000 | 675,304 |
| 6.125% 2/1/45 | | 1,400,000 | 1,400,462 |
| Illinois Finance Authority Revenue | | | |
(Acero Charter Schools)
144A 4.00% 10/1/42 # | | 2,245,000 | 2,014,416 |
Illinois Finance Authority Student Housing &
Academic Facility Revenue | | | |
(University of Illinois at Chicago Project)
Series A 5.00% 2/15/47 | | 3,640,000 | 3,644,805 |
| Indiana Finance Authority Revenue | | | |
| (Matchbook Learning Schools of Indiana Inc Project) | | | |
| 144A 7.00% 6/15/53 # | | 4,000,000 | 4,158,800 |
| 144A 7.00% 6/15/58 # | | 6,405,000 | 6,637,822 |
(Tippecanoe, LLC - Student Housing Project)
Series A 5.375% 6/1/64 | | 6,010,000 | 6,291,929 |
Industrial Development Authority of the County of
Pima, Arizona Revenue | | | |
(Noah Webster Schools-Pima Project)
Series A 7.00% 12/15/43 | | 1,500,000 | 1,501,530 |
Kent County, Delaware Student Housing and Dining
Facilities Revenue | | | |
(Delaware State University Project)
Series A 5.00% 7/1/58 | | 1,250,000 | 1,253,325 |
| Louisiana Public Facilities Authority Revenue | | | |
| (Athlos Academy Jefferson Paris) | | | |
| Series A 144A 7.375% 6/1/54 # | | 2,500,000 | 2,618,350 |
| Series A 144A 7.50% 6/1/59 # | | 5,000,000 | 5,260,700 |
| (Geo Academies EBR - Geo Prep Mid-City Project) | | | |
| 144A 6.125% 6/1/52 # | | 1,030,000 | 1,070,458 |
| 144A 6.25% 6/1/62 # | | 1,420,000 | 1,477,567 |
| (Jefferson Rise Charter School Project) | | | |
| Series A 144A 6.25% 6/1/52 # | | 1,000,000 | 1,008,620 |
| Series A 144A 6.375% 6/1/62 # | | 1,330,000 | 1,338,140 |
Schedules of investments
Delaware National High-Yield Municipal Bond Fund
| | | Principal
amount° | Value (US $) |
| Municipal Bonds (continued) |
| Education Revenue Bonds (continued) |
| Louisiana Public Facilities Authority Revenue | | | |
(Lake Charles Charter Academy Foundation Project)
8.00% 12/15/41 | | 1,500,000 | $ 1,503,240 |
| (Lincoln Preparatory School Project) | | | |
| Series A 144A 5.25% 6/1/60 # | | 2,000,000 | 1,700,280 |
| Series A 144A 6.375% 6/1/52 # | | 2,000,000 | 2,015,520 |
| Series A 144A 6.50% 6/1/62 # | | 4,000,000 | 4,036,320 |
Macomb County, Michigan Public School Academy
Revenue | | | |
(Academy Of Warren)
Series A 144A 5.50% 5/1/50 # | | 1,810,000 | 1,742,469 |
Macon-Bibb County, Georgia Urban Development
Authority Revenue | | | |
| (Academy for Classical Education) | | | |
| Series A 144A 5.875% 6/15/47 # | | 1,680,000 | 1,724,184 |
| Series A 144A 6.00% 6/15/52 # | | 1,530,000 | 1,570,744 |
Maricopa County, Arizona Industrial Development
Authority Revenue | | | |
(Choice Academies, Inc. Project)
144A 5.75% 9/1/45 # | | 4,925,000 | 5,051,474 |
Massachusetts Development Finance Agency
Revenue | | | |
| Series B 4.00% 2/15/36 | | 2,500,000 | 2,783,350 |
| Series B 5.00% 2/15/34 | | 3,500,000 | 4,204,515 |
| Series V 5.00% 7/1/55 | | 14,470,000 | 17,567,593 |
(Massachusetts Institute Of Technology)
Series P 5.00% 7/1/50 | | 18,030,000 | 21,759,145 |
| (Merrimack College Student Housing Project) | | | |
| Series A 144A 5.00% 7/1/54 # | | 1,200,000 | 1,232,748 |
| Series A 144A 5.00% 7/1/60 # | | 1,100,000 | 1,121,318 |
Miami-Dade County, Florida Industrial Development
Authority Revenue | | | |
| (Youth Co-Op Charter School) | | | |
| Series A 144A 5.75% 9/15/35 # | | 1,000,000 | 1,006,500 |
| Series A 144A 6.00% 9/15/45 # | | 1,000,000 | 1,005,920 |
Michigan Finance Authority Limited Obligation
Revenue | | | |
(Hanley International Academy)
5.00% 9/1/40 | | 1,115,000 | 1,114,967 |
(Landmark Academy Project)
5.00% 6/1/45 | | 2,000,000 | 1,903,120 |
| | | Principal
amount° | Value (US $) |
| Municipal Bonds (continued) |
| Education Revenue Bonds (continued) |
Michigan Finance Authority Limited Obligation
Revenue | | | |
| (Public School Academy Old Redford) | | | |
| Series A 5.90% 12/1/30 | | 1,520,000 | $ 1,520,030 |
| Series A 6.50% 12/1/40 | | 3,900,000 | 3,899,922 |
Michigan Public Educational Facilities Authority
Revenue | | | |
(Old Redford)
Series A 5.875% 12/1/30 | | 1,550,000 | 1,550,000 |
Monroe County, New York Industrial Development
Revenue | | | |
(University of Rochester Project)
Series A 5.00% 7/1/53 | | 2,500,000 | 2,726,275 |
Nevada State Department of Business & Industry
Revenue | | | |
| (Somerset Academy) | | | |
| Series A 144A 5.00% 12/15/35 # | | 1,595,000 | 1,606,707 |
| Series A 144A 5.00% 12/15/38 # | | 1,000,000 | 1,004,480 |
| Series A 144A 5.00% 12/15/48 # | | 500,000 | 493,130 |
| Series A 144A 5.125% 12/15/45 # | | 5,030,000 | 5,038,551 |
| New York State Dormitory Authority Revenue | | | |
(Columbia University)
Series A 5.00% 10/1/50 | | 1,965,000 | 2,403,686 |
(Cornell University)
Series A 5.50% 7/1/54 | | 3,000,000 | 3,435,210 |
(Pace University)
Series A 5.50% 5/1/56 | | 1,750,000 | 1,915,480 |
Oklahoma County, Oklahoma Finance Authority
Revenue | | | |
| (Astec Project) | | | |
| 144A 5.25% 6/15/34 # | | 600,000 | 613,506 |
| 144A 6.00% 6/15/44 # | | 1,000,000 | 1,029,440 |
| 144A 6.50% 6/15/64 # | | 3,000,000 | 3,108,360 |
Philadelphia Authority for Industrial Development
Revenue | | | |
(First Philadelphia Preparatory Charter School Project)
144A 5.00% 6/15/43 # | | 1,465,000 | 1,489,832 |
Philadelphia, Pennsylvania Authority for Industrial
Development Revenue | | | |
(Mast Community Charter School II Project)
5.00% 8/1/50 | | 375,000 | 381,634 |
Schedules of investments
Delaware National High-Yield Municipal Bond Fund
| | | Principal
amount° | Value (US $) |
| Municipal Bonds (continued) |
| Education Revenue Bonds (continued) |
Phoenix, Arizona Industrial Development Authority
Education Revenue | | | |
| (Basic Schools Project) | | | |
| Series 2015A 144A 5.00% 7/1/46 # | | 4,000,000 | $ 4,000,440 |
| Series 2016A 144A 5.00% 7/1/45 # | | 2,000,000 | 2,000,680 |
Phoenix, Arizona Industrial Development Authority
Student Housing Revenue | | | |
(Downtown Phoenix Student Housing, LLC-Arizona State University Project)
Series A 5.00% 7/1/42 | | 1,000,000 | 1,021,500 |
Pima County, Arizona Industrial Development
Authority Education Revenue | | | |
(American Leadership Academy Project)
144A 4.00% 6/15/57 # | | 4,000,000 | 3,232,160 |
| (Career Success Schools Project) | | | |
| 144A 5.50% 5/1/40 # | | 500,000 | 502,165 |
| 144A 5.75% 5/1/50 # | | 2,530,000 | 2,544,623 |
| (Edkey Charter Schools Project) | | | |
| 144A 5.00% 7/1/49 # | | 7,000,000 | 6,672,960 |
| 144A 5.00% 7/1/55 # | | 7,370,000 | 6,938,266 |
Pottsboro, Texas Higher Education Finance Authority
Revenue | | | |
| Series A 5.00% 8/15/36 | | 755,000 | 755,808 |
| Series A 5.00% 8/15/46 | | 1,000,000 | 961,320 |
Shelby County, Health Educational and Housing
Facility Board Revenue | | | |
| (Madrone Memphis Student Housing I, LLC - University of Memphis Project) | | | |
| Series A-1 144A 5.00% 6/1/44 # | | 1,000,000 | 1,030,420 |
| Series A-1 144A 5.25% 6/1/56 # | | 2,000,000 | 2,064,520 |
South Carolina Jobs-Economic Development
Authority Revenue | | | |
| (Green Charter Schools Project) | | | |
| Series A 144A 4.00% 6/1/46 # | | 2,300,000 | 1,780,062 |
| Series A 144A 4.00% 6/1/56 # | | 1,530,000 | 1,106,419 |
(High Point Academy Project)
Series A 144A 5.75% 6/15/49 # | | 5,000,000 | 5,021,750 |
| (Riverwalk Academy Project) | | | |
| Series A 144A 7.125% 6/15/53 # | | 2,550,000 | 2,684,640 |
| Series A 144A 7.25% 6/15/58 # | | 2,915,000 | 3,068,096 |
| (Virtus Academy Project) | | | |
| Series A 144A 6.75% 6/15/43 # | | 940,000 | 973,408 |
| | | Principal
amount° | Value (US $) |
| Municipal Bonds (continued) |
| Education Revenue Bonds (continued) |
South Carolina Jobs-Economic Development
Authority Revenue | | | |
| (Virtus Academy Project) |
| Series A 144A 7.00% 6/15/53 # | | 1,830,000 | $ 1,902,651 |
| Series A 144A 7.125% 6/15/58 # | | 1,510,000 | 1,576,017 |
St. Louis, Missouri Industrial Development Authority
Tax Increment Revenue Improvement | | | |
(Confluence Academy Project)
Series A 144A 5.625% 6/15/53 # | | 4,805,000 | 4,654,844 |
University of Texas System Board of Regents
Revenue | | | |
| Series B 5.00% 8/15/49 | | 26,915,000 | 32,077,835 |
| University of Virginia Revenue | | | |
| Series A 2.18% 11/1/51 | | 10,000,000 | 6,064,600 |
| Series A-2 3.57% 4/1/45 | | 10,000,000 | 9,225,200 |
Upper Dauphin, Pennsylvania Industrial Development
Authority Revenue | | | |
(Pennsylvania Steam Academy Charter School Project)
Series A 144A 6.25% 7/1/57 # | | 2,400,000 | 2,402,664 |
Upper Illinois River Valley Development Authority
Revenue | | | |
(Elgin Math And Science Academy Charter School Project)
Series A 144A 6.00% 3/1/63 # | | 2,990,000 | 3,082,869 |
| Utah State Charter School Finance Authority Revenue | | | |
| (Leadership Learning Academy Project) | | | |
| Series A 144A 5.00% 6/15/39 # | | 1,000,000 | 1,001,180 |
| Series A 144A 5.00% 6/15/50 # | | 2,200,000 | 2,101,660 |
Washington State Housing Finance Commission
Revenue | | | |
| (Radford Court And Nordheim Court Portfolio) | | | |
| 5.00% 7/1/54 | | 2,500,000 | 2,594,225 |
| 5.50% 7/1/59 | | 6,000,000 | 6,460,500 |
(Seattle Academy Of Arts And Sciences Project)
144A 6.375% 7/1/63 # | | 3,000,000 | 3,318,210 |
| Wisconsin Public Finance Authority Revenue | | | |
| 5.75% 7/1/62 | | 12,966,712 | 13,910,429 |
(Cornerstone Charter Academy)
Series A 144A 5.125% 2/1/46 # | | 3,250,000 | 3,092,017 |
| (Founders Academy of Las Vegas) | | | |
| Series A 144A 6.375% 7/1/43 # | | 300,000 | 314,745 |
Schedules of investments
Delaware National High-Yield Municipal Bond Fund
| | | Principal
amount° | Value (US $) |
| Municipal Bonds (continued) |
| Education Revenue Bonds (continued) |
| Wisconsin Public Finance Authority Revenue | | | |
| (Founders Academy of Las Vegas) |
| Series A 144A 6.625% 7/1/53 # | | 600,000 | $ 630,276 |
| Series A 144A 6.75% 7/1/58 # | | 550,000 | 580,003 |
| (North East Carolina Preparatory School Project) | | | |
| Series A 5.00% 6/15/44 | | 1,000,000 | 1,018,230 |
| Series A 5.25% 6/15/54 | | 1,200,000 | 1,226,568 |
(Pine Lake Preparatory)
144A 5.50% 3/1/45 # | | 3,460,000 | 3,472,975 |
| (Revolution Academy) | | | |
| Series A 144A 6.25% 10/1/53 # | | 2,000,000 | 2,108,400 |
| Series A 144A 6.25% 10/1/58 # | | 3,885,000 | 4,083,873 |
| (Shining Rock Classical Academy) | | | |
| Series A 6.00% 6/15/52 | | 1,000,000 | 1,000,370 |
| Series A 6.125% 6/15/57 | | 1,000,000 | 1,002,050 |
(Triad Educational Services, Inc.)
Series A 144A 5.50% 6/15/45 # | | 6,000,000 | 6,050,700 |
| (Wilson Preparatory Academy) | | | |
| Series A 144A 4.125% 6/15/29 # | | 335,000 | 329,060 |
| Series A 144A 5.00% 6/15/39 # | | 500,000 | 501,145 |
| Series A 144A 5.00% 6/15/49 # | | 1,100,000 | 1,070,949 |
(Wittenberg University)
144A 5.25% 12/1/39 # | | 5,000,000 | 4,595,500 |
Yonkers, New York Economic Development
Educational Revenue | | | |
| (Lamartine/Warburton LLC - Charter School of Educational Excellence Project) | | | |
| Series A 5.00% 10/15/49 | | 1,000,000 | 1,002,620 |
| Series A 5.00% 10/15/54 | | 465,000 | 464,972 |
| | 660,941,491 |
| Electric Revenue Bonds — 1.82% |
| Build NYC, New York Resource Revenue | | | |
(Brooklyn Navy Yard Cogeneration Partners, L.P. Project)
144A 5.25% 12/31/33 (AMT) # | | 4,520,000 | 4,227,963 |
Burke County, Georgia Development Authority
Pollution Control Revenue | | | |
(Oglethorpe Power Corporation Project)
Series A 1.50% 1/1/40 • | | 700,000 | 689,759 |
| Guam Power Authority Revenue | | | |
| (Tax-Exempt Forward Delivery) | | | |
| Series A 5.00% 10/1/38 | | 135,000 | 146,687 |
| | | Principal
amount° | Value (US $) |
| Municipal Bonds (continued) |
| Electric Revenue Bonds (continued) |
| Guam Power Authority Revenue | | | |
| (Tax-Exempt Forward Delivery) |
| Series A 5.00% 10/1/44 | | 6,000,000 | $ 6,344,160 |
| Puerto Rico Electric Power Authority Revenue | | | |
| Series A 5.00% 7/1/42 ‡ | | 8,615,000 | 4,652,100 |
| Series A 5.05% 7/1/42 ‡ | | 4,590,000 | 2,478,600 |
| Series A 6.75% 7/1/36 ‡ | | 1,500,000 | 810,000 |
| Series AAA 5.25% 7/1/25 ‡ | | 925,000 | 499,500 |
| Series AAA 5.25% 7/1/26 ‡ | | 1,030,000 | 556,200 |
| Series AAA 5.25% 7/1/27 ‡ | | 5,330,000 | 2,878,200 |
| Series AAA 5.25% 7/1/28 ‡ | | 1,205,000 | 650,700 |
| Series CCC 5.25% 7/1/27 ‡ | | 5,525,000 | 2,983,500 |
| Series TT 5.00% 7/1/23 ‡ | | 2,785,000 | 1,496,937 |
| Series TT 5.00% 7/1/37 ‡ | | 5,230,000 | 2,824,200 |
| Series WW 5.00% 7/1/28 ‡ | | 6,040,000 | 3,261,600 |
| Series WW 5.25% 7/1/25 ‡ | | 1,530,000 | 826,200 |
| Series WW 5.25% 7/1/33 ‡ | | 1,260,000 | 680,400 |
| Series WW 5.50% 7/1/38 ‡ | | 9,035,000 | 4,878,900 |
| Series XX 4.75% 7/1/26 ‡ | | 920,000 | 496,800 |
| Series XX 5.25% 7/1/40 ‡ | | 19,300,000 | 10,422,000 |
| Series XX 5.75% 7/1/36 ‡ | | 7,470,000 | 4,033,800 |
| Series ZZ 4.75% 7/1/27 ‡ | | 760,000 | 410,400 |
| Series ZZ 5.25% 7/1/25 ‡ | | 1,275,000 | 685,313 |
| Series ZZ 5.25% 7/1/26 ‡ | | 7,005,000 | 3,782,700 |
| | 60,716,619 |
| Healthcare Revenue Bonds — 13.16% |
| Arizona Industrial Development Authority Revenue | | | |
(Great Lakes Senior Living Communities LLC Project First Tier)
Series A 5.00% 1/1/54 | | 2,595,000 | 1,603,736 |
| (Great Lakes Senior Living Communities LLC Project Fourth Tier) | | | |
| 144A 7.75% 1/1/54 # | | 2,100,000 | 818,496 |
| Series D 144A 7.25% 1/1/54 #, ‡ | | 2,500,000 | 974,400 |
| (Great Lakes Senior Living Communities LLC Project Second Tier) | | | |
| Series B 5.00% 1/1/49 ‡ | | 975,000 | 446,609 |
| Series B 5.125% 1/1/54 ‡ | | 1,130,000 | 504,895 |
| (Great Lakes Senior Living Communities LLC Project Third Tier) | | | |
| Series C 144A 5.00% 1/1/49 #, ‡ | | 1,000,000 | 417,230 |
Schedules of investments
Delaware National High-Yield Municipal Bond Fund
| | | Principal
amount° | Value (US $) |
| Municipal Bonds (continued) |
| Healthcare Revenue Bonds (continued) |
| Arizona Industrial Development Authority Revenue | | | |
| (Great Lakes Senior Living Communities LLC Project Third Tier) |
| Series C 144A 5.50% 1/1/54 #, ‡ | | 4,000,000 | $ 1,668,480 |
Bexar County, Texas Health Facilities Development
Revenue | | | |
(Army Retirement Residence Foundation Project)
5.00% 7/15/41 | | 5,395,000 | 5,239,031 |
Birmingham, Alabama Special Care Facilities
Financing Authority Revenue | | | |
| (Methodist Home for the Aging) | | | |
| 5.50% 6/1/30 | | 1,850,000 | 1,845,320 |
| 5.75% 6/1/35 | | 1,500,000 | 1,504,275 |
| 5.75% 6/1/45 | | 2,500,000 | 2,380,575 |
| 6.00% 6/1/50 | | 3,130,000 | 3,018,478 |
California Health Facilities Financing Authority
Revenue | | | |
| (Cedars-Sinai Health System) | | | |
| Series A 3.00% 8/15/51 | | 15,170,000 | 12,138,579 |
| Series A 3.00% 8/15/51 (AGM) | | 1,025,000 | 862,435 |
(Kaiser Permanente)
Subseries A-2 5.00% 11/1/47 | | 9,870,000 | 11,978,923 |
| California Municipal Finance Authority Revenue | | | |
(Community Health System Project)
Series A 3.00% 2/1/46 (AGM) | | 10,000,000 | 8,312,200 |
| (Goodwill Industry Sacramento Valley and Northern Nevada Project) | | | |
| Series A 5.25% 1/1/45 | | 1,295,000 | 1,060,566 |
| Series A 144A 6.625% 1/1/32 # | | 500,000 | 499,945 |
| Series A 144A 6.875% 1/1/42 # | | 1,500,000 | 1,480,005 |
(Northbay Healthcare Group)
Series A 5.25% 11/1/47 | | 500,000 | 500,185 |
California Statewide Communities Development
Authority Revenue | | | |
(Enloe Medical Center)
Series A 5.375% 8/15/57 (AGM) | | 2,000,000 | 2,176,680 |
Capital Trust Agency Senior Living Facilities, Florida
Revenue | | | |
(Elim Senior Housing Inc. Project)
144A 5.875% 8/1/52 # | | 2,000,000 | 1,544,320 |
| | | Principal
amount° | Value (US $) |
| Municipal Bonds (continued) |
| Healthcare Revenue Bonds (continued) |
City of Apple Valley, Minnesota Senior Living
Revenue | | | |
(Minnesota Senior Living LLC Project)
Second Tier Series B 5.25% 1/1/37 | | 420,000 | $ 309,628 |
| (Senior Living LLC Project) | | | |
| Fourth Tier Series D 7.25% 1/1/52 | | 7,410,000 | 4,172,719 |
| Second Tier Series B 5.00% 1/1/47 | | 2,375,000 | 1,423,837 |
City of Chicago, Illinois Multi-Family Housing
Revenue | | | |
(Goldblatts Supportive Living Project)
6.125% 12/1/43 ‡ | | 8,560,000 | 5,454,432 |
City of Colby, Kanas Hospital Loan Anticipation
Revenue | | | |
(Citizens Medical Center, Inc. Project)
5.50% 7/1/26 | | 9,000,000 | 9,068,940 |
| City of Lenexa, Kansas Health Care Facility Revenue | | | |
| (Lakeview Village) | | | |
| Series A 4.00% 5/15/34 | | 1,000,000 | 969,400 |
| Series A 5.00% 5/15/39 | | 1,500,000 | 1,516,530 |
City of Medford, Oregon Hospital Facility Authority
Revenue | | | |
(Asante Projects)
Series A 3.00% 8/15/50 (AGM) | | 3,500,000 | 2,731,365 |
City of Rochester, Minnesota Health Care & Housing
Revenue | | | |
(The Homestead at Rochester Project)
Series A 6.875% 12/1/48 | | 2,500,000 | 2,500,400 |
| City of Terre Haute, Indiana Revenue | | | |
(Westminster Village Project)
6.00% 8/1/39 | | 4,000,000 | 3,352,920 |
| City of Topeka, Kansas Healthcare Facilities Revenue | | | |
| (Brewster Place) | | | |
| Series A 6.25% 12/1/42 | | 1,500,000 | 1,590,945 |
| Series A 6.50% 12/1/52 | | 2,000,000 | 2,105,200 |
Clackamas County, Oregon Hospital Facility Authority
Revenue | | | |
| (Rose Villa Project) | | | |
| Series A 5.25% 11/15/50 | | 1,000,000 | 1,002,250 |
| Series A 5.375% 11/15/55 | | 1,000,000 | 1,002,970 |
| Colorado Health Facilities Authority Revenue | | | |
(Aberdeen Ridge)
Series A 5.00% 5/15/58 | | 500,000 | 330,295 |
Schedules of investments
Delaware National High-Yield Municipal Bond Fund
| | | Principal
amount° | Value (US $) |
| Municipal Bonds (continued) |
| Healthcare Revenue Bonds (continued) |
| Colorado Health Facilities Authority Revenue | | | |
(AdventHealth Obligated Group)
Series A 3.00% 11/15/51 | | 7,000,000 | $ 5,428,500 |
(American Baptist)
8.00% 8/1/43 | | 2,500,000 | 1,659,375 |
(Cappella of Grand Junction Project)
144A 5.00% 12/1/54 # | | 1,255,000 | 871,761 |
(CommonSpirit Health)
Series A 5.25% 12/1/54 | | 5,000,000 | 5,502,900 |
(Mental Health Center Denver Project)
Series A 5.75% 2/1/44 | | 500,000 | 500,345 |
| (Sunny Vista Living Center) | | | |
| Series A 144A 5.50% 12/1/30 # | | 750,000 | 619,350 |
| Series A 144A 5.75% 12/1/35 # | | 1,150,000 | 863,615 |
| Series A 144A 6.125% 12/1/45 # | | 1,200,000 | 820,704 |
| Series A 144A 6.25% 12/1/50 # | | 560,000 | 376,723 |
Connecticut State Health & Educational Facilities
Authority Revenue | | | |
| (Church Home of Hartford Incorporated Project) | | | |
| Series A 144A 5.00% 9/1/46 # | | 1,000,000 | 984,260 |
| Series A 144A 5.00% 9/1/53 # | | 1,600,000 | 1,529,296 |
| Cuyahoga County, Ohio Hospital Revenue | | | |
| (The MetroHealth System) | | | |
| 5.25% 2/15/47 | | 4,000,000 | 4,077,280 |
| 5.50% 2/15/52 | | 4,930,000 | 5,039,101 |
Doylestown, Pennsylvania Hospital Authority
Revenue | | | |
| 144A 5.00% 7/1/31 # | | 1,500,000 | 1,567,230 |
| 144A 5.375% 7/1/39 # | | 1,575,000 | 1,670,524 |
Escambia County, Florida Health Facilities Authority
Revenue | | | |
(Baptist Health Care Obligated Group)
Series A 4.00% 8/15/50 | | 8,065,000 | 7,253,177 |
Gainesville & Hall County, Georgia Hospital Authority
Revenue | | | |
(Northeast Georgia Health System Project)
3.00% 2/15/47 | | 3,775,000 | 3,001,351 |
Glendale, Arizona Industrial Development Authority
Revenue | | | |
| (Glencroft Retirement Community Project) | | | |
| 5.00% 11/15/36 | | 950,000 | 870,095 |
| 5.25% 11/15/51 | | 1,350,000 | 1,126,845 |
| | | Principal
amount° | Value (US $) |
| Municipal Bonds (continued) |
| Healthcare Revenue Bonds (continued) |
Guilderland, New York Industrial Development Agency
Revenue | | | |
(Albany Place Development LLC Project)
Series A 144A 5.875% 1/1/52 #, ‡ | | 6,000,000 | $ 3,300,000 |
Henrico County, Virginia Economic Development
Authority Residential Care Facility Revenue | | | |
(Westminster Canterbury Richmond)
Series A 5.00% 10/1/47 | | 2,170,000 | 2,283,556 |
Hillsborough County, Florida Industrial Development
Authority Hospital Revenue | | | |
(BayCare Health System Issue)
Series C 5.50% 11/15/54 | | 1,500,000 | 1,699,785 |
| Idaho Health Facilities Authority Revenue | | | |
| (St. Luke's Health System Project) | | | |
| Series A 3.00% 3/1/51 | | 7,370,000 | 5,618,446 |
| Series A 4.00% 3/1/51 | | 2,000,000 | 1,848,080 |
(Valley Vista Care Corporation)
Series A 5.00% 11/15/32 | | 455,000 | 418,345 |
| Illinois Finance Authority Revenue | | | |
(Plymouth Place, Inc.)
Series A 6.75% 5/15/58 | | 3,000,000 | 3,228,060 |
| (The Admiral at the Lake Project) | | | |
| 5.25% 5/15/42 | | 900,000 | 782,613 |
| 5.25% 5/15/54 | | 5,910,000 | 4,709,383 |
| 5.50% 5/15/54 | | 3,375,000 | 2,795,783 |
| Illinois Housing Development Authority Revenue | | | |
| (Stonebridge of Gurnee Project) | | | |
| Series A 144A 5.45% 1/1/46 # | | 2,500,000 | 1,919,275 |
| Series A 144A 5.60% 1/1/56 # | | 2,630,000 | 1,945,779 |
| Iowa Finance Authority Revenue | | | |
(ChildServe Project)
Series B 5.00% 6/1/36 | | 2,425,000 | 2,430,238 |
| (PHS Council Bluffs Project) | | | |
| 5.125% 8/1/48 | | 1,750,000 | 1,450,697 |
| 5.25% 8/1/55 | | 2,500,000 | 2,015,650 |
Jefferson County, Washington Public Hospital District
No. 2 Revenue | | | |
(Jefferson Healthcare)
Series A 6.875% 12/1/53 | | 8,880,000 | 9,018,972 |
| Kalispell, Montana Revenue | | | |
| (Immanuel Lutheran Corporation Project) | | | |
| Series A 5.25% 5/15/32 | | 435,000 | 430,089 |
Schedules of investments
Delaware National High-Yield Municipal Bond Fund
| | | Principal
amount° | Value (US $) |
| Municipal Bonds (continued) |
| Healthcare Revenue Bonds (continued) |
| Kalispell, Montana Revenue | | | |
| (Immanuel Lutheran Corporation Project) |
| Series A 5.25% 5/15/47 | | 1,525,000 | $ 1,324,584 |
| Series A 5.25% 5/15/52 | | 5,420,000 | 4,603,260 |
Kentucky Economic Development Finance Authority
Healthcare Revenue | | | |
| (Rosedale Green Project) | | | |
| 5.50% 11/15/35 | | 1,310,000 | 1,282,045 |
| 5.75% 11/15/45 | | 3,000,000 | 2,781,660 |
| 5.75% 11/15/50 | | 1,600,000 | 1,457,216 |
Kirkwood, Missouri Industrial Development Authority
Revenue | | | |
(Aberdeen Heights Project)
Series A 5.25% 5/15/50 | | 9,000,000 | 7,824,240 |
| Lake County, Florida Retirement Facility Revenue | | | |
| (Lakeside At Waterman Village Project) | | | |
| Series A 5.75% 8/15/50 | | 2,500,000 | 2,431,000 |
| Series A 5.75% 8/15/55 | | 1,500,000 | 1,441,365 |
Lancaster County, Pennsylvania Hospital Authority
Revenue | | | |
(Penn State Health)
5.00% 11/1/51 | | 4,670,000 | 4,829,013 |
Louisiana Local Government Environmental Facilities
& Community Development Authority Revenue | | | |
| (The Glen Retirement System Project) | | | |
| Series A 5.00% 1/1/49 | | 3,500,000 | 2,680,510 |
| Series A 5.00% 1/1/55 | | 2,635,000 | 1,944,156 |
| Louisiana Public Facilities Authority Revenue | | | |
(Ochsner Clinic Foundation Project)
Series A 3.00% 5/15/47 | | 10,000,000 | 8,014,900 |
Maricopa County, Arizona Industrial Development
Authority Senior Living Facility Revenue | | | |
(Christian Care Surprise Project)
144A 6.00% 1/1/48 # | | 5,645,000 | 4,376,399 |
| Michigan Finance Authority Hospital Revenue | | | |
| Series A 3.00% 12/1/49 | | 12,000,000 | 9,566,760 |
| Michigan State Strategic Fund Limited Revenue | | | |
(Evangelical Homes)
5.50% 6/1/47 | | 2,560,000 | 2,081,075 |
| | | Principal
amount° | Value (US $) |
| Municipal Bonds (continued) |
| Healthcare Revenue Bonds (continued) |
Missouri State, Health and Educational Facilities
Authority Revenue | | | |
(Mercy Health)
4.00% 6/1/53 | | 4,810,000 | $ 4,519,091 |
Montgomery County, Pennsylvania Industrial
Development Authority Revenue | | | |
| (Whitemarsh Continuing Care Retirement Community Project) | | | |
| 5.25% 1/1/40 | | 1,550,000 | 1,549,907 |
| 5.375% 1/1/50 | | 6,250,000 | 6,019,437 |
| Series A 5.375% 1/1/51 | | 2,000,000 | 1,922,280 |
Moon, Pennsylvania Industrial Development Authority
Revenue | | | |
(Baptist Homes Society)
6.125% 7/1/50 | | 8,935,000 | 6,123,513 |
| Muskingum County, Ohio Hospital Facilities Revenue | | | |
(Genesis Healthcare System Obligated Group Project)
5.00% 2/15/48 | | 2,000,000 | 1,950,060 |
Nassau County, New York Industrial Development
Agency Revenue | | | |
(Amsterdam at Harborside Project)
Series B 5.00% 1/1/58 • | | 10,884,206 | 3,259,167 |
| New Hampshire, National Finance Authority Revenue | | | |
| (The Vista Project) | | | |
| Series A 144A 5.25% 7/1/39 # | | 1,515,000 | 1,518,000 |
| Series A 144A 5.625% 7/1/46 # | | 1,000,000 | 1,003,830 |
| Series A 144A 5.75% 7/1/54 # | | 2,000,000 | 2,005,240 |
New Hope, Texas Cultural Education Facilities
Finance Revenue | | | |
(Army Retirement Residence Foundation Project)
6.00% 7/15/57 | | 6,000,000 | 6,142,140 |
| (Buckingham Senior Living Community, Inc. Project) | | | |
| Series A-1 7.50% 11/15/37 | | 120,000 | 96,162 |
| Series A-2 7.50% 11/15/36 | | 745,000 | 635,269 |
| Series B 2.00% 11/15/61 • | | 3,150,433 | 1,188,785 |
| (Cardinal Bay - Village on the Park) | | | |
| Series A-1 5.00% 7/1/46 | | 660,000 | 531,564 |
| Series A-1 5.00% 7/1/51 | | 1,575,000 | 1,273,340 |
| Series B 4.00% 7/1/31 | | 635,000 | 355,600 |
| Series B 4.75% 7/1/51 | | 1,915,000 | 1,072,400 |
Schedules of investments
Delaware National High-Yield Municipal Bond Fund
| | | Principal
amount° | Value (US $) |
| Municipal Bonds (continued) |
| Healthcare Revenue Bonds (continued) |
New Hope, Texas Cultural Education Facilities
Finance Revenue | | | |
| (Cardinal Bay - Village on the Park) |
| Series C 5.00% 7/1/31 ‡ | | 250,000 | $ 57,500 |
| Series C 5.25% 7/1/36 ‡ | | 350,000 | 80,500 |
| Series C 5.75% 7/1/51 ‡ | | 2,250,000 | 517,500 |
| Series D 6.00% 7/1/26 ‡ | | 90,000 | 12,600 |
| Series D 7.00% 7/1/51 ‡ | | 1,350,000 | 189,000 |
(Legacy Midtown Park Project)
Series A 5.50% 7/1/54 | | 5,000,000 | 3,771,800 |
(Sanctuary LTC Project)
Series A-1 5.50% 1/1/57 | | 15,635,000 | 15,107,006 |
| (The Outlook at Windhaven Project) | | | |
| Series A 6.75% 10/1/52 | | 1,000,000 | 991,220 |
| Series A 6.875% 10/1/57 | | 6,500,000 | 6,486,610 |
New Jersey Economic Development Authority
Revenue | | | |
(Black Horse EHT Urban Renewal LLC Project)
Series A 144A 5.00% 10/1/39 # | | 3,125,000 | 2,303,719 |
(Lions Gate Project)
5.25% 1/1/44 | | 2,000,000 | 1,973,560 |
| New York State Dormitory Authority Revenue | | | |
(Garnet Health Medical Center)
144A 5.00% 12/1/40 # | | 800,000 | 783,008 |
North Carolina Medical Care Commission Health
Care Facilities Revenue | | | |
(Novant Health Obligated Group)
Series A 3.125% 11/1/49 | | 5,000,000 | 3,998,900 |
Northampton County, Pennsylvania Industrial
Development Authority Revenue | | | |
(Morningstar Senior Living)
5.00% 11/1/49 | | 1,830,000 | 1,652,984 |
| Oklahoma Development Finance Authority Revenue | | | |
(OU Medicine Project)
Series B 5.50% 8/15/57 | | 3,000,000 | 3,088,440 |
Onondaga, New York Civic Development Tax-exempt
Revenue | | | |
| (Crouse Health Hospital, Inc. Project) | | | |
| Series A 5.125% 8/1/44 | | 500,000 | 510,445 |
| Series A 5.375% 8/1/54 | | 1,250,000 | 1,286,900 |
| Palomar Health, California Revenue | | | |
| 4.00% 11/1/39 | | 4,375,000 | 3,860,150 |
| | | Principal
amount° | Value (US $) |
| Municipal Bonds (continued) |
| Healthcare Revenue Bonds (continued) |
Payne County, Oklahoma Economic Development
Authority Revenue | | | |
(Epworth Living at the Ranch)
Series A 7.00% 11/1/51 ‡ | | 961,600 | $ 1,971 |
Pennsylvania Economic Development Financing
Authority First Mortgage Revenue | | | |
(Tapestry Moon Senior Housing Project)
Series A 144A 6.75% 12/1/53 #, ‡ | | 10,495,000 | 4,001,219 |
| Prince George's County, Maryland Revenue | | | |
(Collington Episcopal Life Care Community)
5.25% 4/1/47 | | 2,000,000 | 1,879,140 |
Rhode Island Health and Educational Building
Revenue | | | |
| 5.25% 5/15/54 | | 6,100,000 | 6,543,714 |
| Salem, Oregon Hospital Facility Authority Revenue | | | |
(Capital Manor Project)
5.00% 5/15/53 | | 1,895,000 | 1,846,943 |
Seminole County, Florida Industrial Development
Authority Revenue | | | |
| (Legacy Pointe at UCF Project) | | | |
| Series A 5.25% 11/15/39 | | 2,000,000 | 2,006,140 |
| Series A 5.50% 11/15/49 | | 9,000,000 | 8,890,380 |
Shelby County, Tennessee Health Educational &
Housing Facilities Board Revenue | | | |
(The Farms at Bailey Station Project)
5.75% 10/1/59 | | 3,830,000 | 2,620,180 |
| Southeastern Ohio Port Authority Revenue | | | |
| (Memorial Health Systems) | | | |
| 5.00% 12/1/43 | | 805,000 | 750,550 |
| 5.50% 12/1/43 | | 1,250,000 | 1,238,625 |
St. Louis County, Missouri Industrial Development
Authority Revenue | | | |
| (Nazareth Living Center Project) | | | |
| Series A 5.00% 8/15/35 | | 600,000 | 575,544 |
| Series A 5.125% 8/15/45 | | 1,800,000 | 1,632,186 |
Tarrant County, Texas Cultural Education Facilities
Finance Revenue | | | |
(Air Force Villages Obligated Group Project)
5.00% 5/15/45 | | 8,650,000 | 8,283,499 |
| (Buckner Senior Living - Ventana Project) | | | |
| Series A 6.75% 11/15/47 | | 3,250,000 | 3,365,928 |
| Series A 6.75% 11/15/52 | | 5,800,000 | 5,987,746 |
Schedules of investments
Delaware National High-Yield Municipal Bond Fund
| | | Principal
amount° | Value (US $) |
| Municipal Bonds (continued) |
| Healthcare Revenue Bonds (continued) |
Tempe, Arizona Industrial Development Authority
Revenue | | | |
| (Mirabella at ASU Project) | | | |
| Series A 144A 6.125% 10/1/47 # | | 2,150,000 | $ 1,360,628 |
| Series A 144A 6.125% 10/1/52 # | | 2,570,000 | 1,586,332 |
University of North Carolina Board of Governors
Revenue | | | |
| 5.00% 2/1/49 | | 19,355,000 | 22,543,349 |
Westchester County, New York Local Development
Revenue | | | |
(Purchase Senior Learning Community, Inc. Project)
Series A 144A 5.00% 7/1/56 # | | 4,250,000 | 4,249,660 |
| Westminster, Maryland Project Revenue | | | |
| (Lutheran Village Millers Grant) | | | |
| Series A 6.00% 7/1/34 | | 1,000,000 | 1,000,690 |
| Series A 6.125% 7/1/39 | | 750,000 | 750,315 |
| Series A 6.25% 7/1/44 | | 2,500,000 | 2,500,700 |
Wisconsin Health & Educational Facilities Authority
Revenue | | | |
(Children's Hospital of Wisconsin)
3.00% 8/15/52 | | 3,000,000 | 2,290,980 |
| (Covenant Communities Project) | | | |
| Second Tier Series B 5.00% 7/1/48 | | 1,000,000 | 821,490 |
| Second Tier Series B 5.00% 7/1/53 | | 945,000 | 752,078 |
| Third Tier Series C 7.00% 7/1/43 | | 1,000,000 | 853,540 |
| Third Tier Series C 7.50% 7/1/53 | | 1,000,000 | 854,380 |
| (Dickson Hollow Phase II Project) | | | |
| 5.45% 10/1/39 | | 500,000 | 518,420 |
| 6.00% 10/1/44 | | 300,000 | 315,021 |
| 6.125% 10/1/59 | | 2,750,000 | 2,842,758 |
| (St. Camillus Health System) | | | |
| Series A 5.00% 11/1/39 | | 635,000 | 612,705 |
| Series A 5.00% 11/1/46 | | 1,000,000 | 908,950 |
| Series A 5.00% 11/1/54 | | 3,500,000 | 3,040,590 |
| Wisconsin Public Finance Authority Revenue | | | |
| (Bancroft Neurohealth Project) | | | |
| Series A 144A 5.00% 6/1/36 # | | 960,000 | 961,191 |
| Series A 144A 5.125% 6/1/48 # | | 1,375,000 | 1,364,619 |
| (Goodwill Industries of Southern Nevada Project) | | | |
| Series A 5.50% 12/1/38 | | 2,572,956 | 2,365,730 |
| Series A 5.75% 12/1/48 | | 2,576,272 | 2,279,279 |
| | | Principal
amount° | Value (US $) |
| Municipal Bonds (continued) |
| Healthcare Revenue Bonds (continued) |
Woodbury, Minnesota Housing & Redevelopment
Authority Revenue | | | |
(St. Therese of Woodbury)
5.125% 12/1/44 | | 1,250,000 | $ 1,206,387 |
| Yamhill County, Oregon Hospital Authority Revenue | | | |
(Friendsview)
Series A 5.00% 11/15/56 | | 1,600,000 | 1,294,032 |
| | 439,537,776 |
| Housing Revenue Bonds — 3.21% |
California CSCDA Community Improvement Authority
Essential Housing Revenue | | | |
(Jefferson - Anaheim)
Series A-2 144A 3.125% 8/1/56 # | | 1,500,000 | 1,161,915 |
(Parallel - Anaheim)
Series A 144A 4.00% 8/1/56 # | | 700,000 | 630,056 |
(Pasadena Portfolio)
Series A-2 144A 3.00% 12/1/56 # | | 5,800,000 | 4,110,750 |
| California Municipal Finance Authority Revenue | | | |
| Series I 144A 6.00% 1/1/39 # | | 6,530,000 | 6,911,679 |
| City of Dallas, Texas Housing Finance Revenue | | | |
Residential Development-Senior Lien
Series A 6.00% 12/1/62 | | 2,000,000 | 1,987,880 |
| Connecticut Housing Finance Authority Revenue | | | |
(Housing Mortgage Finance Program)
Series D 5.35% 11/15/48 | | 7,000,000 | 7,337,680 |
| Georgia Housing & Finance Authority Revenue | | | |
| Series B 5.05% 12/1/43 | | 2,500,000 | 2,653,400 |
| Series B 5.20% 12/1/48 | | 1,615,000 | 1,686,754 |
| Series B 5.25% 6/1/51 | | 2,000,000 | 2,124,740 |
Idaho Housing & Finance Association Single Family
Mortgage Revenue | | | |
| Series C 4.80% 7/1/53 | | 5,965,000 | 6,033,180 |
| Illinois Housing Development Authority Revenue | | | |
| Series K 5.35% 4/1/47 | | 7,400,000 | 7,764,302 |
Independent Cities, California Finance Authority
Mobile Home Park Revenue | | | |
(Pillar Ridge)
Series A 5.25% 5/15/44 | | 750,000 | 750,675 |
Indiana Housing & Community Development Authority
Single Family Mortgage Revenue | | | |
| Series D-1 5.00% 7/1/43 | | 1,500,000 | 1,567,260 |
| Series D-1 5.125% 7/1/48 | | 1,850,000 | 1,910,791 |
Schedules of investments
Delaware National High-Yield Municipal Bond Fund
| | | Principal
amount° | Value (US $) |
| Municipal Bonds (continued) |
| Housing Revenue Bonds (continued) |
Indiana Housing & Community Development Authority
Single Family Mortgage Revenue | | | |
| Series D-1 5.20% 7/1/53 | | 5,000,000 | $ 5,218,250 |
| Maine State Housing Authority Revenue | | | |
| Series A 3.00% 11/15/44 | | 2,525,000 | 2,058,784 |
Nebraska Investment Finance Authority Single Family
Housing Revenue | | | |
| Series G 5.40% 9/1/53 | | 5,000,000 | 5,256,950 |
New York City, New York Housing Development
Revenue | | | |
| 4.80% 2/1/53 | | 5,000,000 | 5,059,000 |
Pennsylvania Housing Finance Agency Single Family
Mortgage Revenue | | | |
| (Social Bonds) | | | |
| Series 141A 4.60% 10/1/43 | | 1,645,000 | 1,673,590 |
| Series 142A 5.00% 10/1/50 | | 10,340,000 | 10,682,874 |
| Series 143A 5.45% 4/1/51 | | 5,000,000 | 5,286,150 |
| Series 146A 4.75% 4/1/53 | | 5,000,000 | 5,042,500 |
| Rhode Island Housing & Mortgage Finance Revenue | | | |
| Series 80-A 4.65% 10/1/53 | | 3,000,000 | 3,016,170 |
South Carolina State Housing Finance &
Development Authority Revenue | | | |
| Series B 4.90% 7/1/53 | | 1,450,000 | 1,484,887 |
Texas Department of Housing & Community Affairs
Revenue | | | |
| Series C 5.125% 9/1/53 | | 2,500,000 | 2,598,200 |
| Virginia Housing Development Authority | | | |
| Series A 5.30% 11/1/53 | | 3,500,000 | 3,673,285 |
Wisconsin Housing & Economic Development
Authority Housing Revenue | | | |
| Series C 3.00% 5/1/59 | | 1,100,000 | 781,594 |
| Wisconsin Public Finance Authority Revenue | | | |
(The Promenade Apartments)
144A 6.25% 2/1/39 # | | 8,500,000 | 8,841,105 |
| | 107,304,401 |
| Industrial Development Revenue/Pollution ControlRevenue Bonds — 22.65% |
Allegheny County, Pennsylvania Industrial
Development Authority Revenue | | | |
(United States Steel Corporation Project)
5.75% 8/1/42 (AMT) | | 2,000,000 | 2,001,400 |
| | | Principal
amount° | Value (US $) |
| Municipal Bonds (continued) |
| Industrial Development Revenue/Pollution ControlRevenue Bonds (continued) |
| Arizona Industrial Development Authority Revenue | | | |
| (Legacy Cares, Inc. Project) | | | |
| Series A 144A 6.00% 7/1/51 #, ‡ | | 6,540,000 | $ 261,600 |
| Series A 144A 7.75% 7/1/50 #, ‡ | | 21,330,000 | 853,200 |
| Arkansas Development Finance Authority Revenue | | | |
| (Hybar Steel Project) | | | |
| Series A 144A 6.875% 7/1/48 (AMT) # | | 10,000,000 | 11,021,500 |
| Series B 144A 7.375% 7/1/48 (AMT) # | | 10,000,000 | 11,081,400 |
(United States Steel Corporation Project)
5.70% 5/1/53 (AMT) | | 18,750,000 | 20,007,187 |
| Black Belt, Alabama Energy Gas District Revenue | | | |
(Gas Project)
Series D-1 5.50% 6/1/49 • | | 2,330,000 | 2,495,943 |
Buckeye, Ohio Tobacco Settlement Financing
Authority Revenue | | | |
| (Senior) | | | |
| Series A-2 Class 1 3.00% 6/1/48 | | 13,775,000 | 10,428,915 |
| Series A-2 Class 1 4.00% 6/1/48 | | 150,000 | 136,867 |
| Series B-2 Class 2 5.00% 6/1/55 | | 64,670,000 | 59,535,202 |
Calhoun County, Texas Navigation Industrial
Development Authority Revenue | | | |
(Max Midstream Texas, LLC Project)
Series A 144A 3.625% 7/1/26 (AMT) # | | 3,285,000 | 2,789,951 |
California Community Choice Financing Authority
Revenue | | | |
| (Clean Energy Project) | | | |
| Series B 5.00% 1/1/55 • | | 5,000,000 | 5,396,250 |
| Series C 5.25% 1/1/54 • | | 3,000,000 | 3,220,200 |
California County Tobacco Securitization Agency
Settlement Revenue | | | |
(Capital Appreciation Bond - Fresno County Tobacco Funding Corporation)
Series D 8.613% 6/1/55 ^ | | 100,000,000 | 9,485,000 |
(Capital Appreciation Bond- Stanislaus County Tobacco Funding Corporation)
Series D 8.239% 6/1/55 ^ | | 6,250,000 | 505,375 |
California Infrastructure & Economic Development
Bank Revenue | | | |
(Brightline West Passenger Rail Project)
Series A-4 144A 8.00% 1/1/50 (AMT) #, • | | 22,800,000 | 23,018,196 |
Schedules of investments
Delaware National High-Yield Municipal Bond Fund
| | | Principal
amount° | Value (US $) |
| Municipal Bonds (continued) |
| Industrial Development Revenue/Pollution ControlRevenue Bonds (continued) |
California Pollution Control Financing Authority
Revenue | | | |
| (Calplant I Project) | | | |
| 144A 7.50% 7/1/32 (AMT) #, ‡ | | 1,600,000 | $ 21,600 |
| 144A 8.00% 7/1/39 (AMT) #, ‡ | | 5,250,000 | 70,875 |
Chicago, Illinois O'Hare International Airport Special
Facilities Revenue | | | |
(Trips Obligated Group)
5.00% 7/1/48 (AMT) | | 150,000 | 151,575 |
Children's Trust Fund Revenue, Commonwealth of
Puerto Rico | | | |
| (Tobacco Settlement Asset-Backed) | | | |
| Series A 7.707% 5/15/57 ^ | | 225,000,000 | 15,484,500 |
| Series B 9.403% 5/15/57 ^ | | 3,420,000 | 212,485 |
| City of Houston, Texas Airport System Revenue | | | |
| Series B-1 5.00% 7/15/35 (AMT) | | 3,000,000 | 3,012,420 |
(Special Facilities Continental Airlines, Inc. Terminal Improvements Projects)
Series 2011 6.625% 7/15/38 (AMT) | | 2,000,000 | 2,002,640 |
(United Airlines Inc.)
5.00% 7/1/29 (AMT) | | 1,150,000 | 1,150,345 |
City of Valparaiso, Indiana Exempt Facilities
Refunding Revenue | | | |
(Pratt Paper (In), LLC Project)
144A 5.00% 1/1/54 (AMT) # | | 5,000,000 | 5,169,150 |
District of Columbia Tobacco Settlement Financing
Revenue | | | |
| (Capital Appreciation-Asset-Backed) | | | |
| Series C 3.88% 6/15/55 ^ | | 121,000,000 | 12,003,200 |
| Series D 7.392% 6/15/55 ^ | | 262,500,000 | 23,884,875 |
Erie County, New York Tobacco Asset Securitization
Revenue | | | |
| (Capital Appreciation-Asset-Backed) | | | |
| Series A 144A 9.212% 6/1/60 #, ^ | | 196,565,000 | 9,535,368 |
| Series D 7.815% 6/1/55 ^ | | 4,000,000 | 328,240 |
Fayette County, Georgia Development Authority
Revenue | | | |
| (United States Soccer Federation, Inc. Project) | | | |
| 5.25% 10/1/49 | | 2,000,000 | 2,177,420 |
| 5.25% 10/1/54 | | 2,005,000 | 2,169,069 |
| | | Principal
amount° | Value (US $) |
| Municipal Bonds (continued) |
| Industrial Development Revenue/Pollution ControlRevenue Bonds (continued) |
Finance Authority of Maine Solid Waste Disposal
Revenue | | | |
(Casella Waste System Project)
Series R-2 144A 4.375% 8/1/35 (AMT) #, • | | 1,000,000 | $ 1,001,510 |
| Florida Development Finance Revenue | | | |
(Brightline Florida Passenger Rail Expansion Project)
Series A 144A 8.25% 7/1/57 (AMT) #, • | | 24,400,000 | 24,634,240 |
(Brightline Florida Passenger Rail Project)
144A 12.00% 7/15/32 (AMT) #, • | | 35,285,000 | 37,666,737 |
George L Smith II World Congress Center, Georgia
Authority Revenue | | | |
(Convention Center Hotel Second Tier)
Series B 144A 5.00% 1/1/54 # | | 10,000,000 | 9,508,100 |
(Convention Center Hotel)
First Tier Series A 4.00% 1/1/54 | | 13,060,000 | 11,701,891 |
| Georgia Main Street Natural Gas Project Revenue | | | |
| Series A 4.00% 5/15/39 | | 5,500,000 | 5,231,710 |
| Series C 5.00% 12/1/54 • | | 5,000,000 | 5,352,500 |
Golden State, California Tobacco Securitization
Corporate Settlement Revenue | | | |
(Capital Appreciation)
Series B-2 1.355% 6/1/66 ^ | | 355,550,000 | 41,517,573 |
Hoover, Alabama Industrial Development Board
Environmental Improvement Revenue | | | |
(United States Steel Corporation Project)
5.75% 10/1/49 (AMT) | | 10,250,000 | 10,868,280 |
| Indiana Finance Authority Exempt Facility Revenue | | | |
(Polyflow Indiana Project - Green Bonds)
144A 7.00% 3/1/39 (AMT) # | | 6,635,000 | 3,893,949 |
Inland, California Empire Tobacco Securitization
Revenue | | | |
| (Capital Appreciation Turbo Asset-Backed) | | | |
| Series E 144A 8.455% 6/1/57 #, ^ | | 383,610,000 | 31,118,443 |
| Series F 144A 5.666% 6/1/57 #, ^ | | 406,910,000 | 27,071,722 |
| Kentucky Public Energy Authority Revenue | | | |
| Series B 5.00% 1/1/55 • | | 3,500,000 | 3,803,380 |
| Louisiana Public Facilities Authority Revenue | | | |
| (Louisiana Pellets Project) | | | |
| 144A 7.75% 7/1/39 (AMT) #, ‡ | | 1,976,705 | 20 |
| Series A 8.375% 7/1/39 (AMT) ‡ | | 13,547,003 | 135 |
| Series B 10.50% 7/1/39 (AMT) ‡ | | 12,201,587 | 122 |
Schedules of investments
Delaware National High-Yield Municipal Bond Fund
| | | Principal
amount° | Value (US $) |
| Municipal Bonds (continued) |
| Industrial Development Revenue/Pollution ControlRevenue Bonds (continued) |
| Lower Alabama Gas District Revenue | | | |
| Series A 5.00% 9/1/46 | | 10,910,000 | $ 12,005,146 |
| Maine Finance Authority Revenue | | | |
(Go Lab Madison, LLC Project)
144A 8.00% 12/1/51 (AMT) # | | 10,950,000 | 6,017,792 |
Maricopa County, Arizona Industrial Development
Authority Revenue | | | |
(Commercial Metals Company Project)
144A 4.00% 10/15/47 (AMT) # | | 8,020,000 | 7,264,837 |
Miami-Dade County, Florida Industrial Development
Authority Revenue | | | |
(CFC-MB I, LLC Collins Park Housing Project)
144A 6.25% 1/1/59 # | | 7,000,000 | 7,147,070 |
Michigan Finance Authority Limited Obligation
Revenue | | | |
| Series B-2 4.97% 6/1/65 ^ | | 10,000,000 | 1,131,500 |
Mobile County, Alabama Industrial Development
Authority Revenue | | | |
(AM/NS Calvert LLC Project)
Series A 5.00% 6/1/54 (AMT) | | 3,000,000 | 3,122,400 |
Monroe, New York Tobacco Asset Securitization
Revenue | | | |
(Forth Subordinate - Capital Appreciation - Asset-Backed)
Series A 144A 7.939% 6/1/61 #, ^ | | 487,500,000 | 24,082,500 |
Nassau County, New York Tobacco Settlement
Revenue | | | |
(Asset-Backed)
Series A-3 5.125% 6/1/46 | | 10,000,000 | 9,091,700 |
Nevada State Department of Business & Industry
Revenue | | | |
(Fulcrum Sierra Biofuels, LLC Project - Green Bonds)
144A 6.25% 12/15/37 (AMT) #, ‡ | | 2,403,922 | 384,628 |
New Jersey Economic Development Authority Special
Facility Revenue | | | |
| (Continental Airlines Project) | | | |
| 5.25% 9/15/29 (AMT) | | 4,000,000 | 4,003,800 |
| Series B 5.625% 11/15/30 (AMT) | | 1,270,000 | 1,279,360 |
| New Jersey Tobacco Settlement Financing Revenue | | | |
| Subordinate Series B 5.00% 6/1/46 | | 4,300,000 | 4,340,549 |
| | | Principal
amount° | Value (US $) |
| Municipal Bonds (continued) |
| Industrial Development Revenue/Pollution ControlRevenue Bonds (continued) |
New York City, New York Industrial Development
Agency Revenue | | | |
(Queens Baseball Stadium Project)
Series A 2.00% 1/1/38 (AGM) | | 500,000 | $ 381,420 |
(Yankee Stadium Project)
Series A 3.00% 3/1/49 | | 1,000,000 | 753,140 |
| New York Counties Tobacco Trust IV Revenue | | | |
| Series F 0.15% 6/1/60 ^ | | 55,000,000 | 3,519,450 |
New York Counties Tobacco Trust V Pass-Through
Revenue | | | |
(Capital Appreciation Turbo Asset-Backed)
Series S4-B 144A 0.269% 6/1/60 #, ♦, ^ | | 322,800,000 | 14,797,152 |
New York Counties Tobacco Trust VI Pass-Through
Revenue | | | |
| Series C 5.00% 6/1/51 ♦ | | 1,000,000 | 938,950 |
New York Transportation Development Special
Facility Revenue | | | |
(American Airlines Inc. John F. Kennedy International Airport Project)
5.375% 8/1/36 (AMT) | | 1,000,000 | 1,067,020 |
| (Delta Airlines, Inc. - LaGuardia Airport Terminals C&D Redevelopment Project) | | | |
| 4.375% 10/1/45 (AMT) | | 16,840,000 | 16,221,467 |
| 5.00% 10/1/40 (AMT) | | 3,400,000 | 3,514,376 |
Ohio, Port of Greater Cincinnati Development
Authority Revenue | | | |
| (RBM Phase 3 Garage Project) | | | |
| 5.00% 12/1/44 | | 1,000,000 | 1,020,220 |
| 5.125% 12/1/55 | | 1,500,000 | 1,512,000 |
Pennsylvania Economic Development Financing
Authority Revenue | | | |
(National Gypsum)
5.50% 11/1/44 (AMT) | | 4,500,000 | 4,505,895 |
Port Beaumont, Texas Navigation District Dock &
Wharf Facility Revenue | | | |
| (Jefferson Gulf Coast Energy Project) | | | |
| Series A 144A 2.875% 1/1/41 (AMT) # | | 1,750,000 | 1,523,218 |
| Series A 144A 5.125% 1/1/44 (AMT) # | | 2,000,000 | 2,123,980 |
| Series A 144A 5.25% 1/1/54 (AMT) # | | 2,000,000 | 2,127,200 |
Schedules of investments
Delaware National High-Yield Municipal Bond Fund
| | | Principal
amount° | Value (US $) |
| Municipal Bonds (continued) |
| Industrial Development Revenue/Pollution ControlRevenue Bonds (continued) |
Port of Seattle, Washington Industrial Development
Special Facilities Revenue | | | |
(Delta Airlines)
5.00% 4/1/30 (AMT) | | 2,000,000 | $ 2,000,540 |
Public Authority for Colorado Energy Natural Gas
Revenue | | | |
| 6.50% 11/15/38 | | 11,000,000 | 13,688,840 |
| Salt Verde, Arizona Financial Senior Gas Revenue | | | |
| 5.00% 12/1/37 | | 9,250,000 | 10,258,897 |
| 5.25% 12/1/27 | | 2,235,000 | 2,363,803 |
| 5.25% 12/1/28 | | 1,050,000 | 1,121,054 |
| 5.50% 12/1/29 | | 765,000 | 836,183 |
San Diego County, California Tobacco Settlement
Revenue Funding | | | |
| Series C 4.00% 6/1/32 | | 375,000 | 376,534 |
| Shoals, Indiana Exempt Facilities Revenue | | | |
(National Gypsum Project)
7.25% 11/1/43 (AMT) | | 1,860,000 | 1,863,571 |
| St. James Parish, Louisiana Revenue | | | |
| (NuStar Logistics, LP Project) | | | |
| 144A 6.10% 6/1/38 #, • | | 1,000,000 | 1,114,350 |
| Series B 144A 6.10% 12/1/40 #, • | | 1,630,000 | 1,820,840 |
Suffolk, New York Regional Off-Track Betting
Revenue | | | |
| 6.00% 12/1/53 | | 15,000,000 | 15,764,850 |
| Tennessee State Energy Acquisition Gas Revenue | | | |
| Series C 5.00% 2/1/27 | | 2,940,000 | 3,022,643 |
Tobacco Securitization Authority of Southern
California Revenue | | | |
(Capital Appreciation-Second Subordinate Lien)
Series C 1.574% 6/1/46 ^ | | 3,515,000 | 722,262 |
(Capital Appreciation-Third Subordinate Lien)
Series D 3.916% 6/1/46 ^ | | 8,770,000 | 1,507,475 |
(San Diego County Tobacco Asset Securitization Corporation)
Series B-1 Class 2 5.00% 6/1/48 | | 725,000 | 735,288 |
Tulsa, Oklahoma Municipal Airports Improvement
Trust Revenue | | | |
| Series A 5.50% 6/1/35 (AMT) | | 2,000,000 | 2,003,280 |
| | | Principal
amount° | Value (US $) |
| Municipal Bonds (continued) |
| Industrial Development Revenue/Pollution ControlRevenue Bonds (continued) |
Tuscaloosa County, Alabama Industrial Development
Authority Revenue | | | |
(Hunt Refining Project)
Series A 144A 5.25% 5/1/44 # | | 9,440,000 | $ 9,591,229 |
| Vermont Economic Development Authority Revenue | | | |
(Casella Waste System)
144A 4.625% 4/1/36 (AMT) #, • | | 1,000,000 | 1,019,630 |
| Virginia Tobacco Settlement Financing Revenue | | | |
| Series A-1 6.706% 6/1/46 | | 10,665,000 | 8,878,613 |
| Series B-1 5.00% 6/1/47 | | 2,000,000 | 2,000,220 |
| (Capital Appreciation-Asset-Backed) | | | |
| Series C 2.949% 6/1/47 ^ | | 95,170,000 | 26,682,813 |
| Series D 2.20% 6/1/47 ^ | | 179,085,000 | 49,112,270 |
Washington Economic Development Finance
Authority Revenue | | | |
(Columbia Pulp I, LLC Project)
Series 2017A 144A 7.50% 1/1/32 (AMT) #, ‡ | | 4,800,000 | 480 |
| Wisconsin Public Finance Authority Revenue | | | |
(Senior Lien - Grand Hyatt San Antonio Hotel Acquisition Project)
Series A 5.00% 2/1/62 | | 13,255,000 | 13,539,850 |
| | 756,884,545 |
| Lease Revenue Bonds — 2.71% |
| Atlanta, Georgia Development Authority Revenue | | | |
(Gluch Enterprise Zone Project)
144A 6.093% 12/15/48 #, ~ | | 2,500,000 | 2,027,750 |
Baltimore, Maryland Special Obligation Subordinate
Revenue | | | |
(Harbor Point Project)
5.00% 6/1/51 | | 1,000,000 | 1,005,130 |
California Statewide Communities Development
Authority Revenue | | | |
| (Lancer Plaza Project) | | | |
| 5.625% 11/1/33 | | 1,400,000 | 1,402,072 |
| 5.875% 11/1/43 | | 3,765,000 | 3,769,443 |
Idaho Falls, Idaho Annual Appropriation Certificates of
Participation Revenue | | | |
| 144A 5.25% 5/15/51 # | | 5,000,000 | 5,036,300 |
Schedules of investments
Delaware National High-Yield Municipal Bond Fund
| | | Principal
amount° | Value (US $) |
| Municipal Bonds (continued) |
| Lease Revenue Bonds (continued) |
Los Angeles County, California Public Works
Financing Authority Revenue | | | |
(LACMA Building for the Permanent Collection Project)
Series A 3.00% 12/1/50 | | 11,000,000 | $ 8,943,440 |
Metropolitan Pier & Exposition Authority, Illinois
Revenue | | | |
| (McCormick Place Expansion Project) | | | |
| Series A 4.00% 6/15/52 | | 8,305,000 | 7,732,121 |
| Series A 5.00% 6/15/50 | | 4,135,000 | 4,285,349 |
| Series A 5.92% 12/15/56 ^ | | 6,110,000 | 1,311,695 |
| Series B 4.952% 12/15/54 (BAM) ^ | | 3,535,000 | 896,228 |
| Series B 5.03% 12/15/54 ^ | | 3,710,000 | 881,348 |
New Jersey Transportation Trust Fund Authority
Revenue | | | |
| (Transportation Program) | | | |
| Series AA 4.00% 6/15/50 | | 2,945,000 | 2,833,708 |
| Series AA 5.00% 6/15/25 | | 1,000,000 | 1,016,790 |
| Series CC 5.50% 6/15/50 | | 4,250,000 | 4,691,618 |
(Transportation System)
Series A 4.991% 12/15/39 ^ | | 5,290,000 | 2,872,576 |
| New York Liberty Development Revenue | | | |
(4 World Trade Center Project)
Series A 3.00% 11/15/51 | | 5,750,000 | 4,283,117 |
(Class 1 - 3 World Trade Center Project)
144A 5.00% 11/15/44 # | | 14,500,000 | 14,512,035 |
(Class 3 - 3 World Trade Center Project)
144A 7.25% 11/15/44 # | | 7,250,000 | 7,272,330 |
| New York State Thruway Authority Revenue | | | |
| Series A-1 3.00% 3/15/49 | | 5,000,000 | 3,955,250 |
| Series A-1 3.00% 3/15/50 | | 3,640,000 | 2,856,162 |
Phoenix, Arizona Industrial Development Authority
Lease Revenue | | | |
| 5.125% 2/1/34 | | 1,000,000 | 968,850 |
| 5.375% 2/1/41 | | 1,300,000 | 1,227,278 |
| St. Louis, Missouri Municipal Finance Revenue | | | |
| (Convention Center Capital Improvement Project) | | | |
| Series A 6.43% 7/15/36 (AGM) ^ | | 2,250,000 | 1,395,315 |
| Series A 6.44% 7/15/37 (AGM) ^ | | 4,000,000 | 2,369,560 |
| | | Principal
amount° | Value (US $) |
| Municipal Bonds (continued) |
| Lease Revenue Bonds (continued) |
University of Missouri Industrial Development
Authority Revenue | | | |
(Markets At Olive Project)
Series A 5.50% 6/15/42 | | 3,000,000 | $ 3,056,310 |
| | 90,601,775 |
| Local General Obligation Bonds — 3.90% |
| Chicago, Illinois Board of Education | | | |
| Series A 5.00% 12/1/42 | | 7,690,000 | 7,685,770 |
| Series A 5.875% 12/1/47 | | 8,000,000 | 8,810,400 |
| Series A 6.00% 12/1/49 | | 13,820,000 | 15,327,900 |
| Series A 144A 7.00% 12/1/46 # | | 2,500,000 | 2,684,600 |
| Series B 4.00% 12/1/40 | | 4,500,000 | 4,242,420 |
| Series B 4.00% 12/1/41 | | 2,000,000 | 1,865,340 |
| Series G 5.00% 12/1/44 | | 2,545,000 | 2,570,755 |
| Series H 5.00% 12/1/36 | | 4,850,000 | 4,951,026 |
| Series H 5.00% 12/1/46 | | 4,225,000 | 4,257,406 |
| City of Chicago, Illinois | | | |
| Series 2005D 5.50% 1/1/37 | | 2,280,000 | 2,288,162 |
| Series 2007E 5.50% 1/1/42 | | 1,900,000 | 1,903,211 |
| Series A 5.50% 1/1/39 | | 2,660,000 | 2,935,417 |
| Series A 5.50% 1/1/40 | | 2,160,000 | 2,373,019 |
| Series A 5.50% 1/1/49 | | 770,000 | 801,832 |
| Series C 5.00% 1/1/26 | | 500,000 | 510,345 |
(Chicago Recovery Plan)
Series A 5.25% 1/1/45 | | 12,100,000 | 12,939,982 |
| Conroe, Texas Independent School District | | | |
| 5.00% 2/15/49 (PSF) | | 10,000,000 | 10,984,400 |
| Fairfield, Alabama General Obligation Warrants | | | |
| 6.00% 6/1/37 | | 8,485,000 | 7,636,500 |
| Fort Bend, Texas Independent School District | | | |
| Series 2024A 5.00% 8/15/33 (PSF) | | 1,550,000 | 1,813,360 |
| Series 2024A 5.00% 8/15/43 (PSF) | | 3,640,000 | 4,060,238 |
Lamar, Texas Consolidated Independent School
District | | | |
| 5.25% 2/15/59 (PSF) | | 5,000,000 | 5,515,400 |
| Lodi, California Unified School District | | | |
| Series 2020 3.00% 8/1/43 | | 2,750,000 | 2,356,943 |
MIDA Golf and Equestrian Center Public
Infrastructure District, Utah | | | |
| 144A 4.50% 6/1/51 # | | 7,500,000 | 6,003,150 |
| 144A 4.625% 6/1/57 # | | 7,000,000 | 5,615,680 |
Schedules of investments
Delaware National High-Yield Municipal Bond Fund
| | | Principal
amount° | Value (US $) |
| Municipal Bonds (continued) |
| Local General Obligation Bonds (continued) |
| Prairie Center Metropolitan District No. 3, Colorado | | | |
| Series A 5.875% 12/15/46 | | 2,125,000 | $ 2,295,744 |
| Verve, Colorado Metropolitan District No. 1 | | | |
| 5.00% 12/1/51 | | 1,000,000 | 802,160 |
| Village of Riverdale, Illinois | | | |
| 8.00% 10/1/36 | | 6,925,000 | 6,940,512 |
| | 130,171,672 |
| Pre-Refunded/Escrowed to Maturity Bonds — 1.62% |
Blythe Township, Pennsylvania Solid Waste Authority
Revenue | | | |
| 7.75% 12/1/37-27 (AMT) § | | 2,725,000 | 3,047,667 |
| California School Finance Authority Revenue | | | |
(Aspire Public Schools-Obligated Group)
144A 5.00% 8/1/41-25 #, § | | 125,000 | 127,665 |
(Escuela Popular Project)
144A 6.50% 7/1/50-27 #, § | | 1,590,000 | 1,756,362 |
Central Texas Regional Mobility Authority Senior Lien
Revenue | | | |
| Series A 5.00% 1/1/45-25 § | | 4,000,000 | 4,074,360 |
| Decatur County, Texas Hospital Authority | | | |
| (Wise Regional Health System) | | | |
| Series C 4.00% 9/1/29 | | 491,000 | 504,277 |
| Series C 4.00% 9/1/34-31 § | | 987,000 | 1,032,895 |
| Series C 4.00% 9/1/44-31 § | | 2,036,000 | 2,181,330 |
Golden State, California Tobacco Securitization
Corporate Settlement Revenue | | | |
(Enhanced Asset-Backed)
Series A 5.00% 6/1/35-25 § | | 6,265,000 | 6,383,972 |
Iowa Finance Authority Midwestern Disaster Area
Revenue | | | |
(Iowa Fertilizer Company Project)
5.00% 12/1/50-32 § | | 10,625,000 | 12,357,088 |
Multnomah County, Oregon Hospital Facilities
Authority Revenue | | | |
(Mirabella at South Waterfront)
Series A 5.50% 10/1/49-24 § | | 2,400,000 | 2,403,672 |
New Jersey Economic Development Authority Special
Facility | | | |
| Series WW 5.25% 6/15/30-25 § | | 5,000,000 | 5,105,550 |
North Texas Tollway Authority Special Project System
Revenue | | | |
| Series C 7.00% 9/1/43-31 §, ~ | | 5,000,000 | 6,190,600 |
| | | Principal
amount° | Value (US $) |
| Municipal Bonds (continued) |
| Pre-Refunded/Escrowed to Maturity Bonds (continued) |
Osceola County, Florida Expressway System Senior
Lien | | | |
(Poinciana Parkway Project)
Series A 5.375% 10/1/47-24 § | | 2,000,000 | $ 2,003,260 |
San Francisco City & County, California Airport
Commission Revenue | | | |
(San Francisco International Airport)
Series A 4.00% 5/1/49-29 (AMT) § | | 55,000 | 56,769 |
Washington State Housing Finance Commission
Revenue | | | |
(Heron's Key Senior Living)
Series A 144A 7.00% 7/1/45-25 #, § | | 1,000,000 | 1,028,910 |
(Heron's Key)
Series A 144A 7.00% 7/1/50-25 #, § | | 3,625,000 | 3,729,799 |
| Wisconsin Public Finance Authority Revenue | | | |
(Rose Villa Project)
Series A 144A 5.75% 11/15/44-24 #, § | | 2,000,000 | 2,008,480 |
| | 53,992,656 |
| Resource Recovery Revenue Bonds — 0.25% |
Brazoria County, Texas Industrial Development Solid
Waste Disposal Facilities Revenue | | | |
(Aleon Renewable Metals, LLC Project)
144A 10.00% 6/1/42 (AMT) #, • | | 3,000,000 | 3,009,390 |
Union County, New Jersey Improvement Authority
Revenue | | | |
(Aries Linden, LLC Project)
144A 6.75% 12/1/41 (AMT) # | | 7,990,000 | 5,289,460 |
| | 8,298,850 |
| Special Tax Revenue Bonds — 14.05% |
Allentown, Pennsylvania Neighborhood Improvement
Zone Development Authority Revenue | | | |
(Waterfront - 30 E. Allen Street Project)
Series A 144A 5.25% 5/1/42 # | | 1,275,000 | 1,299,875 |
| Atlanta, Georgia Development Authority Revenue | | | |
(Westside Gulch Area Project)
Series A-2 144A 5.50% 4/1/39 # | | 5,000,000 | 5,105,700 |
Black Desert Public Infrastructure District, Utah
Revenue | | | |
(Black Desert Assessment Area #1)
144A 5.625% 12/1/53 # | | 2,000,000 | 2,071,660 |
Schedules of investments
Delaware National High-Yield Municipal Bond Fund
| | | Principal
amount° | Value (US $) |
| Municipal Bonds (continued) |
| Special Tax Revenue Bonds (continued) |
Branson, Missouri Industrial Development Authority
Tax Increment Revenue | | | |
(Branson Shoppes Redevelopment Project)
Series A 3.90% 11/1/29 | | 325,000 | $ 311,727 |
Celebration Pointe, Florida Community Development
District No. 1 Revenue | | | |
| 5.125% 5/1/45 | | 2,460,000 | 2,460,443 |
Cherry Hill, Virginia Community Development
Authority Revenue | | | |
| (Potomac Shores Project) | | | |
| 144A 5.15% 3/1/35 # | | 1,000,000 | 1,005,170 |
| 144A 5.40% 3/1/45 # | | 2,000,000 | 2,005,020 |
City of Kansas, Missouri Tax Increment Financing
Commission Revenue | | | |
(Brywood Centre Project)
Series A 8.00% 4/1/33 ‡ | | 3,950,000 | 750,500 |
| City of Newport Beach, California Revenue | | | |
| Series A 4.00% 9/2/33 | | 200,000 | 206,280 |
| Series A 4.125% 9/2/38 | | 575,000 | 585,977 |
City of Rancho, Mirage Community Facilities District
No. 5 Revenue | | | |
| Series A 5.00% 9/1/54 | | 1,400,000 | 1,454,348 |
City of Tampa, Florida Capital Improvement Cigarette
Tax Allocation Revenue | | | |
(H. Lee Moffitt Cancer Center Project)
Series A 4.55% 9/1/53 ^ | | 12,095,000 | 2,985,651 |
| Commonwealth of Puerto Rico Revenue | | | |
| 1.723% 11/1/51 • | | 19,338,526 | 12,400,830 |
| 2.314% 11/1/51 • | | 18,049,927 | 9,498,774 |
| 3.097% 11/1/43 • | | 79,270,216 | 50,237,499 |
Conley, Missouri Road Transportation Development
District Revenue | | | |
| 5.375% 5/1/47 | | 6,655,000 | 6,673,301 |
East Dundee, Illinois Limited Obligation Tax Increment
Revenue | | | |
(Route 25 South Redevelopment Project)
5.625% 12/1/31 | | 1,200,000 | 1,200,648 |
Fountain Urban Renewal Authority, Colorado
Revenue | | | |
(South Academy Highlands Project)
Series A 5.50% 11/1/44 | | 3,750,000 | 3,589,575 |
| | | Principal
amount° | Value (US $) |
| Municipal Bonds (continued) |
| Special Tax Revenue Bonds (continued) |
GDB Debt Recovery Authority of Puerto Rico
Revenue | | | |
(Taxable)
7.50% 8/20/40 | | 71,770,696 | $ 69,976,429 |
Glen Cove, New York Local Economic Assistance
Revenue | | | |
(Garvies Point Public Improvement Project)
Series A 5.00% 1/1/56 | | 2,000,000 | 1,700,680 |
Grandview, Missouri Industrial Development Authority
Revenue | | | |
(Grandview Crossing Project)
5.75% 12/1/28 ‡ | | 1,000,000 | 400,000 |
| Guam Government Business Privilege Tax Revenue | | | |
| Series F 4.00% 1/1/42 | | 2,500,000 | 2,441,200 |
Henderson, Nevada Local Improvement Districts
Revenue | | | |
| (Black Mountain Ranch) | | | |
| 3.00% 9/1/36 | | 300,000 | 257,832 |
| 3.50% 9/1/45 | | 720,000 | 585,187 |
| 4.00% 9/1/51 | | 495,000 | 434,526 |
Indianapolis, Indiana Local Public Improvement Bond
Bank Revenue | | | |
| (Convention Center Hotel Project) | | | |
| Series E 6.00% 3/1/53 | | 3,000,000 | 3,318,420 |
| Series E 6.125% 3/1/57 | | 3,250,000 | 3,594,500 |
Juban Crossing Economic Development District,
Louisiana Revenue | | | |
(General Infrastructure Projects)
Series C 144A 7.00% 9/15/44 # | | 2,910,000 | 2,914,220 |
(Road Projects)
Series A 144A 7.00% 9/15/44 # | | 1,745,000 | 1,747,530 |
Lakeside 370 Levee District, Missouri Subdistrict B
Revenue | | | |
| Series 2015-B 0.00% 4/1/55 | | 773,910 | 696,519 |
| Las Vegas, Nevada Revenue | | | |
| (Villages At Tule Springs Village 1) | | | |
| 144A 5.50% 6/1/37 # | | 740,000 | 758,019 |
| 144A 5.75% 6/1/42 # | | 1,090,000 | 1,114,678 |
| 144A 5.75% 6/1/47 # | | 1,560,000 | 1,583,322 |
| 144A 6.00% 6/1/52 # | | 1,780,000 | 1,828,683 |
Schedules of investments
Delaware National High-Yield Municipal Bond Fund
| | | Principal
amount° | Value (US $) |
| Municipal Bonds (continued) |
| Special Tax Revenue Bonds (continued) |
Las Vegas, Nevada Special Improvement District No.
817 Local Improvement Revenue | | | |
| (Summerlin Village 29) | | | |
| 5.50% 6/1/38 | | 375,000 | $ 397,657 |
| 5.75% 6/1/43 | | 500,000 | 525,415 |
| 6.00% 6/1/53 | | 1,000,000 | 1,044,910 |
Lees Summit, Missouri Industrial Development
Authority Revenue | | | |
(Kensington Farms Improvement Project)
5.75% 3/1/29 ‡ | | 2,185,000 | 1,201,750 |
Marquis Community Development Authority of York
County Virginia Revenue | | | |
| Series B 5.625% 9/1/41 ‡ | | 2,779,000 | 972,650 |
(Capital Appreciation Bonds)
Series C 0.00% 9/1/41 ^ | | 821,000 | 2,052 |
(Convertible Capital Appreciation Bonds)
144A 7.50% 9/1/45 #, ‡, ~ | | 859,000 | 300,650 |
Matching Fund Special Purpose Securitization, Virgin
Islands Revenue | | | |
| Series A 5.00% 10/1/39 | | 8,945,000 | 9,327,578 |
Midtown Miami, Florida Community Development
District Revenue | | | |
(Parking Garage Project)
Series A 5.00% 5/1/37 | | 500,000 | 500,095 |
| Mobile, Alabama Improvement District Revenue | | | |
| (McGowin Park Project) | | | |
| Series A 5.25% 8/1/30 | | 1,000,000 | 980,890 |
| Series A 5.50% 8/1/35 | | 1,300,000 | 1,260,493 |
| Monongalia County, West Virginia | | | |
| (Development District No. 4 – University Town Centre) | | | |
| Series A 144A 5.00% 6/1/33 # | | 920,000 | 969,570 |
| Series A 144A 5.75% 6/1/43 # | | 1,500,000 | 1,618,065 |
| Series A 144A 6.00% 6/1/53 # | | 1,500,000 | 1,616,205 |
| New Hampshire, National Finance Authority Revenue | | | |
(Tamarron Project, Fort Bend County, Texas)
144A 5.25% 12/1/35 # | | 6,825,000 | 6,828,139 |
New York City, New York Transitional Finance
Authority Future Tax Secured Revenue | | | |
| (Subordinate Bonds) | | | |
| Series A-3 3.00% 5/1/45 | | 5,000,000 | 4,143,150 |
| Series B-1 3.00% 8/1/48 | | 6,605,000 | 5,285,321 |
| | | Principal
amount° | Value (US $) |
| Municipal Bonds (continued) |
| Special Tax Revenue Bonds (continued) |
| New York State Dormitory Authority Revenue | | | |
| Series A 5.25% 3/15/52 | | 2,000,000 | $ 2,220,960 |
| New York State Urban Development Revenue | | | |
| (General Purpose) | | | |
| Series A 3.00% 3/15/50 | | 3,310,000 | 2,623,936 |
| Series E 3.00% 3/15/50 | | 2,500,000 | 1,981,825 |
New York Triborough Bridge & Tunnel Authority
Payroll Mobility Tax Senior Lien Revenue | | | |
(MTA Bridges and Tunnels)
Series C-3 3.00% 5/15/51 | | 8,500,000 | 6,671,480 |
Northampton County, Pennsylvania Industrial
Development Authority Revenue | | | |
(Route 33 Project)
7.00% 7/1/32 | | 1,655,000 | 1,657,996 |
| Ohio Infrastructure Improvement Revenue | | | |
(Hickory Chase Project)
Senior Series A 144A 5.00% 12/1/40 # | | 1,315,000 | 1,237,586 |
Oklahoma County, Oklahoma Finance Authority
Revenue | | | |
(Astec Project)
144A 6.25% 6/15/54 # | | 1,500,000 | 1,539,150 |
Orange County, California Community Facilities
District No. 2023-1 Revenue | | | |
| (Rienda Phase 2B) | | | |
| Series A 5.50% 8/15/48 | | 1,500,000 | 1,624,230 |
| Series A 5.50% 8/15/53 | | 1,200,000 | 1,293,480 |
Prairie Center Metropolitan District No. 3, Colorado
Revenue | | | |
| Series A 144A 5.00% 12/15/41 # | | 2,000,000 | 2,014,460 |
| Puerto Rico Sales Tax Financing Revenue | | | |
| (Restructured) | | | |
| Series A-1 4.75% 7/1/53 | | 42,908,000 | 42,585,761 |
| Series A-1 5.00% 7/1/58 | | 18,772,000 | 18,854,972 |
| Series A-1 5.831% 7/1/46 ^ | | 104,102,000 | 35,102,153 |
| Series A-1 5.915% 7/1/51 ^ | | 143,746,000 | 35,276,706 |
| Series A-2 4.536% 7/1/53 | | 1,022,000 | 980,354 |
| Series A-2 4.784% 7/1/58 | | 9,355,000 | 9,256,773 |
| Series B-1 4.75% 7/1/53 | | 5,619,000 | 5,576,801 |
Richmond Heights, Missouri Tax Increment &
Transaction Sales Tax Revenue | | | |
(Francis Place Redevelopment Project)
5.625% 11/1/25 | | 505,000 | 503,197 |
Schedules of investments
Delaware National High-Yield Municipal Bond Fund
| | | Principal
amount° | Value (US $) |
| Municipal Bonds (continued) |
| Special Tax Revenue Bonds (continued) |
San Buenaventura, California Redevelopment Agency
Revenue | | | |
| (Merged San Buenaventura Redevelopment Project) | | | |
| 7.75% 8/1/28 | | 725,000 | $ 727,755 |
| 8.00% 8/1/38 | | 1,500,000 | 1,505,865 |
St. Louis County, Missouri Industrial Development
Authority Revenue | | | |
| (Manchester Ballas Community) | | | |
| Series A 144A 5.00% 9/1/38 # | | 1,050,000 | 1,049,958 |
| Series A 144A 5.25% 9/1/45 # | | 3,540,000 | 3,539,752 |
Sterling Ranch, Colorado Community Authority Board
Revenue | | | |
| 5.625% 12/1/43 | | 1,500,000 | 1,557,570 |
Stone Canyon, Missouri Community Improvement
District Revenue | | | |
(Public Infrastructure Improvement Project)
5.75% 4/1/27 ‡ | | 1,250,000 | 350,000 |
| Town of Bridgeville, Delaware Revenue | | | |
| (Heritage Shores Special Development District) | | | |
| 144A 5.25% 7/1/44 # | | 875,000 | 919,958 |
| 144A 5.625% 7/1/53 # | | 1,535,000 | 1,623,600 |
| Verve, Colorado Metropolitan District No. 1 Revenue | | | |
| 6.50% 12/1/43 | | 4,365,000 | 4,341,036 |
| 6.75% 12/1/52 | | 4,000,000 | 3,979,960 |
Village Community Development District No. 15,
Florida | | | |
| 144A 5.00% 5/1/43 # | | 1,000,000 | 1,032,440 |
| 144A 5.25% 5/1/54 # | | 3,500,000 | 3,624,775 |
| Whiting Redevelopment District, Indiana Revenue | | | |
| 4.00% 1/15/32 | | 2,600,000 | 2,520,362 |
| Wisconsin Public Finance Authority Revenue | | | |
(American Dream @ Meadowlands Project)
144A 7.00% 12/1/50 # | | 5,065,000 | 5,201,147 |
| (McLemore Hotel & Conference Center) | | | |
| Series A 144A 4.50% 6/1/56 # | | 13,000,000 | 10,700,300 |
| Series B 144A 6.50% 6/1/56 # | | 1,000,000 | 856,800 |
(Miami Worldcenter Project)
Series A 144A 5.00% 6/1/41 # | | 9,500,000 | 9,691,615 |
(Nolina & Sorella Projects)
144A 5.50% 12/15/32 # | | 4,000,000 | 3,995,960 |
| | | Principal
amount° | Value (US $) |
| Municipal Bonds (continued) |
| Special Tax Revenue Bonds (continued) |
Wyandotte County, Kansas Unified Government
Special Obligation Revenue | | | |
(Sales Tax Vacation Village Project)
Series A 6.00% 9/1/35 | | 4,690,000 | $ 4,219,218 |
(Wyandotte Plaza Redevelopment Project)
5.00% 12/1/34 | | 3,000,000 | 2,919,330 |
| | 469,528,534 |
| State General Obligation Bonds — 5.06% |
| California State | | | |
| 4.00% 9/1/29 | | 3,950,000 | 4,218,718 |
| Commonwealth of Massachusetts | | | |
| Series A 5.00% 1/1/54 | | 12,000,000 | 13,069,200 |
| Series C 2.75% 3/1/50 | | 5,000,000 | 3,814,600 |
| Series D 4.00% 11/1/35 | | 5,000,000 | 5,221,850 |
| Commonwealth of Puerto Rico Revenue | | | |
| (Restructured) | | | |
| Series A-1 4.00% 7/1/37 | | 4,913,928 | 4,807,443 |
| Series A-1 4.00% 7/1/41 | | 39,322,237 | 37,374,213 |
| Series A-1 4.00% 7/1/46 | | 64,764,861 | 60,136,117 |
| Illinois State | | | |
| 5.00% 1/1/28 | | 1,190,000 | 1,218,965 |
| 5.50% 5/1/39 | | 6,000,000 | 6,592,860 |
| Series A 5.125% 12/1/29 | | 1,310,000 | 1,395,032 |
| Series A 5.50% 3/1/47 | | 9,700,000 | 10,638,475 |
| Series B 3.00% 12/1/41 | | 2,605,000 | 2,194,035 |
| Series C 4.00% 10/1/41 | | 400,000 | 390,080 |
| Series C 4.00% 10/1/42 | | 2,900,000 | 2,814,015 |
| Series C 5.00% 11/1/29 | | 4,600,000 | 4,879,312 |
(Rebuild Illinois Program)
Series B 4.00% 11/1/35 | | 2,000,000 | 2,008,540 |
| New Jersey State | | | |
(COVID-19 General Obligation Emergency Bonds)
Series A 4.00% 6/1/32 | | 2,080,000 | 2,241,616 |
| State of Washington | | | |
| Series C 5.00% 8/1/40 | | 5,250,000 | 6,006,525 |
| | 169,021,596 |
| Transportation Revenue Bonds — 9.00% |
Allegheny County, Pennsylvania Airport Authority
Revenue | | | |
| (Pittsburgh International Airport) | | | |
| Series A 5.50% 1/1/48 (AGM) (AMT) | | 5,000,000 | 5,498,550 |
Schedules of investments
Delaware National High-Yield Municipal Bond Fund
| | | Principal
amount° | Value (US $) |
| Municipal Bonds (continued) |
| Transportation Revenue Bonds (continued) |
Allegheny County, Pennsylvania Airport Authority
Revenue | | | |
| (Pittsburgh International Airport) |
| Series A 5.50% 1/1/53 (AGM) (AMT) | | 6,770,000 | $ 7,365,963 |
Burbank-Glendale-Pasadena, California Airport
Authority Brick Campaign Revenue | | | |
(Senior)
Series B 5.25% 7/1/54 (AMT) | | 6,000,000 | 6,436,140 |
California Municipal Finance Authority Senior Lien
Revenue | | | |
| (LINXS APM Project) | | | |
| Series A 4.00% 12/31/47 (AMT) | | 10,150,000 | 9,354,849 |
| Series A 5.00% 12/31/43 (AMT) | | 1,500,000 | 1,528,260 |
Central Texas Regional Mobility Authority Senior Lien
Revenue | | | |
| (Capital Appreciation bonds) | | | |
| 7.81% 1/1/36 ^ | | 2,500,000 | 1,608,050 |
| 7.85% 1/1/40 ^ | | 2,000,000 | 1,027,220 |
| Chicago O'Hare International Airport Revenue | | | |
(Senior Lien)
Series A 5.50% 1/1/59 (AMT) | | 3,760,000 | 4,086,894 |
City & County of Denver, Colorado Airport System
Revenue | | | |
| Series A 4.00% 12/1/48 (AMT) | | 5,000,000 | 4,678,600 |
City of Dallas and Fort Worth, Texas International
Airport Revenue | | | |
| 5.25% 11/1/48 | | 1,500,000 | 1,667,205 |
City of Los Angeles, California Department of Airports
Revenue | | | |
(Los Angeles International Airport)
Series F 3.00% 5/15/49 (AMT) | | 3,030,000 | 2,332,797 |
Colorado High Performance Transportation Enterprise
Revenue | | | |
(U.S. 36 & I-25 Managed Lanes)
5.75% 1/1/44 (AMT) | | 3,250,000 | 3,257,605 |
Commonwealth of Massachusetts Transportation
Fund Revenue | | | |
(Rail Enhancement Project)
Series A 5.00% 6/1/53 | | 5,500,000 | 5,998,080 |
| Florida Development Finance Revenue | | | |
| (Brightline Florida Passenger Rail Project) | | | |
| 5.25% 7/1/53 (AGM) (AMT) | | 15,000,000 | 15,821,700 |
| | | Principal
amount° | Value (US $) |
| Municipal Bonds (continued) |
| Transportation Revenue Bonds (continued) |
| Florida Development Finance Revenue | | | |
| (Brightline Florida Passenger Rail Project) |
| 5.50% 7/1/53 (AMT) | | 30,000,000 | $ 31,129,500 |
Foothill-Eastern, California Transportation Corridor
Agency Toll Road Revenue | | | |
| Subseries B-1 3.95% 1/15/53 | | 2,800,000 | 2,608,144 |
| Subseries B-2 3.50% 1/15/53 | | 1,600,000 | 1,371,680 |
| Subseries B-2 3.50% 1/15/53 (AGM) | | 2,000,000 | 1,795,580 |
| Grand Parkway, Texas Transportation Revenue | | | |
(First Tier)
3.00% 10/1/50 | | 3,500,000 | 2,680,965 |
| Louisiana Public Facilities Authority Revenue | | | |
(I-10 Calcasieu River Bridge Public-Private Partnership Project)
5.75% 9/1/64 (AMT) | | 8,750,000 | 9,585,625 |
| Metropolitan Nashville Airport Authority Revenue | | | |
| Series B 5.50% 7/1/52 (AMT) | | 1,500,000 | 1,627,395 |
Metropolitan Washington Airports Authority Dulles Toll
Road Revenue | | | |
(Convertible Capital Appreciation Bonds)
Series B 6.50% 10/1/44 ~ | | 1,000,000 | 1,093,310 |
New York Metropolitan Transportation Authority
Revenue | | | |
| (Climate Bond Certified - Green Bonds) | | | |
| Series B 4.00% 11/15/50 | | 5,000,000 | 4,780,600 |
| Subordinate Series C-1 5.25% 11/15/55 | | 5,000,000 | 5,258,150 |
| New York State Thruway Authority Revenue | | | |
| Series B 3.00% 1/1/53 (BAM) | | 3,410,000 | 2,599,375 |
New York Transportation Development Special
Facility Revenue | | | |
| (John F. Kennedy International Airport New Terminal One Project-Green Bonds) | | | |
| 5.125% 6/30/60 (AGM) (AMT) | | 3,650,000 | 3,803,629 |
| 5.375% 6/30/60 (AMT) | | 24,500,000 | 25,565,995 |
| 5.50% 6/30/54 (AMT) | | 6,600,000 | 7,079,292 |
| 5.50% 6/30/60 (AMT) | | 43,975,000 | 46,871,633 |
| 6.00% 6/30/54 (AMT) | | 10,000,000 | 10,931,800 |
| (Terminal 4 John F. Kennedy International Airport Project) | | | |
| 5.00% 12/1/38 (AMT) | | 2,455,000 | 2,618,724 |
| 5.00% 12/1/41 (AMT) | | 4,920,000 | 5,180,514 |
Schedules of investments
Delaware National High-Yield Municipal Bond Fund
| | | Principal
amount° | Value (US $) |
| Municipal Bonds (continued) |
| Transportation Revenue Bonds (continued) |
| North Carolina Turnpike Authority Revenue | | | |
| (Triangle Expressway System) | | | |
| 4.00% 1/1/55 (AGM) | | 1,000,000 | $ 960,350 |
| Series C 4.97% 7/1/41 ^ | | 4,160,000 | 1,833,021 |
| Pennsylvania Turnpike Commission Revenue | | | |
| Series C 3.00% 12/1/51 | | 1,700,000 | 1,329,281 |
| Subordinate Series B 3.00% 12/1/51 | | 2,500,000 | 1,948,275 |
| Phoenix, Arizona Civic Improvement Revenue | | | |
| (Junior Lien) | | | |
| Series A 5.00% 7/1/40 | | 30,000 | 30,281 |
| Series B 3.25% 7/1/49 (AMT) | | 1,555,000 | 1,266,034 |
Plaquemines, Louisiana Port Harbor & Terminal
District Dock & Warf Facilities Revenue | | | |
(Nola Terminal LLC Project)
Series A 144A 9.00% 12/1/44 # | | 5,000,000 | 5,021,950 |
Port of Seattle, Washington Intermediate Lien
Revenue | | | |
(Private Activity)
Series B 4.00% 8/1/47 (AMT) | | 2,250,000 | 2,091,397 |
Puerto Rico Industrial Tourist Educational Medical &
Environmental Control Facilities Financing Authority Revenue | | | |
(San Juan Cruise Terminal Project)
Series A-1 6.75% 1/1/45 (AMT) | | 3,000,000 | 3,595,020 |
San Diego County, California Regional Airport
Authority Revenue | | | |
| Series B 4.00% 7/1/56 (AMT) | | 3,000,000 | 2,818,320 |
San Francisco City & County, California Airport
Commission Revenue | | | |
(San Francisco International Airport)
Series A 4.00% 5/1/49 (AMT) | | 4,945,000 | 4,740,376 |
| South Jersey Port, New Jersey Revenue | | | |
(Subordinated Marine Terminal Revenue)
Series B 5.00% 1/1/48 (AMT) | | 2,000,000 | 2,032,500 |
Texas Private Activity Bond Surface Transportation
Revenue | | | |
(NTE Mobility Partners LLC North Tarrant Express Project)
5.50% 12/31/58 (AMT) | | 9,765,000 | 10,662,403 |
(NTE Mobility Partners Segments 3 LLC Segment 3C Project)
5.00% 6/30/58 (AMT) | | 20,780,000 | 21,152,378 |
| | | Principal
amount° | Value (US $) |
| Municipal Bonds (continued) |
| Transportation Revenue Bonds (continued) |
| Virginia Small Business Financing Authority Revenue | | | |
(Transform 66-33 Project)
5.00% 12/31/52 (AMT) | | 3,840,000 | $ 3,896,256 |
| | 300,621,666 |
| Water & Sewer Revenue Bonds — 1.16% |
| City of Chicago, Illinois Waterworks Revenue | | | |
| (Second Lien) | | | |
| 5.00% 11/1/26 | | 180,000 | 188,104 |
| 5.00% 11/1/28 | | 30,000 | 31,182 |
Forsyth County, Georgia Water & Sewerage Authority
Revenue | | | |
| 3.00% 4/1/44 | | 3,945,000 | 3,357,668 |
| Jefferson County, Alabama Sewer Revenue | | | |
| 5.50% 10/1/53 | | 17,200,000 | 18,799,772 |
New York City Municipal Water Finance Authority
Revenue | | | |
| Subseries AA-1 3.00% 6/15/51 | | 5,800,000 | 4,558,742 |
| Subseries AA-1 3.50% 6/15/48 | | 5,000,000 | 4,509,650 |
| Subseries BB-1 3.00% 6/15/44 | | 8,750,000 | 7,440,300 |
| | 38,885,418 |
| Total Municipal Bonds (cost $3,351,242,100) | 3,286,506,999 |
|
|
|
| Short-Term Investments — 1.11% |
| Variable Rate Demand Notes — 1.11%¤ |
City of Minneapolis, Minnesota Health Care System
Revenue | | | |
(Fairview Health Services) Series C 3.80% 11/15/48
(LOC - Wells Fargo Bank, N.A.) | | 5,700,000 | 5,700,000 |
City of Phoenix, Arizona Health Care Facilities
Revenue | | | |
(Mayo Clinic) Series B 3.75% 11/15/52
(SPA - Northern Trust) | | 6,860,000 | 6,860,000 |
| Illinois Finance Authority Revenue | | | |
| (The University of Chicago Medical Center) Series B 3.80% 8/1/44 (LOC - TD Bank, N.A.) | | 1,700,000 | 1,700,000 |
Los Angeles, California Department of Water & Power
Revenue | | | |
Subordinate Series A-2 3.65% 7/1/45
(SPA - Barclays Bank) | | 2,000,000 | 2,000,000 |
Schedules of investments
Delaware National High-Yield Municipal Bond Fund
| | | Principal
amount° | Value (US $) |
| Short-Term Investments (continued) |
| Variable Rate Demand Notes¤ (continued) |
| Massachusetts Development Finance Agency | | | |
| (Children Hospital Issue) Series U-2 3.80% 3/1/48 (LOC - TD Bank, N.A.) | | 4,000,000 | $ 4,000,000 |
Massachusetts Development Finance Agency
Revenue | | | |
| (Boston University Issue) Series U-6E 3.80% 10/1/42 (LOC - TD Bank, N.A.) | | 3,000,000 | 3,000,000 |
| (Children Hospital Issue) Series U-1 3.80% 3/1/48 (LOC - TD Bank, N.A.) | | 12,000,000 | 12,000,000 |
| New York City, New York | | | |
Fiscal 2023 Subordinate Series A-4 3.80% 9/1/49
(SPA - TD Bank, N.A.) | | 1,900,000 | 1,900,000 |
| Total Short-Term Investments (cost $37,160,000) | 37,160,000 |
Total Value of Securities—99.48%
(cost $3,388,402,100) | | | $3,323,666,999 |
| ° | Principal amount shown is stated in USD unless noted that the security is denominated in another currency. |
| # | Security exempt from registration under Rule 144A of the Securities Act of 1933, as amended. At August 31, 2024, the aggregate value of Rule 144A securities was $873,015,371, which represents 26.13% of the Fund’s net assets. See Note 10 in “Notes to financial statements.” |
| ^ | Zero-coupon security. The rate shown is the effective yield at the time of purchase. |
| • | Variable rate investment. Rates reset periodically. Rate shown reflects the rate in effect at August 31, 2024. For securities based on a published reference rate and spread, the reference rate and spread are indicated in their descriptions. The reference rate descriptions (i.e. SOFR01M, SOFR03M, etc.) used in this report are identical for different securities, but the underlying reference rates may differ due to the timing of the reset period. Certain variable rate securities are not based on a published reference rate and spread but are determined by the issuer or agent and are based on current market conditions, or for mortgage-backed securities, are impacted by the individual mortgages which are paying off over time. These securities do not indicate a reference rate and spread in their descriptions. |
| ‡ | Non-income producing security. Security is currently in default. |
| ♦ | Pass Through Agreement. Security represents the contractual right to receive a proportionate amount of underlying payments due to the counterparty pursuant to various agreements related to the rescheduling of obligations and the exchange of certain notes. |
| ~ | Step-up bond that pays an initial coupon rate for the first period and then a higher coupon rate for the following periods. Stated rate in effect at August 31, 2024. |
| § | Pre-refunded bonds. Municipal bonds that are generally backed or secured by US Treasury bonds. For pre-refunded bonds, the stated maturity is followed by the year in which the bond will be pre-refunded. See Note 10 in “Notes to financial statements.” |
| ¤ | Tax-exempt obligations that contain a floating or variable interest rate adjustment formula and an unconditional right of demand to receive payment of the unpaid principal balance plus accrued interest upon a short notice period (generally up to 30 days) prior to specified dates either from the issuer or by drawing on a bank letter of credit, a guarantee, or insurance issued with respect to such instrument. Each rate shown is as of August 31, 2024. |
| Summary of abbreviations: |
| AGM – Insured by Assured Guaranty Municipal Corporation |
| AMT – Subject to Alternative Minimum Tax |
| BAM – Insured by Build America Mutual Assurance |
| CHF – Collegiate Housing Foundation |
| KIPP – Knowledge is Power Program |
| LLC – Limited Liability Corporation |
| LOC – Letter of Credit |
| N.A. – National Association |
| PSF – Guaranteed by Permanent School Fund |
| SOFR01M – Secured Overnight Financing Rate 1 Month |
| SOFR03M – Secured Overnight Financing Rate 3 Month |
| SPA – Stand-by Purchase Agreement |
| USD – US Dollar |
See accompanying notes, which are an integral part of the financial statements.
Schedules of investments
| Delaware Tax-Free USA Fund | August 31, 2024 |
| | | Principal
amount° | Value (US $) |
| Municipal Bonds — 98.07% |
| Education Revenue Bonds — 12.24% |
| Arizona Industrial Development Authority Revenue | | | |
| Series A 5.25% 11/1/48 | | 2,195,000 | $ 2,367,659 |
| (Great Hearts Arizona Projects) | | | |
| Series A 2.25% 7/1/46 | | 1,295,000 | 864,736 |
| Series A 2.375% 7/1/52 | | 1,295,000 | 817,831 |
(Leman Academy Of Excellence of Projects)
Series A 4.50% 7/1/54 | | 3,560,000 | 3,227,603 |
(Social Bonds)
Series A 5.25% 11/1/53 | | 2,750,000 | 2,944,920 |
Board of Governors of the Colorado State University
System Enterprise Revenue | | | |
| Series A 5.00% 3/1/43 | | 7,880,000 | 9,114,087 |
| Build NYC, New York Resource Revenue | | | |
(East Harlem Scholars Academy Charter School Project)
144A 5.75% 6/1/62 # | | 1,250,000 | 1,305,450 |
| (KIPP NYC Public School Facilities - Canal West Project) | | | |
| 5.25% 7/1/52 | | 1,000,000 | 1,043,330 |
| 5.25% 7/1/57 | | 4,000,000 | 4,162,840 |
California Community College Financing Authority
Student Housing Revenue | | | |
(Napa Valley College Project)
Series A 144A 5.75% 7/1/60 # | | 5,000,000 | 5,126,100 |
| California Educational Facilities Authority Revenue | | | |
| (Stanford University) | | | |
| Series U-7 5.00% 6/1/46 | | 6,500,000 | 8,088,600 |
| Series V-1 5.00% 5/1/49 | | 14,555,000 | 18,078,183 |
| Series V-2 2.25% 4/1/51 | | 500,000 | 326,795 |
| California Enterprise Development Authority Revenue | | | |
(Heights Christian Schools Project)
Series A 144A 6.375% 6/1/63 # | | 4,280,000 | 4,343,772 |
Camden County, New Jersey Improvement Authority
Revenue | | | |
(KIPP Cooper Norcross Academy - 2022 Project)
6.00% 6/15/62 | | 1,325,000 | 1,425,634 |
Chicago, Illinois Board of Education Dedicated Capital
Improvement Tax Revenue | | | |
| 5.75% 4/1/48 | | 1,850,000 | 2,060,308 |
| 5.75% 4/1/48 (BAM) | | 2,000,000 | 2,241,220 |
| | | Principal
amount° | Value (US $) |
| Municipal Bonds (continued) |
| Education Revenue Bonds (continued) |
| Clemson University, South Carolina | | | |
(Byrnes Hall Project)
Series A 4.125% 5/1/53 | | 2,000,000 | $ 1,987,000 |
DeKalb County, Georgia Development Authority
Revenue | | | |
(The Globe Academy, INC. Project)
Series A 5.00% 6/1/63 | | 1,315,000 | 1,314,211 |
| Florida Development Finance Revenue | | | |
(Mater Academy Projects)
Series A 4.00% 6/15/52 | | 1,535,000 | 1,357,462 |
Gloucester County, New Jersey Improvement
Authority Revenue | | | |
(Rowan University Projects)
5.00% 7/1/54 (BAM) | | 2,500,000 | 2,678,100 |
| Indiana Finance Authority Revenue | | | |
| (CHF - Tippecanoe, LLC - Student Housing Project) | | | |
| Series A 5.00% 6/1/53 | | 2,500,000 | 2,586,875 |
| Series A 5.125% 6/1/58 | | 5,350,000 | 5,544,847 |
Jacksonville, Alabama Public Educational Building
Authority Revenue | | | |
(JSU Foundation Project)
Series A 5.25% 8/1/53 (AGM) | | 1,500,000 | 1,611,360 |
Knox County, Tennessee Health, Educational &
Housing Facility Board Revenue | | | |
| (University of Tennessee Project) | | | |
| Series A-1 5.00% 7/1/64 (BAM) | | 3,000,000 | 3,107,400 |
| Series B-1 5.25% 7/1/64 (BAM) | | 2,300,000 | 2,432,434 |
Maricopa County, Arizona Industrial Development
Authority Revenue | | | |
(Choice Academies, Inc. Project)
144A 5.75% 9/1/45 # | | 2,455,000 | 2,518,044 |
Massachusetts Development Finance Agency
Revenue | | | |
| Series B 4.00% 2/15/36 | | 2,500,000 | 2,783,350 |
| Series B 5.00% 2/15/34 | | 3,500,000 | 4,204,515 |
(Harvard University)
Series A 5.00% 7/15/40 | | 5,000,000 | 6,074,750 |
Metropolitan Government Nashville & Davidson
County, Tennessee Health & Educational Facilities Board Revenue | | | |
(Belmont University)
5.25% 5/1/48 | | 1,500,000 | 1,631,895 |
Schedules of investments
Delaware Tax-Free USA Fund
| | | Principal
amount° | Value (US $) |
| Municipal Bonds (continued) |
| Education Revenue Bonds (continued) |
| New York State Dormitory Authority Revenue | | | |
(Cornell University)
Series A 5.50% 7/1/54 | | 3,000,000 | $ 3,435,210 |
Pennsylvania Economic Development Financing
Authority Revenue | | | |
| (Villanova University Project) | | | |
| 5.00% 8/1/39 | | 500,000 | 576,580 |
| 5.00% 8/1/40 | | 500,000 | 572,960 |
Philadelphia, Pennsylvania Authority for Industrial
Development Revenue | | | |
(Saint Joseph's University Project)
5.50% 11/1/60 | | 4,745,000 | 5,145,668 |
University of Texas System Board of Regents
Revenue | | | |
| Series B 5.00% 8/15/49 | | 8,670,000 | 10,333,079 |
Washington Higher Education Facilities Authority
Revenue | | | |
(Gonzaga University)
4.00% 4/1/47 | | 6,475,000 | 6,040,204 |
Washington State Housing Finance Commission
Revenue | | | |
(Radford Court and Nordheim Court Portfolio)
5.50% 7/1/49 | | 2,000,000 | 2,170,840 |
| Wisconsin Public Finance Authority Revenue | | | |
| Series 1 5.75% 7/1/62 | | 5,984,636 | 6,420,198 |
| (CFP3 – Eastern Michigan University Student Housing Project) | | | |
| Series A-1 5.375% 7/1/47 (BAM) | | 2,775,000 | 3,013,955 |
| Series A-1 5.50% 7/1/52 (BAM) | | 4,000,000 | 4,353,640 |
| | 149,433,645 |
| Electric Revenue Bonds — 2.19% |
| Guam Power Authority Revenue | | | |
| Series A 5.00% 10/1/43 | | 2,000,000 | 2,120,260 |
| Municipal Electric Authority of Georgia Revenue | | | |
(Plant Vogtle Units 3 & 4 Project M)
4.00% 1/1/59 | | 9,000,000 | 8,436,060 |
New York Utility Debt Securitization Authority
Revenue | | | |
| Series 1 5.00% 12/15/41 | | 2,500,000 | 2,888,600 |
| Puerto Rico Electric Power Authority Revenue | | | |
| Series A 5.00% 7/1/42 ‡ | | 3,665,000 | 1,979,100 |
| Series A 5.05% 7/1/42 ‡ | | 100,000 | 54,000 |
| | | Principal
amount° | Value (US $) |
| Municipal Bonds (continued) |
| Electric Revenue Bonds (continued) |
| Puerto Rico Electric Power Authority Revenue | | | |
| Series A 6.75% 7/1/36 ‡ | | 1,725,000 | $ 931,500 |
| Series AAA 5.25% 7/1/25 ‡ | | 285,000 | 153,900 |
| Series CCC 5.25% 7/1/27 ‡ | | 2,005,000 | 1,082,700 |
| Series TT 5.00% 7/1/32 ‡ | | 2,705,000 | 1,460,700 |
| Series WW 5.00% 7/1/28 ‡ | | 510,000 | 275,400 |
| Series WW 5.25% 7/1/33 ‡ | | 2,485,000 | 1,341,900 |
| Series XX 4.75% 7/1/26 ‡ | | 390,000 | 210,600 |
| Series ZZ 4.75% 7/1/27 ‡ | | 305,000 | 164,700 |
| Series ZZ 5.25% 7/1/25 ‡ | | 395,000 | 212,312 |
Salt River, Arizona Project Agricultural Improvement &
Power District Electric System Revenue | | | |
| Series A 5.00% 1/1/50 | | 5,000,000 | 5,439,650 |
| | 26,751,382 |
| Healthcare Revenue Bonds — 13.75% |
Alachua County, Florida Health Facilities Authority
Revenue | | | |
(Oak Hammock at the University of Florida, Inc. Project)
4.00% 10/1/46 | | 1,750,000 | 1,519,683 |
| Apple Valley, Minnesota Senior Living Revenue | | | |
| (Senior Living LLC Project) | | | |
| Series B 5.00% 1/1/47 | | 1,815,000 | 1,088,111 |
| Series D 7.25% 1/1/52 | | 1,980,000 | 1,114,977 |
| Arizona Industrial Development Authority Revenue | | | |
(Great Lakes Senior Living Communities LLC Project Fourth Tier)
144A 7.75% 1/1/54 # | | 225,000 | 87,696 |
(Great Lakes Senior Living Communities LLC Project Second Tier)
Series B 5.00% 1/1/49 ‡ | | 300,000 | 137,418 |
(Phoenix Children's Hospital)
Series A 4.00% 2/1/50 | | 7,560,000 | 7,241,724 |
California Health Facilities Financing Authority
Revenue | | | |
(Cedars-Sinai Health System)
Series A 3.00% 8/15/51 (BAM) | | 4,000,000 | 3,365,600 |
| (CommonSpirit Health) | | | |
| Series A 4.00% 4/1/45 | | 3,470,000 | 3,333,039 |
| Series A 4.00% 4/1/49 | | 5,000,000 | 4,795,950 |
(Kaiser Permanente)
Subseries A-2 5.00% 11/1/47 | | 18,020,000 | 21,870,333 |
Schedules of investments
Delaware Tax-Free USA Fund
| | | Principal
amount° | Value (US $) |
| Municipal Bonds (continued) |
| Healthcare Revenue Bonds (continued) |
| California Municipal Finance Authority Revenue | | | |
(Community Medical Centers)
Series A 5.00% 2/1/47 | | 2,025,000 | $ 2,042,638 |
| Colorado Health Facilities Authority Revenue | | | |
| (AdventHealth Obligated Group) | | | |
| Series A 3.00% 11/15/51 | | 1,500,000 | 1,163,250 |
| Series A 4.00% 11/15/46 | | 3,000,000 | 2,949,450 |
| (CommonSpirit Health) | | | |
| Series A-2 4.00% 8/1/49 (BAM) | | 7,925,000 | 7,751,760 |
| Series A-2 5.00% 8/1/44 | | 2,290,000 | 2,380,432 |
Dutchess County, New York Local Development
Revenue | | | |
(Nuvance Health)
Series B 4.00% 7/1/49 | | 1,745,000 | 1,669,948 |
Glendale, Arizona Industrial Development Authority
Revenue | | | |
(Royal Oaks Inspirata Pointe Project)
Series A 5.00% 5/15/56 | | 1,905,000 | 1,823,180 |
| Hamilton County, Ohio Hospital Facilities Revenue | | | |
(Cincinnati Children's Hospital Medical Center)
Series CC 5.00% 11/15/49 | | 6,460,000 | 7,590,112 |
Hillsborough County, Florida Industrial Development
Authority Hospital Revenue | | | |
(BayCare Health System Issue)
Series C 5.50% 11/15/54 | | 5,000,000 | 5,665,950 |
(Tampa General Hospital Project)
Series A 3.50% 8/1/55 | | 13,915,000 | 11,259,183 |
| Illinois Finance Authority Revenue | | | |
(NorthShore - Edward-Elmhurst Health Credit Group)
Series A 5.00% 8/15/51 | | 3,775,000 | 3,989,684 |
(Shedd Aquarium Society Project)
5.00% 6/1/44 | | 1,500,000 | 1,584,765 |
Jefferson County, Washington Public Hospital District
No. 2 Revenue | | | |
(Jefferson Healthcare)
Series A 6.875% 12/1/53 | | 3,000,000 | 3,046,950 |
Lake County, Ohio Port & Economic Development
Authority Revenue | | | |
(Tapestry Wickliffe, LLC Project)
Series A 144A 6.75% 12/1/52 #, ‡ | | 1,300,000 | 52,000 |
| | | Principal
amount° | Value (US $) |
| Municipal Bonds (continued) |
| Healthcare Revenue Bonds (continued) |
Louisiana Local Government Environmental Facilities
& Community Development Authority Revenue | | | |
(The Glen Retirement System Project)
Series A 5.00% 1/1/49 | | 1,905,000 | $ 1,458,963 |
| Michigan Finance Authority Revenue | | | |
(Henry Ford Health System)
Series A 4.00% 11/15/50 | | 1,500,000 | 1,368,930 |
(The Henry Ford Health Detroit South Campus Central Utility Plant Project)
5.50% 2/28/57 | | 2,500,000 | 2,788,775 |
Missouri State, Health and Educational Facilities
Authority Revenue | | | |
| (Mercy Health) | | | |
| 4.00% 6/1/53 | | 5,000,000 | 4,697,600 |
| 4.00% 6/1/53 (BAM) | | 2,390,000 | 2,297,507 |
Montgomery County, Pennsylvania Higher Education
and Health Authority Revenue | | | |
(Thomas Jefferson University)
Series B 4.00% 5/1/56 | | 7,500,000 | 6,949,725 |
Moon, Pennsylvania Industrial Development Authority
Revenue | | | |
(Baptist Homes Society)
6.125% 7/1/50 | | 1,895,000 | 1,298,719 |
New Hope, Texas Cultural Education Facilities
Finance Revenue | | | |
(Legacy Midtown Park Project)
Series A 5.50% 7/1/54 | | 1,725,000 | 1,301,271 |
(Sanctuary LTC Project)
Series A-1 5.50% 1/1/57 | | 4,000,000 | 3,864,920 |
| New York State Dormitory Authority Revenue | | | |
(Montefiore Obligated Group)
Series A 3.00% 9/1/50 (AGM) | | 12,640,000 | 9,844,032 |
(Northwell Health Obligated Group)
Series A 5.00% 5/1/52 | | 3,000,000 | 3,201,450 |
| Ohio State Hospital Revenue | | | |
(Cleveland Clinic Health System Obligated Group)
Series A 5.00% 1/1/35 | | 3,000,000 | 3,512,040 |
Pennsylvania Economic Development Financing
Authority First Mortgage Revenue | | | |
| (Tapestry Moon Senior Housing Project) | | | |
| Series A 144A 6.50% 12/1/38 #, ‡ | | 3,285,000 | 1,252,406 |
| Series A 144A 6.75% 12/1/53 #, ‡ | | 3,765,000 | 1,435,407 |
Schedules of investments
Delaware Tax-Free USA Fund
| | | Principal
amount° | Value (US $) |
| Municipal Bonds (continued) |
| Healthcare Revenue Bonds (continued) |
Pennsylvania Economic Development Financing
Authority Revenue | | | |
| Series A 4.00% 11/15/42 | | 3,300,000 | $ 3,231,459 |
| Series A 4.00% 5/15/53 | | 5,000,000 | 4,682,650 |
Rhode Island Health and Educational Building
Revenue | | | |
| 5.25% 5/15/54 | | 2,300,000 | 2,467,302 |
Seminole County, Florida Industrial Development
Authority Revenue | | | |
(Legacy Pointe at UCF Project)
Series A 5.50% 11/15/49 | | 3,055,000 | 3,017,790 |
Tempe, Arizona Industrial Development Authority
Revenue | | | |
(Mirabella at ASU Project)
Series A 144A 6.125% 10/1/52 # | | 1,395,000 | 861,064 |
University of North Carolina Board of Governors
Revenue | | | |
| 5.00% 2/1/49 | | 3,700,000 | 4,309,501 |
| Virginia Small Business Financing Authority Revenue | | | |
(LifeSpire of Virginia)
4.00% 12/1/41 | | 2,500,000 | 2,406,225 |
Westchester County, New York Local Development
Revenue | | | |
| (Westchester Medical Center Obligated Group Project) | | | |
| 5.00% 11/1/51 (AGM) | | 1,250,000 | 1,332,850 |
| 5.75% 11/1/53 (AGM) | | 2,500,000 | 2,819,650 |
| | 167,924,069 |
| Housing Revenue Bonds — 5.31% |
| Alaska Housing Finance Revenue | | | |
| (Veterans Mortgage Program) | | | |
| 4.60% 12/1/50 | | 5,585,000 | 5,577,516 |
| 4.65% 12/1/52 | | 4,965,000 | 4,982,775 |
California CSCDA Community Improvement Authority
Essential Housing Revenue | | | |
(Pasadena Portfolio)
Series A-2 144A 3.00% 12/1/56 # | | 1,300,000 | 921,375 |
| Connecticut Housing Finance Authority Revenue | | | |
(Housing Mortgage Finance Program)
Series D 5.35% 11/15/48 | | 3,000,000 | 3,144,720 |
| Illinois Housing Development Authority Revenue | | | |
| Series K 5.25% 10/1/43 | | 4,000,000 | 4,236,920 |
| | | Principal
amount° | Value (US $) |
| Municipal Bonds (continued) |
| Housing Revenue Bonds (continued) |
Industrial Development Authority of the County of
Pima, Arizona Revenue | | | |
| Series B 4.90% 7/1/54 | | 1,200,000 | $ 1,229,904 |
Maryland Community Development Administration
Revenue | | | |
| Series C 4.50% 9/1/49 | | 3,250,000 | 3,259,685 |
| Massachusetts Housing Finance Agency Revenue | | | |
(Sustainability Bonds)
Series A-1 5.00% 12/1/67 | | 1,800,000 | 1,870,542 |
Nebraska Investment Finance Authority Single Family
Housing Revenue | | | |
| Series G 5.40% 9/1/53 | | 5,000,000 | 5,256,950 |
New Jersey Housing & Mortgage Finance Agency
Revenue | | | |
| Series A-1 5.00% 1/20/66 | | 1,850,000 | 1,901,245 |
| New Mexico Mortgage Finance Authority Revenue | | | |
(Single Family Mortgage Program)
4.70% 9/1/53 | | 1,485,000 | 1,488,549 |
| North Dakota Housing Finance Agency Revenue | | | |
(Home Mortgage Financial Program)
4.55% 7/1/48 | | 4,250,000 | 4,282,555 |
| Ohio Housing Finance Agency Revenue | | | |
(Mortgage - Backed Securities Program)
Series B 4.70% 9/1/54 | | 2,000,000 | 2,009,740 |
Pennsylvania Housing Finance Agency Single Family
Mortgage Revenue | | | |
| (Social Bonds) | | | |
| Series 142A 5.00% 10/1/50 | | 3,660,000 | 3,781,366 |
| Series 143A 5.45% 4/1/51 | | 3,000,000 | 3,171,690 |
| Series 146A 4.75% 4/1/53 | | 5,000,000 | 5,042,500 |
| Rhode Island Housing & Mortgage Finance Revenue | | | |
| Series 80A 4.65% 10/1/53 | | 8,000,000 | 8,043,120 |
Tucson, Arizona Industrial Development Authority
Revenue | | | |
| Series A 4.85% 7/1/48 | | 725,000 | 737,281 |
Washington State Housing Finance Commission
Revenue | | | |
| Series 1N 4.70% 12/1/49 | | 2,385,000 | 2,407,753 |
Wyoming Community Development Authority
Revenue | | | |
| Series 1 4.70% 12/1/49 | | 1,500,000 | 1,513,245 |
| | 64,859,431 |
Schedules of investments
Delaware Tax-Free USA Fund
| | | Principal
amount° | Value (US $) |
| Municipal Bonds (continued) |
| Industrial Development Revenue/Pollution ControlRevenue Bonds — 15.91% |
| Arizona Industrial Development Authority Revenue | | | |
(Legacy Cares, Inc. Project)
Series A 144A 7.75% 7/1/50 #, ‡ | | 6,400,000 | $ 256,000 |
| Arkansas Development Finance Authority Revenue | | | |
| (Hybar Steel Project) | | | |
| Series A 144A 6.875% 7/1/48 (AMT) # | | 6,500,000 | 7,163,975 |
| Series B 144A 7.375% 7/1/48 (AMT) # | | 5,000,000 | 5,540,700 |
Buckeye, Ohio Tobacco Settlement Financing
Authority Revenue | | | |
| (Senior) | | | |
| Series A-2 Class 1 3.00% 6/1/48 | | 15,360,000 | 11,628,902 |
| Series A-2 Class 1 4.00% 6/1/48 | | 9,975,000 | 9,101,689 |
California Community Choice Financing Authority
Revenue | | | |
(Clean Energy Project)
Series B 5.00% 1/1/55 • | | 2,500,000 | 2,698,125 |
California Infrastructure & Economic Development
Bank Revenue | | | |
(Brightline West Passenger Rail Project)
Series A-4 144A 8.00% 1/1/50 (AMT) #, • | | 6,500,000 | 6,562,205 |
Central Plains, Nebraska Energy Project Revenue
(Project No. 3) | | | |
| Series A 5.00% 9/1/34 | | 2,000,000 | 2,169,380 |
Chandler, Arizona Industrial Development Authority
Revenue | | | |
(Intel Corporation Project)
Second Subseries 5.00% 9/1/52 (AMT) • | | 3,000,000 | 3,089,160 |
| Colorado Regional Transportation District Revenue | | | |
(Denver Transit Partners Eagle P3 Project)
Series A 4.00% 7/15/39 | | 1,995,000 | 2,009,324 |
Erie County, New York Tobacco Asset Securitization
Revenue | | | |
(Capital Appreciation-Asset-Backed)
Series A 144A 9.242% 6/1/60 #, ^ | | 65,340,000 | 3,169,643 |
| Finance Authority of Maine Revenue | | | |
(Go Lab Madison, LLC Project)
144A 8.00% 12/1/51 (AMT) # | | 5,660,000 | 3,110,566 |
| Florida Development Finance Revenue | | | |
(Brightline Florida Passenger Rail Project)
144A 12.00% 7/15/32 (AMT) #, • | | 13,000,000 | 13,877,500 |
| | | Principal
amount° | Value (US $) |
| Municipal Bonds (continued) |
| Industrial Development Revenue/Pollution ControlRevenue Bonds (continued) |
George L Smith II World Congress Center, Georgia
Authority Revenue | | | |
(Convention Center Hotel)
First Tier Series A 4.00% 1/1/54 | | 20,715,000 | $ 18,560,847 |
| Illinois Finance Authority Revenue | | | |
(Shedd Aquarium Society Project)
5.00% 6/1/47 | | 1,125,000 | 1,177,808 |
| Indiana Finance Authority Exempt Facility Revenue | | | |
(Polyflow Indiana Project - Green Bonds)
144A 7.00% 3/1/39 (AMT) # | | 2,480,000 | 1,455,462 |
Inland, California Empire Tobacco Securitization
Revenue | | | |
| (Capital Appreciation Turbo Asset-Backed) | | | |
| Series E 144A 8.656% 6/1/57 #, ^ | | 122,985,000 | 9,976,543 |
| Series F 144A 7.519% 6/1/57 #, ^ | | 80,485,000 | 5,354,667 |
| Lower Alabama Gas District Revenue | | | |
| Series A 5.00% 9/1/34 | | 6,845,000 | 7,483,844 |
| Series A 5.00% 9/1/46 | | 2,265,000 | 2,492,361 |
| Main Street Natural Gas Project, Georgia Revenue | | | |
| Series C 5.00% 12/1/54 • | | 2,000,000 | 2,141,000 |
Mobile County, Alabama Industrial Development
Authority Revenue | | | |
(AM/NS Calvert LLC Project)
Series A 5.00% 6/1/54 (AMT) | | 2,000,000 | 2,081,600 |
| M-S-R Energy Authority, California Gas Revenue | | | |
| Series A 6.125% 11/1/29 | | 1,180,000 | 1,263,969 |
| Series B 6.50% 11/1/39 | | 4,015,000 | 5,208,981 |
New York City, New York Industrial Development
Agency Revenue | | | |
(Yankee Stadium)
7.07% 3/1/25 (AGC) ^ | | 3,175,000 | 3,122,232 |
New York Counties Tobacco Trust V Pass-Through
Revenue | | | |
(Capital Appreciation Turbo Asset-Backed)
Series 4B 144A 8.105% 6/1/60 #, ♦, ^ | | 393,200,000 | 18,024,288 |
Public Authority for Colorado Energy Natural Gas
Revenue | | | |
| 6.50% 11/15/38 | | 4,745,000 | 5,904,868 |
| Salt Verde, Arizona Financial Senior Gas Revenue | | | |
| 5.00% 12/1/37 | | 6,725,000 | 7,458,496 |
Schedules of investments
Delaware Tax-Free USA Fund
| | | Principal
amount° | Value (US $) |
| Municipal Bonds (continued) |
| Industrial Development Revenue/Pollution ControlRevenue Bonds (continued) |
| South Carolina Public Service Authority Revenue | | | |
(Santee Cooper)
Series A 5.50% 12/1/54 | | 5,000,000 | $ 5,556,950 |
Southeast Energy Authority A Cooperative District,
Alabama Revenue | | | |
(Project No.2)
Series B 4.00% 12/1/51 • | | 5,000,000 | 5,011,200 |
Suffolk Regional Off-Track Betting, New York
Revenue | | | |
| 5.75% 12/1/44 | | 1,000,000 | 1,046,860 |
| 6.00% 12/1/53 | | 4,000,000 | 4,203,960 |
Tobacco Securitization Authority of Southern
California Revenue | | | |
(Capital Appreciation-Second Subordinate Lien)
Series C 7.084% 6/1/46 ^ | | 13,510,000 | 2,776,035 |
(Capital Appreciation-Third Subordinate Lien)
Series D 7.576% 6/1/46 ^ | | 2,255,000 | 387,612 |
Tuscaloosa County, Alabama Industrial Development
Authority Revenue | | | |
(Hunt Refining Project)
Series A 144A 5.25% 5/1/44 # | | 7,775,000 | 7,899,555 |
| Wisconsin Public Finance Authority Revenue | | | |
(Senior Lien - Grand Hyatt San Antonio Hotel Acquisition Project)
Series A 5.00% 2/1/62 | | 5,145,000 | 5,255,566 |
| | 194,221,873 |
| Lease Revenue Bonds — 7.31% |
| Illinois Finance Authority Revenue | | | |
| (Provident Group–SCCIL Properties LLC – University Of Illinois Urbana-Champaign Project) | | | |
| Series A 5.25% 10/1/53 | | 1,000,000 | 1,079,030 |
| Series A 5.25% 10/1/57 | | 1,500,000 | 1,613,925 |
Kansas City, Missouri Industrial Development
Authority Revenue | | | |
(Kansas City International Airport Terminal Modernization Project)
Series A 5.00% 3/1/57 (AGM) (AMT) | | 2,450,000 | 2,520,682 |
Metropolitan Pier & Exposition Authority, Illinois
Revenue | | | |
| (McCormick Place Expansion Project) | | | |
| 5.75% 12/15/56 (AGM) ^ | | 36,795,000 | 8,466,897 |
| | | Principal
amount° | Value (US $) |
| Municipal Bonds (continued) |
| Lease Revenue Bonds (continued) |
Metropolitan Pier & Exposition Authority, Illinois
Revenue | | | |
| (McCormick Place Expansion Project) |
| 5.92% 12/15/56 ^ | | 5,000,000 | $ 1,073,400 |
| Series A 4.00% 6/15/50 (BAM) | | 2,000,000 | 1,905,920 |
| Series A 4.00% 6/15/52 | | 14,490,000 | 13,490,480 |
| Series B 4.822% 12/15/54 (BAM) ^ | | 29,170,000 | 7,395,470 |
| Series B 4.854% 12/15/51 (BAM) ^ | | 31,975,000 | 9,361,641 |
| Series B 5.26% 12/15/54 ^ | | 5,000,000 | 1,187,800 |
| Series B-1 4.57% 6/15/47 (AGM) ^ | | 7,740,000 | 2,790,657 |
New Jersey State Transportation Trust Fund Authority
Revenue | | | |
| Series A 5.396% 12/15/39 (BAM) ^ | | 25,700,000 | 14,123,949 |
| New York Liberty Development Revenue | | | |
(4 World Trade Center - Green Bond)
Series A 2.875% 11/15/46 (BAM) | | 16,960,000 | 12,914,531 |
New York State Thruway Authority State Personal
Income Tax Revenue | | | |
| Series A-1 3.00% 3/15/49 | | 2,500,000 | 1,977,625 |
| Series A-1 3.00% 3/15/51 | | 3,000,000 | 2,334,840 |
Tucson, Arizona Industrial Development Authority
Revenue | | | |
| Series A 4.90% 7/1/54 | | 1,350,000 | 1,373,342 |
| Virginia College Building Authority Revenue | | | |
(21st Century College And Equipment Programs)
5.25% 2/1/42 | | 5,000,000 | 5,643,850 |
| | 89,254,039 |
| Local General Obligation Bonds — 3.60% |
| City of Chicago, Illinois | | | |
| Series A 5.25% 1/1/45 | | 6,000,000 | 6,416,520 |
County of Harris, Texas Permanent Improvement
Refunding Bonds | | | |
| Series A 5.00% 9/15/43 | | 2,000,000 | 2,229,220 |
| Dallas Independent School District, Texas | | | |
| 4.00% 2/15/53 (PSF) | | 2,000,000 | 1,937,640 |
| Fort Bend, Texas Independent School District | | | |
| 5.00% 8/15/44 (PSF) | | 2,570,000 | 2,856,401 |
Lamar, Texas Consolidated Independent School
District | | | |
| 5.25% 2/15/59 (PSF) | | 5,000,000 | 5,515,400 |
Schedules of investments
Delaware Tax-Free USA Fund
| | | Principal
amount° | Value (US $) |
| Municipal Bonds (continued) |
| Local General Obligation Bonds (continued) |
| Los Angeles, California Community College District | | | |
| Series C 5.00% 8/1/25 | | 1,905,000 | $ 1,950,129 |
| Mecklenburg County, North Carolina | | | |
| Series A 5.00% 9/1/25 | | 3,000,000 | 3,073,470 |
MIDA Golf and Equestrian Center Public
Infrastructure District, Utah | | | |
| 144A 4.625% 6/1/57 # | | 2,000,000 | 1,604,480 |
| Midland, Texas Independent School District | | | |
| 5.00% 2/15/50 (PSF) | | 2,250,000 | 2,331,067 |
| Multnomah County, Oregon School District No. 40 | | | |
| Series A 5.157% 6/15/51 ^ | | 3,000,000 | 791,940 |
| Palomar Health, California | | | |
| Series A 6.746% 8/1/32 (AGC) ^ | | 5,000,000 | 3,746,950 |
| Series A 7.00% 8/1/31 (AGC) ^ | | 3,315,000 | 2,590,507 |
| Series A 7.07% 8/1/33 (AGC) ^ | | 5,000,000 | 3,591,650 |
Wake County, North Carolina General Obligation
Public Improvement Bonds | | | |
| Series A 4.00% 2/1/34 | | 5,000,000 | 5,363,050 |
| | 43,998,424 |
| Pre-Refunded/Escrowed to Maturity Bonds — 1.79% |
| Central Texas Turnpike System Revenue | | | |
| Series A 3.278% 8/15/26 (AMBAC) ^ | | 1,340,000 | 1,266,930 |
Iowa Finance Authority Midwestern Disaster Area
Revenue | | | |
(Iowa Fertilizer Company Project)
5.00% 12/1/50-32 § | | 7,725,000 | 8,984,329 |
Metropolitan Washington, D.C. Airports Authority
Dulles Toll Road Revenue | | | |
(Convertible Capital Appreciation Bonds)
Series C 6.50% 10/1/41-26 (AGC) §, ~ | | 7,000,000 | 7,548,730 |
San Francisco City & County, California Airport
Commission Revenue | | | |
(San Francisco International Airport)
Series A 4.00% 5/1/49-29 (AMT) § | | 45,000 | 46,448 |
Washington State Housing Finance Commission
Revenue | | | |
(Heron's Key Senior Living)
Series A 144A 7.00% 7/1/45-25 #, § | | 3,890,000 | 4,002,460 |
| | 21,848,897 |
| | | Principal
amount° | Value (US $) |
| Municipal Bonds (continued) |
| Resource Recovery Revenue Bond — 0.09% |
Union County, New Jersey Improvement Authority
Revenue | | | |
(Aries Linden, LLC Project)
144A 6.75% 12/1/41 (AMT) # | | 1,550,000 | $ 1,026,116 |
| | 1,026,116 |
| Special Tax Revenue Bonds — 16.49% |
| City of Bullhead, Arizona Excise Taxes Revenue | | | |
| 2.30% 7/1/41 | | 1,000,000 | 747,730 |
City of Tampa, Florida Capital Improvement Cigarette
Tax Allocation Revenue | | | |
(H. Lee Moffitt Cancer Center Project)
Series A 4.55% 9/1/53 ^ | | 25,000,000 | 6,171,250 |
| Commonwealth of Puerto Rico Revenue | | | |
| 1.724% 11/1/51 • | | 3,262,606 | 2,092,146 |
| 3.148% 11/1/43 • | | 38,562,266 | 24,438,836 |
GDB Debt Recovery Authority of Puerto Rico
Revenue | | | |
(Taxable)
7.50% 8/20/40 | | 33,008,653 | 32,183,437 |
Indianapolis, Indiana Local Public Improvement Bond
Bank Revenue | | | |
| Series F-1 5.25% 3/1/67 (BAM) | | 4,000,000 | 4,293,600 |
Matching Fund Special Purpose Securitization, Virgin
Islands Revenue | | | |
| Series A 5.00% 10/1/39 | | 2,205,000 | 2,299,308 |
Metropolitan Government Nashville & Davidson
County, Tennessee Sports Authority Revenue | | | |
| (Stadium Project Senior Lien) | | | |
| Series A 5.25% 7/1/53 (AGM) | | 4,000,000 | 4,365,120 |
| Series A 5.25% 7/1/56 (AGM) | | 4,500,000 | 4,892,760 |
Miami-Dade County, Florida Special Obligation
Revenue | | | |
| 4.56% 10/1/45 ^ | | 5,000,000 | 1,993,500 |
| 5.15% 10/1/42 (BAM) ^ | | 2,585,000 | 1,221,102 |
New York City, New York Industrial Development
Agency Revenue | | | |
| (Yankee Stadium) | | | |
| 7.18% 3/1/26 (AGC) ^ | | 3,185,000 | 3,035,146 |
| 7.29% 3/1/27 (AGC) ^ | | 3,000,000 | 2,764,440 |
New York City, New York Transitional Finance
Authority Future Tax Secured Revenue | | | |
| Series B-1 3.00% 11/1/47 | | 4,000,000 | 3,257,440 |
Schedules of investments
Delaware Tax-Free USA Fund
| | | Principal
amount° | Value (US $) |
| Municipal Bonds (continued) |
| Special Tax Revenue Bonds (continued) |
New York Convention Center Development Corporate
Senior Lien Revenue | | | |
(Hotel Unit Fee Secured)
Series B 2.873% 11/15/55 (BAM) ^ | | 2,585,000 | $ 575,524 |
| New York State Dormitory Authority Revenue | | | |
| Series A 5.00% 3/15/34 | | 1,350,000 | 1,591,015 |
| Series A 5.00% 3/15/42 | | 5,000,000 | 5,598,300 |
| Series A 5.25% 3/15/52 | | 1,000,000 | 1,110,480 |
| Puerto Rico Sales Tax Financing Revenue | | | |
| (Restructured) | | | |
| Series A-1 4.75% 7/1/53 | | 17,300,000 | 17,170,077 |
| Series A-1 5.00% 7/1/58 | | 6,562,000 | 6,591,004 |
| Series A-1 5.556% 7/1/46 ^ | | 153,255,000 | 51,676,054 |
| Series A-1 6.00% 7/1/51 ^ | | 55,886,000 | 13,714,983 |
Southeastern Pennsylvania Transportation Authority
Revenue | | | |
(Asset Improvement Program)
5.25% 6/1/52 | | 5,000,000 | 5,441,450 |
| Wisconsin Public Finance Authority Revenue | | | |
(American Dream @ Meadowlands Project)
144A 7.00% 12/1/50 # | | 1,645,000 | 1,689,218 |
Wyandotte County, Kansas City, Kansas Unified
Government Special Obligation Revenue | | | |
(Sales Tax - Vacation Village Project Area 1 and 2A)
Series 2015A 5.75% 9/1/32 | | 2,530,000 | 2,394,189 |
| | 201,308,109 |
| State General Obligation Bonds — 6.39% |
| California State | | | |
| 5.50% 8/1/49 | | 6,195,000 | 7,222,812 |
| (Various Purpose) | | | |
| 5.00% 11/1/42 | | 3,000,000 | 3,361,710 |
| 5.00% 9/1/44 | | 3,000,000 | 3,390,270 |
| 5.25% 10/1/50 | | 4,750,000 | 5,337,480 |
| Commonwealth of Massachusetts | | | |
| Series A 5.00% 1/1/54 | | 2,250,000 | 2,450,475 |
| Commonwealth of Puerto Rico Revenue | | | |
(Restructured)
Series A-1 4.00% 7/1/46 | | 14,700,000 | 13,649,391 |
| Illinois State | | | |
| 5.25% 10/1/47 | | 6,580,000 | 7,107,190 |
| 5.50% 5/1/39 | | 3,725,000 | 4,093,067 |
| | | Principal
amount° | Value (US $) |
| Municipal Bonds (continued) |
| State General Obligation Bonds (continued) |
| Illinois State | | | |
| Series A 4.00% 3/1/41 | | 1,110,000 | $ 1,085,769 |
| Series A 5.50% 3/1/47 | | 9,500,000 | 10,419,125 |
| Series B 5.50% 5/1/47 | | 2,000,000 | 2,196,200 |
(Rebuild Illinois Program)
Series B 4.00% 11/1/39 | | 10,775,000 | 10,583,528 |
| Maryland State | | | |
| Series A 5.00% 3/15/26 | | 2,000,000 | 2,076,000 |
| Series A 5.00% 3/15/28 | | 2,290,000 | 2,489,047 |
| Washington State | | | |
| Series B 5.00% 6/1/46 | | 2,270,000 | 2,488,556 |
| | 77,950,620 |
| Transportation Revenue Bonds — 11.70% |
Burbank-Glendale-Pasadena, California Airport
Authority Brick Campaign Revenue | | | |
| (Senior) | | | |
| Series B 5.25% 7/1/44 (AMT) | | 4,250,000 | 4,664,800 |
| Series B 5.25% 7/1/49 (AMT) | | 2,275,000 | 2,459,343 |
| Central Texas Turnpike System Revenue | | | |
| Series C 5.00% 8/15/39 | | 1,500,000 | 1,664,310 |
| Series C 5.00% 8/15/40 | | 1,500,000 | 1,653,900 |
| Series C 5.00% 8/15/41 | | 1,500,000 | 1,645,125 |
City & County of Denver, Colorado Airport System
Revenue | | | |
| Series A 4.00% 12/1/43 (AMT) | | 5,900,000 | 5,656,920 |
| Series B 5.50% 11/15/42 (AMT) | | 1,000,000 | 1,125,770 |
| Series B 5.50% 11/15/43 (AMT) | | 1,000,000 | 1,121,240 |
| City of Chicago, Illinois International Airport Revenue | | | |
| Series B 5.50% 1/1/59 | | 6,000,000 | 6,662,280 |
City of Dallas and Fort Worth, Texas International
Airport Revenue | | | |
| 5.25% 11/1/48 | | 5,000,000 | 5,557,350 |
City of Phoenix, Arizona Civic Improvement Airport
Revenue | | | |
(Junior Lien)
Series B 5.00% 7/1/49 (AMT) | | 1,370,000 | 1,408,757 |
| City of Salt Lake, Utah Airport Revenue | | | |
| Series A 5.00% 7/1/42 (AMT) | | 3,055,000 | 3,110,204 |
| Colorado Bridge & Tunnel Enterprise Revenue | | | |
| Series A 5.50% 12/1/54 (AGM) | | 3,000,000 | 3,401,160 |
Schedules of investments
Delaware Tax-Free USA Fund
| | | Principal
amount° | Value (US $) |
| Municipal Bonds (continued) |
| Transportation Revenue Bonds (continued) |
Commonwealth of Massachusetts Transportation
Fund Revenue | | | |
| (Rail Enhancement Project) | | | |
| Series A 5.00% 6/1/53 | | 2,000,000 | $ 2,181,120 |
| Series B 5.00% 6/1/52 | | 2,775,000 | 3,007,295 |
| Florida Development Finance Revenue | | | |
| (Brightline Florida Passenger Rail Project) | | | |
| 5.25% 7/1/53 (AGM) (AMT) | | 10,000,000 | 10,547,800 |
| 5.50% 7/1/53 (AMT) | | 5,000,000 | 5,188,250 |
Harris County, Texas Toll Road Senior Lien Revenue
and Refunding | | | |
| Series A 5.00% 8/15/27 | | 1,000,000 | 1,070,940 |
| Lee County, Florida Airport Revenue | | | |
| Series B 4.00% 10/1/51 (AMT) | | 4,430,000 | 4,129,026 |
Los Angeles, California Department of Airports
Revenue | | | |
| Series C 4.00% 5/15/50 (AMT) | | 4,365,000 | 4,186,297 |
| Series F 4.00% 5/15/49 (AMT) | | 2,250,000 | 2,160,135 |
| Louisiana Public Facilities Authority Revenue | | | |
(I-10 Calcasieu River Bridge Public-Private Partnership Project)
5.75% 9/1/64 (AMT) | | 4,000,000 | 4,382,000 |
| Massachusetts Port Authority Revenue | | | |
| Series A 5.00% 7/1/40 (AMT) | | 2,000,000 | 2,093,660 |
| Miami-Dade County, Florida Aviation Revenue | | | |
| Series A 4.00% 10/1/44 (AMT) | | 1,500,000 | 1,426,980 |
| Monroe Country, Florida Airport Revenue | | | |
| (Key West International Airport) | | | |
| Series 2022 5.00% 10/1/42 (AMT) | | 1,505,000 | 1,569,730 |
| Series 2022 5.00% 10/1/52 (AMT) | | 2,445,000 | 2,483,216 |
| Series 2022 5.25% 10/1/47 (AMT) | | 1,100,000 | 1,148,642 |
New York Transportation Development Special
Facilities Revenue | | | |
(John F. Kennedy International Airport New Terminal One Project-Green Bonds)
5.25% 6/30/60 (AGM) (AMT) | | 12,500,000 | 13,266,375 |
New York Transportation Development Special
Facility Revenue | | | |
| (John F. Kennedy International Airport New Terminal One Project-Green Bonds) | | | |
| 5.125% 6/30/60 (AGM) (AMT) | | 5,000,000 | 5,210,450 |
| 5.50% 6/30/60 (AMT) | | 5,000,000 | 5,329,350 |
| | | Principal
amount° | Value (US $) |
| Municipal Bonds (continued) |
| Transportation Revenue Bonds (continued) |
| Pennsylvania Turnpike Commission Revenue | | | |
| Series C 6.25% 6/1/33 (AGM) ~ | | 4,000,000 | $ 4,221,200 |
Port of Seattle, Washington Intermediate Lien
Revenue | | | |
(Private Activity)
Series B 4.00% 8/1/47 (AMT) | | 1,500,000 | 1,394,265 |
San Diego County, California Regional Airport
Authority Revenue | | | |
| Series B 4.00% 7/1/56 (AMT) (BAM) | | 7,000,000 | 6,680,520 |
San Francisco City & County, California Airport
Commission Revenue | | | |
(San Francisco International Airport)
Series A 4.00% 5/1/49 (AMT) | | 3,955,000 | 3,791,342 |
| (San Francisco International Airport) | | | |
| Second Series E 5.00% 5/1/50 (AMT) | | 3,825,000 | 3,921,581 |
| Series A 5.00% 5/1/52 (AMT) | | 4,000,000 | 4,190,480 |
State of Oregon Department of Transportation
Highway User Tax Revenue | | | |
(Senior Lien)
Series A 5.25% 11/15/47 | | 3,250,000 | 3,618,908 |
Texas Private Activity Bond Surface Transportation
Revenue | | | |
(NTE Mobility Partners LLC North Tarrant Express Project)
5.50% 12/31/58 (AMT) | | 5,000,000 | 5,459,500 |
| | 142,790,221 |
| Water & Sewer Revenue Bonds — 1.30% |
City of Tampa, Florida Water & Wastewater System
Revenue | | | |
(Green Bonds)
Series A 5.25% 10/1/57 | | 10,000,000 | 10,997,900 |
| Jefferson County, Alabama Sewer Revenue | | | |
| 5.50% 10/1/53 | | 4,500,000 | 4,918,545 |
| | 15,916,445 |
| Total Municipal Bonds (cost $1,153,347,464) | 1,197,283,271 |
|
|
Schedules of investments
Delaware Tax-Free USA Fund
| | | Principal
amount° | Value (US $) |
|
|
| Short-Term Investments — 2.54% |
| Variable Rate Demand Notes — 2.54%¤ |
City of Minneapolis, Minnesota Health Care System
Revenue | | | |
(Fairview Health Services) Series C 3.80% 11/15/48
(LOC - Wells Fargo Bank, N.A.) | | 3,400,000 | $ 3,400,000 |
City of Phoenix, Arizona Health Care Facilities
Revenue | | | |
(Mayo Clinic) Series B 3.75% 11/15/52
(SPA - Northern Trust) | | 1,000,000 | 1,000,000 |
| Illinois Finance Authority Revenue | | | |
| (The University of Chicago Medical Center) | | | |
| Series B 3.80% 8/1/44 (LOC - TD Bank, N.A.) | | 2,000,000 | 2,000,000 |
| Series D-1 3.80% 8/1/43 (LOC - TD Bank, N.A.) | | 1,265,000 | 1,265,000 |
Los Angeles, California Department of Water & Power
Revenue | | | |
| Subordinate Series A-7 3.65% 7/1/35 (SPA - Bank of America, N.A.) | | 2,000,000 | 2,000,000 |
Subordinate Series B-3 3.65% 7/1/34
(SPA - Barclays Bank) | | 1,700,000 | 1,700,000 |
Massachusetts Development Finance Agency
Revenue | | | |
| (Children Hospital Issue) | | | |
| Series U-1 3.80% 3/1/48 (LOC - TD Bank, N.A.) | | 1,600,000 | 1,600,000 |
| Series U-2 3.80% 3/1/48 (LOC - TD Bank, N.A.) | | 4,600,000 | 4,600,000 |
New York City, New York Municipal Water Finance
Authority Water & Sewer System Revenue | | | |
(Second General Resolution) Fiscal 2023 Subordinate Series BB-2 3.83% 6/15/44
(SPA - Mizuho Bank) | | 6,000,000 | 6,000,000 |
New York City, New York Transitional Finance
Authority Future Tax Secured Revenue | | | |
| (Adjustable Rate Bonds) | | | |
Subordinate Series A-4 4.00% 8/1/39
(SPA – JPMorgan Chase Bank, N.A.) | | 3,100,000 | 3,100,000 |
Subordinate Series C-4 3.90% 11/1/44
(SPA - Barclays Bank) | | 1,390,000 | 1,390,000 |
| | | Principal
amount° | Value (US $) |
| Short-Term Investments (continued) |
| Variable Rate Demand Notes¤ (continued) |
San Francisco, California Bay Area Toll Authority
Revenue | | | |
| Series I 3.75% 4/1/59 (LOC - TD Bank, N.A.) | | 3,000,000 | $ 3,000,000 |
| Total Short-Term Investments (cost $31,055,000) | 31,055,000 |
Total Value of Securities—100.61%
(cost $1,184,402,464) | | | $1,228,338,271 |
| ° | Principal amount shown is stated in USD unless noted that the security is denominated in another currency. |
| # | Security exempt from registration under Rule 144A of the Securities Act of 1933, as amended. At August 31, 2024, the aggregate value of Rule 144A securities was $108,616,692, which represents 8.90% of the Fund’s net assets. See Note 10 in “Notes to financial statements.” |
| ‡ | Non-income producing security. Security is currently in default. |
| • | Variable rate investment. Rates reset periodically. Rate shown reflects the rate in effect at August 31, 2024. For securities based on a published reference rate and spread, the reference rate and spread are indicated in their descriptions. The reference rate descriptions (i.e. SOFR01M, SOFR03M, etc.) used in this report are identical for different securities, but the underlying reference rates may differ due to the timing of the reset period. Certain variable rate securities are not based on a published reference rate and spread but are determined by the issuer or agent and are based on current market conditions, or for mortgage-backed securities, are impacted by the individual mortgages which are paying off over time. These securities do not indicate a reference rate and spread in their descriptions. |
| ^ | Zero-coupon security. The rate shown is the effective yield at the time of purchase. |
| ♦ | Pass Through Agreement. Security represents the contractual right to receive a proportionate amount of underlying payments due to the counterparty pursuant to various agreements related to the rescheduling of obligations and the exchange of certain notes. |
| § | Pre-refunded bonds. Municipal bonds that are generally backed or secured by US Treasury bonds. For pre-refunded bonds, the stated maturity is followed by the year in which the bond will be pre-refunded. See Note 10 in “Notes to financial statements.” |
| ~ | Step-up bond that pays an initial coupon rate for the first period and then a higher coupon rate for the following periods. Stated rate in effect at August 31, 2024. |
| ¤ | Tax-exempt obligations that contain a floating or variable interest rate adjustment formula and an unconditional right of demand to receive payment of the unpaid principal balance plus accrued interest upon a short notice period (generally up to 30 days) prior to specified dates either from the issuer or by drawing on a bank letter of credit, a guarantee, or insurance issued with respect to such instrument. Each rate shown is as of August 31, 2024. |
Schedules of investments
Delaware Tax-Free USA Fund
| Summary of abbreviations: |
| AGC – Insured by Assured Guaranty Corporation |
| AGM – Insured by Assured Guaranty Municipal Corporation |
| AMBAC – Insured by American Municipal Bond Assurance Corporation |
| AMT – Subject to Alternative Minimum Tax |
| BAM – Insured by Build America Mutual Assurance |
| CHF – Collegiate Housing Foundation |
| KIPP – Knowledge is Power Program |
| LLC – Limited Liability Corporation |
| LOC – Letter of Credit |
| N.A. – National Association |
| PSF – Guaranteed by Permanent School Fund |
| SOFR01M – Secured Overnight Financing Rate 1 Month |
| SOFR03M – Secured Overnight Financing Rate 3 Month |
| SPA – Stand-by Purchase Agreement |
| USD – US Dollar |
See accompanying notes, which are an integral part of the financial statements.
Schedules of investments
| Delaware Tax-Free USA Intermediate Fund | August 31, 2024 |
| | | Principal
amount° | Value (US $) |
| Municipal Bonds — 98.52% |
| Education Revenue Bonds — 6.82% |
| Arizona Industrial Development Authority Revenue | | | |
(American Charter Schools Foundation Project)
144A 6.00% 7/1/37 # | | 1,270,000 | $ 1,316,545 |
(Empower College Prep Project)
144A 6.00% 7/1/49 # | | 875,000 | 889,175 |
(KIPP NYC Public Charter Schools - Macombs Facility Project)
Series A 4.00% 7/1/51 | | 2,000,000 | 1,844,080 |
(Odyssey Preparatory Academy Project)
Series A 144A 5.50% 7/1/52 # | | 875,000 | 878,229 |
Board of Governors of the Colorado State University
System Enterprise Revenue | | | |
| Series A 5.00% 3/1/43 | | 2,000,000 | 2,313,220 |
Bucks County, Pennsylvania Industrial Development
Authority Revenue | | | |
(School Lane Charter School Project)
5.125% 3/15/36 | | 2,000,000 | 2,036,740 |
| Build NYC, New York Resource Revenue | | | |
| (East Harlem Scholars Academy Charter School Project) | | | |
| 144A 5.00% 6/1/32 # | | 375,000 | 396,022 |
| 144A 5.75% 6/1/42 # | | 750,000 | 799,665 |
| (KIPP NYC Public School Facilities - Canal West Project) | | | |
| 5.00% 7/1/30 | | 510,000 | 551,346 |
| 5.00% 7/1/32 | | 560,000 | 612,343 |
| 5.00% 7/1/33 | | 585,000 | 636,129 |
| 5.00% 7/1/34 | | 415,000 | 449,329 |
| 5.00% 7/1/36 | | 415,000 | 445,399 |
| 5.00% 7/1/37 | | 550,000 | 588,929 |
| 5.00% 7/1/42 | | 1,000,000 | 1,046,600 |
California Community College Financing Authority
Revenue | | | |
(Napa Valley College Project)
Series A 144A 4.25% 7/1/32 # | | 1,480,000 | 1,461,485 |
| California Educational Facilities Authority Revenue | | | |
| (Stanford University) | | | |
| Series T-1 5.00% 3/15/39 | | 5,000,000 | 6,174,000 |
| Series U-6 5.00% 5/1/45 | | 1,000,000 | 1,242,750 |
| Series U-7 5.00% 6/1/46 | | 1,000,000 | 1,244,400 |
| California Municipal Finance Authority Revenue | | | |
| Series A 144A 5.50% 6/1/53 # | | 1,000,000 | 1,001,880 |
Schedules of investments
Delaware Tax-Free USA Intermediate Fund
| | | Principal
amount° | Value (US $) |
| Municipal Bonds (continued) |
| Education Revenue Bonds (continued) |
| California School Finance Authority Revenue | | | |
(Hawking Steam Charter School Project)
Series A 144A 5.00% 7/1/42 # | | 1,000,000 | $ 1,025,340 |
(Partnerships to Uplift Communities Project)
144A 5.00% 8/1/33 # | | 620,000 | 654,788 |
California Statewide Communities Development
Authority Revenue | | | |
(California Baptist University)
Series A 144A 6.125% 11/1/33 # | | 2,215,000 | 2,219,297 |
| Capital Trust Agency, Florida Revenue | | | |
| (Liza Jackson Preparatory School Project) | | | |
| Series A 5.00% 8/1/40 | | 300,000 | 306,534 |
| Series A 5.00% 8/1/55 | | 800,000 | 800,240 |
(University Bridge, LLC Student Housing Project)
Series A 144A 5.25% 12/1/43 # | | 2,000,000 | 2,016,460 |
Chicago, Illinois Board of Education Dedicated Capital
Improvement Tax Revenue | | | |
| 5.75% 4/1/48 | | 2,500,000 | 2,784,200 |
City of Phoenix, Arizona Industrial Development
Authority Housing Revenue | | | |
| (Downtown Phoenix Student Housing, LLC - Arizona State University Project) | | | |
| Series A 5.00% 7/1/30 | | 350,000 | 366,699 |
| Series A 5.00% 7/1/32 | | 235,000 | 244,797 |
Colorado Educational & Cultural Facilities Authority
Revenue | | | |
(Ascent Classical Academy Charter Schools)
Series A 144A 5.25% 4/1/39 # | | 1,520,000 | 1,590,406 |
(Global Village Academy - Northglenn Project)
144A 5.00% 12/1/40 # | | 2,215,000 | 2,131,362 |
| District of Columbia Revenue | | | |
| (KIPP DC Issue) | | | |
| 4.00% 7/1/39 | | 1,275,000 | 1,250,405 |
| 4.00% 7/1/44 | | 1,120,000 | 1,064,459 |
| Florida Development Finance Revenue | | | |
| (Mater Academy Projects) | | | |
| Series A 5.00% 6/15/28 | | 410,000 | 427,286 |
| Series A 5.00% 6/15/29 | | 400,000 | 416,512 |
| Idaho Housing & Finance Association Revenue | | | |
(Alturas International Academy Project)
4.00% 5/1/52 | | 1,400,000 | 1,238,426 |
| | | Principal
amount° | Value (US $) |
| Municipal Bonds (continued) |
| Education Revenue Bonds (continued) |
| Idaho Housing & Finance Association Revenue | | | |
(Anser of Idaho Project)
Series A 4.00% 5/1/30 | | 250,000 | $ 254,820 |
(Meridian South Charter School Project)
144A 4.00% 5/1/46 # | | 710,000 | 561,624 |
| (Sage International School of Boise Project) | | | |
| Series A 4.00% 5/1/40 | | 1,330,000 | 1,290,047 |
| Series A 4.00% 5/1/55 | | 1,540,000 | 1,344,743 |
| Illinois Finance Authority Revenue | | | |
| (CHF - Chicago, LLC - University of Illinois at Chicago Project) | | | |
| Series A 5.00% 2/15/26 | | 400,000 | 403,716 |
| Series A 5.00% 2/15/28 | | 260,000 | 265,564 |
| Series A 5.00% 2/15/30 | | 390,000 | 398,237 |
| Series A 5.00% 2/15/32 | | 265,000 | 270,302 |
| Indiana Finance Authority Revenue | | | |
(Tippecanoe LLC Student Housing Project)
Series A 5.00% 6/1/38 | | 600,000 | 642,384 |
Jacksonville, Alabama Public Educational Building
Authority Revenue | | | |
(JSU Foundation Project)
Series A 5.25% 8/1/53 (AGM) | | 1,530,000 | 1,643,587 |
Knox County, Tennessee Health Educational &
Housing Facility Board Revenue | | | |
| (University of Tennessee Project) | | | |
| Series A-1 5.00% 7/1/43 (BAM) | | 550,000 | 594,066 |
| Series A-1 5.00% 7/1/44 (BAM) | | 625,000 | 672,688 |
| Louisiana Public Facilities Authority Revenue | | | |
(Lincoln Preparatory School Project)
Series A 144A 6.125% 6/1/37 # | | 400,000 | 413,204 |
Maricopa County, Arizona Industrial Development
Authority Revenue | | | |
| (Arizona Autism Charter Schools Project) | | | |
| Series A 144A 5.00% 7/1/40 # | | 250,000 | 253,188 |
| Series A 144A 5.00% 7/1/50 # | | 925,000 | 919,616 |
| (Highland Prep Project) | | | |
| Series A 4.00% 7/1/38 | | 460,000 | 457,139 |
| Series A 4.00% 7/1/40 | | 500,000 | 485,430 |
Miami-Dade County, Florida Educational Facilities
Authority Revenue | | | |
| (University of Miami) | | | |
| Series A 5.00% 4/1/30 | | 520,000 | 525,112 |
Schedules of investments
Delaware Tax-Free USA Intermediate Fund
| | | Principal
amount° | Value (US $) |
| Municipal Bonds (continued) |
| Education Revenue Bonds (continued) |
Miami-Dade County, Florida Educational Facilities
Authority Revenue | | | |
| (University of Miami) |
| Series A 5.00% 4/1/31 | | 1,090,000 | $ 1,100,420 |
Nevada State Department of Business & Industry
Revenue | | | |
(Somerset Academy)
Series A 144A 5.00% 12/15/38 # | | 1,295,000 | 1,300,802 |
| New York State Dormitory Authority Revenue | | | |
(New York University)
Series A 5.75% 7/1/27 (NATL) | | 4,770,000 | 5,016,991 |
(Pace University)
Series A 5.25% 5/1/43 | | 1,390,000 | 1,529,556 |
| Newark, Texas Higher Education Finance Revenue | | | |
(Village Tech Schools)
Series A 5.125% 8/15/47 | | 1,250,000 | 1,216,250 |
| Oregon State Facilities Authority Revenue | | | |
(Metro East Web Academy Project)
Series A 144A 5.00% 6/15/49 # | | 1,000,000 | 948,230 |
Regents of the University of California General
Revenue | | | |
| Series BK 5.00% 5/15/52 | | 1,740,000 | 1,895,869 |
South Carolina Jobs - Economic Development
Authority Educational Facilities Revenue | | | |
(High Point Academy Project)
Series A 144A 5.75% 6/15/39 # | | 1,345,000 | 1,362,337 |
| University of Minnesota Revenue | | | |
| Series A 5.00% 4/1/34 | | 1,855,000 | 1,918,756 |
Washington State Housing Finance Commission
Revenue | | | |
| (Radford Court and Nordheim Court Portfolio) | | | |
| 5.00% 7/1/37 | | 1,825,000 | 2,011,333 |
| 5.00% 7/1/38 | | 1,000,000 | 1,096,130 |
Westchester County, New York Local Development
Revenue | | | |
(Pace University)
Series A 5.00% 5/1/34 | | 4,150,000 | 4,167,513 |
| Wisconsin Public Finance Authority Revenue | | | |
(CFP3 – Eastern Michigan University Student Housing Project)
Series A-1 5.25% 7/1/42 (BAM) | | 3,000,000 | 3,274,590 |
| | 82,699,721 |
| | | Principal
amount° | Value (US $) |
| Municipal Bonds (continued) |
| Electric Revenue Bonds — 4.20% |
| American Municipal Power, Ohio Revenue | | | |
(AMP Fremont Energy Center Project)
Series A 4.00% 2/15/37 | | 1,330,000 | $ 1,357,345 |
| Guam Power Authority Revenue | | | |
| (Tax-Exempt Forward Delivery) | | | |
| Series A 5.00% 10/1/32 | | 4,000,000 | 4,458,120 |
| Series A 5.00% 10/1/33 | | 2,915,000 | 3,241,655 |
| Series A 5.00% 10/1/41 | | 915,000 | 981,411 |
Missouri Joint Municipal Electric Utility Commission
Revenue | | | |
| (Green Bonds - Climate Bond Certified) | | | |
| 5.25% 12/1/39 | | 500,000 | 554,405 |
| 5.25% 12/1/40 | | 500,000 | 549,335 |
| 5.25% 12/1/41 | | 650,000 | 710,034 |
| 5.25% 12/1/42 | | 1,000,000 | 1,090,230 |
| Municipal Electric Authority of Georgia Revenue | | | |
(Plant Vogtle Units 3&4 Project)
Series A 5.00% 1/1/39 | | 6,250,000 | 6,547,312 |
New York Utility Debt Securitization Authority
Restructuring Bonds Revenue | | | |
| 5.00% 12/15/35 | | 5,090,000 | 5,210,022 |
| 5.00% 12/15/36 | | 5,000,000 | 5,114,750 |
| Puerto Rico Electric Power Authority Revenue | | | |
| Series CCC 5.25% 7/1/27 ‡ | | 1,520,000 | 820,800 |
| Series TT 5.00% 7/1/32 ‡ | | 1,555,000 | 839,700 |
| Series WW 5.25% 7/1/33 ‡ | | 1,015,000 | 548,100 |
| Series WW 5.50% 7/1/17 ‡ | | 2,200,000 | 1,182,500 |
| Series WW 5.50% 7/1/19 ‡ | | 1,710,000 | 919,125 |
| Series WW 5.50% 7/1/38 ‡ | | 1,925,000 | 1,039,500 |
| Series XX 5.25% 7/1/40 ‡ | | 4,630,000 | 2,500,200 |
| Series ZZ 5.00% 7/1/19 ‡ | | 2,990,000 | 1,607,125 |
Salt River, Arizona Project Agricultural Improvement &
Power District Electric Systems Revenue | | | |
| Series A 5.00% 1/1/38 | | 5,000,000 | 5,205,750 |
| Series A 5.00% 1/1/43 | | 1,135,000 | 1,254,096 |
| South Carolina Public Service Authority Revenue | | | |
| (Santee Cooper) | | | |
| Series E 5.25% 12/1/37 (AGM) | | 3,000,000 | 3,420,300 |
| Series E 5.25% 12/1/38 (AGM) | | 1,615,000 | 1,831,894 |
| | 50,983,709 |
Schedules of investments
Delaware Tax-Free USA Intermediate Fund
| | | Principal
amount° | Value (US $) |
| Municipal Bonds (continued) |
| Healthcare Revenue Bonds — 8.15% |
| Arizona Health Facilities Authority Revenue | | | |
(Scottsdale Lincoln Hospital Project)
5.00% 12/1/30 | | 5,000,000 | $ 5,022,450 |
California Health Facilities Financing Authority
Revenue | | | |
(Children's Hospital of Orange County)
Series A 2.125% 11/1/41 | | 5,000,000 | 3,551,100 |
(Kaiser Permanente)
Subseries A-2 5.00% 11/1/47 | | 4,600,000 | 5,582,882 |
(Sutter Health)
Series A 5.00% 11/15/38 | | 760,000 | 795,013 |
City of Apple Valley, Minnesota Senior Living
Revenue | | | |
(Minnesota Senior Living LLC Project)
Second Tier Series B 5.25% 1/1/37 | | 915,000 | 674,547 |
| Colorado Health Facilities Authority Revenue | | | |
(AdventHealth Obligated Group)
Series A 4.00% 11/15/46 | | 7,000,000 | 6,882,050 |
| (CommonSpirit Health) | | | |
| Series A-1 4.00% 8/1/37 | | 1,000,000 | 1,008,430 |
| Series A-2 5.00% 8/1/37 | | 1,105,000 | 1,172,361 |
| Cuyahoga County, Ohio Hospital Revenue | | | |
(The MetroHealth System)
5.00% 2/15/37 | | 1,000,000 | 1,027,670 |
Escambia County, Florida Health Facilities Authority
Revenue | | | |
| (Baptist Health Care Obligated Group) | | | |
| Series A 4.00% 8/15/45 | | 655,000 | 601,624 |
| Series A 4.00% 8/15/50 | | 1,950,000 | 1,753,713 |
Gainesville & Hall County, Georgia Hospital Authority
Revenue | | | |
(Northeast Georgia Health System Project)
Series A 3.00% 2/15/51 | | 515,000 | 390,092 |
Glendale, Arizona Industrial Development Authority
Revenue | | | |
(Glencroft Retirement Community Project)
5.25% 11/15/46 | | 875,000 | 754,661 |
(Royal Oaks Inspirata Pointe Project)
Series A 5.00% 5/15/41 | | 500,000 | 503,915 |
| (Royal Oaks Life Care Community) | | | |
| 4.00% 5/15/27 | | 620,000 | 614,649 |
| 4.00% 5/15/30 | | 1,385,000 | 1,358,630 |
| | | Principal
amount° | Value (US $) |
| Municipal Bonds (continued) |
| Healthcare Revenue Bonds (continued) |
Glendale, Arizona Industrial Development Authority
Revenue | | | |
(The Terraces of Phoenix Project)
Series A 5.00% 7/1/48 | | 875,000 | $ 815,019 |
| Hamilton County, Ohio Hospital Facilities Revenue | | | |
(Cincinnati Children's Hospital Medical Center)
Series CC 5.00% 11/15/49 | | 3,540,000 | 4,159,288 |
Henrico County, Virginia Economic Development
Authority Residential Care Facility Revenue | | | |
| (Westminster Canterbury Richmond) | | | |
| Series A 5.00% 10/1/42 | | 650,000 | 694,382 |
| Series A 5.00% 10/1/47 | | 525,000 | 552,473 |
| Series A 5.00% 10/1/52 | | 1,750,000 | 1,827,455 |
| Illinois Finance Authority Revenue | | | |
| Series C 4.00% 2/15/41 | | 3,750,000 | 3,731,287 |
(The Admiral at the Lake Project)
5.50% 5/15/54 | | 875,000 | 724,833 |
| Iowa Finance Authority Senior Housing Revenue | | | |
(PHS Council Bluffs, Inc. Project)
5.00% 8/1/33 | | 500,000 | 478,810 |
Kalispell, Montana Housing and Healthcare Facilities
Revenue | | | |
| (Immanuel Lutheran Corporation Project) | | | |
| Series A 5.25% 5/15/29 | | 630,000 | 629,168 |
| Series A 5.25% 5/15/37 | | 1,400,000 | 1,318,142 |
Lancaster County, Pennsylvania Hospital Authority
Revenue | | | |
(University of Pennsylvania Health System Obligation)
Series A 5.00% 8/15/33 | | 2,430,000 | 2,516,873 |
Maricopa County, Arizona Industrial Development
Authority Revenue | | | |
(Banner Health Obligation Group)
Series A 5.00% 1/1/32 | | 3,000,000 | 3,127,650 |
(Christian Care Surprise, Inc. Project)
144A 5.75% 1/1/36 # | | 1,540,000 | 1,334,410 |
Maryland Health & Higher Educational Facilities
Authority Revenue | | | |
(Adventist Healthcare Obligated)
Series A 5.50% 1/1/36 | | 2,000,000 | 2,062,160 |
| Michigan Finance Authority Revenue | | | |
(Trinity Health Credit Group)
4.00% 12/1/40 | | 2,185,000 | 2,187,557 |
Schedules of investments
Delaware Tax-Free USA Intermediate Fund
| | | Principal
amount° | Value (US $) |
| Municipal Bonds (continued) |
| Healthcare Revenue Bonds (continued) |
Monroe County, New York Industrial Development
Revenue | | | |
| (Rochester Regional Health Project) | | | |
| Series A 3.00% 12/1/40 | | 1,000,000 | $ 780,940 |
| Series A 4.00% 12/1/38 | | 1,000,000 | 986,070 |
Moon, Pennsylvania Industrial Development Authority
Revenue | | | |
(Baptist Homes Society Obligation)
5.625% 7/1/30 | | 2,440,000 | 2,131,584 |
| New Hampshire, National Finance Authority Revenue | | | |
(Springpoint Senior Living Project)
4.00% 1/1/51 | | 1,330,000 | 1,120,937 |
(The Vista Project)
Series A 144A 5.25% 7/1/39 # | | 1,000,000 | 1,001,980 |
New Hope, Texas Cultural Education Facilities
Finance Revenue | | | |
(Sanctuary LTC Project)
Series A-1 5.50% 1/1/57 | | 1,615,000 | 1,560,461 |
| New York State Dormitory Authority Revenue | | | |
| (Orange Regional Medical Center) | | | |
| 144A 5.00% 12/1/32 # | | 700,000 | 700,413 |
| 144A 5.00% 12/1/33 # | | 1,000,000 | 999,370 |
| Ohio State Hospital Revenue | | | |
(Cleveland Clinic Health System Obligated Group)
Series A 5.00% 1/1/35 | | 3,750,000 | 4,390,050 |
Oklahoma Development Finance Authority Health
System Revenue | | | |
| (OU Medicine Project) | | | |
| Series B 5.25% 8/15/43 | | 1,000,000 | 1,031,330 |
| Series B 5.25% 8/15/48 | | 2,000,000 | 2,047,500 |
Pennsylvania Economic Development Financing
Authority First Mortgage Revenue | | | |
| (Tapestry Moon Senior Housing Project) | | | |
| Series A 144A 6.50% 12/1/38 #, ‡ | | 1,000,000 | 381,250 |
| Series A 144A 6.75% 12/1/53 #, ‡ | | 875,000 | 333,594 |
Pennsylvania Economic Development Financing
Authority Revenue | | | |
| (Presbyterian Senior Living Project) | | | |
| Series B-2 5.00% 7/1/38 | | 3,000,000 | 3,228,150 |
| Series B-2 5.00% 7/1/42 | | 1,500,000 | 1,590,555 |
| | | Principal
amount° | Value (US $) |
| Municipal Bonds (continued) |
| Healthcare Revenue Bonds (continued) |
| Prince George's County, Maryland Revenue | | | |
(Collington Episcopal Life Care Community)
5.00% 4/1/30 | | 2,880,000 | $ 2,902,694 |
Rhode Island Health and Educational Building
Revenue | | | |
| (Lifespan Obligated Group) | | | |
| 5.00% 5/15/40 | | 575,000 | 627,854 |
| 5.00% 5/15/41 | | 700,000 | 760,382 |
| 5.00% 5/15/42 | | 700,000 | 756,840 |
| 5.00% 5/15/43 | | 700,000 | 753,627 |
| 5.25% 5/15/49 | | 2,000,000 | 2,157,040 |
| Salem, Oregon Hospital Facility Authority Revenue | | | |
(Capital Manor Project)
4.00% 5/15/40 | | 1,450,000 | 1,326,011 |
Seminole County, Florida Industrial Development
Authority Revenue | | | |
| (Legacy Pointe at UCF Project) | | | |
| Series A 5.25% 11/15/39 | | 5,340,000 | 5,356,394 |
| Series B-1 4.25% 11/15/26 | | 600,000 | 600,000 |
Tempe, Arizona Industrial Development Authority
Revenue | | | |
(Mirabella at ASU Project)
Series A 144A 6.00% 10/1/37 # | | 1,200,000 | 872,652 |
Westchester County, New York Local Development
Revenue | | | |
| (Westchester Medical Center Obligated Group Project) | | | |
| 5.00% 11/1/47 (AGM) | | 500,000 | 536,895 |
| 5.75% 11/1/48 (AGM) | | 1,875,000 | 2,131,425 |
| | 98,919,292 |
| Housing Revenue Bonds — 4.13% |
Denver City & County, Colorado Housing Authority
Revenue | | | |
(Flo Senior Apartments Project)
Series A 4.50% 7/1/41 | | 1,500,000 | 1,528,860 |
| Illinois Housing Development Authority Revenue | | | |
| Series K 4.95% 10/1/38 | | 2,500,000 | 2,647,000 |
| Series K 5.25% 10/1/43 | | 2,800,000 | 2,965,844 |
Maryland Community Development Administration
Revenue | | | |
| Series C 4.375% 9/1/43 | | 1,640,000 | 1,655,432 |
Schedules of investments
Delaware Tax-Free USA Intermediate Fund
| | | Principal
amount° | Value (US $) |
| Municipal Bonds (continued) |
| Housing Revenue Bonds (continued) |
Nebraska Investment Finance Authority Single Family
Housing Revenue | | | |
| Series G 4.95% 9/1/38 | | 1,250,000 | $ 1,344,613 |
| Series G 5.15% 9/1/43 | | 2,610,000 | 2,755,638 |
New York City, New York Housing Development
Revenue | | | |
| 4.60% 8/1/48 | | 2,495,000 | 2,509,047 |
New York State Mortgage Agency Homeowner
Revenue | | | |
| Series 250 4.80% 10/1/48 | | 4,000,000 | 4,043,560 |
| North Carolina Housing Finance Agency Revenue | | | |
(1998 Trust Agreement)
Series 49 4.875% 7/1/42 | | 4,755,000 | 4,934,834 |
| North Dakota Housing Finance Agency Revenue | | | |
| Series D 4.50% 7/1/43 | | 1,740,000 | 1,755,190 |
Pennsylvania Housing Finance Agency Single Family
Mortgage Revenue | | | |
| Series 142A 4.85% 10/1/43 | | 10,730,000 | 11,105,013 |
| Series 143A 5.125% 10/1/41 | | 3,350,000 | 3,570,732 |
| Rhode Island Housing & Mortgage Finance Revenue | | | |
| Series 81-A 5.25% 10/1/43 | | 4,500,000 | 4,783,635 |
San Antonio, Texas Housing Trust Public Facility
Revenue | | | |
(Cedar Ridge Terrace Apartments)
Series A 4.45% 4/1/43 | | 4,500,000 | 4,495,950 |
| | 50,095,348 |
| Industrial Development Revenue/Pollution ControlRevenue Bonds — 19.18% |
| Arizona Industrial Development Authority Revenue | | | |
(Legacy Cares, Inc. Project)
Series A 144A 7.75% 7/1/50 #, ‡ | | 5,520,000 | 220,800 |
| Arkansas Development Finance Authority Revenue | | | |
(United States Steel Corporation Project)
5.70% 5/1/53 (AMT) | | 7,750,000 | 8,269,638 |
| Black Belt, Alabama Energy Gas District Revenue | | | |
| Series A 4.00% 6/1/51 • | | 5,000,000 | 5,052,050 |
(Gas Project)
Series A 5.25% 5/1/55 • | | 5,000,000 | 5,489,100 |
Buckeye, Ohio Tobacco Settlement Financing
Authority Revenue | | | |
| (Senior) | | | |
| Series A-2 Class 1 3.00% 6/1/48 | | 7,060,000 | 5,345,055 |
| | | Principal
amount° | Value (US $) |
| Municipal Bonds (continued) |
| Industrial Development Revenue/Pollution ControlRevenue Bonds (continued) |
Buckeye, Ohio Tobacco Settlement Financing
Authority Revenue | | | |
| (Senior) |
| Series A-2 Class 1 4.00% 6/1/48 | | 1,700,000 | $ 1,551,165 |
| Series B-2 Class 2 5.00% 6/1/55 | | 4,000,000 | 3,682,400 |
California Community Choice Financing Authority
Revenue | | | |
| (Clean Energy Project) | | | |
| Series A-1 5.00% 12/1/53 • | | 3,500,000 | 3,705,660 |
| Series B 5.00% 1/1/55 • | | 5,500,000 | 5,935,875 |
| Series B-1 4.00% 2/1/52 • | | 4,910,000 | 4,994,796 |
| Series C 5.25% 1/1/54 • | | 3,325,000 | 3,569,055 |
| Series D 5.50% 5/1/54 • | | 7,000,000 | 7,502,670 |
California Infrastructure & Economic Development
Bank Revenue | | | |
(Brightline West Passenger Rail Project)
Series A-4 144A 8.00% 1/1/50 (AMT) #, • | | 5,000,000 | 5,047,850 |
California Pollution Control Financing Authority
Revenue | | | |
(Calplant I Project)
144A 8.00% 7/1/39 (AMT) #, ‡ | | 1,250,000 | 16,875 |
(Poseidon Resources (Channelside) LP Desalination Project)
144A 5.00% 7/1/37 (AMT) # | | 3,700,000 | 3,710,582 |
| Central Plains, Nebraska Energy Project Revenue | | | |
| (Project No. 3) | | | |
| Series A 5.00% 9/1/35 | | 1,250,000 | 1,359,550 |
| Series A 5.00% 9/1/36 | | 2,480,000 | 2,692,883 |
| Series A 5.00% 9/1/42 | | 250,000 | 276,018 |
Chandler, Arizona Industrial Development Authority
Revenue | | | |
(Intel Corporation Project)
Second Subseries 5.00% 9/1/52 (AMT) • | | 4,750,000 | 4,891,170 |
| City of Houston, Texas Airport System Revenue | | | |
(United Airlines, Inc. Terminal E Project)
Series A 4.00% 7/1/41 (AMT) | | 1,220,000 | 1,182,265 |
Commonwealth of Pennsylvania Financing Authority
Revenue | | | |
(Tobacco Master Settlement Payment)
5.00% 6/1/27 | | 2,000,000 | 2,107,940 |
Schedules of investments
Delaware Tax-Free USA Intermediate Fund
| | | Principal
amount° | Value (US $) |
| Municipal Bonds (continued) |
| Industrial Development Revenue/Pollution ControlRevenue Bonds (continued) |
Denver, Colorado Convention Center Hotel Authority
Revenue | | | |
| (Senior) | | | |
| 5.00% 12/1/25 | | 1,900,000 | $ 1,934,618 |
| 5.00% 12/1/26 | | 2,500,000 | 2,581,050 |
| 5.00% 12/1/29 | | 600,000 | 617,802 |
| 5.00% 12/1/31 | | 900,000 | 923,193 |
| 5.00% 12/1/32 | | 1,800,000 | 1,843,848 |
| 5.00% 12/1/34 | | 1,500,000 | 1,534,125 |
| 5.00% 12/1/35 | | 1,200,000 | 1,224,744 |
| 5.00% 12/1/36 | | 900,000 | 916,614 |
| Erie, New York Tobacco Asset Securitization Revenue | | | |
(Capital Appreciation Asset-Backed)
Series A 144A 8.054% 6/1/60 #, ^ | | 38,675,000 | 1,876,124 |
| Florida Development Finance Revenue | | | |
(Brightline Florida Passenger Rail Expansion Project)
Series A 144A 8.25% 7/1/57 (AMT) #, • | | 7,400,000 | 7,471,040 |
(Brightline Florida Passenger Rail Project)
144A 12.00% 7/15/32 (AMT) #, • | | 10,000,000 | 10,675,000 |
George L Smith II World Congress Center, Georgia
Authority Revenue | | | |
| (Convention Center Hotel) | | | |
| First Tier Series A 4.00% 1/1/54 | | 2,210,000 | 1,980,182 |
| Second Tier Series B 144A 5.00% 1/1/36 # | | 1,000,000 | 1,012,170 |
Inland, California Empire Tobacco Securitization
Revenue | | | |
| (Capital Appreciation Turbo Asset-Backed) | | | |
| Series E 144A 0.935% 6/1/57 #, ^ | | 62,600,000 | 5,078,112 |
| Series F 144A 4.454% 6/1/57 #, ^ | | 74,090,000 | 4,929,208 |
| Iowa Tobacco Settlement Authority Revenue | | | |
| Series A-2 Class 1 4.00% 6/1/38 | | 300,000 | 303,888 |
| Series A-2 Class 1 4.00% 6/1/39 | | 600,000 | 604,992 |
| Series A-2 Class 1 4.00% 6/1/40 | | 300,000 | 301,023 |
Jefferson County, Texas Industrial Development
Revenue | | | |
(TRP Crude Marketing, LLC Project)
144A 7.75% 4/1/39 # | | 1,175,000 | 1,088,191 |
| Kentucky Public Energy Authority Revenue | | | |
| Series A-1 5.25% 4/1/54 • | | 2,750,000 | 3,017,245 |
| Series B 5.00% 1/1/55 • | | 3,750,000 | 4,075,050 |
| | | Principal
amount° | Value (US $) |
| Municipal Bonds (continued) |
| Industrial Development Revenue/Pollution ControlRevenue Bonds (continued) |
| Lower Alabama Gas District Revenue | | | |
| Series A 5.00% 9/1/34 | | 4,850,000 | $ 5,302,651 |
| Maine Finance Authority Revenue | | | |
(Go Lab Madison, LLC Project)
144A 8.00% 12/1/51 (AMT) # | | 3,490,000 | 1,917,999 |
| Michigan Finance Authority Revenue | | | |
| Series A Class 1 4.00% 6/1/49 | | 2,000,000 | 1,846,700 |
| M-S-R Energy Authority, California Gas Revenue | | | |
| Series B 6.50% 11/1/39 | | 580,000 | 752,480 |
| Series B 7.00% 11/1/34 | | 2,905,000 | 3,667,243 |
New Jersey Economic Development Authority Special
Facility Revenue | | | |
(Continental Airlines Project)
Series B 5.625% 11/15/30 (AMT) | | 1,890,000 | 1,903,929 |
| New Jersey Tobacco Settlement Financing Revenue | | | |
| Subordinate Series B 5.00% 6/1/46 | | 1,705,000 | 1,721,078 |
New York Counties, New York Tobacco Trust V
Pass-Through Revenue | | | |
(Subordinate Turbo Capital Appreciation Bond)
Series S4B 144A 8.459% 6/1/60 #, ♦, ^ | | 20,000,000 | 916,800 |
| New York Liberty Development Revenue | | | |
(Goldman Sachs Headquarters)
5.25% 10/1/35 | | 3,540,000 | 4,139,039 |
New York Transportation Development Special
Facility Revenue | | | |
(American Airlines, Inc. - John F. Kennedy International Airport Project)
3.00% 8/1/31 (AMT) | | 1,000,000 | 936,650 |
| (Delta Airlines, Inc. - LaGuardia Airport Terminals C&D Redevelopment Project) | | | |
| 4.00% 10/1/30 (AMT) | | 1,950,000 | 1,950,351 |
| 4.375% 10/1/45 (AMT) | | 2,500,000 | 2,408,175 |
| 5.00% 1/1/33 (AMT) | | 790,000 | 815,596 |
| 5.00% 1/1/34 (AMT) | | 4,210,000 | 4,343,204 |
| 5.00% 1/1/36 (AMT) | | 3,000,000 | 3,084,900 |
| 5.00% 10/1/40 (AMT) | | 1,125,000 | 1,162,845 |
| 6.00% 4/1/35 (AMT) | | 2,000,000 | 2,249,880 |
| Port of Beaumont, Texas Navigation District Revenue | | | |
(Jefferson Gulf Coast Energy Project)
Series A 144A 5.00% 1/1/39 (AMT) # | | 2,000,000 | 2,128,660 |
Schedules of investments
Delaware Tax-Free USA Intermediate Fund
| | | Principal
amount° | Value (US $) |
| Municipal Bonds (continued) |
| Industrial Development Revenue/Pollution ControlRevenue Bonds (continued) |
Public Authority for Colorado Energy Natural Gas
Revenue | | | |
| 6.50% 11/15/38 | | 3,000,000 | $ 3,733,320 |
| Regional Transportation District, Colorado Revenue | | | |
(Denver Transit Partners Eagle P3 Project)
Series A 4.00% 7/15/33 | | 1,000,000 | 1,037,480 |
| Salt Verde, Arizona Financial Senior Gas Revenue | | | |
| 5.00% 12/1/37 | | 4,200,000 | 4,658,094 |
| 5.25% 12/1/24 | | 3,050,000 | 3,061,865 |
South Carolina Jobs - Economic Development
Authority Revenue | | | |
(AAC East LLC Project - Green Bonds)
Series A 144A 7.00% 5/1/39 (AMT) # | | 1,500,000 | 1,331,490 |
(Jasper Pellets, LLC Project - Green Bonds)
Series A 144A 7.00% 11/1/38 (AMT) #, ‡ | | 1,250,000 | 295,000 |
Southeast Energy Authority, A Cooperative District
Revenue, Alabama | | | |
(Project No. 3)
Series A-1 5.50% 1/1/53 • | | 5,500,000 | 5,959,140 |
St. Paul, Minnesota Port Authority Solid Waste
Disposal Revenue | | | |
(Gerdau St. Paul Steel Mill Project)
Series 7 144A 4.50% 10/1/37 (AMT) # | | 2,000,000 | 1,968,840 |
Suffolk, New York Regional Off-Track Betting
Revenue | | | |
| 5.75% 12/1/44 | | 5,000,000 | 5,234,300 |
| Tennergy Gas Supply, Tennessee Revenue | | | |
| Series A 4.00% 12/1/51 • | | 4,400,000 | 4,435,024 |
Tobacco Securitization Authority of Southern
California Revenue | | | |
(Capital Appreciation - Second Subordinate Lien)
Series C 7.242% 6/1/46 ^ | | 9,655,000 | 1,983,909 |
(Capital Appreciation - Third Subordinate Lien)
Series D 2.609% 6/1/46 ^ | | 1,630,000 | 280,181 |
| TSASC, New York Revenue | | | |
| Fiscal 2017 Senior Series A 5.00% 6/1/30 | | 475,000 | 493,535 |
| Fiscal 2017 Senior Series A 5.00% 6/1/31 | | 475,000 | 493,083 |
Tuscaloosa County, Alabama Industrial Development
Authority Revenue | | | |
(Hunt Refining Project)
Series A 144A 5.25% 5/1/44 # | | 2,945,000 | 2,992,179 |
| | | Principal
amount° | Value (US $) |
| Municipal Bonds (continued) |
| Industrial Development Revenue/Pollution ControlRevenue Bonds (continued) |
| Virginia Tobacco Settlement Financing Revenue | | | |
| (Capital Appreciation Bonds) | | | |
| First Subordinate Series C 1.96% 6/1/47 ^ | | 58,500,000 | $ 16,401,645 |
| Second Subordinate Series D 2.466% 6/1/47 ^ | | 8,185,000 | 2,244,654 |
(Convertible Bond)
Senior Series B 5.20% 6/1/46 ~ | | 1,250,000 | 1,250,250 |
| Wisconsin Public Finance Authority Revenue | | | |
| (Senior Lien - Grand Hyatt San Antonio Hotel Acquisition Project) | | | |
| Series A 5.00% 2/1/52 | | 200,000 | 205,424 |
| Series A 5.00% 2/1/62 | | 2,720,000 | 2,778,453 |
| | 232,677,662 |
| Lease Revenue Bonds — 8.45% |
| California State Public Works Board Revenue | | | |
(Various Capital Project)
Series D 5.00% 11/1/46 | | 5,000,000 | 5,578,950 |
Kansas City, Missouri Industrial Development
Authority Revenue | | | |
(Kansas City International Airport Terminal Modernization Project)
Series A 5.00% 3/1/57 (AGM) (AMT) | | 6,795,000 | 6,991,036 |
Metropolitan Pier & Exposition Authority, Illinois
Revenue | | | |
| (McCormick Place Expansion Project) | | | |
| Series A 3.192% 12/15/56 (BAM) ^ | | 12,000,000 | 2,761,320 |
| Series A 4.00% 12/15/42 | | 5,740,000 | 5,672,268 |
| Series A 4.00% 12/15/47 | | 11,560,000 | 11,022,923 |
| Series A 4.00% 6/15/52 | | 1,970,000 | 1,834,109 |
| Series A 4.00% 6/15/52 (BAM) | | 415,000 | 392,075 |
| Series B-1 4.57% 6/15/47 (AGM) ^ | | 8,965,000 | 3,232,331 |
New Jersey Economic Development Authority
Revenue | | | |
(NJ Transit Transportation Project)
Series A 4.00% 11/1/39 | | 2,835,000 | 2,849,515 |
| (Portal North Bridge Project) | | | |
| Series A 5.00% 11/1/28 | | 500,000 | 544,655 |
| Series A 5.00% 11/1/31 | | 1,000,000 | 1,132,520 |
New Jersey Transportation Trust Fund Authority
Revenue | | | |
| Series A 5.20% 12/15/38 (BAM) ^ | | 9,380,000 | 5,415,637 |
| Series A 5.396% 12/15/39 (BAM) ^ | | 15,910,000 | 8,743,659 |
Schedules of investments
Delaware Tax-Free USA Intermediate Fund
| | | Principal
amount° | Value (US $) |
| Municipal Bonds (continued) |
| Lease Revenue Bonds (continued) |
New Jersey Transportation Trust Fund Authority
Revenue | | | |
| Series CC 5.25% 6/15/39 | | 2,000,000 | $ 2,264,200 |
| Series CC 5.25% 6/15/43 | | 4,750,000 | 5,265,090 |
| (Transportation System) | | | |
| Series A 4.00% 6/15/35 | | 1,810,000 | 1,868,716 |
| Series A 5.00% 12/15/25 | | 5,000,000 | 5,143,000 |
| Series BB 4.00% 6/15/46 | | 5,000,000 | 4,831,550 |
New York City, New York Transitional Finance
Authority Building Aid Revenue | | | |
| Fiscal 2015 Series S-1 5.00% 7/15/30 | | 2,000,000 | 2,015,820 |
| Fiscal 2015 Series S-2 5.00% 7/15/40 | | 5,000,000 | 5,073,500 |
| Fiscal 2019 Subseries S-3A 5.00% 7/15/28 | | 4,400,000 | 4,810,080 |
| New York Liberty Development Revenue | | | |
(4 World Trade Center - Green Bond)
Series A 2.875% 11/15/46 (BAM) | | 1,000,000 | 761,470 |
| New York State Thruway Authority Revenue | | | |
| Series A-1 3.00% 3/15/49 | | 6,000,000 | 4,746,300 |
Virginia College Building Authority Educational
Facilities Revenue | | | |
(21st Century College And Equipment Programs)
Series A 5.00% 2/1/29 | | 4,000,000 | 4,418,840 |
Virginia Public Building Authority Public Facilities
Revenue | | | |
| Series A 4.00% 8/1/39 | | 5,000,000 | 5,138,100 |
| | 102,507,664 |
| Local General Obligation Bonds — 4.86% |
| Chicago, Illinois Board of Education | | | |
| Series B 4.00% 12/1/40 | | 2,810,000 | 2,649,156 |
Chicago, Illinois Board of Education Dedicated Capital
Improvement Tax Revenue | | | |
| 5.00% 4/1/35 | | 825,000 | 848,348 |
| 5.00% 4/1/36 | | 320,000 | 328,659 |
| City & County of Denver, Colorado | | | |
| Series B 5.00% 8/1/41 | | 5,170,000 | 5,954,134 |
| City of Chicago, Illinois | | | |
| Series A 5.50% 1/1/35 | | 1,980,000 | 2,124,382 |
| Series C 5.00% 1/1/26 | | 1,280,000 | 1,306,483 |
(Chicago Recovery Plan)
Series A 5.25% 1/1/45 | | 7,250,000 | 7,753,295 |
| | | Principal
amount° | Value (US $) |
| Municipal Bonds (continued) |
| Local General Obligation Bonds (continued) |
| City of Taylor, Texas Combination Tax | | | |
| (Certificates of Obligation) | | | |
| 5.00% 8/15/36 | | 800,000 | $ 908,352 |
| 5.00% 8/15/39 | | 925,000 | 1,035,686 |
County of Harris, Texas Permanent Improvement
Refunding Bonds | | | |
| 5.00% 9/15/43 | | 5,340,000 | 5,952,017 |
| Series A 5.00% 9/15/43 | | 3,805,000 | 4,241,091 |
Dallas County, Texas Cedar Hill Independent School
District | | | |
| 5.00% 2/15/43 | | 2,000,000 | 2,228,180 |
MIDA Golf and Equestrian Center Public
Infrastructure District, Utah | | | |
| 144A 4.125% 6/1/36 # | | 1,790,000 | 1,605,576 |
| 144A 4.25% 6/1/41 # | | 2,210,000 | 1,874,964 |
| New York City, New York | | | |
| Fiscal 2021 Subseries A-1 5.00% 8/1/27 | | 1,000,000 | 1,068,830 |
| Fiscal 2022 Subseries A-1 5.00% 8/1/47 | | 3,500,000 | 3,744,720 |
| Fiscal 2023 Series C 5.00% 8/1/30 | | 2,355,000 | 2,658,983 |
| Subseries A-1 4.00% 8/1/38 | | 5,000,000 | 5,070,000 |
| New York Liberty Development Revenue | | | |
(Port Authority Consolidated Bonds)
Series 1WTC 2.75% 2/15/44 | | 10,000,000 | 7,659,900 |
| | 59,012,756 |
| Pre-Refunded/Escrowed to Maturity Bonds — 1.43% |
| Atlanta, Georgia Water & Wastewater Revenue | | | |
| 5.00% 11/1/35-25 § | | 5,000,000 | 5,078,400 |
| California State Department of Water Resources | | | |
(Central Valley Project Water System)
Unrefunded Series AS 5.00% 12/1/29-24 § | | 2,680,000 | 2,694,097 |
Golden State, California Tobacco Securitization
Corporate Settlement Revenue | | | |
(Asset-Backed Bonds)
Series A-1 5.00% 6/1/26 | | 850,000 | 885,632 |
(Enhanced Asset-Backed)
Series A 5.00% 6/1/35-25 § | | 3,000,000 | 3,056,970 |
Iowa Finance Authority Midwestern Disaster Area
Revenue | | | |
(Iowa Fertilizer Company Project)
5.00% 12/1/50-32 § | | 4,135,000 | 4,809,088 |
Schedules of investments
Delaware Tax-Free USA Intermediate Fund
| | | Principal
amount° | Value (US $) |
| Municipal Bonds (continued) |
| Pre-Refunded/Escrowed to Maturity Bonds (continued) |
Washington State Housing Finance Commission
Revenue | | | |
(Heron's Key Senior Living)
Series A 144A 7.00% 7/1/45-25 #, § | | 800,000 | $ 823,128 |
| | 17,347,315 |
| Special Tax Revenue Bonds — 13.80% |
Allentown, Pennsylvania Neighborhood Improvement
Zone Development Authority Revenue | | | |
(City Center Refunding Project)
144A 5.00% 5/1/42 # | | 3,150,000 | 3,160,521 |
| (Forward Delivery) | | | |
| 5.00% 5/1/31 | | 670,000 | 721,563 |
| 5.00% 5/1/34 | | 750,000 | 806,565 |
| 5.00% 5/1/35 | | 850,000 | 910,231 |
| 5.00% 5/1/36 | | 850,000 | 904,961 |
Camden County, New Jersey Improvement Authority
Revenue | | | |
(County Capital Program)
Series A 5.00% 1/15/40 | | 5,750,000 | 5,782,775 |
Celebration Pointe, Florida Community Development
District No. 1 Revenue | | | |
| 5.00% 5/1/34 | | 830,000 | 830,523 |
City of Tampa, Florida Capital Improvement Cigarette
Tax Allocation Revenue | | | |
(H. Lee Moffitt Cancer Center Project)
Series A 5.08% 9/1/45 ^ | | 12,000,000 | 4,524,240 |
| Commonwealth of Puerto Rico Revenue | | | |
| 1.724% 11/1/51 • | | 2,063,726 | 1,323,364 |
(Subordinate)
2.911% 11/1/43 • | | 24,392,148 | 15,458,524 |
GDB Debt Recovery Authority of Puerto Rico
Revenue | | | |
(Taxable)
7.50% 8/20/40 | | 30,896,661 | 30,124,245 |
Harris County-Houston, Texas Sports Authority
Revenue | | | |
(Senior Lien)
Series A 5.00% 11/15/30 | | 1,805,000 | 1,810,126 |
Indianapolis, Indiana Local Public Improvement Bond
Bank Convention Center Hotel Revenue | | | |
(Senior)
Series E 5.75% 3/1/43 | | 3,350,000 | 3,731,197 |
| | | Principal
amount° | Value (US $) |
| Municipal Bonds (continued) |
| Special Tax Revenue Bonds (continued) |
Irvine, California Facilities Financing Authority
Revenue | | | |
(Irvine Great Park Infrastructure Project)
Series A 5.00% 9/1/48 (BAM) | | 2,500,000 | $ 2,771,950 |
Matching Fund Special Purpose Securitization, Virgin
Islands Revenue | | | |
| Series A 5.00% 10/1/39 | | 1,785,000 | 1,861,344 |
Metropolitan Government Nashville & Davidson
County, Tennessee Sports Authority Revenue | | | |
(Stadium Project)
Series A 5.00% 7/1/43 (AGM) | | 4,050,000 | 4,422,843 |
Miami-Dade County, Florida Special Obligation
Revenue | | | |
| 5.15% 10/1/42 (BAM) ^ | | 3,000,000 | 1,417,140 |
New York City, New York Transitional Finance
Authority Future Tax Secured Revenue | | | |
| (Subordinate) | | | |
| Fiscal 2014 Series C 5.00% 11/1/27 | | 4,150,000 | 4,162,035 |
| Fiscal 2024 Subseries G-1 5.00% 5/1/42 | | 2,350,000 | 2,638,392 |
| Subseries E-1 5.00% 2/1/32 | | 5,000,000 | 5,225,200 |
New York Metropolitan Transportation Authority
Revenue | | | |
(Climate Bond Certified - Green Bonds)
Subseries B-2 5.00% 11/15/36 | | 5,000,000 | 5,178,600 |
New York State Dormitory Authority Personal Income
Tax Revenue | | | |
| (General Purpose) | | | |
| Series A 5.00% 3/15/41 | | 1,500,000 | 1,688,595 |
| Series E 3.00% 3/15/50 | | 1,500,000 | 1,185,840 |
New York State Thruway Authority State Personal
Income Tax Revenue | | | |
| Series A 5.00% 3/15/41 | | 5,000,000 | 5,576,200 |
New York Triborough Bridge & Tunnel Authority
Payroll Mobility Tax Senior Lien Revenue | | | |
(MTA Bridges and Tunnels)
Subseries A-1 4.00% 5/15/46 | | 6,000,000 | 5,946,660 |
Pasco County, Florida Capital Improvement Tax
Revenue | | | |
| (H. Lee Moffitt Cancer Center Project) | | | |
| Series A 5.50% 9/1/42 (AGM) | | 1,000,000 | 1,119,190 |
| Series A 5.50% 9/1/43 (AGM) | | 1,000,000 | 1,114,200 |
| Series A 5.50% 9/1/44 (AGM) | | 1,000,000 | 1,113,490 |
Schedules of investments
Delaware Tax-Free USA Intermediate Fund
| | | Principal
amount° | Value (US $) |
| Municipal Bonds (continued) |
| Special Tax Revenue Bonds (continued) |
| Puerto Rico Sales Tax Financing Revenue | | | |
| (Restructured) | | | |
| Series A-1 1.126% 7/1/51 ^ | | 31,841,000 | $ 7,814,100 |
| Series A-1 1.607% 7/1/46 ^ | | 9,170,000 | 3,092,032 |
| Series A-1 4.55% 7/1/40 | | 5,765,000 | 5,778,721 |
| Series A-1 4.75% 7/1/53 | | 17,993,000 | 17,857,872 |
| Series A-1 5.00% 7/1/58 | | 1,330,000 | 1,335,879 |
| Series A-2 4.329% 7/1/40 | | 5,453,000 | 5,392,963 |
Richmond Heights, Missouri Tax Increment &
Transaction Sales Tax Revenue | | | |
(Francis Place Redevelopment Project)
5.625% 11/1/25 | | 415,000 | 413,518 |
Utah Telecommunication Open Infrastructure Agency
Revenue | | | |
| 5.25% 6/1/33 | | 1,000,000 | 1,143,450 |
| 5.25% 6/1/34 | | 1,000,000 | 1,140,790 |
| 5.25% 6/1/35 | | 1,000,000 | 1,140,780 |
| 5.25% 6/1/37 | | 2,100,000 | 2,382,135 |
| 5.50% 6/1/40 | | 2,000,000 | 2,256,880 |
Washington County, Pennsylvania Redevelopment
Authority Revenue | | | |
(Victory Centre Tax Increment Financing Project)
5.00% 7/1/35 | | 500,000 | 502,325 |
| Wisconsin Public Finance Authority Revenue | | | |
(American Dream @ Meadowlands Project)
144A 7.00% 12/1/50 # | | 1,010,000 | 1,037,149 |
Wyandotte County, Kansas City, Kansas Unified
Government Special Obligation Revenue | | | |
(Sales Tax - Vacation Village Project Area 1 and 2A)
Series 2015A 5.00% 9/1/27 | | 665,000 | 658,470 |
| | 167,457,578 |
| State General Obligation Bonds — 9.90% |
| California State | | | |
| (Various Purpose) | | | |
| 4.00% 10/1/36 | | 3,875,000 | 4,006,169 |
| 4.00% 10/1/37 | | 2,000,000 | 2,064,700 |
| 5.00% 8/1/26 | | 3,120,000 | 3,261,273 |
| 5.00% 10/1/26 | | 2,500,000 | 2,627,875 |
| 5.00% 9/1/32 | | 1,400,000 | 1,598,660 |
| 5.00% 8/1/33 | | 4,100,000 | 4,252,192 |
| 5.00% 9/1/36 | | 4,000,000 | 4,138,240 |
| | | Principal
amount° | Value (US $) |
| Municipal Bonds (continued) |
| State General Obligation Bonds (continued) |
| California State | | | |
| (Various Purpose) |
| 5.00% 10/1/42 | | 2,000,000 | $ 2,251,840 |
| 5.00% 11/1/42 | | 470,000 | 526,668 |
| 5.25% 8/1/44 | | 3,000,000 | 3,480,780 |
| 5.25% 9/1/47 | | 1,000,000 | 1,122,740 |
| Commonwealth of Massachusetts | | | |
| Series A 5.00% 1/1/37 | | 7,500,000 | 8,066,250 |
| Commonwealth of Puerto Rico Revenue | | | |
| (Restructured) | | | |
| Series A-1 4.00% 7/1/35 | | 7,000,000 | 6,908,790 |
| Series A-1 4.00% 7/1/37 | | 7,488,979 | 7,326,693 |
| Series A-1 4.00% 7/1/41 | | 830,000 | 788,882 |
| Series A-1 4.00% 7/1/46 | | 11,820,000 | 10,975,224 |
| Connecticut State | | | |
| Series F 5.00% 9/15/27 | | 2,790,000 | 2,992,610 |
| Illinois State | | | |
| 5.00% 1/1/28 | | 1,630,000 | 1,669,674 |
| 5.00% 11/1/36 | | 1,965,000 | 2,006,462 |
| 5.25% 2/1/30 | | 2,410,000 | 2,413,808 |
| 5.25% 2/1/32 | | 1,015,000 | 1,016,421 |
| 5.25% 10/1/47 | | 3,180,000 | 3,434,782 |
| 5.50% 5/1/39 | | 2,500,000 | 2,747,025 |
| Series A 4.00% 3/1/41 | | 4,650,000 | 4,548,490 |
| Series A 5.125% 12/1/29 | | 3,260,000 | 3,471,607 |
| Series B 4.00% 10/1/35 | | 8,830,000 | 8,876,357 |
| Series C 4.00% 10/1/37 | | 1,710,000 | 1,706,135 |
| Series D 5.00% 11/1/25 | | 1,220,000 | 1,248,048 |
| (Rebuild Illinois Program) | | | |
| Series B 4.00% 11/1/35 | | 2,200,000 | 2,209,394 |
| Series B 4.00% 11/1/38 | | 1,810,000 | 1,791,375 |
| New Jersey State | | | |
(COVID-19 General Obligation Emergency Bonds)
Series A 4.00% 6/1/32 | | 3,440,000 | 3,707,288 |
| Oregon State | | | |
(Article XI-Q State Projects)
Series A 5.25% 5/1/45 | | 2,590,000 | 2,923,825 |
| Washington State | | | |
| (Various Purpose) | | | |
| Series A 5.00% 8/1/35 | | 3,000,000 | 3,385,620 |
| Series E 5.00% 7/1/31 | | 3,000,000 | 3,018,600 |
Schedules of investments
Delaware Tax-Free USA Intermediate Fund
| | | Principal
amount° | Value (US $) |
| Municipal Bonds (continued) |
| State General Obligation Bonds (continued) |
| Wisconsin State | | | |
| Series B 5.00% 5/1/38 | | 3,000,000 | $ 3,495,450 |
| | 120,059,947 |
| Transportation Revenue Bonds — 16.10% |
| Atlanta, Georgia Department of Aviation Revenue | | | |
| Series B 5.00% 7/1/32 (AMT) | | 1,000,000 | 1,108,570 |
| Series B 5.00% 7/1/33 (AMT) | | 2,045,000 | 2,248,518 |
| Central Texas Turnpike System Revenue | | | |
(First Tier)
Series A 5.00% 8/15/38 | | 4,250,000 | 4,782,397 |
| Chicago, Illinois Midway Airport Revenue | | | |
(Senior)
Series C 5.00% 1/1/41 (AMT) | | 1,250,000 | 1,326,288 |
Chicago, Illinois O'Hare International Airport Senior
Lien Revenue | | | |
| Series A 4.00% 1/1/36 | | 1,180,000 | 1,204,744 |
| Series A 5.00% 1/1/37 (AMT) | | 5,000,000 | 5,230,950 |
| Series B 5.00% 1/1/33 | | 2,520,000 | 2,532,197 |
| Series B 5.00% 1/1/36 | | 5,000,000 | 5,360,050 |
City & County of Denver, Colorado Airport System
Revenue | | | |
| Series A 4.00% 12/1/43 (AMT) | | 7,890,000 | 7,564,932 |
(Subordinate)
Series A 5.00% 12/1/43 (AMT) | | 6,300,000 | 6,489,441 |
City of Los Angeles, California Department of Airports
Revenue | | | |
| Series A 5.00% 5/15/33 (AMT) | | 845,000 | 923,306 |
City of Phoenix, Arizona Civic Improvement Airport
Revenue | | | |
| (Junior Lien) | | | |
| Series A 5.00% 7/1/33 | | 3,355,000 | 3,398,749 |
| Series B 5.00% 7/1/49 (AMT) | | 3,900,000 | 4,010,331 |
| City of Salt Lake, Utah Airport Revenue | | | |
| Series A 5.00% 7/1/37 (AMT) | | 15,000,000 | 15,591,750 |
| Series B 5.00% 7/1/33 | | 1,000,000 | 1,045,690 |
Connecticut State Transportation Infrastructure
Revenue | | | |
| Series B 5.00% 10/1/30 | | 3,375,000 | 3,653,674 |
| Florida Development Finance Revenue | | | |
| (Brightline Florida Passenger Rail Project) | | | |
| 5.25% 7/1/53 (AGM) (AMT) | | 8,875,000 | 9,361,173 |
| | | Principal
amount° | Value (US $) |
| Municipal Bonds (continued) |
| Transportation Revenue Bonds (continued) |
| Florida Development Finance Revenue | | | |
| (Brightline Florida Passenger Rail Project) |
| 5.50% 7/1/53 (AMT) | | 5,225,000 | $ 5,421,721 |
Foothill-Eastern, California Transportation Corridor
Agency Toll Road Revenue | | | |
(Senior Lien)
Series A 4.00% 1/15/46 (BAM) | | 1,000,000 | 1,002,730 |
Gerald R Ford International Airport Authority, Michigan
Revenue | | | |
| 5.00% 1/1/39 (AMT) | | 1,000,000 | 1,109,590 |
| 5.00% 1/1/41 (AMT) | | 1,500,000 | 1,646,160 |
| Illinois State Toll Highway Authority Revenue | | | |
| (Senior) | | | |
| Series A 5.25% 1/1/43 | | 6,500,000 | 7,332,390 |
| Series A 5.25% 1/1/45 | | 3,500,000 | 3,913,420 |
Metropolitan Nashville, Tennessee Airport Authority
Revenue | | | |
| Series B 5.50% 7/1/41 (AMT) | | 1,500,000 | 1,671,000 |
| Series B 5.50% 7/1/42 (AMT) | | 1,855,000 | 2,058,475 |
Metropolitan Washington D.C. Airports Authority
Aviation Revenue | | | |
| Series A 5.00% 10/1/42 (AMT) | | 2,500,000 | 2,680,400 |
Metropolitan Washington D.C. Airports Authority
Dulles Toll Road Revenue | | | |
(Dulles Metrorail and Capital Improvement Projects)
Series B 4.00% 10/1/38 | | 1,000,000 | 1,002,820 |
| Miami-Dade County, Florida Aviation Revenue | | | |
| Series B 5.00% 10/1/37 | | 5,700,000 | 5,716,131 |
| Monroe County, Florida Airport Revenue | | | |
| (Key West International Airport) | | | |
| 5.00% 10/1/36 (AMT) | | 1,235,000 | 1,322,080 |
| 5.00% 10/1/37 (AMT) | | 1,270,000 | 1,355,776 |
| 5.00% 10/1/38 (AMT) | | 1,360,000 | 1,444,605 |
| 5.00% 10/1/40 (AMT) | | 1,475,000 | 1,551,508 |
| New Jersey State Turnpike Authority Revenue | | | |
| Series A 5.00% 1/1/33 | | 1,770,000 | 1,845,030 |
| Series E 5.00% 1/1/32 | | 5,050,000 | 5,371,887 |
New Jersey Transportation Trust Fund Authority
Revenue | | | |
| Series A 5.00% 6/15/29 | | 1,500,000 | 1,550,730 |
Schedules of investments
Delaware Tax-Free USA Intermediate Fund
| | | Principal
amount° | Value (US $) |
| Municipal Bonds (continued) |
| Transportation Revenue Bonds (continued) |
| New Orleans, Louisiana Aviation Board Revenue | | | |
| (North Terminal Project) | | | |
| Series B 5.00% 1/1/32 (AGM) (AMT) | | 2,900,000 | $ 2,912,441 |
| Series B 5.00% 1/1/33 (AGM) (AMT) | | 2,900,000 | 2,912,035 |
New York Metropolitan Transportation Authority
Revenue | | | |
| Subseries A-2 4.00% 11/15/41 | | 3,000,000 | 2,992,830 |
| New York State Thruway Authority General Revenue | | | |
| (Junior Indebtedness Obligations) | | | |
| Series B 4.00% 1/1/38 | | 2,135,000 | 2,176,889 |
| Series B 4.00% 1/1/41 | | 10,000,000 | 9,999,100 |
New York Transportation Development Special
Facilities Revenue | | | |
| (John F. Kennedy International Airport New Terminal One Project-Green Bonds) | | | |
| 5.25% 6/30/43 (AMT) | | 5,500,000 | 5,914,755 |
| 5.50% 6/30/38 (AMT) | | 1,670,000 | 1,848,824 |
| 5.50% 6/30/40 (AMT) | | 800,000 | 877,288 |
| 5.50% 6/30/42 (AGM) (AMT) | | 1,750,000 | 1,920,450 |
(LaGuardia Airport Terminal B Redevelopment Project)
Series A 4.00% 7/1/35 (AGM) (AMT) | | 2,660,000 | 2,655,717 |
| (Terminal 4 John F. Kennedy International Airport Project) | | | |
| 5.00% 12/1/32 (AMT) | | 1,500,000 | 1,635,855 |
| 5.00% 12/1/33 (AMT) | | 3,955,000 | 4,303,317 |
| 5.00% 12/1/37 (AMT) | | 1,000,000 | 1,072,130 |
| Series A 5.00% 12/1/35 (AMT) | | 1,000,000 | 1,063,410 |
New York Transportation Development Special
Facility Revenue | | | |
(John F. Kennedy International Airport New Terminal One Project-Green Bonds)
5.375% 6/30/60 (AMT) | | 2,500,000 | 2,608,775 |
| Oregon State Department of Transportation Revenue | | | |
| 5.00% 5/15/39 | | 1,500,000 | 1,725,525 |
| Pennsylvania Turnpike Commission Revenue | | | |
| Series A-1 5.00% 12/1/40 | | 2,090,000 | 2,107,013 |
| Series A-1 5.00% 12/1/45 | | 1,000,000 | 1,007,320 |
| Series B 5.00% 12/1/45 | | 3,000,000 | 3,036,120 |
| Port Authority of New York & New Jersey Revenue | | | |
| One Hundred Ninety-Fourth Series 5.00% 10/15/32 | | 2,500,000 | 2,557,125 |
| | | Principal
amount° | Value (US $) |
| Municipal Bonds (continued) |
| Transportation Revenue Bonds (continued) |
| Port Authority of New York & New Jersey Revenue | | | |
| Two Hundred Eighteenth Series 4.00% 11/1/41 (AMT) | | 2,480,000 | $ 2,425,068 |
| Two Hundred Twenty-First Series 4.00% 7/15/36 (AMT) | | 1,200,000 | 1,213,500 |
Puerto Rico Industrial Tourist Educational, Medical &
Environmental Control Facilities Financing Authority Revenue | | | |
(San Juan Cruise Terminal Project)
Subseries A-2 6.75% 1/1/45 (AMT) | | 5,000,000 | 5,991,700 |
| South Jersey Port, New Jersey Revenue | | | |
| (Subordinated Marine Terminal) | | | |
| Series B 5.00% 1/1/25 (AMT) | | 390,000 | 391,533 |
| Series B 5.00% 1/1/30 (AMT) | | 230,000 | 242,827 |
| Series B 5.00% 1/1/32 (AMT) | | 215,000 | 225,812 |
| Series B 5.00% 1/1/33 (AMT) | | 705,000 | 738,241 |
| Series B 5.00% 1/1/34 (AMT) | | 880,000 | 919,327 |
| Series B 5.00% 1/1/35 (AMT) | | 675,000 | 703,694 |
| Series B 5.00% 1/1/36 (AMT) | | 660,000 | 686,710 |
| Series B 5.00% 1/1/37 (AMT) | | 430,000 | 446,676 |
Texas Private Activity Bond Surface Transportation
Revenue | | | |
| (Senior Lien) | | | |
| 5.50% 6/30/42 (AMT) | | 500,000 | 539,750 |
| 5.50% 6/30/43 (AMT) | | 1,500,000 | 1,615,905 |
| | 195,296,875 |
| Water & Sewer Revenue Bonds — 1.50% |
Broward County, Florida Water & Sewer Utility
Revenue | | | |
| Series A 4.00% 10/1/45 | | 2,640,000 | 2,601,746 |
City of Tampa, Florida Water & Wastewater System
Revenue | | | |
(Green Bonds)
Series A 5.00% 10/1/47 | | 4,000,000 | 4,391,960 |
Great Lakes, Michigan Water Authority Water Supply
System Revenue | | | |
(Senior Lien Bond)
Series C 5.00% 7/1/31 | | 3,000,000 | 3,116,250 |
| Jefferson County, Alabama Sewer Revenue | | | |
| 5.25% 10/1/42 | | 2,000,000 | 2,204,380 |
| 5.25% 10/1/44 | | 2,500,000 | 2,734,600 |
Schedules of investments
Delaware Tax-Free USA Intermediate Fund
| | | Principal
amount° | Value (US $) |
| Municipal Bonds (continued) |
| Water & Sewer Revenue Bonds (continued) |
San Antonio, Texas River Authority Wastewater
System Revenue | | | |
| 4.00% 1/1/40 (BAM) | | 820,000 | $ 826,601 |
| San Antonio, Texas Water System Revenue | | | |
(Junior Lien)
Series A 5.00% 5/15/33 | | 2,250,000 | 2,361,240 |
| | 18,236,777 |
| Total Municipal Bonds (cost $1,173,022,715) | 1,195,294,644 |
|
|
|
| Short-Term Investments — 0.83% |
| Variable Rate Demand Notes — 0.83%¤ |
| Arizona Industrial Development Authority Revenue | | | |
(Phoenix Children's Hospital) Series B 3.80% 2/1/48
(LOC - TD Bank, N.A.) | | 1,530,000 | 1,530,000 |
City of Minneapolis, Minnesota Health Care System
Revenue | | | |
(Fairview Health Services) Series C 3.80% 11/15/48
(LOC - Wells Fargo Bank, N.A.) | | 1,500,000 | 1,500,000 |
| Illinois Finance Authority Revenue | | | |
(The University of Chicago Medical Center) Series B 3.80% 8/1/44
(LOC - TD Bank, N.A.) | | 1,000,000 | 1,000,000 |
Los Angeles, California Department of Water & Power
System Revenue | | | |
Subseries A-1 3.65% 7/1/50
(SPA - Royal Bank of Canada) | | 1,000,000 | 1,000,000 |
Subseries A-2 3.65% 7/1/45
(SPA - Barclays Bank) | | 700,000 | 700,000 |
| New York City, New York | | | |
Fiscal 2023 Subordinate Series A-4 3.80% 9/1/49
(SPA - TD Bank, N.A.) | | 1,000,000 | 1,000,000 |
| | | Principal
amount° | Value (US $) |
| Short-Term Investments (continued) |
| Variable Rate Demand Notes¤ (continued) |
| Oregon Facilities Authority Refunding Revenue | | | |
(PeaceHealth) Series B 3.80% 8/1/34
(LOC - TD Bank, N.A.) | | 3,400,000 | $ 3,400,000 |
| Total Short-Term Investments (cost $10,130,000) | 10,130,000 |
Total Value of Securities—99.35%
(cost $1,183,152,715) | | | $1,205,424,644 |
| ° | Principal amount shown is stated in USD unless noted that the security is denominated in another currency. |
| # | Security exempt from registration under Rule 144A of the Securities Act of 1933, as amended. At August 31, 2024, the aggregate value of Rule 144A securities was $88,941,582, which represents 7.33% of the Fund’s net assets. See Note 10 in “Notes to financial statements.” |
| ‡ | Non-income producing security. Security is currently in default. |
| • | Variable rate investment. Rates reset periodically. Rate shown reflects the rate in effect at August 31, 2024. For securities based on a published reference rate and spread, the reference rate and spread are indicated in their descriptions. The reference rate descriptions (i.e. SOFR01M, SOFR03M, etc.) used in this report are identical for different securities, but the underlying reference rates may differ due to the timing of the reset period. Certain variable rate securities are not based on a published reference rate and spread but are determined by the issuer or agent and are based on current market conditions, or for mortgage-backed securities, are impacted by the individual mortgages which are paying off over time. These securities do not indicate a reference rate and spread in their descriptions. |
| ^ | Zero-coupon security. The rate shown is the effective yield at the time of purchase. |
| ♦ | Pass Through Agreement. Security represents the contractual right to receive a proportionate amount of underlying payments due to the counterparty pursuant to various agreements related to the rescheduling of obligations and the exchange of certain notes. |
| ~ | Step-up bond that pays an initial coupon rate for the first period and then a higher coupon rate for the following periods. Stated rate in effect at August 31, 2024. |
| § | Pre-refunded bonds. Municipal bonds that are generally backed or secured by US Treasury bonds. For pre-refunded bonds, the stated maturity is followed by the year in which the bond will be pre-refunded. See Note 10 in “Notes to financial statements.” |
| ¤ | Tax-exempt obligations that contain a floating or variable interest rate adjustment formula and an unconditional right of demand to receive payment of the unpaid principal balance plus accrued interest upon a short notice period (generally up to 30 days) prior to specified dates either from the issuer or by drawing on a bank letter of credit, a guarantee, or insurance issued with respect to such instrument. Each rate shown is as of August 31, 2024. |
Schedules of investments
Delaware Tax-Free USA Intermediate Fund
| Summary of abbreviations: |
| AGM – Insured by Assured Guaranty Municipal Corporation |
| AMT – Subject to Alternative Minimum Tax |
| BAM – Insured by Build America Mutual Assurance |
| CHF – Collegiate Housing Foundation |
| KIPP – Knowledge is Power Program |
| LLC – Limited Liability Corporation |
| LOC – Letter of Credit |
| N.A. – National Association |
| NATL – Insured by National Public Finance Guarantee Corporation |
| SOFR01M – Secured Overnight Financing Rate 1 Month |
| SOFR03M – Secured Overnight Financing Rate 3 Month |
| SPA – Stand-by Purchase Agreement |
| USD – US Dollar |
See accompanying notes, which are an integral part of the financial statements.
Statements of assets and liabilities
August 31, 2024
| | Delaware
National High-Yield
Municipal Bond Fund | | Delaware
Tax-Free
USA Fund | | Delaware
Tax-Free USA
Intermediate Fund |
| Assets: | | | | | |
| Investments, at value* | $3,323,666,999 | | $1,228,338,271 | | $1,205,424,644 |
| Cash | 4,180,582 | | 8,698,293 | | 215,775 |
| Interest receivable | 32,827,283 | | 11,587,499 | | 12,524,889 |
| Receivable for fund shares sold | 3,653,923 | | 1,095,473 | | 1,328,614 |
| Prepaid expenses | 45,628 | | 23,602 | | 26,462 |
| Other assets | 19,450 | | 7,206 | | 8,544 |
| Total Assets | 3,364,393,865 | | 1,249,750,344 | | 1,219,528,928 |
| Liabilities: | | | | | |
| Payable for securities purchased | 13,179,531 | | 25,013,214 | | 3,444,300 |
| Payable for fund shares redeemed | 7,136,875 | | 2,408,224 | | 1,550,295 |
| Investment management fees payable to affiliates | 1,328,063 | | 441,735 | | 447,277 |
| Distribution payable | 1,085,177 | | 505,382 | | 455,365 |
| Other accrued expenses | 581,221 | | 299,933 | | 267,790 |
| Distribution fees payable to affiliates | 194,948 | | 160,270 | | 85,344 |
| Total Liabilities | 23,505,815 | | 28,828,758 | | 6,250,371 |
| Total Net Assets | $3,340,888,050 | | $1,220,921,586 | | $1,213,278,557 |
|
| Net Assets Consist of: | | | | | |
| Paid-in capital | $3,566,668,338 | | $1,296,211,513 | | $1,258,306,292 |
| Total distributable earnings (loss) | (225,780,288) | | (75,289,927) | | (45,027,735) |
| Total Net Assets | $3,340,888,050 | | $1,220,921,586 | | $1,213,278,557 |
Statements of assets and liabilities
| | Delaware
National High-Yield
Municipal Bond Fund | Delaware
Tax-Free
USA Fund | Delaware
Tax-Free USA
Intermediate Fund |
|
| Net Asset Value | | | |
|
| Class A: | | | |
| Net assets | $697,863,078 | $700,740,288 | $384,303,540 |
| Shares of beneficial interest outstanding, unlimited authorization, no par | 67,229,177 | 65,088,043 | 34,263,248 |
| Net asset value per share | $10.38 | $10.77 | $11.22 |
| Sales charge | 4.50% | 4.50% | 2.75% |
| Offering price per share, equal to net asset value per share / (1 - sales charge) | $10.87 | $11.28 | $11.54 |
|
| Class C: | | | |
| Net assets | $57,976,291 | $10,351,997 | $4,257,701 |
| Shares of beneficial interest outstanding, unlimited authorization, no par | 5,563,985 | 961,344 | 379,975 |
| Net asset value per share | $10.42 | $10.77 | $11.21 |
|
| Institutional Class: | | | |
| Net assets | $2,585,048,681 | $509,829,301 | $824,717,316 |
| Shares of beneficial interest outstanding, unlimited authorization, no par | 246,776,822 | 46,978,680 | 72,835,480 |
| Net asset value per share | $10.48 | $10.85 | $11.32 |
*Investments, at cost | $3,388,402,100 | $1,184,402,464 | $1,183,152,715 |
See accompanying notes, which are an integral part of the financial statements.
Statements of operations
Year ended August 31, 2024
| | Delaware
National High-Yield
Municipal Bond Fund | | Delaware
Tax-Free
USA Fund | | Delaware
Tax-Free USA
Intermediate Fund |
| Investment Income: | | | | | |
| Interest | $168,472,604 | | $53,804,627 | | $50,908,250 |
|
| Expenses: | | | | | |
| Management fees | 13,661,489 | | 5,577,812 | | 5,588,497 |
| Distribution expenses — Class A | 1,585,321 | | 1,669,759 | | 982,008 |
| Distribution expenses — Class C | 532,476 | | 93,715 | | 47,215 |
| Dividend disbursing and transfer agent fees and expenses | 2,400,792 | | 648,431 | | 889,436 |
| Accounting and administration expenses | 460,055 | | 177,923 | | 192,048 |
| Legal fees | 416,146 | | 148,172 | | 143,929 |
| Registration fees | 302,801 | | 96,817 | | 127,742 |
| Reports and statements to shareholders expenses | 250,466 | | 105,376 | | 67,580 |
| Trustees’ fees | 123,808 | | 45,991 | | 51,268 |
| Audit and tax fees | 58,261 | | 58,261 | | 46,001 |
| Custodian fees | 25,184 | | 9,778 | | 10,478 |
| Other | 188,903 | | 78,519 | | 95,724 |
| | 20,005,702 | | 8,710,554 | | 8,241,926 |
| Less expenses waived | (486,586) | | (998,357) | | (1,384,352) |
| Less expenses paid indirectly | (25,214) | | (10,636) | | (11,069) |
| Total operating expenses | 19,493,902 | | 7,701,561 | | 6,846,505 |
| Net Investment Income (Loss) | 148,978,702 | | 46,103,066 | | 44,061,745 |
| Net Realized and Unrealized Gain (Loss): | | | | | |
| Net realized gain (loss) on investments | (18,736,172) | | (17,448,039) | | (5,951,355) |
| Net change in unrealized appreciation (depreciation) on investments | 220,433,223 | | 96,180,019 | | 61,821,739 |
| Net Realized and Unrealized Gain (Loss) | 201,697,051 | | 78,731,980 | | 55,870,384 |
| Net Increase (Decrease) in Net Assets Resulting from Operations | $350,675,753 | | $124,835,046 | | $99,932,129 |
See accompanying notes, which are an integral part of the financial statements.
Statements of changes in net assets
Delaware National High-Yield Municipal Bond Fund
| | Year ended |
| | 8/31/24 | | 8/31/23 |
| Increase (Decrease) in Net Assets from Operations: | | | |
| Net investment income (loss) | $148,978,702 | | $95,971,125 |
| Net realized gain (loss) | (18,736,172) | | (18,871,167) |
| Net change in unrealized appreciation (depreciation) | 220,433,223 | | (111,713,910) |
| Net increase (decrease) in net assets resulting from operations | 350,675,753 | | (34,613,952) |
|
| Dividends and Distributions to Shareholders from: | | | |
| Distributable earnings: | | | |
| Class A | (30,302,564) | | (13,967,631) |
| Class C | (2,140,227) | | (1,769,724) |
| Institutional Class | (110,605,695) | | (83,695,859) |
| | (143,048,486) | | (99,433,214) |
|
| Capital Share Transactions (See Note 6): | | | |
| Proceeds from shares sold: | | | |
| Class A | 186,625,706 | | 153,803,317 |
| Class C | 20,202,133 | | 15,810,320 |
| Institutional Class | 1,529,392,541 | | 1,557,341,473 |
|
| Net assets from reorganization:1 | | | |
| Class A | 312,501,951 | | — |
| Class C | 8,337,619 | | — |
| Institutional Class | 121,654,911 | | — |
|
| Net asset value of shares issued upon reinvestment of dividends and distributions: | | | |
| Class A | 29,845,821 | | 12,838,334 |
| Class C | 2,100,899 | | 1,666,105 |
| Institutional Class | 99,427,315 | | 72,106,517 |
| | 2,310,088,896 | | 1,813,566,066 |
| | Year ended |
| | 8/31/24 | | 8/31/23 |
| Capital Share Transactions (continued): | | | |
| Cost of shares redeemed: | | | |
| Class A | $(194,164,768) | | $(93,380,058) |
| Class C | (19,665,663) | | (17,682,031) |
| Institutional Class | (1,131,718,242) | | (1,252,490,538) |
| | (1,345,548,673) | | (1,363,552,627) |
| Increase in net assets derived from capital share transactions | 964,540,223 | | 450,013,439 |
| Net Increase in Net Assets | 1,172,167,490 | | 315,966,273 |
|
| Net Assets: | | | |
| Beginning of year | 2,168,720,560 | | 1,852,754,287 |
| End of year | $3,340,888,050 | | $2,168,720,560 |
| 1 | See Note 7 in “Notes to financial statements.” |
See accompanying notes, which are an integral part of the financial statements.
Statements of changes in net assets
Delaware Tax-Free USA Fund
| | Year ended |
| | 8/31/24 | | 8/31/23 |
| Increase (Decrease) in Net Assets from Operations: | | | |
| Net investment income (loss) | $46,103,066 | | $29,720,825 |
| Net realized gain (loss) | (17,448,039) | | (30,645,705) |
| Net change in unrealized appreciation (depreciation) | 96,180,019 | | (10,710,260) |
| Net increase (decrease) in net assets resulting from operations | 124,835,046 | | (11,635,140) |
|
| Dividends and Distributions to Shareholders from: | | | |
| Distributable earnings: | | | |
| Class A | (28,207,419) | | (19,406,727) |
| Class C | (323,466) | | (234,267) |
| Institutional Class | (17,572,181) | | (10,079,832) |
| | (46,103,066) | | (29,720,826) |
|
| Capital Share Transactions (See Note 6): | | | |
| Proceeds from shares sold: | | | |
| Class A | 79,423,670 | | 64,922,267 |
| Class C | 3,894,045 | | 2,019,449 |
| Institutional Class | 276,783,350 | | 199,258,747 |
|
| Net assets from reorganization:1 | | | |
| Class A | 213,736,002 | | — |
| Class C | 2,397,289 | | — |
| Institutional Class | 89,102,523 | | — |
|
| Net asset value of shares issued upon reinvestment of dividends and distributions: | | | |
| Class A | 26,742,635 | | 17,429,261 |
| Class C | 321,227 | | 225,820 |
| Institutional Class | 15,149,070 | | 8,676,864 |
| | 707,549,811 | | 292,532,408 |
| | Year ended |
| | 8/31/24 | | 8/31/23 |
| Capital Share Transactions (continued): | | | |
| Cost of shares redeemed: | | | |
| Class A | $(139,057,713) | | $(124,176,268) |
| Class C | (3,641,318) | | (3,565,123) |
| Institutional Class | (165,108,781) | | (293,420,592) |
| | (307,807,812) | | (421,161,983) |
| Increase (decrease) in net assets derived from capital share transactions | 399,741,999 | | (128,629,575) |
| Net Increase (Decrease) in Net Assets | 478,473,979 | | (169,985,541) |
|
| Net Assets: | | | |
| Beginning of year | 742,447,607 | | 912,433,148 |
| End of year | $1,220,921,586 | | $742,447,607 |
| 1 | See Note 7 in “Notes to financial statements.” |
See accompanying notes, which are an integral part of the financial statements.
Statements of changes in net assets
Delaware Tax-Free USA Intermediate Fund
| | Year ended |
| | 8/31/24 | | 8/31/23 |
| Increase (Decrease) in Net Assets from Operations: | | | |
| Net investment income (loss) | $44,061,745 | | $39,501,500 |
| Net realized gain (loss) | (5,951,355) | | (19,902,832) |
| Net change in unrealized appreciation (depreciation) | 61,821,739 | | (12,794,094) |
| Net increase (decrease) in net assets resulting from operations | 99,932,129 | | 6,804,574 |
|
| Dividends and Distributions to Shareholders from: | | | |
| Distributable earnings: | | | |
| Class A | (14,305,347) | | (14,615,401) |
| Class C | (136,450) | | (153,171) |
| Institutional Class | (29,619,949) | | (24,733,154) |
| | (44,061,746) | | (39,501,726) |
|
| Capital Share Transactions (See Note 6): | | | |
| Proceeds from shares sold: | | | |
| Class A | 24,779,419 | | 48,083,715 |
| Class C | 997,283 | | 1,188,284 |
| Institutional Class | 275,460,185 | | 528,477,921 |
|
| Net asset value of shares issued upon reinvestment of dividends and distributions: | | | |
| Class A | 12,715,168 | | 12,840,577 |
| Class C | 133,840 | | 149,566 |
| Institutional Class | 26,063,116 | | 21,906,539 |
| | 340,149,011 | | 612,646,602 |
| | Year ended |
| | 8/31/24 | | 8/31/23 |
| Capital Share Transactions (continued): | | | |
| Cost of shares redeemed: | | | |
| Class A | $(84,370,514) | | $(88,524,439) |
| Class C | (2,279,949) | | (2,825,816) |
| Institutional Class | (264,665,066) | | (389,254,059) |
| | (351,315,529) | | (480,604,314) |
| Increase (decrease) in net assets derived from capital share transactions | (11,166,518) | | 132,042,288 |
| Net Increase in Net Assets | 44,703,865 | | 99,345,136 |
|
| Net Assets: | | | |
| Beginning of year | 1,168,574,692 | | 1,069,229,556 |
| End of year | $1,213,278,557 | | $1,168,574,692 |
See accompanying notes, which are an integral part of the financial statements.
Financial highlights
Delaware National High-Yield Municipal Bond Fund Class A
Selected data for each share of the Fund outstanding throughout each period were as follows:
| |
| |
Net asset value, beginning of period
|
| |
| Income (loss) from investment operations: |
Net investment income1
|
Net realized and unrealized gain (loss)
|
Total from investment operations
|
| |
| Less dividends and distributions from: |
Net investment income
|
Net realized gain
|
Total dividends and distributions
|
| |
Net asset value, end of period
|
| |
Total return2
|
| |
| Ratios and supplemental data: |
Net assets, end of period (000 omitted)
|
Ratio of expenses to average net assets
|
Ratio of expenses to average net assets prior to fees waived
|
Ratio of net investment income to average net assets
|
Ratio of net investment income to average net assets prior to fees waived
|
Portfolio turnover
|
| 1 | Calculated using average shares outstanding. |
| 2 | Total return is based on the change in net asset value of a share during the period and assumes reinvestment of dividends and distributions at net asset value and does not reflect the impact of a sales charge. Total return during the period presented reflects waivers by the manager and/or distributor (as applicable). Performance would have been lower had the waivers not been in effect. |
See accompanying notes, which are an integral part of the financial statements.
| Year ended |
| 8/31/24 | | 8/31/23 | | 8/31/22 | | 8/31/21 | | 8/31/20 |
| $9.67 | | $10.35 | | $12.04 | | $11.15 | | $11.48 |
| |
| | | | | | | | | |
| 0.50 | | 0.46 | | 0.44 | | 0.42 | | 0.44 |
| 0.69 | | (0.66) | | (1.67) | | 0.91 | | (0.33) |
| 1.19 | | (0.20) | | (1.23) | | 1.33 | | 0.11 |
| |
| | | | | | | | | |
| (0.48) | | (0.44) | | (0.43) | | (0.42) | | (0.44) |
| — | | (0.04) | | (0.03) | | (0.02) | | — |
| (0.48) | | (0.48) | | (0.46) | | (0.44) | | (0.44) |
| |
| $10.38 | | $9.67 | | $10.35 | | $12.04 | | $11.15 |
| |
| 12.58% | | (1.92%) | | (10.49%) | | 12.12% | | 1.06% |
| |
| | | | | | | | | |
| $697,863 | | $315,959 | | $261,839 | | $247,542 | | $182,214 |
| 0.85% | | 0.85% | | 0.85% | | 0.85% | | 0.85% |
| 0.87% | | 0.88% | | 0.88% | | 0.88% | | 0.91% |
| 4.97% | | 4.62% | | 3.94% | | 3.65% | | 3.99% |
| 4.95% | | 4.59% | | 3.91% | | 3.62% | | 3.93% |
| 19% | | 18% | | 56% | | 16% | | 44% |
Financial highlights
Delaware National High-Yield Municipal Bond Fund Class C
Selected data for each share of the Fund outstanding throughout each period were as follows:
| |
| |
Net asset value, beginning of period
|
| |
| Income (loss) from investment operations: |
Net investment income1
|
Net realized and unrealized gain (loss)
|
Total from investment operations
|
| |
| Less dividends and distributions from: |
Net investment income
|
Net realized gain
|
Total dividends and distributions
|
| |
Net asset value, end of period
|
| |
Total return2
|
| |
| Ratios and supplemental data: |
Net assets, end of period (000 omitted)
|
Ratio of expenses to average net assets
|
Ratio of expenses to average net assets prior to fees waived
|
Ratio of net investment income to average net assets
|
Ratio of net investment income to average net assets prior to fees waived
|
Portfolio turnover
|
| 1 | Calculated using average shares outstanding. |
| 2 | Total return is based on the change in net asset value of a share during the period and assumes reinvestment of dividends and distributions at net asset value and does not reflect the impact of a sales charge. Total return during the period presented reflects waivers by the manager and/or distributor (as applicable). Performance would have been lower had the waivers not been in effect. |
See accompanying notes, which are an integral part of the financial statements.
| Year ended |
| 8/31/24 | | 8/31/23 | | 8/31/22 | | 8/31/21 | | 8/31/20 |
| $9.71 | | $10.39 | | $12.09 | | $11.20 | | $11.52 |
| |
| | | | | | | | | |
| 0.42 | | 0.38 | | 0.35 | | 0.33 | | 0.36 |
| 0.69 | | (0.66) | | (1.67) | | 0.91 | | (0.32) |
| 1.11 | | (0.28) | | (1.32) | | 1.24 | | 0.04 |
| |
| | | | | | | | | |
| (0.40) | | (0.36) | | (0.35) | | (0.33) | | (0.36) |
| — | | (0.04) | | (0.03) | | (0.02) | | — |
| (0.40) | | (0.40) | | (0.38) | | (0.35) | | (0.36) |
| |
| $10.42 | | $9.71 | | $10.39 | | $12.09 | | $11.20 |
| |
| 11.71% | | (2.64%) | | (11.18%) | | 11.25% | | 0.41% |
| |
| | | | | | | | | |
| $57,976 | | $43,123 | | $46,410 | | $58,285 | | $68,993 |
| 1.60% | | 1.60% | | 1.60% | | 1.60% | | 1.60% |
| 1.62% | | 1.63% | | 1.63% | | 1.63% | | 1.66% |
| 4.22% | | 3.87% | | 3.19% | | 2.90% | | 3.24% |
| 4.20% | | 3.84% | | 3.16% | | 2.87% | | 3.18% |
| 19% | | 18% | | 56% | | 16% | | 44% |
Financial highlights
Delaware National High-Yield Municipal Bond Fund Institutional Class
Selected data for each share of the Fund outstanding throughout each period were as follows:
| |
| |
Net asset value, beginning of period
|
| |
| Income (loss) from investment operations: |
Net investment income1
|
Net realized and unrealized gain (loss)
|
Total from investment operations
|
| |
| Less dividends and distributions from: |
Net investment income
|
Net realized gain
|
Total dividends and distributions
|
| |
Net asset value, end of period
|
| |
Total return2
|
| |
| Ratios and supplemental data: |
Net assets, end of period (000 omitted)
|
Ratio of expenses to average net assets
|
Ratio of expenses to average net assets prior to fees waived
|
Ratio of net investment income to average net assets
|
Ratio of net investment income to average net assets prior to fees waived
|
Portfolio turnover
|
| 1 | Calculated using average shares outstanding. |
| 2 | Total return is based on the change in net asset value of a share during the period and assumes reinvestment of dividends and distributions at net asset value. Total return during the period presented reflects waivers by the manager. Performance would have been lower had the waivers not been in effect. |
See accompanying notes, which are an integral part of the financial statements.
| Year ended |
| 8/31/24 | | 8/31/23 | | 8/31/22 | | 8/31/21 | | 8/31/20 |
| $9.77 | | $10.45 | | $12.15 | | $11.26 | | $11.58 |
| |
| | | | | | | | | |
| 0.53 | | 0.49 | | 0.47 | | 0.45 | | 0.47 |
| 0.69 | | (0.66) | | (1.68) | | 0.91 | | (0.32) |
| 1.22 | | (0.17) | | (1.21) | | 1.36 | | 0.15 |
| |
| | | | | | | | | |
| (0.51) | | (0.47) | | (0.46) | | (0.45) | | (0.47) |
| — | | (0.04) | | (0.03) | | (0.02) | | — |
| (0.51) | | (0.51) | | (0.49) | | (0.47) | | (0.47) |
| |
| $10.48 | | $9.77 | | $10.45 | | $12.15 | | $11.26 |
| |
| 12.78% | | (1.62%) | | (10.22%) | | 12.32% | | 1.44% |
| |
| | | | | | | | | |
| $2,585,049 | | $1,809,639 | | $1,544,505 | | $1,452,944 | | $1,095,548 |
| 0.60% | | 0.60% | | 0.60% | | 0.60% | | 0.60% |
| 0.62% | | 0.63% | | 0.63% | | 0.63% | | 0.66% |
| 5.22% | | 4.87% | | 4.19% | | 3.90% | | 4.24% |
| 5.20% | | 4.84% | | 4.16% | | 3.87% | | 4.18% |
| 19% | | 18% | | 56% | | 16% | | 44% |
Financial highlights
Delaware Tax-Free USA Fund Class A
Selected data for each share of the Fund outstanding throughout each period were as follows:
| |
| |
Net asset value, beginning of period
|
| |
| Income (loss) from investment operations: |
Net investment income1
|
Net realized and unrealized gain (loss)
|
Total from investment operations
|
| |
| Less dividends and distributions from: |
Net investment income
|
Net realized gain
|
Total dividends and distributions
|
| |
Net asset value, end of period
|
| |
Total return2
|
| |
| Ratios and supplemental data: |
Net assets, end of period (000 omitted)
|
Ratio of expenses to average net assets
|
Ratio of expenses to average net assets prior to fees waived
|
Ratio of net investment income to average net assets
|
Ratio of net investment income to average net assets prior to fees waived
|
Portfolio turnover
|
| 1 | Calculated using average shares outstanding. |
| 2 | Total return is based on the change in net asset value of a share during the period and assumes reinvestment of dividends and distributions at net asset value and does not reflect the impact of a sales charge. Total return during the period presented reflects waivers by the manager and/or distributor (as applicable). Performance would have been lower had the waivers not been in effect. |
See accompanying notes, which are an integral part of the financial statements.
| Year ended |
| 8/31/24 | | 8/31/23 | | 8/31/22 | | 8/31/21 | | 8/31/20 |
| $10.03 | | $10.51 | | $12.56 | | $11.94 | | $11.96 |
| |
| | | | | | | | | |
| 0.44 | | 0.40 | | 0.33 | | 0.36 | | 0.38 |
| 0.74 | | (0.48) | | (1.88) | | 0.70 | | 0.01 |
| 1.18 | | (0.08) | | (1.55) | | 1.06 | | 0.39 |
| |
| | | | | | | | | |
| (0.44) | | (0.40) | | (0.33) | | (0.36) | | (0.38) |
| — | | — | | (0.17) | | (0.08) | | (0.03) |
| (0.44) | | (0.40) | | (0.50) | | (0.44) | | (0.41) |
| |
| $10.77 | | $10.03 | | $10.51 | | $12.56 | | $11.94 |
| |
| 11.99% | | (0.72%) | | (12.65%) | | 9.03% | | 3.44% |
| |
| | | | | | | | | |
| $700,740 | | $469,980 | | $534,749 | | $944,054 | | $478,671 |
| 0.80% | | 0.80% | | 0.80% | | 0.82% | | 0.81% |
| 0.89% | | 0.95% | | 0.91% | | 0.92% | | 0.95% |
| 4.20% | | 3.93% | | 2.82% | | 2.84% | | 3.24% |
| 4.11% | | 3.78% | | 2.71% | | 2.74% | | 3.10% |
| 28% | | 65% | | 71% | | 40% | | 77% |
Financial highlights
Delaware Tax-Free USA Fund Class C
Selected data for each share of the Fund outstanding throughout each period were as follows:
| |
| |
Net asset value, beginning of period
|
| |
| Income (loss) from investment operations: |
Net investment income1
|
Net realized and unrealized gain (loss)
|
Total from investment operations
|
| |
| Less dividends and distributions from: |
Net investment income
|
Net realized gain
|
Total dividends and distributions
|
| |
Net asset value, end of period
|
| |
Total return2
|
| |
| Ratios and supplemental data: |
Net assets, end of period (000 omitted)
|
Ratio of expenses to average net assets
|
Ratio of expenses to average net assets prior to fees waived
|
Ratio of net investment income to average net assets
|
Ratio of net investment income to average net assets prior to fees waived
|
Portfolio turnover
|
| 1 | Calculated using average shares outstanding. |
| 2 | Total return is based on the change in net asset value of a share during the period and assumes reinvestment of dividends and distributions at net asset value and does not reflect the impact of a sales charge. Total return during the period presented reflects waivers by the manager and/or distributor (as applicable). Performance would have been lower had the waivers not been in effect. |
See accompanying notes, which are an integral part of the financial statements.
| Year ended |
| 8/31/24 | | 8/31/23 | | 8/31/22 | | 8/31/21 | | 8/31/20 |
| $10.03 | | $10.51 | | $12.56 | | $11.94 | | $11.96 |
| |
| | | | | | | | | |
| 0.36 | | 0.32 | | 0.24 | | 0.26 | | 0.29 |
| 0.74 | | (0.48) | | (1.88) | | 0.70 | | 0.01 |
| 1.10 | | (0.16) | | (1.64) | | 0.96 | | 0.30 |
| |
| | | | | | | | | |
| (0.36) | | (0.32) | | (0.24) | | (0.26) | | (0.29) |
| — | | — | | (0.17) | | (0.08) | | (0.03) |
| (0.36) | | (0.32) | | (0.41) | | (0.34) | | (0.32) |
| |
| $10.77 | | $10.03 | | $10.51 | | $12.56 | | $11.94 |
| |
| 11.15% | | (1.46%) | | (13.31%) | | 8.22% | | 2.66% |
| |
| | | | | | | | | |
| $10,352 | | $6,723 | | $8,366 | | $9,834 | | $10,778 |
| 1.55% | | 1.55% | | 1.55% | | 1.57% | | 1.56% |
| 1.64% | | 1.70% | | 1.66% | | 1.67% | | 1.70% |
| 3.45% | | 3.18% | | 2.07% | | 2.09% | | 2.49% |
| 3.36% | | 3.03% | | 1.96% | | 1.99% | | 2.35% |
| 28% | | 65% | | 71% | | 40% | | 77% |
Financial highlights
Delaware Tax-Free USA Fund Institutional Class
Selected data for each share of the Fund outstanding throughout each period were as follows:
| |
| |
Net asset value, beginning of period
|
| |
| Income (loss) from investment operations: |
Net investment income1
|
Net realized and unrealized gain (loss)
|
Total from investment operations
|
| |
| Less dividends and distributions from: |
Net investment income
|
Net realized gain
|
Total dividends and distributions
|
| |
Net asset value, end of period
|
| |
Total return2
|
| |
| Ratios and supplemental data: |
Net assets, end of period (000 omitted)
|
Ratio of expenses to average net assets
|
Ratio of expenses to average net assets prior to fees waived
|
Ratio of net investment income to average net assets
|
Ratio of net investment income to average net assets prior to fees waived
|
Portfolio turnover
|
| 1 | Calculated using average shares outstanding. |
| 2 | Total return is based on the change in net asset value of a share during the period and assumes reinvestment of dividends and distributions at net asset value. Total return during the period presented reflects waivers by the manager. Performance would have been lower had the waivers not been in effect. |
See accompanying notes, which are an integral part of the financial statements.
| Year ended |
| 8/31/24 | | 8/31/23 | | 8/31/22 | | 8/31/21 | | 8/31/20 |
| $10.11 | | $10.59 | | $12.66 | | $12.03 | | $12.05 |
| |
| | | | | | | | | |
| 0.46 | | 0.43 | | 0.36 | | 0.39 | | 0.41 |
| 0.74 | | (0.48) | | (1.90) | | 0.71 | | 0.01 |
| 1.20 | | (0.05) | | (1.54) | | 1.10 | | 0.42 |
| |
| | | | | | | | | |
| (0.46) | | (0.43) | | (0.36) | | (0.39) | | (0.41) |
| — | | — | | (0.17) | | (0.08) | | (0.03) |
| (0.46) | | (0.43) | | (0.53) | | (0.47) | | (0.44) |
| |
| $10.85 | | $10.11 | | $10.59 | | $12.66 | | $12.03 |
| |
| 12.21% | | (0.43%) | | (12.48%) | | 9.34% | | 3.70% |
| |
| | | | | | | | | |
| $509,830 | | $265,745 | | $369,318 | | $209,447 | | $135,801 |
| 0.55% | | 0.55% | | 0.55% | | 0.57% | | 0.56% |
| 0.64% | | 0.70% | | 0.66% | | 0.67% | | 0.70% |
| 4.45% | | 4.18% | | 3.07% | | 3.09% | | 3.49% |
| 4.36% | | 4.03% | | 2.96% | | 2.99% | | 3.35% |
| 28% | | 65% | | 71% | | 40% | | 77% |
Financial highlights
Delaware Tax-Free USA Intermediate Fund Class A
Selected data for each share of the Fund outstanding throughout each period were as follows:
| |
| |
Net asset value, beginning of period
|
| |
| Income (loss) from investment operations: |
Net investment income1
|
Net realized and unrealized gain (loss)
|
Total from investment operations
|
| |
| Less dividends and distributions from: |
Net investment income
|
Total dividends and distributions
|
| |
Net asset value, end of period
|
| |
Total return2
|
| |
| Ratios and supplemental data: |
Net assets, end of period (000 omitted)
|
Ratio of expenses to average net assets
|
Ratio of expenses to average net assets prior to fees waived
|
Ratio of net investment income to average net assets
|
Ratio of net investment income to average net assets prior to fees waived
|
Portfolio turnover
|
| 1 | Calculated using average shares outstanding. |
| 2 | Total return is based on the change in net asset value of a share during the period and assumes reinvestment of dividends and distributions at net asset value and does not reflect the impact of a sales charge. Total return during the period presented reflects waivers by the manager and/or distributor (as applicable). Performance would have been lower had the waivers not been in effect. |
See accompanying notes, which are an integral part of the financial statements.
| Year ended |
| 8/31/24 | | 8/31/23 | | 8/31/22 | | 8/31/21 | | 8/31/20 |
| $10.66 | | $11.01 | | $12.63 | | $12.26 | | $12.28 |
| |
| | | | | | | | | |
| 0.40 | | 0.37 | | 0.33 | | 0.33 | | 0.35 |
| 0.56 | | (0.35) | | (1.62) | | 0.37 | | (0.02) |
| 0.96 | | 0.02 | | (1.29) | | 0.70 | | 0.33 |
| |
| | | | | | | | | |
| (0.40) | | (0.37) | | (0.33) | | (0.33) | | (0.35) |
| (0.40) | | (0.37) | | (0.33) | | (0.33) | | (0.35) |
| |
| $11.22 | | $10.66 | | $11.01 | | $12.63 | | $12.26 |
| |
| 9.15% | | 0.17% | | (10.33%) | | 5.79% | | 2.76% |
| |
| | | | | | | | | |
| $384,304 | | $411,551 | | $452,772 | | $564,932 | | $106,135 |
| 0.75% | | 0.75% | | 0.71% | | 0.65% | | 0.65% |
| 0.87% | | 0.88% | | 0.87% | | 0.88% | | 0.91% |
| 3.64% | | 3.39% | | 2.80% | | 2.64% | | 2.87% |
| 3.52% | | 3.26% | | 2.64% | | 2.41% | | 2.61% |
| 28% | | 27% | | 59% | | 23% | | 27% |
Financial highlights
Delaware Tax-Free USA Intermediate Fund Class C
Selected data for each share of the Fund outstanding throughout each period were as follows:
| |
| |
Net asset value, beginning of period
|
| |
| Income (loss) from investment operations: |
Net investment income1
|
Net realized and unrealized gain (loss)
|
Total from investment operations
|
| |
| Less dividends and distributions from: |
Net investment income
|
Total dividends and distributions
|
| |
Net asset value, end of period
|
| |
Total return2
|
| |
| Ratios and supplemental data: |
Net assets, end of period (000 omitted)
|
Ratio of expenses to average net assets
|
Ratio of expenses to average net assets prior to fees waived
|
Ratio of net investment income to average net assets
|
Ratio of net investment income to average net assets prior to fees waived
|
Portfolio turnover
|
| 1 | Calculated using average shares outstanding. |
| 2 | Total return is based on the change in net asset value of a share during the period and assumes reinvestment of dividends and distributions at net asset value and does not reflect the impact of a sales charge. Total return during the period presented reflects waivers by the manager and/or distributor (as applicable). Performance would have been lower had the waivers not been in effect. |
See accompanying notes, which are an integral part of the financial statements.
| Year ended |
| 8/31/24 | | 8/31/23 | | 8/31/22 | | 8/31/21 | | 8/31/20 |
| $10.65 | | $11.00 | | $12.62 | | $12.25 | | $12.27 |
| |
| | | | | | | | | |
| 0.32 | | 0.28 | | 0.24 | | 0.23 | | 0.24 |
| 0.56 | | (0.35) | | (1.62) | | 0.37 | | (0.02) |
| 0.88 | | (0.07) | | (1.38) | | 0.60 | | 0.22 |
| |
| | | | | | | | | |
| (0.32) | | (0.28) | | (0.24) | | (0.23) | | (0.24) |
| (0.32) | | (0.28) | | (0.24) | | (0.23) | | (0.24) |
| |
| $11.21 | | $10.65 | | $11.00 | | $12.62 | | $12.25 |
| |
| 8.34% | | (0.58%) | | (11.04%) | | 4.90% | | 1.89% |
| |
| | | | | | | | | |
| $4,258 | | $5,177 | | $6,872 | | $7,497 | | $11,864 |
| 1.50% | | 1.50% | | 1.50% | | 1.50% | | 1.50% |
| 1.62% | | 1.63% | | 1.62% | | 1.63% | | 1.66% |
| 2.89% | | 2.64% | | 2.01% | | 1.79% | | 2.02% |
| 2.77% | | 2.51% | | 1.89% | | 1.66% | | 1.86% |
| 28% | | 27% | | 59% | | 23% | | 27% |
Financial highlights
Delaware Tax-Free USA Intermediate Fund Institutional Class
Selected data for each share of the Fund outstanding throughout each period were as follows:
| |
| |
Net asset value, beginning of period
|
| |
| Income (loss) from investment operations: |
Net investment income1
|
Net realized and unrealized gain (loss)
|
Total from investment operations
|
| |
| Less dividends and distributions from: |
Net investment income
|
Total dividends and distributions
|
| |
Net asset value, end of period
|
| |
Total return2
|
| |
| Ratios and supplemental data: |
Net assets, end of period (000 omitted)
|
Ratio of expenses to average net assets
|
Ratio of expenses to average net assets prior to fees waived
|
Ratio of net investment income to average net assets
|
Ratio of net investment income to average net assets prior to fees waived
|
Portfolio turnover
|
| 1 | Calculated using average shares outstanding. |
| 2 | Total return is based on the change in net asset value of a share during the period and assumes reinvestment of dividends and distributions at net asset value. Total return during the period presented reflects waivers by the manager. Performance would have been lower had the waivers not been in effect. |
See accompanying notes, which are an integral part of the financial statements.
| Year ended |
| 8/31/24 | | 8/31/23 | | 8/31/22 | | 8/31/21 | | 8/31/20 |
| $10.76 | | $11.11 | | $12.75 | | $12.38 | | $12.40 |
| |
| | | | | | | | | |
| 0.43 | | 0.40 | | 0.36 | | 0.35 | | 0.37 |
| 0.56 | | (0.35) | | (1.64) | | 0.37 | | (0.02) |
| 0.99 | | 0.05 | | (1.28) | | 0.72 | | 0.35 |
| |
| | | | | | | | | |
| (0.43) | | (0.40) | | (0.36) | | (0.35) | | (0.37) |
| (0.43) | | (0.40) | | (0.36) | | (0.35) | | (0.37) |
| |
| $11.32 | | $10.76 | | $11.11 | | $12.75 | | $12.38 |
| |
| 9.37% | | 0.45% | | (10.17%) | | 5.92% | | 2.92% |
| |
| | | | | | | | | |
| $824,717 | | $751,847 | | $609,586 | | $649,184 | | $453,727 |
| 0.50% | | 0.50% | | 0.50% | | 0.50% | | 0.50% |
| 0.62% | | 0.63% | | 0.62% | | 0.63% | | 0.66% |
| 3.89% | | 3.64% | | 3.01% | | 2.79% | | 3.02% |
| 3.77% | | 3.51% | | 2.89% | | 2.66% | | 2.86% |
| 28% | | 27% | | 59% | | 23% | | 27% |
Notes to financial statements
| Delaware Funds by Macquarie® national tax-free funds | August 31, 2024 |
Delaware Group® Tax-Free Fund is organized as a Delaware statutory trust and offers two series: Delaware Tax-Free USA Fund and Delaware Tax-Free USA Intermediate Fund.
Voyageur Mutual Funds is organized as a Delaware statutory trust and offers five series: Delaware Minnesota High-Yield Municipal Bond Fund, Delaware National High-Yield Municipal Bond Fund, Delaware Tax-Free California Fund, Delaware Tax-Free Idaho Fund, and Delaware Tax-Free New York Fund. Delaware Group Tax-Free Fund and Voyageur Mutual Funds are each referred to as a Trust, or collectively, as the "Trusts". These financial statements and the related notes pertain to Delaware National High-Yield Municipal Bond Fund, Delaware Tax-Free USA Fund, and Delaware Tax-Free USA Intermediate Fund (each, a Fund or collectively, the Funds). Each Trust is an open-end investment company. Each Fund is considered diversified under the Investment Company Act of 1940, as amended (1940 Act), and offers Class A, Class C, and Institutional Class shares. Class A shares are sold with a maximum front-end sales charge of 4.50% for Delaware Tax-Free USA Fund and Delaware National High-Yield Municipal Bond Fund, and 2.75% for Delaware Tax-Free USA Intermediate Fund. There is no front-end sales charge when you purchase $250,000 or more of Class A shares. However, if Delaware Distributors, L.P. (DDLP) paid your financial intermediary a commission on your purchase of $250,000 or more of Class A shares, for shares of Delaware National High-Yield Municipal Bond Fund or Delaware Tax-Free USA Fund, you will have to pay a limited contingent deferred sales charge (Limited CDSC) of 1.00% if you redeem these shares within the first 18 months after your purchase or for shares of Delaware Tax-Free USA Intermediate Fund, you will have to pay a Limited CDSC of 0.75% if you redeem these shares within the first 12 months after your purchase, unless a specific waiver of the Limited CDSC applies. Class C shares have no upfront sales charge, but are sold with a contingent deferred sales charge (CDSC) of 1.00%, which will be incurred if redeemed during the first 12 months. Institutional Class shares are not subject to a sales charge and are offered for sale exclusively to certain eligible investors.
1. Significant Accounting Policies
Each Fund follows accounting and reporting guidance under Financial Accounting Standards Board (FASB) Accounting Standards Codification Topic 946, Financial Services — Investment Companies. The following accounting policies are in accordance with US generally accepted accounting principles (US GAAP) and are consistently followed by the Funds.
Security Valuation — Fixed income securities are generally priced based upon valuations provided by an independent pricing service or broker in accordance with methodologies included within Delaware Management Company (DMC)’s Pricing Policy (the Policy). Fixed income security valuations are then reviewed by DMC as part of its duties as each Fund’s valuation designee (Valuation Designee) and, to the extent required by the Policy and applicable regulation, fair valued consistent with the Policy. To the extent current market prices are not available, the pricing service may take into account developments related to the specific security, as well as transactions in comparable securities. Valuations for fixed income securities utilize matrix systems, which reflect such factors as security prices, yields, maturities, and ratings, and are supplemented by dealer and exchange quotations. Investments for which market quotations
are not readily available are valued at fair value as determined in good faith pursuant to Rule 2a-5 under the 1940 Act (Rule 2a-5). As a general principle, the fair value of a security or other asset is the price that would be received to sell an asset or paid to transfer a liability in an orderly transaction between market participants at the measurement date. Pursuant to Rule 2a-5, the Board of Trustees (Board) has designated DMC as the Valuation Designee for each Fund to perform the fair value determination relating to all applicable Fund investments. DMC has established a Pricing Committee to assist with its designated responsibilities as Valuation Designee, and DMC may carry out its designated responsibilities as Valuation Designee through the Pricing Committee and other teams and committees, which operate under policies and procedures approved by the Board and subject to the Board’s oversight. Fair value pricing may be used more frequently for securities traded primarily in non-US markets. In considering whether fair valuation is required and in determining fair values, the Valuation Designee may, among other things, consider significant events (which may be considered to include changes in the value of US securities or securities indexes) that occur after the close of the relevant market and before the close of the New York Stock Exchange. The Valuation Designee may utilize modeling tools provided by third-party vendors to determine fair values of non-US securities.
Federal Income Taxes — No provision for federal income taxes has been made as each Fund intends to continue to qualify for federal income tax purposes as a regulated investment company under Subchapter M of the Internal Revenue Code of 1986, as amended, and make the requisite distributions to shareholders. Each Fund evaluates tax positions taken or expected to be taken in the course of preparing each Fund’s tax returns to determine whether the tax positions are “more-likely-than-not” of being sustained by the applicable tax authority. Tax positions not deemed to meet the “more-likely-than-not” threshold are recorded as a tax benefit or expense in the current year. Management has analyzed each Fund’s tax positions taken or expected to be taken on each Fund’s federal income tax returns through the year ended August 31, 2024, and for all open tax years (years ended August 31, 2021–August 31, 2023), and has concluded that no provision for federal income tax is required in each Fund’s financial statements. If applicable, each Fund recognizes interest accrued on unrecognized tax benefits in interest expense and penalties in “Other” on the “Statements of operations.” During the year ended August 31, 2024, the Funds did not incur any interest or tax penalties.
Class Accounting — Investment income and common expenses are allocated to the various classes of each Fund on the basis of “settled shares” of each class in relation to the net assets of each Fund. Realized and unrealized gain (loss) on investments are allocated to the various classes of each Fund on the basis of daily net assets of each class. Distribution expenses relating to a specific class are charged directly to that class.
Use of Estimates — The preparation of financial statements in conformity with US GAAP requires management to make estimates and assumptions that affect the fair value of investments, the reported amounts of assets and liabilities and disclosure of contingent assets and liabilities at the date of the financial statements, and the reported amounts of revenues and
Notes to financial statements
Delaware Funds by Macquarie® national tax-free funds
1. Significant Accounting Policies (continued)
expenses during the reporting period. Actual results could differ from those estimates and the differences could be material.
Other — Expenses directly attributable to a Fund are charged directly to each Fund. Other expenses common to various funds within the Delaware Funds by Macquarie® (Delaware Funds) are generally allocated among such funds on the basis of average net assets. Management fees and certain other expenses are paid monthly. Security transactions are recorded on the date the securities are purchased or sold (trade date) for financial reporting purposes. Costs used in calculating realized gains and losses on the sale of investment securities are those of the specific securities sold. Interest income is recorded on an accrual basis. Discounts and premiums on debt securities are accreted or amortized to interest income, respectively, over the lives of the respective securities using the effective interest method. Premiums on callable debt securities are amortized to interest income to the earliest call date using the effective interest method. Each Fund declares dividends daily from net investment income and pays the dividends monthly and declares and pays distributions from net realized gain on investments, if any, at least annually. Each Fund may distribute more frequently, if necessary for tax purposes. Dividends and distributions, if any, are recorded on the ex-dividend date.
Each Fund receives earnings credits from its custodian when positive cash balances are maintained, which may be used to offset custody fees. The expenses paid under this arrangement are included on the “Statements of operations” under “Custodian fees” with the corresponding expenses offset included under “Less expenses paid indirectly.” For the year ended August 31, 2024, each Fund earned the following amounts under this arrangement:
| Fund | | Custody credits |
| Delaware National High-Yield Municipal Bond Fund | | $25,108 |
| Delaware Tax-Free USA Fund | | 9,742 |
| Delaware Tax-Free USA Intermediate Fund | | 10,313 |
Each Fund receives earnings credits from its transfer agent when positive cash balances are maintained, which may be used to offset transfer agent fees. If the amount earned is greater than $1, the expenses paid under this arrangement are included on the “Statements of operations” under “Dividend disbursing and transfer agent fees and expenses” with the corresponding expenses offset included under “Less expenses paid indirectly.” For the year ended August 31, 2024, each Fund earned the following amounts under this arrangement:
| Fund | | Earnings Credits |
| Delaware National High-Yield Municipal Bond Fund | | $106 |
| Delaware Tax-Free USA Fund | | 894 |
| Delaware Tax-Free USA Intermediate Fund | | 756 |
2. Investment Management, Administration Agreements, and Other Transactions with Affiliates
In accordance with the terms of its respective investment management agreement, each Fund pays DMC, a series of Macquarie Investment Management Business Trust (MIMBT) and the investment managers, an annual fee which is calculated daily and paid monthly based on each Fund’s average daily net assets as follows:
| | Delaware National High-Yield
Municipal Bond Fund | | Delaware Tax-Free
USA Fund | | Delaware Tax-Free USA
Intermediate Fund |
| On the first $500 million | 0.5500% | | 0.5500% | | 0.5000% |
| On the next $500 million | 0.5000% | | 0.5000% | | 0.4750% |
| On the next $1.5 billion | 0.4500% | | 0.4500% | | 0.4500% |
| In excess of $2.5 billion | 0.4250% | | 0.4250% | | 0.4250% |
DMC has contractually agreed to waive all or a portion of its investment advisory fees and/or pay/reimburse expenses (excluding any distribution and service (12b-1) fees, acquired fund fees and expenses, taxes, interest, inverse floater program expenses, short sale dividend and interest expenses, brokerage fees, certain insurance costs, and nonroutine expenses or costs, including, but not limited to, those relating to reorganizations, litigation, conducting shareholder meetings, and liquidations), in order to prevent total annual fund operating expenses from exceeding the following percentages of each Fund’s average daily net assets from September 1, 2023 through December 30, 2024. These waivers and reimbursements may only be terminated by agreement of DMC and each Fund. The waivers and reimbursements are accrued daily and received monthly.
| Fund | | Operating expense
limitation as
a percentage
of average
daily net assets |
| Delaware National High-Yield Municipal Bond Fund | | 0.60% |
| Delaware Tax-Free USA Fund | | 0.55% |
| Delaware Tax-Free USA Intermediate Fund | | 0.50% |
Notes to financial statements
Delaware Funds by Macquarie® national tax-free funds
2. Investment Management, Administration Agreements, and Other Transactions with Affiliates (continued)
After consideration of class specific expenses, including 12b-1 fees, the class level operating expense limitation as a percentage of average daily net assets from September 1, 2023 through December 30, 2024, unless terminated by agreement of DMC and the Funds, is as follows:
| | | Operating expense limitation as a percentage of average daily net assets |
| Fund | | Class A | | Class C | | Institutional Class |
| Delaware National High-Yield Municipal Bond Fund | | 0.85% | | 1.60% | | 0.60% |
| Delaware Tax-Free USA Fund | | 0.80% | | 1.55% | | 0.55% |
| Delaware Tax-Free USA Intermediate Fund | | 0.75% | | 1.50% | | 0.50% |
Delaware Investments Fund Services Company (DIFSC), an affiliate of DMC, provides fund accounting and financial administrative oversight services to each Fund. For these services, effective October 1, 2023, DIFSC’s fees are calculated daily and paid monthly, based on the aggregate daily net assets of all funds within the Delaware Funds at the following annual rates: 0.0050% of the first $60 billion; 0.00475% of the next $30 billion; and 0.0015% of aggregate average daily net assets in excess of $90 billion (Total Fee). Prior to October 1, 2023, DIFSC’s annual rates were: 0.00475% of the first $35 billion; 0.0040% of the next $10 billion; 0.0025% of the next $45 billion; and 0.0015% of aggregate average daily net assets in excess of $90 billion. Each fund in the Delaware Funds pays a minimum of $4,000, which, in aggregate, is subtracted from the Total Fee. Each fund then pays its portion of the remainder of the Total Fee on a relative net asset value (NAV) basis. These amounts are included on the “Statements of operations” under “Accounting and administration expenses.” For the year ended August 31, 2024, each Fund paid for these services as follows:
| Fund | | Fees |
| Delaware National High-Yield Municipal Bond Fund | | $127,822 |
| Delaware Tax-Free USA Fund | | 50,005 |
| Delaware Tax-Free USA Intermediate Fund | | 53,205 |
DIFSC is also the transfer agent and dividend disbursing agent of each Fund. For these services, DIFSC’s fees are calculated daily and paid monthly, based on the aggregate daily net assets of the retail funds within the Delaware Funds at the following annual rates: 0.014% of the first $20 billion; 0.011% of the next $5 billion; 0.007% of the next $5 billion; 0.004% of the next $20 billion; 0.002% of the next $25 billion; and 0.0015% of average daily net assets in excess of $75 billion. The fees payable to DIFSC under the shareholder services agreement described above are allocated among all retail funds in the Delaware Funds on a relative NAV basis. These amounts are included on the “Statements of operations” under “Dividend disbursing and transfer
agent fees and expenses.” For the year ended August 31, 2024, each Fund paid for these services as follows:
| Fund | | Fees |
| Delaware National High-Yield Municipal Bond Fund | | $188,998 |
| Delaware Tax-Free USA Fund | | 70,261 |
| Delaware Tax-Free USA Intermediate Fund | | 75,791 |
Pursuant to a sub-transfer agency agreement between DIFSC and BNY Mellon Investment Servicing (US) Inc. (BNYIS), BNYIS provides certain sub-transfer agency services to the Funds. Sub-transfer agency fees are paid by the Funds and are also included on the “Statements of operations” under “Dividend disbursing and transfer agent fees and expenses.” The fees are calculated daily and paid as invoices on a monthly or quarterly basis.
Pursuant to a distribution agreement and distribution plan, Delaware Tax-Free USA Intermediate Fund and Delaware National High-Yield Municipal Bond Fund pay DDLP, the distributor and an affiliate of DMC, an annual 12b-1 fee of 0.25% of the average daily net assets of the Class A shares. Delaware Tax-Free USA Fund’s Class A shares are subject to a blended 12b-1 fee of 0.10% on all shares acquired prior to June 1, 1992 and 0.25% on all shares acquired on or after June 1, 1992. All Class A shareholders bear 12b-1 fees at the same rate, the blended rate, currently 0.25% of the average daily net assets, based on the formula described above. This method of calculating Class A 12b-1 fees may be discontinued at the sole discretion of the Board. Each Fund pays DDLP, an annual 12b-1 fee of 1.00% of the average daily net assets of the Class C shares. The fees are calculated daily and paid monthly. Institutional Class shares do not pay a 12b-1 fee.
As provided in the investment management agreement, each Fund bears a portion of the cost of certain resources shared with DMC, including the cost of internal personnel of DMC and/or its affiliates that provide legal and regulatory reporting services to the Funds. These amounts are included on the “Statements of operations” under “Legal fees.”
For the year ended August 31, 2024, each Fund paid for internal legal and regulatory reporting services provided by DMC and/or its affiliates’ employees as follows:
| Fund | | Fees |
| Delaware National High-Yield Municipal Bond Fund | | $73,023 |
| Delaware Tax-Free USA Fund | | 29,031 |
| Delaware Tax-Free USA Intermediate Fund | | 31,455 |
For the year ended August 31, 2024, DDLP earned commissions on sales of Class A shares for each Fund as follows:
| Fund | | Class A |
| Delaware National High-Yield Municipal Bond Fund | | $25,402 |
| Delaware Tax-Free USA Fund | | 16,552 |
| Delaware Tax-Free USA Intermediate Fund | | 5,419 |
Notes to financial statements
Delaware Funds by Macquarie® national tax-free funds
2. Investment Management, Administration Agreements, and Other Transactions with Affiliates (continued)
For the year ended August 31, 2024, DDLP received gross CDSC commissions on redemptions of each Fund’s Class A and Class C shares, and these commissions were entirely used to offset upfront commissions previously paid by DDLP to broker/dealers on sales of those shares. The amounts received were as follows:
| Fund | | Class A | | Class C |
| Delaware National High-Yield Municipal Bond Fund | | $90,952 | | $8,600 |
| Delaware Tax-Free USA Fund | | 4,826 | | 194 |
| Delaware Tax-Free USA Intermediate Fund | | 1,032 | | 41 |
Trustees’ fees include expenses accrued by each Fund for each Trustee’s retainer and meeting fees. Certain officers of DMC, DIFSC, and DDLP are officers and/or Trustees of the Trusts. These officers and Trustees are paid no compensation by the Funds.
The Funds participated in securities sale transactions with other affiliated funds or accounts advised by DMC. During the year ended August 31, 2024, the Delaware Tax-Free USA Fund participated in securities sales of $7,583,702, which resulted in net gains (losses) of $(1,053,346) with other affiliated funds and accounts advised by DMC.
3. Investments
For the year ended August 31, 2024, each Fund made purchases and sales of investment securities other than short-term investments and US government securities as follows:
| Fund | | Purchases | | Sales |
| Delaware National High-Yield Municipal Bond Fund | | $1,057,381,435 | | $549,275,219 |
| Delaware Tax-Free USA Fund | | 363,412,986 | | 293,335,505 |
| Delaware Tax-Free USA Intermediate Fund | | 318,905,269 | | 337,695,415 |
The tax cost of investments includes adjustments to net unrealized appreciation (depreciation) which may not necessarily be the final tax cost basis adjustments but which approximate the tax basis unrealized gains and losses that may be realized and distributed to shareholders. At August 31, 2024, the cost and unrealized appreciation (depreciation) of investments for federal income tax purposes for each Fund were as follows:
| Fund | | Cost of
investments | | Aggregate
unrealized
appreciation
of investments | | Aggregate
unrealized
depreciation
of investments | | Net unrealized
appreciation
(depreciation)
of investments |
| Delaware National High-Yield Municipal Bond Fund | | $3,439,163,287 | | $179,605,818 | | $(295,102,106) | | $(115,496,288) |
| Delaware Tax-Free USA Fund | | 1,186,571,682 | | 69,356,545 | | (27,589,956) | | 41,766,589 |
| Delaware Tax-Free USA Intermediate Fund | | 1,184,488,171 | | 51,605,658 | | (30,669,185) | | 20,936,473 |
US GAAP defines fair value as the price that each Fund would receive to sell an asset or pay to transfer a liability in an orderly transaction between market participants at the measurement date under current market conditions. A three-level hierarchy for fair value measurements has been established based upon the transparency of inputs to the valuation of an asset or liability. Inputs may be observable or unobservable and refer broadly to the assumptions that market participants would use in pricing the asset or liability. Observable inputs reflect the assumptions market participants would use in pricing the asset or liability based on market data obtained from sources independent of the reporting entity. Unobservable inputs reflect the reporting entity’s own assumptions about the assumptions that market participants would use in pricing the asset or liability based on the best information available under the circumstances. Each Fund’s investment in its entirety is assigned a level based upon the observability of the inputs which are significant to the overall valuation. The three-level hierarchy of inputs is summarized as follows:
Level 1 − Inputs are quoted prices in active markets for identical investments. (Examples: equity securities, open-end investment companies, futures contracts, and exchange-traded options contracts)
Level 2 − Other observable inputs, including, but not limited to: quoted prices for similar assets or liabilities in markets that are active, quoted prices for identical or similar assets or
Notes to financial statements
Delaware Funds by Macquarie® national tax-free funds
3. Investments (continued)
liabilities in markets that are not active, inputs other than quoted prices that are observable for the assets or liabilities (such as interest rates, yield curves, volatilities, prepayment speeds, loss severities, credit risks, and default rates) or other market-corroborated inputs. (Examples: debt securities, government securities, swap contracts, forward foreign currency exchange contracts, foreign securities utilizing international fair value pricing, broker-quoted securities, and fair valued securities)
Level 3 − Significant unobservable inputs, including each Fund’s own assumptions used to determine the fair value of investments. (Examples: broker-quoted securities and fair valued securities)
Level 3 investments are valued using significant unobservable inputs. Each Fund may also use an income-based valuation approach in which the anticipated future cash flows of the investment are discounted to calculate fair value. Discounts may also be applied due to the nature or duration of any restrictions on the disposition of the investments. Valuations may also be based upon current market prices of securities that are comparable in coupon, rating, maturity, and industry. The derived value of a Level 3 investment may not represent the value which is received upon disposition and this could impact the results of operations.
The following tables summarize the valuation of each Fund's investments by fair value hierarchy levels as of August 31, 2024:
| | Delaware National High-Yield Municipal Bond Fund |
| | Level 2 |
| Securities | |
| Assets: | |
| Municipal Bonds | $3,286,506,999 |
| Short-Term Investments | 37,160,000 |
| Total Value of Securities | $3,323,666,999 |
| | Delaware Tax-Free USA Fund |
| | Level 2 |
| Securities | |
| Assets: | |
| Municipal Bonds | $1,197,283,271 |
| Short-Term Investments | 31,055,000 |
| Total Value of Securities | $1,228,338,271 |
| | Delaware Tax-Free USA Intermediate Fund |
| | Level 2 |
| Securities | |
| Assets: | |
| Municipal Bonds | $1,195,294,644 |
| Short-Term Investments | 10,130,000 |
| Total Value of Securities | $1,205,424,644 |
During the year ended August 31, 2024, there were no transfers into or out of Level 3 investments. Each Fund’s policy is to recognize transfers into or out of Level 3 investments based on fair value at the beginning of the reporting year.
A reconciliation of Level 3 investments is presented when a Fund has a significant amount of Level 3 investments at the beginning or end of the year in relation to that Fund’s net assets. As of August 31, 2024, there were no Level 3 investments in either of the Funds
4. Dividend and Distribution Information
Income and long-term capital gain distributions are determined in accordance with federal income tax regulations, which may differ from US GAAP. Additionally, distributions from net short-term gains on sales of investment securities are treated as ordinary income for federal income tax purposes. The tax character of dividends and distributions paid during the years ended August 31, 2024 and 2023 were as follows:
| | | Tax-exempt
income | | Ordinary
income | | Long-term
capital
gains | Total | |
| Year ended August 31, 2024: | | | | | | | | |
Delaware National High-Yield Municipal
Bond Fund | | $142,186,797 | | $861,689 | | $— | $143,048,486 | |
| Delaware Tax-Free USA Fund | | 44,560,462 | | 1,542,604 | | — | 46,103,066 | |
| Delaware Tax-Free USA Intermediate Fund | | 43,887,388 | | 174,358 | | — | 44,061,746 | |
| |
| Year ended August 31, 2023: | | | | | | | | |
Delaware National High-Yield Municipal
Bond Fund | | 91,922,037 | | 77,918 | | 7,433,259 | 99,433,214 | |
| Delaware Tax-Free USA Fund | | 28,535,389 | | 1,185,437 | | — | 29,720,826 | |
| Delaware Tax-Free USA Intermediate Fund | | 39,482,926 | | 18,800 | | — | 39,501,726 | |
Notes to financial statements
Delaware Funds by Macquarie® national tax-free funds
5. Components of Net Assets on a Tax Basis
As of August 31, 2024, the components of net assets on a tax basis were as follows:
| | Delaware National High-Yield
Municipal Bond Fund | | Delaware Tax-Free
USA Fund | | Delaware Tax-Free USA
Intermediate Fund |
| Shares of beneficial interest | $3,566,668,338 | | $1,296,211,513 | | $1,258,306,292 |
| Undistributed ordinary income | — | | 142,505 | | — |
| Undistributed tax-exempt income | 2,059,813 | | 319,921 | | 422,027 |
| Distributions payable | (1,085,177) | | (505,382) | | (455,365) |
| Capital loss carryforwards | (111,192,085)* | | (116,948,520)* | | (65,930,870)* |
| Deferred directors fees | (66,551) | | (65,040) | | — |
| Unrealized appreciation (depreciation) of investments | (115,496,288) | | 41,766,589 | | 20,936,473 |
| Net assets | $3,340,888,050 | | $1,220,921,586 | | $1,213,278,557 |
| * | A portion of the Fund’s capital loss carryforward is subject to limitations under the Internal Revenue Code and related regulations. |
The differences between book basis and tax basis components of net assets are primarily attributable to tax deferral of losses on wash sales and tax treatment of market discount and premium on debt instruments, as applicable.
For financial reporting purposes, capital accounts are adjusted to reflect the tax character of permanent book/tax differences. Reclassifications are primarily due to reorganization-related adjustments. Results of operations and net assets were not affected by these reclassifications. For the year ended August 31, 2024, the Funds recorded the following reclassifications:
| | Paid-in capital | | Total distributable earnings (loss) |
| Delaware National High-Yield Municipal Bond Fund | $85,494,616 | | (85,494,616) |
| Delaware Tax-Free USA Fund | 35,220,316 | | (35,220,316) |
For federal income tax purposes, capital loss carryforwards may be carried forward and applied against future capital gains. At August 31, 2024, the Funds have capital loss carryforwards available to offset future realized capital gains as follows:
| | Loss carryforward character | | |
| | Short-term | | Long-term | | Total |
Delaware National High-Yield
Municipal Bond Fund | $ 13,950,948 | | $97,241,137 | | $ 111,192,085 |
Delaware Tax-Free
USA Fund | 68,761,454 | | 48,187,066 | | 116,948,520 |
Delaware Tax-Free USA
Intermediate Fund | 53,316,522 | | 12,614,348 | | 65,930,870 |
Notes to financial statements
Delaware Funds by Macquarie® national tax-free funds
6. Capital Shares
Transactions in capital shares were as follows:
| | Delaware National High-Yield
Municipal Bond Fund | | Delaware Tax-Free
USA Fund | | Delaware Tax-Free USA
Intermediate Fund |
| | Year ended | | Year ended | | Year ended |
| | 8/31/24 | | 8/31/23 | | 8/31/24 | | 8/31/23 | | 8/31/24 | | 8/31/23 |
| Shares sold: |
| Class A | 18,524,335 | | 15,539,442 | | 7,629,084 | | 6,444,065 | | 2,269,568 | | 4,500,219 |
| Class C | 2,013,701 | | 1,589,181 | | 374,937 | | 200,006 | | 91,534 | | 110,390 |
| Institutional Class | 154,910,930 | | 156,610,912 | | 26,459,021 | | 19,371,149 | | 25,048,067 | | 48,946,268 |
|
| Shares from reorganization:1 |
| Class A | 32,586,231 | | — | | 21,567,710 | | — | | — | | — |
| Class C | 865,796 | | — | | 241,906 | | — | | — | | — |
| Institutional Class | 12,567,656 | | — | | 8,919,172 | | — | | — | | — |
|
| Shares issued upon reinvestment of dividends and distributions: |
| Class A | 2,993,148 | | 1,306,224 | | 2,589,081 | | 1,723,149 | | 1,166,081 | | 1,196,194 |
| Class C | 209,868 | | 168,989 | | 31,083 | | 22,343 | | 12,293 | | 13,954 |
| Institutional Class | 9,856,842 | | 7,269,709 | | 1,450,279 | | 850,586 | | 2,366,413 | | 2,020,209 |
| | 234,528,507 | | 182,484,457 | | 69,262,273 | | 28,611,298 | | 30,953,956 | | 56,787,234 |
|
| Shares redeemed: |
| Class A | (19,532,298) | | (9,485,208) | | (13,545,023) | | (12,223,030) | | (7,771,986) | | (8,237,446) |
| Class C | (1,964,971) | | (1,784,899) | | (356,631) | | (348,509) | | (209,808) | | (263,388) |
| Institutional Class | (115,875,987) | | (126,415,803) | | (16,127,541) | | (28,817,690) | | (24,428,480) | | (35,987,523) |
| | (137,373,256) | | (137,685,910) | | (30,029,195) | | (41,389,229) | | (32,410,274) | | (44,488,357) |
| Net increase (decrease) | 97,155,251 | | 44,798,547 | | 39,233,078 | | (12,777,931) | | (1,456,318) | | 12,298,877 |
Certain shareholders may exchange shares of one class for shares of another class in the same Fund. These exchange transactions are included in shares sold and shares redeemed in the table on the previous page and on the “Statements of changes in net assets.” For the years ended August 31, 2024 and 2023, each Fund had the following exchange transactions:
| | | Exchange Redemptions | | Exchange Subscriptions | | | |
| | | Class A
Shares | | Class C
Shares | | Institutional
Class
Shares | | Class A
Shares | | Institutional
Class
Shares | | Value | |
| |
| Delaware National High-Yield Municipal Bond Fund | |
| Year ended | |
| 8/31/24 | | 262,262 | | 29,966 | | 17,571 | | 28,896 | | 278,626 | | $3,130,197 | |
| 8/31/23 | | 493,993 | | 5,948 | | 27,463 | | 29,441 | | 494,187 | | 5,405,940 | |
| |
| Delaware Tax-Free USA Fund | |
| Year ended | |
| 8/31/24 | | 265,648 | | 7,259 | | 12,415 | | 19,824 | | 263,497 | | 2,903,203 | |
| 8/31/23 | | 367,183 | | 10,333 | | — | | 10,355 | | 364,280 | | 3,971,790 | |
| |
| Delaware Tax-Free USA Intermediate Fund | |
| Year ended | |
| 8/31/24 | | 78,305 | | 1,231 | | 10,702 | | 12,035 | | 77,573 | | 968,733 | |
| 8/31/23 | | 107,901 | | 1,333 | | 3,617 | | 4,982 | | 106,891 | | 1,239,618 | |
7. Reorganizations
On February 15-16, 2023, the Board approved proposals to reorganize the following acquired funds (Acquired Funds), each a series of Ivy Funds, with and into the following acquiring funds (Acquiring Funds) set forth in the table below (each a Reorganization and together the Reorganizations).
| Acquired Fund | Acquiring Fund |
Delaware Ivy Municipal High
Income Fund (Acquired Fund I) | Delaware National High-Yield
Municipal Bond Fund (Acquiring
Fund I) |
Delaware Ivy Municipal Bond
Fund (Acquired Fund II) | Delaware Tax-Free USA Fund
(Acquiring Fund II) |
In approving the Reorganizations, the Board and the applicable corresponding board of trustees considered various factors, including that the applicable Acquiring Fund and the applicable Acquired Fund share similar investment objectives, principal investment strategies and principal risks, and materially similar fundamental investment restrictions and that the applicable Acquiring Fund's overall total expense ratio is expected to be equal to or lower than the corresponding Acquired Fund's total expense ratio following the applicable Reorganization taking into account applicable expense limitation arrangements.
Notes to financial statements
Delaware Funds by Macquarie® national tax-free funds
7. Reorganizations (continued)
The applicable Acquired Fund shareholders approved each Reorganization on the following dates:
| Acquired Fund | Shareholder Approval Date |
| Acquired Fund I | August 10, 2023 |
| Acquired Fund II | June 27, 2023 |
Pursuant to an Agreement and Plan of Reorganization (the “Plan”): (i) all of the property and assets of the Acquired Funds were acquired by the Acquiring Funds, and (ii) the Trusts, on behalf of the Acquiring Funds, assumed the liabilities of the Acquired Funds in exchange for shares of the Acquiring Funds. In accordance with the Plan, the Acquired Funds liquidated and dissolved following the Reorganizations. The Reorganizations were accomplished by a tax-free exchange of shares on September 15, 2023. For financial reporting purposes, assets received and shares issued by the Acquiring Funds were recorded at fair value; however, the cost basis of the investments received from the Acquired Funds was carried forward to align ongoing reporting of the Acquiring Funds’ realized and unrealized gains and losses with amounts distributable to shareholders for tax purposes.
The share transactions associated with the Acquired Fund I and the Acquiring Fund I Reorganizations were as follows:
| | Acquired
Fund I
Net Assets | | Acquired
Fund I Shares
Outstanding | | Shares
Converted
to Acquiring
Fund I | | Acquiring
Fund I
Net Assets | | Conversion
Ratio |
| Class A | $309,636,927 | | 75,891,404 | | 32,586,231 | | $315,787,147 | | 0.4254 |
| Class C | 8,337,619 | | 2,043,534 | | 865,796 | | 42,795,914 | | 0.4237 |
Class I/
Institutional Class* | 120,826,680 | | 29,614,382 | | 12,567,656 | | 1,806,357,370 | | 0.4215 |
| Class R6** | 828,231 | | 202,998 | | — | | — | | — |
| Class Y*** | 2,865,024 | | 702,212 | | — | | — | | — |
* Acquired Fund I Class I shares are named Institutional Class for the Acquiring Fund I.
** Class R6 shares of the Acquired Fund I were converted into Institutional Class shares of the Acquiring Fund I.
*** Class Y shares of the Acquired Fund I were converted into Class A shares of the Acquiring Fund I.
The net assets of the Acquired Fund I before the Acquired Fund I Reorganization were $443,535,339. The Acquired Fund I net assets and shares outstanding presented on the table above do not include the shareholders that did not participate in the Acquired Fund I
Reorganization. The net assets of the Acquiring Fund I immediately following the Acquired Fund I Reorganization were $2,607,434,912.
The share transactions associated with the Acquired Fund II and the Acquiring Fund II Reorganizations were as follows:
| | Acquired
Fund II
Net Assets | | Acquired
Fund II Shares
Outstanding | | Shares
Converted
to Acquiring
Fund II | | Acquiring
Fund II
Net Assets | | Conversion
Ratio |
| Class A | $213,736,002 | | 21,721,138 | | 21,567,710 | | $464,030,626 | | 0.9929 |
| Class C | 2,397,289 | | 243,627 | | 241,906 | | 6,644,838 | | 0.9929 |
Class I/
Institutional Class* | 88,087,677 | | 8,952,000 | | 8,919,172 | | 261,686,732 | | 0.9850 |
| Class R6** | 1,014,846 | | 103,135 | | — | | — | | — |
* Acquired Fund II Class I shares are named Institutional Class for the Acquiring Fund II.
** Class R6 shares of the Acquired Fund II were converted into Institutional Class shares of the Acquiring Fund II.
The net assets of the Acquired Fund II before the Acquired Fund II Reorganization were $305,457,973. The Acquired Fund II net assets and shares outstanding presented on the table above do not include the shareholders that did not participate in the Acquired Fund II Reorganization. The net assets of the Acquiring Fund II immediately following the Acquired Fund II Reorganization were $1,037,598,010.
Assuming the Reorganizations had been completed on September 1, 2023, the Acquiring Funds’ pro forma results of operations for the year ended August 31, 2024, would have been as follows:
| | Acquiring Fund I | | Acquiring Fund II |
| Net investment income | $149,983,168 | | $46,789,320 |
| Net realized loss on investments | (18,443,912) | | (18,060,765) |
| Net change in unrealized appreciation (depreciation) | 214,019,102 | | 93,047,977 |
| Net increase in net assets resulting from operations | $345,558,358 | | $121,776,532 |
Because the combined investment portfolios have been managed as a single integrated portfolio since the Reorganizations were completed, it is not practical to separate the amounts of revenue and earnings of the Acquired Funds that have been included in the Acquiring Funds’ “Statements of operations” since the Reorganizations were consummated on September 15, 2023.
8. Line of Credit
Each Fund, along with certain other funds in the Delaware Funds (Participants), was a participant in a $355,000,000 revolving line of credit (Agreement) intended to be used for
Notes to financial statements
Delaware Funds by Macquarie® national tax-free funds
8. Line of Credit (continued)
temporary or emergency purposes as an additional source of liquidity to fund redemptions of investor shares. Under the Agreement, the Participants were charged an annual commitment fee of 0.15%, which was allocated across the Participants based on a weighted average of the respective net assets of each Participant. The Participants were permitted to borrow up to a maximum of one-third of their net assets under the Agreement. Each Participant was individually, and not jointly, liable for its particular advances, if any, under the line of credit. The line of credit available under the Agreement expired on October 30, 2023.
On October 30, 2023, each Fund, along with the other Participants, entered into an amendment to the Agreement for a $335,000,000 revolving line of credit to be used as described above. It operates in substantially the same manner as the original Agreement. Under the amendment to the Agreement, the Participants are charged an annual commitment fee of 0.15%, which is allocated across the Participants based on a weighted average of the respective net assets of each Participant. The line of credit available under the Agreement expires on October 28, 2024.
Each Fund had no amounts outstanding as of August 31, 2024, or at any time during the year then ended.
9. Securities Lending
Each Fund, along with other funds in the Delaware Funds, may lend its securities pursuant to a security lending agreement (Lending Agreement) with The Bank of New York Mellon (BNY). At the time a security is loaned, the borrower must post collateral equal to the required percentage of the market value of the loaned security, including any accrued interest. The required percentage is: (1) 102% with respect to US securities and foreign securities that are denominated and payable in US dollars; and (2) 105% with respect to foreign securities. With respect to each loan, if on any business day the aggregate market value of securities collateral plus cash collateral held is less than the aggregate market value of the securities which are the subject of such loan, the borrower will be notified to provide additional collateral by the end of the following business day, which, together with the collateral already held, will be not less than the applicable initial collateral requirements for such security loan. If the aggregate market value of securities collateral and cash collateral held with respect to a security loan exceeds the applicable initial collateral requirement, upon the request of the borrower, BNY must return enough collateral to the borrower by the end of the following business day to reduce the value of the remaining collateral to the applicable initial collateral requirement for such security loan. As a result of the foregoing, the value of the collateral held with respect to a loaned security on any particular day, may be more or less than the value of the security on loan. The collateral percentage with respect to the market value of the loaned security is determined by the security lending agent.
Cash collateral received by each Fund of the Trust is generally invested in a series of individual separate accounts, each corresponding to a fund. The investment guidelines permit each separate account to hold certain securities that would be considered eligible securities for a
money market fund. Cash collateral received is generally invested in government securities; certain obligations issued by government sponsored enterprises; repurchase agreements collateralized by US Treasury securities; obligations issued by the central government of any Organization for Economic Cooperation and Development (OECD) country or its agencies, instrumentalities, or establishments; obligations of supranational organizations; commercial paper, notes, bonds, and other debt obligations; certificates of deposit, time deposits, and other bank obligations; certain money market funds; and asset-backed securities. Each Fund can also accept US government securities and letters of credit (non-cash collateral) in connection with securities loans.
In the event of default or bankruptcy by the lending agent, realization and/or retention of the collateral may be subject to legal proceedings. In the event the borrower fails to return loaned securities and the collateral received is insufficient to cover the value of the loaned securities and provided such collateral shortfall is not the result of investment losses, the lending agent has agreed to pay the amount of the shortfall to each Fund or, at the discretion of the lending agent, replace the loaned securities. Each Fund continues to record dividends or interest, as applicable, on the securities loaned and is subject to changes in value of the securities loaned that may occur during the term of the loan. Each Fund has the right under the Lending Agreement to recover the securities from the borrower on demand. With respect to security loans collateralized by non-cash collateral, each Fund receives loan premiums paid by the borrower. With respect to security loans collateralized by cash collateral, the earnings from the collateral investments are shared among each Fund, the security lending agent, and the borrower. Each Fund records security lending income net of allocations to the security lending agent and the borrower.
Each Fund may incur investment losses as a result of investing securities lending collateral. This could occur if an investment in each collateral investment account defaulted or became impaired. Under those circumstances, the value of each Fund’s cash collateral account may be less than the amount each Fund would be required to return to the borrowers of the securities and each Fund would be required to make up for this shortfall.
During the year ended August 31, 2024, each Fund had no securities out on loan.
10. Geographic, Credit and Market Risks
The impact of COVID-19, and other infectious illness outbreaks that may arise in the future, could adversely affect the economies of many nations or the entire global economy, individual issuers and capital markets in ways that cannot necessarily be foreseen.
When interest rates rise, fixed income securities (i.e. debt obligations) generally will decline in value. These declines in value are greater for fixed income securities with longer maturities or durations. Interest rate changes are influenced by a number of factors, such as government policy, monetary policy, inflation expectations, and the supply and demand of bonds. A fund may be subject to a greater risk of rising interest rates when interest rates are low or inflation rates are high or rising.
Notes to financial statements
Delaware Funds by Macquarie® national tax-free funds
10. Geographic, Credit and Market Risks (continued)
The Funds concentrate their investments in securities issued by municipalities, and may be subject to geographic concentration risk. In addition, the Funds have the flexibility to invest in issuers in US territories and possessions such as the Commonwealth of Puerto Rico, the US Virgin Islands, and Guam, whose bonds are also free of federal and individual state income taxes. The value of the Funds’ investments may be adversely affected by new legislation within the US states or territories, regional or local economic conditions, and differing levels of supply and demand for municipal bonds. Many municipalities insure repayment for their obligations. Although bond insurance reduces the risk of loss due to default by an issuer, such bonds remain subject to the risk that value may fluctuate for other reasons and there is no certainty that the insurance company will meet its obligations. A real or perceived decline in creditworthiness of a bond insurer can have an adverse impact on the value of insured bonds held in each Fund.
As of August 31, 2024, Delaware Tax-Free USA Fund invested in municipal bonds issued by the states of California and territory of Puerto Rico, which constituted approximately 13.91% and 13.70%, respectively, of the Fund’s net assets. As of August 31, 2024, Delaware Tax-Free USA Intermediate Fund invested in municipal bonds issued by the states of California, New York, and territory of Puerto Rico, which constituted approximately 10.24%, 15.15% and 10.67%, respectively, of the Fund’s net assets. As of August 31, 2024, Delaware National High-Yield Municipal Bond Fund invested in municipal bonds issued by the state of California, New York, and territory of Puerto Rico, which constituted approximately 12.17%, 10.30% and 13.79%, respectively, of the Fund’s net assets. These investments could make each Fund more sensitive to economic conditions in those states than other more geographically diversified national municipal income funds.
From time to time, each Fund may invest in industrial development bonds (IDBs) or pollution control revenue (PCR) bonds that are issued by a conduit authority on behalf of a corporation that is either foreign owned or has international affiliates or operations. While the bonds may be issued to finance a facility located in the US, the bonds may be secured by a payment obligation or guaranty of the corporation. To the extent each Fund invests in such securities, that Fund may be exposed to risks associated with international investments. The risk of international investments not ordinarily associated with US investments includes fluctuation in currency values, differences in accounting principles, and/or economic or political instability in other nations.
Each Fund invests in certain obligations that may have liquidity protection designed to ensure that the receipt of payments due on the underlying security is timely. Such protection may be provided through guarantees, insurance policies, or letters of credit obtained by the issuer or sponsor through third parties, through various means of structuring the transaction, or through a combination of such approaches. The Funds will not pay any additional fees for such credit support, although the existence of credit support may increase the price of a security.
Each Fund may invest in advance refunded bonds, escrow secured bonds, or defeased bonds. Under current federal tax laws and regulations, state and local government borrowers are
permitted to refinance outstanding bonds by issuing new bonds. The issuer refinances the outstanding debt to either reduce interest costs or to remove or alter restrictive covenants imposed by the bonds being refinanced. A refunding transaction where the municipal securities are being refunded within 90 days from the issuance of the refunding issue is known as a “current refunding.” “Advance refunded bonds” are bonds in which the refunded bond issue remains outstanding for more than 90 days following the issuance of the refunding issue. In an advance refunding, the issuer will use the proceeds of a new bond issue to purchase high grade interest-bearing debt securities, which are then deposited in an irrevocable escrow account held by an escrow agent to secure all future payments of principal and interest and bond premium of the advance refunded bond. Bonds are “escrowed to maturity” when the proceeds of the refunding issue are deposited in an escrow account for investment sufficient to pay all of the principal and interest on the original interest payment and maturity dates.
Bonds are considered “pre-refunded” when the refunding issuer’s proceeds are escrowed only until a permitted call date or dates on the refunded issue with the refunded issue being redeemed at the time, including any required premium. Bonds become “defeased” when the rights and interests of the bondholders and of their lien on the pledged revenues or other security under the terms of the bond contract are substituted with an alternative source of revenues (the escrow securities) sufficient to meet payments of principal and interest to maturity or to the first call dates. Escrowed secured bonds will often receive a rating of AAA from Moody’s, S&P, and/or Fitch Ratings due to the strong credit quality of the escrow securities and the irrevocable nature of the escrow deposit agreement.
Each Fund may invest up to 15% of its net assets in illiquid securities, which may include securities with contractual restrictions on resale, securities exempt from registration under Rule 144A promulgated under the Securities Act of 1933, as amended, and other securities which may not be readily marketable. The relative illiquidity of these securities may impair each Fund from disposing of them in a timely manner and at a fair price when it is necessary or desirable to do so. While maintaining oversight, the Board has delegated to DMC the day-to-day functions of determining whether individual securities are liquid for purposes of each Fund’s limitation on investments in illiquid securities. Securities eligible for resale pursuant to Rule 144A, which are determined to be liquid, are not subject to each Fund’s 15% limit on investments in illiquid securities. Rule 144A securities have been identified on the “Schedules of investments.”
11. Contractual Obligations
Each Fund enters into contracts in the normal course of business that contain a variety of indemnifications. Each Fund’s maximum exposure under these arrangements is unknown. However, each Fund has not had prior claims or losses pursuant to these contracts. Management has reviewed each Fund’s existing contracts and expects the risk of loss to
be remote.
Notes to financial statements
Delaware Funds by Macquarie® national tax-free funds
12. Subsequent Events
On October 28, 2024, each Fund, along with the other Participants, entered into an amendment to the Agreement for a $335,000,000 revolving line of credit to be used as described in Note 8. It operates in substantially the same manner as the original Agreement. Under the amendment to the Agreement, the Participants are charged an annual commitment fee of 0.15%, which is allocated across the Participants based on a weighted average of the respective net assets of each Participant. The line of credit available under the Agreement expires on October 27, 2025.
MIMBT, of which DMC is a series, entered into a settlement agreement on September 19, 2024 with the U.S. Securities and Exchange Commission (SEC) consenting to an order (Settlement Order) relating to a legacy investment strategy, the Absolute Return Mortgage-Backed Securities Strategy (ARMBS Strategy). MIMBT no longer offers the ARMBS Strategy. MIMBT agreed to the Settlement Order without admitting or denying the SEC's findings. The Settlement Order does not impact MIMBT's ability to continue to provide services to each Fund.
Management has determined that no other material events or transactions occurred subsequent to August 31, 2024, that would require recognition or disclosure in the Funds’ financial statements.
Report of independent registered public accounting firm
To the Board of Trustees of Voyageur Mutual Funds and Delaware Group® Tax-Free Fund and Shareholders of Delaware National High-Yield Municipal Bond Fund, Delaware Tax-Free USA Fund and Delaware Tax-Free USA Intermediate Fund
Opinions on the Financial Statements
We have audited the accompanying statements of assets and liabilities, including the schedules of investments, of Delaware National High-Yield Municipal Bond Fund (one of the funds constituting Voyageur Mutual Funds), Delaware Tax-Free USA Fund and Delaware Tax-Free USA Intermediate Fund (constituting Delaware Group® Tax-Free Fund) (hereafter collectively referred to as the “Funds”) as of August 31, 2024, the related statements of operations for the year ended August 31, 2024, the statements of changes in net assets for each of the two years in the period ended August 31, 2024, including the related notes, and the financial highlights for each of the five years in the period ended August 31, 2024 (collectively referred to as the “financial statements”). In our opinion, the financial statements present fairly, in all material respects, the financial position of each of the Funds as of August 31, 2024, the results of each of their operations for the year then ended, the changes in each of their net assets for each of the two years in the period ended August 31, 2024 and each of the financial highlights for each of the five years in the period ended August 31, 2024 in conformity with accounting principles generally accepted in the United States of America.
Basis for Opinions
These financial statements are the responsibility of the Funds’ management. Our responsibility is to express an opinion on the Funds’ financial statements based on our audits. We are a public accounting firm registered with the Public Company Accounting Oversight Board (United States) (PCAOB) and are required to be independent with respect to the Funds in accordance with the U.S. federal securities laws and the applicable rules and regulations of the Securities and Exchange Commission and the PCAOB.
We conducted our audits of these financial statements in accordance with the standards of the PCAOB. Those standards require that we plan and perform the audit to obtain reasonable assurance about whether the financial statements are free of material misstatement, whether due to error or fraud.
Our audits included performing procedures to assess the risks of material misstatement of the financial statements, whether due to error or fraud, and performing procedures that respond to those risks. Such procedures included examining, on a test basis, evidence regarding the amounts and disclosures in the financial statements. Our audits also included evaluating the accounting principles used and significant estimates made by management, as well as evaluating the overall presentation of the financial statements. Our procedures included confirmation of securities owned as of August 31, 2024 by correspondence with the custodian and brokers; when replies were not received from brokers, we performed other auditing procedures. We believe that our audits provide a reasonable basis for our opinions.
/s/PricewaterhouseCoopers LLP
Philadelphia, Pennsylvania
October 30, 2024
We have served as the auditor of one or more Macquarie investment companies since 2010.
Other Fund information (Unaudited)
Delaware Funds by Macquarie® national tax-free funds
Tax Information
The information set forth below is for each Fund’s fiscal year as required by federal income tax laws. Shareholders, however, must report distributions on a calendar year basis for income tax purposes, which may include distributions for portions of two fiscal years of each Fund. Accordingly, the information needed by shareholders for income tax purposes will be sent to them in January of each year. Please consult your tax advisor for proper treatment of this information.
All disclosures are based on financial information available as of the date of this report and, accordingly are subject to change. For any and all items requiring reporting, it is the intention of each Fund to report the maximum amount permitted under the Internal Revenue Code and the regulations thereunder.
For the year ended August 31, 2024, each Fund reports distributions paid during the year as follows:
| | (A)
Tax-Exempt
Distributions
(Tax Basis) | (B)
Ordinary Income
Distributions
(Tax Basis) | Total
Distributions
(Tax Basis) |
| Delaware National High-Yield Municipal Bond Fund | 99.40% | 0.60% | 100.00% |
| Delaware Tax-Free USA Fund | 96.65% | 3.35% | 100.00% |
| Delaware Tax-Free USA Intermediate Fund | 99.60% | 0.40% | 100.00% |
(A) and (B) are based on a percentage of each Fund’s total distributions.
Changes in and Disagreements with Accountants for Open-End Management Investment Companies
Not applicable.
Proxy Disclosures for Open-End Management Investment Companies
Not applicable.
Remuneration Paid to Directors, Officers, and Others of Open-End Management Investment Companies
The aggregate remuneration paid to directors, officers and others is disclosed within the financial statements.
Statement Regarding Basis of Approval for Investment Advisory Contract
Board Consideration of Investment Management Agreements at a Meeting Held on August 13-15, 2024
At a meeting held on August 13-15, 2024 (the “Annual Contract Renewal Meeting”), the Board of Trustees (the “Board”), including a majority of Trustees each of whom is not an “interested person” as defined under the Investment Company Act of 1940 (the “Independent Trustees”), approved the renewal of the Delaware Tax-Free USA Fund, Delaware Tax-Free USA Intermediate Fund and Delaware National High-Yield Municipal Bond Fund (each, a “Fund” and together, the “Funds”) Investment Management Agreements with Delaware Management Company (“DMC”).
Prior to the Annual Contract Renewal Meeting, including at a Board meeting held in May 2024, the Trustees conferred extensively among themselves and with representatives of DMC about these matters. Also, the Board was assisted by the Equity Investments Committee and the Fixed Income Multi-Asset Sub-Advised Funds Investments Committee (each an “Investment Committee” and together, the “Investment Committees”), with each Investment Committee assisting the full Board in reviewing investment performance and other matters throughout the year. The Independent Trustees were also assisted in their evaluation of the Investment Management Agreements by independent legal counsel, from whom they received separate legal advice and with whom they met separately.
In providing information to the Board, DMC was guided by a detailed set of requests for information submitted to them by independent legal counsel on behalf of the Independent Trustees at the start of the Board’s annual contract renewal process earlier in 2024. Prior to the Annual Contract Renewal Meeting, and in response to the requests, the Board received and reviewed materials specifically relating to the renewal of the Investment Management Agreements. In considering and approving the Investment Management Agreements, the Trustees considered the information they believed relevant, including but not limited to the information discussed below. The Board considered not only the specific information presented in connection with the Annual Contract Renewal Meeting and the review process for the Investment Management Agreements, but also the knowledge gained over time through interaction with DMC about various topics. In this regard, the Board reviewed reports of DMC at each of its quarterly meetings, which included information about, among other things, Fund performance, investment strategies, and expenses. In addition, the Investment Committees confer with portfolio managers at various times throughout the year. In considering information relating to the approval of the Funds’ Investment Management Agreements, the Independent Trustees also received information from an independent fund consultant, JDL Consultants, LLC (“JDL”).
Other Fund information (Unaudited)
Delaware Funds by Macquarie® national tax-free funds
Board Consideration of Investment Management Agreements at a Meeting Held on August 13-15, 2024 (continued)
The Board did not identify any particular information or consideration that was all-important or controlling, and each individual Trustee may have attributed different weights to various factors.
After its deliberations, the Board, including the Independent Trustees, unanimously approved the continuation of the Investment Management Agreements for a one-year term. The following summarizes a number of important, but not necessarily all of the, factors considered by the Board in support of its approval.
Nature, extent, and quality of services. The Board received and considered various information regarding the nature, extent, and quality of the advisory services provided to the Funds by DMC under its Investment Management Agreements and the experience of the officers and employees of DMC who provide these services, including each Fund’s portfolio managers. The Board met with DMC’s senior management and investment personnel. The Board reviewed the materials provided by the Funds’ portfolio management team discussing its performance, investment strategies and outlook, as well as DMC with respect to comparing Fund performance to the performance of a comparable group of mutual funds, relevant benchmarks, and performance metrics, as applicable. The Board’s review included consideration of DMC’s investment oversight and research and analysis capabilities, and its ability to attract and retain skilled investment professionals. The Board also considered information regarding DMC’s programs for risk management, including investment, operational, liquidity, derivatives (as applicable), valuation and compliance risks and its plans for enhancing those programs (including through the allocation of additional resources and enhancements to existing processes and testing). The Board received information with respect to the cybersecurity program and business continuity plans of DMC and its affiliates, as well as information from Macquarie Group Ltd. (“Macquarie”), the parent company of DMC, regarding Macquarie’s commitment to the U.S. mutual fund business.
In addition, the Board considered certain non-advisory services that DMC and its affiliates provide to the fund complex. Among other things, these services include third party service provider oversight, transfer agency, internal audit, pricing and valuation, portfolio trading, and legal and compliance functions. The Board noted DMC’s responsibility for overseeing the preparation of the Funds’ prospectus, summary prospectus, statement of additional information and shareholder reports; responsibility for other periodic filings with regulators; organizing Board meetings and preparing materials for such Board meetings; and furnishing analytical and other support to assist the Board.
The Board took into account the benefits to shareholders of investing in a Fund that is part of a family of funds managed by an affiliate of Macquarie, and the resources available to DMC as part of Macquarie’s global asset management business.
The Board also received and considered information about the nature and extent of services offered and fee rates charged by DMC to other types of clients with investment strategies similar to those of the Funds. In this regard, the Board received information about the significantly greater scope of services, and compliance, reporting and other legal and regulatory obligations
and risks of managing registered investment companies compared with those associated with managing assets of other types of clients, including third-party sub-advised fund clients, unregistered funds and separately managed accounts.
The Board concluded that, overall, it was satisfied with the nature, extent and quality of services provided (and expected to be provided) to the Funds by DMC.
Investment performance. The Board received and considered information with respect to the investment performance of the Funds, including performance reports and discussions with portfolio managers at meetings of the Board’s Investment Committees throughout the year as well as reports provided by Broadridge Financial Solutions, Inc., an independent investment company data provider (“Broadridge”), furnished for the Annual Contract Renewal Meeting. The Broadridge reports prepared for each Fund’s institutional share class showed its investment performance in comparison to the institutional share class of a group of similar funds (the “Performance Universe”). The Board received a description of the methodology used to select the peer funds in the Performance Universe. Comparative annualized performance for each Fund was shown for the past 1-, 3-, 5-, and 10-year or since inception periods, as applicable, ended December 31, 2023.
Delaware Tax-Free USA Fund. The Performance Universe for the Fund consisted of the Fund and all retail and institutional general and insured municipal debt funds, regardless of asset size or primary channel of distribution. The Board noted that the Broadridge report comparison showed that the Fund’s total return for the 1-, 3-, 5-, and 10-year periods was in the first quartile of its Performance Universe. The Broadridge report comparison showed that the Fund’s total return for the 1-, 3-, 5-, and 10-year periods was above the median of its Performance Universe. The Board also noted that the Fund outperformed its benchmark index for the 1-, 5-, and 10-year periods and was approximately equal to its benchmark index for the 3-year period. The Board, however, noted that the investment performance of the current portfolio management team began as of February 2019. The Board noted that the Fund was generally outperforming its Performance Universe and benchmark index during the periods under review.
Delaware Tax-Free USA Intermediate Fund. The Performance Universe for the Fund consisted of the Fund and all retail and institutional intermediate municipal debt funds, regardless of asset size or primary channel of distribution. The Board noted that the Broadridge report comparison showed that the Fund’s total return for the 1-, 5-, and 10-year periods was in the first quartile of its Performance Universe and for the 3-year period was in the third quartile of its Performance Universe. The Broadridge report comparison showed that the Fund’s total return for the
1-, 5-, and 10-year periods was above the median of its Performance Universe and for the 3-year period was below the median of its Performance Universe. The Board also noted that the Fund outperformed its benchmark index for the 1-year period, underperformed its benchmark index for the 3-year period and performed approximately equal to its benchmark index for the 5- and 10-year periods. The Board, however, noted that the investment performance of the current portfolio management team began as of February 2019. The Board noted that the Fund was generally outperforming its Performance Universe and benchmark index during the periods under review (except for the 3-year period).
Other Fund information (Unaudited)
Delaware Funds by Macquarie® national tax-free funds
Board Consideration of Investment Management Agreements at a Meeting Held on August 13-15, 2024 (continued)
Delaware National High-Yield Municipal Bond Fund. The Performance Universe for the Fund consisted of the Fund and all retail and institutional high yield municipal debt funds, regardless of asset size or primary channel of distribution. The Board noted that the Broadridge report comparison showed that the Fund’s total return for the 1-, 3-, 5-, and 10-year periods was in the first quartile of its Performance Universe. The Broadridge report comparison showed that the Fund’s total return for the 1-, 3-, 5-, and 10-year periods was above the median of its Performance Universe. The Board also noted that the Fund outperformed its benchmark index for the 1-, 3-, 5-, and 10-year periods. The Board noted that the Fund was generally outperforming its Performance Universe and benchmark index during the periods under review. The Board, however, noted that the investment performance of the current portfolio management team only began as of May 2023.
Comparative expenses. The Board received and considered expense data for the Funds. DMC provided the Board with information on pricing levels and fee structures for each Fund as of its most recently completed fiscal year. The Broadridge total expenses (reflecting any applicable fee waivers and/or expense reimbursements), for comparative consistency, were shown by Broadridge for Institutional Class shares, including 12b-1 and non-12b-1 service fees (as applicable). The Board also considered the comparative analysis of contractual management fees and actual total expense ratios of each Fund versus contractual management fees and actual total expense ratios of a group of peer funds as selected by Broadridge (the “Expense Group”). Each Fund’s total expenses were also compared with those of its Expense Universe, which is comprised of the Fund, its Expense Group and all other similar with an institutional share class (i.e., funds without 12b-1 fees and non-12b-1 service fees) with assets equal to or greater than $100 million, excluding outliers (the “Expense Universe”). In reviewing comparative costs, each Fund’s contractual management fee and the actual management fee incurred by each Fund were compared with the contractual management fees (assuming all funds in the Expense Group were similar in size to each Fund) and actual management fees, taking into account any applicable breakpoints and fee waivers and/or expense reimbursements, with a Fund’s Expense Universe.
The Board also received and considered information regarding the Fund’s net operating expense ratios and their various components, including actual management fees, custodian and other non-management fees, and Rule 12b-1 and non-Rule 12b-1 shareholder service fees.
Delaware Tax-Free USA Fund. The expense comparisons for the Fund showed that its actual management fee was below the median of its Expense Universe and its actual total expenses were above its Expense Group average. It was noted that consistent with DMC’s waiver methodology, its advisory fee waivers, if any, were at the fund level and not class level.
Delaware Tax-Free USA Intermediate Fund. The expense comparisons for the Fund showed that its actual management fee was above the median of its Expense Universe and its actual total expenses were above its Expense Group average. It was noted that consistent with DMC’s waiver methodology, its advisory fee waivers, if any, were at the fund level and not class level.
Delaware National High-Yield Municipal Bond Fund. The expense comparisons for the Fund showed that its actual management fee was below the median of its Expense Universe and its actual total expenses were above its Expense Group average. It was noted that consistent with DMC’s waiver methodology, its advisory fee waivers, if any, were at the fund level and not class level.
Based on its consideration of the factors and information it deemed relevant, including those described here, the Board determined that the compensation payable to DMC under the Investment Management Agreements was reasonable.
Economies of scale. The Board received and considered information about the potential for DMC to realize economies of scale in the provision of management services to the Funds, the difficulties of calculating economies of scale at an individual Fund level, and the extent to which potential scale benefits are shared with shareholders, including the extent to which any economies of scale are reflected in the level of management fees charged. DMC discussed its advisory fee pricing and structure for the complex, including the current breakpoints. The Board noted that, as of March 31, 2024, Delaware Tax-Free USA Fund’s and Delaware Tax-Free USA Intermediate Fund’s net assets each exceeded their second breakpoint levels and Delaware National High-Yield Municipal Bond Fund’s net assets exceeded its third breakpoint level and that breakpoints result in a lower advisory fee than would otherwise be the case in the absence of breakpoints, when the asset levels specified in the breakpoints schedule are exceeded. The Board noted that each Fund may also benefit from economies of scale through initial fee setting, fee waivers and expense reimbursements, as well as DMC’s investment in its business, including investments in business infrastructure, technology and cybersecurity.
Management profitability. The Board received and considered the Investment Management Profitability Analysis that addressed the overall profitability of DMC’s business in providing management and other services to each Fund and the complex as a whole, including the methodology used by DMC in allocating costs for the purpose of determining profitability. The Board also reviewed a report prepared by JDL regarding DMC’s profitability as compared to certain peer fund complexes and the Independent Trustees discussed DMC’s profitability in such context with representatives from JDL. The Board recognized that calculating and comparing profitability at the individual fund level is difficult; that DMC’s profit, if any, can vary significantly depending on the particular fund; and that DMC’s support for, and commitment to, a fund are not solely dependent on the profits realized as to that fund.
Based on its review, the Board determined that DMC’s profitability was not excessive in light of the nature, extent and quality of the services provided to each Fund.
Ancillary benefits. The Board received and considered information regarding the extent to which DMC and its affiliates might derive ancillary benefits from fund operations, including the potential for procuring additional business as a result of the prestige and visibility associated with its role as investment manager to the complex; the benefits from allocation of fund brokerage to improve trading efficiencies; the portfolio transactions executed through “soft dollar” arrangements; and the fees that various affiliates received for serving as transfer agent and for overseeing fund accounting and financial administration services to the complex. The Board considered that it receives periodic reports from DMC that include a representation that any soft
Other Fund information (Unaudited)
Delaware Funds by Macquarie® national tax-free funds
Board Consideration of Investment Management Agreements at a Meeting Held on August 13-15, 2024 (continued)
dollar arrangements are consistent with regulatory requirements. The Board received information from DMC regarding its view of the performance of its affiliates in providing transfer agent and fund accounting and financial administration oversight services and the organizational structure employed to provide these services pursuant to their contracts with the Funds.
Based on its consideration of the factors and information it deemed relevant, including the costs of providing investment management and other services to the Funds and the ongoing commitment of DMC and its affiliates to the Funds, the Board did not find that any ancillary benefits received by DMC and its affiliates were unreasonable.
Conclusion. Based on its review, consideration and evaluation of all factors it believed relevant, including the above-described factors and conclusions, the Board, including all of the Independent Trustees, unanimously approved the continuation of DMC’s Investment Management Agreements for an additional one-year period.
Contact information
Shareholder assistance by phone
800 523-1918, weekdays from 8:30am to
6:00pm ET
For securities dealers and financial
institutions representatives only
800 362-7500
Regular mail
Delaware Funds by Macquarie
P.O. Box 534437
Pittsburgh, PA 15253-4437
Overnight courier service
Delaware Funds by Macquarie
Attention: 534437
500 Ross Street, 154-0520
Pittsburgh, PA 15262
Macquarie Asset Management • 610 Market Street • Philadelphia, PA 19106-2354
Macquarie Asset Management (MAM) is the asset management division of Macquarie Group. MAM is an integrated asset manager across public and private markets offering a diverse range of capabilities, including real assets, real estate, credit, equities, and multi-asset solutions.
The Funds are advised by Delaware Management Company, a series of MIMBT, a US registered investment adviser, and distributed by Delaware Distributors, L.P. (DDLP), an affiliate of MIMBT and Macquarie Group Limited.
Other than Macquarie Bank Limited ABN 46 008 583 542 (“Macquarie Bank”), any Macquarie Group entity noted in this document is not an authorized deposit-taking institution for the purposes of the Banking Act 1959 (Commonwealth of Australia). The obligations of these other Macquarie Group entities do not represent deposits or other liabilities of Macquarie Bank. Macquarie Bank does not guarantee or otherwise provide assurance in respect of the obligations of these other Macquarie Group entities. In addition, if this document relates to an investment, (a) the investor is subject to investment risk including possible delays in repayment and loss of income and principal invested and (b) none of Macquarie Bank or any other Macquarie Group entity guarantees any particular rate of return on or the performance of the investment, nor do they guarantee repayment of capital in respect of the investment.
The Funds are governed by US laws and regulations.
This page is not part of the Financial statements and other information.
Fixed income mutual funds
Delaware Tax-Free Arizona Fund
Delaware Tax-Free California Fund
Delaware Tax-Free Colorado Fund
Delaware Tax-Free Idaho Fund
Delaware Tax-Free New York Fund
Delaware Tax-Free Pennsylvania Fund
Financial statements and other information
For the year ended August 31, 2024
This report and the financial statements contained herein are submitted for the general information of the shareholders of the Funds. This report is not authorized for distribution to prospective investors in the Funds unless preceded or accompanied by an effective prospectus.
Form N-PORT and proxy voting information
Each Fund files its complete schedule of portfolio holdings with the Securities and Exchange Commission (SEC) for the first and third quarters of each fiscal year on Form N-PORT. Each Fund’s Form N-PORT, as well as a description of the policies and procedures that the Funds use to determine how to vote proxies (if any) relating to portfolio securities, are available without charge (i) upon request, by calling 800 523-1918; and (ii) on the SEC’s website at sec.gov. In addition, a description of the policies and procedures that the Funds use to determine how to vote proxies (if any) relating to portfolio securities and the Schedule of Investments included in the Funds’ most recent Form N-PORT are available without charge on the Funds’ website at delawarefunds.com/literature.
Information (if any) regarding how the Funds voted proxies relating to portfolio securities during the most recently disclosed 12-month period ended June 30 is available without charge (i) through the Funds’ website at delawarefunds.com/proxy; and (ii) on the SEC’s website at sec.gov.
Schedules of investments
| Delaware Tax-Free Arizona Fund | August 31, 2024 |
| | | Principal
amount° | Value (US $) |
| Municipal Bonds — 98.62% |
| Education Revenue Bonds — 28.04% |
| Arizona Industrial Development Authority Revenue | | | |
(Academies of Math & Science Projects)
Series A 5.00% 7/1/51 | | 1,000,000 | $ 1,004,030 |
(ACCEL Schools Project)
Series A 144A 5.25% 8/1/48 # | | 350,000 | 337,967 |
| (American Charter Schools Foundation Project) | | | |
| 144A 6.00% 7/1/37 # | | 250,000 | 259,163 |
| 144A 6.00% 7/1/47 # | | 400,000 | 410,392 |
(Doral Academy of Nevada - Fire Mesa and Red Rock Campus Projects)
Series A 5.00% 7/15/49 | | 375,000 | 375,442 |
(Empower College Prep Project)
144A 6.00% 7/1/49 # | | 500,000 | 508,100 |
| (Great Hearts Arizona Projects) | | | |
| Series A 2.25% 7/1/46 | | 1,000,000 | 667,750 |
| Series A 2.375% 7/1/52 | | 1,205,000 | 760,994 |
(KIPP NYC Public Charter Schools - Macombs Facility Project)
Series A 4.00% 7/1/51 | | 1,230,000 | 1,134,109 |
(Odyssey Preparatory Academy Project)
Series A 144A 5.50% 7/1/52 # | | 375,000 | 376,384 |
(Social Bonds - Equitable School)
Series A 4.00% 11/1/50 | | 1,600,000 | 1,531,424 |
| Arizona State University Revenue System | | | |
| Series A 5.00% 7/1/43 | | 1,000,000 | 1,075,250 |
(Green Bonds)
Series A 5.00% 7/1/54 | | 1,000,000 | 1,096,470 |
City of Phoenix, Arizona Industrial Development Authority
Revenue | | | |
(Great Hearts Academic Project)
5.00% 7/1/46 | | 1,000,000 | 1,000,570 |
Maricopa County, Arizona Industrial Development
Authority Revenue | | | |
(Arizona Autism Charter Schools Project)
Series A 144A 5.00% 7/1/40 # | | 250,000 | 253,187 |
(Choice Academies, Inc. Project)
144A 5.75% 9/1/45 # | | 1,225,000 | 1,256,458 |
(Creighton University Project)
4.00% 7/1/50 | | 1,000,000 | 951,440 |
(Highland Prep Projects)
Series A 4.00% 7/1/56 | | 2,000,000 | 1,754,060 |
(Reid Traditional Schools Projects)
5.00% 7/1/47 | | 785,000 | 787,826 |
Schedules of investments
Delaware Tax-Free Arizona Fund
| | | Principal
amount° | Value (US $) |
| Municipal Bonds (continued) |
| Education Revenue Bonds (continued) |
Pima County, Arizona Industrial Development Authority
Education Revenue | | | |
(Edkey Charter Schools Project)
144A 5.00% 7/1/55 # | | 750,000 | $ 706,065 |
| | 16,247,081 |
| Electric Revenue Bonds — 9.89% |
| Mesa, Arizona Utility System Revenue | | | |
| 4.00% 7/1/31 | | 850,000 | 862,002 |
| 4.00% 7/1/42 | | 550,000 | 554,471 |
| Puerto Rico Electric Power Authority Revenue | | | |
| Series A 5.05% 7/1/42 ‡ | | 55,000 | 29,700 |
| Series AAA 5.25% 7/1/25 ‡ | | 35,000 | 18,900 |
| Series WW 5.00% 7/1/28 ‡ | | 550,000 | 297,000 |
| Series XX 4.75% 7/1/26 ‡ | | 35,000 | 18,900 |
| Series XX 5.75% 7/1/36 ‡ | | 125,000 | 67,500 |
| Series ZZ 4.75% 7/1/27 ‡ | | 30,000 | 16,200 |
| Series ZZ 5.25% 7/1/25 ‡ | | 45,000 | 24,188 |
Salt River, Arizona Project Agricultural Improvement &
Power District Electric System Revenue | | | |
| Series A 5.00% 1/1/47 | | 1,500,000 | 1,637,865 |
| Series A 5.00% 1/1/50 | | 1,000,000 | 1,087,930 |
| Series B 5.25% 1/1/53 | | 1,000,000 | 1,113,460 |
| | 5,728,116 |
| Healthcare Revenue Bonds — 23.50% |
Arizona Health Facilities Authority Hospital System
Revenue | | | |
(Scottsdale Lincoln Hospital Project)
5.00% 12/1/42 | | 500,000 | 502,245 |
| Arizona Industrial Development Authority Revenue | | | |
(Children's National Prince George's County Regional Medical Center)
Series A 4.00% 9/1/46 | | 2,250,000 | 2,099,790 |
(Great Lakes Senior Living Communities LLC Project First Tier)
Series A 5.00% 1/1/54 | | 145,000 | 89,611 |
(Great Lakes Senior Living Communities LLC Project Fourth Tier)
144A 7.75% 1/1/54 # | | 150,000 | 58,464 |
| (Great Lakes Senior Living Communities LLC Project Second Tier) | | | |
| Series B 5.00% 1/1/49 ‡ | | 55,000 | 25,193 |
| | | Principal
amount° | Value (US $) |
| Municipal Bonds (continued) |
| Healthcare Revenue Bonds (continued) |
| Arizona Industrial Development Authority Revenue | | | |
| (Great Lakes Senior Living Communities LLC Project Second Tier) |
| Series B 5.125% 1/1/54 ‡ | | 65,000 | $ 29,043 |
(Great Lakes Senior Living Communities LLC Project Third Tier)
Series C 144A 5.00% 1/1/49 #, ‡ | | 500,000 | 208,615 |
(Phoenix Children's Hospital)
Series A 4.00% 2/1/50 | | 1,000,000 | 957,900 |
Glendale, Arizona Industrial Development Authority
Revenue | | | |
| (Glencroft Retirement Community Project) | | | |
| 5.00% 11/15/36 | | 150,000 | 137,383 |
| 5.25% 11/15/46 | | 415,000 | 357,925 |
(Royal Oaks Inspirata Pointe Project)
Series A 5.00% 5/15/56 | | 1,000,000 | 957,050 |
(The Beatitudes Campus Project)
5.00% 11/15/45 | | 200,000 | 171,458 |
(The Terraces of Phoenix Project)
Series A 5.00% 7/1/48 | | 275,000 | 256,149 |
Maricopa County, Arizona Industrial Development
Authority Health Facilities Revenue | | | |
| (Banner Health) | | | |
| Series A 4.00% 1/1/41 | | 1,000,000 | 992,800 |
| Series F 4.00% 1/1/45 | | 1,750,000 | 1,715,420 |
Maricopa County, Arizona Industrial Development
Authority Hospital Revenue | | | |
(HonorHealth)
Series A 3.00% 9/1/51 | | 975,000 | 760,169 |
Maricopa County, Arizona Industrial Development
Authority Senior Living Facility Revenue | | | |
(Christian Care Surprise Project)
144A 6.00% 1/1/48 # | | 405,000 | 313,984 |
Puerto Rico Industrial Tourist Educational Medical &
Environmental Control Facilities Financing Authority Revenue | | | |
| (Hospital Auxilio Mutuo Obligated Group Project) | | | |
| 4.00% 7/1/39 | | 325,000 | 310,070 |
| 5.00% 7/1/30 | | 105,000 | 114,787 |
Tempe, Arizona Industrial Development Authority
Revenue | | | |
(Mirabella at ASU Project)
Series A 144A 6.125% 10/1/52 # | | 800,000 | 493,800 |
Schedules of investments
Delaware Tax-Free Arizona Fund
| | | Principal
amount° | Value (US $) |
| Municipal Bonds (continued) |
| Healthcare Revenue Bonds (continued) |
Yavapai County, Arizona Industrial Development Authority
Hospital Facility | | | |
| (Yavapai Regional Medical Center) | | | |
| 3.125% 8/1/43 | | 1,250,000 | $ 1,032,413 |
| 4.00% 8/1/43 | | 1,500,000 | 1,437,885 |
Yuma, Arizona Industrial Development Authority Hospital
Revenue | | | |
| (Yuma Regional Medical Center) | | | |
| Series A 5.00% 8/1/32 | | 295,000 | 295,156 |
| Series A 5.25% 8/1/32 | | 300,000 | 300,237 |
| | 13,617,547 |
| Industrial Development Revenue/Pollution ControlRevenue Bonds — 7.00% |
| Arizona Industrial Development Authority Revenue | | | |
| (Legacy Cares, Inc. Project) | | | |
| Series A 144A 6.00% 7/1/51 #, ‡ | | 450,000 | 18,000 |
| Series A 144A 7.75% 7/1/50 #, ‡ | | 285,000 | 11,400 |
Chandler, Arizona Industrial Development Authority
Revenue | | | |
(Intel Corporation Project)
Second Subseries 5.00% 9/1/52 (AMT) • | | 750,000 | 772,290 |
Children's Trust Fund Revenue, Commonwealth of Puerto
Rico | | | |
(Tobacco Settlement Asset-Backed)
Series A 8.21% 5/15/57 ^ | | 15,000,000 | 1,032,300 |
| Salt Verde, Arizona Financial Senior Gas Revenue | | | |
| 5.00% 12/1/37 | | 2,000,000 | 2,218,140 |
| | 4,052,130 |
| Lease Revenue Bonds — 2.61% |
Arizona Game & Fish Department & Community
Beneficial Interest Certificates | | | |
(Administration Building Project)
5.00% 7/1/32 | | 1,000,000 | 1,001,290 |
Tucson and Pima County, Arizona Industrial Development
Authority Revenue | | | |
| Series A 4.70% 7/1/43 | | 500,000 | 508,940 |
| | 1,510,230 |
| Local General Obligation Bonds — 3.98% |
| City of Goodyear, Arizona | | | |
| 3.00% 7/1/39 | | 750,000 | 676,455 |
| | | Principal
amount° | Value (US $) |
| Municipal Bonds (continued) |
| Local General Obligation Bonds (continued) |
Maricopa County, Arizona Unified School District No.
95 Queen Creek | | | |
(School Improvement Project)
4.00% 7/1/35 | | 500,000 | $ 514,985 |
Phoenix, Arizona Various Purpose General Obligation
Bond | | | |
| Series A 5.00% 7/1/45 | | 1,000,000 | 1,116,670 |
| | 2,308,110 |
| Special Tax Revenue Bonds — 15.95% |
| City of Bullhead, Arizona Excise Taxes Revenue | | | |
| 2.55% 7/1/46 | | 1,000,000 | 720,620 |
| 4.00% 7/1/52 | | 1,035,000 | 994,501 |
| Commonwealth of Puerto Rico | | | |
| 1.724% 11/1/51 • | | 108,465 | 69,553 |
| 3.041% 11/1/43 • | | 1,282,001 | 812,468 |
| GDB Debt Recovery Authority of Puerto Rico Revenue | | | |
(Taxable)
7.50% 8/20/40 | | 1,734,210 | 1,690,855 |
Matching Fund Special Purpose Securitization, Virgin
Islands | | | |
| Series A 5.00% 10/1/32 | | 300,000 | 321,324 |
| Puerto Rico Sales Tax Financing Revenue | | | |
| (Capital Appreciation - Restructured) | | | |
| Series A-1 5.565% 7/1/51 ^ | | 3,179,000 | 780,158 |
| Series A-1 5.615% 7/1/46 ^ | | 1,180,000 | 397,884 |
| (Restructured) | | | |
| Series A-1 4.75% 7/1/53 | | 2,485,000 | 2,466,338 |
| Series A-2 4.329% 7/1/40 | | 1,000,000 | 988,990 |
| | 9,242,691 |
| Transportation Revenue Bonds — 5.94% |
City of Phoenix, Arizona Civic Improvement Airport
Revenue | | | |
| (Junior Lien) | | | |
| Series B 4.00% 7/1/37 (AMT) | | 2,250,000 | 2,249,932 |
| Series B 5.00% 7/1/49 (AMT) | | 400,000 | 411,316 |
(Senior Lien)
4.00% 7/1/48 (AMT) | | 500,000 | 478,825 |
Schedules of investments
Delaware Tax-Free Arizona Fund
| | | Principal
amount° | Value (US $) |
| Municipal Bonds (continued) |
| Transportation Revenue Bonds (continued) |
Puerto Rico Industrial, Tourist, Educational, Medical &
Environmental Control Facilities Financing Authority Revenue | | | |
(San Juan Cruise Terminal Project)
Series A-3 6.75% 1/1/46 (AMT) | | 250,000 | $ 299,585 |
| | 3,439,658 |
| Water & Sewer Revenue Bond — 1.71% |
| Goodyear, Arizona Water & Sewer Revenue | | | |
| Second Series 4.00% 7/1/45 (AGM) | | 1,000,000 | 992,050 |
| | 992,050 |
| Total Municipal Bonds (cost $59,383,054) | 57,137,613 |
|
|
|
| Short-Term Investments — 0.69% |
| Variable Rate Demand Note — 0.69%¤ |
| Arizona Industrial Development Authority Revenue | | | |
(Phoenix Children's Hospital) Series B 3.80% 2/1/48
(LOC - TD Bank, N.A.) | | 400,000 | 400,000 |
| Total Short-Term Investments (cost $400,000) | 400,000 |
Total Value of Securities—99.31%
(cost $59,783,054) | | | $57,537,613 |
| ° | Principal amount shown is stated in USD unless noted that the security is denominated in another currency. |
| # | Security exempt from registration under Rule 144A of the Securities Act of 1933, as amended. At August 31, 2024, the aggregate value of Rule 144A securities was $5,211,979, which represents 9.00% of the Fund’s net assets. See Note 10 in “Notes to financial statements.” |
| ‡ | Non-income producing security. Security is currently in default. |
| • | Variable rate investment. Rates reset periodically. Rate shown reflects the rate in effect at August 31, 2024. For securities based on a published reference rate and spread, the reference rate and spread are indicated in their descriptions. The reference rate descriptions (i.e. SOFR01M, SOFR03M, etc.) used in this report are identical for different securities, but the underlying reference rates may differ due to the timing of the reset period. Certain variable rate securities are not based on a published reference rate and spread but are determined by the issuer or agent and are based on current market conditions, or for mortgage-backed securities, are impacted by the individual mortgages which are paying off over time. These securities do not indicate a reference rate and spread in their descriptions. |
| ^ | Zero-coupon security. The rate shown is the effective yield at the time of purchase. |
| ¤ | Tax-exempt obligations that contain a floating or variable interest rate adjustment formula and an unconditional right of demand to receive payment of the unpaid principal balance plus accrued interest upon a short notice period (generally up to 30 days) prior to specified dates either from the issuer or by drawing on a bank letter of credit, a guarantee, or insurance issued with respect to such instrument. Each rate shown is as of August 31, 2024. |
| Summary of abbreviations: |
| AGM – Insured by Assured Guaranty Municipal Corporation |
| AMT – Subject to Alternative Minimum Tax |
| KIPP – Knowledge is Power Program |
| LLC – Limited Liability Corporation |
| LOC – Letter of Credit |
| N.A. – National Association |
| SOFR01M – Secured Overnight Financing Rate 1 Month |
| SOFR03M – Secured Overnight Financing Rate 3 Month |
| USD – US Dollar |
See accompanying notes, which are an integral part of the financial statements.
Schedules of investments
| Delaware Tax-Free California Fund | August 31, 2024 |
| | | Principal
amount° | Value (US $) |
| Municipal Bonds — 97.79% |
| Education Revenue Bonds — 18.26% |
California Community College Financing Authority
Student Housing Revenue | | | |
(Napa Valley College Project)
Series A 144A 5.75% 7/1/60 # | | 1,500,000 | $ 1,537,830 |
| California Educational Facilities Authority Revenue | | | |
(Loma Linda University)
Series A 5.00% 4/1/47 | | 1,700,000 | 1,735,003 |
| (Stanford University) | | | |
| Series U-7 5.00% 6/1/46 | | 2,985,000 | 3,714,534 |
| Series V-1 5.00% 5/1/49 | | 2,995,000 | 3,719,970 |
| Series V-2 2.25% 4/1/51 | | 1,130,000 | 738,557 |
| Series V-2 5.00% 4/1/51 | | 500,000 | 620,760 |
| California Enterprise Development Authority Revenue | | | |
(Curtis School Foundation Project)
4.00% 6/1/49 | | 1,000,000 | 962,890 |
(Heights Christian Schools Project)
Series A 144A 6.375% 6/1/63 # | | 1,480,000 | 1,502,052 |
| California Municipal Finance Authority Revenue | | | |
(Bella Mente Montessori Academy Project)
Series A 144A 5.00% 6/1/48 # | | 500,000 | 501,990 |
(Biola University)
5.00% 10/1/39 | | 1,000,000 | 1,034,350 |
| (California Baptist University) | | | |
| Series A 144A 5.00% 11/1/46 # | | 500,000 | 500,875 |
| Series A 144A 5.375% 11/1/40 # | | 1,000,000 | 1,010,510 |
| (CHF - Davis I, LLC - West Village Student Housing Project) | | | |
| 4.00% 5/15/48 (BAM) | | 300,000 | 290,376 |
| 5.00% 5/15/48 | | 1,000,000 | 1,027,540 |
(Emerson College)
Series B 5.00% 1/1/32 | | 1,000,000 | 1,041,160 |
(Julian Charter School Project)
Series A 144A 5.625% 3/1/45 # | | 850,000 | 820,445 |
| (Palmdale Aerospace Academy Project) | | | |
| Series A 144A 5.00% 7/1/46 # | | 670,000 | 668,184 |
| Series A 144A 5.00% 7/1/49 # | | 300,000 | 300,702 |
(Southwestern Law School)
4.00% 11/1/41 | | 575,000 | 549,367 |
(The Creative Center of Los Altos Project - Pinewood School and Oakwood School)
Series B 144A 4.50% 11/1/46 # | | 500,000 | 453,015 |
| | | Principal
amount° | Value (US $) |
| Municipal Bonds (continued) |
| Education Revenue Bonds (continued) |
| California Municipal Finance Authority Revenue | | | |
(Westside Neighborhood School Project)
144A 6.20% 6/15/54 # | | 1,650,000 | $ 1,779,228 |
| California School Finance Authority Revenue | | | |
| Series A 144A 6.00% 6/1/63 # | | 500,000 | 511,335 |
| (Aspire Public Schools-Obligated Group) | | | |
| 144A 5.00% 8/1/41 # | | 225,000 | 226,321 |
| Series A 144A 5.00% 8/1/45 # | | 715,000 | 718,060 |
(Camino Nuevo Charter Academy - Obligated Group)
Series A 144A 5.25% 6/1/53 # | | 1,000,000 | 1,022,480 |
(Classical Academies Project)
Series A 144A 5.00% 10/1/50 # | | 250,000 | 253,360 |
(Encore Education Obligated Group)
Series A 144A 5.00% 6/1/42 # | | 500,000 | 433,985 |
(Envision Education - Obligated Group)
Series A 144A 5.00% 6/1/64 # | | 1,000,000 | 1,002,490 |
(Escuela Popular Project)
144A 6.50% 7/1/50 # | | 90,000 | 92,247 |
(Granada Hills Charter Obligated Group)
144A 5.00% 7/1/49 # | | 1,250,000 | 1,263,550 |
| (Green Dot Public Schools California Projects) | | | |
| Series A 144A 5.00% 8/1/35 # | | 1,000,000 | 1,010,050 |
| Series A 144A 5.00% 8/1/48 # | | 250,000 | 254,292 |
(Grimmway Schools - Obligated Group)
Series A 144A 5.00% 7/1/36 # | | 500,000 | 507,200 |
(Harbor Springs Obligated Group)
Series A 144A 5.625% 7/1/63 # | | 700,000 | 730,331 |
(Hawking Steam Charter School Project)
Series A 144A 5.50% 7/1/62 # | | 775,000 | 798,746 |
(HTH Learning Project)
Series A 144A 5.00% 7/1/49 # | | 300,000 | 301,704 |
(ICEF - View Park Elementary & Middle Schools)
Series A 5.625% 10/1/34 | | 575,000 | 575,167 |
(John Adams Academies - Obligated Group)
Series A 144A 5.00% 7/1/52 # | | 1,000,000 | 977,870 |
(KIPP LA Projects)
Series A 144A 5.125% 7/1/44 # | | 1,000,000 | 1,000,440 |
| (Partnerships To Uplift Communities Project) | | | |
| 144A 5.25% 8/1/38 # | | 500,000 | 529,140 |
| 144A 5.50% 8/1/47 # | | 525,000 | 554,484 |
| (Stem Preparatory Schools - Obligated Group) | | | |
| Series A 144A 5.00% 6/1/43 # | | 280,000 | 288,753 |
Schedules of investments
Delaware Tax-Free California Fund
| | | Principal
amount° | Value (US $) |
| Municipal Bonds (continued) |
| Education Revenue Bonds (continued) |
| California School Finance Authority Revenue | | | |
| (Stem Preparatory Schools - Obligated Group) |
| Series A 144A 5.125% 6/1/53 # | | 500,000 | $ 511,435 |
| Series A 144A 5.375% 5/1/63 # | | 1,000,000 | 1,027,900 |
| California State University Systemwide Revenue | | | |
| Series A 3.00% 11/1/52 | | 6,650,000 | 5,330,108 |
| Regents of the University of California General Revenue | | | |
| Series BE 4.00% 5/15/50 | | 450,000 | 452,250 |
| Series BK 5.00% 5/15/52 | | 2,000,000 | 2,179,160 |
| Series BS 5.00% 5/15/43 | | 2,000,000 | 2,286,060 |
| Series BS 5.00% 5/15/44 | | 1,000,000 | 1,137,740 |
| Series BV 5.00% 5/15/45 | | 1,000,000 | 1,132,930 |
Regents of the University of California Limited Project
Revenue | | | |
| Series Q 3.00% 5/15/51 | | 1,000,000 | 817,320 |
| | 52,436,246 |
| Electric Revenue Bonds — 5.37% |
| Guam Power Authority Revenue | | | |
(Tax-Exempt Forward Delivery)
Series A 5.00% 10/1/41 | | 970,000 | 1,040,403 |
Los Angeles, California Department of Water & Power
Revenue | | | |
| (Power System) | | | |
| Series A 5.00% 7/1/42 | | 1,000,000 | 1,037,010 |
| Series C 5.00% 7/1/40 | | 1,350,000 | 1,562,908 |
| Series C 5.00% 7/1/42 | | 2,665,000 | 3,037,114 |
| Series C 5.00% 7/1/45 | | 2,500,000 | 2,817,200 |
| Series D 5.00% 7/1/26 | | 2,000,000 | 2,092,760 |
| Puerto Rico Electric Power Authority Revenue | | | |
| Series A 5.00% 7/1/42 ‡ | | 350,000 | 189,000 |
| Series A 5.05% 7/1/42 ‡ | | 70,000 | 37,800 |
| Series A 6.75% 7/1/36 ‡ | | 185,000 | 99,900 |
| Series AAA 5.25% 7/1/25 ‡ | | 40,000 | 21,600 |
| Series CCC 5.25% 7/1/27 ‡ | | 325,000 | 175,500 |
| Series TT 5.00% 7/1/32 ‡ | | 340,000 | 183,600 |
| Series TT 5.00% 7/1/37 ‡ | | 1,165,000 | 629,100 |
| Series WW 5.00% 7/1/28 ‡ | | 470,000 | 253,800 |
| Series WW 5.25% 7/1/33 ‡ | | 335,000 | 180,900 |
| Series WW 5.50% 7/1/38 ‡ | | 730,000 | 394,200 |
| Series XX 4.75% 7/1/26 ‡ | | 45,000 | 24,300 |
| Series XX 5.25% 7/1/40 ‡ | | 230,000 | 124,200 |
| | | Principal
amount° | Value (US $) |
| Municipal Bonds (continued) |
| Electric Revenue Bonds (continued) |
| Puerto Rico Electric Power Authority Revenue | | | |
| Series XX 5.75% 7/1/36 ‡ | | 150,000 | $ 81,000 |
| Series ZZ 4.75% 7/1/27 ‡ | | 35,000 | 18,900 |
| Series ZZ 5.25% 7/1/25 ‡ | | 55,000 | 29,562 |
| Southern California Public Power Authority Revenue | | | |
(Southern Transmission System Renewal Project)
5.00% 7/1/53 | | 1,250,000 | 1,392,213 |
| | 15,422,970 |
| Healthcare Revenue Bonds — 14.74% |
| California Health Facilities Financing Authority Revenue | | | |
| (Cedars-Sinai Health System) | | | |
| Series A 3.00% 8/15/51 | | 1,900,000 | 1,520,323 |
| Series A 3.00% 8/15/51 (BAM) | | 1,910,000 | 1,607,074 |
(Children's Hospital Los Angeles)
Series A 5.00% 8/15/47 | | 500,000 | 511,420 |
| (Children's Hospital of Orange County) | | | |
| Series A 2.125% 11/1/41 | | 2,500,000 | 1,775,550 |
| Series A 5.00% 11/1/49 | | 1,610,000 | 1,779,630 |
| (CommonSpirit Health) | | | |
| Series A 4.00% 4/1/45 | | 1,280,000 | 1,229,478 |
| Series A 4.00% 4/1/49 | | 1,705,000 | 1,635,419 |
| Series A 5.00% 12/1/44 | | 550,000 | 611,110 |
| Series A 5.00% 12/1/54 | | 2,500,000 | 2,697,225 |
(Episcopal Communities & Services)
Series B 5.25% 11/15/58 | | 2,500,000 | 2,641,125 |
| (Kaiser Permanente) | | | |
| Subordinate Series A-2 4.00% 11/1/44 | | 1,150,000 | 1,137,327 |
| Subseries A-2 5.00% 11/1/47 | | 3,400,000 | 4,126,478 |
(Lucile Salter Packard Children's Hospital At Stanford)
Series A 4.00% 5/15/51 | | 1,120,000 | 1,106,661 |
California Infrastructure & Economic Development Bank
Revenue | | | |
(Adventist Health Energy Projects)
Series A 5.25% 7/1/49 | | 2,350,000 | 2,551,771 |
| California Municipal Finance Authority Revenue | | | |
(Community Medical Centers)
Series A 5.00% 2/1/47 | | 1,200,000 | 1,210,452 |
| (Eisenhower Medical Center) | | | |
| Series B 5.00% 7/1/37 | | 250,000 | 256,610 |
| Series B 5.00% 7/1/42 | | 250,000 | 253,720 |
Schedules of investments
Delaware Tax-Free California Fund
| | | Principal
amount° | Value (US $) |
| Municipal Bonds (continued) |
| Healthcare Revenue Bonds (continued) |
| California Municipal Finance Authority Revenue | | | |
(Goodwill Industry of Sacramento Valley & Northern Nevada Project)
5.00% 1/1/35 | | 635,000 | $ 560,642 |
(Northbay Healthcare Group)
Series A 5.25% 11/1/47 | | 500,000 | 500,185 |
(Palomar Health Certificates)
Series A 5.25% 11/1/52 (AGM) | | 500,000 | 535,075 |
California Municipal Finance Authority Senior Living
Revenue | | | |
| (Mt. San Antonio Gardens Project) | | | |
| Series A 4.00% 11/15/52 | | 750,000 | 629,250 |
| Series A 4.00% 11/15/56 | | 1,075,000 | 883,027 |
| California Public Finance Authority Senior Living Revenue | | | |
| (Enso Village Project - Green Bonds) | | | |
| Series A 144A 5.00% 11/15/46 # | | 1,000,000 | 952,260 |
| Series A 144A 5.00% 11/15/51 # | | 500,000 | 463,565 |
| Series A 144A 5.00% 11/15/56 # | | 640,000 | 584,730 |
California Statewide Communities Development Authority
Revenue | | | |
(Adventist Health System/West)
Series A 4.00% 3/1/48 | | 1,000,000 | 910,810 |
(Emanate Health)
Series A 4.00% 4/1/45 | | 500,000 | 491,680 |
(Enloe Medical Center)
Series A 5.25% 8/15/52 (AGM) | | 2,000,000 | 2,165,380 |
(Front Porch Communities and Services)
4.00% 4/1/51 | | 1,000,000 | 923,900 |
(Huntington Memorial Hospital)
4.00% 7/1/48 | | 500,000 | 490,015 |
| (John Muir Health) | | | |
| Series A 5.00% 8/15/51 | | 1,500,000 | 1,525,230 |
| Series A 5.25% 12/1/54 | | 1,250,000 | 1,399,937 |
(Marin General Hospital - Green Bonds)
Series A 4.00% 8/1/45 | | 500,000 | 454,290 |
| Palomar Health, California Revenue | | | |
| 5.00% 11/1/47 (AGM) | | 500,000 | 513,810 |
Puerto Rico Industrial Tourist Educational Medical &
Environmental Control Facilities Financing Authority Revenue | | | |
| (Hospital Auxilio Mutuo Obligated Group Project) | | | |
| 5.00% 7/1/30 | | 445,000 | 486,478 |
| | | Principal
amount° | Value (US $) |
| Municipal Bonds (continued) |
| Healthcare Revenue Bonds (continued) |
Puerto Rico Industrial Tourist Educational Medical &
Environmental Control Facilities Financing Authority Revenue | | | |
| (Hospital Auxilio Mutuo Obligated Group Project) |
| 5.00% 7/1/32 | | 900,000 | $ 975,204 |
| Washington Township Health Care District Revenue | | | |
| Series A 3.75% 7/1/31 | | 255,000 | 246,136 |
| | 42,342,977 |
| Housing Revenue Bonds — 2.65% |
California CSCDA Community Improvement Authority
Essential Housing Revenue | | | |
(Jefferson - Anaheim)
Series A-2 144A 3.125% 8/1/56 # | | 1,500,000 | 1,161,915 |
(Parallel - Anaheim)
Series A 144A 4.00% 8/1/56 # | | 300,000 | 270,024 |
(Pasadena Portfolio)
Series A-2 144A 3.00% 12/1/56 # | | 3,510,000 | 2,487,713 |
| California Housing Finance Agency Revenue | | | |
| Series 2019-2 Class A 4.00% 3/20/33 | | 461,415 | 475,100 |
Independent Cities, California Finance Authority Mobile
Home Park Revenue | | | |
| (Pillar Ridge) | | | |
| Series A 5.25% 5/15/44 | | 1,000,000 | 1,000,900 |
| Series A 5.25% 5/15/49 | | 1,200,000 | 1,200,924 |
| Los Angeles, California Housing Authority Revenue | | | |
(Union Portfolio Project)
Series A 3.25% 6/1/35 | | 250,000 | 239,848 |
Santa Clara County, California Multifamily Housing
Authority Revenue | | | |
(RiverTown Apartments Project)
Series A 5.85% 8/1/31 (AMT) | | 760,000 | 761,512 |
| | 7,597,936 |
| Industrial Development Revenue/Pollution ControlRevenue Bonds — 11.05% |
California Community Choice Financing Authority
Revenue | | | |
| (Clean Energy Project) | | | |
| 5.00% 5/1/54 • | | 2,500,000 | 2,708,575 |
| Series A-1 5.00% 12/1/53 • | | 1,500,000 | 1,588,140 |
| Series C 5.25% 1/1/54 • | | 2,000,000 | 2,146,800 |
| Series D 5.50% 5/1/54 • | | 2,000,000 | 2,143,620 |
Schedules of investments
Delaware Tax-Free California Fund
| | | Principal
amount° | Value (US $) |
| Municipal Bonds (continued) |
| Industrial Development Revenue/Pollution ControlRevenue Bonds (continued) |
California County Tobacco Securitization Agency
Settlement Revenue | | | |
(Capital Appreciation - Stanislaus County Tobacco Funding Corporation)
Series D 9.019% 6/1/55 ^ | | 1,000,000 | $ 80,860 |
California Infrastructure & Economic Development Bank
Revenue | | | |
(Brightline West Passenger Rail Project)
Series A-4 144A 8.00% 1/1/50 (AMT) #, • | | 2,500,000 | 2,523,925 |
| California M-S-R Energy Authority Revenue | | | |
| Series C 6.50% 11/1/39 | | 1,905,000 | 2,471,509 |
| Series C 7.00% 11/1/34 | | 300,000 | 378,717 |
| California Pollution Control Financing Authority Revenue | | | |
(Calplant I Project)
144A 8.00% 7/1/39 (AMT) #, ‡ | | 300,000 | 4,050 |
(Poseidon Resources (ChannelSide) LP Desalination Project)
144A 5.00% 11/21/45 (AMT) # | | 940,000 | 941,645 |
(Waste Management Project)
Series A1 3.375% 7/1/25 (AMT) | | 300,000 | 299,007 |
Children's Trust Fund Revenue, Commonwealth of Puerto
Rico | | | |
(Tobacco Settlement Asset-Backed)
Series A 8.21% 5/15/57 ^ | | 47,000,000 | 3,234,540 |
Golden State, California Tobacco Securitization
Settlement Revenue | | | |
(Capital Appreciation)
Subordinate Series B-2 4.959% 6/1/66 ^ | | 9,450,000 | 1,103,477 |
(Tobacco Settlement Asset-Backed)
Series A-1 5.00% 6/1/51 | | 3,500,000 | 3,635,380 |
| Inland, California Empire Tobacco Securitization Revenue | | | |
| (Capital Appreciation Turbo Asset-Backed) | | | |
| Series E 144A 8.596% 6/1/57 #, ^ | | 8,500,000 | 689,520 |
| Series F 144A 9.491% 6/1/57 #, ^ | | 29,440,000 | 1,958,643 |
Long Beach, California Bond Finance Authority Natural
Gas Purchase Revenue | | | |
| Series A 5.50% 11/15/37 | | 165,000 | 193,487 |
| M-S-R Energy Authority, California Gas Revenue | | | |
| Series B 6.50% 11/1/39 | | 750,000 | 973,035 |
| Southern California Public Power Authority Revenue | | | |
(Natural Gas Project)
Series A 5.00% 11/1/33 | | 295,000 | 313,830 |
| | | Principal
amount° | Value (US $) |
| Municipal Bonds (continued) |
| Industrial Development Revenue/Pollution ControlRevenue Bonds (continued) |
Tobacco Securitization Authority of Southern California
Revenue | | | |
(Capital Appreciation - 2nd Subordinate Lien)
Series C 7.028% 6/1/46 ^ | | 16,770,000 | $ 3,445,900 |
(Capital Appreciation - 3rd Subordinate Lien)
Series D 7.487% 6/1/46 ^ | | 5,270,000 | 905,860 |
| | 31,740,520 |
| Lease Revenue Bonds — 5.45% |
| California Enterprise Development Authority Revenue | | | |
(Mead Valley Wellness Village Project)
Series A 5.50% 11/1/59 | | 2,500,000 | 2,866,000 |
| California State Public Works Board Revenue | | | |
| Series E 3.00% 10/1/36 (AGM) | | 1,525,000 | 1,447,408 |
(Green Bonds)
Series D 4.00% 5/1/47 | | 2,520,000 | 2,531,793 |
(May Lee State Office Complex)
Series A 5.00% 4/1/49 | | 1,000,000 | 1,111,450 |
| (Various Capital Projects) | | | |
| Series B 4.00% 5/1/39 | | 1,555,000 | 1,604,014 |
| Series B 4.00% 5/1/46 | | 1,000,000 | 1,006,340 |
| Garden Grove Public Financing Authority Revenue | | | |
| Series A 4.00% 4/1/54 (BAM) | | 1,500,000 | 1,469,550 |
| Irvine, California Facilities Financing Authority Revenue | | | |
(Gateway Preserve Land Acquisition Project)
4.25% 5/1/53 | | 2,500,000 | 2,504,625 |
San Diego County, California Certificates of Participation
Revenue | | | |
(County Public Health Laboratory and Capital Improvements)
5.00% 10/1/53 | | 1,000,000 | 1,099,950 |
| | 15,641,130 |
| Local General Obligation Bonds — 3.02% |
| Alameda, California Oakland Unified School District | | | |
| Series A 5.25% 8/1/48 (AGM) | | 1,500,000 | 1,688,160 |
Anaheim City, California School District Capital
Appreciation
Election of 2002 | | | |
| 4.58% 8/1/25 (NATL) ^ | | 1,000,000 | 973,750 |
Schedules of investments
Delaware Tax-Free California Fund
| | | Principal
amount° | Value (US $) |
| Municipal Bonds (continued) |
| Local General Obligation Bonds (continued) |
Bass Lake, California Joint Union Elementary School
District Election of 2006 | | | |
| 4.40% 8/1/45 (AGM) ^ | | 2,025,000 | $ 782,622 |
| Long Beach, California Community College District | | | |
| Series D 3.00% 8/1/38 | | 1,250,000 | 1,155,750 |
| Palomar Health, California | | | |
| Series B 4.00% 8/1/37 | | 1,000,000 | 979,110 |
San Bernardino and Los Angeles Counties, California
Victor Valley Community College District
Election of 2008 | | | |
| Series E 5.00% 8/1/51 | | 1,445,000 | 1,586,075 |
| San Diego County, California Unified School District | | | |
(Dedicated Unlimited Ad Valorem Property Tax Bonds)
Series G-3 4.00% 7/1/53 | | 1,500,000 | 1,493,895 |
| | 8,659,362 |
| Pre-Refunded/Escrowed to Maturity Bonds — 1.61% |
| California Health Facilities Financing Authority Revenue | | | |
(Sutter Health)
Series A 5.00% 8/15/43-25 § | | 1,000,000 | 1,024,410 |
| California School Finance Authority Revenue | | | |
(Aspire Public Schools-Obligated Group)
144A 5.00% 8/1/41-25 #, § | | 25,000 | 25,533 |
(Escuela Popular Project)
144A 6.50% 7/1/50-27 #, § | | 160,000 | 176,741 |
Golden State, California Tobacco Securitization
Settlement Revenue | | | |
(Enhanced Asset-Backed)
Series A 5.00% 6/1/45-25 § | | 1,000,000 | 1,018,990 |
| New Haven, California Unified School DistrictElection of 2014 | | | |
| Series A 5.00% 8/1/40-25 § | | 1,000,000 | 1,022,680 |
San Francisco Bay Area, California Subordinate Toll
Bridge Authority Revenue | | | |
| Series S-H 5.00% 4/1/44-29 § | | 1,000,000 | 1,118,070 |
San Francisco City & County, California Airports
Commission Revenue | | | |
| (San Francisco International Airport) | | | |
| Series A 4.00% 5/1/49-29 (AMT) § | | 20,000 | 20,643 |
| Series E 4.00% 5/1/50-29 (AMT) § | | 215,000 | 221,917 |
| | 4,628,984 |
| | | Principal
amount° | Value (US $) |
| Municipal Bonds (continued) |
| Special Tax Revenue Bonds — 11.60% |
City of Irvine, California Community Facilities District
Revenue | | | |
| (Great Park) | | | |
| 4.00% 9/1/58 (BAM) | | 750,000 | $ 753,765 |
| 5.25% 9/1/53 (BAM) | | 1,000,000 | 1,114,940 |
City of Ontario, California Community Facilities District
No. 28 Revenue | | | |
(New Haven Facilities - Area A)
5.00% 9/1/47 | | 230,000 | 234,749 |
City of Sacramento County, California Transient
Occupancy Tax Revenue | | | |
(Convention Center Complex)
Senior Series A 5.00% 6/1/38 | | 500,000 | 528,960 |
| Commonwealth of Puerto Rico Revenue | | | |
| 1.724% 11/1/51 • | | 522,868 | 335,290 |
| 3.029% 11/1/43 • | | 6,180,032 | 3,916,595 |
| GDB Debt Recovery Authority of Puerto Rico Revenue | | | |
(Taxable)
7.50% 8/20/40 | | 5,720,408 | 5,570,054 |
| Irvine, California Facilities Financing Authority Revenue | | | |
| (Irvine Great Park Infrastructure Project) | | | |
| Series A 4.00% 9/1/58 (BAM) | | 1,205,000 | 1,180,165 |
| Series A 5.00% 9/1/48 (BAM) | | 1,000,000 | 1,108,780 |
Jurupa Valley, California Community Facilities
District No. 36 Revenue | | | |
| (Eastvale Area) | | | |
| Series A 4.125% 9/1/42 | | 200,000 | 195,598 |
| Series A 4.25% 9/1/47 | | 300,000 | 290,241 |
Matching Fund Special Purpose Securitization, Virgin
Islands | | | |
| Series A 5.00% 10/1/32 | | 500,000 | 535,540 |
Orange County, California Community Facilities District
No. 2023-1 Revenue | | | |
(Rienda Phase 2B)
Series A 5.50% 8/15/53 | | 500,000 | 538,950 |
| Puerto Rico Sales Tax Financing Revenue | | | |
| (Restructured) | | | |
| Series A-1 4.75% 7/1/53 | | 2,780,000 | 2,759,122 |
| Series A-1 5.00% 7/1/58 | | 1,975,000 | 1,983,729 |
| Series A-1 5.319% 7/1/51 ^ | | 23,429,000 | 5,749,711 |
| Series A-1 5.634% 7/1/46 ^ | | 10,820,000 | 3,648,396 |
Schedules of investments
Delaware Tax-Free California Fund
| | | Principal
amount° | Value (US $) |
| Municipal Bonds (continued) |
| Special Tax Revenue Bonds (continued) |
| Puerto Rico Sales Tax Financing Revenue | | | |
(Restructured)
Series A-2 4.329% 7/1/40 | | 1,595,000 | $ 1,577,439 |
| Tejon Ranch Public Facilities Finance Authority Revenue | | | |
(Tejon Industrial Complex Public Improvements - East)
Series A 5.00% 9/1/54 | | 1,000,000 | 1,044,550 |
Tulare Redevelopment Agency Successor Agency
Revenue | | | |
| Series A 4.00% 8/1/40 (BAM) | | 250,000 | 250,270 |
| | 33,316,844 |
| State General Obligation Bonds — 9.63% |
| Commonwealth of Puerto Rico Revenue | | | |
| (Restructured) | | | |
| Series A-1 4.00% 7/1/41 | | 1,901,743 | 1,807,531 |
| Series A-1 4.00% 7/1/46 | | 2,154,636 | 2,000,644 |
| State of California | | | |
| 5.00% 9/1/44 | | 1,500,000 | 1,695,135 |
| 5.25% 10/1/50 | | 2,500,000 | 2,809,200 |
| 5.50% 8/1/54 | | 2,250,000 | 2,604,870 |
| (Various Purpose) | | | |
| 3.00% 3/1/46 | | 3,000,000 | 2,503,290 |
| 4.00% 8/1/36 | | 2,000,000 | 2,016,040 |
| 4.00% 9/1/42 | | 1,750,000 | 1,789,462 |
| 5.00% 4/1/32 | | 1,420,000 | 1,638,737 |
| 5.00% 9/1/36 | | 2,695,000 | 3,133,234 |
| 5.00% 9/1/44 | | 2,000,000 | 2,260,180 |
| 5.25% 10/1/45 | | 3,000,000 | 3,409,710 |
| | 27,668,033 |
| Transportation Revenue Bonds — 12.16% |
Burbank-Glendale-Pasadena Airport Authority Brick
Campaign Revenue | | | |
(Senior)
Series B 4.375% 7/1/49 (AMT) (AGM) | | 1,250,000 | 1,255,112 |
California Municipal Finance Authority Senior Lien
Revenue | | | |
| (LINXS APM Project) | | | |
| Series A 4.00% 12/31/47 (AMT) | | 1,750,000 | 1,612,905 |
| Series A 5.00% 12/31/43 (AMT) | | 1,000,000 | 1,018,840 |
| City of Long Beach, California Marina Revenue | | | |
(Alamitos Bay Marina Project)
5.00% 5/15/45 | | 500,000 | 500,880 |
| | | Principal
amount° | Value (US $) |
| Municipal Bonds (continued) |
| Transportation Revenue Bonds (continued) |
City of Los Angeles, California Department of Airports
Revenue | | | |
| Series A 5.00% 5/15/33 (AMT) | | 1,545,000 | $ 1,688,175 |
| Series B 5.00% 5/15/46 (AMT) | | 300,000 | 303,534 |
| Series B 5.00% 5/15/48 | | 1,650,000 | 1,798,137 |
| Series D 4.00% 5/15/41 (AMT) | | 3,000,000 | 2,945,460 |
| Series D 5.00% 5/15/36 (AMT) | | 1,000,000 | 1,008,890 |
| Series F 4.00% 5/15/49 (AMT) | | 2,000,000 | 1,920,120 |
| Series H 4.00% 5/15/47 (AMT) | | 1,500,000 | 1,441,845 |
(Private Activity)
Series G 5.00% 5/15/33 (AMT) | | 220,000 | 241,732 |
Foothill-Eastern, California Transportation Corridor
Agency Toll Road Revenue | | | |
| Subseries B-1 3.95% 1/15/53 | | 300,000 | 279,444 |
| Subseries B-2 3.50% 1/15/53 (AGM) | | 500,000 | 448,895 |
(Junior Lien)
Series C 4.00% 1/15/43 | | 2,275,000 | 2,246,631 |
| (Senior Lien) | | | |
| Series A 4.00% 1/15/46 | | 1,000,000 | 973,260 |
| Series A 4.00% 1/15/46 (BAM) | | 1,000,000 | 1,002,730 |
| Port Authority of Guam Revenue | | | |
(Governmental)
Series A 5.00% 7/1/48 | | 375,000 | 381,037 |
| Sacramento County, California Airport System Revenue | | | |
| Series C 5.00% 7/1/39 (AMT) | | 500,000 | 516,920 |
| Subordinate Series B 5.00% 7/1/41 | | 500,000 | 510,545 |
San Diego County, California Redevelopment Agency
Revenue | | | |
(Centre City Redevelopment Project)
Series A 6.40% 9/1/25 | | 325,000 | 325,933 |
San Diego County, California Regional Airport Authority
Revenue | | | |
| Series B 4.00% 7/1/56 (AMT) (BAM) | | 690,000 | 658,508 |
| Series B 5.00% 7/1/37 (AMT) | | 2,000,000 | 2,055,040 |
(Private Activity)
Series B 5.00% 7/1/46 (AMT) | | 1,500,000 | 1,566,855 |
San Francisco City & County, California Airport
Commission Revenue | | | |
(San Francisco International Airport)
Series A 4.00% 5/1/49 (AMT) | | 2,005,000 | 1,922,033 |
Schedules of investments
Delaware Tax-Free California Fund
| | | Principal
amount° | Value (US $) |
| Municipal Bonds (continued) |
| Transportation Revenue Bonds (continued) |
San Francisco City & County, California Airports
Commission Revenue | | | |
| (San Francisco International Airport) | | | |
| Second Series A 5.00% 5/1/34 (AMT) | | 1,000,000 | $ 1,065,150 |
| Second Series A 5.25% 5/1/49 (AMT) | | 1,000,000 | 1,082,390 |
| Series A 5.00% 5/1/42 (AMT) | | 1,930,000 | 1,970,241 |
| Series E 4.00% 5/1/50 (AMT) | | 2,285,000 | 2,181,238 |
| | 34,922,480 |
| Water & Sewer Revenue Bonds — 2.25% |
Alameda and Contra Costa Counties, California
East Bay Municipal Utility District Water System Revenue | | | |
| Series A 5.00% 6/1/54 | | 2,000,000 | 2,222,120 |
| Arvin-Edison, California Water Storage District Revenue | | | |
| 4.00% 5/1/40 | | 315,000 | 318,695 |
California Pollution Control Financing Authority Water
Furnishing Revenue Refunding Bonds | | | |
(San Diego County Water Authority Desalination Project Pipeline)
144A 5.00% 11/21/45 # | | 250,000 | 258,625 |
| Guam Government Waterworks Authority Revenue | | | |
| Series A 5.00% 7/1/45 | | 1,000,000 | 1,075,450 |
| Series A 5.00% 1/1/46 | | 885,000 | 947,340 |
| San Jose Financing Authority Revenue | | | |
(Green Bonds)
5.00% 11/1/47 | | 1,470,000 | 1,646,973 |
| | 6,469,203 |
| Total Municipal Bonds (cost $278,146,715) | 280,846,685 |
|
|
|
| Short-Term Investments — 1.94% |
| Variable Rate Demand Notes — 1.94%¤ |
California Statewide Communities Development Authority
Revenue | | | |
(Rady Children's Hospital - San Diego) Series B 3.50% 8/15/47
(LOC - Wells Fargo Bank, N.A.) | | 400,000 | 400,000 |
Los Angeles, California Department of Water & Power
Revenue | | | |
| 3.65% 7/1/51 (SPA - TD Bank N.A.) | | 160,000 | 160,000 |
Subordinate Series A-2 3.65% 7/1/45
(SPA - Barclays Bank) | | 100,000 | 100,000 |
| | | Principal
amount° | Value (US $) |
| Short-Term Investments (continued) |
| Variable Rate Demand Notes¤ (continued) |
Los Angeles, California Department of Water & Power
Revenue | | | |
Subordinate Series B-3 3.65% 7/1/34
(SPA - Barclays Bank) | | 2,900,000 | $ 2,900,000 |
(Power System) Series A-3 3.65% 7/1/35
(SPA - Bank of America, N.A.) | | 2,025,000 | 2,025,000 |
| Total Short-Term Investments (cost $5,585,000) | 5,585,000 |
Total Value of Securities—99.73%
(cost $283,731,715) | | | $286,431,685 |
| ° | Principal amount shown is stated in USD unless noted that the security is denominated in another currency. |
| # | Security exempt from registration under Rule 144A of the Securities Act of 1933, as amended. At August 31, 2024, the aggregate value of Rule 144A securities was $35,589,893, which represents 12.39% of the Fund’s net assets. See Note 10 in “Notes to financial statements.” |
| ‡ | Non-income producing security. Security is currently in default. |
| • | Variable rate investment. Rates reset periodically. Rate shown reflects the rate in effect at August 31, 2024. For securities based on a published reference rate and spread, the reference rate and spread are indicated in their descriptions. The reference rate descriptions (i.e. SOFR01M, SOFR03M, etc.) used in this report are identical for different securities, but the underlying reference rates may differ due to the timing of the reset period. Certain variable rate securities are not based on a published reference rate and spread but are determined by the issuer or agent and are based on current market conditions, or for mortgage-backed securities, are impacted by the individual mortgages which are paying off over time. These securities do not indicate a reference rate and spread in their descriptions. |
| ^ | Zero-coupon security. The rate shown is the effective yield at the time of purchase. |
| § | Pre-refunded bonds. Municipal bonds that are generally backed or secured by US Treasury bonds. For pre-refunded bonds, the stated maturity is followed by the year in which the bond will be pre-refunded. See Note 10 in “Notes to financial statements.” |
| ¤ | Tax-exempt obligations that contain a floating or variable interest rate adjustment formula and an unconditional right of demand to receive payment of the unpaid principal balance plus accrued interest upon a short notice period (generally up to 30 days) prior to specified dates either from the issuer or by drawing on a bank letter of credit, a guarantee, or insurance issued with respect to such instrument. Each rate shown is as of August 31, 2024. |
| Summary of abbreviations: |
| AGM – Insured by Assured Guaranty Municipal Corporation |
| AMT – Subject to Alternative Minimum Tax |
Schedules of investments
Delaware Tax-Free California Fund
| Summary of abbreviations: (continued) |
| BAM – Insured by Build America Mutual Assurance |
| CHF – Collegiate Housing Foundation |
| CSCDA – California Statewide Communities Development Authority |
| ICEF – Inner City Education Foundation |
| KIPP – Knowledge is Power Program |
| LLC – Limited Liability Corporation |
| LOC – Letter of Credit |
| N.A. – National Association |
| NATL – Insured by National Public Finance Guarantee Corporation |
| SOFR01M – Secured Overnight Financing Rate 1 Month |
| SOFR03M – Secured Overnight Financing Rate 3 Month |
| SPA – Stand-by Purchase Agreement |
| USD – US Dollar |
See accompanying notes, which are an integral part of the financial statements.
Schedules of investments
| Delaware Tax-Free Colorado Fund | August 31, 2024 |
| | | Principal
amount° | Value (US $) |
| Municipal Bonds — 98.77% |
| Education Revenue Bonds — 14.10% |
Board of Governors of the Colorado State University
System Enterprise Revenue | | | |
| Series A 5.00% 3/1/43 | | 3,990,000 | $ 4,614,874 |
| Series C 4.00% 3/1/47 | | 1,065,000 | 1,041,133 |
Colorado Educational & Cultural Facilities Authority
Revenue | | | |
(Alexander Dawson School - Nevada Project)
5.00% 5/15/29 | | 1,230,000 | 1,261,353 |
(Ascent Classical Academy Charter Schools)
Series A 144A 5.80% 4/1/54 # | | 1,000,000 | 1,045,970 |
| (Aspen View Academy Project) | | | |
| 4.00% 5/1/51 | | 500,000 | 446,860 |
| 4.00% 5/1/61 | | 750,000 | 645,420 |
| (Charter School - Aspen Ridge School Project) | | | |
| Series A 144A 5.00% 7/1/36 # | | 500,000 | 502,175 |
| Series A 144A 5.25% 7/1/46 # | | 1,350,000 | 1,353,361 |
(Charter School - Skyview Academy Project)
144A 5.50% 7/1/49 # | | 870,000 | 870,313 |
(Charter School Project)
5.00% 7/15/37 | | 1,150,000 | 1,151,414 |
(Community Leadership Academy, Inc. Second Campus Project)
7.45% 8/1/48 | | 1,000,000 | 1,001,680 |
| (Global Village Academy - Northglenn Project) | | | |
| 144A 5.00% 12/1/50 # | | 950,000 | 864,737 |
| 144A 5.00% 12/1/55 # | | 1,000,000 | 892,990 |
(Golden View Classical Academy Project)
4.00% 1/1/52 | | 1,115,000 | 938,953 |
(Liberty Common Charter School Project)
Series A 5.00% 1/15/39 | | 1,000,000 | 1,000,260 |
| (Littleton Preparatory Charter School Project) | | | |
| 5.00% 12/1/33 | | 420,000 | 420,227 |
| 5.00% 12/1/42 | | 540,000 | 540,081 |
| (Loveland Classical Schools Project) | | | |
| 144A 5.00% 7/1/36 # | | 1,750,000 | 1,775,375 |
| 144A 5.00% 7/1/46 # | | 500,000 | 502,040 |
(Pinnacle Charter School Project)
5.00% 6/1/26 | | 475,000 | 478,753 |
| (Science Technology Engineering and Math School Project) | | | |
| 5.00% 11/1/44 | | 890,000 | 890,187 |
| 5.00% 11/1/54 | | 1,500,000 | 1,496,865 |
Schedules of investments
Delaware Tax-Free Colorado Fund
| | | Principal
amount° | Value (US $) |
| Municipal Bonds (continued) |
| Education Revenue Bonds (continued) |
Colorado Educational & Cultural Facilities Authority
Revenue | | | |
(Skyview Academy Project)
144A 5.375% 7/1/44 # | | 860,000 | $ 860,301 |
| (University of Denver Project) | | | |
| Series A 4.00% 3/1/35 | | 400,000 | 404,392 |
| Series A 4.00% 3/1/36 | | 550,000 | 555,236 |
(University of Lab Charter School)
144A 5.00% 12/15/45 # | | 500,000 | 501,190 |
(Vail Mountain School Project)
5.00% 5/1/31 | | 1,000,000 | 1,014,160 |
| Colorado School of Mines Revenue | | | |
| Series A 4.00% 12/1/49 | | 1,500,000 | 1,486,860 |
| Series A 5.00% 12/1/54 | | 1,000,000 | 1,077,210 |
| University of Colorado Revenue | | | |
(University Enterprise Refunding Revenue)
Series C-4 4.00% 6/1/51 | | 2,000,000 | 1,948,300 |
| | 31,582,670 |
| Electric Revenue Bonds — 6.50% |
| Colorado Springs Utilities System Refunding Revenue | | | |
| Series A 4.00% 11/15/50 | | 2,035,000 | 1,978,346 |
| Series B 5.25% 11/15/52 | | 2,000,000 | 2,188,400 |
| Colorado Springs Utilities System Revenue | | | |
| Series A 5.25% 11/15/54 | | 3,000,000 | 3,353,220 |
| Guam Power Authority Revenue | | | |
(Tax-Exempt Forward Delivery)
Series A 5.00% 10/1/35 | | 1,640,000 | 1,808,920 |
Loveland, Colorado Electric & Communications
Enterprise Revenue | | | |
| Series A 5.00% 12/1/44 | | 1,000,000 | 1,047,970 |
| Platte River, Colorado Power Authority Revenue | | | |
| Series JJ 5.00% 6/1/27 | | 1,000,000 | 1,040,650 |
| Puerto Rico Electric Power Authority Revenue | | | |
| Series A 5.05% 7/1/42 ‡ | | 170,000 | 91,800 |
| Series AAA 5.25% 7/1/25 ‡ | | 95,000 | 51,300 |
| Series CCC 5.25% 7/1/27 ‡ | | 705,000 | 380,700 |
| Series WW 5.00% 7/1/28 ‡ | | 660,000 | 356,400 |
| Series WW 5.25% 7/1/33 ‡ | | 210,000 | 113,400 |
| Series WW 5.50% 7/1/17 ‡ | | 460,000 | 247,250 |
| Series WW 5.50% 7/1/19 ‡ | | 360,000 | 193,500 |
| Series XX 4.75% 7/1/26 ‡ | | 105,000 | 56,700 |
| | | Principal
amount° | Value (US $) |
| Municipal Bonds (continued) |
| Electric Revenue Bonds (continued) |
| Puerto Rico Electric Power Authority Revenue | | | |
| Series XX 5.25% 7/1/40 ‡ | | 1,840,000 | $ 993,600 |
| Series XX 5.75% 7/1/36 ‡ | | 365,000 | 197,100 |
| Series ZZ 4.75% 7/1/27 ‡ | | 85,000 | 45,900 |
| Series ZZ 5.00% 7/1/19 ‡ | | 620,000 | 333,250 |
| Series ZZ 5.25% 7/1/25 ‡ | | 140,000 | 75,250 |
| | 14,553,656 |
| Healthcare Revenue Bonds — 23.13% |
| Colorado Health Facilities Authority Revenue | | | |
(Aberdeen Ridge)
Series A 5.00% 5/15/58 | | 1,500,000 | 990,885 |
| (AdventHealth Obligated Group) | | | |
| Series A 3.00% 11/15/51 | | 6,325,000 | 4,905,037 |
| Series A 4.00% 11/15/43 | | 2,290,000 | 2,276,145 |
| Series A 4.00% 11/15/50 | | 6,015,000 | 5,810,310 |
| (American Baptist) | | | |
| 7.625% 8/1/33 | | 150,000 | 113,705 |
| 8.00% 8/1/43 | | 1,000,000 | 663,750 |
(Bethesda Project)
Series A-1 5.00% 9/15/48 | | 2,250,000 | 2,179,597 |
(Cappella of Grand Junction Project)
144A 5.00% 12/1/54 # | | 2,220,000 | 1,542,079 |
| (CommonSpirit Health) | | | |
| Series A 5.25% 12/1/54 | | 2,000,000 | 2,201,160 |
| Series A-1 4.00% 8/1/37 | | 1,130,000 | 1,139,526 |
| Series A-1 4.00% 8/1/38 | | 120,000 | 120,514 |
| Series A-2 4.00% 8/1/49 (BAM) | | 3,670,000 | 3,589,774 |
| Series A-2 5.00% 8/1/37 | | 1,500,000 | 1,591,440 |
(Covenant Living Communities and Services)
Series A 4.00% 12/1/40 | | 1,250,000 | 1,217,187 |
(Covenant Retirement Communities, Inc.)
Series A 5.00% 12/1/35 | | 1,000,000 | 1,003,500 |
(Craig Hospital Project)
Series A 5.00% 12/1/47 | | 1,830,000 | 1,946,113 |
(Frasier Project)
Series A 4.00% 5/15/48 | | 1,000,000 | 873,310 |
| (Intermountain Health) | | | |
| Series A 5.00% 5/15/54 | | 1,000,000 | 1,057,950 |
| Series E 3.80% 5/15/64 | | 2,850,000 | 2,850,000 |
| (Intermountain Healthcare) | | | |
| Series A 5.00% 5/15/47 | | 1,380,000 | 1,483,459 |
Schedules of investments
Delaware Tax-Free Colorado Fund
| | | Principal
amount° | Value (US $) |
| Municipal Bonds (continued) |
| Healthcare Revenue Bonds (continued) |
| Colorado Health Facilities Authority Revenue | | | |
| (Intermountain Healthcare) |
| Series A 5.00% 5/15/52 | | 1,195,000 | $ 1,270,596 |
(Mental Health Center Denver Project)
Series A 5.75% 2/1/44 | | 2,000,000 | 2,001,380 |
(National Jewish Health Project)
5.00% 1/1/27 | | 300,000 | 300,054 |
(Sanford)
Series A 5.00% 11/1/44 | | 3,410,000 | 3,581,659 |
(SCL Health System)
Series A 4.00% 1/1/37 | | 3,470,000 | 3,522,501 |
(Sunny Vista Living Center)
Series A 144A 6.25% 12/1/50 # | | 935,000 | 628,993 |
(Vail Valley Medical Center Project)
5.00% 1/15/35 | | 1,000,000 | 1,020,500 |
(Valley View Hospital Association Project)
Series A 4.00% 5/15/35 | | 685,000 | 691,131 |
| Denver, Colorado Health & Hospital Authority Revenue | | | |
| Series A 4.00% 12/1/39 | | 1,000,000 | 931,040 |
| Series A 4.00% 12/1/40 | | 250,000 | 228,805 |
Puerto Rico Industrial Tourist Educational Medical &
Environmental Control Facilities Financing Authority Revenue | | | |
(Hospital Auxilio Mutuo Obligated Group Project)
4.00% 7/1/39 | | 75,000 | 71,555 |
| | 51,803,655 |
| Housing Revenue Bonds — 1.93% |
| Colorado Housing and Finance Authority Revenue | | | |
| Multi-Family | | | |
| Series A-1 4.80% 10/1/59 | | 1,000,000 | 1,013,790 |
| Series C-1 4.70% 10/1/59 | | 750,000 | 752,318 |
Denver City & County, Colorado Housing Authority
Revenue | | | |
(Flo Senior Apartments Project)
Series A 4.50% 7/1/41 | | 2,500,000 | 2,548,100 |
| | 4,314,208 |
| Industrial Development Revenue/Pollution ControlRevenue Bonds — 9.53% |
Children's Trust Fund, Commonwealth of Puerto Rico
Revenue | | | |
(Tobacco Settlement Asset-Backed)
Series A 8.21% 5/15/57 ^ | | 52,100,000 | 3,585,522 |
| | | Principal
amount° | Value (US $) |
| Municipal Bonds (continued) |
| Industrial Development Revenue/Pollution ControlRevenue Bonds (continued) |
City & County of Denver, Colorado Special Facilities
Airport Revenue | | | |
(United Airlines, Inc. Project)
5.00% 10/1/32 (AMT) | | 215,000 | $ 215,036 |
| Colorado Regional Transportation District Revenue | | | |
| (Denver Transit Partners Eagle P3 Project) | | | |
| Series A 3.00% 7/15/37 | | 1,025,000 | 926,416 |
| Series A 4.00% 7/15/34 | | 1,100,000 | 1,128,545 |
| Series A 4.00% 7/15/38 | | 700,000 | 707,357 |
| Series A 4.00% 7/15/39 | | 1,500,000 | 1,510,770 |
| Series A 4.00% 7/15/40 | | 2,815,000 | 2,813,424 |
| Series A 5.00% 7/15/32 | | 1,045,000 | 1,141,871 |
| Colorado Springs Utilities System Revenue | | | |
| Series A 5.00% 11/15/49 | | 1,200,000 | 1,321,524 |
Denver, Colorado Convention Center Hotel Authority
Revenue | | | |
| 5.00% 12/1/40 | | 2,660,000 | 2,697,293 |
Public Authority for Colorado Energy Natural Gas
Revenue | | | |
| 6.50% 11/15/38 | | 4,250,000 | 5,288,870 |
| | 21,336,628 |
| Lease Revenue Bonds — 2.24% |
Colorado Higher Education Lease Purchase Financing
Program Revenue | | | |
| 4.00% 9/1/41 | | 1,000,000 | 1,003,520 |
Colorado State Department of Transportation Certificates
of Participation Revenue | | | |
| 5.00% 6/15/34 | | 660,000 | 681,107 |
| 5.00% 6/15/36 | | 1,055,000 | 1,085,595 |
| Denver, Colorado Health & Hospital Authority Revenue | | | |
(550 Acoma, Inc.)
4.00% 12/1/38 | | 750,000 | 705,570 |
| State of Colorado Revenue | | | |
| 4.00% 3/15/37 | | 1,500,000 | 1,532,430 |
| | 5,008,222 |
| Local General Obligation Bonds — 7.67% |
Adams & Weld Counties, Colorado School District No.
27J Brighton | | | |
| 4.00% 12/1/46 | | 1,370,000 | 1,368,465 |
Schedules of investments
Delaware Tax-Free Colorado Fund
| | | Principal
amount° | Value (US $) |
| Municipal Bonds (continued) |
| Local General Obligation Bonds (continued) |
| Beacon Point, Colorado Metropolitan District | | | |
| 5.00% 12/1/30 (AGM) | | 1,130,000 | $ 1,157,154 |
| Denver City & County, Colorado School District No. 1 | | | |
| Series A 5.00% 12/1/45 | | 5,000,000 | 5,454,800 |
| El Paso County School District No. 2 Harrison | | | |
| 5.00% 12/1/38 | | 1,000,000 | 1,069,020 |
| Grand River, Colorado Hospital District | | | |
| 5.25% 12/1/35 (AGM) | | 1,000,000 | 1,055,100 |
| Jefferson County, Colorado School District No. R-1 | | | |
| 5.25% 12/15/24 | | 1,250,000 | 1,257,525 |
| Prairie Center Metropolitan District No. 3 | | | |
| Series B 5.875% 12/15/46 | | 1,000,000 | 1,080,350 |
| Verve, Colorado Metropolitan District No. 1 | | | |
| 5.00% 12/1/51 | | 2,000,000 | 1,604,320 |
| Weld County, Colorado School District No. Re-1 | | | |
| 5.00% 12/15/31 (AGM) | | 1,000,000 | 1,052,390 |
| Weld County, Colorado School District No. Re-3J | | | |
| 5.00% 12/15/34 (BAM) | | 2,000,000 | 2,089,380 |
| | 17,188,504 |
| Pre-Refunded Bonds — 2.34% |
Colorado Educational & Cultural Facilities Authority
Revenue | | | |
(Atlas Preparatory Charter School)
144A 5.25% 4/1/45-25 #, § | | 1,300,000 | 1,314,924 |
| Colorado Health Facilities Authority Revenue | | | |
(NCMC Project)
4.00% 5/15/32-26 § | | 2,000,000 | 2,038,460 |
(Parkview Medical Center, Inc. Project)
Series A 4.00% 9/1/50-30 § | | 1,750,000 | 1,879,780 |
| | 5,233,164 |
| Special Tax Revenue Bonds — 18.55% |
Arapahoe County, Riverpark Metropolitan District
Revenue | | | |
| 6.00% 12/1/42 | | 745,000 | 764,191 |
| 6.375% 12/1/54 | | 1,250,000 | 1,289,563 |
City & County of Denver, Colorado Dedicated Excise Tax
Revenue | | | |
| Series A 4.00% 8/1/51 | | 1,000,000 | 969,100 |
| | | Principal
amount° | Value (US $) |
| Municipal Bonds (continued) |
| Special Tax Revenue Bonds (continued) |
Colorado Regional Transportation District Sales Tax
Revenue | | | |
| (FasTracks Project) | | | |
| Series A 5.00% 11/1/30 | | 670,000 | $ 700,900 |
| Series A 5.00% 11/1/31 | | 1,495,000 | 1,563,307 |
| Commonwealth of Puerto Rico Revenue | | | |
| 1.724% 11/1/51 • | | 404,681 | 259,501 |
| 3.029% 11/1/43 • | | 4,783,111 | 3,031,297 |
(Subordinate)
3.799% 11/1/51 • | | 1,306,663 | 687,631 |
| Fountain Urban Renewal Authority, Colorado Revenue | | | |
(South Academy Highlands Project)
Series A 5.50% 11/1/44 | | 1,375,000 | 1,316,177 |
| GDB Debt Recovery Authority of Puerto Rico Revenue | | | |
(Taxable)
7.50% 8/20/40 | | 6,685,397 | 6,518,262 |
Lincoln Park Metropolitan District Douglas County,
Colorado Revenue | | | |
| 5.00% 12/1/46 (AGM) | | 1,000,000 | 1,037,370 |
Matching Fund Special Purpose Securitization, Virgin
Islands Revenue | | | |
| Series A 5.00% 10/1/32 | | 450,000 | 481,986 |
| Plaza Metropolitan District No. 1, Colorado Revenue | | | |
| 144A 5.00% 12/1/40 # | | 1,265,000 | 1,265,000 |
Prairie Center Metropolitan District No. 3, Colorado
Revenue | | | |
| Series A 144A 5.00% 12/15/41 # | | 1,000,000 | 1,007,230 |
| Puerto Rico Sales Tax Financing Revenue | | | |
| (Capital Appreciation - Restructured) | | | |
| Series A-1 5.696% 7/1/46 ^ | | 10,000,000 | 3,371,900 |
| Series A-1 6.142% 7/1/51 ^ | | 17,857,000 | 4,382,287 |
| (Restructured) | | | |
| Series A-1 4.75% 7/1/53 | | 3,986,000 | 3,956,065 |
| Series A-1 5.00% 7/1/58 | | 2,910,000 | 2,922,862 |
| Series A-2 4.536% 7/1/53 | | 3,000,000 | 2,877,750 |
Southlands Metropolitan District No. 1, Colorado
Revenue | | | |
| Series A-1 5.00% 12/1/37 | | 500,000 | 505,065 |
| Series A-1 5.00% 12/1/47 | | 300,000 | 300,534 |
| Sterling Ranch Community Authority Board Revenue | | | |
(Senior)
Series A 6.50% 12/1/54 | | 1,000,000 | 1,046,030 |
Schedules of investments
Delaware Tax-Free Colorado Fund
| | | Principal
amount° | Value (US $) |
| Municipal Bonds (continued) |
| Special Tax Revenue Bonds (continued) |
| Thornton, Colorado Development Authority Revenue | | | |
| (East 144th Avenue & I-25 Project) | | | |
| Series B 5.00% 12/1/35 | | 485,000 | $ 486,935 |
| Series B 5.00% 12/1/36 | | 810,000 | 813,208 |
| | 41,554,151 |
| State General Obligation Bonds — 0.98% |
| Commonwealth of Puerto Rico Revenue | | | |
| (Restructured) | | | |
| Series A-1 4.00% 7/1/41 | | 1,422,839 | 1,352,352 |
| Series A-1 4.00% 7/1/46 | | 900,000 | 835,677 |
| | 2,188,029 |
| Transportation Revenue Bonds — 7.89% |
City & County of Denver, Colorado Airport System
Revenue | | | |
| Series A 4.00% 11/15/41 (AMT) | | 710,000 | 696,822 |
| Series A 4.00% 12/1/43 (AMT) | | 4,445,000 | 4,261,866 |
| Series A 4.00% 12/1/48 (AMT) | | 400,000 | 374,288 |
| Series A 5.00% 11/15/30 (AMT) | | 1,500,000 | 1,571,340 |
| Series A 5.00% 11/15/47 (AMT) | | 1,000,000 | 1,049,430 |
| Series A 5.25% 12/1/43 (AMT) | | 2,000,000 | 2,086,500 |
| Colorado Bridge & Tunnel Enterprise Revenue | | | |
(Senior Infrastructure)
Series A 5.25% 12/1/49 (AGM) | | 2,000,000 | 2,230,980 |
Colorado High Performance Transportation Enterprise
Revenue | | | |
(C-470 Express Lanes)
5.00% 12/31/56 | | 3,250,000 | 3,251,657 |
(U.S. 36 & I-25 Managed Lanes)
5.75% 1/1/44 (AMT) | | 2,140,000 | 2,145,008 |
| | 17,667,891 |
| Water & Sewer Revenue Bonds — 3.91% |
Arapahoe County of Colorado Water & Wastewater
Authority Revenue | | | |
| 4.00% 12/1/36 | | 3,000,000 | 3,070,140 |
Douglas County, Colorado Centennial Water & Sanitation
District Revenue | | | |
| 4.00% 12/1/38 | | 500,000 | 510,600 |
| Guam Government Waterworks Authority Revenue | | | |
| Series A 5.00% 7/1/44 | | 885,000 | 955,066 |
| | | Principal
amount° | Value (US $) |
| Municipal Bonds (continued) |
| Water & Sewer Revenue Bonds (continued) |
| Johnstown, Colorado Wastewater Revenue | | | |
| 4.00% 12/1/51 (AGM) | | 2,875,000 | $ 2,746,775 |
Metro Wastewater Reclamation District, Colorado
Revenue | | | |
| Series A 3.00% 4/1/38 | | 1,620,000 | 1,481,279 |
| | 8,763,860 |
| Total Municipal Bonds (cost $223,389,272) | 221,194,638 |
| | | Number of
shares | |
| Short-Term Investments — 0.85% |
| Money Market Mutual Funds — 0.05% |
| Dreyfus Tax Exempt Cash Management - Institutional Shares (seven-day effective yield 2.87%) | | 98,262 | 98,262 |
| | 98,262 |
| | | Principal
amount° | |
| Variable Rate Demand Note — 0.80%¤ |
Colorado Educational & Cultural Facilities Authority
Revenue | | | |
| (National Jewish Federation Bond Program) Series F-2 3.80% 7/1/41 (LOC - TD, Bank N.A.) | | 1,800,000 | 1,800,000 |
| | 1,800,000 |
| Total Short-Term Investments (cost $1,898,262) | 1,898,262 |
Total Value of Securities—99.62%
(cost $225,287,534) | | | $223,092,900 |
| ° | Principal amount shown is stated in USD unless noted that the security is denominated in another currency. |
| # | Security exempt from registration under Rule 144A of the Securities Act of 1933, as amended. At August 31, 2024, the aggregate value of Rule 144A securities was $14,926,678, which represents 6.67% of the Fund’s net assets. See Note 10 in “Notes to financial statements.” |
| ‡ | Non-income producing security. Security is currently in default. |
| ^ | Zero-coupon security. The rate shown is the effective yield at the time of purchase. |
| § | Pre-refunded bonds. Municipal bonds that are generally backed or secured by US Treasury bonds. For pre-refunded bonds, the stated maturity is followed by the year in which the bond will be pre-refunded. See Note 10 in “Notes to financial statements.” |
Schedules of investments
Delaware Tax-Free Colorado Fund
| • | Variable rate investment. Rates reset periodically. Rate shown reflects the rate in effect at August 31, 2024. For securities based on a published reference rate and spread, the reference rate and spread are indicated in their descriptions. The reference rate descriptions (i.e. SOFR01M, SOFR03M, etc.) used in this report are identical for different securities, but the underlying reference rates may differ due to the timing of the reset period. Certain variable rate securities are not based on a published reference rate and spread but are determined by the issuer or agent and are based on current market conditions, or for mortgage-backed securities, are impacted by the individual mortgages which are paying off over time. These securities do not indicate a reference rate and spread in their descriptions. |
| ¤ | Tax-exempt obligations that contain a floating or variable interest rate adjustment formula and an unconditional right of demand to receive payment of the unpaid principal balance plus accrued interest upon a short notice period (generally up to 30 days) prior to specified dates either from the issuer or by drawing on a bank letter of credit, a guarantee, or insurance issued with respect to such instrument. Each rate shown is as of August 31, 2024. |
| Summary of abbreviations: |
| AGM – Insured by Assured Guaranty Municipal Corporation |
| AMT – Subject to Alternative Minimum Tax |
| BAM – Insured by Build America Mutual Assurance |
| LOC – Letter of Credit |
| N.A. – National Association |
| SOFR01M – Secured Overnight Financing Rate 1 Month |
| SOFR03M – Secured Overnight Financing Rate 3 Month |
| USD – US Dollar |
See accompanying notes, which are an integral part of the financial statements.
Schedules of investments
| Delaware Tax-Free Idaho Fund | August 31, 2024 |
| | | Principal
amount° | Value (US $) |
| Municipal Bonds — 99.31% |
| Education Revenue Bonds — 22.67% |
| Boise, Idaho State University Revenue | | | |
| (General Project) | | | |
| Series A 5.00% 4/1/47 | | 500,000 | $ 511,835 |
| Series A 5.00% 4/1/48 | | 435,000 | 448,359 |
| Idaho Housing & Finance Association Revenue | | | |
| Series A 5.00% 6/1/50 | | 1,275,000 | 1,275,689 |
(Alturas International Academy Project)
4.00% 5/1/52 | | 1,500,000 | 1,326,885 |
| (Anser of Idaho Project) | | | |
| Series A 2.25% 5/1/51 | | 1,165,000 | 691,928 |
| Series A 3.00% 5/1/41 | | 3,150,000 | 2,589,867 |
| Series A 4.00% 5/1/56 | | 1,585,000 | 1,365,065 |
| (Compass Public Charter School Project) | | | |
| Series A 144A 5.00% 7/1/54 # | | 1,000,000 | 942,370 |
| Series A 144A 6.00% 7/1/39 # | | 370,000 | 384,149 |
| Series A 144A 6.00% 7/1/49 # | | 595,000 | 611,071 |
| Series A 144A 6.00% 7/1/54 # | | 570,000 | 583,805 |
(Gem Prep: Meridian Project)
Series A 4.00% 5/1/57 | | 1,000,000 | 863,810 |
| (Idaho Arts Charter School Project) | | | |
| Series A 4.00% 5/1/41 | | 330,000 | 315,579 |
| Series A 4.00% 5/1/50 | | 520,000 | 462,951 |
| Series A 4.00% 5/1/55 | | 305,000 | 265,005 |
| Series A 144A 5.00% 12/1/38 # | | 2,050,000 | 2,054,572 |
| Series A 144A 5.00% 12/1/46 # | | 1,000,000 | 968,570 |
(Meridian South Charter School Project)
144A 4.00% 5/1/46 # | | 1,000,000 | 791,020 |
| (North Star Charter School) | | | |
| Series A 6.75% 7/1/48 | | 529,151 | 541,004 |
| Series B 144A 4.88% 7/1/49 #, ^ | | 2,888,155 | 538,583 |
| (Sage International School of Boise Project) | | | |
| Series A 4.00% 5/1/50 | | 3,000,000 | 2,683,170 |
| Series A 4.00% 5/1/55 | | 1,100,000 | 960,531 |
(Victory Charter School Project)
Series A 144A 5.00% 7/1/39 # | | 1,500,000 | 1,502,340 |
(White Pine Charter School Project)
Series A 5.75% 5/1/58 | | 1,000,000 | 1,064,490 |
| Idaho State University General Revenue | | | |
| Series A 4.00% 4/1/37 | | 350,000 | 357,399 |
| Series A 4.50% 4/1/52 | | 1,750,000 | 1,787,188 |
| Series A 5.25% 4/1/42 | | 605,000 | 672,923 |
Schedules of investments
Delaware Tax-Free Idaho Fund
| | | Principal
amount° | Value (US $) |
| Municipal Bonds (continued) |
| Education Revenue Bonds (continued) |
| Idaho State University Revenue | | | |
| 3.00% 4/1/49 | | 1,700,000 | $ 1,361,989 |
| The Regents of The University of Idaho General Revenue | | | |
| Series A 4.00% 4/1/45 (BAM) | | 700,000 | 692,181 |
| Series A 5.00% 4/1/35 (AGM) | | 580,000 | 645,645 |
| University of Idaho Revenue | | | |
| Unrefunded Series A 5.00% 4/1/41 | | 340,000 | 356,439 |
| | 29,616,412 |
| Electric Revenue Bonds — 4.62% |
| Boise-Kuna, Idaho Irrigation District Revenue | | | |
(Idaho Arrowrock Hydroelectric Project)
5.00% 6/1/34 | | 2,000,000 | 2,009,060 |
| Idaho Energy Resources Authority Revenue | | | |
(Idaho Falls Power Project)
5.00% 9/15/39 | | 2,000,000 | 2,297,900 |
| Puerto Rico Electric Power Authority Revenue | | | |
| Series A 5.05% 7/1/42 ‡ | | 75,000 | 40,500 |
| Series AAA 5.25% 7/1/25 ‡ | | 45,000 | 24,300 |
| Series CCC 5.25% 7/1/27 ‡ | | 345,000 | 186,300 |
| Series WW 5.00% 7/1/28 ‡ | | 320,000 | 172,800 |
| Series WW 5.50% 7/1/38 ‡ | | 1,500,000 | 810,000 |
| Series XX 4.75% 7/1/26 ‡ | | 50,000 | 27,000 |
| Series XX 5.25% 7/1/40 ‡ | | 595,000 | 321,300 |
| Series XX 5.75% 7/1/36 ‡ | | 175,000 | 94,500 |
| Series ZZ 4.75% 7/1/27 ‡ | | 40,000 | 21,600 |
| Series ZZ 5.25% 7/1/25 ‡ | | 60,000 | 32,250 |
| | 6,037,510 |
| Healthcare Revenue Bonds — 12.93% |
| Idaho Health Facilities Authority Revenue | | | |
(Madison Memorial Hospital Project)
5.00% 9/1/37 | | 1,350,000 | 1,359,504 |
| (St. Luke's Health System Project) | | | |
| 3.00% 3/1/51 (BAM) | | 3,300,000 | 2,604,063 |
| 4.00% 3/1/46 (BAM) | | 500,000 | 486,935 |
| 4.00% 3/1/51 (BAM) | | 2,210,000 | 2,099,610 |
| Series A 3.00% 3/1/51 | | 3,000,000 | 2,287,020 |
| (Trinity Health Credit Group) | | | |
| Series ID 4.00% 12/1/43 | | 3,900,000 | 3,875,508 |
| Series ID 5.00% 12/1/46 | | 750,000 | 766,522 |
| (Valley Vista Care Corporation) | | | |
| Series A 4.00% 11/15/27 | | 575,000 | 573,327 |
| | | Principal
amount° | Value (US $) |
| Municipal Bonds (continued) |
| Healthcare Revenue Bonds (continued) |
| Idaho Health Facilities Authority Revenue | | | |
| (Valley Vista Care Corporation) |
| Series A 5.25% 11/15/37 | | 1,005,000 | $ 888,993 |
| Series A 5.25% 11/15/47 | | 1,130,000 | 900,260 |
| Idaho State Building Authority Revenue | | | |
(Department of Health & Welfare Project)
Series B 5.00% 9/1/43 | | 1,000,000 | 1,047,970 |
| | 16,889,712 |
| Housing Revenue Bonds — 6.80% |
Idaho Housing & Finance Association Multifamily Housing
Revenue | | | |
| (Sunset Landing Apartments Project) | | | |
| Series A 2.75% 7/1/40 | | 1,300,000 | 1,053,741 |
| Series A 3.125% 7/1/54 | | 2,000,000 | 1,484,120 |
| Idaho Housing & Finance Association Revenue | | | |
| Series A 4.50% 1/21/49 | | 190,829 | 192,183 |
Idaho Housing & Finance Association Single Family
Mortgage Revenue | | | |
| Series A 4.65% 1/1/54 | | 2,985,000 | 2,990,313 |
| Series A 4.75% 1/1/48 | | 1,000,000 | 1,010,330 |
| Series C 3.00% 1/1/43 (FHA) | | 400,000 | 333,668 |
| Series C 4.80% 7/1/53 | | 1,795,000 | 1,815,517 |
| | 8,879,872 |
| Industrial Development Revenue/Pollution ControlRevenue Bonds — 4.07% |
Children's Trust Fund, Commonwealth of Puerto Rico
Revenue | | | |
(Tobacco Settlement Asset-Backed)
Series A 8.21% 5/15/57 ^ | | 30,000,000 | 2,064,600 |
| Nez Perce County, Idaho Pollution Control Revenue | | | |
(Potlatch Project)
2.75% 10/1/24 | | 1,250,000 | 1,246,500 |
| Power County, Idaho Industrial Development Revenue | | | |
(FMC Project)
6.45% 8/1/32 (AMT) | | 2,000,000 | 2,006,500 |
| | 5,317,600 |
| Lease Revenue Bonds — 6.70% |
| Boise, Idaho Urban Renewal Agency Revenue | | | |
| 5.00% 12/15/31 | | 750,000 | 779,085 |
| 5.00% 12/15/32 | | 750,000 | 778,582 |
Schedules of investments
Delaware Tax-Free Idaho Fund
| | | Principal
amount° | Value (US $) |
| Municipal Bonds (continued) |
| Lease Revenue Bonds (continued) |
Idaho Falls, Idaho Annual Appropriation Certificates of
Participation Revenue | | | |
| 144A 5.25% 5/15/51 # | | 2,000,000 | $ 2,014,520 |
| Idaho Fish & Wildlife Foundation Revenue | | | |
(Idaho Department of Fish & Game Headquarters Office Project)
4.00% 12/1/39 | | 1,040,000 | 1,053,811 |
(Idaho Department of Fish & Game Nampa Regional Office Project)
5.00% 12/1/41 | | 200,000 | 210,634 |
Idaho Housing & Finance Association Economic
Development Facilities Revenue | | | |
| (TDF Project) | | | |
| Series A 6.50% 2/1/26 | | 420,000 | 420,731 |
| Series A 7.00% 2/1/36 | | 1,500,000 | 1,502,850 |
| Idaho State Building Authority Revenue | | | |
(Department of Health & Welfare Project)
Series B 4.00% 9/1/48 | | 1,290,000 | 1,255,970 |
Nez Perce County, Idaho Annual Appropriation
Certificates of Participation Revenue | | | |
| 5.00% 3/1/52 | | 710,000 | 744,861 |
| | 8,761,044 |
| Local General Obligation Bonds — 8.49% |
Ada & Boise Counties, Idaho Independent School District
Boise City | | | |
| 5.00% 8/1/34 | | 1,000,000 | 1,048,570 |
| 5.00% 8/1/35 | | 1,160,000 | 1,215,784 |
| 5.00% 8/1/36 | | 500,000 | 523,095 |
| Canyon County, Idaho School District No. 139 Vallivue | | | |
| 5.00% 9/15/42 | | 1,000,000 | 1,118,430 |
| 5.00% 9/15/43 | | 2,000,000 | 2,227,820 |
(School Board Guaranteed)
Series B 5.00% 9/15/24 | | 1,480,000 | 1,480,933 |
| City of Ketchum, Idaho | | | |
| 2.125% 9/15/41 | | 500,000 | 358,185 |
| Idaho Bond Bank Authority | | | |
| Series A 4.00% 9/15/33 | | 530,000 | 542,937 |
| Series A 4.00% 9/15/37 | | 1,000,000 | 1,011,990 |
| Series C 5.00% 9/15/42 | | 500,000 | 521,110 |
| | | Principal
amount° | Value (US $) |
| Municipal Bonds (continued) |
| Local General Obligation Bonds (continued) |
| Nez Perce County, Idaho Independent School DistrictNo. 1 | | | |
(Sales Tax & Credit Enhancement Guaranty)
Series B 5.00% 9/15/36 | | 1,000,000 | $ 1,048,540 |
| | 11,097,394 |
| Pre-Refunded Bonds — 1.29% |
Ada & Canyon Counties, Idaho Joint School District No.
3 Kuna | | | |
(Sales Tax & Credit Enhancement Guaranty)
Series B 5.00% 9/15/35-27 § | | 1,100,000 | 1,167,232 |
| Idaho State Building Authority Revenue | | | |
(State Office Campus Project)
Series A 4.00% 9/1/48-27 § | | 500,000 | 521,080 |
| | 1,688,312 |
| Resource Recovery Revenue Bond — 0.31% |
| Idawy, Idaho Solid Waste District Revenue | | | |
| Series A 3.00% 1/1/50 | | 550,000 | 406,197 |
| | 406,197 |
| Special Tax Revenue Bonds — 22.61% |
| Commonwealth of Puerto Rico Revenue | | | |
| 1.724% 11/1/51 • | | 265,594 | 170,312 |
| (Subordinate) | | | |
| 3.195% 11/1/43 • | | 3,139,170 | 1,989,449 |
| 3.799% 11/1/51 • | | 3,330,467 | 1,752,658 |
| GDB Debt Recovery Authority of Puerto Rico Revenue | | | |
(Taxable)
7.50% 8/20/40 | | 4,128,533 | 4,025,320 |
| Idaho Bond Bank Authority | | | |
| Series A 4.00% 9/15/39 | | 230,000 | 233,956 |
| Idaho Housing & Finance Association Sales Tax Revenue | | | |
| (Transportation Expansion And Congestion Mitigation) | | | |
| 5.00% 8/15/47 | | 3,630,000 | 3,940,365 |
| Series A 4.00% 8/15/48 | | 2,370,000 | 2,336,322 |
| Series A 5.00% 8/15/42 | | 2,000,000 | 2,257,020 |
| Series A 5.25% 8/15/48 | | 1,620,000 | 1,806,527 |
| Idaho Water Resource Board Loan Program Revenue | | | |
(Ground Water Rights Mitigation)
Series A 5.00% 9/1/32 | | 3,565,000 | 3,567,531 |
Schedules of investments
Delaware Tax-Free Idaho Fund
| | | Principal
amount° | Value (US $) |
| Municipal Bonds (continued) |
| Special Tax Revenue Bonds (continued) |
| Puerto Rico Sales Tax Financing Revenue | | | |
| (Capital Appreciation - Restructured) | | | |
| Series A-1 5.466% 7/1/46 ^ | | 3,320,000 | $ 1,119,471 |
| Series A-1 5.974% 7/1/51 ^ | | 7,109,000 | 1,744,620 |
| (Restructured) | | | |
| Series A-1 4.55% 7/1/40 | | 875,000 | 877,082 |
| Series A-1 4.75% 7/1/53 | | 3,045,000 | 3,022,132 |
| Series A-1 5.00% 7/1/58 | | 691,000 | 694,054 |
| | 29,536,819 |
| State General Obligation Bond — 0.35% |
| Commonwealth of Puerto Rico Revenue | | | |
(Restructured)
Series A-1 4.00% 7/1/46 | | 500,000 | 464,265 |
| | 464,265 |
| Transportation Revenue Bonds — 6.29% |
| City of Boise, Idaho Airport Revenue | | | |
(Employee Parking Facilities Project)
Series B 4.00% 9/1/51 (AMT) | | 1,955,000 | 1,822,431 |
| (Public Parking Facilities Project) | | | |
| Series A 5.00% 9/1/46 | | 1,000,000 | 1,077,530 |
| Series A 5.00% 9/1/51 | | 1,000,000 | 1,064,050 |
| Idaho Housing & Finance Association Revenue | | | |
| Series A 4.00% 7/15/39 | | 2,735,000 | 2,750,617 |
Puerto Rico Industrial Tourist Educational Medical &
Environmental Control Facilities Financing Authority Revenue | | | |
(San Juan Bay Cruise Terminal project)
Series A-3 6.75% 1/1/46 (AMT) | | 1,250,000 | 1,497,925 |
| | 8,212,553 |
| Water & Sewer Revenue Bonds — 2.18% |
| City of Boise, Idaho Water Renewal Revenue | | | |
| 5.00% 9/1/51 | | 2,000,000 | 2,140,860 |
| Guam Government Waterworks Authority Revenue | | | |
| Series A 5.00% 7/1/43 | | 650,000 | 705,276 |
| | 2,846,136 |
| Total Municipal Bonds (cost $132,727,491) | 129,753,826 |
| | | Number of
shares | Value (US $) |
| Short-Term Investments — 1.61% |
| Money Market Mutual Funds — 1.61% |
| Dreyfus Tax Exempt Cash Management - Institutional Shares (seven-day effective yield 2.87%) | | 2,102,936 | $ 2,102,811 |
| Total Short-Term Investments (cost $2,102,811) | 2,102,811 |
Total Value of Securities—100.92%
(cost $134,830,302) | | | $131,856,637 |
| ° | Principal amount shown is stated in USD unless noted that the security is denominated in another currency. |
| # | Security exempt from registration under Rule 144A of the Securities Act of 1933, as amended. At August 31, 2024, the aggregate value of Rule 144A securities was $10,391,000, which represents 7.95% of the Fund’s net assets. See Note 10 in “Notes to financial statements.” |
| ^ | Zero-coupon security. The rate shown is the effective yield at the time of purchase. |
| ‡ | Non-income producing security. Security is currently in default. |
| § | Pre-refunded bonds. Municipal bonds that are generally backed or secured by US Treasury bonds. For pre-refunded bonds, the stated maturity is followed by the year in which the bond will be pre-refunded. See Note 10 in “Notes to financial statements.” |
| • | Variable rate investment. Rates reset periodically. Rate shown reflects the rate in effect at August 31, 2024. For securities based on a published reference rate and spread, the reference rate and spread are indicated in their descriptions. The reference rate descriptions (i.e. SOFR01M, SOFR03M, etc.) used in this report are identical for different securities, but the underlying reference rates may differ due to the timing of the reset period. Certain variable rate securities are not based on a published reference rate and spread but are determined by the issuer or agent and are based on current market conditions, or for mortgage-backed securities, are impacted by the individual mortgages which are paying off over time. These securities do not indicate a reference rate and spread in their descriptions. |
| Summary of abbreviations: |
| AGM – Insured by Assured Guaranty Municipal Corporation |
| AMT – Subject to Alternative Minimum Tax |
| BAM – Insured by Build America Mutual Assurance |
| FHA – Federal Housing Administration |
| FMC – First Mile Connectivity |
| SOFR01M – Secured Overnight Financing Rate 1 Month |
| SOFR03M – Secured Overnight Financing Rate 3 Month |
| TDF – Term Deposit Facility |
Schedules of investments
Delaware Tax-Free Idaho Fund
| Summary of abbreviations: (continued) |
| USD – US Dollar |
See accompanying notes, which are an integral part of the financial statements.
Schedules of investments
| Delaware Tax-Free New York Fund | August 31, 2024 |
| | | Principal
amount° | Value (US $) |
| Municipal Bonds — 96.48% |
| Education Revenue Bonds — 17.07% |
| Albany, New York Capital Resource Revenue | | | |
(KIPP Capital Region Public Charter Schools Project)
5.00% 6/1/64 | | 1,000,000 | $ 1,009,900 |
Buffalo & Erie County, New York Industrial Land
Development Revenue | | | |
(Tapestry Charter School Project)
Series A 5.00% 8/1/52 | | 500,000 | 501,050 |
| Build NYC, New York Resource Revenue | | | |
(Classical Charter Schools Project)
Series A 4.75% 6/15/53 | | 1,700,000 | 1,688,355 |
| (East Harlem Scholars Academy Charter School Project) | | | |
| 144A 5.75% 6/1/52 # | | 500,000 | 524,960 |
| 144A 5.75% 6/1/62 # | | 1,000,000 | 1,044,360 |
(Inwood Academy for Leadership Charter School Project)
Series A 144A 5.50% 5/1/48 # | | 500,000 | 509,235 |
| (KIPP NYC Public School Facilities - Canal West Project) | | | |
| 5.00% 7/1/35 | | 530,000 | 571,647 |
| 5.00% 7/1/42 | | 1,365,000 | 1,428,609 |
(Manhattan College Project)
5.00% 8/1/47 | | 500,000 | 504,720 |
(Metropolitan College of New York Project)
5.50% 11/1/44 | | 600,000 | 360,000 |
(Metropolitan Lighthouse Charter School Project)
Series A 144A 5.00% 6/1/52 # | | 250,000 | 249,980 |
(New Dawn Charter Schools Project)
144A 5.75% 2/1/49 # | | 500,000 | 499,970 |
| (New World Preparatory Charter School Project) | | | |
| Series A 144A 4.00% 6/15/51 # | | 315,000 | 257,916 |
| Series A 144A 4.00% 6/15/56 # | | 450,000 | 358,781 |
(The Packer Collegiate Institute Project)
5.00% 6/1/40 | | 750,000 | 756,157 |
| Dutchess County, New York Local Development Revenue | | | |
(Vassar College Project)
5.00% 7/1/36 | | 1,000,000 | 1,046,250 |
| Madison County, New York Capital Resource Revenue | | | |
(Colgate University Refunding Project)
Series B 5.00% 7/1/39 | | 1,000,000 | 1,014,610 |
Schedules of investments
Delaware Tax-Free New York Fund
| | | Principal
amount° | Value (US $) |
| Municipal Bonds (continued) |
| Education Revenue Bonds (continued) |
Monroe County, New York Industrial Development
Revenue | | | |
(St. John Fisher College Project)
Series A 5.50% 6/1/39 | | 300,000 | $ 300,378 |
| (True North Rochester Preparatory Charter School Project) | | | |
| 144A 5.00% 6/1/50 # | | 705,000 | 715,434 |
| Series A 144A 5.00% 6/1/59 # | | 1,000,000 | 1,011,040 |
| (University of Rochester Project) | | | |
| Series A 4.00% 7/1/50 | | 2,125,000 | 2,070,855 |
| Series A 5.00% 7/1/53 | | 1,000,000 | 1,090,510 |
Nassau County, New York Local Economic Assistance
Revenue | | | |
(Roosevelt Children's Academy Charter School Project)
Series A 5.00% 7/1/55 | | 1,750,000 | 1,788,342 |
New York City, New York Trust for Cultural Resources
Revenue | | | |
(Alvin Ailey Dance Foundation)
Series A 4.00% 7/1/46 | | 1,000,000 | 959,290 |
| New York State Dormitory Authority Revenue | | | |
(Columbia University)
Series A 5.00% 10/1/50 | | 2,325,000 | 2,844,056 |
(Cornell University)
Series A 5.50% 7/1/54 | | 3,500,000 | 4,007,745 |
(New York University)
5.50% 7/1/40 (AMBAC) | | 740,000 | 879,697 |
New York State Dormitory Authority Revenue Non-State
Supported Debt | | | |
| Series A 5.00% 7/1/33 | | 2,000,000 | 2,078,520 |
| Series A 5.50% 5/1/49 | | 1,000,000 | 1,100,410 |
(Hudson City School District)
Unrefunded Series A 5.625% 10/1/29 (AGC) | | 375,000 | 375,746 |
| (New York State University Dormitory Facilities) | | | |
| Series A 5.00% 7/1/37 | | 2,200,000 | 2,317,458 |
| Series A 5.00% 7/1/42 | | 1,300,000 | 1,346,969 |
(Vaughn College of Aeronautics and Technology)
Series A 144A 5.50% 12/1/46 # | | 300,000 | 271,125 |
| Saratoga County, New York Capital Resource Revenue | | | |
| (Skidmore College Project) | | | |
| 5.00% 7/1/43 | | 3,570,000 | 3,746,001 |
| 5.00% 7/1/48 | | 1,000,000 | 1,043,020 |
| | | Principal
amount° | Value (US $) |
| Municipal Bonds (continued) |
| Education Revenue Bonds (continued) |
| Tompkins County, New York Development Revenue | | | |
(Ithaca College Project)
5.00% 7/1/34 | | 750,000 | $ 758,048 |
Westchester County, New York Local Development
Revenue | | | |
(Pace University)
Series A 5.00% 5/1/34 | | 1,725,000 | 1,732,280 |
Yonkers, New York Economic Development Educational
Revenue | | | |
| (Lamartine/Warburton LLC - Charter School of Educational Excellence Project) | | | |
| Series A 5.00% 10/15/49 | | 795,000 | 797,083 |
| Series A 5.00% 10/15/50 | | 1,575,000 | 1,586,450 |
| | 45,146,957 |
| Electric Revenue Bonds — 6.20% |
| Build NYC, New York Resource Revenue | | | |
(Brooklyn Navy Yard Cogeneration Partners, L.P. Project)
144A 5.25% 12/31/33 (AMT) # | | 1,000,000 | 935,390 |
| Guam Power Authority Revenue | | | |
(Tax-Exempt Forward Delivery)
Series A 5.00% 10/1/35 | | 1,310,000 | 1,444,930 |
Long Island, New York Power Authority Electric System
Revenue | | | |
| 5.00% 9/1/37 | | 450,000 | 479,169 |
| 5.00% 9/1/38 | | 2,000,000 | 2,123,080 |
| 5.00% 9/1/42 | | 1,500,000 | 1,565,955 |
| Series A 5.25% 9/1/54 | | 1,250,000 | 1,397,000 |
| Series B 5.00% 9/1/41 | | 2,065,000 | 2,127,322 |
| New York Power Authority Revenue | | | |
| 4.00% 11/15/40 (AGM) | | 1,000,000 | 1,028,010 |
| Series A 5.125% 11/15/58 (AGM) | | 1,500,000 | 1,663,695 |
| New York State Power Authority Revenue | | | |
| Series A 4.00% 11/15/50 | | 1,000,000 | 981,540 |
| Puerto Rico Electric Power Authority Revenue | | | |
| Series A 5.05% 7/1/42 ‡ | | 65,000 | 35,100 |
| Series A 6.75% 7/1/36 ‡ | | 625,000 | 337,500 |
| Series AAA 5.25% 7/1/25 ‡ | | 35,000 | 18,900 |
| Series TT 5.00% 7/1/32 ‡ | | 1,120,000 | 604,800 |
| Series WW 5.25% 7/1/33 ‡ | | 195,000 | 105,300 |
| Series WW 5.50% 7/1/17 ‡ | | 420,000 | 225,750 |
| Series WW 5.50% 7/1/19 ‡ | | 330,000 | 177,375 |
Schedules of investments
Delaware Tax-Free New York Fund
| | | Principal
amount° | Value (US $) |
| Municipal Bonds (continued) |
| Electric Revenue Bonds (continued) |
| Puerto Rico Electric Power Authority Revenue | | | |
| Series XX 4.75% 7/1/26 ‡ | | 40,000 | $ 21,600 |
| Series XX 5.25% 7/1/40 ‡ | | 1,430,000 | 772,200 |
| Series ZZ 4.75% 7/1/27 ‡ | | 30,000 | 16,200 |
| Series ZZ 5.00% 7/1/19 ‡ | | 570,000 | 306,375 |
| Series ZZ 5.25% 7/1/25 ‡ | | 50,000 | 26,875 |
| | 16,394,066 |
| Healthcare Revenue Bonds — 7.45% |
Buffalo & Erie County, New York Industrial Land
Development Revenue | | | |
(Catholic Health System Project)
Series N 5.25% 7/1/35 | | 250,000 | 246,935 |
| Build NYC, New York Resource Revenue | | | |
(The Children's Aid Society Project)
4.00% 7/1/49 | | 1,000,000 | 952,760 |
| Dutchess County, New York Local Development Revenue | | | |
(Nuvance Health)
Series B 4.00% 7/1/49 | | 3,000,000 | 2,870,970 |
Guilderland, New York Industrial Development Agency
Revenue | | | |
(Albany Place Development LLC Project)
Series A 144A 5.875% 1/1/52 #, ‡ | | 500,000 | 275,000 |
Monroe County, New York Industrial Development
Revenue | | | |
| (Rochester General Hospital Project) | | | |
| 5.00% 12/1/36 | | 405,000 | 413,784 |
| 5.00% 12/1/46 | | 540,000 | 544,514 |
(Rochester Regional Health Project)
Series A 4.00% 12/1/38 | | 2,550,000 | 2,514,479 |
Nassau County, New York Local Economic Assistance
Revenue | | | |
(Catholic Health Services of Long Island Obligated Group Project)
5.00% 7/1/33 | | 725,000 | 725,421 |
| New York State Dormitory Authority Revenue | | | |
| (Montefiore Obligated Group) | | | |
| Series A 4.00% 8/1/38 | | 1,000,000 | 982,680 |
| Series A 4.00% 9/1/45 | | 2,000,000 | 1,890,940 |
| Series A 4.00% 9/1/50 | | 500,000 | 453,830 |
(Northwell Health Obligated Group)
Series A 5.00% 5/1/52 | | 3,000,000 | 3,201,450 |
| | | Principal
amount° | Value (US $) |
| Municipal Bonds (continued) |
| Healthcare Revenue Bonds (continued) |
New York State Dormitory Authority Revenue Non-State
Supported Debt | | | |
(Orange Regional Medical Center Obligated Group)
144A 5.00% 12/1/34 # | | 700,000 | $ 698,383 |
New York State Dormitory Authority Revenue Non-State
Supported Debt Revenue | | | |
(Orange Regional Medical Center Obligated Group)
144A 5.00% 12/1/45 # | | 700,000 | 657,188 |
Onondaga, New York Civic Development Tax-exempt
Revenue | | | |
(Crouse Health Hospital, Inc. Project)
Series A 5.125% 8/1/44 | | 500,000 | 510,445 |
Puerto Rico Industrial, Tourist, Educational, Medical &
Environmental Control Facilities Financing Authority Revenue | | | |
(Hospital Auxilio Mutuo Obligated Group Project)
4.00% 7/1/36 | | 400,000 | 385,920 |
| Southold, New York Local Development Revenue | | | |
(Peconic Landing at Southold Project)
5.00% 12/1/45 | | 750,000 | 750,337 |
Westchester County, New York Local Development
Revenue | | | |
| (Purchase Senior Learning Community, Inc. Project) | | | |
| Series A 144A 5.00% 7/1/46 # | | 615,000 | 620,978 |
| Series A 144A 5.00% 7/1/56 # | | 1,000,000 | 999,920 |
| | 19,695,934 |
| Housing Revenue Bonds — 2.66% |
| New York City, New York Housing Development Revenue | | | |
| 4.80% 2/1/53 | | 1,750,000 | 1,770,650 |
| (Sustainable Development Bonds) | | | |
| Series A 5.00% 5/1/63 | | 2,125,000 | 2,183,183 |
| Series B-1 5.30% 11/1/53 | | 2,000,000 | 2,082,780 |
| New York State Mortgage Agency Homeowner Revenue | | | |
| Series 250 4.80% 10/1/48 | | 1,000,000 | 1,010,890 |
| | 7,047,503 |
| Industrial Development Revenue/Pollution ControlRevenue Bonds — 9.00% |
Children's Trust Fund, Commonwealth of Puerto Rico
Revenue | | | |
(Tobacco Settlement Asset-Backed)
Series A 8.21% 5/15/57 ^ | | 48,900,000 | 3,365,298 |
Schedules of investments
Delaware Tax-Free New York Fund
| | | Principal
amount° | Value (US $) |
| Municipal Bonds (continued) |
| Industrial Development Revenue/Pollution ControlRevenue Bonds (continued) |
Erie County, New York Tobacco Asset Securitization
Revenue | | | |
(Capital Appreciation-Asset-Backed)
Series A 144A 9.23% 6/1/60 #, ^ | | 65,350,000 | $ 3,170,128 |
New York City, New York Industrial Development Agency
Revenue | | | |
(Senior Trips)
Series A 5.00% 7/1/28 (AMT) | | 1,045,000 | 1,045,303 |
| (Yankee Stadium Project) | | | |
| Series A 3.00% 3/1/40 (AGM) | | 1,000,000 | 870,660 |
| Series A 4.00% 3/1/45 (AGM) | | 1,000,000 | 979,630 |
(Yankee Stadium Projects)
Series A 3.00% 3/1/49 (AGM) | | 3,440,000 | 2,677,146 |
New York Counties Tobacco Trust V Pass-Through
Revenue | | | |
| Series 4B 144A 0.971% 6/1/60 #, ♦, ^ | | 39,000,000 | 1,787,760 |
| New York State Urban Development Revenue | | | |
| Series A 5.00% 3/15/48 | | 1,500,000 | 1,637,115 |
New York Transportation Development Special Facilities
Revenue | | | |
(Delta Airlines - LaGuardia Airport Terminals C&D Redevelopment Project)
4.00% 1/1/36 (AMT) | | 750,000 | 742,553 |
(Delta Airlines Inc. LaGuardia Airport Terminals C&D Redevelopment Project)
5.00% 1/1/36 (AMT) | | 2,015,000 | 2,072,024 |
Suffolk County, New York Tobacco Asset Securitization
Revenue | | | |
| Senior Series A-2 4.00% 6/1/50 | | 1,595,000 | 1,464,003 |
| Suffolk, New York Regional Off-Track Betting Revenue | | | |
| 5.75% 12/1/44 | | 1,250,000 | 1,308,575 |
| TSASC, New York | | | |
| Fiscal 2017 Senior Series A 5.00% 6/1/41 | | 1,900,000 | 1,937,411 |
Westchester County, New York Tobacco Asset
Securitization Revenue | | | |
| Subordinate Series C 5.00% 6/1/45 | | 750,000 | 734,677 |
| | 23,792,283 |
| Lease Revenue Bonds — 5.19% |
New York City, New York Transitional Finance Authority
Building Aid Revenue | | | |
| Fiscal 2019 Subordinate Series S-3A 5.00% 7/15/37 | | 1,000,000 | 1,062,000 |
| | | Principal
amount° | Value (US $) |
| Municipal Bonds (continued) |
| Lease Revenue Bonds (continued) |
| New York Liberty Development Revenue | | | |
(4 World Trade Center - Green Bond)
Series A 2.875% 11/15/46 (BAM) | | 1,620,000 | $ 1,233,581 |
(Class 1 - 3 World Trade Center Project)
144A 5.00% 11/15/44 # | | 4,000,000 | 4,003,320 |
(Class 2 - 3 World Trade Center Project)
144A 5.375% 11/15/40 # | | 500,000 | 500,875 |
(Class 3 - 3 World Trade Center Project)
144A 7.25% 11/15/44 # | | 1,500,000 | 1,504,620 |
New York State Dormitory Authority Revenue Non-State
Supported Debt | | | |
(Court Facility)
Series A 5.50% 5/15/27 (AMBAC) | | 2,500,000 | 2,685,150 |
| New York State Thruway Authority Revenue | | | |
| Series A-1 3.00% 3/15/49 | | 1,500,000 | 1,186,575 |
New York State Thruway Authority State Personal Income
Tax Revenue | | | |
| Series A-1 3.00% 3/15/51 | | 2,000,000 | 1,556,560 |
| | 13,732,681 |
| Local General Obligation Bonds — 2.93% |
| New York City, New York | | | |
| Fiscal 2018 Subordinate Series F-1 5.00% 4/1/39 | | 1,000,000 | 1,053,950 |
| Fiscal 2023 Subordinate Series B-1 5.25% 10/1/47 | | 1,500,000 | 1,649,145 |
| Fiscal 2024 Series C 5.25% 3/1/53 | | 1,500,000 | 1,656,435 |
| Series D 4.00% 4/1/50 | | 1,825,000 | 1,783,919 |
| Series D 5.00% 4/1/44 | | 500,000 | 552,160 |
| Series F-1 3.00% 3/1/51 (BAM) | | 1,360,000 | 1,057,754 |
| | 7,753,363 |
| Resource Recovery Revenue Bond — 0.54% |
| Niagara Area, New York Development Revenue | | | |
(Covanta Project)
Series A 144A 4.75% 11/1/42 (AMT) # | | 1,500,000 | 1,438,200 |
| | 1,438,200 |
| Special Tax Revenue Bonds — 24.94% |
| Commonwealth of Puerto Rico Revenue | | | |
| 1.724% 11/1/51 • | | 558,938 | 358,419 |
| (Subordinate) | | | |
| 3.097% 11/1/43 • | | 6,606,362 | 4,186,782 |
| 3.799% 11/1/51 • | | 955,735 | 502,956 |
Schedules of investments
Delaware Tax-Free New York Fund
| | | Principal
amount° | Value (US $) |
| Municipal Bonds (continued) |
| Special Tax Revenue Bonds (continued) |
| GDB Debt Recovery Authority of Puerto Rico Revenue | | | |
(Taxable)
7.50% 8/20/40 | | 5,251,892 | $ 5,110,916 |
Glen Cove, New York Local Economic Assistance
Revenue | | | |
(Garvies Point Public Improvement Project)
Series A 5.00% 1/1/56 | | 250,000 | 212,585 |
| Hudson Yards, New York Infrastructure Revenue | | | |
(Tax-Exempt)
Series A 4.00% 2/15/44 | | 2,875,000 | 2,849,930 |
Matching Fund Special Purpose Securitization, Virgin
Islands Revenue | | | |
| Series A 5.00% 10/1/32 | | 500,000 | 535,540 |
New York City, New York Transitional Finance Authority
Future Tax Secured Revenue | | | |
| Fiscal 2015 Subordinate Series B-1 5.00% 8/1/42 | | 2,000,000 | 2,005,800 |
| Series A-1 5.00% 8/1/42 | | 5,220,000 | 5,477,189 |
(Subordinate Bonds)
Series A-3 3.00% 5/1/45 | | 2,000,000 | 1,657,260 |
| New York Convention Center Development Revenue | | | |
| (Hotel Unit Fee Secured) | | | |
| 5.00% 11/15/35 | | 1,000,000 | 1,018,390 |
| 5.00% 11/15/40 | | 1,000,000 | 1,011,230 |
| New York Metropolitan Transportation Authority Revenue | | | |
(Climate Bond Certified - Green Bonds)
Subseries B-2 5.00% 11/15/36 | | 1,500,000 | 1,553,580 |
New York State Dormitory Authority Personal Income Tax
Revenue | | | |
| Series A 5.25% 3/15/52 | | 1,500,000 | 1,665,720 |
| (General Purpose) | | | |
| Series A 4.00% 3/15/49 | | 1,000,000 | 985,420 |
| Series E 3.00% 3/15/50 | | 3,000,000 | 2,371,680 |
| Series E 4.00% 3/15/48 | | 1,000,000 | 985,390 |
| New York State Dormitory Authority Sales Tax Revenue | | | |
| Series A 5.00% 3/15/52 | | 2,500,000 | 2,727,800 |
New York State Thruway Authority State Personal Income
Tax Revenue | | | |
(Climate Bond Certified - Green Bonds)
Series C 5.00% 3/15/55 | | 1,000,000 | 1,075,000 |
| | | Principal
amount° | Value (US $) |
| Municipal Bonds (continued) |
| Special Tax Revenue Bonds (continued) |
New York Triborough Bridge & Tunnel Authority Payroll
Mobility Tax Senior Lien Revenue | | | |
(MTA Bridges and Tunnels)
Series C-3 3.00% 5/15/51 | | 2,215,000 | $ 1,738,509 |
| New York Triborough Bridge & Tunnel Authority Revenue | | | |
| Series B 5.00% 3/15/27 | | 2,000,000 | 2,119,260 |
(MTA Bridges and Tunnels Climate Bond Certified - Green Bonds)
Series D-2 5.50% 5/15/52 | | 1,000,000 | 1,114,730 |
New York Triborough Bridge & Tunnel Authority Sales Tax
Revenue | | | |
| (TBTA Capital Lockbox - City Sales Tax) | | | |
| Series A 4.00% 5/15/48 | | 2,000,000 | 1,969,740 |
| Series A 4.00% 5/15/57 | | 1,000,000 | 972,700 |
| Subordinate Series A-1 5.25% 5/15/64 | | 2,500,000 | 2,750,500 |
| Puerto Rico Sales Tax Financing Revenue | | | |
| (Restructured) | | | |
| Series A-1 1.148% 7/1/46 ^ | | 13,880,000 | 4,680,197 |
| Series A-1 4.55% 7/1/40 | | 444,000 | 445,057 |
| Series A-1 4.75% 7/1/53 | | 6,805,000 | 6,753,894 |
| Series A-1 5.00% 7/1/58 | | 3,665,000 | 3,681,199 |
| Series A-1 5.504% 7/1/51 ^ | | 6,855,000 | 1,682,286 |
| Series A-2 4.329% 7/1/40 | | 480,000 | 474,715 |
| Series A-2 4.536% 7/1/53 | | 1,330,000 | 1,275,803 |
| | 65,950,177 |
| State General Obligation Bonds — 1.29% |
| Commonwealth of Puerto Rico Revenue | | | |
| (Restructured) | | | |
| Series A-1 4.00% 7/1/37 | | 1,605,640 | 1,570,846 |
| Series A-1 4.00% 7/1/46 | | 1,980,000 | 1,838,489 |
| | 3,409,335 |
| Transportation Revenue Bonds — 14.36% |
| New York Metropolitan Transportation Authority Revenue | | | |
| Series A-2 4.00% 11/15/43 | | 2,500,000 | 2,462,550 |
| (Climate Bond Certified - Green Bonds) | | | |
| Series 1 4.00% 11/15/46 | | 2,250,000 | 2,183,580 |
| Series B 4.00% 11/15/50 | | 1,000,000 | 956,120 |
| Series E 4.00% 11/15/45 | | 1,500,000 | 1,460,550 |
| Subordinate Series C-1 5.25% 11/15/55 | | 1,500,000 | 1,577,445 |
(Sustainable Bonds)
Series A 5.25% 11/15/49 | | 1,500,000 | 1,636,920 |
Schedules of investments
Delaware Tax-Free New York Fund
| | | Principal
amount° | Value (US $) |
| Municipal Bonds (continued) |
| Transportation Revenue Bonds (continued) |
| New York State Thruway Authority General Revenue | | | |
| Series B 4.00% 1/1/50 | | 1,000,000 | $ 971,540 |
| Series O 3.00% 1/1/51 (BAM) | | 2,000,000 | 1,576,300 |
| Series P 5.25% 1/1/54 | | 500,000 | 561,470 |
(Junior Indebtedness Obligation)
Series B 4.00% 1/1/45 | | 1,500,000 | 1,466,325 |
New York Transportation Development Special Facilities
Revenue | | | |
(John F. Kennedy International Airport New Terminal One Project)
5.25% 6/30/60 (AMT) (AGM) | | 2,500,000 | 2,653,275 |
| (LaGuardia Airport Terminal B Redevelopment Project) | | | |
| Series A 5.00% 7/1/41 (AMT) | | 2,000,000 | 1,999,900 |
| Series A 5.25% 1/1/50 (AMT) | | 1,000,000 | 999,980 |
(Terminal 4 John F. Kennedy International Airport Project)
5.00% 12/1/32 (AMT) | | 2,000,000 | 2,181,140 |
New York Transportation Development Special Facility
Revenue | | | |
| (John F. Kennedy International Airport New Terminal One Project-Green Bonds) | | | |
| 5.125% 6/30/60 (AGM) (AMT) | | 1,350,000 | 1,406,822 |
| 5.375% 6/30/60 (AMT) | | 2,000,000 | 2,087,020 |
| 5.50% 6/30/54 (AMT) | | 1,700,000 | 1,823,454 |
| 5.50% 6/30/60 (AMT) | | 2,750,000 | 2,931,142 |
(Terminal 4 John F. Kennedy International Airport Project)
5.00% 12/1/38 (AMT) | | 340,000 | 362,675 |
Niagara, New York Frontier Transportation Authority
Revenue | | | |
| (Buffalo Niagara International Airport) | | | |
| Series A 5.00% 4/1/35 (AMT) | | 775,000 | 808,248 |
| Series A 5.00% 4/1/37 (AMT) | | 750,000 | 777,255 |
| Series A 5.00% 4/1/39 (AMT) | | 350,000 | 360,871 |
| Port Authority of New York & New Jersey Revenue | | | |
| Series 244 5.00% 7/15/42 | | 1,800,000 | 2,052,270 |
| Series 244 5.00% 7/15/54 | | 1,500,000 | 1,646,490 |
| Two Hundred Twenty-First Series 4.00% 7/15/60 (AMT) | | 1,130,000 | 1,040,560 |
| | 37,983,902 |
| | | Principal
amount° | Value (US $) |
| Municipal Bonds (continued) |
| Water & Sewer Revenue Bonds — 4.85% |
New York City, New York Municipal Water Finance
Authority Water & Sewer System Revenue | | | |
| Series BB 5.25% 6/15/54 | | 2,500,000 | $ 2,776,425 |
| (Second General Resolution) | | | |
| Fiscal 2017 Series DD 5.00% 6/15/47 | | 1,000,000 | 1,033,270 |
| Fiscal 2018 Series EE 5.00% 6/15/40 | | 2,500,000 | 2,622,775 |
| Fiscal 2019 Subordinate Series FF-1 4.00% 6/15/49 | | 1,000,000 | 978,520 |
| Fiscal 2020 Series GG-1 4.00% 6/15/50 | | 1,000,000 | 982,370 |
New York State Environmental Facilities Clean Water and
Drinking Water Revenue | | | |
(New York City Municipal Water Finance Authority Projects - Second Resolution)
Series B 5.00% 6/15/43 | | 470,000 | 492,960 |
(New York Municipal Water Finance Authority Projects - Second Resolution Bonds)
Series A 5.25% 6/15/53 | | 2,500,000 | 2,814,700 |
| New York State Environmental Facilities Revenue | | | |
(2010 Master Financing Program)
Series B 5.00% 11/15/42 | | 1,000,000 | 1,136,090 |
| | 12,837,110 |
| Total Municipal Bonds (cost $253,125,179) | 255,181,511 |
|
|
|
| Short-Term Investments — 2.84% |
| Variable Rate Demand Notes — 2.84%¤ |
New York City, New York Municipal Water Finance
Authority Water & Sewer System Revenue | | | |
4.00% 6/15/50
(SPA - JPMorgan Chase Bank, N.A) | | 1,400,000 | 1,400,000 |
Series AA-3 3.80% 6/15/49
(SPA - TD Bank, N.A.) | | 700,000 | 700,000 |
Series DD-1 3.80% 6/15/43
(SPA - TD Bank, N.A.) | | 1,000,000 | 1,000,000 |
Subordinate Series BB-2 3.83% 6/15/44
(SPA - Mizuho Bank) | | 2,200,000 | 2,200,000 |
New York City, New York Transitional Finance Authority
Future Tax Secured Revenue | | | |
(Adjustable Rate Bonds) Subordinate Series C-4 3.90% 11/1/44
(SPA - Barclays Bank) | | 700,000 | 700,000 |
| New York Metropolitan Transportation Authority Revenue | | | |
| (Dedicated Tax Fund Variable Rate Refunding Bonds) Series A2 3.80% 11/1/26 | | 300,000 | 300,000 |
Schedules of investments
Delaware Tax-Free New York Fund
| | | Principal
amount° | Value (US $) |
| Short-Term Investments (continued) |
| Variable Rate Demand Notes¤ (continued) |
| New York Triborough Bridge & Tunnel Authority Revenue | | | |
Series B 3.80% 1/1/32
(LOC - TD Bank, N.A.) | | 1,200,000 | $ 1,200,000 |
| Total Short-Term Investments (cost $7,500,000) | 7,500,000 |
Total Value of Securities—99.32%
(cost $260,625,179) | | | $262,681,511 |
| ° | Principal amount shown is stated in USD unless noted that the security is denominated in another currency. |
| # | Security exempt from registration under Rule 144A of the Securities Act of 1933, as amended. At August 31, 2024, the aggregate value of Rule 144A securities was $22,034,563, which represents 8.33% of the Fund’s net assets. See Note 10 in “Notes to financial statements.” |
| ‡ | Non-income producing security. Security is currently in default. |
| ^ | Zero-coupon security. The rate shown is the effective yield at the time of purchase. |
| ♦ | Pass Through Agreement. Security represents the contractual right to receive a proportionate amount of underlying payments due to the counterparty pursuant to various agreements related to the rescheduling of obligations and the exchange of certain notes. |
| • | Variable rate investment. Rates reset periodically. Rate shown reflects the rate in effect at August 31, 2024. For securities based on a published reference rate and spread, the reference rate and spread are indicated in their descriptions. The reference rate descriptions (i.e. SOFR01M, SOFR03M, etc.) used in this report are identical for different securities, but the underlying reference rates may differ due to the timing of the reset period. Certain variable rate securities are not based on a published reference rate and spread but are determined by the issuer or agent and are based on current market conditions, or for mortgage-backed securities, are impacted by the individual mortgages which are paying off over time. These securities do not indicate a reference rate and spread in their descriptions. |
| ¤ | Tax-exempt obligations that contain a floating or variable interest rate adjustment formula and an unconditional right of demand to receive payment of the unpaid principal balance plus accrued interest upon a short notice period (generally up to 30 days) prior to specified dates either from the issuer or by drawing on a bank letter of credit, a guarantee, or insurance issued with respect to such instrument. Each rate shown is as of August 31, 2024. |
| Summary of abbreviations: |
| AGC – Insured by Assured Guaranty Corporation |
| AGM – Insured by Assured Guaranty Municipal Corporation |
| AMBAC – Insured by American Municipal Bond Assurance Corporation |
| Summary of abbreviations: (continued) |
| AMT – Subject to Alternative Minimum Tax |
| BAM – Insured by Build America Mutual Assurance |
| KIPP – Knowledge is Power Program |
| LLC – Limited Liability Corporation |
| LOC – Letter of Credit |
| N.A. – National Association |
| SOFR01M – Secured Overnight Financing Rate 1 Month |
| SOFR03M – Secured Overnight Financing Rate 3 Month |
| SPA – Stand-by Purchase Agreement |
| USD – US Dollar |
See accompanying notes, which are an integral part of the financial statements.
Schedules of investments
| Delaware Tax-Free Pennsylvania Fund | August 31, 2024 |
| | | Principal
amount° | Value (US $) |
| Municipal Bonds — 98.63% |
| Education Revenue Bonds — 11.76% |
Allegheny County, Pennsylvania Higher Education
Building Authority Revenue | | | |
(Robert Morris University)
5.00% 10/15/47 | | 1,500,000 | $ 1,362,360 |
| Bethlehem Redevelopment Authority Revenue | | | |
(Moravian University Project)
Series 2024 5.50% 10/1/54 | | 3,000,000 | 3,168,420 |
Bucks County, Pennsylvania Industrial Development
Authority Revenue | | | |
(School Lane Charter School Project)
Series A 5.125% 3/15/46 | | 2,500,000 | 2,509,050 |
Chester County, Pennsylvania Industrial Development
Authority Revenue | | | |
| (Avon Grove Charter School Project) | | | |
| Series A 5.00% 12/15/47 | | 1,160,000 | 1,165,556 |
| Series A 5.00% 12/15/51 | | 770,000 | 771,247 |
| (Renaissance Academy Charter School Project) | | | |
| 5.00% 10/1/34 | | 1,000,000 | 1,000,250 |
| 5.00% 10/1/39 | | 1,250,000 | 1,250,100 |
| 5.00% 10/1/44 | | 1,000,000 | 999,920 |
(Westtown School)
Series A 4.00% 1/1/52 | | 2,250,000 | 2,115,518 |
City of Erie, Pennsylvania Higher Education Building
Authority Revenue | | | |
(AICUP Financing Program - Gannon University Project)
Series TT1 4.00% 5/1/41 | | 475,000 | 415,259 |
Lehigh County, Pennsylvania General Purpose Authority
Revenue | | | |
(Muhlenberg College Project)
Series 2024 5.25% 2/1/54 | | 1,350,000 | 1,435,725 |
Montgomery County, Pennsylvania Higher Education and
Health Authority Revenue | | | |
(AICUP Financing Program - Gwynedd Mercy University Project)
5.00% 5/1/42 | | 2,500,000 | 2,563,475 |
Montgomery County, Pennsylvania Industrial
Development Authority Revenue | | | |
(AICUP Financing Program - Gwynedd Mercy University Project)
Series VV1 5.75% 5/1/48 | | 1,500,000 | 1,584,915 |
(Germantown Academy Project)
Series A 4.00% 10/1/51 | | 1,430,000 | 1,239,424 |
| | | Principal
amount° | Value (US $) |
| Municipal Bonds (continued) |
| Education Revenue Bonds (continued) |
Pennsylvania Economic Development Financing Authority
Revenue | | | |
(Villanova University Project)
Series 2024 5.00% 8/1/49 | | 1,500,000 | $ 1,660,155 |
Pennsylvania Higher Educational Facilities Authority
Revenue | | | |
(Ursinus College Project)
Series A 5.00% 11/1/32 | | 1,130,000 | 1,180,647 |
| Pennsylvania State University | | | |
| 5.25% 9/1/53 | | 3,000,000 | 3,327,900 |
| 5.25% 9/1/54 | | 3,000,000 | 3,360,150 |
| Series A 5.25% 9/1/52 | | 2,000,000 | 2,200,640 |
Philadelphia, Pennsylvania Authority for Industrial
Development Revenue | | | |
| (International Apartments of Temple University) | | | |
| Series A 5.375% 6/15/30 ‡ | | 1,145,000 | 973,250 |
| Series A 5.625% 6/15/42 ‡ | | 3,000,000 | 2,550,000 |
(Saint Joseph's University Project)
5.50% 11/1/60 | | 6,000,000 | 6,506,640 |
| Swarthmore Borough, Pennsylvania Authority Revenue | | | |
(Swarthmore College)
5.00% 9/15/53 | | 2,840,000 | 3,099,917 |
Upper Dauphin, Pennsylvania Industrial Development
Authority Revenue | | | |
| (Pennsylvania Steam Academy Charter School Project) | | | |
| Series A 144A 6.25% 7/1/57 # | | 2,500,000 | 2,502,775 |
| Series B 144A 6.00% 7/1/29 # | | 235,000 | 233,550 |
| | 49,176,843 |
| Electric Revenue Bonds — 0.48% |
| Puerto Rico Electric Power Authority Revenue | | | |
| Series A 5.00% 7/1/42 ‡ | | 1,110,000 | 599,400 |
| Series A 5.05% 7/1/42 ‡ | | 400,000 | 216,000 |
| Series WW 5.25% 7/1/33 ‡ | | 1,055,000 | 569,700 |
| Series WW 5.50% 7/1/38 ‡ | | 1,190,000 | 642,600 |
| | 2,027,700 |
| Healthcare Revenue Bonds — 32.05% |
Allegheny County, Pennsylvania Hospital Development
Authority Revenue | | | |
| (Allegheny Health Network Obligated Group Issue) | | | |
| Series A 4.00% 4/1/44 | | 2,640,000 | 2,492,345 |
Schedules of investments
Delaware Tax-Free Pennsylvania Fund
| | | Principal
amount° | Value (US $) |
| Municipal Bonds (continued) |
| Healthcare Revenue Bonds (continued) |
Allegheny County, Pennsylvania Hospital Development
Authority Revenue | | | |
| (Allegheny Health Network Obligated Group Issue) |
| Series A 5.00% 4/1/47 | | 13,240,000 | $ 13,529,558 |
| (University of Pittsburgh Medical Center) | | | |
| Series A 4.00% 7/15/38 | | 1,125,000 | 1,129,500 |
| Series A 4.00% 7/15/39 | | 2,000,000 | 1,999,360 |
Berks County, Pennsylvania Industrial Development
Authority Revenue | | | |
| (The Highlands at Wyomissing) | | | |
| Series A 5.00% 5/15/37 | | 1,365,000 | 1,387,277 |
| Series A 5.00% 5/15/42 | | 470,000 | 473,144 |
| Series A 5.00% 5/15/47 | | 600,000 | 601,302 |
| Series C 5.00% 5/15/42 | | 1,000,000 | 1,006,690 |
| Series C 5.00% 5/15/47 | | 1,000,000 | 1,002,170 |
Bucks County, Pennsylvania Industrial Development
Authority Revenue | | | |
| (St. Luke's University Health Network Project) | | | |
| 3.00% 8/15/53 | | 3,000,000 | 2,227,260 |
| 4.00% 8/15/50 | | 1,400,000 | 1,286,712 |
| 4.00% 8/15/50 (BAM) | | 1,600,000 | 1,536,736 |
| Butler County, Pennsylvania Hospital Authority Revenue | | | |
(Butler Health System Project)
Series A 5.00% 7/1/39 | | 1,625,000 | 1,592,337 |
| Centre County, Pennsylvania Hospital Authority Revenue | | | |
(Mount Nittany Medical Center Project)
Series A 4.00% 11/15/47 | | 1,400,000 | 1,342,306 |
Chester County, Pennsylvania Health and Education
Facilities Authority Revenue | | | |
(Main Line Health System)
Series A 4.00% 9/1/50 | | 2,060,000 | 1,920,002 |
Cumberland County, Pennsylvania Municipal Authority
Revenue | | | |
(Asbury Pennsylvania Obligated Group)
5.00% 1/1/45 | | 3,000,000 | 2,810,580 |
(Diakon Lutheran Social Ministries)
5.00% 1/1/38 | | 995,000 | 996,254 |
(Penn State Health)
Series A 4.00% 11/1/44 | | 5,000,000 | 4,831,350 |
| Doylestown, Pennsylvania Hospital Authority Revenue | | | |
| 144A 5.375% 7/1/39 # | | 1,000,000 | 1,060,650 |
| | | Principal
amount° | Value (US $) |
| Municipal Bonds (continued) |
| Healthcare Revenue Bonds (continued) |
| DuBois, Pennsylvania Hospital Authority Revenue | | | |
| (Penn Highlands Healthcare) | | | |
| 4.00% 7/15/45 | | 1,495,000 | $ 1,374,458 |
| 4.00% 7/15/48 | | 2,000,000 | 1,760,320 |
Geisinger Authority, Pennsylvania Health System
Revenue | | | |
(Geisinger Health System)
Series A-2 5.00% 2/15/39 | | 1,150,000 | 1,184,661 |
Lancaster County, Pennsylvania Hospital Authority
Revenue | | | |
| (Brethren Village Project) | | | |
| 5.00% 7/1/31 | | 130,000 | 130,738 |
| 5.25% 7/1/35 | | 250,000 | 250,783 |
| 5.50% 7/1/45 | | 1,000,000 | 1,000,790 |
(Landis Homes Retirement Community Project)
Series A 5.00% 7/1/45 | | 2,000,000 | 2,006,780 |
| (Masonic Villages Project) | | | |
| 5.00% 11/1/35 | | 1,000,000 | 1,039,300 |
| 5.00% 11/1/36 | | 510,000 | 528,906 |
| 5.00% 11/1/37 | | 250,000 | 259,080 |
| 5.125% 11/1/38 | | 3,500,000 | 3,811,395 |
Lehigh County, Pennsylvania General Purpose Hospital
Authority Revenue | | | |
(Lehigh Valley Health Network)
Series A 4.00% 7/1/49 | | 11,105,000 | 10,371,515 |
Maxatawny Township, Pennsylvania Municipal Authority
Revenue | | | |
(Diakon Lutheran Social Ministries Project)
Series A 4.50% 1/1/45 | | 2,000,000 | 1,935,140 |
| Monroeville, Pennsylvania Finance Authority Revenue | | | |
| Series B 4.00% 2/15/41 | | 2,100,000 | 2,074,947 |
Montgomery County, Pennsylvania Higher Education and
Health Authority Revenue | | | |
| (Thomas Jefferson University) | | | |
| Series A 4.00% 9/1/49 | | 2,500,000 | 2,333,925 |
| Series B 4.00% 5/1/47 | | 4,000,000 | 3,776,080 |
| Series B 4.00% 5/1/52 | | 5,950,000 | 5,561,703 |
| Series B 4.00% 5/1/56 (BAM) | | 2,550,000 | 2,379,354 |
| Series B 5.00% 5/1/57 | | 3,000,000 | 3,133,050 |
Schedules of investments
Delaware Tax-Free Pennsylvania Fund
| | | Principal
amount° | Value (US $) |
| Municipal Bonds (continued) |
| Healthcare Revenue Bonds (continued) |
Montgomery County, Pennsylvania Industrial
Development Authority Revenue | | | |
(Foulkeways at Gwynedd Project)
5.00% 12/1/46 | | 1,500,000 | $ 1,505,595 |
(Waverly Heights Project)
Series 2019 4.00% 12/1/37 | | 300,000 | 298,617 |
| (Whitemarsh Continuing Care Retirement Community Project) | | | |
| 4.00% 1/1/25 | | 75,000 | 74,840 |
| 5.375% 1/1/50 | | 4,035,000 | 3,886,149 |
| Series A 5.25% 1/1/48 | | 1,000,000 | 954,650 |
| Series A 5.375% 1/1/51 | | 1,600,000 | 1,537,824 |
Moon, Pennsylvania Industrial Development Authority
Revenue | | | |
(Baptist Homes Society)
6.125% 7/1/50 | | 4,090,000 | 2,803,041 |
Northampton County, Pennsylvania General Purpose
Authority Revenue | | | |
(St. Luke's University Health Network Project)
Series A1 5.25% 8/15/53 | | 1,500,000 | 1,631,700 |
Northampton County, Pennsylvania Industrial
Development Authority Revenue | | | |
(Morningstar Senior Living, Inc. Project)
5.00% 11/1/44 | | 1,000,000 | 927,960 |
Pennsylvania Economic Development Financing Authority
First Mortgage Revenue | | | |
| (Tapestry Moon Senior Housing Project) | | | |
| Series A 144A 6.50% 12/1/38 #, ‡ | | 715,000 | 272,594 |
| Series A 144A 6.75% 12/1/53 #, ‡ | | 5,400,000 | 2,058,750 |
Pennsylvania Economic Development Financing Authority
Revenue | | | |
| (Presbyterian Senior Living Project) | | | |
| Series B-1 5.25% 7/1/49 | | 2,750,000 | 2,914,395 |
| Series B-2 5.25% 7/1/46 | | 2,500,000 | 2,668,250 |
| (University of Pittsburgh Medical Center) | | | |
| Series A 4.00% 11/15/42 | | 5,200,000 | 5,091,996 |
| Series A 4.00% 2/15/52 | | 1,710,000 | 1,604,647 |
| Subordinate Series A-2 4.00% 5/15/48 | | 2,250,000 | 2,150,145 |
Pennsylvania Higher Educational Facilities Authority
Revenue | | | |
| (University of Pennsylvania Health System) | | | |
| 4.00% 8/15/49 | | 7,660,000 | 7,387,610 |
| | | Principal
amount° | Value (US $) |
| Municipal Bonds (continued) |
| Healthcare Revenue Bonds (continued) |
Pennsylvania Higher Educational Facilities Authority
Revenue | | | |
| (University of Pennsylvania Health System) |
| Series A 4.00% 8/15/42 | | 2,000,000 | $ 1,977,360 |
| Series B 4.00% 8/15/40 | | 1,345,000 | 1,375,330 |
Philadelphia, Pennsylvania Authority for Industrial
Development Revenue | | | |
(Thomas Jefferson University)
Series A 5.00% 9/1/47 | | 2,500,000 | 2,528,700 |
(Wesley Enhanced Living Obligated Group)
Series A 5.00% 7/1/49 | | 2,500,000 | 2,208,450 |
| | 133,997,061 |
| Housing Revenue Bonds — 4.08% |
Pennsylvania Housing Finance Agency Single Family
Mortgage Revenue | | | |
| (Social Bonds) | | | |
| Series 142A 5.00% 10/1/50 | | 5,000,000 | 5,165,800 |
| Series 143A 5.30% 4/1/44 | | 4,645,000 | 4,897,967 |
| Series 143A 5.45% 4/1/51 | | 3,750,000 | 3,964,612 |
| Series 146A 4.75% 4/1/53 | | 3,000,000 | 3,025,500 |
| | 17,053,879 |
| Industrial Development Revenue/Pollution ControlRevenue Bonds — 8.85% |
Allegheny County, Pennsylvania Industrial Development
Authority Revenue | | | |
| (United States Steel Corporation Project) | | | |
| 4.875% 11/1/24 | | 2,650,000 | 2,653,948 |
| 5.125% 5/1/30 | | 750,000 | 808,065 |
| 5.75% 8/1/42 (AMT) | | 725,000 | 725,508 |
Allentown, Pennsylvania Neighborhood Improvement
Zone Development Authority Revenue | | | |
(City Center Project)
144A 5.00% 5/1/42 # | | 1,000,000 | 1,023,080 |
Chester County, Pennsylvania Industrial Development
Authority Revenue | | | |
| (Longwood Gardens, Inc. Project) | | | |
| Series 2021 4.00% 12/1/46 | | 1,330,000 | 1,299,756 |
| Series 2021 4.00% 12/1/51 | | 2,635,000 | 2,497,163 |
Schedules of investments
Delaware Tax-Free Pennsylvania Fund
| | | Principal
amount° | Value (US $) |
| Municipal Bonds (continued) |
| Industrial Development Revenue/Pollution ControlRevenue Bonds (continued) |
Children's Trust Fund, Commonwealth of Puerto Rico
Revenue | | | |
(Tobacco Settlement Asset-Backed)
Series A 8.21% 5/15/57 ^ | | 95,000,000 | $ 6,537,900 |
Pennsylvania Commonwealth Financing Authority
Revenue | | | |
(Tobacco Master Settlement Payment Revenue)
4.00% 6/1/39 (AGM) | | 5,045,000 | 5,071,688 |
Pennsylvania Economic Development Financing Authority
Revenue | | | |
(National Gypsum)
5.50% 11/1/44 (AMT) | | 4,000,000 | 4,005,240 |
Pennsylvania Economic Development Financing Authority
Solid Waste Disposal Revenue | | | |
(Proctor & Gamble Paper Project)
5.375% 3/1/31 (AMT) | | 11,000,000 | 12,362,020 |
| | 36,984,368 |
| Lease Revenue Bonds — 0.89% |
Pennsylvania Economic Development Financing Authority
Tax-Exempt Private Activity Revenue | | | |
| (Pennsylvania Rapid Bridge Replacement Project) | | | |
| Series 2015 5.00% 12/31/29 (AMT) | | 500,000 | 513,970 |
| Series 2015 5.00% 12/31/34 (AMT) | | 2,115,000 | 2,164,766 |
| Philadelphia, Pennsylvania Municipal Authority Revenue | | | |
(Juvenile Justice Services Center)
5.00% 4/1/38 | | 1,000,000 | 1,036,490 |
| | 3,715,226 |
| Local General Obligation Bonds — 3.42% |
| City of Philadelphia, Pennsylvania | | | |
| 5.00% 8/1/41 | | 1,260,000 | 1,304,163 |
| Series A 4.00% 5/1/42 | | 500,000 | 490,330 |
| City of Pittsburgh, Pennsylvania | | | |
| 5.00% 9/1/41 | | 1,000,000 | 1,081,910 |
| 5.00% 9/1/42 | | 1,000,000 | 1,077,420 |
| 5.00% 9/1/43 | | 500,000 | 536,320 |
| Council Rock, Pennsylvania School District | | | |
| 4.00% 11/15/52 | | 2,975,000 | 2,904,046 |
| Marple Newtown, Pennsylvania School District | | | |
| 3.00% 6/1/40 | | 3,740,000 | 3,327,590 |
| | | Principal
amount° | Value (US $) |
| Municipal Bonds (continued) |
| Local General Obligation Bonds (continued) |
| Township of Lower Paxton, Pennsylvania | | | |
| Series A 4.00% 4/1/50 | | 1,100,000 | $ 1,070,905 |
| West Branch Area School District, Pennsylvania | | | |
| 4.00% 5/15/41 (AGM) | | 930,000 | 929,777 |
| 4.00% 5/15/44 (AGM) | | 1,595,000 | 1,559,511 |
| | 14,281,972 |
| Pre-Refunded/Escrowed to Maturity Bonds — 0.84% |
Berks County, Pennsylvania Industrial Development
Authority Revenue | | | |
| (The Highlands at Wyomissing) | | | |
| 5.00% 5/15/38-25 § | | 415,000 | 428,853 |
| 5.00% 5/15/43-25 § | | 500,000 | 516,690 |
| 5.00% 5/15/48-25 § | | 1,000,000 | 1,033,380 |
Cumberland County, Pennsylvania Municipal Authority
Revenue | | | |
(Diakon Lutheran Social Ministries)
5.00% 1/1/38-25 § | | 1,005,000 | 1,011,261 |
Pennsylvania Higher Educational Facilities Authority
Revenue | | | |
(University of the Arts)
5.20% 3/15/25 (AGC) | | 515,000 | 521,334 |
| Philadelphia, Pennsylvania School District | | | |
| Series F 5.00% 9/1/38-26 § | | 5,000 | 5,236 |
| | 3,516,754 |
| Special Tax Revenue Bonds — 19.14% |
Allentown, Pennsylvania Neighborhood Improvement
Zone Development Authority Revenue | | | |
(City Center Project)
144A 5.25% 5/1/42 # | | 4,300,000 | 4,334,185 |
(Forward Delivery)
5.00% 5/1/42 | | 2,000,000 | 2,075,640 |
Chester County, Pennsylvania Industrial Development
Authority Revenue | | | |
(Woodlands at Greystone Project)
144A 5.125% 3/1/48 # | | 802,000 | 780,466 |
| Commonwealth of Puerto Rico Revenue | | | |
| 1.724% 11/1/51 • | | 785,142 | 503,473 |
| 2.859% 11/1/43 • | | 9,279,961 | 5,881,175 |
| GDB Debt Recovery Authority of Puerto Rico Revenue | | | |
(Taxable)
7.50% 8/20/40 | | 16,420,643 | 16,010,127 |
Schedules of investments
Delaware Tax-Free Pennsylvania Fund
| | | Principal
amount° | Value (US $) |
| Municipal Bonds (continued) |
| Special Tax Revenue Bonds (continued) |
Matching Fund Special Purpose Securitization, Virgin
Islands Revenue | | | |
| Series A 5.00% 10/1/39 | | 5,040,000 | $ 5,255,561 |
Northampton County, Pennsylvania Industrial
Development Authority Revenue | | | |
(Route 33 Project)
7.00% 7/1/32 | | 1,510,000 | 1,512,733 |
| Puerto Rico Sales Tax Financing Revenue | | | |
| (Restructured) | | | |
| Series A-1 4.75% 7/1/53 | | 7,858,000 | 7,798,986 |
| Series A-1 5.00% 7/1/58 | | 5,000,000 | 5,022,100 |
| Series A-1 5.614% 7/1/46 ^ | | 26,050,000 | 8,783,800 |
| Series A-1 5.716% 7/1/51 ^ | | 16,638,000 | 4,083,132 |
| Series A-2 4.329% 7/1/40 | | 5,201,000 | 5,143,737 |
| Series A-2 4.536% 7/1/53 | | 1,000,000 | 959,250 |
Southeastern Pennsylvania Transportation Authority
Revenue | | | |
(Asset Improvement Program)
5.25% 6/1/52 | | 10,000,000 | 10,882,900 |
Washington County, Pennsylvania Redevelopment
Authority Revenue | | | |
(Victory Centre Tax Increment Financing Project)
5.00% 7/1/35 | | 1,000,000 | 1,004,650 |
| | 80,031,915 |
| State General Obligation Bonds — 1.98% |
| Commonwealth of Pennsylvania | | | |
| 4.00% 10/1/39 | | 1,000,000 | 1,024,760 |
| Series D 4.00% 8/15/34 | | 1,370,000 | 1,378,316 |
| Commonwealth of Puerto Rico Revenue | | | |
| (Restructured) | | | |
| Series A-1 4.00% 7/1/37 | | 2,172,745 | 2,125,662 |
| Series A-1 4.00% 7/1/41 | | 1,169,072 | 1,111,156 |
| Series A-1 4.00% 7/1/46 | | 2,830,000 | 2,627,740 |
| | 8,267,634 |
| Transportation Revenue Bonds — 13.83% |
Allegheny County, Pennsylvania Airport Authority
Revenue | | | |
| Series A 4.00% 1/1/38 (AMT) | | 1,400,000 | 1,381,268 |
| Series A 5.00% 1/1/56 (AMT) | | 2,505,000 | 2,572,710 |
(Pittsburgh International Airport)
Series A 5.50% 1/1/53 (AGM) (AMT) | | 1,260,000 | 1,370,918 |
| | | Principal
amount° | Value (US $) |
| Municipal Bonds (continued) |
| Transportation Revenue Bonds (continued) |
| City of Philadelphia, Pennsylvania Airport Revenue | | | |
| 4.00% 7/1/46 (AGM) (AMT) | | 3,125,000 | $ 3,001,375 |
| 5.00% 7/1/51 (AMT) | | 3,000,000 | 3,097,260 |
| Series A 4.00% 7/1/33 | | 10,000,000 | 10,366,500 |
| Delaware River Joint Toll Bridge Commission Revenue | | | |
(Pennsylvania - New Jersey)
5.00% 7/1/42 | | 5,000,000 | 5,187,200 |
Pennsylvania Economic Development Financing Authority
Revenue | | | |
| Series B-2 4.859% 1/1/45 (BAM) ^ | | 3,345,000 | 1,386,235 |
| Series B-2 5.52% 1/1/46 (BAM) ^ | | 1,885,000 | 741,879 |
| Series B-2 5.54% 1/1/47 (BAM) ^ | | 2,050,000 | 765,962 |
Pennsylvania Turnpike Commission Oil Franchise Tax
Revenue | | | |
| Series A 5.00% 12/1/46 | | 2,750,000 | 2,960,293 |
| Pennsylvania Turnpike Commission Revenue | | | |
| Series A 4.00% 12/1/38 | | 2,250,000 | 2,298,960 |
| Series A 5.00% 12/1/44 | | 2,000,000 | 2,106,700 |
| Series A-1 5.00% 12/1/45 | | 1,000,000 | 1,007,320 |
| Series C 3.00% 12/1/51 | | 2,825,000 | 2,208,952 |
| Series C 5.00% 12/1/44 | | 1,000,000 | 1,115,710 |
| Subordinate Series A 3.00% 12/1/42 | | 2,000,000 | 1,723,760 |
| Subordinate Series A 4.00% 12/1/49 (AGM) | | 2,375,000 | 2,306,624 |
| Subordinate Series B 3.00% 12/1/51 | | 7,550,000 | 5,883,790 |
| Subordinate Series B 4.00% 12/1/51 | | 1,200,000 | 1,124,904 |
(Subordinate)
Series A 4.00% 12/1/43 (BAM) | | 1,785,000 | 1,787,892 |
Puerto Rico Industrial, Tourist, Educational, Medical &
Environmental Control Facilities Financing Authority Revenue | | | |
(San Juan Cruise Terminal Project)
Series A-3 6.50% 1/1/41 (AMT) | | 2,000,000 | 2,392,440 |
Susquehanna Area, Pennsylvania Regional Airport
Authority Revenue | | | |
| 5.00% 1/1/38 (AMT) | | 1,000,000 | 1,015,810 |
| | 57,804,462 |
| Water & Sewer Revenue Bonds — 1.31% |
Allegheny County, Pennsylvania Sanitary Authority
Revenue | | | |
| 5.00% 6/1/53 | | 2,125,000 | 2,251,926 |
Schedules of investments
Delaware Tax-Free Pennsylvania Fund
| | | Principal
amount° | Value (US $) |
| Municipal Bonds (continued) |
| Water & Sewer Revenue Bonds (continued) |
Lehigh County, Pennsylvania Water & Sewer Authority
Revenue | | | |
(City of Allentown Concession)
Series 2024 5.00% 12/1/40 (BAM) | | 2,820,000 | $ 3,218,720 |
| | 5,470,646 |
| Total Municipal Bonds (cost $408,094,734) | 412,328,460 |
|
|
|
| Short-Term Investments — 0.86% |
| Variable Rate Demand Notes — 0.86%¤ |
Lancaster County, Pennsylvania Hospital Authority
Revenue | | | |
(Masonic Homes Project) Series D 3.90% 7/1/34
(LOC - JP Morgan Chase Bank) | | 1,800,000 | 1,800,000 |
Northampton County, Pennsylvania General Purpose
Authority Revenue | | | |
(St. Luke's University Health Network Project) Series B 3.80% 8/15/54
(TD Bank, N.A.) | | 1,800,000 | 1,800,000 |
| Total Short-Term Investments (cost $3,600,000) | 3,600,000 |
Total Value of Securities—99.49%
(cost $411,694,734) | | | $415,928,460 |
| ° | Principal amount shown is stated in USD unless noted that the security is denominated in another currency. |
| ‡ | Non-income producing security. Security is currently in default. |
| # | Security exempt from registration under Rule 144A of the Securities Act of 1933, as amended. At August 31, 2024, the aggregate value of Rule 144A securities was $12,266,050, which represents 2.93% of the Fund’s net assets. See Note 10 in “Notes to financial statements.” |
| ^ | Zero-coupon security. The rate shown is the effective yield at the time of purchase. |
| § | Pre-refunded bonds. Municipal bonds that are generally backed or secured by US Treasury bonds. For pre-refunded bonds, the stated maturity is followed by the year in which the bond will be pre-refunded. See Note 10 in “Notes to financial statements.” |
| • | Variable rate investment. Rates reset periodically. Rate shown reflects the rate in effect at August 31, 2024. For securities based on a published reference rate and spread, the reference rate and spread are indicated in their descriptions. The reference rate descriptions (i.e. SOFR01M, SOFR03M, etc.) used in this report are identical for different securities, but the underlying reference rates may differ due to the timing of the reset period. Certain variable rate securities are not based on a published reference rate and spread but are determined by the issuer or agent and are based on current market conditions, or for mortgage-backed securities, are impacted by the individual mortgages which are paying off over time. These securities do not indicate a reference rate and spread in their descriptions. |
| ¤ | Tax-exempt obligations that contain a floating or variable interest rate adjustment formula and an unconditional right of demand to receive payment of the unpaid principal balance plus accrued interest upon a short notice period (generally up to 30 days) prior to specified dates either from the issuer or by drawing on a bank letter of credit, a guarantee, or insurance issued with respect to such instrument. Each rate shown is as of August 31, 2024. |
| Summary of abbreviations: |
| AGC – Insured by Assured Guaranty Corporation |
| AGM – Insured by Assured Guaranty Municipal Corporation |
| AICUP – Association of Independent Colleges & Universities of Pennsylvania |
| AMT – Subject to Alternative Minimum Tax |
| BAM – Insured by Build America Mutual Assurance |
| LOC – Letter of Credit |
| N.A. – National Association |
| SOFR01M – Secured Overnight Financing Rate 1 Month |
| SOFR03M – Secured Overnight Financing Rate 3 Month |
| USD – US Dollar |
See accompanying notes, which are an integral part of the financial statements.
Statements of assets and liabilities
August 31, 2024
| | Delaware Tax-Free
Arizona Fund | | Delaware Tax-Free
California Fund | | Delaware Tax-Free
Colorado Fund |
| Assets: | | | | | |
| Investments, at value* | $57,537,613 | | $286,431,685 | | $223,092,900 |
| Cash | 86,354 | | 1,409,144 | | 490,581 |
| Dividend and interest receivable | 510,745 | | 2,910,932 | | 2,256,061 |
| Prepaid expenses | 41,240 | | 39,986 | | 40,195 |
| Receivable for fund shares sold | 848 | | 112,143 | | 45,818 |
| Other assets | 617 | | 959 | | 1,741 |
| Total Assets | 58,177,417 | | 290,904,849 | | 225,927,296 |
| Liabilities: | | | | | |
| Payable for fund shares redeemed | 83,033 | | 798,049 | | 938,843 |
| Other accrued expenses | 66,324 | | 95,163 | | 81,799 |
| Investment management fees payable to affiliates | 63,675 | | 111,267 | | 133,953 |
| Distribution payable | 14,459 | | 71,235 | | 56,133 |
| Distribution fees payable to affiliates | 9,915 | | 20,903 | | 28,808 |
| Payable for securities purchased | — | | 2,599,403 | | 750,000 |
| Total Liabilities | 237,406 | | 3,696,020 | | 1,989,536 |
| Total Net Assets | $57,940,011 | | $287,208,829 | | $223,937,760 |
| Net Assets Consist of: | | | | | |
| Paid-in capital | $63,583,735 | | $288,941,925 | | $235,647,791 |
| Total distributable earnings (loss) | (5,643,724) | | (1,733,096) | | (11,710,031) |
| Total Net Assets | $57,940,011 | | $287,208,829 | | $223,937,760 |
| | Delaware Tax-Free
Arizona Fund | Delaware Tax-Free
California Fund | Delaware Tax-Free
Colorado Fund |
|
| Net Asset Value | | | |
|
| Class A: | | | |
| Net assets | $43,007,116 | $88,231,281 | $126,555,686 |
| Shares of beneficial interest outstanding, unlimited authorization, no par | 4,127,482 | 7,787,439 | 12,041,081 |
| Net asset value per share | $10.42 | $11.33 | $10.51 |
| Sales charge | 4.50% | 4.50% | 4.50% |
| Offering price per share, equal to net asset value per share / (1 - sales charge) | $10.91 | $11.86 | $11.01 |
|
| Class C: | | | |
| Net assets | $882,988 | $2,572,662 | $2,235,786 |
| Shares of beneficial interest outstanding, unlimited authorization, no par | 84,528 | 226,599 | 212,192 |
| Net asset value per share | $10.45 | $11.35 | $10.54 |
|
| Institutional Class: | | | |
| Net assets | $14,049,907 | $196,404,886 | $95,146,288 |
| Shares of beneficial interest outstanding, unlimited authorization, no par | 1,348,537 | 17,332,150 | 9,052,488 |
| Net asset value per share | $10.42 | $11.33 | $10.51 |
*Investments, at cost | $59,783,054 | $283,731,715 | $225,287,534 |
See accompanying notes, which are an integral part of the financial statements.
Statements of assets and liabilities
| | Delaware Tax-Free
Idaho Fund | | Delaware Tax-Free
New York Fund | | Delaware Tax-Free
Pennsylvania Fund |
| Assets: | | | | | |
| Investments, at value* | $131,856,637 | | $262,681,511 | | $415,928,460 |
| Cash | — | | 571,268 | | 1,501,473 |
| Dividend and interest receivable | 1,494,868 | | 2,720,658 | | 4,488,489 |
| Receivable for fund shares sold | 78,212 | | 561,282 | | 544,836 |
| Prepaid expenses | 56,213 | | 39,969 | | 40,534 |
| Other assets | 967 | | 1,460 | | 3,180 |
| Total Assets | 133,486,897 | | 266,576,148 | | 422,506,972 |
| Liabilities: | | | | | |
| Due to custodian | 148,389 | | — | | — |
| Payable for securities purchased | 2,297,040 | | 1,135,370 | | 3,353,040 |
| Payable for fund shares redeemed | 186,749 | | 596,791 | | 559,133 |
| Investment management fees payable to affiliates | 89,813 | | 118,889 | | 215,741 |
| Other accrued expenses | 70,313 | | 86,060 | | 134,004 |
| Distribution payable | 18,930 | | 124,498 | | 94,828 |
| Distribution fees payable to affiliates | 17,788 | | 37,932 | | 74,223 |
| Total Liabilities | 2,829,022 | | 2,099,540 | | 4,430,969 |
| Total Net Assets | $130,657,875 | | $264,476,608 | | $418,076,003 |
| Net Assets Consist of: | | | | | |
| Paid-in capital | $142,652,000 | | $266,426,628 | | $430,576,558 |
| Total distributable earnings (loss) | (11,994,125) | | (1,950,020) | | (12,500,555) |
| Total Net Assets | $130,657,875 | | $264,476,608 | | $418,076,003 |
| | Delaware Tax-Free
Idaho Fund | Delaware Tax-Free
New York Fund | Delaware Tax-Free
Pennsylvania Fund |
|
| Net Asset Value | | | |
|
| Class A: | | | |
| Net assets | $65,895,157 | $163,179,928 | $323,007,507 |
| Shares of beneficial interest outstanding, unlimited authorization, no par | 6,203,830 | 15,144,509 | 43,408,678 |
| Net asset value per share | $10.62 | $10.77 | $7.44 |
| Sales charge | 4.50% | 4.50% | 4.50% |
| Offering price per share, equal to net asset value per share / (1 - sales charge) | $11.12 | $11.28 | $7.79 |
|
| Class C: | | | |
| Net assets | $4,555,410 | $4,612,781 | $11,056,300 |
| Shares of beneficial interest outstanding, unlimited authorization, no par | 429,120 | 429,104 | 1,485,438 |
| Net asset value per share | $10.62 | $10.75 | $7.44 |
|
| Institutional Class: | | | |
| Net assets | $60,207,308 | $96,683,899 | $84,012,196 |
| Shares of beneficial interest outstanding, unlimited authorization, no par | 5,666,931 | 8,980,283 | 11,298,226 |
| Net asset value per share | $10.62 | $10.77 | $7.44 |
*Investments, at cost | $134,830,302 | $260,625,179 | $411,694,734 |
See accompanying notes, which are an integral part of the financial statements.
Statements of operations
Year ended August 31, 2024
| | Delaware Tax-Free
Arizona Fund | | Delaware Tax-Free
California Fund | | Delaware Tax-Free
Colorado Fund |
| Investment Income: | | | | | |
| Interest | $2,566,999 | | $10,896,029 | | $9,327,837 |
| Dividends | — | | — | | 29,634 |
| | 2,566,999 | | 10,896,029 | | 9,357,471 |
|
| Expenses: | | | | | |
| Management fees | 285,887 | | 1,331,456 | | 1,157,984 |
| Distribution expenses — Class A | 108,656 | | 200,334 | | 308,213 |
| Distribution expenses — Class C | 8,788 | | 24,395 | | 26,869 |
| Registration fees | 68,968 | | 74,064 | | 61,733 |
| Audit and tax fees | 45,921 | | 46,179 | | 45,921 |
| Accounting and administration expenses | 28,283 | | 59,328 | | 52,102 |
| Dividend disbursing and transfer agent fees and expenses | 26,490 | | 142,036 | | 121,457 |
| Legal fees | 19,348 | | 76,409 | | 42,942 |
| Reports and statements to shareholders expenses | 10,338 | | 37,986 | | 14,445 |
| Trustees’ fees | 2,540 | | 10,385 | | 8,233 |
| Custodian fees | 703 | | 2,547 | | 6,439 |
| Other | 10,190 | | 42,104 | | 23,327 |
| | 616,112 | | 2,047,223 | | 1,869,665 |
| Less expenses waived | (159,372) | | (481,977) | | (328,030) |
| Less expenses paid indirectly | (722) | | (2,618) | | (1,292) |
| Total operating expenses | 456,018 | | 1,562,628 | | 1,540,343 |
| Net Investment Income (Loss) | 2,110,981 | | 9,333,401 | | 7,817,128 |
|
| Net Realized and Unrealized Gain (Loss): | | | | | |
| Net realized gain (loss) on investments | (1,441,220) | | (1,651,543) | | (984,903) |
| Net change in unrealized appreciation (depreciation) on investments | 4,873,284 | | 15,010,486 | | 12,295,771 |
| Net Realized and Unrealized Gain (Loss) | 3,432,064 | | 13,358,943 | | 11,310,868 |
| Net Increase (Decrease) in Net Assets Resulting from Operations | $5,543,045 | | $22,692,344 | | $19,127,996 |
See accompanying notes, which are an integral part of the financial statements.
| | Delaware Tax-Free
Idaho Fund | | Delaware Tax-Free
New York Fund | | Delaware Tax-Free
Pennsylvania Fund |
| Investment Income: | | | | | |
| Interest | $5,299,829 | | $10,194,237 | | $18,515,114 |
| Dividends | 45,614 | | — | | — |
| | 5,345,443 | | 10,194,237 | | 18,515,114 |
|
| Expenses: | | | | | |
| Management fees | 682,199 | | 1,243,158 | | 2,145,047 |
| Distribution expenses — Class A | 163,561 | | 360,723 | | 763,530 |
| Distribution expenses — Class C | 44,961 | | 32,091 | | 95,518 |
| Dividend disbursing and transfer agent fees and expenses | 72,129 | | 124,190 | | 221,613 |
| Registration fees | 67,963 | | 70,555 | | 68,879 |
| Audit and tax fees | 45,921 | | 45,921 | | 45,921 |
| Accounting and administration expenses | 39,346 | | 55,186 | | 79,963 |
| Legal fees | 28,206 | | 44,769 | | 58,692 |
| Reports and statements to shareholders expenses | 11,151 | | 16,736 | | 6,318 |
| Trustees’ fees | 4,441 | | 9,763 | | 17,137 |
| Custodian fees | 1,455 | | 2,225 | | 3,577 |
| Other | 13,962 | | 16,030 | | 29,935 |
| | 1,175,295 | | 2,021,347 | | 3,536,130 |
| Less expenses waived | (206,159) | | (377,105) | | (390,344) |
| Less expenses paid indirectly | (1,158) | | (2,453) | | (3,741) |
| Total operating expenses | 967,978 | | 1,641,789 | | 3,142,045 |
| Net Investment Income (Loss) | 4,377,465 | | 8,552,448 | | 15,373,069 |
|
| Net Realized and Unrealized Gain (Loss): | | | | | |
| Net realized gain (loss) on investments | (393,049) | | (1,539,340) | | (833,634) |
| Net change in unrealized appreciation (depreciation) on investments | 6,872,458 | | 12,312,676 | | 20,655,283 |
| Net Realized and Unrealized Gain (Loss) | 6,479,409 | | 10,773,336 | | 19,821,649 |
| Net Increase (Decrease) in Net Assets Resulting from Operations | $10,856,874 | | $19,325,784 | | $35,194,718 |
See accompanying notes, which are an integral part of the financial statements.
Statements of changes in net assets
Delaware Tax-Free Arizona Fund
| | Year ended |
| | 8/31/24 | | 8/31/23 |
| Increase (Decrease) in Net Assets from Operations: | | | |
| Net investment income (loss) | $2,110,981 | | $2,203,289 |
| Net realized gain (loss) | (1,441,220) | | (1,651,704) |
| Net change in unrealized appreciation (depreciation) | 4,873,284 | | (2,578,957) |
| Net increase (decrease) in net assets resulting from operations | 5,543,045 | | (2,027,372) |
|
| Dividends and Distributions to Shareholders from: | | | |
| Distributable earnings: | | | |
| Class A | (1,542,571) | | (1,643,098) |
| Class C | (24,486) | | (23,479) |
| Institutional Class | (487,159) | | (500,798) |
| | (2,054,216) | | (2,167,375) |
|
| Capital Share Transactions (See Note 6): | | | |
| Proceeds from shares sold: | | | |
| Class A | 2,013,642 | | 3,574,099 |
| Class C | 257,270 | | 203,897 |
| Institutional Class | 4,530,733 | | 4,382,454 |
|
| Net asset value of shares issued upon reinvestment of dividends and distributions: | | | |
| Class A | 1,365,808 | | 1,466,847 |
| Class C | 24,486 | | 23,475 |
| Institutional Class | 468,511 | | 479,748 |
| | 8,660,450 | | 10,130,520 |
| | Year ended |
| | 8/31/24 | | 8/31/23 |
| Capital Share Transactions (continued): | | | |
| Cost of shares redeemed: | | | |
| Class A | $(8,679,770) | | $(13,153,564) |
| Class C | (288,916) | | (448,544) |
| Institutional Class | (4,498,926) | | (9,951,656) |
| | (13,467,612) | | (23,553,764) |
| Decrease in net assets derived from capital share transactions | (4,807,162) | | (13,423,244) |
| Net Decrease in Net Assets | (1,318,333) | | (17,617,991) |
|
| Net Assets: | | | |
| Beginning of year | 59,258,344 | | 76,876,335 |
| End of year | $57,940,011 | | $59,258,344 |
See accompanying notes, which are an integral part of the financial statements.
Statements of changes in net assets
Delaware Tax-Free California Fund
| | Year ended |
| | 8/31/24 | | 8/31/23 |
| Increase (Decrease) in Net Assets from Operations: | | | |
| Net investment income (loss) | $9,333,401 | | $6,649,150 |
| Net realized gain (loss) | (1,651,543) | | (1,542,727) |
| Net change in unrealized appreciation (depreciation) | 15,010,486 | | (3,894,500) |
| Net increase (decrease) in net assets resulting from operations | 22,692,344 | | 1,211,923 |
|
| Dividends and Distributions to Shareholders from: | | | |
| Distributable earnings: | | | |
| Class A | (2,886,232) | | (2,431,975) |
| Class C | (69,595) | | (59,702) |
| Institutional Class | (6,126,580) | | (4,027,340) |
| | (9,082,407) | | (6,519,017) |
|
| Capital Share Transactions (See Note 6): | | | |
| Proceeds from shares sold: | | | |
| Class A | 21,114,312 | | 12,292,940 |
| Class C | 567,766 | | 375,687 |
| Institutional Class | 85,705,446 | | 90,167,613 |
|
| Net assets from reorganization:1 | | | |
| Class A | 7,161,531 | | — |
| Class C | 357,099 | | — |
| Institutional Class | 4,402,146 | | — |
|
| Net asset value of shares issued upon reinvestment of dividends and distributions: | | | |
| Class A | 2,711,320 | | 2,227,676 |
| Class C | 67,433 | | 58,605 |
| Institutional Class | 5,591,014 | | 3,500,222 |
| | 127,678,067 | | 108,622,743 |
| | Year ended |
| | 8/31/24 | | 8/31/23 |
| Capital Share Transactions (continued): | | | |
| Cost of shares redeemed: | | | |
| Class A | $(16,582,877) | | $(14,852,977) |
| Class C | (561,654) | | (844,429) |
| Institutional Class | (40,366,205) | | (37,873,243) |
| | (57,510,736) | | (53,570,649) |
| Increase in net assets derived from capital share transactions | 70,167,331 | | 55,052,094 |
| Net Increase in Net Assets | 83,777,268 | | 49,745,000 |
|
| Net Assets: | | | |
| Beginning of year | 203,431,561 | | 153,686,561 |
| End of year | $287,208,829 | | $203,431,561 |
| 1 | See Note 7 in “Notes to financial statements.” |
See accompanying notes, which are an integral part of the financial statements.
Statements of changes in net assets
Delaware Tax-Free Colorado Fund
| | Year ended |
| | 8/31/24 | | 8/31/23 |
| Increase (Decrease) in Net Assets from Operations: | | | |
| Net investment income (loss) | $7,817,128 | | $7,596,620 |
| Net realized gain (loss) | (984,903) | | (5,137,100) |
| Net change in unrealized appreciation (depreciation) | 12,295,771 | | (3,603,204) |
| Net increase (decrease) in net assets resulting from operations | 19,127,996 | | (1,143,684) |
|
| Dividends and Distributions to Shareholders from: | | | |
| Distributable earnings: | | | |
| Class A | (4,380,176) | | (4,466,012) |
| Class C | (75,489) | | (99,573) |
| Institutional Class | (3,213,842) | | (2,867,680) |
| | (7,669,507) | | (7,433,265) |
|
| Capital Share Transactions (See Note 6): | | | |
| Proceeds from shares sold: | | | |
| Class A | 13,056,225 | | 7,142,609 |
| Class C | 319,105 | | 265,872 |
| Institutional Class | 39,440,328 | | 32,457,083 |
|
| Net asset value of shares issued upon reinvestment of dividends and distributions: | | | |
| Class A | 3,996,159 | | 4,097,868 |
| Class C | 73,942 | | 97,526 |
| Institutional Class | 2,975,770 | | 2,685,949 |
| | 59,861,529 | | 46,746,907 |
| | Year ended |
| | 8/31/24 | | 8/31/23 |
| Capital Share Transactions (continued): | | | |
| Cost of shares redeemed: | | | |
| Class A | $(24,544,156) | | $(21,503,738) |
| Class C | (1,399,457) | | (1,948,138) |
| Institutional Class | (34,235,513) | | (32,101,650) |
| | (60,179,126) | | (55,553,526) |
| Decrease in net assets derived from capital share transactions | (317,597) | | (8,806,619) |
| Net Increase (Decrease) in Net Assets | 11,140,892 | | (17,383,568) |
|
| Net Assets: | | | |
| Beginning of year | 212,796,868 | | 230,180,436 |
| End of year | $223,937,760 | | $212,796,868 |
See accompanying notes, which are an integral part of the financial statements.
Statements of changes in net assets
Delaware Tax-Free Idaho Fund
| | Year ended |
| | 8/31/24 | | 8/31/23 |
| Increase (Decrease) in Net Assets from Operations: | | | |
| Net investment income (loss) | $4,377,465 | | $3,971,062 |
| Net realized gain (loss) | (393,049) | | (2,376,811) |
| Net change in unrealized appreciation (depreciation) | 6,872,458 | | (2,403,529) |
| Net increase (decrease) in net assets resulting from operations | 10,856,874 | | (809,278) |
|
| Dividends and Distributions to Shareholders from: | | | |
| Distributable earnings: | | | |
| Class A | (2,209,529) | | (2,049,712) |
| Class C | (117,825) | | (117,116) |
| Institutional Class | (1,959,183) | | (1,697,616) |
| | (4,286,537) | | (3,864,444) |
|
| Capital Share Transactions (See Note 6): | | | |
| Proceeds from shares sold: | | | |
| Class A | 11,510,477 | | 16,995,143 |
| Class C | 1,034,787 | | 705,381 |
| Institutional Class | 19,373,306 | | 21,898,695 |
|
| Net asset value of shares issued upon reinvestment of dividends and distributions: | | | |
| Class A | 2,137,635 | | 1,953,262 |
| Class C | 117,725 | | 116,674 |
| Institutional Class | 1,820,272 | | 1,607,629 |
| | 35,994,202 | | 43,276,784 |
| | Year ended |
| | 8/31/24 | | 8/31/23 |
| Capital Share Transactions (continued): | | | |
| Cost of shares redeemed: | | | |
| Class A | $(15,991,095) | | $(18,952,998) |
| Class C | (1,348,873) | | (1,109,842) |
| Institutional Class | (14,994,347) | | (19,749,321) |
| | (32,334,315) | | (39,812,161) |
| Increase in net assets derived from capital share transactions | 3,659,887 | | 3,464,623 |
| Net Increase (Decrease) in Net Assets | 10,230,224 | | (1,209,099) |
|
| Net Assets: | | | |
| Beginning of year | 120,427,651 | | 121,636,750 |
| End of year | $130,657,875 | | $120,427,651 |
See accompanying notes, which are an integral part of the financial statements.
Statements of changes in net assets
Delaware Tax-Free New York Fund
| | Year ended |
| | 8/31/24 | | 8/31/23 |
| Increase (Decrease) in Net Assets from Operations: | | | |
| Net investment income (loss) | $8,552,448 | | $6,974,865 |
| Net realized gain (loss) | (1,539,340) | | (2,131,943) |
| Net change in unrealized appreciation (depreciation) | 12,312,676 | | (4,834,624) |
| Net increase (decrease) in net assets resulting from operations | 19,325,784 | | 8,298 |
|
| Dividends and Distributions to Shareholders from: | | | |
| Distributable earnings: | | | |
| Class A | (5,194,525) | | (4,350,900) |
| Class C | (90,774) | | (78,647) |
| Institutional Class | (3,023,666) | | (2,350,712) |
| | (8,308,965) | | (6,780,259) |
|
| Capital Share Transactions (See Note 6): | | | |
| Proceeds from shares sold: | | | |
| Class A | 46,696,952 | | 25,930,760 |
| Class C | 3,377,365 | | 548,305 |
| Institutional Class | 43,367,004 | | 36,258,510 |
|
| Net asset value of shares issued upon reinvestment of dividends and distributions: | | | |
| Class A | 4,427,555 | | 3,637,579 |
| Class C | 85,382 | | 65,957 |
| Institutional Class | 2,480,719 | | 2,018,704 |
| | 100,434,977 | | 68,459,815 |
| | Year ended |
| | 8/31/24 | | 8/31/23 |
| Capital Share Transactions (continued): | | | |
| Cost of shares redeemed: | | | |
| Class A | $(25,723,308) | | $(25,172,845) |
| Class C | (1,729,368) | | (1,546,228) |
| Institutional Class | (20,768,673) | | (32,708,869) |
| | (48,221,349) | | (59,427,942) |
| Increase in net assets derived from capital share transactions | 52,213,628 | | 9,031,873 |
| Net Increase in Net Assets | 63,230,447 | | 2,259,912 |
|
| Net Assets: | | | |
| Beginning of year | 201,246,161 | | 198,986,249 |
| End of year | $264,476,608 | | $201,246,161 |
See accompanying notes, which are an integral part of the financial statements.
Statements of changes in net assets
Delaware Tax-Free Pennsylvania Fund
| | Year ended |
| | 8/31/24 | | 8/31/23 |
| Increase (Decrease) in Net Assets from Operations: | | | |
| Net investment income (loss) | $15,373,069 | | $14,824,610 |
| Net realized gain (loss) | (833,634) | | (10,953,077) |
| Net change in unrealized appreciation (depreciation) | 20,655,283 | | (3,634,903) |
| Net increase (decrease) in net assets resulting from operations | 35,194,718 | | 236,630 |
|
| Dividends and Distributions to Shareholders from: | | | |
| Distributable earnings: | | | |
| Class A | (12,221,796) | | (11,855,458) |
| Class C | (302,591) | | (280,340) |
| Institutional Class | (2,909,620) | | (2,688,812) |
| | (15,434,007) | | (14,824,610) |
|
| Capital Share Transactions (See Note 6): | | | |
| Proceeds from shares sold: | | | |
| Class A | 66,616,955 | | 90,808,169 |
| Class C | 5,052,511 | | 1,929,675 |
| Institutional Class | 39,556,013 | | 30,568,725 |
|
| Net asset value of shares issued upon reinvestment of dividends and distributions: | | | |
| Class A | 11,017,413 | | 10,596,263 |
| Class C | 295,898 | | 271,565 |
| Institutional Class | 2,796,789 | | 2,610,502 |
| | 125,335,579 | | 136,784,899 |
| | Year ended |
| | 8/31/24 | | 8/31/23 |
| Capital Share Transactions (continued): | | | |
| Cost of shares redeemed: | | | |
| Class A | $(78,410,593) | | $(120,653,920) |
| Class C | (3,662,600) | | (3,528,529) |
| Institutional Class | (25,064,042) | | (39,578,290) |
| | (107,137,235) | | (163,760,739) |
| Increase (decrease) in net assets derived from capital share transactions | 18,198,344 | | (26,975,840) |
| Net Increase (Decrease) in Net Assets | 37,959,055 | | (41,563,820) |
|
| Net Assets: | | | |
| Beginning of year | 380,116,948 | | 421,680,768 |
| End of year | $418,076,003 | | $380,116,948 |
See accompanying notes, which are an integral part of the financial statements.
Financial highlights
Delaware Tax-Free Arizona Fund Class A
Selected data for each share of the Fund outstanding throughout each period were as follows:
| |
| |
Net asset value, beginning of period
|
| |
| Income (loss) from investment operations: |
Net investment income1
|
Net realized and unrealized gain (loss)
|
Total from investment operations
|
| |
| Less dividends and distributions from: |
Net investment income
|
Net realized gain
|
Total dividends and distributions
|
| |
Net asset value, end of period
|
| |
Total return3
|
| |
| Ratios and supplemental data: |
Net assets, end of period (000 omitted)
|
Ratio of expenses to average net assets
|
Ratio of expenses to average net assets prior to fees waived
|
Ratio of net investment income to average net assets
|
Ratio of net investment income to average net assets prior to fees waived
|
Portfolio turnover
|
| 1 | Calculated using average shares outstanding. |
| 2 | Amount is less than $(0.005) per share. |
| 3 | Total return is based on the change in net asset value of a share during the period and assumes reinvestment of dividends and distributions at net asset value and does not reflect the impact of a sales charge. Total return during the period presented reflects waivers by the manager and/or distributor (as applicable). Performance would have been lower had the waivers not been in effect. |
See accompanying notes, which are an integral part of the financial statements.
| Year ended |
| 8/31/24 | | 8/31/23 | | 8/31/22 | | 8/31/21 | | 8/31/20 |
| $9.78 | | $10.40 | | $12.09 | | $11.55 | | $11.70 |
| |
| | | | | | | | | |
| 0.37 | | 0.33 | | 0.30 | | 0.31 | | 0.33 |
| 0.63 | | (0.63) | | (1.61) | | 0.55 | | (0.13) |
| 1.00 | | (0.30) | | (1.31) | | 0.86 | | 0.20 |
| |
| | | | | | | | | |
| (0.36) | | (0.32) | | (0.30) | | (0.31) | | (0.35) |
| — | | —2 | | (0.08) | | (0.01) | | — |
| (0.36) | | (0.32) | | (0.38) | | (0.32) | | (0.35) |
| |
| $10.42 | | $9.78 | | $10.40 | | $12.09 | | $11.55 |
| |
| 10.39% | | (2.84%) | | (11.06%) | | 7.51% | | 1.79% |
| |
| | | | | | | | | |
| $43,007 | | $45,650 | | $56,882 | | $66,710 | | $62,186 |
| 0.84% | | 0.84% | | 0.84% | | 0.84% | | 0.84% |
| 1.12% | | 1.10% | | 1.01% | | 1.00% | | 1.01% |
| 3.65% | | 3.31% | | 2.70% | | 2.60% | | 2.87% |
| 3.37% | | 3.05% | | 2.53% | | 2.44% | | 2.70% |
| 18% | | 22% | | 30% | | 19% | | 36% |
Financial highlights
Delaware Tax-Free Arizona Fund Class C
Selected data for each share of the Fund outstanding throughout each period were as follows:
| |
| |
Net asset value, beginning of period
|
| |
| Income (loss) from investment operations: |
Net investment income1
|
Net realized and unrealized gain (loss)
|
Total from investment operations
|
| |
| Less dividends and distributions from: |
Net investment income
|
Net realized gain
|
Total dividends and distributions
|
| |
Net asset value, end of period
|
| |
Total return3
|
| |
| Ratios and supplemental data: |
Net assets, end of period (000 omitted)
|
Ratio of expenses to average net assets
|
Ratio of expenses to average net assets prior to fees waived
|
Ratio of net investment income to average net assets
|
Ratio of net investment income to average net assets prior to fees waived
|
Portfolio turnover
|
| 1 | Calculated using average shares outstanding. |
| 2 | Amount is less than $(0.005) per share. |
| 3 | Total return is based on the change in net asset value of a share during the period and assumes reinvestment of dividends and distributions at net asset value and does not reflect the impact of a sales charge. Total return during the period presented reflects waivers by the manager and/or distributor (as applicable). Performance would have been lower had the waivers not been in effect. |
See accompanying notes, which are an integral part of the financial statements.
| Year ended |
| 8/31/24 | | 8/31/23 | | 8/31/22 | | 8/31/21 | | 8/31/20 |
| $9.80 | | $10.43 | | $12.12 | | $11.58 | | $11.73 |
| |
| | | | | | | | | |
| 0.29 | | 0.26 | | 0.22 | | 0.22 | | 0.24 |
| 0.64 | | (0.64) | | (1.61) | | 0.55 | | (0.12) |
| 0.93 | | (0.38) | | (1.39) | | 0.77 | | 0.12 |
| |
| | | | | | | | | |
| (0.28) | | (0.25) | | (0.22) | | (0.22) | | (0.27) |
| — | | —2 | | (0.08) | | (0.01) | | — |
| (0.28) | | (0.25) | | (0.30) | | (0.23) | | (0.27) |
| |
| $10.45 | | $9.80 | | $10.43 | | $12.12 | | $11.58 |
| |
| 9.66% | | (3.65%) | | (11.70%) | | 6.70% | | 1.03% |
| |
| | | | | | | | | |
| $883 | | $834 | | $1,119 | | $1,527 | | $2,561 |
| 1.59% | | 1.59% | | 1.59% | | 1.59% | | 1.59% |
| 1.87% | | 1.85% | | 1.76% | | 1.75% | | 1.76% |
| 2.90% | | 2.56% | | 1.95% | | 1.85% | | 2.12% |
| 2.62% | | 2.30% | | 1.78% | | 1.69% | | 1.95% |
| 18% | | 22% | | 30% | | 19% | | 36% |
Financial highlights
Delaware Tax-Free Arizona Fund Institutional Class
Selected data for each share of the Fund outstanding throughout each period were as follows:
| |
| |
Net asset value, beginning of period
|
| |
| Income (loss) from investment operations: |
Net investment income1
|
Net realized and unrealized gain (loss)
|
Total from investment operations
|
| |
| Less dividends and distributions from: |
Net investment income
|
Net realized gain
|
Total dividends and distributions
|
| |
Net asset value, end of period
|
| |
Total return3
|
| |
| Ratios and supplemental data: |
Net assets, end of period (000 omitted)
|
Ratio of expenses to average net assets
|
Ratio of expenses to average net assets prior to fees waived
|
Ratio of net investment income to average net assets
|
Ratio of net investment income to average net assets prior to fees waived
|
Portfolio turnover
|
| 1 | Calculated using average shares outstanding. |
| 2 | Amount is less than $(0.005) per share. |
| 3 | Total return is based on the change in net asset value of a share during the period and assumes reinvestment of dividends and distributions at net asset value. Total return during the period presented reflects waivers by the manager. Performance would have been lower had the waivers not been in effect. |
See accompanying notes, which are an integral part of the financial statements.
| Year ended |
| 8/31/24 | | 8/31/23 | | 8/31/22 | | 8/31/21 | | 8/31/20 |
| $9.78 | | $10.40 | | $12.09 | | $11.55 | | $11.70 |
| |
| | | | | | | | | |
| 0.39 | | 0.36 | | 0.33 | | 0.34 | | 0.36 |
| 0.63 | | (0.63) | | (1.61) | | 0.55 | | (0.13) |
| 1.02 | | (0.27) | | (1.28) | | 0.89 | | 0.23 |
| |
| | | | | | | | | |
| (0.38) | | (0.35) | | (0.33) | | (0.34) | | (0.38) |
| — | | —2 | | (0.08) | | (0.01) | | — |
| (0.38) | | (0.35) | | (0.41) | | (0.35) | | (0.38) |
| |
| $10.42 | | $9.78 | | $10.40 | | $12.09 | | $11.55 |
| |
| 10.66% | | (2.60%) | | (10.84%) | | 7.78% | | 2.05% |
| |
| | | | | | | | | |
| $14,050 | | $12,774 | | $18,875 | | $22,147 | | $15,072 |
| 0.59% | | 0.59% | | 0.59% | | 0.59% | | 0.59% |
| 0.87% | | 0.85% | | 0.76% | | 0.75% | | 0.76% |
| 3.90% | | 3.56% | | 2.95% | | 2.85% | | 3.12% |
| 3.62% | | 3.30% | | 2.78% | | 2.69% | | 2.95% |
| 18% | | 22% | | 30% | | 19% | | 36% |
Financial highlights
Delaware Tax-Free California Fund Class A
Selected data for each share of the Fund outstanding throughout each period were as follows:
| |
| |
Net asset value, beginning of period
|
| |
| Income (loss) from investment operations: |
Net investment income1
|
Net realized and unrealized gain (loss)
|
Total from investment operations
|
| |
| Less dividends and distributions from: |
Net investment income
|
Net realized gain
|
Total dividends and distributions
|
| |
Net asset value, end of period
|
| |
Total return2
|
| |
| Ratios and supplemental data: |
Net assets, end of period (000 omitted)
|
Ratio of expenses to average net assets
|
Ratio of expenses to average net assets prior to fees waived
|
Ratio of net investment income to average net assets
|
Ratio of net investment income to average net assets prior to fees waived
|
Portfolio turnover
|
| 1 | Calculated using average shares outstanding. |
| 2 | Total return is based on the change in net asset value of a share during the period and assumes reinvestment of dividends and distributions at net asset value and does not reflect the impact of a sales charge. Total return during the period presented reflects waivers by the manager and/or distributor (as applicable). Performance would have been lower had the waivers not been in effect. |
See accompanying notes, which are an integral part of the financial statements.
| Year ended |
| 8/31/24 | | 8/31/23 | | 8/31/22 | | 8/31/21 | | 8/31/20 |
| $10.68 | | $10.97 | | $12.64 | | $12.18 | | $12.49 |
| |
| | | | | | | | | |
| 0.41 | | 0.39 | | 0.35 | | 0.37 | | 0.38 |
| 0.64 | | (0.30) | | (1.65) | | 0.46 | | (0.20) |
| 1.05 | | 0.09 | | (1.30) | | 0.83 | | 0.18 |
| |
| | | | | | | | | |
| (0.40) | | (0.38) | | (0.35) | | (0.37) | | (0.38) |
| — | | — | | (0.02) | | — | | (0.11) |
| (0.40) | | (0.38) | | (0.37) | | (0.37) | | (0.49) |
| |
| $11.33 | | $10.68 | | $10.97 | | $12.64 | | $12.18 |
| |
| 9.98% | | 0.87% | | (10.48%) | | 6.88% | | 1.59% |
| |
| | | | | | | | | |
| $88,231 | | $69,093 | | $71,308 | | $86,059 | | $44,059 |
| 0.80% | | 0.81% | | 0.82% | | 0.86% | | 0.82% |
| 1.00% | | 1.00% | | 0.99% | | 1.06% | | 1.03% |
| 3.70% | | 3.62% | | 2.94% | | 2.95% | | 3.17% |
| 3.50% | | 3.43% | | 2.77% | | 2.75% | | 2.96% |
| 25% | | 22% | | 31% | | 14% | | 36% |
Financial highlights
Delaware Tax-Free California Fund Class C
Selected data for each share of the Fund outstanding throughout each period were as follows:
| |
| |
Net asset value, beginning of period
|
| |
| Income (loss) from investment operations: |
Net investment income1
|
Net realized and unrealized gain (loss)
|
Total from investment operations
|
| |
| Less dividends and distributions from: |
Net investment income
|
Net realized gain
|
Total dividends and distributions
|
| |
Net asset value, end of period
|
| |
Total return2
|
| |
| Ratios and supplemental data: |
Net assets, end of period (000 omitted)
|
Ratio of expenses to average net assets
|
Ratio of expenses to average net assets prior to fees waived
|
Ratio of net investment income to average net assets
|
Ratio of net investment income to average net assets prior to fees waived
|
Portfolio turnover
|
| 1 | Calculated using average shares outstanding. |
| 2 | Total return is based on the change in net asset value of a share during the period and assumes reinvestment of dividends and distributions at net asset value and does not reflect the impact of a sales charge. Total return during the period presented reflects waivers by the manager and/or distributor (as applicable). Performance would have been lower had the waivers not been in effect. |
See accompanying notes, which are an integral part of the financial statements.
| Year ended |
| 8/31/24 | | 8/31/23 | | 8/31/22 | | 8/31/21 | | 8/31/20 |
| $10.71 | | $11.00 | | $12.66 | | $12.21 | | $12.52 |
| |
| | | | | | | | | |
| 0.32 | | 0.31 | | 0.26 | | 0.27 | | 0.29 |
| 0.63 | | (0.30) | | (1.64) | | 0.45 | | (0.20) |
| 0.95 | | 0.01 | | (1.38) | | 0.72 | | 0.09 |
| |
| | | | | | | | | |
| (0.31) | | (0.30) | | (0.26) | | (0.27) | | (0.29) |
| — | | — | | (0.02) | | — | | (0.11) |
| (0.31) | | (0.30) | | (0.28) | | (0.27) | | (0.40) |
| |
| $11.35 | | $10.71 | | $11.00 | | $12.66 | | $12.21 |
| |
| 9.05% | | 0.12% | | (11.05%) | | 5.99% | | 0.83% |
| |
| | | | | | | | | |
| $2,573 | | $2,001 | | $2,479 | | $3,843 | | $6,829 |
| 1.55% | | 1.56% | | 1.57% | | 1.61% | | 1.57% |
| 1.75% | | 1.75% | | 1.74% | | 1.81% | | 1.78% |
| 2.95% | | 2.87% | | 2.19% | | 2.20% | | 2.42% |
| 2.75% | | 2.68% | | 2.02% | | 2.00% | | 2.21% |
| 25% | | 22% | | 31% | | 14% | | 36% |
Financial highlights
Delaware Tax-Free California Fund Institutional Class
Selected data for each share of the Fund outstanding throughout each period were as follows:
| |
| |
Net asset value, beginning of period1
|
| |
| Income (loss) from investment operations: |
Net investment income1
|
Net realized and unrealized gain (loss)
|
Total from investment operations
|
| |
| Less dividends and distributions from: |
Net investment income
|
Net realized gain
|
Total dividends and distributions
|
| |
Net asset value, end of period
|
| |
Total return2
|
| |
| Ratios and supplemental data: |
Net assets, end of period (000 omitted)
|
Ratio of expenses to average net assets
|
Ratio of expenses to average net assets prior to fees waived
|
Ratio of net investment income to average net assets
|
Ratio of net investment income to average net assets prior to fees waived
|
Portfolio turnover
|
| 1 | Calculated using average shares outstanding. |
| 2 | Total return is based on the change in net asset value of a share during the period and assumes reinvestment of dividends and distributions at net asset value. Total return during the period presented reflects waivers by the manager. Performance would have been lower had the waivers not been in effect. |
See accompanying notes, which are an integral part of the financial statements.
| Year ended |
| 8/31/24 | | 8/31/23 | | 8/31/22 | | 8/31/21 | | 8/31/20 |
| $10.69 | | $10.97 | | $12.64 | | $12.18 | | $12.49 |
| |
| | | | | | | | | |
| 0.43 | | 0.42 | | 0.38 | | 0.40 | | 0.41 |
| 0.63 | | (0.29) | | (1.65) | | 0.46 | | (0.20) |
| 1.06 | | 0.13 | | (1.27) | | 0.86 | | 0.21 |
| |
| | | | | | | | | |
| (0.42) | | (0.41) | | (0.38) | | (0.40) | | (0.41) |
| — | | — | | (0.02) | | — | | (0.11) |
| (0.42) | | (0.41) | | (0.40) | | (0.40) | | (0.52) |
| |
| $11.33 | | $10.69 | | $10.97 | | $12.64 | | $12.18 |
| |
| 10.15% | | 1.22% | | (10.26%) | | 7.14% | | 1.84% |
| |
| | | | | | | | | |
| $196,405 | | $132,338 | | $79,900 | | $45,996 | | $34,098 |
| 0.55% | | 0.56% | | 0.57% | | 0.61% | | 0.57% |
| 0.75% | | 0.75% | | 0.74% | | 0.81% | | 0.78% |
| 3.95% | | 3.87% | | 3.19% | | 3.20% | | 3.42% |
| 3.75% | | 3.68% | | 3.02% | | 3.00% | | 3.21% |
| 25% | | 22% | | 31% | | 14% | | 36% |
Financial highlights
Delaware Tax-Free Colorado Fund Class A
Selected data for each share of the Fund outstanding throughout each period were as follows:
| |
| |
Net asset value, beginning of period
|
| |
| Income (loss) from investment operations: |
Net investment income1
|
Net realized and unrealized gain (loss)
|
Total from investment operations
|
| |
| Less dividends and distributions from: |
Net investment income
|
Total dividends and distributions
|
| |
Net asset value, end of period
|
| |
Total return2
|
| |
| Ratios and supplemental data: |
Net assets, end of period (000 omitted)
|
Ratio of expenses to average net assets3
|
Ratio of expenses to average net assets prior to fees waived3
|
Ratio of net investment income to average net assets
|
Ratio of net investment income to average net assets prior to fees waived
|
Portfolio turnover
|
| 1 | Calculated using average shares outstanding. |
| 2 | Total return is based on the change in net asset value of a share during the period and assumes reinvestment of dividends and distributions at net asset value and does not reflect the impact of a sales charge. Total return during the period presented reflects waivers by the manager and/or distributor (as applicable). Performance would have been lower had the waivers not been in effect. |
| 3 | Expense ratios do not include expenses of any investment companies in which the Fund invests. |
See accompanying notes, which are an integral part of the financial statements.
| Year ended |
| 8/31/24 | | 8/31/23 | | 8/31/22 | | 8/31/21 | | 8/31/20 |
| $9.92 | | $10.30 | | $11.70 | | $11.36 | | $11.48 |
| |
| | | | | | | | | |
| 0.37 | | 0.35 | | 0.30 | | 0.29 | | 0.33 |
| 0.58 | | (0.39) | | (1.40) | | 0.34 | | (0.12) |
| 0.95 | | (0.04) | | (1.10) | | 0.63 | | 0.21 |
| |
| | | | | | | | | |
| (0.36) | | (0.34) | | (0.30) | | (0.29) | | (0.33) |
| (0.36) | | (0.34) | | (0.30) | | (0.29) | | (0.33) |
| |
| $10.51 | | $9.92 | | $10.30 | | $11.70 | | $11.36 |
| |
| 9.77% | | (0.39%) | | (9.49%) | | 5.64% | | 1.88% |
| |
| | | | | | | | | |
| $126,556 | | $127,477 | | $142,904 | | $164,258 | | $162,955 |
| 0.82% | | 0.82% | | 0.82% | | 0.83% | | 0.84% |
| 0.98% | | 0.98% | | 0.96% | | 0.96% | | 0.96% |
| 3.62% | | 3.43% | | 2.76% | | 2.54% | | 2.91% |
| 3.46% | | 3.27% | | 2.62% | | 2.41% | | 2.79% |
| 16% | | 34% | | 24% | | 10% | | 18% |
Financial highlights
Delaware Tax-Free Colorado Fund Class C
Selected data for each share of the Fund outstanding throughout each period were as follows:
| |
| |
Net asset value, beginning of period
|
| |
| Income (loss) from investment operations: |
Net investment income1
|
Net realized and unrealized gain (loss)
|
Total from investment operations
|
| |
| Less dividends and distributions from: |
Net investment income
|
Total dividends and distributions
|
| |
Net asset value, end of period
|
| |
Total return2
|
| |
| Ratios and supplemental data: |
Net assets, end of period (000 omitted)
|
Ratio of expenses to average net assets3
|
Ratio of expenses to average net assets prior to fees waived3
|
Ratio of net investment income to average net assets
|
Ratio of net investment income to average net assets prior to fees waived
|
Portfolio turnover
|
| 1 | Calculated using average shares outstanding. |
| 2 | Total return is based on the change in net asset value of a share during the period and assumes reinvestment of dividends and distributions at net asset value and does not reflect the impact of a sales charge. Total return during the period presented reflects waivers by the manager and/or distributor (as applicable). Performance would have been lower had the waivers not been in effect. |
| 3 | Expense ratios do not include expenses of any investment companies in which the Fund invests. |
See accompanying notes, which are an integral part of the financial statements.
| Year ended |
| 8/31/24 | | 8/31/23 | | 8/31/22 | | 8/31/21 | | 8/31/20 |
| $9.94 | | $10.32 | | $11.73 | | $11.39 | | $11.51 |
| |
| | | | | | | | | |
| 0.30 | | 0.27 | | 0.22 | | 0.21 | | 0.24 |
| 0.59 | | (0.39) | | (1.41) | | 0.34 | | (0.12) |
| 0.89 | | (0.12) | | (1.19) | | 0.55 | | 0.12 |
| |
| | | | | | | | | |
| (0.29) | | (0.26) | | (0.22) | | (0.21) | | (0.24) |
| (0.29) | | (0.26) | | (0.22) | | (0.21) | | (0.24) |
| |
| $10.54 | | $9.94 | | $10.32 | | $11.73 | | $11.39 |
| |
| 9.05% | | (1.14%) | | (10.22%) | | 4.85% | | 1.12% |
| |
| | | | | | | | | |
| $2,236 | | $3,111 | | $4,845 | | $6,758 | | $8,121 |
| 1.57% | | 1.57% | | 1.57% | | 1.58% | | 1.59% |
| 1.73% | | 1.73% | | 1.71% | | 1.71% | | 1.71% |
| 2.87% | | 2.68% | | 2.01% | | 1.79% | | 2.16% |
| 2.71% | | 2.52% | | 1.87% | | 1.66% | | 2.04% |
| 16% | | 34% | | 24% | | 10% | | 18% |
Financial highlights
Delaware Tax-Free Colorado Fund Institutional Class
Selected data for each share of the Fund outstanding throughout each period were as follows:
| |
| |
Net asset value, beginning of period
|
| |
| Income (loss) from investment operations: |
Net investment income1
|
Net realized and unrealized gain (loss)
|
Total from investment operations
|
| |
| Less dividends and distributions from: |
Net investment income
|
Total dividends and distributions
|
| |
Net asset value, end of period
|
| |
Total return2
|
| |
| Ratios and supplemental data: |
Net assets, end of period (000 omitted)
|
Ratio of expenses to average net assets3
|
Ratio of expenses to average net assets prior to fees waived3
|
Ratio of net investment income to average net assets
|
Ratio of net investment income to average net assets prior to fees waived
|
Portfolio turnover
|
| 1 | Calculated using average shares outstanding. |
| 2 | Total return is based on the change in net asset value of a share during the period and assumes reinvestment of dividends and distributions at net asset value. Total return during the period presented reflects waivers by the manager. Performance would have been lower had the waivers not been in effect. |
| 3 | Expense ratios do not include expenses of any investment companies in which the Fund invests. |
See accompanying notes, which are an integral part of the financial statements.
| Year ended |
| 8/31/24 | | 8/31/23 | | 8/31/22 | | 8/31/21 | | 8/31/20 |
| $9.92 | | $10.30 | | $11.70 | | $11.36 | | $11.48 |
| |
| | | | | | | | | |
| 0.40 | | 0.37 | | 0.33 | | 0.32 | | 0.36 |
| 0.58 | | (0.39) | | (1.40) | | 0.34 | | (0.12) |
| 0.98 | | (0.02) | | (1.07) | | 0.66 | | 0.24 |
| |
| | | | | | | | | |
| (0.39) | | (0.36) | | (0.33) | | (0.32) | | (0.36) |
| (0.39) | | (0.36) | | (0.33) | | (0.32) | | (0.36) |
| |
| $10.51 | | $9.92 | | $10.30 | | $11.70 | | $11.36 |
| |
| 10.05% | | (0.14%) | | (9.27%) | | 5.91% | | 2.14% |
| |
| | | | | | | | | |
| $95,146 | | $82,209 | | $82,431 | | $76,092 | | $51,941 |
| 0.57% | | 0.57% | | 0.57% | | 0.58% | | 0.59% |
| 0.73% | | 0.73% | | 0.71% | | 0.71% | | 0.71% |
| 3.87% | | 3.68% | | 3.01% | | 2.79% | | 3.16% |
| 3.71% | | 3.52% | | 2.87% | | 2.66% | | 3.04% |
| 16% | | 34% | | 24% | | 10% | | 18% |
Financial highlights
Delaware Tax-Free Idaho Fund Class A
Selected data for each share of the Fund outstanding throughout each period were as follows:
| |
| |
Net asset value, beginning of period
|
| |
| Income (loss) from investment operations: |
Net investment income1
|
Net realized and unrealized gain (loss)
|
Total from investment operations
|
| |
| Less dividends and distributions from: |
Net investment income
|
Total dividends and distributions
|
| |
Net asset value, end of period
|
| |
Total return2
|
| |
| Ratios and supplemental data: |
Net assets, end of period (000 omitted)
|
Ratio of expenses to average net assets3
|
Ratio of expenses to average net assets prior to fees waived3
|
Ratio of net investment income to average net assets
|
Ratio of net investment income to average net assets prior to fees waived
|
Portfolio turnover
|
| 1 | Calculated using average shares outstanding. |
| 2 | Total return is based on the change in net asset value of a share during the period and assumes reinvestment of dividends and distributions at net asset value and does not reflect the impact of a sales charge. Total return during the period presented reflects waivers by the manager and/or distributor (as applicable). Performance would have been lower had the waivers not been in effect. |
| 3 | Expense ratios do not include expenses of any investment companies in which the Fund invests. |
See accompanying notes, which are an integral part of the financial statements.
| Year ended |
| 8/31/24 | | 8/31/23 | | 8/31/22 | | 8/31/21 | | 8/31/20 |
| $10.06 | | $10.44 | | $11.91 | | $11.52 | | $11.65 |
| |
| | | | | | | | | |
| 0.36 | | 0.34 | | 0.30 | | 0.30 | | 0.33 |
| 0.55 | | (0.39) | | (1.47) | | 0.39 | | (0.13) |
| 0.91 | | (0.05) | | (1.17) | | 0.69 | | 0.20 |
| |
| | | | | | | | | |
| (0.35) | | (0.33) | | (0.30) | | (0.30) | | (0.33) |
| (0.35) | | (0.33) | | (0.30) | | (0.30) | | (0.33) |
| |
| $10.62 | | $10.06 | | $10.44 | | $11.91 | | $11.52 |
| |
| 9.19% | | (0.51%) | | (10.00%) | | 6.03% | | 1.77% |
| |
| | | | | | | | | |
| $65,895 | | $64,691 | | $67,247 | | $71,345 | | $60,667 |
| 0.86% | | 0.86% | | 0.86% | | 0.86% | | 0.86% |
| 1.03% | | 1.03% | | 1.01% | | 1.01% | | 1.02% |
| 3.45% | | 3.27% | | 2.62% | | 2.53% | | 2.87% |
| 3.28% | | 3.10% | | 2.47% | | 2.38% | | 2.71% |
| 14% | | 25% | | 38% | | 17% | | 22% |
Financial highlights
Delaware Tax-Free Idaho Fund Class C
Selected data for each share of the Fund outstanding throughout each period were as follows:
| |
| |
Net asset value, beginning of period
|
| |
| Income (loss) from investment operations: |
Net investment income1
|
Net realized and unrealized gain (loss)
|
Total from investment operations
|
| |
| Less dividends and distributions from: |
Net investment income
|
Total dividends and distributions
|
| |
Net asset value, end of period
|
| |
Total return2
|
| |
| Ratios and supplemental data: |
Net assets, end of period (000 omitted)
|
Ratio of expenses to average net assets3
|
Ratio of expenses to average net assets prior to fees waived3
|
Ratio of net investment income to average net assets
|
Ratio of net investment income to average net assets prior to fees waived
|
Portfolio turnover
|
| 1 | Calculated using average shares outstanding. |
| 2 | Total return is based on the change in net asset value of a share during the period and assumes reinvestment of dividends and distributions at net asset value and does not reflect the impact of a sales charge. Total return during the period presented reflects waivers by the manager and/or distributor (as applicable). Performance would have been lower had the waivers not been in effect. |
| 3 | Expense ratios do not include expenses of any investment companies in which the Fund invests. |
See accompanying notes, which are an integral part of the financial statements.
| Year ended |
| 8/31/24 | | 8/31/23 | | 8/31/22 | | 8/31/21 | | 8/31/20 |
| $10.06 | | $10.44 | | $11.90 | | $11.51 | | $11.64 |
| |
| | | | | | | | | |
| 0.28 | | 0.26 | | 0.21 | | 0.21 | | 0.24 |
| 0.55 | | (0.39) | | (1.46) | | 0.39 | | (0.13) |
| 0.83 | | (0.13) | | (1.25) | | 0.60 | | 0.11 |
| |
| | | | | | | | | |
| (0.27) | | (0.25) | | (0.21) | | (0.21) | | (0.24) |
| (0.27) | | (0.25) | | (0.21) | | (0.21) | | (0.24) |
| |
| $10.62 | | $10.06 | | $10.44 | | $11.90 | | $11.51 |
| |
| 8.38% | | (1.26%) | | (10.59%) | | 5.24% | | 1.00% |
| |
| | | | | | | | | |
| $4,556 | | $4,532 | | $4,997 | | $6,453 | | $8,819 |
| 1.61% | | 1.61% | | 1.61% | | 1.61% | | 1.61% |
| 1.78% | | 1.78% | | 1.76% | | 1.76% | | 1.77% |
| 2.70% | | 2.52% | | 1.87% | | 1.78% | | 2.12% |
| 2.53% | | 2.35% | | 1.72% | | 1.63% | | 1.96% |
| 14% | | 25% | | 38% | | 17% | | 22% |
Financial highlights
Delaware Tax-Free Idaho Fund Institutional Class
Selected data for each share of the Fund outstanding throughout each period were as follows:
| |
| |
Net asset value, beginning of period
|
| |
| Income (loss) from investment operations: |
Net investment income1
|
Net realized and unrealized gain (loss)
|
Total from investment operations
|
| |
| Less dividends and distributions from: |
Net investment income
|
Total dividends and distributions
|
| |
Net asset value, end of period
|
| |
Total return2
|
| |
| Ratios and supplemental data: |
Net assets, end of period (000 omitted)
|
Ratio of expenses to average net assets3
|
Ratio of expenses to average net assets prior to fees waived3
|
Ratio of net investment income to average net assets
|
Ratio of net investment income to average net assets prior to fees waived
|
Portfolio turnover
|
| 1 | Calculated using average shares outstanding. |
| 2 | Total return is based on the change in net asset value of a share during the period and assumes reinvestment of dividends and distributions at net asset value. Total return during the period presented reflects waivers by the manager. Performance would have been lower had the waivers not been in effect. |
| 3 | Expense ratios do not include expenses of any investment companies in which the Fund invests. |
See accompanying notes, which are an integral part of the financial statements.
| Year ended |
| 8/31/24 | | 8/31/23 | | 8/31/22 | | 8/31/21 | | 8/31/20 |
| $10.07 | | $10.44 | | $11.91 | | $11.52 | | $11.65 |
| |
| | | | | | | | | |
| 0.38 | | 0.36 | | 0.32 | | 0.33 | | 0.36 |
| 0.54 | | (0.38) | | (1.47) | | 0.39 | | (0.13) |
| 0.92 | | (0.02) | | (1.15) | | 0.72 | | 0.23 |
| |
| | | | | | | | | |
| (0.37) | | (0.35) | | (0.32) | | (0.33) | | (0.36) |
| (0.37) | | (0.35) | | (0.32) | | (0.33) | | (0.36) |
| |
| $10.62 | | $10.07 | | $10.44 | | $11.91 | | $11.52 |
| |
| 9.35% | | (0.17%) | | (9.77%) | | 6.29% | | 2.02% |
| |
| | | | | | | | | |
| $60,207 | | $51,205 | | $49,393 | | $51,125 | | $36,057 |
| 0.61% | | 0.61% | | 0.61% | | 0.61% | | 0.61% |
| 0.78% | | 0.78% | | 0.76% | | 0.76% | | 0.77% |
| 3.70% | | 3.52% | | 2.87% | | 2.78% | | 3.12% |
| 3.53% | | 3.35% | | 2.72% | | 2.63% | | 2.96% |
| 14% | | 25% | | 38% | | 17% | | 22% |
Financial highlights
Delaware Tax-Free New York Fund Class A
Selected data for each share of the Fund outstanding throughout each period were as follows:
| |
| |
Net asset value, beginning of period
|
| |
| Income (loss) from investment operations: |
Net investment income1
|
Net realized and unrealized gain (loss)
|
Total from investment operations
|
| |
| Less dividends and distributions from: |
Net investment income
|
Net realized gain
|
Total dividends and distributions
|
| |
Net asset value, end of period
|
| |
Total return3
|
| |
| Ratios and supplemental data: |
Net assets, end of period (000 omitted)
|
Ratio of expenses to average net assets
|
Ratio of expenses to average net assets prior to fees waived
|
Ratio of net investment income to average net assets
|
Ratio of net investment income to average net assets prior to fees waived
|
Portfolio turnover
|
| 1 | Calculated using average shares outstanding. |
| 2 | Amount is less than $(0.005) per share. |
| 3 | Total return is based on the change in net asset value of a share during the period and assumes reinvestment of dividends and distributions at net asset value and does not reflect the impact of a sales charge. Total return during the period presented reflects waivers by the manager and/or distributor (as applicable). Performance would have been lower had the waivers not been in effect. |
See accompanying notes, which are an integral part of the financial statements.
| Year ended |
| 8/31/24 | | 8/31/23 | | 8/31/22 | | 8/31/21 | | 8/31/20 |
| $10.23 | | $10.56 | | $12.06 | | $11.66 | | $11.86 |
| |
| | | | | | | | | |
| 0.39 | | 0.37 | | 0.31 | | 0.29 | | 0.33 |
| 0.53 | | (0.34) | | (1.50) | | 0.45 | | (0.14) |
| 0.92 | | 0.03 | | (1.19) | | 0.74 | | 0.19 |
| |
| | | | | | | | | |
| (0.38) | | (0.36) | | (0.31) | | (0.29) | | (0.33) |
| — | | — | | —2 | | (0.05) | | (0.06) |
| (0.38) | | (0.36) | | (0.31) | | (0.34) | | (0.39) |
| |
| $10.77 | | $10.23 | | $10.56 | | $12.06 | | $11.66 |
| |
| 9.14% | | 0.29% | | (9.96%) | | 6.46% | | 1.68% |
| |
| | | | | | | | | |
| $163,180 | | $130,791 | | $130,721 | | $161,593 | | $42,514 |
| 0.80% | | 0.80% | | 0.80% | | 0.83% | | 0.80% |
| 0.97% | | 0.98% | | 0.97% | | 1.01% | | 1.05% |
| 3.71% | | 3.56% | | 2.78% | | 2.47% | | 2.86% |
| 3.54% | | 3.38% | | 2.61% | | 2.29% | | 2.61% |
| 21% | | 24% | | 30% | | 13% | | 31% |
Financial highlights
Delaware Tax-Free New York Fund Class C
Selected data for each share of the Fund outstanding throughout each period were as follows:
| |
| |
Net asset value, beginning of period
|
| |
| Income (loss) from investment operations: |
Net investment income1
|
Net realized and unrealized gain (loss)
|
Total from investment operations
|
| |
| Less dividends and distributions from: |
Net investment income
|
Net realized gain
|
Total dividends and distributions
|
| |
Net asset value, end of period
|
| |
Total return3
|
| |
| Ratios and supplemental data: |
Net assets, end of period (000 omitted)
|
Ratio of expenses to average net assets
|
Ratio of expenses to average net assets prior to fees waived
|
Ratio of net investment income to average net assets
|
Ratio of net investment income to average net assets prior to fees waived
|
Portfolio turnover
|
| 1 | Calculated using average shares outstanding. |
| 2 | Amount is less than $(0.005) per share. |
| 3 | Total return is based on the change in net asset value of a share during the period and assumes reinvestment of dividends and distributions at net asset value and does not reflect the impact of a sales charge. Total return during the period presented reflects waivers by the manager and/or distributor (as applicable). Performance would have been lower had the waivers not been in effect. |
See accompanying notes, which are an integral part of the financial statements.
| Year ended |
| 8/31/24 | | 8/31/23 | | 8/31/22 | | 8/31/21 | | 8/31/20 |
| $10.21 | | $10.53 | | $12.03 | | $11.63 | | $11.83 |
| |
| | | | | | | | | |
| 0.31 | | 0.29 | | 0.23 | | 0.21 | | 0.24 |
| 0.53 | | (0.33) | | (1.50) | | 0.45 | | (0.14) |
| 0.84 | | (0.04) | | (1.27) | | 0.66 | | 0.10 |
| |
| | | | | | | | | |
| (0.30) | | (0.28) | | (0.23) | | (0.21) | | (0.24) |
| — | | — | | —2 | | (0.05) | | (0.06) |
| (0.30) | | (0.28) | | (0.23) | | (0.26) | | (0.30) |
| |
| $10.75 | | $10.21 | | $10.53 | | $12.03 | | $11.63 |
| |
| 8.34% | | (0.37%) | | (10.66%) | | 5.68% | | 0.92% |
| |
| | | | | | | | | |
| $4,613 | | $2,757 | | $3,818 | | $4,720 | | $7,037 |
| 1.55% | | 1.55% | | 1.55% | | 1.58% | | 1.55% |
| 1.72% | | 1.73% | | 1.72% | | 1.76% | | 1.80% |
| 2.96% | | 2.81% | | 2.02% | | 1.72% | | 2.11% |
| 2.79% | | 2.63% | | 1.85% | | 1.54% | | 1.86% |
| 21% | | 24% | | 30% | | 13% | | 31% |
Financial highlights
Delaware Tax-Free New York Fund Institutional Class
Selected data for each share of the Fund outstanding throughout each period were as follows:
| |
| |
Net asset value, beginning of period
|
| |
| Income (loss) from investment operations: |
Net investment income1
|
Net realized and unrealized gain (loss)
|
Total from investment operations
|
| |
| Less dividends and distributions from: |
Net investment income
|
Net realized gain
|
Total dividends and distributions
|
| |
Net asset value, end of period
|
| |
Total return3
|
| |
| Ratios and supplemental data: |
Net assets, end of period (000 omitted)
|
Ratio of expenses to average net assets
|
Ratio of expenses to average net assets prior to fees waived
|
Ratio of net investment income to average net assets
|
Ratio of net investment income to average net assets prior to fees waived
|
Portfolio turnover
|
| 1 | Calculated using average shares outstanding. |
| 2 | Amount is less than $(0.005) per share. |
| 3 | Total return is based on the change in net asset value of a share during the period and assumes reinvestment of dividends and distributions at net asset value. Total return during the period presented reflects waivers by the manager. Performance would have been lower had the waivers not been in effect. |
See accompanying notes, which are an integral part of the financial statements.
| Year ended |
| 8/31/24 | | 8/31/23 | | 8/31/22 | | 8/31/21 | | 8/31/20 |
| $10.22 | | $10.55 | | $12.06 | | $11.66 | | $11.85 |
| |
| | | | | | | | | |
| 0.41 | | 0.39 | | 0.34 | | 0.32 | | 0.36 |
| 0.54 | | (0.34) | | (1.51) | | 0.45 | | (0.13) |
| 0.95 | | 0.05 | | (1.17) | | 0.77 | | 0.23 |
| |
| | | | | | | | | |
| (0.40) | | (0.38) | | (0.34) | | (0.32) | | (0.36) |
| — | | — | | —2 | | (0.05) | | (0.06) |
| (0.40) | | (0.38) | | (0.34) | | (0.37) | | (0.42) |
| |
| $10.77 | | $10.22 | | $10.55 | | $12.06 | | $11.66 |
| |
| 9.52% | | 0.54% | | (9.82%) | | 6.73% | | 2.03% |
| |
| | | | | | | | | |
| $96,684 | | $67,698 | | $64,447 | | $50,997 | | $38,394 |
| 0.55% | | 0.55% | | 0.55% | | 0.58% | | 0.55% |
| 0.72% | | 0.73% | | 0.72% | | 0.76% | | 0.80% |
| 3.96% | | 3.81% | | 3.03% | | 2.72% | | 3.11% |
| 3.79% | | 3.63% | | 2.86% | | 2.54% | | 2.86% |
| 21% | | 24% | | 30% | | 13% | | 31% |
Financial highlights
Delaware Tax-Free Pennsylvania Fund Class A
Selected data for each share of the Fund outstanding throughout each period were as follows:
| |
| |
Net asset value, beginning of period
|
| |
| Income (loss) from investment operations: |
Net investment income1
|
Net realized and unrealized gain (loss)
|
Total from investment operations
|
| |
| Less dividends and distributions from: |
Net investment income
|
Net realized gain
|
Total dividends and distributions
|
| |
Net asset value, end of period
|
| |
Total return2
|
| |
| Ratios and supplemental data: |
Net assets, end of period (000 omitted)
|
Ratio of expenses to average net assets
|
Ratio of expenses to average net assets prior to fees waived
|
Ratio of net investment income to average net assets
|
Ratio of net investment income to average net assets prior to fees waived
|
Portfolio turnover
|
| 1 | Calculated using average shares outstanding. |
| 2 | Total return is based on the change in net asset value of a share during the period and assumes reinvestment of dividends and distributions at net asset value and does not reflect the impact of a sales charge. Total return during the period presented reflects waivers by the manager and/or distributor (as applicable). Performance would have been lower had the waivers not been in effect. |
See accompanying notes, which are an integral part of the financial statements.
| Year ended |
| 8/31/24 | | 8/31/23 | | 8/31/22 | | 8/31/21 | | 8/31/20 |
| $7.06 | | $7.31 | | $8.34 | | $8.06 | | $8.25 |
| |
| | | | | | | | | |
| 0.28 | | 0.27 | | 0.22 | | 0.23 | | 0.25 |
| 0.38 | | (0.25) | | (1.00) | | 0.32 | | (0.11) |
| 0.66 | | 0.02 | | (0.78) | | 0.55 | | 0.14 |
| |
| | | | | | | | | |
| (0.28) | | (0.27) | | (0.22) | | (0.23) | | (0.25) |
| — | | — | | (0.03) | | (0.04) | | (0.08) |
| (0.28) | | (0.27) | | (0.25) | | (0.27) | | (0.33) |
| |
| $7.44 | | $7.06 | | $7.31 | | $8.34 | | $8.06 |
| |
| 9.61% | | 0.29% | | (9.59%) | | 7.04% | | 1.72% |
| |
| | | | | | | | | |
| $323,008 | | $307,781 | | $338,811 | | $384,915 | | $364,480 |
| 0.83% | | 0.84% | | 0.84% | | 0.83% | | 0.83% |
| 0.93% | | 0.95% | | 0.94% | | 0.92% | | 0.92% |
| 3.91% | | 3.75% | | 2.75% | | 2.86% | | 3.09% |
| 3.81% | | 3.64% | | 2.65% | | 2.77% | | 3.00% |
| 16% | | 35% | | 47% | | 32% | | 40% |
Financial highlights
Delaware Tax-Free Pennsylvania Fund Class C
Selected data for each share of the Fund outstanding throughout each period were as follows:
| |
| |
Net asset value, beginning of period
|
| |
| Income (loss) from investment operations: |
Net investment income1
|
Net realized and unrealized gain (loss)
|
Total from investment operations
|
| |
| Less dividends and distributions from: |
Net investment income
|
Net realized gain
|
Total dividends and distributions
|
| |
Net asset value, end of period
|
| |
Total return2
|
| |
| Ratios and supplemental data: |
Net assets, end of period (000 omitted)
|
Ratio of expenses to average net assets
|
Ratio of expenses to average net assets prior to fees waived
|
Ratio of net investment income to average net assets
|
Ratio of net investment income to average net assets prior to fees waived
|
Portfolio turnover
|
| 1 | Calculated using average shares outstanding. |
| 2 | Total return is based on the change in net asset value of a share during the period and assumes reinvestment of dividends and distributions at net asset value and does not reflect the impact of a sales charge. Total return during the period presented reflects waivers by the manager and/or distributor (as applicable). Performance would have been lower had the waivers not been in effect. |
See accompanying notes, which are an integral part of the financial statements.
| Year ended |
| 8/31/24 | | 8/31/23 | | 8/31/22 | | 8/31/21 | | 8/31/20 |
| $7.07 | | $7.31 | | $8.34 | | $8.06 | | $8.25 |
| |
| | | | | | | | | |
| 0.23 | | 0.21 | | 0.16 | | 0.17 | | 0.19 |
| 0.37 | | (0.24) | | (1.00) | | 0.32 | | (0.11) |
| 0.60 | | (0.03) | | (0.84) | | 0.49 | | 0.08 |
| |
| | | | | | | | | |
| (0.23) | | (0.21) | | (0.16) | | (0.17) | | (0.19) |
| — | | — | | (0.03) | | (0.04) | | (0.08) |
| (0.23) | | (0.21) | | (0.19) | | (0.21) | | (0.27) |
| |
| $7.44 | | $7.07 | | $7.31 | | $8.34 | | $8.06 |
| |
| 8.64% | | (0.33%) | | (10.27%) | | 6.24% | | 0.95% |
| |
| | | | | | | | | |
| $11,056 | | $8,854 | | $10,540 | | $14,040 | | $19,009 |
| 1.58% | | 1.59% | | 1.59% | | 1.59% | | 1.59% |
| 1.68% | | 1.70% | | 1.69% | | 1.68% | | 1.68% |
| 3.16% | | 3.00% | | 1.99% | | 2.10% | | 2.33% |
| 3.06% | | 2.89% | | 1.89% | | 2.01% | | 2.24% |
| 16% | | 35% | | 47% | | 32% | | 40% |
Financial highlights
Delaware Tax-Free Pennsylvania Fund Institutional Class
Selected data for each share of the Fund outstanding throughout each period were as follows:
| |
| |
Net asset value, beginning of period
|
| |
| Income (loss) from investment operations: |
Net investment income1
|
Net realized and unrealized gain (loss)
|
Total from investment operations
|
| |
| Less dividends and distributions from: |
Net investment income
|
Net realized gain
|
Total dividends and distributions
|
| |
Net asset value, end of period
|
| |
Total return2
|
| |
| Ratios and supplemental data: |
Net assets, end of period (000 omitted)
|
Ratio of expenses to average net assets
|
Ratio of expenses to average net assets prior to fees waived
|
Ratio of net investment income to average net assets
|
Ratio of net investment income to average net assets prior to fees waived
|
Portfolio turnover
|
| 1 | Calculated using average shares outstanding. |
| 2 | Total return is based on the change in net asset value of a share during the period and assumes reinvestment of dividends and distributions at net asset value. Total return during the period presented reflects waivers by the manager. Performance would have been lower had the waivers not been in effect. |
See accompanying notes, which are an integral part of the financial statements.
| Year ended |
| 8/31/24 | | 8/31/23 | | 8/31/22 | | 8/31/21 | | 8/31/20 |
| $7.06 | | $7.31 | | $8.33 | | $8.05 | | $8.25 |
| |
| | | | | | | | | |
| 0.30 | | 0.29 | | 0.24 | | 0.25 | | 0.27 |
| 0.38 | | (0.25) | | (0.99) | | 0.32 | | (0.12) |
| 0.68 | | 0.04 | | (0.75) | | 0.57 | | 0.15 |
| |
| | | | | | | | | |
| (0.30) | | (0.29) | | (0.24) | | (0.25) | | (0.27) |
| — | | — | | (0.03) | | (0.04) | | (0.08) |
| (0.30) | | (0.29) | | (0.27) | | (0.29) | | (0.35) |
| |
| $7.44 | | $7.06 | | $7.31 | | $8.33 | | $8.05 |
| |
| 9.88% | | 0.53% | | (9.26%) | | 7.31% | | 1.84% |
| |
| | | | | | | | | |
| $84,012 | | $63,482 | | $72,330 | | $72,333 | | $55,919 |
| 0.58% | | 0.59% | | 0.59% | | 0.59% | | 0.59% |
| 0.68% | | 0.70% | | 0.69% | | 0.68% | | 0.68% |
| 4.16% | | 4.00% | | 2.99% | | 3.10% | | 3.33% |
| 4.06% | | 3.89% | | 2.89% | | 3.01% | | 3.24% |
| 16% | | 35% | | 47% | | 32% | | 40% |
Notes to financial statements
| Delaware Funds by Macquarie® state tax-free funds | August 31, 2024 |
Voyageur Insured Funds is organized as a Delaware statutory trust and offers one series:
Delaware Tax-Free Arizona Fund. Voyageur Mutual Funds is organized as a Delaware statutory trust and offers five series: Delaware Minnesota High-Yield Municipal Bond Fund, Delaware National High-Yield Municipal Bond Fund, Delaware Tax-Free California Fund, Delaware Tax-Free Idaho Fund, and Delaware Tax-Free New York Fund. Voyageur Mutual Funds II is organized as a Delaware statutory trust and offers one series: Delaware Tax-Free Colorado Fund. Delaware Group® State Tax-Free Income Trust is organized as a Delaware statutory trust and offers one series: Delaware Tax-Free Pennsylvania Fund. Voyageur Insured Funds, Voyageur Mutual Funds, Voyageur Mutual Funds II, and Delaware Group State Tax-Free Income Trust are each referred to as a Trust, or collectively as the Trusts. These financial statements and the related notes pertain to Delaware Tax-Free Arizona Fund, Delaware Tax-Free California Fund, Delaware Tax-Free Colorado Fund, Delaware Tax-Free Idaho Fund, Delaware Tax-Free New York Fund, and Delaware Tax-Free Pennsylvania Fund (each, a Fund or collectively, the Funds). Each Trust is an open-end investment company. Each Fund is considered diversified under the Investment Company Act of 1940, as amended (1940 Act), and offers Class A, Class C, and Institutional Class shares. Class A shares are sold with a maximum front-end sales charge of 4.50%. There is no front-end sales charge when you purchase $250,000 or more of Class A shares. However, if Delaware Distributors, L.P. (DDLP) paid your financial intermediary a commission on your purchase of $250,000 or more of Class A shares, for shares of Delaware Tax-Free Arizona Fund, Delaware Tax-Free California Fund, Delaware Tax-Free Colorado Fund, Delaware Tax-Free Idaho Fund, Delaware Tax-Free New York Fund or Delaware Tax-Free Pennsylvania Fund you will have to pay a limited contingent deferred sales charge (Limited CDSC) of 1.00% if you redeem these shares within the first 18 months after your purchase, unless a specific waiver of the Limited CDSC applies. Class C shares have no upfront sales charge, but are sold with a contingent deferred sales charge (CDSC) of 1.00%, which will be incurred if redeemed during the first 12 months. Institutional Class shares are not subject to a sales charge and are offered for sale exclusively to certain eligible investors.
1. Significant Accounting Policies
Each Fund follows accounting and reporting guidance under Financial Accounting Standards Board (FASB) Accounting Standards Codification Topic 946, Financial Services — Investment Companies. The following accounting policies are in accordance with US generally accepted accounting principles (US GAAP) and are consistently followed by the Funds.
Security Valuation — Fixed income securities are generally priced based upon valuations provided by an independent pricing service or broker in accordance with methodologies included within Delaware Management Company (DMC)’s Pricing Policy (the Policy). Fixed income security valuations are then reviewed by DMC as part of its duties as each Fund’s valuation designee (Valuation Designee) and, to the extent required by the Policy and applicable regulation, fair valued consistent with the Policy. To the extent current market prices are not available, the pricing service may take into account developments related to the specific security, as well as transactions in comparable securities. Valuations for fixed income securities utilize
matrix systems, which reflect such factors as security prices, yields, maturities, and ratings, and are supplemented by dealer and exchange quotations. Open-end investment companies, other than exchange-traded funds (ETFs), are valued at their published net asset value (NAV). Investments for which market quotations are not readily available are valued at fair value as determined in good faith pursuant to Rule 2a-5 under the 1940 Act (Rule 2a-5). As a general principle, the fair value of a security or other asset is the price that would be received to sell an asset or paid to transfer a liability in an orderly transaction between market participants at the measurement date. Pursuant to Rule 2a-5, the Board of Trustees (Board) has designated DMC as the Valuation Designee for each Fund to perform the fair value determination relating to all applicable Fund investments. DMC has established a Pricing Committee to assist with its designated responsibilities as Valuation Designee, and DMC may carry out its designated responsibilities as Valuation Designee through the Pricing Committee and other teams and committees, which operate under policies and procedures approved by the Board and subject to the Board’s oversight. Fair value pricing may be used more frequently for securities traded primarily in non-US markets. In considering whether fair valuation is required and in determining fair values, the Valuation Designee may, among other things, consider significant events (which may be considered to include changes in the value of US securities or securities indexes) that occur after the close of the relevant market and before the close of the New York Stock Exchange. The Valuation Designee may utilize modeling tools provided by third-party vendors to determine fair values of non-US securities.
Federal Income Taxes — No provision for federal income taxes has been made as each Fund intends to continue to qualify for federal income tax purposes as a regulated investment company under Subchapter M of the Internal Revenue Code of 1986, as amended, and make the requisite distributions to shareholders. Each Fund evaluates tax positions taken or expected to be taken in the course of preparing each Fund’s tax returns to determine whether the tax positions are “more-likely-than-not” of being sustained by the applicable tax authority. Tax positions not deemed to meet the “more-likely-than-not” threshold are recorded as a tax benefit or expense in the current year. Management has analyzed each Fund’s tax positions taken or expected to be taken on each Fund’s federal income tax returns through the year ended August 31, 2024, and for all open tax years (years ended August 31, 2021–August 31, 2023), and has concluded that no provision for federal income tax is required in each Fund’s financial statements. If applicable, each Fund recognizes interest accrued on unrecognized tax benefits in interest expense and penalties in “Other” on the “Statements of operations.” During the year ended August 31, 2024, the Funds did not incur any interest or tax penalties.
Class Accounting — Investment income and common expenses are allocated to the various classes of each Fund on the basis of “settled shares” of each class in relation to the net assets of each Fund. Realized and unrealized gain (loss) on investments are allocated to the various classes of each Fund on the basis of daily net assets of each class. Distribution expenses relating to a specific class are charged directly to that class.
Use of Estimates — The preparation of financial statements in conformity with US GAAP requires management to make estimates and assumptions that affect the fair value of
Notes to financial statements
Delaware Funds by Macquarie® state tax-free funds
1. Significant Accounting Policies (continued)
investments, the reported amounts of assets and liabilities and disclosure of contingent assets and liabilities at the date of the financial statements, and the reported amounts of revenues and expenses during the reporting period. Actual results could differ from those estimates and the differences could be material.
Other — Expenses directly attributable to a Fund are charged directly to each Fund. Other expenses common to various funds within the Delaware Funds by Macquarie® (Delaware Funds) are generally allocated among such funds on the basis of average net assets. Management fees and certain other expenses are paid monthly. Security transactions are recorded on the date the securities are purchased or sold (trade date) for financial reporting purposes. Costs used in calculating realized gains and losses on the sale of investment securities are those of the specific securities sold. Interest income is recorded on an accrual basis. Income and capital gain distributions from any investment companies (Underlying Funds) in which each Fund invests are recorded on the ex-dividend date. Discounts and premiums on debt securities are accreted or amortized to interest income, respectively, over the lives of the respective securities using the effective interest method. Premiums on callable debt securities are amortized to interest income to the earliest call date using the effective interest method. Each Fund declares dividends daily from net investment income and pays the dividends monthly and declares and pays distributions from net realized gain on investments, if any, at least annually. Each Fund may distribute more frequently, if necessary for tax purposes. Dividends and distributions, if any, are recorded on the ex-dividend date.
Each Fund receives earnings credits from its custodian when positive cash balances are maintained, which may be used to offset custody fees. The expenses paid under this arrangement are included on the “Statements of operations” under “Custodian fees” with the corresponding expenses offset included under “Less expenses paid indirectly.” For the year ended August 31, 2024, each Fund earned the following amounts under this arrangement:
| Fund | | Custody credits |
| Delaware Tax-Free Arizona Fund | | $697 |
| Delaware Tax-Free California Fund | | 2,538 |
| Delaware Tax-Free Colorado Fund | | 1,222 |
| Delaware Tax-Free Idaho Fund | | 1,139 |
| Delaware Tax-Free New York Fund | | 2,217 |
| Delaware Tax-Free Pennsylvania Fund | | 3,492 |
Each Fund receives earnings credits from its transfer agent when positive cash balances are maintained, which may be used to offset transfer agent fees. If the amount earned is greater than $1, the expenses paid under this arrangement are included on the “Statements of operations”
under “Dividend disbursing and transfer agent fees and expenses” with the corresponding expenses offset included under “Less expenses paid indirectly.” For the year ended August 31, 2024, each Fund earned the following amounts under this arrangement:
| Fund | | Earnings Credits |
| Delaware Tax-Free Arizona Fund | | $25 |
| Delaware Tax-Free California Fund | | 80 |
| Delaware Tax-Free Colorado Fund | | 70 |
| Delaware Tax-Free Idaho Fund | | 19 |
| Delaware Tax-Free New York Fund | | 236 |
| Delaware Tax-Free Pennsylvania Fund | | 249 |
2. Investment Management, Administration Agreements, and Other Transactions with Affiliates
In accordance with the terms of its respective investment management agreement, each Fund pays DMC, a series of Macquarie Investment Management Business Trust (MIMBT) and the investment managers, an annual fee which is calculated daily and paid monthly based on each Fund’s average daily net assets as follows:
| | Delaware Tax-Free
Arizona Fund | | Delaware Tax-Free
California Fund | | Delaware Tax-Free
Colorado Fund | | Delaware Tax-Free
Idaho Fund | | Delaware Tax-Free
New York Fund | | Delaware Tax-Free
Pennsylvania Fund |
| On the first $500 million | 0.5000% | | 0.5500% | | 0.5500% | | 0.5500% | | 0.5500% | | 0.5500% |
| On the next $500 million | 0.4750% | | 0.5000% | | 0.5000% | | 0.5000% | | 0.5000% | | 0.5000% |
| On the next $1.5 billion | 0.4500% | | 0.4500% | | 0.4500% | | 0.4500% | | 0.4500% | | 0.4500% |
| In excess of $2.5 billion | 0.4250% | | 0.4250% | | 0.4250% | | 0.4250% | | 0.4250% | | 0.4250% |
DMC has contractually agreed to waive all or a portion of its investment advisory fees and/or pay/reimburse expenses (excluding any distribution and service (12b-1) fees, acquired fund fees and expenses, taxes, interest, inverse floater program expenses, short sale dividend and interest expenses, brokerage fees, certain insurance costs, and nonroutine expenses or costs, including, but not limited to, those relating to reorganizations, litigation, conducting shareholder meetings, and liquidations), in order to prevent total annual fund operating expenses from exceeding the following percentages of each Fund’s average daily net assets from September 1, 2023 (except as noted) through December 30, 2024. These waivers and reimbursements may only be
Notes to financial statements
Delaware Funds by Macquarie® state tax-free funds
2. Investment Management, Administration Agreements, and Other Transactions with Affiliates (continued)
terminated by agreement of DMC and each Fund. The waivers and reimbursements are accrued daily and received monthly.
| Fund | | Operating expense
limitation as
a percentage
of average
daily net assets |
| Delaware Tax-Free Arizona Fund | | 0.59% |
| Delaware Tax-Free California Fund | | 0.55% |
| Delaware Tax-Free Colorado Fund | | 0.57% |
| Delaware Tax-Free Idaho Fund | | 0.61% |
| Delaware Tax-Free New York Fund | | 0.55% |
| Delaware Tax-Free Pennsylvania Fund | | 0.58%* |
| * | Effective December 29, 2023. Prior to December 29, 2023, the expense limitation for Delaware Tax-Free Pennsylvania Fund was 0.59%. |
After consideration of class specific expenses, including 12b-1 fees, the class level operating expense limitation as a percentage of average daily net assets from September 1, 2023 (except as noted) through December 30, 2024, unless terminated by agreement of DMC and the Funds, is as follows:
| | | Operating expense limitation as a percentage
of average daily net assets |
| Fund | | Class A | | Class C | | Institutional Class |
| Delaware Tax-Free Arizona Fund | | 0.84% | | 1.59% | | 0.59% |
| Delaware Tax-Free California Fund | | 0.80% | | 1.55% | | 0.55% |
| Delaware Tax-Free Colorado Fund | | 0.82% | | 1.57% | | 0.57% |
| Delaware Tax-Free Idaho Fund | | 0.86% | | 1.61% | | 0.61% |
| Delaware Tax-Free New York Fund | | 0.80% | | 1.55% | | 0.55% |
| Delaware Tax-Free Pennsylvania Fund | | 0.83%* | | 1.58%* | | 0.58%* |
| * | Effective December 29, 2023. Prior to December 29, 2023, the expense limitation for Delaware Tax-Free Pennsylvania Fund were as follows for Class A, Class C, and Institutional Class, respectively: 0.84%, 1.59%, and 0.59%. |
Delaware Investments Fund Services Company (DIFSC), an affiliate of DMC, provides fund accounting and financial administrative oversight services to each Fund. For these services, effective October 1, 2023, DIFSC’s fees are calculated daily and paid monthly, based on the aggregate daily net assets of all funds within the Delaware Funds at the following annual rates: 0.0050% of the first $60 billion; 0.00475% of the next $30 billion; and 0.0015% of aggregate average daily net assets in excess of $90 billion (Total Fee). Prior to October 1, 2023, DIFSC’s annual rates were: 0.00475% of the first $35 billion; 0.0040% of the next $10 billion;
0.0025% of the next $45 billion; and 0.0015% of aggregate average daily net assets in excess of $90 billion. Each fund in the Delaware Funds pays a minimum of $4,000, which, in aggregate, is subtracted from the Total Fee. Each fund then pays its portion of the remainder of the Total Fee on a relative NAV basis. These amounts are included on the “Statements of operations” under “Accounting and administration expenses.” For the year ended August 31, 2024, each Fund paid for these services as follows:
| Fund | | Fees |
| Delaware Tax-Free Arizona Fund | | $6,428 |
| Delaware Tax-Free California Fund | | 14,359 |
| Delaware Tax-Free Colorado Fund | | 12,948 |
| Delaware Tax-Free Idaho Fund | | 9,282 |
| Delaware Tax-Free New York Fund | | 13,666 |
| Delaware Tax-Free Pennsylvania Fund | | 20,611 |
DIFSC is also the transfer agent and dividend disbursing agent of each Fund. For these services, DIFSC’s fees are calculated daily and paid monthly, based on the aggregate daily net assets of the retail funds within the Delaware Funds at the following annual rates: 0.014% of the first $20 billion; 0.011% of the next $5 billion; 0.007% of the next $5 billion; 0.004% of the next $20 billion; 0.002% of the next $25 billion; and 0.0015% of average daily net assets in excess of $75 billion. The fees payable to DIFSC under the shareholder services agreement described above are allocated among all retail funds in the Delaware Funds on a relative NAV basis. These amounts are included on the “Statements of operations” under “Dividend disbursing and transfer agent fees and expenses.” For the year ended August 31, 2024, each Fund paid for these services as follows:
| Fund | | Fees |
| Delaware Tax-Free Arizona Fund | | $3,740 |
| Delaware Tax-Free California Fund | | 15,817 |
| Delaware Tax-Free Colorado Fund | | 13,771 |
| Delaware Tax-Free Idaho Fund | | 8,111 |
| Delaware Tax-Free New York Fund | | 14,769 |
| Delaware Tax-Free Pennsylvania Fund | | 25,502 |
Pursuant to a sub-transfer agency agreement between DIFSC and BNY Mellon Investment Servicing (US) Inc. (BNYIS), BNYIS provides certain sub-transfer agency services to the Funds. Sub-transfer agency fees are paid by the Funds and are also included on the “Statements of operations” under “Dividend disbursing and transfer agent fees and expenses.” The fees are calculated daily and paid as invoices on a monthly or quarterly basis.
Pursuant to a distribution agreement and distribution plan, each Fund pays DDLP, the distributor and an affiliate of DMC, an annual 12b-1 fee of 0.25% of the average daily net assets of the Class A shares (except for Delaware Tax-Free Pennsylvania Fund). Delaware Tax-Free Pennsylvania Fund’s Class A shares are subject to a blended 12b-1 fee of 0.10% on all shares
Notes to financial statements
Delaware Funds by Macquarie® state tax-free funds
2. Investment Management, Administration Agreements, and Other Transactions with Affiliates (continued)
acquired prior to June 1, 1992 and 0.25% on all shares acquired on or after June 1, 1992. All Class A shareholders bear 12b-1 fees at the same rate, the blended rate, currently 0.25% of the average daily net assets, based on the formula described above. This method of calculating Class A 12b-1 fees may be discontinued at the sole discretion of the Board. Each Fund pays DDLP, an annual 12b-1 fee of 1.00% of the average daily net assets of the Class C shares. The fees are calculated daily and paid monthly. Institutional Class shares do not pay 12b-1 fees.
As provided in the investment management agreement, each Fund bears a portion of the cost of certain resources shared with DMC, including the cost of internal personnel of DMC and/or its affiliates that provide legal and regulatory reporting services to the Funds. These amounts are included on the “Statements of operations” under “Legal fees.” For the year ended August 31, 2024, each Fund paid for internal legal and regulatory reporting services provided by DMC and/or its affiliates’ employees as follows:
| Fund | | Fees |
| Delaware Tax-Free Arizona Fund | | $3,165 |
| Delaware Tax-Free California Fund | | 7,238 |
| Delaware Tax-Free Colorado Fund | | 6,164 |
| Delaware Tax-Free Idaho Fund | | 3,767 |
| Delaware Tax-Free New York Fund | | 6,389 |
| Delaware Tax-Free Pennsylvania Fund | | 31,382 |
For the year ended August 31, 2024, DDLP earned commissions on sales of Class A shares for each Fund as follows:
| Fund | | Class A |
| Delaware Tax-Free Arizona Fund | | $570 |
| Delaware Tax-Free California Fund | | 4,257 |
| Delaware Tax-Free Colorado Fund | | 3,683 |
| Delaware Tax-Free Idaho Fund | | 5,483 |
| Delaware Tax-Free New York Fund | | 6,830 |
| Delaware Tax-Free Pennsylvania Fund | | 9,296 |
For the year ended August 31, 2024, DDLP received gross CDSC commissions on redemptions of each Fund’s Class A and Class C shares, and these commissions were entirely used to offset upfront commissions previously paid by DDLP to broker/dealers on sales of those shares. The amounts received were as follows:
| Fund | | Class A | | Class C |
| Delaware Tax-Free Arizona Fund | | $3,896 | | $— |
| Delaware Tax-Free California Fund | | 4,434 | | — |
| Delaware Tax-Free Colorado Fund | | 376 | | 47 |
| Delaware Tax-Free Idaho Fund | | 18,187 | | 388 |
| Delaware Tax-Free New York Fund | | 9,986 | | — |
| Delaware Tax-Free Pennsylvania Fund | | 4,195 | | 4,201 |
Trustees’ fees include expenses accrued by each Fund for each Trustee’s retainer and meeting fees. Certain officers of DMC, DIFSC, and DDLP are officers and/or Trustees of the Trusts. These officers and Trustees are paid no compensation by the Funds.
In addition to the management fees and other expenses of a Fund, a Fund indirectly bears the investment management fees and other expenses of any Underlying Funds, including ETFs, in which it invests. The amount of these fees and expenses incurred indirectly by a Fund will vary based upon the expense and fee levels of any Underlying Funds and the number of shares that are owned of any Underlying Funds at different times.
3. Investments
For the year ended August 31, 2024, each Fund made purchases and sales of investment securities other than short-term investments and US government securities as follows:
| Fund | | Purchases | | Sales |
| Delaware Tax-Free Arizona Fund | | $10,080,161 | | $14,817,507 |
| Delaware Tax-Free California Fund | | 115,008,142 | | 59,521,734 |
| Delaware Tax-Free Colorado Fund | | 32,276,287 | | 34,836,930 |
| Delaware Tax-Free Idaho Fund | | 21,708,987 | | 16,787,940 |
| Delaware Tax-Free New York Fund | | 95,218,133 | | 45,498,171 |
| Delaware Tax-Free Pennsylvania Fund | | 79,273,891 | | 62,092,576 |
Notes to financial statements
Delaware Funds by Macquarie® state tax-free funds
3. Investments (continued)
The tax cost of investments includes adjustments to net unrealized appreciation (depreciation) which may not necessarily be the final tax cost basis adjustments but which approximate the tax basis unrealized gains and losses that may be realized and distributed to shareholders. At August 31, 2024, the cost and unrealized appreciation (depreciation) of investments for federal income tax purposes for each Fund were as follows:
| Fund | | Cost of
investments | | Aggregate
unrealized
appreciation
of investments | | Aggregate
unrealized
depreciation
of investments | | Net unrealized
appreciation
(depreciation)
of investments |
| Delaware Tax-Free Arizona Fund | | $59,657,990 | | $1,707,927 | | $(3,828,304) | | $(2,120,377) |
| Delaware Tax-Free California Fund | | 283,493,225 | | 8,151,997 | | (5,213,537) | | 2,938,460 |
| Delaware Tax-Free Colorado Fund | | 225,784,672 | | 5,768,529 | | (8,460,301) | | (2,691,772) |
| Delaware Tax-Free Idaho Fund | | 135,131,005 | | 3,684,393 | | (6,958,761) | | (3,274,368) |
| Delaware Tax-Free New York Fund | | 260,712,138 | | 6,619,043 | | (4,649,670) | | 1,969,373 |
| Delaware Tax-Free Pennsylvania Fund | | 411,739,965 | | 15,375,295 | | (11,186,800) | | 4,188,495 |
US GAAP defines fair value as the price that each Fund would receive to sell an asset or pay to transfer a liability in an orderly transaction between market participants at the measurement date under current market conditions. A three-level hierarchy for fair value measurements has been established based upon the transparency of inputs to the valuation of an asset or liability. Inputs may be observable or unobservable and refer broadly to the assumptions that market participants would use in pricing the asset or liability. Observable inputs reflect the assumptions market participants would use in pricing the asset or liability based on market data obtained from sources independent of the reporting entity. Unobservable inputs reflect the reporting entity’s own assumptions about the assumptions that market participants would use in pricing the asset or liability based on the best information available under the circumstances. Each Fund’s
investment in its entirety is assigned a level based upon the observability of the inputs which are significant to the overall valuation. The three-level hierarchy of inputs is summarized as follows:
Level 1 − Inputs are quoted prices in active markets for identical investments. (Examples: equity securities, open-end investment companies, futures contracts, and exchange-traded options contracts)
Level 2 − Other observable inputs, including, but not limited to: quoted prices for similar assets or liabilities in markets that are active, quoted prices for identical or similar assets or liabilities in markets that are not active, inputs other than quoted prices that are observable for the assets or liabilities (such as interest rates, yield curves, volatilities, prepayment speeds, loss severities, credit risks, and default rates) or other market-corroborated inputs. (Examples: debt securities, government securities, swap contracts, forward foreign currency exchange contracts, foreign securities utilizing international fair value pricing, broker-quoted securities, and fair valued securities)
Level 3 − Significant unobservable inputs, including each Fund’s own assumptions used to determine the fair value of investments. (Examples: broker-quoted securities and fair valued securities)
Level 3 investments are valued using significant unobservable inputs. Each Fund may also use an income-based valuation approach in which the anticipated future cash flows of the investment are discounted to calculate fair value. Discounts may also be applied due to the nature or duration of any restrictions on the disposition of the investments. Valuations may also be based upon current market prices of securities that are comparable in coupon, rating, maturity, and industry. The derived value of a Level 3 investment may not represent the value which is received upon disposition and this could impact the results of operations.
The following tables summarize the valuation of each Fund’s investments by fair value hierarchy levels as of August 31, 2024:
| | Delaware Tax-Free Arizona Fund |
| | Level 2 |
| Securities | |
| Assets: | |
| Municipal Bonds | $57,137,613 |
| Short-Term Investments | 400,000 |
| Total Value of Securities | $57,537,613 |
Notes to financial statements
Delaware Funds by Macquarie® state tax-free funds
3. Investments (continued)
| | Delaware Tax-Free California Fund |
| | Level 2 |
| Securities | |
| Assets: | |
| Municipal Bonds | $280,846,685 |
| Short-Term Investments | 5,585,000 |
| Total Value of Securities | $286,431,685 |
| | | Delaware Tax-Free Colorado Fund | |
| | | Level 1 | | Level 2 | Total | |
| Securities | | | | | | |
| Assets: | | | | | | |
| Municipal Bonds | | $— | | $221,194,638 | $221,194,638 | |
| Short-Term Investments | | 98,262 | | 1,800,000 | 1,898,262 | |
| Total Value of Securities | | $98,262 | | $222,994,638 | $223,092,900 | |
| | | Delaware Tax-Free Idaho Fund | |
| | | Level 1 | | Level 2 | Total | |
| Securities | | | | | | |
| Assets: | | | | | | |
| Municipal Bonds | | $— | | $129,753,826 | $129,753,826 | |
| Short-Term Investments | | 2,102,811 | | — | 2,102,811 | |
| Total Value of Securities | | $2,102,811 | | $129,753,826 | $131,856,637 | |
| | Delaware Tax-Free New York Fund |
| | Level 2 |
| Securities | |
| Assets: | |
| Municipal Bonds | $255,181,511 |
| Short-Term Investments | 7,500,000 |
| Total Value of Securities | $262,681,511 |
| | Delaware Tax-Free Pennsylvania Fund |
| | Level 2 |
| Securities | |
| Assets: | |
| Municipal Bonds | $412,328,460 |
| Short-Term Investments | 3,600,000 |
| Total Value of Securities | $415,928,460 |
During the year ended August 31, 2024, there were no transfers into or out of Level 3 investments. Each Fund’s policy is to recognize transfers into or out of Level 3 investments based on fair value at the beginning of the reporting year.
A reconciliation of Level 3 investments is presented when a Fund has a significant amount of Level 3 investments at the beginning or end of the year in relation to that Fund’s net assets. As of August 31, 2024, there were no Level 3 investments in any of the Funds.
4. Dividend and Distribution Information
Income and long-term capital gain distributions are determined in accordance with federal income tax regulations, which may differ from US GAAP. Additionally, distributions from net short-term gains on sales of investment securities are treated as ordinary income for federal income tax purposes. The tax character of dividends and distributions paid during the years ended August 31, 2024 and 2023 were as follows:
| | | Tax-exempt
income | | Ordinary
income | Total | |
| Year ended August 31, 2024: | | | | | | |
| Delaware Tax-Free Arizona Fund | | $2,048,714 | | $5,502 | $2,054,216 | |
| Delaware Tax-Free California Fund | | 9,063,284 | | 19,123 | 9,082,407 | |
| Delaware Tax-Free Colorado Fund | | 7,655,985 | | 13,522 | 7,669,507 | |
| Delaware Tax-Free Idaho Fund | | 4,254,573 | | 31,964 | 4,286,537 | |
| Delaware Tax-Free New York Fund | | 8,066,738 | | 242,227 | 8,308,965 | |
| Delaware Tax-Free Pennsylvania Fund | | 15,080,403 | | 353,604 | 15,434,007 | |
| |
| Year ended August 31, 2023: | | | | | | |
| Delaware Tax-Free Arizona Fund | | 2,159,007 | | 8,368 | 2,167,375 | |
| Delaware Tax-Free California Fund | | 6,497,314 | | 21,703 | 6,519,017 | |
| Delaware Tax-Free Colorado Fund | | 7,420,640 | | 12,625 | 7,433,265 | |
| Delaware Tax-Free Idaho Fund | | 3,861,880 | | 2,564 | 3,864,444 | |
| Delaware Tax-Free New York Fund | | 6,617,949 | | 162,310 | 6,780,259 | |
| Delaware Tax-Free Pennsylvania Fund | | 14,540,382 | | 284,228 | 14,824,610 | |
Notes to financial statements
Delaware Funds by Macquarie® state tax-free funds
5. Components of Net Assets on a Tax Basis
As of August 31, 2024, the components of net assets on a tax basis were as follows:
| | Delaware Tax-Free
Arizona Fund | | Delaware Tax-Free
California Fund | | Delaware Tax-Free
Colorado Fund |
| Shares of beneficial interest | $63,583,735 | | $288,941,925 | | $235,647,791 |
| Undistributed tax-exempt income | 5,790 | | 121,325 | | 408,664 |
| Distributions payable | (14,459) | | (71,235) | | (56,133) |
| Capital loss carryforwards | (3,514,678) | | (4,721,405)* | | (9,370,790) |
| Deferred directors fees | — | | (241) | | — |
| Unrealized appreciation (depreciation) of investments | (2,120,377) | | 2,938,460 | | (2,691,772) |
| Net assets | $57,940,011 | | $287,208,829 | | $223,937,760 |
| | Delaware Tax-Free
Idaho Fund | | Delaware Tax-Free
New York Fund | | Delaware Tax-Free
Pennsylvania Fund |
| Shares of beneficial interest | $142,652,000 | | $266,426,628 | | $430,576,558 |
| Undistributed tax-exempt income | 5,494 | | 579,957 | | — |
| Distributions payable | (18,930) | | (124,498) | | (94,828) |
| Capital loss carryforwards | (8,706,321) | | (4,374,852)* | | (16,594,222) |
| Unrealized appreciation (depreciation) of investments | (3,274,368) | | 1,969,373 | | 4,188,495 |
| Net assets | $130,657,875 | | $264,476,608 | | $418,076,003 |
| * | A portion of the Fund’s capital loss carryforward is subject to limitations under the Internal Revenue Code and related regulations. |
The differences between book basis and tax basis components of net assets are primarily attributable to tax treatment of market discount and premium on debt instruments and tax deferral of losses due to wash sales, as applicable.
For financial reporting purposes, capital accounts are adjusted to reflect the tax character of permanent book/tax differences. Reclassifications are primarily due to Fund level overdistribution and reorganization-related adjustments. Results of operations and net assets were not affected
by these reclassifications. For the year ended August 31, 2024, the Funds recorded the following reclassifications:
| | Paid-in capital | | Total distributable earnings (loss) |
| Delaware Tax-Free California Fund | $242,478 | | (242,478) |
| Delaware Tax-Free Pennsylvania Fund | (74,165) | | 74,165 |
For federal income tax purposes, capital loss carryforwards may be carried forward and applied against future capital gains. At August 31, 2024, the Funds have capital loss carryforwards available to offset future realized capital gains as follows:
| | Loss carryforward character | | |
| | Short-term | | Long-term | | Total |
Delaware Tax-Free
Arizona Fund | $ 875,769 | | $2,638,909 | | $ 3,514,678 |
Delaware Tax-Free
California Fund | 1,815,648 | | 2,905,757 | | 4,721,405 |
Delaware Tax-Free
Colorado Fund | 4,966,735 | | 4,404,055 | | 9,370,790 |
Delaware Tax-Free
Idaho Fund | 4,533,885 | | 4,172,436 | | 8,706,321 |
Delaware Tax-Free
New York Fund | 1,425,474 | | 2,949,378 | | 4,374,852 |
Delaware Tax-Free
Pennsylvania Fund | 7,567,126 | | 9,027,096 | | 16,594,222 |
Notes to financial statements
Delaware Funds by Macquarie® state tax-free funds
6. Capital Shares
Transactions in capital shares were as follows:
| | Delaware Tax-Free
Arizona Fund | | Delaware Tax-Free
California Fund | | Delaware Tax-Free
Colorado Fund |
| | Year ended | | Year ended | | Year ended |
| | 8/31/24 | | 8/31/23 | | 8/31/24 | | 8/31/23 | | 8/31/24 | | 8/31/23 |
| Shares sold: |
| Class A | 196,675 | | 355,524 | | 1,907,043 | | 1,148,802 | | 1,269,068 | | 708,020 |
| Class C | 25,313 | | 19,939 | | 50,552 | | 34,458 | | 30,837 | | 26,393 |
| Institutional Class | 455,135 | | 439,574 | | 7,774,166 | | 8,325,544 | | 3,870,454 | | 3,225,993 |
|
| Shares from reorganization:1 |
| Class A | — | | — | | 676,254 | | — | | — | | — |
| Class C | — | | — | | 33,657 | | — | | — | | — |
| Institutional Class | — | | — | | 415,689 | | — | | — | | — |
|
| Shares issued upon reinvestment of dividends and distributions: |
| Class A | 136,073 | | 146,699 | | 247,218 | | 207,624 | | 393,077 | | 408,205 |
| Class C | 2,430 | | 2,342 | | 6,142 | | 5,457 | | 7,271 | | 9,701 |
| Institutional Class | 46,605 | | 48,027 | | 508,651 | | 325,448 | | 292,458 | | 267,560 |
| | 862,231 | | 1,012,105 | | 11,619,372 | | 10,047,333 | | 5,863,165 | | 4,645,872 |
|
| Shares redeemed: |
| Class A | (874,305) | | (1,301,114) | | (1,510,183) | | (1,387,649) | | (2,472,772) | | (2,142,669) |
| Class C | (28,292) | | (44,564) | | (50,645) | | (78,456) | | (138,747) | | (192,575) |
| Institutional Class | (459,849) | | (995,521) | | (3,750,778) | | (3,546,840) | | (3,398,418) | | (3,210,723) |
| | (1,362,446) | | (2,341,199) | | (5,311,606) | | (5,012,945) | | (6,009,937) | | (5,545,967) |
| Net increase (decrease) | (500,215) | | (1,329,094) | | 6,307,766 | | 5,034,388 | | (146,772) | | (900,095) |
| | Delaware Tax-Free
Idaho Fund | | Delaware Tax-Free
New York Fund | | Delaware Tax-Free
Pennsylvania Fund |
| | Year ended | | Year ended | | Year ended |
| | 8/31/24 | | 8/31/23 | | 8/31/24 | | 8/31/23 | | 8/31/24 | | 8/31/23 |
| Shares sold: |
| Class A | 1,108,251 | | 1,656,764 | | 4,414,397 | | 2,493,095 | | 9,464,115 | | 12,904,727 |
| Class C | 98,978 | | 68,969 | | 316,750 | | 52,421 | | 698,734 | | 269,783 |
| Institutional Class | 1,875,245 | | 2,147,615 | | 4,149,088 | | 3,512,151 | | 5,461,598 | | 4,359,438 |
|
| Shares issued upon reinvestment of dividends and distributions: |
| Class A | 207,877 | | 191,593 | | 422,168 | | 353,002 | | 1,523,820 | | 1,490,669 |
| Class C | 11,457 | | 11,454 | | 8,145 | | 6,418 | | 40,889 | | 38,195 |
| Institutional Class | 176,734 | | 157,640 | | 236,607 | | 195,980 | | 386,625 | | 367,405 |
| | 3,478,542 | | 4,234,035 | | 9,547,155 | | 6,613,067 | | 17,575,781 | | 19,430,217 |
|
| Shares redeemed: |
| Class A | (1,539,920) | | (1,861,186) | | (2,476,530) | | (2,443,964) | | (11,153,572) | | (17,159,399) |
| Class C | (131,826) | | (108,766) | | (165,957) | | (151,146) | | (507,357) | | (495,977) |
| Institutional Class | (1,471,466) | | (1,948,199) | | (2,028,169) | | (3,195,136) | | (3,544,272) | | (5,632,202) |
| | (3,143,212) | | (3,918,151) | | (4,670,656) | | (5,790,246) | | (15,205,201) | | (23,287,578) |
| Net increase (decrease) | 335,330 | | 315,884 | | 4,876,499 | | 822,821 | | 2,370,580 | | (3,857,361) |
Certain shareholders may exchange shares of one class for shares of another class in the same Fund. These exchange transactions are included in shares sold and shares redeemed in the tables on the previous page and above and on the “Statements of changes in net assets.” For the years ended August 31, 2024 and 2023, each Fund had the following exchange transactions:
| | | Exchange Redemptions | | Exchange Subscriptions | | | |
| | | Class A
Shares | | Class C
Shares | | Institutional
Class
Shares | | Class A
Shares | | Institutional
Class
Shares | | Value |
| |
| Delaware Tax-Free Arizona Fund | |
| Year ended | |
| 8/31/24 | | 114,002 | | — | | — | | — | | 114,002 | | $1,065,336 |
| 8/31/23 | | — | | — | | 29,308 | | 29,308 | | — | | 287,804 |
Notes to financial statements
Delaware Funds by Macquarie® state tax-free funds
6. Capital Shares (continued)
| | | Exchange Redemptions | | Exchange Subscriptions | | | |
| | | Class A
Shares | | Class C
Shares | | Institutional
Class
Shares | | Class A
Shares | | Institutional
Class
Shares | | Value | |
| |
| Delaware Tax-Free California Fund | |
| Year ended | |
| 8/31/24 | | 7,211 | | — | | 30,248 | | 30,309 | | 7,211 | | $399,576 | |
| 8/31/23 | | 2,606 | | — | | — | | — | | 2,606 | | 28,713 | |
| |
| Delaware Tax-Free Colorado Fund | |
| Year ended | |
| 8/31/24 | | 49,422 | | 3,384 | | 4,394 | | 4,394 | | 52,812 | | 586,324 | |
| 8/31/23 | | 74,673 | | 2,690 | | 2,116 | | 4,815 | | 74,673 | | 798,445 | |
| |
| Delaware Tax-Free Idaho Fund* | |
| Year ended | |
| 8/31/24 | | 27,009 | | — | | 17,503 | | 17,520 | | 27,009 | | 468,270 | |
| |
| Delaware Tax-Free New York Fund | |
| Year ended | |
| 8/31/24 | | 30,386 | | 104 | | — | | 104 | | 30,404 | | 313,986 | |
| 8/31/23 | | 20,232 | | 6,789 | | — | | 6,785 | | 20,252 | | 273,391 | |
| |
| Delaware Tax-Free Pennsylvania Fund | |
| Year ended | |
| 8/31/24 | | 110,344 | | 14,796 | | — | | 14,810 | | 110,349 | | 919,281 | |
| 8/31/23 | | 105,897 | | 28,025 | | — | | 28,056 | | 105,970 | | 955,662 | |
*Delaware Tax-Free Idaho Fund did not have any exchange transactions for the year ended August 31, 2023.
7. Reorganization
On February 15-16, 2023, the Board approved a proposal to reorganize Delaware Ivy California Municipal High Income Fund (the “Acquired Fund”), a series of Ivy Funds, with and into Delaware Tax-Free California Fund (the “Acquiring Fund”), a series of Voyageur Mutual Funds (the “Trust”) (the “Reorganization”). On June 27, 2023, the Acquired Fund shareholders approved the Reorganization. Pursuant to an Agreement and Plan of Reorganization (the “Plan”): (i) all of the property, and assets of the Acquired Fund were acquired by the Acquiring Fund and (ii) Voyageur Mutual Funds on behalf of the Acquiring Fund, assumed the liabilities of the Acquired Fund, in exchange for shares of the Acquiring Fund. In accordance with the Plan, the Acquired Fund liquidated and dissolved following the Reorganization. The Reorganization was accomplished by a tax-free exchange of shares on September 15, 2023. For financial reporting purposes, assets received and shares issued by the Acquiring Fund were recorded at fair value; however, the cost basis of the investments received from the Acquired Fund was carried forward to align ongoing
reporting of the Acquiring Fund’s realized and unrealized gains and losses with amounts distributable to shareholders for tax purposes.
The share transactions associated with the Reorganization were as follows:
| | Acquired
Fund
Net Assets | | Acquired
Fund Shares
Outstanding | | Shares
Converted
to Acquiring
Fund | | Acquiring
Fund
Net Assets | | Conversion
Ratio |
| Class A | $7,115,020 | | 821,596 | | 676,254 | | $68,507,883 | | 0.8178 |
| Class C | 357,099 | | 41,235 | | 33,657 | | 1,983,584 | | 0.8162 |
Class I/
Institutional Class* | 4,402,146 | | 508,331 | | 415,689 | | 131,292,034 | | 0.8178 |
| Class Y** | 46,511 | | 5,371 | | — | | — | | — |
* Acquired Fund Class I shares are named Institutional Class for the Acquiring Fund.
** Class Y shares of the Acquired Fund were converted into Class A shares of the Acquiring Fund.
The net assets of the Acquired Fund before the Reorganization were $11,942,940. The Acquired Fund net assets and shares outstanding presented on the table above do not include the shareholders that did not participate in the Reorganization. The net assets of the Acquiring Fund immediately following the Reorganization were $213,704,277.
Assuming the Reorganization had been completed on September 1, 2023, the Acquiring Fund’s pro forma results of operations for the year ended August 31, 2024, would have been as follows:
| Net investment income | $9,352,466 |
| Net realized loss on investments | (1,675,553) |
| Net change in unrealized appreciation (depreciation) | 14,897,182 |
| Net increase in net assets resulting from operations | $22,574,095 |
Because the combined investment portfolios have been managed as a single integrated portfolio since the Reorganization was completed, it is not practical to separate the amounts of revenue and earnings of the Acquired Fund that have been included in the Acquiring Fund’s “Statements of operations” since the Reorganization was consummated on September 15, 2023.
8. Line of Credit
Each Fund, along with certain other funds in the Delaware Funds (Participants), was a participant in a $355,000,000 revolving line of credit (Agreement) intended to be used for temporary or emergency purposes as an additional source of liquidity to fund redemptions of investor shares. Under the Agreement, the Participants were charged an annual commitment fee of 0.15%, which was allocated across the Participants based on a weighted average of the respective net assets of each Participant. The Participants were permitted to borrow up to a
Notes to financial statements
Delaware Funds by Macquarie® state tax-free funds
8. Line of Credit (continued)
maximum of one-third of their net assets under the Agreement. Each Participant was individually, and not jointly, liable for its particular advances, if any, under the line of credit. The line of credit available under the Agreement expired on October 30, 2023.
On October 30, 2023, each Fund, along with the other Participants, entered into an amendment to the Agreement for a $335,000,000 revolving line of credit to be used as described above. It operates in substantially the same manner as the original Agreement. Under the amendment to the Agreement, the Participants are charged an annual commitment fee of 0.15%, which is allocated across the Participants based on a weighted average of the respective net assets of each Participant. The line of credit available under the Agreement expires on October 28, 2024.
Each Fund had no amounts outstanding as of August 31, 2024, or at any time during the year then ended.
9. Securities Lending
Each Fund, along with other funds in the Delaware Funds, may lend its securities pursuant to a security lending agreement (Lending Agreement) with The Bank of New York Mellon (BNY). At the time a security is loaned, the borrower must post collateral equal to the required percentage of the market value of the loaned security, including any accrued interest. The required percentage is: (1) 102% with respect to US securities and foreign securities that are denominated and payable in US dollars; and (2) 105% with respect to foreign securities. With respect to each loan, if on any business day the aggregate market value of securities collateral plus cash collateral held is less than the aggregate market value of the securities which are the subject of such loan, the borrower will be notified to provide additional collateral by the end of the following business day, which, together with the collateral already held, will be not less than the applicable initial collateral requirements for such security loan. If the aggregate market value of securities collateral and cash collateral held with respect to a security loan exceeds the applicable initial collateral requirement, upon the request of the borrower, BNY must return enough collateral to the borrower by the end of the following business day to reduce the value of the remaining collateral to the applicable initial collateral requirement for such security loan. As a result of the foregoing, the value of the collateral held with respect to a loaned security on any particular day, may be more or less than the value of the security on loan. The collateral percentage with respect to the market value of the loaned security is determined by the security lending agent.
Cash collateral received by each Fund of the Trust is generally invested in a series of individual separate accounts, each corresponding to a fund. The investment guidelines permit each separate account to hold certain securities that would be considered eligible securities for a money market fund. Cash collateral received is generally invested in government securities; certain obligations issued by government sponsored enterprises; repurchase agreements collateralized by US Treasury securities; obligations issued by the central government of any Organization for Economic Cooperation and Development (OECD) country or its agencies,
instrumentalities, or establishments; obligations of supranational organizations; commercial paper, notes, bonds, and other debt obligations; certificates of deposit, time deposits, and other bank obligations; certain money market funds; and asset-backed securities. Each Fund can also accept US government securities and letters of credit (non-cash collateral) in connection with securities loans.
In the event of default or bankruptcy by the lending agent, realization and/or retention of the collateral may be subject to legal proceedings. In the event the borrower fails to return loaned securities and the collateral received is insufficient to cover the value of the loaned securities and provided such collateral shortfall is not the result of investment losses, the lending agent has agreed to pay the amount of the shortfall to each Fund or, at the discretion of the lending agent, replace the loaned securities. Each Fund continues to record dividends or interest, as applicable, on the securities loaned and is subject to changes in value of the securities loaned that may occur during the term of the loan. Each Fund has the right under the Lending Agreement to recover the securities from the borrower on demand. With respect to security loans collateralized by non-cash collateral, each Fund receives loan premiums paid by the borrower. With respect to security loans collateralized by cash collateral, the earnings from the collateral investments are shared among each Fund, the security lending agent, and the borrower. Each Fund records security lending income net of allocations to the security lending agent and the borrower.
Each Fund may incur investment losses as a result of investing securities lending collateral. This could occur if an investment in each collateral investment account defaulted or became impaired. Under those circumstances, the value of each Fund’s cash collateral account may be less than the amount each Fund would be required to return to the borrowers of the securities and each Fund would be required to make up for this shortfall.
During the year ended August 31, 2024, each Fund had no securities out on loan.
10. Geographic, Credit and Market Risks
The impact of COVID-19, and other infectious illness outbreaks that may arise in the future, could adversely affect the economies of many nations or the entire global economy, individual issuers and capital markets in ways that cannot necessarily be foreseen.
When interest rates rise, fixed income securities (i.e. debt obligations) generally will decline in value. These declines in value are greater for fixed income securities with longer maturities or durations. Interest rate changes are influenced by a number of factors, such as government policy, monetary policy, inflation expectations, and the supply and demand of bonds. A fund may be subject to a greater risk of rising interest rates when interest rates are low or inflation rates are high or rising.
The Funds concentrate their investments in securities issued by each corresponding state’s municipalities. The Funds invest primarily in a specific state and may be subject to geographic concentration risk. In addition, the Funds have the flexibility to invest in issuers in US territories and possessions such as the Commonwealth of Puerto Rico, the US Virgin Islands, and Guam whose bonds are also free of federal and individual state income taxes. The value of the Funds’
Notes to financial statements
Delaware Funds by Macquarie® state tax-free funds
10. Geographic, Credit and Market Risks (continued)
investments may be adversely affected by new legislation within the US states or territories, regional or local economic conditions, and differing levels of supply and demand for municipal bonds. Many municipalities insure repayment for their obligations. Although bond insurance reduces the risk of loss due to default by an issuer, such bonds remain subject to the risk that value may fluctuate for other reasons and there is no certainty that the insurance company will meet its obligations. A real or perceived decline in creditworthiness of a bond insurer can have an adverse impact on the value of insured bonds held in each Fund.
Each Fund invests a portion of its assets in high yield fixed income securities, which are securities rated lower than BBB- by Standard & Poor’s Financial Services LLC (S&P) and Baa3 by Moody’s Investors Service, Inc. (Moody’s), or similarly rated by another nationally recognized statistical rating organization. Investments in these higher yielding securities are generally accompanied by a greater degree of credit risk than higher rated securities. Additionally, lower rated securities may be more susceptible to adverse economic and competitive industry conditions than investment grade securities.
Each Fund invests in certain obligations that may have liquidity protection designed to ensure that the receipt of payments due on the underlying security is timely. Such protection may be provided through guarantees, insurance policies, or letters of credit obtained by the issuer or sponsor through third parties, through various means of structuring the transaction, or through a combination of such approaches. Each Fund will usually not pay any additional fees for such credit support, although the existence of credit support may increase the price of a security.
From time to time, each Fund may invest in industrial development bonds or pollution control revenue bonds that are issued by a conduit authority on behalf of a corporation that is either foreign owned or has international affiliates or operations. While the bonds may be issued to finance a facility located in the US, the bonds may be secured by a payment obligation or guaranty of the corporation. To the extent each Fund invests in such securities, that Fund may be exposed to risks associated with international investments. The risk of international investments not ordinarily associated with US investments includes fluctuation in currency values, differences in accounting principles, and/or economic or political instability in other nations.
Each Fund may invest in advance refunded bonds, escrow secured bonds, or defeased bonds. Under current federal tax laws and regulations, state and local government borrowers are permitted to refinance outstanding bonds by issuing new bonds. The issuer refinances the outstanding debt to either reduce interest costs or to remove or alter restrictive covenants imposed by the bonds being refinanced. A refunding transaction where the municipal securities are being refunded within 90 days from the issuance of the refunding issue is known as a “current refunding.” “Advance refunded bonds” are bonds in which the refunded bond issue remains outstanding for more than 90 days following the issuance of the refunding issue. In an advance refunding, the issuer will use the proceeds of a new bond issue to purchase high grade interest-bearing debt securities, which are then deposited in an irrevocable escrow account held by an escrow agent to secure all future payments of principal and interest and bond premium of
the advance refunded bond. Bonds are “escrowed to maturity” when the proceeds of the refunding issue are deposited in an escrow account for investment sufficient to pay all of the principal and interest on the original interest payment and maturity dates.
Bonds are considered “pre-refunded” when the refunding issuer’s proceeds are escrowed only until a permitted call date or dates on the refunded issue with the refunded issue being redeemed at the time, including any required premium. Bonds become “defeased” when the rights and interests of the bondholders and of their lien on the pledged revenues or other security under the terms of the bond contract are substituted with an alternative source of revenues (the escrow securities) sufficient to meet payments of principal and interest to maturity or to the first call dates. Escrowed secured bonds will often receive a rating of AAA from Moody’s, S&P, and/or Fitch Ratings due to the strong credit quality of the escrow securities and the irrevocable nature of the escrow deposit agreement.
Each Fund may invest up to 15% of its net assets in illiquid securities, which may include securities with contractual restrictions on resale, securities exempt from registration under Rule 144A promulgated under the Securities Act of 1933, as amended, and other securities which may not be readily marketable. The relative illiquidity of these securities may impair each Fund from disposing of them in a timely manner and at a fair price when it is necessary or desirable to do so. While maintaining oversight, the Board has delegated to DMC the day-to-day functions of determining whether individual securities are liquid for purposes of the Funds'
limitation on investments in illiquid securities. Securities eligible for resale pursuant to Rule 144A, which are determined to be liquid, are not subject to the Funds' 15% limit on investments in illiquid securities. Rule 144A securities have been identified on the “Schedules of investments.”
11. Contractual Obligations
Each Fund enters into contracts in the normal course of business that contain a variety of indemnifications. Each Fund’s maximum exposure under these arrangements is unknown. However, each Fund has not had prior claims or losses pursuant to these contracts. Management has reviewed each Fund’s existing contracts and expects the risk of loss to be remote.
12. Subsequent Events
On October 28, 2024, each Fund, along with the other Participants, entered into an amendment to the Agreement for a $335,000,000 revolving line of credit to be used as described in Note 8. It operates in substantially the same manner as the original Agreement. Under the amendment to the Agreement, the Participants are charged an annual commitment fee of 0.15%, which is allocated across the Participants based on a weighted average of the respective net assets of each Participant. The line of credit available under the Agreement expires on October 27, 2025.
MIMBT, of which DMC is a series, entered into a settlement agreement on September 19, 2024 with the U.S. Securities and Exchange Commission (SEC) consenting to an order (Settlement Order) relating to a legacy investment strategy, the Absolute Return Mortgage-Backed Securities
Notes to financial statements
Delaware Funds by Macquarie® state tax-free funds
12. Subsequent Events (continued)
Strategy (ARMBS Strategy). MIMBT no longer offers the ARMBS Strategy. MIMBT agreed to the Settlement Order without admitting or denying the SEC’s findings. The Settlement Order does not impact MIMBT’s ability to continue to provide services to the Funds.
Management has determined that no other material events or transactions occurred subsequent to August 31, 2024, that would require recognition or disclosure in the Funds’ financial statements.
Report of independent registered public accounting firm
To the Board of Trustees of Voyageur Insured Funds, Voyageur Mutual Funds, Voyageur Mutual Funds II and Delaware Group® State Tax-Free Income Trust and Shareholders of Delaware Tax-Free Arizona Fund, Delaware Tax-Free California Fund, Delaware Tax-Free Colorado Fund, Delaware Tax-Free Idaho Fund, Delaware Tax-Free New York Fund and Delaware Tax-Free Pennsylvania Fund
Opinions on the Financial Statements
We have audited the accompanying statements of assets and liabilities, including the schedules of investments, of Delaware Tax-Free Arizona Fund (constituting Voyageur Insured Funds), Delaware Tax-Free California Fund, Delaware Tax-Free Idaho Fund, Delaware Tax-Free New York Fund (three of the funds constituting Voyageur Mutual Funds), Delaware Tax-Free Colorado Fund (constituting Voyageur Mutual Funds II) and Delaware Tax-Free Pennsylvania Fund (constituting Delaware Group® State Tax-Free Income Trust) (hereafter collectively referred to as the “Funds”) as of August 31, 2024, the related statements of operations for the year ended August 31, 2024, the statements of changes in net assets for each of the two years in the period ended August 31, 2024, including the related notes, and the financial highlights for each of the five years in the period ended August 31, 2024 (collectively referred to as the “financial statements”). In our opinion, the financial statements present fairly, in all material respects, the financial position of each of the Funds as of August 31, 2024, the results of each of their operations for the year then ended, the changes in each of their net assets for each of the two years in the period ended August 31, 2024 and each of the financial highlights for each of the five years in the period ended August 31, 2024 in conformity with accounting principles generally accepted in the United States of America.
Basis for Opinions
These financial statements are the responsibility of the Funds’ management. Our responsibility is to express an opinion on the Funds’ financial statements based on our audits. We are a public accounting firm registered with the Public Company Accounting Oversight Board (United States) (PCAOB) and are required to be independent with respect to the Funds in accordance with the U.S. federal securities laws and the applicable rules and regulations of the Securities and Exchange Commission and the PCAOB.
We conducted our audits of these financial statements in accordance with the standards of the PCAOB. Those standards require that we plan and perform the audit to obtain reasonable assurance about whether the financial statements are free of material misstatement, whether due to error or fraud.
Our audits included performing procedures to assess the risks of material misstatement of the financial statements, whether due to error or fraud, and performing procedures that respond to those risks. Such procedures included examining, on a test basis, evidence regarding the amounts and disclosures in the financial statements. Our audits also included evaluating the accounting principles used and significant estimates made by management, as well as evaluating the overall presentation of the financial statements. Our procedures included confirmation of securities owned as of August 31, 2024, by correspondence with the custodian, transfer agent and brokers; when replies were not received from brokers, we performed other auditing procedures. We believe that our audits provide a reasonable basis for our opinions.
/s/PricewaterhouseCoopers LLP
Philadelphia, Pennsylvania
October 30, 2024
We have served as the auditor of one or more Macquarie investment companies since 2010.
Other Fund information (Unaudited)
Delaware Funds by Macquarie® state tax-free funds
Tax Information
The information set forth below is for each Fund’s fiscal year as required by federal income tax laws. Shareholders, however, must report distributions on a calendar year basis for income tax purposes, which may include distributions for portions of two fiscal years of each Fund. Accordingly, the information needed by shareholders for income tax purposes will be sent to them in January of each year. Please consult your tax advisor for proper treatment of this information.
All disclosures are based on financial information available as of the date of this report and, accordingly are subject to change. For any and all items requiring reporting, it is the intention of each Fund to report the maximum amount permitted under the Internal Revenue Code and the regulations thereunder.
For the year ended August 31, 2024, each Fund reports distributions paid during the year as follows:
| | (A)
Tax-Exempt
Distributions
(Tax Basis) | (B)
Ordinary Income
Distributions
(Tax Basis) | Total
Distributions
(Tax Basis) |
| Delaware Tax-Free Arizona Fund | 99.73% | 0.27% | 100.00% |
| Delaware Tax-Free California Fund | 99.79% | 0.21% | 100.00% |
| Delaware Tax-Free Colorado Fund | 99.82% | 0.18% | 100.00% |
Delaware Tax-Free
Idaho Fund | 99.25% | 0.75% | 100.00% |
| Delaware Tax-Free New York Fund | 97.08% | 2.92% | 100.00% |
| Delaware Tax-Free Pennsylvania Fund | 97.71% | 2.29% | 100.00% |
(A) and (B) are based on a percentage of each Fund’s total distributions.
Changes in and Disagreements with Accountants for Open-End Management Investment Companies
Not applicable.
Proxy Disclosures for Open-End Management Investment Companies
Not applicable.
Remuneration Paid to Directors, Officers, and Others of Open-End Management Investment Companies
The aggregate remuneration paid to directors, officers and others is disclosed within the financial statements.
Statement Regarding Basis of Approval for Investment Advisory Contract
Board Consideration of Investment Management Agreements at a Meeting Held on August 13-15, 2024
At a meeting held on August 13-15, 2024 (the “Annual Contract Renewal Meeting”), the Board of Trustees (the “Board”), including a majority of Trustees each of whom is not an “interested person” as defined under the Investment Company Act of 1940 (the “Independent Trustees”), approved the renewal of the Delaware Tax-Free Arizona Fund, Delaware Tax-Free California Fund, Delaware Tax-Free Colorado Fund, Delaware Tax-Free Idaho Fund, Delaware Tax-Free New York Fund and Delaware Tax-Free Pennsylvania Fund (each, a “Fund” and together, the “Funds”) Investment Management Agreements with Delaware Management Company (“DMC”).
Prior to the Annual Contract Renewal Meeting, including at a Board meeting held in May 2024, the Trustees conferred extensively among themselves and with representatives of DMC about these matters. Also, the Board was assisted by the Equity Investments Committee and the Fixed Income Multi-Asset Sub-Advised Funds Investments Committee (each an “Investment Committee” and together, the “Investment Committees”), with each Investment Committee assisting the full Board in reviewing investment performance and other matters throughout the year. The Independent Trustees were also assisted in their evaluation of the Investment Management Agreements by independent legal counsel, from whom they received separate legal advice and with whom they met separately.
In providing information to the Board, DMC was guided by a detailed set of requests for information submitted to them by independent legal counsel on behalf of the Independent Trustees at the start of the Board’s annual contract renewal process earlier in 2024. Prior to the Annual Contract Renewal Meeting, and in response to the requests, the Board received and reviewed materials specifically relating to the renewal of the Investment Management Agreements. In considering and approving the Investment Management Agreements, the Trustees considered the information they believed relevant, including but not limited to the information discussed below. The Board considered not only the specific information presented in connection with the Annual Contract Renewal Meeting and the review process for the
Other Fund information (Unaudited)
Delaware Funds by Macquarie® state tax-free funds
Board Consideration of Investment Management Agreements at a Meeting Held on August 13-15, 2024 (continued)
Investment Management Agreements, but also the knowledge gained over time through interaction with DMC about various topics. In this regard, the Board reviewed reports of DMC at each of its quarterly meetings, which included information about, among other things, Fund performance, investment strategies, and expenses. In addition, the Investment Committees confer with portfolio managers at various times throughout the year. In considering information relating to the approval of the Funds’ Investment Management Agreements, the Independent Trustees also received information from an independent fund consultant, JDL Consultants,
LLC (“JDL”).
The Board did not identify any particular information or consideration that was all-important or controlling, and each individual Trustee may have attributed different weights to various factors.
After its deliberations, the Board, including the Independent Trustees, unanimously approved the continuation of the Investment Management Agreements for a one-year term. The following summarizes a number of important, but not necessarily all of the, factors considered by the Board in support of its approval.
Nature, extent, and quality of services. The Board received and considered various information regarding the nature, extent, and quality of the advisory services provided to the Funds by DMC under its Investment Management Agreements and the experience of the officers and employees of DMC who provide these services, including each Fund’s portfolio managers. The Board met with DMC’s senior management and investment personnel. The Board reviewed the materials provided by the Funds’ portfolio management team discussing its performance, investment strategies and outlook, as well as DMC with respect to comparing Fund performance to the performance of a comparable group of mutual funds, relevant benchmarks, and performance metrics, as applicable. The Board’s review included consideration of DMC’s investment oversight and research and analysis capabilities, and its ability to attract and retain skilled investment professionals. The Board also considered information regarding DMC’s programs for risk management, including investment, operational, liquidity, derivatives (as applicable), valuation and compliance risks and its plans for enhancing those programs (including through the allocation of additional resources and enhancements to existing processes and testing). The Board received information with respect to the cybersecurity program and business continuity plans of DMC and its affiliates, as well as information from Macquarie Group Ltd. (“Macquarie”), the parent company of DMC, regarding Macquarie’s commitment to the U.S. mutual fund business.
In addition, the Board considered certain non-advisory services that DMC and its affiliates provide to the fund complex. Among other things, these services include third party service provider oversight, transfer agency, internal audit, pricing and valuation, portfolio trading, and legal and compliance functions. The Board noted DMC’s responsibility for overseeing: the preparation of the Funds’ prospectus, summary prospectus, statement of additional information,
and shareholder reports; responsibility for other periodic filings with regulators; organizing Board meetings and preparing materials for such Board meetings; and furnishing analytical and other support to assist the Board.
The Board took into account the benefits to shareholders of investing in a Fund that is part of a family of funds managed by an affiliate of Macquarie, and the resources available to DMC as part of Macquarie’s global asset management business.
The Board also received and considered information about the nature and extent of services offered and fee rates charged by DMC to other types of clients with investment strategies similar to those of the Funds. In this regard, the Board received information about the significantly greater scope of services, and compliance, reporting and other legal and regulatory obligations and risks of managing registered investment companies compared with those associated with managing assets of other types of clients, including third-party sub-advised fund clients, unregistered funds and separately managed accounts.
The Board concluded that, overall, it was satisfied with the nature, extent and quality of services provided (and expected to be provided) to the Funds by DMC.
Investment performance. The Board received and considered information with respect to the investment performance of the Funds, including performance reports and discussions with portfolio managers at meetings of the Board’s Investment Committees throughout the year as well as reports provided by Broadridge Financial Solutions, Inc., an independent investment company data provider (“Broadridge”), furnished for the Annual Contract Renewal Meeting. The Broadridge reports prepared for each Fund’s institutional share class showed its investment performance in comparison to the institutional share class of a group of similar funds (the “Performance Universe”). The Board received a description of the methodology used to select the peer funds in the Performance Universe. Comparative annualized performance for each Fund was shown for the past 1-, 3-, 5-, and 10-year or since inception periods, as applicable, ended December 31, 2023.
Delaware Tax-Free Arizona Fund. The Performance Universe for the Fund consisted of the Fund and all retail and institutional “other states” municipal debt funds, regardless of asset size or primary channel of distribution. The Board noted that the Broadridge report comparison showed that the Fund’s total return for the 1-, 5-, and 10-year periods was in the first quartile of its Performance Universe and for the 3-year period was in the second quartile of its Performance Universe. The Broadridge report comparison showed that the Fund’s total return for the 1-, 3-, 5-, and 10-year periods was above the median of its Performance Universe. The Board also noted that the Fund outperformed its benchmark index for the 1- and 10-year periods and underperformed its benchmark index for the 3- and 5-year periods. The Board noted that the Fund was generally outperforming its Performance Universe during the periods under review. The Board also noted the explanations from DMC concerning the reasons for the Fund’s relative performance versus its benchmark index for the various periods and any actions that DMC has taken to address performance concerns.
Delaware Tax-Free California Fund. The Performance Universe for the Fund consisted of the Fund and all retail and institutional California municipal debt funds, regardless of asset size or
Other Fund information (Unaudited)
Delaware Funds by Macquarie® state tax-free funds
Board Consideration of Investment Management Agreements at a Meeting Held on August 13-15, 2024 (continued)
primary channel of distribution. The Board noted that the Broadridge report comparison showed that the Fund’s total return for the 1-, 3-, 5-, and 10-year periods was in the first quartile of its Performance Universe. The Broadridge report comparison showed that the Fund’s total return for the 1-, 3-, 5-, and 10-year periods was above the median of its Performance Universe. The Board also noted that the Fund outperformed its benchmark index for the 1-, 3-, 5-, and 10-year periods. The Board noted that the Fund was generally outperforming its Performance Universe and benchmark index during the periods under review.
Delaware Tax-Free Colorado Fund. The Performance Universe for the Fund consisted of the Fund and all retail and institutional “other states” municipal debt funds, regardless of asset size or primary channel of distribution. The Board noted that the Broadridge report comparison showed that the Fund’s total return for the 1-,3-, 5-, and 10-year periods was in the first quartile of its Performance Universe. The Broadridge report comparison showed that the Fund’s total return for the 1, 3-, 5-, and 10-year periods was above the median of its Performance Universe. The Board also noted that the Fund outperformed its benchmark index for the 1- and 10-year periods and performed approximately equal to its benchmark index for the 3- and 5-year periods. The Board noted that the Fund was generally outperforming or in line with its Performance Universe and benchmark index during the periods under review.
Delaware Tax-Free Idaho Fund. The Performance Universe for the Fund consisted of the Fund and all retail and institutional “other states” municipal debt funds, regardless of asset size or primary channel of distribution. The Board noted that the Broadridge report comparison showed that the Fund’s total return for the 1-, 3-, 5-, and 10-year periods was in the first quartile of its Performance Universe. The Broadridge report comparison showed that the Fund’s total return for the 1-, 3-, 5-, and 10-year periods was above the median of its Performance Universe. The Board also noted that the Fund outperformed its benchmark index for the 1-year period and underperformed its benchmark index for the 3-, 5-, and 10-year periods. The Board noted that the Fund was generally outperforming its Performance Universe during the periods under review. The Board also noted the explanations from DMC concerning the reasons for the Fund’s relative performance versus its benchmark index for the various periods and any actions that DMC has taken to address performance concerns.
Delaware Tax-Free New York Fund. The Performance Universe for the Fund consisted of the Fund all retail and institutional New York municipal debt funds, regardless of asset size or primary channel of distribution. The Board noted that the Broadridge report comparison showed that the Fund’s total return for the 1-, 3-, 5-, and 10-year periods was in the first quartile of its Performance Universe. The Broadridge report comparison showed that the Fund’s total return for the 1-, 3-, 5- and 10-year periods was above the median of its Performance Universe. The Board also noted that the Fund outperformed its benchmark index for the 1-, 3-, 5-, and 10-year periods. The Board noted that the Fund was outperforming its Performance Universe and benchmark index during the periods under review.
Delaware Tax-Free Pennsylvania Fund. The Performance Universe for the Fund consisted of the Fund and all retail and institutional Pennsylvania municipal debt funds, regardless of asset size or primary channel of distribution. The Board noted that the Broadridge report comparison showed that the Fund’s total return for the 1-, 3-, 5-, and 10-year periods was in the first quartile of its Performance Universe. The Broadridge report comparison showed that the Fund’s total return for the 1-, 3-, 5-, and 10-year periods was above the median of its Performance Universe. The Board also noted that the Fund outperformed its benchmark index for the 1-, 3-, 5-, and 10-year periods. The Board noted that the Fund was generally outperforming its Performance Universe and benchmark index during the periods under review.
Comparative expenses. The Board received and considered expense data for the Funds. DMC provided the Board with information on pricing levels and fee structures for each Fund as of its most recently completed fiscal year. The Broadridge total expenses (reflecting any applicable fee waivers and/or expense reimbursements), for comparative consistency, were shown by Broadridge for Institutional Class shares, including 12b-1 and non-12b-1 service fees (as applicable). The Board also considered the comparative analysis of contractual management fees and actual total expense ratios of each Fund versus contractual management fees and actual total expense ratios of a group of peer funds as selected by Broadridge (the “Expense Group”). Each Fund’s total expenses were also compared with those of its Expense Universe, which is comprised of the Fund, its Expense Group and all other similar with an institutional share class (i.e., funds without 12b-1 fees and non-12b-1 service fees) with assets equal to or greater than $100 million, excluding outliers (the “Expense Universe”). In reviewing comparative costs, each Fund’s contractual management fee and the actual management fee incurred by each Fund were compared with the contractual management fees (assuming all funds in the Expense Group were similar in size to each Fund) and actual management fees, taking into account any applicable breakpoints and fee waivers and/or expense reimbursements, with a Fund’s Expense Universe.
The Board also received and considered information regarding the Fund’s net operating expense ratios and their various components, including actual management fees, custodian and other non-management fees, and Rule 12b-1 and non-Rule 12b-1 shareholder service fees.
Delaware Tax-Free Arizona Fund. The expense comparisons for the Fund showed that its actual management fee was below the median of its Expense Universe and its actual total expenses were above its Expense Group average. It was noted that consistent with DMC’s waiver methodology, its advisory fee waivers, if any, were at the fund level and not class level.
Delaware Tax-Free California Fund. The expense comparisons for the Fund showed that its actual management fee was below the median of its Expense Universe and its actual total expenses were above its Expense Group average. It was noted that consistent with DMC’s waiver methodology, its advisory fee waivers, if any, were at the fund level and not class level.
Delaware Tax-Free Colorado Fund. The expense comparisons for the Fund showed that its actual management fee was below the median of its Expense Universe and its actual total expenses were above its Expense Group average. It was noted that consistent with DMC’s waiver methodology, its advisory fee waivers, if any, were at the fund level and not class level.
Other Fund information (Unaudited)
Delaware Funds by Macquarie® state tax-free funds
Board Consideration of Investment Management Agreements at a Meeting Held on August 13-15, 2024 (continued)
Delaware Tax-Free Idaho Fund. The expense comparisons for the Fund showed that its actual management fee was below the median of its Expense Universe and its actual total expenses were above its Expense Group average. It was noted that consistent with DMC’s waiver methodology, its advisory fee waivers, if any, were at the fund level and not class level.
Delaware Tax-Free New York Fund. The expense comparisons for the Fund showed that its actual management fee was below the median of its Expense Universe and its actual total expenses were above its Expense Group average. It was noted that consistent with DMC’s waiver methodology, its advisory fee waivers, if any, were at the fund level and not class level.
Delaware Tax-Free Pennsylvania Fund. The expense comparisons for the Fund showed that its actual management fee was above the median of its Expense Universe and its actual total expenses were above its Expense Group average. It was noted that consistent with DMC’s waiver methodology, its advisory fee waivers, if any, were at the fund level and not class level.
Based on its consideration of the factors and information it deemed relevant, including those described here, the Board determined that the compensation payable to DMC under the Investment Management Agreements was reasonable.
Economies of scale. The Board received and considered information about the potential for DMC to realize economies of scale in the provision of management services to the Funds, the difficulties of calculating economies of scale at an individual Fund level, and the extent to which potential scale benefits are shared with shareholders, including the extent to which any economies of scale are reflected in the level of management fees charged. DMC discussed its advisory fee pricing and structure for the complex, including the current breakpoints. The Board considered the continuation and/or implementation of contractual fee waivers and/or expense reimbursements, as applicable. The Board noted that each Fund may also benefit from economies of scale through initial fee setting, fee waivers and expense reimbursements, as well as DMC’s investment in its business, including investments in business infrastructure, technology and cybersecurity.
Management profitability. The Board received and considered the Investment Management Profitability Analysis that addressed the overall profitability of DMC’s business in providing management and other services to each Fund and the complex as a whole, including the methodology used by DMC in allocating costs for the purpose of determining profitability. The Board also reviewed a report prepared by JDL regarding DMC’s profitability as compared to certain peer fund complexes and the Independent Trustees discussed DMC’s profitability in such context with representatives from JDL. The Board recognized that calculating and comparing profitability at the individual fund level is difficult; that DMC’s profit, if any, can vary significantly depending on the particular fund; and that DMC’s support for, and commitment to, a fund are not solely dependent on the profits realized as to that fund.
Based on its review, the Board determined that DMC’s profitability was not excessive in light of the nature, extent and quality of the services provided to each Fund.
Ancillary benefits. The Board received and considered information regarding the extent to which DMC and its affiliates might derive ancillary benefits from fund operations, including the potential for procuring additional business as a result of the prestige and visibility associated with its role as investment manager to the complex; the benefits from allocation of fund brokerage to improve trading efficiencies; the portfolio transactions executed through “soft dollar” arrangements; and the fees that various affiliates received for serving as transfer agent and for overseeing fund accounting and financial administration services to the complex. The Board considered that it receives periodic reports from DMC that include a representation that any soft dollar arrangements are consistent with regulatory requirements. The Board received information from DMC regarding its view of the performance of its affiliates in providing transfer agent and fund accounting and financial administration oversight services and the organizational structure employed to provide these services pursuant to their contracts with the Funds.
Based on its consideration of the factors and information it deemed relevant, including the costs of providing investment management and other services to the Funds and the ongoing commitment of DMC and its affiliates to the Funds, the Board did not find that any ancillary benefits received by DMC and its affiliates were unreasonable.
Conclusion. Based on its review, consideration and evaluation of all factors it believed relevant, including the above-described factors and conclusions, the Board, including all of the Independent Trustees, unanimously approved the continuation of DMC’s Investment Management Agreements for an additional one-year period.
Contact information
Shareholder assistance by phone
800 523-1918, weekdays from 8:30am to
6:00pm ET
For securities dealers and financial
institutions representatives only
800 362-7500
Regular mail
Delaware Funds by Macquarie
P.O. Box 534437
Pittsburgh, PA 15253-4437
Overnight courier service
Delaware Funds by Macquarie
Attention: 534437
500 Ross Street, 154-0520
Pittsburgh, PA 15262
Macquarie Asset Management • 610 Market Street • Philadelphia, PA 19106-2354
Macquarie Asset Management (MAM) is the asset management division of Macquarie Group. MAM is an integrated asset manager across public and private markets offering a diverse range of capabilities, including real assets, real estate, credit, equities, and multi-asset solutions.
The Funds are advised by Delaware Management Company, a series of MIMBT, a US registered investment adviser, and distributed by Delaware Distributors, L.P. (DDLP), an affiliate of MIMBT and Macquarie Group Limited.
Other than Macquarie Bank Limited ABN 46 008 583 542 (“Macquarie Bank”), any Macquarie Group entity noted in this document is not an authorized deposit-taking institution for the purposes of the Banking Act 1959 (Commonwealth of Australia). The obligations of these other Macquarie Group entities do not represent deposits or other liabilities of Macquarie Bank. Macquarie Bank does not guarantee or otherwise provide assurance in respect of the obligations of these other Macquarie Group entities. In addition, if this document relates to an investment, (a) the investor is subject to investment risk including possible delays in repayment and loss of income and principal invested and (b) none of Macquarie Bank or any other Macquarie Group entity guarantees any particular rate of return on or the performance of the investment, nor do they guarantee repayment of capital in respect of the investment.
The Funds are governed by US laws and regulations.
This page is not part of the Financial statements and other information.
Item 8. Changes in and Disagreements with Accountants for Open-End Management Investment Companies.
Not applicable.
Item 9. Proxy Disclosures for Open-End Management Investment Companies.
Not applicable.
Item 10. Remuneration Paid to Directors, Officers, and Others of Open-End Management Investment Companies.
This information is included as part of materials filed under Item 7 of this form.
Item 11. Statement Regarding Basis for Approval of Investment Advisory Contract.
This information is included as part of materials filed under Item 7 of this form.
Item 12. Disclosure of Proxy Voting Policies and Procedures for Closed-End Management Investment Companies.
Not applicable.
Item 13. Portfolio Managers of Closed-End Management Investment Companies.
Not applicable.
Item 14. Purchases of Equity Securities by Closed-End Management Investment Company and Affiliated Purchasers.
Not applicable.
Item 15. Submission of Matters to a Vote of Security Holders.
There have been no material changes to the procedures by which shareholders may recommend nominees to the registrant’s board of trustees, where those changes were implemented after the registrant last provided disclosure in response to the requirements of Item 407(c)(2)(iv) of Regulation S-K (17 CFR 229.407) (as required by Item 22(b)(15) of Schedule 14A (17 CFR 240.14a-101)), or this Item.
Item 16. Controls and Procedures.
| | (a) | The registrant’s principal executive officer and principal financial officers, or persons performing similar functions, have concluded that the registrant’s disclosure controls and procedures (as defined in Rule 30a-3(c) under the Investment Company Act of 1940, as amended (17 CFR 270.30a-3(c))) are effective, as of a date within 90 days of the filing of this report, based on their evaluation of these controls and procedures required by Rule 30a-3(b) under the Investment Company Act of 1940 (17 CFR 270.30a-3(b)) and Rules 13a-15(b) or 15d-15(b) under the Securities Exchange Act of 1934, as amended (17 CFR 240.13a-15(b) or 240.15d-15(b)) and provide reasonable assurance that the information required to be disclosed by the registrant in its reports or statements filed under the Securities Exchange Act of 1934 is recorded, processed, summarized and reported within the time periods specified in the rules and forms of the Securities and Exchange Commission. |
| | (b) | There were no significant changes in the registrant’s internal control over financial reporting (as defined in Rule 30a-3(d) under the Investment Company Act of 1940 (17 CFR 270.30a-3(d)) that occurred during the period covered by the report to stockholders included herein that have materially affected, or are reasonably likely to materially affect, the registrant’s internal control over financial reporting. |
Item 17. Disclosure of Securities Lending Activities for Closed-End Management Investment Companies.
Not applicable.
Item 18. Recovery of Erroneously Awarded Compensation.
Not applicable.
Item 19. Exhibits.
SIGNATURES
Pursuant to the requirements of the Securities Exchange Act of 1934 and the Investment Company Act of 1940, the registrant has duly caused this report to be signed on its behalf, by the undersigned, thereunto duly authorized.
Name of Registrant: Voyageur Mutual Funds
| | |
| /s/ SHAWN K. LYTLE |
| By: | | Shawn K. Lytle |
| Title: | | President and Chief Executive Officer |
| Date: | | November 5, 2024 |
Pursuant to the requirements of the Securities Exchange Act of 1934 and the Investment Company Act of 1940, this report has been signed below by the following persons on behalf of the registrant and in the capacities and on the dates indicated.
| | |
| /s/ SHAWN K. LYTLE |
| By: | | Shawn K. Lytle |
| Title: | | President and Chief Executive Officer |
| Date: | | November 5, 2024 |
|
| /s/ RICHARD SALUS |
| By: | | Richard Salus |
| Title: | | Chief Financial Officer |
| Date: | | November 5, 2024 |