UNITED STATES SECURITIES AND EXCHANGE COMMISSION
Washington, D.C. 20549
FORM N-CSR
CERTIFIED SHAREHOLDER REPORT OF REGISTERED MANAGEMENT
INVESTMENT COMPANIES
| Investment Company Act file number: | 811-07742 | |
| Exact name of registrant as specified in charter: | Voyageur Mutual Funds | |
| Address of principal executive offices: | 2005 Market Street | |
| Philadelphia, PA 19103 | ||
| Name and address of agent for service: | David F. Connor, Esq. | |
| 2005 Market Street | ||
| Philadelphia, PA 19103 | ||
| Registrant’s telephone number, including area code: | (800) 523-1918 | |
| Date of fiscal year end: | August 31 | |
| Date of reporting period: | August 31, 2019 |
Item 1. Reports to Stockholders
Table of Contents
Delaware Funds® by MACQUARIE |  |
Annual report
Fixed income mutual funds
DelawareTax-Free Minnesota Fund
DelawareTax-Free Minnesota Intermediate Fund
Delaware Minnesota High-Yield Municipal Bond Fund
August 31, 2019
Beginning on or about June 1, 2021, as permitted by regulations adopted by the Securities and Exchange Commission, paper copies of your Fund’s shareholder reports will no longer be sent to you by mail, unless you specifically request them from the Fund or from your financial intermediary, such as a broker/dealer, bank, or insurance company. Instead, you will be notified by mail each time a report is posted on the website and provided with a link to access the report.
If you already elected to receive shareholder reports electronically, you will not be affected by this change and you do not need to take any action. You may elect to receive shareholder reports and other communications from the Fund electronically by signing up at delawarefunds.com/edelivery. If you own these shares through a financial intermediary, you may contact your financial intermediary.
You may elect to receive paper copies of all future shareholder reports free of charge. You can inform the Fund that you wish to continue receiving paper copies of your shareholder reports by contacting us at 800523-1918. If you own these shares through a financial intermediary, you may contact your financial intermediary to elect to continue to receive paper copies of your shareholder reports. Your election to receive reports in paper will apply to all funds held with the Delaware Funds® by Macquarie or your financial intermediary.
|
|
Carefully consider the Funds’ investment objectives, risk factors, charges, and expenses before investing. This and other information can be found in the Funds’ prospectus and their summary prospectuses, which may be obtained by visiting delawarefunds.com/literature or calling 800523-1918. Investors should read the prospectus and the summary prospectus carefully before investing.
You can obtain shareholder reports and prospectuses online instead of in the mail.
Visit delawarefunds.com/edelivery.
|
Table of Contents
Experience Delaware Funds®by Macquarie
Macquarie Investment Management (MIM) is a global asset manager with offices throughout the United States, Europe, Asia, and Australia. As active managers we prioritize autonomy and accountability at the investment team level in pursuit of opportunities that matter for clients. Delaware Funds is one of the longest-standing mutual fund families, with more than 80 years in existence.
If you are interested in learning more about creating an investment plan, contact your financial advisor.
You can learn more about Delaware Funds or obtain a prospectus for DelawareTax-Free Minnesota Fund, DelawareTax-Free Minnesota Intermediate Fund, and Delaware Minnesota High-Yield Municipal Bond Fund at delawarefunds.com/literature.
Manage your account online
| ● | Check your account balance and transactions |
| ● | View statements and tax forms |
| ● | Make purchases and redemptions |
Visit delawarefunds.com/account-access.
Macquarie Asset Management (MAM) offers a diverse range of products including securities investment management, infrastructure and real asset management, and fund and equity-based structured products. MIM is the marketing name for certain companies comprising the asset management division of Macquarie Group. This includes the following registered investment advisers: Macquarie Investment Management Business Trust (MIMBT), Delaware Capital Management Advisers, Inc., Macquarie Funds Management Hong Kong Limited, Macquarie Investment Management Austria Kapitalanlage AG, Macquarie Investment Management Global Limited, Macquarie Investment Management Europe Limited, Macquarie Capital Investment Management LLC, and Macquarie Investment Management Europe S.A.
The Funds are distributed byDelaware Distributors, L.P. (DDLP), an affiliate of MIMBT and Macquarie Group Limited.
Other than Macquarie Bank Limited (MBL), none of the entities noted are authorized deposit-taking institutions for the purposes of the Banking Act 1959 (Commonwealth of Australia). The obligations of these entities do not represent deposits or other liabilities of MBL. MBL does not guarantee or otherwise provide assurance in respect of the obligations of these entities, unless noted otherwise. The Funds are governed by US laws and regulations.
| 1 | ||||
| 6 | ||||
| 18 | ||||
| 21 | ||||
| 24 | ||||
| 60 | ||||
| 62 | ||||
| 64 | ||||
| 70 | ||||
| 88 | ||||
| 103 | ||||
| 104 | ||||
| 110 | ||||
| 120 |
Unless otherwise noted, views expressed herein are current as of Aug. 31, 2019, and subject to change for events occurring after such date.
The Funds are not FDIC insured and are not guaranteed. It is possible to lose the principal amount invested.
Advisory services provided by Delaware Management Company, a series of MIMBT, a US registered investment advisor.
All third-party marks cited are the property of their respective owners.
© 2019 Macquarie Management Holdings, Inc.
Table of Contents
| Portfolio management review | ||||
Delaware Funds® by Macquarie Minnesota municipal bond funds | September 10, 2019 | |||
| Performance preview (for the year ended August 31, 2019) | ||||
| ||||
| DelawareTax-Free Minnesota Fund (Institutional Class shares) | 1-year return | +7.81% | ||
| ||||
| DelawareTax-Free Minnesota Fund (Class A shares) | 1-year return | +7.54% | ||
| ||||
| Bloomberg Barclays Municipal Bond Index (benchmark) | 1-year return | +8.72% | ||
| ||||
| Lipper Minnesota Municipal Debt Funds Average | 1-year return | +7.55% | ||
| ||||
Past performance does not guarantee future results.
For complete, annualized performance for DelawareTax-Free Minnesota Fund, please see the table on page 6. Institutional Class shares are not subject to a sales charge and are offered for sale exclusively to certain eligible investors. In addition, Institutional Class shares pay no distribution and service fee.
The performance of Class A shares excludes the applicable sales charge. Both Institutional Class shares and Class A shares reflect the reinvestment of all distributions.
The Lipper Minnesota Municipal Debt Funds Average compares funds that invest primarily in municipal debt issues that are exempt from taxation in Minnesota.
Please see page 9 for a description of the index. Index performance returns do not reflect any management fees, transaction costs, or expenses. Indices are unmanaged and one cannot invest directly in an index.
| ||||
| DelawareTax-Free Minnesota Intermediate Fund (Institutional Class shares) | 1-year return | +7.06% | ||
| ||||
| DelawareTax-Free Minnesota Intermediate Fund (Class A shares) | 1-year return | +7.00% | ||
| ||||
| Bloomberg Barclays 3–15 Year Blend Municipal Bond Index (benchmark) | 1-year return | +8.16% | ||
| ||||
| Lipper Other States Intermediate Municipal Debt Funds Average | 1-year return | +7.10% | ||
| ||||
Past performance does not guarantee future results.
For complete, annualized performance for DelawareTax-Free Minnesota Intermediate Fund, please see the table on page 10. Institutional Class shares are not subject to a sales charge and are offered for sale exclusively to certain eligible investors. In addition, Institutional Class shares pay no distribution and service fee.
The performance of Class A shares excludes the applicable sales charge. Both Institutional Class shares and Class A shares reflect the reinvestment of all distributions.
The Lipper Other States Intermediate Municipal Debt Funds Average compares funds that invest in municipal debt issues with dollar-weighted average maturities of 5 to 10 years and are exempt from taxation on a specified city or state basis.
Please see page 13 for a description of the index. Index performance returns do not reflect any management fees, transaction costs, or expenses. Indices are unmanaged and one cannot invest directly in an index.
| ||||
| Delaware Minnesota High-Yield Municipal Bond Fund (Institutional Class shares) | 1-year return | +8.50% | ||
| ||||
| Delaware Minnesota High-Yield Municipal Bond Fund (Class A shares) | 1-year return | +8.33% | ||
| ||||
| Bloomberg Barclays Municipal Bond Index (benchmark) | 1-year return | +8.72% | ||
| ||||
| Lipper Minnesota Municipal Debt Funds Average | 1-year return | +7.55% | ||
| ||||
Past performance does not guarantee future results.
For complete, annualized performance for Delaware Minnesota High-Yield Municipal Bond Fund, please see the table on page 14. Institutional Class shares are not subject to a sales charge and are offered for sale exclusively to certain eligible investors. In addition, Institutional Class shares pay no distribution and service fee.
The performance of Class A shares excludes the applicable sales charge. Both Institutional Class shares and Class A shares reflect the reinvestment of all distributions.
The Lipper Minnesota Municipal Debt Funds Average compares funds that invest primarily in municipal debt issues that are exempt from taxation in Minnesota.
Please see page 17 for a description of the index. Index performance returns do not reflect any management fees, transaction costs, or expenses. Indices are unmanaged and one cannot invest directly in an index.
1
Table of Contents
Portfolio management review
Delaware Funds® by Macquarie Minnesota municipal bond funds
Economic backdrop
Throughout the fiscal year ended Aug. 31, 2019, the US economy grew, albeit at a moderating pace, reflecting mounting concerns about theUS-China trade dispute. In the third quarter of 2018, US gross domestic product (GDP) – a measure of national economic output – rose by an annualized 2.9%, down from the previous quarter. Growth slowed to 1.1% in the final three months of 2018 before bouncing back to 3.1% in the first quarter of 2019. In the second quarter of 2019, the country’s GDP rose an estimated 2.0%.
Against this backdrop of economic expansion, job growth also remained strong. In August 2019, the US unemployment rate stood at 3.7%, matching its level one year earlier and close to the nearly50-year low of 3.6% achieved in both April and May 2019.
When the fiscal year began in September 2018, the US Federal Reserve continued to raise its short-term target interest rate, maintaining a cycle that had been in place since 2015. In September and again in December 2018, the Fed lifted the federal funds rate by 0.25 percentage points. As data mounted suggesting a slowing US economy, however, the Fed adjusted its policy direction – initially, by no longer raising rates and then, in June 2019, reversing its rate increase from December. By the end of the Funds’ fiscal year on Aug. 31, 2019, the federal funds rate was within a range of 2.00% to 2.25%. Investors widely anticipated that the Fed would enact further rate cuts at its meetings later in 2019.
Sources: US Bureau of Economic Analysis, US Bureau of Labor Statistics, and Bloomberg.
Municipal bond market conditions
Uncertainty about trade policy led to uncertainty about future global growth, encouraging global central banks to implement increasingly stimulative economic policies. This led to a highly favorable backdrop for municipal debt, particularly
as the Funds’ fiscal year progressed. The US municipal bond market, as measured by the Bloomberg Barclays Municipal Bond Index, returned 8.72% for the 12 months ended Aug. 31, 2019.
As rates on longer-term bonds fell more than those on shorter-term issues, the municipal yield curve flattened. The largest yield declines came from the “belly” of the municipal yield curve, while the strongest overall performance came from the20-year(17-22 years) and the long bond (22+ years) segments of the curve. Meanwhile, credit spreads tightened, indicating that investors were willing to accept somewhat less yield in exchange for assuming credit risk in an environment of generally healthy credit fundamentals.
Lower-rated bonds generally outperformed their higher-rated counterparts, while bonds with longer maturities tended to outpace those with shorter maturities. The following tables highlight these performance trends for the Funds’ fiscal year ended Aug. 31, 2019:
Returns by credit rating | ||||
AAA | 8.17% | |||
AA | 8.37% | |||
A | 9.20% | |||
BBB | 10.48% | |||
Returns by maturity | ||||
1 year | 2.65% | |||
5 years | 6.34% | |||
10 years | 9.48% | |||
22+ years | 11.14% | |||
Source: Bloomberg. | ||||
Focused on credit research
For all three of the Funds highlighted in this report, we maintained the same management strategy we employ in all market conditions. We follow abottom-up (bond by bond) investment approach. This means we select bonds for the Funds on an
2
Table of Contents
issuer-by-issuer basis, rather than based on ourtop-down view of interest rates or economic and market conditions. And we rely on diligent credit research to identify securities we believe offer the Funds’ shareholders a favorabletrade-off between risk and reward.
Given this process, the Funds tend to have relatively low allocations to bonds with high credit ratings and greater exposure to securities with lower-investment-grade or below-investment-grade credit ratings. By focusing on higher yielding bonds with solid underlying credit quality, we believe we can potentially add value for the Funds’ shareholders. That said, it was sometimes difficult to find as many suitable lower-rated, higher yielding Minnesota bonds as we wished. This reflects changing issuance patterns in Minnesota’s municipal marketplace, highlighted by a greater proportion of relatively highly rated state and local general obligation and school district bonds with relatively low coupons. In this environment, our approach has been to seek a favorabletrade-off between risk and reward potential while maintaining our overall, credit-oriented management approach.
At fiscal year end on Aug. 31, 2019, roughly 31% of the net assets ofDelawareTax-Free Minnesota Fundwas invested in bonds with lower-investment-grade credit ratings (A and BBB), and approximately 22% of the net assets ofDelawareTax-Free Minnesota Intermediate Fundwas invested in these same credit tiers. Both Funds also maintained allocations to high yield municipal bonds, securities with credit ratings below BBB. By prospectus, both Funds may hold up to 20% of their net assets in high yield debt, although these allocations remained below that threshold in both Funds throughout the fiscal year. Whenever we invest in the high yield market segment, we thoroughly analyze the securities’ credit risk and emphasize those bonds that we believe offer the Funds’ shareholders a favorable risk-reward balance.
Consistent with its mandate,Delaware Minnesota High-Yield Municipal Bond Fundmaintained the largest exposure to high yield bonds of the three Funds. As of Aug. 31, 2019, more than 38% of this Fund’s net assets was held in bonds with credit ratings below BBB, including nonrated bonds.
Portfolio positioning
Throughout the fiscal year, our main objective was to maintain the Funds’ existing credit positioning as best we could. Our challenge was that when interest rates fell, the Funds experienced naturally shortening durations, as various longtime portfolio holdings approached their maturity or call dates.
Because our management approach entails keeping the Funds’ duration (that is, interest rate sensitivity) relatively neutral compared with peer funds – a reflection of our view that we can more effectively add value through credit selection than by trying to anticipate the direction of interest rate movements – we needed to take proactive steps to maintain that neutral stance in a falling interest rate environment.
When available, new bond purchases focused on longer-duration bonds, including bonds with longer call dates. Proceeds for new purchases came from investment inflows and from bond maturities and calls. Using the proceeds from the sale of certain shorter-duration holdings also helped us keep the Funds neutrally positioned in an environment of falling interest rates, while maintaining the credit-oriented investment approach we regularly follow.
Although we believe we were often successful in accomplishing our objectives, our ability to do so was more limited in the Minnesota municipal bond marketplace than we preferred. Unlike in other state markets, where we were frequent buyers of noncallable debt, bonds with this structure were harder to come by in Minnesota, which features a large amount of shorter-call supply. Against this backdrop, we tried to accomplish our duration
3
Table of Contents
Portfolio management review
Delaware Funds® by Macquarie Minnesota municipal bond funds
objectives methodically, even as we found it challenging to do so within desired time frames.
Notable performance factors
As noted, longer-maturity bonds tended to outperform shorter-maturity bonds for this fiscal year, while lower-quality issues generally outperformed their higher-rated counterparts. Such trends are evident as we highlight some of the Funds’ strongest- and weakest-performing securities over the 12 months.
In bothDelawareTax-Free Minnesota FundandDelaware Minnesota High-Yield Municipal Bond Fund,for example, the strongest-performing holding consisted of charter school bonds for Stride Academy, which gained more than 23%. Both Funds, along withDelawareTax-Free Minnesota Intermediate Fund,also benefited from an education bond issue of Academia Cesar Chavez Charter School, which returned more than 17%. Both issues benefited from relatively long maturities and lower credit ratings. The Chavez Charter School bonds also benefited from improvements in the school’s academic performance following a probationary period.
Another leading performer inDelawareTax-Free Minnesota Intermediate Fundconsisted of bonds for Maple Grove Hospital, which gained close to 14% for the Fund’s fiscal year, reflecting the bonds’ relatively longer maturity and lower credit quality.
Not surprisingly, many of the weakest individual performers across the Funds were bonds with short call or maturity dates, high credit quality, or both. InDelawareTax-Free Minnesota FundandDelawareTax-Free Minnesota Intermediate Fund,for example, the lowest-returning holdings were issues of Allina Health, whose return of less than 2% was emblematic of the securities’ short call dates.
Meanwhile,pre-refunded bonds of the Dakota and Washington Counties Housing and Redevelopment Authority of the City of Anoka returned less than 2% forDelawareTax-Free Minnesota Fund.As these short-duration, high-quality bonds prepared to hit their maturity date at fiscal year end, we were not disappointed to see them go in light of their high coupon. A similar issue underperformed inDelawareTax-Free Minnesota Intermediate Fund,also returning less than 2%.
The lowest-returning holdings forDelaware Minnesota High-Yield Municipal Bond Fundwere a couple ofpre-refunded bonds, including issues of the University of St. Thomas and Samaritan Bethany. Both bonds returned less than 2% for the Fund for the fiscal year.
Minnesota economic backdrop
Minnesota is supported by a diverse economy with employment anchored by the manufacturing, real estate, and healthcare and social services sectors. Other relevant notes:
| ● | Nonfarm employment remained flat year over year and totaled 3.0 million in July 2019, while the July unemployment rate was 3.4%, stronger than the national average of 3.7%. |
| ● | Per capita personal income has consistently remained above the national average and was 8% above the national average for the most recent estimate. |
| ● | General Fund net receipts collected during fiscal year 2019 are projected to total $23.4 billion, which would be 2.8% above projections and 6.2% above the prior fiscal year. |
| ● | Net income tax collections for fiscal year 2019 are expected to be 3.8% higher than projections, while sales tax receipts are expected to be 1.2% above the forecast. |
4
Table of Contents
| ● | The state’srainy-day fund has grown to nearly $2.5 billion as of fiscal year end 2019. The biennial budget for fiscal years 2020 and 2021 totals $48.5 billion, a 6.5% increase from the previous biennial budget, with a projected deficit of $315 million. |
Sources: bls.gov, bea.gov, ncsl.org, Minnesota Management and Budget.
5
Table of Contents
| Performance summaries | ||
| DelawareTax-Free Minnesota Fund | August 31, 2019 |
The performance quoted represents past performance and does not guarantee future results. Investment return and principal value of an investment will fluctuate so that shares, when redeemed, may be worth more or less than their original cost. Current performance may be lower or higher than the performance quoted. Performance data current to the most recent month end may be obtained by calling 800523-1918 or visiting delawarefunds.com/performance.
Fund and benchmark performance1,2 |
| Average annual total returns through August 31, 2019
|
| |||||||||||||
1 year
| 5 years
| 10 years
| Lifetime
| |||||||||||||
Class A (Est. Feb. 27, 1984) | ||||||||||||||||
Excluding sales charge | +7.54% | +3.33% | +4.22% | +6.19% | ||||||||||||
Including sales charge | +2.72% | +2.37% | +3.75% | +6.05% | ||||||||||||
Class C (Est. May 4, 1994) | ||||||||||||||||
Excluding sales charge | +6.73% | +2.56% | +3.44% | +4.07% | ||||||||||||
Including sales charge | +5.73% | +2.56% | +3.44% | +4.07% | ||||||||||||
Institutional Class (Est. Dec. 31, 2013) | ||||||||||||||||
Excluding sales charge | +7.81% | +3.60% | n/a | +4.54% | ||||||||||||
Including sales charge | +7.81% | +3.60% | n/a | +4.54% | ||||||||||||
Bloomberg Barclays Municipal Bond Index | +8.72% | +3.85% | +4.62% | +4.71%* | ||||||||||||
*The benchmark lifetime return is for Institutional Class share comparison only and is calculated using the last business day in the month of the Fund’s Institutional Class inception date.
1 Returns reflect the reinvestment of all distributions and are presented both with and without the applicable sales charges described below. Returns do not reflect the deduction of taxes the shareholder would pay on Fund distributions or redemptions of Fund shares.
Expense limitations were in effect for certain classes during some or all of the periods shown in the “Fund and benchmark performance” table. Expenses for each class are listed on the “Fund expense ratios” table on page 7. Performance would have been lower had expense limitations not been in effect.
Institutional Class shares are not subject to a sales charge and are offered for sale exclusively to certain eligible investors. In addition, Institutional Class shares pay no distribution and service(12b-1) fee.
Class A shares are sold with a maximumfront-end sales charge of 4.50%, and have an annual12b-1 fee of 0.25% of average daily net assets.
Performance for Class A shares, excluding sales charges, assumes that nofront-end sales charge applied.
Class C shares are sold with a contingent deferred sales charge of 1.00% if redeemed during the first 12 months. They are also subject to an annual12b-1 fee of 1.00% of average daily net assets. Performance for Class C shares, excluding sales charges, assumes either that contingent deferred sales charges did not apply or that the investment was not redeemed.
Fixed income securities and bond funds can lose value, and investors can lose principal, as interest rates rise. They also may be affected by economic conditions that hinder an issuer’s ability to make interest and principal payments on its debt.
The Fund may also be subject to prepayment risk, the risk that the principal of a bond that is held by a portfolio will be prepaid prior to maturity, at the time when interest rates are lower than what the
6
Table of Contents
bond was paying. A portfolio may then have to reinvest that money at a lower interest rate.
Funds that invest primarily in one state may be more susceptible to the economic, regulatory, regional, and other factors of that state than geographically diversified funds.
Substantially all dividend income derived fromtax-free funds is exempt from federal income tax. Some income may be subject to state or local and/or the federal alternative minimum tax (AMT) that applies to certain investors. Capital gains, if any, are taxable.
Duration number will change as market conditions change. Therefore, duration should not be solely relied upon to indicate a municipal bond fund’s potential volatility.
This document may mention bond ratings published by nationally recognized statistical
rating organizations (NRSROs) Standard & Poor’s, Moody’s Investors Service, and Fitch, Inc. For securities rated by an NRSRO other than S&P, the rating is converted to the equivalent S&P credit rating. Bonds rated AAA are rated as having the highest quality and are generally considered to have the lowest degree of investment risk. Bonds rated AA are considered to be of high quality, but with a slightly higher degree of risk than bonds rated AAA. Bonds rated A are considered to have many favorable investment qualities, though they are somewhat more susceptible to adverse economic conditions. Bonds rated BBB are believed to be of medium-grade quality and generally riskier over the long term. Bonds rated BB, B, and CCC are regarded as having significant speculative characteristics, with BB indicating the least degree of speculation of the three.
2 The Fund’s expense ratios, as described in the most recent prospectus, are disclosed in the following “Fund expense ratios” table. Delaware Management Company has agreed to reimburse certain expenses and/or waive certain fees in order to prevent total annual fund operating expenses (excluding any12b-1 fees, acquired fund fees and expenses, taxes, interest, short sale and dividend and interest expenses, brokerage fees, certain insurance costs, and nonroutine expenses or costs, including, but not limited to, those relating to reorganizations, litigation, conducting shareholder meetings, and liquidations) from exceeding 0.60% of the Fund’s average daily net assets during the period from Sept. 1, 2018 to Aug. 31, 2019.** Please see the most recent prospectus and any applicable supplement(s) for additional information on these fee waivers and/or reimbursements. Please see the “Financial highlights” section in this report for the most recent expense ratios.
| Fund expense ratios | Class A
| Class C
| Institutional Class
| |||
Total annual operating expenses | 0.94% | 1.69% | 0.69% | |||
(without fee waivers) | ||||||
Net expenses | 0.85% | 1.60% | 0.60% | |||
(including fee waivers, if any) | ||||||
Type of waiver | Contractual
| Contractual
| Contractual
|
**The aggregate contractual waiver period covering this report is from Dec. 29, 2017 through Dec. 28, 2019.
7
Table of Contents
Performance summaries
DelawareTax-Free Minnesota Fund
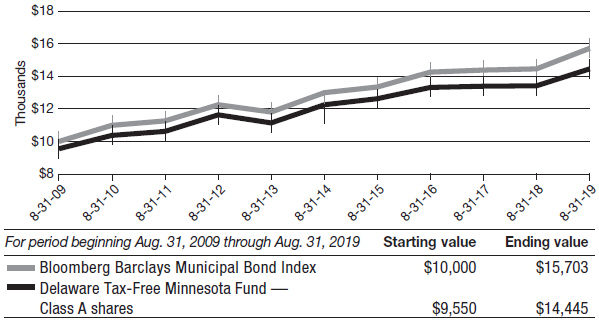
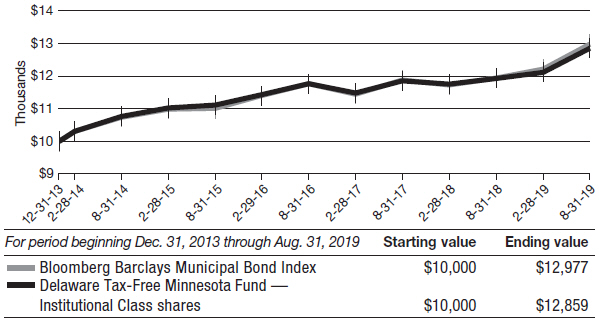
Performance of a $10,000 investment1
Class A shares
Average annual total returns from Aug. 31, 2009 through Aug. 31, 2019
Institutional Class shares
Average annual total returns from Dec. 31, 2013 (inception date) through Aug. 31, 2019
8
Table of Contents
1 The “Performance of a $10,000 investment” graph for Class A shares assumes $10,000 invested in Class A shares of the Fund on Aug. 31, 2009, and includes the effect of a 4.50%front-end sales charge and the reinvestment of all distributions. The graph also assumes $10,000 invested in the Bloomberg Barclays Municipal Bond Index as of Aug. 31, 2009.
The “Performance of a $10,000 investment” graph for Institutional Class shares assumes $10,000 invested in Institutional Class shares of the Fund on Dec. 31, 2013, and includes the reinvestment of all distributions. The graph also assumes $10,000 invested in the Bloomberg Barclays Municipal Bond Index as of Dec. 31, 2013.
The graphs do not reflect the deduction of taxes the shareholders would pay on Fund distributions or redemptions of Fund shares. Expense
limitations were in effect for some or all of the periods shown. Performance would have been lower had expense limitations not been in effect. Expenses are listed in the “Fund expense ratios” table on page 7. Please note additional details on pages 6 through 9.
The Bloomberg Barclays Municipal Bond Index measures the total return performance of the long-term, investment gradetax-exempt bond market.
Index performance returns do not reflect any management fees, transaction costs, or expenses. Indices are unmanaged and one cannot invest directly in an index. Past performance is not a guarantee of future results.
Performance of other Fund classes will vary due to different charges and expenses.
| Nasdaq symbols | CUSIPs | |||||||||||||
Class A | DEFFX | 928918101 | ||||||||||||
Class C | DMOCX | 928918408 | ||||||||||||
Institutional Class | DMNIX | 928918705 | ||||||||||||
9
Table of Contents
| Performance summaries | ||
| DelawareTax-Free Minnesota Intermediate Fund | August 31, 2019 |
The performance quoted represents past performance and does not guarantee future results. Investment return and principal value of an investment will fluctuate so that shares, when redeemed, may be worth more or less than their original cost. Current performance may be lower or higher than the performance quoted. Performance data current to the most recent month end may be obtained by calling 800523-1918 or visiting delawarefunds.com/performance.
| Fund and benchmark performance1,2 |
| Average annual total returns through August 31, 2019
|
| |||||||||||||
1 year
| 5 years
| 10 years
| Lifetime
| |||||||||||||
Class A (Est. Oct. 27, 1985) | ||||||||||||||||
Excluding sales charge | +7.00% | +2.89% | +3.55% | +4.73% | ||||||||||||
Including sales charge | +4.02% | +2.32% | +3.26% | +4.64% | ||||||||||||
Class C (Est. May 4, 1994) | ||||||||||||||||
Excluding sales charge | +6.09% | +2.00% | +2.68% | +3.31% | ||||||||||||
Including sales charge | +5.09% | +2.00% | +2.68% | +3.31% | ||||||||||||
Institutional Class (Est. Dec. 31, 2013) | ||||||||||||||||
Excluding sales charge | +7.06% | +3.02% | n/a | +3.70% | ||||||||||||
Including sales charge | +7.06% | +3.02% | n/a | +3.70% | ||||||||||||
| Bloomberg Barclays 3–15 Year Blend Municipal Bond Index | +8.16% | +3.42% | +4.15% | +4.06%* | ||||||||||||
*The benchmark lifetime return is for Institutional Class share comparison only and is calculated using the last business day in the month of the Fund’s Institutional Class inception date
1 Returns reflect the reinvestment of all distributions and are presented both with and without the applicable sales charges described below. Returns do not reflect the deduction of taxes the shareholder would pay on Fund distributions or redemptions of Fund shares.
Expense limitations were in effect for certain classes during some or all of the periods shown in the “Fund and benchmark performance” table. Expenses for each class are listed on the “Fund expense ratios” table on page 11. Performance would have been lower had expense limitations not been in effect.
Institutional Class shares are not subject to a sales charge and are offered for sale exclusively to certain eligible investors. In addition, Institutional Class shares pay no distribution and service(12b-1) fee.
Class A shares are sold with a maximumfront-end sales charge of 2.75%, and have an annual12b-1 fee of 0.25% of average daily net assets. This fee
was contractually limited to 0.15% of average daily net assets from Sept. 1, 2018 through Aug. 31, 2019.** Performance for Class A shares, excluding sales charges, assumes that nofront-end sales charge applied.
Class C shares are sold with a contingent deferred sales charge of 1.00% if redeemed during the first 12 months. They are also subject to an annual12b-1 fee of 1.00% of average daily net assets. Performance for Class C shares, excluding sales charges, assumes either that contingent deferred sales charges did not apply or that the investment was not redeemed.
Fixed income securities and bond funds can lose value, and investors can lose principal, as interest rates rise. They also may be affected by economic conditions that hinder an issuer’s ability to make interest and principal payments on its debt.
The Fund may also be subject to prepayment risk, the risk that the principal of a bond that is held by a portfolio will be prepaid prior to maturity, at the
10
Table of Contents
time when interest rates are lower than what the bond was paying. A portfolio may then have to reinvest that money at a lower interest rate.
Funds that invest primarily in one state may be more susceptible to the economic, regulatory, regional, and other factors of that state than geographically diversified funds.
Substantially all dividend income derived fromtax-free funds is exempt from federal income tax. Some income may be subject to state or local and/or the federal alternative minimum tax (AMT) that applies to certain investors. Capital gains, if any, are taxable.
Duration number will change as market conditions change. Therefore, duration should not be solely relied upon to indicate a municipal bond fund’s potential volatility.
This document may mention bond ratings published by nationally recognized statistical
rating organizations (NRSROs) Standard & Poor’s, Moody’s Investors Service, and Fitch, Inc. For securities rated by an NRSRO other than S&P, the rating is converted to the equivalent S&P credit rating. Bonds rated AAA are rated as having the highest quality and are generally considered to have the lowest degree of investment risk. Bonds rated AA are considered to be of high quality, but with a slightly higher degree of risk than bonds rated AAA. Bonds rated A are considered to have many favorable investment qualities, though they are somewhat more susceptible to adverse economic conditions. Bonds rated BBB are believed to be of medium-grade quality and generally riskier over the long term. Bonds rated BB, B, and CCC are regarded as having significant speculative characteristics, with BB indicating the least degree of speculation of the three.
2 The Fund’s expense ratios, as described in the most recent prospectus, are disclosed in the following “Fund expense ratios” table. Delaware Management Company has agreed to reimburse certain expenses and/or waive certain fees in order to prevent total annual fund operating expenses (excluding any12b-1 fees, acquired fund fees and expenses, taxes, interest, short sale and dividend and interest expenses, brokerage fees, certain insurance costs, and nonroutine expenses or costs, including, but not limited to, those relating to reorganizations, litigation, conducting shareholder meetings, and liquidations) from exceeding 0.56% of the Fund’s average daily net assets during the period from Sept. 1, 2018 to Aug. 31, 2019.*** Please see the most recent prospectus and any applicable supplement(s) for additional information on these fee waivers and/or reimbursements. Please see the “Financial highlights” section in this report for the most recent expense ratios.
| Fund expense ratios | Class A
| Class C
| Institutional Class
| |||
Total annual operating expenses | 1.00% | 1.75% | 0.75% | |||
(without fee waivers) | ||||||
Net expenses | 0.71% | 1.56% | 0.56% | |||
(including fee waivers, if any) | ||||||
Type of waiver | Contractual
| Contractual
| Contractual
|
**The aggregate contractual waiver period covering this report is from Dec. 29, 2017 through Dec. 28, 2019.
*** The aggregate contractual waiver period covering this report is from April 1, 2018 through Dec. 28, 2019.
11
Table of Contents
Performance summaries
DelawareTax-Free Minnesota Intermediate Fund
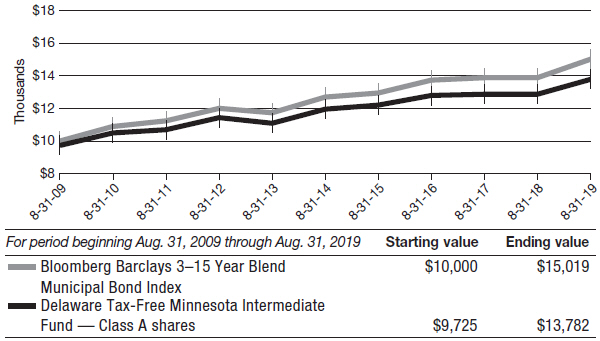
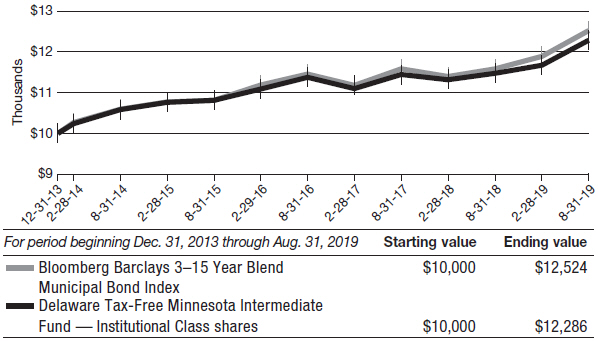
Performance of a $10,000 investment1
Class A shares
Average annual total returns from Aug. 31, 2009 through Aug. 31, 2019
Institutional Class shares
Average annual total returns from Dec. 31, 2013 (inception date) through Aug. 31, 2019
12
Table of Contents
1 The “Performance of a $10,000 investment” graph for Class A shares assumes $10,000 invested in Class A shares of the Fund on Aug. 31, 2009, and includes the effect of a 2.75%front-end sales charge and the reinvestment of all distributions. The graph also assumes $10,000 invested in the Bloomberg Barclays 3–15 Year Blend Municipal Bond Index as of Aug. 31, 2009.
The “Performance of a $10,000 investment” graph for Institutional Class shares assumes $10,000 invested in Institutional Class shares of the Fund on Dec. 31, 2013, and includes the reinvestment of all distributions. The graph also assumes $10,000 invested in the Bloomberg Barclays 3–15 Year Blend Municipal Bond Index as of Dec. 31, 2013.
The graphs do not reflect the deduction of taxes the shareholders would pay on Fund distributions or redemptions of Fund shares. Expense
limitations were in effect for some or all of the periods shown. Performance would have been lower had expense limitations not been in effect. Expenses are listed in the “Fund expense ratios” table on page 11. Please note additional details on pages 10 through 13.
The Bloomberg Barclays 3–15 Year Blend Municipal Bond Index measures the total return performance of investment grade, UStax-exempt bonds with maturities from 2 to 17 years.
Index performance returns do not reflect any management fees, transaction costs, or expenses. Indices are unmanaged and one cannot invest directly in an index. Past performance is not a guarantee of future results.
Performance of other Fund classes will vary due to different charges and expenses.
| Nasdaq symbols | CUSIPs | |||||||||||||
Class A | DXCCX | 928930106 | ||||||||||||
Class C | DVSCX | 928930205 | ||||||||||||
Institutional Class | DMIIX | 92910U109 | ||||||||||||
13
Table of Contents
| Performance summaries | ||
| Delaware Minnesota High-Yield Municipal Bond Fund | August 31, 2019 |
The performance quoted represents past performance and does not guarantee future results. Investment return and principal value of an investment will fluctuate so that shares, when redeemed, may be worth more or less than their original cost. Current performance may be lower or higher than the performance quoted. Performance data current to the most recent month end may be obtained by calling 800523-1918 or visiting delawarefunds.com/performance.
| Fund and benchmark performance1,2 |
| Average annual total returns through August 31, 2019
|
| |||||||||||||
1 year
| 5 years
| 10 years
| Lifetime
| |||||||||||||
Class A (Est. June 4, 1996) | ||||||||||||||||
Excluding sales charge | +8.33% | +3.84% | +4.89% | +5.10% | ||||||||||||
Including sales charge | +3.48% | +2.90% | +4.40% | +4.89% | ||||||||||||
Class C (Est. June 7, 1996) | ||||||||||||||||
Excluding sales charge | +7.51% | +3.07% | +4.10% | +4.32% | ||||||||||||
Including sales charge | +6.51% | +3.07% | +4.10% | +4.32% | ||||||||||||
Institutional Class (Est. Dec. 31, 2013) | ||||||||||||||||
Excluding sales charge | +8.50% | +4.09% | n/a | +5.05% | ||||||||||||
Including sales charge | +8.50% | +4.09% | n/a | +5.05% | ||||||||||||
| Bloomberg Barclays Municipal Bond Index | +8.72% | +3.85% | +4.62% | +4.71%* | ||||||||||||
*The benchmark lifetime return is for Institutional Class share comparison only and is calculated using the last business day in the month of the Fund’s Institutional Class inception date
1 Returns reflect the reinvestment of all distributions and are presented both with and without the applicable sales charges described below. Returns do not reflect the deduction of taxes the shareholder would pay on Fund distributions or redemptions of Fund shares.
Expense limitations were in effect for certain classes during some or all of the periods shown in the “Fund and benchmark performance” table. Expenses for each class are listed on the “Fund expense ratios” table on page 15. Performance would have been lower had expense limitations not been in effect.
Institutional Class shares are not subject to a sales charge and are offered for sale exclusively to certain eligible investors. In addition, Institutional Class shares pay no distribution and service(12b-1) fee.
Class A shares are sold with a maximumfront-end sales charge of 4.50%, and have an annual12b-1 fee of 0.25% of average daily net assets.
Performance for Class A shares, excluding sales charges, assumes that nofront-end sales charge applied.
Class C shares are sold with a contingent deferred sales charge of 1.00% if redeemed during the first 12 months. They are also subject to an annual12b-1 fee of 1.00% of average daily net assets. Performance for Class C shares, excluding sales charges, assumes either that contingent deferred sales charges did not apply or that the investment was not redeemed.
Fixed income securities and bond funds can lose value, and investors can lose principal, as interest rates rise. They also may be affected by economic conditions that hinder an issuer’s ability to make interest and principal payments on its debt.
The Fund may also be subject to prepayment risk, the risk that the principal of a bond that is held by a portfolio will be prepaid prior to maturity, at the time when interest rates are lower than what the
14
Table of Contents
bond was paying. A portfolio may then have to reinvest that money at a lower interest rate.
Funds that invest primarily in one state may be more susceptible to the economic, regulatory, regional, and other factors of that state than geographically diversified funds.
Substantially all dividend income derived fromtax-free funds is exempt from federal income tax. Some income may be subject to state or local and/or the federal alternative minimum tax (AMT) that applies to certain investors. Capital gains, if any, are taxable.
Duration number will change as market conditions change. Therefore, duration should not be solely relied upon to indicate a municipal bond fund’s potential volatility.
This document may mention bond ratings published by nationally recognized statistical
rating organizations (NRSROs) Standard & Poor’s, Moody’s Investors Service, and Fitch, Inc. For securities rated by an NRSRO other than S&P, the rating is converted to the equivalent S&P credit rating. Bonds rated AAA are rated as having the highest quality and are generally considered to have the lowest degree of investment risk. Bonds rated AA are considered to be of high quality, but with a slightly higher degree of risk than bonds rated AAA. Bonds rated A are considered to have many favorable investment qualities, though they are somewhat more susceptible to adverse economic conditions. Bonds rated BBB are believed to be of medium-grade quality and generally riskier over the long term. Bonds rated BB, B, and CCC are regarded as having significant speculative characteristics, with BB indicating the least degree of speculation of the three.
2 The Fund’s expense ratios, as described in the most recent prospectus, are disclosed in the following “Fund expense ratios” table. Delaware Management Company has agreed to reimburse certain expenses and/or waive certain fees in order to prevent total annual fund operating expenses (excluding any12b-1 fees, acquired fund fees and expenses, taxes, interest, short sale and dividend and interest expenses, brokerage fees, certain insurance costs, and nonroutine expenses or costs, including, but not limited to, those relating to reorganizations, litigation, conducting shareholder meetings, and liquidations) from exceeding 0.64% of the Fund’s average daily net assets during the period from Sept. 1, 2018 to Aug. 31, 2019.** Please see the most recent prospectus and any applicable supplement(s) for additional information on these fee waivers and/or reimbursements. Please see the “Financial highlights” section in this report for the most recent expense ratios.
| Fund expense ratios | Class A
| Class C
| Institutional Class
| |||
Total annual operating expenses | 0.99% | 1.74% | 0.74% | |||
(without fee waivers) | ||||||
Net expenses | 0.89% | 1.64% | 0.64% | |||
(including fee waivers, if any) | ||||||
Type of waiver | Contractual
| Contractual
| Contractual
|
**The aggregate contractual waiver period covering this report is from Dec. 29, 2017 through Dec. 28, 2019.
15
Table of Contents
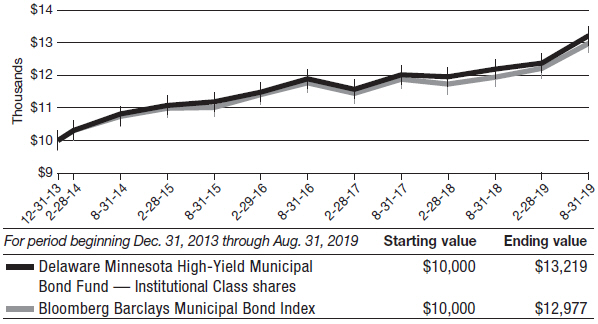
Performance summaries
Delaware Minnesota High-Yield Municipal Bond Fund
Performance of a $10,000 investment1
Class A shares
Average annual total returns from Aug. 31, 2009 through Aug. 31, 2019
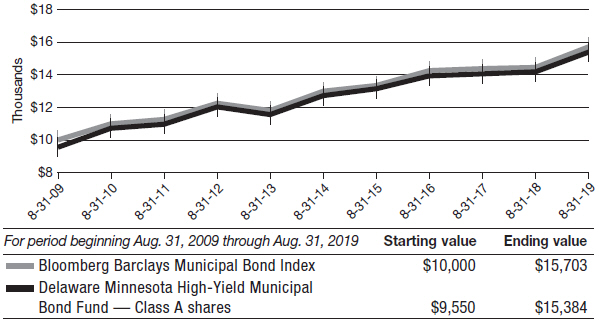
Institutional Class shares
Average annual total returns from Dec. 31, 2013 (inception date) through Aug. 31, 2019
16
Table of Contents
1 The “Performance of a $10,000 investment” graph for Class A shares assumes $10,000 invested in Class A shares of the Fund on Aug. 31, 2009, and includes the effect of a 4.50%front-end sales charge and the reinvestment of all distributions. The graph also assumes $10,000 invested in the Bloomberg Barclays Municipal Bond Index as of Aug. 31, 2009.
The “Performance of a $10,000 investment” graph for Institutional Class shares assumes $10,000 invested in Institutional Class shares of the Fund on Dec. 31, 2013, and includes the reinvestment of all distributions. The graph also assumes $10,000 invested in the Bloomberg Barclays Municipal Bond Index as of Dec. 31, 2013.
The graphs do not reflect the deduction of taxes the shareholders would pay on Fund distributions or redemptions of Fund shares. Expense
limitations were in effect for some or all of the periods shown. Performance would have been lower had expense limitations not been in effect. Expenses are listed in the “Fund expense ratios” table on page 15. Please note additional details on pages 14 through 17.
The Bloomberg Barclays Municipal Bond Index measures the total return performance of the long-term, investment gradetax-exempt bond market.
Index performance returns do not reflect any management fees, transaction costs, or expenses. Indices are unmanaged and one cannot invest directly in an index. Past performance is not a guarantee of future results.
Performance of other Fund classes will vary due to different charges and expenses.
| Nasdaq symbols | CUSIPs | |||||||||||||
Class A | DVMHX | 928928316 | ||||||||||||
Class C | DVMMX | 928928282 | ||||||||||||
Institutional Class | DMHIX | 928928175 | ||||||||||||
17
Table of Contents
For thesix-month period from March 1, 2019 to August 31, 2019 (Unaudited)
As a shareholder of a Fund, you incur two types of costs: (1) transaction costs, including sales charges (loads) on purchase payments, reinvested dividends, or other distributions; redemption fees; and exchange fees; and (2) ongoing costs, including management fees; distribution and service(12b-1) fees; and other Fund expenses. These following examples are intended to help you understand your ongoing costs (in dollars) of investing in a Fund and to compare these costs with the ongoing costs of investing in other mutual funds.
The examples are based on an investment of $1,000 invested at the beginning of the period and held for the entiresix-month period from March 1, 2019 to Aug. 31, 2019.
Actual expenses
The first section of the tables shown, “Actual Fund return,” provides information about actual account values and actual expenses. You may use the information in this section of the table, together with the amount you invested, to estimate the expenses that you paid over the period. Simply divide your account value by $1,000 (for example, an $8,600 account value divided by $1,000 = 8.6), then multiply the result by the number in the first section under the heading entitled “Expenses Paid During Period” to estimate the expenses you paid on your account during this period.
Hypothetical example for comparison purposes
The second section of the tables shown, “Hypothetical 5% return,” provides information about hypothetical account values and hypothetical expenses based on the Funds’ actual expense ratios and an assumed rate of return of 5% per year before expenses, which is not the Funds’ actual return. The hypothetical account values and expenses may not be used to estimate the actual ending account balance or expenses you paid for the period. You may use this information to compare the ongoing costs of investing in the Funds and other funds. To do so, compare this 5% hypothetical example with the 5% hypothetical examples that appear in the shareholder reports of the other funds.
Please note that the expenses shown in the tables are meant to highlight your ongoing costs only and do not reflect any transactional costs, such as sales charges (loads), redemption fees, or exchange fees. Therefore, the second section of each table is useful in comparing ongoing costs only, and will not help you determine the relative total costs of owning different funds. In addition, if these transactional costs were included, your costs would have been higher. The Funds’ expenses shown in the tables reflect fee waivers in effect and assume reinvestment of all dividends and distributions.
18
Table of Contents
DelawareTax-Free Minnesota Fund
Expense analysis of an investment of $1,000
Beginning
Account Value
3/1/19 | Ending
Account Value
8/31/19 | Annualized
Expense Ratio | Expenses
Paid During Period
3/1/19 to 8/31/19* | |||||||||||||
Actual Fund return† | ||||||||||||||||
Class A | $1,000.00 | $1,058.60 | 0.85% | $4.41 | ||||||||||||
Class C | 1,000.00 | 1,054.50 | 1.60% | 8.29 | ||||||||||||
Institutional Class | 1,000.00 | 1,060.80 | 0.60% | 3.12 | ||||||||||||
Hypothetical 5% return(5% return before expenses) |
| |||||||||||||||
Class A | $1,000.00 | $1,020.92 | 0.85% | $4.33 | ||||||||||||
Class C | 1,000.00 | 1,017.14 | 1.60% | 8.13 | ||||||||||||
Institutional Class | 1,000.00 | 1,022.18 | 0.60% | 3.06 | ||||||||||||
DelawareTax-Free Minnesota Intermediate Fund
Expense analysis of an investment of $1,000
Beginning
Account Value
3/1/19 | Ending
Account Value
8/31/19 | Annualized
Expense Ratio | Expenses
Paid During Period
3/1/19 to 8/31/19* | |||||||||||||
Actual Fund return† | ||||||||||||||||
Class A | $1,000.00 | $1,051.50 | 0.71% | $3.67 | ||||||||||||
Class C | 1,000.00 | 1,047.00 | 1.56% | 8.05 | ||||||||||||
Institutional Class | 1,000.00 | 1,052.30 | 0.56% | 2.90 | ||||||||||||
Hypothetical 5% return(5% return before expenses) |
| |||||||||||||||
Class A | $1,000.00 | $1,021.63 | 0.71% | $3.62 | ||||||||||||
Class C | 1,000.00 | 1,017.34 | 1.56% | 7.93 | ||||||||||||
Institutional Class | 1,000.00 | 1,022.38 | 0.56% | 2.85 | ||||||||||||
19
Table of Contents
Disclosure of Fund expenses
For thesix-month period from March 1, 2019 to August 31, 2019 (Unaudited)
Delaware Minnesota High-Yield Municipal Bond Fund
Expense analysis of an investment of $1,000
Beginning
Account Value
3/1/19 | Ending
Account Value
8/31/19 | Annualized
Expense Ratio | Expenses
Paid During Period
3/1/19 to 8/31/19* | |||||||||||||
Actual Fund return† | ||||||||||||||||
Class A | $1,000.00 | $1,066.00 | 0.89% | $4.63 | ||||||||||||
Class C | 1,000.00 | 1,061.90 | 1.64% | 8.52 | ||||||||||||
Institutional Class | 1,000.00 | 1,067.30 | 0.64% | 3.33 | ||||||||||||
Hypothetical 5% return(5% return before expenses) |
| |||||||||||||||
Class A | $1,000.00 | $1,020.72 | 0.89% | $4.53 | ||||||||||||
Class C | 1,000.00 | 1,016.94 | 1.64% | 8.34 | ||||||||||||
Institutional Class | 1,000.00 | 1,021.98 | 0.64% | 3.26 | ||||||||||||
*“Expenses Paid During Period” are equal to the relevant Fund’s annualized expense ratio, multiplied by the average account value over the period, multiplied by 184/365 (to reflect theone-half year period).
† Because actual returns reflect only the most recentsix-month period, the returns shown may differ significantly from fiscal year returns.
20
Table of Contents
Security type / sector / state / territory allocations
| DelawareTax-Free Minnesota Fund | As of August 31, 2019 (Unaudited) |
Sector designations may be different than the sector designations presented in other fund materials.
Security type / sector
| Percentage of net assets
| |||||||
Municipal Bonds* | 103.05% | |||||||
Corporate Revenue Bond | 0.62% | |||||||
Education Revenue Bonds | 18.51% | |||||||
Electric Revenue Bonds | 9.51% | |||||||
Healthcare Revenue Bonds | 27.75% | |||||||
Housing Revenue Bonds | 0.41% | |||||||
Lease Revenue Bonds | 2.79% | |||||||
Local General Obligation Bonds | 9.79% | |||||||
Pre-Refunded/Escrowed to Maturity Bonds | 7.78% | |||||||
Special Tax Revenue Bonds | 3.03% | |||||||
State General Obligation Bonds | 12.44% | |||||||
Transportation Revenue Bonds | 7.35% | |||||||
Water & Sewer Revenue Bonds
|
| 3.07%
|
| |||||
Short-Term Investments | 1.53% | |||||||
Total Value of Securities | 104.58% | |||||||
Liabilities Net of Receivables and Other Assets | (4.58%) | |||||||
Total Net Assets | 100.00% | |||||||
* As of the date of this report, DelawareTax-Free Minnesota Fund held bonds issued by or on behalf of territories and the states of the US as follows:
State / territory
| Percentage of net assets
| |||||||
Guam | 0.38% | |||||||
Minnesota | 101.78% | |||||||
Puerto Rico | 2.06% | |||||||
US Virgin Islands
|
| 0.36%
|
| |||||
Total Value of Securities | 104.58% | |||||||
21
Table of Contents
Security type / sector / state / territory allocations
| DelawareTax-Free Minnesota Intermediate Fund | As of August 31, 2019 (Unaudited) |
Sector designations may be different than the sector designations presented in other fund materials.
Security type / sector
| Percentage of net assets
| |||||||
Municipal Bonds* |
|
97.85% |
| |||||
Corporate Revenue Bond | 0.32% | |||||||
Education Revenue Bonds | 15.20% | |||||||
Electric Revenue Bonds | 10.09% | |||||||
Healthcare Revenue Bonds | 31.14% | |||||||
Housing Revenue Bond | 0.38% | |||||||
Lease Revenue Bonds | 5.19% | |||||||
Local General Obligation Bonds | 7.39% | |||||||
Pre-Refunded/Escrowed to Maturity Bonds | 7.08% | |||||||
Special Tax Revenue Bonds | 2.26% | |||||||
State General Obligation Bonds | 9.08% | |||||||
Transportation Revenue Bonds | 8.04% | |||||||
Water & Sewer Revenue Bonds
|
| 1.68%
|
| |||||
Short-Term Investments | 2.16% | |||||||
Total Value of Securities | 100.01% | |||||||
Liabilities Net of Receivables and Other Assets | (0.01%) | |||||||
Total Net Assets | 100.00% | |||||||
* As of the date of this report, DelawareTax-Free Minnesota Intermediate Fund held bonds issued by or on behalf of territories and the states of the US as follows:
State / territory
| Percentage of net assets
| |||||||
Minnesota |
|
98.48% |
| |||||
Puerto Rico
|
| 1.53%
|
| |||||
Total Value of Securities | 100.01% | |||||||
22
Table of Contents
Security type / sector / state / territory allocations
Delaware Minnesota High-Yield Municipal Bond Fund | As of August 31, 2019 (Unaudited) |
Sector designations may be different than the sector designations presented in other fund materials.
Security type / sector
| Percentage of net assets
| |||||||
Municipal Bonds* |
|
98.96% |
| |||||
Corporate Revenue Bond | 0.98% | |||||||
Education Revenue Bonds | 19.80% | |||||||
Electric Revenue Bonds | 7.78% | |||||||
Healthcare Revenue Bonds | 33.97% | |||||||
Housing Revenue Bonds | 1.81% | |||||||
Lease Revenue Bonds | 2.39% | |||||||
Local General Obligation Bonds | 7.50% | |||||||
Pre-Refunded/Escrowed to Maturity Bonds | 5.38% | |||||||
Special Tax Revenue Bonds | 5.02% | |||||||
State General Obligation Bonds | 8.43% | |||||||
Transportation Revenue Bonds | 4.40% | |||||||
Water & Sewer Revenue Bonds
|
| 1.50%
|
| |||||
Short-Term Investments |
|
1.59% |
| |||||
Total Value of Securities | 100.55% | |||||||
Liabilities Net of Receivables and Other Assets | (0.55%) | |||||||
Total Net Assets | 100.00% | |||||||
* As of the date of this report, Delaware Minnesota High-Yield Municipal Bond Fund held bonds issued by or on behalf of territories and the states of the US as follows:
State / territory
| Percentage of net assets
| |||||||
Guam |
|
0.34% |
| |||||
Minnesota | 96.22% | |||||||
Puerto Rico | 3.99% | |||||||
Total Value of Securities | 100.55% | |||||||
23
Table of Contents
| DelawareTax-Free Minnesota Fund | August 31, 2019 | |||
| Principal amount° | Value (US $) | |||||||
Municipal Bonds – 103.05% | ||||||||
Corporate Revenue Bond – 0.62% | ||||||||
St. Paul Port Authority Solid Waste Disposal Revenue | ||||||||
(Gerdau St. Paul Steel Mill Project) | ||||||||
Series 7 144A 4.50% 10/1/37 (AMT)# | 3,565,000 | $ | 3,621,149 | |||||
|
| |||||||
| 3,621,149 | ||||||||
|
| |||||||
Education Revenue Bonds – 18.51% | ||||||||
Bethel Charter School Lease Revenue | ||||||||
(Spectrum High School Project) | ||||||||
Series A 4.00% 7/1/32 | 840,000 | 906,175 | ||||||
Series A 4.25% 7/1/47 | 1,550,000 | 1,652,021 | ||||||
Series A 4.375% 7/1/52 | 400,000 | 428,412 | ||||||
Brooklyn Park Charter School Lease Revenue | ||||||||
(Prairie Seeds Academy Project) | ||||||||
Series A 5.00% 3/1/34 | 2,260,000 | 2,348,976 | ||||||
Series A 5.00% 3/1/39 | 385,000 | 395,969 | ||||||
Cologne Charter School Lease Revenue | ||||||||
(Cologne Academy Project) | ||||||||
Series A 5.00% 7/1/34 | 250,000 | 268,457 | ||||||
Series A 5.00% 7/1/45 | 1,390,000 | 1,470,995 | ||||||
Deephaven Charter School Lease Revenue | ||||||||
(Eagle Ridge Academy Project) Series A 5.50% 7/1/50 | 2,000,000 | 2,199,960 | ||||||
Duluth Housing & Redevelopment Authority Revenue | ||||||||
(Duluth Public Schools Academy Project) | ||||||||
Series A 5.00% 11/1/38 | 700,000 | 778,281 | ||||||
Series A 5.00% 11/1/48 | 2,800,000 | 3,075,604 | ||||||
Duluth Independent School District No. 709 Certificates of Participation | ||||||||
Series B 5.00% 2/1/28 | 350,000 | 441,529 | ||||||
Forest Lake Charter School Lease Revenue Fund | ||||||||
(Lakes International Language Academy Project) | ||||||||
Series A 5.25% 8/1/43 | 400,000 | 445,808 | ||||||
Series A 5.375% 8/1/50 | 1,690,000 | 1,889,217 | ||||||
Series A 5.50% 8/1/36 | 580,000 | 625,808 | ||||||
Series A 5.75% 8/1/44 | 1,190,000 | 1,283,177 | ||||||
Ham Lake Charter School Lease Revenue | ||||||||
(Davinci Academy Project) | ||||||||
Series A 5.00% 7/1/36 | 765,000 | 819,950 | ||||||
Series A 5.00% 7/1/47 | 2,290,000 | 2,426,873 | ||||||
Hugo Charter School Lease Revenue | ||||||||
(Noble Academy Project) | ||||||||
Series A 5.00% 7/1/34 | 580,000 | 619,620 | ||||||
Series A 5.00% 7/1/44 | 1,770,000 | 1,869,934 | ||||||
24
Table of Contents
| Principal amount° | Value (US $) | |||||||
Municipal Bonds(continued) | ||||||||
Education Revenue Bonds(continued) | ||||||||
Minneapolis Charter School Lease Revenue | ||||||||
(Hiawatha Academies Project) | ||||||||
Series A 5.00% 7/1/31 | 885,000 | $ | 970,845 | |||||
Series A 5.00% 7/1/47 | 2,300,000 | 2,469,441 | ||||||
Minneapolis Student Housing Revenue (Riverton Community Housing Project) | ||||||||
5.25% 8/1/39 | 470,000 | 506,345 | ||||||
5.50% 8/1/49 | 2,260,000 | 2,449,433 | ||||||
Minnesota Colleges & Universities Revenue Fund Series A 5.00% 10/1/26 | 4,990,000 | 6,271,681 | ||||||
Minnesota Higher Education Facilities Authority Revenue | ||||||||
(Bethel University) | ||||||||
5.00% 5/1/32 | 1,375,000 | 1,639,124 | ||||||
5.00% 5/1/37 | 1,250,000 | 1,469,563 | ||||||
5.00% 5/1/47 | 250,000 | 289,045 | ||||||
(Carleton College) | ||||||||
4.00% 3/1/35 | 1,000,000 | 1,146,610 | ||||||
4.00% 3/1/36 | 415,000 | 474,648 | ||||||
5.00% 3/1/44 | 2,085,000 | 2,534,463 | ||||||
(College of St. Benedict) Series8-K 4.00% 3/1/43 | 1,000,000 | 1,067,150 | ||||||
(College of St. Scholastica) | ||||||||
4.00% 12/1/29 | 280,000 | 330,663 | ||||||
4.00% 12/1/30 | 290,000 | 339,425 | ||||||
4.00% 12/1/33 | 500,000 | 571,820 | ||||||
4.00% 12/1/34 | 500,000 | 569,220 | ||||||
4.00% 12/1/40 | 1,200,000 | 1,347,072 | ||||||
(Gustavus Adolphus College) 5.00% 10/1/47 | 5,600,000 | 6,625,696 | ||||||
(St. Catherine University) | ||||||||
Series A 4.00% 10/1/36 | 925,000 | 1,017,111 | ||||||
Series A 5.00% 10/1/35 | 875,000 | 1,058,339 | ||||||
Series A 5.00% 10/1/45 | 2,120,000 | 2,512,645 | ||||||
(St. John’s University) | ||||||||
Series8-I 5.00% 10/1/32 | 500,000 | 592,970 | ||||||
Series8-I 5.00% 10/1/33 | 250,000 | 295,825 | ||||||
(St. Olaf College) | ||||||||
Series8-G 5.00% 12/1/31 | 670,000 | 804,824 | ||||||
Series8-G 5.00% 12/1/32 | 670,000 | 803,719 | ||||||
Series8-N 4.00% 10/1/35 | 500,000 | 568,315 | ||||||
(St. Scholastica College) Series7-J 6.30% 12/1/40 | 1,800,000 | 1,822,446 | ||||||
(Trustees of The Hamline University) | ||||||||
Series B 5.00% 10/1/37 | 955,000 | 1,101,841 | ||||||
25
Table of Contents
| Schedules of investments |
DelawareTax-Free Minnesota Fund
| Principal amount° | Value (US $) | |||||||
Municipal Bonds(continued) | ||||||||
Education Revenue Bonds(continued) | ||||||||
Minnesota Higher Education Facilities Authority Revenue | ||||||||
(Trustees of The Hamline University) | ||||||||
Series B 5.00% 10/1/38 | 1,000,000 | $ | 1,150,760 | |||||
Series B 5.00% 10/1/39 | 170,000 | 195,362 | ||||||
Series B 5.00% 10/1/40 | 625,000 | 716,881 | ||||||
Series B 5.00% 10/1/47 | 1,060,000 | 1,207,064 | ||||||
(University of St. Thomas) | ||||||||
4.00% 10/1/36 | 700,000 | 822,815 | ||||||
4.00% 10/1/37 | 750,000 | 878,347 | ||||||
4.00% 10/1/44 | 1,255,000 | 1,439,949 | ||||||
5.00% 10/1/40 | 500,000 | 630,375 | ||||||
Series8-L 5.00% 4/1/35 | 1,250,000 | 1,494,813 | ||||||
Series A 4.00% 10/1/34 | 400,000 | 456,012 | ||||||
Series A 4.00% 10/1/36 | 500,000 | 567,740 | ||||||
Otsego Charter School Lease Revenue | ||||||||
(Kaleidoscope Charter School) | ||||||||
Series A 5.00% 9/1/34 | 520,000 | 555,682 | ||||||
Series A 5.00% 9/1/44 | 1,165,000 | 1,226,931 | ||||||
Rice County Educational Facilities Revenue | ||||||||
(Shattuck-St. Mary’s School) Series A 144A 5.00% 8/1/22 # | 2,855,000 | 3,022,360 | ||||||
St. Cloud Charter School Lease Revenue | ||||||||
(Stride Academy Project) Series A 5.00% 4/1/46 | 875,000 | 598,824 | ||||||
St. Paul Housing & Redevelopment Authority Charter School Lease Revenue | ||||||||
(Academia Cesar Chavez School Project) Series A 5.25% 7/1/50 | 1,945,000 | 2,066,990 | ||||||
(Great River School Project) | ||||||||
Series A 144A 4.75% 7/1/29 # | 300,000 | 323,544 | ||||||
Series A 144A 5.50% 7/1/52 # | 735,000 | 795,571 | ||||||
(Nova Classical Academy Project) | ||||||||
Series A 4.00% 9/1/36 | 500,000 | 531,695 | ||||||
Series A 4.125% 9/1/47 | 1,750,000 | 1,843,853 | ||||||
(Twin Cities Academy Project) Series A 5.30% 7/1/45 | 1,440,000 | 1,550,275 | ||||||
University of Minnesota | ||||||||
Series A 5.00% 4/1/34 | 925,000 | 1,127,418 | ||||||
Series A 5.00% 9/1/34 | 2,625,000 | 3,307,343 | ||||||
Series A 5.00% 4/1/35 | 3,175,000 | 3,860,483 | ||||||
Series A 5.00% 4/1/36 | 2,650,000 | 3,215,086 | ||||||
Series A 5.00% 4/1/37 | 1,125,000 | 1,361,666 | ||||||
Series A 5.00% 9/1/40 | 1,560,000 | 1,936,459 | ||||||
Series A 5.00% 9/1/41 | 1,750,000 | 2,168,967 | ||||||
26
Table of Contents
| Principal amount° | Value (US $) | |||||||
Municipal Bonds(continued) | ||||||||
Education Revenue Bonds(continued) | ||||||||
University of Minnesota | ||||||||
Series A 5.00% 4/1/44 | 3,000,000 | $ | 3,813,420 | |||||
|
| |||||||
| 108,463,730 | ||||||||
|
| |||||||
Electric Revenue Bonds – 9.51% | ||||||||
Chaska Electric Revenue | ||||||||
(Generating Facilities) Series A 5.00% 10/1/30 | 1,150,000 | 1,377,987 | ||||||
Minnesota Municipal Power Agency Electric Revenue | ||||||||
4.00% 10/1/41 | 1,000,000 | 1,114,160 | ||||||
5.00% 10/1/29 | 395,000 | 465,472 | ||||||
5.00% 10/1/30 | 500,000 | 587,990 | ||||||
5.00% 10/1/33 | 1,205,000 | 1,412,212 | ||||||
5.00% 10/1/47 | 2,000,000 | 2,387,780 | ||||||
Series A 5.00% 10/1/30 | 1,060,000 | 1,246,539 | ||||||
Series A 5.00% 10/1/34 | 750,000 | 878,400 | ||||||
Series A 5.00% 10/1/35 | 1,525,000 | 1,785,287 | ||||||
Northern Municipal Power Agency Electric System Revenue | ||||||||
5.00% 1/1/27 | 540,000 | 657,007 | ||||||
5.00% 1/1/28 | 350,000 | 424,077 | ||||||
5.00% 1/1/28 | 210,000 | 261,101 | ||||||
5.00% 1/1/29 | 585,000 | 706,077 | ||||||
5.00% 1/1/29 | 220,000 | 272,334 | ||||||
5.00% 1/1/30 | 520,000 | 624,224 | ||||||
5.00% 1/1/31 | 200,000 | 244,602 | ||||||
5.00% 1/1/32 | 210,000 | 255,238 | ||||||
5.00% 1/1/35 | 160,000 | 192,610 | ||||||
5.00% 1/1/36 | 180,000 | 216,157 | ||||||
5.00% 1/1/41 | 400,000 | 476,016 | ||||||
Series A 5.00% 1/1/25 | 125,000 | 139,657 | ||||||
Series A 5.00% 1/1/26 | 425,000 | 473,658 | ||||||
Series A 5.00% 1/1/31 | 520,000 | 576,779 | ||||||
Puerto Rico Electric Power Authority Revenue | ||||||||
Series CCC 5.25% 7/1/27 ‡ | 1,255,000 | 1,007,137 | ||||||
Series WW 5.00% 7/1/28 ‡ | 1,775,000 | 1,420,000 | ||||||
Rochester Electric Utility Revenue | ||||||||
Series A 5.00% 12/1/42 | 1,395,000 | 1,679,636 | ||||||
Series A 5.00% 12/1/47 | 2,265,000 | 2,718,272 | ||||||
Series B 5.00% 12/1/27 | 295,000 | 339,734 | ||||||
Series B 5.00% 12/1/28 | 275,000 | 315,719 | ||||||
Series B 5.00% 12/1/31 | 1,365,000 | 1,562,870 | ||||||
Series B 5.00% 12/1/33 | 300,000 | 344,742 | ||||||
27
Table of Contents
| Schedules of investments |
DelawareTax-Free Minnesota Fund
| Principal amount° | Value (US $) | |||||||
Municipal Bonds(continued) | ||||||||
Electric Revenue Bonds(continued) | ||||||||
Southern Minnesota Municipal Power Agency Revenue | ||||||||
Series A 5.00% 1/1/41 | 1,310,000 | $ | 1,545,053 | |||||
Series A 5.00% 1/1/42 | 1,500,000 | 1,840,710 | ||||||
Series A 5.00% 1/1/46 | 2,000,000 | 2,353,220 | ||||||
Series A 5.00% 1/1/47 | 3,130,000 | 3,832,967 | ||||||
Southern Minnesota Municipal Power Agency Revenue Capital Appreciation Series A 6.70% 1/1/25 (NATL)^ | 5,000,000 | 4,631,050 | ||||||
St. Paul Housing & Redevelopment Energy Revenue | ||||||||
Series A 4.00% 10/1/30 | 1,235,000 | 1,410,815 | ||||||
Series A 4.00% 10/1/31 | 885,000 | 1,002,740 | ||||||
Series A 4.00% 10/1/33 | 365,000 | 411,034 | ||||||
Western Minnesota Municipal Power Agency Revenue | ||||||||
Series A 5.00% 1/1/34 | 4,000,000 | 4,590,960 | ||||||
Series A 5.00% 1/1/40 | 3,935,000 | 4,495,462 | ||||||
Series A 5.00% 1/1/46 | 3,000,000 | 3,417,540 | ||||||
|
| |||||||
| 55,695,025 | ||||||||
|
| |||||||
Healthcare Revenue Bonds – 27.75% | ||||||||
Anoka Healthcare & Housing Facilities Revenue | ||||||||
(The Homestead at Anoka Project) | ||||||||
5.125% 11/1/49 | 1,100,000 | 1,166,572 | ||||||
5.375% 11/1/34 | 320,000 | 349,024 | ||||||
Apple Valley Senior Housing Revenue | ||||||||
(PHS Apple Valley Senior Housing, Inc. - Orchard Path Project) | ||||||||
5.00% 9/1/43 | 465,000 | 505,241 | ||||||
5.00% 9/1/58 | 3,220,000 | 3,479,661 | ||||||
Apple Valley Senior Living Revenue | ||||||||
(Senior Living LLC Project) | ||||||||
2nd Tier Series B 5.00% 1/1/47 | 1,725,000 | 1,757,033 | ||||||
2nd Tier Series B 5.25% 1/1/37 | 510,000 | 532,950 | ||||||
4th Tier Series D 7.00% 1/1/37 | 1,665,000 | 1,721,510 | ||||||
4th Tier Series D 7.25% 1/1/52 | 2,500,000 | 2,606,100 | ||||||
Bethel Housing & Health Care Facilities Revenue | ||||||||
(Benedictine Health System – St. Peter Communities Project) Series A 5.50% 12/1/48 | 2,350,000 | 2,490,225 | ||||||
Bethel Senior Housing Revenue | ||||||||
(The Lodge at The Lakes at Stillwater Project) | ||||||||
5.00% 6/1/38 | 450,000 | 479,885 | ||||||
5.00% 6/1/48 | 1,000,000 | 1,059,520 | ||||||
5.00% 6/1/53 | 600,000 | 633,552 | ||||||
28
Table of Contents
| Principal amount° | Value (US $) | |||||||
Municipal Bonds(continued) | ||||||||
Healthcare Revenue Bonds(continued) | ||||||||
Center City Health Care Facilities Revenue | ||||||||
(Hazelden Betty Ford Foundation Project) | ||||||||
4.00% 11/1/34 | 500,000 | $ | 572,460 | |||||
4.00% 11/1/41 | 800,000 | 897,464 | ||||||
5.00% 11/1/26 | 500,000 | 581,495 | ||||||
Crookston Health Care Facilities Revenue | ||||||||
(Riverview Health Project) | ||||||||
5.00% 5/1/38 | 100,000 | 112,415 | ||||||
5.00% 5/1/44 | 1,500,000 | 1,663,260 | ||||||
5.00% 5/1/51 | 1,585,000 | 1,749,095 | ||||||
Dakota County Community Development Agency Senior Housing Revenue | ||||||||
(Walker Highview Hills Project) | ||||||||
Series A 144A 5.00% 8/1/36 # | 280,000 | 293,247 | ||||||
Series A 144A 5.00% 8/1/46 # | 2,380,000 | 2,473,153 | ||||||
Deephaven Housing & Healthcare Revenue | ||||||||
(St. Therese Senior Living Project) | ||||||||
Series A 5.00% 4/1/38 | 730,000 | 749,177 | ||||||
Series A 5.00% 4/1/40 | 705,000 | 723,048 | ||||||
Series A 5.00% 4/1/48 | 315,000 | 322,330 | ||||||
Duluth Economic Development Authority | ||||||||
(Essentia Health Obligated Group) Series A 5.00% 2/15/48 | 1,850,000 | 2,198,743 | ||||||
(St. Luke’s Hospital of Duluth Obligated Group) | ||||||||
5.75% 6/15/32 | 1,850,000 | 2,035,129 | ||||||
6.00% 6/15/39 | 3,570,000 | 3,961,201 | ||||||
Glencoe Health Care Facilities Revenue | ||||||||
(Glencoe Regional Health Services Project) | ||||||||
4.00% 4/1/24 | 500,000 | 526,995 | ||||||
4.00% 4/1/25 | 660,000 | 695,594 | ||||||
4.00% 4/1/31 | 60,000 | 62,795 | ||||||
Hayward Health Care Facilities Revenue | ||||||||
(American Baptist Homes Midwest Obligated Group) | ||||||||
5.375% 8/1/34 | 660,000 | 694,643 | ||||||
5.75% 2/1/44 | 500,000 | 527,905 | ||||||
(St. John’s Lutheran Home of Albert Lea Project) 5.375% 10/1/44 | 575,000 | 601,829 | ||||||
Maple Grove Health Care Facilities Revenue | ||||||||
(Maple Grove Hospital Corporation) | ||||||||
4.00% 5/1/37 | 2,000,000 | 2,216,940 | ||||||
5.00% 5/1/27 | 1,400,000 | 1,746,640 | ||||||
5.00% 5/1/29 | 1,000,000 | 1,232,540 | ||||||
29
Table of Contents
| Schedules of investments |
DelawareTax-Free Minnesota Fund
| Principal amount° | Value (US $) | |||||||
Municipal Bonds(continued) | ||||||||
Healthcare Revenue Bonds(continued) | ||||||||
Maple Grove Health Care Facilities Revenue | ||||||||
(Maple Grove Hospital Corporation) | ||||||||
5.00% 5/1/30 | 850,000 | $ | 1,042,746 | |||||
5.00% 5/1/31 | 500,000 | 609,705 | ||||||
5.00% 5/1/32 | 500,000 | 607,015 | ||||||
(North Memorial Health Care) | ||||||||
5.00% 9/1/31 | 1,000,000 | 1,179,110 | ||||||
5.00% 9/1/32 | 1,000,000 | 1,175,600 | ||||||
Maple Plain Senior Housing & Health Care Revenue | ||||||||
(Haven Homes Incorporate Project) 5.00% 7/1/54 | 3,500,000 | 3,723,300 | ||||||
Minneapolis Health Care System Revenue | ||||||||
(Fairview Health Services) | ||||||||
Series A 4.00% 11/15/48 | 5,600,000 | 6,265,168 | ||||||
Series A 5.00% 11/15/33 | 500,000 | 595,145 | ||||||
Series A 5.00% 11/15/34 | 500,000 | 593,735 | ||||||
Series A 5.00% 11/15/44 | 1,000,000 | 1,170,140 | ||||||
Series A 5.00% 11/15/49 | 3,475,000 | 4,223,167 | ||||||
Minneapolis Senior Housing & Healthcare Revenue | ||||||||
(Ecumen-Abiitan Mill City Project) | ||||||||
5.00% 11/1/35 | 500,000 | 528,690 | ||||||
5.25% 11/1/45 | 1,950,000 | 2,055,846 | ||||||
5.375% 11/1/50 | 455,000 | 480,830 | ||||||
Minneapolis – St. Paul Housing & Redevelopment Authority | ||||||||
Health Care Facilities Revenue | ||||||||
(Allina Health System) Series A 5.00% 11/15/28 | 1,550,000 | 1,951,481 | ||||||
(Children’s Health Care) Series A 5.25% 8/15/35 | 2,085,000 | 2,160,665 | ||||||
Minnesota Agricultural & Economic Development Board Revenue | ||||||||
(Essenthia Health Obligated Group) | ||||||||
SeriesC-1 5.00% 2/15/30 (AGC) | 5,725,000 | 5,808,471 | ||||||
SeriesC-1 5.25% 2/15/23 (AGC) | 5,000,000 | 5,096,350 | ||||||
SeriesC-1 5.50% 2/15/25 (AGC) | 5,120,000 | 5,218,560 | ||||||
Red Wing Senior Housing | ||||||||
(Deer Crest Project) | ||||||||
Series A 5.00% 11/1/27 | 430,000 | 445,355 | ||||||
Series A 5.00% 11/1/32 | 330,000 | 341,326 | ||||||
Series A 5.00% 11/1/42 | 1,250,000 | 1,291,000 | ||||||
Rochester Health Care & Housing Revenue | ||||||||
(The Homestead at Rochester Project) Series A 6.875% 12/1/48 | 2,980,000 | 3,271,951 | ||||||
30
Table of Contents
| Principal amount° | Value (US $) | |||||||
Municipal Bonds (continued) | ||||||||
Healthcare Revenue Bonds(continued) | ||||||||
Rochester Health Care Facilities Revenue | ||||||||
(Mayo Clinic) 4.00% 11/15/41 | 4,515,000 | $ | 4,731,585 | |||||
Series D Remarketing 5.00% 11/15/38 | 6,405,000 | 6,549,817 | ||||||
(Olmsted Medical Center Project) | ||||||||
5.00% 7/1/24 | 295,000 | 334,751 | ||||||
5.00% 7/1/33 | 650,000 | 718,380 | ||||||
5.875% 7/1/30 | 1,850,000 | 1,915,915 | ||||||
Sartell Health Care Facilities Revenue | ||||||||
(Country Manor Campus Project) | ||||||||
Series A 5.25% 9/1/27 | 1,280,000 | 1,395,930 | ||||||
Series A 5.30% 9/1/37 | 1,200,000 | 1,317,792 | ||||||
Sauk Rapids Health Care Housing Facilities Revenue | ||||||||
(Good Shepherd Lutheran Home) 5.125% 1/1/39 | 1,350,000 | 1,399,329 | ||||||
Shakopee Health Care Facilities Revenue | ||||||||
(St. Francis Regional Medical Center) | ||||||||
4.00% 9/1/31 | 915,000 | 991,549 | ||||||
5.00% 9/1/24 | 575,000 | 669,519 | ||||||
5.00% 9/1/25 | 750,000 | 874,365 | ||||||
5.00% 9/1/26 | 575,000 | 668,823 | ||||||
5.00% 9/1/27 | 405,000 | 469,804 | ||||||
5.00% 9/1/28 | 425,000 | 492,507 | ||||||
5.00% 9/1/29 | 425,000 | 491,313 | ||||||
5.00% 9/1/34 | 730,000 | 826,433 | ||||||
St. Cloud Health Care Revenue | ||||||||
(Centracare Health System Project) | ||||||||
4.00% 5/1/49 | 4,315,000 | 4,839,143 | ||||||
5.00% 5/1/48 | 5,090,000 | 6,287,321 | ||||||
Series A 4.00% 5/1/37 | 965,000 | 1,072,752 | ||||||
Series A 5.00% 5/1/46 | 3,715,000 | 4,383,849 | ||||||
Unrefunded Balance 5.125% 5/1/30 | 740,000 | 758,433 | ||||||
St. Paul Housing & Redevelopment Authority Health Care Facilities Revenue | ||||||||
(Allina Health System) SeriesA-1 Unrefunded Balance 5.25% 11/15/29 | 2,825,000 | 2,848,702 | ||||||
(Fairview Health Services) | ||||||||
Series A 4.00% 11/15/43 | 2,450,000 | 2,733,343 | ||||||
Series A 5.00% 11/15/47 | 1,560,000 | 1,884,012 | ||||||
(HealthPartners Obligated Group Project) | ||||||||
Series A 5.00% 7/1/29 | 2,200,000 | 2,609,882 | ||||||
Series A 5.00% 7/1/32 | 3,000,000 | 3,494,160 | ||||||
Series A 5.00% 7/1/33 | 1,260,000 | 1,461,411 | ||||||
31
Table of Contents
| Schedules of investments |
DelawareTax-Free Minnesota Fund
| Principal amount° | Value (US $) | |||||||
Municipal Bonds(continued) | ||||||||
Healthcare Revenue Bonds(continued) | ||||||||
St. Paul Housing & Redevelopment Authority Housing & Health Care Facilities Revenue | ||||||||
(Episcopal Homes Project) 5.125% 5/1/48 | 3,100,000 | $ | 3,195,077 | |||||
St. Paul Housing & Redevelopment Authority Multifamily Housing Revenue | ||||||||
(Marian Center Project) | ||||||||
Series A 5.30% 11/1/30 | 500,000 | 500,295 | ||||||
Series A 5.375% 5/1/43 | 500,000 | 500,150 | ||||||
Wayzata Senior Housing Revenue | ||||||||
(Folkestone Senior Living Community) | ||||||||
3.75% 8/1/36 | 500,000 | 518,485 | ||||||
4.00% 8/1/44 | 800,000 | 833,320 | ||||||
5.00% 8/1/49 | 1,000,000 | 1,106,450 | ||||||
5.00% 8/1/54 | 875,000 | 966,026 | ||||||
West St. Paul Housing and Health Care Facilities Revenue | ||||||||
(Walker Westwood Ridge Campus Project) | ||||||||
4.50% 11/1/40 | 250,000 | 261,475 | ||||||
4.75% 11/1/52 | 750,000 | 790,020 | ||||||
Winona Health Care Facilities Revenue | ||||||||
(Winona Health Obligation Group) | ||||||||
4.50% 7/1/25 | 850,000 | 882,496 | ||||||
4.65% 7/1/26 | 540,000 | 561,913 | ||||||
Woodbury Housing & Redevelopment Authority Revenue | ||||||||
(St. Therese of Woodbury) | ||||||||
5.00% 12/1/34 | 500,000 | 536,100 | ||||||
5.125% 12/1/44 | 1,605,000 | 1,703,547 | ||||||
5.25% 12/1/49 | 750,000 | 798,630 | ||||||
|
| |||||||
| 162,629,531 | ||||||||
|
| |||||||
Housing Revenue Bonds – 0.41% | ||||||||
Minnesota Housing Finance Agency Homeownership Finance (Mortgage-Backed Securities Program) | ||||||||
Series D 4.70% 1/1/31 (GNMA) (FNMA) (FHLMC) | 965,000 | 976,831 | ||||||
Northwest Multi-County Housing & Redevelopment Authority | ||||||||
(Pooled Housing Program) 5.50% 7/1/45 | 1,330,000 | 1,428,979 | ||||||
|
| |||||||
| 2,405,810 | ||||||||
|
| |||||||
Lease Revenue Bonds – 2.79% | ||||||||
Minnesota General Fund Revenue Appropriations | ||||||||
Series A 5.00% 6/1/38 | 1,250,000 | 1,417,963 | ||||||
Series A 5.00% 6/1/43 | 3,835,000 | 4,341,680 | ||||||
Series B 5.00% 3/1/28 | 2,500,000 | 2,731,575 | ||||||
32
Table of Contents
| Principal amount° | Value (US $) | |||||||
Municipal Bonds(continued) | ||||||||
Lease Revenue Bonds(continued) | ||||||||
Minnesota Housing Finance Agency | ||||||||
(State Appropriation – Housing Infrastructure) | ||||||||
Series C 5.00% 8/1/34 | 1,565,000 | $ | 1,829,047 | |||||
Series C 5.00% 8/1/35 | 1,645,000 | 1,919,962 | ||||||
University of Minnesota Special Purpose Revenue | ||||||||
(State Supported Biomed Science Research Facilities Funding Project) | ||||||||
Series A 5.00% 8/1/35 | 3,960,000 | 4,093,294 | ||||||
|
| |||||||
| 16,333,521 | ||||||||
|
| |||||||
Local General Obligation Bonds – 9.79% | ||||||||
Brainerd Independent School District No. 181 | ||||||||
(School Building) | ||||||||
Series A 4.00% 2/1/38 | 1,500,000 | 1,692,720 | ||||||
Series A 4.00% 2/1/43 | 3,500,000 | 3,911,390 | ||||||
Burnsville-Eagan-Savage Independent School District No. 191 | ||||||||
(Alternative Facilities) | ||||||||
Series A 4.00% 2/1/28 | 920,000 | 1,040,814 | ||||||
Series A 4.00% 2/1/29 | 1,800,000 | 2,033,226 | ||||||
Chaska Independent School District No. 112 | ||||||||
(School Building) Series A 5.00% 2/1/27 | 1,905,000 | 2,351,227 | ||||||
Duluth | ||||||||
(DECC Improvement) | ||||||||
Series A 5.00% 2/1/32 | 1,000,000 | 1,212,030 | ||||||
Series A 5.00% 2/1/33 | 3,585,000 | 4,336,846 | ||||||
Duluth Independent School District No. 709 | ||||||||
Series A 4.00% 2/1/27 | 160,000 | 181,293 | ||||||
Series A 4.00% 2/1/28 | 1,250,000 | 1,413,675 | ||||||
Hennepin County | ||||||||
Series A 5.00% 12/1/26 | 1,885,000 | 2,398,022 | ||||||
Series A 5.00% 12/1/36 | 940,000 | 1,163,513 | ||||||
Series A 5.00% 12/1/37 | 2,850,000 | 3,597,527 | ||||||
Series A 5.00% 12/1/37 | 2,645,000 | 3,265,411 | ||||||
Series A 5.00% 12/1/38 | 3,310,000 | 4,168,548 | ||||||
Series B 5.00% 12/1/30 | 1,000,000 | 1,256,670 | ||||||
Series B 5.00% 12/15/39 | 5,000,000 | 6,426,350 | ||||||
Series C 5.00% 12/1/28 | 1,500,000 | 1,999,320 | ||||||
Series C 5.00% 12/1/30 | 1,245,000 | 1,564,554 | ||||||
Series C 5.00% 12/1/37 | 3,000,000 | 3,703,680 | ||||||
Mounds View Independent School District No. 621 | ||||||||
(Minnesota School District Credit Enhancement | ||||||||
Program) Series A 4.00% 2/1/43 | 3,000,000 | 3,348,270 | ||||||
33
Table of Contents
| Schedules of investments |
DelawareTax-Free Minnesota Fund
| Principal amount° | Value (US $) | |||||||
Municipal Bonds(continued) | ||||||||
Local General Obligation Bonds(continued) | ||||||||
Mountain Iron-Buhl Independent School District No. 712 | ||||||||
(School Building) Series A 4.00% 2/1/26 | 1,315,000 | $ | 1,540,128 | |||||
St. Michael-Albertville Independent School District No. 885 | ||||||||
(School Building) Series A 5.00% 2/1/27 | 1,865,000 | 2,299,265 | ||||||
Wayzata Independent School District No. 284 | ||||||||
Series A 5.00% 2/1/28 | 1,950,000 | 2,480,810 | ||||||
|
| |||||||
| 57,385,289 | ||||||||
|
| |||||||
Pre-Refunded/Escrowed to Maturity Bonds – 7.78% | ||||||||
Anoka Health Care Facilities Revenue | ||||||||
(The Homestead at Anoka Project) Series A 7.00%11/1/40-19§ | 1,000,000 | 1,019,090 | ||||||
Dakota & Washington Counties Housing & Redevelopment Authority Single Family Residential Mortgage Revenue | ||||||||
(City of Anoka) 8.45% 9/1/19 (GNMA) (AMT) | 9,000,000 | 9,000,000 | ||||||
(City of Bloomington) | ||||||||
Series B 8.375% 9/1/21 (GNMA) (AMT) | 14,115,000 | 15,970,276 | ||||||
Minnesota Higher Education Facilities Authority Revenue | ||||||||
(St. Catherine University) | ||||||||
Series7-Q 5.00%10/1/23-22§ | 350,000 | 389,805 | ||||||
Series7-Q 5.00%10/1/24-22§ | 475,000 | 529,022 | ||||||
Series7-Q 5.00%10/1/27-22§ | 200,000 | 222,746 | ||||||
Rochester Healthcare & Housing Revenue | ||||||||
(Samaritan Bethany Project) Series A 7.375%12/1/41-19§ | 5,220,000 | 5,297,256 | ||||||
St. Paul Housing & Redevelopment Authority Hospital Facility Revenue | ||||||||
(Healtheast Care System Project) | ||||||||
Series A 5.00%11/15/29-25§ | 910,000 | 1,114,695 | ||||||
Series A 5.00%11/15/30-25§ | 670,000 | 820,710 | ||||||
University of Minnesota | ||||||||
Series A 5.25%12/1/29-20§ | 1,850,000 | 1,945,331 | ||||||
Series A 5.50% 7/1/21 | 8,795,000 | 9,281,276 | ||||||
|
| |||||||
| 45,590,207 | ||||||||
|
| |||||||
Special Tax Revenue Bonds – 3.03% | ||||||||
Minneapolis Development Revenue | ||||||||
(Limited Tax Supported Common Bond Fund) | ||||||||
Series2-A 6.00% 12/1/40 | 3,000,000 | 3,174,090 | ||||||
Minneapolis Revenue | ||||||||
(YMCA Greater Twin Cities Project) 4.00% 6/1/30 | 250,000 | 279,190 | ||||||
Puerto Rico Sales Tax Financing Revenue | ||||||||
(Capital Appreciation - Restructured) | ||||||||
SeriesA-1 5.375% 7/1/46 ^ | 11,323,000 | 3,040,678 | ||||||
34
Table of Contents
| Principal amount° | Value (US $) | |||||||
Municipal Bonds(continued) | ||||||||
Special Tax Revenue Bonds(continued) | ||||||||
Puerto Rico Sales Tax Financing Revenue | ||||||||
(Capital Appreciation - Restructured) | ||||||||
SeriesA-1 5.625% 7/1/51 ^ | 12,906,000 | $ | 2,508,152 | |||||
(Restructured) | ||||||||
SeriesA-1 4.75% 7/1/53 | 3,143,000 | 3,230,407 | ||||||
SeriesA-1 5.00% 7/1/58 | 835,000 | 872,709 | ||||||
St. Paul Sales Tax Revenue | ||||||||
Series G 5.00% 11/1/30 | 655,000 | 771,878 | ||||||
Series G 5.00% 11/1/31 | 1,500,000 | 1,760,760 | ||||||
Virgin Islands Public Finance Authority | ||||||||
(Matching Fund Senior Lien) 5.00% 10/1/29 (AGM) | 2,000,000 | 2,130,480 | ||||||
|
| |||||||
| 17,768,344 | ||||||||
|
| |||||||
State General Obligation Bonds – 12.44% | ||||||||
Minnesota | ||||||||
Series A Unrefunded Balance 5.00% 10/1/24 | 4,555,000 | 4,922,133 | ||||||
Series A Unrefunded Balance 5.00% 10/1/27 | 5,200,000 | 5,610,176 | ||||||
(State Trunk Highway) | ||||||||
Series B 5.00% 10/1/29 | 5,000,000 | 5,386,900 | ||||||
Series E 5.00% 10/1/26 | 3,395,000 | 4,298,579 | ||||||
(Various Purposes) | ||||||||
Series A 5.00% 8/1/25 | 5,545,000 | 6,589,013 | ||||||
Series A 5.00% 8/1/27 | 7,840,000 | 9,582,989 | ||||||
Series A 5.00% 8/1/29 | 2,500,000 | 3,040,425 | ||||||
Series A 5.00% 8/1/30 | 4,200,000 | 4,937,940 | ||||||
Series A 5.00% 8/1/32 | 3,875,000 | 4,541,733 | ||||||
Series A 5.00% 8/1/33 | 2,075,000 | 2,693,599 | ||||||
Series A 5.00% 10/1/33 | 1,000,000 | 1,271,250 | ||||||
Series A 5.00% 8/1/35 | 2,975,000 | 3,837,780 | ||||||
Series A 5.00% 8/1/38 | 3,450,000 | 4,412,515 | ||||||
Series A Unrefunded Balance 4.00% 8/1/27 | 955,000 | 1,027,007 | ||||||
Series D 5.00% 8/1/26 | 6,000,000 | 7,563,780 | ||||||
Series D 5.00% 8/1/27 | 2,525,000 | 3,174,001 | ||||||
|
| |||||||
| 72,889,820 | ||||||||
|
| |||||||
Transportation Revenue Bonds – 7.35% | ||||||||
Minneapolis – St. Paul Metropolitan Airports Commission Revenue | ||||||||
(Senior) | ||||||||
Series A 5.00% 1/1/28 | 1,250,000 | 1,265,750 | ||||||
Series C 5.00% 1/1/29 | 350,000 | 438,211 | ||||||
Series C 5.00% 1/1/33 | 850,000 | 1,045,899 | ||||||
Series C 5.00% 1/1/36 | 600,000 | 732,390 | �� | |||||
Series C 5.00% 1/1/41 | 600,000 | 724,398 | ||||||
35
Table of Contents
| Schedules of investments |
DelawareTax-Free Minnesota Fund
| Principal amount° | Value (US $) | |||||||
Municipal Bonds(continued) | ||||||||
Transportation Revenue Bonds(continued) | ||||||||
Minneapolis – St. Paul Metropolitan Airports Commission Revenue | ||||||||
(Senior) | ||||||||
Series C 5.00% 1/1/46 | 1,595,000 | $ | 1,913,266 | |||||
(Subordinate) | ||||||||
Series A 5.00% 1/1/35 | 1,000,000 | 1,138,250 | ||||||
Series A 5.00% 1/1/44 | 3,000,000 | 3,763,950 | ||||||
Series A 5.00% 1/1/49 | 5,000,000 | 6,229,000 | ||||||
Series B 5.00% 1/1/26 | 575,000 | 626,003 | ||||||
Series B 5.00% 1/1/27 | 1,160,000 | 1,261,210 | ||||||
Series B 5.00% 1/1/28 | 2,750,000 | 2,986,637 | ||||||
Series B 5.00% 1/1/29 | 120,000 | 130,152 | ||||||
Series B 5.00% 1/1/30 | 1,675,000 | 1,813,489 | ||||||
Series B 5.00% 1/1/31 | 1,750,000 | 1,891,347 | ||||||
Series B 5.00% 1/1/44 (AMT) | 5,095,000 | 6,301,292 | ||||||
Series B 5.00% 1/1/49 (AMT) | 6,150,000 | 7,570,650 | ||||||
St. Paul Port Authority Revenue | ||||||||
(Amherst H. Wilder Foundation) Series 3 5.00% 12/1/36 | 3,200,000 | 3,254,528 | ||||||
|
| |||||||
| 43,086,422 | ||||||||
|
| |||||||
Water & Sewer Revenue Bonds – 3.07% | ||||||||
Guam Government Waterworks Authority 5.00% 7/1/40 | 1,930,000 | 2,243,278 | ||||||
Metropolitan Council General Obligation Wastewater Revenue | ||||||||
(Minneapolis-St. Paul Metropolitan Area) | ||||||||
Series B 4.00% 9/1/27 | 2,400,000 | 2,609,640 | ||||||
Series B 5.00% 9/1/25 | 2,000,000 | 2,229,700 | ||||||
Series C 4.00% 3/1/31 | 3,120,000 | 3,686,498 | ||||||
Series C 4.00% 3/1/32 | 3,225,000 | 3,792,213 | ||||||
Series E 5.00% 9/1/23 | 2,000,000 | 2,230,320 | ||||||
Minnesota Public Facilities Authority Series B 4.00% 3/1/26 | 1,000,000 | 1,181,450 | ||||||
|
| |||||||
| 17,973,099 | ||||||||
|
| |||||||
Total Municipal Bonds(cost $568,514,354) | 603,841,947 | |||||||
|
| |||||||
36
Table of Contents
| Principal amount° | Value (US $) | |||||||
Short-Term Investments – 1.53% | ||||||||
Variable Rate Demand Notes – 1.53%¤ | ||||||||
Minneapolis Health Care System Revenue (Fairview Health Services) | ||||||||
Series C 1.37% 11/15/48 (LOC – Wells Fargo Bank N.A.) | 3,825,000 | $ | 3,825,000 | |||||
Minneapolis – St. Paul Housing & Redevelopment Authority | ||||||||
Health Care Facilities Revenue | ||||||||
(Allina Health System) SeriesB-2 1.37% 11/15/35 | ||||||||
(LOC – JPMorgan Chase Bank N.A.) | 2,950,000 | 2,950,000 | ||||||
(Children’s Hospitals and Clinics) | ||||||||
Series A 0.75% 8/15/34 (AGM) (SPA - US Bank N.A.) | 1,000,000 | 1,000,000 | ||||||
SeriesA-2 0.75% 8/15/37 (AGM) (SPA - US Bank N.A.) | 1,000,000 | 1,000,000 | ||||||
Series B 0.74% 8/15/25 (AGM) (SPA - US Bank N.A.) | 200,000 | 200,000 | ||||||
|
| |||||||
Total Short-Term Investments(cost $8,975,000) | 8,975,000 | |||||||
|
| |||||||
Total Value of Securities – 104.58% | $ | 612,816,947 | ||||||
|
| |||||||
| # | Security exempt from registration under Rule 144A of the Securities Act of 1933, as amended. At Aug. 31, 2019, the aggregate value of Rule 144A securities was $10,529,024, which represents 1.80% of the Fund’s net assets. See Note 8 in “Notes to financial statements.” |
| ¤ | Tax-exempt obligations that contain a floating or variable interest rate adjustment formula and an unconditional right of demand to receive payment of the unpaid principal balance plus accrued interest upon a short notice period (generally up to 30 days) prior to specified dates either from the issuer or by drawing on a bank letter of credit, a guarantee, or insurance issued with respect to such instrument. Each rate shown is as of Aug. 31, 2019. |
| § | Pre-refunded bonds. Municipal bonds that are generally backed or secured by US Treasury bonds. Forpre-refunded bonds, the stated maturity is followed by the year in which the bond will bepre-refunded. See Note 8 in “Notes to financial statements.” |
| ° | Principal amount shown is stated in USD unless noted that the security is denominated in another currency. |
| ‡ | Non-income producing security. Security is currently in default. |
| ^ | Zero-coupon security. The rate shown is the effective yield at the time of purchase. |
37
Table of Contents
| Schedules of investments |
DelawareTax-Free Minnesota Fund
Summary of abbreviations:
AGC – Insured by Assured Guaranty Corporation
AGM – Insured by Assured Guaranty Municipal Corporation
AMT – Subject to Alternative Minimum Tax
FHLMC – Federal Home Loan Mortgage Corporation collateral
FNMA – Federal National Mortgage Association collateral
GNMA – Government National Mortgage Association collateral
LOC – Letter of Credit
N.A. – National Association
NATL – Insured by National Public Finance Guarantee Corporation
SPA –Stand-by Purchase Agreement
USD – US Dollar
See accompanying notes, which are an integral part of the financial statements.
38
Table of Contents
| Schedules of investments |
| Delaware Tax-Free Minnesota Intermediate Fund | August 31, 2019 | |||
| Principal amount° | Value (US $) | |||||||
Municipal Bonds – 97.85% | ||||||||
Corporate Revenue Bond – 0.32% | ||||||||
St. Paul Port Authority Solid Waste Disposal Revenue | ||||||||
(Gerdau St. Paul Steel Mill Project) Series 7 144A 4.50% 10/1/37 (AMT)# | 255,000 | $ | 259,016 | |||||
|
| |||||||
| 259,016 | ||||||||
|
| |||||||
Education Revenue Bonds – 15.20% | ||||||||
Bethel Charter School Lease Revenue | ||||||||
(Spectrum High School Project) Series A 4.00% 7/1/32 | 425,000 | 458,481 | ||||||
Brooklyn Park Charter School Lease Revenue | ||||||||
(Prairie Seeds Academy Project) Series A 5.00% 3/1/34 | 485,000 | 504,094 | ||||||
Cologne Charter School Lease Revenue | ||||||||
(Cologne Academy Project) Series A 5.00% 7/1/29 | 305,000 | 332,057 | ||||||
Duluth Housing & Redevelopment Authority Revenue | ||||||||
(Duluth Public Schools Academy Project) Series A 5.00% 11/1/38 | 400,000 | 444,732 | ||||||
Forest Lake Charter School Lease Revenue Fund | ||||||||
(Lakes International Language Academy Project) Series A 5.50% 8/1/36 | 420,000 | 453,172 | ||||||
Hugo Charter School Lease Revenue | ||||||||
(Noble Academy Project) Series A 5.00% 7/1/29 | 530,000 | 572,071 | ||||||
Minneapolis Charter School Lease Revenue | ||||||||
(Hiawatha Academies Project) Series A 5.00% 7/1/31 | 500,000 | 548,500 | ||||||
Minneapolis Student Housing Revenue | ||||||||
(Riverton Community Housing Project) 5.25% 8/1/39 | 525,000 | 565,598 | ||||||
Minnesota Higher Education Facilities Authority Revenue | ||||||||
(Bethel University) 5.00% 5/1/32 | 525,000 | 625,847 | ||||||
(Gustavus Adolphus College) 5.00% 10/1/34 | 435,000 | 528,416 | ||||||
5.00% 10/1/35 | 555,000 | 671,905 | ||||||
(St. Catherine University) Series A 5.00% 10/1/35 | 565,000 | 683,384 | ||||||
(St. John’s University) Series8-I 5.00% 10/1/31 | 130,000 | 154,222 | ||||||
(St. Olaf College) | ||||||||
Series8-G 5.00% 12/1/31 | 125,000 | 150,154 | ||||||
Series8-G 5.00% 12/1/32 | 125,000 | 149,947 | ||||||
(St. Scholastica College) Series H 5.125% 12/1/30 | 1,000,000 | 1,009,640 | ||||||
(University of St. Thomas) | ||||||||
4.00% 10/1/36 | 300,000 | 352,635 | ||||||
5.00% 10/1/34 | 350,000 | 449,239 | ||||||
5.00% 10/1/35 | 750,000 | 959,505 | ||||||
Series7-U 4.00% 4/1/26 | 1,400,000 | 1,531,194 | ||||||
Rice County Educational Facilities Revenue | ||||||||
(Shattuck-St. Mary’s School) Series A 144A 5.00% 8/1/22 # | 325,000 | 344,051 | ||||||
39
Table of Contents
| Schedules of investments |
DelawareTax-Free Minnesota Intermediate Fund
| Principal amount° | Value (US $) | |||||||
Municipal Bonds(continued) | ||||||||
Education Revenue Bonds(continued) | ||||||||
St. Paul Housing & Redevelopment Authority Charter School Lease Revenue | ||||||||
(Academia Cesar Chavez School Project) Series A 5.25% 7/1/50 | 340,000 | $ | 361,325 | |||||
(Great River School Project) Series A 144A 5.25% 7/1/33 # | 140,000 | 153,423 | ||||||
(Twin Cities Academy Project) Series A 5.30% 7/1/45 | 260,000 | 279,911 | ||||||
|
| |||||||
| 12,283,503 | ||||||||
|
| |||||||
Electric Revenue Bonds – 10.09% | ||||||||
Central Minnesota Municipal Power Agency | ||||||||
(Brookings Twin Cities Transmission Project) | ||||||||
Series E 5.00% 1/1/21 | 1,095,000 | 1,151,152 | ||||||
Series E 5.00% 1/1/23 | 1,000,000 | 1,085,670 | ||||||
Chaska Electric Revenue | ||||||||
Series A 5.00% 10/1/28 | 250,000 | 302,147 | ||||||
Minnesota Municipal Power Agency Electric Revenue | ||||||||
Series A 5.00% 10/1/29 | 500,000 | 589,205 | ||||||
Series A 5.00% 10/1/30 | 240,000 | 282,235 | ||||||
Northern Municipal Power Agency Electric System Revenue | ||||||||
5.00% 1/1/29 | 150,000 | 181,045 | ||||||
5.00% 1/1/30 | 235,000 | 289,111 | ||||||
5.00% 1/1/31 | 350,000 | 417,970 | ||||||
Series A 5.00% 1/1/25 | 200,000 | 223,452 | ||||||
Rochester Electric Utility Revenue | ||||||||
Series A 5.00% 12/1/28 | 300,000 | 376,326 | ||||||
Series A 5.00% 12/1/29 | 500,000 | 624,975 | ||||||
Series A 5.00% 12/1/31 | 575,000 | 710,413 | ||||||
St. Paul Housing & Redevelopment Energy Revenue Series A 4.00% 10/1/30 | 425,000 | 485,503 | ||||||
Western Minnesota Municipal Power Agency Revenue Series A 5.00% 1/1/33 | 1,250,000 | 1,435,538 | ||||||
|
| |||||||
| 8,154,742 | ||||||||
|
| |||||||
Healthcare Revenue Bonds – 31.14% | ||||||||
Anoka Healthcare & Housing Facilities Revenue | ||||||||
(The Homestead at Anoka Project) 5.375% 11/1/34 | 270,000 | 294,489 | ||||||
Apple Valley Senior Living Revenue | ||||||||
(Senior Living LLC Project) | ||||||||
3rd Tier Series C 4.25% 1/1/27 | 500,000 | 492,245 | ||||||
3rd Tier Series C 5.00% 1/1/32 | 420,000 | 420,882 | ||||||
40
Table of Contents
| Principal amount° | Value (US $) | |||||||
Municipal Bonds(continued) | ||||||||
Healthcare Revenue Bonds(continued) | ||||||||
Bethel Housing & Health Care Facilities Revenue | ||||||||
(Benedictine Health System - St. Peter Communities Project) Series A 5.50% 12/1/48 | 250,000 | $ | 264,917 | |||||
Bethel Senior Housing Revenue | ||||||||
(The Lodge at the Lakes at Stillwater Project) 5.00% 6/1/38 | 250,000 | 266,603 | ||||||
Center City Health Care Facilities Revenue | ||||||||
(Hazelden Betty Ford Foundation Project) 5.00% 11/1/24 | 600,000 | 701,442 | ||||||
Crookston Health Care Facilities Revenue | ||||||||
(RiverView Health Project) 5.00% 5/1/38 | 400,000 | 449,660 | ||||||
Dakota County Community Development Agency Senior Housing Revenue | ||||||||
(Walker Highview Hills Project) Series A 144A 5.00% 8/1/36 # | 480,000 | 502,709 | ||||||
Duluth Economic Development Authority | ||||||||
(Essentia Health Obligated Group) Series A 5.00% 2/15/37 | 750,000 | 906,630 | ||||||
(St. Luke’s Hospital of Duluth Obligated Group) 5.75% 6/15/32 | 750,000 | 825,053 | ||||||
Glencoe Health Care Facilities Revenue | ||||||||
(Glencoe Regional Health Services Project) 4.00% 4/1/26 | 270,000 | 284,191 | ||||||
Hayward Health Care Facilities Revenue | ||||||||
(American Baptist Homes Midwest Obligated Group) 4.25% 8/1/24 | 568,334 | 588,169 | ||||||
Maple Grove Health Care Facilities Revenue | ||||||||
(Maple Grove Hospital Corporation) | ||||||||
4.00% 5/1/37 | 500,000 | 554,235 | ||||||
5.00% 5/1/28 | 1,000,000 | 1,237,140 | ||||||
(North Memorial Health Care) 5.00% 9/1/31 | 320,000 | 377,315 | ||||||
Minneapolis Health Care System Revenue | ||||||||
(Fairview Health Services) | ||||||||
Series A 5.00% 11/15/33 | 500,000 | 595,145 | ||||||
Series A 5.00% 11/15/34 | 500,000 | 593,735 | ||||||
Series A 5.00% 11/15/49 | 1,000,000 | 1,215,300 | ||||||
Minneapolis Senior Housing & Healthcare Revenue | ||||||||
(Ecumen-Abiitan Mill City Project) 5.00% 11/1/35 | 530,000 | 560,411 | ||||||
Minneapolis – St. Paul Housing & Redevelopment Authority Health Care Facilities Revenue | ||||||||
(Allina Health System) Series A 5.00% 11/15/27 | 1,205,000 | 1,520,818 | ||||||
(Children’s Health Care) Series A 5.25% 8/15/25 | 1,000,000 | 1,036,380 | ||||||
41
Table of Contents
| Schedules of investments |
DelawareTax-Free Minnesota Intermediate Fund
| Principal amount° | Value (US $) | |||||||
Municipal Bonds(continued) | ||||||||
Healthcare Revenue Bonds(continued) | ||||||||
Minnesota Agricultural & Economic Development Board Revenue | ||||||||
(Essenthia Health Obligated Group) SeriesC-1 5.50% 2/15/25 (AGC) | 2,500,000 | $ | 2,548,125 | |||||
Rochester Health Care Facilities Revenue | ||||||||
(Mayo Clinic) Series C 4.50% 11/15/38 • | 925,000 | 990,296 | ||||||
(Olmsted Medical Center Project) 5.125% 7/1/20 | 220,000 | 227,231 | ||||||
Sartell Health Care Facilities Revenue | ||||||||
(Country Manor Campus Project) Series A 5.00% 9/1/21 | 1,050,000 | 1,121,631 | ||||||
Sauk Rapids Health Care Housing Facilities Revenue | ||||||||
(Good Shepherd Lutheran Home) 5.125% 1/1/39 | 575,000 | 596,011 | ||||||
St. Cloud Health Care Revenue | ||||||||
(Centracare Health System Project) 5.00% 5/1/48 | 810,000 | 1,000,536 | ||||||
Unrefunded Balance 5.125% 5/1/30 | 360,000 | 368,968 | ||||||
St. Paul Housing & Redevelopment Authority Health Care Facilities Revenue | ||||||||
(Allina Health System) Unrefunded Balance SeriesA-2 5.25% 11/15/28 | 975,000 | 983,346 | ||||||
(Fairview Health Services) Series A 5.00% 11/15/47 | 275,000 | 332,118 | ||||||
(HealthPartners Obligated Group Project) | ||||||||
5.00% 7/1/32 | 1,000,000 | 1,164,720 | ||||||
5.00% 7/1/33 | 200,000 | 231,970 | ||||||
St. Paul Housing & Redevelopment Authority Housing & Health Care Facilities Revenue | ||||||||
(Episcopal Homes Project) 5.00% 5/1/33 | 500,000 | 524,470 | ||||||
Wayzata Senior Housing Revenue | ||||||||
(Folkestone Senior Living Community) | ||||||||
5.00% 8/1/34 | 125,000 | 140,569 | ||||||
5.00% 8/1/35 | 150,000 | 168,312 | ||||||
West St. Paul, Housing and Health Care Facilities Revenue | ||||||||
(Walker Westwood Ridge Campus Project) 5.00% 11/1/37 | 500,000 | 542,070 | ||||||
Woodbury Housing & Redevelopment Authority Revenue | ||||||||
(St. Therese of Woodbury) 5.00% 12/1/34 | 500,000 | 536,100 | ||||||
|
| |||||||
| 25,163,942 | ||||||||
|
| |||||||
Housing Revenue Bond – 0.38% | ||||||||
Northwest Multi-County Housing & Redevelopment Authority | ||||||||
(Pooled Housing Program) 5.50% 7/1/45 | 285,000 | 306,210 | ||||||
|
| |||||||
| 306,210 | ||||||||
|
| |||||||
42
Table of Contents
| Principal amount° | Value (US $) | |||||||
Municipal Bonds(continued) | ||||||||
Lease Revenue Bonds – 5.19% | ||||||||
Minnesota General Fund Revenue Appropriations | ||||||||
Series A 5.00% 6/1/38 | 1,100,000 | $ | 1,247,807 | |||||
Series A 5.00% 6/1/43 | 715,000 | 809,466 | ||||||
Series B 5.00% 3/1/27 | 1,000,000 | 1,093,400 | ||||||
St. Paul Housing & Redevelopment Authority | ||||||||
(Minnesota Public Radio Project) 5.00% 12/1/25 | 1,000,000 | 1,042,080 | ||||||
|
| |||||||
| 4,192,753 | ||||||||
|
| |||||||
Local General Obligation Bonds – 7.39% | ||||||||
Duluth Independent School District No. 709 | ||||||||
Series A 4.00% 2/1/28 | 250,000 | 282,735 | ||||||
Hennepin County | ||||||||
Series A 5.00% 12/1/36 | 1,500,000 | 1,856,670 | ||||||
Series A 5.00% 12/1/38 | 1,055,000 | 1,328,646 | ||||||
Series C 5.00% 12/1/30 | 1,500,000 | 1,885,005 | ||||||
St. Michael-Albertville Independent School District No. 885 | ||||||||
(School Building) Series A 5.00% 2/1/27 | 500,000 | 616,425 | ||||||
|
| |||||||
| 5,969,481 | ||||||||
|
| |||||||
Pre-Refunded/Escrowed to Maturity Bonds – 7.08% | ||||||||
Anoka Housing Facilities Revenue | ||||||||
(Senior Homestead Anoka Project) Series B 6.875%11/1/34-19§ | 750,000 | 764,213 | ||||||
Minnesota Higher Education Facilities Authority Revenue | ||||||||
(St. Catherine University) Series7-Q 5.00% 10/1/22 | 425,000 | 473,335 | ||||||
Rochester Healthcare & Housing Revenue | ||||||||
(Samaritan Bethany Project) Series A 6.875%12/1/29-19§ | 950,000 | 963,015 | ||||||
St. Paul Housing & Redevelopment Authority Health Care Facilities Revenue | ||||||||
(Allina Health System) SeriesA-2 5.25%11/15/28-19§ | 1,025,000 | 1,033,313 | ||||||
St. Paul Housing & Redevelopment Authority Hospital Revenue | ||||||||
(Healtheast Care System Project) | ||||||||
Series A 5.00%11/15/29-25§ | 165,000 | 202,115 | ||||||
Series A 5.00%11/15/30-25§ | 120,000 | 146,993 | ||||||
University of Minnesota | ||||||||
Series A 5.00%12/1/23-20§ | 1,000,000 | 1,048,460 | ||||||
Series D 5.00%12/1/26-21§ | 1,000,000 | 1,087,040 | ||||||
|
| |||||||
| 5,718,484 | ||||||||
|
| |||||||
43
Table of Contents
| Schedules of investments |
DelawareTax-Free Minnesota Intermediate Fund
| Principal amount° | Value (US $) | |||||||
Municipal Bonds(continued) | ||||||||
Special Tax Revenue Bonds – 2.26% | ||||||||
Minneapolis Revenue | ||||||||
(YMCA Greater Twin Cities Project) 4.00% 6/1/27 | 100,000 | $ | 113,210 | |||||
Puerto Rico Sales Tax Financing Revenue (Restructured) | ||||||||
Series A1 4.55% 7/1/40 | 830,000 | 856,718 | ||||||
SeriesA-2 4.536% 7/1/53 | 378,000 | 384,131 | ||||||
St. Paul Sales Tax Revenue | ||||||||
Series G 5.00% 11/1/28 | 400,000 | 473,804 | ||||||
|
| |||||||
| 1,827,863 | ||||||||
|
| |||||||
State General Obligation Bonds – 9.08% | ||||||||
Minnesota | ||||||||
Series A 5.00% 8/1/33 | 285,000 | 369,964 | ||||||
Series A 5.00% 8/1/34 | 1,000,000 | 1,293,910 | ||||||
Series D 5.00% 8/1/26 | 2,500,000 | 3,151,575 | ||||||
Series D 5.00% 8/1/27 | 1,500,000 | 1,885,545 | ||||||
Series E 5.00% 10/1/26 | 500,000 | 633,075 | ||||||
|
| |||||||
| 7,334,069 | ||||||||
|
| |||||||
Transportation Revenue Bonds – 8.04% | ||||||||
Minneapolis – St. Paul Metropolitan Airports Commission Revenue | ||||||||
(Senior) Series B 5.00% 1/1/22 (AMT) | 1,000,000 | 1,002,690 | ||||||
(Subordinate) | ||||||||
Series B 5.00% 1/1/26 | 710,000 | 772,977 | ||||||
Series B 5.00% 1/1/31 | 750,000 | 810,577 | ||||||
Series B 5.00% 1/1/44 (AMT) | 1,100,000 | 1,360,436 | ||||||
Series D 5.00% 1/1/22 (AMT) | 1,000,000 | 1,012,000 | ||||||
St. Paul Housing & Redevelopment Authority | ||||||||
(Parking Enterprise) | ||||||||
Series A 4.00% 8/1/26 | 450,000 | 517,631 | ||||||
Series A 4.00% 8/1/27 | 545,000 | 622,995 | ||||||
Series A 4.00% 8/1/28 | 350,000 | 398,727 | ||||||
|
| |||||||
| 6,498,033 | ||||||||
|
| |||||||
Water & Sewer Revenue Bonds – 1.68% | ||||||||
Metropolitan Council General Obligation Wastewater Revenue (Minneapolis – St. Paul Metropolitan Area) | ||||||||
Series C 4.00% 3/1/31 | 565,000 | 667,587 | ||||||
Series C 4.00% 3/1/32 | 585,000 | 687,890 | ||||||
|
| |||||||
| 1,355,477 | ||||||||
|
| |||||||
Total Municipal Bonds(cost $74,495,308) | 79,063,573 | |||||||
|
| |||||||
44
Table of Contents
| Principal amount° | Value (US $) | |||||||
Short-Term Investments – 2.16% | ||||||||
Variable Rate Demand Notes – 2.16%¤ | ||||||||
Minneapolis Health Care System Revenue (Fairview Health Services) | ||||||||
Series C | ||||||||
1.37% 11/15/48 (LOC – Wells Fargo Bank N.A.) | 500,000 | $ | 500,000 | |||||
Minneapolis – St. Paul Housing & Redevelopment Authority Health Care Facilities Revenue | ||||||||
(Allina Health System) SeriesB-1 1.37% 11/15/35 | ||||||||
(LOC – JPMorgan Chase Bank N.A.) | 250,000 | 250,000 | ||||||
(Children’s Hospitals & Clinics) Series B 0.74% 8/15/25 | ||||||||
(AGM) (SPA – US Bank N.A.) | 1,000,000 | 1,000,000 | ||||||
|
| |||||||
Total Short-Term Investments(cost $1,750,000) | 1,750,000 | |||||||
|
| |||||||
Total Value of Securities – 100.01% | $ | 80,813,573 | ||||||
|
| |||||||
| # | Security exempt from registration under Rule 144A of the Securities Act of 1933, as amended. At Aug. 31, 2019, the aggregate value of Rule 144A securities was $1,259,199, which represents 1.56% of the Fund’s net assets. See Note 8 in “Notes to financial statements.” |
| ¤ | Tax-exempt obligations that contain a floating or variable interest rate adjustment formula and an unconditional right of demand to receive payment of the unpaid principal balance plus accrued interest upon a short notice period (generally up to 30 days) prior to specified dates either from the issuer or by drawing on a bank letter of credit, a guarantee, or insurance issued with respect to such instrument. Each rate shown is as of Aug. 31, 2019. |
| § | Pre-refunded bonds. Municipal bonds that are generally backed or secured by US Treasury bonds. Forpre-refunded bonds, the stated maturity is followed by the year in which the bond will bepre-refunded. See Note 8 in “Notes to financial statements.” |
| ° | Principal amount shown is stated in USD unless noted that the security is denominated in another currency. |
| • | Variable rate investment. Rates reset periodically. Rate shown reflects the rate in effect at Aug. 31, 2019. For securities based on a published reference rate and spread, the reference rate and spread are indicated in their description above. The reference rate descriptions (i.e. LIBOR03M, LIBOR06M, etc.) used in this report are identical for different securities, but the underlying reference rates may differ due to the timing of the reset period. Certain variable rate securities are not based on a published reference rate and spread but are determined by the issuer or agent and are based on current market conditions, or for mortgage-backed securities, are impacted by the individual mortgages which are paying off over time. These securities do not indicate a reference rate and spread in their description above. |
45
Table of Contents
| Schedules of investments |
DelawareTax-Free Minnesota Intermediate Fund
Summary of abbreviations:
AGC – Insured by Assured Guaranty Corporation
AGM – Insured by Assured Guaranty Municipal Corporation
AMT – Subject to Alternative Minimum Tax
ICE – Intercontinental Exchange
LIBOR – London Interbank Offered Rate
LIBOR03M – ICE LIBOR USD 3 Month
LIBOR06M – ICE LIBOR USD 6 Month
LOC – Letter of Credit
N.A. – National Association
SPA –Stand-by Purchase Agreement
USD – US Dollar
See accompanying notes, which are an integral part of the financial statements.
46
Table of Contents
| Schedules of investments |
| Delaware Minnesota High-Yield Municipal Bond Fund | August 31, 2019 | |||
| Principal amount° | Value (US $) | |||||||
Municipal Bonds – 98.96% | ||||||||
Corporate Revenue Bond – 0.98% | ||||||||
St. Paul Port Authority Solid Waste Disposal Revenue | ||||||||
(Gerdau St. Paul Steel Mill Project) | ||||||||
Series 7 144A 4.50% 10/1/37 (AMT)# | 1,920,000 | $ | 1,950,240 | |||||
|
| |||||||
| 1,950,240 | ||||||||
|
| |||||||
Education Revenue Bonds – 19.80% | ||||||||
Bethel Charter School Lease Revenue | ||||||||
(Spectrum High School Project) Series A 4.00% 7/1/37 | 850,000 | 906,075 | ||||||
Brooklyn Park Charter School Lease Revenue | ||||||||
(Prairie Seeds Academy Project) Series A 5.00% 3/1/39 | 1,270,000 | 1,306,182 | ||||||
Cologne Charter School Lease Revenue | ||||||||
(Cologne Academy Project) | ||||||||
Series A 5.00% 7/1/34 | 250,000 | 268,457 | ||||||
Series A 5.00% 7/1/45 | 230,000 | 243,402 | ||||||
Deephaven Charter School Lease Revenue | ||||||||
(Eagle Ridge Academy Project) Series A 5.50% 7/1/50 | 1,000,000 | 1,099,980 | ||||||
Duluth Housing & Redevelopment Authority Revenue | ||||||||
(Duluth Public Schools Academy Project) Series A 5.00% 11/1/48 | 1,000,000 | 1,098,430 | ||||||
Forest Lake Charter School Lease Revenue Fund | ||||||||
(Lakes International Language Academy) | ||||||||
Series A 5.375% 8/1/50 | 660,000 | 737,801 | ||||||
Series A 5.75% 8/1/44 | 585,000 | 630,805 | ||||||
Ham Lake Charter School Lease Revenue | ||||||||
(Davinci Academy Project) | ||||||||
Series A 5.00% 7/1/36 | 235,000 | 251,880 | ||||||
Series A 5.00% 7/1/47 | 710,000 | 752,437 | ||||||
(Parnassus Preparatory School Project) Series A 5.00% 11/1/47 | 650,000 | 694,668 | ||||||
Hugo Charter School Lease Revenue | ||||||||
(Noble Academy Project) | ||||||||
Series A 5.00% 7/1/34 | 165,000 | 176,271 | ||||||
Series A 5.00% 7/1/44 | 495,000 | 522,948 | ||||||
Minneapolis Charter School Lease Revenue | ||||||||
(Hiawatha Academies Project) | ||||||||
Series A 5.00% 7/1/36 | 1,000,000 | 1,085,260 | ||||||
Series A 5.00% 7/1/47 | 800,000 | 858,936 | ||||||
Minneapolis Student Housing Revenue | ||||||||
(Riverton Community Housing Project) | ||||||||
144A 4.75% 8/1/43 # | 750,000 | 800,355 | ||||||
144A 5.00% 8/1/53 # | 570,000 | 610,618 | ||||||
5.25% 8/1/39 | 800,000 | 861,864 | ||||||
47
Table of Contents
| Schedules of investments |
Delaware Minnesota High-Yield Municipal Bond Fund
| Principal amount° | Value (US $) | |||||||
Municipal Bonds(continued) | ||||||||
Education Revenue Bonds(continued) | ||||||||
Minnesota Higher Education Facilities Authority Revenue | ||||||||
(Bethel University) 5.00% 5/1/47 | 1,500,000 | $ | 1,734,270 | |||||
(Carleton College) 4.00% 3/1/37 | 635,000 | 724,332 | ||||||
(Gustavus Adolphus College) 5.00% 10/1/47 | 1,000,000 | 1,183,160 | ||||||
(Minneapolis College of Art & Design) 4.00% 5/1/24 | 250,000 | 268,527 | ||||||
4.00% 5/1/25 | 200,000 | 214,364 | ||||||
4.00% 5/1/26 | 100,000 | 107,019 | ||||||
(St. Catherine University) | ||||||||
Series A 4.00% 10/1/37 | 580,000 | 636,115 | ||||||
Series A 5.00% 10/1/45 | 670,000 | 794,091 | ||||||
(St. John’s University) Series8-I 5.00% 10/1/34 | 215,000 | 253,945 | ||||||
(St. Olaf College) | ||||||||
Series8-G 5.00% 12/1/31 | 205,000 | 246,252 | ||||||
Series8-G 5.00% 12/1/32 | 205,000 | 245,914 | ||||||
Series8-N 4.00% 10/1/34 | 800,000 | 910,424 | ||||||
Series8-N 4.00% 10/1/35 | 590,000 | 670,612 | ||||||
(St. Scholastica College) Series H 5.125% 12/1/40 | 750,000 | 757,230 | ||||||
(Trustees of the Hamline University of Minnesota) | ||||||||
Series B 5.00% 10/1/37 | 300,000 | 346,128 | ||||||
Series B 5.00% 10/1/39 | 770,000 | 884,876 | ||||||
(University of St. Thomas) | ||||||||
4.00% 10/1/41 | 1,000,000 | 1,159,340 | ||||||
4.00% 10/1/44 | 850,000 | 975,265 | ||||||
Series A 4.00% 10/1/35 | 400,000 | 455,380 | ||||||
Otsego Charter School Lease Revenue | ||||||||
(Kaleidoscope Charter School) Series A 5.00% 9/1/44 | 1,435,000 | 1,511,285 | ||||||
Rice County Educational Facilities Revenue | ||||||||
(Shattuck-St. Mary’s School) Series A 144A 5.00% 8/1/22 # | 770,000 | 815,137 | ||||||
St. Cloud Charter School Lease Revenue | ||||||||
(Stride Academy Project) Series A 5.00% 4/1/46 | 750,000 | 513,277 | ||||||
St. Paul Housing & Redevelopment Authority Charter School Lease Revenue | ||||||||
(Academia Cesar Chavez School Project) Series A 5.25% 7/1/50 | 1,750,000 | 1,859,760 | ||||||
(Great River School Project) Series A 144A 5.50% 7/1/52 # | 265,000 | 286,839 | ||||||
(Hmong College Preparatory Academy Project) | ||||||||
Series A 5.75% 9/1/46 | 500,000 | 559,045 | ||||||
Series A 6.00% 9/1/51 | 500,000 | 565,020 | ||||||
48
Table of Contents
| Principal amount° | Value (US $) | |||||||
Municipal Bonds(continued) | ||||||||
Education Revenue Bonds(continued) | ||||||||
St. Paul Housing & Redevelopment Authority Charter School Lease Revenue | ||||||||
(Nova Classical Academy Project) | ||||||||
Series A 4.00% 9/1/36 | 1,270,000 | $ | 1,350,505 | |||||
Series A 4.125% 9/1/47 | 500,000 | 526,815 | ||||||
(Twin Cities Academy Project) Series A 5.375% 7/1/50 | 1,500,000 | 1,616,640 | ||||||
University of Minnesota | ||||||||
Series A 5.00% 4/1/34 | 2,115,000 | 2,577,825 | ||||||
Series A 5.00% 9/1/40 | 900,000 | 1,117,188 | ||||||
Series A 5.00% 9/1/41 | 620,000 | 768,434 | ||||||
|
| |||||||
| 39,541,383 | ||||||||
|
| |||||||
Electric Revenue Bonds – 7.78% | ||||||||
Central Minnesota Municipal Power Agency | ||||||||
(Brookings Twin Cities Transmission Project) 5.00% 1/1/42 | 1,500,000 | 1,620,150 | ||||||
Chaska Electric Revenue | ||||||||
Series A 5.00% 10/1/28 | 350,000 | 423,007 | ||||||
Hutchinson Utilities Commission Revenue | ||||||||
Series A 5.00% 12/1/22 | 490,000 | 550,373 | ||||||
Series A 5.00% 12/1/26 | 360,000 | 401,184 | ||||||
Minnesota Municipal Power Agency Electric Revenue | ||||||||
5.00% 10/1/27 | 165,000 | 194,877 | ||||||
5.00% 10/1/47 | 745,000 | 889,448 | ||||||
Series A 5.00% 10/1/28 | 500,000 | 590,150 | ||||||
Northern Municipal Power Agency Electric System Revenue | ||||||||
5.00% 1/1/26 | 500,000 | 611,525 | ||||||
5.00% 1/1/28 | 500,000 | 605,825 | ||||||
5.00% 1/1/29 | 470,000 | 567,276 | ||||||
5.00% 1/1/33 | 225,000 | 272,021 | ||||||
5.00% 1/1/34 | 200,000 | 241,262 | ||||||
Series A 5.00% 1/1/24 | 335,000 | 375,096 | ||||||
Puerto Rico Electric Power Authority | ||||||||
Series CCC 5.25% 7/1/27 ‡ | 410,000 | 329,025 | ||||||
Series WW 5.00% 7/1/28 ‡ | 585,000 | 468,000 | ||||||
Rochester Electric Utility Revenue | ||||||||
Series A 5.00% 12/1/34 | 450,000 | 551,052 | ||||||
Series A 5.00% 12/1/35 | 500,000 | 610,785 | ||||||
Series A 5.00% 12/1/36 | 520,000 | 633,682 | ||||||
Southern Minnesota Municipal Power Agency Revenue Series A 5.00% 1/1/41 | 400,000 | 471,772 | ||||||
49
Table of Contents
| Schedules of investments |
Delaware Minnesota High-Yield Municipal Bond Fund
| Principal amount° | Value (US $) | |||||||
Municipal Bonds(continued) | ||||||||
Electric Revenue Bonds(continued) | ||||||||
St. Paul Housing & Redevelopment Energy Revenue Series A 4.00% 10/1/32 | 800,000 | $ | 901,624 | |||||
Western Minnesota Municipal Power Agency Revenue | ||||||||
Series A 5.00% 1/1/30 | 500,000 | 572,500 | ||||||
Series A 5.00% 1/1/33 | 750,000 | 861,323 | ||||||
Series A 5.00% 1/1/34 | 450,000 | 516,483 | ||||||
Series A 5.00% 1/1/40 | 2,000,000 | 2,284,860 | ||||||
|
| |||||||
| 15,543,300 | ||||||||
|
| |||||||
Healthcare Revenue Bonds – 33.97% | ||||||||
Anoka Healthcare & Housing Facilities Revenue | ||||||||
(The Homestead at Anoka Project) 5.125% 11/1/49 | 400,000 | 424,208 | ||||||
Anoka Housing & Redevelopment Authority Revenue | ||||||||
(Fridley Medical Center Project) Series A 6.875% 5/1/40 | 1,000,000 | 1,018,620 | ||||||
Apple Valley Senior Housing Revenue | ||||||||
(PHS Senior Housing, Inc. Orchard Path Project) | ||||||||
4.50% 9/1/53 | 840,000 | 880,421 | ||||||
5.00% 9/1/43 | 535,000 | 581,299 | ||||||
5.00% 9/1/58 | 1,175,000 | 1,269,752 | ||||||
Apple Valley Senior Living Revenue | ||||||||
(Senior Living LLC Project) | ||||||||
2nd Tier Series B 5.00% 1/1/47 | 560,000 | 570,399 | ||||||
4th Tier Series D 7.00% 1/1/37 | 515,000 | 532,479 | ||||||
4th Tier Series D 7.25% 1/1/52 | 1,500,000 | 1,563,660 | ||||||
Bethel Housing & Health Care Facilities Revenue | ||||||||
(Benedictine Health System - St. Peter Communities | ||||||||
Project) Series A 5.50% 12/1/48 | 1,280,000 | 1,356,378 | ||||||
Bethel Senior Housing Revenue | ||||||||
(The Lodge at the Lakes at Stillwater Project) 5.25% 6/1/58 | 725,000 | 771,799 | ||||||
Brooklyn Center Multifamily Housing Revenue | ||||||||
(Sanctuary at Brooklyn Center Project) Series A 5.50% 11/1/35 | 750,000 | 778,057 | ||||||
City of West St. Paul Minnesota | ||||||||
(Walker Westwood Ridge Campus Project) 5.00% 11/1/49 | 1,500,000 | 1,603,035 | ||||||
Cloquet Housing Facilities | ||||||||
(HADC Cloquet Project) Series A 5.00% 8/1/48 | 850,000 | 867,629 | ||||||
Crookston Health Care Facilities Revenue | ||||||||
(Riverview Health Project) 5.00% 5/1/51 | 1,025,000 | 1,131,118 | ||||||
Dakota County Community Development Agency Senior Housing Revenue | ||||||||
(Walker Highview Hills Project) Series A 144A 5.00% 8/1/51 # | 870,000 | 902,834 | ||||||
50
Table of Contents
| Principal amount° | Value (US $) | |||||||
Municipal Bonds(continued) | ||||||||
Healthcare Revenue Bonds (continued) | ||||||||
Deephaven Housing & Healthcare Revenue | ||||||||
(St. Therese Senior Living Project) | ||||||||
Series A 5.00% 4/1/38 | 335,000 | $ | 343,800 | |||||
Series A 5.00% 4/1/40 | 315,000 | 323,064 | ||||||
Series A 5.00% 4/1/48 | 185,000 | 189,305 | ||||||
Duluth Economic Development Authority | ||||||||
(Essentia Health Obligated Group) Series A 5.00% 2/15/48 | 590,000 | 701,221 | ||||||
(St. Luke’s Hospital of Duluth Obligated Group) | ||||||||
5.75% 6/15/32 | 750,000 | 825,053 | ||||||
6.00% 6/15/39 | 1,000,000 | 1,109,580 | ||||||
Glencoe Health Care Facilities Revenue | ||||||||
(Glencoe Regional Health Services Project) 4.00% 4/1/31 | 185,000 | 193,617 | ||||||
Hayward Health Care Facilities Revenue | ||||||||
(American Baptist Homes Midwest Obligated Group) 5.375% 8/1/34 | 750,000 | 789,367 | ||||||
(St. John’s Lutheran Home of Albert Lea Project) 5.375% 10/1/44 | 165,000 | 172,699 | ||||||
Maple Grove Health Care Facilities Revenue | ||||||||
(Maple Grove Hospital Corporation) | ||||||||
4.00% 5/1/37 | 1,155,000 | 1,280,283 | ||||||
5.00% 5/1/26 | 1,300,000 | 1,588,184 | ||||||
5.00% 5/1/29 | 500,000 | 616,270 | ||||||
(North Memorial Health Care) 5.00% 9/1/30 | 610,000 | 722,679 | ||||||
Maple Plain Senior Housing & Health Care Revenue | ||||||||
(Haven Homes Incorporate Project) 5.00% 7/1/49 | 1,000,000 | 1,070,570 | ||||||
Minneapolis Health Care System Revenue | ||||||||
(Fairview Health Services) | ||||||||
Series A 4.00% 11/15/48 | 1,000,000 | 1,118,780 | ||||||
Series A 5.00% 11/15/33 | 1,200,000 | 1,428,348 | ||||||
Series A 5.00% 11/15/34 | 500,000 | 593,735 | ||||||
Series A 5.00% 11/15/44 | 1,000,000 | 1,170,140 | ||||||
Series A 5.00% 11/15/49 | 1,450,000 | 1,762,185 | ||||||
Minneapolis Senior Housing & Healthcare Revenue | ||||||||
(Ecumen-Abiitan Mill City Project) 5.375% 11/1/50 | 1,700,000 | 1,796,509 | ||||||
Minneapolis – St. Paul Housing & Redevelopment Authority Health Care Facilities Revenue | ||||||||
(Allina Health System) Series A 5.00% 11/15/29 | 415,000 | 519,862 | ||||||
Morris Health Care Facilities Revenue | ||||||||
(Farmington Health Services) | ||||||||
4.10% 8/1/44 | 500,000 | 504,430 | ||||||
4.20% 8/1/49 | 1,500,000 | 1,513,245 | ||||||
51
Table of Contents
| Schedules of investments |
Delaware Minnesota High-Yield Municipal Bond Fund
| Principal amount° | Value (US $) | |||||||
Municipal Bonds(continued) | ||||||||
Healthcare Revenue Bonds(continued) | ||||||||
Oakdale Senior Housing | ||||||||
(Oak Meadows Project) 5.00% 4/1/34 | 500,000 | $ | 509,535 | |||||
Rochester Health Care & Housing Revenue | ||||||||
(The Homestead at Rochester Project) | ||||||||
Series A 5.25% 12/1/23 | 175,000 | 188,036 | ||||||
Series A 6.875% 12/1/48 | 800,000 | 878,376 | ||||||
Rochester Health Care Facilities Revenue | ||||||||
(Mayo Clinic) 4.00% 11/15/41 | 1,790,000 | 1,875,866 | ||||||
(Olmsted Medical Center Project) | ||||||||
5.00% 7/1/22 | 350,000 | 385,525 | ||||||
5.00% 7/1/27 | 245,000 | 276,159 | ||||||
5.00% 7/1/28 | 225,000 | 252,902 | ||||||
Sartell Health Care Facilities Revenue | ||||||||
(Country Manor Campus Project) Series A 5.25% 9/1/22 | 1,080,000 | 1,194,037 | ||||||
Sauk Rapids Health Care Housing Facilities Revenue | ||||||||
(Good Shepherd Lutheran Home) 5.125% 1/1/39 | 825,000 | 855,145 | ||||||
Shakopee Health Care Facilities Revenue | ||||||||
(St. Francis Regional Medical Center) | ||||||||
4.00% 9/1/31 | 130,000 | 140,876 | ||||||
5.00% 9/1/34 | 105,000 | 118,871 | ||||||
St. Cloud Health Care Revenue | ||||||||
(Centracare Health System Project) | ||||||||
4.00% 5/1/49 | 250,000 | 280,367 | ||||||
5.00% 5/1/48 | 3,900,000 | 4,817,397 | ||||||
Unrefunded Balance 5.125% 5/1/30 | 15,000 | 15,374 | ||||||
Series A 4.00% 5/1/37 | 1,440,000 | 1,600,790 | ||||||
Series A 5.00% 5/1/46 | 2,000,000 | 2,360,080 | ||||||
St. Joseph Senior Housing & Healthcare Revenue | ||||||||
(Woodcrest Country Manor Project) 5.00% 7/1/55 | 1,000,000 | 1,058,540 | ||||||
St. Paul Housing & Redevelopment Authority Health Care Facilities Revenue (Fairview Health Services) | ||||||||
Series A 4.00% 11/15/43 | 645,000 | 719,594 | ||||||
Series A 5.00% 11/15/47 | 485,000 | 585,735 | ||||||
(HealthPartners Obligated Group Project) | ||||||||
Series A 4.00% 7/1/33 | 1,320,000 | 1,452,845 | ||||||
Series A 5.00% 7/1/29 | 1,000,000 | 1,186,310 | ||||||
Series A 5.00% 7/1/32 | 900,000 | 1,048,248 | ||||||
Series A 5.00% 7/1/33 | 1,540,000 | 1,786,169 | ||||||
52
Table of Contents
| Principal amount° | Value (US $) | |||||||
Municipal Bonds(continued) | ||||||||
Healthcare Revenue Bonds(continued) | ||||||||
St. Paul Housing & Redevelopment Authority Housing & Health Care Facilities Revenue | ||||||||
(Episcopal Homes Project) | ||||||||
5.125% 5/1/48 | 1,700,000 | $ | 1,752,139 | |||||
Series A 5.15% 11/1/42 | 775,000 | 782,145 | ||||||
St. Paul Housing & Redevelopment Authority Multifamily Housing Revenue | ||||||||
(Marian Center Project) Series A 5.375% 5/1/43 | 1,000,000 | 1,000,300 | ||||||
Twin Valley Congregate Housing Revenue | ||||||||
(Living Options Project) 5.95% 11/1/28 | 1,825,000 | 1,825,858 | ||||||
Victoria Health Care Facilities Revenue | ||||||||
(Augustana Emerald Care Project) 5.00% 8/1/39 | 1,500,000 | 1,545,615 | ||||||
Wayzata Senior Housing Revenue | ||||||||
(Folkestone Senior Living Community) | ||||||||
4.00% 8/1/38 | 250,000 | 261,828 | ||||||
4.00% 8/1/39 | 400,000 | 417,916 | ||||||
4.00% 8/1/44 | 350,000 | 364,578 | ||||||
5.00% 8/1/54 | 350,000 | 386,411 | ||||||
Woodbury Housing & Redevelopment Authority Revenue | ||||||||
(St. Therese of Woodbury) 5.25% 12/1/49 | 1,250,000 | 1,331,050 | ||||||
|
| |||||||
| 67,839,231 | ||||||||
|
| |||||||
Housing Revenue Bonds – 1.81% | ||||||||
Bethel Senior Housing Revenue | ||||||||
(Birchwood Landing at the Lakes at Stillwater Project) 5.00% 5/1/54 | 1,000,000 | 1,060,300 | ||||||
Minneapolis Multifamily Housing Revenue | ||||||||
(Olson Townhomes Project) 6.00% 12/1/19 (AMT) | 310,000 | 310,688 | ||||||
Minneapolis – St. Paul Housing Finance Board Single Family Mortgage-Backed Securities Program | ||||||||
(City Living Project) SeriesA-2 5.00% 12/1/38 (GNMA) (FNMA) (FHLMC) (AMT) | 11,235 | 11,242 | ||||||
Minnesota Housing Finance Agency State Appropriation | ||||||||
(Housing Infrastructure) Series C 5.00% 8/1/33 | 100,000 | 116,994 | ||||||
Northwest Multi-County Housing & Redevelopment Authority | ||||||||
(Pooled Housing Program) 5.50% 7/1/45 | 1,275,000 | 1,369,885 | ||||||
Stillwater Multifamily Housing Revenue | ||||||||
(Orleans Homes Project) 5.50% 2/1/42 (AMT) | 750,000 | 750,667 | ||||||
|
| |||||||
| 3,619,776 | ||||||||
|
| |||||||
53
Table of Contents
| Schedules of investments |
Delaware Minnesota High-Yield Municipal Bond Fund
| Principal amount° | Value (US $) | |||||||
Municipal Bonds(continued) | ||||||||
Lease Revenue Bonds – 2.39% | ||||||||
Minnesota General Fund Revenue Appropriations | ||||||||
Series A 5.00% 6/1/38 | 1,750,000 | $ | 1,985,147 | |||||
Series A 5.00% 6/1/43 | 1,000,000 | 1,132,120 | ||||||
Minnesota Housing Finance Agency State Appropriation | ||||||||
(Housing Infrastructure) Series C 5.00% 8/1/32 | 1,415,000 | 1,657,007 | ||||||
|
| |||||||
| 4,774,274 | ||||||||
|
| |||||||
Local General Obligation Bonds – 7.50% | ||||||||
Chaska Independent School District No. 112 | ||||||||
(School Building) Series A 5.00% 2/1/28 | 1,000,000 | 1,229,870 | ||||||
Duluth General Obligation Entertainment Convention Center Improvement | ||||||||
Series A 5.00% 2/1/34 | 1,000,000 | 1,207,250 | ||||||
Duluth Independent School District No. 709 | ||||||||
Series A 4.00% 2/1/27 | 440,000 | 498,555 | ||||||
Series A 4.20% 3/1/34 | 750,000 | 806,857 | ||||||
Foley Independent School District No. 51 | ||||||||
(School Building) Series A 5.00% 2/1/21 | 1,105,000 | 1,108,326 | ||||||
Hennepin County | ||||||||
Series A 5.00% 12/1/26 | 750,000 | 954,120 | ||||||
Series A 5.00% 12/1/37 | 910,000 | 1,148,684 | ||||||
Series C 5.00% 12/1/37 | 2,500,000 | 3,086,400 | ||||||
Mahtomedi Independent School District No. 832 | ||||||||
(School Building) | ||||||||
Series A 5.00% 2/1/28 | 1,000,000 | 1,195,230 | ||||||
Series A 5.00% 2/1/29 | 1,000,000 | 1,194,070 | ||||||
Series A 5.00% 2/1/30 | 445,000 | 531,103 | ||||||
Series A 5.00% 2/1/31 | 1,000,000 | 1,192,920 | ||||||
Wayzata Independent School District No. 284 | ||||||||
(School Building) Series A 5.00% 2/1/28 | 650,000 | 826,937 | ||||||
|
| |||||||
| 14,980,322 | ||||||||
|
| |||||||
Pre-Refunded/Escrowed to Maturity Bonds – 5.38% | ||||||||
Anoka Health Care Facilities Revenue | ||||||||
(The Homestead at Anoka Project) Series A 7.00%11/1/46-19§ | 1,650,000 | 1,681,499 | ||||||
Deephaven Charter School Lease Revenue | ||||||||
(Eagle Ridge Academy Project) Series A 5.50%7/1/43-23§ | 500,000 | 581,765 | ||||||
Minnesota Higher Education Facilities Authority Revenue | ||||||||
(St. Catherine University) | ||||||||
Series7-Q 5.00%10/1/25-22§ | 325,000 | 361,962 | ||||||
Series7-Q 5.00%10/1/26-22§ | 280,000 | 311,844 | ||||||
(University of St. Thomas) Series7-A 5.00%10/1/39-19§ | 1,000,000 | 1,002,900 | ||||||
54
Table of Contents
| Principal amount° | Value (US $) | |||||||
Municipal Bonds(continued) | ||||||||
Pre-Refunded/Escrowed to Maturity Bonds(continued) | ||||||||
Oak Park Heights Housing Revenue | ||||||||
(Oakgreen Commons Project) 7.00%8/1/45-20§ | 1,500,000 | $ | 1,578,195 | |||||
Rochester Healthcare & Housing Revenue | ||||||||
(Samaritan Bethany Project) | ||||||||
Series A 6.875%12/1/29-19§ | 1,000,000 | 1,013,700 | ||||||
Series A 7.375%12/1/41-19§ | 375,000 | 380,550 | ||||||
St. Paul Housing & Redevelopment Authority Charter School Lease Revenue | ||||||||
(Nova Classical Academy Project) Series A 6.625%9/1/42-21§ | 1,500,000 | 1,660,620 | ||||||
St. Paul Housing & Redevelopment Authority Hospital Facility Revenue | ||||||||
(Healtheast Care System Project) | ||||||||
Series A 5.00%11/15/29-25§ | 275,000 | 336,859 | ||||||
Series A 5.00%11/15/30-25§ | 205,000 | 251,113 | ||||||
University of Minnesota | ||||||||
Series A 5.25%12/1/28-20§ | 1,500,000 | 1,577,295 | ||||||
|
| |||||||
| 10,738,302 | ||||||||
|
| |||||||
Special Tax Revenue Bonds – 5.02% | ||||||||
Minneapolis Revenue | ||||||||
(YMCA Greater Twin Cities Project) 4.00% 6/1/31 | 250,000 | 278,003 | ||||||
Minneapolis Tax Increment Revenue | ||||||||
(Grant Park Project) | ||||||||
4.00% 3/1/27 | 200,000 | 208,404 | ||||||
4.00% 3/1/30 | 260,000 | 269,433 | ||||||
(Village of St. Anthony Falls Project) | ||||||||
4.00% 3/1/24 | 700,000 | 725,627 | ||||||
4.00% 3/1/27 | 650,000 | 661,239 | ||||||
Puerto Rico Sales Tax Financing Revenue | ||||||||
(Capital Appreciation - Restructured) | ||||||||
SeriesA-1 5.375% 7/1/46 ^ | 3,635,000 | 976,143 | ||||||
SeriesA-1 5.625% 7/1/51 ^ | 4,145,000 | 805,539 | ||||||
(Restructured) | ||||||||
SeriesA-1 4.75% 7/1/53 | 2,005,000 | 2,060,759 | ||||||
SeriesA-1 5.00% 7/1/58 | 275,000 | 287,419 | ||||||
SeriesA-2 4.536% 7/1/53 | 3,000,000 | 3,048,660 | ||||||
St. Paul Sales Tax Revenue | ||||||||
Series G 5.00% 11/1/28 | 600,000 | 710,706 | ||||||
|
| |||||||
| 10,031,932 | ||||||||
|
| |||||||
State General Obligation Bonds – 8.43% | ||||||||
Minnesota | ||||||||
Series A 5.00% 8/1/27 | 750,000 | 916,740 | ||||||
55
Table of Contents
| Schedules of investments |
Delaware Minnesota High-Yield Municipal Bond Fund
| Principal amount° | Value (US $) | |||||||
Municipal Bonds(continued) | ||||||||
State General Obligation Bonds(continued) | ||||||||
Minnesota | ||||||||
Series A 5.00% 8/1/29 | 1,000,000 | $ | 1,216,170 | |||||
Series A 5.00% 8/1/33 | 660,000 | 856,759 | ||||||
Series A 5.00% 10/1/33 | 2,000,000 | 2,542,500 | ||||||
Series A 5.00% 8/1/34 | 2,185,000 | 2,827,193 | ||||||
Series A 5.00% 8/1/38 | 1,000,000 | 1,278,990 | ||||||
Series A Unrefunded Balance 5.00% 10/1/24 | 985,000 | 1,064,391 | ||||||
Series D 5.00% 8/1/26 | 1,000,000 | 1,260,630 | ||||||
Series D 5.00% 8/1/27 | 1,000,000 | 1,257,030 | ||||||
Series E 5.00% 10/1/26 | 1,085,000 | 1,373,773 | ||||||
(Various Purposes) Series A 5.00% 8/1/32 | 1,915,000 | 2,244,495 | ||||||
|
| |||||||
| 16,838,671 | ||||||||
|
| |||||||
Transportation Revenue Bonds – 4.40% | ||||||||
Minneapolis – St. Paul Metropolitan Airports Commission Revenue | ||||||||
(Senior) | ||||||||
Series A 5.00% 1/1/32 | 1,245,000 | 1,538,185 | ||||||
Series C 5.00% 1/1/46 | 185,000 | 221,915 | ||||||
(Subordinate) | ||||||||
Series A 5.00% 1/1/22 | 1,000,000 | 1,052,860 | ||||||
Series A 5.00% 1/1/32 | 500,000 | 572,050 | ||||||
Series B 5.00% 1/1/29 | 2,130,000 | 2,310,198 | ||||||
Series B 5.00% 1/1/44 (AMT) | 1,000,000 | 1,236,760 | ||||||
Series B 5.00% 1/1/49 (AMT) | 1,500,000 | 1,846,500 | ||||||
|
| |||||||
| 8,778,468 | ||||||||
|
| |||||||
Water & Sewer Revenue Bonds – 1.50% | ||||||||
Guam Government Waterworks Authority 5.00% 7/1/37 | 575,000 | 672,756 | ||||||
Metropolitan Council General Obligation Wastewater Revenue (Minneapolis – St. Paul Metropolitan Area) | ||||||||
Series C 4.00% 3/1/31 | 965,000 | 1,140,215 | ||||||
Series C 4.00% 3/1/32 | 1,000,000 | 1,175,880 | ||||||
|
| |||||||
| 2,988,851 | ||||||||
|
| |||||||
Total Municipal Bonds(cost $186,145,079) | 197,624,750 | |||||||
|
| |||||||
56
Table of Contents
| Principal amount° | Value (US $) | |||||||
Short-Term Investments – 1.59% | ||||||||
Variable Rate Demand Notes – 1.59%¤ | ||||||||
Minneapolis – St. Paul Housing & Redevelopment Authority Health Care Facilities Revenue | ||||||||
(Children’s Hospitals and Clinics) | ||||||||
Series A 0.75% 8/15/34 (AGM) (SPA – US Bank N.A.) | 800,000 | $ | 800,000 | |||||
SeriesA-1 0.75% 8/15/37 (AGM) (SPA – US Bank N.A.) | 1,875,000 | 1,875,000 | ||||||
Series B 0.74% 8/15/25 (AGM) (SPA – US Bank N.A.) | 300,000 | 300,000 | ||||||
Minneapolis – St. Paul Housing & Redevelopment Authority | ||||||||
Health Care Revenue (Allina Health System) SeriesB-1 1.37% 11/15/35 (LOC – JPMorgan Chase Bank N.A.) | 200,000 | 200,000 | ||||||
|
| |||||||
Total Short-Term Investments(cost $3,175,000) | 3,175,000 | |||||||
|
| |||||||
Total Value of Securities – 100.55% | $ | 200,799,750 | ||||||
|
| |||||||
| # | Security exempt from registration under Rule 144A of the Securities Act of 1933, as amended. At Aug. 31, 2019, the aggregate value of Rule 144A securities was $5,366,023, which represents 2.69% of the Fund’s net assets. See Note 8 in “Notes to financial statements.” |
| ¤ | Tax-exempt obligations that contain a floating or variable interest rate adjustment formula and an unconditional right of demand to receive payment of the unpaid principal balance plus accrued interest upon a short notice period (generally up to 30 days) prior to specified dates either from the issuer or by drawing on a bank letter of credit, a guarantee, or insurance issued with respect to such instrument. Each rate shown is as of Aug. 31, 2019. |
| § | Pre-refunded bonds. Municipal bonds that are generally backed or secured by US Treasury bonds. Forpre-refunded bonds, the stated maturity is followed by the year in which the bond will bepre-refunded. See Note 8 in “Notes to financial statements.” |
| ° | Principal amount shown is stated in USD unless noted that the security is denominated in another currency. |
| ‡ | Non-income producing security. Security is currently in default. |
| ^ | Zero-coupon security. The rate shown is the effective yield at the time of purchase. |
Summary of abbreviations:
AGM – Insured by Assured Guaranty Municipal Corporation
AMT – Subject to Alternative Minimum Tax
FHLMC – Federal Home Loan Mortgage Corporation collateral
FNMA – Federal National Mortgage Association collateral
GNMA – Government National Mortgage Association collateral
LOC – Letter of Credit
57
Table of Contents
| Schedules of investments |
Delaware Minnesota High-Yield Municipal Bond Fund
Summary of abbreviations: (continued)
N.A. – National Association
SPA –Stand-by Purchase Agreement
USD – US Dollar
See accompanying notes, which are an integral part of the financial statements.
58
Table of Contents
This page intentionally left blank.
Table of Contents
Statements of assets and liabilities
August 31, 2019
Delaware Fund | Delaware Tax-Free Minnesota Intermediate Fund | Delaware High-Yield Bond Fund | ||||||||||
Assets: | ||||||||||||
Investments, at value1 | $ | 612,816,947 | $ | 80,813,573 | $ | 200,799,750 | ||||||
Cash | 50,660 | 178,359 | 50,598 | |||||||||
Interest receivable | 6,919,317 | 816,741 | 2,224,509 | |||||||||
Receivable for fund shares sold | 476,137 | 479,544 | 48,647 | |||||||||
|
|
|
|
|
| |||||||
Total assets | 620,263,061 | 82,288,217 | 203,123,504 | |||||||||
|
|
|
|
|
| |||||||
Liabilities: | ||||||||||||
Payable for securities purchased | 33,367,436 | 1,358,984 | 3,081,235 | |||||||||
Distribution payable | 381,672 | 52,573 | 134,386 | |||||||||
Investment management fees payable to affiliates | 197,067 | 19,021 | 62,166 | |||||||||
Payable for fund shares redeemed | 128,195 | — | 39,994 | |||||||||
Distribution fees payable to affiliates | 107,334 | 13,233 | 39,325 | |||||||||
Other accrued expenses | 104,445 | 39,309 | 61,309 | |||||||||
Dividend disbursing and transfer agent fees and expenses payable to affiliates | 4,885 | 672 | 1,645 | |||||||||
Trustees’ fees and expenses payable to affiliates | 4,289 | 594 | 1,432 | |||||||||
Accounting and administration expenses payable to affiliates | 2,211 | 597 | 970 | |||||||||
Legal fees payable to affiliates | 879 | 122 | 294 | |||||||||
Reports and statements to shareholders expenses payable to affiliates | 271 | 37 | 92 | |||||||||
|
|
|
|
|
| |||||||
Total liabilities | 34,298,684 | 1,485,142 | 3,422,848 | |||||||||
|
|
|
|
|
| |||||||
Total Net Assets | $ | 585,964,377 | $ | 80,803,075 | $ | 199,700,656 | ||||||
|
|
|
|
|
| |||||||
Net Assets Consist of: | ||||||||||||
Paid-in capital | $ | 550,851,980 | $ | 76,335,861 | $ | 189,260,917 | ||||||
Total distributable earnings (loss) | 35,112,397 | 4,467,214 | 10,439,739 | |||||||||
|
|
|
|
|
| |||||||
Total Net Assets | $ | 585,964,377 | $ | 80,803,075 | $ | 199,700,656 | ||||||
|
|
|
|
|
| |||||||
60
Table of Contents
Delaware Fund | Delaware Tax-Free Minnesota Intermediate Fund | Delaware High-Yield Bond Fund | ||||||||||
Net Asset Value | ||||||||||||
Class A: | ||||||||||||
Net assets | $ | 386,790,523 | $ | 55,917,764 | $ | 103,486,941 | ||||||
Shares of beneficial interest outstanding, unlimited authorization, no par | 30,499,990 | 4,970,755 | 9,232,846 | |||||||||
Net asset value per share | $ | 12.68 | $ | 11.25 | $ | 11.21 | ||||||
Sales charge | 4.50 | % | 2.75 | % | 4.50 | % | ||||||
Offering price per share, equal to net asset value per share/(1 – sales charge) | $ | 13.28 | $ | 11.57 | $ | 11.74 | ||||||
Class C: | ||||||||||||
Net assets | $ | 29,932,934 | $ | 7,167,026 | $ | 21,058,429 | ||||||
Shares of beneficial interest outstanding, unlimited authorization, no par | 2,352,720 | 635,845 | 1,875,123 | |||||||||
Net asset value per share | $ | 12.72 | $ | 11.27 | $ | 11.23 | ||||||
Institutional Class: | ||||||||||||
Net assets | $ | 169,240,920 | $ | 17,718,285 | $ | 75,155,286 | ||||||
Shares of beneficial interest outstanding, unlimited authorization, no par | 13,348,045 | 1,574,493 | 6,707,367 | |||||||||
Net asset value per share | $ | 12.68 | $ | 11.25 | $ | 11.20 | ||||||
| ||||||||||||
1Investments, at cost | $ | 577,489,354 | $ | 76,245,308 | $ | 189,320,079 | ||||||
See accompanying notes, which are an integral part of the financial statements.
61
Table of Contents
Year ended August 31, 2019
| Delaware Tax-Free Minnesota Fund | Delaware Tax-Free Minnesota Intermediate Fund | Delaware Bond Fund | ||||||||||
Investment Income: | ||||||||||||
Interest | $ | 20,808,959 | $ | 2,772,625 | $ | 6,899,047 | ||||||
|
|
|
|
|
| |||||||
Expenses: | ||||||||||||
Management fees | 3,006,000 | 386,722 | 981,891 | |||||||||
Distribution expenses—Class A | 941,672 | 138,546 | 242,471 | |||||||||
Distribution expenses—Class C | 309,709 | 77,004 | 203,445 | |||||||||
Dividend disbursing and transfer agent fees and expenses | 318,663 | 50,739 | 121,584 | |||||||||
Accounting and administration expenses | 139,913 | 55,309 | 73,368 | |||||||||
Registration fees | 71,809 | 23,975 | 20,945 | |||||||||
Reports and statements to shareholders expenses | 60,547 | 15,265 | 23,890 | |||||||||
Audit and tax fees | 46,673 | 46,673 | 46,673 | |||||||||
Legal fees | 39,441 | 5,969 | 11,158 | |||||||||
Trustees’ fees and expenses | 31,696 | 4,451 | 10,255 | |||||||||
Custodian fees | 14,487 | 2,757 | 6,163 | |||||||||
Other | 48,760 | 17,659 | 28,003 | |||||||||
|
|
|
|
|
| |||||||
| 5,029,370 | 825,069 | 1,769,846 | ||||||||||
Less expenses waived | (464,307 | ) | (175,598 | ) | (180,699 | ) | ||||||
Less waived distribution expenses—Class A | — | (55,419 | ) | — | ||||||||
Less expenses paid indirectly | (6,565 | ) | (632 | ) | (982 | ) | ||||||
|
|
|
|
|
| |||||||
Total operating expenses | 4,558,498 | 593,420 | 1,588,165 | |||||||||
|
|
|
|
|
| |||||||
Net Investment Income | 16,250,461 | 2,179,205 | 5,310,882 | |||||||||
|
|
|
|
|
| |||||||
Net Realized and Unrealized Gain (Loss): | ||||||||||||
Net realized gain (loss) on investments | 422,779 | 5,373 | (149,752 | ) | ||||||||
Net change in unrealized appreciation (depreciation) of investments | 23,896,388 | 2,996,731 | 9,364,456 | |||||||||
|
|
|
|
|
| |||||||
Net Realized and Unrealized Gain | 24,319,167 | 3,002,104 | 9,214,704 | |||||||||
|
|
|
|
|
| |||||||
Net Increase in Net Assets Resulting from Operations | $ | 40,569,628 | $ | 5,181,309 | $ | 14,525,586 | ||||||
|
|
|
|
|
| |||||||
See accompanying notes, which are an integral part of the financial statements.
62
Table of Contents
This page intentionally left blank.
Table of Contents
Statements of changes in net assets
DelawareTax-Free Minnesota Fund
| Year ended | ||||||||
| 8/31/19 | 8/31/18 | |||||||
Increase (Decrease) in Net Assets from Operations: | ||||||||
Net investment income | $ | 16,250,461 | $ | 16,357,240 | ||||
Net realized gain | 422,779 | 299,568 | ||||||
Net change in unrealized appreciation (depreciation) | 23,896,388 | (15,406,873 | ) | |||||
|
|
|
| |||||
Net increase in net assets resulting from operations | 40,569,628 | 1,249,935 | ||||||
|
|
|
| |||||
Dividends and Distributions to Shareholders from: | ||||||||
Distributable earnings*: | ||||||||
Class A | (11,013,173 | ) | (14,247,459 | ) | ||||
Class C | (674,498 | ) | (1,274,213 | ) | ||||
Institutional Class | (4,532,590 | ) | (3,638,192 | ) | ||||
|
|
|
| |||||
| (16,220,261 | ) | (19,159,864 | ) | |||||
|
|
|
| |||||
Capital Share Transactions: | ||||||||
Proceeds from shares sold: | ||||||||
Class A | 34,266,180 | 38,349,082 | ||||||
Class C | 3,098,448 | 2,636,660 | ||||||
Institutional Class | 83,152,024 | 54,835,728 | ||||||
Net asset value of shares issued upon reinvestment of dividends and distributions: | ||||||||
Class A | 9,748,901 | 12,235,255 | ||||||
Class C | 653,678 | 1,195,247 | ||||||
Institutional Class | 3,221,296 | 3,287,427 | ||||||
|
|
|
| |||||
| 134,140,527 | 112,539,399 | |||||||
|
|
|
| |||||
64
Table of Contents
| Year ended | ||||||||
| 8/31/19 | 8/31/18 | |||||||
Capital Share Transactions (continued): | ||||||||
Cost of shares redeemed: | ||||||||
Class A | $ | (63,834,709 | ) | $ | (70,209,949 | ) | ||
Class C | (10,695,643 | ) | (17,670,338 | ) | ||||
Institutional Class | (44,007,882 | ) | (24,104,373 | ) | ||||
|
|
|
| |||||
| (118,538,234 | ) | (111,984,660 | ) | |||||
|
|
|
| |||||
Increase in net assets derived from capital share transactions | 15,602,293 | 554,739 | ||||||
|
|
|
| |||||
Net Increase (Decrease) in Net Assets | 39,951,660 | (17,355,190 | ) | |||||
Net Assets: | ||||||||
Beginning of year | 546,012,717 | 563,367,907 | ||||||
|
|
|
| |||||
End of year1 | $ | 585,964,377 | $ | 546,012,717 | ||||
|
|
|
| |||||
| 1 | Net Assets – End of year includes distributions in excess of net investment income of $240,388 in 2018. The Securities and Exchange Commission eliminated the requirement to disclose undistributed (distributions in excess of) net investment income in 2018. |
| * | For the year ended Aug. 31, 2019, the Fund has adopted amendments to RegulationS-X (see Note 10 in “Notes to financial statements”). For the year ended Aug. 31, 2018, the dividends and distributions to shareholders were as follows: |
| Class A | Class C | Institutional Class | ||||||||||
Dividends from net investment income | $ | (12,134,393 | ) | $ | (1,024,249 | ) | $ | (3,183,679 | ) | |||
Distributions from net realized gains | (2,113,066 | ) | (249,964 | ) | (454,513 | ) | ||||||
See accompanying notes, which are an integral part of the financial statements.
65
Table of Contents
Statements of changes in net assets
DelawareTax-Free Minnesota Intermediate Fund
| Year ended | ||||||||
| 8/31/19 | 8/31/18 | |||||||
Increase (Decrease) in Net Assets from Operations: | ||||||||
Net investment income | $ | 2,179,205 | $ | 2,428,417 | ||||
Net realized gain | 5,373 | 72,266 | ||||||
Net change in unrealized appreciation (depreciation) | 2,996,731 | (2,687,546 | ) | |||||
|
|
|
| |||||
Net increase (decrease) in net assets resulting from operations | 5,181,309 | (186,863 | ) | |||||
|
|
|
| |||||
Dividends and Distributions to Shareholders from: | ||||||||
Distributable earnings*: | ||||||||
Class A | (1,593,527 | ) | (2,031,660 | ) | ||||
Class C | (156,332 | ) | (249,902 | ) | ||||
Institutional Class | (428,375 | ) | (518,897 | ) | ||||
|
|
|
| |||||
| (2,178,234 | ) | (2,800,459 | ) | |||||
|
|
|
| |||||
Capital Share Transactions: | ||||||||
Proceeds from shares sold: | ||||||||
Class A | 5,671,277 | 4,764,864 | ||||||
Class C | 898,626 | 670,790 | ||||||
Institutional Class | 8,405,771 | 5,446,733 | ||||||
Net asset value of shares issued upon reinvestment of dividends and distributions: | ||||||||
Class A | 1,357,246 | 1,731,184 | ||||||
Class C | 149,449 | 237,000 | ||||||
Institutional Class | 397,172 | 499,540 | ||||||
|
|
|
| |||||
| 16,879,541 | 13,350,111 | |||||||
|
|
|
| |||||
66
Table of Contents
| Year ended | ||||||||
| 8/31/19 | 8/31/18 | |||||||
Capital Share Transactions (continued): | ||||||||
Cost of shares redeemed: | ||||||||
Class A | $ | (12,485,742 | ) | $ | (14,067,022 | ) | ||
Class C | (2,719,349 | ) | (3,881,824 | ) | ||||
Institutional Class | (3,186,459 | ) | (12,720,892 | ) | ||||
|
|
|
| |||||
| (18,391,550 | ) | (30,669,738 | ) | |||||
|
|
|
| |||||
Decrease in net assets derived from capital share transactions | (1,512,009 | ) | (17,319,627 | ) | ||||
|
|
|
| |||||
Net Increase (Decrease) in Net Assets | 1,491,066 | (20,306,949 | ) | |||||
Net Assets: | ||||||||
Beginning of year | 79,312,009 | 99,618,958 | ||||||
|
|
|
| |||||
End of year1 | $ | 80,803,075 | $ | 79,312,009 | ||||
|
|
|
| |||||
| 1 | Net Assets – End of year includes distributions in excess of net investment income of $4,190 in 2018. The Securities and Exchange Commission eliminated the requirement to disclose undistributed (distributions in excess of) net investment income in 2018. |
| * | For the year ended Aug. 31, 2019, the Fund has adopted amendments to RegulationS-X (see Note 10 in “Notes to financial statements”). For the year ended Aug. 31, 2018, the dividends and distributions to shareholders were as follows: |
| Class A | Class C | Institutional Class | ||||||||||
Dividends from net investment income | $ | (1,771,652 | ) | $ | (205,693 | ) | $ | (450,722 | ) | |||
Distributions from net realized gain | (260,008 | ) | (44,209 | ) | (68,175 | ) | ||||||
See accompanying notes, which are an integral part of the financial statements.
67
Table of Contents
Statements of changes in net assets
Delaware Minnesota High-Yield Municipal Bond Fund
| Year ended | ||||||||
| 8/31/19 | 8/31/18 | |||||||
Increase (Decrease) in Net Assets from Operations: | ||||||||
Net investment income | $ | 5,310,882 | $ | 5,142,414 | ||||
Net realized loss | (149,752 | ) | (71,151 | ) | ||||
Net change in unrealized appreciation (depreciation) | 9,364,456 | (3,485,137 | ) | |||||
|
|
|
| |||||
Net increase in net assets resulting from operations | 14,525,586 | 1,586,126 | ||||||
|
|
|
| |||||
Dividends and Distributions to Shareholders from: | ||||||||
Distributable earnings*: | ||||||||
Class A | (2,884,919 | ) | (2,914,141 | ) | ||||
Class C | (452,855 | ) | (667,362 | ) | ||||
Institutional Class | (1,963,896 | ) | (1,591,025 | ) | ||||
|
|
|
| |||||
| (5,301,670 | ) | (5,172,528 | ) | |||||
|
|
|
| |||||
Capital Share Transactions: | ||||||||
Proceeds from shares sold: | ||||||||
Class A | 11,808,073 | 16,270,537 | ||||||
Class C | 3,143,949 | 3,339,629 | ||||||
Institutional Class | 31,389,740 | 24,537,706 | ||||||
Net asset value of shares issued upon reinvestment of dividends and distributions: | ||||||||
Class A | 2,586,210 | 2,338,287 | ||||||
Class C | 420,887 | 598,928 | ||||||
Institutional Class | 1,877,843 | 1,536,871 | ||||||
|
|
|
| |||||
| 51,226,702 | 48,621,958 | |||||||
|
|
|
| |||||
68
Table of Contents
| Year ended | ||||||||
| 8/31/19 | 8/31/18 | |||||||
Capital Share Transactions (continued): | ||||||||
Cost of shares redeemed: | ||||||||
Class A | $ | (14,747,115 | ) | $ | (16,152,757 | ) | ||
Class C | (5,154,694 | ) | (13,869,963 | ) | ||||
Institutional Class | (14,980,335 | ) | (16,399,941 | ) | ||||
|
|
|
| |||||
| (34,882,144 | ) | (46,422,661 | ) | |||||
|
|
|
| |||||
Increase in net assets derived from capital share transactions | 16,344,558 | 2,199,297 | ||||||
|
|
|
| |||||
Net Increase (Decrease) in Net Assets | 25,568,474 | (1,387,105 | ) | |||||
Net Assets: | ||||||||
Beginning of year | 174,132,182 | 175,519,287 | ||||||
|
|
|
| |||||
End of year1 | $ | 199,700,656 | $ | 174,132,182 | ||||
|
|
|
| |||||
| 1 | Net Assets - There was no undistributed net investment income in 2018. The Securities and Exchange Commission eliminated the requirement to disclose undistributed (distributions in excess of) net investment income in 2018. |
| * | For the year ended Aug. 31, 2019, the Fund has adopted amendments to RegulationS-X (see Note 10 in “Notes to financial statements”). For the year ended Aug. 31, 2018, the dividends and distributions to shareholders were as follows: |
| Class A | Class C | Institutional Class | ||||||||||
Dividends from net investment income | $ | (2,914,141 | ) | $ | (667,362 | ) | $ | (1,591,025 | ) | |||
See accompanying notes, which are an integral part of the financial statements.
69
Table of Contents
DelawareTax-Free Minnesota Fund Class A
Selected data for each share of the Fund outstanding throughout each period were as follows:
| Net asset value, beginning of period |
Income (loss) from investment operations: |
Net investment income1 |
Net realized and unrealized gain (loss) |
Total from investment operations |
Less dividends and distributions from: |
Net investment income |
Net realized gain |
Total dividends and distributions |
Net asset value, end of period |
Total return2 |
Ratios and supplemental data: |
Net assets, end of period (000 omitted) |
Ratio of expenses to average net assets |
Ratio of expenses to average net assets prior to fees waived |
Ratio of net investment income to average net assets |
Ratio of net investment income to average net assets prior to fees waived |
Portfolio turnover
|
| 1 | The average shares outstanding have been applied for per share information. |
| 2 | Total return is based on the change in net asset value of a share during the period and assumes reinvestment of dividends and distributions at net asset value and does not reflect the impact of a sales charge. Total return during all of the periods shown reflects a waiver by the manager. Performance would have been lower had the waiver not been in effect. |
See accompanying notes, which are an integral part of the financial statements.
70
Table of Contents
| Year ended | ||||||||||||||||||||||||||||
| 8/31/19 | 8/31/18 | 8/31/17 | 8/31/16 | 8/31/15 | ||||||||||||||||||||||||
| $ | 12.14 | $ | 12.54 | $ | 12.87 | $ | 12.60 | $ | 12.67 | |||||||||||||||||||
| 0.36 | 0.37 | 0.38 | 0.41 | 0.44 | ||||||||||||||||||||||||
| 0.54 | (0.34 | ) | (0.32 | ) | 0.28 | (0.06 | ) | |||||||||||||||||||||
|
|
|
|
|
|
|
|
|
| |||||||||||||||||||
| 0.90 | 0.03 | 0.06 | 0.69 | 0.38 | ||||||||||||||||||||||||
|
|
|
|
|
|
|
|
|
| |||||||||||||||||||
| ||||||||||||||||||||||||||||
| (0.36 | ) | (0.37 | ) | (0.39 | ) | (0.42 | ) | (0.45 | ) | |||||||||||||||||||
| — | (0.06 | ) | — | — | — | |||||||||||||||||||||||
|
|
|
|
|
|
|
|
|
| |||||||||||||||||||
| (0.36 | ) | (0.43 | ) | (0.39 | ) | (0.42 | ) | (0.45 | ) | |||||||||||||||||||
|
|
|
|
|
|
|
|
|
| |||||||||||||||||||
| $ | 12.68 | $ | 12.14 | $ | 12.54 | $ | 12.87 | $ | 12.60 | |||||||||||||||||||
|
|
|
|
|
|
|
|
|
| |||||||||||||||||||
| 7.54% | 0.26% | 0.49% | 5.52% | 3.02% | ||||||||||||||||||||||||
| ||||||||||||||||||||||||||||
| $ | 386,790 | $ | 390,477 | $ | 423,497 | $ | 481,066 | $ | 479,275 | |||||||||||||||||||
| 0.85% | 0.85% | 0.85% | 0.85% | 0.87% | ||||||||||||||||||||||||
| 0.93% | 0.94% | 0.95% | 0.95% | 0.96% | ||||||||||||||||||||||||
| 2.92% | 2.99% | 3.08% | 3.25% | 3.51% | ||||||||||||||||||||||||
| 2.84% | 2.90% | 2.98% | 3.15% | 3.42% | ||||||||||||||||||||||||
| 13% | 16% | 17% | 15% | 11% | ||||||||||||||||||||||||
71
Table of Contents
Financial highlights
DelawareTax-Free Minnesota Fund Class C
Selected data for each share of the Fund outstanding throughout each period were as follows:
| Net asset value, beginning of period |
Income (loss) from investment operations: |
Net investment income1 |
Net realized and unrealized gain (loss) |
Total from investment operations |
Less dividends and distributions from: |
Net investment income |
Net realized gain |
Total dividends and distributions |
Net asset value, end of period |
Total return2 |
Ratios and supplemental data: |
Net assets, end of period (000 omitted) |
Ratio of expenses to average net assets |
Ratio of expenses to average net assets prior to fees waived |
Ratio of net investment income to average net assets |
Ratio of net investment income to average net assets prior to fees waived |
Portfolio turnover |
| 1 | The average shares outstanding have been applied for per share information. |
| 2 | Total return is based on the change in net asset value of a share during the period and assumes reinvestment of dividends and distributions at net asset value and does not reflect the impact of a sales charge. Total return during all of the periods shown reflects a waiver by the manager. Performance would have been lower had the waiver not been in effect. |
See accompanying notes, which are an integral part of the financial statements.
72
Table of Contents
| Year ended | ||||||||||||||||||||||||||||
| 8/31/19 | 8/31/18 | 8/31/17 | 8/31/16 | 8/31/15 | ||||||||||||||||||||||||
| $ | 12.18 | $ | 12.58 | $ | 12.91 | $ | 12.64 | $ | 12.71 | |||||||||||||||||||
| 0.27 | 0.28 | 0.29 | 0.32 | 0.35 | ||||||||||||||||||||||||
| 0.54 | (0.34 | ) | (0.33 | ) | 0.27 | (0.07 | ) | |||||||||||||||||||||
|
|
|
|
|
|
|
|
|
| |||||||||||||||||||
| 0.81 | (0.06 | ) | (0.04 | ) | 0.59 | 0.28 | ||||||||||||||||||||||
|
|
|
|
|
|
|
|
|
| |||||||||||||||||||
| (0.27 | ) | (0.28 | ) | (0.29 | ) | (0.32 | ) | (0.35 | ) | |||||||||||||||||||
| — | (0.06 | ) | — | — | — | |||||||||||||||||||||||
|
|
|
|
|
|
|
|
|
| |||||||||||||||||||
| (0.27 | ) | (0.34 | ) | (0.29 | ) | (0.32 | ) | (0.35 | ) | |||||||||||||||||||
|
|
|
|
|
|
|
|
|
| |||||||||||||||||||
| $ | 12.72 | $ | 12.18 | $ | 12.58 | $ | 12.91 | $ | 12.64 | |||||||||||||||||||
|
|
|
|
|
|
|
|
|
| |||||||||||||||||||
| 6.73% | (0.49% | ) | (0.25% | ) | 4.73% | 2.25% | ||||||||||||||||||||||
| $ | 29,933 | $ | 35,642 | $ | 51,045 | $ | 53,502 | $ | 45,393 | |||||||||||||||||||
| 1.60% | 1.60% | 1.60% | 1.60% | 1.62% | ||||||||||||||||||||||||
| 1.68% | 1.69% | 1.70% | 1.70% | 1.71% | ||||||||||||||||||||||||
| 2.17% | 2.24% | 2.33% | 2.50% | 2.76% | ||||||||||||||||||||||||
| 2.09% | 2.15% | 2.23% | 2.40% | 2.67% | ||||||||||||||||||||||||
| 13% | 16% | 17% | 15% | 11% | ||||||||||||||||||||||||
73
Table of Contents
Financial highlights
DelawareTax-Free Minnesota Fund Institutional Class
Selected data for each share of the Fund outstanding throughout each period were as follows:
Net asset value, beginning of period |
Income (loss) from investment operations: |
Net investment income1 |
Net realized and unrealized gain (loss) |
Total from investment operations |
Less dividends and distributions from: |
Net investment income |
Net realized gain |
Total dividends and distributions |
Net asset value, end of period |
Total return2 |
Ratios and supplemental data: |
Net assets, end of period (000 omitted) |
Ratio of expenses to average net assets |
Ratio of expenses to average net assets prior to fees waived |
Ratio of net investment income to average net assets |
Ratio of net investment income to average net assets prior to fees waived |
Portfolio turnover |
| 1 | The average shares outstanding have been applied for per share information. |
| 2 | Total return is based on the change in net asset value of a share during the period and assumes reinvestment of dividends and distributions at net asset value. Total return during all of the periods shown reflects a waiver by the manager. Performance would have been lower had the waiver not been in effect. |
See accompanying notes, which are an integral part of the financial statements.
74
Table of Contents
| Year ended | ||||||||||||||||||||||||||||
| 8/31/19 | 8/31/18 | 8/31/17 | 8/31/16 | 8/31/15 | ||||||||||||||||||||||||
| $ | 12.14 | $ | 12.54 | $ | 12.87 | $ | 12.59 | $ | 12.66 | |||||||||||||||||||
| 0.39 | 0.40 | 0.41 | 0.45 | 0.48 | ||||||||||||||||||||||||
| 0.54 | (0.34 | ) | (0.32 | ) | 0.28 | (0.07 | ) | |||||||||||||||||||||
|
|
|
|
|
|
|
|
|
| |||||||||||||||||||
| 0.93 | 0.06 | 0.09 | 0.73 | 0.41 | ||||||||||||||||||||||||
|
|
|
|
|
|
|
|
|
| |||||||||||||||||||
| (0.39 | ) | (0.40 | ) | (0.42 | ) | (0.45 | ) | (0.48 | ) | |||||||||||||||||||
| — | (0.06 | ) | — | — | — | |||||||||||||||||||||||
|
|
|
|
|
|
|
|
|
| |||||||||||||||||||
| (0.39 | ) | (0.46 | ) | (0.42 | ) | (0.45 | ) | (0.48 | ) | |||||||||||||||||||
|
|
|
|
|
|
|
|
|
| |||||||||||||||||||
| $ | 12.68 | $ | 12.14 | $ | 12.54 | $ | 12.87 | $ | 12.59 | |||||||||||||||||||
|
|
|
|
|
|
|
|
|
| |||||||||||||||||||
| 7.81% | 0.51% | 0.75% | 5.87% | 3.27% | ||||||||||||||||||||||||
| $ | 169,241 | $ | 119,894 | $ | 88,826 | $ | 53,133 | $ | 32,084 | |||||||||||||||||||
| 0.60% | 0.60% | 0.60% | 0.60% | 0.62% | ||||||||||||||||||||||||
| 0.68% | 0.69% | 0.70% | 0.70% | 0.71% | ||||||||||||||||||||||||
| 3.17% | 3.24% | 3.33% | 3.50% | 3.76% | ||||||||||||||||||||||||
| 3.09% | 3.15% | 3.23% | 3.40% | 3.67% | ||||||||||||||||||||||||
| 13% | 16% | 17% | 15% | 11% | ||||||||||||||||||||||||
75
Table of Contents
Financial highlights
DelawareTax-Free Minnesota Intermediate Fund Class A
Selected data for each share of the Fund outstanding throughout each period were as follows:
Net asset value, beginning of period |
Income (loss) from investment operations: |
Net investment income1 |
Net realized and unrealized gain (loss) |
Total from investment operations |
Less dividends and distributions from: |
Net investment income |
Net realized gain |
Total dividends and distributions |
Net asset value, end of period |
Total return2 |
Ratios and supplemental data: |
Net assets, end of period (000 omitted) |
Ratio of expenses to average net assets |
Ratio of expenses to average net assets prior to fees waived |
Ratio of net investment income to average net assets |
Ratio of net investment income to average net assets prior to fees waived |
Portfolio turnover |
| 1 | The average shares outstanding have been applied for per share information. |
| 2 | Total return is based on the change in net asset value of a share during the period and assumes reinvestment of dividends and distributions at net asset value and does not reflect the impact of a sales charge. Total return during all of the periods reflects waivers by the manager and/or distributor. Performance would have been lower had the waivers not been in effect. |
See accompanying notes, which are an integral part of the financial statements.
76
Table of Contents
| Year ended | ||||||||||||||||||||||||||||
| 8/31/19 | 8/31/18 | 8/31/17 | 8/31/16 | 8/31/15 | ||||||||||||||||||||||||
| $ | 10.82 | $ | 11.17 | $ | 11.44 | $ | 11.22 | $ | 11.32 | |||||||||||||||||||
| 0.31 | 0.30 | 0.31 | 0.33 | 0.34 | ||||||||||||||||||||||||
| 0.43 | (0.31 | ) | (0.25 | ) | 0.22 | (0.10 | ) | |||||||||||||||||||||
|
|
|
|
|
|
|
|
|
| |||||||||||||||||||
| 0.74 | (0.01 | ) | 0.06 | 0.55 | 0.24 | |||||||||||||||||||||||
|
|
|
|
|
|
|
|
|
| |||||||||||||||||||
| (0.31 | ) | (0.30 | ) | (0.31 | ) | (0.33 | ) | (0.34 | ) | |||||||||||||||||||
| — | (0.04 | ) | (0.02 | ) | — | — | ||||||||||||||||||||||
|
|
|
|
|
|
|
|
|
| |||||||||||||||||||
| (0.31 | ) | (0.34 | ) | (0.33 | ) | (0.33 | ) | (0.34 | ) | |||||||||||||||||||
|
|
|
|
|
|
|
|
|
| |||||||||||||||||||
| $ | 11.25 | $ | 10.82 | $ | 11.17 | $ | 11.44 | $ | 11.22 | |||||||||||||||||||
|
|
|
|
|
|
|
|
|
| |||||||||||||||||||
| 7.00% | (0.01%) | 0.55% | 4.98% | 2.12% | ||||||||||||||||||||||||
| $ | 55,918 | $ | 59,284 | $ | 68,934 | $ | 79,730 | $ | 84,663 | |||||||||||||||||||
| 0.71% | 0.79% | 0.84% | 0.84% | 0.85% | ||||||||||||||||||||||||
| 1.04% | 1.00% | 0.99% | 0.97% | 0.98% | ||||||||||||||||||||||||
| 2.87% | 2.77% | 2.79% | 2.92% | 2.98% | ||||||||||||||||||||||||
| 2.54% | 2.56% | 2.64% | 2.79% | 2.85% | ||||||||||||||||||||||||
| 19% | 17% | 22% | 14% | 14% | ||||||||||||||||||||||||
77
Table of Contents
Financial highlights
DelawareTax-Free Minnesota Intermediate Fund Class C
Selected data for each share of the Fund outstanding throughout each period were as follows:
Net asset value, beginning of period |
Income (loss) from investment operations: |
Net investment income1 |
Net realized and unrealized gain (loss) |
Total from investment operations |
Less dividends and distributions from: |
Net investment income |
Net realized gain |
Total dividends and distributions |
Net asset value, end of period |
Total return2 |
Ratios and supplemental data: |
Net assets, end of period (000 omitted) |
Ratio of expenses to average net assets |
Ratio of expenses to average net assets prior to fees waived |
Ratio of net investment income to average net assets |
Ratio of net investment income to average net assets prior to fees waived |
Portfolio turnover |
| 1 | The average shares outstanding have been applied for per share information. |
| 2 | Total return is based on the change in net asset value of a share during the period and assumes reinvestment of dividends and distributions at net asset value and does not reflect the impact of a sales charge. Total return during all of the periods shown reflects waivers by the manager. Performance would have been lower had the waivers not been in effect. |
See accompanying notes, which are an integral part of the financial statements.
78
Table of Contents
| Year ended | ||||||||||||||||||||||||||||
| 8/31/19 | 8/31/18 | 8/31/17 | 8/31/16 | 8/31/15 | ||||||||||||||||||||||||
| $ | 10.84 | $ | 11.19 | $ | 11.47 | $ | 11.24 | $ | 11.35 | |||||||||||||||||||
| 0.22 | 0.21 | 0.22 | 0.24 | 0.24 | ||||||||||||||||||||||||
| 0.43 | (0.31 | ) | (0.26 | ) | 0.23 | (0.11 | ) | |||||||||||||||||||||
|
|
|
|
|
|
|
|
|
| |||||||||||||||||||
| 0.65 | (0.10 | ) | (0.04 | ) | 0.47 | 0.13 | ||||||||||||||||||||||
|
|
|
|
|
|
|
|
|
| |||||||||||||||||||
| (0.22 | ) | (0.21 | ) | (0.22 | ) | (0.24 | ) | (0.24 | ) | |||||||||||||||||||
| — | (0.04 | ) | (0.02 | ) | — | — | ||||||||||||||||||||||
|
|
|
|
|
|
|
|
|
| |||||||||||||||||||
| (0.22 | ) | (0.25 | ) | (0.24 | ) | (0.24 | ) | (0.24 | ) | |||||||||||||||||||
|
|
|
|
|
|
|
|
|
| |||||||||||||||||||
| $ | 11.27 | $ | 10.84 | $ | 11.19 | $ | 11.47 | $ | 11.24 | |||||||||||||||||||
|
|
|
|
|
|
|
|
|
| |||||||||||||||||||
| 6.09% | (0.86%) | (0.39%) | 4.17% | 1.16% | ||||||||||||||||||||||||
| $ | 7,167 | $ | 8,558 | $ | 11,885 | $ | 13,315 | $ | 11,740 | |||||||||||||||||||
| 1.56% | 1.64% | 1.69% | 1.69% | 1.70% | ||||||||||||||||||||||||
| 1.79% | 1.75% | 1.74% | 1.72% | 1.73% | ||||||||||||||||||||||||
| 2.02% | 1.92% | 1.94% | 2.07% | 2.13% | ||||||||||||||||||||||||
| 1.79% | 1.81% | 1.89% | 2.04% | 2.10% | ||||||||||||||||||||||||
| 19% | 17% | 22% | 14% | 14% | ||||||||||||||||||||||||
79
Table of Contents
Financial highlights
DelawareTax-Free Minnesota Intermediate Fund Institutional Class
Selected data for each share of the Fund outstanding throughout each period were as follows:
Net asset value, beginning of period |
Income (loss) from investment operations: |
Net investment income1 |
Net realized and unrealized gain (loss) |
Total from investment operations |
Less dividends and distributions from: |
Net investment income |
Net realized gain |
Total dividends and distributions |
Net asset value, end of period |
Total return2 |
Ratios and supplemental data: |
Net assets, end of period (000 omitted) |
Ratio of expenses to average net assets |
Ratio of expenses to average net assets prior to fees waived |
Ratio of net investment income to average net assets |
Ratio of net investment income to average net assets prior to fees waived |
Portfolio turnover |
| 1 | The average shares outstanding have been applied for per share information. |
| 2 | Total return is based on the change in net asset value of a share during the period and assumes reinvestment of dividends and distributions at net asset value. Total return during all of the periods shown reflects a waiver by the manager. Performance would have been lower had the waiver not been in effect. |
See accompanying notes, which are an integral part of the financial statements.
80
Table of Contents
| Year ended | ||||||||||||||||||||||||||||
| 8/31/19 | 8/31/18 | 8/31/17 | 8/31/16 | 8/31/15 | ||||||||||||||||||||||||
| $ | 10.83 | $ | 11.17 | $ | 11.45 | $ | 11.22 | $ | 11.33 | |||||||||||||||||||
| 0.33 | 0.32 | 0.33 | 0.35 | 0.35 | ||||||||||||||||||||||||
| 0.42 | (0.30 | ) | (0.26 | ) | 0.23 | (0.11 | ) | |||||||||||||||||||||
|
|
|
|
|
|
|
|
|
| |||||||||||||||||||
| 0.75 | 0.02 | 0.07 | 0.58 | 0.24 | ||||||||||||||||||||||||
|
|
|
|
|
|
|
|
|
| |||||||||||||||||||
| (0.33 | ) | (0.32 | ) | (0.33 | ) | (0.35 | ) | (0.35 | ) | |||||||||||||||||||
| — | (0.04 | ) | (0.02 | ) | — | — | ||||||||||||||||||||||
|
|
|
|
|
|
|
|
|
| |||||||||||||||||||
| (0.33 | ) | (0.36 | ) | (0.35 | ) | (0.35 | ) | (0.35 | ) | |||||||||||||||||||
|
|
|
|
|
|
|
|
|
| |||||||||||||||||||
| $ | 11.25 | $ | 10.83 | $ | 11.17 | $ | 11.45 | $ | 11.22 | |||||||||||||||||||
|
|
|
|
|
|
|
|
|
| |||||||||||||||||||
| 7.06% | 0.23% | 0.61% | 5.22% | 2.18% | ||||||||||||||||||||||||
| $ | 17,718 | $ | 11,470 | $ | 18,800 | $ | 12,694 | $ | 4,402 | |||||||||||||||||||
| 0.56% | 0.64% | 0.69% | 0.69% | 0.70% | ||||||||||||||||||||||||
| 0.79% | 0.75% | 0.74% | 0.72% | 0.73% | ||||||||||||||||||||||||
| 3.02% | 2.92% | 2.94% | 3.07% | 3.13% | ||||||||||||||||||||||||
| 2.79% | 2.81% | 2.89% | 3.04% | 3.10% | ||||||||||||||||||||||||
| 19% | 17% | 22% | 14% | 14% | ||||||||||||||||||||||||
81
Table of Contents
Financial highlights
Delaware Minnesota High-Yield Municipal Bond Fund Class A
Selected data for each share of the Fund outstanding throughout each period were as follows:
Net asset value, beginning of period |
Income (loss) from investment operations: |
Net investment income1 |
Net realized and unrealized gain (loss) |
Total from investment operations |
Less dividends and distributions from: |
Net investment income |
Total dividends and distributions |
Net asset value, end of period |
Total return2 |
Ratios and supplemental data: |
Net assets, end of period (000 omitted) |
Ratio of expenses to average net assets |
Ratio of expenses to average net assets prior to fees waived |
Ratio of net investment income to average net assets |
Ratio of net investment income to average net assets prior to fees waived |
Portfolio turnover |
| 1 | The average shares outstanding have been applied for per share information. |
| 2 | Total return is based on the change in net asset value of a share during the period and assumes reinvestment of dividends and distributions at net asset value and does not reflect the impact of a sales charge. Total return during all of the periods shown reflects a waiver by the manager. Performance would have been lower had the waiver not been in effect. |
See accompanying notes, which are an integral part of the financial statements.
82
Table of Contents
| Year ended | ||||||||||||||||||||||||||||
| 8/31/19 | 8/31/18 | 8/31/17 | 8/31/16 | 8/31/15 | ||||||||||||||||||||||||
| $ | 10.66 | $ | 10.88 | $ | 11.13 | $ | 10.84 | $ | 10.88 | |||||||||||||||||||
| 0.32 | 0.32 | 0.33 | 0.36 | 0.38 | ||||||||||||||||||||||||
| 0.55 | (0.22 | ) | (0.25 | ) | 0.29 | (0.04 | ) | |||||||||||||||||||||
|
|
|
|
|
|
|
|
|
| |||||||||||||||||||
| 0.87 | 0.10 | 0.08 | 0.65 | 0.34 | ||||||||||||||||||||||||
|
|
|
|
|
|
|
|
|
| |||||||||||||||||||
| (0.32 | ) | (0.32 | ) | (0.33 | ) | (0.36 | ) | (0.38 | ) | |||||||||||||||||||
|
|
|
|
|
|
|
|
|
| |||||||||||||||||||
| (0.32 | ) | (0.32 | ) | (0.33 | ) | (0.36 | ) | (0.38 | ) | |||||||||||||||||||
|
|
|
|
|
|
|
|
|
| |||||||||||||||||||
| $ | 11.21 | $ | 10.66 | $ | 10.88 | $ | 11.13 | $ | 10.84 | |||||||||||||||||||
| 8.33 | % | 0.95 | % | 0.84 | % | 6.12 | % | 3.20 | % | |||||||||||||||||||
| $ | 103,487 | $ | 98,980 | $ | 98,491 | $ | 121,168 | $ | 122,618 | |||||||||||||||||||
| 0.89% | 0.89% | 0.89% | 0.89% | 0.91% | ||||||||||||||||||||||||
| 0.99% | 0.99% | 0.99% | 0.98% | 1.01% | ||||||||||||||||||||||||
| 2.97% | 2.98% | 3.08% | 3.23% | 3.52% | ||||||||||||||||||||||||
| 2.87% | 2.88% | 2.98% | 3.14% | 3.42% | ||||||||||||||||||||||||
| 12% | 14% | 19% | 15% | 16% | ||||||||||||||||||||||||
83
Table of Contents
Financial highlights
Delaware Minnesota High-Yield Municipal Bond Fund Class C
Selected data for each share of the Fund outstanding throughout each period were as follows:
Net asset value, beginning of period |
Income (loss) from investment operations: |
Net investment income1 |
Net realized and unrealized gain (loss) |
Total from investment operations |
Less dividends and distributions from: |
Net investment income |
Total dividends and distributions |
Net asset value, end of period |
Total return2 |
Ratios and supplemental data: |
Net assets, end of period (000 omitted) |
Ratio of expenses to average net assets |
Ratio of expenses to average net assets prior to fees waived |
Ratio of net investment income to average net assets |
Ratio of net investment income to average net assets prior to fees waived |
Portfolio turnover |
| 1 | The average shares outstanding have been applied for per share information. |
| 2 | Total return is based on the change in net asset value of a share during the period and assumes reinvestment of dividends and distributions at net asset value and does not reflect the impact of a sales charge. Total return during all of the periods shown reflects a waiver by the manager. Performance would have been lower had the waiver not been in effect. |
See accompanying notes, which are an integral part of the financial statements.
84
Table of Contents
| Year ended | ||||||||||||||||||||||||||||||||||||||
| 8/31/19 | 8/31/18 | 8/31/17 | 8/31/16 | 8/31/15 | ||||||||||||||||||||||||||||||||||
| $ | 10.68 | $ | 10.90 | $ | 11.15 | $ | 10.87 | $ | 10.90 | |||||||||||||||||||||||||||||
| 0.24 | 0.24 | 0.25 | 0.27 | 0.30 | ||||||||||||||||||||||||||||||||||
| 0.55 | (0.22 | ) | (0.25 | ) | 0.29 | (0.03 | ) | |||||||||||||||||||||||||||||||
|
|
|
|
|
|
|
|
|
| |||||||||||||||||||||||||||||
| 0.79 | 0.02 | — | 0.56 | 0.27 | ||||||||||||||||||||||||||||||||||
|
|
|
|
|
|
|
|
|
| |||||||||||||||||||||||||||||
| (0.24 | ) | (0.24 | ) | (0.25 | ) | (0.28 | ) | (0.30 | ) | |||||||||||||||||||||||||||||
|
|
|
|
|
|
|
|
|
| |||||||||||||||||||||||||||||
| (0.24 | ) | (0.24 | ) | (0.25 | ) | (0.28 | ) | (0.30 | ) | |||||||||||||||||||||||||||||
|
|
|
|
|
|
|
|
|
| |||||||||||||||||||||||||||||
| $ | 11.23 | $ | 10.68 | $ | 10.90 | $ | 11.15 | $ | 10.87 | |||||||||||||||||||||||||||||
|
|
|
|
|
|
|
|
|
| |||||||||||||||||||||||||||||
| 7.51% | 0.19% | 0.09% | 5.22% | 2.53% | ||||||||||||||||||||||||||||||||||
| $ | 21,059 | $ | 21,651 | $ | 32,223 | $ | 35,751 | $ | 32,174 | |||||||||||||||||||||||||||||
| 1.64% | 1.64% | 1.64% | 1.64% | 1.66% | ||||||||||||||||||||||||||||||||||
| 1.74% | 1.74% | 1.74% | 1.73% | 1.76% | ||||||||||||||||||||||||||||||||||
| 2.22% | 2.23% | 2.33% | 2.48% | 2.77% | ||||||||||||||||||||||||||||||||||
| 2.12% | 2.13% | 2.23% | 2.39% | 2.67% | ||||||||||||||||||||||||||||||||||
| 12% | 14% | 19% | 15% | 16% | ||||||||||||||||||||||||||||||||||
85
Table of Contents
Financial highlights
Delaware Minnesota High-Yield Municipal Bond Fund Institutional Class
Selected data for each share of the Fund outstanding throughout each period were as follows:
Net asset value, beginning of period |
Income (loss) from investment operations: |
Net investment income1 |
Net realized and unrealized gain (loss) |
Total from investment operations |
Less dividends and distributions from: |
Net investment income |
Total dividends and distributions |
Net asset value, end of period |
Total return2 |
Ratios and supplemental data: |
Net assets, end of period (000 omitted) |
Ratio of expenses to average net assets |
Ratio of expenses to average net assets prior to fees waived |
Ratio of net investment income to average net assets |
Ratio of net investment income to average net assets prior to fees waived |
Portfolio turnover |
| 1 | The average shares outstanding have been applied for per share information. |
| 2 | Total return is based on the change in net asset value of a share during the period and assumes reinvestment of dividends and distributions at net asset value. Total return during all of the periods shown reflects a waiver by the manager. Performance would have been lower had the waiver not been in effect. |
See accompanying notes, which are an integral part of the financial statements.
86
Table of Contents
Year ended | ||||||||||||||||||||||||||||||||||||||
| 8/31/19 | 8/31/18 | 8/31/17 | 8/31/16 | 8/31/15 | ||||||||||||||||||||||||||||||||||
| $ | 10.66 | $ | 10.87 | $ | 11.12 | $ | 10.84 | $ | 10.88 | |||||||||||||||||||||||||||||
| 0.35 | 0.35 | 0.36 | 0.38 | 0.41 | ||||||||||||||||||||||||||||||||||
| 0.54 | (0.21 | ) | (0.25 | ) | 0.29 | (0.04 | ) | |||||||||||||||||||||||||||||||
|
|
|
|
|
|
|
|
|
| |||||||||||||||||||||||||||||
| 0.89 | 0.14 | 0.11 | 0.67 | 0.37 | ||||||||||||||||||||||||||||||||||
|
|
|
|
|
|
|
|
|
| |||||||||||||||||||||||||||||
| (0.35 | ) | (0.35 | ) | (0.36 | ) | (0.39 | ) | (0.41 | ) | |||||||||||||||||||||||||||||
|
|
|
|
|
|
|
|
|
| |||||||||||||||||||||||||||||
| (0.35 | ) | (0.35 | ) | (0.36 | ) | (0.39 | ) | (0.41 | ) | |||||||||||||||||||||||||||||
|
|
|
|
|
|
|
|
|
| |||||||||||||||||||||||||||||
| $ | 11.20 | $ | 10.66 | $ | 10.87 | $ | 11.12 | $ | 10.84 | |||||||||||||||||||||||||||||
|
|
|
|
|
|
|
|
|
| |||||||||||||||||||||||||||||
| 8.50% | 1.30% | 1.09% | 6.28% | 3.46% | ||||||||||||||||||||||||||||||||||
| $ | 75,155 | $ | 53,501 | $ | 44,805 | $ | 31,206 | $ | 14,841 | |||||||||||||||||||||||||||||
| 0.64% | 0.64% | 0.64% | 0.64% | 0.66% | ||||||||||||||||||||||||||||||||||
| 0.74% | 0.74% | 0.74% | 0.73% | 0.76% | ||||||||||||||||||||||||||||||||||
| 3.22% | 3.23% | 3.33% | 3.48% | 3.77% | ||||||||||||||||||||||||||||||||||
| 3.12% | 3.13% | 3.23% | 3.39% | 3.67% | ||||||||||||||||||||||||||||||||||
| 12% | 14% | 19% | 15% | 16% | ||||||||||||||||||||||||||||||||||
87
Table of Contents
| ||
Delaware Funds® by Macquarie Minnesota municipal bond funds | August 31, 2019 |
Voyageur Mutual Funds is organized as a Delaware statutory trust and offers five series: Delaware Minnesota High-Yield Municipal Bond Fund, Delaware National High-Yield Municipal Bond Fund, DelawareTax-Free California Fund, DelawareTax-Free Idaho Fund, and DelawareTax-Free New York Fund. VoyageurTax-Free Funds is organized as a Delaware statutory trust and offers DelawareTax-Free Minnesota Fund. Voyageur IntermediateTax-Free Funds is organized as a Delaware statutory trust and offers DelawareTax-Free Minnesota Intermediate Fund. Voyageur Mutual Funds, VoyageurTax-Free Funds, and Voyageur IntermediateTax-Free Funds are each referred to as a Trust, or collectively, as the Trusts. These financial statements and the related notes pertain to DelawareTax-Free Minnesota Fund, DelawareTax-Free Minnesota Intermediate Fund, and Delaware Minnesota High-Yield Municipal Bond Fund (each a Fund, or collectively, the Funds). Each Fund is anopen-end investment company. The Funds are considered diversified under the Investment Company Act of 1940, as amended (1940 Act), and offer Class A, Class C, and Institutional Class shares. Class A shares are sold with a maximumfront-end sales charge of 4.50% for DelawareTax-Free Minnesota Fund and Delaware Minnesota High-Yield Municipal Bond Fund, and 2.75% for DelawareTax-Free Minnesota Intermediate Fund. Class A share purchases of $1,000,000 or more will incur a contingent deferred sales charge (CDSC) instead of afront-end sales charge of 1.00%, which will be incurred if redeemed during the first year, and 0.50% during the second year for DelawareTax-Free Minnesota Fund and Delaware Minnesota High-Yield Municipal Bond Fund, and 0.75% for DelawareTax-Free Minnesota Intermediate Fund, if redeemed within the first year, provided that Delaware Distributors, L.P. (DDLP) paid a financial advisor a commission on the purchase of those shares. Class C shares are sold with a CDSC of 1.00%, which will be incurred if redeemed during the first 12 months. Institutional Class shares are not subject to a sales charge and are offered for sale exclusively to certain eligible investors.
The investment objective of DelawareTax-Free Minnesota Fund is to seek as high a level of current income exempt from federal income tax and from Minnesota state personal income taxes as is consistent with preservation of capital.
The investment objective of DelawareTax-Free Minnesota Intermediate Fund is to seek to provide investors with preservation of capital and, secondarily, current income exempt from federal income tax and Minnesota state personal income taxes, by maintaining a dollar-weighted average effective portfolio maturity of 10 years or less.
The investment objective of Delaware Minnesota High-Yield Municipal Bond Fund is to seek a high level of current income exempt from federal income tax and from Minnesota state personal income taxes, primarily through investment in medium- and lower-grade municipal obligations.
1. Significant Accounting Policies
Each Fund follows accounting and reporting guidance under Financial Accounting Standards Board (FASB) Accounting Standards Codification Topic 946, Financial Services — Investment Companies. The following accounting policies are in accordance with US generally accepted accounting principles (US GAAP) and are consistently followed by the Funds.
Security Valuation— Debt securities are valued based upon valuations provided by an independent pricing service or broker and reviewed by management. To the extent current market prices are not available, the pricing service may take into account developments related to the specific security, as well
88
Table of Contents
as transactions in comparable securities. Valuations for fixed income securities utilize matrix systems, which reflect such factors as security prices, yields, maturities, and ratings, and are supplemented by dealer and exchange quotations. Generally, other securities and assets for which market quotations are not readily available are valued at fair value as determined in good faith under the direction of each Trust’s Board of Trustees (each, a Board, or collectively, the Boards). In determining whether market quotations are readily available or fair valuation will be used, various factors will be taken into consideration, such as market closures or suspension of trading in a security. Restricted securities are valued at fair value using methods approved by the Boards.
Federal Income Taxes— No provision for federal income taxes has been made as each Fund intends to continue to qualify for federal income tax purposes as a regulated investment company under Subchapter M of the Internal Revenue Code of 1986, as amended, and make the requisite distributions to shareholders. Each Fund evaluates tax positions taken or expected to be taken in the course of preparing each Fund’s tax returns to determine whether the tax positions are“more-likely-than-not” of being sustained by the applicable tax authority. Tax positions not deemed to meet the“more-likely-than-not” threshold are recorded as a tax benefit or expense in the current year. Management has analyzed each Fund’s tax positions taken or expected to be taken on each Fund’s federal income tax returns through the year ended Aug. 31, 2019 and for all open tax years (years ended Aug. 31, 2016–Aug. 31, 2018), and has concluded that no provision for federal income tax is required in each Fund’s financial statements. If applicable, each Fund recognizes interest accrued on unrecognized tax benefits in interest expense and penalties in “Other expenses” on the “Statements of operations.” During the year ended Aug. 31, 2019, the Funds did not incur any interest or tax penalties.
Class Accounting— Investment income and common expenses are allocated to the various classes of each Fund on the basis of “settled shares” of each class in relation to the net assets of each Fund. Realized and unrealized gain (loss) on investments are allocated to the various classes of each Fund on the basis of daily net assets of each class. Distribution expenses relating to a specific class are charged directly to that class.
Use of Estimates— The preparation of financial statements in conformity with US GAAP requires management to make estimates and assumptions that affect the fair value of investments, the reported amounts of assets and liabilities and disclosure of contingent assets and liabilities at the date of the financial statements, and the reported amounts of revenues and expenses during the reporting period. Actual results could differ from those estimates and the differences could be material.
Other— Expenses directly attributable to a Fund are charged directly to that Fund. Other expenses common to various funds within the Delaware Funds® by Macquarie (Delaware Funds) are generally allocated among such funds on the basis of average net assets. Management fees and certain other expenses are paid monthly. Security transactions are recorded on the date the securities are purchased or sold (trade date) for financial reporting purposes. Costs used in calculating realized gains and losses on the sale of investment securities are those of the specific securities sold. Interest income is recorded on the accrual basis. Discounts and premiums on debt securities are accreted or amortized to interest income, respectively, over the lives of the respective securities using the effective interest method. Each Fund declares dividends daily from net investment income and pays the dividends monthly and declares and pays distributions from net realized gain on investments, if any, annually. Each Fund may
89
Table of Contents
Notes to financial statements
Delaware Funds® by Macquarie Minnesota municipal bond funds
1. Significant Accounting Policies (continued)
distribute more frequently, if necessary for tax purposes. Dividends and distributions, if any, are recorded on theex-dividend date.
Each Fund receives earnings credits from its custodian when positive cash balances are maintained, which may be used to offset custody fees. The expenses paid under this arrangement are included on the “Statements of operations” under “Custodian fees” with the corresponding expenses offset included under “Less expenses paid indirectly.” For the year ended Aug. 31, 2019, each Fund earned the following amounts under this arrangement:
| Delaware Tax-Free | Delaware Minnesota | |||||
| Delaware Tax-Free | Minnesota | High-Yield Municipal | ||||
| Minnesota Fund | Intermediate Fund | Bond Fund | ||||
| $6,154 | $557 | $822 |
Each Fund receives earnings credits from its transfer agent when positive cash balances are maintained, which may be used to offset transfer agent fees. If the amount earned is greater than $1, the expenses paid under this arrangement are included on the “Statements of operations” under “Dividend disbursing and transfer agent fees and expenses” with the corresponding expenses offset included under “Less expenses paid indirectly.” For the year ended Aug. 31, 2019, each Fund earned the following amounts under this arrangement:
| Delaware Tax-Free | Delaware Minnesota | |||||
| Delaware Tax-Free | Minnesota | High-Yield Municipal | ||||
| Minnesota Fund | Intermediate Fund | Bond Fund | ||||
| $411 | $75 | $160 |
2. Investment Management, Administration Agreements, and Other Transactions with Affiliates
In accordance with the terms of its respective investment management agreement, each Fund pays Delaware Management Company (DMC), a series of Macquarie Investment Management Business Trust and the investment manager, an annual fee which is calculated daily and paid monthly based on each Fund’s average daily net assets as follows:
| Delaware Tax-Free Minnesota Fund | Delaware Tax-Free Minnesota Intermediate Fund | Delaware Minnesota High-Yield Municipal Bond Fund | ||||
On the first $500 million | 0.550% | 0.500% | 0.550% | |||
On the next $500 million | 0.500% | 0.475% | 0.500% | |||
On the next $1.5 billion | 0.450% | 0.450% | 0.450% | |||
In excess of $2.5 billion | 0.425% | 0.425% | 0.425% |
DMC has contractually agreed to waive that portion, if any, of its management fees and/or pay/reimburse each Fund to the extent necessary to ensure that total annual operating expenses (excluding any distribution and service(12b-1) fees, taxes, interest, acquired fund fees and expenses, inverse floater program expenses, short sale, dividend and interest expenses, brokerage fees, certain insurance costs, and nonroutine expenses or costs, including, but not limited to, those relating to reorganizations, litigation, conducting shareholder meetings, and liquidations), do not exceed the
90
Table of Contents
following percentage of each Fund’s average daily net assets from Sept. 1, 2018 through Aug. 31, 2019.* These waivers and reimbursements apply only to expenses paid directly by each Fund and may only be terminated by agreement of DMC and each Fund. The waivers and reimbursements are accrued daily and received monthly.
| Delaware | Delaware Tax-Free | Delaware Minnesota | ||||
| Tax-Free | Minnesota | High-Yield Municipal | ||||
| Minnesota Fund | Intermediate Fund | Bond Fund | ||||
Operating expense limitation as a percentage of average daily net assets | 0.60% | 0.56% | 0.64% |
Delaware Investments Fund Services Company (DIFSC), an affiliate of DMC, provides fund accounting and financial administration oversight services to each Fund. For these services, DIFSC’s fees are calculated daily and paid monthly based on the aggregate daily net assets of all funds within the Delaware Funds at the following annual rates: 0.00475% of the first $35 billion; 0.0040% of the next $10 billion; and 0.0025% of aggregate average daily net assets in excess of $45 billion (Total Fee). Each fund in the Delaware Funds pays a minimum of $4,000, which, in aggregate, is subtracted from the Total Fee. Each fund then pays its portion of the remainder of the Total Fee on a relative net asset value (NAV) basis. These amounts are included on the “Statements of operations” under “Accounting and administration expenses.” For the year ended Aug. 31, 2019, each Fund was charged for these services as follows:
| Delaware | Delaware Tax-Free | Delaware Minnesota | ||||
| Tax-Free | Minnesota | High-Yield Municipal | ||||
| Minnesota Fund | Intermediate Fund | Bond Fund | ||||
| $24,864 | $6,928 | $10,757 |
DIFSC is also the transfer agent and dividend disbursing agent of the Funds. For these services, DIFSC’s fees are calculated daily and paid monthly based on the aggregate daily net assets of the retail funds within the Delaware Funds at the following annual rates: 0.014% of the first $20 billion; 0.011% of the next $5 billion; 0.007% of the next $5 billion; and 0.005% of the next $20 billion; and 0.0025% of average daily net assets in excess of $50 billion. The fees payable to DIFSC under the shareholder services agreement described above are allocated among all retail funds in the Delaware Funds on a relative NAV basis. These amounts are included on the “Statements of operations” under “Dividend disbursing and transfer agent fees and expenses.” For the year ended Aug. 31, 2019, each Fund was charged for these services as follows:
| Delaware | Delaware Tax-Free | Delaware Minnesota | ||||
| Tax-Free | Minnesota | High-Yield Municipal | ||||
| Minnesota Fund | Intermediate Fund | Bond Fund | ||||
| $45,872 | $6,381 | $14,890 |
91
Table of Contents
Notes to financial statements
Delaware Funds® by Macquarie Minnesota municipal bond funds
2. Investment Management, Administration Agreements, and Other Transactions with Affiliates (continued)
Pursuant to asub-transfer agency agreement between DIFSC and BNY Mellon Investment Servicing (US) Inc. (BNYMIS), BNYMIS provides certainsub-transfer agency services to each Fund.Sub-transfer agency fees are paid by each Fund and are also included on the “Statements of operations” under “Dividend disbursing and transfer agent fees and expenses.” The fees that are calculated daily and paid as invoices are received on a monthly or quarterly basis.
Pursuant to a distribution agreement and distribution plan, each Fund pays DDLP, the distributor and an affiliate of DMC, an annual12b-1 fee of 0.25% of the average daily net assets of the Class A shares and 1.00% of the average daily net assets of the Class C shares. DDLP has contracted to waive DelawareTax-Free Minnesota Intermediate Fund’s Class A shares12b-1 fee to 0.15% of average daily net assets from Sept. 1, 2018 through Aug. 31, 2019.** The fees are calculated daily and paid monthly. Institutional Class shares do not pay12b-1 fees.
As provided in the investment management agreement, each Fund bears a portion of the cost of certain resources shared with DMC, including the cost of internal personnel of DMC and/or its affiliates that provide legal, tax, and regulatory reporting services to each Fund. These amounts are included on the “Statements of operations” under “Legal fees.” For the year ended Aug. 31, 2019, each Fund was charged for internal legal, tax, and regulatory reporting services provided by DMC and/or its affiliates’ employees as follows:
| Delaware | Delaware Tax-Free | Delaware Minnesota | ||||
| Tax-Free | Minnesota | High-Yield Municipal | ||||
| Minnesota Fund | Intermediate Fund | Bond Fund | ||||
| $15,228 | $2,187 | $4,948 |
For the year ended Aug. 31, 2019, DDLP earned commissions on sales of Class A shares for each Fund as follows:
| Delaware | Delaware Tax-Free | Delaware Minnesota | ||||
| Tax-Free | Minnesota | High-Yield Municipal | ||||
| Minnesota Fund | Intermediate Fund | Bond Fund | ||||
| $20,347 | $4,240 | $9,705 |
For the year ended Aug. 31, 2019, DDLP received gross CDSC commissions on redemptions of each Fund’s Class A and Class C shares, respectively, and these commissions were entirely used to offset upfront commissions previously paid by DDLP to broker/dealers on sales of those shares. The amounts received were as follows:
| Delaware | Delaware Tax-Free | Delaware Minnesota | |||||||||||||
| Tax-Free | Minnesota | High-Yield Municipal | |||||||||||||
| Minnesota Fund | Intermediate Fund | Bond Fund | |||||||||||||
Class A | $ | 1,061 | $ | — | $ | — | |||||||||
Class C | 1,081 | 194 | 2,911 | ||||||||||||
92
Table of Contents
Trustees’ fees include expenses accrued by each Fund for each Trustee’s retainer and meeting fees. Certain officers of DMC, DIFSC, and DDLP are officers and/or Trustees of the Trusts. These officers and Trustees are paid no compensation by the Funds.
Cross trades for the year ended Aug. 31, 2019, were executed by each Fund pursuant to procedures adopted by the Boards designed to ensure compliance with Rule17a-7 under the 1940 Act. Cross trading is the buying or selling of portfolio securities between funds of investment companies, or between a fund of an investment company and another entity, that are or could be considered affiliates by virtue of having a common investment advisor (or affiliated investment advisors), common directors/trustees and/or common officers. At their regularly scheduled meetings, the Boards review such transactions for compliance with the procedures adopted by the Boards. Pursuant to these procedures, for the year ended Aug. 31, 2019, the Funds engaged in the following Rule17a-7 securities purchases and securities sales, which resulted in net realized gains (losses) as follows:
| Delaware | Delaware Tax-Free | Delaware Minnesota | ||||||||||
| Tax-Free | Minnesota | High-Yield Municipal | ||||||||||
| Minnesota Fund | Intermediate Fund | Bond Fund | ||||||||||
Purchases | $ | 13,471,671 | $5,878,927 | $9,560,504 | ||||||||
Sales | 5,720,495 | 9,275,841 | 11,656,149 | |||||||||
Net realized gains (losses) | (24,941 | ) | 13,949 | (116,537 | ) | |||||||
*For DelawareTax-Free Minnesota Fund and Delaware Minnesota High-Yield Municipal Bond Fund, the aggregate contractual waiver period covering this report is from Dec. 29, 2017 through Dec. 28, 2019. For DelawareTax-Free Minnesota Intermediate Fund, the aggregate contractual waiver period covering this report is from April��1, 2018 through Dec. 28, 2019.
**For DelawareTax-Free Minnesota Intermediate Fund Class A shares, the aggregate contractual waiver period covering this report is from Dec. 29, 2017 through Dec. 28, 2019.
3. Investments
For the year ended Aug. 31, 2019, each Fund made purchases and sales of investment securities other than short-term investments as follows:
| Delaware | Delaware Tax-Free | Delaware Minnesota | ||||||||||
| Tax-Free | Minnesota | High-Yield Municipal | ||||||||||
| Minnesota Fund | Intermediate Fund | Bond Fund | ||||||||||
Purchases | $ | 117,050,659 | $14,601,815 | $37,830,477 | ||||||||
Sales | 73,153,557 | 16,818,305 | 21,643,593 | |||||||||
93
Table of Contents
Notes to financial statements
Delaware Funds® by Macquarie Minnesota municipal bond funds
3. Investments (continued)
The tax cost of investments includes adjustments to net unrealized appreciation (depreciation) which may not necessarily be the final tax cost basis adjustments, but approximate the tax basis unrealized gains and losses that may be realized and distributed to shareholders. At Aug. 31, 2019, the cost and unrealized appreciation (depreciation) of investments for federal income tax purposes for each Fund were as follows:
| Delaware | Delaware Tax-Free | Delaware Minnesota | ||||||||||
| Tax-Free | Minnesota | High-Yield Municipal | ||||||||||
| Minnesota Fund | Intermediate Fund | Bond Fund | ||||||||||
Cost of investments | $ | 577,717,653 | $ | 76,244,130 | $ | 189,390,637 | ||||||
|
|
|
|
|
| |||||||
Aggregate unrealized appreciation of investments | $ | 35,567,984 | $ | 4,569,465 | $ | 11,716,394 | ||||||
Aggregate unrealized depreciation of investments | (468,690 | ) | (22 | ) | (307,281 | ) | ||||||
|
|
|
|
|
| |||||||
Net unrealized appreciation of investments | $ | 35,099,294 | $ | 4,569,443 | $ | 11,409,113 | ||||||
|
|
|
|
|
| |||||||
US GAAP defines fair value as the price that each Fund would receive to sell an asset or pay to transfer a liability in an orderly transaction between market participants at the measurement date under current market conditions. A three-level hierarchy for fair value measurements has been established based upon the transparency of inputs to the valuation of an asset or liability. Inputs may be observable or unobservable and refer broadly to the assumptions that market participants would use in pricing the asset or liability. Observable inputs reflect the assumptions market participants would use in pricing the asset or liability based on market data obtained from sources independent of the reporting entity. Unobservable inputs reflect the reporting entity’s own assumptions about the assumptions that market participants would use in pricing the asset or liability based on the best information available under the circumstances. Each Fund’s investment in its entirety is assigned a level based upon the observability of the inputs which are significant to the overall valuation. The three-level hierarchy of inputs is summarized below.
| Level 1 – | Inputs are quoted prices in active markets for identical investments. (Examples: equity securities,open-end investment companies, futures contracts, and exchange-traded options contracts) |
| Level 2 – | Other observable inputs, including, but not limited to: quoted prices for similar assets or liabilities in markets that are active, quoted prices for identical or similar assets or liabilities in markets that are not active, inputs other than quoted prices that are observable for the assets or liabilities (such as interest rates, yield curves, volatilities, prepayment speeds, loss severities, credit risks, and default rates) or other market-corroborated inputs. (Examples: debt securities, government securities, swap contracts, foreign currency exchange contracts, foreign securities utilizing international fair value pricing, broker-quoted securities, and fair valued securities) |
| Level 3 – | Significant unobservable inputs, including each Fund’s own assumptions used to determine the fair value of investments. (Examples: broker-quoted securities and fair valued securities) |
94
Table of Contents
Level 3 investments are valued using significant unobservable inputs. Each Fund may also use an income-based valuation approach in which the anticipated future cash flows of the investment are discounted to calculate fair value. Discounts may also be applied due to the nature or duration of any restrictions on the disposition of the investments. Valuations may also be based upon current market prices of securities that are comparable in coupon, rating, maturity, and industry. The derived value of a Level 3 investment may not represent the value which is received upon disposition and this could impact the results of operations.
The following tables summarize the valuation of each Fund’s investments by fair value hierarchy levels as of Aug. 31, 2019:
| Delaware Tax-Free Minnesota Fund | |||||
Level 2 | |||||
Securities | |||||
Assets: | |||||
Municipal Bonds | $ | 603,841,947 | |||
Short-Term Investments | 8,975,000 | ||||
|
| ||||
Total Value of Securities | $ | 612,816,947 | |||
|
| ||||
| Delaware Tax-Free Minnesota Intermediate Fund | |||||
Level 2 | |||||
Securities | |||||
Assets: | |||||
Municipal Bonds | $ | 79,063,573 | |||
Short-Term Investments | 1,750,000 | ||||
|
| ||||
Total Value of Securities | $ | 80,813,573 | |||
|
| ||||
| Delaware Minnesota High-Yield Municipal Bond Fund | |||||
Level 2 | |||||
Securities | |||||
Assets: | |||||
Municipal Bonds | $ | 197,624,750 | |||
Short-Term Investments | 3,175,000 | ||||
|
| ||||
Total Value of Securities | $ | 200,799,750 | |||
|
| ||||
During the year ended Aug. 31, 2019, there were no transfers between Level 1 investments, Level 2 investments, or Level 3 investments that had a significant impact to each Fund. Each Fund’s policy is to recognize transfers between levels based on fair value at the beginning of the reporting period.
95
Table of Contents
Notes to financial statements
Delaware Funds® by Macquarie Minnesota municipal bond funds
3. Investments (continued)
A reconciliation of Level 3 investments is presented when each Fund has a significant amount of Level 3 investments at the beginning, interim, or end of the period in relation to each Fund’s net assets. During the year ended Aug. 31, 2019, there were no Level 3 investments.
4. Dividend and Distribution Information
Income and long-term capital gain distributions are determined in accordance with federal income tax regulations, which may differ from US GAAP. Additionally, distributions from net short-term gains on sales of investment securities are treated as ordinary income for federal income tax purposes. The tax character of dividends and distributions paid during the years ended Aug. 31, 2019 and 2018 were as follows:
| Delaware | Delaware Tax-Free | Delaware Minnesota | |||||||||||||
| Tax-Free | Minnesota | High-Yield Municipal | |||||||||||||
| Minnesota Fund | Intermediate Fund | Bond Fund | |||||||||||||
Year ended 8/31/19 | |||||||||||||||
Ordinary income | $ | 57 | $ | — | $ | 19 | |||||||||
Tax-exempt income | 16,220,204 | 2,178,234 | 5,301,651 | ||||||||||||
|
|
|
|
|
| ||||||||||
Total | $ | 16,220,261 | $ | 2,178,234 | $ | 5,301,670 | |||||||||
|
|
|
|
|
| ||||||||||
Year ended 8/31/18 | |||||||||||||||
Ordinary income | $ | 24,273 | $ | — | $ | 30,002 | |||||||||
Tax-exempt income | 16,367,225 | 2,431,471 | 5,142,526 | ||||||||||||
Long-term capital gains | 2,768,366 | 368,988 | — | ||||||||||||
|
|
|
|
|
| ||||||||||
Total | $ | 19,159,864 | $ | 2,800,459 | $ | 5,172,528 | |||||||||
|
|
|
|
|
| ||||||||||
96
Table of Contents
5. Components of Net Assets on a Tax Basis
As of Aug. 31, 2019, the components of net assets on a tax basis were as follows:
| Delaware | Delaware Tax-Free | Delaware Minnesota | |||||||||||||
| Tax-Free | Minnesota | High-Yield Municipal | |||||||||||||
| Minnesota Fund | Intermediate Fund | Bond Fund | |||||||||||||
Shares of beneficial interest | $ | 550,851,980 | $ | 76,335,861 | $ | 189,260,917 | |||||||||
Undistributedtax-exempt income | 141,285 | 48,383 | 134,386 | ||||||||||||
Undistributed long-term capital gains | 253,490 | — | — | ||||||||||||
Capital loss carryforwards | — | (98,039 | ) | (969,374 | ) | ||||||||||
Distributions payable | (381,672 | ) | (52,573 | ) | (134,386 | ) | |||||||||
Unrealized appreciation of investments | 35,099,294 | 4,569,443 | 11,409,113 | ||||||||||||
|
|
|
|
|
| ||||||||||
Net assets | $ | 585,964,377 | $ | 80,803,075 | $ | 199,700,656 | |||||||||
|
|
|
|
|
| ||||||||||
The differences between book basis and tax basis components of net assets are primarily attributable to tax treatment of market discount and premium on debt instruments and tax deferral of losses due to wash sales, if applicable.
Under the Regulated Investment Company Modernization Act of 2010, net capital losses recognized for tax years beginning after Dec. 22, 2010 may be carried forward indefinitely, and their character is retained as short-term and/or long-term losses. At Aug. 31, 2019, DelawareTax-Free Minnesota Fund did not have any capital loss carryforwards.
At Aug. 31, 2019, capital loss carryforwards available to offset future realized capital gains for DelawareTax-Free Minnesota Intermediate Fund and Delaware Minnesota High-Yield Municipal Bond Fund were as follows:
Loss carryforward character | |||||||||||||||
Short-term | Long-term | Total | |||||||||||||
DelawareTax-Free Minnesota Intermediate Fund | $ | 98,039 | $ | — | $ | 98,039 | |||||||||
Delaware Minnesota High-Yield Municipal Bond Fund | 845,337 | 124,037 | 969,374 | ||||||||||||
97
Table of Contents
Notes to financial statements
Delaware Funds® by Macquarie Minnesota municipal bond funds
6. Capital Shares
Transactions in capital shares were as follows:
| Delaware Tax-Free | Delaware Minnesota | |||||||||||||||||||||||
| Delaware Tax-Free | Minnesota | High-Yield Municipal | ||||||||||||||||||||||
| Minnesota Fund | Intermediate Fund | Bond Fund | ||||||||||||||||||||||
Year ended
|
Year ended
|
Year ended
| ||||||||||||||||||||||
| 8/31/19 | 8/31/18 | 8/31/19 | 8/31/18 | 8/31/19 | 8/31/18 | |||||||||||||||||||
Shares sold: | ||||||||||||||||||||||||
Class A | 2,812,545 | 3,125,082 | 521,273 | 436,654 | 1,091,129 | 1,521,905 | ||||||||||||||||||
Class C | 252,325 | 213,991 | 82,541 | 61,309 | 291,127 | 310,619 | ||||||||||||||||||
Institutional Class | 6,847,310 | 4,490,186 | 773,437 | 499,420 | 2,920,048 | 2,291,763 | ||||||||||||||||||
Shares issued upon reinvestment of dividends and distributions: |
| |||||||||||||||||||||||
Class A | 798,095 | 996,278 | 124,608 | 158,251 | 240,677 | 218,090 | ||||||||||||||||||
Class C | 53,400 | 96,954 | 13,717 | 21,615 | 39,113 | 55,726 | ||||||||||||||||||
Institutional Class | 263,476 | 267,851 | 36,374 | 45,617 | 174,526 | 143,414 | ||||||||||||||||||
|
|
|
|
|
|
|
|
|
|
|
| |||||||||||||
| 11,027,151 | 9,190,342 | 1,551,950 | 1,222,866 | 4,756,620 | 4,541,517 | |||||||||||||||||||
|
|
|
|
|
|
|
|
|
|
|
| |||||||||||||
Shares redeemed: | ||||||||||||||||||||||||
Class A | (5,263,546 | ) | (5,728,359 | ) | (1,153,362 | ) | (1,288,814 | ) | (1,382,974 | ) | (1,510,584 | ) | ||||||||||||
Class C | (878,285 | ) | (1,441,859 | ) | (249,651 | ) | (355,611 | ) | (481,931 | ) | (1,296,104 | ) | ||||||||||||
Institutional Class | (3,637,252 | ) | (1,965,838 | ) | (294,820 | ) | (1,168,219 | ) | (1,406,980 | ) | (1,535,704 | ) | ||||||||||||
|
|
|
|
|
|
|
|
|
|
|
| |||||||||||||
| (9,779,083 | ) | (9,136,056 | ) | (1,697,833 | ) | (2,812,644 | ) | (3,271,885 | ) | (4,342,392 | ) | |||||||||||||
|
|
|
|
|
|
|
|
|
|
|
| |||||||||||||
Net increase (decrease) | 1,248,068 | 54,286 | (145,883 | ) | (1,589,778 | ) | 1,484,735 | 199,125 | ||||||||||||||||
|
|
|
|
|
|
|
|
|
|
|
| |||||||||||||
100
Table of Contents
Certain shareholders may exchange shares of one class for shares of another class in the same Fund. These exchange transactions are included as subscriptions and redemptions in the tables on the previous page and on the “Statements of changes in net assets.” For the years ended Aug. 31, 2019 and 2018, the Funds had the following exchange transactions:
| Year ended 8/31/19 | ||||||||||||||||||||
| Exchange Redemptions | Exchange Subscriptions | |||||||||||||||||||
| Class A Shares | Class C Shares | Class A Shares | Institutional Class Shares | Value | ||||||||||||||||
DelawareTax-Free Minnesota Fund | 59,365 | 40,077 | 31,466 | 68,171 | $ | 1,220,708 | ||||||||||||||
DelawareTax-Free Minnesota Intermediate Fund | 1,165 | 9,191 | 9,217 | 1,165 | 112,353 | |||||||||||||||
Delaware Minnesota High-Yield Municipal Bond Fund | 26,086 | 44,298 | 9,709 | 60,819 | 745,406 | |||||||||||||||
| Year ended 8/31/18 | ||||||||||||||||||||
| Exchange Redemptions | Exchange Subscriptions | |||||||||||||||||||
| Class A Shares | Class C Shares | Class A Shares | Institutional Class Shares | Value | ||||||||||||||||
DelawareTax-Free Minnesota Fund | 179,677 | 324,507 | 282,986 | 222,704 | $ | 6,195,653 | ||||||||||||||
DelawareTax-Free Minnesota Intermediate Fund | 24,209 | 52,010 | 43,368 | 33,036 | 833,306 | |||||||||||||||
Delaware Minnesota High-Yield Municipal Bond Fund | 47,282 | 241,837 | 232,144 | 57,805 | 3,092,167 | |||||||||||||||
7. Line of Credit
Each Fund, along with certain other funds in the Delaware Funds (Participants), was a participant in a revolving line of credit intended to be used for temporary or emergency purposes as an additional source of liquidity to fund redemptions of investor shares. The revolving line of credit available was reduced from $155,000,000 to $130,000,000 on Sept. 6, 2018. Under the agreement, the Participants were charged an annual commitment fee of 0.15%, which was allocated across the Participants based on a weighted average of the respective net assets of each Participant. The Participants were permitted to borrow up to a maximum ofone-third of their net assets under the agreement. Each Participant was individually, and not jointly, liable for its particular advances, if any, under the line of credit. The line of credit available under the agreement expired on Nov. 5, 2018.
99
Table of Contents
Notes to financial statements
Delaware Funds® by Macquarie Minnesota municipal bond funds
7. Line of Credit (continued)
On Nov. 5, 2018, the Participants entered into an amendment to the agreement for a $190,000,000 revolving line of credit. The revolving line of credit available was increased to $220,000,000 on Nov. 29, 2018. The revolving line of credit is to be used as described on the previous page and operates in substantially the same manner as the original agreement. The line of credit available under the agreement expires on Nov. 4, 2019.
The Funds had no amounts outstanding as of Aug. 31, 2019, or at any time during the year then ended.
8. Geographic, Credit, and Market Risks
When interest rates rise, fixed income securities (i.e. debt obligations) generally will decline in value. These declines in value are greater for fixed income securities with longer maturities or durations.
The Funds concentrate their investments in securities issued by municipalities, mainly in Minnesota, and may be subject to geographic concentration risk. In addition, the Funds have the flexibility to invest in issuers in US territories and possessions such as the Commonwealth of Puerto Rico, the US Virgin Islands, and Guam, whose bonds are also free of federal and individual state income taxes.
The value of the Funds’ investments may be adversely affected by new legislation within the US state or territories, regional or local economic conditions, and differing levels of supply and demand for municipal bonds. Many municipalities insure repayment for their obligations. Although bond insurance reduces the risk of loss due to default by an issuer, such bonds remain subject to the risk that value may fluctuate for other reasons, and there is no certainty that the insurance company will meet its obligations. A real or perceived decline in creditworthiness of a bond insurer can have an adverse impact on the value of insured bonds held in each Fund. At Aug. 31, 2019, the percentages of each Fund’s net assets insured by bond insurers are listed below, and these securities have been identified in the “Schedules of investments.”
| Delaware | Delaware Tax-Free | Delaware Minnesota | |||||||||||||
| Tax-Free | Minnesota | High-Yield Municipal | |||||||||||||
| Minnesota Fund | Intermediate Fund | Bond Fund | |||||||||||||
Assured Guaranty Corporation | 2.75 | % | 3.15 | % | — | ||||||||||
Assured Guaranty Municipal Corporation | 0.74 | % | 1.24 | % | 1.49 | % | |||||||||
National Public Finance Guarantee Corporation | 0.79 | % | — | — | |||||||||||
|
|
|
|
|
| ||||||||||
| 4.28 | % | 4.39 | % | 1.49 | % | ||||||||||
|
|
|
|
|
| ||||||||||
Each Fund invests a portion of its assets in high yield fixed income securities, which are securities rated lower thanBBB- by Standard & Poor’s Financial Services LLC (S&P), lower than Baa3 by Moody’s Investors Service Inc. (Moody’s), or similarly rated by another nationally recognized statistical rating organization. Investments in these higher yielding securities are generally accompanied by a greater degree of credit risk than higher rated securities. Additionally, lower rated securities may be more susceptible to adverse economic and competitive industry conditions than investment grade securities.
100
Table of Contents
Each Fund invests in certain obligations that may have liquidity protection designed to ensure that the receipt of payments due on the underlying security is timely. Such protection may be provided through guarantees, insurance policies, or letters of credit obtained by the issuer or sponsor through third parties, through various means of structuring the transaction or through a combination of such approaches. Each Fund will not pay any additional fees for such credit support, although the existence of credit support may increase the price of a security.
Each Fund may invest in advance refunded bonds, escrow secured bonds, or defeased bonds. Under current federal tax laws and regulations, state and local government borrowers are permitted to refinance outstanding bonds by issuing new bonds. The issuer refinances the outstanding debt to either reduce interest costs or to remove or alter restrictive covenants imposed by the bonds being refinanced. A refunding transaction where the municipal securities are being refunded within 90 days from the issuance of the refunding issue is known as a “current refunding.” Advance refunded bonds are bonds in which the refunded bond issue remains outstanding for more than 90 days following the issuance of the refunding issue. In an advance refunding, the issuer will use the proceeds of a new bond issue to purchase high grade interest-bearing debt securities, which are then deposited in an irrevocable escrow account held by an escrow agent to secure all future payments of principal and interest and bond premium of the advance refunded bond. Bonds are “escrowed to maturity” when the proceeds of the refunding issue are deposited in an escrow account for investment sufficient to pay all of the principal and interest on the original interest payment and maturity dates.
Bonds are considered“pre-refunded” when the refunding issue’s proceeds are escrowed only until a permitted call date or dates on the refunded issue with the refunded issue being redeemed at the time, including any required premium. Bonds become “defeased” when the rights and interests of the bondholders and of their lien on the pledged revenues or other security under the terms of the bond contract are substituted with an alternative source of revenues (the escrow securities) sufficient to meet payments of principal and interest to maturity or to the first call dates. Escrowed secured bonds will often receive a rating of AAA from Moody’s, S&P, and/or Fitch Ratings due to the strong credit quality of the escrow securities and the irrevocable nature of the escrow deposit agreement.
Each Fund may invest up to 15% of its net assets in illiquid securities, which may include securities with contractual restrictions on resale, securities exempt from registration under Rule 144A, promulgated under the Securities Act of 1933, as amended, and other securities which may not be readily marketable. The relative illiquidity of these securities may impair each Fund from disposing of them in a timely manner and at a fair price when it is necessary or desirable to do so. While maintaining oversight, each Board has delegated to DMC, theday-to-day functions of determining whether individual securities are liquid for purposes of each Fund’s limitation on investments in illiquid securities. Securities eligible for resale pursuant to Rule 144A, which are determined to be liquid, are not subject to each Fund’s 15% limit on investments in illiquid securities. Rule 144A securities have been identified on the “Schedules of investments.” Restricted securities are valued pursuant to the security valuation procedures described in Note 1.
9. Contractual Obligations
Each Fund enters into contracts in the normal course of business that contain a variety of indemnifications. The Fund’s maximum exposure under these arrangements is unknown. However, each
101
Table of Contents
Notes to financial statements
Delaware Funds® by Macquarie Minnesota municipal bond funds
9. Contractual Obligations (continued)
Fund has not had prior claims or losses pursuant to these contracts. Management has reviewed each Fund’s existing contracts and expects the risk of loss to be remote.
10. Recent Accounting Pronouncements
In March 2017, the FASB issued an Accounting Standards Update (ASU), ASU2017-08, Receivables — Nonrefundable Fees and Other Costs (Subtopic310-20), Premium Amortization on Purchased Callable Debt Securities which amends the amortization period for certain callable debt securities purchased at a premium, shortening such period to the earliest call date. The ASU2017-08 does not require any accounting change for debt securities held at a discount; the discount continues to be amortized to maturity. The ASU2017-08 is effective for fiscal years, and interim periods within those fiscal years, beginning after Dec. 15, 2018. At this time, management is evaluating the implications of these changes on the financial statements.
In August 2018, the FASB issued an ASU2018-13, which changes certain fair value measurement disclosure requirements. The ASU2018-13, in addition to other modifications and additions, removes the requirement to disclose the amount and reasons for transfers between Level 1 and Level 2 of the fair value hierarchy, the policy for the timing of transfers between levels and the valuation process for Level 3 fair value measurements. The ASU2018-13 is effective for fiscal years, and interim periods within those fiscal years, beginning after Dec. 15, 2019. At this time, management is evaluating the implications of these changes on the financial statements.
In August 2018, the Securities and Exchange Commission (SEC) adopted amendments to RegulationS-X to update and simplify the disclosure requirements for registered investment companies by eliminating requirements that are redundant or duplicative of US GAAP requirements or other SEC disclosure requirements. The new amendments require the presentation of the total, rather than the components, of distributable earnings on the “Statements of assets and liabilities” and the total, rather than the components, of dividends from net investment income and distributions from net realized gains on the “Statements of changes in net assets.” The amendments also removed the requirement for the parenthetical disclosure of undistributed net investment income on the “Statements of changes in net assets” and certain tax adjustments that were reflected in the “Notes to financial statements.” All of these have been reflected in the Funds’ financial statements.
11. Subsequent Events
Management has determined that no material events or transactions occurred subsequent to Aug. 31, 2019, that would require recognition or disclosure in the Funds’ financial statements.
102
Table of Contents
registered public accounting firm
To the Board of Trustees of VoyageurTax-Free Funds, Voyageur IntermediateTax-Free Funds and Voyageur Mutual Funds and Shareholders of DelawareTax-Free Minnesota Fund, DelawareTax-Free Minnesota Intermediate Fund and Delaware Minnesota High-Yield Municipal Bond Fund
Opinions on the Financial Statements
We have audited the accompanying statements of assets and liabilities, including the schedules of investments, of DelawareTax-Free Minnesota Fund (constituting VoyageurTax-Free Funds), DelawareTax-Free Minnesota Intermediate Fund (constituting Voyageur IntermediateTax-Free Funds) and Delaware Minnesota High-Yield Municipal Bond Fund (one of the funds constituting Voyageur Mutual Funds) (hereafter collectively referred to as the “Funds”) as of August 31, 2019, the related statements of operations for the year ended August 31, 2019, the statements of changes in net assets for each of the two years in the period ended August 31, 2019, including the related notes, and the financial highlights for each of the five years in the period ended August 31, 2019 (collectively referred to as the “financial statements”). In our opinion, the financial statements present fairly, in all material respects, the financial position of the Funds as of August 31, 2019, the results of each of their operations for the year then ended, the changes in each of their net assets for each of the two years in the period ended August 31, 2019 and each of the financial highlights for each of the five years in the period ended August 31, 2019 in conformity with accounting principles generally accepted in the United States of America.
Basis for Opinions
These financial statements are the responsibility of the Funds’ management. Our responsibility is to express an opinion on the Funds’ financial statements based on our audits. We are a public accounting firm registered with the Public Company Accounting Oversight Board (United States) (PCAOB) and are required to be independent with respect to the Funds in accordance with the U.S. federal securities laws and the applicable rules and regulations of the Securities and Exchange Commission and the PCAOB.
We conducted our audits of these financial statements in accordance with the standards of the PCAOB. Those standards require that we plan and perform the audit to obtain reasonable assurance about whether the financial statements are free of material misstatement, whether due to error or fraud.
Our audits included performing procedures to assess the risks of material misstatement of the financial statements, whether due to error or fraud, and performing procedures that respond to those risks. Such procedures included examining, on a test basis, evidence regarding the amounts and disclosures in the financial statements. Our audits also included evaluating the accounting principles used and significant estimates made by management, as well as evaluating the overall presentation of the financial statements. Our procedures included confirmation of securities owned as of August 31, 2019 by correspondence with the custodian and brokers. We believe that our audits provide a reasonable basis for our opinions.
/s/PricewaterhouseCoopers LLP
Philadelphia, Pennsylvania
October 16, 2019
We have served as the auditor of one or more investment companies in Delaware Funds® by Macquarie since 2010.
103
Table of Contents
Other Fund information (Unaudited)
Delaware Funds® by Macquarie Minnesota municipal bond funds
Tax Information
The information set forth below is for each Fund’s fiscal year as required by federal income tax laws. Shareholders, however, must report distributions on a calendar year basis for income tax purposes, which may include distributions for portions of two fiscal years of the Funds. Accordingly, the information needed by shareholders for income tax purposes will be sent to them in January of each year. Please consult your tax advisor for proper treatment of this information.
All disclosures are based on financial information available as of the date of this annual report and, accordingly are subject to change. For any and all items requiring reporting, it is the intention of the Funds to report the maximum amount permitted under the Internal Revenue Code and the regulations thereunder.
For the fiscal year ended Aug. 31, 2019, each Fund reports distributions paid during the year as follows:
| (A) | ||||
| Tax-Exempt | ||||
| Income | Total | |||
| Distributions | Distributions | |||
| (Tax Basis) | (Tax Basis) | |||
DelawareTax-Free Minnesota Fund | 100.00% | 100.00% | ||
DelawareTax-Free Minnesota Intermediate Fund | 100.00% | 100.00% | ||
Delaware Minnesota High-Yield Municipal Bond Fund | 100.00% | 100.00% |
(A) is based on a percentage of each Fund’s total distributions.
Board consideration of Investment Advisory agreements for DelawareTax-Free Minnesota Fund, DelawareTax-Free Minnesota Intermediate Fund, and Delaware Minnesota High-Yield Municipal Bond Fund at a meeting held on August21-22, 2019
At a meeting held on Aug.21-22, 2019 (the “Annual Meeting”), the Board of Trustees (the “Board”), including a majority of disinterested or independent Trustees, approved the renewal of the Investment Advisory Agreements for DelawareTax-Free Minnesota Fund, DelawareTax-Free Minnesota Intermediate Fund, and Delaware Minnesota High-Yield Municipal Bond Fund (each, a “Fund” and together, the “Funds”). In making its decision, the Board considered information furnished at regular quarterly Board meetings, including reports detailing Fund performance, investment strategies, and expenses, as well as information prepared specifically in connection with the renewal of the investment advisory contract. Information furnished specifically in connection with the renewal of the Investment Management Agreement with Delaware Management Company (“DMC”), a series of Macquarie Investment Management Business Trust (“MIMBT”), included materials provided by DMC and its affiliates (collectively, “Macquarie Investment Management”) concerning, among other things, the nature, extent, and quality of services provided to the Funds; the costs of such services to the Funds;
104
Table of Contents
economies of scale; and the investment manager’s financial condition and profitability. In addition, in connection with the Annual Meeting, materials were provided to the Trustees in May 2019, including reports provided by Broadridge Financial Solutions (“Broadridge”). The Broadridge reports compared each Fund’s investment performance and expenses with those of other comparable mutual funds. The Independent Trustees reviewed and discussed the Broadridge reports with independent legal counsel to the Independent Trustees. In addition to the information noted above, the Board also requested and received information regarding DMC’s policy with respect to advisory fee levels and its breakpoint philosophy; the structure of portfolio manager compensation; comparative client fee information; and any constraints or limitations on the availability of securities for certain investment styles, which had in the past year inhibited, or which were likely in the future to inhibit, the investment manager’s ability to invest fully in accordance with Fund policies.
In considering information relating to the approval of each Fund’s advisory agreement, the Independent Trustees received assistance and advice from and met separately with independent legal counsel to the Independent Trustees and also received assistance and advice from an experienced and knowledgeable independent fund consultant, JDL Consultants, LLC (“JDL”). Although the Board gave attention to all information furnished, the following discussion identifies, under separate headings, the primary factors taken into account by the Board during its contract renewal considerations.
Nature, extent, and quality of services.The Board considered the services provided by DMC to the Funds and their shareholders. In reviewing the nature, extent, and quality of services, the Board considered reports furnished to it throughout the year, which covered matters such as the relative performance of the Funds; compliance of portfolio managers with the investment policies, strategies, and restrictions for the Funds; compliance by DMC and Delaware Distributors, L.P. (together, “Management”) personnel with the Code of Ethics adopted throughout the Delaware Funds® by Macquarie (“Delaware Funds”); and adherence to fair value pricing procedures as established by the Board. The Board was pleased with the current staffing of DMC and the emphasis placed on research in the investment process. The Board recognized DMC’s receipt of certain favorable industry distinctions during the past several years. The Board gave favorable consideration to DMC’s efforts to control expenses while maintaining service levels committed to Fund matters. The Board also noted the benefits provided to Fund shareholders through (a) each shareholder’s ability to: (i) exchange an investment in one Delaware Fund for the same class of shares in another Delaware Fund without a sales charge, or (ii) reinvest Fund dividends into additional shares of the Fund or into additional shares of other Delaware Funds, and (b) the privilege to combine holdings in other Delaware Funds to obtain a reduced sales charge. The Board was satisfied with the nature, extent, and quality of the overall services provided by DMC.
Investment performance.The Board placed significant emphasis on the investment performance of the Funds in view of the importance of investment performance to shareholders. Although the Board considered performance reports and discussions with portfolio managers at Investment Committee meetings throughout the year, the Board gave particular weight to the Broadridge reports furnished for the Annual Meeting. The Broadridge reports prepared for each Fund showed the investment performance of its Class A shares in comparison to a group of similar funds as selected by Broadridge (the “Performance Universe”). A fund with the best performance ranked first, and a fund with the poorest performance ranked last. The highest/best performing 25% of funds in the Performance Universe make
105
Table of Contents
Other Fund information (Unaudited)
Delaware Funds® by Macquarie Minnesota municipal bond funds
Board consideration of Investment Advisory agreements for DelawareTax-Free Minnesota Fund, DelawareTax-Free Minnesota Intermediate Fund, and Delaware Minnesota High-Yield Municipal Bond Fund at a meeting held on August21-22, 2019 (continued)
up the first quartile; the next 25%, the second quartile; the next 25%, the third quartile; and the poorest/ worst performing 25% of funds in the Performance Universe make up the fourth quartile. Comparative annualized performance for each Fund was shown for the past1-,3-,5-, and10-year periods, to the extent applicable, ended Jan. 31, 2019. The Board’s objective is that each Fund’s performance for the1-,3-, and5-year periods be at or above the median of its Performance Universe.
DelawareTax-Free Minnesota Fund – The Performance Universe for the Fund consisted of the Fund and all retail and institutional Minnesota municipal debt funds as selected by Broadridge. The Broadridge report comparison showed that the Fund’s total return for the1-year period was in the third quartile of its Performance Universe. The report further showed that the Fund’s total return for the3-,5-, and10-year periods was in the second quartile of its Performance Universe. The Board was satisfied with performance.
DelawareTax-Free Minnesota Intermediate Fund – The Performance Universe for the Fund consisted of the Fund and all retail and institutional “other states” intermediate municipal debt funds as selected by Broadridge. The Broadridge report comparison showed that the Fund’s total return for the1-year period was in the third quartile of its Performance Universe. The report further showed that the Fund’s total return for the3-,5-, and10-year periods was in the first quartile of its Performance Universe. The Board was satisfied with performance.
Delaware Minnesota High-Yield Municipal Bond Fund – Broadridge currently classifies the Fund as a Minnesota municipal debt fund. However, Management believes that it is more appropriate to include the Fund in the high yield municipal debt funds category, to provide a comparison to a representative peer group based on credit quality instead of a peer group based on state of issuance. Accordingly, the Broadridge report prepared for the Fund compares the Fund’s performance to two separate Performance Universes – one consisting of the Fund and all retail and institutional Minnesota municipal debt funds and the other consisting of the Fund and all retail and institutional high yield municipal debt funds. When compared to Minnesota municipal debt funds, the Broadridge report comparison showed that the Fund’s total return for the1-,3-,5-, and10-year periods was in the first quartile of its Performance Universe. When compared to high yield municipal debt funds, the Broadridge report comparison showed that the Fund’s total return for the1-year period was in the third quartile of its Performance Universe and the Fund’s total return for the3-,5-, and10-year periods was in the fourth quartile of its Performance Universe. The Board observed that, when compared to other Minnesota municipal debt funds, the Fund’s performance was in line with the Board’s objective; however, when compared to other high yield municipal debt funds, the Fund’s performance results were not in line with the Board’s objective. In evaluating the Fund’s performance, the Board considered the numerous investment and performance reports and other information delivered by Management personnel to the Board’s Investments Committee. The Board was satisfied that Management was taking action to improve comparative Fund performance and to meet the Board’s performance objective.
Comparative expenses.The Board considered expense data for the Delaware Funds. Management provided the Board with information on pricing levels and fee structures for each Fund as of its most
106
Table of Contents
recently completed fiscal year. The Board also focused on the comparative analysis of effective management fees and total expense ratios of each Fund versus effective management fees and total expense ratios of a group of similar funds as selected by Broadridge (the “Expense Group”). In reviewing comparative costs, each Fund’s contractual management fee and the actual management fee incurred by the Fund were compared with the contractual management fees (assuming all funds in the Expense Group were similar in size to the Fund) and actual management fees (as reported by each fund) within the Expense Group, taking into account any applicable breakpoints and fee waivers. Each Fund’s total expenses were also compared with those of its Expense Group. The Broadridge total expenses, for comparative consistency, were shown by Broadridge for Class A shares and comparative total expenses including12b-1 andnon-12b-1 service fees. The Board’s objective is for each Fund’s total expense ratio to be competitive with those of the peer funds within its Expense Group.
DelawareTax-Free Minnesota Fund – The expense comparisons for the Fund showed that its actual management fee was in the quartile with the second lowest expenses of its Expense Group and its total expenses were in the quartile with the highest expenses of its Expense Group. The Board gave favorable consideration to the Fund’s management fee but noted that the Fund’s total expenses were not in line with the Board’s objective. In evaluating the total expenses, the Board considered waivers in place through December 2019 and various initiatives implemented by Management, such as the negotiation of lower fees for fund accounting and fund accounting oversight services, which had created an opportunity for a further reduction in expenses. The Board was satisfied with Management’s efforts to improve the Fund’s total expense ratio and to bring it in line with the Board’s objective.
DelawareTax-Free Minnesota Intermediate Fund – The expense comparisons for the Fund showed that its actual management fee was in the quartile with the second lowest expenses of its Expense Group and its total expenses were in the quartile with the lowest expenses of its Expense Group. The Board was satisfied with the management fee and total expenses of the Fund in comparison to those of its Expense Group as shown in the Broadridge report.
Delaware Minnesota High-Yield Municipal Bond Fund – When compared to Minnesota municipal debt funds, the expense comparisons for the Fund showed that its actual management fee was in the quartile with the second lowest expenses in its Expense Group and its total expenses were in the quartile with the highest expenses of the Expense Group. When compared to high yield municipal debt funds, the expense comparisons for the Fund showed that its actual management fee was in the quartile with the highest expenses of its Expense Group and its total expenses were in the quartile with the second highest expenses of the Expense Group. The Board noted that the Fund’s total expenses were not in line with the Board’s objective. In evaluating the total expenses, the Board considered fee waivers in place through December 2019 and various initiatives implemented by Management, such as the negotiation of lower fees for fund accounting, fund accounting oversight services, and custody, which had created an opportunity for a further reduction in expenses. The Board was satisfied with Management’s efforts to improve the Fund’s total expense ratio and to bring it in line with the Board’s objective.
Management profitability.The Board considered the level of profits realized by DMC in connection with the operation of the Funds. In this respect, the Board reviewed the Investment Management Profitability Analysis that addressed the overall profitability of DMC’s business in providing management and other services to each of the individual funds and the Delaware Funds as a whole. Specific attention was given
107
Table of Contents
Other Fund information (Unaudited)
Delaware Funds® by Macquarie Minnesota municipal bond funds
Board consideration of Investment Advisory agreements for DelawareTax-Free Minnesota Fund, DelawareTax-Free Minnesota Intermediate Fund, and Delaware Minnesota High-Yield Municipal Bond Fund at a meeting held on August21-22, 2019 (continued)
to the methodology used by DMC in allocating costs for the purpose of determining profitability. Management stated that the level of profits of DMC, to a certain extent, reflects recent operational cost savings and efficiencies initiated by DMC. The Board considered DMC’s efforts to improve services provided to Fund shareholders and to meet additional regulatory and compliance requirements resulting from recent industry-wide Securities and Exchange Commission initiatives. The Board also considered the extent to which DMC might derive ancillary benefits from fund operations, including the potential for procuring additional business as a result of the prestige and visibility associated with its role as service provider to the Delaware Funds and the benefits from allocation of fund brokerage to improve trading efficiencies. As part of its work, the Board also reviewed a report prepared by JDL regarding MIMBT profitability as compared to certain peer fund complexes and the Independent Trustees discussed with JDL personnel regarding DMC’s profitability in such context. The Board found that the management fees were reasonable in light of the services rendered and the level of profitability of DMC.
Economies of scale.The Trustees considered whether economies of scale are realized by DMC as each Fund’s assets increase and the extent to which any economies of scale are reflected in the level of management fees charged. The Trustees reviewed each Fund’s advisory fee pricing and structure, approved by the Board and shareholders, which includes breakpoints, and which applies to most funds in the Delaware Funds complex. Breakpoints in the advisory fee occur when the advisory fee rate is reduced on assets in excess of specified levels. Breakpoints result in a lower advisory fee than would otherwise be the case in the absence of breakpoints, when the asset levels specified in the breakpoints are exceeded. Although, as of March 31, 2019, DelawareTax-Free Minnesota Intermediate Fund and Delaware Minnesota High-Yield Municipal Bond Fund had not reached a size at which they could take advantage of any breakpoints in the applicable fee schedule, the Board recognized that each Fund’s fee was structured so that, if the Fund increases sufficiently in size, then economies of scale may be shared. The Board noted that, as of March 31, 2019, DelawareTax-Free Minnesota Fund’s assets exceeded the first breakpoint level. The Board believed that, given the extent to which economies of scale might be realized by DMC and its affiliates, the schedule of fees under the Investment Management Agreement provides a sharing of benefits with the Fund and its shareholders.
108
Table of Contents
This page intentionally left blank.
Table of Contents
Board of trustees / directors and officers addendum
Delaware Funds®by Macquarie
A mutual fund is governed by a Board of Trustees/Directors (“Trustees”), which has oversight responsibility for the management of a fund’s business affairs. Trustees establish procedures and oversee and review the performance of the investment manager, the distributor, and others who perform services for the fund. The independent fund trustees, in particular, are advocates
| Name, Address, | Position(s) | Length of | ||
| and Birth Date | Held with Fund(s) | Time Served | ||
Interested Trustee
| ||||
Shawn K. Lytle1 2005 Market Street Philadelphia, PA 19103 February 1970 | President, Chief Executive Officer, and Trustee | President and Chief Executive Officer since August 2015
| ||
Trustee since September 2015
| ||||
Independent Trustees
| ||||
| Thomas L. Bennett | Chair and Trustee | Trustee since | ||
| 2005 Market Street | March 2005 | |||
| Philadelphia, PA 19103 | ||||
| October 1947 | Chair since | |||
| March 2015 | ||||
| Jerome D. Abernathy | Trustee | Since January 2019 | ||
| 2005 Market Street | ||||
| Philadelphia, PA 19103 | ||||
July 1959
| ||||
| Ann D. Borowiec | Trustee | Since March 2015 | ||
| 2005 Market Street | ||||
| Philadelphia, PA 19103 | ||||
November 1958
|
| 1 | Shawn K. Lytle is considered to be an “Interested Trustee” because he is an executive officer of the Fund’s(s’) investment advisor. |
110
Table of Contents
for shareholder interests. Each trustee has served in that capacity since he or she was elected to or appointed to the Board of Trustees, and will continue to serve until his or her retirement or the election of a new trustee in his or her place. The following is a list of the Trustees and Officers with certain background and related information.
| Number of Portfolios in | ||||
| Principal Occupation(s) | Fund Complex Overseen | Other Directorships | ||
| During the Past Five Years | by Trustee or Officer | Held by Trustee or Officer | ||
| ||||
| President — Macquarie | 59 | Trustee — UBS | ||
| Investment Management2 | Relationship Funds, | |||
| (June 2015–Present) | SMA Relationship | |||
| Trust, and UBS Funds | ||||
| Regional Head of | (May 2010–April 2015) | |||
| Americas — UBS Global | ||||
| Asset Management | ||||
(April 2010–May 2015)
| ||||
| ||||
| Private Investor | 59 | None | ||
(March 2004–Present)
| ||||
| Managing Member, | 59 | None | ||
| Stonebrook Capital | ||||
| Management, LLC (financial | ||||
| technology: macro factors | ||||
| and databases) | ||||
(January 1993–Present)
| ||||
| Chief Executive Officer, | 59 | Director — | ||
| Private Wealth Management | Banco Santander International | |||
| (2011–2013) and | (October 2016–Present) | |||
| Market Manager, | ||||
| New Jersey Private | Director — | |||
| Bank (2005–2011) — | Santander Bank, N.A. | |||
J.P. Morgan Chase & Co.
| (December 2016–Present) | |||
| 2 | Macquarie Investment Management is the marketing name for Macquarie Management Holdings, Inc. and its subsidiaries, including the Fund’s(s’) investment advisor, principal underwriter, and its transfer agent. |
111
Table of Contents
Board of trustees / directors and officers addendum
Delaware Funds®by Macquarie
Name, Address, and Birth Date | Position(s) Held with Fund(s) | Length of Time Served | ||
Independent Trustees (continued)
| ||||
| Joseph W. Chow | Trustee | Since January 2013 | ||
| 2005 Market Street | ||||
| Philadelphia, PA 19103 | ||||
January 1953
| ||||
| John A. Fry | Trustee | Since January 2001 | ||
| 2005 Market Street | ||||
| Philadelphia, PA 19103 | ||||
May 1960
| ||||
| Lucinda S. Landreth | Trustee | Since March 2005 | ||
| 2005 Market Street | ||||
| Philadelphia, PA 19103 | ||||
June 1947
| ||||
112
Table of Contents
| Number of Portfolios in | ||||
| Principal Occupation(s) | Fund Complex Overseen | Other Directorships | ||
| During the Past Five Years | by Trustee or Officer | Held by Trustee or Officer | ||
| ||||
| Private Investor | 59 | Director and Audit Committee | ||
| (April 2011–Present) | Member — Hercules | |||
| Technology Growth | ||||
| Capital, Inc. | ||||
(July 2004–July 2014)
| ||||
| President — | 59 | Director; Compensation | ||
| Drexel University | Committee and | |||
| (August 2010–Present) | Governance Committee | |||
| Member — Community | ||||
| President — | Health Systems | |||
| Franklin & Marshall College | (May 2004–present) | |||
| (July 2002–June 2010) | ||||
| Director — Drexel | ||||
| Morgan & Co. | ||||
| (2015–present) | ||||
| Director and Audit Committee | ||||
| Member — vTv | ||||
| Therapeutics Inc. | ||||
| (2017–present) | ||||
| Director and Audit Committee | ||||
| Member — FS Credit Real | ||||
| Estate Income Trust, Inc. | ||||
(2018–present)
| ||||
| Private Investor | 59 | None | ||
(2004–Present)
| ||||
113
Table of Contents
Board of trustees / directors and officers addendum
Delaware Funds®by Macquarie
| Name, Address, | Position(s) | Length of | ||
| and Birth Date | Held with Fund(s) | Time Served | ||
Independent Trustees (continued)
| ||||
| Frances A. Sevilla-Sacasa | Trustee | Since September 2011 | ||
| 2005 Market Street | ||||
| Philadelphia, PA 19103 | ||||
January 1956
| ||||
| Thomas K. Whitford | Trustee | Since January 2013 | ||
| 2005 Market Street | ||||
| Philadelphia, PA 19103 | ||||
March 1956
|
114
Table of Contents
| Number of Portfolios in | ||||
| Principal Occupation(s) | Fund Complex Overseen | Other Directorships | ||
| During the Past Five Years | by Trustee or Officer | Held by Trustee or Officer | ||
| ||||
| Private Investor | 59 | Trust Manager and | ||
| (January 2017–Present) | Audit Committee | |||
| Chair — Camden | ||||
| Chief Executive Officer — | Property Trust | |||
| Banco Itaú | (August 2011–Present) | |||
| International | ||||
| (April 2012–December 2016) | Director; Audit | |||
| Committee Member — | ||||
| Executive Advisor to Dean | Carrizo Oil & Gas, Inc. | |||
| (August 2011–March 2012) | (March 2018–Present) | |||
| and Interim Dean | ||||
| (January 2011–July 2011) — | ||||
| University of Miami School of | ||||
| Business Administration | ||||
| President — U.S. Trust, | ||||
| Bank of America Private | ||||
| Wealth Management | ||||
| (Private Banking) | ||||
| (July 2007–December 2008) | ||||
| Vice Chairman | 59 | Director — HSBC North | ||
| (2010–April 2013) — | America Holdings Inc. | |||
| PNC Financial | (December 2013–Present) | |||
| Services Group | ||||
| Director — HSBC USA Inc. | ||||
| (July 2014–Present) | ||||
| Director — | ||||
| HSBC Bank USA, | ||||
| National Association | ||||
| (July 2014–March 2017) | ||||
| Director — HSBC | ||||
| Finance Corporation | ||||
| (December 2013–April 2018) | ||||
115
Table of Contents
Board of trustees / directors and officers addendum
Delaware Funds®by Macquarie
| Name, Address, | Position(s) | Length of | ||
| and Birth Date | Held with Fund(s) | Time Served | ||
Independent Trustees (continued)
| ||||
| Christianna Wood | Trustee | Since January 2019 | ||
| 2005 Market Street | ||||
| Philadelphia, PA 19103 | ||||
August 1959
|
116
Table of Contents
| Number of Portfolios in | ||||
| Principal Occupation(s) | Fund Complex Overseen | Other Directorships | ||
| During the Past Five Years | by Trustee or Officer | Held by Trustee or Officer | ||
| ||||
| Chief Executive Officer | 59 | Director; Finance Committee | ||
| and President — | and Audit Committee | |||
| Gore Creek | Member — H&R | |||
| Capital, Ltd. | Block Corporation | |||
| (August 2009–Present) | (July 2008–Present)
| |||
| Director; Chair of Investments | ||||
| Committee and Audit | ||||
| Committee Member — | ||||
| Grange Insurance | ||||
(2013–Present)
| ||||
| Trustee; Chair of | ||||
| Nominating and Governance | ||||
| Committee and Audit | ||||
| Committee Member — | ||||
| The Merger Fund | ||||
| (2013–Present), | ||||
| The Merger Fund VL | ||||
| (2013-Present), | ||||
| WCM Alternatives: | ||||
| Event-Driven Fund | ||||
| (2013–Present), | ||||
| and WCM Alternatives: | ||||
| Credit Event Fund | ||||
(December 2017–Present)
| ||||
| Director; Chair of | ||||
| Governance Committee | ||||
| and Audit Committee | ||||
| Member — International | ||||
| Securities Exchange | ||||
| (2010–2016) |
117
Table of Contents
Board of trustees / directors and officers addendum
Delaware Funds®by Macquarie
| Name, Address, | Position(s) | Length of | ||
| and Birth Date | Held with Fund(s) | Time Served | ||
Independent Trustees (continued)
| ||||
| Janet L. Yeomans | Trustee | Since April 1999 | ||
| 2005 Market Street | ||||
| Philadelphia, PA 19103 | ||||
July 1948
| ||||
Officers
| ||||
| David F. Connor | Senior Vice President, | Senior Vice President since | ||
| 2005 Market Street | General Counsel, | May 2013; General | ||
| Philadelphia, PA 19103 | and Secretary | Counsel since May 2015; | ||
| December 1963 | Secretary since | |||
October 2005
| ||||
| Daniel V. Geatens | Vice President | Vice President and | ||
| 2005 Market Street | and Treasurer | Treasurer since October 2007 | ||
| Philadelphia, PA 19103 | ||||
October 1972
| ||||
| Richard Salus | Senior Vice President | Senior Vice President and | ||
| 2005 Market Street | and Chief Financial Officer | Chief Financial Officer | ||
| Philadelphia, PA 19103 | since November 2006 | |||
October 1963
|
The Statement of Additional Information for the Fund(s) includes additional information about the Trustees and Officers and is available, without charge, upon request by calling 800523-1918.
118
Table of Contents
| Number of Portfolios in | ||||
| Principal Occupation(s) | Fund Complex Overseen | Other Directorships | ||
| During the Past Five Years | by Trustee or Officer | Held by Trustee or Officer | ||
| ||||
| Vice President and Treasurer | 59 | Director; Personnel and | ||
| (January 2006–July 2012), | Compensation Committee | |||
| Vice President — | Chair; Member of Nominating, | |||
| Mergers & Acquisitions | Investments, and Audit | |||
| (January 2003–January 2006), | Committees for various | |||
| and Vice President | periods throughout | |||
| and Treasurer | directorship — | |||
| (July 1995–January 2003) — | Okabena Company | |||
| 3M Company | (2009–2017) | |||
| ||||
| David F. Connor has served | 59 | None3 | ||
| in various capacities at | ||||
| different times at | ||||
| Macquarie Investment | ||||
Management.
| ||||
| Daniel V. Geatens has served | 59 | None3 | ||
| in various capacities at | ||||
| different times at | ||||
| Macquarie Investment | ||||
Management.
| ||||
| Richard Salus has served | 59 | None3 | ||
| in various capacities | ||||
| at different times at | ||||
| Macquarie Investment | ||||
| Management. |
| 3 | David F. Connor, Daniel V. Geatens, and Richard Salus serve in similar capacities for the six portfolios of the Optimum Fund Trust, which have the same investment advisor, principal underwriter, and transfer agent as the registrant. Mr. Geatens also serves as the Chief Financial Officer and Treasurer for Macquarie Global Infrastructure Total Return Fund Inc., which has an affiliated investment manager. |
119
Table of Contents
| Board of trustees | ||||||
Shawn K. Lytle President and Chief Executive Officer Delaware Funds® by Macquarie Philadelphia, PA
Thomas L. Bennett Chairman of the Board Delaware Funds by Macquarie Private Investor Rosemont, PA
Jerome D. Abernathy Managing Member Stonebrook Capital Management, LLC Jersey City, NJ
| Ann D. Borowiec Former Chief Executive Officer Private Wealth Management J.P. Morgan Chase & Co. New York, NY
Joseph W. Chow Former Executive Vice President State Street Corporation Boston, MA
John A. Fry President Drexel University Philadelphia, PA | Lucinda S. Landreth Former Chief Investment Officer Assurant, Inc. New York, NY
Frances A. Sevilla-Sacasa Former Chief Executive Officer Banco Itaú International Miami, FL | Thomas K. Whitford Former Vice Chairman PNC Financial Services Group Pittsburgh, PA
Christianna Wood Chief Executive Officer and President Gore Creek Capital, Ltd. Golden, CO
Janet L. Yeomans Former Vice President and Treasurer 3M Company St. Paul, MN | |||
| Affiliated officers | ||||||
| David F. Connor | Daniel V. Geatens | Richard Salus | ||||
| Senior Vice President, | Vice President and | Senior Vice President and | ||||
| General Counsel, | Treasurer | Chief Financial Officer | ||||
| and Secretary | Delaware Funds | Delaware Funds | ||||
| Delaware Funds | by Macquarie | by Macquarie | ||||
| by Macquarie | Philadelphia, PA | Philadelphia, PA | ||||
| Philadelphia, PA | ||||||
This annual report is for the information of DelawareTax-Free Minnesota Fund, DelawareTax-Free Minnesota Intermediate Fund, and Delaware Minnesota High-Yield Municipal Bond Fund shareholders, but it may be used with prospective investors when preceded or accompanied by the Delaware Fund fact sheet for the most recently completed calendar quarter. These documents are available at delawarefunds.com/literature.
Each Fund files its complete schedule of portfolio holdings with the Securities and Exchange Commission (SEC) for the first and third quarters of each fiscal year on FormN-Q or FormN-PORT (available for filings after March 31, 2019). Each Fund’s FormsN-Q or FormsN-PORT, as well as a description of the policies and procedures that the Funds use to determine how to vote proxies (if any) relating to portfolio securities, are available without charge (i) upon request, by calling 800523-1918; and (ii) on the SEC’s website at sec.gov. In addition, a description of the policies and procedures that the Funds use to determine how to vote proxies (if any) relating to portfolio securities and the Schedules of Investments included in the Funds’ most recent FormN-Q or FormN-PORT are available without charge on the Funds’ website at delawarefunds.com/literature. Each Fund’s FormsN-Q and FormsN-PORT may be reviewed and copied at the SEC’s Public Reference Room in Washington, D.C.; information on the operation of the Public Reference Room may be obtained by calling 800SEC-0330.
Information (if any) regarding how the Funds voted proxies relating to portfolio securities during the most recently disclosed12-month period ended June 30 is available without charge (i) through the Funds’ website at delawarefunds.com/proxy; and (ii) on the SEC’s website at sec.gov.
120
Table of Contents
Delaware Funds® by MACQUARIE |  |
Annual report
Fixed income mutual funds
DelawareTax-Free USA Fund
DelawareTax-Free USA Intermediate Fund
Delaware National High-Yield Municipal Bond Fund
August 31, 2019
|
Beginning on or about June 1, 2021, as permitted by regulations adopted by the Securities and Exchange Commission, paper copies of your Fund’s shareholder reports will no longer be sent to you by mail, unless you specifically request them from the Fund or from your financial intermediary, such as a broker/dealer, bank, or insurance company. Instead, you will be notified by mail each time a report is posted on the website and provided with a link to access the report.
If you already elected to receive shareholder reports electronically, you will not be affected by this change and you do not need to take any action. You may elect to receive shareholder reports and other communications from the Fund electronically by signing up at delawarefunds.com/edelivery. If you own these shares through a financial intermediary, you may contact your financial intermediary.
You may elect to receive paper copies of all future shareholder reports free of charge. You can inform the Fund that you wish to continue receiving paper copies of your shareholder reports by contacting us at 800523-1918. If you own these shares through a financial intermediary, you may contact your financial intermediary to elect to continue to receive paper copies of your shareholder reports. Your election to receive reports in paper will apply to all funds held with the Delaware Funds® by Macquarie or your financial intermediary. |
Carefully consider the Funds’ investment objectives, risk factors, charges, and expenses before investing. This and other information can be found in the Funds’ prospectus and their summary prospectuses, which may be obtained by visiting delawarefunds.com/literature or calling 800523-1918. Investors should read the prospectus and the summary prospectus carefully before investing.
You can obtain shareholder reports and prospectuses online instead of in the mail. Visit delawarefunds.com/edelivery. |
Table of Contents
Experience Delaware Funds®by Macquarie
Macquarie Investment Management (MIM) is a global asset manager with offices throughout the United States, Europe, Asia, and Australia. As active managers we prioritize autonomy and accountability at the investment team level in pursuit of opportunities that matter for clients. Delaware Funds is one of the longest-standing mutual fund families, with more than 80 years in existence.
If you are interested in learning more about creating an investment plan, contact your financial advisor.
You can learn more about Delaware Funds or obtain a prospectus for DelawareTax-Free USA Fund, DelawareTax-Free USA Intermediate Fund, and Delaware National High-Yield Municipal Bond Fund at delawarefunds.com/literature.
Manage your account online
• Check your account balance and transactions
• View statements and tax forms
• Make purchases and redemptions
Visit delawarefunds.com/account-access.
Macquarie Asset Management (MAM) offers a diverse range of products including securities investment management, infrastructure and real asset management, and fund and equity-based structured products. MIM is the marketing name for certain companies comprising the asset management division of Macquarie Group. This includes the following registered investment advisers: Macquarie Investment Management Business Trust (MIMBT), Delaware Capital Management Advisers, Inc., Macquarie Funds Management Hong Kong Limited, Macquarie Investment Management Austria Kapitalanlage AG, Macquarie Investment Management Global Limited, Macquarie Investment Management Europe Limited, Macquarie Capital Investment Management LLC, and Macquarie Investment Management Europe S.A.
The Funds are distributed byDelaware Distributors, L.P. (DDLP), an affiliate of MIMBT and Macquarie Group Limited.
Other than Macquarie Bank Limited (MBL), none of the entities noted are authorized deposit-taking institutions for the purposes of the Banking Act 1959 (Commonwealth of Australia). The obligations of these entities do not represent deposits or other liabilities of MBL. MBL does not guarantee or otherwise provide assurance in respect of the obligations of these entities, unless noted otherwise. The Funds are governed by US laws and regulations.
| 1 | ||||
| 5 | ||||
| 18 | ||||
| 21 | ||||
| 27 | ||||
| 78 | ||||
| 80 | ||||
| 82 | ||||
| 88 | ||||
| 106 | ||||
| 123 | ||||
| 124 | ||||
| 130 | ||||
| 140 | ||||
Unless otherwise noted, views expressed herein are current as of Aug. 31, 2019, and subject to change for events occurring after such date.
The Funds are not FDIC insured and are not guaranteed. It is possible to lose the principal amount invested.
Advisory services provided by Delaware Management Company, a series of MIMBT, a US registered investment advisor.
All third-party marks cited are the property of their respective owners.
© 2019 Macquarie Management Holdings, Inc.
Table of Contents
Delaware Funds® by Macquarie nationaltax-free funds | September 10, 2019 |
| Performance preview (for the year ended August 31, 2019) | ||||
DelawareTax-Free USA Fund (Institutional Class shares) | 1-year return | +8.68% | ||
DelawareTax-Free USA Fund (Class A shares) | 1-year return | +8.35% | ||
Bloomberg Barclays Municipal Bond Index (benchmark) | 1-year return | +8.72% | ||
Lipper General & Insured Municipal Debt Funds Average | 1-year return | +8.33% | ||
Past performance does not guarantee future results.
For complete, annualized performance for DelawareTax-Free USA Fund, please see the table on page 5.
Institutional Class shares are not subject to a sales charge and are offered for sale exclusively to certain eligible investors. In addition, Institutional Class shares pay no distribution and service fee.
The performance of Class A shares excludes the applicable sales charge. Both Institutional Class shares and Class A shares reflect the reinvestment of all distributions.
The Lipper General & Insured Municipal Debt Funds Average compares funds that either invest primarily in municipal debt issues in the top four credit ratings or invest primarily in municipal debt issues insured as to timely payment.
Please see page 8 for a description of the index. Index performance returns do not reflect any management fees, transaction costs, or expenses. Indices are unmanaged and one cannot invest directly in an index.
DelawareTax-Free USA Intermediate Fund (Institutional Class shares) | 1-year return | +7.92% | ||
DelawareTax-Free USA Intermediate Fund (Class A shares) | 1-year return | +7.71% | ||
Bloomberg Barclays 3–15 Year Blend Municipal Bond Index (benchmark) | 1-year return | +8.16% | ||
Lipper Intermediate Municipal Debt Funds Average | 1-year return | +7.25% |
Past performance does not guarantee future results.
For complete, annualized performance for DelawareTax-Free USA Intermediate Fund, please see the table on page 9.
Institutional Class shares are not subject to a sales charge and are offered for sale exclusively to certain eligible investors. In addition, Institutional Class shares pay no distribution and service fee.
The performance of Class A shares excludes the applicable sales charge. Both Institutional Class shares and Class A shares reflect the reinvestment of all distributions.
The Lipper Intermediate Municipal Debt Funds Average compares funds that invest in municipal debt issues with dollar-weighted average maturities of 5 to 10 years.
Please see page 12 for a description of the Index. Index performance returns do not reflect any management fees, transaction costs, or expenses. Indices are unmanaged and one cannot invest directly in an index.
| Delaware National High-Yield Municipal Bond Fund (Institutional Class shares) | 1-year return | +9.03% | ||
| Delaware National High-Yield Municipal Bond Fund (Class A shares) | 1-year return | +8.81% | ||
| Bloomberg Barclays Municipal Bond Index (benchmark) | 1-year return | +8.72% | ||
| Lipper High Yield Municipal Debt Funds Average | 1-year return | +8.33% |
Past performance does not guarantee future results.
For complete, annualized performance for Delaware National High-Yield Municipal Bond Fund, please see the table on page 14.
Institutional Class shares are not subject to a sales charge and are offered for sale exclusively to certain eligible investors. In addition, Institutional Class shares pay no distribution and service fee.
The performance of Class A shares excludes the applicable sales charge. Both Institutional Class shares and Class A shares reflect the reinvestment of all distributions.
The Lipper High Yield Municipal Debt Funds Average compares funds that invest at least 50% of assets in lower-rated municipal debt issues.
Please see page 17 for a description of the index. Index performance returns do not reflect any management fees, transaction costs, or expenses. Indices are unmanaged and one cannot invest directly in an index.
1
Table of Contents
Portfolio management review
Delaware Funds® by Macquarie nationaltax-free funds
Economic backdrop
Throughout the fiscal year ended Aug. 31, 2019, the US economy grew, albeit at a moderating pace, reflecting mounting concerns about theUS-China trade dispute. In the third quarter of 2018, US gross domestic product (GDP) – a measure of national economic output – rose by an annualized 2.9%, down from the previous quarter. Growth slowed to 1.1% in the final three months of 2018 before bouncing back to 3.1% in the first quarter of 2019. In the second quarter of 2019, the country’s GDP rose an estimated 2.0%.
Against this backdrop of economic expansion, job growth also remained strong. In August 2019, the US unemployment rate stood at 3.7%, matching its level one year earlier and close to the nearly
50-year low of 3.6% achieved in both April and May 2019.
When the fiscal year began in September 2018, the US Federal Reserve continued to raise its short-term target interest rate, maintaining a cycle that had been in place since 2015. In September and again in December 2018, the Fed lifted the federal funds rate by 0.25 percentage points. As data mounted suggesting a slowing US economy, however, the Fed adjusted its policy direction – initially, by no longer raising rates and then, in June 2019, reversing its rate increase from December. By the end of the Funds’ fiscal year on Aug. 31, 2019, the federal funds rate was within a range of 2.00% to 2.25%. Investors widely anticipated that the Fed would enact further rate cuts at its meetings later in 2019.
Sources: US Bureau of Economic Analysis, US Bureau of Labor Statistics, and Bloomberg.
Municipal bond market conditions
Uncertainty about trade policy led to uncertainty about future global growth, encouraging global central banks to implement increasingly stimulative economic policies. This led to a highly favorable backdrop for municipal debt, particularly
as the Funds’ fiscal year progressed. The US municipal bond market, as measured by the Bloomberg Barclays Municipal Bond Index, returned 8.72% for the 12 months ended Aug. 31, 2019.
As rates on longer-term bonds fell more than those on shorter-term issues, the municipal yield curve flattened. The largest yield declines came from the “belly” of the municipal yield curve, while the strongest overall performance came from the20-year(17-22 years) and the long bond (22+ years) segments of the curve. Meanwhile, credit spreads tightened, indicating that investors were willing to accept somewhat less yield in exchange for assuming credit risk in an environment of generally healthy credit fundamentals.
Lower-rated bonds generally outperformed their higher-rated counterparts, while bonds with longer maturities tended to outpace those with shorter maturities. The following tables highlight these performance trends for the Funds’ fiscal year ended Aug. 31, 2019:
| Returns by credit rating | ||||
AAA | 8.17 | % | ||
AA | 8.37 | % | ||
A | 9.20 | % | ||
BBB | 10.48 | % | ||
| Returns by maturity | ||||
| 1 year | 2.65 | % | ||
5 years | 6.34 | % | ||
10 years | 9.48 | % | ||
22+ years | 11.14 | % | ||
Source: Bloomberg. | ||||
Focused on credit research
For all three of the Funds highlighted in this report, we maintained the same management strategy we employ in all market conditions. We follow abottom-up (bond by bond) investment approach. This means we select bonds for the Funds on an
2
Table of Contents
issuer-by-issuer basis, rather than based on ourtop-down view of interest rates or economic and market conditions. And we rely on diligent credit research to identify securities we believe offer the Funds’ shareholders a favorabletrade-off between risk and reward.
Given this process, the Funds tend to have relatively low allocations to bonds with high credit ratings and greater exposure to securities with lower-investment-grade or below-investment-grade credit ratings. By focusing on higher yielding bonds with solid underlying credit quality, we believe we can potentially add value for the Funds’ shareholders.
As of Aug. 31, 2019, roughly 37% of the net assets ofDelawareTax-Free USA Fundwas invested in bonds with lower-investment-grade credit ratings (A and BBB), and approximately 41% of the net assets ofDelawareTax-Free USA Intermediate Fundwas invested in these same credit tiers. Both Funds also maintained allocations to high yield municipal bonds, securities with credit ratings below BBB. By prospectus, both Funds may hold up to 20% of their net assets in high yield debt, although these allocations remained below that threshold in both Funds throughout the fiscal year. Whenever we invest in the high yield market segment, we thoroughly analyze the securities’ credit risk and emphasize those bonds that we believe offer the Funds’ shareholders a favorable risk-reward balance.
Consistent with its mandate,Delaware National High-Yield Municipal Bond Fundmaintained the largest exposure to high yield bonds of the three Funds. As of Aug. 31, 2019, more than 57% of this Fund’s net assets was held in bonds with credit ratings below BBB, including nonrated bonds.
Portfolio positioning
Throughout the fiscal year, our main objective was to maintain the Funds’ existing credit positioning as best we could. Our challenge was that when
interest rates fell, the Funds experienced naturally shortening durations, as various longtime portfolio holdings approached their maturity or call dates.
Because our management approach entails keeping the Funds’ duration (that is, interest rate sensitivity) relatively neutral compared to peer funds – a reflection of our view that we can more effectively add value through credit selection than by trying to anticipate the direction of interest rate movements – we needed to take proactive steps to maintain that neutral stance in a falling interest rate environment.
Accordingly, new bond purchases often focused on longer-duration bonds, including bonds with longer call dates. We often emphasized areas of the market in which bond issues tend to be noncallable, such as the prepaid gas sector. Proceeds for new purchases came from investment inflows and from bond maturities and calls. Using the proceeds from the sale of certain shorter-duration holdings also helped us keep the Funds neutrally positioned in an environment of falling interest rates, while maintaining the credit-oriented investment approach we regularly follow.
Notable performance factors
As noted, longer-maturity bonds tended to outperform shorter-maturity bonds for the fiscal year, while lower-quality issues generally outperformed their higher-rated counterparts. Such trends are evident as we highlight some of the Funds’ strongest- and weakest-performing securities over the 12 months.
In bothDelawareTax-Free USA FundandDelaware National High-Yield Municipal Bond Fund, for example,top-performing holdings included Kaiser Foundation hospital bonds (+27%), ratedAA- by Standard & Poor’s. These California issues benefited from their relatively long 2047 maturity date and their noncallable status, which positioned them to benefit disproportionately from falling long-term interest rates.
3
Table of Contents
Portfolio management review
Delaware Funds® by Macquarie nationaltax-free funds
Prepaid gas bonds of Salt Verde Financial Corp. also contributed to the performance ofDelawareTax-Free USA FundandDelawareTax-Free USA Intermediate Fund. In a market environment favoring lower-rated securities, these bonds benefited from their lower-investment-grade credit rating of BBB+. Their lack of a call date – common in the prepaid gas sector – also helped lift their performance. These securities returned more than 21% forDelawareTax-Free USA Fundand more than 17% forDelawareTax-Free USA Intermediate Fund.
Another strong-performing prepaid gas issue inDelawareTax-Free USA Intermediate Fundconsisted of bonds for Lower Alabama Gas District (+18%). These securities were similarly noncallable, had a 2034 maturity date, and a lower-investment-grade credit rating.
Further adding value toDelaware National High-Yield Municipal Bond Fundwerezero-coupon, long-maturity Idaho North Star Charter School bonds, which returned 49% for the Fund. These nonrated bonds’ high degree of interest rate sensitivity was a major factor behind their strong results for the12-month period.
In contrast, many of the Funds’ biggest individual underperformers were bonds with short durations and higher credit ratings. In bothDelawareTax-Free USA FundandDelawareTax-Free
USA Intermediate Fund, for example, a position in City of Atlanta water and sewer revenue bonds produced modest returns of less than 2%, reflecting their short durations and higher credit quality. The latter Fund also saw a return of less than 2% from its position in Broward County (Florida) airport revenue bonds, as their shorter call dates held back these securities.
Meanwhile, inDelawareTax-Free USA Fund, a position in California tobacco securitization bonds(-3%) was a relative underperformer for the fiscal year, as tobacco debt lagged, particularly in the first half of the fiscal year, due to weakening industry trends.
The lowest-returning holdings forDelaware National High-Yield Municipal Bond Fundwere two bonds whose issuers experienced financial challenges. These included Texas senior-housing bonds for Buckingham Senior Living Community and Washington State corporate-backed industrial development revenue bonds for Columbia Pulp, a maker of straw used in paper products. These bonds returned-18% and-3%, respectively, for the12-month period. Despite the securities’ recent subpar performance, we continued to have confidence in the long-term prospects of both issuers and, as of Aug. 31, 2019, maintained the Fund’s investment in each.
4
Table of Contents
| Performance summaries | ||
| Delaware Tax-Free USA Fund | August 31, 2019 | |
The performance quoted represents past performance and does not guarantee future results. Investment return and principal value of an investment will fluctuate so that shares, when redeemed, may be worth more or less than their original cost. Current performance may be lower or higher than the performance quoted. Performance data current to the most recent month end may be obtained by calling 800523-1918 or visiting delawarefunds.com/performance.
| Fund and benchmark performance1,2 | Average annual total returns through August 31, 2019 | |||||||||||||||
| 1 year | 5 years | 10 years | Lifetime | |||||||||||||
Class A (Est. Jan. 11, 1984) | ||||||||||||||||
Excluding sales charge | +8.35% | +4.01% | +5.13% | +6.47% | ||||||||||||
Including sales charge | +3.47% | +3.06% | +4.65% | +6.33% | ||||||||||||
Class C (Est. Nov. 29, 1995) | ||||||||||||||||
Excluding sales charge | +7.55% | +3.21% | +4.34% | +3.85% | ||||||||||||
Including sales charge | +6.55% | +3.21% | +4.34% | +3.85% | ||||||||||||
Institutional Class (Est. Dec. 31, 2008) | ||||||||||||||||
Excluding sales charge | +8.68% | +4.26% | +5.45% | +6.23% | ||||||||||||
Including sales charge | +8.68% | +4.26% | +5.45% | +6.23% | ||||||||||||
Bloomberg Barclays Municipal Bond Index | +8.72% | +3.85% | +4.62% | +5.26%* | ||||||||||||
*The benchmark lifetime return is for Institutional Class share comparison only and is calculated using the last business day in the month of the Fund’s Institutional Class inception date.
1Returns reflect the reinvestment of all distributions and are presented both with and without the applicable sales charges described below. Returns do not reflect the deduction of taxes the shareholder would pay on Fund distributions or redemptions of Fund shares.
Expense limitations were in effect for certain classes during some or all of the periods shown in the “Fund and benchmark performance” table. Expenses for each class are listed on the “Fund expense ratios” table on page 7. Performance would have been lower had expense limitations not been in effect.
Institutional Class shares are not subject to a sales charge and are offered for sale exclusively to certain eligible investors. In addition, Institutional Class shares pay no distribution and service(12b-1) fee.
Class A shares are sold with a maximumfront-end sales charge of 4.50%, and have an annual12b-1 fee of 0.25% of average daily net assets. The Board has adopted a formula for calculating12b-1
plan fees for the Fund’s Class A shares. The Fund’s Class A shares are currently subject to a blended12b-1 fee equal to the sum of: (i) 0.10% of average daily net assets representing shares acquired prior to June 1, 1992, and (ii) 0.25% of average daily net assets representing shares acquired on or after June 1, 1992. All Class A shares currently bear12b-1 fees at the same rate, the blended rate, currently 0.25% of average daily net assets, based on the formula described above. This method of calculating Class A12b-1 fees may be discontinued at the sole discretion of the Board. Performance for Class A shares, excluding sales charges, assumes that nofront-end sales charge applied.
Class C shares are sold with a contingent deferred sales charge of 1.00% if redeemed during the first 12 months. They are also subject to an annual12b-1 fee of 1.00% of average daily net assets. Performance for Class C shares, excluding sales charges, assumes either that contingent deferred
5
Table of Contents
Performance summaries
DelawareTax-Free USA Fund
sales charges did not apply or that the investment was not redeemed.
Fixed income securities and bond funds can lose value, and investors can lose principal, as interest rates rise. They also may be affected by economic conditions that hinder an issuer’s ability to make interest and principal payments on its debt.
The Fund may also be subject to prepayment risk, the risk that the principal of a bond that is held by a portfolio will be prepaid prior to maturity, at the time when interest rates are lower than what the bond was paying. A portfolio may then have to reinvest that money at a lower interest rate.
High yielding,non-investment-grade bonds (junk bonds) involve higher risk than investment grade bonds. The high yield secondary market is particularly susceptible to liquidity problems when institutional investors, such as mutual funds and certain other financial institutions, temporarily stop buying bonds for regulatory, financial, or other reasons. In addition, a less liquid secondary market makes it more difficult for the Fund to obtain precise valuations of the high yield securities in its portfolio.
Substantially all dividend income derived fromtax-free funds is exempt from federal income tax. Some income may be subject to state or local and/or the federal alternative minimum tax (AMT) that applies to certain investors. Capital gains, if any, are taxable.
Duration number will change as market conditions change. Therefore, duration should not be solely relied upon to indicate a municipal bond fund’s potential volatility.
This document may mention bond ratings published by nationally recognized statistical rating organizations (NRSROs) Standard & Poor’s, Moody’s Investors Service, and Fitch, Inc. For securities rated by an NRSRO other than S&P, the rating is converted to the equivalent S&P credit rating. Bonds rated AAA are rated as having the highest quality and are generally considered to have the lowest degree of investment risk. Bonds rated AA are considered to be of high quality, but with a slightly higher degree of risk than bonds rated AAA. Bonds rated A are considered to have many favorable investment qualities, though they are somewhat more susceptible to adverse economic conditions. Bonds rated BBB are believed to be of medium-grade quality and generally riskier over the long term. Bonds rated BB, B, and CCC are regarded as having significant speculative characteristics, with BB indicating the least degree of speculation of the three.
6
Table of Contents
2The Fund’s expense ratios, as described in the most recent prospectus, are disclosed in the following “Fund expense ratios” table. Delaware Management Company has agreed to reimburse certain expenses and/or waive certain fees in order to prevent total annual fund operating expenses (excluding any12b-1 fees, acquired fund fees and expenses, taxes, interest, short sale and dividend and interest expenses, brokerage fees, certain insurance costs, and nonroutine expenses or costs, including, but not limited to, those relating to reorganizations, litigation, conducting shareholder meetings, and liquidations) from exceeding 0.56% of the Fund’s average daily net assets during the period from Sept. 1, 2018 to Aug. 31, 2019.** Please see the most recent prospectus and any applicable supplement(s) for additional information on these fee waivers and/or reimbursements. Please see the “Financial highlights” section in this report for the most recent expense ratios.
| Fund expense ratios | Class A | Class C | Institutional Class | |||
Total annual operating expenses | 0.96% | 1.71% | 0.71% | |||
(without fee waivers) | ||||||
Net expenses | 0.81% | 1.56% | 0.56% | |||
(including fee waivers, if any) | ||||||
Type of waiver | Contractual | Contractual | Contractual |
**The aggregate contractual waiver period covering this report is from Dec. 29, 2017 through Dec. 28, 2019.
7
Table of Contents
Performance summaries
DelawareTax-Free USA Fund
Performance of a $10,000 investment1
Average annual total returns from Aug. 31, 2009 through Aug. 31, 2019
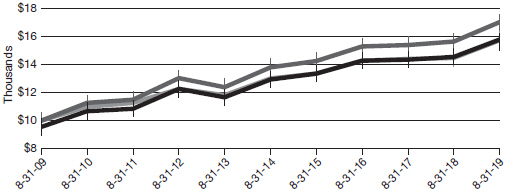
| For period beginning Aug. 31, 2009 through Aug. 31, 2019 | Starting value | Ending value | ||||||||
| DelawareTax-Free USA Fund — Institutional Class shares | $10,000 | $16,999 | |||||||
| DelawareTax-Free USA Fund — Class A shares | $9,550 | $15,753 | |||||||
| Bloomberg Barclays Municipal Bond Index | $10,000 | $15,703 | |||||||


1The “Performance of a $10,000 investment” graph assumes $10,000 invested in Institutional Class and Class A shares of the Fund on Aug. 31, 2009, and includes the effect of a 4.50%front-end sales charge (for Class A shares) and the reinvestment of all distributions. The graph does not reflect the deduction of taxes the shareholders would pay on Fund distributions or redemptions of Fund shares. Expense limitations were in effect for some or all of the periods shown. Performance would have been lower had expense limitations not been in effect. Expenses are listed in the “Fund expense ratios” table on page 7. Please note additional details on pages 5 through 8.
The graph also assumes $10,000 invested in the Bloomberg Barclays Municipal Bond Index as of Aug. 31, 2009. The Bloomberg Barclays Municipal Bond Index measures the total return performance of the long-term, investment gradetax-exempt bond market.
Index performance returns do not reflect any management fees, transaction costs, or expenses. Indices are unmanaged and one cannot invest directly in an index.Past performance is not a guarantee of future results.
Performance of other Fund classes will vary due to different charges and expenses.
| Nasdaq symbols | CUSIPs | |||||
Class A | DMTFX | 245909106 | ||||
Class C | DUSCX | 245909700 | ||||
Institutional Class | DTFIX | 24610H104 |
8
Table of Contents
| Performance summaries | ||
| Delaware Tax-Free USA Intermediate Fund | August 31, 2019 | |
The performance quoted represents past performance and does not guarantee future results. Investment return and principal value of an investment will fluctuate so that shares, when redeemed, may be worth more or less than their original cost. Current performance may be lower or higher than the performance quoted. Performance data current to the most recent month end may be obtained by calling 800523-1918 or visiting delawarefunds.com/performance.
| Fund and benchmark performance1,2 | Average annual total returns through August 31, 2019 | |||||||||||||||
| 1 year | 5 years | 10 years | Lifetime | |||||||||||||
Class A (Est. Jan. 7, 1993) | ||||||||||||||||
Excluding sales charge | +7.71% | +3.13% | +3.79% | +4.71% | ||||||||||||
Including sales charge | +4.78% | +2.55% | +3.51% | +4.60% | ||||||||||||
Class C (Est. Nov. 29, 1995) | ||||||||||||||||
Excluding sales charge | +6.81% | +2.26% | +2.92% | +3.55% | ||||||||||||
Including sales charge | +5.81% | +2.26% | +2.92% | +3.55% | ||||||||||||
Institutional Class (Est. Dec. 31, 2008) | ||||||||||||||||
Excluding sales charge | +7.92% | +3.29% | +4.04% | +4.59% | ||||||||||||
Including sales charge | +7.92% | +3.29% | +4.04% | +4.59% | ||||||||||||
Bloomberg Barclays 3–15 Year Blend Municipal Bond Index | +8.16% | +3.42% | +4.15% | +4.57%* | ||||||||||||
*The benchmark lifetime return is for Institutional Class share comparison only and is calculated using the last business day in the month of the Fund’s Institutional Class inception date.
1Returns reflect the reinvestment of all distributions and are presented both with and without the applicable sales charges described below. Returns do not reflect the deduction of taxes the shareholder would pay on Fund distributions or redemptions of Fund shares.
Expense limitations were in effect for certain classes during some or all of the periods shown in the “Fund and benchmark performance” table. Expenses for each class are listed on the “Fund expense ratios” table on page 11. Performance would have been lower had expense limitations not been in effect.
Institutional Class shares are not subject to a sales charge and are offered for sale exclusively to certain eligible investors. In addition, Institutional Class shares pay no distribution and service(12b-1) fee.
Class A shares are sold with a maximumfront-end sales charge of 2.75%, and have an
annual12b-1 fee of 0.25% of average daily net assets. This fee was contractually limited to 0.15% of average daily net assets from Sept. 1, 2018 through Aug. 31, 2019.** Performance for Class A shares, excluding sales charges, assumes that nofront-end sales charge applied.
Class C shares are sold with a contingent deferred sales charge of 1.00% if redeemed during the first 12 months. They are also subject to an annual12b-1 fee of 1.00% of average daily net assets. Performance for Class C shares, excluding sales charges, assumes either that contingent deferred sales charges did not apply or that the investment was not redeemed.
Fixed income securities and bond funds can lose value, and investors can lose principal, as interest rates rise. They also may be affected by economic conditions that hinder an issuer’s ability to make interest and principal payments on its debt.
9
Table of Contents
Performance summaries
DelawareTax-Free USA Intermediate Fund
The Fund may also be subject to prepayment risk, the risk that the principal of a bond that is held by a portfolio will be prepaid prior to maturity, at the time when interest rates are lower than what the bond was paying. A portfolio may then have to reinvest that money at a lower interest rate.
High yielding,non-investment-grade bonds (junk bonds) involve higher risk than investment grade bonds. The high yield secondary market is particularly susceptible to liquidity problems when institutional investors, such as mutual funds and certain other financial institutions, temporarily stop buying bonds for regulatory, financial, or other reasons. In addition, a less liquid secondary market makes it more difficult for the Fund to obtain precise valuations of the high yield securities in its portfolio.
Substantially all dividend income derived fromtax-free funds is exempt from federal income tax. Some income may be subject to state or local taxes and/or the federal alternative minimum tax (AMT) that applies to certain investors. Capital gains, if any, are taxable.
Duration number will change as market conditions change. Therefore, duration should not be solely relied upon to indicate a municipal bond fund’s potential volatility.
This document may mention bond ratings published by nationally recognized statistical rating organizations (NRSROs) Standard & Poor’s, Moody’s Investors Service, and Fitch, Inc. For securities rated by an NRSRO other than S&P, the rating is converted to the equivalent S&P credit rating. Bonds rated AAA are rated as having the highest quality and are generally considered to have the lowest degree of investment risk. Bonds rated AA are considered to be of high quality, but with a slightly higher degree of risk than bonds rated AAA. Bonds rated A are considered to have many favorable investment qualities, though they are somewhat more susceptible to adverse economic conditions. Bonds rated BBB are believed to be of medium-grade quality and generally riskier over the long term. Bonds rated BB, B, and CCC are regarded as having significant speculative characteristics, with BB indicating the least degree of speculation of the three.
10
Table of Contents
2The Fund’s expense ratios, as described in the most recent prospectus, are disclosed in the following “Fund expense ratios” table. Delaware Management Company has agreed to reimburse certain expenses and/or waive certain fees in order to prevent total annual fund operating expenses (excluding any12b-1 fees, acquired fund fees and expenses, taxes, interest, short sale and dividend and interest expenses, brokerage fees, certain insurance costs, and nonroutine expenses or costs, including, but not limited to, those relating to reorganizations, litigation, conducting shareholder meetings, and liquidations) from exceeding 0.50% of the Fund’s average daily net assets during the period from Sept. 1, 2018 to Aug. 31, 2019.*** Please see the most recent prospectus and any applicable supplement(s) for additional information on these fee waivers and/or reimbursements. Please see the “Financial highlights” section in this report for the most recent expense ratios.
| Fund expense ratios | Class A | Class C | Institutional Class | |||
Total annual operating expenses (without fee waivers) | 0.92% | 1.67% | 0.67% | |||
Net expenses (including fee waivers, if any) | 0.65% | 1.50% | 0.50% | |||
Type of waiver | Contractual | Contractual | Contractual |
**The aggregate contractual waiver period covering this report is from Dec. 29, 2017 through Dec. 28, 2019.
***The aggregate contractual waiver period covering this report is from April 1, 2018 through Dec. 28, 2019.
11
Table of Contents
Performance summaries
DelawareTax-Free USA Intermediate Fund
Performance of a $10,000 investment1
Average annual total returns from Aug. 31, 2009 through Aug. 31, 2019
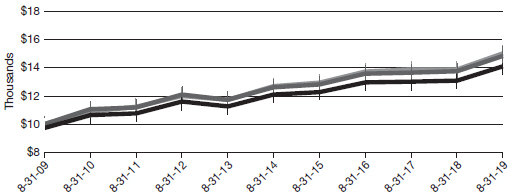
| For period beginning Aug. 31, 2009 through Aug. 31, 2019 | Starting value | Ending value | ||||||||
| Bloomberg Barclays 3–15 Year Blend Municipal Bond Index | $10,000 | $15,019 | |||||||
| DelawareTax-Free USA Intermediate Fund — Institutional Class shares | $10,000 | $14,853 | |||||||
| DelawareTax-Free USA Intermediate Fund — Class A shares | $9,725 | $14,118 | |||||||


1The “Performance of a $10,000 investment” graph assumes $10,000 invested in Institutional Class and Class A shares of the Fund on Aug. 31, 2009, and includes the effect of a 2.75%front-end sales charge (for Class A shares) and the reinvestment of all distributions. The graph does not reflect the deduction of taxes the shareholders would pay on Fund distributions or redemptions of Fund shares. Expense limitations were in effect for some or all of the periods shown. Performance would have been lower had expense limitations not been in effect. Expenses are listed in the “Fund expense ratios” table on page 11. Please note additional details on pages 9 through 13.
The graph also assumes $10,000 invested in the Bloomberg Barclays 3–15 Year Blend Municipal Bond Index as of Aug. 31, 2009. The Bloomberg Barclays 3–15 Year Blend Municipal Bond Index measures the total return performance of investment grade, UStax-exempt bonds with maturities from 2 to 17 years.
Index performance returns do not reflect any management fees, transaction costs, or expenses. Indices are unmanaged and one cannot invest directly in an index.Past performance is not a guarantee of future results.
Performance of other Fund classes will vary due to different charges and expenses.
12
Table of Contents
| Nasdaq symbols | CUSIPs | |||||
Class A | DMUSX | 245909304 | ||||
Class C | DUICX | 245909882 | ||||
Institutional Class | DUSIX | 24610H203 |
13
Table of Contents
| Performance summaries | ||
| Delaware National High-Yield Municipal Bond Fund | August 31, 2019 | |
The performance quoted represents past performance and does not guarantee future results. Investment return and principal value of an investment will fluctuate so that shares, when redeemed, may be worth more or less than their original cost. Current performance may be lower or higher than the performance quoted. Performance data current to the most recent month end may be obtained by calling 800523-1918 or visiting delawarefunds.com/performance.
| Fund and benchmark performance1,2 | Average annual total returns through August 31, 2019 | |||||||||||||||
| 1 year | 5 years | 10 years | Lifetime | |||||||||||||
Class A (Est. Sept. 22, 1986) | ||||||||||||||||
Excluding sales charge | +8.81% | +5.63% | +7.12% | +6.30% | ||||||||||||
Including sales charge | +3.90% | +4.66% | +6.63% | +6.15% | ||||||||||||
Class C (Est. May 26, 1997) | ||||||||||||||||
Excluding sales charge | +7.98% | +4.81% | +6.31% | +4.71% | ||||||||||||
Including sales charge | +6.98% | +4.81% | +6.31% | +4.71% | ||||||||||||
Institutional Class (Est. Dec. 31, 2008) | ||||||||||||||||
Excluding sales charge | +9.03% | +5.88% | +7.46% | +9.04% | ||||||||||||
Including sales charge | +9.03% | +5.88% | +7.46% | +9.04% | ||||||||||||
Bloomberg Barclays Municipal Bond Index | +8.72% | +3.85% | +4.62% | +5.26%* | ||||||||||||
*The benchmark lifetime return is for Institutional Class share comparison only and is calculated using the last business day in the month of the Fund’s Institutional Class inception date.
1Returns reflect the reinvestment of all distributions and are presented both with and without the applicable sales charges described below. Returns do not reflect the deduction of taxes the shareholder would pay on Fund distributions or redemptions of Fund shares.
Expense limitations were in effect for certain classes during some or all of the periods shown in the “Fund and benchmark performance” table. Expenses for each class are listed on the “Fund expense ratios” table on page 16. Performance would have been lower had expense limitations not been in effect.
Institutional Class shares are not subject to a sales charge and are offered for sale exclusively to certain eligible investors. In addition, Institutional Class shares pay no distribution and service(12b-1) fee.
Class A shares are sold with a maximumfront-end sales charge of 4.50%, and have an annual12b-1
fee of 0.25% of average daily net assets. Performance for Class A shares, excluding sales charges, assumes that nofront-end sales charge applied.
Class C shares are sold with a contingent deferred sales charge of 1.00% if redeemed during the first 12 months. They are also subject to an annual12b-1 fee of 1.00% of average daily net assets. Performance for Class C shares, excluding sales charges, assumes either that contingent deferred sales charges did not apply or that the investment was not redeemed.
Fixed income securities and bond funds can lose value, and investors can lose principal, as interest rates rise. They also may be affected by economic conditions that hinder an issuer’s ability to make interest and principal payments on its debt.
The Fund may also be subject to prepayment risk, the risk that the principal of a bond that is held by a portfolio will be prepaid prior to maturity, at the time when interest rates are lower than what
14
Table of Contents
the bond was paying. A portfolio may then have to reinvest that money at a lower interest rate.
High yielding,non-investment-grade bonds (junk bonds) involve higher risk than investment grade bonds. The high yield secondary market is particularly susceptible to liquidity problems when institutional investors, such as mutual funds and certain other financial institutions, temporarily stop buying bonds for regulatory, financial, or other reasons. In addition, a less liquid secondary market makes it more difficult for the Fund to obtain precise valuations of the high yield securities in its portfolio.
Substantially all dividend income derived fromtax-free funds is exempt from federal income tax. Some income may be subject to state or local taxes and/or the federal alternative minimum tax (AMT) that applies to certain investors. Capital gains, if any, are taxable.
Duration number will change as market conditions change. Therefore, duration should not be solely relied upon to indicate a municipal bond fund’s potential volatility.
This document may mention bond ratings published by nationally recognized statistical rating organizations (NRSROs) Standard & Poor’s, Moody’s Investors Service, and Fitch, Inc. For securities rated by an NRSRO other than S&P, the rating is converted to the equivalent S&P credit rating. Bonds rated AAA are rated as having the highest quality and are generally considered to have the lowest degree of investment risk. Bonds rated AA are considered to be of high quality, but with a slightly higher degree of risk than bonds rated AAA. Bonds rated A are considered to have many favorable investment qualities, though they are somewhat more susceptible to adverse economic conditions. Bonds rated BBB are believed to be of medium-grade quality and generally riskier over the long term. Bonds rated BB, B, and CCC are regarded as having significant speculative characteristics, with BB indicating the least degree of speculation of the three.
15
Table of Contents
Performance summaries
Delaware National High-Yield Municipal Bond Fund
2The Fund’s expense ratios, as described in the most recent prospectus, are disclosed in the following “Fund expense ratios” table. Delaware Management Company has agreed to reimburse certain expenses and/or waive certain fees in order to prevent total annual fund operating expenses (excluding any12b-1 fees, acquired fund fees and expenses, taxes, interest, short sale and dividend and interest expenses, brokerage fees, certain insurance costs, and nonroutine expenses or costs, including, but not limited to, those relating to reorganizations, litigation, conducting shareholder meetings, and liquidations) from exceeding 0.60% of the Fund’s average daily net assets during the period from Sept. 1, 2018 to Aug. 31, 2019.** Please see the most recent prospectus and any applicable supplement(s) for additional information on these fee waivers and/or reimbursements. Please see the “Financial highlights” section in this report for the most recent expense ratios.
| Fund expense ratios | Class A | Class C | Institutional Class | |||
Total annual operating expenses (without fee waivers) | 0.91% | 1.66% | 0.66% | |||
Net expenses (including fee waivers, if any) | 0.85% | 1.60% | 0.60% | |||
Type of waiver | Contractual | Contractual | Contractual |
**The aggregate contractual waiver period covering this report is from Dec. 29, 2017 through Dec. 28, 2019.
16
Table of Contents
Performance of a $10,000 investment1
Average annual total returns from Aug. 31, 2009 through Aug. 31, 2019
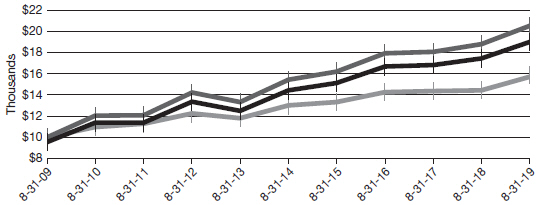
| For period beginning Aug. 31, 2009 through Aug. 31, 2019 | Starting value | Ending value | ||||||||
| Delaware National High-Yield Municipal Bond Fund — Institutional Class shares | $10,000 | $20,540 | |||||||
| Delaware National High-Yield Municipal Bond Fund — Class A shares | $9,550 | $19,007 | |||||||
| Bloomberg Barclays Municipal Bond Index | $10,000 | $15,703 | |||||||


1The “Performance of a $10,000 investment” graph assumes $10,000 invested in Institutional Class and Class A shares of the Fund on Aug. 31, 2009, and includes the effect of a 4.50%front-end sales charge (for Class A shares) and the reinvestment of all distributions. The graph does not reflect the deduction of taxes the shareholders would pay on Fund distributions or redemptions of Fund shares. Expense limitations were in effect for some or all of the periods shown. Performance would have been lower had expense limitations not been in effect. Expenses are listed in the “Fund expense ratios” table on page 16. Please note additional details on pages 14 through 17.
The graph also assumes $10,000 invested in the Bloomberg Barclays Municipal Bond Index as of Aug. 31, 2009. The Bloomberg Barclays Municipal Bond Index measures the total return performance of the long-term, investment gradetax-exempt bond market.
Index performance returns do not reflect any management fees, transaction costs, or expenses. Indices are unmanaged and one cannot invest directly in an index.Past performance is not a guarantee of future results.
Performance of other Fund classes will vary due to different charges and expenses.
| Nasdaq symbols | CUSIPs | |||||||
Class A | CXHYX | 928928241 | ||||||
Class C | DVHCX | 928928225 | ||||||
Institutional Class | DVHIX | 24610H302 |
17
Table of Contents
For thesix-month period from March 1, 2019 to August 31, 2019 (Unaudited)
As a shareholder of a Fund, you incur two types of costs: (1) transaction costs, including sales charges (loads) on purchase payments, reinvested dividends, or other distributions; redemption fees; and exchange fees; and (2) ongoing costs, including management fees; distribution and service(12b-1) fees; and other Fund expenses. These following examples are intended to help you understand your ongoing costs (in dollars) of investing in a Fund and to compare these costs with the ongoing costs of investing in other mutual funds.
The examples are based on an investment of $1,000 invested at the beginning of the period and held for the entiresix-month period from March 1, 2019 to Aug. 31, 2019.
Actual expenses
The first section of the tables shown, “Actual Fund return,” provides information about actual account values and actual expenses. You may use the information in this section of the table, together with the amount you invested, to estimate the expenses that you paid over the period. Simply divide your account value by $1,000 (for example, an $8,600 account value divided by $1,000 = 8.6), then multiply the result by the number in the first section under the heading entitled “Expenses Paid During Period” to estimate the expenses you paid on your account during this period.
Hypothetical example for comparison purposes
The second section of the tables shown, “Hypothetical 5% return,” provides information about hypothetical account values and hypothetical expenses based on the Funds’ actual expense ratios and an assumed rate of return of 5% per year before expenses, which is not the Funds’ actual return. The hypothetical account values and expenses may not be used to estimate the actual ending account balance or expenses you paid for the period. You may use this information to compare the ongoing costs of investing in each Fund and other funds. To do so, compare this 5% hypothetical example with the 5% hypothetical examples that appear in the shareholder reports of the other funds.
Please note that the expenses shown in the tables are meant to highlight your ongoing costs only and do not reflect any transactional costs, such as sales charges (loads), redemption fees, or exchange fees. Therefore, the second section of each table is useful in comparing ongoing costs only, and will not help you determine the relative total costs of owning different funds. In addition, if these transactional costs were included, your costs would have been higher. The Funds’ expenses shown in the tables reflect fee waivers in effect and assume reinvestment of all dividends and distributions.
18
Table of Contents
DelawareTax-Free USA Fund
Expense analysis of an investment of $1,000
| Beginning Account Value 3/1/19 | Ending Account Value 8/31/19 | Annualized Expense Ratio | Expenses Paid During Period 3/1/19 to 8/31/19* | |||||||||||||||||
Actual Fund return† | ||||||||||||||||||||
Class A | $1,000.00 | $1,073.10 | 0.81 | % | $4.23 | |||||||||||||||
Class C | 1,000.00 | 1,069.00 | 1.56 | % | 8.14 | |||||||||||||||
Institutional Class | 1,000.00 | 1,074.90 | 0.56 | % | 2.93 | |||||||||||||||
| Hypothetical 5% return(5% return before expenses) |
| |||||||||||||||||||
Class A | $1,000.00 | $1,021.12 | 0.81 | % | $4.13 | |||||||||||||||
Class C | 1,000.00 | 1,017.34 | 1.56 | % | 7.93 | |||||||||||||||
Institutional Class | 1,000.00 | 1,022.38 | 0.56 | % | 2.85 | |||||||||||||||
| DelawareTax-Free USA Intermediate Fund |
| |||||||||||||||||||
| Expense analysis of an investment of $1,000 |
| |||||||||||||||||||
| Beginning Account Value 3/1/19 | Ending Account Value 8/31/19 | Annualized Expense Ratio | Expenses Paid During Period 3/1/19 to 8/31/19* | |||||||||||||||||
Actual Fund return† | ||||||||||||||||||||
Class A | $1,000.00 | $1,060.80 | 0.65 | % | $3.38 | |||||||||||||||
Class C | 1,000.00 | 1,056.30 | 1.50 | % | 7.77 | |||||||||||||||
Institutional Class | 1,000.00 | 1,062.00 | 0.50 | % | 2.60 | |||||||||||||||
| Hypothetical 5% return(5% return before expenses) |
| |||||||||||||||||||
Class A | $1,000.00 | $1,021.93 | 0.65 | % | $3.31 | |||||||||||||||
Class C | 1,000.00 | 1,017.64 | 1.50 | % | 7.63 | |||||||||||||||
Institutional Class | 1,000.00 | 1,022.68 | 0.50 | % | 2.55 | |||||||||||||||
19
Table of Contents
Disclosure of Fund expenses
For thesix-month period from March 1, 2019 to August 31, 2019 (Unaudited)
Delaware National High-Yield Municipal Bond Fund
Expense analysis of an investment of $1,000
| Beginning Account Value 3/1/19 | Ending Account Value 8/31/19 | Annualized Expense Ratio | Expenses Paid During Period 3/1/19 to 8/31/19* | |||||||||||||||||
Actual Fund return† | ||||||||||||||||||||
Class A | $ | 1,000.00 | $ | 1,085.10 | 0.85 | % | $ | 4.47 | ||||||||||||
Class C | 1,000.00 | 1,079.80 | 1.60 | % | 8.39 | |||||||||||||||
Institutional Class | 1,000.00 | 1,085.80 | 0.60 | % | 3.15 | |||||||||||||||
| Hypothetical 5% return(5% return before expenses) |
| |||||||||||||||||||
Class A | $ | 1,000.00 | $ | 1,020.92 | 0.85 | % | $ | 4.33 | ||||||||||||
Class C | 1,000.00 | 1,017.14 | 1.60 | % | 8.13 | |||||||||||||||
Institutional Class | 1,000.00 | 1,022.18 | 0.60 | % | 3.06 | |||||||||||||||
| *“ | Expenses Paid During Period” are equal to the relevant Fund’s annualized expense ratio, multiplied by the average account value over the period, multiplied by 184/365 (to reflect theone-half year period). |
| † | Because actual returns reflect only the most recentsix-month period, the returns shown may differ significantly from fiscal year returns. |
20
Table of Contents
| Security type / sector / state / territory allocations | ||
| Delaware Tax-Free USA Fund | As of August 31, 2019 (Unaudited) | |
Sector designations may be different than the sector designations presented in other fund materials.
| Security type / sector | Percentage of net assets | ||||
Municipal Bonds* | 100.12% | ||||
Corporate Revenue Bonds | 13.32% | ||||
Education Revenue Bonds | 9.96% | ||||
Electric Revenue Bonds | 4.59% | ||||
Healthcare Revenue Bonds | 11.96% | ||||
Lease Revenue Bonds | 2.66% | ||||
Local General Obligation Bonds | 9.17% | ||||
Pre-Refunded/Escrowed to Maturity Bonds | 10.34% | ||||
Special Tax Revenue Bonds | 10.61% | ||||
State General Obligation Bonds | 12.07% | ||||
Transportation Revenue Bonds | 14.62% | ||||
Water & Sewer Revenue Bonds | 0.82% | ||||
Short-Term Investments | 0.61% | ||||
Total Value of Securities | 100.73% | ||||
Liabilities Net of Receivables and Other Assets | (0.73%) | ||||
Total Net Assets | 100.00% | ||||
*As of the date of this report, DelawareTax-Free USA Fund held bonds issued by or on behalf of territories and the states of the US as follows:
| State / territory | Percentage of net assets | |
Alabama | 1.88% | |
Arizona | 4.61% | |
California | 14.14% | |
Colorado | 3.86% | |
Connecticut | 1.41% | |
Delaware | 0.13% | |
Florida | 2.66% | |
Georgia | 0.98% | |
Idaho | 0.03% | |
Illinois | 7.33% | |
Indiana | 1.63% | |
Kansas | 0.23% | |
Louisiana | 0.38% | |
Maryland | 3.28% | |
Massachusetts | 2.23% | |
Michigan | 0.21% | |
Minnesota | 1.59% | |
Mississippi | 0.14% | |
Missouri | 0.94% | |
Nebraska | 1.05% |
21
Table of Contents
Security type / sector / state / territory allocations
DelawareTax-Free USA Fund
| State / territory | Percentage of net assets | |
New Jersey | 4.82% | |
New York | 11.61% | |
North Carolina | 3.96% | |
Ohio | 4.57% | |
Oklahoma | 2.42% | |
Oregon | 0.12% | |
Pennsylvania | 4.12% | |
Puerto Rico | 4.04% | |
Texas | 12.74% | |
Utah | 0.65% | |
Virginia | 1.49% | |
Washington | 0.59% | |
Wisconsin | 0.89% | |
Total Value of Securities | 100.73% |
22
Table of Contents
| Security type / sector / state / territory allocations | ||
| DelawareTax-Free USA Intermediate Fund | As of August 31, 2019 (Unaudited) | |
Sector designations may be different than the sector designations presented in other fund materials.
| Security type / sector | Percentage of net assets | |
Municipal Bonds* | 98.56% | |
Corporate Revenue Bonds | 13.73% | |
Education Revenue Bonds | 6.11% | |
Electric Revenue Bonds | 2.68% | |
Healthcare Revenue Bonds | 9.93% | |
Lease Revenue Bonds | 4.75% | |
Local General Obligation Bonds | 8.02% | |
Pre-Refunded/Escrowed to Maturity Bonds | 4.73% | |
Special Tax Revenue Bonds | 12.01% | |
State General Obligation Bonds | 18.79% | |
Transportation Revenue Bonds | 14.71% | |
Water & Sewer Revenue Bonds | 3.10% | |
Short-Term Investments | 0.28% | |
Total Value of Securities | 98.84% | |
Receivables and Other Assets Net of Liabilities | 1.16% | |
Total Net Assets | 100.00% | |
*As of the date of this report, DelawareTax-Free USA Intermediate Fund held bonds issued by or on behalf of territories and the states of the US as follows:
| ||
| State / territory | Percentage of net assets | |
Alabama | 1.52% | |
Arizona | 9.46% | |
California | 15.32% | |
Colorado | 1.00% | |
Connecticut | 1.43% | |
Delaware | 0.06% | |
Florida | 1.68% | |
Georgia | 1.22% | |
Hawaii | 0.65% | |
Idaho | 0.56% | |
Illinois | 7.32% | |
Iowa | 0.10% | |
Kansas | 0.29% | |
Kentucky | 1.03% | |
Louisiana | 2.80% | |
Maryland | 1.33% | |
Massachusetts | 2.13% | |
Michigan | 0.82% | |
Minnesota | 1.53% | |
Mississippi | 0.26% | |
23
Table of Contents
Security type / sector / state / territory allocations
DelawareTax-Free USA Intermediate Fund
| State / territory | Percentage of net assets | |
Missouri | 0.29% | |
Montana | 0.09% | |
New Jersey | 3.80% | |
New York | 16.27% | |
North Carolina | 0.75% | |
Ohio | 0.21% | |
Oklahoma | 0.60% | |
Oregon | 1.65% | |
Pennsylvania | 6.08% | |
Puerto Rico | 1.95% | |
South Carolina | 0.58% | |
Tennessee | 0.81% | |
Texas | 9.70% | |
Utah | 0.48% | |
Virginia | 2.12% | |
Washington | 1.70% | |
Wisconsin | 1.25% | |
Total Value of Securities | 98.84% |
24
Table of Contents
| Security type / sector / state / territory allocations | ||
| Delaware National High-Yield Municipal Bond Fund | As of August 31, 2019 (Unaudited) | |
Sector designations may be different than the sector designations presented in other fund materials.
| Security type / sector | Percentage of net assets | |
Municipal Bonds* | 100.00% | |
Corporate Revenue Bonds | 18.48% | |
Education Revenue Bonds | 19.07% | |
Electric Revenue Bonds | 1.95% | |
Healthcare Revenue Bonds | 23.42% | |
Housing Revenue Bonds | 0.49% | |
Lease Revenue Bonds | 3.95% | |
Local General Obligation Bonds | 4.30% | |
Pre-Refunded/Escrowed to Maturity Bonds | 4.23% | |
Resource Recovery Revenue Bonds | 0.53% | |
Special Tax Revenue Bonds | 9.43% | |
State General Obligation Bonds | 5.90% | |
Transportation Revenue Bonds | 5.44% | |
Water & Sewer Revenue Bonds | 2.81% | |
Total Value of Securities | 100.00% | |
Receivables and Other Assets Net of Liabilities | 0.00% | |
Total Net Assets | 100.00% | |
*As of the date of this report, Delaware National High-Yield Municipal Bond Fund held bonds issued by or on behalf of territories and the states of the US as follows:
| ||
| State / territory | Percentage of net assets | |
Alabama | 3.10% | |
Arizona | 6.12% | |
Arkansas | 0.60% | |
California | 15.37% | |
Colorado | 2.86% | |
Delaware | 0.11% | |
District of Columbia | 0.29% | |
Florida | 3.74% | |
Georgia | 1.35% | |
Hawaii | 0.55% | |
Idaho | 0.65% | |
Illinois | 8.99% | |
Indiana | 1.76% | |
Iowa | 0.48% | |
Kansas | 0.36% | |
Kentucky | 1.10% | |
Louisiana | 1.05% | |
Maine | 0.13% | |
Maryland | 1.19% | |
25
Table of Contents
Security type / sector / state / territory allocations
Delaware National High-Yield Municipal Bond Fund
| State / territory | Percentage of net assets | |
Massachusetts | 0.44% | |
Michigan | 0.51% | |
Minnesota | 2.14% | |
Missouri | 1.78% | |
Montana | 0.10% | |
Nebraska | 0.30% | |
Nevada | 0.71% | |
New Hampshire | 0.43% | |
New Jersey | 3.53% | |
New York | 4.64% | |
North Carolina | 1.08% | |
Ohio | 6.63% | |
Oklahoma | 0.39% | |
Oregon | 0.38% | |
Pennsylvania | 4.84% | |
Puerto Rico | 6.05% | |
South Carolina | 0.39% | |
Tennessee | 0.30% | |
Texas | 8.14% | |
Utah | 0.09% | |
Vermont | 0.08% | |
Virginia | 2.80% | |
Washington | 1.39% | |
West Virginia | 0.19% | |
Wisconsin | 2.80% | |
Wyoming | 0.07% | |
Total Value of Securities | 100.00% |
26
Table of Contents
| Schedules of investments | ||
| Delaware Tax-Free USA Fund | August 31, 2019 | |
| Principal amount° | Value (US $) | |||||||
Municipal Bonds – 100.12% | ||||||||
Corporate Revenue Bonds – 13.32% | ||||||||
Buckeye, Ohio Tobacco Settlement Financing Authority | ||||||||
(Asset-Backed Senior Turbo) SeriesA-2 5.875% 6/1/47 | 16,725,000 | $ | 16,808,792 | |||||
Central Plains, Nebraska Energy Project | ||||||||
(Project No. 3) | ||||||||
Series A 5.00% 9/1/31 | 2,810,000 | 3,625,012 | ||||||
Series A 5.00% 9/1/35 | 2,160,000 | 2,898,137 | ||||||
Florida Development Finance Corporation Surface Transportation Facility Revenue | ||||||||
(Virgin Trains USA Passenger Rail Project) Series A 144A 6.50% 1/1/49 | 5,050,000 | 4,816,639 | ||||||
Golden State, California Tobacco Securitization Corporate Settlement Revenue | ||||||||
(Capital Appreciation-Asset-Backed) Series B 1.548% 6/1/47 ^ | 9,410,000 | 1,616,262 | ||||||
Indiana Finance Authority Exempt Facility Revenue | ||||||||
(Polyflow Indiana Project - Green Bond) 144A 7.00% 3/1/39 (AMT)# | 5,700,000 | 5,895,396 | ||||||
Lower Alabama Gas District | ||||||||
Series A 5.00% 9/1/34 | 4,400,000 | 5,858,380 | ||||||
Series A 5.00% 9/1/46 | 2,500,000 | 3,648,475 | ||||||
M-S-R Energy Authority, California Gas Revenue | ||||||||
Series A 6.125% 11/1/29 | 1,915,000 | 2,477,780 | ||||||
Series B 6.50% 11/1/39 | 5,000,000 | 7,997,400 | ||||||
Series C 6.50% 11/1/39 | 1,500,000 | 2,399,220 | ||||||
New Jersey Economic Development Authority Revenue | ||||||||
(Continental Airlines Project) Series B 5.625% 11/15/30 (AMT) | 1,365,000 | 1,587,945 | ||||||
New Jersey Tobacco Settlement Financing | ||||||||
Series B 5.00% 6/1/46 | 2,080,000 | 2,329,725 | ||||||
New York Liberty Development Corporation Revenue | ||||||||
(Goldman Sachs Headquarters) 5.25% 10/1/35 | 685,000 | 953,582 | ||||||
(Second Priority - Bank of America Tower) Class 3 6.375% 7/15/49 | 1,000,000 | 1,019,900 | ||||||
New York Transportation Development Corporation Special Facility Revenue | ||||||||
(Delta Air Lines, Inc. - LaGuardia Airport Terminals C&D Redevelopment Project) Series 2018 4.00% 1/1/36 (AMT) | 910,000 | 1,006,651 | ||||||
Public Authority for Colorado Energy Natural Gas Revenue | ||||||||
6.50% 11/15/38 | 5,000,000 | 7,798,750 | ||||||
Salt Verde, Arizona Financial Senior Gas Revenue | ||||||||
5.00% 12/1/37 | 1,600,000 | 2,219,824 | ||||||
27
Table of Contents
Schedules of investments
Delaware Tax-Free USA Fund
| Principal amount° | Value (US $) | |||||||
Municipal Bonds(continued) | ||||||||
Corporate Revenue Bonds(continued) | ||||||||
Shoals, Indiana | ||||||||
(National Gypsum Co. Project) 7.25% 11/1/43 (AMT) | 1,940,000 | $ | 2,168,959 | |||||
Valparaiso, Indiana | ||||||||
(Pratt Paper, LLC Project) 7.00% 1/1/44 (AMT) | 1,780,000 | 2,109,015 | ||||||
Virginia Tobacco Settlement Financing | ||||||||
(Capital Appreciation) Series C 2.419% 6/1/47 ^ | 31,035,000 | 3,646,302 | ||||||
|
| |||||||
| 82,882,146 | ||||||||
|
| |||||||
Education Revenue Bonds – 9.96% | ||||||||
Arizona Industrial Development Authority Revenue | ||||||||
(American Charter Schools Foundation Project) 144A 6.00% 7/1/47 # | 1,385,000 | 1,589,481 | ||||||
Auburn University, Alabama General Fee Revenue | ||||||||
Series A 5.00% 6/1/33 | 1,720,000 | 2,192,123 | ||||||
California Educational Facilities Authority Revenue | ||||||||
(Loma Linda University) Series A 5.00% 4/1/47 | 1,000,000 | 1,184,040 | ||||||
(Stanford University) SeriesV-1 5.00% 5/1/49 | 12,325,000 | 19,625,960 | ||||||
California State University | ||||||||
(Systemwide) Series A 5.00% 11/1/42 | 700,000 | 861,749 | ||||||
Capital Trust Agency, Florida Revenue | ||||||||
(University Bridge, LLC Student Housing Project) Series A 144A 5.25% 12/1/43 # | 2,000,000 | 2,162,520 | ||||||
Illinois Finance Authority Revenue | ||||||||
(University of Illinois at Chicago Project) | ||||||||
Series A 5.00% 2/15/47 | 1,860,000 | 2,119,433 | ||||||
Series A 5.00% 2/15/50 | 540,000 | 613,732 | ||||||
Kent County, Delaware | ||||||||
(Delaware State University Project) Series A 5.00% 7/1/53 | 710,000 | 787,383 | ||||||
New Jersey Economic Development Authority | ||||||||
(Provident Group - Montclair State University) 5.00% 6/1/42 (AGM) | 1,250,000 | 1,483,063 | ||||||
Pennsylvania State Higher Educational Facilities Authority Student Housing Revenue | ||||||||
(University Properties Inc. - East Stroudsburg University of Pennsylvania) 5.00% 7/1/31 | 3,000,000 | 3,073,470 | ||||||
Pima County, Arizona Industrial Development Authority Education Revenue | ||||||||
(American Leadership Academy Project) | ||||||||
144A 5.00% 6/15/47 # | 655,000 | 677,794 | ||||||
144A 5.00% 6/15/52 # | 560,000 | 578,738 | ||||||
University of California | ||||||||
Series AZ 5.25% 5/15/58 | 2,860,000 | 3,584,438 | ||||||
28
Table of Contents
| Principal amount° | Value (US $) | |||||||
Municipal Bonds(continued) | ||||||||
Education Revenue Bonds(continued) | ||||||||
University of Michigan | ||||||||
Series A 5.00% 4/1/30 | 1,000,000 | $ | 1,331,190 | |||||
University of Texas System Board of Regents | ||||||||
Series B 5.00% 8/15/49 | 12,500,000 | 20,122,750 | ||||||
|
| |||||||
| 61,987,864 | ||||||||
|
| |||||||
Electric Revenue Bonds – 4.59% | ||||||||
Electric and Gas Systems Revenue San Antonio, Texas | ||||||||
5.25% 2/1/24 | 2,500,000 | 2,950,825 | ||||||
Long Island, New York Power Authority Electric System Revenue | ||||||||
5.00% 9/1/47 | 1,605,000 | 1,954,890 | ||||||
Puerto Rico Electric Power Authority Revenue | ||||||||
Series A 5.00% 7/1/42 ‡ | 3,135,000 | 2,508,000 | ||||||
Series CCC 5.25% 7/1/27 ‡ | 300,000 | 240,750 | ||||||
Series WW 5.00% 7/1/28 ‡ | 400,000 | 320,000 | ||||||
Series XX 5.25% 7/1/40 ‡ | 2,870,000 | 2,303,175 | ||||||
Salt River, Arizona Project Agricultural Improvement & Power District Electric Systems Revenue | ||||||||
Series A 5.00% 12/1/35 | 4,610,000 | 5,508,120 | ||||||
(Salt River Project Electric System) | ||||||||
Series A 5.00% 1/1/30 | 6,000,000 | 7,751,880 | ||||||
Series A 5.00% 1/1/39 | 4,000,000 | 5,028,680 | ||||||
|
| |||||||
| 28,566,320 | ||||||||
|
| |||||||
Healthcare Revenue Bonds – 11.96% | ||||||||
Alachua County, Florida Health Facilities Authority | ||||||||
(Oak Hammock University) Series A 8.00% 10/1/42 | 1,000,000 | 1,138,580 | ||||||
Allegheny County, Pennsylvania Hospital Development Authority Revenue | ||||||||
(Allegheny Health Network Obligated Group Issue) | ||||||||
Series A 4.00% 4/1/44 | 1,800,000 | 1,963,530 | ||||||
Series A 5.00% 4/1/47 | 1,800,000 | 2,155,356 | ||||||
Apple Valley, Minnesota | ||||||||
(Senior Living, LLC Project Fourth Tier) Series D 7.25% 1/1/52 | 2,500,000 | 2,606,100 | ||||||
(Senior Living, LLC Project Second Tier) Series B 5.00% 1/1/47 | 2,500,000 | 2,546,425 | ||||||
Arizona Industrial Development Authority Revenue | ||||||||
(Great Lakes Senior Living Communities LLC Project) Series A 5.00% 1/1/54 | 1,070,000 | 1,221,480 | ||||||
(Second Tier - Great Lakes Senior Living Communities LLC Project) | ||||||||
Series B 5.00% 1/1/49 | 400,000 | 448,604 | ||||||
Series B 5.125% 1/1/54 | 470,000 | 530,071 | ||||||
29
Table of Contents
Schedules of investments
Delaware Tax-Free USA Fund
| Principal amount° | Value (US $) | |||||||
Municipal Bonds(continued) | ||||||||
Healthcare Revenue Bonds(continued) | ||||||||
Brookhaven Development Authority Revenue, Georgia | ||||||||
(Children’s Healthcare of Atlanta) Series A 4.00% 7/1/49 | 1,810,000 | $ | 2,051,200 | |||||
California Health Facilities Financing Authority Revenue | ||||||||
(Kaiser Permanente) | ||||||||
SeriesA-2 4.00% 11/1/44 | 2,000,000 | 2,248,360 | ||||||
SeriesA-2 5.00% 11/1/47 | 2,105,000 | 3,311,018 | ||||||
(Sutter Health) Series A 5.00% 11/15/38 | 1,000,000 | 1,249,490 | ||||||
California Municipal Finance Authority Revenue | ||||||||
(Community Medical Centers) Series A 5.00% 2/1/42 | 2,550,000 | 3,044,547 | ||||||
Colorado Health Facilities Authority Revenue | ||||||||
(AdventHealth Obligated Group) Series A 4.00% 11/15/43 | 3,000,000 | 3,436,260 | ||||||
(American Baptist) 8.00% 8/1/43 | 2,040,000 | 2,333,903 | ||||||
(CommonSpirit Health) | ||||||||
SeriesA-1 4.00% 8/1/44 | 1,000,000 | 1,108,120 | ||||||
SeriesA-2 4.00% 8/1/49 | 2,000,000 | 2,201,680 | ||||||
SeriesA-2 5.00% 8/1/44 | 1,750,000 | 2,134,247 | ||||||
(Mental Health Center Denver Project) Series A 5.75% 2/1/44 | 1,875,000 | 2,118,787 | ||||||
Cuyahoga County, Ohio | ||||||||
(The Metro Health System) | ||||||||
5.25% 2/15/47 | 2,235,000 | 2,605,138 | ||||||
5.50% 2/15/57 | 3,000,000 | 3,531,810 | ||||||
Maricopa County, Arizona Industrial Development Authority Senior Living Facility Revenue Bonds | ||||||||
(Christian Care Surprise, Inc. Project) 144A 6.00% 1/1/48 # | 1,195,000 | 1,271,970 | ||||||
Maryland Health & Higher Educational Facilities Authority Revenue | ||||||||
(Adventist Healthcare Obligated) Series A 5.50% 1/1/46 | 2,000,000 | 2,376,900 | ||||||
Montgomery County, Pennsylvania Industrial Development Authority Revenue | ||||||||
(Foulkeways At Gwynedd Project) 5.00% 12/1/46 | 1,500,000 | 1,684,740 | ||||||
Moon, Pennsylvania Industrial Development Authority | ||||||||
(Baptist Homes Society Obligation) 6.125% 7/1/50 | 2,250,000 | 2,465,505 | ||||||
New York State Dormitory Authority | ||||||||
(Orange Regional Medical Center) | ||||||||
144A 5.00% 12/1/34 # | 400,000 | 477,372 | ||||||
144A 5.00% 12/1/35 # | 1,200,000 | 1,428,432 | ||||||
144A 5.00% 12/1/37 # | 800,000 | 947,280 | ||||||
30
Table of Contents
| Principal amount° | Value (US $) | |||||||
Municipal Bonds(continued) | ||||||||
Healthcare Revenue Bonds(continued) | ||||||||
North Carolina Medical Care Commission Health Care Facilities Revenue | ||||||||
(First Mortgage - Galloway Ridge Project) Series A 5.875% 1/1/31 | 1,555,000 | $ | 1,572,509 | |||||
Orange County, New York Funding Corporation Assisted Living Residence Revenue | ||||||||
6.50% 1/1/46 | 3,000,000 | 3,118,830 | ||||||
Oregon Health & Science University Revenue | ||||||||
(Capital Appreciation Insured) Series A 5.757% 7/1/21 (NATL)^ | 775,000 | 740,365 | ||||||
Palm Beach County, Florida Health Facilities Authority | ||||||||
(Sinai Residences Boca Raton Project) | ||||||||
Series A 7.25% 6/1/34 | 120,000 | 135,191 | ||||||
Series A 7.50% 6/1/49 | 610,000 | 690,502 | ||||||
Pennsylvania Economic Development Financing Authority First Mortgage Revenue | ||||||||
(Tapestry Moon Senior Housing Project) Series A 144A 6.75% 12/1/53 # | 3,115,000 | 3,231,532 | ||||||
Public Finance Authority, Wisconsin | ||||||||
(Bancroft Neurohealth Project) Series A 144A 5.00% 6/1/36 # | 540,000 | 585,538 | ||||||
Rochester, Minnesota | ||||||||
(The Homestead at Rochester) Series A 6.875% 12/1/48 | 2,350,000 | 2,580,229 | ||||||
Tarrant County, Texas Cultural Education Facilities Finance Corporation Retirement Facility Revenue | ||||||||
(Buckner Senior Living - Ventana Project) 6.625% 11/15/37 | 1,400,000 | 1,636,250 | ||||||
Tempe, Arizona Industrial Development Authority Revenue | ||||||||
(Friendship Village) Series A 6.25% 12/1/46 | 1,000,000 | 1,061,620 | ||||||
(Mirabella At ASU Project) Series A 144A 6.125% 10/1/52 # | 690,000 | 792,872 | ||||||
Washington Health Care Facilities Authority Revenue | ||||||||
(CommonSpirit Health) SeriesA-2 5.00% 8/1/44 | 3,000,000 | 3,658,710 | ||||||
|
| |||||||
| 74,441,053 | ||||||||
|
| |||||||
Lease Revenue Bonds – 2.66% | ||||||||
California Pollution Control Financing Authority Revenue | ||||||||
(San Diego County Water Authority Desalination Project Pipeline) 144A 5.00% 7/1/39 # | 1,000,000 | 1,221,660 | ||||||
Metropolitan Pier & Exposition Authority, Illinois | ||||||||
(McCormick Place Expansion Project) Series A 5.00% 6/15/57 | 1,620,000 | 1,819,292 | ||||||
New Jersey Economic Development Authority | ||||||||
(School Facilities Construction) Series GG 5.75% 9/1/23 | 100,000 | 106,430 | ||||||
31
Table of Contents
Schedules of investments
Delaware Tax-Free USA Fund
| Principal amount° | Value (US $) | |||||||
Municipal Bonds(continued) | ||||||||
Lease Revenue Bonds (continued) | ||||||||
New Jersey Economic Development Authority | ||||||||
(State Government Buildings Project) Series A 5.00% 6/15/47 | 2,250,000 | $ | 2,617,470 | |||||
New Jersey Transportation Trust Fund Authority | ||||||||
(Transportation Program) Series AA 5.00% 6/15/24 | 5,000,000 | 5,465,650 | ||||||
Public Finance Authority, Wisconsin Airport Facilities Revenue | ||||||||
(AFCO Investors II Portfolio) 144A 5.75% 10/1/31 (AMT)# | 2,245,000 | 2,354,691 | ||||||
St. Louis, Missouri Industrial Development Authority Leasehold Revenue | ||||||||
(Convention Center Hotel) 5.80% 7/15/20 (AMBAC)^ | 3,035,000 | 2,983,284 | ||||||
|
| |||||||
| 16,568,477 | ||||||||
|
| |||||||
Local General Obligation Bonds – 9.17% | ||||||||
Chicago, Illinois | ||||||||
Series A 5.25% 1/1/29 | 2,020,000 | 2,247,714 | ||||||
Series A 5.50% 1/1/49 | 1,530,000 | 1,817,135 | ||||||
Series A 6.00% 1/1/38 | 595,000 | 714,262 | ||||||
Chicago, Illinois Board of Education | ||||||||
5.00% 4/1/42 | 1,060,000 | 1,200,026 | ||||||
5.00% 4/1/46 | 1,085,000 | 1,222,122 | ||||||
Series H 5.00% 12/1/46 | 1,775,000 | 1,982,071 | ||||||
Los Angeles, California Community College District | ||||||||
Series C 5.00% 8/1/25 | 2,500,000 | 3,095,625 | ||||||
Mecklenburg County, North Carolina | ||||||||
Series A 5.00% 4/1/25 | 7,020,000 | 8,532,389 | ||||||
Series A 5.00% 9/1/25 | 8,000,000 | 9,848,000 | ||||||
New York City, New York | ||||||||
SeriesE-1 5.00% 3/1/44 | 5,000,000 | 6,170,800 | ||||||
SeriesF-1 5.00% 4/1/45 | 5,355,000 | 6,602,126 | ||||||
SubseriesD-1 4.00% 12/1/42 | 1,700,000 | 1,958,706 | ||||||
SubseriesD-1 5.00% 10/1/36 | 6,500,000 | 7,025,265 | ||||||
Wake County, North Carolina | ||||||||
Series A 5.00% 3/1/27 | 3,650,000 | 4,674,811 | ||||||
|
| |||||||
| 57,091,052 | ||||||||
|
| |||||||
Pre-Refunded/Escrowed to Maturity Bonds – 10.34% | ||||||||
Atlanta, Georgia Water & Wastewater Revenue | ||||||||
Series A 6.25%11/1/39-19§ | 4,000,000 | 4,032,800 | ||||||
Bowling Green, Ohio Student Housing Revenue CFP I | ||||||||
(State University Project) 6.00%6/1/45-20§ | 5,295,000 | 5,487,632 | ||||||
32
Table of Contents
| Principal amount° | Value (US $) | |||||||
Municipal Bonds(continued) | ||||||||
Pre-Refunded/Escrowed to Maturity Bonds(continued) | ||||||||
Brooklyn Arena Local Development, New York Pilot Revenue | ||||||||
(Barclays Center Project) 6.50%7/15/30-20§ | 6,000,000 | $ | 6,120,780 | |||||
California Municipal Finance Authority Mobile Home Park Revenue | ||||||||
(Caritas Projects) Series A 6.40%8/15/45-20§ | 4,375,000 | 4,597,994 | ||||||
Central Texas Regional Mobility Authority Revenue | ||||||||
Senior Lien 6.00%1/1/41-21§ | 5,160,000 | 5,487,350 | ||||||
Illinois Railsplitter Tobacco Settlement Authority | ||||||||
6.00%6/1/28-21§ | 6,000,000 | 6,504,600 | ||||||
Louisiana Public Facilities Authority Revenue | ||||||||
(Ochsner Clinic Foundation Project) 6.50%5/15/37-21§ | 2,190,000 | 2,387,494 | ||||||
Maryland Economic Development Corporation Revenue | ||||||||
(Transportation Facilities Project) Series A 5.75%6/1/35-20§ | 5,075,000 | 5,248,362 | ||||||
New Jersey Economic Development Authority Revenue | ||||||||
(Provident Group - Montclair State University) 5.875%6/1/42-20§ | 4,225,000 | 4,376,424 | ||||||
(School Facilities Construction) Series G 5.75%9/1/23-21§ | 900,000 | 961,605 | ||||||
Oklahoma State Turnpike Authority Revenue | ||||||||
(First Senior) 6.00% 1/1/22 | 13,535,000 | 15,066,350 | ||||||
San Juan, Texas Higher Education Finance Authority Education Revenue | ||||||||
(Idea Public Schools) Series A 6.70%8/15/40-20§ | 1,500,000 | 1,577,160 | ||||||
Southwestern Illinois Development Authority Revenue | ||||||||
(Memorial Group) 7.125%11/1/43-23§ | 2,000,000 | 2,481,060 | ||||||
|
| |||||||
| 64,329,611 | ||||||||
|
| |||||||
Special Tax Revenue Bonds – 10.61% | ||||||||
Allentown, Pennsylvania Neighborhood Improvement Zone Development Authority Tax Revenue | ||||||||
(City Center Project) 144A 5.375% 5/1/42 # | 1,525,000 | 1,724,745 | ||||||
Conley Road Transportation Development District, Missouri | ||||||||
5.375% 5/1/47 | 2,000,000 | 2,102,740 | ||||||
Kansas City, Missouri Land Clearance Redevelopment Authority Revenue | ||||||||
(Convention Centre Hotel Project - TIF Financing) Series B 144A 5.00% 2/1/50 # | 725,000 | 793,629 | ||||||
Massachusetts Bay Transportation Authority | ||||||||
Series A 5.00% 7/1/31 | 5,000,000 | 6,897,200 | ||||||
Massachusetts School Building Authority | ||||||||
Series C 5.00% 8/15/31 | 2,500,000 | 3,017,050 | ||||||
33
Table of Contents
Schedules of investments
Delaware Tax-Free USA Fund
| Principal amount° | Value (US $) | |||||||
Municipal Bonds(continued) | ||||||||
Special Tax Revenue Bonds(continued) | ||||||||
Mosaic, Virginia District Community Development Authority Revenue | ||||||||
Series A 6.875% 3/1/36 | 3,980,000 | $ | 4,216,531 | |||||
New Jersey Economic Development Authority Revenue | ||||||||
(Cigarette Tax) 5.00% 6/15/28 | 2,695,000 | 2,910,923 | ||||||
New York City, New York Industrial Development Agency | ||||||||
(Yankee Stadium) 7.00% 3/1/49 (AGC) | 1,000,000 | 1,004,890 | ||||||
New York City, New York Transitional Finance Authority | ||||||||
(Future Tax Secured Fiscal 2011) | ||||||||
Series C 5.25% 11/1/25 | 4,430,000 | 4,645,608 | ||||||
SeriesD-1 5.00% 2/1/26 | 3,000,000 | 3,165,870 | ||||||
(Future Tax Secured Fiscal 2014) SeriesA-1 5.00% 11/1/42 | 10,000,000 | 11,422,500 | ||||||
Public Finance Authority, Wisconsin | ||||||||
(American Dream @ Meadowlands Project) 144A 7.00% 12/1/50 # | 2,155,000 | 2,603,240 | ||||||
Puerto Rico Sales Tax Financing Revenue | ||||||||
(Restructured) | ||||||||
SeriesA-1 4.55% 7/1/40 | 1,706,000 | 1,760,916 | ||||||
SeriesA-1 4.75% 7/1/53 | 5,276,000 | 5,422,725 | ||||||
SeriesA-1 5.00% 7/1/58 | 5,465,000 | 5,711,799 | ||||||
SeriesA-1 5.375% 7/1/46 ^ | 2,470,000 | 663,294 | ||||||
SeriesA-1 5.625% 7/1/51 ^ | 21,330,000 | 4,145,272 | ||||||
SeriesA-2 4.329% 7/1/40 | 2,000,000 | 2,037,500 | ||||||
Tampa, Florida Sports Authority Revenue Sales Tax | ||||||||
(Tampa Bay Arena Project) 5.75% 10/1/20 (NATL) | 330,000 | 338,719 | ||||||
Wyandotte County, Kansas City, Kansas Unified Government Special Obligation Revenue | ||||||||
(Sales Tax - Vacation Village Project Area 1 and 2A) Series 2015A 5.75% 9/1/32 | 1,280,000 | 1,417,677 | ||||||
|
| |||||||
| 66,002,828 | ||||||||
|
| |||||||
State General Obligation Bonds – 12.07% | ||||||||
California State | ||||||||
5.25% 11/1/40 | 3,795,000 | 3,972,037 | ||||||
Various Purposes | ||||||||
5.00% 8/1/27 | 2,500,000 | 3,144,475 | ||||||
5.00% 3/1/30 | 5,000,000 | 5,999,500 | ||||||
5.00% 4/1/32 | 1,400,000 | 1,973,062 | ||||||
5.00% 10/1/47 | 2,145,000 | 2,572,842 | ||||||
Commonwealth of Massachusetts | ||||||||
Series A 5.25% 1/1/33 | 3,000,000 | 3,970,380 | ||||||
34
Table of Contents
| Principal amount° | Value (US $) | |||||||
Municipal Bonds(continued) | ||||||||
State General Obligation Bonds(continued) | ||||||||
Commonwealth of Pennsylvania | ||||||||
5.00% 9/15/26 | 2,500,000 | $ | 3,110,150 | |||||
5.00% 7/15/28 | 4,125,000 | 5,321,126 | ||||||
Connecticut State | ||||||||
Series B 5.00% 6/15/35 | 2,475,000 | 2,894,042 | ||||||
Series E 5.00% 9/15/35 | 2,500,000 | 3,111,375 | ||||||
Series E 5.00% 9/15/37 | 2,250,000 | 2,783,250 | ||||||
Florida State | ||||||||
(Department Of TransportationRight-of-Way Acquisition and Bridge Construction) | ||||||||
Series A 4.00% 7/1/33 | 2,500,000 | 2,959,850 | ||||||
Series A 4.00% 7/1/34 | 3,660,000 | 4,312,834 | ||||||
Illinois State | ||||||||
5.00% 1/1/29 | 5,405,000 | 6,169,916 | ||||||
5.00% 5/1/36 | 480,000 | 524,784 | ||||||
5.00% 11/1/36 | 1,780,000 | 2,014,337 | ||||||
5.00% 2/1/39 | 830,000 | 899,845 | ||||||
Series A 5.00% 4/1/38 | 785,000 | 839,966 | ||||||
Series C 5.00% 11/1/29 | 3,050,000 | 3,556,361 | ||||||
Maryland State | ||||||||
Series A 5.00% 3/15/26 | 5,000,000 | 6,230,000 | ||||||
Series A 5.00% 3/15/28 | 5,000,000 | 6,554,850 | ||||||
Texas State | ||||||||
(Transportation Commission Mobility) Series A 5.00% 10/1/33 | 1,755,000 | 2,221,865 | ||||||
|
| |||||||
| 75,136,847 | ||||||||
|
| |||||||
Transportation Revenue Bonds – 14.62% | ||||||||
Chicago, Illinois Midway International Airport | ||||||||
Series A 5.00% 1/1/28 (AMT) | 2,025,000 | 2,308,601 | ||||||
Chicago, Illinois O’Hare International Airport | ||||||||
Series B 5.00% 1/1/33 | 2,345,000 | 2,742,947 | ||||||
Series D 5.25% 1/1/42 | 2,000,000 | 2,436,000 | ||||||
Dallas, Texas Love Field | ||||||||
5.00% 11/1/35 (AMT) | 1,000,000 | 1,197,070 | ||||||
5.00% 11/1/36 (AMT) | 1,000,000 | 1,194,280 | ||||||
Harris County, Texas Toll Road Authority | ||||||||
Senior Lien Series A 5.00% 8/15/27 | 3,750,000 | 4,805,775 | ||||||
Metropolitan Transportation Authority Revenue, New York | ||||||||
(Green Bond) SeriesC-2 3.08% 11/15/40 (BAM)^ | 4,350,000 | 2,471,105 | ||||||
Minneapolis – St. Paul, Minnesota Metropolitan Airports Commission Revenue | ||||||||
Series A 5.00% 1/1/44 | 1,750,000 | 2,195,637 | ||||||
35
Table of Contents
Schedules of investments
Delaware Tax-Free USA Fund
| Principal amount° | Value (US $) | |||||||
Municipal Bonds(continued) | ||||||||
Transportation Revenue Bonds(continued) | ||||||||
New Jersey Turnpike Authority | ||||||||
Series A 5.00% 1/1/28 | 5,000,000 | $ | 5,884,550 | |||||
North Texas Tollway Authority Revenue | ||||||||
(Second Tier) Series A 5.00% 1/1/34 | 5,000,000 | 5,855,400 | ||||||
Series A 5.00% 1/1/43 | 7,000,000 | 8,551,760 | ||||||
Port Authority of New York & New Jersey Special Project | ||||||||
(JFK International Air Terminal) | ||||||||
Series 8 6.00% 12/1/42 | 4,735,000 | 5,007,310 | ||||||
Series 8 6.50% 12/1/28 | 5,500,000 | 5,733,970 | ||||||
Salt Lake City, Utah Airport Revenue | ||||||||
Series B 5.00% 7/1/42 | 3,350,000 | 4,076,381 | ||||||
San Francisco, California City & County Airport Commission International Airport Revenue | ||||||||
Series E 5.00% 5/1/50 (AMT) | 7,500,000 | 9,173,775 | ||||||
South Jersey Port, New Jersey | ||||||||
(Subordinated Marine Terminal) | ||||||||
Series A 5.00% 1/1/49 | 450,000 | 526,127 | ||||||
Series B 5.00% 1/1/42 (AMT) | 450,000 | 529,569 | ||||||
Series B 5.00% 1/1/48 (AMT) | 1,035,000 | 1,206,593 | ||||||
Texas Private Activity Bond Surface Transportation Corporate Senior Lien | ||||||||
(LBJ Infrastructure) | ||||||||
7.00% 6/30/40 | 5,715,000 | 5,998,864 | ||||||
7.50% 6/30/33 | 1,560,000 | 1,645,192 | ||||||
(NTE Mobility Partners) | ||||||||
6.75% 6/30/43 (AMT) | 2,490,000 | 2,916,512 | ||||||
6.875% 12/31/39 | 5,500,000 | 5,606,205 | ||||||
7.00% 12/31/38 (AMT) | 1,830,000 | 2,168,532 | ||||||
(NTE Mobility Partners Segments 3 LLC Segment 3C Project) 5.00% 6/30/58 (AMT) | 4,500,000 | 5,336,325 | ||||||
Virginia Small Business Financing Authority Revenue | ||||||||
(Transform 66 P3 Project) 5.00% 12/31/56 (AMT) | 1,220,000 | 1,407,331 | ||||||
|
| |||||||
| 90,975,811 | ||||||||
|
| |||||||
Water & Sewer Revenue Bonds – 0.82% | ||||||||
Dominion, Colorado Water & Sanitation District | ||||||||
5.75% 12/1/36 | 2,500,000 | 2,682,700 | ||||||
Southern California Water Replenishment District | ||||||||
5.00% 8/1/33 | 2,000,000 | 2,417,480 | ||||||
|
| |||||||
| 5,100,180 | ||||||||
|
| |||||||
Total Municipal Bonds(cost $573,221,293) | 623,082,189 | |||||||
|
| |||||||
36
Table of Contents
| Principal amount° | Value (US $) | |||||||
Short-Term Investments – 0.61% | ||||||||
Variable Rate Demand Notes – 0.61%¤ | ||||||||
Denver, Colorado City & County Series A2 | ||||||||
1.39% 12/1/29 (SPA - JPMorgan Chase Bank N.A.) | 200,000 | $ | 200,000 | |||||
Idaho Health Facilities Authority Revenue (St. Luke’s Health System Project) Series C | ||||||||
1.40% 3/1/48 (LOC – US Bank N.A.) | 200,000 | 200,000 | ||||||
Illinois Finance Authority Revenue (Northwestern Memorial Hospital) SeriesA-3 | ||||||||
1.37% 8/15/42 (SPA - JPMorgan Chase Bank N.A.) | 1,400,000 | 1,400,000 | ||||||
Los Angeles, California Department of Water and Power RevenueSubseries B-3 | ||||||||
1.17% 7/1/34 (SPA – Barclays Bank) | 200,000 | 200,000 | ||||||
Mississippi Business Finance Corporation Gulf Opportunity Zone Industrial Development Revenue | ||||||||
(Chevron USA) | ||||||||
Series A 1.35% 12/1/30 | 600,000 | 600,000 | ||||||
Series I 1.35% 11/1/35 | 300,000 | 300,000 | ||||||
Philadelphia, Pennsylvania Hospitals & Higher Education Facilities Authority Revenue | ||||||||
(The Children’s Hospital Of Philadelphia Project) | ||||||||
Series A 1.36% 7/1/41 (SPA - Wells Fargo Bank N.A.) | 400,000 | 400,000 | ||||||
Series B 1.36% 7/1/41 (SPA - Wells Fargo Bank N.A.) | 500,000 | 500,000 | ||||||
|
| |||||||
Total Short-Term Investments(cost $3,800,000) | 3,800,000 | |||||||
|
| |||||||
Total Value of Securities – 100.73% | $ | 626,882,189 | ||||||
|
| |||||||
| # | Security exempt from registration under Rule 144A of the Securities Act of 1933, as amended. At Aug. 31, 2019, the aggregate value of Rule 144A securities was $33,153,529, which represents 5.33% of the Fund’s net assets. See Note 9 in “Notes to financial statements.” |
| ¤ | Tax-exempt obligations that contain a floating or variable interest rate adjustment formula and an unconditional right of demand to receive payment of the unpaid principal balance plus accrued interest upon a short notice period (generally up to 30 days) prior to specified dates either from the issuer or by drawing on a bank letter of credit, a guarantee, or insurance issued with respect to such instrument. Each rate shown is as of Aug. 31, 2019. |
| § | Pre-refunded bonds. Municipal bonds that are generally backed or secured by US Treasury bonds. Forpre-refunded bonds, the stated maturity is followed by the year in which the bond will bepre-refunded. See Note 9 in “Notes to financial statements.” |
| ° | Principal amount shown is stated in USD unless noted that the security is denominated in another currency. |
| ‡ | Non-income producing security. Security is currently in default. |
| ● | Variable rate investment. Rates reset periodically. Rate shown reflects the rate in effect at Aug. 31, 2019. For securities based on a published reference rate and spread, the reference rate and |
37
Table of Contents
Schedules of investments
Delaware Tax-Free USA Fund
spread are indicated in their description above. The reference rate descriptions (i.e. LIBOR03M, LIBOR06M, etc.) used in this report are identical for different securities, but the underlying reference rates may differ due to the timing of the reset period. Certain variable rate securities are not based on a published reference rate and spread but are determined by the issuer or agent and are based on current market conditions, or for mortgage-backed securities, are impacted by the individual mortgages which are paying off over time. These securities do not indicate a reference rate and spread in their description above.
| ^ | Zero-coupon security. The rate shown is the effective yield at the time of purchase. |
Summary of abbreviations:
AGC – Insured by Assured Guaranty Corporation
AGM – Insured by Assured Guaranty Municipal Corporation
AMBAC – Insured by AMBAC Assurance Corporation
AMT – Subject to Alternative Minimum Tax
BAM – Build America Mutual Assurance
ICE – Intercontinental Exchange
LIBOR – London Interbank Offered Rate
LIBOR03M – ICE LIBOR USD 3 Month
LIBOR06M – ICE LIBOR USD 6 Month
LOC – Letter of Credit
N.A. – National Association
NATL – Insured by National Public Finance Guarantee Corporation
SPA –Stand-by Purchase Agreement
USD – US Dollar
See accompanying notes, which are an integral part of the financial statements.
38
Table of Contents
| Schedules of investments | ||
| Delaware Tax-Free USA Intermediate Fund | August 31, 2019 | |
| Principal amount° | Value (US $) | |||||||
Municipal Bonds – 98.56% | ||||||||
Corporate Revenue Bonds – 13.73% | ||||||||
Black Belt Energy Gas District, Alabama | ||||||||
(Project No. 4) Series A 4.00% 6/1/25 | 1,655,000 | $ | 1,866,641 | |||||
Chandler, Arizona Industrial Development Revenue Bonds | ||||||||
(Intel Corporation Project) 2.70% 12/1/37 (AMT)● | 3,000,000 | 3,135,990 | ||||||
Commonwealth of Pennsylvania Financing Authority | ||||||||
(Tobacco Master Settlement Payment) 5.00% 6/1/27 | 2,000,000 | 2,492,820 | ||||||
Denver City & County, Colorado Special Facilities Airport Revenue | ||||||||
(United Airlines Project) 5.00% 10/1/32 (AMT) | 1,190,000 | 1,311,880 | ||||||
Florida Development Finance Corporation Surface Transportation Facility Revenue | ||||||||
(Virgin Trains USA Passenger Rail Project) Series A 144A 6.50% 1/1/49 (AMT)#● | 2,275,000 | 2,169,872 | ||||||
Golden State, California Tobacco Securitization Corporate Settlement Revenue | ||||||||
(Asset-Backed Bonds) SeriesA-1 5.00% 6/1/26 | 850,000 | 1,020,077 | ||||||
(Capital Appreciation Asset-Backed) Series B 1.548% 6/1/47 ^ | 5,885,000 | 1,010,808 | ||||||
Houston, Texas Airport System Revenue | ||||||||
(United Airlines) 5.00% 7/1/29 (AMT) | 3,010,000 | 3,406,447 | ||||||
Kentucky Public Energy Authority | ||||||||
(Gas Supply Revenue Bonds) SeriesC-1 4.00% 12/1/49● | 5,000,000 | 5,611,800 | ||||||
Lower Alabama Gas District | ||||||||
Series A 5.00% 9/1/34 | 4,850,000 | 6,457,533 | ||||||
Maricopa County, Arizona Corporation Pollution Control Revenue | ||||||||
(Public Service - Palo Verde Project) Series B 5.20% 6/1/43● | 6,000,000 | 6,169,320 | ||||||
Michigan Tobacco Settlement Finance Authority | ||||||||
Series A 6.00% 6/1/34 | 810,000 | 814,066 | ||||||
M-S-R Energy Authority, California Gas Revenue | ||||||||
Series B 6.50% 11/1/39 | 3,485,000 | 5,574,188 | ||||||
Nassau County, New York Tobacco Settlement | ||||||||
(Asset-Backed) SeriesA-3 5.125% 6/1/46 | 65,000 | 64,998 | ||||||
New Jersey Economic Development Authority Special Facilities Revenue | ||||||||
(Continental Airlines Project) Series B 5.625% 11/15/30 (AMT) | 1,890,000 | 2,198,694 | ||||||
New Jersey Tobacco Settlement Financing Corporation | ||||||||
Series B 5.00% 6/1/46 | 1,965,000 | 2,200,918 | ||||||
New York Liberty Development Revenue | ||||||||
(Goldman Sachs Headquarters) 5.25% 10/1/35 | 3,405,000 | 4,740,066 | ||||||
39
Table of Contents
Schedules of investments
Delaware Tax-Free USA Intermediate Fund
| Principal amount° | Value (US $) | |||||||
Municipal Bonds(continued) | ||||||||
Corporate Revenue Bonds(continued) | ||||||||
New York Transportation Development Special Facilities Revenue | ||||||||
(Delta Airlines, Inc.-LaGuardia Airport Terminals C&D Redevelopment Project) 5.00% 1/1/34 (AMT) | 3,000,000 | $ | 3,637,740 | |||||
Salt Verde, Arizona Financial Corporation Senior Gas Revenue | ||||||||
5.00% 12/1/32 | 3,850,000 | 5,116,689 | ||||||
5.00% 12/1/37 | 2,500,000 | 3,468,475 | ||||||
5.25% 12/1/24 | 3,050,000 | 3,595,005 | ||||||
TSASC, New York | ||||||||
Series A 5.00% 6/1/30 | 475,000 | 575,201 | ||||||
Series A 5.00% 6/1/31 | 475,000 | 571,449 | ||||||
Tulsa, Oklahoma Airports Improvement Trust | ||||||||
(American Airlines) 5.00% 6/1/35 (AMT)● | 975,000 | 1,111,198 | ||||||
Virginia Tobacco Settlement Financing Corporation | ||||||||
(Capital Appreciation Asset-Backed) Series C 2.419% 6/1/47 ^ | 29,400,000 | 3,454,206 | ||||||
Wisconsin Public Finance Authority Exempt Facilities Revenue | ||||||||
(National Gypsum) 5.25% 4/1/30 (AMT) | 2,905,000 | 3,229,779 | ||||||
|
| |||||||
| 75,005,860 | ||||||||
|
| |||||||
Education Revenue Bonds – 6.11% | ||||||||
Arizona Industrial Development Authority Revenue | ||||||||
(American Charter Schools Foundation Project) 144A 6.00% 7/1/37 # | 1,420,000 | 1,655,791 | ||||||
Bucks County, Pennsylvania Industrial Development Authority Revenue | ||||||||
(School Lane Charter School Project) 5.125% 3/15/36 | 2,000,000 | 2,325,280 | ||||||
California State University | ||||||||
(Systemwide) Series A 5.00% 11/1/31 | 2,000,000 | 2,548,400 | ||||||
California Statewide Communities Development Authority Revenue | ||||||||
(California Baptist University) Series A 6.125% 11/1/33 | 2,215,000 | 2,592,259 | ||||||
Illinois Finance Authority Revenue | ||||||||
(University of Illinois at Chicago) | ||||||||
Series A 5.00% 2/15/29 | 400,000 | 475,160 | ||||||
Series A 5.00% 2/15/31 | 365,000 | 430,039 | ||||||
Series A 5.00% 2/15/37 | 430,000 | 497,669 | ||||||
Kent County, Delaware | ||||||||
(Delaware State University Project) Series A 5.00% 7/1/40 | 310,000 | 348,797 | ||||||
40
Table of Contents
| Principal amount° | Value (US $) | |||||||
Municipal Bonds(continued) | ||||||||
Education Revenue Bonds(continued) | ||||||||
Miami-Dade County, Florida Educational Facilities Authority | ||||||||
(University of Miami) | ||||||||
Series A 5.00% 4/1/30 | 520,000 | $ | 613,980 | |||||
Series A 5.00% 4/1/31 | 1,090,000 | 1,282,385 | ||||||
Minnesota Higher Education Facilities Authority Revenue | ||||||||
(University of St. Thomas) | ||||||||
4.00% 10/1/32 | 250,000 | 297,697 | ||||||
4.00% 10/1/36 | 750,000 | 881,587 | ||||||
4.00% 10/1/37 | 500,000 | 585,565 | ||||||
New York City, New York Trust for Cultural Resources | ||||||||
(Whitney Museum of American Art) 5.00% 7/1/21 | 3,025,000 | 3,185,053 | ||||||
New York State Dormitory Authority Revenue | ||||||||
(Non State Supported Debt - Rockefeller University) Series A 5.00% 7/1/27 | 1,055,000 | 1,057,986 | ||||||
(Touro College & University System) Series A 5.25% 1/1/34 | 1,335,000 | 1,503,303 | ||||||
Pennsylvania Higher Educational Facilities Authority Revenue | ||||||||
(Unrefunded Drexel University) Series A 5.25% 5/1/25 | 310,000 | 329,344 | ||||||
Phoenix, Arizona Industrial Development Authority Housing Revenue | ||||||||
(Downtown Phoenix Student Housing,LLC-Arizona State University Project) | ||||||||
Series A 5.00% 7/1/30 | 350,000 | 427,658 | ||||||
Series A 5.00% 7/1/32 | 235,000 | 283,520 | ||||||
Pima County, Arizona Industrial Development Authority Education Revenue | ||||||||
(Facility American Leadership Academy Project) | ||||||||
144A 5.00% 6/15/47 # | 745,000 | 770,926 | ||||||
144A 5.00% 6/15/52 # | 640,000 | 661,414 | ||||||
South Carolina Jobs - Economic Development Authority Economic Development Revenue | ||||||||
(Wofford College Project) 5.00% 4/1/44 | 1,430,000 | 1,742,155 | ||||||
South Carolina Jobs - Economic Development Authority Educational Facilities Revenue | ||||||||
(High Point Academy Project) Series A 144A 5.75% 6/15/39 # | 1,245,000 | 1,418,441 | ||||||
Texas A&M University Revenue Financing System | ||||||||
Series E 5.00% 5/15/26 | 2,500,000 | 3,124,000 | ||||||
University of Texas Permanent University Fund | ||||||||
Series B 5.00% 7/1/27 | 3,715,000 | 4,376,047 | ||||||
|
| |||||||
| 33,414,456 | ||||||||
|
| |||||||
41
Table of Contents
Schedules of investments
Delaware Tax-Free USA Intermediate Fund
| Principal amount° | Value (US $) | |||||||
Municipal Bonds(continued) | ||||||||
Electric Revenue Bonds – 2.68% | ||||||||
Long Island, New York Power Authority | ||||||||
5.00% 9/1/33 | 250,000 | $ | 314,655 | |||||
5.00% 9/1/35 | 1,000,000 | 1,248,010 | ||||||
New York State Utility Debt Securitization Authority | ||||||||
(Restructuring Bonds) 5.00% 12/15/33 | 1,500,000 | 1,836,675 | ||||||
Salt River, Arizona Project Agricultural Improvement & Power District Electric Systems Revenue | ||||||||
Series A 5.00% 12/1/35 | 4,000,000 | 4,779,280 | ||||||
(Salt River Project Electric System) 5.00% 1/1/30 | 5,000,000 | 6,459,900 | ||||||
|
| |||||||
| 14,638,520 | ||||||||
|
| |||||||
Healthcare Revenue Bonds – 9.93% | ||||||||
Apple Valley, Minnesota | ||||||||
(Minnesota Senior Living LLC Project) Series B 5.25% 1/1/37 | 970,000 | 1,013,650 | ||||||
Arizona Health Facilities Authority | ||||||||
(Scottsdale Lincoln Hospital Project) 5.00% 12/1/30 | 5,000,000 | 5,852,000 | ||||||
Berks County, Pennsylvania Municipal Authority Revenue | ||||||||
(Reading Hospital & Medical Center Project) SeriesA-3 5.25% 11/1/24 | 2,205,000 | 2,219,112 | ||||||
Brookhaven Development Authority, Georgia | ||||||||
(Children’s Healthcare of Atlanta, Inc.) Series A 4.00% 7/1/44 | 1,500,000 | 1,713,900 | ||||||
California Health Facilities Financing Authority | ||||||||
(Kaiser Permanente) Series A1 5.00% 11/1/27 | 4,100,000 | 5,406,260 | ||||||
California Statewide Communities Development Authority | ||||||||
(Loma Linda University Medical Center) | ||||||||
Series A 144A 5.00% 12/1/33 # | 260,000 | 309,884 | ||||||
Series A 144A 5.00% 12/1/41 # | 1,685,000 | 1,914,615 | ||||||
Series A 5.25% 12/1/34 | 2,790,000 | 3,182,023 | ||||||
Capital Trust Agency, Florida | ||||||||
(Tuscan Gardens Senior Living Center) Series A 7.00% 4/1/35 | 1,630,000 | 1,659,128 | ||||||
Colorado Health Facilities Authority Revenue | ||||||||
(CommonSpirit Health) | ||||||||
Series A 4.00% 8/1/37 | 500,000 | 563,145 | ||||||
Series A 4.00% 8/1/38 | 1,500,000 | 1,688,865 | ||||||
Series A 5.00% 8/1/37 | 1,105,000 | 1,368,045 | ||||||
Cuyahoga County, Ohio | ||||||||
(The Metrohealth System) 5.00% 2/15/37 | 1,000,000 | 1,156,460 | ||||||
Iowa Finance Authority Senior Housing Revenue Bonds | ||||||||
(PHS Council Bluffs, Inc. Project) 5.00% 8/1/33 | 500,000 | 536,270 | ||||||
42
Table of Contents
| Principal amount° | Value (US $) | |||||||
Municipal Bonds(continued) | ||||||||
Healthcare Revenue Bonds(continued) | ||||||||
Kalispell, Montana | ||||||||
(Immanuel Lutheran Corporation Project) Series A 5.25% 5/15/32 | 435,000 | $ | 474,972 | |||||
Lancaster County, Pennsylvania Hospital Authority | ||||||||
(Brethren Village Project) | ||||||||
5.00% 7/1/31 | 440,000 | 489,909 | ||||||
5.00% 7/1/32 | 440,000 | 488,312 | ||||||
(University of Pennsylvania Health System Obligation) Series A 5.00% 8/15/33 | 2,430,000 | 2,955,852 | ||||||
Maricopa County, Arizona Industrial Development Authority Revenue | ||||||||
(Banner Health Obligation Group) Series A 5.00% 1/1/32 | 3,000,000 | 3,697,110 | ||||||
(Christian Care Surprise, Inc. Project) 144A 5.75% 1/1/36 # | 1,500,000 | 1,601,145 | ||||||
Maryland Health & Higher Educational Facilities Authority Revenue | ||||||||
(Adventist Healthcare Obligated) Series A 5.50% 1/1/36 | 2,000,000 | 2,433,000 | ||||||
Moon, Pennsylvania Industrial Development Authority | ||||||||
(Baptist Homes Society Obligation) 5.625% 7/1/30 | 2,440,000 | 2,669,262 | ||||||
New York State Dormitory Authority Revenue | ||||||||
(Orange Regional Medical Center) | ||||||||
144A 5.00% 12/1/31 # | 1,000,000 | 1,205,450 | ||||||
144A 5.00% 12/1/32 # | 1,100,000 | 1,322,937 | ||||||
144A 5.00% 12/1/33 # | 1,000,000 | 1,198,410 | ||||||
Oklahoma Development Finance Authority Health System Revenue | ||||||||
(OU Medicine Project) Series B 5.25% 8/15/43 | 1,790,000 | 2,179,164 | ||||||
Prince George’s County, Maryland | ||||||||
(Collington Episcopal Life Care Community) 5.00% 4/1/31 | 2,000,000 | 2,199,460 | ||||||
Public Finance Authority, Wisconsin Senior Living Revenue | ||||||||
(Mary’s Woods at Marylhurst Project) 144A 5.00% 5/15/29 # | 500,000 | 574,945 | ||||||
Washington Health Care Facilities Authority Revenue | ||||||||
(CommonSpirit Health) Series A 5.00% 8/1/38 | 1,750,000 | 2,160,638 | ||||||
|
| |||||||
| 54,233,923 | ||||||||
|
| |||||||
Lease Revenue Bonds – 4.75% | ||||||||
California Statewide Communities Development Authority Revenue | ||||||||
(Lancer Plaza Project) 5.125% 11/1/23 | 410,000 | 442,435 | ||||||
43
Table of Contents
Schedules of investments
Delaware Tax-Free USA Intermediate Fund
| Principal amount° | Value (US $) | |||||||
Municipal Bonds(continued) | ||||||||
Lease Revenue Bonds(continued) | ||||||||
Golden State, California Tobacco Securitization Corporate Settlement Revenue | ||||||||
(Asset-Backed Enhanced) Series A 5.00% 6/1/35 | 3,000,000 | $ | 3,576,990 | |||||
Idaho Building Authority Revenue | ||||||||
(Health & Welfare Project) Series A 5.00% 9/1/24 | 2,800,000 | 3,071,852 | ||||||
Los Angeles County, California | ||||||||
(Disney Concert Hall Parking) 5.00% 3/1/23 | 2,395,000 | 2,732,695 | ||||||
New Jersey State Transportation Trust Fund Authority | ||||||||
Series B 5.50% 6/15/31 | 5,000,000 | 5,331,200 | ||||||
(Highway Reimbursement) Series A 5.00% 6/15/30 | 2,415,000 | 2,876,531 | ||||||
New York Liberty Development Revenue | ||||||||
(World Trade Center Project)Class 2-3 144A 5.15% 11/15/34 # | 1,000,000 | 1,129,930 | ||||||
New York State Dormitory Authority Revenue | ||||||||
(Health Facilities Improvement Program) | ||||||||
Series 1 5.00% 1/15/28 | 750,000 | 977,977 | ||||||
Series 1 5.00% 1/15/29 | 3,100,000 | 4,022,095 | ||||||
Public Finance Authority, Wisconsin Airport Facilities Revenue | ||||||||
(AFCO Investors II Portfolio) 144A 5.00% 10/1/23 (AMT)# | 1,745,000 | 1,795,867 | ||||||
|
| |||||||
| 25,957,572 | ||||||||
|
| |||||||
Local General Obligation Bonds – 8.02% | ||||||||
Chesterfield County, Virginia | ||||||||
Series B 5.00% 1/1/22 | 4,070,000 | 4,442,812 | ||||||
Chicago, Illinois | ||||||||
Series A 5.25% 1/1/29 | 640,000 | 712,147 | ||||||
Series A 5.50% 1/1/35 | 1,980,000 | 2,406,571 | ||||||
Series C 5.00% 1/1/26 | 1,280,000 | 1,473,907 | ||||||
Chicago, Illinois Board of Education | ||||||||
5.00% 4/1/35 | 825,000 | 949,245 | ||||||
5.00% 4/1/36 | 320,000 | 367,286 | ||||||
(Dedicated Revenues) | ||||||||
Series C 5.00% 12/1/30 | 2,160,000 | 2,500,114 | ||||||
Series C 5.00% 12/1/34 | 2,160,000 | 2,468,470 | ||||||
Conroe, Texas Independent School District | ||||||||
5.00% 2/15/25 (PSF) | 3,070,000 | 3,123,940 | ||||||
Fort Worth, Texas Independent School District | ||||||||
(School Building) 5.00% 2/15/27 (PSF) | 2,000,000 | 2,329,580 | ||||||
New York City, New York | ||||||||
SeriesB-1 4.00% 10/1/41 | 500,000 | 569,595 | ||||||
Series E 5.00% 8/1/23 | 3,685,000 | 4,236,092 | ||||||
44
Table of Contents
| Principal amount° | Value (US $) | |||||||
Municipal Bonds(continued) | ||||||||
Local General Obligation Bonds(continued) | ||||||||
New York City, New York | ||||||||
SubseriesD-1 4.00% 12/1/42 | 4,300,000 | $ | 4,954,374 | |||||
SubseriesD-1 5.00% 10/1/30 | 4,000,000 | 4,316,360 | ||||||
San Francisco, California Bay Area Rapid Transit District | ||||||||
(Election 2004) Series D 5.00% 8/1/31 | 4,000,000 | 4,857,800 | ||||||
Wake County, North Carolina | ||||||||
Series A 5.00% 3/1/27 | 3,200,000 | 4,098,464 | ||||||
|
| |||||||
| 43,806,757 | ||||||||
|
| |||||||
Pre-Refunded/Escrowed to Maturity Bonds – 4.73% | ||||||||
California State Department of Water Resources | ||||||||
(Water System) Series AS 5.00%12/1/29-24§ | 15,000 | 18,116 | ||||||
Clifton, Texas Higher Education Finance Corporation Revenue | ||||||||
(Uplift Education) Series A 6.00%12/1/30-20§ | 1,100,000 | 1,165,417 | ||||||
Maryland State Economic Development Corporation Revenue | ||||||||
(Transportation Facilities Project) Series A 5.375%6/1/25-20§ | 2,535,000 | 2,614,599 | ||||||
New York State Dormitory Authority Revenue | ||||||||
(North Shore Long Island Jewish Health System) Series A 5.00%5/1/23-21§ | 4,000,000 | 4,268,600 | ||||||
Pennsylvania Higher Educational Facilities Authority Revenue | ||||||||
(Drexel University) Series A 5.25%5/1/25-21§ | 4,980,000 | 5,322,026 | ||||||
San Francisco, California City & County Airports Commission | ||||||||
Series D5.00% 5/1/25-21§ | 570,000 | 609,091 | ||||||
San Francisco, California City & County Public Utilities Commission Water Revenue | ||||||||
Subseries A 5.00%11/1/27-21§ | 5,000,000 | 5,443,900 | ||||||
Southwestern Illinois Development Authority | ||||||||
(Memorial Group) 7.125%11/1/30-23§ | 2,190,000 | 2,716,761 | ||||||
Virginia Commonwealth Transportation Board | ||||||||
(Gans-Garvee) 5.00%3/15/24-23§ | 3,250,000 | 3,697,428 | ||||||
|
| |||||||
| 25,855,938 | ||||||||
|
| |||||||
Special Tax Revenue Bonds – 12.01% | ||||||||
Allentown, Pennsylvania Neighborhood Improvement Zone Development Authority Tax Revenue | ||||||||
(City Center Project) | ||||||||
144A 5.00% 5/1/28 # | 750,000 | 893,347 | ||||||
144A 5.00% 5/1/33 # | 650,000 | 765,817 | ||||||
45
Table of Contents
Schedules of investments
Delaware Tax-Free USA Intermediate Fund
| Principal amount° | Value (US $) | |||||||
Municipal Bonds(continued) | ||||||||
Special Tax Revenue Bonds(continued) | ||||||||
Celebration Pointe, Florida Community Development District | ||||||||
4.75% 5/1/24 | 485,000 | $ | 516,409 | |||||
5.00% 5/1/34 | 880,000 | 935,079 | ||||||
Connecticut State Transportation Infrastructure | ||||||||
Series B 5.00% 10/1/30 | 3,375,000 | 4,289,726 | ||||||
Dallas, Texas Convention Center Hotel Development Revenue | ||||||||
Series A 5.00% 1/1/24 | 3,420,000 | 3,428,584 | ||||||
Series A 5.25% 1/1/23 | 5,375,000 | 5,389,674 | ||||||
Ernest N Morail-New Orleans, Louisiana Exhibition Hall Authority Special Tax Revenue | ||||||||
5.00% 7/15/26 | 2,330,000 | 2,566,914 | ||||||
Harris County-Houston, Texas Sports Authority | ||||||||
(Senior Lien) Series A 5.00% 11/15/30 | 1,805,000 | 2,102,518 | ||||||
Kansas City, Missouri Land Clearance Redevelopment Authority Revenue | ||||||||
(Convention Center Hotel Project - TIF Financing) | ||||||||
Series B 144A 4.375% 2/1/31 # | 400,000 | 436,556 | ||||||
Series B 144A 5.00% 2/1/40 # | 200,000 | 222,452 | ||||||
Louisiana State Highway Improvement Revenue | ||||||||
Series A 5.00% 6/15/29 | 5,195,000 | 6,048,694 | ||||||
Massachusetts School Building Authority | ||||||||
Series C 5.00% 8/15/29 | 1,630,000 | 1,982,243 | ||||||
New Jersey Economic Development Authority Revenue | ||||||||
(Cigarette Tax) | ||||||||
5.00% 6/15/22 | 1,750,000 | 1,910,317 | ||||||
5.00% 6/15/23 | 1,250,000 | 1,361,500 | ||||||
New York City, New York Transitional Finance Authority Building Aid Revenue | ||||||||
Subordinate SubseriesS-3A 5.00% 7/15/28 | 4,400,000 | 5,791,940 | ||||||
New York City, New York Transitional Finance Authority Future Tax Secured | ||||||||
SubseriesA-1 5.00% 11/1/23 | 2,865,000 | 3,323,973 | ||||||
Subseries C 5.00% 11/1/27 | 4,150,000 | 4,855,500 | ||||||
SubseriesE-1 5.00% 2/1/26 | 4,020,000 | 4,394,182 | ||||||
Public Finance Authority, Wisconsin | ||||||||
(American Dream @ Meadowlands Project) 144A 7.00% 12/1/50 # | 1,010,000 | 1,220,080 | ||||||
Puerto Rico Sales Tax Financing Revenue | ||||||||
(Restructured) | ||||||||
SeriesA-1 4.55% 7/1/40 | 5,765,000 | 5,950,575 | ||||||
SeriesA-2 4.329% 7/1/40 | 4,636,000 | 4,722,925 | ||||||
46
Table of Contents
| Principal amount° | Value (US $) | |||||||
Municipal Bonds(continued) | ||||||||
Special Tax Revenue Bonds(continued) | ||||||||
Richmond Heights, Missouri Tax Increment & Transaction Sales Tax Revenue Refunding & Improvement | ||||||||
(Francis Place Redevelopment Project) 5.625% 11/1/25 | 915,000 | $ | 915,558 | |||||
Wyandotte County, Kansas City, Kansas Unified Government Special Obligation Revenue | ||||||||
(Sales Tax - Vacation Village Project Area 1 and 2A) Series 2015A 5.00% 9/1/27 | 1,460,000 | 1,595,897 | ||||||
|
| |||||||
| 65,620,460 | ||||||||
|
| |||||||
State General Obligation Bonds – 18.79% | ||||||||
California State | ||||||||
5.00% 8/1/26 | 3,120,000 | 3,937,908 | ||||||
5.00% 9/1/30 | 1,715,000 | 2,139,068 | ||||||
Series C 5.00% 9/1/30 | 5,985,000 | 7,274,289 | ||||||
(Various Purposes) | ||||||||
5.00% 8/1/28 | 3,000,000 | 3,967,350 | ||||||
5.00% 4/1/32 | 1,410,000 | 1,987,155 | ||||||
5.00% 9/1/32 | 4,100,000 | 5,096,259 | ||||||
5.25% 9/1/28 | 7,750,000 | 8,388,057 | ||||||
Commonwealth of Massachusetts | ||||||||
Series A 5.00% 1/1/35 | 7,500,000 | 9,636,900 | ||||||
Commonwealth of Pennsylvania | ||||||||
5.00% 9/15/26 | 2,500,000 | 3,110,150 | ||||||
5.00% 7/15/28 | 3,870,000 | 4,992,184 | ||||||
Connecticut State | ||||||||
Series F 5.00% 9/15/27 | 2,790,000 | 3,526,309 | ||||||
Georgia State | ||||||||
Series A 5.00% 7/1/26 | 3,000,000 | 3,777,690 | ||||||
Hawaii State | ||||||||
Series FW 4.00% 1/1/34 | 3,010,000 | 3,572,629 | ||||||
Illinois State | ||||||||
4.00% 2/1/24 | 1,220,000 | 1,296,823 | ||||||
5.00% 1/1/29 | 2,000,000 | 2,283,040 | ||||||
5.00% 3/1/36 | 960,000 | 1,009,536 | ||||||
5.00% 11/1/36 | 1,965,000 | 2,223,692 | ||||||
Series C 5.00% 11/1/29 | 3,400,000 | 3,964,468 | ||||||
Minnesota State | ||||||||
(Various Purposes) Series F 5.00% 10/1/22 | 5,000,000 | 5,597,950 | ||||||
New York State | ||||||||
Series A 5.00% 2/15/28 | 5,000,000 | 5,289,950 | ||||||
Oregon State | ||||||||
Series L 5.00% 5/1/26 | 6,000,000 | 6,386,700 | ||||||
(ArticleXI-Q State Projects) Series A 5.00% 5/1/28 | 2,000,000 | 2,614,400 | ||||||
47
Table of Contents
Schedules of investments
Delaware Tax-Free USA Intermediate Fund
| Principal amount° | Value (US $) | |||||||
Municipal Bonds(continued) | ||||||||
State General Obligation Bonds(continued) | ||||||||
Texas State | ||||||||
(Transportation Commission Highway Improvement) 5.00% 4/1/29 | 3,000,000 | $ | 3,512,190 | |||||
Washington State | ||||||||
SeriesR-2015E 5.00% 7/1/31 | 3,000,000 | 3,567,810 | ||||||
(Various Purposes) Series2015-A-1 5.00% 8/1/30 | 3,000,000 | 3,544,320 | ||||||
|
| |||||||
| 102,696,827 | ||||||||
|
| |||||||
Transportation Revenue Bonds – 14.71% | ||||||||
Bay Area, California Toll Authority | ||||||||
(San Francisco Bay Area) 4.00% 4/1/34 | 1,000,000 | 1,157,950 | ||||||
Broward County, Florida Airport System Revenue | ||||||||
Series O 5.375% 10/1/29 | 2,000,000 | 2,006,700 | ||||||
Chicago, Illinois Midway International Airport | ||||||||
Series A 5.00% 1/1/28 (AMT) | 1,905,000 | 2,171,795 | ||||||
Chicago, Illinois O’Hare International Airport Revenue | ||||||||
Series B 5.00% 1/1/32 | 1,000,000 | 1,172,180 | ||||||
Series B 5.00% 1/1/33 | 1,520,000 | 1,777,944 | ||||||
(General-Airport-Senior Lien) | ||||||||
Series B 5.00% 1/1/36 | 2,500,000 | 3,155,925 | ||||||
Series B 5.00% 1/1/37 | 3,000,000 | 3,775,620 | ||||||
(General-Airport-Third Lien) Series C 5.25% 1/1/28 | 2,150,000 | 2,179,111 | ||||||
Houston, Texas Airports Commission Revenue | ||||||||
Series B 5.00% 7/1/25 | 1,000,000 | 1,071,020 | ||||||
Series B 5.00% 7/1/26 | 3,000,000 | 3,209,670 | ||||||
Memphis-Shelby County, Tennessee Airport Authority Revenue | ||||||||
Series D 5.00% 7/1/24 | 4,110,000 | 4,402,673 | ||||||
New Jersey State Turnpike Authority Turnpike Revenue | ||||||||
Series A 5.00% 1/1/33 | 1,770,000 | 2,190,322 | ||||||
New Orleans, Louisiana Aviation Board | ||||||||
Series B 5.00% 1/1/32 (AGM) (AMT) | 2,900,000 | 3,349,645 | ||||||
Series B 5.00% 1/1/33 (AGM) (AMT) | 2,900,000 | 3,342,569 | ||||||
New York State Thruway Authority | ||||||||
Series J 5.00% 1/1/27 | 5,705,000 | 6,615,290 | ||||||
Pennsylvania State Turnpike Commission Revenue | ||||||||
Subordinate SeriesA-1 5.00% 12/1/29 | 3,590,000 | 4,175,098 | ||||||
Phoenix, Arizona Civic Improvement Corporation Airport Revenue | ||||||||
(Junior Lien Airport) Series A 5.00% 7/1/33 | 3,355,000 | 3,996,811 | ||||||
Port Authority of New York & New Jersey | ||||||||
(194th Series) 5.00% 10/15/32 | 2,500,000 | 3,048,425 | ||||||
(JFK International Air Terminal) Series 8 6.50% 12/1/28 | 8,300,000 | 8,653,082 | ||||||
48
Table of Contents
| Principal amount° | Value (US $) | |||||||
Municipal Bonds(continued) | ||||||||
Transportation Revenue Bonds(continued) | ||||||||
Salt Lake City, Utah Airport Revenue | ||||||||
Series B 5.00% 7/1/31 | 500,000 | $ | 624,620 | |||||
Series B 5.00% 7/1/32 | 600,000 | 746,940 | ||||||
Series B 5.00% 7/1/33 | 1,000,000 | 1,242,290 | ||||||
San Francisco, California City & County Airport Commission - San Francisco International Airport | ||||||||
Series D 5.00% 5/1/25 | 1,430,000 | 1,523,393 | ||||||
South Jersey Port, New Jersey | ||||||||
(Subordinated Marine Terminal) | ||||||||
Series B 5.00% 1/1/32 (AMT) | 215,000 | 258,166 | ||||||
Series B 5.00% 1/1/33 (AMT) | 315,000 | 377,594 | ||||||
Series B 5.00% 1/1/34 (AMT) | 430,000 | 514,542 | ||||||
Series B 5.00% 1/1/35 (AMT) | 430,000 | 513,356 | ||||||
Series B 5.00% 1/1/36 (AMT) | 430,000 | 511,962 | ||||||
Series B 5.00% 1/1/37 (AMT) | 430,000 | 511,274 | ||||||
Texas Private Activity Bond Surface Transportation Corporate Senior Lien Revenue | ||||||||
(LBJ Infrastructure) 7.50% 6/30/33 | 3,625,000 | 3,822,961 | ||||||
(NTE Mobility Partners) | ||||||||
7.00% 12/31/38 (AMT) | 3,750,000 | 4,443,713 | ||||||
7.50% 12/31/31 | 3,765,000 | 3,847,529 | ||||||
|
| |||||||
| 80,390,170 | ||||||||
|
| |||||||
Water & Sewer Revenue Bonds – 3.10% | ||||||||
Atlanta, Georgia Water & Wastewater Revenue | ||||||||
Series B 5.50% 11/1/23 (AGM) | 1,175,000 | 1,183,249 | ||||||
California State Department of Water Resources | ||||||||
(Water System) Series AS 5.00% 12/1/29 | 2,680,000 | 3,214,767 | ||||||
Dominion, Colorado Water & Sanitation District | ||||||||
5.25% 12/1/27 | 500,000 | 536,605 | ||||||
Great Lakes, Michigan Water Authority Water Supply System Revenue | ||||||||
(Senior Lien Bond) Series C 5.00% 7/1/31 | 3,000,000 | 3,661,590 | ||||||
Sacramento, California Water Revenue | ||||||||
5.00% 9/1/26 | 3,160,000 | 3,658,522 | ||||||
San Antonio, Texas Water System Revenue | ||||||||
Series A 5.00% 5/15/32 | 1,500,000 | 1,870,890 | ||||||
Series A 5.00% 5/15/33 | 2,250,000 | 2,800,395 | ||||||
|
| |||||||
| 16,926,018 | ||||||||
|
| |||||||
Total Municipal Bonds(cost $497,966,540) | 538,546,501 | |||||||
|
| |||||||
49
Table of Contents
Schedules of investments
Delaware Tax-Free USA Intermediate Fund
| Principal amount° | Value (US $) | |||||||
Short-Term Investments – 0.28% | ||||||||
Variable Rate Demand Notes – 0.28%¤ | ||||||||
California State Series B2 | ||||||||
0.95% 5/1/34 (LOC - CITI Bank N.A.) | 100,000 | $ | 100,000 | |||||
Mississippi Business Finance Corporation Gulf Opportunity Zone Industrial Development Revenue (Chevron USA) | ||||||||
Series A 1.35% 12/1/30 | 1,400,000 | 1,400,000 | ||||||
|
| |||||||
Total Short-Term Investments(cost $1,500,000) | 1,500,000 | |||||||
|
| |||||||
Total Value of Securities – 98.84% | $ | 540,046,501 | ||||||
|
| |||||||
| # | Security exempt from registration under Rule 144A of the Securities Act of 1933, as amended. At Aug. 31, 2019, the aggregate value of Rule 144A securities was $21,267,879, which represents 3.89% of the Fund’s net assets. See Note 9 in “Notes to financial statements.” |
| ¤ | Tax-exempt obligations that contain a floating or variable interest rate adjustment formula and an unconditional right of demand to receive payment of the unpaid principal balance plus accrued interest upon a short notice period (generally up to 30 days) prior to specified dates either from the issuer or by drawing on a bank letter of credit, a guarantee, or insurance issued with respect to such instrument. Each rate shown is as of Aug. 31, 2019. |
| § | Pre-refunded bonds. Municipal bonds that are generally backed or secured by US Treasury bonds. Forpre-refunded bonds, the stated maturity is followed by the year in which the bond will bepre-refunded. See Note 9 in “Notes to financial statements.” |
| ° | Principal amount shown is stated in USD unless noted that the security is denominated in another currency. |
| ● | Variable rate investment. Rates reset periodically. Rate shown reflects the rate in effect at Aug. 31, 2019. For securities based on a published reference rate and spread, the reference rate and spread are indicated in their description above. The reference rate descriptions (i.e. LIBOR03M, LIBOR06M, etc.) used in this report are identical for different securities, but the underlying reference rates may differ due to the timing of the reset period. Certain variable rate securities are not based on a published reference rate and spread but are determined by the issuer or agent and are based on current market conditions, or for mortgage-backed securities, are impacted by the individual mortgages which are paying off over time. These securities do not indicate a reference rate and spread in their description above. |
| ^ | Zero-coupon security. The rate shown is the effective yield at the time of purchase. |
Summary of abbreviations:
AGM – Insured by Assured Guaranty Municipal Corporation
AMT – Subject to Alternative Minimum Tax
ICE – Intercontinental Exchange
LIBOR – London Interbank Offered Rate
LIBOR03M – ICE LIBOR USD 3 Month
50
Table of Contents
Summary of abbreviations: (continued)
LIBOR06M – ICE LIBOR USD 6 Month
LOC – Letter of Credit
N.A. – National Association
PSF – Guaranteed by Permanent School Fund
USD – US Dollar
See accompanying notes, which are an integral part of the financial statements.
51
Table of Contents
| Schedules of investments | ||
| Delaware National High-Yield Municipal Bond Fund | August 31, 2019 | |
| Principal amount° | Value (US $) | |||||||
Municipal Bonds – 100.00% | ||||||||
Corporate Revenue Bonds – 18.48% | ||||||||
Allegheny County, Pennsylvania Industrial Development Authority Revenue | ||||||||
(Environmental Improvement - US Steel Corp. Project) 5.75% 8/1/42 (AMT) | 2,000,000 | $ | 2,055,280 | |||||
Anuvia, Florida | ||||||||
144A 5.00% 7/1/29 # | 134,139 | 115,360 | ||||||
Arkansas Development Finance Authority Revenue | ||||||||
(Big River Steel Project) Series A 144A 4.50% 9/1/49 (AMT)# | 8,000,000 | 8,697,760 | ||||||
Buckeye, Ohio Tobacco Settlement Financing Authority | ||||||||
(Asset-Backed Senior Turbo) | ||||||||
SeriesA-2 5.75% 6/1/34 | 5,475,000 | 5,483,158 | ||||||
SeriesA-2 5.875% 6/1/47 | 22,075,000 | 22,185,596 | ||||||
SeriesA-2 6.00% 6/1/42 | 3,100,000 | 3,123,281 | ||||||
SeriesA-2 6.50% 6/1/47 | 24,770,000 | 25,389,498 | ||||||
California County Tobacco Securitization Agency Settlement Revenue | ||||||||
(Capital Appreciation Bond - Fresno County Tobacco Funding Corporation) 0.83% 6/1/55 ^ | 100,000,000 | 6,228,000 | ||||||
California Pollution Control Financing Authority Revenue | ||||||||
(Calplant I Project) 144A 8.00% 7/1/39 (AMT)# | 5,250,000 | 5,749,905 | ||||||
(Poseidon Resources) 144A 5.00% 7/1/37 (AMT)# | 5,000,000 | 5,395,750 | ||||||
California State Enterprise Development Authority Revenue | ||||||||
(Sunpower Corp. - Recovery Zone Facility) 8.50% 4/1/31 | 1,000,000 | 1,050,150 | ||||||
Central Plains Energy Project, Nebraska | ||||||||
(Project No. 3) Series A 5.00% 9/1/37 | 3,210,000 | 4,393,495 | ||||||
Columbus County, North Carolina Industrial Facilities & Pollution Control Financing | ||||||||
(International Paper Co. Project) Series A 5.70% 5/1/34 | 1,000,000 | 1,028,550 | ||||||
Florida Development Finance | ||||||||
(Virgin Trains USA Passenger Rail Project) Series A 144A 6.50% 1/1/49 (AMT)#● | 10,000,000 | 9,537,900 | ||||||
Golden State, California Tobacco Securitization Corporate Settlement Revenue | ||||||||
(Asset-Backed) SeriesA-2 5.00% 6/1/47 | 4,000,000 | 4,102,640 | ||||||
(Capital Appreciation -Asset-Backed-1st Subordinate) Series B 1.548% 6/1/47 ^ | 30,145,000 | 5,177,705 | ||||||
Houston, Texas Airport System Revenue | ||||||||
SeriesB-1 5.00% 7/15/35 (AMT) | 5,000,000 | 5,655,350 | ||||||
(Special Facilities Continental Airlines, Inc. Terminal Improvements Projects) Series 2011 6.625% 7/15/38 (AMT) | 2,000,000 | 2,159,840 | ||||||
52
Table of Contents
| Principal amount° | Value (US $) | |||||||
Municipal Bonds(continued) | ||||||||
Corporate Revenue Bonds(continued) | ||||||||
Houston, Texas Airport System Revenue | ||||||||
(United Airlines Inc.) 5.00% 7/1/29 (AMT) | 1,150,000 | $ | 1,301,467 | |||||
Indiana Finance Authority Exempt Facility Revenue | ||||||||
(Polyflow Indiana Project - Green Bond) 144A 7.00% 3/1/39 (AMT)# | 12,500,000 | 12,928,500 | ||||||
Louisiana Local Government Environmental Facilities & Community Development Authority Revenue | ||||||||
(Westlake Chemical Corp.) SeriesA-1 6.50% 11/1/35 | 3,000,000 | 3,172,320 | ||||||
Louisiana Tobacco Settlement Financing Corporation | ||||||||
Asset-Backed Note Series A 5.25% 5/15/35 | 2,540,000 | 2,805,074 | ||||||
Lower Alabama Gas District Project Revenue | ||||||||
Series A 5.00% 9/1/46 | 2,300,000 | 3,356,597 | ||||||
Main Street Natural Gas Project Revenue, Georgia | ||||||||
Series A 5.50% 9/15/23 | 40,000 | 46,130 | ||||||
Michigan Tobacco Settlement Financing Authority Revenue Asset-Backed | ||||||||
Series A 6.00% 6/1/48 | 1,255,000 | 1,261,300 | ||||||
M-S-R Energy Authority, California Gas Revenue | ||||||||
Series A 6.50% 11/1/39 | 2,500,000 | 3,998,700 | ||||||
Series B 6.50% 11/1/39 | 2,500,000 | 3,998,700 | ||||||
Nassau County, New York Tobacco Settlement Corporation Revenue | ||||||||
(Asset-Backed) SeriesA-3 5.125% 6/1/46 | 1,235,000 | 1,234,963 | ||||||
Nevada State Department of Business & Industry | ||||||||
(Green Fulcrum Sierra Biofuels Project) 144A 6.25% 12/15/37 (AMT)# | 2,500,000 | 2,934,775 | ||||||
New Jersey Economic Development Authority Special Facility Revenue | ||||||||
(Continental Airlines Project) | ||||||||
5.25% 9/15/29 (AMT) | 4,000,000 | 4,417,280 | ||||||
Series B 5.625% 11/15/30 (AMT) | 1,270,000 | 1,477,429 | ||||||
New Jersey Tobacco Settlement Financing Corporation | ||||||||
Series B 5.00% 6/1/46 | 4,460,000 | 4,995,468 | ||||||
New York Liberty Development Corporation Revenue | ||||||||
(Goldman Sachs Headquarters Issue) 5.25% 10/1/35 | 7,000,000 | 9,744,630 | ||||||
(Second Priority - Bank of America Tower) Class 3 6.375% 7/15/49 | 2,000,000 | 2,039,800 | ||||||
New York Transportation Development Corporation Special Facility Revenue | ||||||||
(Delta Air Lines, Inc. - LaGuardia Airport Terminals C&D Redevelopment Project) Series 2018 4.00% 1/1/36 (AMT) | 1,960,000 | 2,168,172 | ||||||
53
Table of Contents
| Schedules of investments | ||
| Delaware National High-Yield Municipal Bond Fund | ||
| Principal amount° | Value (US $) | |||||||
Municipal Bonds (continued) | ||||||||
Corporate Revenue Bonds(continued) | ||||||||
Pennsylvania Economic Development Financing Authority | ||||||||
(CarbonLite P, LLC Project) 144A 5.75% 6/1/36 (AMT)# | 7,625,000 | $ | 8,207,397 | |||||
(National Gypsum) 5.50% 11/1/44 (AMT) | 4,500,000 | 4,835,430 | ||||||
Pima County, Arizona Industrial Development Authority Pollution Control Revenue | ||||||||
(Tucson Electric Power) Series A 5.25% 10/1/40 | 500,000 | 518,495 | ||||||
Port of Seattle, Washington Industrial Development Corporation Special Facilities Revenue | ||||||||
(Delta Airlines) 5.00% 4/1/30 (AMT) | 2,000,000 | 2,201,000 | ||||||
Public Authority for Colorado Energy Natural Gas Revenue | ||||||||
Series 28 6.50% 11/15/38 | 2,000,000 | 3,119,500 | ||||||
Salt Verde, Arizona Financial Senior Gas Revenue | ||||||||
5.00% 12/1/37 | 11,765,000 | 16,322,643 | ||||||
5.25% 12/1/27 | 2,235,000 | 2,819,520 | ||||||
5.25% 12/1/28 | 1,050,000 | 1,350,290 | ||||||
5.50% 12/1/29 | 765,000 | 1,016,563 | ||||||
Shoals, Indiana | ||||||||
(National Gypsum Co. Project) 7.25% 11/1/43 (AMT) | 1,625,000 | 1,816,783 | ||||||
Tennessee State Energy Acquisition Gas Revenue | ||||||||
Series A 4.00% 5/1/48● | 720,000 | 779,465 | ||||||
Series C 5.00% 2/1/27 | 2,940,000 | 3,559,723 | ||||||
TSASC, New York | ||||||||
Series A 5.00% 6/1/41 | 705,000 | 788,303 | ||||||
Subordinate Series B 5.00% 6/1/48 | 1,000,000 | 991,900 | ||||||
Tulsa, Oklahoma Municipal Airports Improvement Trust Revenue | ||||||||
Series A 5.50% 6/1/35 (AMT) | 2,000,000 | 2,203,800 | ||||||
(American Airlines) 5.00% 6/1/35 (AMT)● | 3,000,000 | 3,419,070 | ||||||
Valparaiso, Indiana | ||||||||
(Pratt Paper LLC Project) 7.00% 1/1/44 (AMT) | 2,865,000 | 3,394,567 | ||||||
Virginia Tobacco Settlement Financing Corporation | ||||||||
SeriesB-1 5.00% 6/1/47 | 2,000,000 | 2,005,040 | ||||||
Series C 2.419% 6/1/47 ^ | 66,475,000 | 7,810,148 | ||||||
Series D 2.594% 6/1/47 ^ | 137,270,000 | 14,690,635 | ||||||
Washington Economic Development Finance Authority Revenue | ||||||||
(Columbia Pulp I, LLC Project) Series 2017A 144A 7.50% 1/1/32 (AMT)# | 5,000,000 | 5,177,300 | ||||||
|
| |||||||
| 266,438,095 | ||||||||
|
| |||||||
54
Table of Contents
| Principal amount° | Value (US $) | |||||||
Municipal Bonds(continued) | ||||||||
Education Revenue Bonds – 19.07% | ||||||||
Arizona Industrial Development Authority Revenue | ||||||||
(ACCEL Schools Project) Series A 144A 5.25% 8/1/48 # | 3,200,000 | $ | 3,449,888 | |||||
(American Charter Schools Foundation Project) | ||||||||
144A 6.00% 7/1/37 # | 775,000 | 903,689 | ||||||
144A 6.00% 7/1/47 # | 4,735,000 | 5,434,075 | ||||||
(Basis Schools Projects) | ||||||||
Series A 144A 5.125% 7/1/37 # | 750,000 | 831,067 | ||||||
Series A 144A 5.375% 7/1/50 # | 1,000,000 | 1,105,240 | ||||||
(Kaizen Education Foundation Project) 144A 5.80% 7/1/52 # | 4,000,000 | 4,441,200 | ||||||
(Pinecrest Academy Nevada-Horizon, Inspirada) Series A 144A 5.75% 7/15/48 # | 2,250,000 | 2,544,705 | ||||||
Arlington, Texas Higher Education Finance | ||||||||
(Leadership Preparatory School) | ||||||||
Series A 5.00% 6/15/36 | 700,000 | 718,914 | ||||||
Series A 5.00% 6/15/46 | 1,325,000 | 1,354,799 | ||||||
Build NYC Resource, New York | ||||||||
5.00% 11/1/39 | 1,000,000 | 1,065,810 | ||||||
(Inwood Academy for Leadership Charter School Project) | ||||||||
Series A 144A 5.125% 5/1/38 # | 575,000 | 618,430 | ||||||
Series A 144A 5.50% 5/1/48 # | 1,500,000 | 1,641,375 | ||||||
(New Dawn Charter Schools Project) | ||||||||
144A 5.625% 2/1/39 # | 1,290,000 | 1,387,795 | ||||||
144A 5.75% 2/1/49 # | 2,700,000 | 2,893,725 | ||||||
Burbank, Illinois | ||||||||
(Intercultural Montessori Language) 144A 6.25% 9/1/45 # | 4,000,000 | 4,486,600 | ||||||
California Educational Facilities Authority Revenue | ||||||||
(Loma Linda University) Series A 5.00% 4/1/47 | 1,500,000 | 1,776,060 | ||||||
(Stanford University) SeriesV-1 5.00% 5/1/49 | 24,050,000 | 38,296,499 | ||||||
California Municipal Finance Authority Revenue | ||||||||
(California Baptist University) Series A 144A 5.50% 11/1/45 # | 4,000,000 | 4,663,440 | ||||||
(Julian Charter School Project) Series A 144A 5.625% 3/1/45 # | 5,250,000 | 5,492,970 | ||||||
(Partnership Uplift Community Project) Series A 5.25% 8/1/42 | 1,700,000 | 1,791,647 | ||||||
(Santa Rosa Academy Project) Series A 6.00% 7/1/42 | 1,250,000 | 1,351,137 | ||||||
(Southwestern Law School) 6.50% 11/1/41 | 1,500,000 | 1,671,675 | ||||||
55
Table of Contents
| Schedules of investments | ||
| Delaware National High-Yield Municipal Bond Fund | ||
| Principal amount° | Value (US $) | |||||||
Municipal Bonds(continued) | ||||||||
Education Revenue Bonds(continued) | ||||||||
California School Finance Authority | ||||||||
(Aspire Public Schools) | ||||||||
Series A 144A 5.00% 8/1/35 # | 585,000 | $ | 668,363 | |||||
Series A 144A 5.00% 8/1/40 # | 605,000 | 684,806 | ||||||
(Encore Education Obligated Group) Series A 144A 5.00% 6/1/52 # | 1,000,000 | 902,060 | ||||||
(Escuela Popular Project) 144A 6.50% 7/1/50 # | 2,750,000 | 2,892,367 | ||||||
(New Designs Charter School) Series A 5.50% 6/1/42 | 1,750,000 | 1,873,305 | ||||||
(View Park Elementary & Middle Schools) | ||||||||
Series A 5.875% 10/1/44 | 1,000,000 | 1,116,420 | ||||||
Series A 6.00% 10/1/49 | 720,000 | 806,206 | ||||||
California State University | ||||||||
(Systemwide) | ||||||||
Series A 5.00% 11/1/26 | 2,000,000 | 2,567,680 | ||||||
Series A 5.00% 11/1/27 | 2,300,000 | 2,987,470 | ||||||
California Statewide Communities Development Authority Charter School Revenue | ||||||||
(Green Dot Public Schools) Series A 7.25% 8/1/41 | 1,915,000 | 2,096,599 | ||||||
California Statewide Communities Development Authority Revenue | ||||||||
(Lancer Educational Student Housing Project) Series A 144A 5.00% 6/1/46 # | 1,500,000 | 1,682,790 | ||||||
Capital Trust Agency, Florida | ||||||||
(Pineapple Cove Classical Academy Inc. Project) | ||||||||
Series A 144A 5.375% 7/1/54 # | 6,000,000 | 6,372,240 | ||||||
(River City Education Services Project) | ||||||||
Series A 5.375% 2/1/35 | 870,000 | 909,541 | ||||||
Series A 5.625% 2/1/45 | 1,500,000 | 1,572,075 | ||||||
(University Bridge, LLC Student Housing Project) | ||||||||
Series A 144A 5.25% 12/1/58 # | 8,000,000 | 8,561,440 | ||||||
Colorado Educational & Cultural Facilities Authority Revenue | ||||||||
(Charter School - Community Leadership Academy) 7.45% 8/1/48 | 2,000,000 | 2,290,080 | ||||||
(Charter School - Loveland Classical School) 144A 5.00% 7/1/46 # | 1,500,000 | 1,597,035 | ||||||
(Skyview Charter School) 144A 5.375% 7/1/44 # | 500,000 | 531,895 | ||||||
(Windsor Charter Academy Project) Series 2016 144A 5.00% 9/1/36 # | 1,000,000 | 1,022,610 | ||||||
East Hempfield Township, Pennsylvania Industrial Development Authority | ||||||||
(Student Services Income - Student Housing Project) 5.00% 7/1/30 | 1,000,000 | 1,094,930 | ||||||
56
Table of Contents
| Principal amount° | Value (US $) | |||||||
Municipal Bonds(continued) | ||||||||
Education Revenue Bonds(continued) | ||||||||
Hawaii State Department of Budget & Finance | ||||||||
(Hawaii Pacific University) Series A 6.875% 7/1/43 | 2,000,000 | $ | 2,150,500 | |||||
Henderson, Nevada Public Improvement Trust | ||||||||
(Touro College & University System) | ||||||||
Series A 5.50% 1/1/39 | 460,000 | 519,726 | ||||||
Series A 5.50% 1/1/44 | 2,000,000 | 2,249,100 | ||||||
Idaho Housing & Finance Association | ||||||||
(Idaho Arts Charter School) 144A 5.00% 12/1/36 # | 715,000 | 798,412 | ||||||
(North Star Charter School) | ||||||||
Capital Appreciation Subordinate Series B 144A 4.88% 7/1/49 #^ | 2,888,155 | 572,577 | ||||||
Series A 6.75% 7/1/48 | 529,150 | 580,874 | ||||||
(Xavier Charter School Project) Series A 5.00% 6/1/50 | 1,000,000 | 1,107,800 | ||||||
Illinois Finance Authority Charter School Revenue | ||||||||
(Chicago International Charter School Project) 5.00% 12/1/47 | 2,805,000 | 3,171,221 | ||||||
(Uno Charter School) Series A 7.125% 10/1/41 | 1,000,000 | 1,072,740 | ||||||
Illinois Finance Authority Revenue | ||||||||
(Lake Forest College) Series A 6.00% 10/1/48 | 1,000,000 | 1,084,070 | ||||||
(Rogers Park Montessori) | ||||||||
6.00% 2/1/34 | 675,000 | 746,550 | ||||||
6.125% 2/1/45 | 1,800,000 | 1,973,682 | ||||||
Illinois Finance Authority Student Housing & Academic Facility Revenue | ||||||||
(University of Illinois at Chicago Project) Series A 5.00% 2/15/47 | 3,500,000 | 3,988,180 | ||||||
Illinois Finance Authority Student Housing Revenue | ||||||||
(Dekalb II - Northern Illinois University Project) 6.875% 10/1/43 | 1,000,000 | 1,066,520 | ||||||
Indiana State Finance Authority Revenue Educational Facilities | ||||||||
(Drexel Foundation - Thea Bowman Academy Charter School) Series A 7.00% 10/1/39 | 1,000,000 | 1,001,580 | ||||||
Kanawha, West Virginia | ||||||||
(West Virginia University Foundation Project) 6.75% 7/1/45 | 2,500,000 | 2,729,375 | ||||||
Kent County, Delaware Student Housing and Dining Facilities Revenue | ||||||||
(Delaware State University Project) | ||||||||
Series A 5.00% 7/1/53 | 140,000 | 155,259 | ||||||
Series A 5.00% 7/1/58 | 1,250,000 | 1,376,750 | ||||||
57
Table of Contents
| Schedules of investments | ||
| Delaware National High-Yield Municipal Bond Fund | ||
| Principal amount° | Value (US $) | |||||||
Municipal Bonds(continued) | ||||||||
Education Revenue Bonds(continued) | ||||||||
Louisiana Public Facilities Authority Revenue | ||||||||
(Lake Charles Charter Academy Foundation Project) 8.00% 12/15/41 | 1,500,000 | $ | 1,624,965 | |||||
Macon-Bibb County, Georgia Urban Development Authority Revenue | ||||||||
(Academy for Classical Education) | ||||||||
Series A 144A 5.875% 6/15/47 # | 1,680,000 | 1,780,313 | ||||||
Series A 144A 6.00% 6/15/52 # | 1,530,000 | 1,623,437 | ||||||
Maryland State Health & Higher Educational Facilities Authority Revenue | ||||||||
(Patterson Park Public Charter School) Series A 6.125% 7/1/45 | 1,000,000 | 1,000,180 | ||||||
Miami-Dade County, Florida Industrial Development Authority | ||||||||
(YouthCo-Op Charter School) | ||||||||
Series A 144A 5.75% 9/15/35 # | 1,000,000 | 1,059,410 | ||||||
Series A 144A 6.00% 9/15/45 # | 1,000,000 | 1,060,780 | ||||||
Michigan Finance Authority Limited Obligation Revenue | ||||||||
(Public School Academy Old Redford) Series A 6.50% 12/1/40 | 900,000 | 911,421 | ||||||
Michigan Public Educational Facilities Authority Revenue | ||||||||
(Limited-Obligation-Landmark Academy) 7.00% 12/1/39 | 950,000 | 956,393 | ||||||
Nevada State Department of Business & Industry | ||||||||
(Somerset Academy) | ||||||||
Series A 144A 5.00% 12/15/35 # | 1,595,000 | 1,743,813 | ||||||
Series A 144A 5.125% 12/15/45 # | 2,515,000 | 2,718,463 | ||||||
New Jersey State Higher Education Student Assistance Authority Student Loan Revenue | ||||||||
Series 1B 5.75% 12/1/39 (AMT) | 1,250,000 | 1,393,600 | ||||||
New York State Dormitory Authority | ||||||||
(Touro College & University System) Series A 5.50% 1/1/44 | 2,875,000 | 3,223,393 | ||||||
Pennsylvania State Higher Educational Facilities Authority Revenue | ||||||||
(Foundation Indiana University) Series A 2.204% 7/1/39 (SGI)● | 2,400,000 | 2,103,720 | ||||||
Philadelphia, Pennsylvania Authority for Industrial Development Revenue | ||||||||
(1st Philadelphia Preparatory) Series A 7.25% 6/15/43 | 1,230,000 | 1,433,688 | ||||||
(Global Leadership Academy Project) 6.375% 11/15/40 | 1,000,000 | 1,029,200 | ||||||
(Green Woods Charter School Project) Series A 5.75% 6/15/42 | 1,600,000 | 1,689,712 | ||||||
58
Table of Contents
| Principal amount° | Value (US $) | |||||||
Municipal Bonds(continued) | ||||||||
Education Revenue Bonds(continued) | ||||||||
Philadelphia, Pennsylvania Authority for Industrial Development Revenue | ||||||||
(Tacony Academy Charter School Project) 7.00% 6/15/43 | 1,540,000 | $ | 1,716,499 | |||||
Phoenix, Arizona Industrial Development Authority Education Revenue | ||||||||
(Basic Schools Project) | ||||||||
Series 2015A 144A 5.00% 7/1/46 # | 4,000,000 | 4,298,240 | ||||||
Series 2016A 144A 5.00% 7/1/45 # | 2,000,000 | 2,150,200 | ||||||
(Choice Academies Project) | ||||||||
5.375% 9/1/32 | 1,000,000 | 1,054,560 | ||||||
5.625% 9/1/42 | 600,000 | 630,168 | ||||||
(Downtown Phoenix Student Housing, LLC - Arizona State University Project) Series 2018A 5.00% 7/1/37 | 250,000 | 297,345 | ||||||
(Eagle College Preparatory Project) Series A 5.00% 7/1/43 | 450,000 | 465,655 | ||||||
(Rowan University Project) 5.00% 6/1/42 | 2,000,000 | 2,147,240 | ||||||
Pima County, Arizona Industrial Development Authority Education Revenue | ||||||||
(American Leadership Academy Project) | ||||||||
144A 5.00% 6/15/47 # | 1,630,000 | 1,686,724 | ||||||
144A 5.00% 6/15/52 # | 1,400,000 | 1,446,844 | ||||||
(Edkey Charter Schools Project) 6.00% 7/1/43 | 2,000,000 | 2,009,360 | ||||||
Pottsboro, Texas Higher Education Finance Authority Revenue | ||||||||
Series A 5.00% 8/15/36 | 655,000 | 712,168 | ||||||
Series A 5.00% 8/15/46 | 1,000,000 | 1,069,500 | ||||||
Private Colleges & Universities Authority, Georgia Revenue | ||||||||
(Mercer University) Series A 5.00% 10/1/32 | 1,005,000 | 1,064,084 | ||||||
Public Finance Authority Revenue, Wisconsin | ||||||||
(Goodwill Industries of Southern Nevada Project) | ||||||||
Series A 5.50% 12/1/38 | 2,572,956 | 2,310,617 | ||||||
Series A 5.75% 12/1/48 | 2,576,272 | 2,318,336 | ||||||
(Minnesota College of Osteopathic Medicine) | ||||||||
Senior SeriesA-1 144A 5.50% 12/1/48 # | 4,125,000 | 4,127,929 | ||||||
Subordinate Series B 144A 7.75% 12/1/48 #● | 2,500,000 | 1,451,200 | ||||||
(Wilson Preparatory Academy) | ||||||||
Series A 144A 4.125% 6/15/29 # | 540,000 | 567,686 | ||||||
Series A 144A 5.00% 6/15/39 # | 500,000 | 528,800 | ||||||
Series A 144A 5.00% 6/15/49 # | 1,100,000 | 1,155,033 | ||||||
59
Table of Contents
| Schedules of investments | ||
| Delaware National High-Yield Municipal Bond Fund | ||
| Principal amount° | Value (US $) | |||||||
Municipal Bonds(continued) | ||||||||
Education Revenue Bonds(continued) | ||||||||
South Carolina Jobs-Economic Development Authority Educational Facilities Revenue | ||||||||
(High Point Academy Project) Series A 144A 5.75% 6/15/49 # | 5,000,000 | $ | 5,635,050 | |||||
St. Paul, Minnesota Housing & Redevelopment Authority Charter School Lease Revenue | ||||||||
(Academia Cesar Chavez School Project) Series A 5.25% 7/1/50 | 2,560,000 | 2,720,563 | ||||||
(Hmong College Preparatory Academy Project) | ||||||||
Series A 5.75% 9/1/46 | 1,000,000 | 1,118,090 | ||||||
Series A 6.00% 9/1/51 | 3,000,000 | 3,390,120 | ||||||
University of California | ||||||||
Series AZ 5.25% 5/15/58 | 6,185,000 | 7,751,661 | ||||||
University of Texas System Board of Regents | ||||||||
Series B 5.00% 8/15/49 | 18,900,000 | 30,425,598 | ||||||
Utah State Charter School Finance Authority Revenue | ||||||||
(North Davis Preparatory) 6.375% 7/15/40 | 1,290,000 | 1,330,196 | ||||||
Wisconsin Public Finance Authority Revenue | ||||||||
(Pine Lake Preparatory) 144A 5.50% 3/1/45 # | 3,460,000 | 3,770,535 | ||||||
(Roseman University Health Sciences Project) 5.75% 4/1/42 | 2,000,000 | 2,117,420 | ||||||
Wyoming Community Development Authority Student Housing Revenue | ||||||||
(CHF-Wyoming LLC) 6.50% 7/1/43 | 1,000,000 | 1,056,940 | ||||||
Yonkers, New York Economic Development Corporation Education Revenue | ||||||||
(Charter School Educational Excellence) Series A 6.25% 10/15/40 | 595,000 | 614,742 | ||||||
|
| |||||||
| 274,987,159 | ||||||||
|
| |||||||
Electric Revenue Bonds – 1.95% | ||||||||
Municipal Electric Authority of Georgia | ||||||||
(Plant Vogtle Units 3 & 4 Project) Series A 5.00% 1/1/49 | 10,000,000 | 11,619,900 | ||||||
Puerto Rico Electric Power Authority Revenue | ||||||||
Series A 5.00% 7/1/42 ‡ | 7,740,000 | 6,192,000 | ||||||
Series CCC 5.25% 7/1/27 ‡ | 730,000 | 585,825 | ||||||
Series WW 5.00% 7/1/28 ‡ | 990,000 | 792,000 | ||||||
Series XX 5.25% 7/1/40 ‡ | 7,040,000 | 5,649,600 | ||||||
Salt River Project Agricultural Improvement & Power District, Arizona | ||||||||
(Salt River Project) Series A 5.00% 1/1/31 | 2,520,000 | 3,238,855 | ||||||
|
| |||||||
| 28,078,180 | ||||||||
|
| |||||||
60
Table of Contents
| Principal amount° | Value (US $) | |||||||
Municipal Bonds(continued) | ||||||||
Healthcare Revenue Bonds – 23.42% | ||||||||
Abag, California Finance Authority for Nonprofit Corporations | ||||||||
(Episcopal Senior Communities) 6.125% 7/1/41 | 1,650,000 | $ | 1,780,301 | |||||
Alachua County, Florida Health Facilities Authority | ||||||||
(Oak Hammock University) | ||||||||
Series A 8.00% 10/1/42 | 1,000,000 | 1,138,580 | ||||||
Series A 8.00% 10/1/46 | 1,500,000 | 1,703,160 | ||||||
Allen County, Indiana Economic Development Revenue | ||||||||
(StoryPoint Fort Wayne Project) SeriesA-1 144A 6.875% 1/15/52 # | 1,650,000 | 1,820,263 | ||||||
Apple Valley, Minnesota | ||||||||
(Minnesota Senior Living LLC, Project) | ||||||||
Series B 5.00% 1/1/47 | 2,500,000 | 2,546,425 | ||||||
Series D 7.25% 1/1/52 | 7,290,000 | 7,599,388 | ||||||
Arizona Industrial Development Authority Revenue | ||||||||
(Great Lakes Senior Living Communities LLC Project Fourth Tier) Series D 144A 7.25% 1/1/54 # | 2,500,000 | 2,626,850 | ||||||
(Great Lakes Senior Living Communities LLC Project Second Tier) | ||||||||
Series B 5.00% 1/1/49 | 975,000 | 1,093,472 | ||||||
Series B 5.125% 1/1/54 | 1,130,000 | 1,274,425 | ||||||
(Great Lakes Senior Living Communities LLC Project Third Tier) | ||||||||
Series C 144A 5.00% 1/1/49 # | 1,000,000 | 1,056,380 | ||||||
Series C 144A 5.50% 1/1/54 # | 4,000,000 | 4,384,440 | ||||||
(Great Lakes Senior Living Communities LLC Project) Series A 5.00% 1/1/54 | 2,595,000 | 2,962,374 | ||||||
Bexar County, Texas Health Facilities Development | ||||||||
(Army Retirement Residence Foundation Project) Series 2010 5.875% 7/1/30 | 155,000 | 160,278 | ||||||
Birmingham, Alabama Special Care Facilities Financing Authority | ||||||||
(Methodist Home for the Aging) | ||||||||
5.50% 6/1/30 | 1,850,000 | 2,132,754 | ||||||
5.75% 6/1/35 | 1,500,000 | 1,723,350 | ||||||
5.75% 6/1/45 | 2,500,000 | 2,822,250 | ||||||
6.00% 6/1/50 | 2,650,000 | 3,022,431 | ||||||
Butler County, Ohio Port Authority | ||||||||
(StoryPoint Fairfield Project) SeriesA-1 144A 6.50% 1/15/52 # | 650,000 | 707,635 | ||||||
California Health Facilities Financing Authority Revenue | ||||||||
(Kaiser Permanente) SeriesA-2 5.00% 11/1/47 | 4,870,000 | �� 7,660,169 | ||||||
61
Table of Contents
| Schedules of investments | ||
| Delaware National High-Yield Municipal Bond Fund | ||
| Principal amount° | Value (US $) | |||||||
Municipal Bonds(continued) | ||||||||
Healthcare Revenue Bonds(continued) | ||||||||
California Municipal Finance Authority Revenue | ||||||||
(Northbay Healthcare Group) Series A 5.25% 11/1/47 | 500,000 | $ | 582,680 | |||||
California Statewide Communities Development Authority Revenue | ||||||||
(be.group) 144A 7.25% 11/15/41 # | 500,000 | 506,120 | ||||||
(Loma Linda University Medical Center) 5.50% 12/1/54 | 13,000,000 | 14,686,230 | ||||||
Series A 144A 5.25% 12/1/56 # | 3,000,000 | 3,430,800 | ||||||
Series A 144A 5.50% 12/1/58 # | 4,600,000 | 5,486,190 | ||||||
Camden County, New Jersey Improvement Authority Revenue | ||||||||
(Cooper Health System Obligation Group) 5.75% 2/15/42 | 2,500,000 | 2,814,800 | ||||||
Capital Trust Agency, Florida | ||||||||
(Elim Senior Housing Inc. Project) 144A 5.875% 8/1/52 # | 2,500,000 | 2,637,975 | ||||||
(Tuscan Gardens Senior Living Center) Series A 7.00% 4/1/49 | 5,000,000 | 5,006,450 | ||||||
Chesterfield County, Virginia Economic Development Authority Revenue | ||||||||
(1st Mortgage - Brandermill Woods Project) 5.125% 1/1/43 | 1,030,000 | 1,062,352 | ||||||
Chesterton, Indiana | ||||||||
(StoryPoint Chesterton Project) SeriesA-1 144A 6.375% 1/15/51 # | 1,000,000 | 1,081,840 | ||||||
Cobb County, Georgia Development Authority | ||||||||
(Provident Village at Creekside Project) Series A 144A 6.00% 7/1/51 # | 3,500,000 | 3,384,080 | ||||||
Colorado Health Facilities Authority Revenue | ||||||||
(American Baptist) 8.00% 8/1/43 | 2,500,000 | 2,860,175 | ||||||
(CommonSpirit Health) | ||||||||
SeriesA-1 4.00% 8/1/44 | 3,750,000 | 4,155,450 | ||||||
SeriesA-2 4.00% 8/1/49 | 5,000,000 | 5,504,200 | ||||||
SeriesA-2 5.00% 8/1/44 | 2,500,000 | 3,048,925 | ||||||
(Mental Health Center Denver Project) Series A 5.75% 2/1/44 | 500,000 | 565,010 | ||||||
(School Health Systems) Series A 5.00% 1/1/44 | 1,000,000 | 1,126,920 | ||||||
(Sunny Vista Living Center) | ||||||||
Series A 144A 5.50% 12/1/30 # | 750,000 | 798,757 | ||||||
Series A 144A 5.75% 12/1/35 # | 1,150,000 | 1,226,095 | ||||||
Series A 144A 6.125% 12/1/45 # | 1,200,000 | 1,288,116 | ||||||
Series A 144A 6.25% 12/1/50 # | 560,000 | 603,299 | ||||||
62
Table of Contents
| Principal amount° | Value (US $) | |||||||
Municipal Bonds(continued) | ||||||||
Healthcare Revenue Bonds(continued) | ||||||||
Cumberland County, Pennsylvania Municipal Authority Revenue | ||||||||
(Asbury Pennsylvania Obligation Group) 5.25% 1/1/41 | 1,600,000 | $ | 1,659,024 | |||||
Cuyahoga County, Ohio Hospital Revenue | ||||||||
(The Metrohealth System) | ||||||||
5.25% 2/15/47 | 5,200,000 | 6,061,172 | ||||||
5.50% 2/15/52 | 4,655,000 | 5,497,322 | ||||||
5.50% 2/15/57 | 7,250,000 | 8,535,207 | ||||||
Decatur, Texas Hospital Authority | ||||||||
(Wise Regional Health Systems) | ||||||||
Series A 5.00% 9/1/34 | 1,000,000 | 1,121,030 | ||||||
Series A 5.25% 9/1/29 | 500,000 | 573,905 | ||||||
Series A 5.25% 9/1/44 | 2,000,000 | 2,223,120 | ||||||
Duluth, Minnesota Economic Development Authority Revenue | ||||||||
(St. Luke’s Hospital Authority Obligation Group) 5.75% 6/15/32 | 3,750,000 | 4,125,263 | ||||||
Florida Development Finance | ||||||||
(UF Health - Jacksonville Project) Series A 6.00% 2/1/33 | 2,375,000 | 2,664,797 | ||||||
Glendale, Arizona Industrial Development Authority Revenue | ||||||||
(Glencroft Retirement Community Project) | ||||||||
5.00% 11/15/36 | 830,000 | 891,619 | ||||||
5.25% 11/15/51 | 1,350,000 | 1,442,367 | ||||||
Guilderland, New York Industrial Development Agency | ||||||||
Series A 144A 5.875% 1/1/52 # | 6,000,000 | 6,177,300 | ||||||
Hawaii State Department of Budget & Finance Special Purpose Senior Living Revenue | ||||||||
(Hawaii Pacific Health Obligation) Series A 5.50% 7/1/43 | 2,990,000 | 3,368,564 | ||||||
(Kahala Nui) 5.25% 11/15/37 | 1,000,000 | 1,118,280 | ||||||
Hospital Facilities Authority of Multnomah County, Oregon | ||||||||
(Mirabella at South Waterfront) 5.50% 10/1/49 | 2,400,000 | 2,641,272 | ||||||
Idaho Health Facilities Authority Revenue | ||||||||
(St. Luke’s Health System Project) Series A 5.00% 3/1/33 | 485,000 | 598,272 | ||||||
(Valley Vista Care Corporation) Series A 5.00% 11/15/32 | 455,000 | 492,788 | ||||||
Illinois Finance Authority Revenue | ||||||||
(Admiral at Lake Project) 5.25% 5/15/54 | 5,000,000 | 5,362,600 | ||||||
(Lutheran Home & Services) 5.75% 5/15/46 | 1,685,000 | 1,753,445 | ||||||
63
Table of Contents
| Schedules of investments | ||
| Delaware National High-Yield Municipal Bond Fund | ||
| Principal amount° | Value (US $) | |||||||
Municipal Bonds(continued) | ||||||||
Healthcare Revenue Bonds(continued) | ||||||||
Illinois Housing Development Authority | ||||||||
(Stonebridge of Gurnee Project) | ||||||||
Series A 144A 5.45% 1/1/46 # | 2,500,000 | $ | 2,503,775 | |||||
Series A 144A 5.60% 1/1/56 # | 2,630,000 | 2,645,070 | ||||||
Indiana Finance Authority Revenue | ||||||||
(King’s Daughters Hospital & Health) | ||||||||
5.50% 8/15/40 | 1,000,000 | 1,036,990 | ||||||
5.50% 8/15/45 | 1,000,000 | 1,035,610 | ||||||
(Marquette Project) 5.00% 3/1/39 | 1,250,000 | 1,318,437 | ||||||
Iowa Finance Authority | ||||||||
(PHS Council Bluffs Project) | ||||||||
5.125% 8/1/48 | 1,650,000 | 1,752,168 | ||||||
5.25% 8/1/55 | 2,500,000 | 2,659,450 | ||||||
(Sunrise Retirement Community) 5.75% 9/1/43 | 2,500,000 | 2,556,575 | ||||||
Kalispell, Montana | ||||||||
(Immanuel Lutheran Corporation Project) Series A 5.25% 5/15/47 | 1,300,000 | 1,406,197 | ||||||
Kentucky Economic Development Finance Authority Healthcare Revenue | ||||||||
(Rosedale Green Project) | ||||||||
5.50% 11/15/35 | 1,310,000 | 1,413,097 | ||||||
5.75% 11/15/45 | 2,500,000 | 2,702,250 | ||||||
5.75% 11/15/50 | 1,600,000 | 1,724,928 | ||||||
Kentwood, Michigan Economic Development Corporation Revenue | ||||||||
(Limited Obligation - Holland Home) 5.625% 11/15/41 | 1,250,000 | 1,352,637 | ||||||
Kirkwood, Missouri Industrial Development Authority | ||||||||
(Aberdeen Heights) Series A 5.25% 5/15/50 | 6,000,000 | 6,745,860 | ||||||
Lucas County, Ohio Health Care Facilities Revenue | ||||||||
(Sunset Retirement Communities) 5.50% 8/15/30 | 1,000,000 | 1,066,570 | ||||||
Maine Health & Higher Educational Facilities Authority Revenue | ||||||||
(Maine General Medical Center) 6.75% 7/1/41 | 1,700,000 | 1,839,791 | ||||||
Maricopa County, Arizona Industrial Development Authority | ||||||||
(Christian Care Surprise Project) Series 2016 144A 6.00% 1/1/48 # | 5,400,000 | 5,747,814 | ||||||
Maryland Health & Higher Educational Facilities Authority | ||||||||
(Adventist Healthcare) Series A 5.50% 1/1/46 | 5,000,000 | 5,942,250 | ||||||
Michigan State Strategic Fund Limited Revenue | ||||||||
(Evangelical Homes) 5.50% 6/1/47 | 2,750,000 | 2,909,417 | ||||||
64
Table of Contents
| Principal amount° | Value (US $) | |||||||
Municipal Bonds(continued) | ||||||||
Healthcare Revenue Bonds(continued) | ||||||||
Missouri State Health & Educational Facilities Authority Revenue | ||||||||
(Lutheran Senior Services) 6.00% 2/1/41 | 1,000,000 | $ | 1,052,810 | |||||
Montgomery County, Pennsylvania Industrial Development Authority Revenue | ||||||||
(Whitemarsh Continuing Care) | ||||||||
5.25% 1/1/40 | 1,550,000 | 1,607,365 | ||||||
5.375% 1/1/50 | 6,250,000 | 6,503,000 | ||||||
Series A 5.375% 1/1/51 | 1,750,000 | 1,844,535 | ||||||
Moon, Pennsylvania Industrial Development Authority | ||||||||
(Baptist Homes Society Obligation) 6.125% 7/1/50 | 8,500,000 | 9,314,130 | ||||||
National Finance Authority Revenue, New Hampshire | ||||||||
(The Vista Project) | ||||||||
Series A 144A 5.25% 7/1/39 # | 1,265,000 | 1,382,759 | ||||||
Series A 144A 5.625% 7/1/46 # | 1,000,000 | 1,103,580 | ||||||
Series A 144A 5.75% 7/1/54 # | 2,000,000 | 2,205,680 | ||||||
New Hampshire Health & Education Facilities Authority | ||||||||
(Rivermeade) Series A 6.875% 7/1/41 | 1,380,000 | 1,465,836 | ||||||
New Hope, Texas Cultural Education Facilities Finance | ||||||||
(Cardinal Bay - Village on the Park) | ||||||||
Series A1 5.00% 7/1/46 | 830,000 | 926,305 | ||||||
Series A1 5.00% 7/1/51 | 1,595,000 | 1,759,413 | ||||||
Series B 4.00% 7/1/31 | 635,000 | 650,221 | ||||||
Series B 4.75% 7/1/51 | 1,915,000 | 1,981,431 | ||||||
Series C 5.00% 7/1/31 | 250,000 | 264,025 | ||||||
Series C 5.25% 7/1/36 | 350,000 | 369,887 | ||||||
Series C 5.50% 7/1/46 | 1,250,000 | 1,318,163 | ||||||
Series C 5.75% 7/1/51 | 1,000,000 | 1,069,050 | ||||||
Series D 6.00% 7/1/26 | 120,000 | 123,349 | ||||||
Series D 7.00% 7/1/51 | 1,350,000 | 1,413,018 | ||||||
(Legacy Midtown Park Project) Series A 5.50% 7/1/54 | 2,500,000 | 2,661,500 | ||||||
New Jersey Economic Development Authority | ||||||||
(Lions Gate Project) 5.25% 1/1/44 | 2,000,000 | 2,091,000 | ||||||
New Jersey Health Care Facilities Financing Authority Revenue | ||||||||
(Barnabas Health Services) Series A 4.00% 7/1/26 | 980,000 | 1,055,881 | ||||||
(St. Peters University Hospital) 6.25% 7/1/35 | 2,700,000 | 2,889,162 | ||||||
New York State Dormitory Authority | ||||||||
(Orange Regional Medical Center) | ||||||||
144A 5.00% 12/1/40 # | 1,100,000 | 1,252,724 | ||||||
144A 5.00% 12/1/45 # | 800,000 | 906,328 | ||||||
65
Table of Contents
Schedules of investments
Delaware National High-Yield Municipal Bond Fund
| Principal amount° | Value (US $) | |||||||
Municipal Bonds(continued) | ||||||||
Healthcare Revenue Bonds(continued) | ||||||||
North Carolina Medical Care Commission Health Care Facilities Revenue | ||||||||
(First Mortgage - Galloway Ridge Project) 6.00% 1/1/39 | 1,520,000 | $ | 1,536,826 | |||||
Northampton County, Pennsylvania Industrial Development Authority Revenue | ||||||||
(Morningstar Senior Living) 5.00% 7/1/36 | 2,000,000 | 2,108,600 | ||||||
Orange County, New York Funding Corporation Assisted Living Residence Revenue | ||||||||
6.50% 1/1/46 | 3,800,000 | 3,950,518 | ||||||
Palm Beach County, Florida Health Facilities Authority | ||||||||
(Sinai Residences Boca Raton Project) | ||||||||
Series A 7.25% 6/1/34 | 285,000 | 321,078 | ||||||
Series A 7.50% 6/1/49 | 2,920,000 | 3,305,352 | ||||||
Payne County, Oklahoma Economic Development Authority | ||||||||
(Epworth Living at the Ranch) Series A 7.00% 11/1/51 ‡ | 961,600 | 9,616 | ||||||
Pennsylvania Economic Development Financing Authority | ||||||||
(Tapestry Moon Senior Housing Project) Series 2018A 144A 6.75% 12/1/53 # | 9,495,000 | 9,850,208 | ||||||
Prince George’s County, Maryland | ||||||||
(Collington Episcopal Life Care Community) 5.25% 4/1/47 | 2,000,000 | 2,189,280 | ||||||
Public Finance Authority, Wisconsin | ||||||||
(Bancroft Neurohealth Project) | ||||||||
Series A 144A 5.00% 6/1/36 # | 960,000 | 1,040,957 | ||||||
Series A 144A 5.125% 6/1/48 # | 1,375,000 | 1,479,830 | ||||||
Puerto Rico Industrial Tourist Educational Medical & Environmental Control Facilities Financing Authority | ||||||||
(Auxilio Mutuo) Series A 6.00% 7/1/33 | 5,630,000 | 5,930,361 | ||||||
Rochester, Minnesota | ||||||||
(The Homestead at Rochester) Series A 6.875% 12/1/48 | 2,500,000 | 2,744,925 | ||||||
Salem, Oregon Hospital Facility Authority Revenue | ||||||||
(Capital Manor) 6.00% 5/15/47 | 1,500,000 | 1,633,590 | ||||||
San Buenaventura, California Revenue | ||||||||
(Community Memorial Health System) 7.50% 12/1/41 | 4,475,000 | 5,009,673 | ||||||
Southeastern Ohio Port Authority | ||||||||
(Memorial Health Systems) | ||||||||
5.00% 12/1/43 | 805,000 | 856,166 | ||||||
5.50% 12/1/43 | 1,250,000 | 1,368,988 | ||||||
St. Louis County, Missouri Industrial Development Authority | ||||||||
(Nazareth Living Center Project) Series A 5.00% 8/15/35 | 600,000 | 646,596 | ||||||
66
Table of Contents
| Principal amount° | Value (US $) | |||||||
Municipal Bonds(continued) | ||||||||
Healthcare Revenue Bonds(continued) | ||||||||
St. Louis County, Missouri Industrial Development Authority | ||||||||
(Nazareth Living Center Project) Series A 5.125% 8/15/45 | 1,800,000 | $ | 1,925,856 | |||||
Suffolk County, New York Economic Development Corporation Revenue | ||||||||
(Peconic Landing Southland) 6.00% 12/1/40 | 575,000 | 601,306 | ||||||
Tarrant County, Texas Cultural Education Facilities Finance | ||||||||
(Buckingham Senior Living Community) 5.50% 11/15/45 ‡ | 3,000,000 | 2,100,000 | ||||||
(Buckner Senior Living - Ventana Project) | ||||||||
6.75% 11/15/47 | 1,850,000 | 2,145,519 | ||||||
6.75% 11/15/52 | 3,300,000 | 3,815,427 | ||||||
Tempe, Arizona Industrial Development Authority Revenue | ||||||||
(Friendship Village) Series A 6.25% 12/1/46 | 500,000 | 530,810 | ||||||
(Mirabella At ASU Project) Series A 144A 6.125% 10/1/52 # | 1,720,000 | 1,976,435 | ||||||
Vermont Economic Development Authority Revenue | ||||||||
(Wake Robin Corp. Project) 5.40% 5/1/33 | 1,100,000 | 1,155,132 | ||||||
Washington Health Care Facilities Authority Revenue | ||||||||
(CommonSpirit Health) SeriesA-2 5.00% 8/1/39 | 3,250,000 | 4,002,115 | ||||||
Washington State Housing Finance Commission | ||||||||
(Heron’s Key) Series A 144A 7.00% 7/1/50 # | 2,000,000 | 2,164,140 | ||||||
Westminster, Maryland | ||||||||
(Lutheran Village Millers Grant) | ||||||||
6.00% 7/1/34 | 800,000 | 902,808 | ||||||
Series A 5.00% 7/1/24 | 1,450,000 | 1,601,250 | ||||||
Series A 6.125% 7/1/39 | 750,000 | 843,038 | ||||||
Series A 6.25% 7/1/44 | 2,500,000 | 2,810,900 | ||||||
Wisconsin Health & Educational Facilities Authority | ||||||||
(Covenant Communities Project) | ||||||||
Series B 5.00% 7/1/48 | 1,000,000 | 1,079,630 | ||||||
Series C 7.00% 7/1/43 | 900,000 | 901,638 | ||||||
Series C 7.50% 7/1/53 | 1,000,000 | 1,002,260 | ||||||
Wisconsin Public Finance Authority | ||||||||
(Rose Villa Project) Series A 144A 5.75% 11/15/44 # | 2,000,000 | 2,186,180 | ||||||
|
| |||||||
| 337,675,782 | ||||||||
|
| |||||||
Housing Revenue Bonds – 0.49% | ||||||||
California Municipal Finance Authority Mobile Home Park Revenue | ||||||||
(Caritas Affordable Housing) Senior Series A 5.25% 8/15/39 | 1,200,000 | 1,367,040 | ||||||
(Caritas Projects) Senior Series A 5.50% 8/15/47 | 1,500,000 | 1,617,780 | ||||||
67
Table of Contents
Schedules of investments
Delaware National High-Yield Municipal Bond Fund
| Principal amount° | Value (US $) | |||||||
Municipal Bonds(continued) | ||||||||
Housing Revenue Bonds(continued) | ||||||||
Independent Cities Finance Authority, California | ||||||||
Series A 5.25% 5/15/44 | 750,000 | $ | 827,887 | |||||
Series A 5.25% 5/15/49 | 3,000,000 | 3,304,620 | ||||||
|
| |||||||
| 7,117,327 | ||||||||
|
| |||||||
Lease Revenue Bonds – 3.95% | ||||||||
California Municipal Finance Authority Revenue | ||||||||
(Goodwill Industry Sacramento Valley) 5.25% 1/1/45 | 1,295,000 | 1,317,145 | ||||||
(Goodwill Industry Sacramento Valley and Northern Nevada Project) | ||||||||
Series A 144A 6.625% 1/1/32 # | 500,000 | 529,625 | ||||||
Series A 144A 6.875% 1/1/42 # | 1,500,000 | 1,594,380 | ||||||
California Statewide Communities Development Authority Revenue | ||||||||
(Lancer Plaza Project) 5.875% 11/1/43 | 1,875,000 | 2,129,737 | ||||||
Capital Trust Agency, Florida Revenue | ||||||||
(Air Cargo - Aero Miami) Series A 5.35% 7/1/29 | 715,000 | 733,747 | ||||||
Industrial Development Authority of Phoenix, Arizona | ||||||||
5.125% 2/1/34 | 1,000,000 | 1,029,300 | ||||||
5.375% 2/1/41 | 1,400,000 | 1,441,076 | ||||||
Metropolitan Pier & Exposition Authority, Illinois | ||||||||
(McCormick Place Expansion Project) Series A 5.00% 6/15/57 | 3,975,000 | 4,464,005 | ||||||
New Jersey Economic Development Authority Special Facility Revenue | ||||||||
Series WW 5.25% 6/15/30 | 5,000,000 | 5,807,350 | ||||||
New Jersey Transportation Trust Fund Authority | ||||||||
(Federal Highway Reimbursement Revenue) Series A 5.00% 6/15/31 | 5,450,000 | 6,449,312 | ||||||
(Transportation Program) | ||||||||
Series AA 5.00% 6/15/25 | 1,000,000 | 1,178,770 | ||||||
Series AA 5.00% 6/15/44 | 4,975,000 | 5,488,519 | ||||||
Series AA 5.25% 6/15/41 | 1,000,000 | 1,136,800 | ||||||
New York Liberty Development Revenue | ||||||||
(Class2-3 World Trade Center Project) 144A 5.375% 11/15/40 # | 2,410,000 | 2,726,795 | ||||||
(Class3-3 World Trade Center Project) 144A 7.25% 11/15/44 # | 9,600,000 | 11,533,920 | ||||||
68
Table of Contents
| Principal amount° | Value (US $) | |||||||
Municipal Bonds(continued) | ||||||||
Lease Revenue Bonds(continued) | ||||||||
Public Finance Authority, Wisconsin Airport Facilities Revenue | ||||||||
(AFCO Investors II Portfolio) 144A 5.75% 10/1/31 (AMT)# | 3,775,000 | $ | 3,959,447 | |||||
(Senior Obligation Group) Series B 5.00% 7/1/42 (AMT) | 4,000,000 | 4,296,680 | ||||||
Wise County, Texas | ||||||||
(Parker County Junior College District) 8.00% 8/15/34 | 1,000,000 | 1,085,340 | ||||||
|
| |||||||
| 56,901,948 | ||||||||
|
| |||||||
Local General Obligation Bonds – 4.30% | ||||||||
Chicago, Illinois | ||||||||
Series 2005D 5.50% 1/1/37 | 2,280,000 | 2,575,807 | ||||||
Series 2005D 5.50% 1/1/40 | 3,000,000 | 3,371,550 | ||||||
Series 2007E 5.50% 1/1/42 | 2,150,000 | 2,410,107 | ||||||
Series 2007F 5.50% 1/1/42 | 1,250,000 | 1,401,225 | ||||||
Series A 5.25% 1/1/29 | 4,415,000 | 4,912,703 | ||||||
Series A 5.50% 1/1/33 | 2,000,000 | 2,277,280 | ||||||
Series A 5.50% 1/1/49 | 770,000 | 914,506 | ||||||
Series A 6.00% 1/1/38 | 6,285,000 | 7,544,765 | ||||||
Series C 5.00% 1/1/26 | 2,105,000 | 2,423,886 | ||||||
Chicago, Illinois Board of Education | ||||||||
Series A 144A 7.00% 12/1/46 # | 2,500,000 | 3,181,925 | ||||||
Series G 5.00% 12/1/44 | 2,445,000 | 2,737,349 | ||||||
Series H 5.00% 12/1/36 | 3,405,000 | 3,870,429 | ||||||
Series H 5.00% 12/1/46 | 4,225,000 | 4,717,889 | ||||||
Fairfax County, Virginia | ||||||||
Series A 5.00% 10/1/30 | 5,000,000 | 6,657,300 | ||||||
Wake County, North Carolina | ||||||||
Series A 5.00% 3/1/28 | 3,830,000 | 5,023,696 | ||||||
Series A 5.00% 3/1/31 | 6,045,000 | 8,013,857 | ||||||
|
| |||||||
| 62,034,274 | ||||||||
|
| |||||||
Pre-Refunded/Escrowed to Maturity Bonds – 4.23% | ||||||||
Arlington, Texas Higher Education Finance | ||||||||
(Arlington Classic Academy) 7.65%8/15/40-20§ | 1,000,000 | 1,059,970 | ||||||
Bexar County, Texas Health Facilities Development | ||||||||
(Army Retirement Residence Foundation Project) Series 2010 5.875%7/1/30-20§ | 845,000 | 877,600 | ||||||
Bowling Green, Ohio Student Housing Revenue CFP I | ||||||||
(State University Project) 6.00%6/1/45-20§ | 1,215,000 | 1,259,202 | ||||||
California Municipal Finance Authority Mobile Home Park Revenue | ||||||||
(Caritas Projects) Senior Series A 6.40%8/15/45-20§ | 1,665,000 | 1,749,865 | ||||||
69
Table of Contents
| Schedules of investments | ||
| Delaware National High-Yield Municipal Bond Fund | ||
| Principal amount° | Value (US $) | |||||||
Municipal Bonds(continued) | ||||||||
Pre-Refunded/Escrowed to Maturity Bonds(continued) | ||||||||
California Municipal Finance Authority Revenue | ||||||||
(Azusa Pacific University Project) Series B 144A 7.75%4/1/31-21#§ | 750,000 | $ | 823,687 | |||||
(Eisenhower Medical Center) Series A 5.75%7/1/40-20§ | 1,000,000 | 1,039,080 | ||||||
California Statewide Communities Development Authority Revenue | ||||||||
(California Baptist University Project) 7.50%11/1/41-21§ | 1,000,000 | 1,139,820 | ||||||
Central Texas Regional Mobility Authority Revenue | ||||||||
Senior Lien 6.00%1/1/41-21§ | 1,890,000 | 2,009,902 | ||||||
Subordinate Lien 6.75%1/1/41-21§ | 1,000,000 | 1,073,130 | ||||||
Clifton, Texas Higher Education Finance Corporation Revenue | ||||||||
(Idea Public Schools) 5.75%8/15/41-21§ | 1,000,000 | 1,087,100 | ||||||
(Uplift Education) Series A 6.25%12/1/45-20§ | 1,000,000 | 1,062,550 | ||||||
District of Columbia Revenue | ||||||||
(Center of Strategic & International Studies) 6.625%3/1/41-21§ | 2,235,000 | 2,416,504 | ||||||
(KIPP Charter School) 6.00%7/1/48-23§ | 1,450,000 | 1,717,191 | ||||||
Hawaii Pacific Health Special Purpose Revenue | ||||||||
Series A 5.50%7/1/40-20§ | 1,250,000 | 1,294,813 | ||||||
Illinois Finance Authority Revenue | ||||||||
(Admiral at Lake Project) | ||||||||
Series A 7.625%5/15/25-20§ | 1,750,000 | 1,827,665 | ||||||
Series A 7.75%5/15/30-20§ | 500,000 | 522,620 | ||||||
Series A 8.00%5/15/40-20§ | 2,205,000 | 2,308,106 | ||||||
Series A 8.00%5/15/46-20§ | 1,500,000 | 1,570,140 | ||||||
Illinois Railsplitter Tobacco Settlement Authority | ||||||||
6.00%6/1/28-21§ | 1,455,000 | 1,577,365 | ||||||
Kentucky Economic Development Finance Authority Hospital Revenue | ||||||||
(Owensboro Medical Health System) Series A 6.50%3/1/45-20§ | 4,965,000 | 5,157,841 | ||||||
Louisiana Public Facilities Authority Revenue | ||||||||
(Ochsner Clinic Foundation Project) 6.50%5/15/37-21§ | 1,705,000 | 1,858,757 | ||||||
Lucas County, Ohio Improvement | ||||||||
(Lutheran Homes) Series A 7.00%11/1/45-20§ | 3,865,000 | 4,121,559 | ||||||
Martin County, Florida Health Facilities Authority Revenue | ||||||||
(Martin Memorial Medical Center) 5.50%11/15/42-21§ | 1,000,000 | 1,095,010 | ||||||
Maryland Health & Higher Educational Facilities Authority | ||||||||
(Doctors Community Hospital) 5.75%7/1/38-20§ | 1,730,000 | 1,796,449 | ||||||
New Jersey Economic Development Authority Revenue | ||||||||
(Provident Group - Montclair University Student Housing Project) 5.875%6/1/42-20§ | 1,500,000 | 1,553,760 | ||||||
70
Table of Contents
| Principal amount° | Value (US $) | |||||||
Municipal Bonds(continued) | ||||||||
Pre-Refunded/Escrowed to Maturity Bonds(continued) | ||||||||
Norco, California Redevelopment Agency Tax Allocation | ||||||||
(Area #1 Project) 6.00%3/1/36-20§ | 1,000,000 | $ | 1,024,810 | |||||
North Texas Education Finance Revenue | ||||||||
(Uplift Education) Series A 5.25%12/1/47-22§ | 2,100,000 | 2,325,057 | ||||||
Onondaga, New York Civic Development Revenue | ||||||||
(St. Joseph’s Hospital Health Center Project) 4.50%7/1/32-22§ | 1,000,000 | 1,096,950 | ||||||
Oregon State Facilities Authority Revenue | ||||||||
(Concordia University Project) | ||||||||
Series A 144A 6.125%9/1/30-20#§ | 705,000 | 736,309 | ||||||
Series A 144A 6.375%9/1/40-20#§ | 500,000 | 525,635 | ||||||
Pennsylvania State Higher Educational Facilities Authority Revenue | ||||||||
(Edinboro University Foundation) 5.80%7/1/30-20§ | 1,300,000 | 1,350,453 | ||||||
Philadelphia, Pennsylvania Authority for Industrial Development Revenue | ||||||||
(New Foundation Charter School Project) 6.625%12/15/41-22§ | 1,000,000 | 1,172,560 | ||||||
San Juan, Texas Higher Education Finance Authority Education Revenue | ||||||||
(Idea Public Schools) Series A 6.70%8/15/40-20§ | 2,000,000 | 2,102,880 | ||||||
Southwestern Illinois Development Authority Revenue | ||||||||
(Memorial Group) | ||||||||
7.125%11/1/30-23§ | 1,420,000 | 1,761,553 | ||||||
7.125%11/1/43-23§ | 2,500,000 | 3,101,325 | ||||||
St. Johns County, Florida Industrial Development Authority Revenue | ||||||||
(Presbyterian Retirement) Series A 5.875%8/1/40-20§ | 1,000,000 | 1,042,470 | ||||||
Travis County, Texas Health Facilities Development Corporation Revenue | ||||||||
(Westminster Manor Project) 7.125%11/1/40-20§ | 1,000,000 | 1,067,810 | ||||||
University of Arizona Medical Center Hospital Revenue 6.00%7/1/39-21§ | 1,500,000 | 1,630,695 | ||||||
|
| |||||||
| 60,938,193 | ||||||||
|
| |||||||
Resource Recovery Revenue Bonds – 0.53% | ||||||||
Blythe Township, Pennsylvania Solid Waste Authority Revenue | ||||||||
7.75% 12/1/37 (AMT) | 3,000,000 | 3,448,440 | ||||||
Essex County, New Jersey Improvement Authority | ||||||||
144A 5.25% 7/1/45 (AMT)# | 2,500,000 | 2,541,900 | ||||||
71
Table of Contents
| Schedules of investments | ||
| Delaware National High-Yield Municipal Bond Fund | ||
| Principal amount° | Value (US $) | |||||||
Municipal Bonds(continued) | ||||||||
Resource Recovery Revenue Bonds(continued) | ||||||||
Orange County, Florida Industrial Development Authority Revenue | ||||||||
(Anuvia Florida LLC Project) Series A 144A 4.00% 7/1/48 (AMT)# | 2,665,000 | $ | 1,698,511 | |||||
|
| |||||||
| 7,688,851 | ||||||||
|
| |||||||
Special Tax Revenue Bonds – 9.43% | ||||||||
Allentown, Pennsylvania Neighborhood Improvement Zone Development Authority Tax Revenue | ||||||||
(City Center Project) Series 2018 144A 5.375% 5/1/42 # | 3,600,000 | 4,071,528 | ||||||
Celebration Pointe, Florida Community Development District | ||||||||
5.125% 5/1/45 | 2,000,000 | 2,112,060 | ||||||
Cherry Hill, Virginia Community Development Authority | ||||||||
(Potomac Shores Project) | ||||||||
144A 5.15% 3/1/35 # | 1,000,000 | 1,061,250 | ||||||
144A 5.40% 3/1/45 # | 2,000,000 | 2,123,660 | ||||||
Conley Road Transportation Development District, Missouri | ||||||||
5.375% 5/1/47 | 5,200,000 | 5,467,124 | ||||||
Dutchess County, New York Local Development Corporation Revenue | ||||||||
(Anderson Center Services Inc. Project) 6.00% 10/1/30 | 1,700,000 | 1,763,784 | ||||||
Fountain Urban Renewal Authority, Colorado | ||||||||
(Improvement - South Academy Highland) Series A 5.50% 11/1/44 | 3,750,000 | 4,011,900 | ||||||
Glen Cove, New York Local Economic Assistance | ||||||||
(Garvies Point Public Improvement Project) Series A 5.00% 1/1/56 | 2,000,000 | 2,180,120 | ||||||
Juban Crossing Economic Development District, Louisiana | ||||||||
(General Infrastructure Projects) Series C 144A 7.00% 9/15/44 # | 3,320,000 | 3,417,940 | ||||||
(Road Projects) Series A 144A 7.00% 9/15/44 # | 2,135,000 | 2,197,983 | ||||||
Kansas City, Missouri Land Clearance Redevelopment Authority Revenue | ||||||||
(Convention Centre Hotel Project - TIF Financing) | ||||||||
Series B 144A 5.00% 2/1/40 # | 935,000 | 1,039,963 | ||||||
Series B 144A 5.00% 2/1/50 # | 1,825,000 | 1,997,755 | ||||||
Midtown Miami, Florida Community Development District | ||||||||
(Parking Garage Project) Series A 5.00% 5/1/37 | 1,235,000 | 1,309,372 | ||||||
Mobile, Alabama Improvement District | ||||||||
(McGowin Park Project) | ||||||||
Series A 5.25% 8/1/30 | 1,000,000 | 1,065,440 | ||||||
Series A 5.50% 8/1/35 | 1,300,000 | 1,384,812 | ||||||
72
Table of Contents
| Principal amount° | Value (US $) | |||||||
Municipal Bonds(continued) | ||||||||
Special Tax Revenue Bonds(continued) | ||||||||
Mosaic District, Virginia Community Development Authority Revenue | ||||||||
Series A 6.875% 3/1/36 | 1,500,000 | $ | 1,589,145 | |||||
Nampa Development Corporation, Idaho Revenue | ||||||||
144A 5.00% 9/1/31 # | 2,940,000 | 3,171,143 | ||||||
5.90% 3/1/30 | 2,000,000 | 2,021,520 | ||||||
New York City, New York Industrial Development Agency | ||||||||
(Pilot - Queens Baseball Stadium) 5.00% 1/1/22 (AMBAC) | 1,000,000 | 1,002,620 | ||||||
(Yankee Stadium) 7.00% 3/1/49 (AGC) | 1,000,000 | 1,004,890 | ||||||
Northampton County, Pennsylvania Industrial Development Authority | ||||||||
(Route 33 Project) 7.00% 7/1/32 | 2,335,000 | 2,651,019 | ||||||
Prairie Center Metropolitan District No 3, Colorado | ||||||||
Series A 144A 5.00% 12/15/41 # | 2,000,000 | 2,130,320 | ||||||
Public Finance Authority Revenue, Wisconsin | ||||||||
(American Dream @ Meadowlands Project) 144A 7.00% 12/1/50 # | 5,065,000 | 6,118,520 | ||||||
Puerto Rico Sales Tax Financing Revenue | ||||||||
(Capital Appreciation - Restructured) SeriesA-1 5.625% 7/1/51 ^ | 37,719,000 | 7,330,310 | ||||||
(Restructured) | ||||||||
SeriesA-1 4.75% 7/1/53 | 24,518,000 | 25,199,846 | ||||||
SeriesA-1 5.00% 7/1/58 | 24,170,000 | 25,261,517 | ||||||
SeriesA-1 5.069% 7/1/46 ^ | 26,868,000 | 7,215,133 | ||||||
SeriesA-2 4.329% 7/1/40 | 3,000,000 | 3,056,250 | ||||||
Regional Transportation, Colorado District Revenue | ||||||||
(Denver Transit Partners) 6.00% 1/15/41 | 1,000,000 | 1,032,920 | ||||||
Richmond Heights, Missouri Tax Increment & Transaction Sales Tax Revenue Improvement | ||||||||
(Francis Place Redevelopment Project) 5.625% 11/1/25 | 1,100,000 | 1,100,671 | ||||||
St. Louis County, Missouri Industrial Development Authority | ||||||||
(Manchester Ballas Community) | ||||||||
Series A 144A 5.00% 9/1/38 # | 1,050,000 | 1,078,581 | ||||||
Series A 144A 5.25% 9/1/45 # | 3,540,000 | 3,632,040 | ||||||
St. Louis, Missouri Industrial Development Authority Tax Increment Revenue Improvement | ||||||||
(Grand Center Redevelopment Project) 6.375% 12/1/25 | 910,000 | 913,567 | ||||||
73
Table of Contents
| Schedules of investments | ||
| Delaware National High-Yield Municipal Bond Fund | ||
| Principal amount° | Value (US $) | |||||||
Municipal Bonds(continued) | ||||||||
Special Tax Revenue Bonds(continued) | ||||||||
Wyandotte County, Kansas City, Kansas Unified Government Special Obligation Revenue | ||||||||
(Sales Tax Vacation Village Project) Series A 6.00% 9/1/35 | 4,690,000 | $ | 5,166,973 | |||||
|
| |||||||
| 135,881,676 | ||||||||
|
| |||||||
State General Obligation Bonds – 5.90% | ||||||||
California State | ||||||||
Various Purposes | ||||||||
5.00% 4/1/32 | 2,100,000 | 2,959,593 | ||||||
5.00% 8/1/46 | 2,000,000 | 2,420,540 | ||||||
(Bid Group A) 5.00% 10/1/28 | 5,000,000 | 6,636,350 | ||||||
(Bid Group B) 5.00% 8/1/27 | 5,000,000 | 6,288,950 | ||||||
Commonwealth of Massachusetts | ||||||||
Series B 5.00% 1/1/32 | 5,000,000 | 6,359,150 | ||||||
Illinois State | ||||||||
5.00% 11/1/27 | 2,000,000 | 2,325,120 | ||||||
5.00% 5/1/36 | 1,710,000 | 1,869,543 | ||||||
5.00% 11/1/36 | 2,245,000 | 2,540,554 | ||||||
5.00% 2/1/39 | 2,980,000 | 3,230,767 | ||||||
Series A 5.00% 10/1/30 | 2,000,000 | 2,370,500 | ||||||
Series A 5.00% 12/1/34 | 2,100,000 | 2,425,836 | ||||||
Series A 5.00% 4/1/38 | 2,805,000 | 3,001,406 | ||||||
Series C 5.00% 11/1/29 | 8,970,000 | 10,459,199 | ||||||
Series D 5.00% 11/1/28 | 6,000,000 | 7,027,740 | ||||||
Minnesota State | ||||||||
Series A 5.00% 8/1/30 | 5,000,000 | 6,549,550 | ||||||
New York State | ||||||||
Series A 5.25% 2/15/24 | 2,000,000 | 2,126,440 | ||||||
Ohio State | ||||||||
(Infrastructure Improvement) Series A 5.00% 9/1/32 | 7,675,000 | 9,944,114 | ||||||
Washington State | ||||||||
(Various Purpose) Series C 5.00% 2/1/28 | 5,000,000 | 6,512,750 | ||||||
|
| |||||||
| 85,048,102 | ||||||||
|
| |||||||
Transportation Revenue Bonds – 5.44% | ||||||||
Chicago, Illinois O’Hare International Airport Revenue | ||||||||
Series B 5.00% 1/1/33 | 4,135,000 | 4,836,709 | ||||||
Foothill-Eastern Transportation Corridor Agency, California | ||||||||
Series A 5.75% 1/15/46 | 5,000,000 | 5,861,300 | ||||||
Series A 6.00% 1/15/49 | 7,690,000 | 9,129,799 | ||||||
Houston, Texas Airport System Revenue Subordinate Lien | ||||||||
Series A 5.00% 7/1/25 (AMT) | 1,000,000 | 1,066,320 | ||||||
74
Table of Contents
| Principal amount° | Value (US $) | |||||||
Municipal Bonds(continued) | ||||||||
Transportation Revenue Bonds(continued) | ||||||||
Kentucky Public Transportation Infrastructure Authority (1st Tier - Downtown Crossing) | ||||||||
Series A 5.75% 7/1/49 | 3,000,000 | $ | 3,389,730 | |||||
Series A 6.00% 7/1/53 | 1,290,000 | 1,472,922 | ||||||
Long Beach, California Marina Revenue | ||||||||
5.00% 5/15/40 | 1,000,000 | 1,139,360 | ||||||
Port Authority of New York & New Jersey Special Project | ||||||||
(JFK International Air Terminal) Series 8 6.00% 12/1/42 | 1,970,000 | 2,083,295 | ||||||
Riverside County, California Transportation Senior Lien | ||||||||
Series A 5.75% 6/1/48 | 1,000,000 | 1,117,450 | ||||||
San Francisco, California City & County Airport Commission - San Francisco International Airport | ||||||||
Series E 5.00% 5/1/50 (AMT) | 9,500,000 | 11,620,115 | ||||||
South Jersey Port, New Jersey | ||||||||
(Subordinated Marine Terminal Revenue) | ||||||||
Series A 5.00% 1/1/49 | 1,110,000 | 1,297,779 | ||||||
Series B 5.00% 1/1/42 (AMT) | 1,110,000 | 1,306,270 | ||||||
Series B 5.00% 1/1/48 (AMT) | 2,535,000 | 2,955,278 | ||||||
Texas Private Activity Bond Surface Transportation Corporate Senior Lien | ||||||||
(LBJ Infrastructure) | ||||||||
7.00% 6/30/40 | 7,000,000 | 7,347,690 | ||||||
7.50% 6/30/33 | 500,000 | 527,305 | ||||||
(NTE Mobility) | ||||||||
6.75% 6/30/43 (AMT) | 1,905,000 | 2,231,307 | ||||||
6.875% 12/31/39 | 4,055,000 | 4,133,302 | ||||||
7.00% 12/31/38 (AMT) | 1,335,000 | 1,581,962 | ||||||
(NTE Mobility Partners Segment 3 LLC Segment 3C Project) 5.00% 6/30/58 (AMT) | 10,000,000 | 11,858,500 | ||||||
Virginia Small Business Financing Authority | ||||||||
(Transform 66 P3 Project) 5.00% 12/31/56 (AMT) | 2,975,000 | 3,431,811 | ||||||
|
| |||||||
| 78,388,204 | ||||||||
|
| |||||||
Water & Sewer Revenue Bonds – 2.81% | ||||||||
Chicago, Illinois Waterworks Revenue | ||||||||
(2nd Lien) | ||||||||
5.00% 11/1/26 | 180,000 | 218,828 | ||||||
5.00% 11/1/28 | 30,000 | 36,061 | ||||||
Dominion, Colorado Water & Sanitation District Revenue | ||||||||
6.00% 12/1/46 | 4,000,000 | 4,309,240 | ||||||
Jefferson County, Alabama Sewer Revenue | ||||||||
(Senior Lien-Warrants) Series A 5.50% 10/1/53 (AGM) | 2,500,000 | 2,909,600 | ||||||
75
Table of Contents
| Schedules of investments | ||
| Delaware National High-Yield Municipal Bond Fund | ||
| Principal amount° | Value (US $) | |||||||
Municipal Bonds(continued) | ||||||||
Water & Sewer Revenue Bonds(continued) | ||||||||
Jefferson County, Alabama Sewer Revenue | ||||||||
(Sub Lien-Warrants) | ||||||||
Series D 6.50% 10/1/53 | 16,500,000 | $ | 20,043,210 | |||||
Series D 7.00% 10/1/51 | 5,000,000 | 6,179,750 | ||||||
Texas Water Development Board | ||||||||
(Master Trust) Series B 5.00% 4/15/31 | 5,240,000 | 6,825,886 | ||||||
|
| |||||||
| 40,522,575 | ||||||||
|
| |||||||
Total Municipal Bonds(cost $1,323,607,717) | 1,441,700,366 | |||||||
|
| |||||||
Total Value of Securities – 100.00% | $ | 1,441,700,366 | ||||||
|
| |||||||
| # | Security exempt from registration under Rule 144A of the Securities Act of 1933, as amended. At Aug. 31, 2019, the aggregate value of Rule 144A securities was $297,284,335, which represents 20.62% of the Fund’s net assets. See Note 9 in “Notes to financial statements.” |
| § | Pre-refunded bonds. Municipal bonds that are generally backed or secured by US Treasury bonds. Forpre-refunded bonds, the stated maturity is followed by the year in which the bond will bepre-refunded. See Note 9 in “Notes to financial statements.” |
| ° | Principal amount shown is stated in USD unless noted that the security is denominated in another currency. |
| ‡ | Non-income producing security. Security is currently in default. |
| ● | Variable rate investment. Rates reset periodically. Rate shown reflects the rate in effect at Aug. 31, 2019. For securities based on a published reference rate and spread, the reference rate and spread are indicated in their description above. The reference rate descriptions (i.e. LIBOR03M, LIBOR06M, etc.) used in this report are identical for different securities, but the underlying reference rates may differ due to the timing of the reset period. Certain variable rate securities are not based on a published reference rate and spread but are determined by the issuer or agent and are based on current market conditions, or for mortgage-backed securities, are impacted by the individual mortgages which are paying off over time. These securities do not indicate a reference rate and spread in their description above. |
| ^ | Zero-coupon security. The rate shown is the effective yield at the time of purchase. |
Summary of abbreviations:
AGC – Insured by Assured Guaranty Corporation
AGM – Insured by Assured Guaranty Municipal Corporation
AMBAC – Insured by the AMBAC Assurance Corporation
AMT – Subject to Alternative Minimum Tax
ICE – Intercontinental Exchange
LIBOR – London Interbank Offered Rate
LIBOR03M – ICE LIBOR USD 3 Month
76
Table of Contents
Summary of abbreviations: (continued)
LIBOR06M – ICE LIBOR USD 6 Month
SGI – Insured by Syncora Guarantee Inc.
USD – US Dollar
See accompanying notes, which are an integral part of the financial statements.
77
Table of Contents
Statements of assets and liabilities
August 31, 2019
Delaware USA Fund | Delaware Tax-Free USA Intermediate Fund | Delaware National High-Yield | |||||||||||||
Assets: | |||||||||||||||
Investments, at value1 | $ | 626,882,189 | $ | 540,046,501 | $ | 1,441,700,366 | |||||||||
Cash | 179,311 | 38,151 | — | ||||||||||||
Interest receivable | 6,940,231 | 5,991,205 | 16,936,885 | ||||||||||||
Receivable for fund shares sold | 949,405 | 1,263,620 | 7,529,115 | ||||||||||||
Receivable for securities sold | — | 3,060,000 | 6,088,800 | ||||||||||||
|
|
|
|
|
| ||||||||||
Total assets | 634,951,136 | 550,399,477 | 1,472,255,166 | ||||||||||||
|
|
|
|
|
| ||||||||||
Liabilities: | |||||||||||||||
Cash due to custodian | — | — | 9,996,763 | ||||||||||||
Payable for securities purchased | 11,369,843 | 3,000,000 | 17,741,330 | ||||||||||||
Distribution payable | 483,552 | 391,650 | 1,431,598 | ||||||||||||
Payable for fund shares redeemed | 342,774 | 317,442 | 437,234 | ||||||||||||
Investment management fees payable to affiliates | 206,261 | 132,009 | 480,076 | ||||||||||||
Distribution fees payable to affiliates | 112,085 | 35,141 | 120,886 | ||||||||||||
Other accrued expenses | 107,794 | 116,832 | 311,290 | ||||||||||||
Dividend disbursing and transfer agent fees and expense payable to affiliates | 5,132 | 4,531 | 11,857 | ||||||||||||
Trustees’ fees and expenses payable to affiliates | 4,395 | 3,951 | 10,310 | ||||||||||||
Accounting and administration expenses payable to affiliates | 2,306 | 2,075 | 4,883 | ||||||||||||
Legal fees payable to affiliates | 901 | 810 | 2,113 | ||||||||||||
Reports and statements to shareholders expenses payable to affiliates | 288 | 253 | 665 | ||||||||||||
|
|
|
|
|
| ||||||||||
Total liabilities | 12,635,331 | 4,004,694 | 30,549,005 | ||||||||||||
|
|
|
|
|
| ||||||||||
Total Net Assets | $ | 622,315,805 | $ | 546,394,783 | $ | 1,441,706,161 | |||||||||
|
|
|
|
|
| ||||||||||
Net Assets Consist of: | |||||||||||||||
Paid-in capital | $ | 571,628,110 | $ | 507,685,940 | $ | 1,335,212,255 | |||||||||
Total distributable earnings (loss) | 50,687,695 | 38,708,843 | 106,493,906 | ||||||||||||
|
|
|
|
|
| ||||||||||
Total Net Assets | $ | 622,315,805 | $ | 546,394,783 | $ | 1,441,706,161 | |||||||||
|
|
|
|
|
| ||||||||||
78
Table of Contents
Delaware USA Fund | Delaware Tax-Free USA Intermediate Fund | Delaware National High-Yield | |||||||||||||
Net Asset Value | |||||||||||||||
Class A: | |||||||||||||||
Net assets | $ | 472,153,173 | $ | 123,690,581 | $ | 208,549,036 | |||||||||
Shares of beneficial interest outstanding, unlimited authorization, no par | 39,476,792 | 10,072,215 | 18,171,871 | ||||||||||||
Net asset value per share | $ | 11.96 | $ | 12.28 | $ | 11.48 | |||||||||
Sales charge | 4.50 | % | 2.75 | % | 4.50 | % | |||||||||
Offering price per share, equal to net asset value per share / (1 – sales charge) | $ | 12.52 | $ | 12.63 | $ | 12.02 | |||||||||
Class C: | |||||||||||||||
Net assets | $ | 16,050,833 | $ | 22,874,140 | $ | 91,184,133 | |||||||||
Shares of beneficial interest outstanding, unlimited authorization, no par | 1,341,819 | 1,863,888 | 7,913,343 | ||||||||||||
Net asset value per share | $ | 11.96 | $ | 12.27 | $ | 11.52 | |||||||||
Institutional Class: | |||||||||||||||
Net assets | $ | 134,111,799 | $ | 399,830,062 | $ | 1,141,972,992 | |||||||||
Shares of beneficial interest outstanding, unlimited authorization, no par | 11,129,646 | 32,247,298 | 98,593,143 | ||||||||||||
Net asset value per share | $ | 12.05 | $ | 12.40 | $ | 11.58 | |||||||||
| |||||||||||||||
1Investments, at cost | $ | 577,021,293 | $ | 499,466,540 | $ | 1,323,607,717 | |||||||||
See accompanying notes, which are an integral part of the financial statements.
79
Table of Contents
Year ended August 31, 2019
Delaware USA Fund | Delaware Tax-Free USA Intermediate Fund | Delaware National High-Yield Municipal Bond Fund | |||||||||||||
Investment Income: | |||||||||||||||
Interest | $ | 24,137,891 | $ | 19,726,150 | $ | 66,341,034 | |||||||||
|
|
|
|
|
| ||||||||||
Expenses: | |||||||||||||||
Management fees | 3,016,095 | 2,615,133 | 6,640,185 | ||||||||||||
Distribution expenses — Class A | 1,118,712 | 311,755 | 485,561 | ||||||||||||
Distribution expenses — Class C | 166,331 | 249,144 | 888,505 | ||||||||||||
Dividend disbursing and transfer agent fees and expenses | 402,336 | 436,227 | 1,011,446 | ||||||||||||
Accounting and administration expenses | 140,257 | 135,097 | 275,147 | ||||||||||||
Registration fees | 90,682 | 92,044 | 161,631 | ||||||||||||
Audit and tax fees | 47,193 | 47,193 | 47,193 | ||||||||||||
Reports and statements to shareholders expenses | 46,820 | 41,328 | 90,168 | ||||||||||||
Legal fees | 43,359 | 33,820 | 99,410 | ||||||||||||
Trustees’ fees and expenses | 31,795 | 30,190 | 75,195 | ||||||||||||
Custodian fees | 17,195 | 14,739 | 35,600 | ||||||||||||
Other | 42,043 | 43,677 | 91,992 | ||||||||||||
|
|
|
|
|
| ||||||||||
| 5,162,818 | 4,050,347 | 9,902,033 | |||||||||||||
Less expenses waived | (774,525 | ) | (861,382 | ) | (655,569 | ) | |||||||||
Less waived distribution expenses — Class A | — | (124,702 | ) | — | |||||||||||
Less expenses paid indirectly | (4,940 | ) | (5,833 | ) | (19,109 | ) | |||||||||
|
|
|
|
|
| ||||||||||
Total operating expenses | 4,383,353 | 3,058,430 | 9,227,355 | ||||||||||||
|
|
|
|
|
| ||||||||||
Net Investment Income | 19,754,538 | 16,667,720 | 57,113,679 | ||||||||||||
|
|
|
|
|
| ||||||||||
Net Realized and Unrealized Gain: | |||||||||||||||
Net realized gain on investments | 1,048,183 | 1,077,571 | 3,014,071 | ||||||||||||
Net change in unrealized appreciation (depreciation) of investments | 23,917,474 | 21,366,521 | 55,266,412 | ||||||||||||
|
|
|
|
|
| ||||||||||
Net Realized and Unrealized Gain | 24,965,657 | 22,444,092 | 58,280,483 | ||||||||||||
|
|
|
|
|
| ||||||||||
Net Increase in Net Assets Resulting from Operations | $ | 44,720,195 | $ | 39,111,812 | $ | 115,394,162 | |||||||||
|
|
|
|
|
| ||||||||||
See accompanying notes, which are an integral part of the financial statements.
80
Table of Contents
This page intentionally left blank.
Table of Contents
Statements of changes in net assets
DelawareTax-Free USA Fund
| Year ended | ||||||||
| 8/31/19 | 8/31/18 | |||||||
Increase (Decrease) in Net Assets from Operations: | ||||||||
Net investment income | $ | 19,754,538 | $ | 20,085,601 | ||||
Net realized gain | 1,048,183 | 1,601,289 | ||||||
Net change in unrealized appreciation (depreciation) | 23,917,474 | (13,534,385 | ) | |||||
|
|
|
| |||||
Net increase in net assets resulting from operations | 44,720,195 | 8,152,505 | ||||||
|
|
|
| |||||
Dividends and Distributions to Shareholders from: | ||||||||
Distributable earnings*: | ||||||||
Class A | (16,273,524 | ) | (16,632,280 | ) | ||||
Class C | (472,923 | ) | (721,618 | ) | ||||
Institutional Class | (3,153,841 | ) | (2,731,703 | ) | ||||
|
|
|
| |||||
| (19,900,288 | ) | (20,085,601 | ) | |||||
|
|
|
| |||||
Capital Share Transactions: | ||||||||
Proceeds from shares sold: | ||||||||
Class A | 109,025,107 | 144,964,138 | ||||||
Class C | 2,698,828 | 2,742,284 | ||||||
Institutional Class | 93,831,044 | 33,395,228 | ||||||
Net asset value of shares issued upon reinvestment of dividends and distributions: | ||||||||
Class A | 14,655,203 | 14,612,119 | ||||||
Class C | 404,200 | 644,001 | ||||||
Institutional Class | 2,682,248 | 2,271,556 | ||||||
|
|
|
| |||||
| 223,296,630 | 198,629,326 | |||||||
|
|
|
| |||||
82
Table of Contents
| Year ended | ||||||||
| 8/31/19 | 8/31/18 | |||||||
Capital Share Transactions (continued): | ||||||||
Cost of shares redeemed: | ||||||||
Class A | $ | (152,307,083 | ) | $ | (83,964,343 | ) | ||
Class C | (6,533,225 | ) | (11,372,623 | ) | ||||
Institutional Class | (44,281,845 | ) | (19,620,579 | ) | ||||
|
|
|
| |||||
| (203,122,153 | ) | (114,957,545 | ) | |||||
|
|
|
| |||||
Increase in net assets derived from capital share transactions | 20,174,477 | 83,671,781 | ||||||
|
|
|
| |||||
Net Increase in Net Assets | 44,994,384 | 71,738,685 | ||||||
Net Assets: | ||||||||
Beginning of year | 577,321,421 | 505,582,736 | ||||||
|
|
|
| |||||
End of year1 | $ | 622,315,805 | $ | 577,321,421 | ||||
|
|
|
| |||||
| 1 | Net Assets – End of year includes distributions in excess of net investment income of $14,723 in 2018. The Securities and Exchange Commission eliminated the requirement to disclose undistributed (distributions in excess of) net investment income in 2018. |
| * | For the year ended Aug. 31, 2019, the Fund has adopted amendments to RegulationS-X (see Note 11 in “Notes to financial statements”). For the year ended Aug. 31, 2018, the dividends and distributions to shareholders were as follows: |
| Class A | Class C | Institutional Class | ||||||||||
Dividends from net investment income | $ | (16,632,280 | ) | $ | (721,618 | ) | $ | (2,731,703 | ) | |||
See accompanying notes, which are an integral part of the financial statements.
83
Table of Contents
Statements of changes in net assets
DelawareTax-Free USA Intermediate Fund
| Year ended | ||||||||
| 8/31/19 | 8/31/18 | |||||||
Increase (Decrease) in Net Assets from Operations: | ||||||||
Net investment income | $ | 16,667,720 | $ | 17,509,720 | ||||
Net realized gain | 1,077,571 | 380,931 | ||||||
Net change in unrealized appreciation (depreciation) | 21,366,521 | (14,485,267 | ) | |||||
|
|
|
| |||||
Net increase in net assets resulting from operations | 39,111,812 | 3,405,384 | ||||||
|
|
|
| |||||
Dividends and Distributions to Shareholders from: | ||||||||
Distributable earnings*: | ||||||||
Class A | (3,886,242 | ) | (4,506,606 | ) | ||||
Class C | (565,999 | ) | (800,814 | ) | ||||
Institutional Class | (12,215,479 | ) | (12,202,300 | ) | ||||
|
|
|
| |||||
| (16,667,720 | ) | (17,509,720 | ) | |||||
|
|
|
| |||||
Capital Share Transactions: | ||||||||
Proceeds from shares sold: | ||||||||
Class A | 27,623,937 | 16,752,051 | ||||||
Class C | 3,447,342 | 1,183,828 | ||||||
Institutional Class | 160,249,995 | 107,068,849 | ||||||
Net asset value of shares issued upon reinvestment of dividends and distributions: | ||||||||
Class A | 3,607,123 | 4,147,980 | ||||||
Class C | 508,002 | 729,575 | ||||||
Institutional Class | 9,563,643 | 9,272,878 | ||||||
|
|
|
| |||||
| 205,000,042 | 139,155,161 | |||||||
|
|
|
| |||||
84
Table of Contents
| Year ended | ||||||||
| 8/31/19 | 8/31/18 | |||||||
Capital Share Transactions (continued): | ||||||||
Cost of shares redeemed: | ||||||||
Class A | $ | (49,240,907 | ) | $ | (44,644,168 | ) | ||
Class C | (10,079,399 | ) | (13,357,830 | ) | ||||
Institutional Class | (163,828,572 | ) | (98,947,892 | ) | ||||
|
|
|
| |||||
| (223,148,878 | ) | (156,949,890 | ) | |||||
|
|
|
| |||||
Decrease in net assets derived from capital share transactions | (18,148,836 | ) | (17,794,729 | ) | ||||
|
|
|
| |||||
Net Increase (Decrease) in Net Assets | 4,295,256 | (31,899,065 | ) | |||||
Net Assets: | ||||||||
Beginning of year | 542,099,527 | 573,998,592 | ||||||
|
|
|
| |||||
End of year1 | $ | 546,394,783 | $ | 542,099,527 | ||||
|
|
|
| |||||
| 1 | Net Assets – End of year includes distributions in excess of net investment income of $33,111 in 2018. The Securities and Exchange Commission eliminated the requirement to disclose undistributed (distributions in excess of) net investment income in 2018. |
| * | For the year ended Aug. 31, 2019, the Fund has adopted amendments to RegulationS-X (see Note 11 in “Notes to financial statements”). For the year ended Aug. 31, 2018, the dividends and distributions to shareholders were as follows: |
| Class A | Class C | Institutional Class | ||||||||||
Dividends from net investment income | $ | (4,506,606 | ) | $ | (800,814 | ) | $ | (12,202,300 | ) | |||
See accompanying notes, which are an integral part of the financial statements.
85
Table of Contents
Statements of changes in net assets
Delaware National High-Yield Municipal Bond Fund
| Year ended | ||||||||
| 8/31/19 | 8/31/18 | |||||||
Increase (Decrease) in Net Assets from Operations: | ||||||||
Net investment income | $ | 57,113,679 | $ | 54,384,298 | ||||
Net realized gain | 3,014,071 | 7,505,047 | ||||||
Net change in unrealized appreciation (depreciation) | 55,266,412 | (13,724,500 | ) | |||||
|
|
|
| |||||
Net increase in net assets resulting from operations | 115,394,162 | 48,164,845 | ||||||
|
|
|
| |||||
Dividends and Distributions to Shareholders from: | ||||||||
Distributable earnings*: | ||||||||
Class A | (8,113,223 | ) | (8,100,736 | ) | ||||
Class C | (3,047,818 | ) | (3,292,016 | ) | ||||
Institutional Class | (45,407,727 | ) | (43,005,882 | ) | ||||
|
|
|
| |||||
| (56,568,768 | ) | (54,398,634 | ) | |||||
|
|
|
| |||||
Capital Share Transactions: | ||||||||
Proceeds from shares sold: | ||||||||
Class A | 54,097,913 | 50,102,652 | ||||||
Class C | 14,629,646 | 12,793,383 | ||||||
Institutional Class | 377,244,099 | 270,134,611 | ||||||
Net asset value of shares issued upon reinvestment of dividends and distributions: | ||||||||
Class A | 7,392,441 | 7,418,908 | ||||||
Class C | 2,752,227 | 2,968,800 | ||||||
Institutional Class | 37,356,231 | 36,466,522 | ||||||
|
|
|
| |||||
| 493,472,557 | 379,884,876 | |||||||
|
|
|
| |||||
86
Table of Contents
| Year ended | ||||||||
| 8/31/19 | 8/31/18 | |||||||
Capital Share Transactions (continued): | ||||||||
Cost of shares redeemed: | ||||||||
Class A | $ | (61,870,843 | ) | $ | (46,315,595 | ) | ||
Class C | (22,089,760 | ) | (21,101,276 | ) | ||||
Institutional Class | (336,446,245 | ) | (217,319,913 | ) | ||||
|
|
|
| |||||
| (420,406,848 | ) | (284,736,784 | ) | |||||
|
|
|
| |||||
Increase in net assets derived from capital share transactions | 73,065,709 | 95,148,092 | ||||||
|
|
|
| |||||
Net Increase in Net Assets | 131,891,103 | 88,914,303 | ||||||
Net Assets: | ||||||||
Beginning of year | 1,309,815,058 | 1,220,900,755 | ||||||
|
|
|
| |||||
End of year1 | $ | 1,441,706,161 | $ | 1,309,815,058 | ||||
|
|
|
| |||||
| 1 | Net Assets – End of year includes distributions in excess of net investment income of $4,102 in 2018. The Securities and Exchange Commission eliminated the requirement to disclose undistributed (distributions in excess of) net investment income in 2018. |
| * | For the year ended Aug. 31, 2019, the Fund has adopted amendments to RegulationS-X (see Note 11 in “Notes to financial statements”). For the year ended Aug. 31, 2018, the dividends and distributions to shareholders were as follows: |
| Class A | Class C | Institutional Class | ||||||||||
Dividends from net investment income | $ | (8,100,736 | ) | $ | (3,292,016 | ) | $ | (43,005,882 | ) | |||
See accompanying notes, which are an integral part of the financial statements.
87
Table of Contents
DelawareTax-Free USA Fund Class A
Selected data for each share of the Fund outstanding throughout each period were as follows:
Net asset value, beginning of period |
Income (loss) from investment operations: |
Net investment income1 |
Net realized and unrealized gain (loss) |
Total from investment operations |
Less dividends and distributions from: |
Net investment income |
Net realized gain |
Total dividends and distributions |
Net asset value, end of period |
Total return3 |
Ratios and supplemental data: |
Net assets, end of period (000 omitted) |
Ratio of expenses to average net assets |
Ratio of expenses to average net assets prior to fees waived |
Ratio of net investment income to average net assets |
Ratio of net investment income to average net assets prior to fees waived |
Portfolio turnover |
|
| 1 | The average shares outstanding have been applied for per share information. |
| 2 | For the year ended Aug. 31, 2019, net realized gain distributions of $120,279 were made by the Fund’s Class A shares, which calculated to $(0.003) per share. |
| 3 | Total return is based on the change in net asset value of a share during the period and assumes reinvestment of dividends and distributions at net asset value and does not reflect the impact of a sales charge. Total return during all of the periods shown reflects a waiver by the manager. Performance would have been lower had the waiver not been in effect. |
See accompanying notes, which are an integral part of the financial statements.
88
Table of Contents
| Year ended | ||||||||||||||||||||
| 8/31/19 | 8/31/18 | 8/31/17 | 8/31/16 | 8/31/15 | ||||||||||||||||
| $ | 11.44 | $ | 11.70 | $ | 12.22 | $ | 11.83 | $ | 11.90 | |||||||||||
| ||||||||||||||||||||
| 0.41 | 0.42 | 0.43 | 0.42 | 0.43 | ||||||||||||||||
| 0.52 | (0.26 | ) | (0.40 | ) | 0.39 | (0.07 | ) | |||||||||||||
|
|
|
|
|
|
|
|
|
| |||||||||||
| 0.93 | 0.16 | 0.03 | 0.81 | 0.36 | ||||||||||||||||
|
|
|
|
|
|
|
|
|
| |||||||||||
| ||||||||||||||||||||
| (0.41 | ) | (0.42 | ) | (0.43 | ) | (0.42 | ) | (0.43 | ) | |||||||||||
| — | 2 | — | (0.12 | ) | — | — | ||||||||||||||
|
|
|
|
|
|
|
|
|
| |||||||||||
| (0.41 | ) | (0.42 | ) | (0.55 | ) | (0.42 | ) | (0.43 | ) | |||||||||||
|
|
|
|
|
|
|
|
|
| |||||||||||
| $ | 11.96 | $ | 11.44 | $ | 11.70 | $ | 12.22 | $ | 11.83 | |||||||||||
|
|
|
|
|
|
|
|
|
| |||||||||||
| 8.35% | 1.44% | 0.41% | 7.00% | 3.09% | ||||||||||||||||
| ||||||||||||||||||||
| $ | 472,153 | $ | 481,117 | $ | 415,314 | $ | 493,408 | $ | 504,204 | |||||||||||
| 0.81% | 0.81% | 0.81% | 0.81% | 0.81% | ||||||||||||||||
| 0.95% | 0.96% | 0.96% | 0.95% | 0.96% | ||||||||||||||||
| 3.55% | 3.66% | 3.71% | 3.52% | 3.63% | ||||||||||||||||
| 3.41% | 3.51% | 3.56% | 3.38% | 3.48% | ||||||||||||||||
| 43% | 42% | 33% | 33% | 16% | ||||||||||||||||
| ||||||||||||||||||||
89
Table of Contents
Financial highlights
DelawareTax-Free USA Fund Class C
Selected data for each share of the Fund outstanding throughout each period were as follows:
Net asset value, beginning of period |
Income (loss) from investment operations: |
Net investment income1 |
Net realized and unrealized gain (loss) |
Total from investment operations |
Less dividends and distributions from: |
Net investment income |
Net realized gain |
Total dividends and distributions |
Net asset value, end of period |
Total return3 |
Ratios and supplemental data: |
Net assets, end of period (000 omitted) |
Ratio of expenses to average net assets |
Ratio of expenses to average net assets prior to fees waived |
Ratio of net investment income to average net assets |
Ratio of net investment income to average net assets prior to fees waived |
Portfolio turnover |
|
| 1 | The average shares outstanding have been applied for per share information. |
| 2 | For the year ended Aug. 31, 2019, net realized gain distributions of $4,649 were made by the Fund’s Class C shares, which calculated to $(0.003) per share. |
| 3 | Total return is based on the change in net asset value of a share during the period and assumes reinvestment of dividends and distributions at net asset value and does not reflect the impact of a sales charge. Total return during all of the periods shown reflects a waiver by the manager. Performance would have been lower had the waiver not been in effect. |
See accompanying notes, which are an integral part of the financial statements.
90
Table of Contents
Year ended | ||||||||||||||||||||
| 8/31/19 | 8/31/18 | 8/31/17 | 8/31/16 | 8/31/15 | ||||||||||||||||
| $ | 11.44 | $ | 11.70 | $ | 12.22 | $ | 11.83 | $ | 11.91 | |||||||||||
| ||||||||||||||||||||
| 0.32 | 0.34 | 0.34 | 0.33 | 0.34 | ||||||||||||||||
| 0.52 | (0.26 | ) | (0.40 | ) | 0.39 | (0.08 | ) | |||||||||||||
|
|
|
|
|
|
|
|
|
| |||||||||||
| 0.84 | 0.08 | (0.06 | ) | 0.72 | 0.26 | |||||||||||||||
|
|
|
|
|
|
|
|
|
| |||||||||||
| (0.32 | ) | (0.34 | ) | (0.34 | ) | (0.33 | ) | (0.34 | ) | |||||||||||
| — | 2 | — | (0.12 | ) | — | — | ||||||||||||||
|
|
|
|
|
|
|
|
|
| |||||||||||
| (0.32 | ) | (0.34 | ) | (0.46 | ) | (0.33 | ) | (0.34 | ) | |||||||||||
|
|
|
|
|
|
|
|
|
| |||||||||||
| $ | 11.96 | $ | 11.44 | $ | 11.70 | $ | 12.22 | $ | 11.83 | |||||||||||
|
|
|
|
|
|
|
|
|
| |||||||||||
| 7.55% | 0.68% | (0.35% | ) | 6.19% | 2.23% | |||||||||||||||
| $ | 16,051 | $ | 18,808 | $ | 27,397 | $ | 31,545 | $ | 30,851 | |||||||||||
| 1.56% | 1.56% | 1.56% | 1.56% | 1.57% | ||||||||||||||||
| 1.70% | 1.71% | 1.71% | 1.70% | 1.72% | ||||||||||||||||
| 2.80% | 2.91% | 2.96% | 2.77% | 2.88% | ||||||||||||||||
| 2.66% | 2.76% | 2.81% | 2.63% | 2.73% | ||||||||||||||||
| 43% | 42% | 33% | 33% | 16% | ||||||||||||||||
| ||||||||||||||||||||
91
Table of Contents
Financial highlights
DelawareTax-Free USA Fund Institutional Class
Selected data for each share of the Fund outstanding throughout each period were as follows:
Net asset value, beginning of period |
Income (loss) from investment operations: |
Net investment income1 |
Net realized and unrealized gain (loss) |
Total from investment operations |
Less dividends and distributions from: |
Net investment income |
Net realized gain |
Total dividends and distributions |
Net asset value, end of period |
Total return3 |
Ratios and supplemental data: |
Net assets, end of period (000 omitted) |
Ratio of expenses to average net assets |
Ratio of expenses to average net assets prior to fees waived |
Ratio of net investment income to average net assets |
Ratio of net investment income to average net assets prior to fees waived |
Portfolio turnover |
|
| 1 | The average shares outstanding have been applied for per share information. |
| 2 | For the year ended Aug. 31, 2019, net realized gain distributions of $20,822 were made by the Fund’s Institutional Class shares, which calculated to $(0.003) per share. |
| 3 | Total return is based on the change in net asset value of a share during the period and assumes reinvestment of dividends and distributions at net asset value. Total return during all of the periods shown reflects a waiver by the manager. Performance would have been lower had the waiver not been in effect. |
See accompanying notes, which are an integral part of the financial statements.
92
Table of Contents
| Year ended | ||||||||||||||||||||
| 8/31/19 | 8/31/18 | 8/31/17 | 8/31/16 | 8/31/15 | ||||||||||||||||
| $ | 11.52 | $ | 11.79 | $ | 12.31 | $ | 11.91 | $ | 11.99 | |||||||||||
| ||||||||||||||||||||
| 0.44 | 0.45 | 0.46 | 0.46 | 0.47 | ||||||||||||||||
| 0.53 | (0.27 | ) | (0.40 | ) | 0.40 | (0.08 | ) | |||||||||||||
|
|
|
|
|
|
|
|
|
| |||||||||||
| 0.97 | 0.18 | 0.06 | 0.86 | 0.39 | ||||||||||||||||
|
|
|
|
|
|
|
|
|
| |||||||||||
| ||||||||||||||||||||
| (0.44 | ) | (0.45 | ) | (0.46 | ) | (0.46 | ) | (0.47 | ) | |||||||||||
| — | 2 | — | (0.12 | ) | — | — | ||||||||||||||
|
|
|
|
|
|
|
|
|
| |||||||||||
| (0.44 | ) | (0.45 | ) | (0.58 | ) | (0.46 | ) | (0.47 | ) | |||||||||||
|
|
|
|
|
|
|
|
|
| |||||||||||
| $ | 12.05 | $ | 11.52 | $ | 11.79 | $ | 12.31 | $ | 11.91 | |||||||||||
|
|
|
|
|
|
|
|
|
| |||||||||||
| 8.68% | 1.61% | 0.68% | 7.32% | 3.26% | ||||||||||||||||
| ||||||||||||||||||||
| $ | 134,112 | $ | 77,396 | $ | 62,872 | $ | 45,696 | $ | 33,323 | |||||||||||
| 0.56% | 0.56% | 0.56% | 0.56% | 0.57% | ||||||||||||||||
| 0.70% | 0.71% | 0.71% | 0.70% | 0.72% | ||||||||||||||||
| 3.80% | 3.91% | 3.96% | 3.77% | 3.88% | ||||||||||||||||
| 3.66% | 3.76% | 3.81% | 3.63% | 3.73% | ||||||||||||||||
| 43% | 42% | 33% | 33% | 16% | ||||||||||||||||
| ||||||||||||||||||||
93
Table of Contents
Financial highlights
DelawareTax-Free USA Intermediate Fund Class A
Selected data for each share of the Fund outstanding throughout each period were as follows:
Net asset value, beginning of period |
Income (loss) from investment operations: |
Net investment income1 |
Net realized and unrealized gain (loss) |
Total from investment operations |
Less dividends and distributions from: |
Net investment income |
Net realized gain |
Total dividends and distributions |
Net asset value, end of period |
Total return3 |
Ratios and supplemental data: |
Net assets, end of period (000 omitted) |
Ratio of expenses to average net assets |
Ratio of expenses to average net assets prior to fees waived |
Ratio of net investment income to average net assets |
Ratio of net investment income to average net assets prior to fees waived |
Portfolio turnover |
|
| 1 | The average shares outstanding have been applied for per share information. |
| 2 | For the year ended Aug. 31, 2017, net realized gain distributions of $58,508 were made by the Fund’s Class A shares, which calculated to $(0.004) per share. |
| 3 | Total return is based on the change in net asset value of a share during the period and assumes reinvestment of dividends and distributions at net asset value and does not reflect the impact of a sales charge. Total return during all of the periods shown reflects waivers by the manager and distributor. Performance would have been lower had the waivers not been in effect. |
See accompanying notes, which are an integral part of the financial statements.
94
Table of Contents
| Year ended | ||||||||||||||||||||
| 8/31/19 | 8/31/18 | 8/31/17 | 8/31/16 | 8/31/15 | ||||||||||||||||
| $ | 11.76 | $ | 12.06 | $ | 12.38 | $ | 12.04 | $ | 12.21 | |||||||||||
| 0.37 | 0.37 | 0.35 | 0.35 | 0.35 | ||||||||||||||||
| 0.52 | (0.30 | ) | (0.32 | ) | 0.34 | (0.17 | ) | |||||||||||||
|
|
|
|
|
|
|
|
|
| |||||||||||
| 0.89 | 0.07 | 0.03 | 0.69 | 0.18 | ||||||||||||||||
|
|
|
|
|
|
|
|
|
| |||||||||||
| (0.37 | ) | (0.37 | ) | (0.35 | ) | (0.35 | ) | (0.35 | ) | |||||||||||
| — | — | — | 2 | — | — | |||||||||||||||
|
|
|
|
|
|
|
|
|
| |||||||||||
| (0.37 | ) | (0.37 | ) | �� | (0.35 | ) | (0.35 | ) | (0.35 | ) | ||||||||||
|
|
|
|
|
|
|
|
|
| |||||||||||
| $ | 12.28 | $ | 11.76 | $ | 12.06 | $ | 12.38 | $ | 12.04 | |||||||||||
|
|
|
|
|
|
|
|
|
| |||||||||||
| 7.71% | 0.57% | 0.35% | 5.79% | 1.46% | ||||||||||||||||
| $ | 123,691 | $ | 136,653 | $ | 164,154 | $ | 188,034 | $ | 184,514 | |||||||||||
| 0.65% | 0.71% | 0.75% | 0.75% | 0.76% | ||||||||||||||||
| 0.91% | 0.92% | 0.93% | 0.92% | 0.93% | ||||||||||||||||
| 3.11% | 3.10% | 2.92% | 2.84% | 2.85% | ||||||||||||||||
| 2.85% | 2.89% | 2.74% | 2.67% | 2.68% | ||||||||||||||||
| 25% | 32% | 26% | 35% | 19% | ||||||||||||||||
| ||||||||||||||||||||
95
Table of Contents
Financial highlights
DelawareTax-Free USA Intermediate Fund Class C
Selected data for each share of the Fund outstanding throughout each period were as follows:
Net asset value, beginning of period |
Income (loss) from investment operations: |
Net investment income1 |
Net realized and unrealized gain (loss) |
Total from investment operations |
Less dividends and distributions from: |
Net investment income |
Net realized gain |
Total dividends and distributions |
Net asset value, end of period |
Total return3 |
Ratios and supplemental data: |
Net assets, end of period (000 omitted) |
Ratio of expenses to average net assets |
Ratio of expenses to average net assets prior to fees waived |
Ratio of net investment income to average net assets |
Ratio of net investment income to average net assets prior to fees waived |
Portfolio turnover |
|
| 1 | The average shares outstanding have been applied for per share information. |
| 2 | For the year ended Aug. 31, 2017, net realized gain distributions of $15,746 were made by the Fund’s Class C shares, which calculated to $(0.004) per share. |
| 3 | Total return is based on the change in net asset value of a share during the period and assumes reinvestment of dividends and distributions at net asset value and does not reflect the impact of a sales charge. Total return during all of the periods shown reflects a waiver by the manager. Performance would have been lower had the waiver not been in effect. |
See accompanying notes, which are an integral part of the financial statements.
96
Table of Contents
| Year ended | ||||||||||||||||||||
| 8/31/19 | 8/31/18 | 8/31/17 | 8/31/16 | 8/31/15 | ||||||||||||||||
| $ | 11.75 | $ | 12.05 | $ | 12.37 | $ | 12.03 | $ | 12.20 | |||||||||||
| 0.27 | 0.27 | 0.25 | 0.24 | 0.24 | ||||||||||||||||
| 0.52 | (0.30 | ) | (0.32 | ) | 0.35 | (0.17 | ) | |||||||||||||
|
|
|
|
|
|
|
|
|
| |||||||||||
| 0.79 | (0.03 | ) | (0.07 | ) | 0.59 | 0.07 | ||||||||||||||
|
|
|
|
|
|
|
|
|
| |||||||||||
| (0.27 | ) | (0.27 | ) | (0.25 | ) | (0.25 | ) | (0.24 | ) | |||||||||||
| — | — | — | 2 | — | — | |||||||||||||||
|
|
|
|
|
|
|
|
|
| |||||||||||
| (0.27 | ) | (0.27 | ) | (0.25 | ) | (0.25 | ) | (0.24 | ) | |||||||||||
|
|
|
|
|
|
|
|
|
| |||||||||||
| $ | 12.27 | $ | 11.75 | $ | 12.05 | $ | 12.37 | $ | 12.03 | |||||||||||
|
|
|
|
|
|
|
|
|
| |||||||||||
| 6.81% | (0.28% | ) | (0.50% | ) | 4.90% | 0.60% | ||||||||||||||
| $ | 22,874 | $ | 28,002 | $ | 40,402 | $ | 49,515 | $ | 48,328 | |||||||||||
| 1.50% | 1.56% | 1.60% | 1.60% | 1.61% | ||||||||||||||||
| 1.66% | 1.67% | 1.68% | 1.67% | 1.68% | ||||||||||||||||
| 2.26% | 2.25% | 2.07% | 1.99% | 2.00% | ||||||||||||||||
| 2.10% | 2.14% | 1.99% | 1.92% | 1.93% | ||||||||||||||||
| 25% | 32% | 26% | 35% | 19% | ||||||||||||||||
| ||||||||||||||||||||
97
Table of Contents
Financial highlights
DelawareTax-Free USA Intermediate Fund Institutional Class
Selected data for each share of the Fund outstanding throughout each period were as follows:
Net asset value, beginning of period |
Income (loss) from investment operations: |
Net investment income1 |
Net realized and unrealized gain (loss) |
Total from investment operations |
Less dividends and distributions from: |
Net investment income |
Net realized gain |
Total dividends and distributions |
Net asset value, end of period |
Total return3 |
Ratios and supplemental data: |
Net assets, end of period (000 omitted) |
Ratio of expenses to average net assets |
Ratio of expenses to average net assets prior to fees waived |
Ratio of net investment income to average net assets |
Ratio of net investment income to average net assets prior to fees waived |
Portfolio turnover |
|
| 1 | The average shares outstanding have been applied for per share information. |
| 2 | For the year ended Aug. 31, 2017, net realized gain distributions of $152,523 were made by the Fund’s Institutional Class shares, which calculated to $(0.004) per share. |
| 3 | Total return is based on the change in net asset value of a share during the period and assumes reinvestment of dividends and distributions at net asset value. Total return during all of the periods shown reflects a waiver by the manager. Performance would have been lower had the waiver not been in effect. |
See accompanying notes, which are an integral part of the financial statements.
98
Table of Contents
| Year ended | ||||||||||||||||||||
| 8/31/19 | 8/31/18 | 8/31/17 | 8/31/16 | 8/31/15 | ||||||||||||||||
| $ | 11.87 | $ | 12.17 | $ | 12.50 | $ | 12.16 | $ | 12.33 | |||||||||||
| 0.39 | 0.39 | 0.37 | 0.37 | 0.37 | ||||||||||||||||
| 0.53 | (0.30 | ) | (0.33 | ) | 0.34 | (0.17 | ) | |||||||||||||
|
|
|
|
|
|
|
|
|
| |||||||||||
| 0.92 | 0.09 | 0.04 | 0.71 | 0.20 | ||||||||||||||||
|
|
|
|
|
|
|
|
|
| |||||||||||
| (0.39 | ) | (0.39 | ) | (0.37 | ) | (0.37 | ) | (0.37 | ) | |||||||||||
| — | — | — | 2 | — | — | |||||||||||||||
|
|
|
|
|
|
|
|
|
| |||||||||||
| (0.39 | ) | (0.39 | ) | (0.37 | ) | (0.37 | ) | (0.37 | ) | |||||||||||
|
|
|
|
|
|
|
|
|
| |||||||||||
| $ | 12.40 | $ | 11.87 | $ | 12.17 | $ | 12.50 | $ | 12.16 | |||||||||||
|
|
|
|
|
|
|
|
|
| |||||||||||
| 7.92% | 0.75% | 0.44% | 5.92% | 1.62% | ||||||||||||||||
| $ | 399,830 | $ | 377,445 | $ | 369,443 | $ | 479,172 | $ | 474,262 | |||||||||||
| 0.50% | 0.56% | 0.60% | 0.60% | 0.61% | ||||||||||||||||
| 0.66% | 0.67% | 0.68% | 0.67% | 0.68% | ||||||||||||||||
| 3.26% | 3.25% | 3.07% | 2.99% | 3.00% | ||||||||||||||||
| 3.10% | 3.14% | 2.99% | 2.92% | 2.93% | ||||||||||||||||
| 25% | 32% | 26% | 35% | 19% | ||||||||||||||||
| ||||||||||||||||||||
99
Table of Contents
Financial highlights
Delaware National High-Yield Municipal Bond Fund Class A
Selected data for each share of the Fund outstanding throughout each period were as follows:
Net asset value, beginning of period |
Income (loss) from investment operations: |
Net investment income1 |
Net realized and unrealized gain (loss) |
Total from investment operations |
Less dividends and distributions from: |
Net investment income |
Total dividends and distributions |
Net asset value, end of period |
Total return2 |
Ratios and supplemental data: |
Net assets, end of period (000 omitted) |
Ratio of expenses to average net assets |
Ratio of expenses to average net assets prior to fees waived |
Ratio of net investment income to average net assets |
Ratio of net investment income to average net assets prior to fees waived |
Portfolio turnover |
|
| 1 | The average shares outstanding have been applied for per share information. |
| 2 | Total return is based on the change in net asset value of a share during the period and assumes reinvestment of dividends and distributions at net asset value and does not reflect the impact of a sales charge. Total return during all of the periods shown reflect a waiver by the manager. Performance would have been lower had the waiver not been in effect. |
See accompanying notes, which are an integral part of the financial statements.
100
Table of Contents
| Year ended | ||||||||||||||||||||
| 8/31/19 | 8/31/18 | 8/31/17 | 8/31/16 | 8/31/15 | ||||||||||||||||
| $ | 11.00 | $ | 11.05 | $ | 11.42 | $ | 10.75 | $ | 10.65 | |||||||||||
| 0.46 | 0.46 | 0.44 | 0.41 | 0.41 | ||||||||||||||||
| 0.48 | (0.05 | ) | (0.37 | ) | 0.67 | 0.10 | ||||||||||||||
|
|
|
|
|
|
|
|
|
| |||||||||||
| 0.94 | 0.41 | 0.07 | 1.08 | 0.51 | ||||||||||||||||
|
|
|
|
|
|
|
|
|
| |||||||||||
| (0.46 | ) | (0.46 | ) | (0.44 | ) | (0.41 | ) | (0.41 | ) | |||||||||||
|
|
|
|
|
|
|
|
|
| |||||||||||
| (0.46 | ) | (0.46 | ) | (0.44 | ) | (0.41 | ) | (0.41 | ) | |||||||||||
|
|
|
|
|
|
|
|
|
| |||||||||||
| $ | 11.48 | $ | 11.00 | $ | 11.05 | $ | 11.42 | $ | 10.75 | |||||||||||
|
|
|
|
|
|
|
|
|
| |||||||||||
| 8.81% | 3.80% | 0.72% | 10.25% | 4.83% | ||||||||||||||||
| $ | 208,549 | $ | 200,493 | $ | 190,211 | $ | 250,810 | $ | 227,090 | |||||||||||
| 0.85% | 0.85% | 0.85% | 0.85% | 0.85% | ||||||||||||||||
| 0.90% | 0.91% | 0.94% | 0.94% | 0.97% | ||||||||||||||||
| 4.22% | 4.19% | 4.02% | 3.73% | 3.80% | ||||||||||||||||
| 4.17% | 4.13% | 3.93% | 3.64% | 3.68% | ||||||||||||||||
| 33% | 19% | 27% | 13% | 10% | ||||||||||||||||
| ||||||||||||||||||||
101
Table of Contents
Financial highlights
Delaware National High-Yield Municipal Bond Fund Class C
Selected data for each share of the Fund outstanding throughout each period were as follows:
Net asset value, beginning of period |
Income (loss) from investment operations: |
Net investment income1 |
Net realized and unrealized gain (loss) |
Total from investment operations |
Less dividends and distributions from: |
Net investment income |
Total dividends and distributions |
Net asset value, end of period |
Total return2 |
Ratios and supplemental data: |
Net assets, end of period (000 omitted) |
Ratio of expenses to average net assets |
Ratio of expenses to average net assets prior to fees waived |
Ratio of net investment income to average net assets |
Ratio of net investment income to average net assets prior to fees waived |
Portfolio turnover |
|
| 1 | The average shares outstanding have been applied for per share information. |
| 2 | Total return is based on the change in net asset value of a share during the period and assumes reinvestment of dividends and distributions at net asset value and does not reflect the impact of a sales charge. Total return during all of the periods shown reflects a waiver by the manager. Performance would have been lower had the waiver not been in effect. |
See accompanying notes, which are an integral part of the financial statements.
102
Table of Contents
| Year ended | ||||||||||||||||||||
| 8/31/19 | 8/31/18 | 8/31/17 | 8/31/16 | 8/31/15 | ||||||||||||||||
| $ | 11.04 | $ | 11.09 | $ | 11.47 | $ | 10.80 | $ | 10.70 | |||||||||||
| 0.38 | 0.38 | 0.36 | 0.33 | 0.33 | ||||||||||||||||
| 0.48 | (0.05 | ) | (0.38 | ) | 0.67 | 0.10 | ||||||||||||||
|
|
|
|
|
|
|
|
|
| |||||||||||
| 0.86 | 0.33 | (0.02 | ) | 1.00 | 0.43 | |||||||||||||||
| (0.38 | ) | (0.38 | ) | (0.36 | ) | (0.33 | ) | (0.33 | ) | |||||||||||
|
|
|
|
|
|
|
|
|
| |||||||||||
| (0.38 | ) | (0.38 | ) | (0.36 | ) | (0.33 | ) | (0.33 | ) | |||||||||||
|
|
|
|
|
|
|
|
|
| |||||||||||
| $ | 11.52 | $ | 11.04 | $ | 11.09 | $ | 11.47 | $ | 10.80 | |||||||||||
|
|
|
|
|
|
|
|
|
| |||||||||||
| 7.98% | 3.03% | (0.11% | ) | 9.41% | 4.04% | |||||||||||||||
| $ | 91,184 | $ | 92,155 | $ | 97,974 | $ | 113,905 | $ | 91,196 | |||||||||||
| 1.60% | 1.60% | 1.60% | 1.60% | 1.60% | ||||||||||||||||
| 1.65% | 1.66% | 1.69% | 1.69% | 1.72% | ||||||||||||||||
| 3.47% | 3.44% | 3.27% | 2.98% | 3.05% | ||||||||||||||||
| 3.42% | 3.38% | 3.18% | 2.89% | 2.93% | ||||||||||||||||
| 33% | 19% | 27% | 13% | 10% | ||||||||||||||||
| ||||||||||||||||||||
103
Table of Contents
Financial highlights
Delaware National High-Yield Municipal Bond Fund Institutional Class
Selected data for each share of the Fund outstanding throughout each period were as follows:
Net asset value, beginning of period |
Income (loss) from investment operations: |
Net investment income1 |
Net realized and unrealized gain (loss) |
Total from investment operations |
Less dividends and distributions from: |
Net investment income |
Total dividends and distributions |
Net asset value, end of period |
Total return2 |
Ratios and supplemental data: |
Net assets, end of period (000 omitted) |
Ratio of expenses to average net assets |
Ratio of expenses to average net assets prior to fees waived |
Ratio of net investment income to average net assets |
Ratio of net investment income to average net assets prior to fees waived |
Portfolio turnover |
|
| 1 | The average shares outstanding have been applied for per share information. |
| 2 | Total return is based on the change in net asset value of a share during the period and assumes reinvestment of dividends and distributions at net asset value. Total return during all of the periods shown reflects a waiver by the manager. Performance would have been lower had the waiver not been in effect. |
See accompanying notes, which are an integral part of the financial statements.
104
Table of Contents
| Year ended | ||||||||||||||||||||
| 8/31/19 | 8/31/18 | 8/31/17 | 8/31/16 | 8/31/15 | ||||||||||||||||
| $ | 11.10 | $ | 11.15 | $ | 11.53 | $ | 10.85 | $ | 10.75 | |||||||||||
| 0.49 | 0.49 | 0.47 | 0.45 | 0.44 | ||||||||||||||||
| 0.48 | (0.05 | ) | (0.38 | ) | 0.67 | 0.10 | ||||||||||||||
|
|
|
|
|
|
|
|
|
| |||||||||||
| 0.97 | 0.44 | 0.09 | 1.12 | 0.54 | ||||||||||||||||
|
|
|
|
|
|
|
|
|
| |||||||||||
| (0.49 | ) | (0.49 | ) | (0.47 | ) | (0.44 | ) | (0.44 | ) | |||||||||||
|
|
|
|
|
|
|
|
|
| |||||||||||
| (0.49 | ) | (0.49 | ) | (0.47 | ) | (0.44 | ) | (0.44 | ) | |||||||||||
|
|
|
|
|
|
|
|
|
| |||||||||||
| $ | 11.58 | $ | 11.10 | $ | 11.15 | $ | 11.53 | $ | 10.85 | |||||||||||
|
|
|
|
|
|
|
|
|
| |||||||||||
| 9.03% | 4.07% | 0.92% | 10.57% | 5.08% | ||||||||||||||||
| $ | 1,141,973 | $ | 1,017,167 | $ | 932,716 | $ | 905,436 | $ | 649,455 | |||||||||||
| 0.60% | 0.60% | 0.60% | 0.60% | 0.60% | ||||||||||||||||
| 0.65% | 0.66% | 0.69% | 0.69% | 0.72% | ||||||||||||||||
| 4.47% | 4.44% | 4.27% | 3.98% | 4.05% | ||||||||||||||||
| 4.42% | 4.38% | 4.18% | 3.89% | 3.93% | ||||||||||||||||
| 33% | 19% | 27% | 13% | 10% | ||||||||||||||||
| ||||||||||||||||||||
105
Table of Contents
| Notes to financial statements | ||
| Delaware Funds® by Macquarie national tax-free funds | August 31, 2019 | |
Delaware Group®Tax-Free Fund is organized as a Delaware statutory trust and offers two series: DelawareTax-Free USA Fund and DelawareTax-Free USA Intermediate Fund. Voyageur Mutual Funds is organized as a Delaware statutory trust and offers five series: DelawareTax-Free California Fund, DelawareTax-Free Idaho Fund, Delaware Minnesota High-Yield Municipal Bond Fund, Delaware National High-Yield Municipal Bond Fund, and DelawareTax-Free New York Fund. Delaware GroupTax-Free Fund and Voyageur Mutual Funds are each referred to as a Trust, or collectively, as the Trusts. These financial statements and the related notes pertain to DelawareTax-Free USA Fund, DelawareTax-Free USA Intermediate Fund, and Delaware National High-Yield Municipal Bond Fund (each a Fund, or collectively, the Funds). Each Fund is anopen-end investment company. The Funds are considered diversified under the Investment Company Act of 1940, as amended (1940 Act), and offer Class A, Class C, and Institutional Class shares. Class A shares are sold with a maximumfront-end sales charge of 4.50% for DelawareTax-Free USA Fund and Delaware National High-Yield Municipal Bond Fund, and 2.75% for DelawareTax-Free USA Intermediate Fund. Class A share purchases of $1,000,000 or more will incur a contingent deferred sales charge (CDSC) instead of afront-end sales charge of 1.00%, if redeemed during the first year and 0.50% during the second year for DelawareTax-Free USA Fund and Delaware National High-Yield Municipal Bond Fund, and 0.75% for DelawareTax-Free USA Intermediate Fund if redeemed within the first year, provided that Delaware Distributors, L.P. (DDLP) paid a financial advisor a commission on the purchase of those shares. Class C shares are sold with a CDSC of 1.00%, which will be incurred if redeemed during the first 12 months. Institutional Class shares are not subject to a sales charge and are offered for sale exclusively to certain eligible investors.
The investment objective of DelawareTax-Free USA Fund and DelawareTax-Free USA Intermediate Fund is to seek as high a level of current interest income exempt from federal income taxes as is available from municipal obligations and as is consistent with prudent investment management and preservation of capital.
The investment objective of Delaware National High-Yield Municipal Bond Fund is to seek a high level of current income exempt from federal income tax primarily through investment in medium- and lower-grade municipal obligations.
1. Significant Accounting Policies
Each Fund follows accounting and reporting guidance under Financial Accounting Standards Board (FASB) Accounting Standards Codification Topic 946, Financial Services – Investment Companies. The following accounting policies are in accordance with US generally accepted accounting principles (US GAAP) and are consistently followed by the Funds.
Security Valuation– Debt securities are valued based upon valuations provided by an independent pricing service or broker and reviewed by management. To the extent current market prices are not available, the pricing service may take into account developments related to the specific security, as well as transactions in comparable securities. Valuations for fixed income securities utilize matrix systems, which reflect such factors as security prices, yields, maturities, and ratings, and are supplemented by dealer and exchange quotations. Generally, other securities and assets for which market quotations are not readily available are valued at fair value as determined in good faith under the direction of each Trust’s Board of Trustees (each, a Board or, collectively, the Boards). In determining whether market
106
Table of Contents
quotations are readily available or fair valuation will be used, various factors will be taken into consideration, such as market closures or suspension of trading in a security. Restricted securities are valued at fair value using methods approved by the Boards.
Federal Income Taxes– No provision for federal income taxes has been made as each Fund intends to continue to qualify for federal income tax purposes as a regulated investment company under Subchapter M of the Internal Revenue Code of 1986, as amended, and make the requisite distributions to shareholders. Each Fund evaluates tax positions taken or expected to be taken in the course of preparing each Fund’s tax returns to determine whether the tax positions are“more-likely-than-not” of being sustained by the applicable tax authority. Tax positions not deemed to meet the“more-likely-than-not” threshold are recorded as a tax benefit or expense in the current year. Management has analyzed each Fund’s tax positions taken or expected to be taken on each Fund’s federal income tax returns through the year ended Aug. 31, 2019 and for all open tax years (years ended Aug. 31, 2016–Aug. 31, 2018), and has concluded that no provision for federal income tax is required in each Fund’s financial statements. If applicable, each Fund recognizes interest accrued on unrecognized tax benefits in interest expense and penalties in “Other expenses” on the “Statements of operations.” During the year ended Aug. 31, 2019, the Funds did not incur any interest or tax penalties.
Class Accounting– Investment income and common expenses are allocated to the various classes of each Fund on the basis of “settled shares” of each class in relation to the net assets of each Fund. Realized and unrealized gain (loss) on investments are allocated to the various classes of each Fund on the basis of daily net assets of each class. Distribution expenses relating to a specific class are charged directly to that class.
Use of Estimates– The preparation of financial statements in conformity with US GAAP requires management to make estimates and assumptions that affect the fair value of investments, the reported amounts of assets and liabilities and disclosure of contingent assets and liabilities at the date of the financial statements, and the reported amounts of revenues and expenses during the reporting period. Actual results could differ from those estimates and the differences could be material.
Other– Expenses directly attributable to a Fund are charged directly to that Fund. Other expenses common to various funds within the Delaware Funds® by Macquarie (Delaware Funds) are generally allocated among such funds on the basis of average net assets. Management fees and certain other expenses are paid monthly. Security transactions are recorded on the date the securities are purchased or sold (trade date) for financial reporting purposes. Costs used in calculating realized gains and losses on the sale of investment securities are those of the specific securities sold. Interest income is recorded on the accrual basis. Discounts and premiums on debt securities are accreted or amortized to interest income, respectively, over the lives of the respective securities using the effective interest method. Each Fund declares dividends daily from net investment income and pays the dividends monthly and declares and pays distributions from net realized gain on investments, if any, annually. Each Fund may distribute more frequently, if necessary for tax purposes. Dividends and distributions, if any, are recorded on theex-dividend date.
Each Fund receives earnings credits from its custodian when positive cash balances are maintained, which may be used to offset custody fees. The expenses paid under this arrangement are included on the “Statements of operations” under “Custodian fees” with the corresponding expenses offset included
107
Table of Contents
Notes to financial statements
Delaware Funds® by Macquarie national tax-free funds
1. Significant Accounting Policies (continued)
under “Less expenses paid indirectly.” For the year ended Aug. 31, 2019, each Fund earned the following amounts under this arrangement:
DelawareTax-Free USA Fund | DelawareTax-Free USA Intermediate Fund | Delaware National High-Yield Municipal Bond Fund | ||
$4,606 | $5,724 | $18,624 |
Each Fund receives earnings credits from its transfer agent when positive cash balances are maintained, which may be used to offset transfer agent fees. If the amount earned is greater than $1, the expenses paid under this arrangement are included on the “Statements of operations” under “Dividend disbursing and transfer agent fees and expenses” with the corresponding expenses offset included under “Less expenses paid indirectly.” For the year ended Aug. 31, 2019, each Fund earned the following amounts under this arrangement:
DelawareTax-Free USA Fund | DelawareTax-Free USA Intermediate Fund | Delaware National High-Yield Municipal Bond Fund | ||
$334 | $109 | $485 |
2. Investment Management, Administration Agreements, and Other Transactions with Affiliates
In accordance with the terms of its respective investment management agreement, each Fund pays Delaware Management Company (DMC), a series of Macquarie Investment Management Business Trust and the investment manager, an annual fee which is calculated daily and paid monthly based on each Fund’s average daily net assets as follows:
| Delaware Tax-Free USA Fund | DelawareTax-Free USA Intermediate Fund | Delaware National High-Yield Municipal Bond Fund | ||||
On the first $500 million | 0.550% | 0.500% | 0.550% | |||
On the next $500 million | 0.500% | 0.475% | 0.500% | |||
On the next $1.5 billion | 0.450% | 0.450% | 0.450% | |||
In excess of $2.5 billion | 0.425% | 0.425% | 0.425% |
DMC has contractually agreed to waive that portion, if any, of its management fee and/or pay/reimburse each Fund to the extent necessary to ensure that total annual operating expenses (excluding any distribution and service(12b-1) fees, acquired fund fees and expenses, taxes, interest, inverse floater program expenses, short sale and dividend interest expenses, brokerage fees, certain insurance costs, and nonroutine expenses or costs including, but not limited to, those relating to reorganizations, litigation, conducting shareholder meetings, and liquidations) in order to prevent total annual fund
108
Table of Contents
operating expenses from exceeding the following percentage of each Fund’s average daily net assets from Sept. 1, 2018 through Aug. 31, 2019.* These expense waivers and reimbursements may only be terminated by agreement of DMC and the Funds. The waivers and reimbursements are accrued daily and received monthly.
Delaware Tax-Free USA Fund | Delaware Tax-Free USA Intermediate Fund | Delaware National High-Yield | ||||
Operating expense limitation as a percentage of average daily net assets | 0.56% | 0.50% | 0.60% |
Delaware Investments Fund Services Company (DIFSC), an affiliate of DMC, provides fund accounting and financial administration oversight services to the Funds. For these services, DIFSC’s fees are calculated daily and paid monthly based on the aggregate daily net assets of all funds within the Delaware Funds at the following annual rates: 0.00475% of the first $35 billion; 0.0040% of the next $10 billion; and 0.0025% of aggregate average daily net assets in excess of $45 billion (Total Fee). Each fund in the Delaware Funds pays a minimum of $4,000, which, in aggregate, is subtracted from the Total Fee. Each fund then pays its portion of the remainder of the Total Fee on a relative net asset value (NAV) basis. These amounts are included on the “Statements of operations” under “Accounting and administration expenses.” For the year ended Aug. 31, 2019, each Fund was charged for these services as follows:
DelawareTax-Free USA Fund | DelawareTax-Free USA Intermediate Fund | Delaware National High-Yield Municipal Bond Fund | ||
$24,939 | $23,844 | $53,540 |
DIFSC is also the transfer agent and dividend disbursing agent of the Funds. For these services, DIFSC’s fees are calculated daily and paid monthly based on the aggregate daily net assets of the retail funds within the Delaware Funds at the following annual rates: 0.014% of the first $20 billion; 0.011% of the next $5 billion; 0.007% of the next $5 billion; 0.005% of the next $20 billion; and 0.0025% of average daily net assets in excess of $50 billion. The fees payable to DIFSC under the shareholder services agreement described above are allocated among all retail funds in the Delaware Funds on a relative NAV basis. These amounts are included on the “Statements of operations” under “Dividend disbursing and transfer agent fees and expenses.” For the year ended Aug. 31, 2019, each Fund was charged for these services as follows:
DelawareTax-Free USA Fund | DelawareTax-Free USA Intermediate Fund | Delaware National High-Yield Municipal Bond Fund | ||
$45,570 | $43,280 | $109,237 |
Pursuant to asub-transfer agency agreement between DIFSC and BNY Mellon Investment Servicing (US) Inc. (BNYMIS), BNYMIS provides certainsub-transfer agency services to each Fund.Sub-transfer agency fees are paid by each Fund and are also included on the “Statements of operations” under “Dividend disbursing and transfer agent fees and expenses.” The fees that are calculated daily and paid as invoices are received on a monthly or quarterly basis.
Pursuant to a distribution agreement and distribution plan, Delaware National High-Yield Municipal Bond Fund pays DDLP, the distributor and an affiliate of DMC, an annual12b-1 fee of 0.25% of the
109
Table of Contents
Notes to financial statements
Delaware Funds® by Macquarie national tax-free funds
2. Investment Management, Administration Agreements, and Other Transactions with Affiliates (continued)
average daily net assets of the Class A shares. The Board for DelawareTax-Free USA Fund has adopted a formula for calculating12b-1 fees for the Fund’s Class A shares that went into effect on June 1, 1992. The Fund’s Class A shares are currently subject to a blended12b-1 fee equal to the sum of: (1) 0.10% of average daily net assets representing shares acquired prior to June 1, 1992, and (2) 0.25% of average daily net assets representing shares that were acquired on or after June 1, 1992. All of the Fund’s Class A shareholders bear12b-1 fees at the same blended rate, currently 0.25% of average daily net assets, based on the formula described on the previous page. This method of calculating Class A12b-1 fees may be discontinued at the sole discretion of the Board. The Class A shares of DelawareTax-Free USA Intermediate Fund were subject to a12b-1 fee of 0.25% of average daily net assets, which was contractually waived to 0.15% of average daily net assets from Sept. 1, 2018 through Aug. 31, 2019.** Each Fund pays 1.00% of the average daily net assets of the Class C shares. The fees are calculated daily and paid monthly. Institutional Class shares do not pay12b-1 fees.
As provided in the investment management agreement, each Fund bears a portion of the cost of certain resources shared with DMC, including the cost of internal personnel of DMC and/or its affiliates that provide legal, tax, and regulatory reporting services to the Funds. These amounts are included on the “Statements of operations” under “Legal fees.” For the year ended Aug. 31, 2019, each Fund was charged for internal legal, tax, and regulatory reporting services provided by DMC and/or its affiliates’ employees as follows:
DelawareTax-Free USA Fund | DelawareTax-Free USA Intermediate Fund | Delaware National High-Yield Municipal Bond Fund | ||
$15,250 | $14,512 | $36,039 |
For the year ended Aug. 31, 2019, DDLP earned commissions on sales of Class A shares for each Fund as follows:
DelawareTax-Free USA Fund | DelawareTax-Free USA Intermediate Fund | Delaware National High-Yield Municipal Bond Fund | ||
$18,364 | $5,459 | $38,172 |
For the year ended Aug. 31, 2019, DDLP received gross CDSC commissions on redemptions of each Fund’s Class A and Class C shares. These commissions were entirely used to offset upfront commissions previously paid by DDLP to broker/dealers on sales of those shares. The amounts received were as follows:
DelawareTax-Free �� USA Fund | DelawareTax-Free USA Intermediate Fund | Delaware National High-Yield | ||||
Class A | $153 | $ — | $54,821 | |||
Class C | 163 | 656 | 1,919 |
Trustees’ fees include expenses accrued by each Fund for each Trustee’s retainer and meeting fees. Certain officers of DMC, DIFSC, and DDLP are officers and/or Trustees of the Trusts. These officers and Trustees are paid no compensation by the Funds.
Cross trades for the year ended Aug. 31, 2019, were executed by each Fund pursuant to procedures adopted by the Boards designed to ensure compliance with Rule17a-7 under the 1940 Act. Cross
110
Table of Contents
trading is the buying or selling of portfolio securities between funds of investment companies, or between a fund of an investment company and another entity, that are or could be considered affiliates by virtue of having a common investment advisor (or affiliated investment advisors), common directors/trustees and/or common officers. At their regularly scheduled meetings, the Boards review such transactions for compliance with the procedures adopted by the Boards. Pursuant to these procedures, for the year ended Aug. 31, 2019, the Funds engaged in Rule17a-7 securities purchases and securities sales, which resulted in realized losses as follows:
DelawareTax-Free USA Fund | DelawareTax-Free USA Intermediate Fund | Delaware National High-Yield Municipal Bond Fund | ||||
Purchases | $49,851,543 | $38,724,650 | $25,246,214 | |||
Sales | 35,492,096 | 29,832,183 | 34,591,437 | |||
Net realized loss | 74,398 | 126,660 | — |
There was no realized gain (loss) as a result of Rule17a-7 securities sales for Delaware National High-Yield Municipal Bond Fund.
*For DelawareTax-Free USA Fund and Delaware National High-Yield Municipal Bond Fund, the aggregate contractual waiver period covering this report is from Dec. 29, 2017 through Dec. 28, 2019. For DelawareTax-Free USA Intermediate Fund, the aggregate contractual waiver period covering this report is from April 1, 2018 through Dec. 28, 2019.
**For DelawareTax-Free USA Intermediate Fund Class A shares, the aggregate contractual waiver period covering this report is from Dec. 29, 2017 through Dec. 28, 2019.
3. Investments
For the year ended Aug. 31, 2019, each Fund made purchases and sales of investment securities other than short-term investments as follows:
Delaware Tax-Free USA Fund | DelawareTax-Free USA Intermediate Fund | Delaware National Municipal Bond Fund | |||||||||||||
Purchases | $269,097,067 | $127,452,156 | $518,792,990 | ||||||||||||
Sales | 238,361,585 | 143,756,228 | 433,154,815 | ||||||||||||
The tax cost of investments includes adjustments to net unrealized appreciation (depreciation) which may not necessarily be final tax cost basis adjustments, but approximate the tax basis unrealized gains and losses that may be realized and distributed to shareholders. At Aug. 31, 2019, the cost and unrealized appreciation (depreciation) of investments for federal income tax purposes for each Fund were as follows:
| Delaware Tax-Free USA Fund | Delaware Tax-Free USA Intermediate Fund | Delaware National High-Yield Municipal Bond Fund | |||||||||||||
Cost of investments | $ | 577,209,948 | $ | 499,466,540 | $ | 1,322,173,100 | |||||||||
|
|
|
|
|
| ||||||||||
Aggregate unrealized appreciation of investments | $ | 50,013,037 | $ | 40,747,208 | $ | 122,927,261 | |||||||||
111
Table of Contents
Notes to financial statements
Delaware Funds® by Macquarie national tax-free funds
3. Investments (continued)
| Delaware Tax-Free USA Fund | DelawareTax-Free USA Intermediate Fund | Delaware National High-Yield Municipal Bond Fund | |||||||||||||
Aggregate unrealized depreciation of investments | (340,796 | ) | (167,247 | ) | (3,399,995 | ) | |||||||||
|
|
|
|
|
| ||||||||||
Net unrealized appreciation of investments | $ | 49,672,241 | $ | 40,579,961 | $ | 119,527,266 | |||||||||
|
|
|
|
|
| ||||||||||
US GAAP defines fair value as the price that each Fund would receive to sell an asset or pay to transfer a liability in an orderly transaction between market participants at the measurement date under current market conditions. A three-level hierarchy for fair value measurements has been established based upon the transparency of inputs to the valuation of an asset or liability. Inputs may be observable or unobservable and refer broadly to the assumptions that market participants would use in pricing the asset or liability. Observable inputs reflect the assumptions market participants would use in pricing the asset or liability based on market data obtained from sources independent of the reporting entity. Unobservable inputs reflect the reporting entity’s own assumptions about the assumptions that market participants would use in pricing the asset or liability based on the best information available under the circumstances. Each Fund’s investment in its entirety is assigned a level based upon the observability of the inputs which are significant to the overall valuation. The three-level hierarchy of inputs is summarized below.
| Level 1 – | Inputs are quoted prices in active markets for identical investments. (Examples: equity securities,open-end investment companies, futures contracts, and exchange-traded options contracts) | |
| Level 2 – | Other observable inputs, including, but not limited to: quoted prices for similar assets or liabilities in markets that are active, quoted prices for identical or similar assets or liabilities in markets that are not active, inputs other than quoted prices that are observable for the assets or liabilities (such as interest rates, yield curves, volatilities, prepayment speeds, loss severities, credit risks, and default rates) or other market-corroborated inputs. (Examples: debt securities, government securities, swap contracts, foreign currency exchange contracts, foreign securities utilizing international fair value pricing, broker-quoted securities, and fair valued securities) | |
| Level 3 – | Significant unobservable inputs, including each Fund’s own assumptions used to determine the fair value of investments. (Examples: broker-quoted securities and fair valued securities) | |
Level 3 investments are valued using significant unobservable inputs. Each Fund may also use an income-based valuation approach in which the anticipated future cash flows of the investment are discounted to calculate fair value. Discounts may also be applied due to the nature or duration of any restrictions on the disposition of the investments. Valuations may also be based upon current market prices of securities that are comparable in coupon, rating, maturity, and industry. The derived value of a Level 3 investment may not represent the value which is received upon disposition and this could impact the results of operations.
112
Table of Contents
The following tables summarize the valuation of each Fund’s investments by fair value hierarchy levels as of Aug. 31, 2019:
| Delaware Tax-Free USA Fund | ||||
| Level 2 | ||||
Securities | ||||
Assets: | ||||
Municipal Bonds | $623,082,189 | |||
Short-Term Investments | 3,800,000 | |||
Total Value of Securities | $626,882,189 | |||
DelawareTax-Free USA Intermediate Fund | ||||
| Level 2 | ||||
Securities | ||||
Assets: | ||||
Municipal Bonds | $538,546,501 | |||
Short-Term Investments | 1,500,000 | |||
Total Value of Securities | $540,046,501 | |||
Delaware National High-Yield Municipal Bond Fund | ||||
| Level 2 | ||||
Securities | ||||
Assets: | ||||
Municipal Bonds | $1,441,700,366 | |||
During the year ended Aug. 31, 2019, there were no transfers between Level 1 investments, Level 2 investments, or Level 3 investments that had a significant impact to each Fund. Each Fund’s policy is to recognize transfers between levels based on fair value at the beginning of the reporting period.
A reconciliation of Level 3 investments is presented when a Fund has a significant amount of Level 3 investments at the beginning, interim, or end of the period in relation to each Fund’s net assets. During the year ended Aug. 31, 2019, there were no Level 3 investments.
113
Table of Contents
Notes to financial statements
Delaware Funds® by Macquarie national tax-free funds
4. Dividend and Distribution Information
Income and long-term capital gain distributions are determined in accordance with federal income tax regulations, which may differ from US GAAP. Additionally, distributions from net short-term gains on sales of investment securities are treated as ordinary income for federal income tax purposes. The tax character of dividends and distributions paid during the years ended Aug. 31, 2019 and 2018 was as follows:
| Delaware Tax-Free USA Fund | DelawareTax-Free USA Intermediate Fund | Delaware National High-Yield Municipal Bond Fund | |||||||||||||
Year ended 8/31/19 | |||||||||||||||
Tax-exempt income | $ | 19,673,037 | $ | 16,667,720 | $ | 56,547,428 | |||||||||
Ordinary income | 81,501 | — | 21,340 | ||||||||||||
Long-term capital gains | 145,750 | — | — | ||||||||||||
Total | $ | 19,900,288 | $ | 16,667,720 | $ | 56,568,768 | |||||||||
Year ended 8/31/18 | |||||||||||||||
Tax-exempt income | $ | 20,025,612 | $ | 17,495,281 | $ | 54,048,737 | |||||||||
Ordinary income | 59,989 | 14,439 | 349,897 | ||||||||||||
|
|
|
|
|
| ||||||||||
Total | $ | 20,085,601 | $ | 17,509,720 | $ | 54,398,634 | |||||||||
|
|
|
|
|
| ||||||||||
5. Components of Net Assets on a Tax Basis
As of Aug. 31, 2019, the components of net assets on a tax basis were as follows:
| Delaware Tax-Free USA Fund | DelawareTax-Free USA Intermediate Fund | Delaware National High-Yield Municipal Bond Fund | |||||||||||||
Shares of beneficial interest | $ | 571,628,110 | $ | 507,685,940 | $ | 1,335,212,255 | |||||||||
Undistributedtax-exempt income | 468,830 | 358,539 | 1,427,496 | ||||||||||||
Undistributed long-term capital gains | 1,030,177 | — | — | ||||||||||||
Distributions payable | (483,553 | ) | (391,650 | ) | (1,431,598 | ) | |||||||||
Capital loss carryforwards | — | (1,838,007 | ) | (13,029,258 | ) | ||||||||||
Unrealized appreciation of investments | 49,672,241 | 40,579,961 | 119,527,266 | ||||||||||||
|
|
|
|
|
| ||||||||||
Net assets | $ | 622,315,805 | $ | 546,394,783 | $ | 1,441,706,161 | |||||||||
|
|
|
|
|
| ||||||||||
The differences between book basis and tax basis components of net assets are primarily attributable to tax deferral of losses on wash sales and tax treatment of market discount and premium on debt instruments, if applicable.
114
Table of Contents
For federal income tax purposes, capital loss carryforwards may be carried forward and applied against future capital gains. At Aug. 31, 2019, the Funds utilized capital loss carryforwards as follows:
DelawareTax-Free | Delaware National High-Yield | |||||||||
Capital loss carryforwards utilized | $1,077,571 | $2,894,196 | ||||||||
Under the Regulated Investment Company Modernization Act of 2010, net capital losses recognized for tax years beginning after Dec. 22, 2010 may be carried forward indefinitely, and their character is retained as short-term and/or long-term losses. At Aug. 31, 2019, capital loss carryforwards available to offset future realized capital gains were as follows:
Loss carryforward character | ||||||||||||
Short-term | Long-term | Total | ||||||||||
| DelawareTax-Free USA Intermediate Fund | $ | 1,838,007 | $ | — | $ | 1,838,007 | ||||||
Delaware National High-Yield Municipal Bond Fund | 11,623,420 | 1,405,838 | 13,029,258 | |||||||||
At Aug. 31, 2019, there were no capital loss carryforwards for DelawareTax-Free USA Fund.
115
Table of Contents
Notes to financial statements
Delaware Funds® by Macquarie national tax-free funds
6. Capital Shares
Transactions in capital shares were as follows:
| DelawareTax-Free USA Fund | DelawareTax-Free USA Intermediate Fund | Delaware National High-Yield Municipal Bond Fund | ||||||||||||||||||||||
Year ended | Year ended | Year ended | ||||||||||||||||||||||
| 8/31/19 | 8/31/18 | 8/31/19 | 8/31/18 | 8/31/19 | 8/31/18 | |||||||||||||||||||
Shares sold: | ||||||||||||||||||||||||
Class A | 9,633,567 | 12,603,666 | 2,346,565 | 1,415,308 | 4,939,498 | 4,548,565 | ||||||||||||||||||
Class C | 235,464 | 236,676 | 294,667 | 99,772 | 1,334,649 | 1,156,364 | ||||||||||||||||||
Institutional Class | 8,058,705 | 2,876,073 | 13,507,386 | 8,940,604 | 34,265,773 | 24,307,805 | ||||||||||||||||||
Shares issued upon reinvestment of dividends and distributions: |
| |||||||||||||||||||||||
Class A | 1,282,034 | 1,268,997 | 305,278 | 350,140 | 675,346 | 674,320 | ||||||||||||||||||
Class C | 35,429 | 55,857 | 43,148 | 61,629 | 250,585 | 268,726 | ||||||||||||||||||
Institutional Class | 232,343 | 195,804 | 801,340 | 775,842 | 3,379,605 | 3,284,191 | ||||||||||||||||||
|
|
|
|
|
|
|
|
|
|
|
| |||||||||||||
| 19,477,542 | 17,237,073 | 17,298,384 | 11,643,295 | 44,845,456 | 34,239,971 | |||||||||||||||||||
|
|
|
|
|
|
|
|
|
|
|
| |||||||||||||
Shares redeemed: | ||||||||||||||||||||||||
Class A | (13,496,639 | ) | (7,310,314 | ) | (4,200,242 | ) | (3,760,589 | ) | (5,676,550 | ) | (4,205,385 | ) | ||||||||||||
Class C | (572,900 | ) | (989,856 | ) | (856,325 | ) | (1,131,893 | ) | (2,018,698 | ) | (1,909,980 | ) | ||||||||||||
Institutional Class | (3,877,118 | ) | (1,689,696 | ) | (13,850,854 | ) | (8,276,999 | ) | (30,706,607 | ) | (19,583,617 | ) | ||||||||||||
|
|
|
|
|
|
|
|
|
|
|
| |||||||||||||
| (17,946,657 | ) | (9,989,866 | ) | (18,907,421 | ) | (13,169,481 | ) | (38,401,855 | ) | (25,698,982 | ) | |||||||||||||
|
|
|
|
|
|
|
|
|
|
|
| |||||||||||||
Net increase (decrease) | 1,530,885 | 7,247,207 | (1,609,037 | ) | (1,526,186 | ) | 6,443,601 | 8,540,989 | ||||||||||||||||
|
|
|
|
|
|
|
|
|
|
|
| |||||||||||||
116
Table of Contents
Certain shareholders may exchange shares of one class for shares of another class in the same Fund. These exchange transactions are included as subscriptions and redemptions in the tables on the previous page and on the “Statements of changes in net assets.” For the years ended Aug. 31, 2019 and 2018, each Fund had the following exchange transactions:
| Year ended | ||||||||||||||||||||||||||||||
| 8/31/19 | ||||||||||||||||||||||||||||||
| Exchange | Exchange | |||||||||||||||||||||||||||||
| Redemptions | Subscriptions | |||||||||||||||||||||||||||||
| Institutional | Institutional | |||||||||||||||||||||||||||||
| Class A | Class C | Class | Class A | Class | ||||||||||||||||||||||||||
| Shares | Shares | Shares | Shares | Shares | Value | |||||||||||||||||||||||||
DelawareTax-Free USA Fund | 122,933 | 9,379 | — | 9,402 | 122,076 | $ | 1,496,654 | |||||||||||||||||||||||
DelawareTax-Free USA Intermediate Fund | 1,189,029 | 4,719 | 6,641 | 11,435 | 1,178,174 | 13,998,550 | ||||||||||||||||||||||||
Delaware National High-Yield Municipal Bond Fund | 9,893 | — | — | — | 9,811 | 108,773 | ||||||||||||||||||||||||
| Year ended | |||||||||||||||||||||||||
| 8/31/18 | |||||||||||||||||||||||||
| Exchange | Exchange | ||||||||||||||||||||||||
| Redemptions | Subscriptions | ||||||||||||||||||||||||
| Institutional | |||||||||||||||||||||||||
| Class A | Class C | Class A | Class | ||||||||||||||||||||||
| Shares | Shares | Shares | Shares | Value | |||||||||||||||||||||
DelawareTax-Free USA Fund | 48,496 | 77,372 | 77,526 | 48,172 | $ | 1,447,435 | |||||||||||||||||||
DelawareTax-Free USA Intermediate Fund | 24,896 | 31,342 | 31,355 | 24,650 | 662,376 | ||||||||||||||||||||
Delaware National High-Yield Municipal Bond Fund | 44,817 | 87,060 | 55,968 | 75,762 | 1,459,307 | ||||||||||||||||||||
7. Line of Credit
Each Fund, along with certain other funds in the Delaware Funds (Participants), was a participant in a revolving line of credit intended to be used for temporary or emergency purposes as an additional source of liquidity to fund redemptions of investor shares. The revolving line of credit available was reduced from $155,000,000 to $130,000,000 on Sept. 6, 2018. Under the agreement, the Participants were charged an annual commitment fee of 0.15%, which was allocated across the Participants based on a weighted average of the respective net assets of each Participant. The Participants were permitted to borrow up to a maximum ofone-third of their net assets under the agreement. Each Participant was individually, and not jointly, liable for its particular advances, if any, under the line of credit. The line of credit available under the agreement expired on Nov. 5, 2018.
On Nov. 5, 2018, the Participants entered into an amendment to the agreement for a $190,000,000 revolving line of credit. The revolving line of credit available was increased to $220,000,000 on
117
Table of Contents
Notes to financial statements
Delaware Funds® by Macquarie national tax-free funds
7. Line of Credit (continued)
Nov. 29, 2018. The revolving line of credit is to be used as described on the previous page and operates in substantially the same manner as the original agreement. The line of credit available under the agreement expires on Nov. 4, 2019.
The Funds had no amounts outstanding as of Aug. 31, 2019, or at any time during the year then ended.
8. Securities Lending
DelawareTax-Free USA intermediate Fund, along with other funds in the Delaware Funds, may lend its securities pursuant to a security lending agreement (Lending Agreement) with The Bank of New York Mellon (BNY Mellon). At the time a security is loaned, the borrower must post collateral equal to the required percentage of the market value of the loaned security, including any accrued interest. The required percentage is: (1) 102% with respect to US securities and foreign securities that are denominated and payable in US dollars; and (2) 105% with respect to foreign securities. With respect to each loan, if on any business day, the aggregate market value of securities collateral plus cash collateral held is less than the aggregate market value of the securities which are the subject of such loan, the borrower will be notified to provide additional collateral by the end of the following business day, which, together with the collateral already held, will be not less than the applicable initial collateral requirements for such security loan. If the aggregate market value of securities collateral and cash collateral held with respect to a security loan exceeds the applicable initial collateral requirement, upon the request of the borrower, BNY Mellon must return enough collateral to the borrower by the end of the following business day to reduce the value of the remaining collateral to the applicable initial collateral requirement for such security loan. As a result of the foregoing, the value of the collateral held with respect to a loaned security on any particular day, may be more or less than the value of the security on loan. The collateral percentage with respect to the market value of the loaned security is determined by the security lending agent.
Cash collateral received by each fund of the Trust is generally invested in a series of individual separate accounts, each corresponding to a fund. The investment guidelines permit each separate account to hold certain securities that would be considered eligible securities for a money market fund. Cash collateral received is generally invested in government securities; certain obligations issued by government sponsored enterprises; repurchase agreements collateralized by US Treasury securities; obligations issued by the central government of any Organization for Economic Cooperation and Development (OECD) country or its agencies, instrumentalities, or establishments; obligations of supranational organizations; commercial paper, notes, bonds, and other debt obligations; certificates of deposit, time deposits, and other bank obligations; and asset-backed securities. The Fund can also accept US government securities and letters of credit(non-cash collateral) in connection with securities loans.
In the event of default or bankruptcy by the lending agent, realization and/or retention of the collateral may be subject to legal proceedings. In the event the borrower fails to return loaned securities and the collateral received is insufficient to cover the value of the loaned securities and provided such collateral shortfall is not the result of investment losses, the lending agent has agreed to pay the amount of the shortfall to the Fund or, at the discretion of the lending agent, replace the loaned securities. The Fund continues to record dividends or interest, as applicable, on the securities loaned and is subject to
118
Table of Contents
changes in value of the securities loaned that may occur during the term of the loan. The Fund has the right under the Lending Agreement to recover the securities from the borrower on demand. With respect to security loans collateralized bynon-cash collateral, the Fund receives loan premiums paid by the borrower. With respect to security loans collateralized by cash collateral, the earnings from the collateral investments are shared among the Fund, the security lending agent, and the borrower. The Fund records security lending income net of allocations to the security lending agent and the borrower.
The Fund may incur investment losses as a result of investing securities lending collateral. This could occur if an investment in the collateral investment account defaulted or became impaired. Under those circumstances, the value of the Fund’s cash collateral account may be less than the amount the Fund would be required to return to the borrowers of the securities and the Fund would be required to make up for this shortfall.
During the year ended Aug. 31, 2019, DelawareTax-Free USA Intermediate Fund had no securities out on loan. For the year ended Aug. 31, 2019, DelawareTax-Fee USA Fund and Delaware National High-Yield Municipal Bond Fund were not included in the Lending Agreement.
9. Geographic, Credit, and Market Risks
When interest rates rise, fixed income securities (i.e. debt obligations) generally will decline in value. These declines in value are greater for fixed income securities with longer maturities or durations.
The Funds concentrate their investments in securities issued by municipalities, and may be subject to geographic concentration risk. In addition, the Funds have the flexibility to invest in issuers in US territories and possessions such as the Commonwealth of Puerto Rico, the US Virgin Islands, and Guam, whose bonds are also free of federal and individual state income taxes.
The value of the Funds’ investments may be adversely affected by new legislation within the US states or territories, regional or local economic conditions, and differing levels of supply and demand for municipal bonds. Many municipalities insure repayment for their obligations. Although bond insurance reduces the risk of loss due to default by an issuer, such bonds remain subject to the risk that value may fluctuate for other reasons and there is no certainty that the insurance company will meet its obligations. A real or perceived decline in creditworthiness of a bond insurer can have an adverse impact on the value of insured bonds held in each Fund. At Aug. 31, 2019, the percentage of each Fund’s net assets insured by bond issuers are listed on the next page and these securities have been identified on the “Schedules of investments.”
119
Table of Contents
Notes to financial statements
Delaware Funds® by Macquarie national tax-free funds
9. Geographic, Credit, and Market Risks (continued)
| Delaware Tax-Free USA Fund | Delaware Tax-Free USA Intermediate Fund | Delaware National High-Yield Municipal Bond Fund | |||||||||||||
Assured Guaranty Corporation | 0.16 | % | — | 0.07 | % | ||||||||||
Assured Guaranty Municipal Corporation | 0.24 | % | 1.44 | % | 0.20 | % | |||||||||
AMBAC Assurance Corporation | 0.48 | % | — | 0.07 | % | ||||||||||
Build America Mutual Assurance | 0.40 | % | — | — | |||||||||||
| National Public Finance Guarantee Corporation | 0.17 | % | — | — | |||||||||||
Syncora Guarantee | — | — | 0.15 | % | |||||||||||
|
|
|
|
|
| ||||||||||
Total | 1.45 | % | 1.44 | % | 0.49 | % | |||||||||
|
|
|
|
|
| ||||||||||
As of Aug. 31, 2019, DelawareTax-Free USA Fund invested in municipal bonds issued by the states of California, New York, and Texas, which constituted approximately 14.14%, 11.61%, and 12.74%, respectively, of the Fund’s net assets. As of Aug. 31, 2019, DelawareTax-Free USA Intermediate Fund invested in municipal bonds issued by the states of California and New York, which constituted approximately 15.32% and 16.27%, respectively, of the Fund’s net assets. As of Aug. 31, 2019, Delaware National High-Yield Municipal Bond Fund invested in municipal bonds issued by the state of California which constituted approximately 15.37% of the Fund’s net assets. These investments could make each Fund more sensitive to economic conditions in those states than other more geographically diversified national municipal income funds.
Each Fund invests a portion of its assets in high yield fixed income securities, which are securities rated lower thanBBB- by Standard & Poor’s Financial Services LLC (S&P), lower than Baa3 by Moody’s Investors Service, Inc. (Moody’s), or similarly rated by another nationally recognized statistical rating organization. Investments in these higher-yielding securities are generally accompanied by a greater degree of credit risk than higher-rated securities. Additionally, lower-rated securities may be more susceptible to adverse economic and competitive industry conditions than investment grade securities.
Each Fund invests in certain obligations that may have liquidity protection designed to ensure that the receipt of payments due on the underlying security is timely. Such protection may be provided through guarantees, insurance policies, or letters of credit obtained by the issuer or sponsor through third parties, through various means of structuring the transaction or through a combination of such approaches. Each Fund will not pay any additional fees for such credit support, although the existence of credit support may increase the price of a security.
Each Fund may invest in advance refunded bonds, escrow secured bonds, or defeased bonds. Under current federal tax laws and regulations, state and local government borrowers are permitted to refinance outstanding bonds by issuing new bonds. The issuer refinances the outstanding debt to either reduce interest costs or to remove or alter restrictive covenants imposed by the bonds being refinanced. A refunding transaction where the municipal securities are being refunded within 90 days from the
120
Table of Contents
issuance of the refunding issue is known as a “current refunding.” “Advance refunded bonds” are bonds in which the refunded bond issue remains outstanding for more than 90 days following the issuance of the refunding issue. In an advance refunding, the issuer will use the proceeds of a new bond issue to purchase high grade interest-bearing debt securities, which are then deposited in an irrevocable escrow account held by an escrow agent to secure all future payments of principal and interest and bond premium of the advance refunded bond. Bonds are “escrowed to maturity” when the proceeds of the refunding issue are deposited in an escrow account for investment sufficient to pay all of the principal and interest on the original interest payment and maturity dates.
Bonds are considered“pre-refunded” when the refunding issue’s proceeds are escrowed only until a permitted call date or dates on the refunded issue with the refunded issue being redeemed at the time, including any required premium. Bonds become “defeased” when the rights and interests of the bondholders and of their lien on the pledged revenues or other security under the terms of the bond contract are substituted with an alternative source of revenues (the escrow securities) sufficient to meet payments of principal and interest to maturity or to the first call dates. Escrowed secured bonds will often receive a rating of AAA from Moody’s, S&P, and/or Fitch Ratings due to the strong credit quality of the escrow securities and the irrevocable nature of the escrow deposit agreement.
Each Fund may invest up to 15% of its net assets in illiquid securities, which may include securities with contractual restrictions on resale, securities exempt from registration under Rule 144A, promulgated under the Securities Act of 1933, as amended, and other securities which may not be readily marketable. The relative illiquidity of these securities may impair each Fund from disposing of them in a timely manner and at a fair price when it is necessary or desirable to do so. While maintaining oversight, the Boards have delegated to DMC, theday-to-day functions of determining whether individual securities are liquid for purposes of each Fund’s limitation on investments in illiquid securities. Securities eligible for resale pursuant to Rule 144A, which are determined to be liquid, are not subject to each Fund’s 15% limit on investments in illiquid securities. Rule 144A securities held by each Fund have been identified on the “Schedules of investments.” Restricted securities are valued pursuant to the security valuation procedures described in Note 1.
10. Contractual Obligations
Each Fund enters into contracts in the normal course of business that contain a variety of indemnifications. Each Fund’s maximum exposure under these arrangements is unknown. However, each Fund has not had prior claims or losses pursuant to these contracts. Management has reviewed each Fund’s existing contracts and expects the risk of loss to be remote.
11. Recent Accounting Pronouncements
In March 2017, the FASB issued an Accounting Standards Update (ASU), ASU2017-08, Receivables – Nonrefundable Fees and Other Costs (Subtopic310-20), Premium Amortization on Purchased Callable Debt Securities which amends the amortization period for certain callable debt securities purchased at a premium, shortening such period to the earliest call date. The ASU2017-08 does not require any accounting change for debt securities held at a discount; the discount continues to be amortized to maturity. The ASU2017-08 is effective for fiscal years, and interim periods within those
121
Table of Contents
Notes to financial statements
Delaware Funds® by Macquarie national tax-free funds
11. Recent Accounting Pronouncements (continued)
fiscal years, beginning after Dec. 15, 2018. At this time, management is evaluating the implications of these changes on the financial statements.
In August 2018, the FASB issued an ASU2018-13, which changes certain fair value measurement disclosure requirements. The ASU2018-13, in addition to other modifications and additions, removes the requirement to disclose the amount and reasons for transfers between Level 1 and Level 2 of the fair value hierarchy, the policy for the timing of transfers between levels and the valuation process for Level 3 fair value measurements. The ASU2018-13 is effective for fiscal years, and interim periods within those fiscal years, beginning after Dec. 15, 2019. At this time, management is evaluating the implications of these changes on the financial statements.
In August 2018, the Securities and Exchange Commission (SEC) adopted amendments to RegulationS-X to update and simplify the disclosure requirements for registered investment companies by eliminating requirements that are redundant or duplicative of US GAAP requirements or other SEC disclosure requirements. The new amendments require the presentation of the total, rather than the components, of distributable earnings on the “Statements of assets and liabilities” and the total, rather than the components, of dividends from net investment income and distributions from net realized gains on the “Statements of changes in net assets.” The amendments also removed the requirement for the parenthetical disclosure of undistributed net investment income on the “Statements of changes in net assets” and certain tax adjustments that were reflected in the “Notes to financial statements.” All of these have been reflected in the Funds’ financial statements.
12. Subsequent Events
Management has determined that no material events or transactions occurred subsequent to Aug. 31, 2019, that would require recognition or disclosure in the Funds’ financial statements.
122
Table of Contents
registered public accounting firm
To the Board of Trustees of Delaware Group®Tax-Free Fund and Voyageur Mutual Funds and Shareholders of DelawareTax-Free USA Fund, DelawareTax-Free USA Intermediate Fund and Delaware National High-Yield Municipal Bond Fund
Opinions on the Financial Statements
We have audited the accompanying statements of assets and liabilities, including the schedules of investments, of DelawareTax-Free USA Fund, DelawareTax-Free USA Intermediate Fund (constituting Delaware Group® Tax Free Fund) and Delaware National High-Yield Municipal Bond Fund (one of the funds constituting Voyageur Mutual Funds) (hereafter collectively referred to as the “Funds”) as of August 31, 2019, the related statements of operations for the year ended August 31, 2019, the statements of changes in net assets for each of the two years in the period ended August 31, 2019, including the related notes, and the financial highlights for each of the five years in the period ended August 31, 2019 (collectively referred to as the “financial statements”). In our opinion, the financial statements present fairly, in all material respects, the financial position of the Funds as of August 31, 2019, the results of each of their operations for the year then ended, the changes in each of their net assets for each of the two years in the period ended August 31, 2019 and each of the financial highlights for each of the five years in the period ended August 31, 2019 in conformity with accounting principles generally accepted in the United States of America.
Basis for Opinions
These financial statements are the responsibility of the Funds’ management. Our responsibility is to express an opinion on the Funds’ financial statements based on our audits. We are a public accounting firm registered with the Public Company Accounting Oversight Board (United States) (PCAOB) and are required to be independent with respect to the Funds in accordance with the U.S. federal securities laws and the applicable rules and regulations of the Securities and Exchange Commission and the PCAOB.
We conducted our audits of these financial statements in accordance with the standards of the PCAOB. Those standards require that we plan and perform the audit to obtain reasonable assurance about whether the financial statements are free of material misstatement, whether due to error or fraud.
Our audits included performing procedures to assess the risks of material misstatement of the financial statements, whether due to error or fraud, and performing procedures that respond to those risks. Such procedures included examining, on a test basis, evidence regarding the amounts and disclosures in the financial statements. Our audits also included evaluating the accounting principles used and significant estimates made by management, as well as evaluating the overall presentation of the financial statements. Our procedures included confirmation of securities owned as of August 31, 2019 by correspondence with the custodian and brokers; when replies were not received from brokers, we performed other auditing procedures. We believe that our audits provide a reasonable basis for our opinions.
/s/PricewaterhouseCoopers LLP |
Philadelphia, Pennsylvania |
October 16, 2019 |
We have served as the auditor of one or more investment companies in Delaware Funds® by Macquarie since 2010.
123
Table of Contents
Other Fund information (Unaudited)
Delaware Funds® by Macquarie nationaltax-free funds
Tax Information
The information set forth below is for each Fund’s fiscal year as required by federal income tax laws. Shareholders, however, must report distributions on a calendar year basis for income tax purposes, which may include distributions for portions of two fiscal years of a fund. Accordingly, the information needed by shareholders for income tax purposes will be sent to them in January of each year. Please consult your tax advisor for proper treatment of this information.
All disclosures are based on financial information available as of the date of this annual report and, accordingly are subject to change. For any and all items requiring reporting, it is the intention of each Fund to report the maximum amount permitted under the Internal Revenue Code and the regulations thereunder.
For the fiscal year ended Aug. 31, 2019, each Fund reports distributions paid during the year as follows:
| (A) Ordinary Income Distributions (Tax Basis) | (B) Tax-Exempt Distributions (Tax Basis) | (C) Long-Term Capital Gain Distributions (Tax Basis) | Total Distributions (Tax Basis) | |||||
DelawareTax-Free USA Fund | 0.41% | 98.86% | 0.73% | 100.00% | ||||
DelawareTax-Free USA Intermediate Fund | — | 100.00% | — | 100.00% | ||||
Delaware National High-Yield Municipal Bond Fund | 0.04% | 99.96% | — | 100.00% |
(A), (B) and (C) are based on a percentage of each Fund’s total distributions.
Board consideration of Investment Advisory agreements for DelawareTax-Free USA Fund, DelawareTax-Free USA Intermediate Fund, and Delaware National High-Yield Municipal Bond Fund at a meeting held on August21-22, 2019
At a meeting held on Aug.21-22, 2019 (the “Annual Meeting”), the Board of Trustees (the “Board”), including a majority of disinterested or independent Trustees, approved the renewal of the Investment Advisory Agreements for DelawareTax-Free USA Fund, DelawareTax-Free USA Intermediate Fund, and Delaware National High-Yield Municipal Bond Fund (each, a “Fund” and together, the “Funds”). In making its decision, the Board considered information furnished at regular quarterly Board meetings, including reports detailing Fund performance, investment strategies, and expenses, as well as information prepared specifically in connection with the renewal of the investment advisory contract. Information furnished specifically in connection with the renewal of the Investment Management Agreement with Delaware Management Company (“DMC”), a series of Macquarie Investment Management Business Trust (“MIMBT”), included materials provided by DMC and its affiliates (collectively, “Macquarie Investment Management”) concerning, among other things, the nature, extent, and quality of services provided to the Funds; the costs of such services to the Funds; economies of scale; and the investment manager’s financial condition and profitability. In addition, in connection with the Annual Meeting, materials were provided to the Trustees in May 2019, including reports provided by Broadridge Financial Solutions (“Broadridge”). The Broadridge reports compared each Fund’s investment performance and expenses with those of other comparable mutual funds. The Independent
124
Table of Contents
Trustees reviewed and discussed the Broadridge reports with independent legal counsel to the Independent Trustees. In addition to the information noted above, the Board also requested and received information regarding DMC’s policy with respect to advisory fee levels and its breakpoint philosophy; the structure of portfolio manager compensation; comparative client fee information; and any constraints or limitations on the availability of securities for certain investment styles, which had in the past year inhibited, or which were likely in the future to inhibit, the investment manager’s ability to invest fully in accordance with Fund policies.
In considering information relating to the approval of each Fund’s advisory agreement, the Independent Trustees received assistance and advice from and met separately with independent legal counsel to the Independent Trustees and also received assistance and advice from an experienced and knowledgeable independent fund consultant, JDL Consultants, LLC (“JDL”). Although the Board gave attention to all information furnished, the following discussion identifies, under separate headings, the primary factors taken into account by the Board during its contract renewal considerations.
Nature, extent, and quality of services.The Board considered the services provided by DMC to the Funds and their shareholders. In reviewing the nature, extent, and quality of services, the Board considered reports furnished to it throughout the year, which covered matters such as the relative performance of the Funds; compliance of portfolio managers with the investment policies, strategies, and restrictions for the Funds; compliance by DMC and Delaware Distributors, L.P. (together, “Management”) personnel with the Code of Ethics adopted throughout the Delaware Funds® by Macquarie (“Delaware Funds”); and adherence to fair value pricing procedures as established by the Board. The Board was pleased with the current staffing of DMC and the emphasis placed on research in the investment process. The Board recognized DMC’s receipt of certain favorable industry distinctions during the past several years. The Board gave favorable consideration to DMC’s efforts to control expenses while maintaining service levels committed to Fund matters. The Board also noted the benefits provided to Fund shareholders through (a) each shareholder’s ability to: (i) exchange an investment in one Delaware Fund for the same class of shares in another Delaware Fund without a sales charge, or (ii) reinvest Fund dividends into additional shares of the Fund or into additional shares of other Delaware Funds, and (b) the privilege to combine holdings in other Delaware Funds to obtain a reduced sales charge. The Board was satisfied with the nature, extent, and quality of the overall services provided by DMC.
Investment performance.The Board placed significant emphasis on the investment performance of the Funds in view of the importance of investment performance to shareholders. Although the Board considered performance reports and discussions with portfolio managers at Investment Committee meetings throughout the year, the Board gave particular weight to the Broadridge reports furnished for the Annual Meeting. The Broadridge reports prepared for each Fund showed the investment performance of its Class A shares in comparison to a group of similar funds as selected by Broadridge (the “Performance Universe”). A fund with the best performance ranked first, and a fund with the poorest performance ranked last. The highest/best performing 25% of funds in the Performance Universe make up the first quartile; the next 25%, the second quartile; the next 25%, the third quartile; and the poorest/worst performing 25% of funds in the Performance Universe make up the fourth quartile. Comparative annualized performance for each Fund was shown for the past1-,3-,5-, and10-year
125
Table of Contents
Other Fund information (Unaudited)
Delaware Funds® by Macquarie nationaltax-free funds
Board consideration of Investment Advisory agreements for DelawareTax-Free USA Fund, DelawareTax-Free USA Intermediate Fund, and Delaware National High-Yield Municipal Bond Fund at a meeting held on August21-22, 2019 (continued)
periods, to the extent applicable, ended Jan. 31, 2019. The Board’s objective is that each Fund’s performance for the1-,3-, and5-year periods be at or above the median of its Performance Universe.
DelawareTax-Free USA Fund – The Performance Universe for the Fund consisted of the Fund and all retail and institutional general and insured municipal debt funds as selected by Broadridge. The Broadridge report comparison showed that the Fund’s total return for the1-year period was in the third quartile of its Performance Universe. The report further showed that the Fund’s total return for the3-,5-, and10-year periods was in the second quartile of its Performance Universe. The Board was satisfied with performance.
DelawareTax-Free USA Intermediate Fund – The Performance Universe for the Fund consisted of the Fund and all retail and institutional intermediate municipal debt funds as selected by Broadridge. The Broadridge report comparison showed that the Fund’s total return for the1-year period was in the third quartile of its Performance Universe. The report further showed that the Fund’s total return for the3-,5-, and10-year periods was in the second quartile of its Performance Universe. The Board was satisfied with performance.
Delaware National High-Yield Municipal Bond Fund – The Performance Universe for the Fund consisted of the Fund and all retail and institutional high yield municipal debt funds as selected by Broadridge. The Broadridge report comparison showed that the Fund’s total return for the1-year period was in the fourth quartile of its Performance Universe. The report further showed that the Fund’s total return for the3- and5-year periods was in the second quartile of its Performance Universe and the Fund’s total return for the10-year period was in the first quartile of its Performance Universe. The Board observed that the Fund’s performance results were mixed but tended toward median, which was acceptable.
Comparative expenses.The Board considered expense data for the Delaware Funds. Management provided the Board with information on pricing levels and fee structures for each Fund as of its most recently completed fiscal year. The Board also focused on the comparative analysis of effective management fees and total expense ratios of each Fund versus effective management fees and total expense ratios of a group of similar funds as selected by Broadridge (the “Expense Group”). In reviewing comparative costs, each Fund’s contractual management fee and the actual management fee incurred by the Fund were compared with the contractual management fees (assuming all funds in the Expense Group were similar in size to the Fund) and actual management fees (as reported by each fund) within the Expense Group, taking into account any applicable breakpoints and fee waivers. Each Fund’s total expenses were also compared with those of its Expense Group. The Broadridge total expenses, for comparative consistency, were shown by Broadridge for Class A shares and comparative total expenses including12b-1 andnon-12b-1 service fees. The Board’s objective is for each Fund’s total expense ratio to be competitive with those of the peer funds within its Expense Group.
DelawareTax-Free USA Fund – The expense comparisons for the Fund showed that its actual management fee was in the quartile with the lowest expenses of its Expense Group and its total expenses were in the quartile with the second lowest expenses of its Expense Group. The Board was
126
Table of Contents
satisfied with the management fee and total expenses of the Fund in comparison to those of its Expense Group as shown in the Broadridge report.
DelawareTax-Free USA Intermediate Fund – The expense comparisons for the Fund showed that its actual management fee and total expenses were in the quartile with the second lowest expenses of its Expense Group. The Board was satisfied with the management fee and total expenses of the Fund in comparison to those of its Expense Group as shown in the Broadridge report.
Delaware National High-Yield Municipal Bond Fund – The expense comparisons for the Fund showed that its actual management fee was in the quartile with the lowest expenses of its Expense Group and its total expenses were in the quartile with the second highest expenses of its Expense Group. The Board gave favorable consideration to the Fund’s management fee but noted that the Fund’s total expenses were not in line with the Board’s objective. In evaluating the total expenses, the Board considered fee waivers in place through December 2019 and various initiatives implemented by Management, such as the negotiation of lower fees for fund accounting, fund accounting oversight, and custody services, which had created an opportunity for a further reduction in expenses. The Board was satisfied with Management’s efforts to improve the Fund’s total expense ratio and to bring it in line with the Board’s objective.
Management profitability.The Board considered the level of profits realized by DMC in connection with the operation of the Funds. In this respect, the Board reviewed the Investment Management Profitability Analysis that addressed the overall profitability of DMC’s business in providing management and other services to each of the individual funds and the Delaware Funds as a whole. Specific attention was given to the methodology used by DMC in allocating costs for the purpose of determining profitability. Management stated that the level of profits of DMC, to a certain extent, reflects recent operational cost savings and efficiencies initiated by DMC. The Board considered DMC’s efforts to improve services provided to Fund shareholders and to meet additional regulatory and compliance requirements resulting from recent industry-wide Securities and Exchange Commission initiatives. The Board also considered the extent to which DMC might derive ancillary benefits from fund operations, including the potential for procuring additional business as a result of the prestige and visibility associated with its role as service provider to the Delaware Funds and the benefits from allocation of fund brokerage to improve trading efficiencies. As part of its work, the Board also reviewed a report prepared by JDL regarding MIMBT profitability as compared to certain peer fund complexes and the Independent Trustees discussed with JDL personnel regarding DMC’s profitability in such context. The Board found that the management fees were reasonable in light of the services rendered and the level of profitability of DMC.
Economies of scale.The Trustees considered whether economies of scale are realized by DMC as each Fund’s assets increase and the extent to which any economies of scale are reflected in the level of management fees charged. The Trustees reviewed each Fund’s advisory fee pricing and structure, approved by the Board and shareholders, which includes breakpoints, and which applies to most funds in the Delaware Funds complex. Breakpoints in the advisory fee occur when the advisory fee rate is reduced on assets in excess of specified levels. Breakpoints result in a lower advisory fee than would otherwise be the case in the absence of breakpoints, when the asset levels specified in the breakpoints are exceeded. The Board noted that, as of March 31, 2019, each of DelawareTax-Free USA Fund’s and DelawareTax-Free USA Intermediate Fund’s assets exceeded the first breakpoint level. The Board also
127
Table of Contents
Other Fund information (Unaudited)
Delaware Funds® by Macquarie nationaltax-free funds
Board consideration of Investment Advisory agreements for DelawareTax-Free USA Fund, DelawareTax-Free USA Intermediate Fund, and Delaware National High-Yield Municipal Bond Fund at a meeting held on August21-22, 2019 (continued)
noted that, as of March 31, 2019, Delaware National High-Yield Municipal Bond Fund’s assets exceeded the second breakpoint level. The Board believed that, given the extent to which economies of scale might be realized by DMC and its affiliates, the schedule of fees under the Investment Management Agreement provides a sharing of benefits with the Funds and their shareholders.
128
Table of Contents
This page intentionally left blank.
Table of Contents
Board of trustees / directors and officers addendum
Delaware Funds®by Macquarie
A mutual fund is governed by a Board of Trustees/Directors (“Trustees”), which has oversight responsibility for the management of a fund’s business affairs. Trustees establish procedures and oversee and review the performance of the investment manager, the distributor, and others who perform services for the fund. The independent fund trustees, in particular, are advocates
Name, Address, and Birth Date | Position(s) Held with Fund(s) | Length of Time Served | ||
Interested Trustee
| ||||
| Shawn K. Lytle1 | President, | President and | ||
| 2005 Market Street | Chief Executive Officer, | Chief Executive Officer | ||
| Philadelphia, PA 19103 | and Trustee | since August 2015 | ||
| February 1970 | ||||
| Trustee since | ||||
| September 2015 | |||
Independent Trustees
| ||||
| Thomas L. Bennett | Chair and Trustee | Trustee since | ||
| 2005 Market Street | March 2005 | |||
| Philadelphia, PA 19103 | ||||
| October 1947 | Chair since | |||
| March 2015 | ||||
| Jerome D. Abernathy | Trustee | Since January 2019 | ||
| 2005 Market Street | ||||
| Philadelphia, PA 19103 | ||||
| July 1959 | ||||
| ||||
| Ann D. Borowiec | Trustee | Since March 2015 | ||
| 2005 Market Street | ||||
| Philadelphia, PA 19103 | ||||
| November 1958 | ||||
|
| 1 | Shawn K. Lytle is considered to be an “Interested Trustee” because he is an executive officer of the Fund’s(s’) investment advisor. |
130
Table of Contents
for shareholder interests. Each trustee has served in that capacity since he or she was elected to or appointed to the Board of Trustees, and will continue to serve until his or her retirement or the election of a new trustee in his or her place. The following is a list of the Trustees and Officers with certain background and related information.
Principal Occupation(s) During the Past Five Years | Number of Portfolios in Fund Complex Overseen by Trustee or Officer | Other Directorships Held by Trustee or Officer | ||
| ||||
| President — Macquarie | 59 | Trustee — UBS | ||
| Investment Management2 | Relationship Funds, | |||
| (June 2015–Present) | SMA Relationship | |||
| Trust, and UBS Funds | ||||
| Regional Head of | (May 2010–April 2015) | |||
| Americas — UBS Global | ||||
| Asset Management | ||||
(April 2010–May 2015)
| ||||
| ||||
| Private Investor | 59 | None | ||
(March 2004–Present)
| ||||
| Managing Member, | 59 | None | ||
| Stonebrook Capital | ||||
Management, LLC (financial technology: macro factors and databases) | ||||
(January 1993–Present)
| ||||
| Chief Executive Officer, | 59 | Director — | ||
| Private Wealth Management | Banco Santander International | |||
| (2011–2013) and | (October 2016–Present) | |||
| Market Manager, | ||||
| New Jersey Private | Director — | |||
| Bank (2005–2011) — | Santander Bank, N.A. | |||
J.P. Morgan Chase & Co.
| (December 2016–Present)
| |||
| 2 | Macquarie Investment Management is the marketing name for Macquarie Management Holdings, Inc. and its subsidiaries, including the Fund’s(s’) investment advisor, principal underwriter, and its transfer agent. |
131
Table of Contents
Board of trustees / directors and officers addendum
Delaware Funds®by Macquarie
| Name, Address, | Position(s) | Length of | ||
| and Birth Date | Held with Fund(s) | Time Served | ||
Independent Trustees (continued)
| ||||
| Joseph W. Chow | Trustee | Since January 2013 | ||
| 2005 Market Street | ||||
| Philadelphia, PA 19103 | ||||
January 1953
| ||||
| John A. Fry | Trustee | Since January 2001 | ||
| 2005 Market Street | ||||
| Philadelphia, PA 19103 | ||||
May 1960
| ||||
| Lucinda S. Landreth | Trustee | Since March 2005 | ||
| 2005 Market Street | ||||
| Philadelphia, PA 19103 | ||||
June 1947
| ||||
132
Table of Contents
Principal Occupation(s) During the Past Five Years | Number of Portfolios in Fund Complex Overseen by Trustee or Officer | Other Directorships Held by Trustee or Officer | ||
| ||||
| Private Investor | 59 | Director and Audit Committee | ||
| (April 2011–Present) | Member — Hercules | |||
| Technology Growth | ||||
| Capital, Inc. | ||||
(July 2004–July 2014)
| ||||
| President — | 59 | Director; Compensation | ||
| Drexel University | Committee and | |||
| (August 2010–Present) | Governance Committee | |||
| Member — Community | ||||
| President — | Health Systems | |||
| Franklin & Marshall College | (May 2004–present) | |||
| (July 2002–June 2010) | ||||
| Director — Drexel | ||||
| Morgan & Co. | ||||
| (2015–present) | ||||
| Director and Audit Committee | ||||
| Member — vTv | ||||
| Therapeutics Inc. | ||||
| (2017–present) | ||||
| Director and Audit Committee | ||||
| Member — FS Credit Real | ||||
| Estate Income Trust, Inc. | ||||
(2018–present)
| ||||
| Private Investor | 59 | None | ||
(2004–Present)
| ||||
133
Table of Contents
Board of trustees / directors and officers addendum
Delaware Funds®by Macquarie
| Name, Address, | Position(s) | Length of | ||
| and Birth Date | Held with Fund(s) | Time Served | ||
Independent Trustees (continued)
| ||||
| Frances A. Sevilla-Sacasa | Trustee | Since September 2011 | ||
| 2005 Market Street | ||||
| Philadelphia, PA 19103 | ||||
January 1956
| ||||
| Thomas K. Whitford | Trustee | Since January 2013 | ||
| 2005 Market Street | ||||
| Philadelphia, PA 19103 | ||||
March 1956
| ||||
134
Table of Contents
| Number of Portfolios in | ||||
| Principal Occupation(s) | Fund Complex Overseen | Other Directorships | ||
| During the Past Five Years | by Trustee or Officer | Held by Trustee or Officer | ||
| ||||
| Private Investor | 59 | Trust Manager and | ||
| (January 2017–Present) | Audit Committee | |||
| Chair — Camden | ||||
| Chief Executive Officer — | Property Trust | |||
| Banco Itaú | (August 2011–Present) | |||
| International | ||||
| (April 2012–December 2016) | Director; Audit | |||
| Committee Member — | ||||
| Executive Advisor to Dean | Carrizo Oil & Gas, Inc. | |||
| (August 2011–March 2012) | (March 2018–Present) | |||
| and Interim Dean | ||||
| (January 2011–July 2011) — | ||||
| University of Miami School of | ||||
| Business Administration | ||||
| President — U.S. Trust, | ||||
| Bank of America Private | ||||
| Wealth Management | ||||
| (Private Banking) | ||||
| (July 2007–December 2008) | ||||
| Vice Chairman | 59 | Director — HSBC North | ||
| (2010–April 2013) — | America Holdings Inc. | |||
| PNC Financial | (December 2013–Present) | |||
| Services Group | ||||
| Director — HSBC USA Inc. | ||||
| (July 2014–Present) | ||||
| Director — | ||||
| HSBC Bank USA, | ||||
| National Association | ||||
| (July 2014–March 2017) | ||||
| Director — HSBC | ||||
| Finance Corporation | ||||
(December 2013–April 2018)
| ||||
135
Table of Contents
Board of trustees / directors and officers addendum
Delaware Funds®by Macquarie
Name, Address, and Birth Date | Position(s) Held with Fund(s) | Length of Time Served | ||
Independent Trustees (continued)
| ||||
| Christianna Wood | Trustee | Since January 2019 | ||
| 2005 Market Street | ||||
| Philadelphia, PA 19103 | ||||
August 1959
| ||||
136
Table of Contents
Principal Occupation(s) During the Past Five Years | Number of Portfolios in Fund Complex Overseen by Trustee or Officer | Other Directorships Held by Trustee or Officer | ||
| ||||
| Chief Executive Officer | 59 | Director; Finance Committee | ||
| and President — | and Audit Committee | |||
| Gore Creek | Member — H&R | |||
| Capital, Ltd. | Block Corporation | |||
| (August 2009–Present) | (July 2008–Present) | |||
| Director; Chair of Investments | ||||
| Committee and Audit | ||||
| Committee Member — | ||||
| Grange Insurance | ||||
| (2013–Present) | ||||
| Trustee; Chair of | ||||
| Nominating and Governance | ||||
| Committee and Audit | ||||
| Committee Member — | ||||
| The Merger Fund | ||||
| (2013–Present), | ||||
| The Merger Fund VL | ||||
| (2013-Present), | ||||
| WCM Alternatives: | ||||
| Event-Driven Fund | ||||
| (2013–Present), | ||||
| and WCM Alternatives: | ||||
| Credit Event Fund | ||||
| (December 2017–Present) | ||||
| Director; Chair of | ||||
| Governance Committee | ||||
| and Audit Committee | ||||
| Member — International | ||||
| Securities Exchange | ||||
| (2010–2016) | ||||
137
Table of Contents
Board of trustees / directors and officers addendum
Delaware Funds®by Macquarie
| Name, Address, | Position(s) | Length of | ||
| and Birth Date | Held with Fund(s) | Time Served | ||
Independent Trustees (continued)
| ||||
| Janet L. Yeomans | Trustee | Since April 1999 | ||
| 2005 Market Street | ||||
| Philadelphia, PA 19103 | ||||
July 1948
| ||||
Officers
| ||||
| David F. Connor | Senior Vice President, | Senior Vice President since | ||
| 2005 Market Street | General Counsel, | May 2013; General | ||
| Philadelphia, PA 19103 | and Secretary | Counsel since May 2015; | ||
| December 1963 | Secretary since | |||
October 2005
| ||||
| Daniel V. Geatens | Vice President | Vice President and | ||
| 2005 Market Street | and Treasurer | Treasurer since October 2007 | ||
| Philadelphia, PA 19103 | ||||
October 1972
| ||||
| Richard Salus | Senior Vice President | Senior Vice President and | ||
| 2005 Market Street | and Chief Financial Officer | Chief Financial Officer | ||
| Philadelphia, PA 19103 | since November 2006 | |||
October 1963
| ||||
The Statement of Additional Information for the Fund(s) includes additional information about the Trustees and Officers and is available, without charge, upon request by calling 800523-1918.
138
Table of Contents
Principal Occupation(s) During the Past Five Years | Number of Portfolios in Fund Complex Overseen by Trustee or Officer | Other Directorships Held by Trustee or Officer | ||
| ||||
| Vice President and Treasurer | 59 | Director; Personnel and | ||
| (January 2006–July 2012), | Compensation Committee | |||
| Vice President — | Chair; Member of Nominating, | |||
| Mergers & Acquisitions | Investments, and Audit | |||
| (January 2003–January 2006), | Committees for various | |||
| and Vice President | periods throughout | |||
| and Treasurer | directorship — | |||
| (July 1995–January 2003) — | Okabena Company | |||
| 3M Company | (2009–2017) | |||
| ||||
| David F. Connor has served | 59 | None3 | ||
| in various capacities at | ||||
| different times at | ||||
| Macquarie Investment | ||||
Management.
| ||||
| Daniel V. Geatens has served | 59 | None3 | ||
| in various capacities at | ||||
| different times at | ||||
| Macquarie Investment | ||||
Management.
| ||||
| Richard Salus has served | 59 | None3 | ||
| in various capacities | ||||
| at different times at | ||||
| Macquarie Investment | ||||
Management.
| ||||
| 3 | David F. Connor, Daniel V. Geatens, and Richard Salus serve in similar capacities for the six portfolios of the Optimum Fund Trust, which have the same investment advisor, principal underwriter, and transfer agent as the registrant. Mr. Geatens also serves as the Chief Financial Officer and Treasurer for Macquarie Global Infrastructure Total Return Fund Inc., which has an affiliated investment manager. |
139
Table of Contents
Board of trustees
Shawn K. Lytle President and Chief Executive Officer Delaware Funds® by Macquarie Philadelphia, PA
Thomas L. Bennett Chairman of the Board Delaware Funds by Macquarie Private Investor Rosemont, PA
Jerome D. Abernathy Managing Member Stonebrook Capital Management, LLC Jersey City, NJ
Affiliated officers
David F. Connor Senior Vice President, General Counsel, and Secretary Delaware Funds by Macquarie Philadelphia, PA | Ann D. Borowiec Former Chief Executive Officer Private Wealth Management J.P. Morgan Chase & Co. New York, NY
Joseph W. Chow Former Executive Vice President State Street Corporation Boston, MA
John A. Fry President Drexel University Philadelphia, PA
Daniel V. Geatens Vice President and Treasurer Delaware Funds by Macquarie Philadelphia, PA | Lucinda S. Landreth Former Chief Investment Officer Assurant, Inc. New York, NY
Frances A. Sevilla-Sacasa Former Chief Executive Officer Banco Itaú International Miami, FL
Richard Salus Senior Vice President and Chief Financial Officer Delaware Funds by Macquarie Philadelphia, PA | Thomas K. Whitford Former Vice Chairman PNC Financial Services Group Pittsburgh, PA
Christianna Wood Chief Executive Officer and President Gore Creek Capital, Ltd. Golden, CO
Janet L. Yeomans Former Vice President and Treasurer 3M Company St. Paul, MN |
This annual report is for the information of DelawareTax-Free USA Fund, DelawareTax-Free USA Intermediate Fund, and Delaware National High-Yield Municipal Bond Fund shareholders, but it may be used with prospective investors when preceded or accompanied by the Delaware Fund fact sheet for the most recently completed calendar quarter. These documents are available at delawarefunds.com/literature.
Each Fund files its complete schedule of portfolio holdings with the Securities and Exchange Commission (SEC) for the first and third quarters of each fiscal year on FormN-Q or FormN-PORT (available for filings after March 31, 2019). Each Fund’s FormsN-Q or FormsN-PORT, as well as a description of the policies and procedures that the Funds use to determine how to vote proxies (if any) relating to portfolio securities, are available without charge (i) upon request, by calling 800523-1918; and (ii) on the SEC’s website at sec.gov. In addition, a description of the policies and procedures that the Funds use to determine how to vote proxies (if any) relating to portfolio securities and the Schedules of Investments included in the Funds’ most recent FormN-Q or FormN-PORT are available without charge on the Funds’ website at delawarefunds.com/literature. Each Fund’s FormsN-Q and FormsN-PORT may be reviewed and copied at the SEC’s Public Reference Room in Washington, D.C.; information on the operation of the Public Reference Room may be obtained by calling 800SEC-0330.
Information (if any) regarding how the Funds voted proxies relating to portfolio securities during the most recently disclosed12-month period ended June 30 is available without charge (i) through the Funds’ website at delawarefunds.com/proxy; and (ii) on the SEC’s website at sec.gov.
140
Table of Contents
 |  |
Annual report
Fixed income mutual funds
DelawareTax-Free Arizona Fund
DelawareTax-Free California Fund
DelawareTax-Free Colorado Fund
DelawareTax-Free Idaho Fund
DelawareTax-Free New York Fund
DelawareTax-Free Pennsylvania Fund
August 31, 2019
Beginning on or about June 1, 2021, as permitted by regulations adopted by the Securities and Exchange Commission, paper copies of your Fund’s shareholder reports will no longer be sent to you by mail, unless you specifically request them from the Fund or from your financial intermediary, such as a broker/dealer, bank, or insurance company. Instead, you will be notified by mail each time a report is posted on the website and provided with a link to access the report.
If you already elected to receive shareholder reports electronically, you will not be affected by this change and you do not need to take any action. You may elect to receive shareholder reports and other communications from the Fund electronically by signing up at delawarefunds.com/edelivery. If you own these shares through a financial intermediary, you may contact your financial intermediary.
You may elect to receive paper copies of all future shareholder reports free of charge. You can inform the Fund that you wish to continue receiving paper copies of your shareholder reports by contacting us at 800523-1918. If you own these shares through a financial intermediary, you may contact your financial intermediary to elect to continue to receive paper copies of your shareholder reports. Your election to receive reports in paper will apply to all funds held with the Delaware Funds® by Macquarie or your financial intermediary.
|
Carefully consider the Funds’ investment objectives, risk factors, charges, and expenses before investing. This and other information can be found in the Funds’ prospectus and their summary prospectuses, which may be obtained by visiting delawarefunds.com/literature or calling 800523-1918. Investors should read the prospectus and the summary prospectus carefully before investing.
You can obtain shareholder reports and prospectuses online instead of in the mail.
Visit delawarefunds.com/edelivery.
Table of Contents
Experience Delaware Funds®by Macquarie
Macquarie Investment Management (MIM) is a global asset manager with offices throughout the United States, Europe, Asia, and Australia. As active managers we prioritize autonomy and accountability at the investment team level in pursuit of opportunities that matter for clients. Delaware Funds is one of the longest-standing mutual fund families, with more than 80 years in existence.
If you are interested in learning more about creating an investment plan, contact your financial advisor.
You can learn more about Delaware Funds or obtain a prospectus for DelawareTax-Free Arizona Fund, DelawareTax-Free California Fund, DelawareTax-Free Colorado Fund, DelawareTax-Free Idaho Fund, DelawareTax-Free New York Fund, and DelawareTax-Free Pennsylvania Fund at delawarefunds.com/literature.
Manage your account online
| ● | Check your account balance and transactions |
| ● | View statements and tax forms |
| ● | Make purchases and redemptions |
Visit delawarefunds.com/account-access.
Macquarie Asset Management (MAM) offers a diverse range of products including securities investment management, infrastructure and real asset management, and fund and equity-based structured products. MIM is the marketing name for certain companies comprising the asset management division of Macquarie Group. This includes the following investment advisers: Macquarie Investment Management Business Trust (MIMBT), Delaware Capital Management Advisers, Inc., Macquarie Funds Management Hong Kong Limited, Macquarie Investment Management Austria Kapitalanlage AG, Macquarie Investment Management Global Limited, Macquarie Investment Management Europe Limited, Macquarie Capital Investment Management LLC, and Macquarie Investment Management Europe S.A.
The Funds are distributed byDelaware Distributors, L.P. (DDLP), an affiliate of MIMBT and Macquarie Group Limited.
Other than Macquarie Bank Limited (MBL), none of the entities noted are authorized deposit-taking institutions for the purposes of the Banking Act 1959 (Commonwealth of Australia). The obligations of these entities do not represent deposits or other liabilities of MBL. MBL does not guarantee or otherwise provide assurance in respect of the obligations of these entities, unless noted otherwise. The Funds are governed by US laws and regulations.
| Table of contents | ||||
| 1 | ||||
| 9 | ||||
| 34 | ||||
| 38 | ||||
| 44 | ||||
| 94 | ||||
| 98 | ||||
| 100 | ||||
| 112 | ||||
| 148 | ||||
| 165 | ||||
| 166 | ||||
| 172 | ||||
| 182 | ||||
Unless otherwise noted, views expressed herein are current as of Aug. 31, 2019, and subject to change for events occurring after such date.
The Funds are not FDIC insured and are not guaranteed. It is possible to lose the principal amount invested.
Advisory services provided by Delaware Management Company, a series of MIMBT, a US registered investment advisor.
All third-party marks cited are the property of their respective owners.
© 2019 Macquarie Management Holdings, Inc.
Table of Contents
| Portfolio management review | ||
| Delaware Funds® by Macquarie statetax-free funds | September 10, 2019 | |
Performance preview (for the year ended August 31, 2019) | ||||||||
| DelawareTax-Free Arizona Fund (Institutional Class shares) | 1-year return | +7.78 | % | |||||
| DelawareTax-Free Arizona Fund (Class A shares) | 1-year return | +7.51 | % | |||||
| Bloomberg Barclays Municipal Bond Index (benchmark) | 1-year return | +8.72 | % | |||||
| Lipper Other States Municipal Debt Funds Average | 1-year return | +7.24 | % |
Past performance does not guarantee future results.
For complete, annualized performance for DelawareTax-Free Arizona Fund, please see the table on page 9.
Institutional Class shares are not subject to a sales charge and are offered for sale exclusively to certain eligible investors. In addition, Institutional Class shares pay no distribution and service fee.
The performance of Class A shares excludes the applicable sales charge. Both Institutional Class shares and Class A shares reflect the reinvestment of all distributions.
The Lipper Other States Municipal Debt Funds Average compares funds that limit assets to those securities that are exempt from taxation on a specified city or state basis.
Please see page 12 for a description of the index. Index performance returns do not reflect any management fees, transaction costs, or expenses. Indices are unmanaged and one cannot invest directly in an index.
DelawareTax-Free California Fund (Institutional Class shares) | 1-year return | +8.25 | % | |||||
DelawareTax-Free California Fund (Class A shares) | 1-year return | +7.99 | % | |||||
Bloomberg Barclays Municipal Bond Index (benchmark) | 1-year return | +8.72 | % | |||||
Lipper California Municipal Debt Funds Average | 1-year return | +8.24 | % |
Past performance does not guarantee future results.
For complete, annualized performance for DelawareTax-Free California Fund, please see the table on page 13.
Institutional Class shares are not subject to a sales charge and are offered for sale exclusively to certain eligible investors. In addition, Institutional Class shares pay no distribution and service fee.
The performance of Class A shares excludes the applicable sales charge. Both Institutional Class shares and Class A shares reflect the reinvestment of all distributions.
The Lipper California Municipal Debt Funds Average compares funds that invest primarily in municipal debt issues that are exempt from taxation in California. Please see page 16 for a description of the index. Index performance returns do not reflect any management fees, transaction costs, or expenses. Indices are unmanaged and one cannot invest directly in an index.
DelawareTax-Free Colorado Fund (Institutional Class shares) | 1-year return | +7.74 | % | |||||
DelawareTax-Free Colorado Fund (Class A shares) | 1-year return | +7.48 | % | |||||
Bloomberg Barclays Municipal Bond Index (benchmark) | 1-year return | +8.72 | % | |||||
Lipper Other States Municipal Debt Funds Average | 1-year return | +7.24 | % |
Past performance does not guarantee future results.
For complete, annualized performance for DelawareTax-Free Colorado Fund, please see the table on page 17.
Institutional Class shares are not subject to a sales charge and are offered for sale exclusively to certain eligible investors. In addition, Institutional Class shares pay no distribution and service fee.
The performance of Class A shares excludes the applicable sales charge. Both Institutional Class shares and Class A shares reflect the reinvestment of all distributions.
The Lipper Other States Municipal Debt Funds Average compares funds that limit assets to those securities that are exempt from taxation on a specified city or state basis.
Please see page 20 for a description of the index. Index performance returns do not reflect any management fees, transaction costs, or expenses. Indices are unmanaged and one cannot invest directly in an index.
1
Table of Contents
Portfolio management review
Delaware Funds® by Macquarie statetax-free funds
DelawareTax-Free Idaho Fund (Institutional Class shares) | 1-year return | +7.46 | % | |||||
DelawareTax-Free Idaho Fund (Class A shares) | 1-year return | +7.19 | % | |||||
Bloomberg Barclays Municipal Bond Index (benchmark) | 1-year return | +8.72 | % | |||||
Lipper Other States Municipal Debt Funds Average | 1-year return | +7.24 | % |
Past performance does not guarantee future results.
For complete, annualized performance for DelawareTax-Free Idaho Fund, please see the table on page 21.
Institutional Class shares are not subject to a sales charge and are offered for sale exclusively to certain eligible investors. In addition, Institutional Class shares pay no distribution and service fee.
The performance of Class A shares excludes the applicable sales charge. Both Institutional Class shares and Class A shares reflect the reinvestment of all distributions.
The Lipper Other States Municipal Debt Funds Average compares funds that limit assets to those securities that are exempt from taxation on a specified city or state basis.
Please see page 24 for a description of the index. Index performance returns do not reflect any management fees, transaction costs, or expenses. Indices are unmanaged and one cannot invest directly in an index.
DelawareTax-Free New York Fund (Institutional Class shares) | 1-year return | +8.17 | % | |||||
DelawareTax-Free New York Fund (Class A shares) | 1-year return | +8.00 | % | |||||
Bloomberg Barclays Municipal Bond Index (benchmark) | 1-year return | +8.72 | % | |||||
Lipper New York Municipal Debt Funds Average | 1-year return | +8.24 | % |
Past performance does not guarantee future results.
For complete, annualized performance for DelawareTax-Free New York Fund, please see the table on page 25.
Institutional Class shares are not subject to a sales charge and are offered for sale exclusively to certain eligible investors. In addition, Institutional Class shares pay no distribution and service fee.
The performance of Class A shares excludes the applicable sales charge. Both Institutional Class shares and Class A shares reflect the reinvestment of all distributions.
The Lipper New York Municipal Debt Funds Average compares funds that invest primarily in municipal debt issues that are exempt from taxation in New York.
Please see page 28 for a description of the index. Index performance returns do not reflect any management fees, transaction costs, or expenses. Indices are unmanaged and one cannot invest directly in an index.
DelawareTax-Free Pennsylvania Fund (Institutional Class shares) | 1-year return | +8.12 | % | |||||
DelawareTax-Free Pennsylvania Fund (Class A shares) | 1-year return | +7.72 | % | |||||
Bloomberg Barclays Municipal Bond Index (benchmark) | 1-year return | +8.72 | % | |||||
Lipper Pennsylvania Municipal Debt Funds Average | 1-year return | +7.86 | % |
Past performance does not guarantee future results.
For complete, annualized performance for DelawareTax-Free Pennsylvania Fund, please see the table on page 29.
Institutional Class shares are not subject to a sales charge and are offered for sale exclusively to certain eligible investors. In addition, Institutional Class shares pay no distribution and service fee.
The performance of Class A shares excludes the applicable sales charge. Both Institutional Class shares and Class A shares reflect the reinvestment of all distributions.
The Lipper Pennsylvania Municipal Debt Funds Average compares funds that invest primarily in municipal debt issues that are exempt from taxation in Pennsylvania.
Please see page 33 for a description of the index. Index performance returns do not reflect any management fees, transaction costs, or expenses. Indices are unmanaged and one cannot invest directly in an index.
2
Table of Contents
Economic backdrop
Throughout the fiscal year ended Aug. 31, 2019, the US economy grew, albeit at a moderating pace, reflecting mounting concerns about trade conflict with China. In the third quarter of 2018, US gross domestic product (GDP) – a measure of national economic output – rose by an annualized 2.9%, down from the previous quarter. Growth slowed to 1.1% in the final three months of 2018 before bouncing back to 3.1% in the first quarter of 2019. In the second quarter of 2019, the country’s GDP rose an estimated 2.0%.
Against this backdrop of economic expansion, job growth also remained strong. In August 2019, the US unemployment rate stood at 3.7%, matching its level one year earlier and close to the nearly50-year low of 3.6% achieved in both April and May 2019.
When the fiscal year began in September 2018, the US Federal Reserve continued to raise its short-term target interest rate, maintaining a cycle that had been in place since 2015. In September and again in December 2018, the Fed lifted the federal funds rate by 0.25 percentage points. As data mounted suggesting a slowing US economy, however, the Fed adjusted its policy direction – initially, by no longer raising rates and then, in June 2019, reversing its rate increase from December. By the end of the Funds’ fiscal year on Aug. 31, 2019, the federal funds rate was within a range of 2.00% to 2.25%. Investors widely anticipated that the Fed would enact further rate cuts at its meetings later in 2019.
Sources: US Bureau of Economic Analysis, US Bureau of Labor Statistics, and Bloomberg.
Municipal bond market conditions
Uncertainty about trade policy led to uncertainty about future global growth, encouraging global central banks to implement increasingly stimulative economic policies. This led to a highly favorable backdrop for municipal debt, particularly
as the Funds’ fiscal year progressed. The US municipal bond market, as measured by the Bloomberg Barclays Municipal Bond Index, returned 8.72% for the 12 months ended Aug. 31, 2019.
As rates on longer-term bonds fell more than those on shorter-term issues, the municipal yield curve flattened. The largest yield declines came from the “belly” of the municipal yield curve, while the strongest overall performance came from the20-year(17-22 years) and the long bond (22+ years) segments of the curve. Meanwhile, credit spreads tightened, indicating that investors were willing to accept somewhat less yield in exchange for assuming credit risk in an environment of generally healthy credit fundamentals.
Lower-rated bonds generally outperformed their higher-rated counterparts, while bonds with longer maturities tended to outpace those with shorter maturities. The following tables highlight these performance trends for the Funds’ fiscal year ended Aug. 31, 2019:
Returns by credit rating | ||||
AAA | 8.17 | % | ||
AA | 8.37 | % | ||
A | 9.20 | % | ||
BBB | 10.48 | % | ||
Returns by maturity | ||||
1 year | 2.65 | % | ||
5 years | 6.34 | % | ||
10 years | 9.48 | % | ||
22+ years | 11.14 | % | ||
Source: Bloomberg.
Economic backdrop in the states
Arizona’seconomy continues to recover from the last recession, with growth in the construction and manufacturing sectors. The state’s nonfarm employment increased by 2.5% from the previous year and totaled 2.93 million in July 2019. The
3
Table of Contents
Portfolio management review
Delaware Funds® by Macquarie statetax-free funds
unemployment rate has remained high compared with the national average (3.7%) and was 4.9% in July 2019. Per capita personal income is 15% below the national average. General Fund revenues totaled $11.2 billion in fiscal year 2019, 11.2% higher than the previous fiscal year and 3.1% above the forecast. Sales and use tax receipts increased 6.5%, income tax collections rose 10.2%, and corporate tax receipts grew by 37.9% during fiscal year 2019. The General Fund operating balance grew to $3.6 billion in fiscal year 2019 and the Budget Stabilization Fund increased to $811 million as of July 2019. The state legislature enacted a $11.9 billion General Fund budget for fiscal year 2020, up 11.0% from the prior fiscal year. Spending for education and for health and human services are budgeted to increase by 6.9% and 10.9%, respectively. (Sources: bls.gov, bea.gov, ncsl.org, Arizona Office of Strategic Planning Budgeting, Arizona Joint Legislative Budget Committee.)
Californiabenefits from a large and highly diverse economy, with real GDP of $2.9 trillion, which ranks it as the fifth largest economy in the world. Nonfarm employment grew by 1.8% year over year and totaled 17.47 million in July 2019. The unemployment rate remained level at 4.2% in July 2019, weaker than the national average of 3.7%. The state’s per capita income remained strong at 6% above the national average. General Fund revenues rose by 6.5% year over year and totaled $144.8 billion in fiscal year 2019. Personal income taxes totaled $99.0 billion in fiscal year 2019, 0.5% above forecasts. Sales and use tax collections totaled $27.1 billion in fiscal year 2019, 0.6% above forecasts. Corporate tax collections totaled $13.8 billion in fiscal year 2019, 1.3% above estimates. California finished fiscal year 2019 with a $6.8 billion General Fund balance and a $14.4 billion Budget Stabilization Fund. The state legislature enacted a General Fund budget of $147.8 billion for fiscal year 2020, a 3.6% year-over-year increase. General Fund revenues are
expected to increase by 3.1% and total $146.0 billion in fiscal year 2020, with personal income taxes rising 4.2%, sales and use collections increasing 4.4%, and corporate tax receipts decreasing 4.7%. The state is expected to end fiscal year 2020 with a General Fund balance of $2.8 billion and a Budget Stabilization Fund of $16.5 billion. (Sources: bls.gov, bea.gov, ncsl.org, ebudget.ca.gov.)
Coloradohas a large, diverse, and growing economy, with per capita income levels 3% above the national average. The state’s nonfarm employment increased by 1.9% year over year and totaled 2.78 million as of July 2019. The unemployment rate in July 2019 was 2.9%, much lower than the national average of 3.7%. General Fund revenues are estimated to be $12.6 billion in fiscal year 2019, a projected 7.1% above the prior fiscal year. Individual income tax receipts are expected to grow 8.3%, while sales taxes and corporate tax collections are expected to rise by 4.7% and 23.3%, respectively. The General Fund reserve for fiscal year 2019 is projected to be $439 million above its statutory requirement of 7.25% of appropriations. The fiscal year 2020 General Fund budget totals $12.2 million, a 6.8% increase from fiscal year 2019. Income taxes are expected to increase 6.7%, sales tax collections are projected to grow 5.1%, and corporate tax collections are expected to decrease 1.7%. The General Fund reserve for fiscal year 2020 is projected to be $275 million above the required reserve. (Sources: bls.gov, bea.gov, ncsl.org, Colorado Office of State Planning and Budgeting, Colorado Joint Budget Committee.)
Idaho’seconomy has experienced a slower recovery since the last recession and growth continues to be concentrated in the technology and agriculture sectors. Nonfarm employment totaled 756,500 in July 2019, a 2.8% increase from the prior year. The state’s unemployment rate was 2.9%, lower than the national average of 3.7%. Per capita income levels have remained
4
Table of Contents
weak at 18% below the national average during the most recent measurement period. The state’s General Fund revenues totaled $3.7 billion, 0.4% below the forecast and in line with the prior fiscal year. Individual income tax revenue finished fiscal year 2019 at 6.4% below the forecast, while corporate income tax receipts and sales tax collections outperformed forecasts by 26.9% and 1.4%, respectively. The state legislature enacted a General Fund budget of $3.9 billion, a 7.1% increase from the prior fiscal year. General fund revenues are forecasted to increase by 5.2% in fiscal year 2019 and total $3.9 billion. (Sources: bls.gov, bea.gov, ncsl.org, Idaho Division of Financial Management.)
New Yorkhas a large and diverse economy that is anchored by New York City. Nonfarm employment grew by 1.0% year over year and totaled 9.78 million in July 2019. The unemployment rate was 4.0% in July 2019, slightly higher than the national average of 3.7%. Per capita income levels were 15% above the national average. General Fund tax receipts totaled $70.5 billion in fiscal year 2019, down 1.3% from the prior fiscal year and in line with the updated projections. Personal income taxes totaled $43.0 billion in fiscal year 2019, in line with the updated financial projections. Sales tax revenue totaled $13.4 billion in fiscal year 2019, 0.5% below projections. Corporate taxes totaled $5.9 billion during fiscal year 2019, 1.7% above projections. General Fund expenditures totaled $72.8 billion in fiscal year 2019, 1.1% below the revised forecast. The state finished fiscal year 2019 with a General Fund balance of $7.2 billion, down from $9.4 billion in fiscal year 2018. New York’s Legislature enacted a General Fund budget of $77.9 billion, a 1.7% increase from the prior fiscal year’s budget. Through the first four months of fiscal year 2020, General Fund revenues totaled $29.0 billion, 1.6% above projections. During the same period, General Fund expenditures totaled $29.6 billion, in line with projections. (Sources:
bls.gov, bea.gov, ncsl.org, New York Division of the Budget, Office of the New York State Comptroller.)
Pennsylvania’slarge, diverse economy is anchored by the healthcare and higher education sectors. Nonfarm employment increased by 0.5% year over year and totaled 6.04 million in July 2019. The unemployment rate of 3.9% in July 2019 was slightly above the national average of 3.7%. However, per capita income was 1% above the national average. Pennsylvania finished fiscal year 2019 with General Fund tax collections totaling $34.9 billion, 0.9% above the prior fiscal year. Sales tax receipts and corporate tax collections beat budget projections by 3.2% and 12.9%, respectively, while personal income tax collections were off by 0.6%. The commonwealth made a $317 million deposit into the Budget Stabilization Reserve Fund, following a $22 million deposit during the prior year. The enacted budget for fiscal year 2020 totaled $34.0 billion, a 1.8% increase from fiscal year 2019, and includes increases to education and criminal justice appropriations. (Sources: bls.gov, bea.gov, ncsl.org, Pennsylvania Office of the Budget, Pennsylvania Department of Revenue.)
Focused on credit research
For all six of the Funds highlighted in this report, we maintained the same management strategy we employ in all market conditions. We follow abottom-up (bond by bond) investment approach. This means we select bonds for the Funds on anissuer-by-issuer basis, rather than based on ourtop-down view of interest rates or economic and market conditions. And we rely on diligent credit research to identify securities we believe offer the Funds’ shareholders a favorabletrade-off between risk and reward.
Given this process, the Funds tend to have relatively low allocations to bonds with high credit ratings and greater exposure to securities with
5
Table of Contents
Portfolio management review
Delaware Funds® by Macquarie statetax-free funds
lower-investment-grade or below-investment-grade credit ratings. By focusing on higher yielding bonds with solid underlying credit quality, we believe we can potentially add value for the Funds’ shareholders.
At fiscal year end on Aug. 31, 2019, roughly 40% of the net assets ofDelawareTax-Free Arizona Fundwas invested in bonds with lower-investment-grade credit ratings (A and BBB). Approximately 47% of the net assets ofDelawareTax-Free California Fundwas invested in these same credit tiers, whileDelawareTax-Free Colorado Fund’sholdings in lower-investment-grade bonds totaled about 43% of net assets. Meanwhile,DelawareTax-Free Idaho Fund’sexposure to bonds rated A and BBB was roughly 31% of the portfolio, compared with about 48% and 40%, respectively, forDelawareTax-Free New York FundandDelawareTax-Free Pennsylvania Fund.
All these Funds also maintained allocations to high yield municipal bonds, securities with credit ratings below BBB. By prospectus, the Funds may hold up to 20% of their net assets in high yield debt, although these allocations remained below that threshold in all six Funds throughout the fiscal year. Whenever we invest in the high yield market segment, we thoroughly analyze the securities’ credit risk and emphasize those bonds that we believe offer the Funds’ shareholders a favorable risk-reward balance.
Portfolio positioning
Throughout the fiscal year, our main objective was to maintain the Funds’ existing credit positioning as best we could. Our challenge was that when interest rates fell, the Funds experienced naturally shortening durations, as various longtime portfolio holdings approached their maturity or call dates.
Because our management approach entails keeping the Funds’ duration (that is, interest-rate sensitivity) relatively neutral compared with peer funds – a reflection of our view that we can more
effectively add value through credit selection than by trying to anticipate the direction of interest rate movements – we needed to take proactive steps to maintain that neutral stance in a falling interest rate environment.
When possible, new bond purchases focused on longer-duration bonds, including bonds with longer call dates. We often emphasized areas of the market in which bond issues tend to be noncallable, such as the prepaid gas sector. Proceeds for new purchases came from investment inflows as well as those of bond maturities and calls. Using the proceeds from the sale of certain shorter-duration holdings also helped us keep the Funds neutrally positioned in an environment of falling interest rates, while maintaining the credit-oriented investment approach we regularly follow.
Although we believe we were generally successful in accomplishing our objectives, our ability to do so varied depending on the municipal bond market in each state. In relatively large markets with substantial new issuance, such as California or New York, we found it relatively straightforward. In smaller state markets, however, it was sometimes more of a challenge to maintain a sufficiently long duration. In those cases, we took advantage of the opportunities that were available, while continuing to seek out bonds that would enable us to maintain our management objectives.
Individual performance contributors
As noted, longer-maturity bonds tended to outperform shorter-maturity bonds for the fiscal year, while lower-quality issues generally outperformed their higher-rated counterparts. Such trends are evident as we highlight some of the Funds’ strongest- and weakest-performing securities over the 12 months.
InDelawareTax-Free Arizona Fund, for example, prepaid gas bonds of Salt Verde Financial Corp. were notably strong performers, returning more than 21% for the Fund. In a market
6
Table of Contents
environment favoring lower-rated securities, these bonds benefited from their lower-investment-grade credit rating of BBB+. Their lack of a call date – common in the prepaid gas sector – also helped lift their performance. Bonds of the American Charter Schools Foundation (+15%) also contributed to performance. These securities’ below-investment-grade credit rating of BB+, coupled with their relatively high coupon and long maturity date were desirable characteristics.
Another strong-performing prepaid gas issue helped lift the performance ofDelawareTax-Free California Fund. These bonds, issued byM-S-R Energy Authority, returned close to 19% for the Fund. As with the Salt Verde bonds, these securities were noncallable, while they also benefited from their lower-investment-grade rating and longer maturity date. Charter school bonds for Bella Mente Montessori Academy in Vista, Calif. also added value. Lower credit ratings and longer maturity dates were behind these securities’ 15% total return for the fiscal year.
InDelawareTax-Free Colorado Fund, a prepaid gas bond issue again contributed to performance. Noncallable securities of Public Authority for Colorado Energy were ratedA- by Standard & Poor’s, featured a 2038 maturity date and a 6.5% coupon, and returned more than 18% for the Fund. Denver airport system revenue bonds also outperformed. This debt, maturing in 2048, experienced significant spread tightening during the period and returned more than 15%.
InDelawareTax-Free Idaho Fund, the strongest individual performers werezero-coupon, long-maturity Idaho North Star Charter School bonds, returning 49% for the Fund. These nonrated bonds benefited from their high durations. Another Idaho charter school issue, Compass Public Charter School, gained 16% during the fiscal year.
The leading individual performer inDelawareTax-Free New York Fundwas an issue of the Brighter Choice charter school in Albany, which benefited from a below-investment-grade credit
rating and relatively longer duration. Similarly, an allocation to Montefiore Medical Center hospital bonds also performed well in light of their lower credit quality and longer duration characteristics. Both issues returned 16% for the Fund.
In DelawareTax-Free Pennsylvania Fund, the Fund’s strongest individual performer was a position in corporate-backedtax-exempt industrial development revenue bonds for Procter & Gamble (+15%). Bonds of Avon Grove Charter School in West Grove, Pa., also returned 15%, as these securities benefited from their long maturity date of 2051 and lower-investment-grade credit rating.
Individual performance detractors
Not surprisingly, many of the weakest individual performers across all six portfolios were bonds with short call or maturity dates, high credit quality, or both. InDelawareTax-Free Arizona Fund, for example, the lowest-returning holdings were issues of the City of Phoenix Civic Improvement Corporation and Kirksville College of Osteopathic Medicine. Both bonds returned slightly more than 2% over the past 12 months, primarily reflecting their shorter call dates.
Similarly, inDelawareTax-Free California Fund, shorter-call state general obligation bonds returned less than 2% for the fiscal year, well below the performance of the benchmark. In addition, a position in California tobacco securitization bonds, which declined more than 3%, was a relative underperformer for the Fund’s fiscal year, as tobacco debt lagged, particularly in the first half of the fiscal year, due to weakening industry trends.
ForDelawareTax-Free Colorado Fund, the weakest individual performers included Denver airport system revenue bonds, which returned just +2% as the securities were refunded to a short call date. Sisters of Charity of Leavenworth Health System hospitals also returned 2%, reflecting their relatively short maturities and high credit ratings.
7
Table of Contents
Portfolio management review
Delaware Funds® by Macquarie statetax-free funds
Meanwhile, inDelawareTax-Free Idaho FundandDelawareTax-Free New York Fund, near-term call dates helped explain the subdued returns of the weakest individual performers. In DelawareTax-Free Idaho Fund, these underperformers included St. Luke’s Health System bonds and University of Idaho higher education bonds. In New York, bonds issued by the One Bryant Park office tower in Manhattan and New York City Health and Hospitals Corp. bonds lagged the benchmark. All these securities returned in the 2% range.
InDelawareTax-Free Pennsylvania Fund, the biggest individual underperformers were short-durationpre-refunded bonds of Tower Health Obligated Group and Einstein Medical Center in Montgomery County. In both cases, the bonds returned 2%, hampered by their limited duration in a falling interest rate environment and, in the case of the Tower Health bonds, their relatively high credit quality.
8
Table of Contents
DelawareTax-Free Arizona Fund | August 31, 2019 |
The performance quoted represents past performance and does not guarantee future results. Investment return and principal value of an investment will fluctuate so that shares, when redeemed, may be worth more or less than their original cost. Current performance may be lower or higher than the performance quoted. Performance data current to the most recent month end may be obtained by calling 800523-1918 or visiting delawarefunds.com/performance.
| Fund and benchmark performance1,2 | Average annual total returns through August 31, 2019 | |||||||||||||||
| 1 year | 5 years | 10 years | Lifetime | |||||||||||||
Class A (Est. April 1, 1991) | ||||||||||||||||
Excluding sales charge | +7.51% | +3.73% | +4.33% | +5.24% | ||||||||||||
Including sales charge | +2.67% | +2.78% | +3.86% | +5.07% | ||||||||||||
Class C (Est. May 26, 1994) | ||||||||||||||||
Excluding sales charge | +6.70% | +2.96% | +3.55% | +4.06% | ||||||||||||
Including sales charge | +5.70% | +2.96% | +3.55% | +4.06% | ||||||||||||
Institutional Class (Est. Dec. 31, 2013) | ||||||||||||||||
Excluding sales charge | +7.78% | +3.99% | n/a | +5.17% | ||||||||||||
Including sales charge | +7.78% | +3.99% | n/a | +5.17% | ||||||||||||
Bloomberg Barclays Municipal Bond Index | +8.72% | +3.85% | +4.62% | +4.71%* | ||||||||||||
*The benchmark lifetime return is for Institutional Class share comparison only and is calculated using the last business day in the month of the Fund’s Institutional Class inception date.
1Returns reflect the reinvestment of all distributions and are presented both with and without the applicable sales charges described below. Returns do not reflect the deduction of taxes the shareholder would pay on Fund distributions or redemptions of Fund shares.
Expense limitations were in effect for certain classes during some or all of the periods shown in the “Fund and benchmark performance” table. Expenses for each class are listed on the “Fund expense ratios” table on page 10. Performance would have been lower had expense limitations not been in effect.
Institutional Class shares are not subject to a sales charge and are offered for sale exclusively to certain eligible investors. In addition, Institutional Class shares pay no distribution and service(12b-1) fee.
Class A shares are sold with a maximumfront-end sales charge of 4.50%, and have an annual12b-1 fee of 0.25% of average daily net assets.
Performance for Class A shares, excluding sales charges, assumes that nofront-end sales charge applied.
Class C shares are sold with a contingent deferred sales charge of 1.00% if redeemed during the first 12 months. They are also subject to an annual12b-1 fee of 1.00% of average daily net assets. Performance for Class C shares, excluding sales charges, assumes either that contingent deferred sales charges did not apply or that the investment was not redeemed.
Fixed income securities and bond funds can lose value, and investors can lose principal, as interest rates rise. They also may be affected by economic conditions that hinder an issuer’s ability to make interest and principal payments on its debt.
The Fund may also be subject to prepayment risk, the risk that the principal of a bond that is held by a portfolio will be prepaid prior to maturity, at the time when interest rates are lower than what the
9
Table of Contents
Performance summaries
DelawareTax-Free Arizona Fund
bond was paying. A portfolio may then have to reinvest that money at a lower interest rate.
Funds that invest primarily in one state may be more susceptible to the economic, regulatory, regional, and other factors of that state than geographically diversified funds.
Substantially all dividend income derived fromtax-free funds is exempt from federal income tax. Some income may be subject to state or local and/or the federal alternative minimum tax (AMT) that applies to certain investors. Capital gains, if any, are taxable.
Duration number will change as market conditions change. Therefore, duration should not be solely relied upon to indicate a municipal bond fund’s potential volatility.
This document may mention bond ratings published by nationally recognized statistical
rating organizations (NRSROs) Standard & Poor’s, Moody’s Investors Service, and Fitch, Inc. For securities rated by an NRSRO other than S&P, the rating is converted to the equivalent S&P credit rating. Bonds rated AAA are rated as having the highest quality and are generally considered to have the lowest degree of investment risk. Bonds rated AA are considered to be of high quality, but with a slightly higher degree of risk than bonds rated AAA. Bonds rated A are considered to have many favorable investment qualities, though they are somewhat more susceptible to adverse economic conditions. Bonds rated BBB are believed to be of medium-grade quality and generally riskier over the long term. Bonds rated BB, B, and CCC are regarded as having significant speculative characteristics, with BB indicating the least degree of speculation of the three.
2The Fund’s expense ratios, as described in the most recent prospectus, are disclosed in the following “Fund expense ratios” table. Delaware Management Company has agreed to reimburse certain expenses and/or waive certain fees in order to prevent total annual fund operating expenses (excluding any12b-1 fees, acquired fund fees and expenses, taxes, interest, short sale and dividend and interest expenses, brokerage fees, certain insurance costs, and nonroutine expenses or costs, including, but not limited to, those relating to reorganizations, litigation, conducting shareholder meetings, and liquidations) from exceeding 0.59% of the Fund’s average daily net assets during the period from Sept. 1, 2018 to Aug. 31, 2019.** Please see the most recent prospectus and any applicable supplement(s) for additional information on these fee waivers and/or reimbursements. Please see the “Financial highlights” section in this report for the most recent expense ratios.
| Fund expense ratios | Class A | Class C | Institutional Class | |||||||
Total annual operating expenses | 1.00% | 1.75% | 0.75% | |||||||
(without fee waivers) | ||||||||||
Net expenses | 0.84% | 1.59% | 0.59% | |||||||
(including fee waivers, if any) | ||||||||||
Type of waiver | Contractual | Contractual | Contractual |
**The aggregate contractual waiver period covering this report is from Dec. 29, 2017 through Dec. 28, 2019.
10
Table of Contents
Performance of a $10,000 investment1
Class A shares
Average annual total returns from Aug. 31, 2009 through Aug. 31, 2019
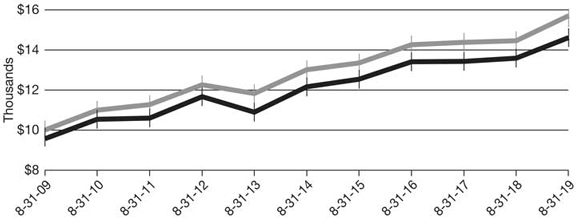
| For period beginning Aug. 31, 2009 through Aug. 31, 2019
| Starting value
| Ending value
| ||||||
| $10,000 | $15,703 | ||||||
| $9,550 | $14,601 | ||||||
 Bloomberg Barclays Municipal Bond Index
 DelawareTax-Free Arizona Fund — Class A shares
Institutional Class shares
Average annual total returns from Dec. 31, 2013 (inception date) through Aug. 31, 2019
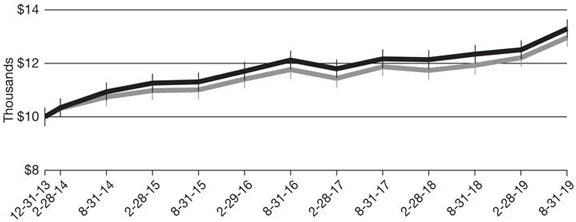
For period beginning Dec. 31, 2013 through Aug. 31, 2019
| Starting value
| Ending value
| ||||||
| $10,000 | $13,304 | ||||||
| $10,000 | $12,977 | ||||||
11
Table of Contents
Performance summaries
DelawareTax-Free Arizona Fund
1The “Performance of a $10,000 investment” graph for Class A shares assumes $10,000 invested in Class A shares of the Fund on Aug. 31, 2009, and includes the effect of a 4.50%front-end sales charge and the reinvestment of all distributions. The graph also assumes $10,000 invested in the Bloomberg Barclays Municipal Bond Index as of Aug. 31, 2009.
The “Performance of a $10,000 investment” graph for Institutional Class shares assumes $10,000 invested in Institutional Class shares of the Fund on Dec. 31, 2013, and includes the reinvestment of all distributions. The graph also assumes $10,000 invested in the Bloomberg Barclays Municipal Bond Index as of Dec. 31, 2013.
The graphs do not reflect the deduction of taxes the shareholders would pay on Fund distributions or redemptions of Fund shares. Expense
limitations were in effect for some or all of the periods shown. Performance would have been lower had expense limitations not been in effect. Expenses are listed in the “Fund expense ratios” table on page 10. Please note additional details on pages 9 through 12.
The Bloomberg Barclays Municipal Bond Index measures the total return performance of the long-term, investment gradetax-exempt bond market.
Index performance returns do not reflect any management fees, transaction costs, or expenses. Indices are unmanaged and one cannot invest directly in an index.Past performance is not a guarantee of future results.
Performance of other Fund classes will vary due to different charges and expenses.
Nasdaq symbols | CUSIPs | |||||
Class A | VAZIX | 928916204 | ||||
Class C | DVACX | 928916501 | ||||
Institutional Class | DAZIX | 928916873 | ||||
| ||||||
12
Table of Contents
| Performance summaries | ||
| DelawareTax-Free California Fund | August 31, 2019 |
The performance quoted represents past performance and does not guarantee future results. Investment return and principal value of an investment will fluctuate so that shares, when redeemed, may be worth more or less than their original cost. Current performance may be lower or higher than the performance quoted. Performance data current to the most recent month end may be obtained by calling 800523-1918 or visiting delawarefunds.com/performance.
| Fund and benchmark performance1,2 | Average annual total returns through August 31, 2019 | |||||||||||||||
| 1 year | 5 years | 10 years | Lifetime | |||||||||||||
Class A (Est. March 2, 1995) | ||||||||||||||||
Excluding sales charge | +7.99% | +4.16% | +5.49% | +5.49% | ||||||||||||
Including sales charge | +3.16% | +3.20% | +5.01% | +5.29% | ||||||||||||
Class C (Est. April 9, 1996) | ||||||||||||||||
Excluding sales charge | +7.26% | +3.39% | +4.71% | +4.64% | ||||||||||||
Including sales charge | +6.26% | +3.39% | +4.71% | +4.64% | ||||||||||||
Institutional Class (Est. Dec. 31, 2013) | ||||||||||||||||
Excluding sales charge | +8.25% | +4.41% | n/a | +5.67% | ||||||||||||
Including sales charge | +8.25% | +4.41% | n/a | +5.67% | ||||||||||||
Bloomberg Barclays Municipal Bond Index | +8.72% | +3.85% | +4.62% | +4.71%* | ||||||||||||
*The benchmark lifetime return is for Institutional Class share comparison only and is calculated using the last business day in the month of the Fund’s Institutional Class inception date.
1Returns reflect the reinvestment of all distributions and are presented both with and without the applicable sales charges described below. Returns do not reflect the deduction of taxes the shareholder would pay on Fund distributions or redemptions of Fund shares.
Expense limitations were in effect for certain classes during some or all of the periods shown in the “Fund and benchmark performance” table. Expenses for each class are listed on the “Fund expense ratios” table on page 14. Performance would have been lower had expense limitations not been in effect.
Institutional Class shares are not subject to a sales charge and are offered for sale exclusively to certain eligible investors. In addition, Institutional Class shares pay no distribution and service(12b-1) fee.
Class A shares are sold with a maximumfront-end sales charge of 4.50%, and have an annual12b-1 fee of 0.25% of average daily net assets.
Performance for Class A shares, excluding sales charges, assumes that nofront-end sales charge applied.
Class C shares are sold with a contingent deferred sales charge of 1.00% if redeemed during the first 12 months. They are also subject to an annual12b-1 fee of 1.00% of average daily net assets. Performance for Class C shares, excluding sales charges, assumes either that contingent deferred sales charges did not apply or that the investment was not redeemed.
Fixed income securities and bond funds can lose value, and investors can lose principal, as interest rates rise. They also may be affected by economic conditions that hinder an issuer’s ability to make interest and principal payments on its debt.
The Fund may also be subject to prepayment risk, the risk that the principal of a bond that is held by a portfolio will be prepaid prior to maturity, at the time when interest rates are lower than what the bond was paying. A portfolio may then have to
13
Table of Contents
Performance summaries
DelawareTax-Free California Fund
reinvest that money at a lower interest rate.
Funds that invest primarily in one state may be more susceptible to the economic, regulatory, regional, and other factors of that state than geographically diversified funds.
Substantially all dividend income derived fromtax-free funds is exempt from federal income tax. Some income may be subject to state or local and/or the federal alternative minimum tax (AMT) that applies to certain investors. Capital gains, if any, are taxable.
Duration number will change as market conditions change. Therefore, duration should not be solely relied upon to indicate a municipal bond fund’s potential volatility.
This document may mention bond ratings published by nationally recognized statistical
rating organizations (NRSROs) Standard & Poor’s, Moody’s Investors Service, and Fitch, Inc. For securities rated by an NRSRO other than S&P, the rating is converted to the equivalent S&P credit rating. Bonds rated AAA are rated as having the highest quality and are generally considered to have the lowest degree of investment risk. Bonds rated AA are considered to be of high quality, but with a slightly higher degree of risk than bonds rated AAA. Bonds rated A are considered to have many favorable investment qualities, though they are somewhat more susceptible to adverse economic conditions. Bonds rated BBB are believed to be of medium-grade quality and generally riskier over the long term. Bonds rated BB, B, and CCC are regarded as having significant speculative characteristics, with BB indicating the least degree of speculation of the three.
2The Fund’s expense ratios, as described in the most recent prospectus, are disclosed in the following “Fund expense ratios” table. Delaware Management Company has agreed to reimburse certain expenses and/or waive certain fees in order to prevent total annual fund operating expenses (excluding any12b-1 fees, acquired fund fees and expenses, taxes, interest, short sale and dividend and interest expenses, brokerage fees, certain insurance costs, and nonroutine expenses or costs, including, but not limited to, those relating to reorganizations, litigation, conducting shareholder meetings, and liquidations) from exceeding 0.57% of the Fund’s average daily net assets during the period from Sept. 1, 2018 to Aug. 31, 2019.** Please see the most recent prospectus and any applicable supplement(s) for additional information on these fee waivers and/or reimbursements. Please see the “Financial highlights” section in this report for the most recent expense ratios.
| Fund expense ratios | Class A | Class C | Institutional Class | |||||||
Total annual operating expenses (without fee waivers) |
1.02% |
1.77% |
0.77% | |||||||
Net expenses (including fee waivers, if any) | 0.82% | 1.57% | 0.57% | |||||||
Type of waiver
| Contractual
| Contractual
| Contractual
|
**The aggregate contractual waiver period covering this report is from Dec. 29, 2017 through Dec. 28, 2019.
14
Table of Contents
Performance of a $10,000 investment1
Class A shares
Average annual total returns from Aug. 31, 2009 through Aug. 31, 2019
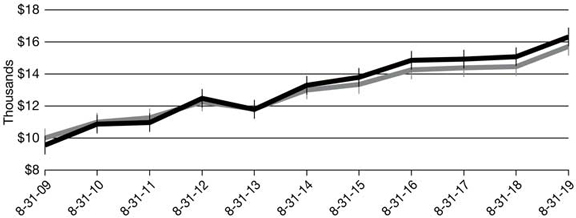
| For period beginning Aug. 31, 2009 through Aug. 31, 2019 | Starting value | Ending value | ||||||
| $9,550 | $16,299 | ||||||
| $10,000 | $15,703 | ||||||
Institutional Class shares
Average annual total returns from Dec. 31, 2013 (inception date) through Aug. 31, 2019
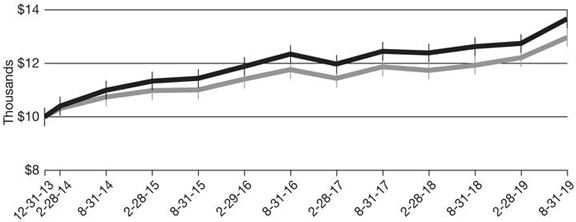
| For period beginning Dec. 31, 2013 through Aug. 31, 2019 | Starting value | Ending value | ||||||
| $10,000 | $13,665 | ||||||
| $10,000 | $12,977 | ||||||
15
Table of Contents
Performance summaries
DelawareTax-Free California Fund
1The “Performance of a $10,000 investment” graph for Class A shares assumes $10,000 invested in Class A shares of the Fund on Aug. 31, 2009, and includes the effect of a 4.50%front-end sales charge and the reinvestment of all distributions. The graph also assumes $10,000 invested in the Bloomberg Barclays Municipal Bond Index as of Aug. 31, 2009.
The “Performance of a $10,000 investment” graph for Institutional Class shares assumes $10,000 invested in Institutional Class shares of the Fund on Dec. 31, 2013, and includes the reinvestment of all distributions. The graph also assumes $10,000 invested in the Bloomberg Barclays Municipal Bond Index as of Dec. 31, 2013.
The graphs do not reflect the deduction of taxes the shareholders would pay on Fund distributions or redemptions of Fund shares. Expense
limitations were in effect for some or all of the periods shown. Performance would have been lower had expense limitations not been in effect. Expenses are listed in the “Fund expense ratios” table on page 14. Please note additional details on pages 13 through 16.
The Bloomberg Barclays Municipal Bond Index measures the total return performance of the long-term, investment gradetax-exempt bond market.
Index performance returns do not reflect any management fees, transaction costs, or expenses. Indices are unmanaged and one cannot invest directly in an index.Past performance is not a guarantee of future results.
Performance of other Fund classes will vary due to different charges and expenses.
| Nasdaq symbols | CUSIPs | |||||
Class A | DVTAX | 928928829 | ||||
Class C | DVFTX | 928928795 | ||||
Institutional Class | DCTIX | 928928167 | ||||
| ||||||
16
Table of Contents
| Performance summaries | ||
| DelawareTax-Free Colorado Fund | August 31, 2019 |
The performance quoted represents past performance and does not guarantee future results. Investment return and principal value of an investment will fluctuate so that shares, when redeemed, may be worth more or less than their original cost. Current performance may be lower or higher than the performance quoted. Performance data current to the most recent month end may be obtained by calling 800523-1918 or visiting delawarefunds.com/performance.
| Fund and benchmark performance1,2 | Average annual total returns through August 31, 2019 | |||||||||||||||
| 1 year | 5 years | 10 years | Lifetime | |||||||||||||
Class A (Est. April 23, 1987) | ||||||||||||||||
Excluding sales charge | +7.48% | +3.79% | +4.57% | +5.68% | ||||||||||||
Including sales charge | +2.64% | +2.84% | +4.08% | +5.53% | ||||||||||||
Class C (Est. May 6, 1994) | ||||||||||||||||
Excluding sales charge | +6.67% | +3.01% | +3.78% | +4.14% | ||||||||||||
Including sales charge | +5.67% | +3.01% | +3.78% | +4.14% | ||||||||||||
Institutional Class (Est. Dec. 31, 2013) | ||||||||||||||||
Excluding sales charge | +7.74% | +4.05% | n/a | +5.30% | ||||||||||||
Including sales charge | +7.74% | +4.05% | n/a | +5.30% | ||||||||||||
Bloomberg Barclays Municipal Bond Index | +8.72% | +3.85% | +4.62% | +4.71%* | ||||||||||||
*The benchmark lifetime return is for Institutional Class share comparison only and is calculated using the last business day in the month of the Fund’s Institutional Class inception date.
1Returns reflect the reinvestment of all distributions and are presented both with and without the applicable sales charges described below. Returns do not reflect the deduction of taxes the shareholder would pay on Fund distributions or redemptions of Fund shares.
Expense limitations were in effect for certain classes during some or all of the periods shown in the “Fund and benchmark performance” table. Expenses for each class are listed on the “Fund expense ratios” table on page 18. Performance would have been lower had expense limitations not been in effect.
Institutional Class shares are not subject to a sales charge and are offered for sale exclusively to certain eligible investors. In addition, Institutional Class shares pay no distribution and service(12b-1) fee.
Class A shares are sold with a maximumfront-end sales charge of 4.50%, and have an annual12b-1 fee of 0.25% of average daily net assets.
Performance for Class A shares, excluding sales charges, assumes that nofront-end sales charge applied.
Class C shares are sold with a contingent deferred sales charge of 1.00% if redeemed during the first 12 months. They are also subject to an annual12b-1 fee of 1.00% of average daily net assets. Performance for Class C shares, excluding sales charges, assumes either that contingent deferred sales charges did not apply or that the investment was not redeemed.
Fixed income securities and bond funds can lose value, and investors can lose principal, as interest rates rise. They also may be affected by economic conditions that hinder an issuer’s ability to make interest and principal payments on its debt.
The Fund may also be subject to prepayment risk, the risk that the principal of a bond that is held by a portfolio will be prepaid prior to maturity, at the time when interest rates are lower than what the bond was paying. A portfolio may then have to
17
Table of Contents
Performance summaries
DelawareTax-Free Colorado Fund
reinvest that money at a lower interest rate.
Funds that invest primarily in one state may be more susceptible to the economic, regulatory, regional, and other factors of that state than geographically diversified funds.
Substantially all dividend income derived fromtax-free funds is exempt from federal income tax. Some income may be subject to state or local and/or the federal alternative minimum tax (AMT) that applies to certain investors. Capital gains, if any, are taxable.
Duration number will change as market conditions change. Therefore, duration should not be solely relied upon to indicate a municipal bond fund’s potential volatility.
This document may mention bond ratings published by nationally recognized statistical
rating organizations (NRSROs) Standard & Poor’s, Moody’s Investors Service, and Fitch, Inc. For securities rated by an NRSRO other than S&P, the rating is converted to the equivalent S&P credit rating. Bonds rated AAA are rated as having the highest quality and are generally considered to have the lowest degree of investment risk. Bonds rated AA are considered to be of high quality, but with a slightly higher degree of risk than bonds rated AAA. Bonds rated A are considered to have many favorable investment qualities, though they are somewhat more susceptible to adverse economic conditions. Bonds rated BBB are believed to be of medium-grade quality and generally riskier over the long term. Bonds rated BB, B, and CCC are regarded as having significant speculative characteristics, with BB indicating the least degree of speculation of the three.
2The Fund’s expense ratios, as described in the most recent prospectus, are disclosed in the following “Fund expense ratios” table. Delaware Management Company has agreed to reimburse certain expenses and/or waive certain fees in order to prevent total annual fund operating expenses (excluding any12b-1 fees, acquired fund fees and expenses, taxes, interest, short sale and dividend and interest expenses, brokerage fees, certain insurance costs, and nonroutine expenses or costs, including, but not limited to, those relating to reorganizations, litigation, conducting shareholder meetings, and liquidations) from exceeding 0.59% of the Fund’s average daily net assets during the period from Sept. 1, 2018 to Aug. 31, 2019.** Please see the most recent prospectus and any applicable supplement(s) for additional information on these fee waivers and/or reimbursements. Please see the “Financial highlights” section in this report for the most recent expense ratios.
| Fund expense ratios | Class A | Class C | Institutional Class | |||||||
Total annual operating expenses | 0.97% | 1.72% | 0.72% | |||||||
(without fee waivers) | ||||||||||
Net expenses | 0.84% | 1.59% | 0.59% | |||||||
(including fee waivers, if any) | ||||||||||
Type of waiver | Contractual | Contractual | Contractual |
**The aggregate contractual waiver period covering this report is from Dec. 29, 2017 through Dec. 28, 2019.
18
Table of Contents
Performance of a $10,000 investment1
Class A shares
Average annual total returns from Aug. 31, 2009 through Aug. 31, 2019
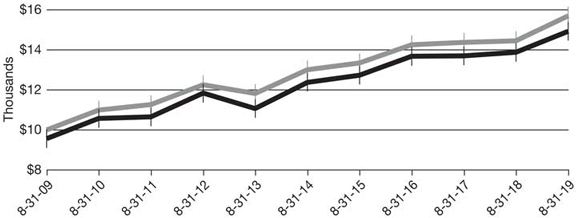
For period beginning Aug. 31, 2009 through Aug. 31, 2019
| Starting value
| Ending value
| ||||||
| $ | 10,000 | $ | 15,703 | ||||
| $ | 9,550 | $ | 14,922 | ||||
Institutional Class shares
Average annual total returns from Dec. 31, 2013 (inception date) through Aug. 31, 2019
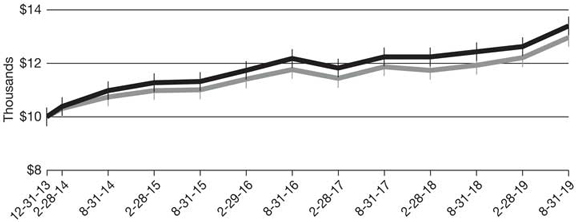
For period beginning Dec. 31, 2013 through Aug. 31, 2019
| Starting value
| Ending value
| ||||||
| $ | 10,000 | $ | 13,399 | ||||
| $ | 10,000 | $ | 12,977 | ||||
19
Table of Contents
Performance summaries
DelawareTax-Free Colorado Fund
1The “Performance of a $10,000 investment” graph for Class A shares assumes $10,000 invested in Class A shares of the Fund on Aug. 31, 2009, and includes the effect of a 4.50%front-end sales charge and the reinvestment of all distributions. The graph also assumes $10,000 invested in the Bloomberg Barclays Municipal Bond Index as of Aug. 31, 2009.
The “Performance of a $10,000 investment” graph for Institutional Class shares assumes $10,000 invested in Institutional Class shares of the Fund on Dec. 31, 2013, and includes the reinvestment of all distributions. The graph also assumes $10,000 invested in the Bloomberg Barclays Municipal Bond Index as of Dec. 31, 2013.
The graphs do not reflect the deduction of taxes the shareholders would pay on Fund distributions or redemptions of Fund shares. Expense
limitations were in effect for some or all of the periods shown. Performance would have been lower had expense limitations not been in effect. Expenses are listed in the “Fund expense ratios” table on page 18. Please note additional details on pages 17 through 20.
The Bloomberg Barclays Municipal Bond Index measures the total return performance of the long-term, investment gradetax-exempt bond market.
Index performance returns do not reflect any management fees, transaction costs, or expenses. Indices are unmanaged and one cannot invest directly in an index.Past performance is not a guarantee of future results.
Performance of other Fund classes will vary due to different charges and expenses.
Nasdaq symbols | CUSIPs | |||||
Class A | VCTFX | 928920107 | ||||
Class C | DVCTX | 92907R101 | ||||
Institutional Class | DCOIX | 92907R200 | ||||
| ||||||
20
Table of Contents
| Performance summaries | ||
| DelawareTax-Free Idaho Fund | August 31, 2019 | |
The performance quoted represents past performance and does not guarantee future results. Investment return and principal value of an investment will fluctuate so that shares, when redeemed, may be worth more or less than their original cost. Current performance may be lower or higher than the performance quoted. Performance data current to the most recent month end may be obtained by calling 800523-1918 or visiting delawarefunds.com/performance.
| Fund and benchmark performance1,2 | Average annual total returns through August 31, 2019 | |||||||||||||||
| 1 year | 5 years | 10 years | Lifetime | |||||||||||||
Class A (Est. Jan. 4, 1995) | ||||||||||||||||
Excluding sales charge | +7.19% | +3.29% | +3.54% | +4.81% | ||||||||||||
Including sales charge | +2.35% | +2.35% | +3.06% | +4.62% | ||||||||||||
Class C (Est. Jan. 11, 1995) | ||||||||||||||||
Excluding sales charge | +6.40% | +2.52% | +2.76% | +4.00% | ||||||||||||
Including sales charge | +5.40% | +2.52% | +2.76% | +4.00% | ||||||||||||
Institutional Class (Est. Dec. 31, 2013) | ||||||||||||||||
Excluding sales charge | +7.46% | +3.53% | n/a | +4.40% | ||||||||||||
Including sales charge | +7.46% | +3.53% | n/a | +4.40% | ||||||||||||
Bloomberg Barclays Municipal Bond Index | +8.72% | +3.85% | +4.62% | 4.71%* | ||||||||||||
*The benchmark lifetime return is for Institutional Class share comparison only and is calculated using the last business day in the month of the Fund’s Institutional Class inception date.
1Returns reflect the reinvestment of all distributions and are presented both with and without the applicable sales charges described below. Returns do not reflect the deduction of taxes the shareholder would pay on Fund distributions or redemptions of Fund shares.
Expense limitations were in effect for certain classes during some or all of the periods shown in the “Fund and benchmark performance” table. Expenses for each class are listed on the “Fund expense ratios” table on page 22. Performance would have been lower had expense limitations not been in effect.
Institutional Class shares are not subject to a sales charge and are offered for sale exclusively to certain eligible investors. In addition, Institutional Class shares pay no distribution and service(12b-1) fee.
Class A shares are sold with a maximumfront-end sales charge of 4.50%, and have an annual12b-1 fee of 0.25% of average daily net assets.
Performance for Class A shares, excluding sales charges, assumes that nofront-end sales charge applied.
Class C shares are sold with a contingent deferred sales charge of 1.00% if redeemed during the first 12 months. They are also subject to an annual12b-1 fee of 1.00% of average daily net assets. Performance for Class C shares, excluding sales charges, assumes either that contingent deferred sales charges did not apply or that the investment was not redeemed.
Fixed income securities and bond funds can lose value, and investors can lose principal, as interest rates rise. They also may be affected by economic conditions that hinder an issuer’s ability to make interest and principal payments on its debt.
The Fund may also be subject to prepayment risk, the risk that the principal of a bond that is held by a portfolio will be prepaid prior to maturity, at the time when interest rates are lower than what the bond was paying. A portfolio may then have to
21
Table of Contents
Performance summaries
DelawareTax-Free Idaho Fund
reinvest that money at a lower interest rate.
Funds that invest primarily in one state may be more susceptible to the economic, regulatory, regional, and other factors of that state than geographically diversified funds.
Substantially all dividend income derived fromtax-free funds is exempt from federal income tax. Some income may be subject to state or local and/or the federal alternative minimum tax (AMT) that applies to certain investors. Capital gains, if any, are taxable.
Duration number will change as market conditions change. Therefore, duration should not be solely relied upon to indicate a municipal bond fund’s potential volatility.
This document may mention bond ratings published by nationally recognized statistical
rating organizations (NRSROs) Standard & Poor’s, Moody’s Investors Service, and Fitch, Inc. For securities rated by an NRSRO other than S&P, the rating is converted to the equivalent S&P credit rating. Bonds rated AAA are rated as having the highest quality and are generally considered to have the lowest degree of investment risk. Bonds rated AA are considered to be of high quality, but with a slightly higher degree of risk than bonds rated AAA. Bonds rated A are considered to have many favorable investment qualities, though they are somewhat more susceptible to adverse economic conditions. Bonds rated BBB are believed to be of medium-grade quality and generally riskier over the long term. Bonds rated BB, B, and CCC are regarded as having significant speculative characteristics, with BB indicating the least degree of speculation of the three.
2The Fund’s expense ratios, as described in the most recent prospectus, are disclosed in the following “Fund expense ratios” table. Delaware Management Company has agreed to reimburse certain expenses and/or waive certain fees in order to prevent total annual fund operating expenses (excluding any12b-1 fees, acquired fund fees and expenses, taxes, interest, short sale and dividend and interest expenses, brokerage fees, certain insurance costs, and nonroutine expenses or costs, including, but not limited to, those relating to reorganizations, litigation, conducting shareholder meetings, and liquidations) from exceeding 0.61% of the Fund’s average daily net assets during the period from Sept. 1, 2018 to Aug. 31, 2019.** Please see the most recent prospectus and any applicable supplement(s) for additional information on these fee waivers and/or reimbursements. Please see the “Financial highlights” section in this report for the most recent expense ratios.
| Fund expense ratios | Class A | Class C | Institutional Class | |||||||||||||
Total annual operating expenses | 1.01% | 1.76% | 0.76% | |||||||||||||
(without fee waivers) | ||||||||||||||||
Net expenses | 0.86% | 1.61% | 0.61% | |||||||||||||
(including fee waivers, if any) | ||||||||||||||||
Type of waiver | Contractual | Contractual | Contractual | |||||||||||||
**The aggregate contractual waiver period covering this report is from Dec. 29, 2017 through Dec. 28, 2019.
22
Table of Contents
Performance of a $10,000 investment1
Class A shares
Average annual total returns from Aug. 31, 2009 through Aug. 31, 2019
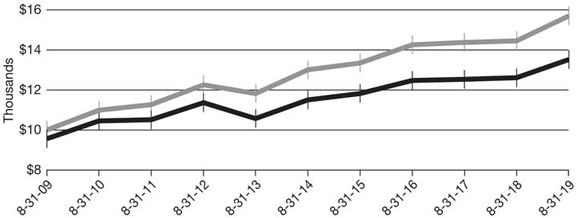
For period beginning Aug. 31, 2009 through Aug. 31, 2019
|
Starting value
|
Ending value
| ||||||
| $10,000 | $15,703 | ||||||
| $9,550 | $13,520 | ||||||
Institutional Class shares
Average annual total returns from Dec. 31, 2013 (inception date) through Aug. 31, 2019

For period beginning Dec. 31, 2013 through Aug. 31, 2019
|
Starting value
|
Ending value
| ||||||
| $10,000 | $12,977 | ||||||
| $10,000 | $12,764 | ||||||
23
Table of Contents
Performance summaries
DelawareTax-Free Idaho Fund
1The “Performance of a $10,000 investment” graph for Class A shares assumes $10,000 invested in Class A shares of the Fund on Aug. 31, 2009, and includes the effect of a 4.50%front-end sales charge and the reinvestment of all distributions. The graph also assumes $10,000 invested in the Bloomberg Barclays Municipal Bond Index as of Aug. 31, 2009.
The “Performance of a $10,000 investment” graph for Institutional Class shares assumes $10,000 invested in Institutional Class shares of the Fund on Dec. 31, 2013, and includes the reinvestment of all distributions. The graph also assumes $10,000 invested in the Bloomberg Barclays Municipal Bond Index as of Dec. 31, 2013.
The graphs do not reflect the deduction of taxes the shareholders would pay on Fund distributions or redemptions of Fund shares. Expense
limitations were in effect for some or all of the periods shown. Performance would have been lower had expense limitations not been in effect. Expenses are listed in the “Fund expense ratios” table on page 22. Please note additional details on pages 21 through 24.
The Bloomberg Barclays Municipal Bond Index measures the total return performance of the long-term, investment gradetax-exempt bond market.
Index performance returns do not reflect any management fees, transaction costs, or expenses. Indices are unmanaged and one cannot invest directly in an index.Past performance is not a guarantee of future results.
Performance of other Fund classes will vary due to different charges and expenses.
| Nasdaq symbols | CUSIPs | |||||
Class A | VIDAX | 928928704 | ||||
Class C | DVICX | 928928803 | ||||
Institutional Class | DTIDX | 928928159 |
24
Table of Contents
| Performance summaries | ||
| DelawareTax-Free New York Fund | August 31, 2019 | |
The performance quoted represents past performance and does not guarantee future results. Investment return and principal value of an investment will fluctuate so that shares, when redeemed, may be worth more or less than their original cost. Current performance may be lower or higher than the performance quoted. Performance data current to the most recent month end may be obtained by calling 800523-1918 or visiting delawarefunds.com/performance.
| Fund and benchmark performance1,2 | Average annual total returns through August 31, 2019 | |||||||||||||||
| 1 year | 5 years | 10 years | Lifetime | |||||||||||||
Class A (Est. Nov. 6, 1987) | ||||||||||||||||
Excluding sales charge | +8.00% | +3.87% | +4.75% | +5.58% | ||||||||||||
Including sales charge | +3.17% | +2.92% | +4.28% | +5.42% | ||||||||||||
Class C (Est. April 26, 1995) | ||||||||||||||||
Excluding sales charge | +7.20% | +3.08% | +3.98% | +4.01% | ||||||||||||
Including sales charge | +6.20% | +3.08% | +3.98% | +4.01% | ||||||||||||
Institutional Class (Est. Dec. 31, 2013) | ||||||||||||||||
Excluding sales charge | +8.17% | +4.11% | n/a | +5.32% | ||||||||||||
Including sales charge | +8.17% | +4.11% | n/a | +5.32% | ||||||||||||
Bloomberg Barclays Municipal Bond Index | +8.72% | +3.85% | +4.62% | +4.71%* | ||||||||||||
*The benchmark lifetime return is for Institutional Class share comparison only and is calculated using the last business day in the month of the Fund’s Institutional Class inception date.
1Returns reflect the reinvestment of all distributions and are presented both with and without the applicable sales charges described below. Returns do not reflect the deduction of taxes the shareholder would pay on Fund distributions or redemptions of Fund shares.
Expense limitations were in effect for certain classes during some or all of the periods shown in the “Fund and benchmark performance” table. Expenses for each class are listed on the “Fund expense ratios” table on page 26. Performance would have been lower had expense limitations not been in effect.
Institutional Class shares are not subject to a sales charge and are offered for sale exclusively to certain eligible investors. In addition, Institutional Class shares pay no distribution and service(12b-1) fee.
Class A shares are sold with a maximumfront-end sales charge of 4.50%, and have an annual12b-1 fee of 0.25% of average daily net assets.
Performance for Class A shares, excluding sales charges, assumes that nofront-end sales charge applied.
Class C shares are sold with a contingent deferred sales charge of 1.00% if redeemed during the first 12 months. They are also subject to an annual12b-1 fee of 1.00% of average daily net assets. Performance for Class C shares, excluding sales charges, assumes either that contingent deferred sales charges did not apply or that the investment was not redeemed.
Fixed income securities and bond funds can lose value, and investors can lose principal, as interest rates rise. They also may be affected by economic conditions that hinder an issuer’s ability to make interest and principal payments on its debt.
The Fund may also be subject to prepayment risk, the risk that the principal of a bond that is held by a portfolio will be prepaid prior to maturity, at the time when interest rates are lower than what the bond was paying. A portfolio may then have to
25
Table of Contents
Performance summaries
DelawareTax-Free New York Fund
reinvest that money at a lower interest rate.
Funds that invest primarily in one state may be more susceptible to the economic, regulatory, regional, and other factors of that state than geographically diversified funds.
Substantially all dividend income derived fromtax-free funds is exempt from federal income tax. Some income may be subject to state or local and/or the federal alternative minimum tax (AMT) that applies to certain investors. Capital gains, if any, are taxable.
Duration number will change as market conditions change. Therefore, duration should not be solely relied upon to indicate a municipal bond fund’s potential volatility.
This document may mention bond ratings published by nationally recognized statistical
rating organizations (NRSROs) Standard & Poor’s, Moody’s Investors Service, and Fitch, Inc. For securities rated by an NRSRO other than S&P, the rating is converted to the equivalent S&P credit rating. Bonds rated AAA are rated as having the highest quality and are generally considered to have the lowest degree of investment risk. Bonds rated AA are considered to be of high quality, but with a slightly higher degree of risk than bonds rated AAA. Bonds rated A are considered to have many favorable investment qualities, though they are somewhat more susceptible to adverse economic conditions. Bonds rated BBB are believed to be of medium-grade quality and generally riskier over the long term. Bonds rated BB, B, and CCC are regarded as having significant speculative characteristics, with BB indicating the least degree of speculation of the three.
2The Fund’s expense ratios, as described in the most recent prospectus, are disclosed in the following “Fund expense ratios” table. Delaware Management Company has agreed to reimburse certain expenses and/or waive certain fees in order to prevent total annual fund operating expenses (excluding any12b-1 fees, acquired fund fees and expenses, taxes, interest, short sale and dividend and interest expenses, brokerage fees, certain insurance costs, and nonroutine expenses or costs, including, but not limited to, those relating to reorganizations, litigation, conducting shareholder meetings, and liquidations) from exceeding 0.55% of the Fund’s average daily net assets during the period from Sept. 1, 2018 to Aug. 31, 2019.** Please see the most recent prospectus and any applicable supplement(s) for additional information on these fee waivers and/or reimbursements. Please see the “Financial highlights” section in this report for the most recent expense ratios.
| Fund expense ratios | Class A | Class C | Institutional Class | |||||||||||||
Total annual operating expenses | 1.08% | 1.83% | 0.83% | |||||||||||||
(without fee waivers) | ||||||||||||||||
Net expenses | 0.80% | 1.55% | 0.55% | |||||||||||||
(including fee waivers, if any) | ||||||||||||||||
Type of waiver | Contractual | Contractual | Contractual | |||||||||||||
**The aggregate contractual waiver period covering this report is from Dec. 29, 2017 through Dec. 28, 2019.
26
Table of Contents
Performance of a $10,000 investment1
Class A shares
Average annual total returns from Aug. 31, 2009 through Aug. 31, 2019
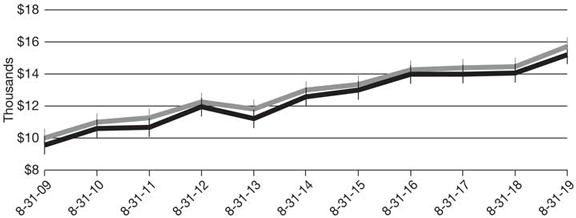
For period beginning Aug. 31, 2009 through Aug. 31, 2019
|
Starting value
|
Ending value
| ||||||
| $10,000 | $15,703 | ||||||
| $9,550 | $15,199 | ||||||
Institutional Class shares
Average annual total returns from Dec. 31, 2013 (inception date) through Aug. 31, 2019
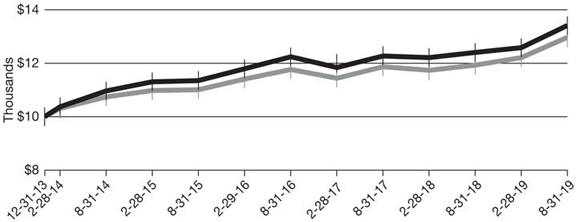
For period beginning Dec. 31, 2013 through Aug. 31, 2019
|
Starting value
|
Ending value
| ||||||
| $10,000 | $13,417 | ||||||
| $10,000 | $12,977 | ||||||
27
Table of Contents
Performance summaries
DelawareTax-Free New York Fund
1The “Performance of a $10,000 investment” graph for Class A shares assumes $10,000 invested in Class A shares of the Fund on Aug. 31, 2009, and includes the effect of a 4.50%front-end sales charge and the reinvestment of all distributions. The graph also assumes $10,000 invested in the Bloomberg Barclays Municipal Bond Index as of Aug. 31, 2009.
The “Performance of a $10,000 investment” graph for Institutional Class shares assumes $10,000 invested in Institutional Class shares of the Fund on Dec. 31, 2013, and includes the reinvestment of all distributions. The graph also assumes $10,000 invested in the Bloomberg Barclays Municipal Bond Index as of Dec. 31, 2013.
The graphs do not reflect the deduction of taxes the shareholders would pay on Fund distributions or redemptions of Fund shares. Expense
limitations were in effect for some or all of the periods shown. Performance would have been lower had expense limitations not been in effect. Expenses are listed in the “Fund expense ratios” table on page 26. Please note additional details on pages 25 through 28.
The Bloomberg Barclays Municipal Bond Index measures the total return performance of the long-term, investment gradetax-exempt bond market.
Index performance returns do not reflect any management fees, transaction costs, or expenses. Indices are unmanaged and one cannot invest directly in an index.Past performance is not a guarantee of future results.
Performance of other Fund classes will vary due to different charges and expenses.
| Nasdaq symbols | CUSIPs | |||||
Class A | FTNYX | 928928274 | ||||
Class C | DVFNX | 928928258 | ||||
Institutional Class | DTNIX | 928928142 |
28
Table of Contents
| Performance summaries | ||
| DelawareTax-Free Pennsylvania Fund | August 31, 2019 |
The performance quoted represents past performance and does not guarantee future results. Investment return and principal value of an investment will fluctuate so that shares, when redeemed, may be worth more or less than their original cost. Current performance may be lower or higher than the performance quoted. Performance data current to the most recent month end may be obtained by calling 800523-1918 or visiting delawarefunds.com/performance.
| Fund and benchmark performance1,2 | Average annual total returns through August 31, 2019 | |||||||||||||||
| 1 year | 5 years | 10 years | Lifetime | |||||||||||||
Class A (Est. March 23, 1977) | ||||||||||||||||
Excluding sales charge | +7.72% | +3.80% | +4.66% | +5.52% | ||||||||||||
Including sales charge | +2.92% | +2.86% | +4.17% | +5.41% | ||||||||||||
Class C (Est. Nov. 29, 1995) | ||||||||||||||||
Excluding sales charge | +6.91% | +3.01% | +3.86% | +3.73% | ||||||||||||
Including sales charge | +5.91% | +3.01% | +3.86% | +3.73% | ||||||||||||
Institutional Class (Est. Dec. 31, 2013) | ||||||||||||||||
Excluding sales charge | +8.12% | +4.05% | n/a | +5.22% | ||||||||||||
Including sales charge | +8.12% | +4.05% | n/a | +5.22% | ||||||||||||
Bloomberg Barclays Municipal Bond Index | +8.72% | +3.85% | +4.62% | +4.71%* | ||||||||||||
*The benchmark lifetime return is for Institutional Class share comparison only and is calculated using the last business day in the month of the Fund’s Institutional Class inception date.
1Returns reflect the reinvestment of all distributions and are presented both with and without the applicable sales charges described below. Returns do not reflect the deduction of taxes the shareholder would pay on Fund distributions or redemptions of Fund shares.
Expense limitations were in effect for certain classes during some or all of the periods shown in the “Fund and benchmark performance” table. Expenses for each class are listed on the “Fund expense ratios” table on page 31. Performance would have been lower had expense limitations not been in effect.
Institutional Class shares are not subject to a sales charge and are offered for sale exclusively to certain eligible investors. In addition, Institutional Class shares pay no distribution and service(12b-1) fee.
Class A shares are sold with a maximumfront-end sales charge of 4.50%, and have an annual12b-1 fee of 0.25% of average daily net assets. The
Board has adopted a formula for calculating12b-1 plan fees for the Fund’s Class A shares. The Fund’s Class A shares are currently subject to a blended12b-1 fee equal to the sum of: (i) 0.10% of average daily net assets representing shares acquired prior to June 1, 1992, and (ii) 0.25% of average daily net assets representing shares acquired on or after June 1, 1992. All Class A shares currently bear12b-1 fees at the same rate, the blended rate, currently 0.24% of average daily net assets, based on the formula described above. This method of calculating Class A12b-1 fees may be discontinued at the sole discretion of the Board. Performance for Class A shares, excluding sales charges, assumes that nofront-end sales charge applied.
Class C shares are sold with a contingent deferred sales charge of 1.00% if redeemed during the first 12 months. They are also subject to an annual12b-1 fee of 1.00% of average daily net assets. Performance for Class C shares, excluding sales charges, assumes either that contingent deferred
29
Table of Contents
Performance summaries
DelawareTax-Free Pennsylvania Fund
sales charges did not apply or that the investment was not redeemed.
Fixed income securities and bond funds can lose value, and investors can lose principal, as interest rates rise. They also may be affected by economic conditions that hinder an issuer’s ability to make interest and principal payments on its debt.
The Fund may also be subject to prepayment risk, the risk that the principal of a bond that is held by a portfolio will be prepaid prior to maturity, at the time when interest rates are lower than what the bond was paying. A portfolio may then have to reinvest that money at a lower interest rate.
Funds that invest primarily in one state may be more susceptible to the economic, regulatory, regional, and other factors of that state than geographically diversified funds.
Substantially all dividend income derived fromtax-free funds is exempt from federal income tax. Some income may be subject to state or local and/or the federal alternative minimum tax (AMT) that applies to certain investors. Capital gains, if any, are taxable.
Duration number will change as market conditions change. Therefore, duration should not be solely relied upon to indicate a municipal bond fund’s potential volatility.
This document may mention bond ratings published by nationally recognized statistical rating organizations (NRSROs) Standard & Poor’s, Moody’s Investors Service, and Fitch, Inc. For securities rated by an NRSRO other than S&P, the rating is converted to the equivalent S&P credit rating. Bonds rated AAA are rated as having the highest quality and are generally considered to have the lowest degree of investment risk. Bonds rated AA are considered to be of high quality, but with a slightly higher degree of risk than bonds rated AAA. Bonds rated A are considered to have many favorable investment qualities, though they are somewhat more susceptible to adverse economic conditions. Bonds rated BBB are believed to be of medium-grade quality and generally riskier over the long term. Bonds rated BB, B, and CCC are regarded as having significant speculative characteristics, with BB indicating the least degree of speculation of the three.
30
Table of Contents
2The Fund’s expense ratios, as described in the most recent prospectus, are disclosed in the following “Fund expense ratios” table. Delaware Management Company has agreed to reimburse certain expenses and/or waive certain fees in order to prevent total annual fund operating expenses (excluding any12b-1 fees, acquired fund fees and expenses, taxes, interest, short sale and dividend and interest expenses, brokerage fees, certain insurance costs, and nonroutine expenses or costs, including, but not limited to, those relating to reorganizations, litigation, conducting shareholder meetings, and liquidations) from exceeding 0.59% of the Fund’s average daily net assets during the period from Sept. 1, 2018 to Aug. 31, 2019.** Please see the most recent prospectus and any applicable supplement(s) for additional information on these fee waivers and/or reimbursements. Please see the “Financial highlights” section in this report for the most recent expense ratios.
| Fund expense ratios | Class A | Class C | Institutional Class | |||||||
Total annual operating expenses | 0.93% | 1.69% | 0.69% | |||||||
(without fee waivers) | ||||||||||
Net expenses | 0.83% | 1.59% | 0.59% | |||||||
(including fee waivers, if any) | ||||||||||
Type of waiver | Contractual | Contractual | Contractual |
**For the period Sept. 1, 2018 to Dec. 27, 2018, the waiver was set at 0.64% of the Fund’s average daily net assets. The aggregate contractual waiver period covering this report is from Dec. 29, 2017 through Dec. 28, 2019.
31
Table of Contents
Performance summaries
DelawareTax-Free Pennsylvania Fund
Performance of a $10,000 investment1
Class A shares
Average annual total returns from Aug. 31, 2009 through Aug. 31, 2019
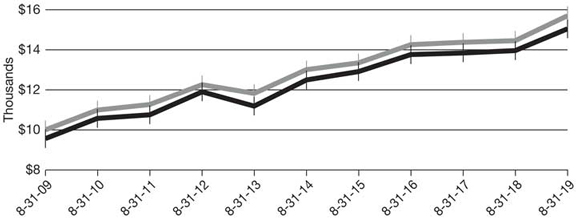
For period beginning Aug. 31, 2009 through Aug. 31, 2019
|
Starting value
|
Ending value
| ||||||
| $10,000 | $15,703 | ||||||
| $9,550 | $15,050 | ||||||
Institutional Class shares
Average annual total returns from Dec. 31, 2013 (inception date) through Aug. 31, 2019
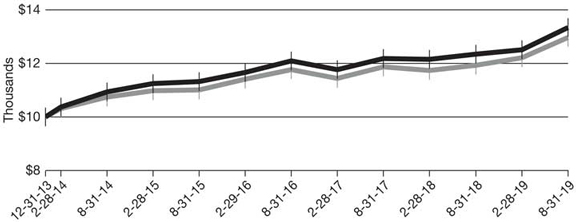
For period beginning Dec. 31, 2013 through Aug. 31, 2019
|
Starting value
|
Ending value
| ||||||
| $10,000 | $13,344 | ||||||
| $10,000 | $12,977 | ||||||
32
Table of Contents
1The “Performance of a $10,000 investment” graph for Class A shares assumes $10,000 invested in Class A shares of the Fund on Aug. 31, 2009, and includes the effect of a 4.50%front-end sales charge and the reinvestment of all distributions. The graph also assumes $10,000 invested in the Bloomberg Barclays Municipal Bond Index as of Aug. 31, 2009.
The “Performance of a $10,000 investment” graph for Institutional Class shares assumes $10,000 invested in Institutional Class shares of the Fund on Dec. 31, 2013, and includes the reinvestment of all distributions. The graph also assumes $10,000 invested in the Bloomberg Barclays Municipal Bond Index as of Dec. 31, 2013.
The graphs do not reflect the deduction of taxes the shareholders would pay on Fund distributions or redemptions of Fund shares. Expense
limitations were in effect for some or all of the periods shown. Performance would have been lower had expense limitations not been in effect. Expenses are listed in the “Fund expense ratios” table on page 31. Please note additional details on pages 29 through 33.
The Bloomberg Barclays Municipal Bond Index measures the total return performance of the long-term, investment gradetax-exempt bond market.
Index performance returns do not reflect any management fees, transaction costs, or expenses. Indices are unmanaged and one cannot invest directly in an index.Past performance is not a guarantee of future results.
Performance of other Fund classes will vary due to different charges and expenses.
| Nasdaq symbols | CUSIPs | |||||
Class A | DELIX | 233216100 | ||||
Class C | DPTCX | 233216308 | ||||
Institutional Class | DTPIX | 24609H701 | ||||
| ||||||
33
Table of Contents
For thesix-month period from March 1, 2019 to August 31, 2019 (Unaudited)
As a shareholder of a Fund, you incur two types of costs: (1) transaction costs, including sales charges (loads) on purchase payments, reinvested dividends, or other distributions; redemption fees; and exchange fees; and (2) ongoing costs, including management fees; distribution and service(12b-1) fees; and other Fund expenses. These following examples are intended to help you understand your ongoing costs (in dollars) of investing in a Fund and to compare these costs with the ongoing costs of investing in other mutual funds.
The examples are based on an investment of $1,000 invested at the beginning of the period and held for the entiresix-month period from March 1, 2019 to Aug. 31, 2019.
Actual expenses
The first section of the tables shown, “Actual Fund return,” provides information about actual account values and actual expenses. You may use the information in this section of the table, together with the amount you invested, to estimate the expenses that you paid over the period. Simply divide your account value by $1,000 (for example, an $8,600 account value divided by $1,000 = 8.6), then multiply the result by the number in the first section under the heading entitled “Expenses Paid During Period” to estimate the expenses you paid on your account during this period.
Hypothetical example for comparison purposes
The second section of the tables shown, “Hypothetical 5% return,” provides information about hypothetical account values and hypothetical expenses based on the Funds’ actual expense ratios and an assumed rate of return of 5% per year before expenses, which is not the Funds’ actual return. The hypothetical account values and expenses may not be used to estimate the actual ending account balance or expenses you paid for the period. You may use this information to compare the ongoing costs of investing in each Fund and other funds. To do so, compare this 5% hypothetical example with the 5% hypothetical examples that appear in the shareholder reports of the other funds.
Please note that the expenses shown in the tables are meant to highlight your ongoing costs only and do not reflect any transactional costs, such as sales charges (loads), redemption fees, or exchange fees. Therefore, the second section of each table is useful in comparing ongoing costs only, and will not help you determine the relative total costs of owning different funds. In addition, if these transactional costs were included, your costs would have been higher. The Funds’ expenses shown in the tables reflect fee waivers in effect and assume reinvestment of all dividends and distributions.
34
Table of Contents
DelawareTax-Free Arizona Fund
Expense analysis of an investment of $1,000
| Beginning Account Value 3/1/19 | Ending Account Value 8/31/19 | Annualized Expense Ratio | Expenses Paid During Period 3/1/19 to 8/31/19* | |||||||
Actual Fund return† | ||||||||||
Class A | $1,000.00 | $1,061.30 | 0.84% | $4.36 | ||||||
Class C | 1,000.00 | 1,057.10 | 1.59% | 8.24 | ||||||
Institutional Class | 1,000.00 | 1,062.60 | 0.59% | 3.07 | ||||||
Hypothetical 5% return(5% return before expenses) | ||||||||||
Class A | $1,000.00 | $1,020.97 | 0.84% | $4.28 | ||||||
Class C | 1,000.00 | 1,017.19 | 1.59% | 8.08 | ||||||
Institutional Class | 1,000.00 | 1,022.23 | 0.59% | 3.01 | ||||||
DelawareTax-Free California Fund
Expense analysis of an investment of $1,000
| Beginning Account Value 3/1/19 | Ending Account Value 8/31/19 | Annualized Expense Ratio | Expenses Paid During Period 3/1/19 to 8/31/19* | |||||||
Actual Fund return† | ||||||||||
Class A | $1,000.00 | $1,069.90 | 0.82% | $4.28 | ||||||
Class C | 1,000.00 | 1,066.70 | 1.57% | 8.18 | ||||||
Institutional Class | 1,000.00 | 1,071.20 | 0.57% | 2.98 | ||||||
Hypothetical 5% return(5% return before expenses) | ||||||||||
Class A | $1,000.00 | $1,021.07 | 0.82% | $4.18 | ||||||
Class C | 1,000.00 | 1,017.29 | 1.57% | 7.98 | ||||||
Institutional Class | 1,000.00 | 1,022.33 | 0.57% | 2.91 | ||||||
35
Table of Contents
Disclosure of Fund expenses
For thesix-month period from March 1, 2019 to August 31, 2019 (Unaudited)
DelawareTax-Free Colorado Fund
Expense analysis of an investment of $1,000
| Beginning Account Value 3/1/19 | Ending Account Value 8/31/19 | Annualized Expense Ratio | Expenses Paid During Period 3/1/19 to 8/31/19* | |||||||
Actual Fund return† | ||||||||||
Class A | $1,000.00 | $1,058.80 | 0.84% | $4.36 | ||||||
Class C | 1,000.00 | 1,054.70 | 1.59% | 8.23 | ||||||
Institutional Class | 1,000.00 | 1,060.10 | 0.59% | 3.06 | ||||||
Hypothetical 5% return(5% return before expenses) | ||||||||||
Class A | $1,000.00 | $1,020.97 | 0.84% | $4.28 | ||||||
Class C | 1,000.00 | 1,017.19 | 1.59% | 8.08 | ||||||
Institutional Class | 1,000.00 | 1,022.23 | 0.59% | 3.01 | ||||||
DelawareTax-Free Idaho Fund
Expense analysis of an investment of $1,000
| Beginning Account Value 3/1/19 | Ending Account Value 8/31/19 | Annualized Expense Ratio | Expenses Paid During Period 3/1/19 to 8/31/19* | |||||||
Actual Fund return† | ||||||||||
Class A | $1,000.00 | $1,055.20 | 0.86% | $4.45 | ||||||
Class C | 1,000.00 | 1,051.30 | 1.61% | 8.32 | ||||||
Institutional Class | 1,000.00 | 1,056.50 | 0.61% | 3.16 | ||||||
Hypothetical 5% return(5% return before expenses) | ||||||||||
Class A | $1,000.00 | $1,020.87 | 0.86% | $4.38 | ||||||
Class C | 1,000.00 | 1,017.09 | 1.61% | 8.19 | ||||||
Institutional Class | 1,000.00 | 1,022.13 | 0.61% | 3.11 | ||||||
36
Table of Contents
DelawareTax-Free New York Fund
Expense analysis of an investment of $1,000
| Beginning Account Value 3/1/19 | Ending Account Value 8/31/19 | Annualized Expense Ratio | Expenses Paid During Period 3/1/19 to 8/31/19* | |||||||
Actual Fund return† | ||||||||||
Class A | $1,000.00 | $1,064.00 | 0.80% | $4.16 | ||||||
Class C | 1,000.00 | 1,060.10 | 1.55% | 8.05 | ||||||
Institutional Class | 1,000.00 | 1,065.30 | 0.55% | 2.86 | ||||||
Hypothetical 5% return(5% return before expenses) | ||||||||||
Class A | $1,000.00 | $1,021.17 | 0.80% | $4.08 | ||||||
Class C | 1,000.00 | 1,017.39 | 1.55% | 7.88 | ||||||
Institutional Class | 1,000.00 | 1,022.43 | 0.55% | 2.80 | ||||||
DelawareTax-Free Pennsylvania Fund
Expense analysis of an investment of $1,000
| Beginning Account Value 3/1/19 | Ending Account Value 8/31/19 | Annualized Expense Ratio | Expenses Paid During Period 3/1/19 to 8/31/19* | |||||||
Actual Fund return† | ||||||||||
Class A | $1,000.00 | $1,063.30 | 0.84% | $4.37 | ||||||
Class C | 1,000.00 | 1,059.20 | 1.60% | 8.30 | ||||||
Institutional Class | 1,000.00 | 1,065.90 | 0.60% | 3.12 | ||||||
Hypothetical 5% return(5% return before expenses) | ||||||||||
Class A | $1,000.00 | $1,020.97 | 0.84% | $4.28 | ||||||
Class C | 1,000.00 | 1,017.14 | 1.60% | 8.13 | ||||||
Institutional Class | 1,000.00 | 1,022.18 | 0.60% | 3.06 | ||||||
| * | “Expenses Paid During Period” are equal to the relevant Fund’s annualized expense ratio, multiplied by the average account value over the period, multiplied by 184/365 (to reflect theone-half year period). |
| † | Because actual returns reflect only the most recentsix-month period, the returns shown may differ significantly from fiscal year returns. |
In addition to the Funds’ expenses reflected above, each Fund also indirectly bears its portion of the fees and expenses of the investment companies (Underlying Funds) in which it invests, including exchange-traded funds. The tables above do not reflect the expenses of the Underlying Funds.
37
Table of Contents
| Security type / sector /state / territory allocations | ||
| DelawareTax-Free Arizona Fund | As of August 31, 2019 (Unaudited) | |
Sector designations may be different than the sector designations presented in other Fund materials.
| Security type / sector | Percentage of net assets | ||||||
Municipal Bonds* | 99.01 | % | |||||
Corporate Revenue Bonds | 9.38 | % | |||||
Education Revenue Bonds | 31.86 | % | |||||
Electric Revenue Bonds | 6.66 | % | |||||
Healthcare Revenue Bonds | 17.90 | % | |||||
Lease Revenue Bonds | 3.00 | % | |||||
Local General Obligation Bonds | 3.90 | % | |||||
Pre-Refunded Bonds | 4.04 | % | |||||
Special Tax Revenue Bonds | 10.61 | % | |||||
Transportation Revenue Bonds | 5.27 | % | |||||
Water & Sewer Revenue Bonds | 6.39 | % | |||||
Short-Term Investment | 0.25 | % | |||||
Total Value of Securities | 99.26 | % | |||||
Receivables and Other Assets Net of Liabilities | 0.74 | % | |||||
Total Net Assets | 100.00 | % | |||||
*As of the date of this report, DelawareTax-Free Arizona Fund held bonds issued by or on behalf of territories and the states of the US as follows:
| State / territory | Percentage of net assets | ||||||
Arizona | 89.88 | % | |||||
Guam | 2.04 | % | |||||
Puerto Rico | 7.34 | % | |||||
Total Value of Securities | 99.26 | % | |||||
38
Table of Contents
| Security type / sector / state / territory allocations | ||
| DelawareTax-Free California Fund | As of August 31, 2019 (Unaudited) | |
Sector designations may be different than the sector designations presented in other Fund materials.
| Security type / sector | Percentage of net assets | ||||||
Municipal Bonds* | 101.17 | % | |||||
Corporate Revenue Bonds | 3.97 | % | |||||
Education Revenue Bonds | 27.83 | % | |||||
Electric Revenue Bonds | 0.43 | % | |||||
Healthcare Revenue Bonds | 19.53 | % | |||||
Housing Revenue Bonds | 4.34 | % | |||||
Lease Revenue Bonds | 8.16 | % | |||||
Local General Obligation Bonds | 3.45 | % | |||||
Pre-Refunded Bonds | 6.04 | % | |||||
Resource Recovery Revenue Bond | 1.02 | % | |||||
Special Tax Revenue Bonds | 5.84 | % | |||||
State General Obligation Bonds | 5.92 | % | |||||
Transportation Revenue Bonds | 14.64 | % | |||||
Short-Term Investment | 0.71 | % | |||||
Total Value of Securities | 101.88 | % | |||||
Liabilities Net of Receivables and Other Assets | (1.88 | %) | |||||
Total Net Assets | 100.00 | % | |||||
*As of the date of this report, DelawareTax-Free California Fund held bonds issued by or on behalf of territories and the states of the US as follows:
| State / territory | Percentage of net assets | ||||||
California | 97.40 | % | |||||
Puerto Rico | 4.48 | % | |||||
Total Value of Securities | 101.88 | % | |||||
39
Table of Contents
| Security type / sector / state / territory allocations | ||
| DelawareTax-Free Colorado Fund | As of August 31, 2019 (Unaudited) | |
Sector designations may be different than the sector designations presented in other Fund materials.
| Security type / sector | Percentage of net assets | ||||||
Municipal Bonds* | 102.18 | % | |||||
Corporate Revenue Bonds | 1.45 | % | |||||
Education Revenue Bonds | 12.30 | % | |||||
Electric Revenue Bonds | 2.84 | % | |||||
Healthcare Revenue Bonds | 27.82 | % | |||||
Housing Revenue Bonds | 0.09 | % | |||||
Lease Revenue Bonds | 3.17 | % | |||||
Local General Obligation Bonds | 10.68 | % | |||||
Pre-Refunded Bonds | 9.09 | % | |||||
Special Tax Revenue Bonds | 21.92 | % | |||||
Transportation Revenue Bonds | 11.83 | % | |||||
Water & Sewer Revenue Bonds | 0.99 | % | |||||
Short-Term Investments | 1.01 | % | |||||
Total Value of Securities | 103.19 | % | |||||
Liabilities Net of Receivables and Other Assets | (3.19 | %) | |||||
Total Net Assets | 100.00 | % | |||||
*As of the date of this report, DelawareTax-Free Colorado Fund held bonds issued by or on behalf of territories and the states of the US as follows:
| State / territory | Percentage of net assets | ||||||
Colorado | 95.45 | % | |||||
Guam | 1.76 | % | |||||
Puerto Rico | 5.50 | % | |||||
US Virgin Islands | 0.48 | % | |||||
Total | 103.19 | % | |||||
40
Table of Contents
| Security type / sector / state / territory allocations | ||
| DelawareTax-Free Idaho Fund | As of August 31, 2019 (Unaudited) | |
Sector designations may be different than the sector designations presented in other Fund materials.
| Security type / sector | Percentage of net assets | ||||||
Municipal Bonds* | 98.24 | % | |||||
Corporate Revenue Bonds | 3.21 | % | |||||
Education Revenue Bonds | 16.28 | % | |||||
Electric Revenue Bonds | 3.79 | % | |||||
Healthcare Revenue Bonds | 11.87 | % | |||||
Housing Revenue Bonds | 3.98 | % | |||||
Lease Revenue Bonds | 8.15 | % | |||||
Local General Obligation Bonds | 25.00 | % | |||||
Pre-Refunded Bonds | 2.49 | % | |||||
Special Tax Revenue Bonds | 18.94 | % | |||||
Transportation Revenue Bonds | 3.20 | % | |||||
Water & Sewer Revenue Bonds | 1.33 | % | |||||
Short-Term Investments | 0.32 | % | |||||
Total Value of Securities | 98.56 | % | |||||
Receivables and Other Assets Net of Liabilities | 1.44 | % | |||||
Total Net Assets | 100.00 | % | |||||
*As of the date of this report, DelawareTax-Free Idaho Fund held bonds issued by or on behalf of territories and the states of the US as follows:
| State / territory | Percentage of net assets | ||||||
Guam | 5.17 | % | |||||
Idaho | 84.94 | % | |||||
Puerto Rico | 6.91 | % | |||||
US Virgin Islands | 1.54 | % | |||||
Total | 98.56 | % | |||||
41
Table of Contents
| Security type / sector / state / territory allocations | ||
| DelawareTax-Free New York Fund | As of August 31, 2019 (Unaudited) | |
Sector designations may be different than the sector designations presented in other Fund materials.
| Security type / sector | Percentage of net assets | ||||||
Municipal Bonds* | 98.81 | % | |||||
Corporate Revenue Bonds | 7.30 | % | |||||
Education Revenue Bonds | 20.50 | % | |||||
Electric Revenue Bonds | 4.34 | % | |||||
Healthcare Revenue Bonds. | 13.51 | % | |||||
Lease Revenue Bonds | 7.04 | % | |||||
Local General Obligation Bonds. | 3.60 | % | |||||
Pre-Refunded Bonds | 7.34 | % | |||||
Resource Recovery Revenue Bond | 1.80 | % | |||||
Special Tax Revenue Bonds | 17.76 | % | |||||
State General Obligation Bond | 0.56 | % | |||||
Transportation Revenue Bonds | 10.48 | % | |||||
Water & Sewer Revenue Bonds | 4.58 | % | |||||
Short-Term Investment | 0.67 | % | |||||
Total Value of Securities | 99.48 | % | |||||
Receivables and Other Assets Net of Liabilities | 0.52 | % | |||||
Total Net Assets | 100.00 | % | |||||
*As of the date of this report, DelawareTax-Free New York Fund held bonds issued by or on behalf of territories and the states of the US as follows:
|
| ||||||
| State / territory | Percentage of net assets | ||||||
Guam | 0.28 | % | |||||
New York | 93.81 | % | |||||
Puerto Rico | 5.39 | % | |||||
Total Value of Securities | 99.48 | % | |||||
42
Table of Contents
| Security type / sector / state / territory allocations | ||
| DelawareTax-Free Pennsylvania Fund | As of August 31, 2019 (Unaudited) | |
Sector designations may be different than the sector designations presented in other Fund materials.
| Security type / sector | Percentage of net assets | ||||||
Municipal Bonds* | 99.60 | % | |||||
Corporate Revenue Bonds | 6.94 | % | |||||
Education Revenue Bonds | 14.45 | % | |||||
Electric Revenue Bonds | 0.42 | % | |||||
Healthcare Revenue Bonds | 31.06 | % | |||||
Housing Revenue Bond | 0.46 | % | |||||
Lease Revenue Bonds | 1.40 | % | |||||
Local General Obligation Bonds | 8.59 | % | |||||
Pre-Refunded/Escrowed to Maturity Bonds | 11.71 | % | |||||
Special Tax Revenue Bonds | 8.51 | % | |||||
State General Obligation Bond | 3.32 | % | |||||
Transportation Revenue Bonds | 8.16 | % | |||||
Water & Sewer Revenue Bonds | 4.58 | % | |||||
Short-Term Investment | 0.36 | % | |||||
Total Value of Securities | 99.96 | % | |||||
Receivables and Other Assets Net of Liabilities | 0.04 | % | |||||
Total Net Assets | 100.00 | % | |||||
*As of the date of this report, DelawareTax-Free Pennsylvania Fund held bonds issued by or on behalf of territories and the states of the US as follows:
|
| ||||||
| State / territory | Percentage of net assets | ||||||
Pennsylvania | 95.83 | % | |||||
Puerto Rico | 4.13 | % | |||||
Total Value of Securities | 99.96 | % | |||||
43
Table of Contents
| Schedules of investments | ||
| DelawareTax-Free Arizona Fund | August 31, 2019 | |
| Principal amount° | Value (US $) | |||||||
| ||||||||
Municipal Bonds – 99.01% | ||||||||
| ||||||||
Corporate Revenue Bonds – 9.38% | ||||||||
Chandler Industrial Development Authority Revenue | ||||||||
(Intel Corporation Project) 2.70% 12/1/37 (AMT)● | 1,000,000 | $ | 1,045,330 | |||||
Maricopa County Pollution Control | ||||||||
(Public Service - Palo Verde Project) Series B 5.20% 6/1/43● | 1,500,000 | 1,542,330 | ||||||
Pima County Industrial Development Authority Pollution Control Revenue | ||||||||
(Tucson Electric Power) Series A 5.25% 10/1/40 | 2,000,000 | 2,073,980 | ||||||
Salt Verde Financial Senior Gas Revenue | ||||||||
5.00% 12/1/37 | 2,000,000 | 2,774,780 | ||||||
|
| |||||||
| 7,436,420 | ||||||||
|
| |||||||
Education Revenue Bonds – 31.86% | ||||||||
Arizona Health Facilities Authority Healthcare Education Revenue | ||||||||
(Kirksville College) 5.125% 1/1/30 | 1,500,000 | 1,517,820 | ||||||
Arizona Industrial Development Authority Revenue | ||||||||
(Academies of Math & Science Projects) Series A 5.00% 7/1/51 | 1,000,000 | 1,158,500 | ||||||
(ACCEL Schools Project) Series A 144A 5.25% 8/1/48 # | 350,000 | 377,331 | ||||||
(American Charter Schools Foundation Project) | ||||||||
144A 6.00% 7/1/47 # | 400,000 | 459,056 | ||||||
(Equitable School Revolving Fund) Series A 4.00% 11/1/49 | 1,600,000 | 1,770,608 | ||||||
(Pincrest Academy of Nevada-Horizon, Inspirada and St. | ||||||||
Rose Campus Projects) Series A 144A 5.75% 7/15/48 # | 250,000 | 282,745 | ||||||
Arizona State University Energy Management Revenue | ||||||||
(Arizona State University Tempe Campus II Project) | ||||||||
4.50% 7/1/24 | 1,000,000 | 1,002,370 | ||||||
Arizona State University System Revenue | ||||||||
(Green Bonds) Series A 5.00% 7/1/43 | 1,000,000 | 1,274,820 | ||||||
Glendale Industrial Development Authority Revenue | ||||||||
(Midwestern University) | ||||||||
5.00% 5/15/31 | 645,000 | 703,263 | ||||||
5.125% 5/15/40 | 1,305,000 | 1,336,555 | ||||||
Maricopa County Industrial Development Authority Revenue | ||||||||
(GreatHearts Arizona Projects) Series A 5.00% 7/1/52 | 725,000 | 856,145 | ||||||
(Reid Traditional Schools Projects) 5.00% 7/1/47 | 785,000 | 886,971 | ||||||
McAllister Academic Village Revenue | ||||||||
(Arizona State University Hassayampa Academic Village Project) 5.00% 7/1/31 | 1,000,000 | 1,228,520 | ||||||
44
Table of Contents
| Principal amount° | Value (US $) | |||||||
| ||||||||
Municipal Bonds(continued) | ||||||||
| ||||||||
Education Revenue Bonds(continued) | ||||||||
Northern Arizona University | ||||||||
5.00% 6/1/36 | 475,000 | $ | 502,208 | |||||
5.00% 6/1/41 | 1,240,000 | 1,309,056 | ||||||
Phoenix Industrial Development Authority | ||||||||
(Basis School Projects) 144A 5.00% 7/1/35 # | 500,000 | 546,075 | ||||||
(Choice Academies Project) 5.625% 9/1/42 | 1,250,000 | 1,312,850 | ||||||
(Eagle College Preparatory Project) Series A 5.00% 7/1/43 | 500,000 | 517,395 | ||||||
(Great Hearts Academic Project) 5.00% 7/1/46 | 1,000,000 | 1,109,350 | ||||||
(Rowan University Project) 5.00% 6/1/42 | 2,000,000 | 2,147,240 | ||||||
Pima County Industrial Development Authority Education Revenue | ||||||||
(American Leadership Academy Project) | ||||||||
144A 5.00% 6/15/47 # | 100,000 | 103,480 | ||||||
144A 5.00% 6/15/52 # | 90,000 | 93,011 | ||||||
(Edkey Charter School Project) 6.00% 7/1/48 | 1,000,000 | 1,003,380 | ||||||
(Tucson Country Day School Project) 5.00% 6/1/37 | 750,000 | 748,193 | ||||||
Tucson Industrial Development Authority Lease Revenue | ||||||||
(University ofArizona-Marshall Foundation) Series A | ||||||||
5.00% 7/15/27 (AMBAC) | 980,000 | 981,803 | ||||||
University of Arizona Board of Regents | ||||||||
Series A 4.00% 6/1/44 | 475,000 | 544,953 | ||||||
Series A 5.00% 6/1/38 | 1,000,000 | 1,114,080 | ||||||
Unrefunded Balance Series A 5.00% 6/1/25 | 335,000 | 368,879 | ||||||
|
| |||||||
| 25,256,657 | ||||||||
|
| |||||||
Electric Revenue Bonds – 6.66% | ||||||||
Puerto Rico Electric Power Authority Revenue | ||||||||
Series CCC 5.25% 7/1/27 ‡ | 170,000 | 136,425 | ||||||
Series WW 5.00% 7/1/28 ‡ | 245,000 | 196,000 | ||||||
Salt River Project Agricultural Improvement & Power District Electric System Revenue | ||||||||
Series A 5.00% 1/1/39 | 3,000,000 | 3,771,510 | ||||||
Series A 5.00% 12/1/45 | 1,000,000 | 1,176,180 | ||||||
|
| |||||||
| 5,280,115 | ||||||||
|
| |||||||
Healthcare Revenue Bonds – 17.90% | ||||||||
Arizona Health Facilities Authority Hospital System Revenue | ||||||||
(Banner Health) Series A 5.00% 1/1/43 | 500,000 | 538,235 | ||||||
(Phoenix Children’s Hospital) Series A 5.00% 2/1/34 | 995,000 | 1,074,948 | ||||||
(Scottsdale Lincoln Hospital Project) 5.00% 12/1/42 | 1,000,000 | 1,143,030 | ||||||
45
Table of Contents
Schedules of investments
DelawareTax-Free Arizona Fund
| Principal amount° | Value (US $) | |||||||
| ||||||||
Municipal Bonds(continued) | ||||||||
| ||||||||
Healthcare Revenue Bonds(continued) | ||||||||
Arizona Industrial Development Authority Revenue | ||||||||
(Great Lakes Senior Living Communities LLC Project First Tier) Series A 5.00% 1/1/54 | 145,000 | $ | 165,528 | |||||
(Great Lakes Senior Living Communities LLC Project Second Tier) | ||||||||
Series B 5.00% 1/1/49 | 55,000 | 61,683 | ||||||
Series B 5.125% 1/1/54 | 65,000 | 73,308 | ||||||
(Great Lakes Senior Living Communities LLC Project Third Tier) Series C 144A 5.00% 1/1/49 # | 500,000 | 528,190 | ||||||
Glendale Industrial Development Authority Revenue | ||||||||
(Glencroft Retirement Community Project) 5.00% 11/15/36 | 270,000 | 290,045 | ||||||
Maricopa County Industrial Development Authority Health Facilities Revenue | ||||||||
(Banner Health) | ||||||||
Series A 4.00% 1/1/41 | 1,000,000 | 1,125,800 | ||||||
Series A 4.00% 1/1/44 | 1,500,000 | 1,706,550 | ||||||
Maricopa County Industrial Development Authority Senior Living Facility Revenue | ||||||||
(Christian Care Surprise Project) 144A 6.00% 1/1/48 # | 405,000 | 431,086 | ||||||
Puerto Rico Industrial Tourist Educational Medical & Environmental Control Facilities Financing Authority | ||||||||
(Hospital Auxilio Mutuo Obligated Group Project) | ||||||||
Series A 6.00% 7/1/33 | 790,000 | 832,147 | ||||||
Tempe Industrial Development Authority Revenue | ||||||||
(Friendship Village) Series A 6.25% 12/1/42 | 1,200,000 | 1,275,012 | ||||||
(Mirabella at ASU Project) Series A 144A 6.125% 10/1/52 # | 250,000 | 287,273 | ||||||
Yavapai County Industrial Development Authority Hospital Facility | ||||||||
(Yavapai Regional Medical Center) 4.00% 8/1/43 | 1,500,000 | 1,678,275 | ||||||
Series A 5.25% 8/1/33 | 2,000,000 | 2,289,000 | ||||||
Yuma Industrial Development Authority Hospital Revenue | ||||||||
(Yuma Regional Medical Center) | ||||||||
Series A 5.00% 8/1/32 | 295,000 | 341,049 | ||||||
Series A 5.25% 8/1/32 | 300,000 | 350,658 | ||||||
|
| |||||||
| 14,191,817 | ||||||||
|
| |||||||
Lease Revenue Bonds – 3.00% | ||||||||
Arizona Game & Fish Department & Community Beneficial Interest Certificates | ||||||||
(Administration Building Project) 5.00% 7/1/32 | 1,000,000 | 1,002,720 | ||||||
46
Table of Contents
| Principal amount° | Value (US $) | |||||||
| ||||||||
Municipal Bonds(continued) | ||||||||
| ||||||||
Lease Revenue Bonds(continued) | ||||||||
Arizona Sports & Tourism Authority Senior Revenue | ||||||||
(Multipurpose Stadium Facility) Series A 5.00% 7/1/36 | 350,000 | $ | 372,855 | |||||
Maricopa County Industrial Development Authority Correctional Contract Revenue | ||||||||
(Phoenix West Prison) Series B 5.375% 7/1/22 (ACA) | 1,000,000 | 1,002,970 | ||||||
|
| |||||||
| 2,378,545 | ||||||||
|
| |||||||
Local General Obligation Bonds – 3.90% | ||||||||
Maricopa County High School District No. 214 Tolleson Union High School | ||||||||
(School Improvement Project) Series B 4.00% 7/1/37 | 1,300,000 | 1,498,484 | ||||||
Maricopa County School District No. 3 Tempe Elementary | ||||||||
(School Improvement Project) Series B 5.00% 7/1/30 | 560,000 | 726,942 | ||||||
Maricopa County Unified School District No. 95 Queen Creek | ||||||||
(School Improvement) 4.00% 7/1/35 | 500,000 | 579,860 | ||||||
Pinal County Community College District | ||||||||
4.00% 7/1/31 | 250,000 | 285,195 | ||||||
|
| |||||||
| 3,090,481 | ||||||||
|
| |||||||
Pre-Refunded Bonds – 4.04% | ||||||||
Phoenix Civic Improvement Airport Revenue | ||||||||
(Junior Lien) Series A 5.25%7/1/33-20 § | 1,250,000 | 1,292,887 | ||||||
Phoenix Industrial Development Authority | ||||||||
(Great Hearts Academic Project) | ||||||||
6.30%7/1/42-21 § | 500,000 | 546,745 | ||||||
6.40%7/1/47-21 § | 500,000 | 547,645 | ||||||
Pinal County Electric District No. 3 | ||||||||
Series A 5.25%7/1/41-21 § | 750,000 | 806,640 | ||||||
University of Arizona Board of Regents | ||||||||
Series A 5.00%6/1/25-22 § | 10,000 | 11,076 | ||||||
|
| |||||||
| 3,204,993 | ||||||||
|
| |||||||
Special Tax Revenue Bonds – 10.61% | ||||||||
Glendale Municipal Property Excise Tax Revenue | ||||||||
(Senior Lien) Series B 5.00% 7/1/33 | 570,000 | 632,711 | ||||||
Glendale Transportation Excise Tax Revenue | ||||||||
5.00% 7/1/30 (AGM) | 1,000,000 | 1,195,890 | ||||||
Guam Government Business Privilege Tax Revenue | ||||||||
Series A 5.125% 1/1/42 | 545,000 | 573,542 | ||||||
Series A 5.25% 1/1/36 | 705,000 | 747,942 | ||||||
Puerto Rico Sales Tax Financing Revenue | ||||||||
(Capital Appreciation - Restructured) | ||||||||
SeriesA-1 5.375% 7/1/46 ^ | 1,870,000 | 502,170 | ||||||
SeriesA-1 5.625% 7/1/51 ^ | 4,715,000 | 916,313 | ||||||
47
Table of Contents
Schedules of investments
DelawareTax-Free Arizona Fund
| Principal amount° | Value (US $) | |||||||
| ||||||||
Municipal Bonds(continued) | ||||||||
| ||||||||
Special Tax Revenue Bonds(continued) | ||||||||
Puerto Rico Sales Tax Financing Revenue | ||||||||
(Restructured) | ||||||||
SeriesA-1 4.75% 7/1/53 | 2,045,000 | $ | 2,101,871 | |||||
SeriesA-1 5.00% 7/1/58 | 115,000 | 120,193 | ||||||
SeriesA-2 4.536% 7/1/53 | 1,000,000 | 1,016,220 | ||||||
Regional Public Transportation Authority | ||||||||
(Maricopa County Public Transportation) 5.25% 7/1/24 | 500,000 | 598,710 | ||||||
|
| |||||||
| 8,405,562 | ||||||||
|
| |||||||
Transportation Revenue Bonds – 5.27% | ||||||||
Arizona Department of Transportation State Highway Fund Revenue | ||||||||
5.00% 7/1/35 | 500,000 | 610,750 | ||||||
Phoenix Civic Improvement Airport Revenue | ||||||||
Series B 5.00% 7/1/37 | 1,000,000 | 1,232,920 | ||||||
(Senior Lien) | ||||||||
4.00% 7/1/48 (AMT) | 500,000 | 554,605 | ||||||
5.00% 7/1/32 (AMT) | 500,000 | 562,795 | ||||||
Series A 5.00% 7/1/36 (AMT) | 1,000,000 | 1,219,320 | ||||||
|
| |||||||
| 4,180,390 | ||||||||
|
| |||||||
Water & Sewer Revenue Bonds – 6.39% | ||||||||
Arizona Water Infrastructure Finance Authority | ||||||||
(Water Quality Revenue) Series A 5.00% 10/1/26 | 1,000,000 | 1,191,870 | ||||||
Central Arizona Water Conservation District | ||||||||
(Central Arizona Project) 5.00% 1/1/31 | 600,000 | 729,756 | ||||||
Guam Government Waterworks Authority Revenue | ||||||||
5.00% 7/1/37 | 250,000 | 292,503 | ||||||
Mesa Utility System Revenue | ||||||||
4.00% 7/1/31 | 850,000 | 979,098 | ||||||
Phoenix Civic Improvement Corporation | ||||||||
(Junior Lien) | ||||||||
5.00% 7/1/27 | 1,000,000 | 1,251,440 | ||||||
5.00% 7/1/31 | 500,000 | 616,455 | ||||||
|
| |||||||
| 5,061,122 | ||||||||
|
| |||||||
Total Municipal Bonds(cost $73,355,561) | 78,486,102 | |||||||
|
| |||||||
48
Table of Contents
| Principal amount° | Value (US $) | |||||||
| ||||||||
Short-Term Investment – 0.25% | ||||||||
| ||||||||
Variable Rate Demand Note – 0.25%¤ | ||||||||
Phoenix Industrial Development Authority | ||||||||
(Mayo Clinic) Series B 1.35% 11/15/52 (SPA - Wells Fargo Bank N.A.) | 200,000 | $ | 200,000 | |||||
|
| |||||||
Total Short-Term Investment(cost $200,000) | 200,000 | |||||||
|
| |||||||
Total Value of Securities – 99.26% | $ | 78,686,102 | ||||||
|
| |||||||
| # | Security exempt from registration under Rule 144A of the Securities Act of 1933, as amended. At Aug. 31, 2019, the aggregate value of Rule 144A securities was $3,108,247, which represents 3.92% of the Fund’s net assets. See Note 8 in “Notes to financial statements.” |
| ¤ | Tax-exempt obligations that contain a floating or variable interest rate adjustment formula and an unconditional right of demand to receive payment of the unpaid principal balance plus accrued interest upon a short notice period (generally up to 30 days) prior to specified dates either from the issuer or by drawing on a bank letter of credit, a guarantee, or insurance issued with respect to such instrument. Each rate shown is as of Aug. 31, 2019. |
| § | Pre-refunded bonds. Municipal bonds that are generally backed or secured by US Treasury bonds. Forpre-refunded bonds, the stated maturity is followed by the year in which the bond will bepre-refunded. See Note 8 in “Notes to financial statements.” |
| ° | Principal amount shown is stated in USD unless noted that the security is denominated in another currency. |
| ‡ | Non-income producing security. Security is currently in default. |
| ● | Variable rate investment. Rates reset periodically. Rate shown reflects the rate in effect at Aug. 31, 2019. For securities based on a published reference rate and spread, the reference rate and spread are indicated in their description above. The reference rate descriptions (i.e. LIBOR03M, LIBOR06M, etc.) used in this report are identical for different securities, but the underlying reference rates may differ due to the timing of the reset period. Certain variable rate securities are not based on a published reference rate and spread but are determined by the issuer or agent and are based on current market conditions, or for mortgage-backed securities, are impacted by the individual mortgages which are paying off over time. These securities do not indicate a reference rate and spread in their description above. |
| ^ | Zero-coupon security. The rate shown is the effective yield at the time of purchase. |
49
Table of Contents
Schedules of investments
DelawareTax-Free Arizona Fund
Summary of abbreviations:
ACA – Insured by American Capital Access
AGM – Insured by Assured Guaranty Municipal Corporation
AMBAC – Insured by AMBAC Assurance Corporation
AMT – Subject to Alternative Minimum Tax
LIBOR – London Interbank Offered Rate
LIBOR03M – ICE LIBOR USD 3 Month
LIBOR06M – ICE LIBOR USD 6 Month
N.A. – National Association
SPA –Stand-by Purchase Agreement
USD – US Dollar
See accompanying notes, which are an integral part of the financial statements.
50
Table of Contents
| Schedules of investments | ||
| DelawareTax-Free California Fund | August 31, 2019 | |
| Principal amount° | Value (US $) | |||||||
| ||||||||
Municipal Bonds – 101.17% | ||||||||
| ||||||||
Corporate Revenue Bonds – 3.97% | ||||||||
Golden State Tobacco Securitization Settlement Revenue | ||||||||
(Asset-Backed) | ||||||||
SeriesA-1 5.25% 6/1/47 | 750,000 | $ | 774,263 | |||||
SeriesA-2 5.00% 6/1/47 | 2,000,000 | 2,051,320 | ||||||
(Capital Appreciation Asset-Backed) Subordinate Series B 1.548% 6/1/47 ^ | 1,615,000 | 277,392 | ||||||
M-S-R Energy Authority Revenue | ||||||||
Series B 6.50% 11/1/39 | 500,000 | 799,740 | ||||||
|
| |||||||
| 3,902,715 | ||||||||
|
| |||||||
Education Revenue Bonds – 27.83% | ||||||||
California Educational Facilities Authority | ||||||||
(Loma Linda University) Series A 5.00% 4/1/47 | 1,000,000 | 1,184,040 | ||||||
(Stanford University) SeriesV-1 5.00% 5/1/49 | 2,500,000 | 3,980,925 | ||||||
California Infrastructure & Economic Development Bank | ||||||||
(Equitable School Revolving Fund) | ||||||||
Series B 5.00% 11/1/39 | 300,000 | 376,278 | ||||||
Series B 5.00% 11/1/44 | 350,000 | 434,479 | ||||||
Series B 5.00% 11/1/49 | 500,000 | 616,525 | ||||||
California Municipal Finance Authority | ||||||||
(Bella Mente Montessori Academy Project) Series A 144A 5.00% 6/1/48 # | 500,000 | 580,750 | ||||||
(Biola University) 5.00% 10/1/39 | 1,000,000 | 1,201,890 | ||||||
(California Baptist University) Series A 144A 5.375% 11/1/40 # | 1,000,000 | 1,164,980 | ||||||
(CHF - Davis I, LLC - West Village Student Housing Project) 5.00% 5/15/48 | 1,000,000 | 1,205,700 | ||||||
(CHF - Riverside II, LLC - UCR North District Phase I | ||||||||
Student Housing Project) 5.00% 5/15/44 (BAM) | 500,000 | 625,035 | ||||||
(Creative Center of Los Altos Project - Pinewood School & Oakwood School) Series B 144A 4.50% 11/1/46 # | 500,000 | 528,800 | ||||||
(Julian Charter School Project) Series A 144A 5.625% 3/1/45 # | 500,000 | 523,140 | ||||||
(Southwestern Law School) 6.50% 11/1/41 | 1,140,000 | 1,270,473 | ||||||
California Public Finance Authority Educational Facilities Revenue | ||||||||
(Trinity Classical Academy Project) | ||||||||
Series A 144A 5.00% 7/1/44 # | 350,000 | 373,492 | ||||||
Series A 144A 5.00% 7/1/54 # | 500,000 | 529,420 | ||||||
California School Finance Authority | ||||||||
(Aspire Public Schools - Obligated Group) Series A 144A 5.00% 8/1/45 # | 715,000 | 806,191 | ||||||
(Encore Education Obligated Group) Series A 144A 5.00% 6/1/42 # | 500,000 | 464,065 | ||||||
51
Table of Contents
Schedules of investments
DelawareTax-Free California Fund
| Principal amount° | Value (US $) | |||||||
| ||||||||
Municipal Bonds(continued) | ||||||||
| ||||||||
Education Revenue Bonds(continued) | ||||||||
California School Finance Authority | ||||||||
(Escuela Popular Project) 144A 6.50% 7/1/50 # | 250,000 | $ | 262,943 | |||||
(Green Dot Public Schools Project) Series A 144A 5.00% 8/1/35 # | 1,000,000 | 1,149,030 | ||||||
(Grimmway Schools - Obligated Group) Series A 144A 5.00% 7/1/36 # | 500,000 | 554,120 | ||||||
(ICEF - View Park Elementary & Middle Schools) Series A 5.625% 10/1/34 | 575,000 | 646,703 | ||||||
(KIPP LA Projects) Series A 5.125% 7/1/44 | 1,000,000 | 1,119,810 | ||||||
(KIPP SoCal Projects) Series A 144A 5.00% 7/1/49 # | 1,000,000 | 1,213,230 | ||||||
(Partnerships to Uplift Communities Valley Project) Series A 144A 6.75% 8/1/44 # | 1,000,000 | 1,132,970 | ||||||
California State University Systemwide Revenue | ||||||||
Series A 5.00% 11/1/47 | 1,000,000 | 1,220,420 | ||||||
California Statewide Communities Development Authority Charter School Revenue | ||||||||
(Green Dot Public Schools - Animo Inglewood Charter High School Project) Series A 7.25% 8/1/41 | 800,000 | 875,864 | ||||||
California Statewide Communities Development Authority Revenue | ||||||||
(California Baptist University) Series A 6.125% 11/1/33 | 750,000 | 877,740 | ||||||
(NCCD - Hooper Street LLC - California College of the Arts Project) 144A 5.25% 7/1/49 # | 250,000 | 290,157 | ||||||
California Statewide Communities Development Authority Student Housing Revenue | ||||||||
(University of California Irvine East Campus Apartments) 5.375% 5/15/38 | 1,000,000 | 1,072,790 | ||||||
Mt. San Antonio Community College District Convertible | ||||||||
Capital Appreciation Election 2008 | ||||||||
Series A 0.00% 8/1/28 ~ | 1,000,000 | 1,101,550 | ||||||
|
| |||||||
| 27,383,510 | ||||||||
|
| |||||||
Electric Revenue Bonds – 0.43% | ||||||||
Puerto Rico Electric Power Authority Revenue | ||||||||
Series CCC 5.25% 7/1/27 ‡ | 220,000 | 176,550 | ||||||
Series WW 5.00% 7/1/28 ‡ | 310,000 | 248,000 | ||||||
|
| |||||||
| 424,550 | ||||||||
|
| |||||||
Healthcare Revenue Bonds – 19.53% | ||||||||
Abag Finance Authority for Nonprofit Corporations | ||||||||
(Episcopal Senior Communities) 6.125% 7/1/41 | 850,000 | 917,125 | ||||||
(Sharp HealthCare) Series A 5.00% 8/1/28 | 250,000 | 272,020 | ||||||
California Health Facilities Financing Authority Revenue | ||||||||
(Cedars-Sinai Medical Center) Series B 4.00% 8/15/36 | 1,000,000 | 1,123,800 | ||||||
52
Table of Contents
| Principal amount° | Value (US $) | |||||||
| ||||||||
Municipal Bonds(continued) | ||||||||
| ||||||||
Healthcare Revenue Bonds(continued) | ||||||||
California Health Facilities Financing Authority Revenue | ||||||||
(Children’s Hospital Los Angeles) | ||||||||
Series A 5.00% 11/15/34 | 500,000 | $ | 550,135 | |||||
Series A 5.00% 8/15/47 | 500,000 | 598,725 | ||||||
(Dignity Health) Series E 5.625% 7/1/25 | 1,000,000 | 1,007,060 | ||||||
(Kaiser Permanente) Subordinate SeriesA-2 4.00% 11/1/44 | 2,005,000 | 2,253,981 | ||||||
(Lucile Salter Packard Children’s Hospital at Stanford) Series A 5.00% 11/15/56 | 1,000,000 | 1,221,580 | ||||||
(Sutter Health) Series D 5.25% 8/15/31 | 1,000,000 | 1,079,100 | ||||||
California Municipal Finance Authority Revenue | ||||||||
(Community Medical Centers) | ||||||||
Series A 5.00% 2/1/42 | 750,000 | 895,455 | ||||||
Series A 5.00% 2/1/47 | 250,000 | 296,623 | ||||||
(Northbay Healthcare Group) Series A 5.25% 11/1/47 | 500,000 | 582,680 | ||||||
California Statewide Communities Development Authority Revenue | ||||||||
(Adventist Health System/West) Series A 4.00% 3/1/48 | 1,000,000 | 1,097,250 | ||||||
(BE.Group) 144A 7.25% 11/15/41 # | 500,000 | 506,120 | ||||||
(Covenant Retirement Communities) Series C 5.625% 12/1/36 | 1,000,000 | 1,163,070 | ||||||
(Episcopal Communities & Services) 5.00% 5/15/32 | 600,000 | 655,698 | ||||||
(Huntington Memorial Hospital) 4.00% 7/1/48 | 500,000 | 545,535 | ||||||
(Loma Linda University Medical Center) Series A 144A 5.50% 12/1/58 # | 400,000 | 477,060 | ||||||
(Marin General Hospital - Green Bonds) Series A 4.00% 8/1/45 | 500,000 | 524,835 | ||||||
(Redlands Community Hospital) 5.00% 10/1/46 | 1,000,000 | 1,171,250 | ||||||
La Verne | ||||||||
(Brethren Hillcrest Homes) 5.00% 5/15/36 | 750,000 | 801,127 | ||||||
Palomar Health | ||||||||
5.00% 11/1/47 (AGM) | 500,000 | 598,895 | ||||||
San Buenaventura | ||||||||
(Community Memorial Health System) 7.50% 12/1/41 | 785,000 | 878,792 | ||||||
|
| |||||||
| 19,217,916 | ||||||||
|
| |||||||
Housing Revenue Bonds – 4.34% | ||||||||
California Municipal Finance Authority Mobile Home Park Revenue | ||||||||
(Caritas Projects) | ||||||||
Series A 4.00% 8/15/42 | 1,270,000 | 1,352,715 | ||||||
Series A 5.50% 8/15/47 | 750,000 | 808,890 | ||||||
53
Table of Contents
Schedules of investments
DelawareTax-Free California Fund
| Principal amount° | Value (US $) | |||||||
| ||||||||
Municipal Bonds(continued) | ||||||||
| ||||||||
Housing Revenue Bonds(continued) | ||||||||
Independent Cities Finance Authority Mobile Home Park Revenue | ||||||||
(Pillar Ridge) Series A 5.25% 5/15/44 | 1,000,000 | $ | 1,103,850 | |||||
Santa Clara County Multifamily Housing Authority Revenue | ||||||||
(RiverTown Apartments Project) Series A 5.85% 8/1/31 (AMT) | 1,000,000 | 1,001,780 | ||||||
|
| |||||||
| 4,267,235 | ||||||||
|
| |||||||
Lease Revenue Bonds – 8.16% | ||||||||
Abag Finance Authority for Nonprofit Corporations | ||||||||
(Jackson Laboratory) 5.00% 7/1/37 | 1,000,000 | 1,098,020 | ||||||
California Infrastructure & Economic Development Bank | ||||||||
(Academy of Motion Picture Arts & Sciences Obligated Group) Series A 5.00% 11/1/41 | 1,000,000 | 1,136,340 | ||||||
California Municipal Finance Authority | ||||||||
(Goodwill Industry of Sacramento Valley & Northern Nevada Project) 5.00% 1/1/35 | 635,000 | 644,138 | ||||||
California Pollution Control Financing Authority Revenue | ||||||||
(San Diego County Water Authority Desalination Project Pipeline) 144A 5.00% 11/21/45 # | 1,000,000 | 1,210,470 | ||||||
California State Public Works Board Lease Revenue | ||||||||
(Department of Corrections and Rehabilitation) Series C 5.00% 10/1/26 | 1,000,000 | 1,080,600 | ||||||
California Statewide Communities Development Authority Revenue | ||||||||
(Lancer Plaza Project) 5.625% 11/1/33 | 1,000,000 | 1,140,920 | ||||||
Golden State Tobacco Securitization Settlement Revenue | ||||||||
(Enhanced Asset-Backed) Series A 5.00% 6/1/29 | 1,000,000 | 1,145,800 | ||||||
San Jose Financing Authority Lease Revenue | ||||||||
(Civic Center Project) Series A 5.00% 6/1/33 | 500,000 | 570,670 | ||||||
|
| |||||||
| 8,026,958 | ||||||||
|
| |||||||
Local General Obligation Bonds – 3.45% | ||||||||
Anaheim School District Capital Appreciation Election 2002 | ||||||||
4.58% 8/1/25 (NATL) ^ | 1,000,000 | 910,350 | ||||||
California Enterprise Development Authority Lease Revenue | ||||||||
(Riverside County Library Facilities Project) 4.00% 11/1/49 | 210,000 | 230,527 | ||||||
Marin Healthcare District Election 2013 | ||||||||
Series A 4.00% 8/1/47 | 1,000,000 | 1,123,050 | ||||||
San Francisco Bay Area Rapid Transit District Election of 2016 | ||||||||
(Green Bonds) SeriesB-1 4.00% 8/1/44 | 500,000 | 586,240 | ||||||
54
Table of Contents
| Principal amount° | Value (US $) | |||||||
| ||||||||
Municipal Bonds(continued) | ||||||||
| ||||||||
Local General Obligation Bonds(continued) | ||||||||
West Contra Costa Unified School District 2012 Election | ||||||||
Series C 4.00% 8/1/41 | 500,000 | $ | 550,425 | |||||
|
| |||||||
| 3,400,592 | ||||||||
|
| |||||||
Pre-Refunded Bonds – 6.04% | ||||||||
Anaheim Public Financing Authority Revenue | ||||||||
(Anaheim Electric System Distribution Facilities) Series A 5.00%10/1/25-21 § | 800,000 | 852,608 | ||||||
California Municipal Finance Authority Mobile Home Park Revenue | ||||||||
(Caritas Projects) Series A 6.40%8/15/45-20 § | 935,000 | 982,657 | ||||||
Imperial Irrigation District Electric System Revenue | ||||||||
Series B 5.00%11/1/36-20 § | 250,000 | 261,843 | ||||||
Pittsburg Unified School District Financing Authority Revenue | ||||||||
(Pittsburg Unified School District Bond Program) 5.50%9/1/46-21 (AGM) § | 800,000 | 871,816 | ||||||
Rancho Santa Fe Community Services District Financing Authority Revenue | ||||||||
(Superior Lien Bonds) Series A 5.75%9/1/30-21 § | 800,000 | 876,584 | ||||||
Riverside County Redevelopment Agency Tax Allocation Housing | ||||||||
Series A 6.00%10/1/39-20 § | 1,000,000 | 1,054,650 | ||||||
San Diego Public Facilities Financing Authority Lease Revenue | ||||||||
(Master Refunding Project) Series A 5.25%3/1/40-20 § | 1,000,000 | 1,043,560 | ||||||
|
| |||||||
| 5,943,718 | ||||||||
|
| |||||||
Resource Recovery Revenue Bond – 1.02% | ||||||||
South Bayside Waste Management Authority Revenue | ||||||||
(Shoreway Environmental Center) Series A 6.00% 9/1/36 | 1,000,000 | 1,000,000 | ||||||
|
| |||||||
| 1,000,000 | ||||||||
|
| |||||||
Special Tax Revenue Bonds – 5.84% | ||||||||
Puerto Rico Sales Tax Financing Revenue | ||||||||
(Capital Appreciation - Restructured) | ||||||||
SeriesA-1 5.375% 7/1/46 ^ | 1,895,000 | 508,883 | ||||||
SeriesA-1 5.625% 7/1/51 ^ | 2,160,000 | 419,774 | ||||||
(Restructured) | ||||||||
SeriesA-1 4.75% 7/1/53 | 1,745,000 | 1,793,528 | ||||||
SeriesA-1 5.00% 7/1/58 | 1,210,000 | 1,264,643 | ||||||
Sacramento Transient Occupancy Tax Revenue | ||||||||
(Convention Center Complex) Senior Series A 5.00% 6/1/48 | 1,000,000 | 1,220,220 | ||||||
55
Table of Contents
Schedules of investments
DelawareTax-Free California Fund
| Principal amount° | Value (US $) | |||||||
| ||||||||
Municipal Bonds(continued) | ||||||||
| ||||||||
Special Tax Revenue Bonds(continued) | ||||||||
Yucaipa Special Tax Community Facilities DistrictNo. 98-1 | ||||||||
(Chapman Heights) 5.375% 9/1/30 | 500,000 | $ | 537,160 | |||||
|
| |||||||
| 5,744,208 | ||||||||
|
| |||||||
State General Obligation Bonds – 5.92% | ||||||||
California | ||||||||
(Various Purpose) | ||||||||
5.00% 4/1/32 | 300,000 | 422,799 | ||||||
5.00% 8/1/46 | 1,000,000 | 1,210,270 | ||||||
5.25% 3/1/30 | 1,000,000 | 1,020,690 | ||||||
5.25% 4/1/35 | 1,000,000 | 1,106,550 | ||||||
5.25% 11/1/40 | 1,000,000 | 1,046,650 | ||||||
6.00% 3/1/33 | 1,000,000 | 1,024,310 | ||||||
|
| |||||||
| 5,831,269 | ||||||||
|
| |||||||
Transportation Revenue Bonds – 14.64% | ||||||||
Alameda Corridor Transportation Authority | ||||||||
(2nd Subordinate Lien) Series B 5.00% 10/1/37 | 500,000 | 592,845 | ||||||
California Municipal Finance Authority Senior Lien | ||||||||
(LINXS APM Project) Series A 5.00% 12/31/47 (AMT) | 645,000 | 776,625 | ||||||
Long Beach Marina Revenue | ||||||||
(Alamitos Bay Marina Project) 5.00% 5/15/45 | 500,000 | 568,250 | ||||||
Los Angeles Department of Airports | ||||||||
(Los Angeles International Airport) | ||||||||
Senior Series D 5.00% 5/15/36 (AMT) | 1,000,000 | 1,170,870 | ||||||
Subordinate Series B 5.00% 5/15/33 | 1,000,000 | 1,027,710 | ||||||
Riverside County Transportation Commission Senior Lien | ||||||||
(Current Interest Obligations) Series A 5.75% 6/1/44 | 500,000 | 559,705 | ||||||
Sacramento County Airport System Revenue | ||||||||
Series C 5.00% 7/1/39 (AMT) | 1,000,000 | 1,228,560 | ||||||
Subordinate Series B 5.00% 7/1/41 | 500,000 | 598,415 | ||||||
San Diego County Regional Airport Authority Revenue | ||||||||
Subordinate Series A 5.00% 7/1/47 | 375,000 | 456,450 | ||||||
San Diego Redevelopment Agency | ||||||||
(Centre City Redevelopment Project) Series A 6.40% 9/1/25 | 870,000 | 873,611 | ||||||
San Francisco City & County Airports Commission | ||||||||
(San Francisco International Airport) | ||||||||
Second Series A 5.00% 5/1/49 (AMT) | 1,000,000 | 1,224,730 | ||||||
Second Series B 5.00% 5/1/46 (AMT) | 1,000,000 | 1,176,640 | ||||||
Second Series E 5.00% 5/1/50 (AMT) | 2,500,000 | 3,057,925 | ||||||
56
Table of Contents
| Principal amount° | Value (US $) | |||||||
| ||||||||
Municipal Bonds (continued) | ||||||||
| ||||||||
Transportation Revenue Bonds (continued) | ||||||||
San Francisco Municipal Transportation Agency Revenue | ||||||||
Series B 5.00% 3/1/37 | 1,000,000 | $ | 1,095,570 | |||||
|
| |||||||
| 14,407,906 | ||||||||
|
| |||||||
Total Municipal Bonds(cost $92,019,996) | 99,550,577 | |||||||
|
| |||||||
| ||||||||
Short-Term Investment – 0.71% | ||||||||
| ||||||||
Variable Rate Demand Note – 0.71%¤ | ||||||||
Los Angeles Department of Water & Power Revenue | ||||||||
SubseriesB-3 | ||||||||
1.17% 7/1/34 (SPA - Barclays Bank PLC) | 700,000 | 700,000 | ||||||
|
| |||||||
Total Short-Term Investment(cost $700,000) | 700,000 | |||||||
|
| |||||||
Total Value of Securities – 101.88% | $ | 100,250,577 | ||||||
|
| |||||||
| # | Security exempt from registration under Rule 144A of the Securities Act of 1933, as amended. At Aug. 31, 2019, the aggregate value of Rule 144A securities was $11,766,938, which represents 11.96% of the Fund’s net assets. See Note 8 in “Notes to financial statements.” |
| ¤ | Tax-exempt obligations that contain a floating or variable interest rate adjustment formula and an unconditional right of demand to receive payment of the unpaid principal balance plus accrued interest upon a short notice period (generally up to 30 days) prior to specified dates either from the issuer or by drawing on a bank letter of credit, a guarantee, or insurance issued with respect to such instrument. Each rate shown is as of Aug. 31, 2019. |
| § | Pre-refunded bonds. Municipal bonds that are generally backed or secured by US Treasury bonds. Forpre-refunded bonds, the stated maturity is followed by the year in which the bond will bepre-refunded. See Note 8 in “Notes to financial statements.” |
| ° | Principal amount shown is stated in USD unless noted that the security is denominated in another currency. |
| ‡ | Non-income producing security. Security is currently in default. |
| ^ | Zero-coupon security. The rate shown is the effective yield at the time of purchase. |
| ~ | Step-up bond that pays an initial coupon rate for the first period and then a higher coupon rate for the following periods. Stated rate in effect at Aug. 31, 2019. |
Summary of abbreviations:
AGM – Insured by Assured Guaranty Municipal Corporation
AMT – Subject to Alternative Minimum Tax
BAM – Insured by Build America Mutual Assurance
CHF – Collegiate Housing Foundation
ICEF – Inner City Education Foundation
LLC – Limited Liability Corporation
57
Table of Contents
Schedules of investments
DelawareTax-Free California Fund
Summary of abbreviations (continued):
NATL – Insured by National Public Finance Guarantee Corporation
NCCD – National Campus and Community Development
PLC – Public Limited Company
SPA –Stand-by Purchase Agreement
UCR – University of California Riverside
USD – US Dollar
See accompanying notes, which are an integral part of the financial statements.
58
Table of Contents
| Schedules of investments | ||
| DelawareTax-Free Colorado Fund | August 31, 2019 | |
| Principal amount° | Value (US $) | |||||||
| ||||||||
Municipal Bonds – 102.18% | ||||||||
| ||||||||
Corporate Revenue Bonds – 1.45% | ||||||||
Denver City & County | ||||||||
(United Airlines Project) 5.00% 10/1/32 (AMT) | 415,000 | $ | 457,504 | |||||
Public Authority for Colorado Energy Natural Gas Revenue | ||||||||
6.50% 11/15/38 | 1,750,000 | 2,729,563 | ||||||
|
| |||||||
| 3,187,067 | ||||||||
|
| |||||||
Education Revenue Bonds – 12.30% | ||||||||
Board of Governors of the Colorado State University System Enterprise Revenue | ||||||||
Series A 5.00% 3/1/43 | 2,480,000 | 3,542,258 | ||||||
Board of Trustees For Colorado Mesa University Enterprise Revenue | ||||||||
Series B 5.00% 5/15/44 | 1,000,000 | 1,253,940 | ||||||
Series B 5.00% 5/15/49 | 750,000 | 934,537 | ||||||
Colorado Educational & Cultural Facilities Authority Revenue | ||||||||
(Academy Charter School Project) 5.50% 5/1/36 (AGC) | 2,280,000 | 2,286,521 | ||||||
(Alexander Dawson School-Nevada Project) 5.00% 5/15/29 | 1,490,000 | 1,809,903 | ||||||
(Aspen Ridge School Project) | ||||||||
Series A 144A 5.00% 7/1/36 # | 500,000 | 539,190 | ||||||
Series A 144A 5.25% 7/1/46 # | 1,350,000 | 1,452,816 | ||||||
(Atlas Preparatory Charter School) 144A 5.25% 4/1/45 # | 1,300,000 | 1,357,980 | ||||||
(Charter School Project) 5.00% 7/15/37 | 1,150,000 | 1,255,029 | ||||||
(Community Leadership Academy, Inc. Second Campus Project) 7.45% 8/1/48 | 1,000,000 | 1,145,040 | ||||||
(Johnson & Wales University) Series A 5.25% 4/1/37 | 1,790,000 | 1,943,868 | ||||||
(Liberty Common Charter School Project) Series A 5.00% 1/15/39 | 1,000,000 | 1,109,350 | ||||||
(Littleton Preparatory Charter School Project) | ||||||||
5.00% 12/1/33 | 450,000 | 470,070 | ||||||
5.00% 12/1/42 | 540,000 | 558,392 | ||||||
(Loveland Classical Schools Project) | ||||||||
144A 5.00% 7/1/36 # | 625,000 | 676,319 | ||||||
144A 5.00% 7/1/46 # | 500,000 | 532,345 | ||||||
(Pinnacle Charter School Project) 5.00% 6/1/26 | 700,000 | 778,491 | ||||||
(Science Technology Engineering and Math Stem School Project) 5.00% 11/1/44 | 890,000 | 937,001 | ||||||
(Skyview Charter School) | ||||||||
144A 5.375% 7/1/44 # | 860,000 | 914,859 | ||||||
144A 5.50% 7/1/49 # | 870,000 | 928,273 | ||||||
(University of Denver Project) | ||||||||
Series A 4.00% 3/1/35 | 400,000 | 454,752 | ||||||
Series A 4.00% 3/1/36 | 550,000 | 623,717 | ||||||
59
Table of Contents
Schedules of investments
DelawareTax-Free Colorado Fund
| Principal amount° | Value (US $) | |||||||
| ||||||||
Municipal Bonds(continued) | ||||||||
| ||||||||
Education Revenue Bonds(continued) | ||||||||
Colorado Educational & Cultural Facilities Authority Revenue | ||||||||
(University of Lab Charter School) 5.00% 12/15/45 | 500,000 | $ | 542,790 | |||||
(Vail Mountain School Project) 4.00% 5/1/46 | 80,000 | 82,986 | ||||||
(Windsor Charter Academy Project) 144A 5.00% 9/1/46 # | 890,000 | 905,335 | ||||||
|
| |||||||
| 27,035,762 | ||||||||
|
| |||||||
Electric Revenue Bonds – 2.84% | ||||||||
Loveland Colorado Electric & Communications Enterprise Revenue | ||||||||
Series A 5.00% 12/1/44 | 1,000,000 | 1,234,710 | ||||||
Platte River Power Authority Revenue | ||||||||
Series JJ 5.00% 6/1/27 | 3,300,000 | 4,113,945 | ||||||
Puerto Rico Electric Power Authority Revenue | ||||||||
Series CCC 5.25% 7/1/27 ‡ | 465,000 | 373,163 | ||||||
Series WW 5.00% 7/1/28 ‡ | 660,000 | 528,000 | ||||||
|
| |||||||
| 6,249,818 | ||||||||
|
| |||||||
Healthcare Revenue Bonds – 27.82% | ||||||||
Colorado Health Facilities Authority Revenue | ||||||||
(AdventHealth Obligated Group) Series A 4.00% 11/15/43 | 4,000,000 | 4,581,680 | ||||||
(American Baptist) | ||||||||
7.625% 8/1/33 | 150,000 | 170,923 | ||||||
8.00% 8/1/43 | 1,000,000 | 1,144,070 | ||||||
(Bethesda Project) SeriesA-1 5.00% 9/15/48 | 2,250,000 | 2,569,207 | ||||||
(Christian Living Community Project) | ||||||||
5.25% 1/1/37 | 1,500,000 | 1,583,145 | ||||||
6.375% 1/1/41 | 1,000,000 | 1,087,660 | ||||||
(CommonSpirit Health) | ||||||||
SeriesA-1 4.00% 8/1/39 | 2,000,000 | 2,243,900 | ||||||
SeriesA-1 4.00% 8/1/44 | 2,000,000 | 2,216,240 | ||||||
SeriesA-2 4.00% 8/1/49 | 1,000,000 | 1,100,840 | ||||||
SeriesA-2 5.00% 8/1/38 | 1,500,000 | 1,851,975 | ||||||
SeriesA-2 5.00% 8/1/39 | 1,500,000 | 1,847,130 | ||||||
SeriesA-2 5.00% 8/1/44 | 2,000,000 | 2,439,140 | ||||||
(Covenant Retirement Communities) | ||||||||
Series A 5.00% 12/1/33 | 4,000,000 | 4,372,320 | ||||||
Series A 5.00% 12/1/35 | 1,000,000 | 1,144,940 | ||||||
(Craig Hospital Project) 5.00% 12/1/32 | 3,500,000 | 3,837,260 | ||||||
(Frasier Meadows Retirement Community Project) | ||||||||
Series A 5.25% 5/15/37 | 485,000 | 562,377 | ||||||
Series B 5.00% 5/15/48 | 660,000 | 699,904 | ||||||
60
Table of Contents
| Principal amount° | Value (US $) | |||||||
| ||||||||
Municipal Bonds(continued) | ||||||||
| ||||||||
Healthcare Revenue Bonds(continued) | ||||||||
Colorado Health Facilities Authority Revenue | ||||||||
(Mental Health Center Denver Project) Series A 5.75% 2/1/44 | 2,000,000 | $ | 2,260,040 | |||||
(National Jewish Health Project) 5.00% 1/1/27 | 300,000 | 317,337 | ||||||
(NCMC Project) 4.00% 5/15/32 | 2,000,000 | 2,256,740 | ||||||
(SCL Health System) | ||||||||
Series A 4.00% 1/1/37 | 3,150,000 | 3,669,498 | ||||||
Series A 4.00% 1/1/38 | 3,895,000 | 4,521,589 | ||||||
Series A 4.00% 1/1/39 | 930,000 | 1,076,568 | ||||||
Series A 5.00% 1/1/44 | 3,050,000 | 3,437,106 | ||||||
(Sisters of Charity of Leavenworth Health System) | ||||||||
Series B 5.25% 1/1/25 | 2,500,000 | 2,533,425 | ||||||
(Sunny Vista Living Center) | ||||||||
Series A 144A 6.25% 12/1/50 # | 935,000 | 1,007,294 | ||||||
(Vail Valley Medical Center Project) 5.00% 1/15/35 | 1,000,000 | 1,183,870 | ||||||
(Valley View Hospital Association Project) Series A 4.00% 5/15/35 | 685,000 | 761,076 | ||||||
Denver Health & Hospital Authority Health Care Revenue | ||||||||
(Recovery Zone Facilities) 5.625% 12/1/40 | 2,500,000 | 2,637,150 | ||||||
Puerto Rico Industrial Tourist Educational Medical & Environmental Control Facilities Financing Authority | ||||||||
(Auxilio Mutuo) Series A 6.00% 7/1/33 | 1,945,000 | 2,048,766 | ||||||
|
| |||||||
| 61,163,170 | ||||||||
|
| |||||||
Housing Revenue Bonds – 0.09% | ||||||||
Colorado Housing & Finance Authority | ||||||||
(Single Family Program Class 1) | ||||||||
Series AA 4.50% 5/1/23 (GNMA) | 95,000 | 95,346 | ||||||
Series AA 4.50% 11/1/23 (GNMA) | 95,000 | 95,342 | ||||||
|
| |||||||
| 190,688 | ||||||||
|
| |||||||
Lease Revenue Bonds – 3.17% | ||||||||
Aurora Certificates of Participation | ||||||||
Series A 5.00% 12/1/30 | 2,370,000 | 2,391,259 | ||||||
Colorado Department of Transportation Certificates of Participation | ||||||||
5.00% 6/15/34 | 660,000 | 797,854 | ||||||
5.00% 6/15/36 | 1,055,000 | 1,269,492 | ||||||
Denver Health & Hospital Authority | ||||||||
4.00% 12/1/38 | 750,000 | 827,677 | ||||||
Regional Transportation District Certificates of Participation | ||||||||
Series A 5.00% 6/1/33 | 1,500,000 | 1,686,165 | ||||||
|
| |||||||
| 6,972,447 | ||||||||
|
| |||||||
61
Table of Contents
Schedules of investments
DelawareTax-Free Colorado Fund
| Principal amount° | Value (US $) | |||||||
| ||||||||
Municipal Bonds(continued) | ||||||||
| ||||||||
Local General Obligation Bonds – 10.68% | ||||||||
Adams & Weld Counties School District No. 27J Brighton | ||||||||
4.00% 12/1/30 | 300,000 | $ | 344,184 | |||||
4.00% 12/1/31 | 1,000,000 | 1,143,970 | ||||||
5.00% 12/1/32 | 500,000 | 632,335 | ||||||
Arapahoe County School District No. 6 Littleton | ||||||||
(Littleton Public Schools) | ||||||||
Series A 5.50% 12/1/33 | 1,000,000 | 1,339,030 | ||||||
Series A 5.50% 12/1/38 | 350,000 | 461,734 | ||||||
Beacon Point Metropolitan District | ||||||||
5.00% 12/1/30 (AGM) | 1,130,000 | 1,358,249 | ||||||
Boulder Valley School District No.Re-2 Boulder | ||||||||
Series A 4.00% 12/1/48 | 1,370,000 | 1,570,404 | ||||||
Central Colorado Water Conservancy District | ||||||||
(Limited Tax) 5.00% 12/1/33 | 1,000,000 | 1,133,050 | ||||||
Commerce City Northern Infrastructure General Improvement District | ||||||||
5.00% 12/1/32 (AGM) | 2,125,000 | 2,361,640 | ||||||
Denver International Business Center Metropolitan District No. 1 | ||||||||
5.00% 12/1/30 | 350,000 | 360,759 | ||||||
Eaton Area Park & Recreation District | ||||||||
5.25% 12/1/34 | 360,000 | 382,993 | ||||||
5.50% 12/1/38 | 455,000 | 486,814 | ||||||
El Paso County School District No 2. Harrison | ||||||||
5.00% 12/1/38 | 1,000,000 | 1,271,850 | ||||||
Grand River Hospital District | ||||||||
5.25% 12/1/35 (AGM) | 1,000,000 | 1,269,960 | ||||||
Jefferson County School District No.R-1 | ||||||||
5.25% 12/15/24 | 1,250,000 | 1,518,650 | ||||||
Leyden Rock Metropolitan District No. 10 | ||||||||
Series A 5.00% 12/1/45 | 1,000,000 | 1,053,320 | ||||||
Sierra Ridge Metropolitan District No. 2 | ||||||||
Series A 5.50% 12/1/46 | 1,000,000 | 1,054,580 | ||||||
Weld County Reorganized School District No.Re-8 | ||||||||
5.00% 12/1/31 | 990,000 | 1,226,976 | ||||||
5.00% 12/1/32 | 660,000 | 816,189 | ||||||
Weld County School District No.Re-1 | ||||||||
5.00% 12/15/31 (AGM) | 1,000,000 | 1,230,390 | ||||||
Weld County School District No.Re-3J | ||||||||
5.00% 12/15/34 (BAM) | 2,000,000 | 2,451,140 | ||||||
|
| |||||||
| 23,468,217 | ||||||||
|
| |||||||
62
Table of Contents
| Principal amount° | Value (US $) | |||||||
| ||||||||
Municipal Bonds(continued) | ||||||||
| ||||||||
Pre-Refunded Bonds – 9.09% | ||||||||
Colorado Building Excellent Schools Today Certificates of Participation | ||||||||
Series G 5.00%3/15/32-21 § | 2,000,000 | $ | 2,119,320 | |||||
Colorado Health Facilities Authority Revenue | ||||||||
(Catholic Health Initiatives) | ||||||||
Series A 5.00%2/1/41-21 § | 2,250,000 | 2,368,687 | ||||||
Series A 5.25%2/1/33-21 § | 1,000,000 | 1,056,230 | ||||||
Series A 5.25%1/1/45-23 § | 2,000,000 | 2,261,820 | ||||||
(The Evangelical Lutheran Good Samaritan Society Project) | ||||||||
5.00%12/1/42-22 § | 2,500,000 | 2,761,850 | ||||||
5.625%6/1/43-23 § | 1,150,000 | 1,337,001 | ||||||
(Total Long-Term Care National Obligated Group Project) | ||||||||
Series A 6.00%11/15/30-20 § | 2,365,000 | 2,497,724 | ||||||
Series A 6.25%11/15/40-20 § | 750,000 | 794,317 | ||||||
University of Colorado | ||||||||
Series A 5.00%6/1/33-23 § | 2,000,000 | 2,291,460 | ||||||
University of Colorado Hospital Authority Revenue | ||||||||
Series A 6.00%11/15/29-19 § | 2,460,000 | 2,483,567 | ||||||
|
| |||||||
| 19,971,976 | ||||||||
|
| |||||||
Special Tax Revenue Bonds – 21.92% | ||||||||
Broomfield Colorado Sales & Use Tax Revenue | ||||||||
5.00% 12/1/33 | 1,000,000 | 1,259,030 | ||||||
Central Platte Valley Metropolitan District | ||||||||
5.00% 12/1/43 | 725,000 | 786,226 | ||||||
Commerce City | ||||||||
5.00% 8/1/44 (AGM) | 1,500,000 | 1,714,200 | ||||||
Denver City & County | ||||||||
Series A 5.00% 8/1/26 | 500,000 | 625,030 | ||||||
Denver Convention Center Hotel Authority Revenue | ||||||||
5.00% 12/1/40 | 2,660,000 | 3,111,987 | ||||||
Denver International Business Center Metropolitan District No. 1 | ||||||||
5.375% 12/1/35 | 1,750,000 | 1,806,035 | ||||||
Denver Urban Renewal Authority | ||||||||
(Stapleton) Senior Subordinated Series B 5.00% 12/1/25 | 1,250,000 | 1,535,525 | ||||||
Fountain Urban Renewal Authority Tax Increment Revenue | ||||||||
(Academy Highlands Project) Series A 5.50% 11/1/44 | 1,375,000 | 1,471,030 | ||||||
Guam Government Business Privilege Tax Revenue | ||||||||
Series A 5.125% 1/1/42 | 1,250,000 | 1,315,463 | ||||||
63
Table of Contents
Schedules of investments
DelawareTax-Free Colorado Fund
| Principal amount° | Value (US $) | |||||||
| ||||||||
Municipal Bonds(continued) | ||||||||
| ||||||||
Special Tax Revenue Bonds(continued) | ||||||||
Guam Government Business Privilege Tax Revenue | ||||||||
Series A 5.25% 1/1/36 | 1,675,000 | $ | 1,777,024 | |||||
Lincoln Park Metropolitan District | ||||||||
5.00% 12/1/46 (AGM) | 1,000,000 | 1,203,290 | ||||||
Plaza Metropolitan District No. 1 | ||||||||
144A 5.00% 12/1/40 # | 1,265,000 | 1,331,387 | ||||||
Prairie Center Metropolitan District No. 3 | ||||||||
Series A 144A 5.00% 12/15/41 # | 1,000,000 | 1,065,160 | ||||||
Puerto Rico Sales Tax Financing Revenue | ||||||||
(Restructured) | ||||||||
SeriesA-1 4.75% 7/1/53 | 1,155,000 | 1,187,120 | ||||||
SeriesA-1 5.00% 7/1/58 | 1,560,000 | 1,630,450 | ||||||
SeriesA-1 5.375% 7/1/46 ^ | 4,815,000 | 1,293,020 | ||||||
SeriesA-1 5.625% 7/1/51 ^ | 10,150,000 | 1,972,551 | ||||||
SeriesA-2 4.536% 7/1/53 | 3,000,000 | 3,048,660 | ||||||
Regional Transportation District | ||||||||
(Fastracks Project) | ||||||||
Series A 5.00% 11/1/30 | 670,000 | 835,711 | ||||||
Series A 5.00% 11/1/31 | 1,495,000 | 1,857,328 | ||||||
Series A 5.00% 11/1/36 | 2,750,000 | 3,370,373 | ||||||
Series B 5.00% 11/1/33 | 1,865,000 | 2,366,965 | ||||||
Certificates of Participation | ||||||||
Series A 5.375% 6/1/31 | 1,540,000 | 1,584,629 | ||||||
Regional Transportation District Sales Revenue | ||||||||
(Denver Transit Partners) | ||||||||
6.00% 1/15/34 | 1,450,000 | 1,497,734 | ||||||
6.00% 1/15/41 | 2,400,000 | 2,479,008 | ||||||
Solaris Metropolitan District No. 3 | ||||||||
(Limited Tax Convertible) Series A 5.00% 12/1/46 | 500,000 | 526,155 | ||||||
Southlands Metropolitan District No. 1 | ||||||||
SeriesA-1 5.00% 12/1/37 | 300,000 | 341,865 | ||||||
SeriesA-1 5.00% 12/1/47 | 700,000 | 786,814 | ||||||
Sterling Ranch Community Authority Board | ||||||||
Series A 5.75% 12/1/45 | 975,000 | 1,021,049 | ||||||
Tallyns Reach Metropolitan District No. 3 | ||||||||
(Limited Tax Convertible) 5.125% 11/1/38 | 740,000 | 794,220 | ||||||
Thornton Development Authority | ||||||||
(East 144th Avenue &I-25 Project) | ||||||||
Series B 5.00% 12/1/35 | 485,000 | 568,619 | ||||||
Series B 5.00% 12/1/36 | 810,000 | 948,826 | ||||||
64
Table of Contents
| Principal amount° | Value (US $) | |||||||
| ||||||||
Municipal Bonds(continued) | ||||||||
| ||||||||
Special Tax Revenue Bonds(continued) | ||||||||
Virgin Islands Public Finance Authority | ||||||||
(Matching Fund Loan Senior Lien) | ||||||||
5.00% 10/1/29 (AGM) | 1,000,000 | $ | 1,065,240 | |||||
|
| |||||||
| 48,177,724 | ||||||||
|
| |||||||
Transportation Revenue Bonds – 11.83% | ||||||||
Colorado High Performance Transportation Enterprise Revenue | ||||||||
(C-470 Express Lanes) 5.00% 12/31/56 | 2,000,000 | 2,209,940 | ||||||
(Senior U.S. 36 &I-25 Managed Lanes) 5.75% 1/1/44 (AMT) | 2,140,000 | 2,357,617 | ||||||
Denver City & County Airport System Revenue | ||||||||
Series A 4.00% 12/1/48 (AMT) | 400,000 | 445,596 | ||||||
Series A 5.00% 11/15/30 (AMT) | 1,750,000 | 2,184,840 | ||||||
Series A 5.00% 12/1/48 (AMT) | 2,000,000 | 2,440,900 | ||||||
Series A 5.25% 11/15/36 | 2,500,000 | 2,519,675 | ||||||
Series B 5.00% 11/15/30 | 1,000,000 | 1,112,530 | ||||||
Series B 5.00% 11/15/32 | 1,000,000 | 1,109,550 | ||||||
Series B 5.00% 11/15/37 | 8,000,000 | 8,834,080 | ||||||
E-470 Public Highway Authority | ||||||||
Series C 5.25% 9/1/25 | 690,000 | 717,145 | ||||||
Series C 5.375% 9/1/26 | 2,000,000 | 2,080,920 | ||||||
|
| |||||||
| 26,012,793 | ||||||||
|
| |||||||
Water & Sewer Revenue Bonds – 0.99% | ||||||||
Dominion Water & Sanitation District | ||||||||
6.00% 12/1/46 | 750,000 | 807,983 | ||||||
Douglas County Centennial Water & Sanitation District | ||||||||
4.00% 12/1/38 | 500,000 | 579,670 | ||||||
Guam Government Waterworks Authority Water & Wastewater System Revenue | ||||||||
5.00% 7/1/37 | 675,000 | 789,757 | ||||||
|
| |||||||
| 2,177,410 | ||||||||
|
| |||||||
Total Municipal Bonds(cost $209,537,110) | 224,607,072 | |||||||
|
| |||||||
65
Table of Contents
Schedules of investments
Delaware Tax-Free Colorado Fund
| Number of shares | Value (US $) | |||||||
| ||||||||
Short-Term Investments – 1.01% | ||||||||
| ||||||||
Money Market Mutual Fund – 0.24% | ||||||||
DreyfusAMT-Free Tax Exempt Cash Management Fund - Institutional Shares | 540,837 | $ | 540,837 | |||||
|
| |||||||
| 540,837 | ||||||||
|
| |||||||
| Principal amount° | ||||||||
Variable Rate Demand Notes – 0.77%¤ | ||||||||
Colorado Educational & Cultural Facilities Authority | ||||||||
Revenue (National Jewish Federation Bond Program) | ||||||||
SeriesB-4 | ||||||||
1.39% 12/1/35(LOC-Toronto-Dominion Bank N.A.) | 840,000 | 840,000 | ||||||
Denver City & County | ||||||||
Series A1 1.39% 12/1/29 | ||||||||
(SPA-JPMorgan Chase Bank N.A.) | 450,000 | 450,000 | ||||||
Series A2 1.39% 12/1/29 | ||||||||
(SPA-JPMorgan Chase Bank N.A.) | 400,000 | 400,000 | ||||||
|
| |||||||
| 1,690,000 | ||||||||
|
| |||||||
Total Short-Term Investments(cost $2,230,837) | 2,230,837 | |||||||
|
| |||||||
Total Value of Securities – 103.19% | $ | 226,837,909 | ||||||
|
| |||||||
| # | Security exempt from registration under Rule 144A of the Securities Act of 1933, as amended. At Aug. 31, 2019, the aggregate value of Rule 144A securities was $10,710,958, which represents 4.87% of the Fund’s net assets. See Note 8 in “Notes to financial statements.” |
| ¤ | Tax-exempt obligations that contain a floating or variable interest rate adjustment formula and an unconditional right of demand to receive payment of the unpaid principal balance plus accrued interest upon a short notice period (generally up to 30 days) prior to specified dates either from the issuer or by drawing on a bank letter of credit, a guarantee, or insurance issued with respect to such instrument. Each rate shown is as of Aug. 31, 2019. |
| § | Pre-refunded bonds. Municipal bonds that are generally backed or secured by US Treasury bonds. Forpre-refunded bonds, the stated maturity is followed by the year in which the bond will bepre-refunded. See Note 8 in “Notes to financial statements.” |
| ° | Principal amount shown is stated in USD unless noted that the security is denominated in another currency. |
| ‡ | Non-income producing security. Security is currently in default. |
| ^ | Zero-coupon security. The rate shown is the effective yield at the time of purchase. |
Summary of abbreviations:
AGC – Insured by Assured Guaranty Corporation
AGM – Insured by Assured Guaranty Municipal Corporation
AMT – Subject to Alternative Minimum Tax
BAM – Insured by Build America Mutual Assurance
66
Table of Contents
Summary of abbreviations: (continued)
GNMA – Government National Mortgage Association collateral
LOC – Letter of Credit
N.A. – National Association
SPA –Stand-by Purchase Agreement
USD – US Dollar
See accompanying notes, which are an integral part of the financial statements.
67
Table of Contents
| Schedules of investments | ||
| DelawareTax-Free Idaho Fund | August 31, 2019 | |
| Principal amount° | Value (US $) | |||||||
| ||||||||
Municipal Bonds – 98.24% | ||||||||
| ||||||||
Corporate Revenue Bonds – 3.21% | ||||||||
Nez Perce County Pollution Control Revenue | ||||||||
(Potlatch Project) 2.75% 10/1/24 | 1,250,000 | $ | 1,307,963 | |||||
Power County Industrial Development Revenue | ||||||||
(FMC Project) 6.45% 8/1/32 (AMT) | 2,000,000 | 2,008,500 | ||||||
|
| |||||||
| 3,316,463 | ||||||||
|
| |||||||
Education Revenue Bonds – 16.28% | ||||||||
Boise State University Revenue | ||||||||
(General Project) | ||||||||
Series A 4.00% 4/1/37 | 1,250,000 | 1,304,900 | ||||||
Series A 5.00% 4/1/42 | 1,350,000 | 1,459,445 | ||||||
Series A 5.00% 4/1/47 | 500,000 | 603,975 | ||||||
Series A 5.00% 4/1/48 | 1,000,000 | 1,221,930 | ||||||
Idaho Housing & Finance Association | ||||||||
(Compass Public Charter School Project) | ||||||||
Series A 144A 6.00% 7/1/39 # | 370,000 | 435,993 | ||||||
Series A 144A 6.00% 7/1/49 # | 595,000 | 691,848 | ||||||
Series A 144A 6.00% 7/1/54 # | 570,000 | 658,156 | ||||||
(Idaho Arts Charter School Project) | ||||||||
Series A 5.00% 12/1/38 | 1,000,000 | 1,128,270 | ||||||
Series A 144A 5.00% 12/1/46 # | 1,000,000 | 1,100,470 | ||||||
(North Star Charter School Project) | ||||||||
Capital Appreciation Subordinate Series B 144A 4.88% 7/1/49 #^ | 2,888,155 | 572,577 | ||||||
Series A 6.75% 7/1/48 | 529,151 | 580,875 | ||||||
(Victory Charter School Project) Series B 5.00% 7/1/39 | 1,000,000 | 1,101,590 | ||||||
(Xavier Charter School Project) Series A 5.00% 6/1/50 | 1,275,000 | 1,412,445 | ||||||
University of Idaho | ||||||||
Series 2011 5.25% 4/1/41 • | 1,710,000 | 1,808,462 | ||||||
Series A 5.00% 4/1/41 | 1,000,000 | 1,242,950 | ||||||
Series B 5.00% 4/1/28 | 1,000,000 | 1,021,350 | ||||||
Series B 5.00% 4/1/32 | 500,000 | 510,440 | ||||||
|
| |||||||
| 16,855,676 | ||||||||
|
| |||||||
Electric Revenue Bonds – 3.79% | ||||||||
Boise-Kuna Irrigation District Revenue | ||||||||
(Idaho Arrowrock Hydroelectric Project) 5.00% 6/1/34 | 2,000,000 | 2,326,260 | ||||||
Guam Power Authority Revenue | ||||||||
Series A 5.00% 10/1/40 | 1,000,000 | 1,156,990 | ||||||
Puerto Rico Electric Power Authority Revenue | ||||||||
Series CCC 5.25% 7/1/27 ‡ | 230,000 | 184,575 | ||||||
Series WW 5.00% 7/1/28 ‡ | 320,000 | 256,000 | ||||||
|
| |||||||
| 3,923,825 | ||||||||
|
| |||||||
68
Table of Contents
| Principal amount° | Value (US $) | |||||||
| ||||||||
Municipal Bonds(continued) | ||||||||
| ||||||||
Healthcare Revenue Bonds – 11.87% | ||||||||
Idaho Health Facilities Authority Revenue | ||||||||
(Madison Memorial Hospital Project) 5.00% 9/1/37 | 1,350,000 | $ | 1,529,793 | |||||
(St. Luke’s Health System Project) | ||||||||
Series A 5.00% 3/1/27 | 1,000,000 | 1,246,550 | ||||||
Series A 5.00% 3/1/47 | 1,500,000 | 1,587,630 | ||||||
(Trinity Health Credit Group) | ||||||||
Series D 4.50% 12/1/37 | 1,385,000 | 1,436,190 | ||||||
Series ID 4.00% 12/1/43 | 1,000,000 | 1,121,710 | ||||||
Series ID 5.00% 12/1/32 | 1,000,000 | 1,092,340 | ||||||
Series ID 5.00% 12/1/46 | 750,000 | 896,940 | ||||||
(Valley Vista Care Corporation) | ||||||||
Series A 5.25% 11/15/37 | 1,005,000 | 1,091,269 | ||||||
Series A 5.25% 11/15/47 | 1,130,000 | 1,209,880 | ||||||
Puerto Rico Industrial Tourist Educational Medical & | ||||||||
(Hospital Auxilio Mutuo Obligated Group Project) | ||||||||
Series A 6.00% 7/1/33 | 1,020,000 | 1,074,417 | ||||||
|
| |||||||
| 12,286,719 | ||||||||
|
| |||||||
Housing Revenue Bonds – 3.98% | ||||||||
Idaho Housing & Finance Association | ||||||||
Series A 4.50% 1/21/49 (GNMA) | 971,588 | 1,027,804 | ||||||
Idaho Housing & Finance Association Single Family Mortgage Revenue | ||||||||
Series A 3.05% 7/1/39 (GNMA) | 1,675,000 | 1,740,794 | ||||||
Series A 3.25% 1/1/43 (GNMA) | 825,000 | 856,276 | ||||||
Series A Class II 4.375% 7/1/32 | 480,000 | 488,832 | ||||||
|
| |||||||
| 4,113,706 | ||||||||
|
| |||||||
Lease Revenue Bonds – 8.15% | ||||||||
Boise Urban Renewal Agency | ||||||||
5.00% 12/15/31 | 750,000 | 908,467 | ||||||
5.00% 12/15/32 | 750,000 | 906,487 | ||||||
Idaho Fish & Wildlife Foundation | ||||||||
5.00% 12/1/41 | 200,000 | 248,448 | ||||||
Idaho Housing & Finance Association Economic Development Facilities Revenue | ||||||||
(TDF Facilities Project) | ||||||||
Series A 6.50% 2/1/26 | 1,370,000 | 1,465,982 | ||||||
Series A 7.00% 2/1/36 | 1,500,000 | 1,604,535 | ||||||
Idaho State Building Authority Revenue | ||||||||
Series B 5.00% 9/1/40 | 1,250,000 | 1,371,437 | ||||||
(Capitol Mall Parking Project) | ||||||||
Series A 4.50% 9/1/26 | 485,000 | 547,565 | ||||||
69
Table of Contents
Schedules of investments
DelawareTax-Free Idaho Fund
| Principal amount° | Value (US $) | |||||||
| ||||||||
Municipal Bonds(continued) | ||||||||
| ||||||||
Lease Revenue Bonds(continued) | ||||||||
Idaho State Building Authority Revenue | ||||||||
(Capitol Mall Parking Project) | ||||||||
Series A 4.50% 9/1/27 | 505,000 | $ | 568,670 | |||||
(Department of Health & Welfare Project) Series B 4.00% 9/1/48 | 750,000 | 818,377 | ||||||
|
| |||||||
| 8,439,968 | ||||||||
|
| |||||||
Local General Obligation Bonds – 25.00% | ||||||||
Ada & Boise Counties Independent School District Boise City | ||||||||
5.00% 8/1/33 | 1,010,000 | 1,254,198 | ||||||
5.00% 8/1/34 | 1,500,000 | 1,857,525 | ||||||
5.00% 8/1/35 | 1,160,000 | 1,433,714 | ||||||
5.00% 8/1/36 | 500,000 | 616,525 | ||||||
Ada & Canyon Counties Joint School District No. 2 Meridian | ||||||||
4.50% 7/30/22 | 1,500,000 | 1,544,295 | ||||||
Ada & Canyon Counties Joint School District No. 3 Kuna | ||||||||
(Sales Tax & Credit Enhancement Guaranty) | ||||||||
Series B 5.00% 9/15/33 | 1,670,000 | 2,072,771 | ||||||
Series B 5.00% 9/15/35 | 1,100,000 | 1,358,775 | ||||||
Canyon County School District No. 131 Nampa | ||||||||
(School Board Guaranteed) | ||||||||
Series B 5.00% 8/15/23 | 1,295,000 | 1,491,633 | ||||||
Canyon County School District No. 132 Caldwell | ||||||||
Series A 5.00% 9/15/22 (AGM) | 1,725,000 | 1,729,882 | ||||||
Series A 5.00% 9/15/23 (AGM) | 1,810,000 | 1,815,086 | ||||||
Canyon County School District No. 139 Vallivue | ||||||||
(School Board Guaranteed) | ||||||||
5.00% 9/15/33 | 1,000,000 | 1,137,570 | ||||||
Series B 5.00% 9/15/24 | 1,480,000 | 1,650,733 | ||||||
Idaho Bond Bank Authority Revenue | ||||||||
Series A 4.00% 9/15/33 | 530,000 | 610,194 | ||||||
Series A 4.00% 9/15/37 | 1,000,000 | 1,135,090 | ||||||
Series C 5.00% 9/15/42 | 500,000 | 615,435 | ||||||
Madison County School District No. 321 Rexburg | ||||||||
(Sales Tax & Credit Enhancement Guaranty) | ||||||||
Series B 5.00% 8/15/25 | 1,080,000 | 1,320,700 | ||||||
Series B 5.00% 8/15/26 | 500,000 | 628,705 | ||||||
Nez Perce County Independent School District No. 1 | ||||||||
(Sales Tax & Credit Enhancement Guaranty) | ||||||||
Series B 5.00% 9/15/36 | 1,000,000 | 1,233,090 | ||||||
Series B 5.00% 9/15/37 | 1,000,000 | 1,228,010 | ||||||
70
Table of Contents
| Principal amount° | Value (US $) | |||||||
| ||||||||
Municipal Bonds(continued) | ||||||||
| ||||||||
Local General Obligation Bonds(continued) | ||||||||
Twin Falls County School District No. 411 | 1,000,000 | $ | 1,143,630 | |||||
|
| |||||||
| 25,877,561 | ||||||||
|
| |||||||
Pre-Refunded Bonds – 2.49% | ||||||||
Idaho Health Facilities Authority Revenue | ||||||||
(St. Luke’s Regional Medical Center Project) | ||||||||
5.00%7/1/35-20 (AGM)§ | 2,500,000 | 2,580,650 | ||||||
|
| |||||||
| 2,580,650 | ||||||||
|
| |||||||
Special Tax Revenue Bonds – 18.94% | ||||||||
Guam Government Business Privilege Tax Revenue | ||||||||
Series A 5.125% 1/1/42 | 545,000 | 573,542 | ||||||
Series A 5.25% 1/1/36 | 705,000 | 747,941 | ||||||
SeriesB-1 5.00% 1/1/42 | 1,425,000 | 1,493,015 | ||||||
Idaho Water Resource Board Loan Program Revenue | ||||||||
(Ground Water Rights Mitigation) Series A 5.00% 9/1/32 | 3,565,000 | 3,912,445 | ||||||
Ketchum Urban Renewal Agency Tax Increment Revenue | ||||||||
5.50% 10/15/34 | 1,500,000 | 1,532,100 | ||||||
Nampa Development Corporation Revenue | ||||||||
5.90% 3/1/30 | 3,000,000 | 3,032,280 | ||||||
(Library Square Project) 144A 5.00% 9/1/31 # | 1,000,000 | 1,078,620 | ||||||
Puerto Rico Sales Tax Financing Revenue | ||||||||
(Capital Appreciation – Restructured) | ||||||||
SeriesA-1 5.375% 7/1/46 ^ | 2,355,000 | 632,412 | ||||||
SeriesA-1 5.625% 7/1/51 ^ | 4,970,000 | 965,870 | ||||||
(Restructured) | ||||||||
SeriesA-1 4.55% 7/1/40 | 875,000 | 903,166 | ||||||
SeriesA-1 4.75% 7/1/53 | 2,000,000 | 2,055,620 | ||||||
SeriesA-1 5.00% 7/1/58 | 1,031,000 | 1,077,560 | ||||||
Virgin Islands Public Finance Authority Revenue | ||||||||
(Senior Lien-Matching Fund Loan Note) | ||||||||
5.00% 10/1/29 (AGM) | 1,500,000 | 1,597,860 | ||||||
|
| |||||||
| 19,602,431 | ||||||||
|
| |||||||
Transportation Revenue Bonds – 3.20% | ||||||||
Boise City Airport Revenue | ||||||||
(Air Terminal Facilities Project) | ||||||||
5.75% 9/1/20 (AGM) (AMT) | 1,000,000 | 1,044,310 | ||||||
(Parking Facilities Project) 4.00% 9/1/32 | 2,180,000 | 2,267,898 | ||||||
|
| |||||||
| 3,312,208 | ||||||||
|
| |||||||
71
Table of Contents
Schedules of investments
DelawareTax-Free Idaho Fund
| Principal amount° | Value (US $) | |||||||
| ||||||||
Municipal Bonds (continued) | ||||||||
| ||||||||
Water & Sewer Revenue Bonds – 1.33% | ||||||||
Guam Government Waterworks Authority | ||||||||
5.00% 7/1/40 | 370,000 | $ | 430,058 | |||||
5.00% 1/1/46 | 835,000 | 949,938 | ||||||
|
| |||||||
| 1,379,996 | ||||||||
|
| |||||||
Total Municipal Bonds(cost $95,613,831) | 101,689,203 | |||||||
|
| |||||||
| Number of shares | ||||||||
| ||||||||
Short-Term Investments – 0.32% | ||||||||
| ||||||||
Money Market Mutual Fund – 0.11% | ||||||||
DreyfusAMT-Free Tax Exempt Cash Management Fund - Institutional Shares(seven-day effective yield 1.23%) | 112,028 | 112,028 | ||||||
|
| |||||||
| 112,028 | ||||||||
|
| |||||||
| Principal amount° | ||||||||
Variable Rate Demand Note – 0.21%¤ | ||||||||
Idaho Health Facilities Authority Revenue (St. Luke’s Health System Project) Series C | ||||||||
1.40% 3/1/48 (LOC – US Bank N.A.) | 225,000 | 225,000 | ||||||
|
| |||||||
| 225,000 | ||||||||
|
| |||||||
Total Short-Term Investments(cost $337,028) | 337,028 | |||||||
|
| |||||||
Total Value of Securities – 98.56% | $ | 102,026,231 | ||||||
|
| |||||||
| # | Security exempt from registration under Rule 144A of the Securities Act of 1933, as amended. At Aug. 31, 2019, the aggregate value of Rule 144A securities was $4,537,664, which represents 4.38% of the Fund’s net assets. See Note 8 in “Notes to financial statements.” |
| ¤ | Tax-exempt obligations that contain a floating or variable interest rate adjustment formula and an unconditional right of demand to receive payment of the unpaid principal balance plus accrued interest upon a short notice period (generally up to 30 days) prior to specified dates either from the issuer or by drawing on a bank letter of credit, a guarantee, or insurance issued with respect to such instrument. Each rate shown is as of Aug. 31, 2019. |
| § | Pre-refunded bonds. Municipal bonds that are generally backed or secured by US Treasury bonds. Forpre-refunded bonds, the stated maturity is followed by the year in which the bond will bepre-refunded. See Note 8 in “Notes to financial statements.” |
| ° | Principal amount shown is stated in USD unless noted that the security is denominated in another currency. |
| ‡ | Non-income producing security. Security is currently in default. |
| ● | Variable rate investment. Rates reset periodically. Rate shown reflects the rate in effect at Aug. 31, 2019. For securities based on a published reference rate and spread, the reference rate and spread are indicated in their description above. The reference rate descriptions (i.e. LIBOR03M, LIBOR06M, etc.) used in this report are identical for different securities, but the underlying reference |
72
Table of Contents
| rates may differ due to the timing of the reset period. Certain variable rate securities are not based on a published reference rate and spread but are determined by the issuer or agent and are based on current market conditions, or for mortgage-backed securities, are impacted by the individual mortgages which are paying off over time. These securities do not indicate a reference rate and spread in their description above. |
| ^ | Zero-coupon security. The rate shown is the effective yield at the time of purchase. |
Summary of abbreviations:
AGM – Insured by Assured Guaranty Municipal Corporation
AMT – Subject to Alternative Minimum Tax
GNMA – Government National Mortgage Association collateral
ICE – Intercontinental Exchange
LIBOR – London Interbank Offered Rate
LIBOR03M – ICE LIBOR USD 3 Month
LIBOR06M – ICE LIBOR USD 6 Month
LOC – Letter of Credit
N.A. – National Association
USD – US Dollar
See accompanying notes, which are an integral part of the financial statements.
73
Table of Contents
| Schedules of investments | ||
| DelawareTax-Free New York Fund | August 31, 2019 | |
| Principal amount° | Value (US $) | |||||||
| ||||||||
Municipal Bonds – 98.81% | ||||||||
| ||||||||
Corporate Revenue Bonds – 7.30% | ||||||||
Nassau County Tobacco Settlement | ||||||||
(Asset-Backed) SeriesA-3 5.125% 6/1/46 | 625,000 | $ | 624,981 | |||||
New York Counties Tobacco Trust VI | ||||||||
(Tobacco Settlement Pass Through) Series C 5.00% 6/1/51 | 500,000 | 524,740 | ||||||
New York Liberty Development Revenue | ||||||||
(Second Priority - Bank of America Tower at One Bryant Park Project) | ||||||||
Class 2 5.625% 7/15/47 | 500,000 | 508,595 | ||||||
Class 3 6.375% 7/15/49 | 865,000 | 882,213 | ||||||
New York Transportation Development Corporation Special Facilities Revenue | ||||||||
(Delta Air Lines - LaGuardia Airport Terminals C&D Redevelopment Project) 5.00% 1/1/36 (AMT) | 1,000,000 | 1,208,180 | ||||||
Suffolk Tobacco Asset Securitization | ||||||||
Series B 5.25% 6/1/37 | 700,000 | 745,689 | ||||||
TSASC Revenue | ||||||||
(Senior) Fiscal 2017 Series A 5.00% 6/1/41 | 900,000 | 1,006,344 | ||||||
(Subordinate) Fiscal 2017 Series B 5.00% 6/1/48 | 1,000,000 | 991,900 | ||||||
|
| |||||||
| 6,492,642 | ||||||||
|
| |||||||
Education Revenue Bonds – 20.50% | ||||||||
Albany Industrial Development Agency Civic Facilities Revenue | ||||||||
(Brighter Choice Charter School) Series A 5.00% 4/1/37 | 250,000 | 250,330 | ||||||
Buffalo & Erie County Industrial Land Development | ||||||||
(Buffalo State College Foundation Housing Project) | ||||||||
Series A 6.00% 10/1/31 | 525,000 | 563,535 | ||||||
(Tapestry Charter School Project) Series A 5.00% 8/1/52 | 500,000 | 549,955 | ||||||
Build NYC Resource | ||||||||
(Bronx Charter School for Excellence Project) | ||||||||
Series A 5.00% 4/1/33 | 500,000 | 544,015 | ||||||
Series A 5.50% 4/1/43 | 500,000 | 546,300 | ||||||
(Inwood Academy for Leadership Charter School Project) Series A 144A 5.50% 5/1/48 # | 500,000 | 547,125 | ||||||
(Manhattan College Project) 5.00% 8/1/47 | 500,000 | 598,705 | ||||||
(Metropolitan College of New York Project) 5.50% 11/1/44 | 600,000 | 649,968 | ||||||
(Metropolitan Lighthouse Charter School Project) | ||||||||
Series A 144A 5.00% 6/1/52 # | 250,000 | 272,627 | ||||||
(New Dawn Charter Schools Project) 144A 5.75% 2/1/49 # | 500,000 | 535,875 | ||||||
74
Table of Contents
| Principal amount° | Value (US $) | |||||||
| ||||||||
Municipal Bonds(continued) | ||||||||
| ||||||||
Education Revenue Bonds(continued) | ||||||||
Build NYC Resource | ||||||||
(The Packer Collegiate Institute Project) 5.00% 6/1/40 | 750,000 | $ | 872,647 | |||||
Dutchess County Local Development | ||||||||
(The Culinary Institute of America Project) SeriesA-1 5.00% 7/1/46 | 300,000 | 348,360 | ||||||
Hempstead Town Local Development | ||||||||
(Hofstra University Project) 5.00% 7/1/42 | 500,000 | 601,985 | ||||||
Madison County Capital Resource Revenue | ||||||||
(Colgate University Project) Series A 5.00% 7/1/28 | 400,000 | 413,244 | ||||||
Monroe County Industrial Development Revenue | ||||||||
(St. John Fisher College Project) Series A 5.50% 6/1/39 | 300,000 | 352,905 | ||||||
(University of Rochester Project) Series C 4.00% 7/1/43 | 500,000 | 561,780 | ||||||
New York City Trust for Cultural Resources | ||||||||
(Alvin Ailey Dance Foundation) Series A 4.00% 7/1/46 | 1,000,000 | 1,095,350 | ||||||
(Whitney Museum of American Art) 5.00% 7/1/31 | 500,000 | 524,730 | ||||||
New York State Dormitory Authority | ||||||||
(Barnard College) Series A 5.00% 7/1/35 | 400,000 | 475,464 | ||||||
(Fordham University) 5.00% 7/1/44 | 650,000 | 746,193 | ||||||
(Marymount Manhattan College) 5.00% 7/1/24 | 350,000 | 350,949 | ||||||
(Pratt Institute) Series A 5.00% 7/1/34 | 1,000,000 | 1,152,010 | ||||||
(Rockefeller University) Series A 5.00% 7/1/27 | 250,000 | 250,707 | ||||||
(Touro College & University) Series A 5.50% 1/1/44 | 1,000,000 | 1,121,180 | ||||||
(University of Rochester Project) Unrefunded Series A 5.125% 7/1/39 | 20,000 | 20,056 | ||||||
Onondaga Civic Development Revenue | ||||||||
(Le Moyne College Project) 5.20% 7/1/29 | 500,000 | 516,810 | ||||||
St. Lawrence County Industrial Development Agency Civic Development Revenue | ||||||||
(St. Lawrence University Project) Series A 4.00% 7/1/43 | 1,000,000 | 1,099,660 | ||||||
Tompkins County Development | ||||||||
(Ithaca College Project) | ||||||||
5.00% 7/1/34 | 750,000 | 889,238 | ||||||
5.00% 7/1/41 | 500,000 | 610,640 | ||||||
Troy Industrial Development Authority | ||||||||
(Rensselaer Polytechnic Institute Project) Series E 5.20% 4/1/37 | 500,000 | 536,735 | ||||||
Yonkers Economic Development Educational Revenue | ||||||||
(Charter School of Educational Excellence Project) | ||||||||
Series A 6.25% 10/15/40 | 600,000 | 619,908 | ||||||
|
| |||||||
| 18,218,986 | ||||||||
|
| |||||||
75
Table of Contents
Schedules of investments
DelawareTax-Free New York Fund
| Principal amount° | Value (US $) | |||||||
| ||||||||
Municipal Bonds(continued) | ||||||||
| ||||||||
Electric Revenue Bonds – 4.34% | ||||||||
Long Island Power Authority Electric System Revenue | ||||||||
5.00% 9/1/37 | 450,000 | $ | 568,067 | |||||
5.00% 9/1/47 | 500,000 | 609,000 | ||||||
Series A 5.00% 9/1/44 | 750,000 | 862,643 | ||||||
New York State Power Authority Revenue | ||||||||
Series A 5.00% 11/15/38 | 500,000 | 540,015 | ||||||
Puerto Rico Electric Power Authority Revenue | ||||||||
Series CCC 5.25% 7/1/27 ‡ | 190,000 | 152,475 | ||||||
Series WW 5.00% 7/1/28 ‡ | 270,000 | 216,000 | ||||||
Utility Debt Securitization Authority | ||||||||
(Restructuring Bonds) 5.00% 12/15/37 | 750,000 | 908,130 | ||||||
|
| |||||||
| 3,856,330 | ||||||||
|
| |||||||
Healthcare Revenue Bonds – 13.51% | ||||||||
Buffalo & Erie County Industrial Land Development | ||||||||
(Catholic Health System Project) 5.25% 7/1/35 | 250,000 | 297,410 | ||||||
Build NYC Resource | ||||||||
(The Children’s Aid Society Project) 4.00% 7/1/49 | 1,000,000 | 1,139,810 | ||||||
Dutchess County Local Development | ||||||||
(Nuvance Health) Series B 4.00% 7/1/49 | 1,000,000 | 1,124,890 | ||||||
Guilderland Industrial Development Agency | ||||||||
(Albany Place Development Project) Series A 144A 5.875% 1/1/52 # | 500,000 | 514,775 | ||||||
Monroe County Industrial Development | ||||||||
(The Rochester General Hospital Project) | ||||||||
5.00% 12/1/36 | 405,000 | 484,720 | ||||||
5.00% 12/1/46 | 540,000 | 632,799 | ||||||
(The Unity Hospital of Rochester Project) 5.50% 8/15/40 (FHA) | 585,000 | 620,322 | ||||||
Nassau County Local Economic Assistance | ||||||||
(Catholic Health Services of Long Island Obligated Group Project) 5.00% 7/1/33 | 725,000 | 818,416 | ||||||
New York City Health & Hospital Revenue | ||||||||
(Health System) Series A 5.00% 2/15/30 | 500,000 | 508,195 | ||||||
New York City Trust for Cultural Resources | ||||||||
(Carnegie Hall) 5.00% 12/1/39 | 250,000 | 324,583 | ||||||
New York State Dormitory Authority Revenue | ||||||||
(Montefiore Obligated Group) Series A 4.00% 8/1/38 | 1,000,000 | 1,125,620 | ||||||
New York State Dormitory Authority RevenueNon-State Supported Debt | ||||||||
(Mt. Sinai Hospital) Series A 5.00% 7/1/26 | 600,000 | 618,450 | ||||||
(New York University Hospitals Center) Series A 4.00% 7/1/40 | 465,000 | 515,722 | ||||||
76
Table of Contents
| Principal amount° | Value (US $) | |||||||
| ||||||||
Municipal Bonds(continued) | ||||||||
| ||||||||
Healthcare Revenue Bonds(continued) | ||||||||
New York State Dormitory Authority RevenueNon-State Supported Debt | ||||||||
(Orange Regional Medical Center Obligated Group) | ||||||||
144A 5.00% 12/1/34 # | 500,000 | $ | 596,715 | |||||
144A 5.00% 12/1/45 # | 700,000 | 793,037 | ||||||
Orange County Funding Assisted Living Residence Revenue | ||||||||
(The Hamlet at Wallkill Assisted Living Project) 6.50% 1/1/46 | 400,000 | 415,844 | ||||||
Southold Local Development Revenue | ||||||||
(Peconic Landing at Southold Project) 5.00% 12/1/45 | 750,000 | 798,233 | ||||||
Suffolk County Economic Development Revenue | ||||||||
(Peconic Landing at Southhold Project) 6.00% 12/1/40 | 650,000 | 679,737 | ||||||
|
| |||||||
| 12,009,278 | ||||||||
|
| |||||||
Lease Revenue Bonds – 7.04% | ||||||||
Hudson Yards Infrastructure | ||||||||
Unrefunded Fiscal 2012 Series A 5.75% 2/15/47 | 385,000 | 409,394 | ||||||
MTA Hudson Rail Yards Trust Obligations | ||||||||
(The Metropolitan Transportation Authority) Series A 5.00% 11/15/56 | 710,000 | 795,647 | ||||||
New York City Industrial Development Agency | ||||||||
(Senior Trips) | ||||||||
Series A 5.00% 7/1/22 (AMT) | 585,000 | 641,300 | ||||||
Series A 5.00% 7/1/28 (AMT) | 1,500,000 | 1,631,895 | ||||||
New York Liberty Development | ||||||||
(4 World Trade Center Project) 5.00% 11/15/31 | 500,000 | 542,580 | ||||||
(Class 1 - 3 World Trade Center Project) 144A 5.00% 11/15/44 # | 1,500,000 | 1,666,185 | ||||||
(Class 2 - 3 World Trade Center Project) 144A 5.375% 11/15/40 # | 500,000 | 565,725 | ||||||
|
| |||||||
| 6,252,726 | ||||||||
|
| |||||||
Local General Obligation Bonds – 3.60% | ||||||||
New York City | ||||||||
Fiscal 2011 Series E 5.00% 8/1/28 | 125,000 | 129,497 | ||||||
Fiscal 2014 Subordinate SeriesD-1 5.00% 8/1/31 | 1,000,000 | 1,149,850 | ||||||
Fiscal 2018 SeriesB-1 4.00% 10/1/41 | 500,000 | 569,595 | ||||||
Fiscal 2019 Series E 5.00% 8/1/32 | 500,000 | 650,280 | ||||||
Subordinate SeriesE-1 5.25% 3/1/35 | 500,000 | 643,370 | ||||||
New York State Dormitory Authority | ||||||||
(School District Financing Program) | ||||||||
Unrefunded Series A 5.00% 10/1/23 | 25,000 | 26,977 | ||||||
77
Table of Contents
Schedules of investments
DelawareTax-Free New York Fund
| Principal amount° | Value (US $) | |||||||
| ||||||||
Municipal Bonds(continued) | ||||||||
| ||||||||
Local General Obligation Bonds(continued) | ||||||||
New York State Dormitory Authority | ||||||||
(School District Financing Program) | ||||||||
Unrefunded Series A 5.00% 10/1/25 (AGM) | 30,000 | $ | 31,194 | |||||
|
| |||||||
| 3,200,763 | ||||||||
|
| |||||||
Pre-Refunded Bonds – 7.34% | ||||||||
Dutchess County Local Development | ||||||||
(Health Quest Systems Project) | ||||||||
Series A 5.00%7/1/34-24 § | 350,000 | 412,885 | ||||||
Series A 5.00%7/1/44-24 § | 1,000,000 | 1,179,670 | ||||||
Hudson Yards Infrastructure | ||||||||
Fiscal 2012 Series A 5.75%2/15/47-21 § | 615,000 | 657,693 | ||||||
Metropolitan Transportation Authority Revenue | ||||||||
Series D 5.25%11/15/27-20 § | 500,000 | 525,960 | ||||||
Monroe County Industrial Development Revenue | ||||||||
(Nazareth College of Rochester Project) | ||||||||
5.25%10/1/31-21 § | 500,000 | 543,960 | ||||||
5.50%10/1/41-21 § | 500,000 | 546,520 | ||||||
New York City Municipal Water Finance Authority Water & Sewer System Revenue | ||||||||
(Second General Resolution) | ||||||||
Fiscal 2012 Series BB | ||||||||
5.25%6/15/44-21 § | 500,000 | 548,265 | ||||||
New York City Transitional Finance Authority Revenue | ||||||||
(Future Tax Secured) | ||||||||
Fiscal 2011 Subordinate SeriesD-1 | ||||||||
5.25%2/1/29-21 § | 305,000 | 323,480 | ||||||
New York State Dormitory Authority RevenueNon-State Supported Debt | ||||||||
(The Northwell Health Obligated Group) | ||||||||
Series A 5.00%5/1/41-21 § | 500,000 | 533,575 | ||||||
Onondaga Civic Development Revenue | ||||||||
(St. Joseph’s Hospital Health Center Project) | ||||||||
4.50%7/1/32-22 § | 380,000 | 416,841 | ||||||
5.00%7/1/42-22 § | 750,000 | 833,123 | ||||||
|
| |||||||
| 6,521,972 | ||||||||
|
| |||||||
Resource Recovery Revenue Bond – 1.80% | ||||||||
Niagara Area Development Revenue | ||||||||
(Covanta Project) Series A 144A 4.75% 11/1/42 (AMT) # | 1,500,000 | 1,596,930 | ||||||
|
| |||||||
| 1,596,930 | ||||||||
|
| |||||||
Special Tax Revenue Bonds – 17.76% | ||||||||
Build NYC Resource | ||||||||
(YMCA of Greater New York Project) 5.00% 8/1/40 | 450,000 | 520,569 | ||||||
78
Table of Contents
| Principal amount° | Value (US $) | |||||||
| ||||||||
Municipal Bonds(continued) | ||||||||
| ||||||||
Special Tax Revenue Bonds(continued) | ||||||||
Glen Cove Local Economic Assistance | ||||||||
(Garvies Point Public Improvement Project) | ||||||||
Series A 5.00% 1/1/56 | 250,000 | $ | 272,515 | |||||
Guam Government Business Privilege Tax Revenue | ||||||||
Series A 5.25% 1/1/36 | 240,000 | 254,618 | ||||||
New York City Transitional Finance Authority Revenue (Building Aid) | ||||||||
Fiscal 2012 Subordinate SeriesS-1A 5.25% 7/15/37 | 1,000,000 | 1,073,830 | ||||||
Fiscal 2015 Subordinate SeriesS-1 5.00% 7/15/43 | 1,000,000 | 1,165,770 | ||||||
(Future Tax Secured) | ||||||||
Fiscal 2014 Subordinate SeriesA-1 5.00% 11/1/42 | 750,000 | 856,687 | ||||||
Fiscal 2014 Subordinate SeriesB-1 5.00% 11/1/40 | 750,000 | 867,495 | ||||||
Fiscal 2015 Subordinate SeriesE-1 5.00% 2/1/41 | 1,000,000 | 1,171,480 | ||||||
Fiscal 2016 Subordinate SeriesC-1 4.00% 11/1/42 | 500,000 | 579,750 | ||||||
Fiscal 2017 Subordinate SeriesA-1 4.00% 5/1/42 | 500,000 | 559,415 | ||||||
Fiscal 2017 Subordinate SeriesE-1 5.00% 2/1/43 | 1,000,000 | 1,210,400 | ||||||
Unrefunded Fiscal 2011 Subordinate Series C 5.25% 11/1/25 | 310,000 | 325,088 | ||||||
Unrefunded Fiscal 2011 Subordinate SeriesD-1 5.25% 2/1/29 | 195,000 | 206,376 | ||||||
New York Convention Center Development Revenue | ||||||||
(Hotel Unit Fee Secured) 5.00% 11/15/35 | 1,000,000 | 1,202,460 | ||||||
New York State Dormitory Authority Revenue | ||||||||
(General Purpose) Series C 5.00% 3/15/34 | 500,000 | 528,210 | ||||||
New York State Urban Development Revenue | ||||||||
(General Purpose) Series A 4.00% 3/15/36 | 500,000 | 567,100 | ||||||
Puerto Rico Sales Tax Financing Revenue (Restructured) | ||||||||
SeriesA-1 4.55% 7/1/40 | 425,000 | 438,681 | ||||||
SeriesA-1 4.75% 7/1/53 | 1,475,000 | 1,516,020 | ||||||
SeriesA-1 5.00% 7/1/58 | 125,000 | 130,645 | ||||||
SeriesA-1 5.687% 7/1/51 ^ | 4,120,000 | 800,681 | ||||||
SeriesA-1 5.729% 7/1/46 ^ | 1,935,000 | 519,625 | ||||||
SeriesA-2 4.536% 7/1/53 | 1,000,000 | 1,016,220 | ||||||
|
| |||||||
| 15,783,635 | ||||||||
|
| |||||||
State General Obligation Bond – 0.56% | ||||||||
New York State | ||||||||
Series A 5.00% 3/1/38 | 500,000 | 501,415 | ||||||
|
| |||||||
| 501,415 | ||||||||
|
| |||||||
Transportation Revenue Bonds – 10.48% | ||||||||
Buffalo & Fort Erie Public Bridge Authority | ||||||||
5.00% 1/1/47 | 435,000 | 517,907 | ||||||
79
Table of Contents
Schedules of investments
DelawareTax-Free New York Fund
| Principal amount° | Value (US $) | |||||||
| ||||||||
Municipal Bonds(continued) | ||||||||
| ||||||||
Transportation Revenue Bonds(continued) | ||||||||
Metropolitan Transportation Authority Revenue | 500,000 | $ | 557,360 | |||||
(Green Bond) | ||||||||
Series B 4.00% 11/15/50 | 1,000,000 | 1,122,080 | ||||||
SeriesC-2 3.08% 11/15/40 (BAM) ^ | 2,380,000 | 1,352,007 | ||||||
New York State Thruway Authority General Revenue | ||||||||
Series I 5.00% 1/1/32 | 700,000 | 762,111 | ||||||
Series L 5.00% 1/1/35 | 100,000 | 126,354 | ||||||
(Junior Indebtedness Obligation) Series A 5.25% 1/1/56 | 1,000,000 | 1,185,590 | ||||||
Port Authority of New York & New Jersey | ||||||||
(Consolidated Bonds - Two Hundred Sixteen Series) | ||||||||
4.00% 9/1/49 | 1,000,000 | 1,158,990 | ||||||
(JFK International Air Terminal Project) | ||||||||
Series 8 6.00% 12/1/42 | 700,000 | 740,257 | ||||||
Series 8 6.50% 12/1/28 | 550,000 | 573,397 | ||||||
Triborough Bridge & Tunnel Authority | ||||||||
(MTA Bridges and Tunnels) Series A 5.00% 11/15/47 | 1,000,000 | 1,217,400 | ||||||
|
| |||||||
| 9,313,453 | ||||||||
|
| |||||||
Water & Sewer Revenue Bonds – 4.58% | ||||||||
New York City Municipal Water Finance Authority Water & Sewer System Revenue | ||||||||
(Second General Resolution) | ||||||||
Fiscal 2017 Series DD 5.00% 6/15/47 | 1,000,000 | 1,214,530 | ||||||
Fiscal 2019 Subordinate SeriesFF-1 4.00% 6/15/49 | 1,000,000 | 1,148,720 | ||||||
Fiscal 2020 Series AA 4.00% 6/15/40 | 1,000,000 | 1,174,410 | ||||||
New York State Environmental Facilities Revenue | ||||||||
(New York City Municipal Water Finance Authority Projects - Second Resolution) | 500,000 | 535,115 | ||||||
|
| |||||||
| 4,072,775 | ||||||||
|
| |||||||
Total Municipal Bonds(cost $82,208,979) | 87,820,905 | |||||||
|
| |||||||
| ||||||||
Short-Term Investment – 0.67% | ||||||||
| ||||||||
Variable Rate Demand Note – 0.67%¤ | ||||||||
New York City Series F6 | ||||||||
1.39% 6/1/44 (SPA - JPMorgan Chase Bank, N.A.) | 600,000 | 600,000 | ||||||
|
| |||||||
Total Short-Term Investment(cost $600,000) | 600,000 | |||||||
|
| |||||||
Total Value of Securities – 99.48% | $ | 88,420,905 | ||||||
|
| |||||||
80
Table of Contents
| # | Security exempt from registration under Rule 144A of the Securities Act of 1933, as amended. At Aug. 31, 2019, the aggregate value of Rule 144A securities was $7,088,994, which represents 7.98% of the Fund’s net assets. See Note 8 in “Notes to financial statements.” |
| ¤ | Tax-exempt obligations that contain a floating or variable interest rate adjustment formula and an unconditional right of demand to receive payment of the unpaid principal balance plus accrued interest upon a short notice period (generally up to 30 days) prior to specified dates either from the issuer or by drawing on a bank letter of credit, a guarantee, or insurance issued with respect to such instrument. Each rate shown is as of Aug. 31, 2019. |
| § | Pre-refunded bonds. Municipal bonds that are generally backed or secured by US Treasury bonds. Forpre-refunded bonds, the stated maturity is followed by the year in which the bond will bepre-refunded. See Note 8 in “Notes to financial statements.” |
| ° | Principal amount shown is stated in USD unless noted that the security is denominated in another currency. |
| ‡ | Non-income producing security. Security is currently in default. |
| ^ | Zero-coupon security. The rate shown is the effective yield at the time of purchase. |
Summary of abbreviations:
AGM – Insured by Assured Guaranty Municipal Corporation
AMT – Subject to Alternative Minimum Tax
BAM – Insured by Build America Mutual Assurance
FHA – Federal Housing Administration
N.A. – National Association
SPA –Stand-by Purchase Agreement
USD – US Dollar
See accompanying notes, which are an integral part of the financial statements.
81
Table of Contents
| Schedules of investments | ||
| DelawareTax-Free Pennsylvania Fund | August 31, 2019 | |
| Principal amount° | Value (US $) | |||||||
| ||||||||
Municipal Bonds – 99.60% | ||||||||
| ||||||||
Corporate Revenue Bonds – 6.94% | ||||||||
Delaware County Industrial Development Authority | ||||||||
(Covanta Project) Series A 5.00% 7/1/43 | 2,155,000 | $ | 2,204,349 | |||||
Pennsylvania Commonwealth Financing Authority Revenue | ||||||||
(Tobacco Master Settlement Payment Revenue) | ||||||||
4.00% 6/1/39 (AGM) | 5,045,000 | 5,669,268 | ||||||
Pennsylvania Economic Development Financing Authority | ||||||||
(National Gypsum) 5.50% 11/1/44 (AMT) | 4,000,000 | 4,298,160 | ||||||
Pennsylvania Economic Development Financing Authority Solid Waste Disposal Revenue | ||||||||
(CarbonLite P, LLC Project) | ||||||||
144A 5.25% 6/1/26 (AMT)# | 1,750,000 | 1,828,995 | ||||||
144A 5.75% 6/1/36 (AMT)# | 2,375,000 | 2,556,403 | ||||||
(Proctor & Gamble Paper Project) 5.375% 3/1/31 (AMT) | 11,000,000 | 14,601,510 | ||||||
|
| |||||||
| 31,158,685 | ||||||||
|
| |||||||
Education Revenue Bonds – 14.45% | ||||||||
Allegheny County Higher Education Building Authority Revenue | ||||||||
(Carnegie Mellon University) | ||||||||
5.00% 3/1/28 | 2,000,000 | 2,248,900 | ||||||
Series A 5.00% 3/1/24 | 1,000,000 | 1,095,990 | ||||||
(Chatham University) Series A | ||||||||
5.00% 9/1/30 | 1,500,000 | 1,616,430 | ||||||
(Robert Morris University) 5.00% 10/15/47 | 1,500,000 | 1,706,100 | ||||||
Series A 5.50% 10/15/30 | 1,275,000 | 1,324,483 | ||||||
Series A 5.75% 10/15/40 | 2,200,000 | 2,283,578 | ||||||
Bucks County Industrial Development Authority Revenue | ||||||||
(George School Project) 5.00% 9/15/36 | 4,455,000 | 4,782,353 | ||||||
(School Lane Charter School Project) Series A | ||||||||
5.125% 3/15/46 | 2,500,000 | 2,859,975 | ||||||
Chester County Industrial Development Authority Revenue | ||||||||
(Avon Grove Charter School Project) | ||||||||
Series A 5.00% 12/15/47 | 1,160,000 | 1,322,887 | ||||||
Series A 5.00% 12/15/51 | 770,000 | 876,083 | ||||||
(Renaissance Academy Charter School Project) | ||||||||
5.00% 10/1/34 | 1,000,000 | 1,115,660 | ||||||
5.00% 10/1/39 | 1,250,000 | 1,382,887 | ||||||
5.00% 10/1/44 | 1,000,000 | 1,100,970 | ||||||
Chester County Industrial Development Authority Student Housing Revenue | ||||||||
(University Student Housing Project at West Chester University) | ||||||||
Series A 5.00% 8/1/30 | 1,100,000 | 1,212,387 | ||||||
Series A 5.00% 8/1/45 | 1,250,000 | 1,352,400 | ||||||
82
Table of Contents
| Principal amount° | Value (US $) | |||||||
| ||||||||
Municipal Bonds(continued) | ||||||||
| ||||||||
Education Revenue Bonds(continued) | ||||||||
Delaware County Authority Revenue | ||||||||
(Cabrini University) 5.00% 7/1/47 | 2,000,000 | $ | 2,301,360 | |||||
East Hempfield Township Industrial Development Authority | ||||||||
(Student Services - Student Housing Project at Millersville University) | ||||||||
5.00% 7/1/39 | 875,000 | 957,425 | ||||||
5.00% 7/1/45 | 2,500,000 | 2,679,150 | ||||||
5.00% 7/1/46 | 1,425,000 | 1,551,227 | ||||||
5.00% 7/1/47 | 1,000,000 | 1,105,080 | ||||||
Montgomery County Higher Education & Health Authority Revenue | ||||||||
(Arcadia University) | ||||||||
5.625% 4/1/40 | 2,375,000 | 2,419,555 | ||||||
5.75% 4/1/40 | 2,000,000 | 2,232,420 | ||||||
Northeastern Pennsylvania Hospital & Education Authority Revenue | ||||||||
(King’s College Project) 5.00% 5/1/44 | 1,000,000 | 1,202,650 | ||||||
Pennsylvania Higher Educational Facilities Authority College & University Revenue | ||||||||
(Drexel University) 5.00% 5/1/41 | 1,000,000 | 1,199,270 | ||||||
(University Properties Student Housing - East Stroudsburg University of Pennsylvania) 5.00% 7/1/42 | 500,000 | 510,525 | ||||||
Pennsylvania State University | ||||||||
Series A 5.00% 9/1/41 | 2,000,000 | 2,563,140 | ||||||
Philadelphia Authority for Industrial Development Revenue | ||||||||
(First Philadelphia Preparatory Charter School Project) | ||||||||
Series A 7.25% 6/15/43 | 2,500,000 | 2,914,000 | ||||||
(Green Woods Charter School Project) | ||||||||
Series A 5.50% 6/15/22 | 565,000 | 591,708 | ||||||
Series A 5.75% 6/15/42 | 2,500,000 | 2,640,175 | ||||||
(International Apartments of Temple University) | ||||||||
Series A 5.375% 6/15/30 | 1,500,000 | 1,534,200 | ||||||
Series A 5.625% 6/15/42 | 3,000,000 | 3,063,390 | ||||||
(Philadelphia Performing Arts Charter School Project) | ||||||||
144A 6.75% 6/15/43 # | 2,550,000 | 2,615,076 | ||||||
(Tacony Academy Charter School Project) | ||||||||
SeriesA-1 6.75% 6/15/33 | 1,020,000 | 1,140,962 | ||||||
SeriesA-1 7.00% 6/15/43 | 1,535,000 | 1,710,926 | ||||||
(Temple University Second Series) 5.00% 4/1/36 | 1,145,000 | 1,329,059 | ||||||
State Public School Building Authority | ||||||||
(Montgomery County Community College) | ||||||||
5.00% 5/1/28 | 2,000,000 | 2,371,720 | ||||||
|
| |||||||
| 64,914,101 | ||||||||
|
| |||||||
83
Table of Contents
Schedules of investments
DelawareTax-Free Pennsylvania Fund
| Principal amount° | Value (US $) | |||||||
| ||||||||
Municipal Bonds(continued) | ||||||||
| ||||||||
Electric Revenue Bonds – 0.42% | ||||||||
Puerto Rico Electric Power Authority | ||||||||
Series CCC 5.25% 7/1/27 ‡ | 985,000 | $ | 790,463 | |||||
Series WW 5.00% 7/1/28 ‡ | 1,385,000 | 1,108,000 | ||||||
|
| |||||||
| 1,898,463 | ||||||||
|
| |||||||
Healthcare Revenue Bonds – 31.06% | ||||||||
Allegheny County Hospital Development Authority Revenue | ||||||||
(Allegheny Health Network Obligated Group Issue) | ||||||||
Series A 4.00% 4/1/44 | 1,350,000 | 1,472,647 | ||||||
(University of Pittsburgh Medical Center) | ||||||||
Series A 4.00% 7/15/36 | 1,750,000 | 2,017,190 | ||||||
Series A 4.00% 7/15/37 | 1,500,000 | 1,719,945 | ||||||
Series A 4.00% 7/15/38 | 700,000 | 799,022 | ||||||
Berks County Industrial Development Authority Revenue | ||||||||
(The Highlands at Wyomissing) | ||||||||
5.00% 5/15/38 | 415,000 | 475,133 | ||||||
5.00% 5/15/43 | 500,000 | 567,080 | ||||||
5.00% 5/15/48 | 1,000,000 | 1,127,390 | ||||||
Series A 5.00% 5/15/37 | 1,365,000 | 1,593,173 | ||||||
Series A 5.00% 5/15/42 | 500,000 | 576,415 | ||||||
Series A 5.00% 5/15/47 | 600,000 | 687,378 | ||||||
Series C 5.00% 5/15/42 | 1,000,000 | 1,125,800 | ||||||
Series C 5.00% 5/15/47 | 1,000,000 | 1,121,230 | ||||||
(Tower Health Project) | ||||||||
4.00% 11/1/47 | 2,500,000 | 2,709,025 | ||||||
5.00% 11/1/50 | 2,000,000 | 2,341,300 | ||||||
Berks County Municipal Authority Revenue | ||||||||
(Reading Hospital & Medical Center Project) Unrefunded | ||||||||
SeriesA-3 5.50% 11/1/31 | 5,005,000 | 5,038,083 | ||||||
Bucks County Industrial Development Authority Revenue | ||||||||
(Saint Luke’s University Health Network Project) | ||||||||
4.00% 8/15/44 | 2,400,000 | 2,641,104 | ||||||
4.00% 8/15/50 | 1,400,000 | 1,534,792 | ||||||
Butler County Hospital Authority Revenue | ||||||||
(Butler Health System Project) Series A 5.00% 7/1/39 | 1,625,000 | 1,861,600 | ||||||
Central Bradford Progress Authority | ||||||||
(Guthrie Health Issue) 5.375% 12/1/41 | 1,000,000 | 1,072,150 | ||||||
Centre County Hospital Authority Revenue | ||||||||
(Mount Nittany Medical Center Project) Series A | ||||||||
4.00% 11/15/47 | 1,400,000 | 1,532,468 | ||||||
84
Table of Contents
| Principal amount° | Value (US $) | |||||||
| ||||||||
Municipal Bonds(continued) | ||||||||
| ||||||||
Healthcare Revenue Bonds(continued) | ||||||||
Chester County Health & Education Facilities Authority Revenue | ||||||||
(Simpson Senior Services Project) | ||||||||
Series A 5.00% 12/1/35 | 775,000 | $ | 817,827 | |||||
Series A 5.25% 12/1/45 | 1,360,000 | 1,449,896 | ||||||
Cumberland County Municipal Authority Revenue | ||||||||
(Diakon Lutheran Social Ministries Project) | ||||||||
5.00% 1/1/38 | 2,000,000 | 2,220,980 | ||||||
DuBois Hospital Authority | ||||||||
(Penn Highlands Healthcare) 4.00% 7/15/48 | 2,000,000 | 2,168,940 | ||||||
Franklin County Industrial Development Authority Revenue | ||||||||
(Menno-Haven Project) 5.00% 12/1/53 | 1,900,000 | 2,095,282 | ||||||
Geisinger Authority Health System Revenue | ||||||||
(Geisinger Health System) | ||||||||
SeriesA-1 5.00% 2/15/45 | 5,000,000 | 5,935,950 | ||||||
SeriesA-1 5.125% 6/1/41 | 4,000,000 | 4,239,080 | ||||||
General Authority of Southcentral Pennsylvania Revenue | ||||||||
(WellSpan Health Obligated Group) | ||||||||
Series A 5.00% 6/1/38 | 1,000,000 | 1,261,500 | ||||||
Series A 5.00% 6/1/39 | 5,000,000 | 6,291,050 | ||||||
Indiana County Hospital Authority Revenue | ||||||||
(Indiana Regional Medical Center) Series A | ||||||||
6.00% 6/1/39 | 1,625,000 | 1,804,725 | ||||||
Lancaster County Hospital Authority Revenue | ||||||||
(Brethren Village Project) | ||||||||
5.25% 7/1/35 | 250,000 | 273,550 | ||||||
5.25% 7/1/41 | 1,000,000 | 1,106,570 | ||||||
5.50% 7/1/45 | 1,000,000 | 1,100,640 | ||||||
(Landis Homes Retirement Community Project) Series A | ||||||||
5.00% 7/1/45 | 2,000,000 | 2,167,720 | ||||||
(Masonic Villages Project) 5.00% 11/1/35 | 1,000,000 | 1,187,660 | ||||||
5.00% 11/1/36 | 510,000 | 604,131 | ||||||
5.00% 11/1/37 | 250,000 | 294,877 | ||||||
(St. Anne’s Retirement Community Project) | ||||||||
5.00% 4/1/27 | 1,425,000 | 1,498,345 | ||||||
5.00% 4/1/33 | 1,830,000 | 1,906,604 | ||||||
Lehigh County General Purpose Authority Revenue | ||||||||
(Bible Fellowship Church Homes Project) | ||||||||
5.125% 7/1/32 | 1,000,000 | 1,027,560 | ||||||
5.25% 7/1/42 | 1,500,000 | 1,541,460 | ||||||
85
Table of Contents
Schedules of investments
DelawareTax-Free Pennsylvania Fund
| Principal amount° | Value (US $) | |||||||
| ||||||||
Municipal Bonds(continued) | ||||||||
| ||||||||
Healthcare Revenue Bonds(continued) | ||||||||
Monroe County Hospital Authority Revenue | ||||||||
(Pocono Medical Center) | ||||||||
5.00% 7/1/36 | 1,710,000 | $ | 2,027,034 | |||||
5.00% 7/1/41 | 1,000,000 | 1,175,140 | ||||||
Monroeville Finance Authority | ||||||||
(University of Pittsburgh Medical Center) 5.00% 2/15/25 | 1,000,000 | 1,198,330 | ||||||
Montgomery County Higher Education & Health Authority Revenue | ||||||||
(Thomas Jefferson University) Series A 4.00% 9/1/49 | 2,500,000 | 2,745,925 | ||||||
Montgomery County Industrial Development Authority Retirement Community Revenue | ||||||||
(ACTS Retirement Life Communities Obligated Group) | ||||||||
5.00% 11/15/27 | 1,250,000 | 1,364,275 | ||||||
5.00% 11/15/28 | 1,600,000 | 1,744,192 | ||||||
5.00% 11/15/29 | 680,000 | 740,404 | ||||||
Montgomery County Industrial Development Authority Revenue | ||||||||
(Albert Einstein Healthcare Network) Series A | ||||||||
5.25% 1/15/45 | 2,500,000 | 2,834,475 | ||||||
(Waverly Heights Project) | ||||||||
5.00% 12/1/44 | 500,000 | 583,010 | ||||||
5.00% 12/1/49 | 750,000 | 871,275 | ||||||
(Whitemarsh Continuing Care Retirement Community Project) | ||||||||
5.375% 1/1/50 | 4,000,000 | 4,161,920 | ||||||
Series A 5.375% 1/1/51 | 1,500,000 | 1,581,030 | ||||||
Moon Industrial Development Authority Revenue | ||||||||
(Baptist Homes Society) 6.125% 7/1/50 | 4,000,000 | 4,383,120 | ||||||
Northampton County Industrial Development Authority | ||||||||
(Morningstar Senior Living Project) 5.00% 7/1/32 | 1,275,000 | 1,350,990 | ||||||
Pennsylvania Economic Development Financing Authority First Mortgage Revenue | ||||||||
(Tapestry Moon Senior Housing Project) Series A 144A 6.75% 12/1/53 # | 3,950,000 | 4,097,770 | ||||||
Pennsylvania Economic Development Financing Authority Revenue | ||||||||
(University of Pittsburgh Medical Center) Series A 5.00% 7/1/43 | 1,265,000 | 1,402,506 | ||||||
Pennsylvania Higher Educational Facilities Authority College & University Revenue | ||||||||
(Thomas Jefferson University) | ||||||||
Series A 5.00% 9/1/45 | 7,000,000 | 8,065,610 | ||||||
Series A 5.25% 9/1/50 | 2,500,000 | 2,902,625 | ||||||
86
Table of Contents
| Principal amount° | Value (US $) | |||||||
| ||||||||
Municipal Bonds(continued) | ||||||||
| ||||||||
Healthcare Revenue Bonds(continued) | ||||||||
Pennsylvania Higher Educational Facilities Authority Revenue | ||||||||
(University of Pennsylvania Health System) | ||||||||
5.00% 8/15/40 | 2,000,000 | $ | 2,356,980 | |||||
Series A 4.00% 8/15/42 | 4,000,000 | 4,461,720 | ||||||
Philadelphia Authority for Industrial Development Revenue | ||||||||
(Children’s Hospital of Philadelphia Project) 5.00% 7/1/34 | 5,000,000 | 6,185,700 | ||||||
(Thomas Jefferson University) Series A 5.00% 9/1/47 | 2,500,000 | 2,946,825 | ||||||
(Wesley Enhanced Living Obligated Group) Series A 5.00% 7/1/49 | 2,500,000 | 2,778,125 | ||||||
Pocono Mountains Industrial Park Authority Revenue | ||||||||
(St. Luke’s Hospital - Monroe Project) Series A 5.00% 8/15/40 | 4,000,000 | 4,583,080 | ||||||
|
| |||||||
| 139,549,333 | ||||||||
|
| |||||||
Housing Revenue Bond – 0.46% | ||||||||
Philadelphia Authority for Industrial Development Revenue | ||||||||
(The PresbyHomes Germantown Project) Series A 5.625% 7/1/35 (HUD) | 2,065,000 | 2,067,870 | ||||||
|
| |||||||
| 2,067,870 | ||||||||
|
| |||||||
Lease Revenue Bonds – 1.40% | ||||||||
Allegheny County Industrial Development Authority Revenue | ||||||||
(Residential Resource Project) | ||||||||
5.10% 9/1/26 | 1,335,000 | 1,335,000 | ||||||
5.125% 9/1/31 | 435,000 | 435,000 | ||||||
Philadelphia Municipal Authority Revenue | ||||||||
(Juvenile Justice Services Center) | ||||||||
5.00% 4/1/37 | 1,250,000 | 1,505,100 | ||||||
5.00% 4/1/38 | 1,000,000 | 1,201,140 | ||||||
5.00% 4/1/39 | 1,500,000 | 1,797,900 | ||||||
|
| |||||||
| 6,274,140 | ||||||||
|
| |||||||
Local General Obligation Bonds – 8.59% | ||||||||
Allegheny County | ||||||||
SeriesC-69 5.00% 12/1/28 | 1,000,000 | 1,115,750 | ||||||
SeriesC-70 5.00% 12/1/33 | 2,205,000 | 2,457,274 | ||||||
SeriesC-77 5.00% 11/1/43 | 4,535,000 | 5,636,461 | ||||||
Chester County | ||||||||
4.00% 7/15/32 | 2,000,000 | 2,401,980 | ||||||
5.00% 7/15/30 | 3,000,000 | 3,963,030 | ||||||
City of Philadelphia | ||||||||
5.00% 8/1/41 | 1,260,000 | 1,520,694 | ||||||
87
Table of Contents
Schedules of investments
DelawareTax-Free Pennsylvania Fund
| Principal amount° | Value (US $) | |||||||
| ||||||||
Municipal Bonds(continued) | ||||||||
Local General Obligation Bonds(continued) | ||||||||
City of Philadelphia | ||||||||
Series A 5.00% 8/1/37 | 1,750,000 | $ | 2,132,305 | |||||
Series A 5.25% 7/15/29 | 2,500,000 | 2,886,950 | ||||||
Series B 5.00% 2/1/39 | 1,000,000 | 1,261,270 | ||||||
City of Pittsburgh | ||||||||
4.00% 9/1/35 | 750,000 | 854,340 | ||||||
4.00% 9/1/36 | 500,000 | 568,190 | ||||||
Series B 5.00% 9/1/26 | 3,000,000 | 3,328,620 | ||||||
North Allegheny School District | ||||||||
4.00% 5/1/37 | 1,065,000 | 1,238,180 | ||||||
Philadelphia School District | ||||||||
Series F 5.00% 9/1/36 | 2,000,000 | 2,368,380 | ||||||
Series F 5.00% 9/1/37 | 1,500,000 | 1,771,545 | ||||||
Series F 5.00% 9/1/38 | 2,000,000 | 2,357,340 | ||||||
Tredyffrin Easttown School District | ||||||||
5.00% 2/15/38 | 2,250,000 | 2,748,218 | ||||||
|
| |||||||
| 38,610,527 | ||||||||
|
| |||||||
Pre-Refunded/Escrowed to Maturity Bonds – 11.71% | ||||||||
Allegheny County Higher Education Building Authority Revenue | ||||||||
(Carlow University Project) | ||||||||
6.75%11/1/31-21§ | 750,000 | 838,920 | ||||||
7.00%11/1/40-21§ | 1,000,000 | 1,122,960 | ||||||
Delaware County Regional Water Quality Control Authority | ||||||||
5.00%5/1/32-23§ | 2,000,000 | 2,281,220 | ||||||
Franklin County Industrial Development Authority Revenue | ||||||||
(Chambersburg Hospital Project) 5.375%7/1/42-20§ | 4,980,000 | 5,153,852 | ||||||
Huntingdon County General Authority Revenue | ||||||||
(Juniata College) Series A 5.00%5/1/30-20§ | 2,650,000 | 2,768,269 | ||||||
Monroe County Hospital Authority | ||||||||
(Pocono Medical Center) | ||||||||
Series A 5.00%1/1/32-22§ | 1,150,000 | 1,249,602 | ||||||
Series A 5.00%1/1/41-22§ | 1,500,000 | 1,629,915 | ||||||
Montgomery County Higher Education & Health Authority Revenue | ||||||||
(Abington Memorial Hospital Obligated Group) Series A | ||||||||
5.00%6/1/31-22§ | 2,000,000 | 2,209,480 | ||||||
Montgomery County Industrial Development Authority Revenue | ||||||||
(New Regional Medical Center Project) | ||||||||
5.375%8/1/38-20 (FHA)§ | 995,000 | 1,034,163 | ||||||
88
Table of Contents
| Principal amount° | Value (US $) | |||||||
Municipal Bonds(continued) | ||||||||
Pre-Refunded/Escrowed to Maturity Bonds(continued) | ||||||||
Pennsylvania Higher Educational Facilities Authority College & University Revenue | ||||||||
(AICUP Financing Program - St. Francis University Project) Series JJ2 6.25%11/1/41-21§ | 2,355,000 | $ | 2,615,086 | |||||
(Edinboro University Foundation Student Housing Project) 6.00%7/1/43-20§ | 1,000,000 | 1,040,450 | ||||||
(Indiana University - Student Housing Project) | ||||||||
Series A 5.00%7/1/27-22§ | 1,740,000 | 1,930,269 | ||||||
Series A 5.00%7/1/41-22§ | 1,500,000 | 1,664,025 | ||||||
(Philadelphia University) 5.00%6/1/32-23§ | 2,000,000 | 2,287,500 | ||||||
(Shippensburg University - Student Housing Project) | ||||||||
5.00%10/1/44-22§ | 1,500,000 | 1,677,840 | ||||||
6.25%10/1/43-21§ | 2,000,000 | 2,212,460 | ||||||
(University of the Arts) 5.20% 3/15/25 (AGC) | 4,490,000 | 5,093,995 | ||||||
Pennsylvania Higher Educational Facilities Authority Revenue | ||||||||
(University of Pennsylvania Health System) | ||||||||
Series A 5.00%8/15/24-21§ | 2,850,000 | 3,065,831 | ||||||
Series A 5.25%8/15/26-21§ | 3,910,000 | 4,224,872 | ||||||
Philadelphia Authority for Industrial Development Revenue | ||||||||
(MaST Charter School Project) 6.00%8/1/35-20§ | 1,610,000 | 1,679,439 | ||||||
(New Foundations Charter School Project) 6.625%12/15/41-22§ | 1,000,000 | 1,172,560 | ||||||
Philadelphia Hospitals & Higher Education Facilities Authority Revenue | ||||||||
(Presbyterian Medical Center) 6.65% 12/1/19 | 2,020,000 | 2,047,088 | ||||||
South Fork Municipal Hospital Authority Revenue | ||||||||
(Conemaugh Health System Project) 5.50%7/1/29-20§ | 3,500,000 | 3,624,285 | ||||||
|
| |||||||
| 52,624,081 | ||||||||
|
| |||||||
Special Tax Revenue Bonds – 8.51% | ||||||||
Allentown Neighborhood Improvement Zone Development Authority Revenue | ||||||||
Series A 5.00% 5/1/42 | 2,500,000 | 2,639,925 | ||||||
(City Center Project) 144A 5.375% 5/1/42 # | 1,800,000 | 2,035,764 | ||||||
(City Center Refunding Project) 144A 5.00% 5/1/42 # | 2,500,000 | 2,817,875 | ||||||
Chester County Industrial Development Authority Special Obligation Revenue | ||||||||
(Woodlands at Greystone Project) | ||||||||
144A 5.00% 3/1/38 # | 560,000 | 602,487 | ||||||
144A 5.125% 3/1/48 # | 1,000,000 | 1,074,360 | ||||||
Northampton County Industrial Development Authority | ||||||||
(Route 33 Project) 7.00% 7/1/32 | 1,900,000 | 2,157,146 | ||||||
89
Table of Contents
Schedules of investments
DelawareTax-Free Pennsylvania Fund
| Principal amount° | Value (US $) | |||||||
| ||||||||
Municipal Bonds(continued) | ||||||||
| ||||||||
Special Tax Revenue Bonds(continued) | ||||||||
Port Authority of Allegheny County | ||||||||
5.75% 3/1/29 | 5,200,000 | $ | 5,549,076 | |||||
Puerto Rico Sales Tax Financing Revenue | ||||||||
(Capital Appreciation - Restructured) | ||||||||
SeriesA-1 5.644% 7/1/51 ^ | 32,795,000 | 6,373,380 | ||||||
SeriesA-1 5.697% 7/1/46 ^ | 11,521,000 | 3,093,849 | ||||||
(Restructured) | ||||||||
SeriesA-1 4.75% 7/1/53 | 2,520,000 | 2,590,081 | ||||||
SeriesA-2 4.329% 7/1/40 | 4,500,000 | 4,584,375 | ||||||
Sports & Exhibition Authority of Pittsburgh & Allegheny County | ||||||||
(Hotel Room Excise Tax) 5.00% 2/1/35 (AGM) | 3,000,000 | 3,094,920 | ||||||
Washington County Redevelopment Authority Revenue | ||||||||
(Victory Centre Tax Increment Financing Project) 5.00% 7/1/35 | 1,500,000 | 1,607,430 | ||||||
|
| |||||||
| 38,220,668 | ||||||||
|
| |||||||
State General Obligation Bond – 3.32% | ||||||||
Commonwealth of Pennsylvania | ||||||||
5.00% 9/15/26 | 3,340,000 | 4,155,160 | ||||||
5.00% 7/15/28 | 3,255,000 | 4,198,852 | ||||||
5.00% 7/15/29 | 5,000,000 | 6,568,800 | ||||||
|
| |||||||
| 14,922,812 | ||||||||
|
| |||||||
Transportation Revenue Bonds – 8.16% | ||||||||
Delaware River Joint Toll Bridge Commission | ||||||||
(Pennsylvania - New Jersey) 5.00% 7/1/47 | 5,000,000 | 6,086,000 | ||||||
Pennsylvania Economic Development Financing Authority Exempt Facilities Revenue | ||||||||
(Amtrak Project) | ||||||||
Series A 5.00% 11/1/32 (AMT) | 3,500,000 | 3,825,150 | ||||||
Series A 5.00% 11/1/41 (AMT) | 5,000,000 | 5,444,300 | ||||||
Pennsylvania Turnpike Commission Revenue | ||||||||
Series A 5.00% 12/1/23 | 2,450,000 | 2,842,417 | ||||||
Series A 5.00% 12/1/49 | 2,000,000 | 2,492,300 | ||||||
Series C 5.00% 12/1/44 | 5,000,000 | 5,763,900 | ||||||
Philadelphia Airport Revenue | ||||||||
Series A 5.00% 7/1/47 | 3,750,000 | 4,540,313 | ||||||
Series B 5.00% 7/1/47 (AMT) | 3,000,000 | 3,560,760 | ||||||
Susquehanna Area Regional Airport Authority Revenue | ||||||||
5.00% 1/1/35 (AMT) | 800,000 | 943,184 | ||||||
5.00% 1/1/38 (AMT) | 1,000,000 | 1,169,270 | ||||||
|
| |||||||
| 36,667,594 | ||||||||
|
| |||||||
90
Table of Contents
| Principal amount° | Value (US $) | |||||||
| ||||||||
Municipal Bonds(continued) | ||||||||
| ||||||||
Water & Sewer Revenue Bonds – 4.58% | ||||||||
Allegheny County Sanitary Authority | ||||||||
5.00% 12/1/28 (BAM) | 2,345,000 | $ | 2,834,378 | |||||
Bucks County Water & Sewer Authority | ||||||||
5.00% 12/1/28 (AGM) | 1,000,000 | 1,277,830 | ||||||
Series A 5.00% 12/1/37 (AGM) | 780,000 | 917,046 | ||||||
Series A 5.00% 12/1/40 (AGM) | 1,000,000 | 1,173,200 | ||||||
Philadelphia Water & Wastewater Revenue | ||||||||
5.00% 11/1/28 | 4,500,000 | 5,024,115 | ||||||
Series A 5.00% 7/1/45 | 2,500,000 | 2,849,225 | ||||||
Series A 5.25% 10/1/52 | 1,000,000 | 1,223,010 | ||||||
Pittsburgh Water & Sewer Authority | ||||||||
(Subordinate Revenue Refunding Bonds) | ||||||||
Series B 4.00% 9/1/34 (AGM) | 1,000,000 | 1,175,190 | ||||||
Series B 4.00% 9/1/35 (AGM) | 300,000 | 349,902 | ||||||
Series B 5.00% 9/1/32 (AGM) | 1,500,000 | 2,035,845 | ||||||
Series B 5.00% 9/1/33 (AGM) | 1,250,000 | 1,719,100 | ||||||
|
| |||||||
| 20,578,841 | ||||||||
|
| |||||||
Total Municipal Bonds(cost $413,530,691) | 447,487,115 | |||||||
|
| |||||||
| ||||||||
Short-Term Investment – 0.36% | ||||||||
| ||||||||
Variable Rate Demand Note – 0.36%¤ | ||||||||
Philadelphia Hospitals & Higher Education Facilities Authority Revenue (The Children’s Hospital of Philadelphia Project) Series A 1.36% 7/1/41 (SPA - Wells Fargo Bank N.A.) | 1,600,000 | 1,600,000 | ||||||
|
| |||||||
Total Short-Term Investment(cost $1,600,000) | 1,600,000 | |||||||
|
| |||||||
Total Value of Securities – 99.96% | $ | 449,087,115 | ||||||
|
| |||||||
| # | Security exempt from registration under Rule 144A of the Securities Act of 1933, as amended. At Aug. 31, 2019, the aggregate value of Rule 144A securities was $17,628,730, which represents 3.92% of the Fund’s net assets. See Note 8 in “Notes to financial statements.” |
| ¤ | Tax-exempt obligations that contain a floating or variable interest rate adjustment formula and an unconditional right of demand to receive payment of the unpaid principal balance plus accrued interest upon a short notice period (generally up to 30 days) prior to specified dates either from the issuer or by drawing on a bank letter of credit, a guarantee, or insurance issued with respect to such instrument. Each rate shown is as of Aug. 31, 2019. |
| § | Pre-refunded bonds. Municipal bonds that are generally backed or secured by US Treasury bonds. Forpre-refunded bonds, the stated maturity is followed by the year in which the bond will bepre-refunded. See Note 8 in “Notes to financial statements.” |
91
Table of Contents
Schedules of investments
DelawareTax-Free Pennsylvania Fund
| ° | Principal amount shown is stated in USD unless noted that the security is denominated in another currency. |
| ‡ | Non-income producing security. Security is currently in default. |
| ^ | Zero-coupon security. The rate shown is the effective yield at the time of purchase. |
Summary of abbreviations:
| AGC | – Insured by Assured Guaranty Corporation | |
| AGM | – Insured by Assured Guaranty Municipal Corporation | |
| AMT | – Subject to Alternative Minimum Tax | |
| BAM | – Insured by Build America Mutual Assurance | |
| FHA | – Federal Housing Administration | |
| HUD | – Housing and Urban Development Section 8 | |
| N.A. | – National Association | |
| SPA | –Stand-by Purchase Agreement | |
| USD | – US Dollar |
See accompanying notes, which are an integral part of the financial statements.
92
Table of Contents
This page intentionally left blank.
Table of Contents
| Statements of assets and liabilities | ||
| August 31, 2019 | ||
| Delaware Tax-Free Arizona Fund | Delaware Tax-Free California Fund | Delaware Tax-Free Colorado Fund | |||||||||||||
Assets: | |||||||||||||||
Investments, at value1 | $ | 78,686,102 | $ | 100,250,577 | $ | 226,837,909 | |||||||||
Cash | 44,208 | 28,398 | — | ||||||||||||
Interest receivable | 664,337 | 1,153,418 | 2,270,024 | ||||||||||||
Receivable for fund shares sold | 1,000 | 85,247 | 326,049 | ||||||||||||
Receivable for securities sold | — | 110,814 | — | ||||||||||||
|
|
|
|
|
| ||||||||||
Total assets | 79,395,647 | 101,628,454 | 229,433,982 | ||||||||||||
|
|
|
|
|
| ||||||||||
Liabilities: | |||||||||||||||
Cash due to custodian | — | — | 8,200 | ||||||||||||
Distribution payable | 56,869 | 77,709 | 162,344 | ||||||||||||
Payable for fund shares redeemed | 2,000 | 5,561 | 13,905 | ||||||||||||
Payable for securities purchased | — | 3,058,850 | 9,254,160 | ||||||||||||
Distribution fees payable to affiliates | 15,804 | 19,174 | 43,992 | ||||||||||||
Accounting and administration expenses payable tonon-affiliates | 15,561 | 15,805 | 17,216 | ||||||||||||
Investment management fees payable to affiliates | 14,365 | 25,980 | 72,718 | ||||||||||||
Reports and statements to shareholders expenses payable tonon-affiliates | 6,934 | 7,754 | 12,746 | ||||||||||||
Audit and tax fees payable | 5,500 | 5,500 | 5,500 | ||||||||||||
Dividend disbursing and transfer agent fees and expenses payable tonon-affiliates | 4,582 | 6,546 | 15,052 | ||||||||||||
Other accrued expenses | 2,940 | 3,567 | 6,376 | ||||||||||||
Dividend disbursing and transfer agent fees and expenses payable to affiliates | 660 | 832 | 1,825 | ||||||||||||
Accounting and administration expenses payable to affiliates | 593 | 658 | 1,039 | ||||||||||||
Trustees’ fees and expenses payable | 578 | 733 | 1,598 | ||||||||||||
Legal fees payable to affiliates | 118 | 150 | 328 | ||||||||||||
Reports and statements to shareholders expenses payable to affiliates | 37 | 46 | 102 | ||||||||||||
|
|
|
|
|
| ||||||||||
Total liabilities | 126,541 | 3,228,865 | 9,617,101 | ||||||||||||
|
|
|
|
|
| ||||||||||
Total Net Assets | $ | 79,269,106 | $ | 98,399,589 | $ | 219,816,881 | |||||||||
|
|
|
|
|
| ||||||||||
Net Assets Consist of: | |||||||||||||||
Paid-in capital | $ | 74,165,118 | $ | 90,178,416 | $ | 207,590,779 | |||||||||
Total distributable earnings (loss) | 5,103,988 | 8,221,173 | 12,226,102 | ||||||||||||
|
|
|
|
|
| ||||||||||
Total Net Assets | $ | 79,269,106 | $ | 98,399,589 | $ | 219,816,881 | |||||||||
|
|
|
|
|
| ||||||||||
94
Table of Contents
| Delaware Tax-Free Arizona Fund | Delaware Tax-Free California Fund | Delaware Tax-Free Colorado Fund | |||||||||||||
Net Asset Value | |||||||||||||||
Class A: | |||||||||||||||
Net assets | $ | 62,033,479 | $ | 42,203,248 | $ | 167,135,818 | |||||||||
Shares of beneficial interest outstanding, unlimited authorization, no par | 5,302,432 | 3,378,049 | 14,557,262 | ||||||||||||
Net asset value per share | $ | 11.70 | $ | 12.49 | $ | 11.48 | |||||||||
Sales charge | 4.50 | % | 4.50 | % | 4.50 | % | |||||||||
Offering price per share, equal to net asset value per share / (1 – sales charge) | $ | 12.25 | $ | 13.08 | $ | 12.02 | |||||||||
Class C: | |||||||||||||||
Net assets | $ | 3,100,035 | $ | 11,550,986 | $ | 10,363,583 | |||||||||
Shares of beneficial interest outstanding, unlimited authorization, no par | 264,305 | 922,959 | 900,320 | ||||||||||||
Net asset value per share | $ | 11.73 | $ | 12.52 | $ | 11.51 | |||||||||
Institutional Class: | |||||||||||||||
Net assets | $ | 14,135,592 | $ | 44,645,355 | $ | 42,317,480 | |||||||||
Shares of beneficial interest outstanding, unlimited authorization, no par | 1,208,164 | 3,573,560 | 3,686,020 | ||||||||||||
Net asset value per share | $ | 11.70 | $ | 12.49 | $ | 11.48 | |||||||||
| |||||||||||||||
1Investments, at cost | $ | 73,555,561 | $ | 92,719,996 | $ | 211,767,947 | |||||||||
See accompanying notes, which are an integral part of the financial statements.
95
Table of Contents
Statements of assets and liabilities
Delaware Tax-Free Idaho Fund | Delaware Tax-Free New York Fund | Delaware Tax-Free Pennsylvania Fund | |||||||||||||
Assets: | |||||||||||||||
Investments, at value1 | $102,026,231 | $88,420,905 | $449,087,115 | ||||||||||||
Cash | 40 | 32,642 | 25,904 | ||||||||||||
Interest receivable | 1,376,817 | 819,752 | 5,201,367 | ||||||||||||
Receivable for securities sold | 259,803 | — | — | ||||||||||||
Receivable for fund shares sold | 30,554 | 68,333 | 244,734 | ||||||||||||
|
|
|
|
|
| ||||||||||
Total assets | 103,693,445 | 89,341,632 | 454,559,120 | ||||||||||||
|
|
|
|
|
| ||||||||||
Liabilities: | |||||||||||||||
Distribution payable | 74,755 | 63,572 | 334,278 | ||||||||||||
Payable for fund shares redeemed | 10,539 | 6,312 | 445,292 | ||||||||||||
Payable for securities purchased | — | 318,588 | 4,152,748 | ||||||||||||
Investment management fees payable to affiliates | 31,296 | 11,553 | 159,227 | ||||||||||||
Distribution fees payable to affiliates | 22,952 | 19,068 | 98,825 | ||||||||||||
Accounting and administration expenses payable tonon-affiliates | 15,849 | 15,674 | 19,951 | ||||||||||||
Reports and statements to shareholders expenses payable tonon-affiliates | 8,103 | 7,206 | 25,725 | ||||||||||||
Dividend disbursing and transfer agent fees and expenses payable tonon-affiliates | 6,281 | 7,047 | 30,099 | ||||||||||||
Audit and tax fees payable | 5,500 | 5,500 | 5,500 | ||||||||||||
Other accrued expenses | 3,583 | 4,686 | 6,831 | ||||||||||||
Dividend disbursing and transfer agent fees and expenses payable to affiliates | 863 | 740 | 3,752 | ||||||||||||
Trustees’ fees and expenses payable | 759 | 651 | 3,293 | ||||||||||||
Accounting and administration expenses payable to affiliates | 670 | 623 | 1,777 | ||||||||||||
Legal fees payable to affiliates | 156 | 133 | 675 | ||||||||||||
Reports and statements to shareholders expenses payable to affiliates | 48 | 41 | 208 | ||||||||||||
|
|
|
|
|
| ||||||||||
Total liabilities | 181,354 | 461,394 | 5,288,181 | ||||||||||||
|
|
|
|
|
| ||||||||||
Total Net Assets | $103,512,091 | $88,880,238 | $449,270,939 | ||||||||||||
|
|
|
|
|
| ||||||||||
Net Assets Consist of: | |||||||||||||||
Paid-in capital | $101,913,843 | $83,233,158 | $412,981,204 | ||||||||||||
Total distributable earnings (loss) | 1,598,248 | 5,647,080 | 36,289,735 | ||||||||||||
|
|
|
|
|
| ||||||||||
Total Net Assets | $103,512,091 | $88,880,238 | $449,270,939 | ||||||||||||
|
|
|
|
|
| ||||||||||
96
Table of Contents
| �� | Delaware Tax-Free Idaho Fund | Delaware Tax-Free New York Fund | Delaware Tax-Free Pennsylvania Fund | ||||||||||||
Net Asset Value | |||||||||||||||
Class A: | |||||||||||||||
Net assets | $ | 55,479,683 | $ | 36,058,213 | $ | 376,964,508 | |||||||||
Shares of beneficial interest outstanding, unlimited authorization, no par | 4,762,553 | 3,041,145 | 45,681,091 | ||||||||||||
Net asset value per share | $ | 11.65 | $ | 11.86 | $ | 8.25 | |||||||||
Sales charge | 4.50 | % | 4.50 | % | 4.50 | % | |||||||||
Offering price per share, equal to net asset value per share / (1 – sales charge) | $ | 12.20 | $ | 12.42 | $ | 8.64 | |||||||||
Class C: | |||||||||||||||
Net assets | $ | 12,875,008 | $ | 13,459,016 | $ | 25,065,003 | |||||||||
Shares of beneficial interest outstanding, unlimited authorization, no par | 1,106,123 | 1,137,991 | 3,036,484 | ||||||||||||
Net asset value per share | $ | 11.64 | $ | 11.83 | $ | 8.25 | |||||||||
Institutional Class: | |||||||||||||||
Net assets | $ | 35,157,400 | $ | 39,363,009 | $ | 47,241,428 | |||||||||
Shares of beneficial interest outstanding, unlimited authorization, no par | 3,017,497 | 3,321,318 | 5,728,762 | ||||||||||||
Net asset value per share | $ | 11.65 | $ | 11.85 | $ | 8.25 | |||||||||
| |||||||||||||||
1Investments, at cost | $ | 95,950,859 | $ | 82,808,979 | $ | 415,130,691 | |||||||||
See accompanying notes, which are an integral part of the financial statements.
97
Table of Contents
| Statements of operations | ||
| Year ended August 31, 2019 | ||
| Delaware Tax-Free Arizona Fund | Delaware Tax-Free California Fund | Delaware Tax-Free Colorado Fund | |||||||||||||
Investment Income: | |||||||||||||||
Interest | $ | 3,120,149 | $ | 3,996,396 | $ | 8,472,132 | |||||||||
|
|
|
|
|
| ||||||||||
Expenses: | |||||||||||||||
Management fees | 377,982 | 525,615 | 1,122,959 | ||||||||||||
Distribution expenses — Class A | 151,757 | 117,197 | 404,731 | ||||||||||||
Distribution expenses — Class C | 30,869 | 117,099 | 101,410 | ||||||||||||
Accounting and administration expenses | 54,997 | 58,561 | 77,952 | ||||||||||||
Audit and tax fees | 46,673 | 46,673 | 46,673 | ||||||||||||
Dividend disbursing and transfer agent fees and expenses | 41,385 | 53,161 | 117,008 | ||||||||||||
Registration fees | 19,902 | 13,856 | 15,205 | ||||||||||||
Reports and statements to shareholders expenses | 15,936 | 17,000 | 27,387 | ||||||||||||
Legal fees | 5,928 | 5,996 | 14,066 | ||||||||||||
Trustees’ fees and expenses | 4,348 | 5,495 | 11,729 | ||||||||||||
Custodian fees | 2,537 | 3,321 | 6,162 | ||||||||||||
Other | 14,771 | 18,046 | 24,053 | ||||||||||||
|
|
|
|
|
| ||||||||||
| 767,085 | 982,020 | 1,969,335 | |||||||||||||
Less expenses waived | (137,327 | ) | (200,878 | ) | (257,273 | ) | |||||||||
Less expenses paid indirectly | (1,030 | ) | (1,752 | ) | (1,436 | ) | |||||||||
|
|
|
|
|
| ||||||||||
Total operating expenses | 628,728 | 779,390 | 1,710,626 | ||||||||||||
|
|
|
|
|
| ||||||||||
Net Investment Income | 2,491,421 | 3,217,006 | 6,761,506 | ||||||||||||
|
|
|
|
|
| ||||||||||
Net Realized and Unrealized Gain: | |||||||||||||||
Net realized gain | 393,695 | 685,110 | 680,050 | ||||||||||||
Net change in unrealized appreciation (depreciation) of investments | 2,638,928 | 3,465,712 | 7,595,228 | ||||||||||||
|
|
|
|
|
| ||||||||||
Net Realized and Unrealized Gain | 3,032,623 | 4,150,822 | 8,275,278 | ||||||||||||
|
|
|
|
|
| ||||||||||
Net Increase in Net Assets Resulting from Operations | $ | 5,524,044 | $ | 7,367,828 | $ | 15,036,784 | |||||||||
|
|
|
|
|
| ||||||||||
See accompanying notes, which are an integral part of the financial statements.
98
Table of Contents
| Delaware Tax-Free Idaho Fund | Delaware Tax-Free New York Fund | Delaware Tax-Free Pennsylvania Fund | |||||||||||||
Investment Income: | |||||||||||||||
Interest | $ | 3,912,789 | $ | 3,314,666 | $ | 18,833,228 | |||||||||
|
|
|
|
|
| ||||||||||
Expenses: | |||||||||||||||
Management fees | 542,314 | 464,791 | 2,387,037 | ||||||||||||
Distribution expenses — Class A | 140,676 | 87,946 | 889,798 | ||||||||||||
Distribution expenses — Class C | 147,704 | 139,486 | 249,681 | ||||||||||||
Accounting and administration expenses | 59,103 | 56,588 | 118,989 | ||||||||||||
Dividend disbursing and transfer agent fees and expenses | 58,878 | 51,329 | 244,052 | ||||||||||||
Audit and tax fees | 46,673 | 46,673 | 46,673 | ||||||||||||
Reports and statements to shareholders expenses | 16,426 | 19,783 | 53,531 | ||||||||||||
Registration fees | 12,023 | 22,539 | 24,575 | ||||||||||||
Legal fees | 6,243 | 6,933 | 32,602 | ||||||||||||
Trustees’ fees and expenses | 5,675 | 4,849 | 24,979 | ||||||||||||
Custodian fees | 3,034 | 3,115 | 13,616 | ||||||||||||
Other | 15,280 | 19,347 | 34,355 | ||||||||||||
|
|
|
|
|
| ||||||||||
| 1,054,029 | 923,379 | 4,119,888 | |||||||||||||
Less expenses waived | (163,052 | ) | (229,466 | ) | (343,463 | ) | |||||||||
Less expenses paid indirectly | (1,136 | ) | (1,556 | ) | (5,767 | ) | |||||||||
|
|
|
|
|
| ||||||||||
Total operating expenses | 889,841 | 692,357 | 3,770,658 | ||||||||||||
|
|
|
|
|
| ||||||||||
Net Investment Income | 3,022,948 | 2,622,309 | 15,062,570 | ||||||||||||
|
|
|
|
|
| ||||||||||
Net Realized and Unrealized Gain: | |||||||||||||||
Net realized gain | 124,264 | 585,562 | 2,465,773 | ||||||||||||
Net change in unrealized appreciation (depreciation) of investments | 3,691,615 | 3,228,074 | 14,954,570 | ||||||||||||
|
|
|
|
|
| ||||||||||
Net Realized and Unrealized Gain | 3,815,879 | 3,813,636 | 17,420,343 | ||||||||||||
|
|
|
|
|
| ||||||||||
Net Increase in Net Assets Resulting from Operations | $ | 6,838,827 | $ | 6,435,945 | $ | 32,482,913 | |||||||||
|
|
|
|
|
| ||||||||||
See accompanying notes, which are an integral part of the financial statements.
99
Table of Contents
Statements of changes in net assets
Delaware Tax-Free Arizona Fund
| Year ended | ||||||||
| 8/31/19 | 8/31/18 | |||||||
Increase (Decrease) in Net Assets from Operations: | ||||||||
Net investment income | $ | 2,491,421 | $ | 2,490,400 | ||||
Net realized gain | 393,695 | 379,155 | ||||||
Net change in unrealized appreciation (depreciation) | 2,638,928 | (2,032,054 | ) | |||||
|
|
|
| |||||
Net increase in net assets resulting from operations | 5,524,044 | 837,501 | ||||||
|
|
|
| |||||
Dividends and Distributions to Shareholders from: | ||||||||
Distributable earnings*: | ||||||||
Class A | (1,967,135 | ) | (2,075,708 | ) | ||||
Class C | (76,738 | ) | (115,956 | ) | ||||
Institutional Class | (409,955 | ) | (287,750 | ) | ||||
|
|
|
| |||||
| (2,453,828 | ) | (2,479,414 | ) | |||||
|
|
|
| |||||
Capital Share Transactions: | ||||||||
Proceeds from shares sold: | ||||||||
Class A | 2,955,388 | 4,543,493 | ||||||
Class C | 480,567 | 428,738 | ||||||
Institutional Class | 6,622,321 | 5,486,278 | ||||||
Net asset value of shares issued upon reinvestment of dividends and distributions: | ||||||||
Class A | 1,574,396 | 1,649,081 | ||||||
Class C | 72,176 | 106,674 | ||||||
Institutional Class | 386,192 | 266,147 | ||||||
|
|
|
| |||||
| 12,091,040 | 12,480,411 | |||||||
|
|
|
| |||||
100
Table of Contents
| Year ended | ||||||||
| 8/31/19 | 8/31/18 | |||||||
Capital Share Transactions (continued): | ||||||||
Cost of shares redeemed: | ||||||||
Class A | $ | (8,235,796 | ) | $ | (8,330,769 | ) | ||
Class C | (701,906 | ) | (2,522,165 | ) | ||||
Institutional Class | (3,500,751 | ) | (2,573,565 | ) | ||||
|
|
|
| |||||
| (12,438,453 | ) | (13,426,499 | ) | |||||
|
|
|
| |||||
Decrease in net assets derived from capital share transactions | (347,413 | ) | (946,088 | ) | ||||
|
|
|
| |||||
Net Increase (Decrease) in Net Assets | 2,722,803 | (2,588,001 | ) | |||||
Net Assets: | ||||||||
Beginning of year | 76,546,303 | 79,134,304 | ||||||
|
|
|
| |||||
End of year1 | $ | 79,269,106 | $ | 76,546,303 | ||||
|
|
|
| |||||
| 1 | Net Assets – End of year includes undistributed net investment income of $19,881 in 2018. The Securities and Exchange Commission eliminated the requirement to disclose undistributed (distributions in excess of) net investment income in 2018. |
| * | For the year ended Aug. 31, 2019, the Fund has adopted amendments to Regulation S-X (see Note 10 in “Notes to financial statements”). For the year ended Aug. 31, 2018, the dividends and distributions to shareholders were as follows: |
| Class A | Class C | Institutional Class | ||||||||||
Dividends from net investment income | $ | (2,075,708 | ) | $ | (115,956 | ) | $ | (287,750 | ) | |||
See accompanying notes, which are an integral part of the financial statements.
101
Table of Contents
Statements of changes in net assets
Delaware Tax-Free California Fund
| Year ended | ||||||||
| 8/31/19 | 8/31/18 | |||||||
Increase (Decrease) in Net Assets from Operations: | ||||||||
Net investment income | $ | 3,217,006 | $ | 3,236,364 | ||||
Net realized gain | 685,110 | 507,199 | ||||||
Net change in unrealized appreciation (depreciation) | 3,465,712 | (2,807,521 | ) | |||||
|
|
|
| |||||
Net increase in net assets resulting from operations | 7,367,828 | 936,042 | ||||||
|
|
|
| |||||
Dividends and Distributions to Shareholders from: | ||||||||
Distributable earnings*: | ||||||||
Class A | (1,658,408 | ) | (1,745,468 | ) | ||||
Class C | (324,849 | ) | (400,194 | ) | ||||
Institutional Class | (1,388,704 | ) | (1,100,024 | ) | ||||
|
|
|
| |||||
| (3,371,961 | ) | (3,245,686 | ) | |||||
|
|
|
| |||||
Capital Share Transactions: | ||||||||
Proceeds from shares sold: | ||||||||
Class A | 2,965,405 | 5,808,059 | ||||||
Class C | 1,612,305 | 1,122,941 | ||||||
Institutional Class | 24,977,510 | 11,785,738 | ||||||
Net asset value of shares issued upon reinvestment of dividends and distributions: | ||||||||
Class A | 1,478,640 | 1,550,043 | ||||||
Class C | 268,745 | 344,098 | ||||||
Institutional Class | 941,368 | 680,219 | ||||||
|
|
|
| |||||
| 32,243,973 | 21,291,098 | |||||||
|
|
|
| |||||
102
Table of Contents
| Year ended | ||||||||
| 8/31/19 | 8/31/18 | |||||||
Capital Share Transactions (continued): | ||||||||
Cost of shares redeemed: | ||||||||
Class A | $ | (17,173,906 | ) | $ | (7,031,840 | ) | ||
Class C | (3,810,193 | ) | (4,542,970 | ) | ||||
Institutional Class | (15,995,310 | ) | (7,025,452 | ) | ||||
|
|
|
| |||||
| (36,979,409 | ) | (18,600,262 | ) | |||||
|
|
|
| |||||
Increase (decrease) in net assets derived from capital share transactions | (4,735,436 | ) | 2,690,836 | |||||
|
|
|
| |||||
Net Increase (Decrease) in Net Assets | (739,569 | ) | 381,192 | |||||
Net Assets: | ||||||||
Beginning of year | 99,139,158 | 98,757,966 | ||||||
|
|
|
| |||||
End of year1 | $ | 98,399,589 | $ | 99,139,158 | ||||
|
|
|
| |||||
| 1 | Net Assets – End of year includes undistributed net investment income of $18,763 in 2018. The Securities and Exchange Commission eliminated the requirement to disclose undistributed (distributions in excess of) net investment income in 2018. |
| * | For the year ended Aug. 31, 2019, the Fund has adopted amendments to Regulation S-X (see Note 10 in “Notes to financial statements”). For the year ended Aug. 31, 2018, the dividends and distributions to shareholders were as follows: |
| Class A | Class C | Institutional Class | ||||||||||
Dividends from net investment income | $ | (1,745,468 | ) | $ | (400,194 | ) | $ | (1,100,024 | ) | |||
See accompanying notes, which are an integral part of the financial statements.
103
Table of Contents
Statements of changes in net assets
Delaware Tax-Free Colorado Fund
| Year ended | ||||||||
| 8/31/19 | 8/31/18 | |||||||
Increase (Decrease) in Net Assets from Operations: | ||||||||
Net investment income | $ | 6,761,506 | $ | 6,720,675 | ||||
Net realized gain | 680,050 | 124,725 | ||||||
Net change in unrealized appreciation (depreciation) | 7,595,228 | (4,554,837 | ) | |||||
|
|
|
| |||||
Net increase in net assets resulting from operations | 15,036,784 | 2,290,563 | ||||||
|
|
|
| |||||
Dividends and Distributions to Shareholders from: | ||||||||
Distributable earnings*: | ||||||||
Class A | (5,362,602 | ) | (5,512,421 | ) | ||||
Class C | (259,844 | ) | (376,689 | ) | ||||
Institutional Class | (1,136,337 | ) | (831,565 | ) | ||||
|
|
|
| |||||
| (6,758,783 | ) | (6,720,675 | ) | |||||
|
|
|
| |||||
Capital Share Transactions: | ||||||||
Proceeds from shares sold: | ||||||||
Class A | 10,480,175 | 16,867,445 | ||||||
Class C | 1,296,364 | 1,730,260 | ||||||
Institutional Class | 21,425,538 | 12,748,594 | ||||||
Net asset value of shares issued upon reinvestment of dividends and distributions: | ||||||||
Class A | 4,775,340 | 4,746,976 | ||||||
Class C | 246,683 | 353,393 | ||||||
Institutional Class | 1,026,471 | 731,288 | ||||||
|
|
|
| |||||
| 39,250,571 | 37,177,956 | |||||||
|
|
|
| |||||
104
Table of Contents
| Year ended | ||||||||
| 8/31/19 | 8/31/18 | |||||||
Capital Share Transactions (continued): | ||||||||
Cost of shares redeemed: | ||||||||
Class A | $ | (18,606,927 | ) | $ | (19,482,166 | ) | ||
Class C | (2,489,442 | ) | (6,807,914 | ) | ||||
Institutional Class | (9,058,719 | ) | (5,330,875 | ) | ||||
|
|
|
| |||||
| (30,155,088 | ) | (31,620,955 | ) | |||||
|
|
|
| |||||
Increase in net assets derived from capital share transactions | 9,095,483 | 5,557,001 | ||||||
|
|
|
| |||||
Net Increase in Net Assets | 17,373,484 | 1,126,889 | ||||||
Net Assets: | ||||||||
Beginning of year | 202,443,397 | 201,316,508 | ||||||
|
|
|
| |||||
End of year1 | $ | 219,816,881 | $ | 202,443,397 | ||||
|
|
|
| |||||
| 1 | Net Assets – End of year includes undistributed net investment income of $352,558 in 2018. The Securities and Exchange Commission eliminated the requirement to disclose undistributed (distributions in excess of) net investment income in 2018. |
| * | For the year ended Aug. 31, 2019, the Fund has adopted amendments to Regulation S-X (see Note 10 in “Notes to financial statements”). For the year ended Aug. 31, 2018, the dividends and distributions to shareholders were as follows: |
| Class A | Class C | Institutional Class | ||||||||||
Dividends from net investment income | $ | (5,512,421 | ) | $ | (376,689 | ) | $ | (831,565 | ) | |||
See accompanying notes, which are an integral part of the financial statements.
105
Table of Contents
Statements of changes in net assets
Delaware Tax-Free Idaho Fund
| Year ended | ||||||||
| 8/31/19 | 8/31/18 | |||||||
Increase (Decrease) in Net Assets from Operations: | ||||||||
Net investment income | $ | 3,022,948 | $ | 3,014,702 | ||||
Net realized gain | 124,264 | 294,775 | ||||||
Net change in unrealized appreciation (depreciation) | 3,691,615 | (2,885,211 | ) | |||||
|
|
|
| |||||
Net increase in net assets resulting from operations | 6,838,827 | 424,266 | ||||||
|
|
|
| |||||
Dividends and Distributions to Shareholders from: | ||||||||
Distributable earnings*: | ||||||||
Class A | (1,747,356 | ) | (1,888,287 | ) | ||||
Class C | (348,293 | ) | (543,768 | ) | ||||
Institutional Class | (919,443 | ) | (576,813 | ) | ||||
|
|
|
| |||||
| (3,015,092 | ) | (3,008,868 | ) | |||||
|
|
|
| |||||
Capital Share Transactions: | ||||||||
Proceeds from shares sold: | ||||||||
Class A | 5,186,079 | 5,531,468 | ||||||
Class C | 981,176 | 1,325,139 | ||||||
Institutional Class | 21,084,240 | 14,737,822 | ||||||
Net asset value of shares issued upon reinvestment of dividends and distributions: | ||||||||
Class A | 1,618,585 | 1,651,109 | ||||||
Class C | 337,431 | 512,413 | ||||||
Institutional Class | 786,152 | 496,728 | ||||||
|
|
|
| |||||
| 29,993,663 | 24,254,679 | |||||||
|
|
|
| |||||
106
Table of Contents
| Year ended | ||||||||
| 8/31/19 | 8/31/18 | |||||||
Capital Share Transactions (continued): | ||||||||
Cost of shares redeemed: | ||||||||
Class A | $ | (12,821,129 | ) | $ | (14,113,035 | ) | ||
Class C | (6,549,156 | ) | (12,991,897 | ) | ||||
Institutional Class | (9,266,863 | ) | (5,605,597 | ) | ||||
|
|
|
| |||||
| (28,637,148 | ) | (32,710,529 | ) | |||||
|
|
|
| |||||
Increase (decrease) in net assets derived from capital share transactions | 1,356,515 | (8,455,850 | ) | |||||
|
|
|
| |||||
Net Increase (Decrease) in Net Assets | 5,180,250 | (11,040,452 | ) | |||||
Net Assets: | ||||||||
Beginning of year | 98,331,841 | 109,372,293 | ||||||
|
|
|
| |||||
End of year1 | $ | 103,512,091 | $ | 98,331,841 | ||||
|
|
|
| |||||
| 1 | Net Assets – End of year includes distributions in excess of net investment income of $16,709 in 2018. The Securities and Exchange Commission eliminated the requirement to disclose undistributed (distributions in excess of) net investment income in 2018. |
| * | For the year ended Aug. 31, 2019, the Fund has adopted amendments to Regulation S-X (see Note 10 in “Notes to financial statements”). For the year ended Aug. 31, 2018, the dividends and distributions to shareholders were as follows: |
| Class A | Class C | Institutional Class | ||||||||||
Dividends from net investment income | $ | (1,888,287 | ) | $ | (543,768 | ) | $ | (576,813 | ) | |||
See accompanying notes, which are an integral part of the financial statements.
107
Table of Contents
Statements of changes in net assets
Delaware Tax-Free New York Fund
| Year ended | ||||||||
| 8/31/19 | 8/31/18 | |||||||
Increase (Decrease) in Net Assets from Operations: | ||||||||
Net investment income | $ | 2,622,309 | $ | 2,699,074 | ||||
Net realized gain | 585,562 | 176,041 | ||||||
Net change in unrealized appreciation (depreciation) | 3,228,074 | (2,366,192 | ) | |||||
|
|
|
| |||||
Net increase in net assets resulting from operations | 6,435,945 | 508,923 | ||||||
|
|
|
| |||||
Dividends and Distributions to Shareholders from: | ||||||||
Distributable earnings*: | ||||||||
Class A | (1,100,376 | ) | (1,233,582 | ) | ||||
Class C | (331,625 | ) | (388,892 | ) | ||||
Institutional Class | (1,194,609 | ) | (1,091,556 | ) | ||||
|
|
|
| |||||
| (2,626,610 | ) | (2,714,030 | ) | |||||
|
|
|
| |||||
Capital Share Transactions: | ||||||||
Proceeds from shares sold: | ||||||||
Class A | 6,693,985 | 5,120,312 | ||||||
Class C | 1,503,175 | 2,254,999 | ||||||
Institutional Class | 16,439,856 | 8,726,165 | ||||||
Net asset value of shares issued upon reinvestment of dividends and distributions: | ||||||||
Class A | 1,011,485 | 1,130,238 | ||||||
Class C | 232,362 | 299,712 | ||||||
Institutional Class | 1,065,959 | 968,692 | ||||||
|
|
|
| |||||
| 26,946,822 | 18,500,118 | |||||||
|
|
|
| |||||
108
Table of Contents
| Year ended | ||||||||
| 8/31/19 | 8/31/18 | |||||||
Capital Share Transactions (continued): | ||||||||
Cost of shares redeemed: | ||||||||
Class A | $ | (11,304,145 | ) | $ | (7,776,362 | ) | ||
Class C | (3,817,643 | ) | (4,270,778 | ) | ||||
Institutional Class | (12,814,924 | ) | (8,099,299 | ) | ||||
|
|
|
| |||||
| (27,936,712 | ) | (20,146,439 | ) | |||||
|
|
|
| |||||
Decrease in net assets derived from capital share transactions | (989,890 | ) | (1,646,321 | ) | ||||
|
|
|
| |||||
Net Increase (Decrease) in Net Assets | 2,819,445 | (3,851,428 | ) | |||||
Net Assets: | ||||||||
Beginning of year | 86,060,793 | 89,912,221 | ||||||
|
|
|
| |||||
End of year1 | $ | 88,880,238 | $ | 86,060,793 | ||||
|
|
|
| |||||
| 1 | Net Assets – End of year includes distributions in excess of net investment income of $650 in 2018. The Securities and Exchange Commission eliminated the requirement to disclose undistributed (distributions in excess of) net investment income in 2018. |
| * | For the year ended Aug. 31, 2019, the Fund has adopted amendments to Regulation S-X (see Note 10 in “Notes to financial statements”). For the year ended Aug. 31, 2018, the dividends and distributions to shareholders were as follows: |
| Class A | Class C | Institutional Class | ||||||||||
Dividends from net investment income | $ | (1,233,582 | ) | $ | (388,892 | ) | $ | (1,091,556 | ) | |||
See accompanying notes, which are an integral part of the financial statements.
109
Table of Contents
Statements of changes in net assets
Delaware Tax-Free Pennsylvania Fund
| Year ended | ||||||||
| 8/31/19 | 8/31/18 | |||||||
Increase (Decrease) in Net Assets from Operations: | ||||||||
Net investment income | $ | 15,062,570 | $ | 15,788,290 | ||||
Net realized gain | 2,465,773 | 469,560 | ||||||
Net change in unrealized appreciation (depreciation) | 14,954,570 | (12,352,389 | ) | |||||
|
|
|
| |||||
Net increase in net assets resulting from operations | 32,482,913 | 3,905,461 | ||||||
|
|
|
| |||||
Dividends and Distributions to Shareholders from: | ||||||||
Distributable earnings*: | ||||||||
Class A | (12,803,560 | ) | (13,755,590 | ) | ||||
Class C | (683,223 | ) | (877,582 | ) | ||||
Institutional Class | (1,575,787 | ) | (1,441,931 | ) | ||||
|
|
|
| |||||
| (15,062,570 | ) | (16,075,103 | ) | |||||
|
|
|
| |||||
Capital Share Transactions: | ||||||||
Proceeds from shares sold: | ||||||||
Class A | 30,339,814 | 28,325,061 | ||||||
Class C | 2,951,101 | 2,076,171 | ||||||
Institutional Class | 19,813,229 | 16,590,343 | ||||||
Net asset value of shares issued upon reinvestment of dividends and distributions: | ||||||||
Class A | 11,094,776 | 11,749,727 | ||||||
Class C | 645,844 | 840,401 | ||||||
Institutional Class | 1,355,377 | 1,235,791 | ||||||
|
|
|
| |||||
| 66,200,141 | 60,817,494 | |||||||
|
|
|
| |||||
110
Table of Contents
| Year ended | ||||||||
| 8/31/19 | 8/31/18 | |||||||
Capital Share Transactions (continued): | ||||||||
Cost of shares redeemed: | ||||||||
Class A | $ | (57,138,828 | ) | $ | (50,721,030 | ) | ||
Class C | (5,875,403 | ) | (8,984,224 | ) | ||||
Institutional Class | (17,175,868 | ) | (8,774,119 | ) | ||||
|
|
|
| |||||
| (80,190,099 | ) | (68,479,373 | ) | |||||
|
|
|
| |||||
Decrease in net assets derived from capital share transactions | (13,989,958 | ) | (7,661,879 | ) | ||||
|
|
|
| |||||
Net Increase (Decrease) in Net Assets | 3,430,385 | (19,831,521 | ) | |||||
Net Assets: | ||||||||
Beginning of period | 445,840,554 | 465,672,075 | ||||||
|
|
|
| |||||
End of period1 | $ | 449,270,939 | $ | 445,840,554 | ||||
|
|
|
| |||||
| 1 | Net Assets – End of period includes distributions in excess of net investment income of $108,965 in 2018. The Securities and Exchange Commission eliminated the requirement to disclose undistributed (distributions in excess of) net investment income in 2018. |
| * | For the year ended Aug. 31, 2019, the Fund has adopted amendments to Regulation S-X (see Note 10 in “Notes to financial statements”). For the year ended Aug. 31, 2018, the dividends and distributions to shareholders were as follows: |
| Class A | Class C | Institutional Class | ||||||||||
Dividends from net investment income | $ | (13,512,474 | ) | $ | (857,030 | ) | $ | (1,418,785 | ) | |||
Distributions from net realized gain | (243,116 | ) | (20,552 | ) | (23,146 | ) | ||||||
See accompanying notes, which are an integral part of the financial statements.
111
Table of Contents
Delaware Tax-Free Arizona Fund Class A
Selected data for each share of the Fund outstanding throughout each period were as follows:
|
Net asset value, beginning of period |
Income (loss) from investment operations: |
Net investment income1 |
Net realized and unrealized gain (loss) |
Total from investment operations |
Less dividends and distributions from: |
Net investment income |
Total dividends and distributions |
Net asset value, end of period |
Total return2 |
Ratios and supplemental data: |
Net assets, end of period (000 omitted) |
Ratio of expenses to average net assets |
Ratio of expenses to average net assets prior to fees waived |
Ratio of net investment income to average net assets |
Ratio of net investment income to average net assets prior to fees waived |
Portfolio turnover |
|
|
| 1 | The average shares outstanding have been applied for per share information. |
| 2 | Total return is based on the change in net asset value of a share during the period and assumes reinvestment of dividends and distributions at net asset value and does not reflect the impact of a sales charge. Total return during all of the periods shown reflects a waiver by the manager. Performance would have been lower had the waiver not been in effect. |
See accompanying notes, which are an integral part of the financial statements.
112
Table of Contents
Year ended | ||||||||||||||||||||||||||||
|
| |||||||||||||||||||||||||||
| 8/31/19 | 8/31/18 | 8/31/17 | 8/31/16 | 8/31/15 | ||||||||||||||||||||||||
| ||||||||||||||||||||||||||||
| $ | 11.24 | $ | 11.48 | $ | 11.83 | $ | 11.44 | $ | 11.45 | |||||||||||||||||||
| 0.37 | 0.36 | 0.37 | 0.38 | 0.38 | ||||||||||||||||||||||||
| 0.46 | (0.24 | ) | (0.35 | ) | 0.39 | (0.01 | ) | |||||||||||||||||||||
|
|
|
|
|
|
|
|
|
| |||||||||||||||||||
| 0.83 | 0.12 | 0.02 | 0.77 | 0.37 | ||||||||||||||||||||||||
|
|
|
|
|
|
|
|
|
| |||||||||||||||||||
| (0.37 | ) | (0.36 | ) | (0.37 | ) | (0.38 | ) | (0.38 | ) | |||||||||||||||||||
|
|
|
|
|
|
|
|
|
| |||||||||||||||||||
| (0.37 | ) | (0.36 | ) | (0.37 | ) | (0.38 | ) | (0.38 | ) | |||||||||||||||||||
|
|
|
|
|
|
|
|
|
| |||||||||||||||||||
| $ | 11.70 | $ | 11.24 | $ | 11.48 | $ | 11.83 | $ | 11.44 | |||||||||||||||||||
|
|
|
|
|
|
|
|
|
| |||||||||||||||||||
| 7.51% | 1.11% | 0.24% | 6.79% | 3.24% | ||||||||||||||||||||||||
| $ | 62,033 | $ | 63,327 | $ | 66,839 | $ | 74,556 | $ | 77,085 | |||||||||||||||||||
| 0.84% | 0.84% | 0.84% | 0.84% | 0.85% | ||||||||||||||||||||||||
| 1.02% | 1.00% | 0.97% | 0.96% | 0.97% | ||||||||||||||||||||||||
| 3.29% | 3.23% | 3.25% | 3.23% | 3.28% | ||||||||||||||||||||||||
| 3.11% | 3.07% | 3.12% | 3.11% | 3.16% | ||||||||||||||||||||||||
| 31% | 6% | 9% | 14% | 12% | ||||||||||||||||||||||||
| ||||||||||||||||||||||||||||
113
Table of Contents
Financial highlights
Delaware Tax-Free Arizona Fund Class C
Selected data for each share of the Fund outstanding throughout each period were as follows:
|
Net asset value, beginning of period |
Income (loss) from investment operations: |
Net investment income1 |
Net realized and unrealized gain (loss) |
Total from investment operations |
Less dividends and distributions from: |
Net investment income |
Total dividends and distributions |
Net asset value, end of period. |
Total return2 |
Ratios and supplemental data: |
Net assets, end of period (000 omitted) |
Ratio of expenses to average net assets |
Ratio of expenses to average net assets prior to fees waived |
Ratio of net investment income to average net assets |
Ratio of net investment income to average net assets prior to fees waived |
Portfolio turnover |
|
|
| 1 | The average shares outstanding have been applied for per share information. |
| 2 | Total return is based on the change in net asset value of a share during the period and assumes reinvestment of dividends and distributions at net asset value and does not reflect the impact of a sales charge. Total return during all of the periods shown reflects a waiver by the manager. Performance would have been lower had the waiver not been in effect. |
See accompanying notes, which are an integral part of the financial statements.
114
Table of Contents
| Year ended | ||||||||||||||||||||||||||||
|
| |||||||||||||||||||||||||||
| 8/31/19 | 8/31/18 | 8/31/17 | 8/31/16 | 8/31/15 | ||||||||||||||||||||||||
| ||||||||||||||||||||||||||||
| $ | 11.27 | $ | 11.51 | $ | 11.87 | $ | 11.47 | $ | 11.48 | |||||||||||||||||||
| 0.28 | 0.28 | 0.29 | 0.29 | 0.29 | ||||||||||||||||||||||||
| 0.46 | (0.24 | ) | (0.37 | ) | 0.40 | (0.01 | ) | |||||||||||||||||||||
|
|
|
|
|
|
|
|
|
| |||||||||||||||||||
| 0.74 | 0.04 | (0.08 | ) | 0.69 | 0.28 | |||||||||||||||||||||||
|
|
|
|
|
|
|
|
|
| |||||||||||||||||||
| (0.28 | ) | (0.28 | ) | (0.28 | ) | (0.29 | ) | (0.29 | ) | |||||||||||||||||||
|
|
|
|
|
|
|
|
|
| |||||||||||||||||||
| (0.28 | ) | (0.28 | ) | (0.28 | ) | (0.29 | ) | (0.29 | ) | |||||||||||||||||||
|
|
|
|
|
|
|
|
|
| |||||||||||||||||||
| $ | 11.73 | $ | 11.27 | $ | 11.51 | $ | 11.87 | $ | 11.47 | |||||||||||||||||||
|
|
|
|
|
|
|
|
|
| |||||||||||||||||||
| 6.70% | 0.36% | (0.59% | ) | 6.07% | 2.47% | |||||||||||||||||||||||
| $ | 3,100 | $ | 3,122 | $ | 5,215 | $ | 6,816 | $ | 6,747 | |||||||||||||||||||
| 1.59% | 1.59% | 1.59% | 1.59% | 1.60% | ||||||||||||||||||||||||
| 1.77% | 1.75% | 1.72% | 1.71% | 1.72% | ||||||||||||||||||||||||
| 2.54% | 2.48% | 2.50% | 2.48% | 2.54% | ||||||||||||||||||||||||
| 2.36% | 2.32% | 2.37% | 2.36% | 2.42% | ||||||||||||||||||||||||
| 31% | 6% | 9% | 14% | 12% | ||||||||||||||||||||||||
| ||||||||||||||||||||||||||||
115
Table of Contents
Financial highlights
Delaware Tax-Free Arizona Fund Institutional Class
Selected data for each share of the Fund outstanding throughout each period were as follows:
|
Net asset value, beginning of period |
Income (loss) from investment operations: |
Net investment income1 |
Net realized and unrealized gain (loss) |
Total from investment operations |
Less dividends and distributions from: |
Net investment income |
Total dividends and distributions |
Net asset value, end of period |
Total return2 |
Ratios and supplemental data: |
Net assets, end of period (000 omitted) |
Ratio of expenses to average net assets |
Ratio of expenses to average net assets prior to fees waived |
Ratio of net investment income to average net assets |
Ratio of net investment income to average net assets prior to fees waived |
Portfolio turnover |
|
|
| 1 | The average shares outstanding have been applied for per share information. |
| 2 | Total return is based on the change in net asset value of a share during the period and assumes reinvestment of dividends and distributions at net asset value. Total return during all of the periods shown reflects a waiver by the manager. Performance would have been lower had the waiver not been in effect. |
See accompanying notes, which are an integral part of the financial statements.
116
Table of Contents
| Year ended | ||||||||||||||||||||||||||||
|
| |||||||||||||||||||||||||||
| 8/31/19 | 8/31/18 | 8/31/17 | 8/31/16 | 8/31/15 | ||||||||||||||||||||||||
| ||||||||||||||||||||||||||||
| $ | 11.24 | $ | 11.48 | $ | 11.84 | $ | 11.44 | $ | 11.45 | |||||||||||||||||||
| 0.39 | 0.39 | 0.40 | 0.41 | 0.41 | ||||||||||||||||||||||||
| 0.46 | (0.24 | ) | (0.36 | ) | 0.39 | (0.01 | ) | |||||||||||||||||||||
|
|
|
|
|
|
|
|
|
| |||||||||||||||||||
| 0.85 | 0.15 | 0.04 | 0.80 | 0.40 | ||||||||||||||||||||||||
|
|
|
|
|
|
|
|
|
| |||||||||||||||||||
| (0.39 | ) | (0.39 | ) | (0.40 | ) | (0.40 | ) | (0.41 | ) | |||||||||||||||||||
|
|
|
|
|
|
|
|
|
| |||||||||||||||||||
| (0.39 | ) | (0.39 | ) | (0.40 | ) | (0.40 | ) | (0.41 | ) | |||||||||||||||||||
|
|
|
|
|
|
|
|
|
| |||||||||||||||||||
| $ | 11.70 | $ | 11.24 | $ | 11.48 | $ | 11.84 | $ | 11.44 | |||||||||||||||||||
|
|
|
|
|
|
|
|
|
| |||||||||||||||||||
| 7.78% | 1.36% | 0.40% | 7.14% | 3.49% | ||||||||||||||||||||||||
| $ | 14,136 | $ | 10,097 | $ | 7,080 | $ | 3,645 | $ | 744 | |||||||||||||||||||
| 0.59% | 0.59% | 0.59% | 0.59% | 0.60% | ||||||||||||||||||||||||
| 0.77% | 0.75% | 0.72% | 0.71% | 0.72% | ||||||||||||||||||||||||
| 3.54% | 3.48% | 3.50% | 3.48% | 3.54% | ||||||||||||||||||||||||
| 3.36% | 3.32% | 3.37% | 3.36% | 3.42% | ||||||||||||||||||||||||
| 31% | 6% | 9% | 14% | 12% | ||||||||||||||||||||||||
| ||||||||||||||||||||||||||||
117
Table of Contents
Financial highlights
Delaware Tax-Free California Fund Class A
Selected data for each share of the Fund outstanding throughout each period were as follows:
|
Net asset value, beginning of period |
Income (loss) from investment operations: |
Net investment income1 |
Net realized and unrealized gain (loss) |
Total from investment operations |
Less dividends and distributions from: |
Net investment income |
Net realized gain |
Total dividends and distributions |
Net asset value, end of period |
Total return2 |
Ratios and supplemental data: |
Net assets, end of period (000 omitted) |
Ratio of expenses to average net assets |
Ratio of expenses to average net assets prior to fees waived |
Ratio of net investment income to average net assets |
Ratio of net investment income to average net assets prior to fees waived |
Portfolio turnover |
|
|
| 1 | The average shares outstanding have been applied for per share information. |
| 2 | Total return is based on the change in net asset value of a share during the period and assumes reinvestment of dividends and distributions at net asset value and does not reflect the impact of a sales charge. Total return during all of the periods shown reflects a waiver by the manager. Performance would have been lower had the waiver not been in effect. |
See accompanying notes, which are an integral part of the financial statements.
118
Table of Contents
| Year ended | ||||||||||||||||||||||||||||
|
| |||||||||||||||||||||||||||
| 8/31/19 | 8/31/18 | 8/31/17 | 8/31/16 | 8/31/15 | ||||||||||||||||||||||||
| ||||||||||||||||||||||||||||
| $ | 11.98 | $ | 12.26 | $ | 12.60 | $ | 12.11 | $ | 12.08 | |||||||||||||||||||
| 0.40 | 0.40 | 0.41 | 0.43 | 0.42 | ||||||||||||||||||||||||
| 0.53 | (0.28 | ) | (0.34 | ) | 0.48 | 0.03 | ||||||||||||||||||||||
|
|
|
|
|
|
|
|
|
| |||||||||||||||||||
| 0.93 | 0.12 | 0.07 | 0.91 | 0.45 | ||||||||||||||||||||||||
|
|
|
|
|
|
|
|
|
| |||||||||||||||||||
| (0.40 | ) | (0.40 | ) | (0.41 | ) | (0.42 | ) | (0.42 | ) | |||||||||||||||||||
| (0.02 | ) | — | — | — | — | |||||||||||||||||||||||
|
|
|
|
|
|
|
|
|
| |||||||||||||||||||
| (0.42 | ) | (0.40 | ) | (0.41 | ) | (0.42 | ) | (0.42 | ) | |||||||||||||||||||
|
|
|
|
|
|
|
|
|
| |||||||||||||||||||
| $ | 12.49 | $ | 11.98 | $ | 12.26 | $ | 12.60 | $ | 12.11 | |||||||||||||||||||
|
|
|
|
|
|
|
|
|
| |||||||||||||||||||
| 7.99% | 1.00% | 0.63% | 7.67% | 3.73% | ||||||||||||||||||||||||
| $ | 42,203 | $ | 53,171 | $ | 54,076 | $ | 63,284 | $ | 60,550 | |||||||||||||||||||
| 0.82% | 0.82% | 0.82% | 0.82% | 0.83% | ||||||||||||||||||||||||
| 1.03% | 1.02% | 1.01% | 1.01% | 1.01% | ||||||||||||||||||||||||
| 3.36% | 3.30% | 3.36% | 3.43% | 3.42% | ||||||||||||||||||||||||
| 3.15% | 3.10% | 3.17% | 3.24% | 3.24% | ||||||||||||||||||||||||
| 32% | 16% | 27% | 18% | 24% | ||||||||||||||||||||||||
| ||||||||||||||||||||||||||||
119
Table of Contents
Financial highlights
Delaware Tax-Free California Fund Class C
Selected data for each share of the Fund outstanding throughout each period were as follows:
|
Net asset value, beginning of period |
Income (loss) from investment operations: |
Net investment income1 |
Net realized and unrealized gain (loss) |
Total from investment operations |
Less dividends and distributions from: |
Net investment income |
Net realized gain |
Total dividends and distributions |
Net asset value, end of period |
Total return2 |
Ratios and supplemental data: |
Net assets, end of period (000 omitted) |
Ratio of expenses to average net assets |
Ratio of expenses to average net assets prior to fees waived |
Ratio of net investment income to average net assets |
Ratio of net investment income to average net assets prior to fees waived |
Portfolio turnover |
|
|
| 1 | The average shares outstanding have been applied for per share information. |
| 2 | Total return is based on the change in net asset value of a share during the period and assumes reinvestment of dividends and distributions at net asset value and does not reflect the impact of a sales charge. Total return during all of the periods shown reflects a waiver by the manager. Performance would have been lower had the waiver not been in effect. |
See accompanying notes, which are an integral part of the financial statements.
120
Table of Contents
| Year ended | ||||||||||||||||||||||||||||
|
| |||||||||||||||||||||||||||
| 8/31/19 | 8/31/18 | 8/31/17 | 8/31/16 | 8/31/15 | ||||||||||||||||||||||||
| ||||||||||||||||||||||||||||
| $ | 12.00 | $ | 12.28 | $ | 12.62 | $ | 12.13 | $ | 12.10 | |||||||||||||||||||
| 0.32 | 0.31 | 0.32 | 0.33 | 0.33 | ||||||||||||||||||||||||
| 0.54 | (0.28 | ) | (0.34 | ) | 0.49 | 0.02 | ||||||||||||||||||||||
|
|
|
|
|
|
|
|
|
| |||||||||||||||||||
| 0.86 | 0.03 | (0.02 | ) | 0.82 | 0.35 | |||||||||||||||||||||||
|
|
|
|
|
|
|
|
|
| |||||||||||||||||||
| (0.32 | ) | (0.31 | ) | (0.32 | ) | (0.33 | ) | (0.32 | ) | |||||||||||||||||||
| (0.02 | ) | — | — | — | — | |||||||||||||||||||||||
|
|
|
|
|
|
|
|
|
| |||||||||||||||||||
| (0.34 | ) | (0.31 | ) | (0.32 | ) | (0.33 | ) | (0.32 | ) | |||||||||||||||||||
|
|
|
|
|
|
|
|
|
| |||||||||||||||||||
| $ | 12.52 | $ | 12.00 | $ | 12.28 | $ | 12.62 | $ | 12.13 | |||||||||||||||||||
|
|
|
|
|
|
|
|
|
| |||||||||||||||||||
| 7.26% | 0.25% | (0.12% | ) | 6.86% | 2.95% | |||||||||||||||||||||||
| $ | 11,551 | $ | 13,015 | $ | 16,473 | $ | 18,827 | $ | 15,853 | |||||||||||||||||||
| 1.57% | 1.57% | 1.57% | 1.57% | 1.58% | ||||||||||||||||||||||||
| 1.78% | 1.77% | 1.76% | 1.76% | 1.76% | ||||||||||||||||||||||||
| 2.61% | 2.55% | 2.61% | 2.68% | 2.67% | ||||||||||||||||||||||||
| 2.40% | 2.35% | 2.42% | 2.49% | 2.49% | ||||||||||||||||||||||||
| 32% | 16% | 27% | 18% | 24% | ||||||||||||||||||||||||
| ||||||||||||||||||||||||||||
121
Table of Contents
Financial highlights
Delaware Tax-Free California Fund Institutional Class
Selected data for each share of the Fund outstanding throughout each period were as follows:
|
Net asset value, beginning of period |
Income (loss) from investment operations: |
Net investment income1 |
Net realized and unrealized gain (loss) |
Total from investment operations |
Less dividends and distributions from: |
Net investment income |
Net realized gain |
Total dividends and distributions |
Net asset value, end of period |
Total return2 |
Ratios and supplemental data: |
Net assets, end of period (000 omitted) |
Ratio of expenses to average net assets |
Ratio of expenses to average net assets prior to fees waived |
Ratio of net investment income to average net assets |
Ratio of net investment income to average net assets prior to fees waived |
Portfolio turnover |
|
| 1 | The average shares outstanding have been applied for per share information. |
| 2 | Total return is based on the change in net asset value of a share during the period and assumes reinvestment of dividends and distributions at net asset value. Total return during all of the periods shown reflects a waiver by the manager. Performance would have been lower had the waiver not been in effect. |
See accompanying notes, which are an integral part of the financial statements.
122
Table of Contents
| Year ended | ||||||||||||||||||||||||||||
|
| |||||||||||||||||||||||||||
| 8/31/19 | 8/31/18 | 8/31/17 | 8/31/16 | 8/31/15 | ||||||||||||||||||||||||
| ||||||||||||||||||||||||||||
| $ | 11.98 | $ | 12.26 | $ | 12.60 | $ | 12.11 | $ | 12.08 | |||||||||||||||||||
| 0.43 | 0.43 | 0.44 | 0.46 | 0.45 | ||||||||||||||||||||||||
| 0.53 | (0.28 | ) | (0.34 | ) | 0.49 | 0.03 | ||||||||||||||||||||||
|
|
|
|
|
|
|
|
|
| |||||||||||||||||||
| 0.96 | 0.15 | 0.10 | 0.95 | 0.48 | ||||||||||||||||||||||||
|
|
|
|
|
|
|
|
|
| |||||||||||||||||||
| (0.43 | ) | (0.43 | ) | (0.44 | ) | (0.46 | ) | (0.45 | ) | |||||||||||||||||||
| (0.02 | ) | — | — | — | — | |||||||||||||||||||||||
|
|
|
|
|
|
|
|
|
| |||||||||||||||||||
| (0.45 | ) | (0.43 | ) | (0.44 | ) | (0.46 | ) | (0.45 | ) | |||||||||||||||||||
|
|
|
|
|
|
|
|
|
| |||||||||||||||||||
| $ | 12.49 | $ | 11.98 | $ | 12.26 | $ | 12.60 | $ | 12.11 | |||||||||||||||||||
|
|
|
|
|
|
|
|
|
| |||||||||||||||||||
| 8.25% | 1.26% | 0.89% | 7.94% | 3.98% | ||||||||||||||||||||||||
| $44,646 | $32,953 | $28,209 | $17,410 | $10,308 | ||||||||||||||||||||||||
| 0.57% | 0.57% | 0.57% | 0.57% | 0.58% | ||||||||||||||||||||||||
| 0.78% | 0.77% | 0.76% | 0.76% | 0.76% | ||||||||||||||||||||||||
| 3.61% | 3.55% | 3.61% | 3.68% | 3.67% | ||||||||||||||||||||||||
| 3.40% | 3.35% | 3.42% | 3.49% | 3.49% | ||||||||||||||||||||||||
| 32% | 16% | 27% | 18% | 24% | ||||||||||||||||||||||||
| ||||||||||||||||||||||||||||
123
Table of Contents
Financial highlights
Delaware Tax-Free Colorado Fund Class A
Selected data for each share of the Fund outstanding throughout each period were as follows:
|
Net asset value, beginning of period |
Income (loss) from investment operations: |
Net investment income1 |
Net realized and unrealized gain (loss) |
Total from investment operations |
Less dividends and distributions from: |
Net investment income |
Total dividends and distributions |
Net asset value, end of period |
Total return2 |
Ratios and supplemental data: |
Net assets, end of period (000 omitted) |
Ratio of expenses to average net assets |
Ratio of expenses to average net assets prior to fees waived |
Ratio of net investment income to average net assets |
Ratio of net investment income to average net assets prior to fees waived |
Portfolio turnover |
|
|
| 1 | The average shares outstanding have been applied for per share information. |
| 2 | Total return is based on the change in net asset value of a share during the period and assumes reinvestment of dividends and distributions at net asset value and does not reflect the impact of a sales charge. Total return during all of the periods shown reflects a waiver by the manager. Performance would have been lower had the waiver not been in effect. |
See accompanying notes, which are an integral part of the financial statements.
124
Table of Contents
| Year ended | ||||||||||||||||||||||||||||
|
| |||||||||||||||||||||||||||
| 8/31/19 | 8/31/18 | 8/31/17 | 8/31/16 | 8/31/15 | ||||||||||||||||||||||||
| ||||||||||||||||||||||||||||
| $ | 11.04 | $ | 11.28 | $ | 11.65 | $ | 11.24 | $ | 11.32 | |||||||||||||||||||
| 0.37 | 0.37 | 0.39 | 0.40 | 0.40 | ||||||||||||||||||||||||
| 0.44 | (0.24 | ) | (0.37 | ) | 0.41 | (0.08 | ) | |||||||||||||||||||||
|
|
|
|
|
|
|
|
|
| |||||||||||||||||||
| 0.81 | 0.13 | 0.02 | 0.81 | 0.32 | ||||||||||||||||||||||||
|
|
|
|
|
|
|
|
|
| |||||||||||||||||||
| (0.37 | ) | (0.37 | ) | (0.39 | ) | (0.40 | ) | (0.40 | ) | |||||||||||||||||||
|
|
|
|
|
|
|
|
|
| |||||||||||||||||||
| (0.37 | ) | (0.37 | ) | (0.39 | ) | (0.40 | ) | (0.40 | ) | |||||||||||||||||||
|
|
|
|
|
|
|
|
|
| |||||||||||||||||||
| $ | 11.48 | $ | 11.04 | $ | 11.28 | $ | 11.65 | $ | 11.24 | |||||||||||||||||||
|
|
|
|
|
|
|
|
|
| |||||||||||||||||||
| 7.48% | 1.22% | 0.26% | 7.33% | 2.87% | ||||||||||||||||||||||||
| $167,136 | $164,087 | $165,554 | $182,764 | $174,078 | ||||||||||||||||||||||||
| 0.84% | 0.84% | 0.84% | 0.84% | 0.85% | ||||||||||||||||||||||||
| 0.97% | 0.97% | 0.96% | 0.96% | 0.97% | ||||||||||||||||||||||||
| 3.31% | 3.36% | 3.48% | 3.50% | 3.54% | ||||||||||||||||||||||||
| 3.18% | 3.23% | 3.36% | 3.38% | 3.42% | ||||||||||||||||||||||||
| 16% | 6% | 17% | 6% | 10% | ||||||||||||||||||||||||
| ||||||||||||||||||||||||||||
125
Table of Contents
Financial highlights
Delaware Tax-Free Colorado Fund Class C
Selected data for each share of the Fund outstanding throughout each period were as follows:
|
Net asset value, beginning of period |
Income (loss) from investment operations: |
Net investment income1 |
Net realized and unrealized gain (loss) |
Total from investment operations |
Less dividends and distributions from: |
Net investment income |
Total dividends and distributions |
Net asset value, end of period |
Total return2 |
Ratios and supplemental data: |
Net assets, end of period (000 omitted) |
Ratio of expenses to average net assets |
Ratio of expenses to average net assets prior to fees waived |
Ratio of net investment income to average net assets |
Ratio of net investment income to average net assets prior to fees waived |
Portfolio turnover |
|
|
| 1 | The average shares outstanding have been applied for per share information. |
| 2 | Total return is based on the change in net asset value of a share during the period and assumes reinvestment of dividends and distributions at net asset value and does not reflect the impact of a sales charge. Total return during all of the periods shown reflects a waiver by the manager. Performance would have been lower had the waiver not been in effect. |
See accompanying notes, which are an integral part of the financial statements.
126
Table of Contents
| Year ended | ||||||||||||||||||||||||||||
|
| |||||||||||||||||||||||||||
| 8/31/19 | 8/31/18 | 8/31/17 | 8/31/16 | 8/31/15 | ||||||||||||||||||||||||
| ||||||||||||||||||||||||||||
| $ | 11.07 | $ | 11.31 | $ | 11.68 | $ | 11.27 | $ | 11.35 | |||||||||||||||||||
| 0.29 | 0.29 | 0.31 | 0.32 | 0.32 | ||||||||||||||||||||||||
| 0.44 | (0.24 | ) | (0.37 | ) | 0.41 | (0.08 | ) | |||||||||||||||||||||
|
|
|
|
|
|
|
|
|
| |||||||||||||||||||
| 0.73 | 0.05 | (0.06 | ) | 0.73 | 0.24 | |||||||||||||||||||||||
|
|
|
|
|
|
|
|
|
| |||||||||||||||||||
| (0.29 | ) | (0.29 | ) | (0.31 | ) | (0.32 | ) | (0.32 | ) | |||||||||||||||||||
|
|
|
|
|
|
|
|
|
| |||||||||||||||||||
| (0.29 | ) | (0.29 | ) | (0.31 | ) | (0.32 | ) | (0.32 | ) | |||||||||||||||||||
|
|
|
|
|
|
|
|
|
| |||||||||||||||||||
| $ | 11.51 | $ | 11.07 | $ | 11.31 | $ | 11.68 | $ | 11.27 | |||||||||||||||||||
|
|
|
|
|
|
|
|
|
| |||||||||||||||||||
| 6.67% | 0.47% | (0.48% | ) | 6.52% | 2.10% | |||||||||||||||||||||||
| $ | 10,364 | $ | 10,923 | $ | 15,975 | $ | 16,461 | $ | 12,192 | |||||||||||||||||||
| 1.59% | 1.59% | 1.59% | 1.59% | 1.60% | ||||||||||||||||||||||||
| 1.72% | 1.72% | 1.71% | 1.71% | 1.72% | ||||||||||||||||||||||||
| 2.56% | 2.61% | 2.73% | 2.75% | 2.79% | ||||||||||||||||||||||||
| 2.43% | 2.48% | 2.61% | 2.63% | 2.67% | ||||||||||||||||||||||||
| 16% | 6% | 17% | 6% | 10% | ||||||||||||||||||||||||
| ||||||||||||||||||||||||||||
127
Table of Contents
Financial highlights
Delaware Tax-Free Colorado Fund Institutional Class
Selected data for each share of the Fund outstanding throughout each period were as follows:
|
Net asset value, beginning of period |
Income (loss) from investment operations: |
Net investment income1 |
Net realized and unrealized gain (loss) |
Total from investment operations |
Less dividends and distributions from: |
Net investment income |
Total dividends and distributions |
Net asset value, end of period |
Total return2 |
Ratios and supplemental data: |
Net assets, end of period (000 omitted) |
Ratio of expenses to average net assets |
Ratio of expenses to average net assets prior to fees waived |
Ratio of net investment income to average net assets |
Ratio of net investment income to average net assets prior to fees waived |
Portfolio turnover |
|
|
| 1 | The average shares outstanding have been applied for per share information. |
| 2 | Total return is based on the change in net asset value of a share during the period and assumes reinvestment of dividends and distributions at net asset value. Total return during all of the periods shown reflects a waiver by the manager. Performance would have been lower had the waiver not been in effect. |
See accompanying notes, which are an integral part of the financial statements.
128
Table of Contents
| Year ended | ||||||||||||||||||||||||||||
|
| |||||||||||||||||||||||||||
| 8/31/19 | 8/31/18 | 8/31/17 | 8/31/16 | 8/31/15 | ||||||||||||||||||||||||
| ||||||||||||||||||||||||||||
| $ | 11.04 | $ | 11.28 | $ | 11.65 | $ | 11.24 | $ | 11.32 | |||||||||||||||||||
| 0.40 | 0.40 | 0.42 | 0.43 | 0.43 | ||||||||||||||||||||||||
| 0.44 | (0.24 | ) | (0.37 | ) | 0.41 | (0.08 | ) | |||||||||||||||||||||
|
|
|
|
|
|
|
|
|
| |||||||||||||||||||
| 0.84 | 0.16 | 0.05 | 0.84 | 0.35 | ||||||||||||||||||||||||
|
|
|
|
|
|
|
|
|
| |||||||||||||||||||
| (0.40 | ) | (0.40 | ) | (0.42 | ) | (0.43 | ) | (0.43 | ) | |||||||||||||||||||
|
|
|
|
|
|
|
|
|
| |||||||||||||||||||
| (0.40 | ) | (0.40 | ) | (0.42 | ) | (0.43 | ) | (0.43 | ) | |||||||||||||||||||
|
|
|
|
|
|
|
|
|
| |||||||||||||||||||
| $ | 11.48 | $ | 11.04 | $ | 11.28 | $ | 11.65 | $ | 11.24 | |||||||||||||||||||
|
|
|
|
|
|
|
|
|
| |||||||||||||||||||
| 7.74% | 1.47% | 0.51% | 7.60% | 3.13% | ||||||||||||||||||||||||
| $ | 42,317 | $ | 27,433 | $ | 19,788 | $ | 12,211 | $ | 5,102 | |||||||||||||||||||
| 0.59% | 0.59% | 0.59% | 0.59% | 0.60% | ||||||||||||||||||||||||
| 0.72% | 0.72% | 0.71% | 0.71% | 0.72% | ||||||||||||||||||||||||
| 3.56% | 3.61% | 3.73% | 3.75% | 3.79% | ||||||||||||||||||||||||
| 3.43% | 3.48% | 3.61% | 3.63% | 3.67% | ||||||||||||||||||||||||
| 16% | 6% | 17% | 6% | 10% | ||||||||||||||||||||||||
| ||||||||||||||||||||||||||||
129
Table of Contents
Financial highlights
Delaware Tax-Free Idaho Fund Class A
Selected data for each share of the Fund outstanding throughout each period were as follows:
|
Net asset value, beginning of period |
Income (loss) from investment operations: |
Net investment income1 |
Net realized and unrealized gain (loss) |
Total from investment operations |
Less dividends and distributions from: |
Net investment income |
Total dividends and distributions |
Net asset value, end of period |
Total return2 |
Ratios and supplemental data: |
Net assets, end of period (000 omitted) |
Ratio of expenses to average net assets |
Ratio of expenses to average net assets prior to fees waived |
Ratio of net investment income to average net assets |
Ratio of net investment income to average net assets prior to fees waived |
Portfolio turnover |
|
|
| 1 | The average shares outstanding have been applied for per share information. |
| 2 | Total return is based on the change in net asset value of a share during the period and assumes reinvestment of dividends and distributions at net asset value and does not reflect the impact of a sales charge. Total return during all of the periods shown reflects a waiver by the manager. Performance would have been lower had the waiver not been in effect. |
See accompanying notes, which are an integral part of the financial statements.
130
Table of Contents
Year ended | ||||||||||||||||||||||||||||
|
| |||||||||||||||||||||||||||
| 8/31/19 | 8/31/18 | 8/31/17 | 8/31/16 | 8/31/15 | ||||||||||||||||||||||||
| ||||||||||||||||||||||||||||
| $ | 11.21 | $ | 11.49 | $ | 11.79 | $ | 11.51 | $ | 11.56 | |||||||||||||||||||
| 0.35 | 0.34 | 0.35 | 0.36 | 0.37 | ||||||||||||||||||||||||
| 0.44 | (0.28 | ) | (0.30 | ) | 0.28 | (0.06 | ) | |||||||||||||||||||||
|
|
|
|
|
|
|
|
|
| |||||||||||||||||||
| 0.79 | 0.06 | 0.05 | 0.64 | 0.31 | ||||||||||||||||||||||||
|
|
|
|
|
|
|
|
|
| |||||||||||||||||||
| (0.35 | ) | (0.34 | ) | (0.35 | ) | (0.36 | ) | (0.36 | ) | |||||||||||||||||||
|
|
|
|
|
|
|
|
|
| |||||||||||||||||||
| (0.35 | ) | (0.34 | ) | (0.35 | ) | (0.36 | ) | (0.36 | ) | |||||||||||||||||||
|
|
|
|
|
|
|
|
|
| |||||||||||||||||||
| $ | 11.65 | $ | 11.21 | $ | 11.49 | $ | 11.79 | $ | 11.51 | |||||||||||||||||||
|
|
|
|
|
|
|
|
|
| |||||||||||||||||||
| 7.19% | 0.56% | 0.47% | 5.66% | 2.76% | ||||||||||||||||||||||||
| $ | 55,480 | $ | 59,425 | $ | 67,907 | $ | 70,306 | $ | 75,163 | |||||||||||||||||||
| 0.86% | 0.86% | 0.86% | 0.86% | 0.88% | ||||||||||||||||||||||||
| 1.03% | 1.01% | 1.00% | 0.99% | 1.00% | ||||||||||||||||||||||||
| 3.11% | 3.04% | 3.03% | 3.11% | 3.17% | ||||||||||||||||||||||||
| 2.94% | 2.89% | 2.89% | 2.98% | 3.05% | ||||||||||||||||||||||||
| 14% | 11% | 10% | 11% | 7% | ||||||||||||||||||||||||
| ||||||||||||||||||||||||||||
131
Table of Contents
Financial highlights
Delaware Tax-Free Idaho Fund Class C
Selected data for each share of the Fund outstanding throughout each period were as follows:
|
Net asset value, beginning of period |
Income (loss) from investment operations: |
Net investment income1 |
Net realized and unrealized gain (loss) |
Total from investment operations |
Less dividends and distributions from: |
Net investment income |
Total dividends and distributions |
Net asset value, end of period |
Total return2 |
Ratios and supplemental data: |
Net assets, end of period (000 omitted) |
Ratio of expenses to average net assets |
Ratio of expenses to average net assets prior to fees waived |
Ratio of net investment income to average net assets |
Ratio of net investment income to average net assets prior to fees waived |
Portfolio turnover |
|
|
| 1 | The average shares outstanding have been applied for per share information. |
| 2 | Total return is based on the change in net asset value of a share during the period and assumes reinvestment of dividends and distributions at net asset value and does not reflect the impact of a sales charge. Total return during all of the periods shown reflects a waiver by the manager. Performance would have been lower had the waiver not been in effect. |
See accompanying notes, which are an integral part of the financial statements.
132
Table of Contents
| Year ended | ||||||||||||||||||||||||||||
|
| |||||||||||||||||||||||||||
| 8/31/19 | 8/31/18 | 8/31/17 | 8/31/16 | 8/31/15 | ||||||||||||||||||||||||
| ||||||||||||||||||||||||||||
| $ | 11.20 | $ | 11.48 | $ | 11.78 | $ | 11.50 | $ | 11.55 | |||||||||||||||||||
| 0.27 | 0.26 | 0.26 | 0.27 | 0.28 | ||||||||||||||||||||||||
| 0.44 | (0.28 | ) | (0.30 | ) | 0.28 | (0.05 | ) | |||||||||||||||||||||
|
|
|
|
|
|
|
|
|
| |||||||||||||||||||
| 0.71 | (0.02 | ) | (0.04 | ) | 0.55 | 0.23 | ||||||||||||||||||||||
|
|
|
|
|
|
|
|
|
| |||||||||||||||||||
| (0.27 | ) | (0.26 | ) | (0.26 | ) | (0.27 | ) | (0.28 | ) | |||||||||||||||||||
|
|
|
|
|
|
|
|
|
| |||||||||||||||||||
| (0.27 | ) | (0.26 | ) | (0.26 | ) | (0.27 | ) | (0.28 | ) | |||||||||||||||||||
|
|
|
|
|
|
|
|
|
| |||||||||||||||||||
| $ | 11.64 | $ | 11.20 | $ | 11.48 | $ | 11.78 | $ | 11.50 | |||||||||||||||||||
|
|
|
|
|
|
|
|
|
| |||||||||||||||||||
| 6.40% | (0.19% | ) | (0.29% | ) | 4.88% | 1.99% | ||||||||||||||||||||||
| $ | 12,875 | $ | 17,597 | $ | 29,375 | $ | 30,834 | $ | 28,557 | |||||||||||||||||||
| 1.61% | 1.61% | 1.61% | 1.61% | 1.63% | ||||||||||||||||||||||||
| 1.78% | 1.76% | 1.75% | 1.74% | 1.75% | ||||||||||||||||||||||||
| 2.36% | 2.29% | 2.28% | 2.36% | 2.42% | ||||||||||||||||||||||||
| 2.19% | 2.14% | 2.14% | 2.23% | 2.30% | ||||||||||||||||||||||||
| 14% | 11% | 10% | 11% | 7% | ||||||||||||||||||||||||
| ||||||||||||||||||||||||||||
133
Table of Contents
Financial highlights
Delaware Tax-Free Idaho Fund Institutional Class
Selected data for each share of the Fund outstanding throughout each period were as follows:
|
Net asset value, beginning of period |
Income (loss) from investment operations: |
Net investment income1 |
Net realized and unrealized gain (loss) |
Total from investment operations |
Less dividends and distributions from: |
Net investment income |
Total dividends and distributions |
Net asset value, end of period |
Total return2 |
Ratios and supplemental data: |
Net assets, end of period (000 omitted) |
Ratio of expenses to average net assets |
Ratio of expenses to average net assets prior to fees waived |
Ratio of net investment income to average net assets |
Ratio of net investment income to average net assets prior to fees waived |
Portfolio turnover |
|
|
| 1 | The average shares outstanding have been applied for per share information. |
| 2 | Total return is based on the change in net asset value of a share during the period and assumes reinvestment of dividends and distributions at net asset value. Total return during all of the periods shown reflects a waiver by the manager. Performance would have been lower had the waiver not been in effect. |
See accompanying notes, which are an integral part of the financial statements.
134
Table of Contents
| Year ended | ||||||||||||||||||||||||||||
|
| |||||||||||||||||||||||||||
| 8/31/19 | 8/31/18 | 8/31/17 | 8/31/16 | 8/31/15 | ||||||||||||||||||||||||
| ||||||||||||||||||||||||||||
| $ | 11.21 | $ | 11.49 | $ | 11.79 | $ | 11.51 | $ | 11.57 | |||||||||||||||||||
| 0.38 | 0.37 | 0.37 | 0.39 | 0.40 | ||||||||||||||||||||||||
| 0.44 | (0.28 | ) | (0.29 | ) | 0.28 | (0.07 | ) | |||||||||||||||||||||
|
|
|
|
|
|
|
|
|
| |||||||||||||||||||
| 0.82 | 0.09 | 0.08 | 0.67 | 0.33 | ||||||||||||||||||||||||
|
|
|
|
|
|
|
|
|
| |||||||||||||||||||
| (0.38 | ) | (0.37 | ) | (0.38 | ) | (0.39 | ) | (0.39 | ) | |||||||||||||||||||
|
|
|
|
|
|
|
|
|
| |||||||||||||||||||
| (0.38 | ) | (0.37 | ) | (0.38 | ) | (0.39 | ) | (0.39 | ) | |||||||||||||||||||
|
|
|
|
|
|
|
|
|
| |||||||||||||||||||
| $ | 11.65 | $ | 11.21 | $ | 11.49 | $ | 11.79 | $ | 11.51 | |||||||||||||||||||
|
|
|
|
|
|
|
|
|
| |||||||||||||||||||
| 7.46% | 0.82% | 0.71% | 5.92% | 2.92% | ||||||||||||||||||||||||
| $ | 35,157 | $ | 21,310 | $ | 12,090 | $ | 10,248 | $ | 2,588 | |||||||||||||||||||
| 0.61% | 0.61% | 0.61% | 0.61% | 0.63% | ||||||||||||||||||||||||
| 0.78% | 0.76% | 0.75% | 0.74% | 0.75% | ||||||||||||||||||||||||
| 3.36% | 3.29% | 3.28% | 3.36% | 3.42% | ||||||||||||||||||||||||
| 3.19% | 3.14% | 3.14% | 3.23% | 3.30% | ||||||||||||||||||||||||
| 14% | 11% | 10% | 11% | 7% | ||||||||||||||||||||||||
| ||||||||||||||||||||||||||||
135
Table of Contents
Financial highlights
Delaware Tax-Free New York Fund Class A
Selected data for each share of the Fund outstanding throughout each period were as follows:
|
Net asset value, beginning of period |
Income (loss) from investment operations: |
Net investment income1 |
Net realized and unrealized gain (loss) |
Total from investment operations |
Less dividends and distributions from: |
Net investment income |
Total dividends and distributions |
Net asset value, end of period |
Total return2 |
Ratios and supplemental data: |
Net assets, end of period (000 omitted) |
Ratio of expenses to average net assets |
Ratio of expenses to average net assets prior to fees waived |
Ratio of net investment income to average net assets |
Ratio of net investment income to average net assets prior to fees waived |
Portfolio turnover |
|
|
| 1 | The average shares outstanding have been applied for per share information. |
| 2 | Total return is based on the change in net asset value of a share during the period and assumes reinvestment of dividends and distributions at net asset value and does not reflect the impact of a sales charge. Total return during all of the periods shown reflects a waiver by the manager. Performance would have been lower had the waiver not been in effect. |
See accompanying notes, which are an integral part of the financial statements.
136
Table of Contents
| Year ended | ||||||||||||||||||||||||||||
|
| |||||||||||||||||||||||||||
| 8/31/19 | 8/31/18 | 8/31/17 | 8/31/16 | 8/31/15 | ||||||||||||||||||||||||
| ||||||||||||||||||||||||||||
| $ | 11.33 | $ | 11.62 | $ | 11.98 | $ | 11.48 | $ | 11.46 | |||||||||||||||||||
| 0.36 | 0.36 | 0.35 | 0.36 | 0.37 | ||||||||||||||||||||||||
| 0.53 | (0.29 | ) | (0.35 | ) | 0.50 | 0.02 | ||||||||||||||||||||||
|
|
|
|
|
|
|
|
|
| |||||||||||||||||||
| 0.89 | 0.07 | — | 0.86 | 0.39 | ||||||||||||||||||||||||
|
|
|
|
|
|
|
|
|
| |||||||||||||||||||
| (0.36 | ) | (0.36 | ) | (0.36 | ) | (0.36 | ) | (0.37 | ) | |||||||||||||||||||
|
|
|
|
|
|
|
|
|
| |||||||||||||||||||
| (0.36 | ) | (0.36 | ) | (0.36 | ) | (0.36 | ) | (0.37 | ) | |||||||||||||||||||
|
|
|
|
|
|
|
|
|
| |||||||||||||||||||
| $ | 11.86 | $ | 11.33 | $ | 11.62 | $ | 11.98 | $ | 11.48 | |||||||||||||||||||
|
|
|
|
|
|
|
|
|
| |||||||||||||||||||
| 8.00% | 0.60% | 0.05% | 7.57% | 3.41% | ||||||||||||||||||||||||
| $ | 36,058 | $ | 38,139 | $ | 40,647 | $ | 55,418 | $ | 51,708 | |||||||||||||||||||
| 0.80% | 0.80% | 0.80% | 0.80% | 0.83% | ||||||||||||||||||||||||
| 1.07% | 1.08% | 1.03% | 1.02% | 1.07% | ||||||||||||||||||||||||
| 3.12% | 3.10% | 3.04% | 3.06% | 3.18% | ||||||||||||||||||||||||
| 2.85% | 2.82% | 2.81% | 2.84% | 2.94% | ||||||||||||||||||||||||
| 21% | 10% | 14% | 8% | 6% | ||||||||||||||||||||||||
| ||||||||||||||||||||||||||||
137
Table of Contents
Financial highlights
Delaware Tax-Free New York Fund Class C
Selected data for each share of the Fund outstanding throughout each period were as follows:
|
Net asset value, beginning of period |
Income (loss) from investment operations: |
Net investment income1 |
Net realized and unrealized gain (loss) |
Total from investment operations |
Less dividends and distributions from: |
Net investment income |
Total dividends and distributions |
Net asset value, end of period |
Total return2 |
Ratios and supplemental data: |
Net assets, end of period (000 omitted) |
Ratio of expenses to average net assets |
Ratio of expenses to average net assets prior to fees waived |
Ratio of net investment income to average net assets |
Ratio of net investment income to average net assets prior to fees waived |
Portfolio turnover |
|
|
| 1 | The average shares outstanding have been applied for per share information. |
| 2 | Total return is based on the change in net asset value of a share during the period and assumes reinvestment of dividends and distributions at net asset value and does not reflect the impact of a sales charge. Total return during all of the periods shown reflects a waiver by the manager. Performance would have been lower had the waiver not been in effect. |
See accompanying notes, which are an integral part of the financial statements.
138
Table of Contents
| Year ended | ||||||||||||||||||||||||||||
|
| |||||||||||||||||||||||||||
| 8/31/19 | 8/31/18 | 8/31/17 | 8/31/16 | 8/31/15 | ||||||||||||||||||||||||
| ||||||||||||||||||||||||||||
| $ | 11.30 | $ | 11.59 | $ | 11.95 | $ | 11.45 | $ | 11.44 | |||||||||||||||||||
| 0.27 | 0.27 | 0.26 | 0.27 | 0.28 | ||||||||||||||||||||||||
| 0.53 | (0.29 | ) | (0.35 | ) | 0.50 | 0.01 | ||||||||||||||||||||||
|
|
|
|
|
|
|
|
|
| |||||||||||||||||||
| 0.80 | (0.02 | ) | (0.09 | ) | 0.77 | 0.29 | ||||||||||||||||||||||
|
|
|
|
|
|
|
|
|
| |||||||||||||||||||
| (0.27 | ) | (0.27 | ) | (0.27 | ) | (0.27 | ) | (0.28 | ) | |||||||||||||||||||
|
|
|
|
|
|
|
|
|
| |||||||||||||||||||
| (0.27 | ) | (0.27 | ) | (0.27 | ) | (0.27 | ) | (0.28 | ) | |||||||||||||||||||
|
|
|
|
|
|
|
|
|
| |||||||||||||||||||
| $ | 11.83 | $ | 11.30 | $ | 11.59 | $ | 11.95 | $ | 11.45 | |||||||||||||||||||
|
|
|
|
|
|
|
|
|
| |||||||||||||||||||
| 7.20% | (0.16% | ) | (0.71% | ) | 6.78% | 2.55% | ||||||||||||||||||||||
| $ | 13,459 | $ | 14,941 | $ | 17,073 | $ | 20,899 | $ | 17,825 | |||||||||||||||||||
| 1.55% | 1.55% | 1.55% | 1.55% | 1.58% | ||||||||||||||||||||||||
| 1.82% | 1.83% | 1.78% | 1.77% | 1.82% | ||||||||||||||||||||||||
| 2.37% | 2.35% | 2.29% | 2.31% | 2.43% | ||||||||||||||||||||||||
| 2.10% | 2.07% | 2.06% | 2.09% | 2.19% | ||||||||||||||||||||||||
| 21% | 10% | 14% | 8% | 6% | ||||||||||||||||||||||||
| ||||||||||||||||||||||||||||
139
Table of Contents
Financial highlights
Delaware Tax-Free New York Fund Institutional Class
Selected data for each share of the Fund outstanding throughout each period were as follows:
|
Net asset value, beginning of period |
Income (loss) from investment operations: |
Net investment income1 |
Net realized and unrealized gain (loss) |
Total from investment operations |
Less dividends and distributions from: |
Net investment income |
Total dividends and distributions |
Net asset value, end of period |
Total return2 |
Ratios and supplemental data: |
Net assets, end of period (000 omitted) |
Ratio of expenses to average net assets |
Ratio of expenses to average net assets prior to fees waived |
Ratio of net investment income to average net assets |
Ratio of net investment income to average net assets prior to fees waived |
Portfolio turnover |
|
|
| 1 | The average shares outstanding have been applied for per share information. |
| 2 | Total return is based on the change in net asset value of a share during the period and assumes reinvestment of dividends and distributions at net asset value. Total return during all of the periods shown reflects a waiver by the manager. Performance would have been lower had the waiver not been in effect. |
See accompanying notes, which are an integral part of the financial statements.
140
Table of Contents
| Year ended | ||||||||||||||||||||||||||||
|
| |||||||||||||||||||||||||||
| 8/31/19 | 8/31/18 | 8/31/17 | 8/31/16 | 8/31/15 | ||||||||||||||||||||||||
| ||||||||||||||||||||||||||||
| $ | 11.33 | $ | 11.61 | $ | 11.97 | $ | 11.47 | $ | 11.46 | |||||||||||||||||||
| 0.38 | 0.39 | 0.38 | 0.39 | 0.40 | ||||||||||||||||||||||||
| 0.52 | (0.28 | ) | (0.35 | ) | 0.50 | 0.01 | ||||||||||||||||||||||
|
|
|
|
|
|
|
|
|
| |||||||||||||||||||
| 0.90 | 0.11 | 0.03 | 0.89 | 0.41 | ||||||||||||||||||||||||
|
|
|
|
|
|
|
|
|
| |||||||||||||||||||
| (0.38 | ) | (0.39 | ) | (0.39 | ) | (0.39 | ) | (0.40 | ) | |||||||||||||||||||
|
|
|
|
|
|
|
|
|
| |||||||||||||||||||
| (0.38 | ) | (0.39 | ) | (0.39 | ) | (0.39 | ) | (0.40 | ) | |||||||||||||||||||
|
|
|
|
|
|
|
|
|
| |||||||||||||||||||
| $ | 11.85 | $ | 11.33 | $ | 11.61 | $ | 11.97 | $ | 11.47 | |||||||||||||||||||
|
|
|
|
|
|
|
|
|
| |||||||||||||||||||
| 8.17% | 0.93% | 0.29% | 7.84% | 3.58% | ||||||||||||||||||||||||
| $ | 39,363 | $ | 32,981 | $ | 32,192 | $ | 19,929 | $ | 12,667 | |||||||||||||||||||
| 0.55% | 0.55% | 0.55% | 0.55% | 0.58% | ||||||||||||||||||||||||
| 0.82% | 0.83% | 0.78% | 0.77% | 0.82% | ||||||||||||||||||||||||
| 3.37% | 3.35% | 3.29% | 3.31% | 3.43% | ||||||||||||||||||||||||
| 3.10% | 3.07% | 3.06% | 3.09% | 3.19% | ||||||||||||||||||||||||
| 21% | 10% | 14% | 8% | 6% | ||||||||||||||||||||||||
| ||||||||||||||||||||||||||||
141
Table of Contents
Financial highlights
Delaware Tax-Free Pennsylvania Fund Class A
Selected data for each share of the Fund outstanding throughout each period were as follows:
|
Net asset value, beginning of period |
Income (loss) from investment operations: |
Net investment income1 |
Net realized and unrealized gain (loss) |
Total from investment operations |
Less dividends and distributions from: |
Net investment income |
Net realized gain |
Total dividends and distributions |
Net asset value, end of period |
Total return2 |
Ratios and supplemental data: |
Net assets, end of period (000 omitted) |
Ratio of expenses to average net assets |
Ratio of expenses to average net assets prior to fees waived |
Ratio of net investment income to average net assets |
Ratio of net investment income to average net assets prior to fees waived |
Portfolio turnover |
|
|
| 1 | The average shares outstanding have been applied for per share information. |
| 2 | Total return is based on the change in net asset value of a share during the period and assumes reinvestment of dividends and distributions at net asset value and does not reflect the impact of a sales charge. Total return during all of the periods shown reflects a waiver by the manager. Performance would have been lower had the waiver not been in effect. |
See accompanying notes, which are an integral part of the financial statements.
142
Table of Contents
| Year ended | ||||||||||||||||||||||||||||
| 8/31/19 | 8/31/18 | 8/31/17 | 8/31/16 | 8/31/15 | ||||||||||||||||||||||||
| $ | 7.93 | $ | 8.14 | $ | 8.39 | $ | 8.15 | $ | 8.16 | |||||||||||||||||||
| 0.28 | 0.28 | 0.28 | 0.29 | 0.29 | ||||||||||||||||||||||||
| 0.32 | (0.20 | ) | (0.25 | ) | 0.24 | (0.01 | ) | |||||||||||||||||||||
|
|
|
|
|
|
|
|
|
| |||||||||||||||||||
| 0.60 | 0.08 | 0.03 | 0.53 | 0.28 | ||||||||||||||||||||||||
|
|
|
|
|
|
|
|
|
| |||||||||||||||||||
| (0.28 | ) | (0.28 | ) | (0.28 | ) | (0.29 | ) | (0.29 | ) | |||||||||||||||||||
| — | (0.01 | ) | — | — | — | |||||||||||||||||||||||
|
|
|
|
|
|
|
|
|
| |||||||||||||||||||
| (0.28 | ) | (0.29 | ) | (0.28 | ) | (0.29 | ) | (0.29 | ) | |||||||||||||||||||
|
|
|
|
|
|
|
|
|
| |||||||||||||||||||
| $ | 8.25 | $ | 7.93 | $ | 8.14 | $ | 8.39 | $ | 8.15 | |||||||||||||||||||
|
|
|
|
|
|
|
|
|
| |||||||||||||||||||
| 7.72% | 0.93% | 0.48% | 6.60% | 3.45% | ||||||||||||||||||||||||
| $ | 376,965 | $ | 378,038 | $ | 399,001 | $ | 439,379 | $ | 441,904 | |||||||||||||||||||
| 0.85% | 0.88% | 0.88% | 0.88% | 0.89% | ||||||||||||||||||||||||
| 0.93% | 0.93% | 0.94% | 0.94% | 0.95% | ||||||||||||||||||||||||
| 3.49% | 3.48% | 3.51% | 3.50% | 3.51% | ||||||||||||||||||||||||
| 3.41% | 3.43% | 3.45% | 3.44% | 3.45% | ||||||||||||||||||||||||
| 23% | 19% | 15% | 14% | 13% | ||||||||||||||||||||||||
| ||||||||||||||||||||||||||||
143
Table of Contents
Financial highlights
Delaware Tax-Free Pennsylvania Fund Class C
Selected data for each share of the Fund outstanding throughout each period were as follows:
Net asset value, beginning of period |
Income (loss) from investment operations: |
Net investment income1 |
Net realized and unrealized gain (loss) |
Total from investment operations |
Less dividends and distributions from: |
Net investment income |
Net realized gain |
Total dividends and distributions |
Net asset value, end of period |
Total return2 |
Ratios and supplemental data: |
Net assets, end of period (000 omitted) |
Ratio of expenses to average net assets |
Ratio of expenses to average net assets prior to fees waived |
Ratio of net investment income to average net assets |
Ratio of net investment income to average net assets prior to fees waived |
Portfolio turnover |
|
|
| 1 | The average shares outstanding have been applied for per share information. |
| 2 | Total return is based on the change in net asset value of a share during the period and assumes reinvestment of dividends and distributions at net asset value and does not reflect the impact of a sales charge. Total return during all of the periods shown reflects a waiver by the manager. Performance would have been lower had the waiver not been in effect. |
See accompanying notes, which are an integral part of the financial statements.
144
Table of Contents
| Year ended | ||||||||||||||||||||||||||||
| 8/31/19 | 8/31/18 | 8/31/17 | 8/31/16 | 8/31/15 | ||||||||||||||||||||||||
| $ | 7.93 | $ | 8.14 | $ | 8.39 | $ | 8.15 | $ | 8.16 | |||||||||||||||||||
| 0.22 | 0.22 | 0.22 | 0.23 | 0.23 | ||||||||||||||||||||||||
| 0.32 | (0.20 | ) | (0.25 | ) | 0.24 | (0.01 | ) | |||||||||||||||||||||
|
|
|
|
|
|
|
|
|
| |||||||||||||||||||
| 0.54 | 0.02 | (0.03 | ) | 0.47 | 0.22 | |||||||||||||||||||||||
|
|
|
|
|
|
|
|
|
| |||||||||||||||||||
| (0.22 | ) | (0.22 | ) | (0.22 | ) | (0.23 | ) | (0.23 | ) | |||||||||||||||||||
| — | (0.01 | ) | — | — | — | |||||||||||||||||||||||
|
|
|
|
|
|
|
|
|
| |||||||||||||||||||
| (0.22 | ) | (0.23 | ) | (0.22 | ) | (0.23 | ) | (0.23 | ) | |||||||||||||||||||
|
|
|
|
|
|
|
|
|
| |||||||||||||||||||
| $ | 8.25 | $ | 7.93 | $ | 8.14 | $ | 8.39 | $ | 8.15 | |||||||||||||||||||
|
|
|
|
|
|
|
|
|
| |||||||||||||||||||
| 6.91% | 0.16% | (0.27% | ) | 5.79% | 2.67% | |||||||||||||||||||||||
| $ | 25,065 | $ | 26,376 | $ | 33,298 | $ | 36,215 | $ | 32,799 | |||||||||||||||||||
| 1.61% | 1.64% | 1.64% | 1.64% | 1.65% | ||||||||||||||||||||||||
| 1.69% | 1.69% | 1.70% | 1.70% | 1.71% | ||||||||||||||||||||||||
| 2.73% | 2.72% | 2.75% | 2.74% | 2.75% | ||||||||||||||||||||||||
| 2.65% | 2.67% | 2.69% | 2.68% | 2.69% | ||||||||||||||||||||||||
| 23% | 19% | 15% | 14% | 13% | ||||||||||||||||||||||||
| ||||||||||||||||||||||||||||
145
Table of Contents
Financial highlights
Delaware Tax-Free Pennsylvania Fund Institutional Class
Selected data for each share of the Fund outstanding throughout each period were as follows:
Net asset value, beginning of period |
Income (loss) from investment operations: |
Net investment income1 |
Net realized and unrealized gain (loss) |
Total from investment operations |
Less dividends and distributions from: |
Net investment income |
Net realized gain |
Total dividends and distributions |
Net asset value, end of period |
Total return2 |
Ratios and supplemental data: |
Net assets, end of period (000 omitted) |
Ratio of expenses to average net assets |
Ratio of expenses to average net assets prior to fees waived |
Ratio of net investment income to average net assets |
Ratio of net investment income to average net assets prior to fees waived |
Portfolio turnover |
|
|
| 1 | The average shares outstanding have been applied for per share information. |
| 2 | Total return is based on the change in net asset value of a share during the period and assumes reinvestment of dividends and distributions at net asset value. Total return during all of the periods shown reflects a waiver by the manager. Performance would have been lower had the waiver not been in effect. |
See accompanying notes, which are an integral part of the financial statements.
146
Table of Contents
| Year ended | ||||||||||||||||||||||||||||
| 8/31/19 | 8/31/18 | 8/31/17 | 8/31/16 | 8/31/15 | ||||||||||||||||||||||||
| $ | 7.92 | $ | 8.13 | $ | 8.38 | $ | 8.14 | $ | 8.16 | |||||||||||||||||||
| 0.30 | 0.30 | 0.30 | 0.31 | 0.31 | ||||||||||||||||||||||||
| 0.33 | (0.20 | ) | (0.25 | ) | 0.24 | (0.02 | ) | |||||||||||||||||||||
|
|
|
|
|
|
|
|
|
| |||||||||||||||||||
| 0.63 | 0.10 | 0.05 | 0.55 | 0.29 | ||||||||||||||||||||||||
|
|
|
|
|
|
|
|
|
| |||||||||||||||||||
| (0.30 | ) | (0.30 | ) | (0.30 | ) | (0.31 | ) | (0.31 | ) | |||||||||||||||||||
| — | (0.01 | ) | — | — | — | |||||||||||||||||||||||
|
|
|
|
|
|
|
|
|
| |||||||||||||||||||
| (0.30 | ) | (0.31 | ) | (0.30 | ) | (0.31 | ) | (0.31 | ) | |||||||||||||||||||
|
|
|
|
|
|
|
|
|
| |||||||||||||||||||
| $ | 8.25 | $ | 7.92 | $ | 8.13 | $ | 8.38 | $ | 8.14 | |||||||||||||||||||
|
|
|
|
|
|
|
|
|
| |||||||||||||||||||
| 8.12% | 1.16% | 0.73% | 6.86% | 3.57% | ||||||||||||||||||||||||
| $ | 47,241 | $ | 41,427 | $ | 33,373 | $ | 26,372 | $ | 16,740 | |||||||||||||||||||
| 0.61% | 0.64% | 0.64% | 0.64% | 0.65% | ||||||||||||||||||||||||
| 0.69% | 0.69% | 0.70% | 0.70% | 0.71% | ||||||||||||||||||||||||
| 3.73% | 3.72% | 3.75% | 3.74% | 3.75% | ||||||||||||||||||||||||
| 3.65% | 3.67% | 3.69% | 3.68% | 3.69% | ||||||||||||||||||||||||
| 23% | 19% | 15% | 14% | 13% | ||||||||||||||||||||||||
| ||||||||||||||||||||||||||||
147
Table of Contents
| Notes to financial statements | ||
| Delaware Funds® by Macquarie statetax-free funds | August 31, 2019 | |
Voyageur Insured Funds is organized as a Delaware statutory trust and offers one series:
DelawareTax-Free Arizona Fund. Voyageur Mutual Funds is organized as a Delaware statutory trust and offers five series: Delaware Minnesota High-Yield Municipal Bond Fund, Delaware National High-Yield Municipal Bond Fund, DelawareTax-Free California Fund, DelawareTax-Free Idaho Fund, and DelawareTax-Free New York Fund. Voyageur Mutual Funds II is organized as a Delaware statutory trust and offers one series: DelawareTax-Free Colorado Fund. Delaware Group® StateTax-Free Income Trust is organized as a Delaware statutory trust and offers one series: DelawareTax-Free Pennsylvania Fund. Voyageur Insured Funds, Voyageur Mutual Funds, Voyageur Mutual Funds II, and Delaware Group StateTax-Free Income Trust are each referred to as a Trust, or collectively as the Trusts. These financial statements and the related notes pertain to DelawareTax-Free Arizona Fund, DelawareTax-Free California Fund, DelawareTax-Free Colorado Fund, DelawareTax-Free Idaho Fund, DelawareTax-Free New York Fund, and DelawareTax-Free Pennsylvania Fund (each a Fund, or collectively, the Funds). Each Fund is anopen-end investment company. The Funds are considered diversified under the Investment Company Act of 1940, as amended (1940 Act), and offer Class A, Class C, and Institutional Class shares. Class A shares are sold with a maximumfront-end sales charge of 4.50%. Class A share purchases of $1,000,000 or more will incur a contingent deferred sales charge (CDSC) instead of afront-end sales charge of 1.00%, if redeemed during the first year, and 0.50% during the second year, provided that Delaware Distributors, L.P. (DDLP) paid a financial advisor a commission on the purchase of those shares. Class C shares are sold with a CDSC of 1.00%, which will be incurred if redeemed during the first 12 months. Institutional Class shares are not subject to a sales charge and are offered for sale exclusively to certain eligible investors.
The investment objective of each Fund is to seek as high a level of current income exempt from federal income tax and from personal income taxes in the respective applicable state, as is consistent with preservation of capital.
1. Significant Accounting Policies
Each Fund follows accounting and reporting guidance under Financial Accounting Standards Board (FASB) Accounting Standards Codification Topic 946, Financial Services – Investment Companies. The following accounting policies are in accordance with US generally accepted accounting principles (US GAAP) and are consistently followed by the Funds.
Security Valuation – Debt securities are valued based upon valuations provided by an independent pricing service or broker and reviewed by management. To the extent current market prices are not available, the pricing service may take into account developments related to the specific security, as well as transactions in comparable securities. Valuations for fixed income securities utilize matrix systems, which reflect such factors as security prices, yields, maturities, and ratings, and are supplemented by dealer and exchange quotations.Open-end investment companies are valued at their published net asset value (NAV). Generally, other securities and assets for which market quotations are not readily available are valued at fair value as determined in good faith under the direction of each Trust’s Board of Trustees (each, a Board or, collectively, the Boards). In determining whether market quotations are readily available or fair valuation will be used, various factors will be taken into consideration, such as market closures or suspension of trading in a security. Restricted securities are valued at fair value using methods approved by the Boards.
148
Table of Contents
Federal Income Taxes– No provision for federal income taxes has been made as each Fund intends to continue to qualify for federal income tax purposes as a regulated investment company under Subchapter M of the Internal Revenue Code of 1986, as amended, and make the requisite distributions to shareholders. Each Fund evaluates tax positions taken or expected to be taken in the course of preparing each Fund’s tax returns to determine whether the tax positions are“more-likely-than-not” of being sustained by the applicable tax authority. Tax positions not deemed to meet the“more-likely-than-not” threshold are recorded as a tax benefit or expense in the current year. Management has analyzed each Fund’s tax positions taken or expected to be taken on each Fund’s federal income tax returns through the year ended Aug. 31, 2019 and for all open tax years (years ended Aug. 31, 2016–Aug. 31, 2018), and has concluded that no provision for federal income tax is required in each Fund’s financial statements. If applicable, each Fund recognizes interest accrued on unrecognized tax benefits in interest expense and penalties in “Other expenses” on the “Statements of operations.” During the year ended Aug. 31, 2019, the Funds did not incur any interest or tax penalties.
Class Accounting– Investment income and common expenses are allocated to the various classes of each Fund on the basis of “settled shares” of each class in relation to the net assets of each Fund. Realized and unrealized gain (loss) on investments are allocated to the various classes of each Fund on the basis of daily net assets of each class. Distribution expenses relating to a specific class are charged directly to that class.
Use of Estimates– The preparation of financial statements in conformity with US GAAP requires management to make estimates and assumptions that affect the fair value of investments, the reported amounts of assets and liabilities and disclosure of contingent assets and liabilities at the date of the financial statements, and the reported amounts of revenues and expenses during the reporting period. Actual results could differ from those estimates and the differences could be material.
Other– Expenses directly attributable to each Fund are charged directly to the Fund. Other expenses common to various funds within the Delaware Funds® by Macquarie (Delaware Funds) are generally allocated among such funds on the basis of average net assets. Management fees and certain other expenses are paid monthly. Security transactions are recorded on the date the securities are purchased or sold (trade date) for financial reporting purposes. Costs used in calculating realized gains and losses on the sale of investment securities are those of the specific securities sold. Interest income is recorded on the accrual basis. Discounts and premiums on debt securities are accreted or amortized to interest income, respectively, over the lives of the respective securities using the effective interest method. Each Fund declares dividends daily from net investment income and pays the dividends monthly and declares and pays distributions from net realized gain on investments, if any, annually. Each Fund may distribute more frequently, if necessary for tax purposes. Dividends and distributions, if any, are recorded on theex-dividend date.
149
Table of Contents
| Notes to financial statements | ||
| Delaware Funds® by Macquarie statetax-free funds | ||
1. Significant Accounting Policies (continued)
Each Fund receives earnings credits from its custodian when positive cash balances are maintained, which may be used to offset custody fees. The expenses paid under this arrangement are included on the “Statements of operations” under “Custodian fees” with the corresponding expenses offset included under “Less expenses paid indirectly.” For the year ended Aug. 31, 2019, each Fund earned the following amounts under this arrangement:
| Delaware Tax-Free Arizona Fund | Delaware Tax-Free California Fund | Delaware Tax-Free Colorado Fund | Delaware Tax-Free Idaho Fund | Delaware Tax-Free New York Fund | Delaware Tax-Free Pennsylvania Fund | |||||
| $985 | $1,715 | $1,323 | $1,085 | $1,519 | $5,456 | |||||
Each Fund receives earnings credits from its transfer agent when positive cash balances are maintained, which may be used to offset transfer agent fees. If the amount earned is greater than $1, the expenses paid under this arrangement are included on the “Statements of operations” under “Dividend disbursing and transfer agent fees and expenses” with the corresponding expenses offset included under “Less expenses paid indirectly.” For the year ended Aug. 31, 2019, each Fund earned the following amounts under this arrangement:
| Delaware Tax-Free Arizona Fund | Delaware Tax-Free California Fund | Delaware Tax-Free Colorado Fund | Delaware Tax-Free Idaho Fund | Delaware Tax-Free New York Fund | Delaware Tax-Free Pennsylvania Fund | |||||
| $45 | $37 | $113 | $51 | $37 | $311 | |||||
2. Investment Management, Administration Agreements, and Other Transactions with Affiliates
In accordance with the terms of its respective investment management agreement, each Fund pays Delaware Management Company (DMC), a series of Macquarie Investment Management Business Trust and the investment manager, an annual fee which is calculated daily and paid monthly based on each Fund’s average daily net assets as follows:
| Delaware Tax-Free Arizona Fund | Delaware Tax-Free California Fund | Delaware Tax-Free Colorado Fund | Delaware Tax-Free Idaho Fund | Delaware Tax-Free New York Fund | Delaware Tax-Free Pennsylvania Fund | |||||||||||
On the first $500 million | 0.500% | 0.550% | 0.550% | 0.550% | 0.550% | 0.550% | ||||||||||
On the next $500 million | 0.475% | 0.500% | 0.500% | 0.500% | 0.500% | 0.500% | ||||||||||
On the next $1.5 billion | 0.450% | 0.450% | 0.450% | 0.450% | 0.450% | 0.450% | ||||||||||
In excess of $2.5 billion | 0.425% | 0.425% | 0.425% | 0.425% | 0.425% | 0.425% | ||||||||||
DMC has contractually agreed to waive all or a portion, if any, of its management fee and/or pay/reimburse each Fund to the extent necessary to ensure total annual operating expenses (excluding any distribution and service(12b-1) fees, acquired fund fees and expenses, taxes, interest, inverse floater program expenses, short sale and dividend interest expenses, brokerage fees, certain insurance costs, and nonroutine expenses or costs, including, but not limited to, those relating to reorganizations,
150
Table of Contents
litigation, conducting shareholder meetings, and liquidations), do not exceed the following percentages of each Fund’s average daily net assets from Sept. 1, 2018 through Aug. 31, 2019.* These expense waivers and reimbursements may only be terminated by agreement of DMC and each Fund. The waivers and reimbursements are accrued daily and received monthly.
| Delaware Tax-Free Arizona Fund | Delaware Tax-Free California Fund | Delaware Tax-Free Colorado Fund | Delaware Tax-Free Idaho Fund | Delaware Tax-Free New York Fund | Delaware Tax-Free Pennsylvania Fund | |||||||
Operating expense limitation as a percentage of average daily net assets Sept. 1, 2018 through Dec. 27, 2018 | 0.59% | 0.57% | 0.59% | 0.61% | 0.55% | 0.64% | ||||||
Operating expense limitation as a percentage of average daily net assets Dec. 28, 2018 through Aug. 31, 2019 | 0.59% | 0.57% | 0.59% | 0.61% | 0.55% | 0.59% |
Delaware Investments Fund Services Company (DIFSC), an affiliate of DMC, provides fund accounting and financial administration oversight services to the Funds. For these services, DIFSC’s fees are calculated daily and paid monthly based on the aggregate daily net assets of all funds within the Delaware Funds at the following annual rates: 0.00475% of the first $35 billion; 0.0040% of the next $10 billion; and 0.0025% of aggregate average daily net assets in excess of $45 billion (Total Fee). Each fund in the Delaware Funds pays a minimum of $4,000, which, in aggregate, is subtracted from the Total Fee. Each fund then pays its portion of the remainder of the Total Fee on a relative NAV basis. These amounts are included on the “Statements of operations” under “Accounting and administration expenses.” For the year ended Aug. 31, 2019, each Fund was charged for these services as follows:
| Delaware Tax-Free Arizona Fund | Delaware Tax-Free California Fund | Delaware Tax-Free Colorado Fund | Delaware Tax-Free Idaho Fund | Delaware Tax-Free New York Fund | Delaware Tax-Free Pennsylvania Fund | |||||
| $6,862 | $7,617 | $11,728 | $7,732 | $7,199 | $20,428 |
DIFSC is also the transfer agent and dividend disbursing agent of the Funds. For these services, DIFSC’s fees are calculated daily and paid monthly based on the aggregate daily net assets of the retail funds within the Delaware Funds at the following annual rates: 0.014% of the first $20 billion; 0.011% of the next $5 billion; 0.007% of the next $5 billion; 0.005% of the next $20 billion; and 0.0025% of average daily net assets in excess of $50 billion. The fees payable to DIFSC under the shareholder services agreement described above are allocated among all retail funds in the Delaware Funds on a relative NAV basis. These amounts are included on the “Statements of operations” under “Dividend disbursing and transfer agent fees and expenses.”
151
Table of Contents
| Notes to financial statements | ||
| Delaware Funds® by Macquarie statetax-free funds | ||
2. Investment Management, Administration Agreements, and Other Transactions with Affiliates (continued)
For the year ended Aug. 31, 2019, each Fund was charged for these services as follows:
| Delaware Tax-Free Arizona Fund | Delaware Tax-Free California Fund | Delaware Tax-Free Colorado Fund | Delaware Tax-Free Idaho Fund | Delaware Tax-Free New York Fund | Delaware Tax-Free Pennsylvania Fund | |||||
| $6,253 | $7,883 | $16,993 | $8,182 | $6,994 | $35,838 |
Pursuant to asub-transfer agency agreement between DIFSC and BNY Mellon Investment Servicing (US) Inc. (BNYMIS), BNYMIS provides certainsub-transfer agency services to each Fund.Sub-transfer agency fees are paid by each Fund and are also included on the “Statements of operations” under “Dividend disbursing and transfer agent fees and expenses.” The fees that are calculated daily and paid as invoices are received on a monthly or quarterly basis.
Pursuant to a distribution agreement and distribution plan, each Fund pays DDLP, the distributor and an affiliate of DMC, an annual12b-1 fee of 0.25% of the average daily net assets of the Class A shares (except for DelawareTax-Free Pennsylvania Fund). The Board for DelawareTax-Free Pennsylvania Fund has adopted a formula for calculating12b-1 fees for the Fund’s Class A shares that went into effect on June 1, 1992. The Fund’s Class A shares are currently subject to a blended12b-1 fee equal to the sum of: (i) 0.10% of average daily net assets representing shares acquired prior to June 1, 1992, and (ii) 0.25% of average daily net assets representing shares acquired on or after June 1, 1992. All of the Fund’s Class A shareholders bear12b-1 fees at the same blended rate, currently 0.24% of average daily net assets, based on the formula described above. This method of calculating Class A12b-1 fees may be discontinued at the sole discretion of the Board. Prior to Dec. 28, 2018, the blended rate was 0.25% of average daily net assets. Each Fund pays 1.00% of the average daily net assets of the Class C shares. The fees are calculated daily and paid monthly. Institutional Class shares do not pay12b-1 fees.
As provided in the investment management agreement, each Fund bears a portion of the cost of certain resources shared with DMC, including the cost of internal personnel of DMC and/or its affiliates that provide legal, tax, and regulatory reporting services to each Fund. These amounts are included on the “Statements of operations” under “Legal fees.” For the year ended Aug. 31, 2019, each Fund was charged for internal legal, tax, and regulatory services provided by DMC and/or its affiliates’ employees as follows:
| Delaware Tax-Free Arizona Fund | Delaware Tax-Free California Fund | Delaware Tax-Free Colorado Fund | Delaware Tax-Free Idaho Fund | Delaware Tax-Free New York Fund | Delaware Tax-Free Pennsylvania Fund | |||||
| $2,132 | $2,686 | $5,679 | $2,757 | $2,376 | $12,010 |
152
Table of Contents
For the year ended Aug. 31, 2019, DDLP earned commissions on sales of Class A shares for each Fund as follows:
| Delaware Tax-Free Arizona Fund | Delaware Tax-Free California Fund | Delaware Tax-Free Colorado Fund | Delaware Tax-Free Idaho Fund | Delaware Tax-Free New York Fund | Delaware Tax-Free Pennsylvania Fund | |||||
| $4,476 | $2,763 | $21,203 | $11,604 | $3,059 | $26,285 |
For the year ended Aug. 31, 2019, DDLP received gross CDSC commissions on redemptions of each Fund’s Class A and Class C shares, respectively, and these commissions were entirely used to offset upfront commissions previously paid by DDLP to broker/dealers on sales of those shares. The amounts received were as follows:
| Delaware Tax-Free Arizona Fund | Delaware Tax-Free California Fund | Delaware Tax-Free Colorado Fund | Delaware Tax-Free Idaho Fund | Delaware Tax-Free New York Fund | Delaware Tax-Free Pennsylvania Fund | |||||||||||||||||||
Class A | $ — | $ — | $ — | $ — | $4,874 | $ — | ||||||||||||||||||
Class C | 510 | 15 | 285 | 1,378 | — | 395 | ||||||||||||||||||
Trustees’ fees include expenses accrued by each Fund for each Trustee’s retainer and meeting fees. Certain officers of DMC, DIFSC, and DDLP are officers and/or Trustees of the Trusts. These officers and Trustees are paid no compensation by the Funds.
In addition to the management fees and other expenses of a Fund, a Fund indirectly bears the investment management fees and other expenses of the investment companies (Underlying Funds) in which it invests. The amount of these fees and expenses incurred indirectly by a Fund will vary based upon the expense and fee levels of the Underlying Funds and the number of shares that are owned of the Underlying Funds at different times.
Cross trades for the year ended Aug. 31, 2019, were executed by the Funds pursuant to procedures adopted by the Board designed to ensure compliance with Rule17a-7 under the 1940 Act. Cross trading is the buying or selling of portfolio securities between funds of investment companies, or between a fund of an investment company and another entity, that are or could be considered affiliates by virtue of having a common investment advisor (or affiliated investment advisors), common directors/trustees and/or common officers. At their regularly scheduled meetings, the Boards review such transactions for compliance with the procedures adopted by the Boards. Pursuant to these procedures, for the year ended Aug. 31, 2019, the following Funds engaged in Rule17a-7 securities purchases and securities sales, as follows:
Delaware | Delaware | Delaware | Delaware Tax-Free Idaho Fund | Delaware New York Fund | Delaware Tax-Free | |||||||||||||||||||
Purchases | $ | 1,400,967 | $ | 900,455 | $1,155,444 | $ | 1,253,250 | $ | — | $ | 3,151,798 | |||||||||||||
Sales | 1,551,064 | 1,900,427 | 550,380 | 1,034,055 | 1,350,606 | 13,837,037 | ||||||||||||||||||
Net realized gain (loss) | — | — | — | 5,491 | — | 26,827 | ||||||||||||||||||
*The aggregate contractual waiver period covering this report is from Dec. 29, 2017 through Dec. 28, 2019. |
| |||||||||||||||||||||||
153
Table of Contents
| Notes to financial statements | ||
| Delaware Funds® by Macquarie state tax-free funds | ||
3. Investments
For the year ended Aug. 31, 2019, each Fund made purchases and sales of investment securities other than short-term investments as follows:
| Delaware Tax-Free Arizona Fund | Delaware Tax-Free California Fund | Delaware Tax-Free Colorado Fund | Delaware Tax-Free Idaho Fund | Delaware Tax-Free New York Fund | Delaware Tax-Free Pennsylvania Fund | |||||||||||||||||||
Purchases | $23,735,273 | $30,036,170 | $48,740,830 | $15,181,191 | $17,738,091 | $98,825,718 | ||||||||||||||||||
Sales | 22,987,067 | 33,075,508 | 31,445,240 | 13,617,174 | 19,648,535 | 107,417,766 | ||||||||||||||||||
The tax cost of investments includes adjustments to net unrealized appreciation (depreciation) which may not necessarily be final tax cost basis adjustments, but approximate the tax basis unrealized gains and losses that may be realized and distributed to shareholders. At Aug. 31, 2019, the cost and unrealized appreciation (depreciation) of investments for federal income tax purposes for each Fund were as follows:
| Delaware Tax-Free Arizona Fund | Delaware Tax-Free California Fund | Delaware Tax-Free Colorado Fund | Delaware Tax-Free Idaho Fund | Delaware Tax-Free New York Fund | Delaware Tax-Free Pennsylvania Fund | |||||||||||||||||||
Cost of investments | $ | 73,373,688 | $ | 92,710,307 | $ | 211,766,195 | $ | 95,920,040 | $ | 82,803,165 | $ | 415,130,691 | ||||||||||||
|
|
|
|
|
|
|
|
|
|
|
| |||||||||||||
Aggregate unrealized appreciation of investments | $ | 5,312,414 | $ | 7,565,814 | $ | 15,071,714 | $ | 6,106,191 | $ | 5,632,534 | $ | 33,956,424 | ||||||||||||
Aggregate unrealized depreciation of investments | — | (25,544 | ) | — | — | (14,794 | ) | — | ||||||||||||||||
|
|
|
|
|
|
|
|
|
|
|
| |||||||||||||
Net unrealized appreciation of investments | $ | 5,312,414 | $ | 7,540,270 | $ | 15,071,714 | $ | 6,106,191 | $ | 5,617,740 | $ | 33,956,424 | ||||||||||||
|
|
|
|
|
|
|
|
|
|
|
| |||||||||||||
US GAAP defines fair value as the price that each Fund would receive to sell an asset or pay to transfer a liability in an orderly transaction between market participants at the measurement date under current market conditions. A three-level hierarchy for fair value measurements has been established based upon the transparency of inputs to the valuation of an asset or liability. Inputs may be observable or unobservable and refer broadly to the assumptions that market participants would use in pricing the asset or liability. Observable inputs reflect the assumptions market participants would use in pricing the asset or liability based on market data obtained from sources independent of the reporting entity. Unobservable inputs reflect the reporting entity’s own assumptions about the assumptions that market participants would use in pricing the asset or liability based on the best information available under the circumstances. Each Fund’s investment in its entirety is assigned a level based upon the observability of the inputs which are significant to the overall valuation. The three-level hierarchy of inputs is summarized on the next page.
154
Table of Contents
| Level 1 – | Inputs are quoted prices in active markets for identical investments. (Examples: equity securities,open-end investment companies, futures contracts, and exchange-traded options contracts) | |
| Level 2 – | Other observable inputs, including, but not limited to: quoted prices for similar assets or liabilities in markets that are active, quoted prices for identical or similar assets or liabilities in markets that are not active, inputs other than quoted prices that are observable for the assets or liabilities (such as interest rates, yield curves, volatilities, prepayment speeds, loss severities, credit risks, and default rates) or other market-corroborated inputs. (Examples: debt securities, government securities, swap contracts, foreign currency exchange contracts, foreign securities utilizing international fair value pricing, broker-quoted securities, and fair valued securities) | |
| Level 3 – | Significant unobservable inputs, including each Fund’s own assumptions used to determine the fair value of investments. (Examples: broker-quoted securities and fair valued securities) | |
Level 3 investments are valued using significant unobservable inputs. Each Fund may also use an income-based valuation approach in which the anticipated future cash flows of the investment are discounted to calculate fair value. Discounts may also be applied due to the nature or duration of any restrictions on the disposition of the investments. Valuations may also be based upon current market prices of securities that are comparable in coupon, rating, maturity, and industry. The derived value of a Level 3 investment may not represent the value which is received upon disposition and this could impact the results of operations.
The following tables summarize the valuation of each Fund’s investments by fair value hierarchy levels as of Aug. 31, 2019:
Delaware Tax-Free Arizona Fund | |||||
Level 2 | |||||
Securities | |||||
Assets: | |||||
Municipal Bonds | $78,486,102 | ||||
Short-Term Investments | 200,000 | ||||
|
| ||||
Total Value of Securities | $78,686,102 | ||||
|
| ||||
| Delaware Tax-Free California Fund | |||||
Level 2 | |||||
Securities | |||||
Assets: | |||||
Municipal Bonds | $ | 99,550,577 | |||
Short-Term Investments | 700,000 | ||||
|
| ||||
Total Value of Securities | $ | 100,250,577 | |||
|
| ||||
155
Table of Contents
| Notes to financial statements | ||
| Delaware Funds® by Macquarie state tax-free funds | ||
3. Investments (continued)
DelawareTax-Free Colorado Fund | ||||||||||||
| Level 1 | Level 2 | Total | ||||||||||
Securities | ||||||||||||
Assets: | ||||||||||||
Municipal Bonds | $ | — | $ | 224,607,072 | $ | 224,607,072 | ||||||
Short-Term Investments1 | 540,837 | 1,690,000 | 2,230,837 | |||||||||
|
|
|
|
|
| |||||||
Total Value of Securities | $ | 540,837 | $ | 226,297,072 | $ | 226,837,909 | ||||||
|
|
|
|
|
| |||||||
DelawareTax-Free Idaho Fund | ||||||||||||
Level 1 | Level 2 | Total | ||||||||||
Securities | ||||||||||||
Assets: | ||||||||||||
Municipal Bonds | $ | — | $ | 101,689,203 | $ | 101,689,203 | ||||||
Short-Term Investments1 | 112,028 | 225,000 | 337,028 | |||||||||
|
|
|
|
|
| |||||||
Total Value of Securities | $ | 112,028 | $ | 101,914,203 | $ | 102,026,231 | ||||||
|
|
|
|
|
| |||||||
| Delaware Tax-Free New York Fund | |||||
Level 2 | |||||
Securities | |||||
Assets: | |||||
Municipal Bonds | $ | 87,820,905 | |||
Short-Term Investments | 600,000 | ||||
|
| ||||
Total Value of Securities | $ | 88,420,905 | |||
|
| ||||
| Delaware Tax-Free Pennsylvania Fund | |||||
Level 2 | |||||
Securities | |||||
Assets: | |||||
Municipal Bonds | $ | 447,487,115 | |||
Short-Term Investments | 1,600,000 | ||||
|
| ||||
Total Value of Securities | $ | 449,087,115 | |||
|
| ||||
156
Table of Contents
| 1 | Security type is valued across multiple levels. Level 1 investments representopen-end investment company investments while Level 2 investments represent matrix-priced investments. The amounts attributed to Level 1 investments and Level 2 investments represent the following percentages of the total market value of this security type for the Funds: |
Short-Term Investments | Delaware Tax-Free Colorado Fund | Delaware Tax-Free Idaho Fund | ||||||||
Level 1 | 24.24 | % | 33.24 | % | ||||||
Level 2 | 75.76 | % | 66.76 | % | ||||||
|
|
|
| |||||||
Total | 100.00 | % | 100.00 | % | ||||||
|
|
|
| |||||||
During the year ended Aug. 31, 2019, there were no transfers between Level 1 investments, Level 2 investments, or Level 3 investments that had a significant impact to each Fund. Each Fund’s policy is to recognize transfers between levels based on fair value at the beginning of the reporting period.
A reconciliation of Level 3 investments is presented when each Fund has a significant amount of Level 3 investments at the beginning, interim, or end of the period in relation to the Fund’s net assets. During the year ended Aug. 31, 2019, there were no Level 3 investments.
4. Dividend and Distribution Information
Income and long-term capital gain distributions are determined in accordance with federal income tax regulations, which may differ from US GAAP. Additionally, distributions from net short-term gains on sales of investment securities are treated as ordinary income for federal income tax purposes. The tax character of dividends and distributions paid during the years ended Aug. 31, 2019 and 2018 were as follows:
| Delaware Tax-Free Arizona Fund | Delaware Tax-Free California Fund | Delaware Tax-Free Colorado Fund | Delaware Tax-Free Idaho Fund | Delaware Tax-Free New York Fund | Delaware Tax-Free Pennsylvania Fund | |||||||||||||||||||||||||
Year ended 8/31/19 | ||||||||||||||||||||||||||||||
Tax-exempt income | $ | 2,453,828 | $ | 3,230,687 | $ | 6,757,874 | $ | 3,015,084 | $ | 2,626,610 | $ | 15,062,570 | ||||||||||||||||||
Ordinary income | — | — | 909 | 8 | — | — | ||||||||||||||||||||||||
Long-term capital gains | — | 141,274 | — | — | — | — | ||||||||||||||||||||||||
|
|
|
|
|
|
|
|
|
|
|
| |||||||||||||||||||
Total | $ | 2,453,828 | $ | 3,371,961 | $ | 6,758,783 | $ | 3,015,092 | $ | 2,626,610 | $ | 15,062,570 | ||||||||||||||||||
|
|
|
|
|
|
|
|
|
|
|
| |||||||||||||||||||
Year ended 8/31/18 | ||||||||||||||||||||||||||||||
Tax-exempt income | $ | 2,479,414 | $ | 3,234,507 | $ | 6,719,815 | $ | 3,008,868 | $ | 2,707,774 | $ | 15,788,289 | ||||||||||||||||||
Ordinary income | — | 11,179 | 860 | — | 6,256 | — | ||||||||||||||||||||||||
Long-term capital gains | — | — | — | — | — | 286,814 | ||||||||||||||||||||||||
|
|
|
|
|
|
|
|
|
|
|
| |||||||||||||||||||
Total | $ | 2,479,414 | $ | 3,245,686 | $ | 6,720,675 | $ | 3,008,868 | $ | 2,714,030 | $ | 16,075,103 | ||||||||||||||||||
|
|
|
|
|
|
|
|
|
|
|
| |||||||||||||||||||
157
Table of Contents
| Notes to financial statements | ||
| Delaware Funds® by Macquarie state tax-free funds | ||
5. Components of Net Assets on a Tax Basis
As of Aug. 31, 2019, the components of net assets on a tax basis were as follows:
| Delaware Tax-Free Arizona Fund | Delaware Tax-Free California Fund | Delaware Tax-Free Colorado Fund | Delaware Tax-Free Idaho Fund | Delaware Tax-Free New York Fund | Delaware Tax-Free Pennsylvania Fund | |||||||||||||||||||||||||
Shares of beneficial interest | $ | 74,165,118 | $ | 90,178,416 | $ | 207,590,779 | $ | 101,913,843 | $ | 83,233,158 | $ | 412,981,204 | ||||||||||||||||||
Undistributedtax-exempt income | 76,750 | 95,985 | 514,902 | 58,046 | 62,922 | 225,313 | ||||||||||||||||||||||||
Undistributed ordinary income | — | 130,030 | — | — | — | — | ||||||||||||||||||||||||
Undistributed long-term capital gains | — | 532,597 | — | — | 29,990 | 2,442,276 | ||||||||||||||||||||||||
Distributions payable | (56,869 | ) | (77,709 | ) | (162,344 | ) | (74,755 | ) | (63,572 | ) | (334,278 | ) | ||||||||||||||||||
Capital loss carryforwards | (228,307 | ) | — | (3,198,170 | ) | (4,491,234 | ) | — | — | |||||||||||||||||||||
Unrealized appreciation of investments | 5,312,414 | 7,540,270 | 15,071,714 | 6,106,191 | 5,617,740 | 33,956,424 | ||||||||||||||||||||||||
|
|
|
|
|
|
|
|
|
|
|
| |||||||||||||||||||
Net assets | $ | 79,269,106 | $ | 98,399,589 | $ | 219,816,881 | $ | 103,512,091 | $ | 88,880,238 | $ | 449,270,939 | ||||||||||||||||||
|
|
|
|
|
|
|
|
|
|
|
| |||||||||||||||||||
The differences between book basis and tax basis components of net assets are primarily attributable to tax treatment of market discount and premium on certain debt instruments and dividends payable, as applicable.
For federal income tax purposes, capital loss carryforwards may be carried forward and applied against future capital gains. At Aug. 31, 2019, the Funds utilized capital loss carryforwards as follows:
| Delaware Tax-Free Arizona Fund | Delaware Tax-Free Colorado Fund | Delaware Tax-Free Idaho Fund | Delaware Tax-Free New York Fund | |||
| $394,053 | $681,021 | $124,933 | $549,357 |
158
Table of Contents
Under the Regulated Investment Company Modernization Act of 2010, net capital losses recognized for tax years beginning after Dec. 22, 2010 may be carried forward indefinitely, and their character is retained as short-term and/or long-term losses. At Aug. 31, 2019, capital loss carryforwards available to offset future realized capital gains, are as follows:
Loss carryforward character | ||||||||||||
| Short-term | Long-term | Total | ||||||||||
DelawareTax-Free Arizona Fund | $ | 95,504 | $ | 132,803 | $ | 228,307 | ||||||
DelawareTax-Free Colorado Fund | 3,090,657 | 107,513 | 3,198,170 | |||||||||
DelawareTax-Free Idaho Fund | 1,825,182 | 2,666,052 | 4,491,234 | |||||||||
At Aug. 31, 2019, there were no capital loss carryforwards for DelawareTax-Free California Fund, DelawareTax-Free New York Fund, and DelawareTax-Free Pennsylvania Fund.
6. Capital Shares
Transactions in capital shares were as follows:
| DelawareTax-Free Arizona Fund | DelawareTax-Free California Fund | DelawareTax-Free Colorado Fund | ||||||||||||||||||||||
| Year ended | Year ended | Year ended | ||||||||||||||||||||||
| 8/31/19 | 8/31/18 | 8/31/19 | 8/31/18 | 8/31/19 | 8/31/18 | |||||||||||||||||||
Shares sold: | ||||||||||||||||||||||||
Class A | 262,361 | 401,414 | 246,328 | 481,529 | 946,719 | 1,516,496 | ||||||||||||||||||
Class C | 42,564 | 37,968 | 135,650 | 92,304 | 115,864 | 154,631 | ||||||||||||||||||
Institutional Class | 589,377 | 484,339 | 2,089,874 | 976,452 | 1,931,423 | 1,145,931 | ||||||||||||||||||
Shares issued upon reinvestment of dividends and distributions: |
| |||||||||||||||||||||||
Class A | 139,629 | 145,750 | 123,662 | 128,458 | 430,740 | 426,365 | ||||||||||||||||||
Class C | 6,385 | 9,402 | 22,436 | 28,460 | 22,232 | 31,641 | ||||||||||||||||||
Institutional Class | 34,201 | 23,553 | 78,502 | 56,412 | 92,420 | 65,726 | ||||||||||||||||||
|
|
|
|
|
|
|
|
|
|
|
| |||||||||||||
| 1,074,517 | 1,102,426 | 2,696,452 | 1,763,615 | 3,539,398 | 3,340,790 | |||||||||||||||||||
|
|
|
|
|
|
|
|
|
|
|
| |||||||||||||
Shares redeemed: | ||||||||||||||||||||||||
Class A | (735,173 | ) | (735,408 | ) | (1,431,252 | ) | (581,599 | ) | (1,685,496 | ) | (1,750,927 | ) | ||||||||||||
Class C | (61,785 | ) | (223,437 | ) | (319,827 | ) | (377,386 | ) | (224,664 | ) | (611,405 | ) | ||||||||||||
Institutional Class | (313,916 | ) | (226,311 | ) | (1,346,002 | ) | (582,597 | ) | (823,168 | ) | (480,166 | ) | ||||||||||||
|
|
|
|
|
|
|
|
|
|
|
| |||||||||||||
| (1,110,874 | ) | (1,185,156 | ) | (3,097,081 | ) | (1,541,582 | ) | (2,733,328 | ) | (2,842,498 | ) | |||||||||||||
|
|
|
|
|
|
|
|
|
|
|
| |||||||||||||
Net increase (decrease) | (36,357 | ) | (82,730 | ) | (400,629 | ) | 222,033 | 806,070 | 498,292 | |||||||||||||||
|
|
|
|
|
|
|
|
|
|
|
| |||||||||||||
159
Table of Contents
| Notes to financial statements | ||
| Delaware Funds® by Macquarie statetax-free funds | ||
6. Capital Shares (continued)
| DelawareTax-Free Idaho Fund | DelawareTax-Free New York Fund | DelawareTax-Free Pennsylvania Fund | ||||||||||||||||||||||
| Year ended | Year ended | Year ended | ||||||||||||||||||||||
| 8/31/19 | 8/31/18 | 8/31/19 | 8/31/18 | 8/31/19 | 8/31/18 | |||||||||||||||||||
Shares sold: | ||||||||||||||||||||||||
Class A | 459,129 | 491,709 | 591,017 | 446,716 | 3,832,279 | 3,540,085 | ||||||||||||||||||
Class C | 86,983 | 116,633 | 133,092 | 196,498 | 371,898 | 257,821 | ||||||||||||||||||
Institutional Class | 1,875,734 | 1,301,911 | 1,449,261 | 762,592 | 2,517,108 | 2,068,244 | ||||||||||||||||||
Shares issued upon reinvestment of dividends and distributions: |
| |||||||||||||||||||||||
Class A | 143,675 | 146,253 | 88,863 | 98,908 | 1,397,399 | 1,467,605 | ||||||||||||||||||
Class C | 30,006 | 45,404 | 20,484 | 26,286 | 81,414 | 104,907 | ||||||||||||||||||
Institutional Class | 69,543 | 44,060 | 93,585 | 84,790 | 170,595 | 154,540 | ||||||||||||||||||
|
|
|
|
|
|
|
|
|
|
|
| |||||||||||||
| 2,665,070 | 2,145,970 | 2,376,302 | 1,615,790 | 8,370,693 | 7,593,202 | |||||||||||||||||||
|
|
|
|
|
|
|
|
|
|
|
| |||||||||||||
Shares redeemed: | ||||||||||||||||||||||||
Class A | (1,140,741 | ) | (1,248,164 | ) | (1,003,925 | ) | (679,446 | ) | (7,228,804 | ) | (6,343,711 | ) | ||||||||||||
Class C | (581,720 | ) | (1,149,919 | ) | (337,176 | ) | (374,553 | ) | (742,301 | ) | (1,126,446 | ) | ||||||||||||
Institutional Class | (828,173 | ) | (497,691 | ) | (1,133,073 | ) | (708,326 | ) | (2,187,569 | ) | (1,096,801 | ) | ||||||||||||
|
|
|
|
|
|
|
|
|
|
|
| |||||||||||||
| (2,550,634 | ) | (2,895,774 | ) | (2,474,174 | ) | (1,762,325 | ) | (10,158,674 | ) | (8,566,958 | ) | |||||||||||||
|
|
|
|
|
|
|
|
|
|
|
| |||||||||||||
Net increase (decrease) | 114,436 | (749,804 | ) | (97,872 | ) | (146,535 | ) | (1,787,981 | ) | (973,756 | ) | |||||||||||||
|
|
|
|
|
|
|
|
|
|
|
| |||||||||||||
Certain shareholders may exchange shares of one class for shares of another class in the same Fund. These exchange transactions are included as subscriptions and redemptions in the tables on the previous page and the “Statements of changes in net assets.” For the years ended Aug. 31, 2019 and 2018, the Funds had the following exchange transactions:
| Year ended | ||||||||||||||||||||
| 8/31/19 | ||||||||||||||||||||
| Exchange Redemptions | Exchange Subscriptions | |||||||||||||||||||
| Class A Shares | Class C Shares | Class A Shares |
Institutional Shares | Value | ||||||||||||||||
DelawareTax-Free California Fund | 94,289 | 4,281 | — | 98,582 | $ | 1,213,599 | ||||||||||||||
DelawareTax-Free Colorado Fund | 10,452 | 5,036 | 4,754 | 10,763 | 172,380 | |||||||||||||||
DelawareTax-Free Idaho Fund | 19,800 | — | — | 19,815 | 226,175 | |||||||||||||||
DelawareTax-Free New York Fund | 6,590 | — | — | 6,591 | 73,949 | |||||||||||||||
DelawareTax-Free Pennsylvania Fund | 83,022 | 15,097 | 15,121 | 83,103 | 778,069 | |||||||||||||||
160
Table of Contents
| Year ended | ||||||||||||||||||||
| 8/31/18 | ||||||||||||||||||||
| Exchange Redemptions | Exchange Subscriptions | |||||||||||||||||||
| Class A Shares | Class C Shares | Class A Shares |
Institutional Shares | Value | ||||||||||||||||
DelawareTax-Free Arizona Fund | — | 35,940 | 36,057 | — | $ | 405,639 | ||||||||||||||
DelawareTax-Free California Fund | — | 31,170 | 31,265 | — | 374,556 | |||||||||||||||
DelawareTax-Free Colorado Fund | 25,842 | 65,040 | 65,280 | 25,862 | 1,012,424 | |||||||||||||||
DelawareTax-Free Idaho Fund | 70,345 | 75,131 | 75,134 | 70,345 | 1,632,222 | |||||||||||||||
DelawareTax-Free New York Fund | — | 2,096 | 2,095 | — | 23,755 | |||||||||||||||
DelawareTax-Free Pennsylvania Fund | 234,332 | 340,876 | 331,960 | 243,871 | 4,583,905 | |||||||||||||||
DelawareTax-Free Arizona Fund did not have any exchange transactions for the year ended Aug. 31, 2019.
7. Line of Credit
Each Fund, along with certain other funds in the Delaware Funds (Participants), was a participant in a revolving line of credit intended to be used for temporary or emergency purposes as an additional source of liquidity to fund redemptions of investor shares. The revolving line of credit available was reduced from $155,000,000 to $130,000,000 on Sept. 6, 2018. Under the agreement, the Participants were charged an annual commitment fee of 0.15%, which was allocated across the Participants based on a weighted average of the respective net assets of each Participant. The Participants were permitted to borrow up to a maximum ofone-third of their net assets under the agreement. Each Participant was individually, and not jointly, liable for its particular advances, if any, under the line of credit. The line of credit available under the agreement expired on Nov. 5, 2018.
On Nov. 5, 2018, the Participants entered into an amendment to the agreement for a $190,000,000 revolving line of credit. The revolving line of credit available was increased to $220,000,000 on Nov. 29, 2018. The revolving line of credit is to be used as described above and operates in substantially the same manner as the original agreement. The line of credit available under the agreement expires on Nov. 4, 2019.
The Funds had no amounts outstanding as of Aug. 31, 2019, or at any time during the year then ended.
8. Geographic, Credit, and Market Risks
When interest rates rise, fixed income securities (i.e. debt obligations) generally will decline in value. These declines in value are greater for fixed income securities with longer maturities or durations.
161
Table of Contents
| Notes to financial statements | ||
| Delaware Funds® by Macquarie statetax-free funds | ||
8. Geographic, Credit, and Market Risks (continued)
The Funds concentrate their investments in securities issued by each corresponding state’s municipalities. The Funds invest primarily in a specific state and may be subject to geographic concentration risk. In addition, the Funds have the flexibility to invest in issuers in US territories and possessions such as the Commonwealth of Puerto Rico, the US Virgin Islands, and Guam whose bonds are also free of federal and individual state income taxes. The value of the Funds’ investments may be adversely affected by new legislation within the states or US territories, regional or local economic conditions, and differing levels of supply and demand for municipal bonds. Many municipalities insure repayment for their obligations. Although bond insurance reduces the risk of loss due to default by an issuer, such bonds remain subject to the risk that value may fluctuate for other reasons and there is no certainty that the insurance company will meet its obligations. A real or perceived decline in creditworthiness of a bond insurer can have an adverse impact on the value of insured bonds held in each Fund.
At Aug. 31, 2019, the percentages of each Fund’s net assets insured by bond insurers are listed below and these securities have been identified on the “Schedules of investments.”
| Delaware Tax-Free Arizona Fund | Delaware Tax-Free California Fund | Delaware Tax-Free Colorado Fund | Delaware Tax-Free Idaho Fund | Delaware Tax-Free New York Fund | Delaware Tax-Free Pennsylvania Fund | |||||||
American Capital Access | 1.26% | — | — | — | — | — | ||||||
Assured Guaranty Corporation | — | — | 1.04% | — | — | 1.13% | ||||||
Assured Guaranty Municipal Corporation | 1.51% | 1.49% | 4.64% | 8.47% | 0.04% | 3.88% | ||||||
AMBAC Assurance Corporation | 1.24% | — | — | — | — | — | ||||||
Build America Mutual Assurance | — | 0.64% | 1.12% | — | 1.52% | 0.63% | ||||||
National Public Finance Guarantee Corporation | — | 0.92% | — | — | — | — | ||||||
|
|
|
|
|
| |||||||
| 4.01% | 3.05% | 6.80% | 8.47% | 1.56% | 5.64% | |||||||
|
|
|
|
|
|
Each Fund invests a portion of its assets in high yield fixed income securities, which are securities rated lower thanBBB- by Standard & Poor’s Financial Services LLC (S&P), lower than Baa3 by Moody’s Investors Service, Inc. (Moody’s), or similarly rated by another nationally recognized statistical rating organization. Investments in these higher yielding securities are generally accompanied by a greater degree of credit risk than higher rated securities. Additionally, lower rated securities may be more susceptible to adverse economic and competitive industry conditions than investment grade securities.
Each Fund invests in certain obligations that may have liquidity protection designed to ensure that the receipt of payments due on the underlying security is timely. Such protection may be provided through
162
Table of Contents
guarantees, insurance policies, or letters of credit obtained by the issuer or sponsor through third parties, through various means of structuring the transaction, or through a combination of such approaches. Each Fund will not pay any additional fees for such credit support, although the existence of credit support may increase the price of a security.
Each Fund may invest in advanced refunded bonds, escrow secured bonds, or defeased bonds. Under current federal tax laws and regulations, state and local government borrowers are permitted to refinance outstanding bonds by issuing new bonds. The issuer refinances the outstanding debt to either reduce interest costs or to remove or alter restrictive covenants imposed by the bonds being refinanced. A refunding transaction where the municipal securities are being refunded within 90 days from the issuance of the refunding issue is known as a “current refunding.” “Advance refunded bonds” are bonds in which the refunded bond issue remains outstanding for more than 90 days following the issuance of the refunding issue. In an advance refunding, the issuer will use the proceeds of a new bond issue to purchase high grade interest bearing debt securities, which are then deposited in an irrevocable escrow account held by an escrow agent to secure all future payments of principal and interest and bond premium of the advance refunded bond. Bonds are “escrowed to maturity” when the proceeds of the refunding issue are deposited in an escrow account for investment sufficient to pay all of the principal and interest on the original interest payment and maturity dates.
Bonds are considered“pre-refunded” when the refunding issue’s proceeds are escrowed only until a permitted call date or dates on the refunded issue with the refunded issue being redeemed at the time, including any required premium. Bonds become “defeased” when the rights and interests of the bondholders and of their lien on the pledged revenues or other security under the terms of the bond contract are substituted with an alternative source of revenues (the escrow securities) sufficient to meet payments of principal and interest to maturity or to the first call dates. Escrowed secured bonds will often receive a rating of AAA from Moody’s, S&P, and/or Fitch Ratings due to the strong credit quality of the escrow securities and the irrevocable nature of the escrow deposit agreement.
Each Fund may invest up to 15% of its net assets in illiquid securities, which may include securities with contractual restrictions on resale, securities exempt from registration under Rule 144A promulgated under the Securities Act of 1933, as amended, and other securities which may not be readily marketable. The relative illiquidity of these securities may impair each Fund from disposing of them in a timely manner and at a fair price when it is necessary or desirable to do so. While maintaining oversight, each Board has delegated to DMC, theday-to-day functions of determining whether individual securities are liquid for purposes of each Fund’s limitation on investments in illiquid securities. Securities eligible for resale pursuant to Rule 144A, which are determined to be liquid, are not subject to each Fund’s 15% limit on investments in illiquid securities. Rule 144A securities have been identified on the “Schedules of investments.” Restricted securities are valued pursuant to the security valuation procedures described in Note 1.
9. Contractual Obligations
Each Fund enters into contracts in the normal course of business that contain a variety of indemnifications. Each Fund’s maximum exposure under these arrangements is unknown. However, each Fund has not had prior claims or losses pursuant to these contracts. Management has reviewed the Funds’ existing contracts and expects the risk of loss to be remote.
163
Table of Contents
Notes to financial statements
Delaware Funds® by Macquarie statetax-free funds
10. Recent Accounting Pronouncements
In March 2017, the FASB issued an Accounting Standards Update (ASU), ASU2017-08, Receivables – Nonrefundable Fees and Other Costs (Subtopic310-20), Premium Amortization on Purchased Callable Debt Securities which amends the amortization period for certain callable debt securities purchased at a premium, shortening such period to the earliest call date. The ASU2017-08 does not require any accounting change for debt securities held at a discount; the discount continues to be amortized to maturity. The ASU2017-08 is effective for fiscal years, and interim periods within those fiscal years, beginning after Dec. 15, 2018. At this time, management is evaluating the implications of these changes on the financial statements.
In August 2018, the FASB issued an ASU2018-13, which changes certain fair value measurement disclosure requirements. The ASU2018-13, in addition to other modifications and additions, removes the requirement to disclose the amount and reasons for transfers between Level 1 and Level 2 of the fair value hierarchy, the policy for the timing of transfers between levels and the valuation process for Level 3 fair value measurements. The ASU2018-13 is effective for fiscal years, and interim periods within those fiscal years, beginning after Dec. 15, 2019. At this time, management is evaluating the implications of these changes on the financial statements.
In August 2018, the Securities and Exchange Commission (SEC) adopted amendments to RegulationS-X to update and simplify the disclosure requirements for registered investment companies by eliminating requirements that are redundant or duplicative of US GAAP requirements or other SEC disclosure requirements. The new amendments require the presentation of the total, rather than the components, of distributable earnings on the “Statements of assets and liabilities” and the total, rather than the components, of dividends from net investment income and distributions from net realized gains on the “Statements of changes in net assets.” The amendments also removed the requirement for the parenthetical disclosure of undistributed net investment income on the “Statements of changes in net assets” and certain tax adjustments that were reflected in the “Notes to financial statements.” All of these have been reflected in the Funds’ financial statements.
11. Subsequent Events
Management has determined that no material events or transactions occurred subsequent to Aug. 31, 2019, that would require recognition or disclosure in the Funds’ financial statements.
164
Table of Contents
registered public accounting firm
To the Board of Trustees of Voyageur Insured Funds, Voyageur Mutual Funds, Voyageur Mutual Funds II and Delaware Group® StateTax-Free Income Trust and Shareholders of DelawareTax-Free Arizona Fund, DelawareTax-Free California Fund, DelawareTax-Free Idaho Fund, DelawareTax-Free New York Fund, DelawareTax-Free Colorado Fund and DelawareTax-Free Pennsylvania Fund
Opinions on the Financial Statements
We have audited the accompanying statements of assets and liabilities, including the schedules of investments, of DelawareTax-Free Arizona Fund (constituting Voyageur Insured Funds), DelawareTax-Free California Fund, DelawareTax-Free Idaho Fund, DelawareTax-Free New York Fund (three of the funds constituting Voyageur Mutual Funds), DelawareTax-Free Colorado Fund (constituting Voyageur Mutual Funds II) and DelawareTax-Free Pennsylvania Fund (constituting Delaware Group® StateTax-Free Income Trust) (hereafter collectively referred to as the “Funds”) as of August 31, 2019, the related statements of operations for the year ended August 31, 2019, the statements of changes in net assets for each of the two years in the period ended August 31, 2019, including the related notes, and the financial highlights for each of the five years in the period ended August 31, 2019 (collectively referred to as the “financial statements”). In our opinion, the financial statements present fairly, in all material respects, the financial position of the Funds as of August 31, 2019, the results of each of their operations for the year then ended, the changes in each of their net assets for each of the two years in the period ended August 31, 2019 and each of the financial highlights for each of the five years in the period ended August 31, 2019 in conformity with accounting principles generally accepted in the United States of America.
Basis for Opinions
These financial statements are the responsibility of the Funds’ management. Our responsibility is to express an opinion on the Funds’ financial statements based on our audits. We are a public accounting firm registered with the Public Company Accounting Oversight Board (United States) (PCAOB) and are required to be independent with respect to the Funds in accordance with the U.S. federal securities laws and the applicable rules and regulations of the Securities and Exchange Commission and the PCAOB.
We conducted our audits of these financial statements in accordance with the standards of the PCAOB. Those standards require that we plan and perform the audit to obtain reasonable assurance about whether the financial statements are free of material misstatement, whether due to error or fraud.
Our audits included performing procedures to assess the risks of material misstatement of the financial statements, whether due to error or fraud, and performing procedures that respond to those risks. Such procedures included examining, on a test basis, evidence regarding the amounts and disclosures in the financial statements. Our audits also included evaluating the accounting principles used and significant estimates made by management, as well as evaluating the overall presentation of the financial statements. Our procedures included confirmation of securities owned as of August 31, 2019 by correspondence with the custodian, transfer agent and brokers; when replies were not received from brokers, we performed other auditing procedures. We believe that our audits provide a reasonable basis for our opinions.
/s/PricewaterhouseCoopers LLP
Philadelphia, Pennsylvania
October 16, 2019
We have served as the auditor of one or more investment companies in Delaware Funds® by Macquarie since 2010.
165
Table of Contents
Other Fund information (Unaudited)
Delaware Funds® by Macquarie statetax-free funds
Tax Information
The information set forth below is for the Funds’ fiscal year as required by federal income tax laws. Shareholders, however, must report distributions on a calendar year basis for income tax purposes, which may include distributions for portions of two fiscal years of the Funds. Accordingly, the information needed by shareholders for income tax purposes will be sent to them in January of each year. Please consult your tax advisor for proper treatment of this information.
All disclosures are based on financial information available as of the date of this annual report and, accordingly are subject to change. For any and all items requiring reporting, it is the intention of each Fund to report the maximum amount permitted under the Internal Revenue Code and the regulations thereunder.
For the fiscal year ended Aug. 31, 2019, each Fund reports distributions paid during the year as follows:
| (A) Long-Term Capital Gains Distributions (Tax Basis) | (B) Ordinary Income Distributions (Tax Basis) | (C) Tax-Exempt Income Distributions (Tax Basis) | Total Distributions (Tax Basis) | |||||
DelawareTax-Free Arizona Fund | — | — | 100.00% | 100.00% | ||||
DelawareTax-Free California Fund | 4.19% | — | 95.81% | 100.00% | ||||
DelawareTax-Free Colorado Fund | — | 0.01% | 99.99% | 100.00% | ||||
DelawareTax-Free Idaho Fund | — | — | 100.00% | 100.00% | ||||
DelawareTax-Free New York Fund | — | — | 100.00% | 100.00% | ||||
DelawareTax-Free Pennsylvania Fund | — | — | 100.00% | 100.00% |
(A), (B) and (C) are based on a percentage of each Fund’s total distributions.
Board consideration of Investment Advisory agreements for DelawareTax-Free Arizona Fund, DelawareTax-Free California Fund, DelawareTax-Free Colorado Fund, DelawareTax-Free Idaho Fund, DelawareTax-Free New York Fund, and DelawareTax-Free Pennsylvania Fund at a meeting held on August21-22, 2019
At a meeting held on Aug.21-22, 2019 (the “Annual Meeting”), the Board of Trustees (the “Board”), including a majority of disinterested or independent Trustees, approved the renewal of the Investment Advisory Agreements for DelawareTax-Free Arizona Fund, DelawareTax-Free California Fund, DelawareTax-Free Colorado Fund, DelawareTax-Free Idaho Fund, DelawareTax-Free New York Fund, and DelawareTax-Free Pennsylvania Fund (each, a “Fund” and together, the “Funds”). In making its decision, the Board considered information furnished at regular quarterly Board meetings, including
166
Table of Contents
reports detailing Fund performance, investment strategies, and expenses, as well as information prepared specifically in connection with the renewal of the investment advisory contract. Information furnished specifically in connection with the renewal of the Investment Management Agreement with Delaware Management Company (“DMC”), a series of Macquarie Investment Management Business Trust (“MIMBT”), included materials provided by DMC and its affiliates (collectively, “Macquarie Investment Management”) concerning, among other things, the nature, extent, and quality of services provided to the Funds; the costs of such services to the Funds; economies of scale; and the investment manager’s financial condition and profitability. In addition, in connection with the Annual Meeting, materials were provided to the Trustees in May 2019, including reports provided by Broadridge Financial Solutions (“Broadridge”). The Broadridge reports compared each Fund’s investment performance and expenses with those of other comparable mutual funds. The Independent Trustees reviewed and discussed the Broadridge reports with independent legal counsel to the Independent Trustees. In addition to the information noted above, the Board also requested and received information regarding DMC’s policy with respect to advisory fee levels and its breakpoint philosophy; the structure of portfolio manager compensation; comparative client fee information; and any constraints or limitations on the availability of securities for certain investment styles, which had in the past year inhibited, or which were likely in the future to inhibit, the investment manager’s ability to invest fully in accordance with Fund policies.
In considering information relating to the approval of each Fund’s advisory agreement, the Independent Trustees received assistance and advice from and met separately with independent legal counsel to the Independent Trustees and also received assistance and advice from an experienced and knowledgeable independent fund consultant, JDL Consultants, LLC (“JDL”). Although the Board gave attention to all information furnished, the following discussion identifies, under separate headings, the primary factors taken into account by the Board during its contract renewal considerations.
Nature, extent, and quality of services.The Board considered the services provided by DMC to the Funds and their shareholders. In reviewing the nature, extent, and quality of services, the Board considered reports furnished to it throughout the year, which covered matters such as the relative performance of the Funds; compliance of portfolio managers with the investment policies, strategies, and restrictions for the Funds; compliance by DMC and Delaware Distributors, L.P. (together, “Management”) personnel with the Code of Ethics adopted throughout the Delaware Funds® by Macquarie (“Delaware Funds”); and adherence to fair value pricing procedures as established by the Board. The Board was pleased with the current staffing of DMC and the emphasis placed on research in the investment process. The Board recognized DMC’s receipt of certain favorable industry distinctions during the past several years. The Board gave favorable consideration to DMC’s efforts to control expenses while maintaining service levels committed to Fund matters. The Board also noted the benefits provided to Fund shareholders through (a) each shareholder’s ability to: (i) exchange an investment in one Delaware Fund for the same class of shares in another Delaware Fund without a sales charge, or (ii) reinvest Fund dividends into additional shares of the Fund or into additional shares of other Delaware Funds, and (b) the privilege to combine holdings in other Delaware Funds to obtain a reduced sales charge. The Board was satisfied with the nature, extent, and quality of the overall services provided by DMC.
167
Table of Contents
| Other Fund information (Unaudited) | ||
| Delaware Funds® by Macquarie statetax-free funds | ||
Board consideration of Investment Advisory agreements for DelawareTax-Free Arizona Fund, DelawareTax-Free California Fund, DelawareTax-Free Colorado Fund, DelawareTax-Free Idaho Fund, DelawareTax-Free New York Fund, and DelawareTax-Free Pennsylvania Fund at a meeting held on August21-22, 2019 (continued)
Investment performance.The Board placed significant emphasis on the investment performance of the Funds in view of the importance of investment performance to shareholders. Although the Board considered performance reports and discussions with portfolio managers at Investment Committee meetings throughout the year, the Board gave particular weight to the Broadridge reports furnished for the Annual Meeting. The Broadridge reports prepared for each Fund showed the investment performance of its Class A shares in comparison to a group of similar funds as selected by Broadridge (the “Performance Universe”). A fund with the best performance ranked first, and a fund with the poorest performance ranked last. The highest/best performing 25% of funds in the Performance Universe make up the first quartile; the next 25%, the second quartile; the next 25%, the third quartile; and the poorest/worst performing 25% of funds in the Performance Universe make up the fourth quartile. Comparative annualized performance for each Fund was shown for the past1-,3-,5-, and10-year periods, to the extent applicable, ended Jan. 31, 2019. The Board’s objective is that each Fund’s performance for the1-,3-, and5-year periods be at or above the median of its Performance Universe.
DelawareTax-Free Arizona Fund – The Performance Universe for the Fund consisted of the Fund and all retail and institutional “other states” municipal debt funds as selected by Broadridge. The Broadridge report comparison showed that the Fund’s total return for the1-year period was in the third quartile of its Performance Universe. The report further showed that the Fund’s total return for the3- and5-year periods was in the first quartile of its Performance Universe and the Fund’s total return for the10-year period was in the second quartile of its Performance Universe. The Board was satisfied with performance.
DelawareTax-Free California Fund – The Performance Universe for the Fund consisted of the Fund and all retail and institutional California municipal debt funds as selected by Broadridge. The Broadridge report comparison showed that the Fund’s total return for the1-year period was in the third quartile of its Performance Universe. The report further showed that the Fund’s total return for the3- and5-year periods was in the second quartile of its Performance Universe and the Fund’s total return for the10-year period was in the first quartile of its Performance Universe. The Board was satisfied with performance.
DelawareTax-Free Colorado Fund – The Performance Universe for the Fund consisted of the Fund and all retail and institutional “other states” municipal debt funds as selected by Broadridge. The Broadridge report comparison showed that the Fund’s total return for the1-year period was in the third quartile of its Performance Universe. The report further showed that the Fund’s total return for the3-,5-, and10-year periods was in the first quartile of its Performance Universe. The Board was satisfied with performance.
DelawareTax-Free Idaho Fund – The Performance Universe for the Fund consisted of the Fund and all retail and institutional “other states” municipal debt funds as selected by Broadridge. The Broadridge report comparison showed that the Fund’s total return for the1- and10-year periods was in the third
168
Table of Contents
quartile of its Performance Universe. The report further showed that the Fund’s total return for the3- and5-year periods was in the second quartile of its Performance Universe. The Board was satisfied with performance.
DelawareTax-Free New York Fund – The Performance Universe for the Fund consisted of the Fund and all retail and institutional New York municipal debt funds as selected by Broadridge. The Broadridge report comparison showed that the Fund’s total return for the1-year period was in the third quartile of its Performance Universe. The report further showed that the Fund’s total return for the3- and10-year periods was in the second quartile of its Performance Universe and the Fund’s total return for the5-year period was in the first quartile of its Performance Universe. The Board was satisfied with performance.
DelawareTax-Free Pennsylvania Fund – The Performance Universe for the Fund consisted of the Fund and all retail and institutional Pennsylvania municipal debt funds as selected by Broadridge. The Broadridge report comparison showed that the Fund’s total return for the1-year period was in the third quartile of its Performance Universe. The report further showed that the Fund’s total return for the3-,5-, and10-year periods was in the second quartile of its Performance Universe. The Board was satisfied with performance.
Comparative expenses.The Board considered expense data for the Delaware Funds. Management provided the Board with information on pricing levels and fee structures for each Fund as of its most recently completed fiscal year. The Board also focused on the comparative analysis of effective management fees and total expense ratios of each Fund versus effective management fees and total expense ratios of a group of similar funds as selected by Broadridge (the “Expense Group”). In reviewing comparative costs, each Fund’s contractual management fee and the actual management fee incurred by the Fund were compared with the contractual management fees (assuming all funds in the Expense Group were similar in size to the Fund) and actual management fees (as reported by each fund) within the Expense Group, taking into account any applicable breakpoints and fee waivers. Each Fund’s total expenses were also compared with those of its Expense Group. The Broadridge total expenses, for comparative consistency, were shown by Broadridge for Class A shares and comparative total expenses including12b-1 andnon-12b-1 service fees. The Board’s objective is for each Fund’s total expense ratio to be competitive with those of the peer funds within its Expense Group.
DelawareTax-Free Arizona Fund – The expense comparisons for the Fund showed that its actual management fee was in the quartile with the second lowest expenses of its Expense Group and its total expenses were in the quartile with the second highest expenses of its Expense Group. The Board gave favorable consideration to the Fund’s management fee but noted that the Fund’s total expenses were not in line with the Board’s objective. In evaluating the total expenses, the Board considered fee waivers in place through December 2019 and various initiatives implemented by Management, such as the negotiation of lower fees for fund accounting, fund accounting oversight services, and custody, which had created an opportunity for a further reduction in expenses. The Board was satisfied with Management’s efforts to improve the Fund’s total expense ratio and to bring it in line with the Board’s objective.
DelawareTax-Free California Fund – The expense comparisons for the Fund showed that its actual management fee was in the quartile with the lowest expenses of its Expense Group and its total expenses were in the quartile with the second highest expenses of its Expense Group. The Board gave
169
Table of Contents
| Other Fund information (Unaudited) | ||
| Delaware Funds® by Macquarie statetax-free funds | ||
Board consideration of Investment Advisory agreements for DelawareTax-Free Arizona Fund, DelawareTax-Free California Fund, DelawareTax-Free Colorado Fund, DelawareTax-Free Idaho Fund, DelawareTax-Free New York Fund, and DelawareTax-Free Pennsylvania Fund at a meeting held on August21-22, 2019 (continued)
favorable consideration to the Fund’s management fee but noted that the Fund’s total expenses were not in line with the Board’s objective. In evaluating the total expenses, the Board considered favorably fee waivers in place through December 2019 and various initiatives implemented by Management, such as a negotiation of lower fees for fund accounting, fund accounting oversight services, and custody, which had created an opportunity for a further reduction in expenses. The Board was satisfied with Management’s efforts to improve the Fund’s total expense ratio and to bring it in line with the Board’s objective.
DelawareTax-Free Colorado Fund – The expense comparisons for the Fund showed that its actual management fee and total expenses were in the quartile with the second highest expenses of its Expense Group. The Board noted that the Fund’s total expenses were not in line with the Board’s objective. In evaluating the total expenses, the Board considered favorably fee waivers in place through December 2019 and various initiatives implemented by Management, such as a negotiation of lower fees for fund accounting, fund accounting oversight services, and custody, which had created an opportunity for a further reduction in expenses. The Board was satisfied with Management’s efforts to improve the Fund’s total expense ratio and to bring it in line with the Board’s objective.
DelawareTax-Free Idaho Fund – The expense comparisons for the Fund showed that its actual management fee was in the quartile with the second lowest expenses of its Expense Group and its total expenses were in the quartile with the second highest expenses of its Expense Group. The Board gave favorable consideration to the Fund’s management fee but noted that the Fund’s total expenses were not in line with the Board’s objective. In evaluating the total expenses, the Board considered waivers in place through Dec. 2019 and various initiatives implemented by Management, such as the negotiation of lower fees for fund accounting, fund accounting oversight services, and custody, which had created an opportunity for a further reduction in expenses. The Board was satisfied with Management’s efforts to improve the Fund’s total expense ratio and to bring it in line with the Board’s objective.
DelawareTax-Free New York Fund – The expense comparisons for the Fund showed that its actual management fee was in the quartile with the lowest expenses of its Expense Group and its total expenses were in the quartile with the second lowest expenses of its Expense Group. The Board gave favorable consideration to the Fund’s management fee but noted that the Fund’s total expenses were not in line with the Board’s objective. In evaluating the total expenses, the Board considered fee waivers in place through December 2019 and various initiatives implemented by Management, such as the negotiation of lower fees for fund accounting, fund accounting oversight services, and custody, which had created an opportunity for a further reduction in expenses. The Board was satisfied with Management’s efforts to improve the Fund’s total expense ratio and to bring it in line with the Board’s objective.
DelawareTax-Free Pennsylvania Fund – The expense comparisons for the Fund showed that its actual management fee and total expenses were in the quartile with the second lowest expenses of its Expense Group. The Board noted that the Fund’s management fee and total expenses were not in line with the
170
Table of Contents
Board’s objective. In evaluating the total expenses, the Board considered fee waivers in place through December 2019 and various initiatives implemented by Management, such as the negotiation of lower fees for fund accounting, fund accounting oversight services, and custody, which had created an opportunity for a further reduction in expenses. The Board was satisfied with Management’s efforts to improve the Fund’s total expense ratio and to bring it in line with the Board’s objective.
Management profitability.The Board considered the level of profits realized by DMC in connection with the operation of the Funds. In this respect, the Board reviewed the Investment Management Profitability Analysis that addressed the overall profitability of DMC’s business in providing management and other services to each of the individual funds and the Delaware Funds as a whole. Specific attention was given to the methodology used by DMC in allocating costs for the purpose of determining profitability. Management stated that the level of profits of DMC, to a certain extent, reflects recent operational cost savings and efficiencies initiated by DMC. The Board considered DMC’s efforts to improve services provided to Fund shareholders and to meet additional regulatory and compliance requirements resulting from recent industry-wide Securities and Exchange Commission initiatives. The Board also considered the extent to which DMC might derive ancillary benefits from fund operations, including the potential for procuring additional business as a result of the prestige and visibility associated with its role as service provider to the Delaware Funds and the benefits from allocation of fund brokerage to improve trading efficiencies. As part of its work, the Board also reviewed a report prepared by JDL regarding MIMBT profitability as compared to certain peer fund complexes and the Independent Trustees discussed with JDL personnel regarding DMC’s profitability in such context. The Board found that the management fees were reasonable in light of the services rendered and the level of profitability of DMC.
Economies of scale.The Trustees considered whether economies of scale are realized by DMC as each Fund’s assets increase and the extent to which any economies of scale are reflected in the level of management fees charged. The Trustees reviewed each Fund’s advisory fee pricing and structure, approved by the Board and shareholders, which includes breakpoints, and which applies to most funds in the Delaware Funds complex. Breakpoints in the advisory fee occur when the advisory fee rate is reduced on assets in excess of specified levels. Breakpoints result in a lower advisory fee than would otherwise be the case in the absence of breakpoints, when the asset levels specified in the breakpoints are exceeded. Although, as of March 31, 2019, each Fund had not reached a size at which it could take advantage of any breakpoints in the applicable fee schedule, the Board recognized that the Fund’s fee was structured so that, if the Fund increases sufficiently in size, then economies of scale may be shared.
171
Table of Contents
Board of trustees / directors and officers addendum
Delaware Funds®by Macquarie
A mutual fund is governed by a Board of Trustees/Directors (“Trustees”), which has oversight responsibility for the management of a fund’s business affairs. Trustees establish procedures and oversee and review the performance of the investment manager, the distributor, and others who perform services for the fund. The independent fund trustees, in particular, are advocates
Name, Address, and Birth Date | Position(s) Held with Fund(s) | Length of Time Served | ||||
Interested Trustee
| ||||||
Shawn K. Lytle1 | President, | President and | ||||
2005 Market Street | Chief Executive Officer, | Chief Executive Officer | ||||
Philadelphia, PA 19103 | and Trustee | since August 2015 | ||||
February 1970 | ||||||
| Trustee since | ||||||
September 2015
| ||||||
Independent Trustees
| ||||||
Thomas L. Bennett | Chair and Trustee | Trustee since | ||||
2005 Market Street | March 2005 | |||||
Philadelphia, PA 19103 | ||||||
October 1947 | Chair since | |||||
| March 2015 | ||||||
Jerome D. Abernathy | Trustee | Since January 2019 | ||||
2005 Market Street | ||||||
Philadelphia, PA 19103 | ||||||
July 1959 | ||||||
Ann D. Borowiec | Trustee | Since March 2015 | ||||
2005 Market Street | ||||||
Philadelphia, PA 19103 | ||||||
November 1958 | ||||||
| 1 | Shawn K. Lytle is considered to be an “Interested Trustee” because he is an executive officer of the Fund’s(s’) investment advisor. |
172
Table of Contents
for shareholder interests. Each trustee has served in that capacity since he or she was elected to or appointed to the Board of Trustees, and will continue to serve until his or her retirement or the election of a new trustee in his or her place. The following is a list of the Trustees and Officers with certain background and related information.
Principal Occupation(s) During the Past Five Years | Number of Portfolios in Fund Complex Overseen by Trustee or Officer | Other Directorships Held by Trustee or Officer | ||
| ||||
President — Macquarie | 59 |
Trustee — UBS | ||
Investment Management2 | Relationship Funds, | |||
(June 2015–Present) | SMA Relationship | |||
| Trust, and UBS Funds | ||||
Regional Head of | (May 2010–April 2015) | |||
Americas — UBS Global | ||||
Asset Management | ||||
(April 2010–May 2015)
| ||||
| ||||
Private Investor | 59 |
None | ||
(March 2004–Present) | ||||
Managing Member, | 59 | None | ||
Stonebrook Capital | ||||
Management, LLC (financial | ||||
technology: macro factors | ||||
and databases) | ||||
(January 1993–Present) | ||||
Chief Executive Officer, | 59 | Director — | ||
Private Wealth Management | Banco Santander International | |||
(2011–2013) and | (October 2016–Present) | |||
Market Manager, | ||||
New Jersey Private | Director — | |||
Bank (2005–2011) — | Santander Bank, N.A. | |||
J.P. Morgan Chase & Co. | (December 2016–Present) | |||
| 2 | Macquarie Investment Management is the marketing name for Macquarie Management Holdings, Inc. and its subsidiaries, including the Fund’s(s’) investment advisor, principal underwriter, and its transfer agent. |
173
Table of Contents
Board of trustees / directors and officers addendum
Delaware Funds®by Macquarie
Name, Address, and Birth Date | Position(s) Held with Fund(s) | Length of Time Served | ||||
Independent Trustees (continued)
| ||||||
Joseph W. Chow | Trustee | Since January 2013 | ||||
2005 Market Street | ||||||
Philadelphia, PA 19103 | ||||||
January 1953 | ||||||
John A. Fry | Trustee | Since January 2001 | ||||
2005 Market Street | ||||||
Philadelphia, PA 19103 | ||||||
May 1960 | ||||||
Lucinda S. Landreth | Trustee | Since March 2005 | ||||
2005 Market Street | ||||||
Philadelphia, PA 19103 | ||||||
June 1947
| ||||||
174
Table of Contents
| Principal Occupation(s) During the Past Five Years | Number of Portfolios in Fund Complex Overseen by Trustee or Officer | Other Directorships Held by Trustee or Officer | ||||
Private Investor | 59 | Director and Audit Committee | ||||
(April 2011–Present) | Member — Hercules | |||||
| Technology Growth | ||||||
| Capital, Inc. | ||||||
(July 2004–July 2014)
| ||||||
President — | 59 | Director; Compensation | ||||
Drexel University | Committee and | |||||
(August 2010–Present) | Governance Committee | |||||
| Member — Community | ||||||
President — | Health Systems | |||||
| Franklin & Marshall College | (May 2004–present) | ||||
(July 2002–June 2010) | ||||||
| Director — Drexel | ||||||
| Morgan & Co. | ||||||
| (2015–present) | ||||||
| Director and Audit Committee | ||||||
| Member — vTv | ||||||
| Therapeutics Inc. | ||||||
| (2017–present) | ||||||
| Director and Audit Committee | ||||||
| Member — FS Credit Real | ||||||
| Estate Income Trust, Inc. | ||||||
(2018–present)
| ||||||
| Private Investor | 59 | None | ||||
| (2004–Present) | ||||||
175
Table of Contents
Board of trustees / directors and officers addendum
Delaware Funds®by Macquarie
Name, Address, and Birth Date | Position(s) Held with Fund(s) | Length of Time Served | ||||
Independent Trustees (continued)
| ||||||
Frances A. Sevilla-Sacasa | Trustee | Since September 2011 | ||||
2005 Market Street | ||||||
Philadelphia, PA 19103 | ||||||
January 1956 | ||||||
| Thomas K. Whitford | Trustee | Since January 2013 | ||||
| 2005 Market Street | ||||||
| Philadelphia, PA 19103 | ||||||
| March 1956 | ||||||
176
Table of Contents
| Principal Occupation(s) During the Past Five Years | Number of Portfolios in Fund Complex Overseen by Trustee or Officer | Other Directorships Held by Trustee or Officer | ||||
| ||||||
Private Investor | 59 | Trust Manager and | ||||
(January 2017–Present) | Audit Committee | |||||
| Chair — Camden | ||||||
Chief Executive Officer — | Property Trust | |||||
Banco Itaú | (August 2011–Present) | |||||
International | ||||||
(April 2012–December 2016) | Director; Audit | |||||
| Committee Member — | ||||||
Executive Advisor to Dean | Carrizo Oil & Gas, Inc. | |||||
(August 2011–March 2012) | (March 2018–Present) | |||||
and Interim Dean | ||||||
(January 2011–July 2011) — | ||||||
University of Miami School of | ||||||
Business Administration | ||||||
| ||||||
President — U.S. Trust, | ||||||
Bank of America Private | ||||||
Wealth Management | ||||||
(Private Banking) | ||||||
(July 2007–December 2008)
| ||||||
Vice Chairman | 59 | Director — HSBC North | ||||
(2010–April 2013) — | America Holdings Inc. | |||||
PNC Financial | (December 2013–Present) | |||||
Services Group | ||||||
| Director — HSBC USA Inc. | ||||||
| (July 2014–Present) | ||||||
| Director — | ||||||
| HSBC Bank USA, | ||||||
| National Association | ||||||
| (July 2014–March 2017) | ||||||
| Director — HSBC | ||||||
| Finance Corporation | ||||||
(December 2013–April 2018)
|
177
Table of Contents
Board of trustees / directors and officers addendum
Delaware Funds®by Macquarie
Name, Address, and Birth Date | Position(s) Held with Fund(s) | Length of Time Served | ||||
Independent Trustees (continued)
| ||||||
Christianna Wood | Trustee | Since January 2019 | ||||
2005 Market Street | ||||||
Philadelphia, PA 19103 | ||||||
August 1959 | ||||||
178
Table of Contents
| Principal Occupation(s) During the Past Five Years | Number of Portfolios in Fund Complex Overseen by Trustee or Officer | Other Directorships Held by Trustee or Officer | ||
Chief Executive Officer | 59 | Director; Finance Committee | ||
and President — | and Audit Committee | |||
Gore Creek | Member — H&R | |||
Capital, Ltd. | Block Corporation | |||
(August 2009–Present) | (July 2008–Present) | |||
| Director; Chair of Investments | ||||
| Committee and Audit | ||||
| Committee Member — | ||||
| Grange Insurance | ||||
| (2013–Present) | ||||
| Trustee; Chair of | ||||
| Nominating and Governance | ||||
| Committee and Audit | ||||
| Committee Member — | ||||
| The Merger Fund | ||||
| (2013–Present), | ||||
| The Merger Fund VL | ||||
| (2013-Present), | ||||
| WCM Alternatives: | ||||
| Event-Driven Fund | ||||
| (2013–Present), | ||||
| and WCM Alternatives: | ||||
| Credit Event Fund | ||||
| (December 2017–Present) | ||||
| Director; Chair of | ||||
| Governance Committee | ||||
| and Audit Committee | ||||
| Member — International | ||||
| Securities Exchange | ||||
| (2010–2016) | ||||
179
Table of Contents
Board of trustees / directors and officers addendum
Delaware Funds®by Macquarie
Name, Address, and Birth Date | Position(s) Held with Fund(s) | Length of Time Served | ||||
Independent Trustees (continued) | ||||||
Janet L. Yeomans | Trustee | Since April 1999 | ||||
2005 Market Street | ||||||
Philadelphia, PA 19103 | ||||||
July 1948 | ||||||
Officers | ||||||
David F. Connor | Senior Vice President, | Senior Vice President since | ||||
2005 Market Street | General Counsel, | May 2013; General | ||||
Philadelphia, PA 19103 | and Secretary | Counsel since May 2015; | ||||
December 1963 | Secretary since | |||||
October 2005
| ||||||
Daniel V. Geatens | Vice President | Vice President and | ||||
2005 Market Street | and Treasurer | Treasurer since October 2007 | ||||
Philadelphia, PA 19103 | ||||||
October 1972
| ||||||
Richard Salus | Senior Vice President | Senior Vice President and | ||||
2005 Market Street | and Chief Financial Officer | Chief Financial Officer | ||||
Philadelphia, PA 19103 | since November 2006 | |||||
October 1963
| ||||||
The Statement of Additional Information for the Fund(s) includes additional information about the Trustees and Officers and is available, without charge, upon request by calling800 523-1918.
180
Table of Contents
| Principal Occupation(s) During the Past Five Years | Number of Portfolios in Fund Complex Overseen by Trustee or Officer | Other Directorships Held by Trustee or Officer | ||
| ||||
Vice President and Treasurer | 59 | Director; Personnel and | ||
(January 2006–July 2012), | Compensation Committee | |||
Vice President — | Chair; Member of Nominating, | |||
Mergers & Acquisitions | Investments, and Audit | |||
(January 2003–January 2006), | Committees for various | |||
and Vice President | periods throughout | |||
and Treasurer | directorship — | |||
(July 1995–January 2003) — | Okabena Company | |||
3M Company | (2009–2017) | |||
| ||||
David F. Connor has served | 59 | None3 | ||
in various capacities at | ||||
different times at | ||||
Macquarie Investment | ||||
Management.
| ||||
Daniel V. Geatens has served | 59 | None3 | ||
in various capacities at | ||||
different times at | ||||
Macquarie Investment | ||||
Management.
| ||||
Richard Salus has served | 59 | None3 | ||
in various capacities | ||||
at different times at | ||||
Macquarie Investment | ||||
Management.
|
| 3 | David F. Connor, Daniel V. Geatens, and Richard Salus serve in similar capacities for the six portfolios of the Optimum Fund Trust, which have the same investment advisor, principal underwriter, and transfer agent as the registrant. Mr. Geatens also serves as the Chief Financial Officer and Treasurer for Macquarie Global Infrastructure Total Return Fund Inc., which has an affiliated investment manager. |
181
Table of Contents
Board of trustees
| ||||||
Shawn K. Lytle President and Chief Executive Officer Delaware Funds® by Macquarie Philadelphia, PA
Thomas L. Bennett Chairman of the Board Delaware Funds by Macquarie Private Investor Rosemont, PA
Jerome D. Abernathy Managing Member Stonebrook Capital Management, LLC Jersey City, NJ | Ann D. Borowiec Former Chief Executive Officer Private Wealth Management J.P. Morgan Chase & Co. New York, NY
Joseph W. Chow Former Executive Vice President State Street Corporation Boston, MA
John A. Fry President Drexel University Philadelphia, PA | Lucinda S. Landreth Former Chief Investment Officer Assurant, Inc. New York, NY
Frances A. Sevilla-Sacasa Former Chief Executive Officer Banco Itaú International Miami, FL | Thomas K. Whitford Former Vice Chairman PNC Financial Services Group Pittsburgh, PA
Christianna Wood Chief Executive Officer and President Gore Creek Capital, Ltd. Golden, CO
Janet L. Yeomans Former Vice President and Treasurer 3M Company St. Paul, MN | |||
Affiliated officers
| ||||||
David F. Connor Senior Vice President, General Counsel, and Secretary Delaware Funds by Macquarie Philadelphia, PA | Daniel V. Geatens Vice President and Treasurer Delaware Funds by Macquarie Philadelphia, PA | Richard Salus Senior Vice President and Chief Financial Officer Delaware Funds by Macquarie Philadelphia, PA | ||||
This annual report is for the information of DelawareTax-Free Arizona Fund, DelawareTax-Free California Fund, DelawareTax-Free Colorado Fund, DelawareTax-Free Idaho Fund, DelawareTax-Free New York Fund, and DelawareTax-Free Pennsylvania Fund shareholders, but it may be used with prospective investors when preceded or accompanied by the Delaware Fund fact sheet for the most recently completed calendar quarter. These documents are available at delawarefunds.com/literature.
Each Fund files its complete schedule of portfolio holdings with the Securities and Exchange Commission (SEC) for the first and third quarters of each fiscal year on FormN-Q or FormN-PORT (available for filings after March 31, 2019). Each Fund’s FormsN-Q or FormsN-PORT, as well as a description of the policies and procedures that the Funds use to determine how to vote proxies (if any) relating to portfolio securities, are available without charge (i) upon request, by calling 800523-1918; and (ii) on the SEC’s website at sec.gov. In addition, a description of the policies and procedures that the Funds use to determine how to vote proxies (if any) relating to portfolio securities and the Schedules of Investments included in the Funds’ most recent FormN-Q or FormN-PORT are available without charge on the Funds’ website at delawarefunds.com/literature. Each Fund’s FormsN-Q and FormsN-PORT may be reviewed and copied at the SEC’s Public Reference Room in Washington, D.C.; information on the operation of the Public Reference Room may be obtained by calling 800SEC-0330.
Information (if any) regarding how the Funds voted proxies relating to portfolio securities during the most recently disclosed12-month period ended June 30 is available without charge (i) through the Funds’ website at delawarefunds.com/proxy; and (ii) on the SEC’s website at sec.gov.
182
Item 2. Code of Ethics
The registrant has adopted a code of ethics that applies to the registrant’s principal executive officer, principal financial officer, principal accounting officer or controller, or persons performing similar functions, regardless of whether these individuals are employed by the registrant or a third party. A copy of the registrant’s Code of Business Ethics has been posted on the Delaware Funds® by Macquarie Internet Web site at www.delawarefunds.com. Any amendments to the Code of Business Ethics, and information on any waiver from its provisions granted by the registrant, will also be posted on this Web site within five business days of such amendment or waiver and will remain on the Web site for at least 12 months.
Item 3. Audit Committee Financial Expert
The registrant’s Board of Trustees/Directors has determined that certain members of the registrant’s Audit Committee are audit committee financial experts, as defined below. For purposes of this item, an “audit committee financial expert” is a person who has the following attributes:
a. An understanding of generally accepted accounting principles and financial statements;
b. The ability to assess the general application of such principles in connection with the accounting for estimates, accruals, and reserves;
c. Experience preparing, auditing, analyzing, or evaluating financial statements that present a breadth and level of complexity of accounting issues that are generally comparable to the breadth and complexity of issues that can reasonably be expected to be raised by the registrant’s financial statements, or experience actively supervising one or more persons engaged in such activities;
d. An understanding of internal controls and procedures for financial reporting; and
e. An understanding of audit committee functions.
An “audit committee financial expert” shall have acquired such attributes through:
a. Education and experience as a principal financial officer, principal accounting officer, controller, public accountant, or auditor or experience in one or more positions that involve the performance of similar functions;
b. Experience actively supervising a principal financial officer, principal accounting officer, controller, public accountant, auditor, or person performing similar functions;
c. Experience overseeing or assessing the performance of companies or public accountants with respect to the preparation, auditing, or evaluation of financial statements; or
d. Other relevant experience.
The registrant’s Board of Trustees/Directors has also determined that each member of the registrant’s Audit Committee is independent. In order to be “independent” for purposes of this item, the Audit Committee member may not: (i) other than in his or her capacity as a member of the Board of Trustees/Directors or any committee thereof, accept directly or indirectly any consulting, advisory or other compensatory fee from the issuer; or (ii) be an “interested person” of the registrant as defined in Section 2(a)(19) of the Investment Company Act of 1940.
The names of the audit committee financial experts on the registrant’s Audit Committee are set forth below:
John A. Fry
Lucinda S. Landreth
Thomas K. Whitford
Christianna Wood
Item 4. Principal Accountant Fees and Services
(a)Audit fees.
The aggregate fees billed for services provided to the registrant by its independent auditors for the audit of the registrant’s annual financial statements and for services normally provided by the independent auditors in connection with statutory and regulatory filings or engagements were $202,520 for the fiscal year ended August 31, 2019.
The aggregate fees billed for services provided to the registrant by its independent auditors for the audit of the registrant’s annual financial statements and for services normally provided by the independent auditors in connection with statutory and regulatory filings or engagements were $193,000 for the fiscal year ended August 31, 2018.
(b)Audit-related fees.
The aggregate fees billed by the registrant’s independent auditors for services relating to the performance of the audit of the registrant’s financial statements and not reported under paragraph (a) of this Item were $0 for the fiscal year ended August 31, 2019.
The aggregate fees billed by the registrant’s independent auditors for services relating to the performance of the audit of the financial statements of the registrant’s investment adviser and other service providers under common control with the adviser and that relate directly to the operations or financial reporting of the registrant were $909,000 for the registrant’s fiscal year ended August 31, 2019. The percentage of these fees relating to services approved by the registrant’s Audit Committee pursuant to thedeminimis exception from the pre-approval requirement in Rule 2-01(c)(7)(i)(C) of Regulation S-X was 0%. These audit-related services were as follows: year end audit procedures, group reporting and subsidiary statutory audits.
The aggregate fees billed by the registrant’s independent auditors for services relating to the performance of the audit of the registrant’s financial statements and not reported under paragraph (a) of this Item were $0 for the fiscal year ended August 31, 2018.
The aggregate fees billed by the registrant’s independent auditors for services relating to the performance of the audit of the financial statements of the registrant’s investment adviser and other service providers under common control with the adviser and that relate directly to the operations or financial reporting of the registrant were $640,000 for the registrant’s fiscal year ended August 31, 2018. The percentage of these fees relating to services approved by the registrant’s Audit Committee pursuant to thedeminimis exception from the pre-approval requirement in Rule 2-01(c)(7)(i)(C) of Regulation S-X was 0%. These audit-related services were as follows: year end audit procedures, group reporting and subsidiary statutory audits.
(c)Tax fees.
The aggregate fees billed by the registrant’s independent auditors for tax-related services provided to the registrant were $27,500 for the fiscal year ended August 31, 2019. The percentage of these fees relating to services approved by the registrant’s Audit Committee pursuant to thedeminimis exception from the pre-approval requirement in Rule 2-01(c)(7)(i)(C) of Regulation S-X was 0%. These tax-related services were as follows: review of income tax returns and review of annual excise distribution calculations.
The aggregate fees billed by the registrant’s independent auditors for tax-related services provided to the registrant’s investment adviser and other service providers under common control with the adviser and that relate directly to the operations or financial reporting of the registrant were $0 for the registrant’s fiscal year ended August 31, 2019. The percentage of these fees relating to services approved by the registrant’s Audit Committee pursuant to thedeminimis exception from the pre-approval requirement in Rule 2-01(c)(7)(i)(C) of Regulation S-X was 0%.
The aggregate fees billed by the registrant’s independent auditors for tax-related services provided to the registrant were $22,920 for the fiscal year ended August 31, 2018. The percentage of these fees relating to services approved by the registrant’s Audit Committee pursuant to thedeminimis exception from the pre-approval requirement in Rule 2-01(c)(7)(i)(C) of Regulation S-X was 0%. These tax-related services were as follows: review of income tax returns and review of annual excise distribution calculations.
The aggregate fees billed by the registrant’s independent auditors for tax-related services provided to the registrant’s investment adviser and other service providers under common control with the adviser and that relate directly to the operations or financial reporting of the registrant were $0 for the registrant’s fiscal year ended August 31, 2018. The percentage of these fees relating to services approved by the registrant’s Audit Committee pursuant to the de minimis exception from the pre-approval requirement in Rule 2-01(c)(7)(i)(C) of Regulation S-X was 0%.
(d)All other fees.
The aggregate fees billed for all services provided by the independent auditors to the registrant other than those set forth in paragraphs (a), (b) and (c) of this Item were $0 for the fiscal year ended August 31, 2019.
The aggregate fees billed for all services other than those set forth in paragraphs (b) and (c) of this Item provided by the registrant’s independent auditors to the registrant’s adviser and other service providers under common control with the adviser and that relate directly to the operations or financial reporting of the registrant were $0 for the registrant’s fiscal year ended August 31, 2019. The percentage of these fees relating to services approved by the registrant’s Audit Committee pursuant to thedeminimis exception from the pre-approval requirement in Rule 2-01(c)(7)(i)(C) of Regulation S-X was 0%.
The aggregate fees billed for all services provided by the independent auditors to the registrant other than those set forth in paragraphs (a), (b) and (c) of this Item $0 for the fiscal year ended August 31, 2018.
The aggregate fees billed for all services other than those set forth in paragraphs (b) and (c) of this Item provided by the registrant’s independent auditors to the registrant’s adviser and other service providers under common control with the adviser and that relate directly to the operations or financial reporting of the registrant were $0 for the registrant’s fiscal year ended August 31, 2018. The percentage of these fees relating to services approved by the registrant’s Audit Committee pursuant to the de minimis exception from the pre-approval requirement in Rule 2-01(c)(7)(i)(C) of Regulation S-X was 0%.
(e) The registrant’s Audit Committee has established pre-approval policies and procedures as permitted by Rule 2-01(c)(7)(i)(B) of Regulation S-X (the “Pre-Approval Policy”) with respect to services provided by the registrant’s independent auditors. Pursuant to the Pre-Approval Policy, the Audit Committee has pre-approved the services set forth in the table below with respect to the registrant up to the specified fee limits. Certain fee limits are based on aggregate fees to the registrant and other registrants within the Delaware Funds® by Macquarie.
| Service | Range of Fees |
| Audit Services | |
| Statutory audits or financial audits for new Funds | up to $40,000 per Fund |
| Services associated with SEC registration statements (e.g., Form N-1A, Form N-14, etc.), periodic reports and other documents filed with the SEC or other documents issued in connection with securities offerings (e.g., comfort letters for closed-end Fund offerings, consents), and assistance in responding to SEC comment letters | up to $10,000 per Fund |
| Consultations by Fund management as to the accounting or disclosure treatment of transactions or events and/or the actual or potential impact of final or proposed rules, standards or interpretations by the SEC, FASB, or other regulatory or standard-setting bodies (Note: Under SEC rules, some consultations may be considered “audit-related services” rather than “audit services”) | up to $25,000 in the aggregate |
| Audit-Related Services | |
| Consultations by Fund management as to the accounting or disclosure treatment of transactions or events and /or the actual or potential impact of final or proposed rules, standards or interpretations by the SEC, FASB, or other regulatory or standard-setting bodies (Note: Under SEC rules, some consultations may be considered “audit services” rather than “audit-related services”) | up to $25,000 in the aggregate |
| Tax Services | |
| U.S. federal, state and local and international tax planning and advice (e.g., consulting on statutory, regulatory or administrative developments, evaluation of Funds’ tax compliance function, etc.) | up to $25,000 in the aggregate |
| U.S. federal, state and local tax compliance (e.g., excise distribution reviews, etc.) | up to $5,000 per Fund |
| Review of federal, state, local and international income, franchise and other tax returns | up to $5,000 per Fund |
Under the Pre-Approval Policy, the Audit Committee has also pre-approved the services set forth in the table below with respect to the registrant’s investment adviser and other entities controlling, controlled by or under common control with the investment adviser that provide ongoing services to the registrant (the “Control Affiliates”) up to the specified fee limit. This fee limit is based on aggregate fees to the investment adviser and its Control Affiliates.
| Service | Range of Fees |
| Non-Audit Services | |
| Services associated with periodic reports and other documents filed with the SEC and assistance in responding to SEC comment letters | up to $10,000 in the aggregate |
The Pre-Approval Policy requires the registrant’s independent auditors to report to the Audit Committee at each of its regular meetings regarding all services initiated since the last such report was rendered, including those services authorized by the Pre-Approval Policy.
(f) Not applicable.
(g) The aggregate non-audit fees billed by the registrant’s independent auditors for services rendered to the registrant and to its investment adviser and other service providers under common control with the adviser were $9,955,000 and $11,748,000 for the registrant’s fiscal years ended August 31, 2019 and August 31, 2018, respectively.
(h) In connection with its selection of the independent auditors, the registrant’s Audit Committee has considered the independent auditors’ provision of non-audit services to the registrant’s investment adviser and other service providers under common control with the adviser that were not required to be pre-approved pursuant to Rule 2-01(c)(7)(ii) of Regulation S-X. The Audit Committee has determined that the independent auditors’ provision of these services is compatible with maintaining the auditors’ independence.
Item 5. Audit Committee of Listed Registrants
Not applicable.
Item 6. Investments
(a) Included as part of report to shareholders filed under Item 1 of this Form N-CSR.
(b) Divestment of securities in accordance with Section 13(c) of the Investment Company Act of 1940.
Not applicable.
Item 7. Disclosure of Proxy Voting Policies and Procedures for Closed-End Management Investment Companies
Not applicable.
Item 8. Portfolio Managers of Closed-End Management Investment Companies
Not applicable.
Item 9. Purchases of Equity Securities by Closed-End Management Investment Company and Affiliated Purchasers
Not applicable.
Item 10. Submission of Matters to a Vote of Security Holders
Not applicable.
Item 11. Controls and Procedures
The registrant’s principal executive officer and principal financial officer have evaluated the registrant’s disclosure controls and procedures within 90 days of the filing of this report and have concluded that they are effective in providing reasonable assurance that the information required to be disclosed by the registrant in its reports or statements filed under the Securities Exchange Act of 1934 is recorded, processed, summarized and reported within the time periods specified in the rules and forms of the Securities and Exchange Commission.
There were no significant changes in the registrant’s internal control over financial reporting that occurred during the period covered by the report to stockholders included herein that have materially affected, or are reasonably likely to materially affect, the registrant’s internal control over financial reporting.
Item 12. Exhibits
(a) (1) Code of Ethics
Not applicable.
(2) Certifications of Principal Executive Officer and Principal Financial Officer pursuant to Rule 30a-2 under the Investment Company Act of 1940 are attached hereto as Exhibit 99.CERT.
(3) Written solicitations to purchase securities pursuant to Rule 23c-1 under the Securities Exchange Act of 1934.
Not applicable.
(b) Certifications pursuant to Section 906 of the Sarbanes-Oxley Act of 2002 are furnished herewith as Exhibit 99.906CERT.
SIGNATURES
Pursuant to the requirements of the Securities Exchange Act of 1934 and the Investment Company Act of 1940, the registrant has duly caused this report to be signed on its behalf, by the undersigned, thereunto duly authorized.
VOYAGEUR MUTUAL FUNDS
| SHAWN K. LYTLE | |
| By: | Shawn K. Lytle |
| Title: | President and Chief Executive Officer |
| Date: | November 6, 2019 |
Pursuant to the requirements of the Securities Exchange Act of 1934 and the Investment Company Act of 1940, this report has been signed below by the following persons on behalf of the registrant and in the capacities and on the dates indicated.
| SHAWN K. LYTLE | |
| By: | Shawn K. Lytle |
| Title: | President and Chief Executive Officer |
| Date: | November 6, 2019 |
| RICHARD SALUS | |
| By: | Richard Salus |
| Title: | Chief Financial Officer |
| Date: | November 6, 2019 |