Keeley Small Cap Value Fund (KSCVX) Inactive
Filed: 31 May 05, 12:00am
UNITED STATES
SECURITIES AND EXCHANGE COMMISSION
Washington, D.C. 20549
FORM N-CSR
CERTIFIED SHAREHOLDER REPORT OF REGISTERED
MANAGEMENT INVESTMENT COMPANIES
Investment Company Act File Number 811-07760
KEELEY Small Cap Value Fund, Inc.
(Exact name of registrant as specified in charter)
401 South LaSalle Street Suite 1201 Chicago, Illinois | 60605 | |
| (Address of principal executive offices) | (Zip code) |
| Copy to: | ||
John L. Keeley, Jr. Keeley Asset Management Corp. 401 South LaSalle Street Suite 1201 Chicago, Illinois 60605 | Stephen E. Goodman Meltzer Purtill & Stelle LLC 1515 E. Woodfield Road Schaumburg, Illinois 60173 | |
(Name and address of agent for service)
Registrant’s telephone number, including area code: (312)786-5000
Date of fiscal year end: September 30
Date of reporting period: March 31, 2005
| Item 1. | Reports to Stockholders. |
The following is a copy of the report transmitted to shareholders pursuant to Rule 30e-1 under the Investment Company Act of 1940 (the “Act”) (17 CFR 270.30e-1)
LETTER TO SHAREHOLDERS
Dear Shareholder,
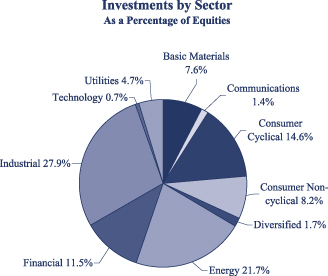
During the past six months from October 1, 2004 through March 31, 2005, the Fund’s net assets grew to $462,328,235 and the number of shareholders was 17,950. For the six month period ending March 31, 2005, the portfolio turnover was 13.02% and the expense ratio declined to 1.51%. The Fund’s portfolio is widely diversified with investments in 149 companies. The Fund is registered for sale in all 50 states and the District of Columbia. Our broker dealer network totals over 200 broker dealers and trust entities.
As of this date, the Fund was rated five of five stars by Morningstar among 76 Small Blend funds for the 10-year period. The KEELEY Small Cap Value Fund, Inc. received five of five stars for the three year period (among 354 funds) and five of five stars (among 253 funds) for the five year period Morningstar ratings reflect historial risk adjusted performance as of 3/31/05 and are subject to change every month. Morningstar ratings are based on a risk adjusted return measure that accounts for variation in a Fund’s monthly performance (including the effects of sales charges and redemption fees), placing more emphasis on downward variations and rewarding consistent performance. The overall rating is a weighted average of the three-, five-, and 10-year returns. The top 10% are labeled five stars, the next 22.5% are labeled four stars, the next 35% are labeled three stars, the next 22.5% are labeled two stars and the bottom 10% one star.
There are risks associated with an investment in small-cap mutual funds, such as smaller product lines and market shares, and limited available information. You should consider the investment objectives, risks and charges and expenses of the investment company carefully before investing. For further details regarding such risks, including information on fees and expenses please refer to the Fund’s prospectus. Read the Prospectus carefully before investing.
Performance Data Excluding 4.5% Maximum Up-Front Sales Charge
For the quarter ended March 31, 2005, the Fund’s total return was +0.18% versus a return of –5.34% for the Russell 2000 Index and –2.15% for the S&P 500 Index. For the one year ending March 31, 2005, the Fund’s average annual return was +24.41% versus +5.41% for the Russell 2000 Index and +6.69% for the S&P 500 Index. For the five year period the Fund’s average annual return was +16.90% versus +4.01% for the Russell 2000 Index and –3.16% for the S&P 500 Index. Since inception, October 1, 1993, the Fund’s average annual return was +15.46% versus +9.51% for the Russell 2000 Index and +10.56% for the S&P 500 Index. Performance Data does not reflect the deduction of the sales load or fee, and that, if reflected, the load or fee would reduce the performance quoted.
Performance data quoted represents past performance and does not guarantee future results. The investment return and principal value of an investment will fluctuate so that an investor’s shares, when redeemed, may be worth more or less than their original cost and the current performance my be lower or higher than the performance data quoted. You may call toll-free at 888-933-5391, or visit our website at www.keeleyfunds.com to obtain performance data current to the most recent month end.
After a strong showing in the fourth quarter of 2004, the equity markets got off to a lackluster start to begin the New Year. Oil prices continued to capture the attention of investors throughout the quarter as oil prices resumed their upward trend from $45 per barrel in early January to $55 by quarter’s end. The latest statistics on producer and consumer prices showed that inflation was picking up, in large part due to this spike in energy prices. Apart from the energy component, however, trends in overall pricing pressure seemed contained.
During the six months, the Federal Reserve continued to push short term interest rates higher, bringing the Fed Funds Rate to 2.75%. Since their cycle of tightening began last June, the Fed has now raised rates on seven occasions. Interestingly, the yield on the ten-year treasury bond stands essentially at the same level (4.5%) that it was when these rate hikes began-the flattening shape of the yield curve could suggest that inflationary pressures are being reigned in.
The economy continues to press forward at a steady pace. The service and housing sectors remain strong; productivity and industrial activity are increasing at a solid pace. In this environment, we remain encouraged by the continuing resurgence of industrial companies in the U.S. and return of the pricing power for these companies. We also note that GDP growth is forecast to average over 3% throughout 2005.
In the period ahead, we expect this stock market gridlock to resolve itself with a modest upward bias as first quarter earnings are released. Tempering this is the possibility that the Federal Reserve System will raise rates in larger increments than the recent ¼ point. In addition, the effect of Sarbanes-Oxley are impacting the earnings of smaller corporations. This is delaying filings in many instances. We believe that this will cause many small companies to go private to avoid these regulations.
Meanwhile, our corporate restructuring universe has been active both in terms on new announcements as well as a pick-up in merger and acquisition activity. During the quarter, two of our holdings agreed to be acquired at premium valuations: Pulitzer Inc. agreed to be acquired by Lee Enterprises at $64 per share and Magnum Hunter Resources agreed to be acquired by Cimarex Energy at $16 per share. Shortly after the quarter ended Shopko Stores Inc. agreed to be acquired at $24 per share by a private equity firm. At March 31, 2005, the percent of assets the Fund held in these companies were 0.84% in Cimarex and 0.90% in Shopko.
Within this environment, we remain committed to our value driven strategy which buys stock of relatively unknown (spin-offs) and out of favor (below actual or perceived book value) companies. This lack of Wall Street coverage and sponsorship allows us to buy stock at a discount to our assessment of fair market value.
Thank you for your continued commitment to the Fund.
Sincerely,

John L. Keeley, Jr.
President
Performance Data Including 4.5% Maximum Up-Front Sales Charge
For the quarter ended March 31, 2005, the Fund’s total return was –4.33% versus a return of –5.34% for the Russell 2000 Index and –2.15% for the S&P 500 Index. For the one year ending March 31, 2005, the Fund’s average annual return was +18.81% versus +5.41% for the Russell 2000 Index and +6.69% for the S&P 500 Index. For the five year period the Fund’s average annual return was +15.83% versus +4.01% for the Russell 2000 Index and –3.16% for the S&P 500 Index. Since inception, October 1, 1993, the Fund’s average annual return was +15.00% versus +9.51% for the Russell 2000 Index and +10.56% for the S&P 500 Index.
Index Comparison
Comparison of a Hypothetical $10,000 Investment
in the KSCVX*, S&P 500®** and Russell 2000**
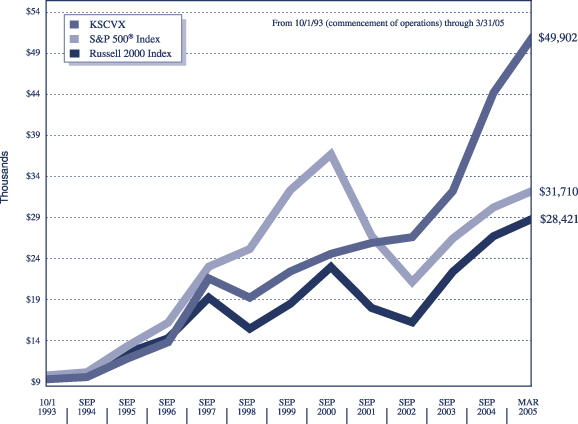
Average annual total returns***
for the periods ended March 31, 2005
12 months ended 3/31/05 | 5 years ended 3/31/05 | 10 years ended 3/31/05 | Since Commencement of Operations 10/1/93 to 3/31/05 | |||||
KSCVX | +24.41% | +16.90% | +17.36% | +15.46% | ||||
KSCVX (includes | +18.81% | +15.83% | +16.82% | +15.00% | ||||
S&P 500® Index | +6.69% | –3.16% | +10.79% | +10.56% | ||||
Russell 2000 Index | +5.41% | +4.01% | +10.43% | +9.51% |
| * | Performance graph includes deduction of 4 1/2% front end load. |
| ** | The S&P 500® Index is a broad market-weighted index dominated by blue-chip stocks. The Russell 2000 Index is comprised of the smallest 2,000 companies in the Russell 3000 Index. The Russell 3000 Index is comprised of the 3,000 largest U.S. companies based on market capitalization. All Indexes are unmanaged and returns include reinvested dividends. |
| *** | PERFORMANCE DATA quoted represents past performance which is not predictive of future performance. The investment return and principal value of shares will fluctuate and when redeemed, may be worth more or less than their original cost. |
PROXY VOTING
A description of the Fund’s proxy voting policies and procedures and a record of the Fund’s proxy votes for the year ended June 30, 2004 are available (i) without charge, upon request, by calling toll free 1-888-933-5391; (ii) on the Fund’s website at www.keeleyfunds.com; and (iii) on the Securities and Exchange Commission’s website at www.sec.gov.
QUARTERLY PORTFOLIO HOLDINGS
The Fund files its complete schedule of portfolio holdings with the Securities and Exchange Commission for the first and third quarters of each fiscal year on Form N-Q. The Fund’s Forms N-Q are available on the EDGAR database on the Securities and Exchange Commission’s website at www.sec.gov. These Forms may also be reviewed and copied at the Securities and Exchange Commission’s Public Reference Room in Washington, D.C. Information about the operation of the Public Reference Room may be obtained by calling 1-800-SEC-0330. The information may also be obtained by calling 1-888-933-5391.
RENEWAL OF INVESTMENT ADVISORY CONTRACT
In November 2004, the Board of Directors of the Fund considered renewal of the Fund’s Investment Advisory Agreement. In considering renewal, the Board reviewed the following factors: (i) the Fund’s expense ratio, (ii) the Fund’s performance on a short-term and long-term basis and relative to a list of nine other funds deemed somewhat comparable to the Fund, the Russell 2000 Index and the S&P® 500 Index; (iii) the Fund’s management fee; (iv) the overall performance of the market as measured by the Russell 2000 Index and the S&P® 500 Index; (v) the total fees collected by the Adviser and its affiliates from the Fund and its shareholders; and (vi) the range and quality of the services offered by the Adviser. In evaluating the Fund’s expenses, the Board first reviewed expenses for funds in the Fund’s S&P Style Name Category as defined by Strategic Insight, and a selected group of ten funds (including the Fund) with net assets ranging from $17.0 million to $641.0 million. The S&P Style Name Category showed average expenses of 1.59%, median expenses of 1.50%, and average net assets of $282 million, which put the Fund at the higher end of the expense category (at 250 out of 386), but still one of the smaller funds in the category. The Board then reviewed the various categories of expenses, and considered those which were likely to go continue to go down as a percentage of Fund assets as fund size increases. The Board reviewed the Lipper Benchmark advisory fee numbers, which showed that the Fund’s 1.00% fee was on the high side of advisory fees. The Board also reviewed information related to the other benefits which affiliates of the Adviser received as a result of their relationship with the Fund, including brokerage fees paid to Keeley Investment Corp. The Board paid particular attention to the Fund’s performance, both over its entire history and on the shorter term, and acknowledged that the Fund had significantly out-performed the Russell 2000 Index and the S&P 500® Index in fiscal 2004, and on an average annual 3-year, 5-year and ten-year basis, and the Board indicated that it was pleased with that record. The Board discussed the Fund’s unusual characteristics—its focus on special situations—companies coming out of bankruptcy, restructuring, spin-offs and S&L and insurance conversions, and the additional effort required to focus on those issues. In evaluating performance, the Board first reviewed data from that same group of funds for a one and three year period, and against the S&P 500®, the Russell 2000 and the Lipper Benchmark. After considering all of these factors, but with particular reference to the Fund’s performance, the Board concluded that the Adviser provided excellent and unique services to the Fund, based on the unusual investment criteria, that there was a substantial cost to the adviser to provide those services, that the performance had been excellent, that the Fund had received value for its cost of advisory services, and based on those factors, renewed the Advisory Agreement.
KEELEY Small Cap Value Fund, Inc.
STATEMENT OF ASSETS AND LIABILITIES
March 31, 2005
(Unaudited)
ASSETS: | ||||
Investments at value (cost $384,249,675) | $ | 468,867,001 | ||
Cash | 36 | |||
Receivable for investments sold | 655,325 | |||
Receivable for shares issued | 7,399,741 | |||
Dividends and interest receivable | 214,945 | |||
Prepaid expenses | 42,037 | |||
Total Assets | 477,179,085 | |||
LIABILITIES: | ||||
Payable for investments purchased | 12,288,438 | |||
Payable for shares redeemed | 2,042,912 | |||
Payable to Adviser | 378,374 | |||
Accrued 12b-1 fees | 95,098 | |||
Other accrued expenses | 46,028 | |||
Total Liabilities | 14,850,850 | |||
NET ASSETS | $ | 462,328,235 | ||
NET ASSETS CONSIST OF: | ||||
Capital stock | $ | 374,151,467 | ||
Accumulated net investment loss | (643,044 | ) | ||
Undistributed net realized gain on investments | 4,202,486 | |||
Net unrealized appreciation on investments | 84,617,326 | |||
NET ASSETS | $ | 462,328,235 | ||
CAPITAL STOCK, $0.01 par value | ||||
Authorized | 100,000,000 | |||
Issued and outstanding | 12,160,660 | |||
NET ASSET VALUE AND REDEMPTION PRICE PER SHARE | $ | 38.02 | ||
MAXIMUM OFFERING PRICE PER SHARE ($38.02 / 0.955) | $ | 39.81 | ||
KEELEY Small Cap Value Fund, Inc.
STATEMENT OF OPERATIONS
For The Six Months Ended March 31, 2005
(Unaudited)
INVESTMENT INCOME: | ||||
Dividend income (net of $1,116 of foreign withholding taxes) | $ | 1,618,275 | ||
Interest income | 137,753 | |||
Total Investment Income | 1,756,028 | |||
EXPENSES: | ||||
Investment advisory fees | 1,585,954 | |||
12b-1 fees | 396,489 | |||
Administration fees | 104,229 | |||
Professional fees | 91,818 | |||
Transfer agent fees and expenses | 77,799 | |||
Custody fees | 48,635 | |||
Federal and state registration fees | 38,480 | |||
Fund accounting fees | 24,247 | |||
Reports to shareholders | 13,637 | |||
Directors’ fees | 10,470 | |||
Other | 7,314 | |||
Total Expenses | 2,399,072 | |||
NET INVESTMENT LOSS | (643,044 | ) | ||
REALIZED AND UNREALIZED GAIN ON INVESTMENTS : | ||||
Net realized gain on investments | 4,212,646 | |||
Change in net unrealized appreciation on investments | 33,442,191 | |||
Net Gain on Investments | 37,654,837 | |||
NET INCREASE IN NET ASSETS RESULTING FROM OPERATIONS | $ | 37,011,793 | ||
See notes to the financial statements.
KEELEY Small Cap Value Fund, Inc.
SCHEDULE OF INVESTMENTS
March 31, 2005
(Unaudited)
| Number of Shares | Value | |||||||
COMMON STOCKS | 95.82 | % | ||||||
Aerospace/Defense | 2.22 | % | ||||||
| 217,500 | GenCorp, Inc. | $ | 4,350,000 | |||||
| 900 | Moog, Inc., Class A* | 40,680 | ||||||
| 47,000 | Moog, Inc., Class B* | 2,138,500 | ||||||
| 119,000 | Teledyne Technologies, Inc.* | 3,724,700 | ||||||
| 10,253,880 | ||||||||
Auto Parts and Equipment | 1.09 | % | ||||||
| 166,500 | Tenneco Automotive, Inc.* | 2,074,590 | ||||||
| 205,000 | Titan International, Inc. | 2,945,850 | ||||||
| 5,020,440 | ||||||||
Banks | 0.95 | % | ||||||
| 72,000 | PrivateBancorp, Inc. | 2,261,520 | ||||||
| 45,000 | Wintrust Financial Corp. | 2,119,050 | ||||||
| 4,380,570 | ||||||||
Building Materials | 0.78 | % | ||||||
| 67,000 | Texas Industries, Inc. | 3,601,250 | ||||||
Coal | 2.48 | % | ||||||
| 147,500 | Alpha Natural Resources, Inc.* | 4,228,825 | ||||||
| 165,000 | Foundation Coal Holdings, Inc. | 3,879,150 | ||||||
| 84,000 | Massey Energy Co. | 3,363,360 | ||||||
| 11,471,335 | ||||||||
Commercial Services | 3.33 | % | ||||||
| 154,000 | Adesa, Inc. | 3,597,440 | ||||||
| 105,000 | Interactive Data Corp.* | 2,178,750 | ||||||
| 110,000 | Midas, Inc.* | 2,511,300 | ||||||
| 180,000 | PHH Corp.* | 3,936,600 | ||||||
| 201,700 | Standard Parking Corp.* | 3,172,741 | ||||||
| 15,396,831 | ||||||||
Distribution / Wholesale | 0.61 | % | ||||||
| 100,000 | WESCO International, Inc.* | 2,800,000 | ||||||
Diversified Financial Services | 3.84 | % | ||||||
| 50,000 | CIT Group, Inc. | 1,900,000 | ||||||
| 246,500 | Epoch Holding Corp.* | 1,170,875 | ||||||
| 46,500 | Jefferies Group, Inc. | 1,752,120 | ||||||
| 328,000 | LaBranche & Co., Inc.* | 3,050,400 | ||||||
| 78,000 | Piper Jaffray Companies, Inc.* | 2,854,020 | ||||||
| 163,000 | SWS Group, Inc. | 2,612,890 | ||||||
| 395,000 | Van der Moolen Holding N.V. ADR* | 2,820,300 | ||||||
| 80,000 | Waddell & Reed Financial, Inc. | 1,579,200 | ||||||
| 17,739,805 | ||||||||
Electric | 4.50 | % | ||||||
| 107,500 | Allegheny Energy, Inc.* | 2,220,950 | ||||||
| 770,000 | Aquila, Inc.* | 2,949,100 | ||||||
| Number of Shares | Value | |||||||
Electric (continued) | ||||||||
| 720,000 | Calpine Corp.* | $ | 2,016,000 | |||||
| 165,000 | CenterPoint Energy, Inc. | 1,984,950 | ||||||
| 240,000 | CMS Energy Corp.* | 3,129,600 | ||||||
| 135,000 | Duquesne Light Holdings, Inc. | 2,419,200 | ||||||
| 89,000 | Florida Public Utilities Co. | �� | 1,673,200 | |||||
| 195,000 | Reliant Energy, Inc.* | 2,219,100 | ||||||
| 102,500 | Westar Energy, Inc. | 2,218,100 | ||||||
| 20,830,200 | ||||||||
Electrical Components & Equipment | 2.59 | % | ||||||
| 55,000 | Ametek, Inc. | 2,213,750 | ||||||
| 297,500 | General Cable Corp.* | 3,590,825 | ||||||
| 182,500 | Insteel Industries, Inc.* | 2,741,150 | ||||||
| 195,000 | Superior Essex, Inc.* | 3,447,600 | ||||||
| 11,993,325 | ||||||||
Electronics | 1.76 | % | ||||||
| 205,000 | Methode Electronics, Inc., Class A | 2,482,550 | ||||||
| 76,500 | Thomas & Betts Corp.* | 2,470,950 | ||||||
| 98,000 | Watts Water Technologies, Inc. | 3,195,780 | ||||||
| 8,149,280 | ||||||||
Energy—Alternate Sources | 1.95 | % | ||||||
| 350,800 | Danielson Holdings Corp.* | 6,051,300 | ||||||
| 220,000 | KFX, Inc.* | 2,948,000 | ||||||
| 8,999,300 | ||||||||
Engineering and Construction | 2.28 | % | ||||||
| 64,000 | Chicago Bridge & Iron Co. N.V. | 2,817,920 | ||||||
| 221,000 | Foster Wheeler, Ltd.* | 3,845,400 | ||||||
| 205,000 | McDermott International, Inc.* | 3,880,650 | ||||||
| 10,543,970 | ||||||||
Entertainment | 1.34 | % | ||||||
| 165,000 | Pinnacle Entertainment, Inc.* | 2,755,500 | ||||||
| 137,000 | Vail Resorts, Inc.* | 3,459,250 | ||||||
| 6,214,750 | ||||||||
Food | 2.61 | % | ||||||
| 162,500 | Chiquita Brands International, Inc. | 4,351,750 | ||||||
| 205,000 | Del Monte Foods Co.* | 2,224,250 | ||||||
| 92,500 | Flowers Foods, Inc. | 2,609,425 | ||||||
| 61,000 | Ralcorp Holdings, Inc. | 2,888,350 | ||||||
| 12,073,775 | ||||||||
Forest Products and Paper | 1.99 | % | ||||||
| 57,000 | Deltic Timber Corp. | 2,228,700 | ||||||
| 167,500 | Longview Fibre Co. | 3,142,300 | ||||||
| 114,000 | Neenah Paper, Inc. | 3,832,680 | ||||||
| 9,203,680 | ||||||||
See notes to the financial statements.
KEELEY Small Cap Value Fund, Inc.
SCHEDULE OF INVESTMENTS
March 31, 2005
(Unaudited)
| Number of Shares | Value | |||||||
Hand/Machine Tools | 0.77 | % | ||||||
| 124,000 | Regal-Beloit Corp. | $ | 3,569,960 | |||||
Healthcare—Products | 0.69 | % | ||||||
| 89,000 | Sybron Dental Specialties, Inc.* | 3,195,100 | ||||||
Healthcare—Services | 0.52 | % | ||||||
| 182,000 | Emeritus Corp.* | 2,387,840 | ||||||
Holdings Company—Diversified | 1.63 | % | ||||||
| 77,000 | Leucadia National Corp. | 2,644,950 | ||||||
| 268,500 | National Patent Development Corp.* | 765,225 | ||||||
| 97,000 | Walter Industries, Inc. | 4,127,350 | ||||||
| 7,537,525 | ||||||||
Home Builders | 2.00 | % | ||||||
| 307,500 | Champion Enterprises, Inc.* | 2,890,500 | ||||||
| 115,000 | Levitt Corp. | 2,948,600 | ||||||
| 113,000 | WCI Communities, Inc.* | 3,399,040 | ||||||
| 9,238,140 | ||||||||
Home Furnishings | 0.09 | % | ||||||
| 20,000 | Furniture Brands International, Inc. | 436,200 | ||||||
Household Products | 0.67 | % | ||||||
| 157,500 | Water Pik Technologies, Inc.* | 3,102,750 | ||||||
Insurance | 3.41 | % | ||||||
| 200,000 | Conseco, Inc.* | 4,084,000 | ||||||
| 387,500 | Crawford & Co. | 2,770,625 | ||||||
| 54,000 | Fidelity National Financial, Inc. | 1,778,760 | ||||||
| 350,000 | Meadowbrook Insurance Group, Inc.* | 1,837,500 | ||||||
| 242,500 | The Phoenix Companies, Inc. | 3,099,150 | ||||||
| 48,000 | Unitrin, Inc. | 2,179,200 | ||||||
| 15,749,235 | ||||||||
Iron/Steel | 3.30 | % | ||||||
| 245,000 | AK Steel Holding Corp.* | 2,709,700 | ||||||
| 126,000 | Allegheny Technologies, Inc. | 3,037,860 | ||||||
| 167,500 | Oregon Steel Mills, Inc.* | 3,852,500 | ||||||
| 250,000 | Ryerson Tull, Inc. | 3,167,500 | ||||||
| 81,000 | Wheeling-Pittsburgh Corp.* | 2,515,050 | ||||||
| 15,282,610 | ||||||||
Lodging | 3.22 | % | ||||||
| 118,000 | Aztar Corp.* | 3,370,080 | ||||||
| 99,000 | Gaylord Entertainment Co.* | 3,999,600 | ||||||
| 138,000 | Marcus Corp. | 2,829,000 | ||||||
| 180,000 | Orient-Express Hotels, Ltd. | 4,698,000 | ||||||
| 14,896,680 | ||||||||
| Number of Shares | Value | |||||||
Machinery—Construction and Mining | 1.90 | % | ||||||
| 88,000 | Bucyrus International, Inc. | $ | 3,437,280 | |||||
| 78,000 | Joy Global, Inc. | 2,734,680 | ||||||
| 60,000 | Terex Corp.* | 2,598,000 | ||||||
| 8,769,960 | ||||||||
Machinery—Diversified | 4.38 | % | ||||||
| 130,000 | Flowserve Corp.* | 3,363,100 | ||||||
| 107,000 | Gardner Denver, Inc.* | 4,227,570 | ||||||
| 362,500 | Global Power Equipment Group, Inc.* | 3,472,750 | ||||||
| 80,000 | Manitowoc Co., Inc. | 3,231,200 | ||||||
| 93,000 | Sauer-Danfoss, Inc. | 2,104,590 | ||||||
| 187,500 | Westinghouse Air Brake Technologies Corp. | 3,841,875 | ||||||
| 20,241,085 | ||||||||
Media | 1.37 | % | ||||||
| 215,000 | Gray Television, Inc. | 3,111,050 | ||||||
| 192,500 | Journal Register Co.* | 3,214,750 | ||||||
| 6,325,800 | ||||||||
Metal Fabricate/Hardware | 3.21 | % | ||||||
| 232,500 | AM Castle & Co.* | 2,929,500 | ||||||
| 156,000 | CIRCOR International, Inc. | 3,845,400 | ||||||
| 120,000 | Commercial Metals Co. | 4,066,800 | ||||||
| 78,500 | Timken Co. | 2,146,190 | ||||||
| 205,000 | Wolverine Tube, Inc.* | 1,834,750 | ||||||
| 14,822,640 | ||||||||
Mining | 1.98 | % | ||||||
| 215,000 | Brush Engineered Materials, Inc.* | 4,091,450 | ||||||
| 143,000 | Compass Minerals International, Inc. | 3,639,350 | ||||||
| 90,000 | Oglebay Norton Co.* | 1,426,500 | ||||||
| 9,157,300 | ||||||||
Miscellaneous Manufacturing | 3.62 | % | ||||||
| 68,000 | The Brink’s Co. | 2,352,800 | ||||||
| 95,500 | EnPro Industries, Inc.* | 2,626,250 | ||||||
| 239,000 | GP Strategies Corp.* | 1,713,630 | ||||||
| 149,500 | Griffon Corp.* | 3,200,795 | ||||||
| 232,500 | Hexcel Corp* | 3,606,075 | ||||||
| 330,000 | Jacuzzi Brands, Inc.* | 3,220,800 | ||||||
| 16,720,350 | ||||||||
Oil and Gas | 10.90 | % | ||||||
| 242,500 | Carrizo Oil & Gas, Inc.* | 4,120,075 | ||||||
| 126,000 | Chesapeake Energy Corp. | 2,764,440 | ||||||
| 99,000 | Cimarex Energy Co.* | 3,861,000 | ||||||
| 150,000 | Comstock Resources, Inc.* | 4,311,000 | ||||||
| 90,000 | Encore Acquisition Co.* | 3,717,000 | ||||||
See notes to the financial statements.
KEELEY Small Cap Value Fund, Inc.
SCHEDULE OF INVESTMENTS
March 31, 2005
(Unaudited)
| Number of Shares | Value | |||||||
Oil and Gas (continued) | ||||||||
| 195,000 | Goodrich Petroleum Corp.* | $ | 4,120,350 | |||||
| 207,500 | KCS Energy, Inc.* | 3,187,200 | ||||||
| 660,000 | Parker Drilling Co.* | 3,795,000 | ||||||
| 100,000 | Plains Exploration & Production Co.* | 3,490,000 | ||||||
| 75,000 | Quicksilver Resources, Inc.* | 3,654,750 | ||||||
| 148,000 | Range Resources Corp. | 3,457,280 | ||||||
| 105,000 | Remington Oil & Gas Corp.* | 3,309,600 | ||||||
| 71,000 | Spinnaker Exploration Co.* | 2,522,630 | ||||||
| 100,000 | Whiting Petroleum Corp.* | 4,078,000 | ||||||
| 50,388,325 | ||||||||
Oil and Gas Services | 3.35 | % | ||||||
| 87,000 | FMC Technologies, Inc.* | 2,886,660 | ||||||
| 237,500 | Key Energy Services, Inc.* | 2,724,125 | ||||||
| 105,000 | Universal Compression Holdings, Inc.* | 3,976,350 | ||||||
| 80,000 | Veritas DGC, Inc.* | 2,396,800 | ||||||
| 172,500 | Willbros Group, Inc.* | 3,484,500 | ||||||
| 15,468,435 | ||||||||
Packaging and Containers | 0.87 | % | ||||||
| 257,500 | Crown Holdings, Inc.* | 4,006,700 | ||||||
Pipelines | 2.08 | % | ||||||
| 250,000 | El Paso Corp. | 2,645,000 | ||||||
| 110,000 | Western Gas Resources, Inc. | 3,789,500 | ||||||
| 170,000 | Williams Cos., Inc. | 3,197,700 | ||||||
| 9,632,200 | ||||||||
Real Estate | 0.65 | % | ||||||
| 45,000 | The St. Joe Co. | 3,028,500 | ||||||
Retail | 5.60 | % | ||||||
| 160,500 | AFC Enterprises, Inc.* | 4,094,355 | ||||||
| 134,500 | Dillard’s, Inc. | 3,618,050 | ||||||
| 75,000 | IHOP Corp. | 3,576,000 | ||||||
| 210,000 | Movado Group, Inc. | 3,885,000 | ||||||
| 190,000 | ShopKo Stores, Inc.* | 4,221,800 | ||||||
| 156,000 | The Steak n Shake Co.* | 3,018,600 | ||||||
| 192,500 | Triarc Companies, Inc. | 2,733,500 | ||||||
| 54,000 | Triarc Companies, Inc., Class B | 746,820 | ||||||
| 25,894,125 | ||||||||
| Number of Shares | Value | |||||||||
Savings and Loans | 2.22 | % | ||||||||
| 160,000 | BankAtlantic Bancorp, Inc. | $ | 2,784,000 | |||||||
| 100,000 | Citizens First Bancorp, Inc. | 2,234,000 | ||||||||
| 120,000 | Home Federal Bancorp, Inc.* | 1,458,000 | ||||||||
| 130,000 | NewAlliance Bancshares, Inc. | 1,820,000 | ||||||||
| 84,500 | TierOne Corp. | 1,985,750 | ||||||||
| 10,281,750 | ||||||||||
Software | 0.69 | % | ||||||||
| 170,000 | MoneyGram International, Inc. | 3,211,300 | ||||||||
Transportation | 1.58 | % | ||||||||
| 190,000 | Kansas City Southern* | 3,659,400 | ||||||||
| 112,000 | Laidlaw International, Inc.* | 2,329,600 | ||||||||
| 100,000 | Providence and Worcester Railroad Co. | 1,330,000 | ||||||||
| 7,319,000 | ||||||||||
Trucking and Leasing | 0.80 | % | ||||||||
| 80,000 | AMERCO* | 3,704,000 | ||||||||
Total Common Stocks | ||||||||||
(cost $358,422,575) | 443,039,901 | |||||||||
| Principal Amount | ||||||||||
SHORT-TERM INVESTMENTS | 5.59 | % | ||||||||
| $ | 6,626,000 | American Family Demand Note, 2.47% | 6,626,000 | |||||||
| 19,201,100 | US Bank Demand Note, 2.60% | 19,201,100 | ||||||||
Total Short-Term Investments | ||||||||||
(cost $25,827,100) | 25,827,100 | |||||||||
Total Investments | 101.41 | % | ||||||||
(cost $384,249,675) | 468,867,001 | |||||||||
Liabilities less Other Assets | (1.41 | )% | (6,538,766 | ) | ||||||
NET ASSETS | 100.00 | % | $ | 462,328,235 | ||||||
* Non-income producing.
Percentages are based on net assets.
See notes to the financial statements.
KEELEY Small Cap Value Fund, Inc.
STATEMENTS OF CHANGES IN NET ASSETS
| Six Months Ended March 31, 2005 (Unaudited) | Year Ended September 30, 2004 | |||||||
OPERATIONS: | ||||||||
Net investment loss | $ | (643,044 | ) | $ | (740,094 | ) | ||
Net realized gain on investments | 4,212,646 | 8,580,664 | ||||||
Change in net unrealized appreciation on investments | 33,442,191 | 29,818,413 | ||||||
Net increase in net assets resulting from operations | 37,011,793 | 37,658,983 | ||||||
DISTRIBUTIONS: | ||||||||
Net realized gains | (8,145,393 | ) | — | |||||
CAPITAL STOCK TRANSACTIONS: | ||||||||
Proceeds from 7,337,008 and 3,106,257 shares issued, respectively | 273,168,492 | 98,624,637 | ||||||
Proceeds from 186,920 and 0 shares of distributions reinvested, respectively | 6,588,931 | — | ||||||
Cost of 1,459,657 and 646,573 shares redeemed, respectively | (53,272,039 | ) | (19,777,694 | ) | ||||
Net increase from capital stock transactions | 226,485,384 | 78,846,943 | ||||||
TOTAL INCREASE IN NET ASSETS | 255,351,784 | 116,505,926 | ||||||
NET ASSETS: | ||||||||
Beginning of period | 206,976,451 | 90,470,525 | ||||||
End of period | $ | 462,328,235 | $ | 206,976,451 | ||||
See notes to the financial statements.
KEELEY Small Cap Value Fund, Inc.
FINANCIAL HIGHLIGHTS
| Six Months Ended March 31, 2005 (Unaudited) | Year Ended September 30, 2004 | Year Ended September 30, 2003 | Year Ended September 30, 2002 | Year Ended September 30, 2001 | Year Ended September 30, 2000 | |||||||||||||||||||
PER SHARE DATA (1) | ||||||||||||||||||||||||
Net asset value, beginning of period | $ | 33.95 | $ | 24.88 | $ | 21.91 | $ | 22.43 | $ | 21.82 | $ | 20.85 | ||||||||||||
Income from investment operations: | ||||||||||||||||||||||||
Net investment loss | (0.05 | ) | (0.12 | ) | (0.15 | ) | (0.21 | ) | (0.20 | ) | (0.14 | ) | ||||||||||||
Net realized and unrealized gains on investments | 5.32 | 9.19 | 4.43 | 0.85 | 1.32 | 2.00 | ||||||||||||||||||
Total from investment operations | 5.27 | 9.07 | 4.28 | 0.64 | 1.12 | 1.86 | ||||||||||||||||||
Less distributions: | ||||||||||||||||||||||||
Net realized gains | (1.20 | ) | — | (1.31 | ) | (1.16 | ) | (0.51 | ) | (0.89 | ) | |||||||||||||
Net asset value, end of period | $ | 38.02 | $ | 33.95 | $ | 24.88 | $ | 21.91 | $ | 22.43 | $ | 21.82 | ||||||||||||
Total return (2) (3) | 15.80 | % | 36.45 | % | 20.61 | % | 2.57 | % | 5.25 | % | 9.39 | % | ||||||||||||
Supplemental data and ratios: | ||||||||||||||||||||||||
Net assets, end of period (in 000’s) | $ | 462,328 | $ | 206,976 | $ | 90,471 | $ | 63,894 | $ | 57,784 | $ | 53,570 | ||||||||||||
Ratio of expenses to average net assets (4) | 1.51 | % | 1.64 | % | 1.75 | % | 1.72 | % | 1.80 | % | 1.86 | % | ||||||||||||
Ratio of net investment loss to average net assets (4) | (0.41 | )% | (0.57 | )% | (0.68 | )% | (0.90 | )% | (0.90 | )% | (0.64 | )% | ||||||||||||
Portfolio turnover rate (3) | 13.02 | % | 29.63 | % | 38.83 | % | 45.31 | % | 43.61 | % | 44.84 | % | ||||||||||||
| (1) | Per share data is for a share outstanding throughout the period. |
| (2) | The total return calculation does not reflect the sales load imposed on the purchase of shares (see Note 7). |
| (3) | Not annualized for the six months ended March 31, 2005. |
| (4) | Annualized for the six months ended March 31, 2005. |
See notes to the financial statements.
KEELEY Small Cap Value Fund, Inc.
NOTES TO THE FINANCIAL STATEMENTS
March 31, 2005
(Unaudited)
| 1. | ORGANIZATION |
The KEELEY Small Cap Value Fund, Inc. (the “Fund”) was incorporated on May 17, 1993 as a Maryland corporation and is registered as a diversified open-end investment company under the Investment Company Act of 1940 (the “1940 Act”).
| 2. | SIGNIFICANT ACCOUNTING POLICIES |
The following is a summary of significant accounting policies consistently followed by the Fund in the preparation of its financial statements. These policies are in conformity with accounting principles generally accepted in the United States of America (“GAAP”). The presentation of financial statements in conformity with GAAP requires management to make estimates and assumptions that affect the reported amounts of assets and liabilities at the date of the financial statements and the reported amounts of revenues and expenses during the reporting period. Actual results could differ from those estimates and assumptions.
a) Investment Valuation—Securities which are traded on a recognized stock exchange are valued at the last sale price each day on the securities exchange on which such securities are primarily traded or at the last sale price on a national securities exchange. Exchange-traded securities for which there were no transactions are valued at the current bid prices. Securities traded on only over-the-counter markets are valued on the basis of last sale price, or closing over-the-counter bid prices when there is no last sale price available. Debt securities (other than short-term obligations) are valued by a service that used electronic data processing methods, avoiding exclusive reliance on exchange or over-the-counter prices. Debt securities purchased within 60 days of their stated maturity date are valued at amortized cost, which approximates fair value. Securities for which quotations are not readily available are valued at fair value as determined in good faith pursuant to policies and procedures adopted by the Board of Directors. For each investment that is fair valued, the Fund considers, to the extent applicable, various factors including, but not limited to, the financial condition of the company, comparable companies in the public market, the nature and duration of the cause for a quotation not being readily available and other relevant factors.
b) Federal Income and Excise Taxes—It is the Fund’s policy to meet the requirements of the Internal Revenue Code applicable to regulated investment companies and to distribute substantially all investment company net taxable income and net capital gains to shareholders in a manner which results in no tax cost to the Fund. Therefore, no federal income or excise tax provision is recorded.
c) Distributions to Shareholders—Dividends from net investment income, if any, will be declared and paid annually. Distributions of net realized gains, if any, will be declared and paid annually. Distributions to shareholders are recorded on the ex-dividend date. The Fund may periodically make reclassifications among certain of its capital accounts as a result of the characterization of certain income and realized gains determined annually in accordance with federal tax regulations that may differ from generally accepted accounting principles. Where appropriate, reclassifications between net asset accounts are made for such differences that permanent in nature.
KEELEY Small Cap Value Fund, Inc.
NOTES TO THE FINANCIAL STATEMENTS (continued)
March 31, 2005
(Unaudited)
d) Other—Investment transactions are recorded on the trade date. The Fund determines the gain or loss realized from investment transactions by comparing the identified original cost of the security lot sold with the net sale proceeds. Dividend income is recognized on the ex-dividend date and interest income is recognized on an accrual basis.
e) Guarantees and Indemnifications—In the normal course of business, the Fund enters into contracts with service providers that contain general indemnification clauses. The Fund’s maximum exposure under these arrangements is unknown as this would involve future claims against the Fund that have not yet occurred. Based on experience, the Fund expects the risk of loss to be remote.
| 3. | INVESTMENT ADVISORY AGREEMENT |
The Fund has an agreement with Keeley Asset Management Corp. (the “Adviser”), with whom certain officers and directors of the Fund are affiliated, to furnish investment advisory services to the Fund. Under the terms of this agreement, the Fund pays the Adviser a monthly fee at the annual rate of 1.00% of the Fund’s average daily net assets. Under the investment advisory agreement, if the aggregate annual operating expenses (excluding interest, taxes, brokerage commissions and other costs incurred in connection with the purchase or sale of portfolio securities, and extraordinary items) exceed 2.50% of the Fund’s average daily net assets, the Adviser will reimburse the Fund for the amount of such excess.
| 4. | DISTRIBUTION PLAN |
The Fund has adopted a Distribution Plan (the “Plan”) pursuant to Rule 12b-1 under the 1940 Act. The Plan is designed to reimburse Keeley Investment Corp. (the “Distributor”), with whom certain officers and directors of the Fund are affiliated, for certain promotional and other sales related costs and to permit the Fund to compensate other dealers of its shares. Unreimbursed amounts may be carried forward and paid in a subsequent year, to the extent that total expenses under the plan do not exceed 0.25% of the average daily net assets of the Fund. The Fund paid to the Distributor and each dealer a monthly fee at the annual rate of 0.25% of the average daily net assets of Fund shares beneficially owned by the Distributor’s and each dealer’s existing brokerage clients. For the period from October 1, 2004 to March 31, 2005, the Fund paid $76,648 of distribution fees to the Distributor.
| 5. | INVESTMENT TRANSACTIONS |
The aggregate purchases and sales of securities, excluding short-term investments, for the Fund for the period from October 1, 2004 to March 31, 2005, were $241,527,373 and $40,248,472, respectively. For the period from October 1, 2004 to March 31, 2005, the Fund paid $742,462 of brokerage commissions on trades of securities to the Distributor.
KEELEY Small Cap Value Fund, Inc.
NOTES TO THE FINANCIAL STATEMENTS (continued)
March 31, 2005
(Unaudited)
| 6. | FEDERAL INCOME TAX INFORMATION |
At March 31, 2005, gross unrealized appreciation and depreciation of investments, based on cost for federal income tax purposes were as follows:
Cost of Investments | $ | 384,513,749 | ||
Gross Unrealized Appreciation | $ | 92,547,927 | ||
Gross Unrealized Depreciation | (8,194,675 | ) | ||
Net Unrealized Appreciation on Investments | $ | 84,353,252 | ||
The difference between cost amounts for financial statement and federal income tax purposes is due primarily to timing differences in recognizing certain gains and losses in security transactions.
The tax character of distributions paid during the fiscal years ended September 30, 2004 and 2003 were as follows:
| 2004 | 2003 | |||||
Long-Term Capital Gains | $ | — | $ | 3,967,366 | ||
As of September 30, 2004 the components of accumulated earnings on a tax basis were as follows:
Undistributed Long-Term Capital Gain | $ | 8,145,367 | |
Net Unrealized Appreciation on Investments | 51,165,001 | ||
Total Accumulated Earnings | $ | 59,310,368 | |
The Fund utilized $28,076 of its capital loss carryforwards during the year ended September 30, 2004.
| 7. | OFFERING PRICE PER SHARE |
The public offering price is the net asset value plus a sales charge, which varies in accordance with the amount of the purchase up to a maximum of 4.5%.
The Distributor retains the entire sales charge when it makes sales directly to the public. Otherwise, when sales are made through dealers, the Distributor receives a portion of the related sales charge. For the period from October 1, 2004 to March 31, 2005, the Fund was advised that the Distributor received $345,953 of sales charges. Sales charges are not an expense of the Fund and are not reflected in the financial statements of the Fund.
As specified in the Fund’s Prospectus, reduced sales charges are available through a right of accumulation and certain sales of Fund shares can be made at net asset value per share.
KEELEY Small Cap Value Fund, Inc.
NOTES TO THE FINANCIAL STATEMENTS (continued)
March 31, 2005
(Unaudited)
| 8. | RELATED PARTY TRANSACTION |
As of March 31, 2005, one director of the Fund beneficially owned 464,583 shares of the Fund, which represents 3.8% of the Fund’s outstanding shares.
KEELEY Small Cap Value Fund, Inc.
Expense Example
For the Six Months Ended March 31, 2005
(Unaudited)
As a shareholder of the KEELEY Small Cap Value Fund, Inc. (the “Fund”), you incur two types of costs: (1) transaction costs, including sales charges (loads) on purchase payments; and (2) ongoing costs, including management fees; distribution (12b-1) fees; and other Fund expenses. This Example is intended to help you understand your ongoing costs (in dollars) of investing in the Fund and to compare these costs with the ongoing costs of investing in other mutual funds.
The Example is based on an investment of $1,000 invested at the beginning of the period and held for the entire period from October 1, 2004 to March 31, 2005 (the “period”).
Actual Expenses
The first line of the table below provides information about actual account values and actual expenses. You may use the information in this line, together with the amount you invested, to estimate the expenses you paid over the period. Simply divide your account value by $1,000 (for example, an $8,600 account value divided by $1,000 equals 8.6), then multiply the result by the number in the first line under the heading entitled “Expenses Paid During Period” to estimate the expenses you paid on your account during the period.
Hypothetical Example for Comparison Purposes
The second line of the table below provides information about hypothetical account values and hypothetical expenses based on the Fund’s actual expense ratio and an assumed rate of return of 5% per year before expenses, which is not the Fund’s actual return. The hypothetical account values and expenses may not be used to estimate the actual ending account balance or expenses you paid for the period. You may use this information to compare the ongoing costs of investing in the Fund and other funds. To do so, compare this 5% hypothetical example with the 5% hypothetical examples that appear in the shareholder reports of other funds.
Please note that the expenses shown in the table are meant to highlight your ongoing costs only and do not reflect any transactional costs, such as sales charges (loads). Therefore, the second line of the table is useful in comparing the ongoing costs only, and will not help you determine the relative total costs of owning different funds. In addition, if these transactional costs were included, your costs could have been higher.
Expenses Paid During the Period
Beginning account value October 1, 2004 | Ending account value March 31, 2005 | Expenses paid during March 31, 2005* | |||||||
Actual | $ | 1,000.00 | $ | 1,158.00 | $ | 8.14 | |||
Hypothetical (5% return before expenses) | 1,000.00 | 1,017.46 | 7.61 | ||||||
| * | Expenses are equal to the Fund’s annualized expense ratio of 1.51% for the period, multiplied by the average account value over the period, multiplied by 182/365 (to reflect the one-half year period). |
Investment Adviser
KEELEY ASSET MANAGEMENT CORP.
Chicago, Illinois
Distributor
KEELEY INVESTMENT CORP.
Chicago, Illinois
Custodian
U.S. BANK, N.A.
Milwaukee, Wisconsin
Transfer Agent and Dividend Disbursing Agent
U.S. BANCORP FUND SERVICES, LLC
Milwaukee, Wisconsin
888-933-5391
Auditors
PRICEWATERHOUSECOOPERS LLP
Milwaukee, Wisconsin
Counsel
MELTZER, PURTILL, STELLE LLC
Schaumburg, Illinois
Performance information is historical and is no guarantee of future results. The investment return and principal value of shares will fluctuate and when redeemed, may be worth more or less than the investor’s original cost. This material may only be used when preceded or accompanied by the Fund’s prospectus.
401 South LaSalle Street Ÿ Suite 1201 Ÿ Chicago Ÿ Illinois Ÿ 60605
(312) 786-5050 Ÿ (800) 533-5344 Ÿ FAX (312) 786-5003
KEELEY SMALL CAP VALUE FUND, INC.
SEMI-ANNUAL REPORT
MARCH 31, 2005
| Item 2. | Code of Ethics. |
Not applicable to semi-annual reports.
| Item 3. | Audit Committee Financial Expert. |
Not applicable to semi-annual reports
| Item 4. | Principal Accountant Fees and Services |
Not applicable to semi-annual reports.
| Item 5. | Audit Committee of Listed Registrants |
Not applicable.
| Item 6. | Schedule of Investments |
The schedule of investments in securities of unaffiliated issuers is included as part of the report to shareholders filed under Item 1.
| Item 7. | Disclosure of Proxy Voting Policies and Procedures for Closed-End Management Investment Companies |
Not applicable.
| Item 8. | Portfolio Managers of Closed-End Management Investment Companies |
Not applicable.
| Item 9. | Purchases of Equity Securities by Closed-End Management Investment Company and Affiliated Purchasers |
Not applicable.
| Item 10. | Submission of Matters to a Vote of Security Holders |
As of the end of the period covered by this report, the registrant had not adopted any procedures by which shareholders may recommend nominees to the registrant’s Board of Directors.
| Item 11. | Controls and Procedures. |
(a) The registrant’s certifying officers have reasonably designed disclosure controls and procedures to ensure material information relating to the registrant is made known to them by others, particularly during the period in which this report is being prepared. The registrant’s certifying officers have determined that the registrant’s disclosure controls and procedures are effective based on their evaluation of these controls and procedures as of a date within 90 days prior to the filing date of this report.
(b) There were no significant changes in the registrant’s internal controls over financial reporting or in other factors during the second fiscal quarter of the period covered by this report that could materially affect, or are reasonably likely to materially affect these controls.
| Item 12. | Exhibits. |
(a)(1) Code of Ethics - Not applicable to semi-annual reports.
(a)(2) Certification for each principal executive and principal financial officer of the registrant as required by Rule 30a-2 under the Act (17 CFR 270.30a-2(a)) - Filed as an attachment to this filing.
(a)(3) Not applicable.
(b) Certifications required by Rule 30a-2(b) under the Act (17 CFR 270.30a-2(b)), Rule 13a-14(b) or Rule 15d-14(b) under the Exchange Act (17 CFR 240.13a-14(b) or 240.15d-14(b)), and Section 1350 of Chapter 63 of Title 18 of the United States Code (18 U.S.C. 1350) - Filed as an attachment to this filing.
SIGNATURES
Pursuant to the requirements of the Securities Exchange Act of 1934 and the Investment Company Act of 1940, the registrant has duly caused this report to be signed on its behalf by the undersigned, thereunto duly authorized.
| KEELEY Small Cap Value Fund, Inc. | ||
| By: | /s/ John L. Keeley, Jr. | |
John L. Keeley, Jr. President | ||
Date: May 25, 2005
Pursuant to the requirements of the Securities Exchange Act of 1934 and the Investment Company Act of 1940, this report has been signed below by the following persons on behalf of the registrant and in the capacities and on the dates indicated.
| By: | /s/ John L. Keeley, Jr. | |
John L. Keeley, Jr. President | ||
Date: May 25, 2005
| By: | /s/ Emily Viehweg | |
Emily Viehweg Treasurer | ||
Date: May 25, 2005