EXHIBIT 99.2

FIRST QUARTER 2008 |
| | |
| Supplemental Operating and Financial Data |
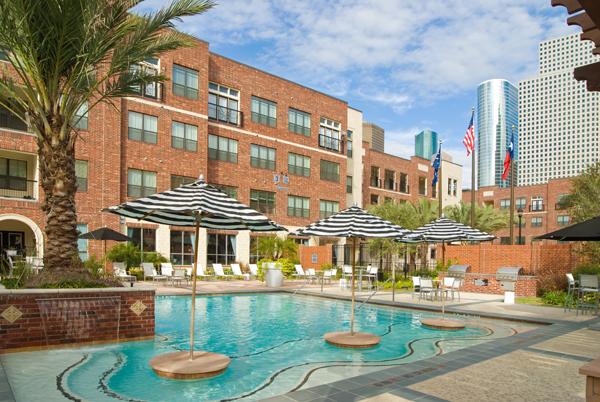
| Camden City Centre - Houston, TX |
| 379 Apartment Homes |
| Currently in Lease-Up |
| | |
| |
| Camden Property Trust |
| Three Greenway Plaza, Suite 1300 |
| Houston, Texas 77046 |
| Phone: 713-354-2500 Fax: 713-354-2700 |
www.camdenliving.com |
| |
| In addition to historical information, this document contains forward-looking statements under the federal securities law. These statements are based on current expectations, estimates and projections about the industry and markets in which Camden operates, management's beliefs, and assumptions made by management. Forward-looking statements are not guarantees of future performance and involve certain risks and uncertainties which are difficult to predict. |
| | |
| | |
| | |
CAMDEN | | TABLE OF CONTENTS |
| | |
| | | |
| | Page |
| Press Release Text | | 3 |
| Financial Highlights | | 6 |
| Operating Results | | 8 |
| Funds from Operations | | 10 |
| Balance Sheets | | 11 |
| Portfolio Statistics | | 13 |
| Components of Property Net Operating Income | | 15 |
| "Same Property" First Quarter Comparisons | | 17 |
| "Same Property" Sequential Quarter Comparisons | | 17 |
| Joint Venture Operations | | 19 |
| Current Development Pipeline | | 21 |
| Joint Venture Development Pipeline | | 23 |
| Future Development Pipeline & Land Held for Sale | | 25 |
| Redevelopment Summary | | 27 |
| Notes Receivable Summary | | 28 |
| Acquisitions & Dispositions | | 29 |
| Debt Analysis | | 30 |
| Debt Covenant Analysis | | 32 |
| Capitalized Expenditures & Maintenance Expense | | 33 |
| Non-GAAP Financial Measures - Definitions & Reconciliations | 34 |
| Other Data | | 38 |
| Community Table | | 39 |
Camden Property Trust Announces First Quarter 2008 Operating Results
HOUSTON--(BUSINESS WIRE)--Camden Property Trust (NYSE:CPT) announced that its funds from operations (“FFO”) for the first quarter of 2008 totaled $0.89 per diluted share or $52.3 million, as compared to $0.89 per diluted share or $55.9 million for the same period in 2007. The Company reported net income (“EPS”) of $14.9 million or $0.27 per diluted share for the first quarter of 2008, as compared to $13.0 million or $0.22 per diluted share for the same period in 2007. EPS for the three months ended March 31, 2008 included a $0.13 per diluted share impact from gain on sale of properties, including discontinued operations. A reconciliation of net income to FFO is included in the financial tables accompanying this press release.
Same-Property Results
For the 43,480 apartment homes included in consolidated same-property results, first quarter 2008 same-property net operating income (“NOI”) increased 1.4% compared to the first quarter of 2007, with revenues increasing 1.5% and expenses increasing 1.6%. On a sequential basis, first quarter 2008 same-property NOI declined 1.2% compared to the fourth quarter of 2007, with revenues increasing 0.5% and expenses increasing 3.5% compared to the prior quarter. Same-property physical occupancy levels for the portfolio averaged 93.8% during the first quarter of 2008, compared to 94.5% in the first quarter of 2007 and 93.6% in the fourth quarter of 2007.
The Company defines same-property communities as communities owned and stabilized as of January 1, 2007, excluding properties held for sale and communities under redevelopment. A reconciliation of net income to net operating income and same-property net operating income is included in the financial tables accompanying this press release.
Development Activity
During the first quarter, lease-up was completed at Camden Old Creek in San Marcos, CA, a $92.2 million project that is currently 94% occupied. As of March 31, 2008, Camden had three wholly-owned apartment communities which were completed and in lease-up: Camden Royal Oaks in Houston, TX, a $21.0 million project that is currently 86% leased; Camden Monument Place in Fairfax, VA, a $62.4 million project that is currently 88% leased; and Camden City Centre in Houston, TX, a $51.6 million project that is currently 77% leased. The Company also had one joint venture community which was completed and in lease-up: Camden Plaza in Houston, TX, a $40.8 million project that is currently 80% leased.
The Company has eight additional communities currently under construction and in lease-up: Camden Potomac Yard in Arlington, VA, a $110.0 million project that is currently 34% leased; Camden Summerfield in Landover, MD, a $68.0 million project that is currently 36% leased; Camden Orange Court in Orlando, FL, a $49.0 million project that is currently 14% leased; Camden Dulles Station in Oak Hill, VA, a $77.0 million project that is currently 9% leased; Camden Cedar Hills in Austin, TX, a $27.0 million project that is currently 3% leased; Camden Whispering Oaks in Houston, TX, a $30.0 million project that is currently 3% leased; Camden College Park in College Park, MD, a $139.9 million joint venture project that is currently 32% leased; and Camden Main & Jamboree in Irvine, CA, a $115.0 million joint venture project that is currently 27% leased.
Camden’s current development pipeline under construction includes six wholly-owned communities comprising 1,778 apartment homes with a total budgeted cost of $361.0 million. The Company also has five joint venture communities under construction comprising 1,605 apartment homes with a total budgeted cost of $376.7 million.
Camden’s future development pipeline currently consists of 18 potential developments comprising 5,855 apartment homes and a total estimated cost of $1.5 billion. The future pipeline represents projects in the early phase of the development process for which Camden either owns the land, has an option to acquire the land or enter into a leasehold interest, or is the buyer under a long-term conditional contract.
Disposition Activity
During the quarter, the Company disposed of Camden Ridgeview, a 167-home apartment community in Austin, TX for $10.6 million, resulting in a gain on sale of $6.1 million. The Company also sold 4,100 square feet of retail space adjacent to its regional office in Las Vegas for $1.4 million, resulting in a gain on sale of $1.1 million.
Properties and Land Held for Sale
At March 31, 2008, Camden had two operating communities consisting of 272 apartment homes held for sale: Camden Pinnacle, a 224-home apartment community in Denver, CO; and Oasis Sands, a 48-home apartment community in Las Vegas, NV.
The Company also had 4.6 acres of undeveloped land in Boca Raton, FL and Dallas, TX classified as held for sale at quarter-end.
Stock Repurchase
During the first quarter of 2008, Camden repurchased 690,400 common shares at an average price per share of $43.41, for a total of $30.0 million. The Company completed a total of $230.1 million of common share repurchases during 2007 and early 2008.
Earnings Guidance
Camden’s earnings guidance for 2008 is based on its current and expected views of the apartment market and general economic conditions. Full-year 2008 FFO is expected to be $3.60 to $3.80 per diluted share, and full-year 2008 EPS is expected to be $0.57 to $0.77 per diluted share. Second quarter 2008 earnings guidance is $0.87 to $0.91 per diluted share for FFO and $0.08 to $0.12 per diluted share for EPS. Guidance for EPS excludes potential future gains on the sale of properties. Camden intends to update its earnings guidance to the market on a quarterly basis. A reconciliation of expected net income to expected FFO is included in the financial tables accompanying this press release.
Conference Call
The Company will hold a conference call on Friday, May 2, 2008 at 10:00 a.m. Central Time to review its first quarter 2008 results and discuss its outlook for future performance. To participate in the call, please dial (800) 860-2442 (domestic) or (412) 858-4600 (international) by 9:50 a.m. Central Time and request the Camden Property Trust First Quarter 2008 Earnings Call, or join the live webcast of the conference call by accessing the Investor Relations section of the Company’s website at www.camdenliving.com. Supplemental financial information is available in the Investor Relations section of the Company’s website under Earnings Releases or by calling Camden’s Investor Relations Department at (800) 922-6336.
Annual Meeting of Shareholders
Camden’s Annual Meeting of Shareholders will be held on May 6, 2008 at the Renaissance Hotel, 6 East Greenway Plaza, Houston, Texas, at 1:30 p.m., Central Standard Time. The Company’s proxy statement, 10-K, and Annual Report to Shareholders are available in the Investor Relations section of the company’s website at www.camdenliving.com. If you wish to receive hard copies of these documents, please contact Camden’s Investor Relations Department at ir@camdenliving.com.
Forward-Looking Statements
In addition to historical information, this press release contains forward-looking statements under the federal securities law. These statements are based on current expectations, estimates and projections about the industry and markets in which Camden operates, management's beliefs, and assumptions made by management. Forward-looking statements are not guarantees of future performance and involve certain risks and uncertainties which are difficult to predict.
About Camden
Camden Property Trust, an S&P 400 Company, is a real estate company engaged in the ownership, development, acquisition, management and disposition of multifamily apartment communities. Camden owns interests in and operates 181 properties containing 62,918 apartment homes across the United States. Upon completion of 11 properties under development, the Company’s portfolio will increase to 66,301 apartment homes in 192 properties. Camden was recently named to FORTUNE® Magazine’s list of the “100 Best Companies to Work For.”
For additional information, please contact Camden’s Investor Relations Department at (800) 922-6336 or (713) 354-2787 or access our website at www.camdenliving.com.
CAMDEN | FINANCIAL HIGHLIGHTS (In thousands, except per share, property data amounts and ratios) | |
| (Unaudited) | | | | | | |
| | | | Three Months Ended March 31, | |
| | | | | 2008 | | | | 2007 | | |
| Total property revenues (a) | | $ | 156,723 | | | $ | 147,676 | | |
| | | | | | | |
| EBITDA | | | | | 87,340 | | | | 86,159 | | |
| | | | | | | |
| Net income | | | | 14,915 | | | | 13,037 | | |
| Per share - basic | | | 0.27 | | | | 0.22 | | |
| Per share - diluted | | | 0.27 | | | | 0.22 | | |
| | | | | | | |
| Income from continuing operations | | | 8,560 | | | | 11,121 | | |
| per share - basic | | | 0.16 | | | | 0.19 | | |
| per share - diluted | | | 0.16 | | | | 0.19 | | |
| | | | | | | |
| Funds from operations | | | 52,330 | | | | 55,919 | | |
| Per share - diluted | | | 0.89 | | | | 0.89 | | |
| | | | | | | |
| Dividends per share | | | 0.70 | | | | 0.69 | | |
| Dividend payout ratio | | | 78.7 | % | | | 77.5 | % | |
| | | | | | | |
| Interest expensed (including discontinued operations) | | | 32,775 | | | | 27,911 | | |
| Interest capitalized | | | 5,360 | | | | 5,136 | | |
| Total interest incurred | | | 38,135 | | | | 33,047 | | |
| | | | | | | |
| Principal amortization | | | 3,280 | | | | 3,535 | | |
| Preferred dividends & distributions | | | 1,750 | | | | 1,750 | | |
| | | | | | | |
| Interest expense coverage ratio | | | 2.7 | | x | | 3.1 | | x |
| Total interest coverage ratio | | | 2.3 | | x | | 2.6 | | x |
| Fixed charge expense coverage ratio | | | 2.3 | | x | | 2.6 | | x |
| Total fixed charge coverage ratio | | | 2.0 | | x | | 2.2 | | x |
| | | | | | | |
| Same property NOI increase (b) | | | 1.4 | % | | | 5.5 | % | |
| (# of apartment homes included) | | | 43,480 | | | | 44,604 | | |
| | | | | | | |
| Gross turnover of apartment homes (annualized) | | | 60 | % | | | 59 | % | |
| Net turnover (excludes on-site transfers and transfers to other Camden communities) | | 53 | % | | | 52 | % | |
| | | | | | | |
| | | | | | | |
| | | | As of March 31, | |
| | | | | 2008 | | | | 2007 | | |
| Total assets | | | $ | 4,892,116 | | | $ | 4,679,880 | | |
| Total debt | | | $ | 2,910,958 | | | $ | 2,466,596 | | |
| Common and common equivalent shares, outstanding end of period (c) | | 58,611 | | | | 63,000 | | |
| Share price, end of period | | $ | 50.20 | | | $ | 70.31 | | |
| Preferred units, end of period | | $ | 97,925 | | | $ | 97,925 | | |
| Book equity value, end of period (d) | | $ | 1,682,851 | | | $ | 1,930,941 | | |
| Market equity value, end of period (d) | | $ | 3,042,272 | | | $ | 4,529,530 | | |
| | | | | | | |
| Debt to total market capitalization ratio | | | 48.9 | % | | | 35.3 | % | |
| | | | | | | |
| Unencumbered real estate assets (at cost) | | | | | |
| to unsecured debt ratio | | | 194 | % | | | 225 | % | |
| | | | | | | |
| | | | | | | |
| | | | | | | |
| (a) Excludes discontinued operations. | | | | | |
| | | | | | | |
| (b) "Same Property" Communities are communities which were owned by the Company and stabilized as of January 1, 2007, excluding properties held for sale and communities under redevelopment. |
| | | | | | | |
(c) Includes at March 31, 2008: 55,525 common shares (including 184 common share equivalents related to share awards & options), plus common share equivalents upon the assumed conversion of minority interest units (3,086) |
| | | | | | | |
| (d) Includes: common shares, preferred and common units, and common share equivalents |
| | | | | | | |
| Note: Please refer to pages 24 and 25 for definitions and reconciliations of all non-GAAP financial measures presented in this document. |
CAMDEN | | | | | | | | OPERATING RESULTS |
| | | | | | | | | | (In thousands, except per share and property data amounts) |
| | | | | | | | | | | | |
| | | | | | | | | | | |
| (Unaudited) | | | | | | | | Three Months Ended |
| | | | | | | | | March 31, |
| OPERATING DATA | | | | | | | 2008 | | 2007 |
| Property revenues | | | | | | | | | |
| Rental revenues | | | | | | | $ | 138,793 | | | $ | 133,036 | |
| Other property revenues | | | | | | | 17,930 | | | | 14,640 | |
| Total property revenues | | | | | | | 156,723 | | | | 147,676 | |
| | | | | | | | | | | |
| Property expenses | | | | | | | | | |
| Property operating and maintenance | | | | | | 40,985 | | | | 38,589 | |
| Real estate taxes | | | | | | | | 17,917 | | | | 16,049 | |
| Total property expenses | | | | | | | 58,902 | | | | 54,638 | |
| | | | | | | | | | | |
| Non-property income | | | | | | | | | |
| Fee and asset management income | | | | | | 2,412 | | | | 2,386 | |
| Interest and other income | | | | | | | 1,333 | | | | 1,562 | |
| Income on deferred compensation plans | | | | | | (8,541 | ) | | | 2,306 | |
| Total non-property income | | | | | | | (4,796 | ) | | | 6,254 | |
| | | | | | | | | | | |
| Other expenses | | | | | | | | | |
| Property management | | | | | | | | 4,900 | | | | 4,728 | |
| Fee and asset management | | | | | | | 1,725 | | | | 1,620 | |
| General and administrative | | | | | | | 7,960 | | | | 8,054 | |
| Interest | | | | | | | | | 32,661 | | | | 27,790 | |
| Depreciation and amortization | | | | | | | 42,785 | | | | 39,053 | |
| Amortization of deferred financing costs | | | | | | 742 | | | | 913 | |
| Expense on deferred compensation plans | | | | | | (8,541 | ) | | | 2,306 | |
| Total other expenses | | | | | | | 82,232 | | | | 84,464 | |
| | | | | | | | | | | |
| Income from continuing operations before gain on sale of properties, | | | | | |
| equity in income of joint ventures, minority interests and income taxes | | | | 10,793 | | | | 14,828 | |
| Gain on sale of properties, including land | | | | 1,106 | | | | - | |
| Equity in income (loss) of joint ventures | | | | | | (47 | ) | | | 735 | |
| Minority interests | | | | | | | | | |
| Distributions on perpetual preferred units | | | | (1,750 | ) | | | (1,750 | ) |
| Income allocated to common units and other minority interests | | | | (1,269 | ) | | | (787 | ) |
| Income from continuing operations before income taxes | | | | 8,833 | | | | 13,026 | |
Income tax expense | | | | (273 | ) | | | (1,905 | ) |
| Income from continuing operations | | | | | | 8,560 | | | | 11,121 | |
| Income from discontinued operations | | | | | | 228 | | | | 2,186 | |
| Gain on sale of discontinued operations | | | | | | 6,127 | | | | - | |
| Income from discontinued operations allocated to common units | | | | - | | | | (270 | ) |
| Net income | | | | | | | | $ | 14,915 | | | $ | 13,037 | |
| | | | | | | | | | | |
| PER SHARE DATA | | | | | | | | | |
| Net income - basic | | | | | | | $ | 0.27 | | | $ | 0.22 | |
| Net income - diluted | | | | | | | | 0.27 | | | | 0.22 | |
| Income from continuing operations - basic | | | | | 0.16 | | | | 0.19 | |
| Income from continuing operations - diluted | | | | 0.16 | | | | 0.19 | |
| | | | | | | | | | | |
| Weighted average number of common and | | | | | | |
| common equivalent shares outstanding: | | | | | | | |
| Basic | | | | | | | | | 54,965 | | | | 58,813 | |
| Diluted | | | | | | | | | 55,625 | | | | 59,994 | |
| | | | | | | | | | | |
| PROPERTY DATA | | | | | | | | | |
| Total operating properties (end of period) (a) | | | | 181 | | | | 187 | |
| Total operating apartment homes in operating properties (end of period) (a) | | | | 62,918 | | | | 64,516 | |
| Total operating apartment homes (weighted average) | | | | 51,763 | | | | 53,097 | |
| Total operating apartment homes - excluding discontinued operations (weighted average) | | | | 51,380 | | | | 49,604 | |
| | | | | | | | | | | |
| | | | | | | | | | | |
| (a) Includes joint ventures and properties held for sale. | | | | | |
| | | | | | | | | | | |
| Note: Please refer to pages 24 and 25 for definitions and reconciliations of all non-GAAP financial measures presented in this document. |
| CAMDEN | | | | | | | FUNDS FROM OPERATIONS |
| | | | | | | | | (In thousands, except per share and property data amounts) |
| | | | | | | | | | | |
| | | | | | | | | | |
| | | | | | | | | | |
| (Unaudited) | | | | | | Three Months Ended |
| | | | | | | | March 31, |
FUNDS FROM OPERATIONS | | | | 2008 | | 2007 |
| | | | | | | | | | |
| Net income | | | | | | $ | 14,915 | | | $ | 13,037 |
| Real estate depreciation and amortization from continuing operations | | | 41,921 | | | | 38,338 |
| Real estate depreciation from discontinued operations | | | 17 | | | | 1,268 |
| Adjustments for unconsolidated joint ventures | | | 1,539 | | | | 1,086 |
| Income from continuing operations allocated to common units | | | 1,156 | | | | 736 |
| Income from discontinued operations allocated to common units | | | - | | | | 270 |
| (Gain) loss on sale of operating properties, net of taxes | | | (1,106 | ) | | | 1,184 |
| (Gain) on sale of discontinued operations | | | (6,112 | ) | | | - |
| Funds from operations - diluted | | | $ | 52,330 | | | $ | 55,919 |
| | | | | | | | | | |
PER SHARE DATA | | | | | | | |
| Funds from operations - diluted | | | | $ | 0.89 | | | $ | 0.89 |
| Cash distributions | | | | | | 0.70 | | | | 0.69 |
| | | | | | | | | | |
| Weighted average number of common and | | | | |
| common equivalent shares outstanding: | | | | |
| FFO - diluted | | | | | | | 58,544 | | | | 63,021 |
| | | | | | | | | | |
PROPERTY DATA | | | | | | | |
| Total operating properties (end of period) (a) | | | 181 | | | | 187 |
| Total operating apartment homes in operating properties (end of period) (a) | | | 62,918 | | | | 64,516 |
| Total operating apartment homes (weighted average) | | | 51,763 | | | | 53,097 |
| Total operating apartment homes - excluding discontinued operations (weighted average) | | | 51,380 | | | | 49,604 |
| | | | | | | | | | |
| | | | | | | | | | |
| (a) Includes joint ventures and properties held for sale. | | | | |
| |
Note: Please refer to pages 24 and 25 for definitions and reconciliations of all non-GAAP financial measures presented in this document. |
| CAMDEN | | | | | | | | | BALANCE SHEETS |
| | | | | | | | | | (In thousands) |
| | | | | | | | | | | | | |
| | | | | | | | | | | | |
| (Unaudited) | | | | Mar 31, | | Dec 31, | | Sep 30, | | Jun 30, | | Mar 31, |
| | | | 2008 | | 2007 | | 2007 | | 2007 | | 2007 |
| ASSETS | | | | | | | | | | | | |
| Real estate assets, at cost | | | | | | | | | | | |
| Land | | | | $ | 749,664 | | | $ | 730,548 | | | $ | 714,044 | | | $ | 713,084 | | | $ | 703,850 | |
| Buildings and improvements | | | | 4,435,787 | | | | 4,316,472 | | | | 4,215,662 | | | | 4,144,075 | | | | 4,108,955 | |
| | | | | 5,185,451 | | | | 5,047,020 | | | | 4,929,706 | | | | 4,857,159 | | | | 4,812,805 | |
| Accumulated depreciation | | | | (907,643 | ) | | | (868,074 | ) | | | (827,944 | ) | | | (788,318 | ) | | | (799,624 | ) |
| Net operating real estate assets | | | 4,277,808 | | | | 4,178,946 | | | | 4,101,762 | | | | 4,068,841 | | | | 4,013,181 | |
| Properties under development, including land | | | 358,994 | | | | 446,664 | | | | 488,620 | | | | 454,617 | | | | 410,002 | |
| Investments in joint ventures | | | | 12,526 | | | | 8,466 | | | | 12,243 | | | | 12,722 | | | | 8,321 | |
| Properties held for sale, including land | | | 23,299 | | | | 25,253 | | | | 73,325 | | | | 72,577 | | | | 32,879 | |
| Total real estate assets | | | | 4,672,627 | | | | 4,659,329 | | | | 4,675,950 | | | | 4,608,757 | | | | 4,464,383 | |
| Accounts receivable - affiliates | | | 36,166 | | | | 35,940 | | | | 36,171 | | | | 35,341 | | | | 34,854 | |
| Notes receivable | | | | | | | | | | | |
| Affiliates | | | | | 52,331 | | | | 50,358 | | | | 48,172 | | | | 45,560 | | | | 43,507 | |
| Other | | | | | 8,710 | | | | 11,565 | | | | 11,565 | | | | 11,565 | | | | 11,565 | |
| Other assets, net (a) | | | | 116,010 | | | | 126,996 | | | | 129,810 | | | | 136,524 | | | | 118,329 | |
| Cash and cash equivalents | | | | 947 | | | | 897 | | | | 1,207 | | | | 3,058 | | | | 1,470 | |
| Restricted cash | | | | 5,325 | | | | 5,675 | | | | 5,904 | | | | 20,053 | | | | 5,772 | |
| Total assets | | | $ | 4,892,116 | | | $ | 4,890,760 | | | $ | 4,908,779 | | | $ | 4,860,858 | | | $ | 4,679,880 | |
| | | | | | | | | | | | |
| | | | | | | | | | | | |
| | | | | | | | | | | | |
| LIABILITIES AND SHAREHOLDERS' EQUITY | | | | | | | | | | |
| Liabilities | | | | | | | | | | | | |
| Notes payable | | | | | | | | | | | |
| Unsecured | | | | $ | 2,351,006 | | | $ | 2,265,319 | | | $ | 2,198,628 | | | $ | 2,065,175 | | | $ | 1,897,865 | |
| Secured | | | | | 559,952 | | | | 562,776 | | | | 565,564 | | | | 566,001 | | | | 568,731 | |
| Accounts payable and accrued expenses | | | 90,779 | | | | 107,403 | | | | 110,643 | | | | 128,892 | | | | 110,486 | |
| Accrued real estate taxes | | | | 17,769 | | | | 24,943 | | | | 42,151 | | | | 29,785 | | | | 16,036 | |
| Other liabilities (b) | | | | 146,817 | | | | 136,365 | | | | 117,317 | | | | 115,547 | | | | 110,684 | |
| Distributions payable | | | | 42,942 | | | | 42,689 | | | | 44,180 | | | | 44,982 | | | | 45,137 | |
| Total liabilities | | | | 3,209,265 | | | | 3,139,495 | | | | 3,078,483 | | | | 2,950,382 | | | | 2,748,939 | |
| | | | | | | | | | | | |
| Commitments and contingencies | | | | | | | | | | |
| | | | | | | | | | | | |
| Minority interests | | | | | | | | | | | |
| Perpetual preferred units | | | | 97,925 | | | | 97,925 | | | | 97,925 | | | | 97,925 | | | | 97,925 | |
| Common units | | | | 97,416 | | | | 111,624 | | | | 104,176 | | | | 105,353 | | | | 102,217 | |
| Other minority interests | | | | 8,537 | | | | 10,403 | | | | 10,740 | | | | 10,916 | | | | 10,335 | |
| Total minority interests | | | | 203,878 | | | | 219,952 | | | | 212,841 | | | | 214,194 | | | | 210,477 | |
| | | | | | | | | | | | |
| Shareholders' equity | | | | | | | | | | | |
| Common shares of beneficial interest | | | 660 | | | | 654 | | | | 654 | | | | 654 | | | | 654 | |
| Additional paid-in capital | | | | 2,227,256 | | | | 2,209,631 | | | | 2,207,333 | | | | 2,204,525 | | | | 2,199,713 | |
| Distributions in excess of net income | | | (250,845 | ) | | | (227,025 | ) | | | (269,667 | ) | | | (241,711 | ) | | | (243,786 | ) |
| Employee notes receivable | | | | (306 | ) | | | (1,950 | ) | | | (1,963 | ) | | | (1,976 | ) | | | (2,025 | ) |
| Treasury shares, at cost | | | | (463,574 | ) | | | (433,874 | ) | | | (318,902 | ) | | | (265,210 | ) | | | (234,092 | ) |
| Other comprehensive loss (c) | | | (34,218 | ) | | | (16,123 | ) | | | - | | | | - | | | | - | |
| Total shareholders' equity | | | | 1,478,973 | | | | 1,531,313 | | | | 1,617,455 | | | | 1,696,282 | | | | 1,720,464 | |
| Total liabilities and shareholders' equity | | $ | 4,892,116 | | | $ | 4,890,760 | | | $ | 4,908,779 | | | $ | 4,860,858 | | | $ | 4,679,880 | |
| | | | | | | | | | | | |
| | | | | | | | | | | | |
| | | | | | | | | | | | |
| (a) includes: | | | | | | | | | | | |
| net deferred charges of: | | | $ | 10,287 | | | $ | 10,811 | | | $ | 10,308 | | | $ | 11,565 | | | $ | 9,724 | |
| value of in place leases of: | | | $ | 62 | | | $ | 258 | | | $ | 703 | | | $ | 1,091 | | | $ | 61 | |
| | | | | | | | | | | | |
| (b) includes: | | | | | | | | | | | |
| deferred revenues of: | | | $ | 2,575 | | | $ | 2,459 | | | $ | 2,738 | | | $ | 2,937 | | | $ | 3,321 | |
| above/below market leases of: | | | ($6 | ) | | | ($13 | ) | | $ | 25 | | | $ | 43 | | | $ | 8 | |
| distributions in excess of investments in joint ventures of: | | $ | 25,065 | | | $ | 23,653 | | | $ | 20,867 | | | $ | 19,549 | | | $ | 18,805 | |
| fair value adjustment of derivative instrument: | | $ | 34,218 | | | $ | 16,123 | | | | - | | | | - | | | | - | |
| | | | | | | | | | | | |
| (c) Represents the fair value adjustment of the derivative instrument. | | | | | | |
| CAMDEN | | | | | | | | | | | | | | | PORTFOLIO STATISTICS |
| | | | | | | | | | | | | | | | | | | | | |
| | | | | | | | | | | | | | | | | | | | | |
| | | | | | | | | | | | | | | | | | | | |
| (Unaudited) | | | | | | | | | | | | | | | | | | |
| | | | | | | | | | | | | | | | | | | | |
| COMMUNITY PORTFOLIO AT MARCH 31, 2008 (in apartment homes) | | | | | | | | | | | | |
| | | | | | | | | | | | | | | | | | | | |
| | | | "Same Property" | | Non-"Same Property" (a) | | Wholly - Owned | | Joint Venture | | Stabilized Operating | | Completed in Lease-up | | Total Operating | | Under Development | | Total |
| D.C. Metro (b)(c) | | 2,663 | | | 1,494 | | | 4,157 | | | - | | 4,157 | | | 368 | | | 4,525 | | | 1,543 | | | 6,068 | |
| Las Vegas, NV | | 2,889 | | | 1,128 | | | 4,017 | | | 4,047 | | 8,064 | | | - | | | 8,064 | | | - | | | 8,064 | |
| Los Angeles/Orange County, CA (d) | | 1,770 | | | - | | | 1,770 | | | 421 | | 2,191 | | | - | | | 2,191 | | | 290 | | | 2,481 | |
| San Diego/Inland Empire, CA | | 846 | | | 350 | | | 1,196 | | | - | | 1,196 | | | - | | | 1,196 | | | - | | | 1,196 | |
| Tampa, FL | | 4,613 | | | 890 | | | 5,503 | | | - | | 5,503 | | | - | | | 5,503 | | | - | | | 5,503 | |
| Dallas, TX | | 6,345 | | | 424 | | | 6,769 | | | 456 | | 7,225 | | | - | | | 7,225 | | | - | | | 7,225 | |
| Houston, TX (e) | | 3,350 | | | 894 | | | 4,244 | | | 1,216 | | 5,460 | | | 886 | | | 6,346 | | | 733 | | | 7,079 | |
| SE Florida | | 2,520 | | | - | | | 2,520 | | | - | | 2,520 | | | - | | | 2,520 | | | - | | | 2,520 | |
| Charlotte, NC | | 3,286 | | | 288 | | | 3,574 | | | - | | 3,574 | | | - | | | 3,574 | | | - | | | 3,574 | |
| Orlando, FL | | 3,296 | | | - | | | 3,296 | | | - | | 3,296 | | | - | | | 3,296 | | | 261 | | | 3,557 | |
| Atlanta, GA | | 3,202 | | | - | | | 3,202 | | | - | | 3,202 | | | - | | | 3,202 | | | - | | | 3,202 | |
| Denver, CO | | 1,985 | | | 224 | | | 2,209 | | | 320 | | 2,529 | | | - | | | 2,529 | | | - | | | 2,529 | |
| Raleigh, NC | | 2,220 | | | 484 | | | 2,704 | | | - | | 2,704 | | | - | | | 2,704 | | | - | | | 2,704 | |
| Phoenix, AZ | | 1,441 | | | - | | | 1,441 | | | 992 | | 2,433 | | | - | | | 2,433 | | | - | | | 2,433 | |
| Austin, TX (f) | | 2,358 | | | 253 | | | 2,611 | | | - | | 2,611 | | | - | | | 2,611 | | | 556 | | | 3,167 | |
| Other | | 696 | | | 1,066 | | | 1,762 | | | 3,237 | | 4,999 | | | - | | | 4,999 | | | - | | | 4,999 | |
| | | | | | | | | | | | | | | | | | | | |
| | Total Portfolio | | 43,480 | | | 7,495 | | | 50,975 | | | 10,689 | | 61,664 | | | 1,254 | | | 62,918 | | | 3,383 | | | 66,301 | |
| | | | | | | | | | | | | | | | | | | | |
| (a) Includes ten redevelopment properties (3,512 apartment homes) and two properties held for sale and reported in discontinued operations (272 apartment homes). |
| (b) D.C. Metro includes Washington D.C., Maryland, and Northern Virginia. | | | | | | | | | | |
| (c) 508 units under development in College Park, MD are held through a joint venture investment. | | | | | | |
| (d) 290 units under development in Irvine, CA are held through a joint venture investment. | | | | | | |
| (e) 459 units under development and 271 units completed in lease-up in Houston, TX are held through joint venture investments. |
| (f) 348 units under development in Austin, TX are held through a joint venture investment. | | | | | | |
| | | | | | | | | | | | | | | | | | | | |
| FIRST QUARTER NOI CONTRIBUTION PERCENTAGE BY REGION | | | | WEIGHTED AVERAGE OCCUPANCY FOR THE QUARTER ENDED: (h) |
| | | | | | | | | | | | | | | | | | | | |
| | | | | | | | | | | | | | | | | | | | |
| | | | "Same Property" | | Operating | | Incl. JVs at | | | | Mar 31 | | Dec 31 | | Sep 30 | | Jun 30 | | Mar 31 |
| | | | Communities | | Communities (f) | | Pro Rata % (g) | | 2008 | | | 2007 | | | 2007 | | | 2007 | | | 2007 | |
| D.C. Metro | | 10.4 | % | | 14.3 | % | | 13.8 | % | | | | 94.4 | % | | 94.2 | % | | 95.6 | % | | 95.8 | % | | 95.5 | % |
| Las Vegas, NV | | 6.5 | % | | 7.6 | % | | 8.7 | % | | | | 93.9 | % | | 93.7 | % | | 94.6 | % | | 95.3 | % | | 95.5 | % |
| Los Angeles/Orange County, CA | | 7.9 | % | | 6.6 | % | | 6.6 | % | | | | 93.5 | % | | 93.9 | % | | 94.5 | % | | 93.3 | % | | 92.7 | % |
| San Diego/Inland Empire, CA | | 3.1 | % | | 3.5 | % | | 3.4 | % | | | | 94.5 | % | | 95.1 | % | | 94.3 | % | | 93.1 | % | | 93.8 | % |
| Tampa, FL | | 8.3 | % | | 8.1 | % | | 7.8 | % | | | | 93.8 | % | | 92.6 | % | | 93.3 | % | | 94.2 | % | | 94.5 | % |
| Dallas, TX | | 9.1 | % | | 8.1 | % | | 7.9 | % | | | | 92.7 | % | | 92.5 | % | | 93.5 | % | | 94.6 | % | | 94.4 | % |
| Houston, TX | | 6.1 | % | | 7.1 | % | | 7.3 | % | | | | 95.2 | % | | 94.6 | % | | 95.2 | % | | 95.2 | % | | 95.0 | % |
| SE Florida | | 8.9 | % | | 7.5 | % | | 7.3 | % | | | | 94.3 | % | | 94.3 | % | | 95.4 | % | | 95.4 | % | | 96.2 | % |
| Charlotte, NC | | 7.5 | % | | 6.7 | % | | 6.5 | % | | | | 92.9 | % | | 93.8 | % | | 95.2 | % | | 95.7 | % | | 95.1 | % |
| Orlando, FL | | 7.0 | % | | 5.8 | % | | 5.6 | % | | | | 93.9 | % | | 92.9 | % | | 93.6 | % | | 93.5 | % | | 92.6 | % |
| Atlanta, GA | | 6.9 | % | | 5.9 | % | | 5.6 | % | | | | 93.5 | % | | 94.1 | % | | 95.6 | % | | 94.7 | % | | 93.5 | % |
| Denver, CO | | 4.9 | % | | 4.4 | % | | 4.6 | % | | | | 94.5 | % | | 95.5 | % | | 96.1 | % | | 96.0 | % | | 94.5 | % |
| Raleigh, NC | | 4.6 | % | | 4.6 | % | | 4.5 | % | | | | 94.1 | % | | 92.5 | % | | 93.8 | % | | 95.0 | % | | 93.4 | % |
| Phoenix, AZ | | 3.3 | % | | 2.7 | % | | 2.9 | % | | | | 93.2 | % | | 93.4 | % | | 94.5 | % | | 94.2 | % | | 95.1 | % |
| Austin, TX | | 3.9 | % | | 3.9 | % | | 3.7 | % | | | | 94.1 | % | | 93.8 | % | | 94.3 | % | | 94.7 | % | | 93.8 | % |
| Other | | 1.6 | % | | 3.2 | % | | 3.8 | % | | | | 94.8 | % | | 94.3 | % | | 95.0 | % | | 95.5 | % | | 94.9 | % |
| | | | | | | | | | | | | | | | | | | | |
| | Total Portfolio | | 100.0 | % | | 100.0 | % | | 100.0 | % | | | | 93.9 | % | | 93.7 | % | | 94.5 | % | | 94.9 | % | | 94.6 | % |
| | | | | | | | | | | | | | | | | | | | |
| | | | | | | | | | | | | | | | | | | | |
| (f) Operating communities include wholly-owned communities and completed communities in lease-up at quarter end and exclude communities sold during the quarter. |
| (g) Based on total NOI from operating communities plus Camden's pro-rata share of total NOI from joint venture communities. |
| (h) Occupancy figures include apartment homes held through joint venture investments but exclude communities in lease-up, under development, or under redevelopment. |
| CAMDEN | | | | | COMPONENTS OF |
| | | | | | | PROPERTY NET OPERATING INCOME |
| | | | | | | (In thousands, except property data amounts) |
| | | | | | | | | | | | | | |
| | | | | | | | | | | | | |
| (Unaudited) | | | | | | | | | | | |
| | | | | | | | | | | | | |
| | | | | | | | | | | | | |
| | | | | Apartment | | Three Months Ended March 31, |
| Property Revenues | | | Homes | | 2008 | | | | 2007 | | Change |
| "Same Property" Communities (a) | | 43,480 | | $ | 129,340 | | | | | $ | 127,479 | | | $ | 1,861 | |
| Non-"Same Property" Communities (b) | | 3,711 | | | 13,286 | | | | | | 9,307 | | | | 3,979 | |
| Development and Lease-Up Communities (c) | | 2,761 | | | 3,053 | | | | | | 265 | | | | 2,788 | |
| Redevelopment Communities (d) | | | 3,512 | | | 9,829 | | | | | | 9,495 | | | | 334 | |
| Dispositions / Other (e) | | | - | | | 1,215 | | | | | | 1,130 | | | | 85 | |
| Total Property Revenues | | | 53,464 | | $ | 156,723 | | | | | $ | 147,676 | | | $ | 9,047 | |
| | | | | | | | | | | | | |
| Property Expenses | | | | | | | | | | | |
| "Same Property" Communities (a) | | 43,480 | | $ | 48,012 | | | | | $ | 47,247 | | | $ | 765 | |
| Non-"Same Property" Communities (b) | | 3,711 | | | 4,296 | | | | | | 2,912 | | | | 1,384 | |
| Development and Lease-Up Communities (c) | | 2,761 | | | 2,075 | | | | | | 355 | | | | 1,720 | |
| Redevelopment Communities (d) | | | 3,512 | | | 3,943 | | | | | | 3,526 | | | | 417 | |
| Dispositions / Other (e) | | | - | | | 576 | | | | | | 598 | | | | (22 | ) |
| Total Property Expenses | | | 53,464 | | $ | 58,902 | | | | | $ | 54,638 | | | $ | 4,264 | |
| | | | | | | | | | | | | |
| Property Net Operating Income | | | | | | | | | | | |
| "Same Property" Communities (a) | | 43,480 | | $ | 81,328 | | | | | $ | 80,232 | | | $ | 1,096 | |
| Non-"Same Property" Communities (b) | | 3,711 | | | 8,990 | | | | | | 6,395 | | | | 2,595 | |
| Development and Lease-Up Communities (c) | | 2,761 | | | 978 | | | | | | (90 | ) | | | 1,068 | |
| Redevelopment Communities (d) | | | 3,512 | | | 5,886 | | | | | | 5,969 | | | | (83 | ) |
| Dispositions / Other (e) | | | - | | | 639 | | | | | | 532 | | | | 107 | |
| Total Property Net Operating Income | | 53,464 | | $ | 97,821 | | | | | $ | 93,038 | | | $ | 4,783 | |
| | | | | | | | | | | | | |
| | | | | | | | | | | | | |
| | | | | | | | | | | | | |
| | | | | | | | | | | | | |
| | | | | | | | | | | | | |
| Income from Discontinued Operations (f) | | | | Three Months Ended March 31, | | |
| | | | | | | 2008 | | | | 2007 | | |
| Property Revenues | | | | | $ | 841 | | | | | $ | 6,806 | | | |
| Property Expenses | | | | | | 482 | | | | | | 3,231 | | | |
| Property Net Operating Income | | | | | | 359 | | | | | | 3,575 | | | |
| Interest | | | | | | | (114 | ) | | | | | (121 | ) | | |
| Depreciation and Amortization | | | | | | (17 | ) | | | | | (1,268 | ) | | |
| Minority Interest | | | | | | - | | | | | | (270 | ) | | |
| Gain on sale of discontinued operations | | | | | 6,127 | | | | | | - | | | |
| Income from Discontinued Operations | | | | $ | 6,355 | | | | | $ | 1,916 | | | |
| | | | | | | | | | | | | |
| | | | | | | | | | | | | |
| Notes: | | | | | | | | | | | | |
| (a) | "Same Property" Communities are communities which were owned by the Company and stabilized as of January 1, 2007, excluding properties held for sale. |
| (b) | Non-"Same Property" Communities are stabilized communities acquired or developed by the Company after January 1, 2007, excluding properties held for sale. |
| (c) | Development and Lease-Up Communities are non-stabilized communities developed or acquired by the Company after January 1, 2007, excluding properties held for sale. |
| (d) | Redevelopment Communities are non-stabilized communities redeveloped by the Company after January 1, 2007, excluding properties held for sale. |
| (e) | Disposition Communities include those communities disposed of by the Company which are not classified as "Discontinued Operations". "Other" includes results from non-multifamily rental properties. "Other" property revenues includes the amortization of above and below market leases of communities acquired during 2007. |
|
| (f) | Represents operating results for communities disposed of during 2007 and 2008 or held for sale at March 31, 2008, of which Camden has, or expects to have, no continuing involvement. |
| | | | | | "SAME PROPERTY" |
| CAMDEN | | | | | | | | | | | | | | FIRST QUARTER COMPARISONS |
| | | | | | | | | | | | | | March 31, 2008 |
| | | | | | | | | | (In thousands, except property data amounts) |
| | | | | | | | | | | | | | | | | | | |
| | | | | | | | | | | | | | | | | | |
| | | | | | | | | | | | | | | | | | |
| (Unaudited) | | | | | | | | | | | | | | | | | | |
| | | | | | | | | | | | | | | | | | |
| | Revenues | | | | Expenses | | | | NOI |
| Quarterly Results (a) | | 1Q08 | | 1Q07 | | Growth | | 1Q08 | | 1Q07 | | Growth | | 1Q08 | | 1Q07 | | Growth |
| | | | | | | | | | | | | | | | | | |
| D.C. Metro | | $ | 11,769 | | $ | 11,757 | | 0.1 | % | | $ | 3,313 | | | $ | 3,183 | | | 4.1 | % | | $ | 8,456 | | $ | 8,574 | | (1.4 | %) |
| Las Vegas, NV | | | 7,897 | | | 7,968 | | (0.9 | %) | | | 2,614 | | | | 2,524 | | | 3.6 | % | | | 5,283 | | | 5,444 | | (3.0 | %) |
| Los Angeles/Orange County, CA | | | 8,960 | | | 8,428 | | 6.3 | % | | | 2,529 | | | | 2,407 | | | 5.1 | % | | | 6,431 | | | 6,021 | | 6.8 | % |
| San Diego/Inland Empire, CA | | | 3,960 | | | 3,803 | | 4.1 | % | | | 1,420 | | | | 1,381 | | | 2.8 | % | | | 2,540 | | | 2,422 | | 4.9 | % |
| Tampa, FL | | | 11,822 | | | 12,145 | | (2.7 | %) | | | 5,094 | | | | 5,194 | | | (1.9 | %) | | | 6,728 | | | 6,951 | | (3.2 | %) |
| Dallas, TX | | | 14,095 | | | 13,773 | | 2.3 | % | | | 6,680 | | | | 6,546 | | | 2.0 | % | | | 7,415 | | | 7,227 | | 2.6 | % |
| Houston, TX | | | 8,470 | | | 8,170 | | 3.7 | % | | | 3,488 | | | | 3,394 | | | 2.8 | % | | | 4,982 | | | 4,776 | | 4.3 | % |
| SE Florida | | | 11,506 | | | 11,696 | | (1.6 | %) | | | 4,273 | | | | 4,456 | | | (4.1 | %) | | | 7,233 | | | 7,240 | | (0.1 | %) |
| Charlotte, NC | | | 9,499 | | | 9,203 | | 3.2 | % | | | 3,397 | | | | 3,235 | | | 5.0 | % | | | 6,102 | | | 5,968 | | 2.2 | % |
| Orlando, FL | | | 9,094 | | | 9,291 | | (2.1 | %) | | | 3,388 | | | | 3,418 | | | (0.9 | %) | | | 5,706 | | | 5,873 | | (2.8 | %) |
| Atlanta, GA | | | 8,993 | | | 8,833 | | 1.8 | % | | | 3,353 | | | | 3,177 | | | 5.5 | % | | | 5,640 | | | 5,656 | | (0.3 | %) |
| Denver, CO | | | 5,670 | | | 5,338 | | 6.2 | % | | | 1,680 | | | | 1,715 | | | (2.0 | %) | | | 3,990 | | | 3,623 | | 10.1 | % |
| Raleigh, NC | | | 5,695 | | | 5,375 | | 6.0 | % | | | 2,004 | | | | 1,943 | | | 3.1 | % | | | 3,691 | | | 3,432 | | 7.5 | % |
| Phoenix, AZ | | | 4,041 | | | 4,223 | | (4.3 | %) | | | 1,378 | | | | 1,321 | | | 4.3 | % | | | 2,663 | | | 2,902 | | (8.2 | %) |
| Austin, TX | | | 5,796 | | | 5,388 | | 7.6 | % | | | 2,640 | | | | 2,590 | | | 1.9 | % | | | 3,156 | | | 2,798 | | 12.8 | % |
| Other | | | 2,073 | | | 2,088 | | (0.7 | %) | | | 761 | | | | 763 | | | (0.3 | %) | | | 1,312 | | | 1,325 | | (1.0 | %) |
| | | | | | | | | | | | | | | | | | |
| Total Same Property | | $ | 129,340 | | $ | 127,479 | | 1.5 | % | | $ | 48,012 | | | $ | 47,247 | | | 1.6 | % | | $ | 81,328 | | $ | 80,232 | | 1.4 | % |
| | | | | | | | | | | | | | | | | | |
| | | | | | | | | | | | | | | | |
| | Apartment Homes | | | | % of NOI | | Average Occupancy (a) | | Weighted Average Rental Rate (b) |
| Quarterly Results (a) | | Included | | | | Contribution (a) | | 1Q08 | | 1Q07 | | Change | | 1Q08 | | 1Q07 | | Change |
| | | | | | | | | | | | | | | | | | |
| D.C. Metro | | | 2,663 | | | | 10.4 | % | | | 94.6 | % | | | 95.5 | % | | (0.9 | %) | | $ | 1,446 | | $ | 1,454 | | (0.6 | %) |
| Las Vegas, NV | | | 2,889 | | | | 6.5 | % | | | 93.6 | % | | | 95.8 | % | | (2.2 | %) | | | 869 | | | 872 | | (0.4 | %) |
| Los Angeles/Orange County, CA | | | 1,770 | | | | 7.9 | % | | | 93.7 | % | | | 92.5 | % | | 1.2 | % | | | 1,659 | | | 1,634 | | 1.5 | % |
| San Diego/Inland Empire, CA | | | 846 | | | | 3.1 | % | | | 94.5 | % | | | 93.8 | % | | 0.7 | % | | | 1,528 | | | 1,525 | | 0.2 | % |
| Tampa, FL | | | 4,613 | | | | 8.3 | % | | | 94.3 | % | | | 94.8 | % | | (0.5 | %) | | | 796 | | | 834 | | (4.5 | %) |
| Dallas, TX | | | 6,345 | | | | 9.1 | % | | | 92.7 | % | | | 94.4 | % | | (1.7 | %) | | | 692 | | | 682 | | 1.5 | % |
| Houston, TX | | | 3,350 | | | | 6.1 | % | | | 95.1 | % | | | 95.1 | % | | (0.0 | %) | | | 797 | | | 777 | | 2.5 | % |
| SE Florida | | | 2,520 | | | | 8.9 | % | | | 94.3 | % | | | 96.2 | % | | (1.9 | %) | | | 1,473 | | | 1,471 | | 0.2 | % |
| Charlotte, NC | | | 3,286 | | | | 7.5 | % | | | 92.9 | % | | | 95.4 | % | | (2.5 | %) | | | 926 | | | 894 | | 3.5 | % |
| Orlando, FL | | | 3,296 | | | | 7.0 | % | | | 93.9 | % | | | 92.6 | % | | 1.3 | % | | | 891 | | | 932 | | (4.4 | %) |
| Atlanta, GA | | | 3,202 | | | | 6.9 | % | | | 93.5 | % | | | 93.5 | % | | 0.0 | % | | | 910 | | | 900 | | 1.1 | % |
| Denver, CO | | | 1,985 | | | | 4.9 | % | | | 94.7 | % | | | 94.4 | % | | 0.3 | % | | | 893 | | | 849 | | 5.2 | % |
| Raleigh, NC | | | 2,220 | | | | 4.6 | % | | | 94.0 | % | | | 93.4 | % | | 0.6 | % | | | 779 | | | 763 | | 2.1 | % |
| Phoenix, AZ | | | 1,441 | | | | 3.3 | % | | | 93.0 | % | | | 94.9 | % | | (1.9 | %) | | | 920 | | | 933 | | (1.4 | %) |
| Austin, TX | | | 2,358 | | | | 3.9 | % | | | 94.1 | % | | | 93.6 | % | | 0.5 | % | | | 755 | | | 734 | | 2.8 | % |
| Other | | | 696 | | | | 1.6 | % | | | 93.3 | % | | | 94.5 | % | | (1.2 | %) | | | 962 | | | 957 | | 0.5 | % |
| | | | | | | | | | | | | | | | | | |
| Total Same Property | | | 43,480 | | | | 100.0 | % | | | 93.8 | % | | | 94.5 | % | | (0.7 | %) | | $ | 948 | | $ | 945 | | 0.3 | % |
| | | | | | | | | | | | | | | | | | |
| (a) "Same Property" Communities are communities which were owned by the Company and stabilized as of January 1, 2007, excluding properties held for sale and communities under redevelopment. |
| (b) Weighted average rental rates are the Company's market rental rates after "loss to lease" and concessions, but before vacancy and bad debt. |
| CAMDEN | | | | | | | | | | JOINT VENTURE OPERATIONS |
| | | | | | | (In thousands, except per share and property data amounts) |
| | | | | | | | | | | | | | | | |
| | | | | | | | | | | | | | | |
| Company's Pro-rata Share of Joint Venture Operations: | | | | | | |
| (Unaudited) | | | | | | | | | | | | | | |
| | | | | | | Three Months Ended | | | | | | |
| | | | | | | March 31, | | | | | | |
| OPERATING DATA (a) | | | | | 2008 | | 2007 | | | | | | |
| Property Revenues | | | | | | | | | | | | | |
| Rental revenues | | | | | $ | 5,568 | | | $ | 4,855 | | | | | | | |
| Other property revenues | | | | | | 710 | | | | 538 | | | | | | | |
| Total property revenues | | | | | 6,278 | | | | 5,393 | | | | | | | |
| | | | | | | | | | | | | | | |
| Property Expenses | | | | | | | | | | | | | |
| Property operating and maintenance | | | | 1,860 | | | | 1,442 | | | | | | | |
| Real estate taxes | | | | | | | 620 | | | | 440 | | | | | | | |
| Total property expenses | | | | | 2,480 | | | | 1,882 | | | | | | | |
| | | | | | | | | | | | | | | |
| Net Operating Income (NOI) | | | | | 3,798 | | | | 3,511 | | | | | | | |
| | | | | | | | | | | | | | | |
| Other expenses | | | | | | | | | | | | | | |
| Interest | | | | | | | | 2,146 | | | | 1,682 | | | | | | | |
| Depreciation and amortization | | | | | 1,559 | | | | 1,072 | | | | | | | |
| Other | | | | | | | | 140 | | | | 22 | | | | | | | |
| Total other expenses | | | | | | 3,845 | | | | 2,776 | | | | | | | |
| | | | | | | | | | | | | | | |
| Equity in income (loss) of joint ventures | | | | ($47 | ) | | $ | 735 | | | | | | | |
| | | | | | | | | | | | | | | |
| | | | | | | Mar 31, | | Dec 31, | | Sep 30, | | Jun 30, | | Mar 31, |
| | | | | | | 2008 | | 2007 | | 2007 | | 2007 | | 2007 |
| BALANCE SHEET DATA (b) | | | | | | | | | | | | |
| Real estate assets, net | | | | | $ | 1,086,732 | | | $ | 1,075,437 | | | $ | 1,063,675 | | | $ | 1,045,006 | | | $ | 995,189 | |
| Cash and other assets, net | | | | | 26,440 | | | | 23,762 | | | | 26,621 | | | | 25,816 | | | | 26,109 | |
| Total assets | | | | | | $ | 1,113,172 | | | $ | 1,099,199 | | | $ | 1,090,296 | | | $ | 1,070,822 | | | $ | 1,021,298 | |
| | | | | | | | | | | | | | | |
| Notes payable | | | | | | $ | 895,471 | | | $ | 883,972 | | | $ | 859,786 | | | $ | 838,937 | | | $ | 795,329 | |
| Notes payable due to Camden | | | | | 51,086 | | | | 50,358 | | | | 47,406 | | | | 45,043 | | | | 43,412 | |
| Other liabilities | | | | | | | 15,616 | | | | 15,144 | | | | 17,013 | | | | 18,782 | | | | 10,463 | |
| Total liabilities | | | | | | $ | 962,173 | | | $ | 949,474 | | | $ | 924,205 | | | $ | 902,762 | | | $ | 849,204 | |
| | | | | | | | | | | | | | | |
| Members' equity | | | | | | | 150,999 | | | | 149,725 | | | | 166,091 | | | | 168,060 | | | | 172,094 | |
| Total liabilities and members' equity | | | $ | 1,113,172 | | | $ | 1,099,199 | | | $ | 1,090,296 | | | $ | 1,070,822 | | | $ | 1,021,298 | |
| | | | | | | | | | | | | | | |
| Camden's equity investment | | | | $ | 12,526 | | | $ | 8,466 | | | $ | 12,243 | | | $ | 12,722 | | | $ | 8,321 | |
| Distributions in excess of investment in joint ventures | | | ($25,065 | ) | | | ($23,653 | ) | | | ($20,867 | ) | | | ($19,549 | ) | | | ($18,805 | ) |
| | | | | | | | | | | | | | | |
| Camden's pro-rata share of debt | | | | $ | 226,828 | | | $ | 222,278 | | | $ | 210,476 | | | $ | 204,480 | | | $ | 184,778 | |
| | | | | | | | | | | | | | | |
| PROPERTY DATA (end of period) | | | | | | | | | | | |
| Total operating properties | | | | | 37 | | | | 37 | | | | 37 | | | | 36 | | | | 36 | |
| Total operating apartment homes | | | | | 10,960 | | | | 10,960 | | | | 10,960 | | | | 10,689 | | | | 10,689 | |
| Pro rata share of operating apartment homes | | | | 2,153 | | | | 2,153 | | | | 2,153 | | | | 2,072 | | | | 2,072 | |
| Total development properties | | | | | 5 | | | | 4 | | | | 4 | | | | 5 | | | | 5 | |
| Total development apartment homes | | | | 1,605 | | | | 1,257 | | | | 1,257 | | | | 1,528 | | | | 1,528 | |
| Pro rata share of development apartment homes | | | 447 | | | | 377 | | | | 377 | | | | 458 | | | | 458 | |
| | | | | | | | | | | | | | | |
| | | | | | | | | | | | | | | |
| (a) Operating data represents Camden's pro-rata share of revenues and expenses. | | |
| (b) Balance sheet and property data reported at 100%. | | | | | | |
| CAMDEN | | | | | | | | | | | | | | | CURRENT DEVELOPMENT PIPELINE |
| | | | | | | | | | | | | | | | | | | | | | |
| | | | | | | | | | | | | | | | | | | | | | | |
| | | | | | | | | | | | | | | | | | | | | | |
| (Unaudited) | | | | | | | | | | | | | | | | | | | | | |
| | | | | | | | | | | | | | | | | | | | | | |
| DEVELOPMENT PIPELINE AS OF MARCH 31, 2008 ($ in millions) | | | | | | | | | | | | |
| | | | | | | | | | | | | | | | | | | | | | |
| | | | | | | | | | | | Estimated/Actual Dates for | | |
| | | | Total | | Total | | Cost | | | | Construction | | Initial | | Construction | | Stabilized | | As of 4/27/08 |
| Completed Communities | | Homes | | Budget | | to Date | | | | Start | | Occupancy | | Completion | | Operations | | % Leased | | % Occupied |
| 1. | Camden Royal Oaks | | 236 | | $ | 22.0 | | $ | 21.0 | | | | 2Q05 | | 2Q06 | | 3Q06 | | 3Q08 | | 86 | % | | 68 | % |
| Houston, TX | | | | | | | | | | | | | | | | | | | | | |
| 2. | Camden Monument Place | | 368 | | | 64.0 | | $ | 62.4 | | | | 1Q05 | | 2Q07 | | 4Q07 | | 2Q08 | | 88 | % | | 82 | % |
| Fairfax, VA | | | | | | | | | | | | | | | | | | | | | |
| 3. | Camden City Centre | | 379 | | | 54.0 | | $ | 51.6 | | | | 1Q06 | | 2Q07 | | 4Q07 | | 3Q08 | | 77 | % | | 72 | % |
| Houston, TX | | | | | | | | | | | | | | | | | | | | | |
| | | | | | | | | | | | | | | | | | | | | | |
| Total Completed Communities | | 983 | | $ | 140.0 | | $ | 135.0 | | | | | | | | | | | | 83 | % | | 75 | % |
| | | | | | | | | | | | | | | | | | | | | | |
| | | | | | | | | | | | | | | | Estimated/Actual Dates for | | | | |
| | | | Total | | Total | | Cost | | Amount | | Construction | | Initial | | Construction | | Stabilized | | As of 4/27/08 |
| Development Communities | | Homes | | Budget | | to Date | | in CIP | | Start | | Occupancy | | Completion | | Operations | | % Leased | | % Occupied |
| | | | | | | | | | | | | | | | | | | | | | |
| UNDER CONSTRUCTION | | | | | | | | | | | | | | | | | | | | |
| 4. | Camden Potomac Yard | | 378 | | $ | 110.0 | | $ | 103.8 | | $ | 0.9 | | 1Q05 | | 3Q07 | | 2Q08 | | 1Q09 | | 34 | % | | 30 | % |
| Arlington, VA | | | | | | | | | | | | | | | | | | | | |
| 5. | Camden Summerfield | | 291 | | | 68.0 | | | 61.2 | | | 5.9 | | 2Q06 | | 4Q07 | | 4Q08 | | 1Q09 | | 36 | % | | 27 | % |
| Landover, MD | | | | | | | | | | | | | | | | | | | | |
| 6. | Camden Orange Court | | 261 | | | 49.0 | | | 44.1 | | | 15.5 | | 2Q06 | | 1Q08 | | 3Q08 | | 1Q09 | | 14 | % | | 7 | % |
| Orlando, FL | | | | | | | | | | | | | | | | | | | | | |
| 7. | Camden Dulles Station | | 366 | | | 77.0 | | | 59.5 | | | 49.1 | | 1Q06 | | 2Q08 | | 1Q09 | | 3Q09 | | 9 | % | | 7 | % |
| Oak Hill, VA | | | | | | | | | | | | | | | | | | | | | |
| 8. | Camden Cedar Hills (a) | | 208 | | | 27.0 | | | 15.1 | | | 14.5 | | 2Q07 | | 2Q08 | | 4Q08 | | 1Q09 | | 3 | % | | 1 | % |
| Austin, TX | | | | | | | | | | | | | | | | | | | | | |
| 9. | Camden Whispering Oaks | | 274 | | | 30.0 | | | 14.4 | | | 13.9 | | 3Q07 | | 2Q08 | | 1Q09 | | 3Q09 | | 3 | % | | 2 | % |
| Houston, TX | | | | | | | | | | | | | | | | | | | | | |
| | | | | | | | | | | | | | | | | | | | | | |
| Total Development Communities | | 1,778 | | $ | 361.0 | | $ | 298.1 | | $ | 99.8 | | | | | | | | | | | | |
| | | | | | | | | | | | | | | | | | | | | | |
| Additional land held for development (b) | | | | | | | 259.2 | | | | | | | | | | | | |
| | | | | | | | | | | | | | | | | | | | | | |
| Total Properties Under Development (per Balance Sheet) | | $ | 359.0 | | | | | | | | | | | | |
| | | | | | | | | | | | | | | | | | | | | | |
| | | | | | | | | | | | | | | | | | | | | | |
| NOI CONTRIBUTION FROM NON STABILIZED COMMUNITIES ($ in millions) | | | | | | | | | | |
| | | | | | | | | | | | | | | | Total Cost | | 1Q08 NOI | | | | |
| Development Communities stabilized at quarter end | | | | | | | | | | $ | 92.2 | | $ | 0.8 | | | | | |
| Completed Communities in lease-up | | | | | | | | | | | | | | | 135.0 | | | 1.1 | | | | | |
| Development Communities | | | | | | | | | | | | | | | 298.1 | | | (0.1 | ) | | | | |
| Total Development NOI Contribution | | | | | | | | | | | | $ | 525.3 | | $ | 1.8 | | | | | |
| | | | | | | | | | | | | | | | | | | | | | |
| | | | | | | | | | | | | | | | | | | | | | |
| (a) Formerly known as Camden Circle C. | | | | | | | | | | | | | | | | | | |
| (b) Please refer to the future development pipeline summary on page 17. | | | | | | | | | | |
| | | | | | | | | | | | | | | | | | | | | | |
| | | | | | | | | | | | | | | | | | | | | | |
| Note: This table contains forward-looking statements. Please see the paragraph regarding forward-looking statements on page 1 of this document. |
| CAMDEN | | | | | | | | | | | JOINT VENTURE DEVELOPMENT PIPELINE |
| | | | | | | | | | | | | | | | | | | | | | |
| | | | | | | | | | | | | | | | | | | | | | | |
| | | | | | | | | | | | | | | | | | | | | | |
| (Unaudited) | | | | | | | | | | | | | | | | | | | | | |
| | | | | | | | | | | | | | | | | | | | | | |
| | | | | | | | | | | | | | | | | | | | | | |
| JOINT VENTURE DEVELOPMENT PIPELINE AS OF MARCH 31, 2008 ($ in millions) | | | | | | | | | | |
| | | | | | | | | | | | | | | | | | | | | | |
| | | | | | | | | | | | | | Estimated/Actual Dates for | | | | |
| | | | Total | | Total | | Cost | | Amount | | Construction | | Initial | | Construction | | Stabilized | | As of 4/27/08 |
| Joint Venture Camden Developed Communities | | Homes | | Budget | | to Date | | in CIP | | Start | | Occupancy | | Completion | | Operations | | % Leased | | % Occupied |
| | | | | | | | | | | | | | | | | | | | | | |
| COMPLETED AND IN LEASE-UP | | | | | | | | | | | | | | | | | | | | |
| 1. | Camden Plaza | | 271 | | $ | 42.9 | | $ | 40.8 | | $ | 0.0 | | 1Q06 | | 2Q07 | | 3Q07 | | 3Q08 | | 80 | % | | 71 | % |
| Houston, TX | | | | | | | | | | | | | | | | | | | | |
| | | | | | | | | | | | | | | | | | | | | | |
| UNDER CONSTRUCTION | | | | | | | | | | | | | | | | | | | | |
| 2. | Camden College Park | | 508 | | | 139.9 | | | 122.4 | | | 61.2 | | 3Q06 | | 4Q07 | | 4Q08 | | 4Q09 | | 32 | % | | 27 | % |
| College Park, MD | | | | | | | | | | | | | | | | | | | | |
| 3. | Camden Main & Jamboree | | 290 | | | 115.0 | | | 109.1 | | | 40.1 | | 3Q04 | | 4Q07 | | 2Q08 | | 1Q09 | | 27 | % | | 21 | % |
| Irvine, CA | | | | | | | | | | | | | | | | | | | | | |
| 4. | Camden Amber Oaks | | 348 | | | 40.0 | | | 11.4 | | | 11.4 | | 4Q07 | | 4Q08 | | 2Q09 | | 3Q10 | | | | |
| Austin, TX | | | | | | | | | | | | | | | | | | | | | |
| | | | | | | | | | | | | | | | | | | | | | |
| | | | | | | | | | | | | | | | | | | | | | |
| Total Joint Venture Camden Developed Communities | | 1,417 | | $ | 337.8 | | $ | 283.7 | | $ | 112.7 | | | | | | | | | | | | |
| | | | | | | | | | | | | | | | | | | | | | |
| | | | | | | | | | | | | | | | | | | | | | |
| | | | | | | | | | Camden | | Camden | | Estimated/Actual Dates for | | | | |
| | | | Total | | Total | | Cost | | Equity | | Mezzanine | | Construction | | Stabilized | | | | |
| Joint Venture Third Party Developed Communities | | Homes | | Budget | | to Date | | Invested | | Invested | | Start | | Operations | | | | |
| | | | | | | | | | | | | | | | | | | | |
| UNDER CONSTRUCTION | | | | | | | | | | | | | | | | | | |
| 1. | Braeswood Place | | 340 | | $ | 48.6 | | $ | 24.3 | | $ | 1.4 | | | $ 8.1 | | 1Q07 | | 4Q09 | | | | |
| Houston, TX | | | | | | | | | | | | | | | | | | |
| 2. | Belle Meade | | 119 | | | 33.2 | | | 11.0 | | | 1.0 | | | $ 5.4 | | 2Q07 | | 3Q09 | | | | |
| Houston, TX | | | | | | | | | | | | | | | | | | | | |
| | | | | | | | | | | | | | | | | | | | | | |
| Total Joint Venture Third Party Developed Communities | | 459 | | $ | 81.8 | | $ | 35.2 | | $ | 2.4 | | | $ 13.5 | | | | | | | | | | |
| | | | | | | | | | | | | | | | | | | | | | |
| | | | | | | | | | | | | | | | | | | | | | |
| Note: This table contains forward-looking statements. Please see the paragraph regarding forward-looking statements on page 1 of this document. |
| CAMDEN | | | FUTURE DEVELOPMENT PIPELINE |
| | | | & LAND HELD FOR SALE |
| | | | | | | | | |
| | | | | | | | |
| (Unaudited) | | | | | | | |
| | | | | | | | |
| DEVELOPMENT PIPELINE AS OF MARCH 31, 2008 ($ in millions) | | | | |
| | | | | | | | |
| | | | Projected | | Estimated | | Cost |
| PIPELINE COMMUNITIES (a) | | Homes | | Budget | | to Date |
| | | | | | | | |
| PRE CONSTRUCTION | | | | | | | |
| 1. | Camden Montague | | | 192 | | $ | 33.0 | | $ | 7.2 |
| Tampa, FL | | | | | | | |
| 2. | Camden South Capitol | | 276 | | | 110.0 | | | 24.4 |
| Washington, DC | | | | | | | |
| 3. | Camden Lake Nona | | | 432 | | | 70.0 | | | 19.4 |
| Orlando, FL | | | | | | | |
| 4. | Camden Noma I | | | 313 | | | 150.0 | | | 23.2 |
| Washington, DC | | | | | | | |
| 5. | Camden Lincoln Station | | 271 | | | 60.0 | | | 6.9 |
| Denver, CO | | | | | | | |
| 6. | Camden Deer Springs | | | 428 | | | 85.0 | | | 18.3 |
| Las Vegas, NV | | | | | | | |
| 7. | Camden North Lamar | | | 290 | | | 55.0 | | | 9.0 |
| Austin, TX | | | | | | | |
| 8. | Camden McGowen Station | | 237 | | | 48.0 | | | 10.2 |
| Houston, TX | | | | | | | |
| 9. | Camden Highlands | | | 400 | | | 80.0 | | | 12.7 |
| Broomfield, CO | | | | | | | |
| | | | | | | | |
| PRE DEVELOPMENT | | | | | | | |
| 10. | Camden Summerfield II | | 187 | | | 55.0 | | | 17.9 |
| Landover, MD | | | | | | | |
| 11. | Camden Selma and Vine | | 306 | | | 250.0 | | | 35.6 |
| Hollywood, CA | | | | | | | |
| 12. | Camden Sutherland (b) | | 253 | | | 45.0 | | | 2.8 |
| Houston, TX | | | | | | | |
| 13. | Camden City Centre II | | | 239 | | | 40.0 | | | 7.4 |
| Houston, TX | | | | | | | |
| 14. | Camden Amber Oaks II | | 244 | | | 30.0 | | | 3.6 |
| Austin, TX | | | | | | | |
| 15. | Camden Noma II | | | 400 | | | 192.0 | | | 28.4 |
| Washington, DC | | | | | | | |
| 16. | Camden Andrau | | | 601 | | | 57.0 | | | 8.2 |
| Houston, TX | | | | | | | |
| 17. | Camden Countryway | | | 348 | | | 60.0 | | | 14.6 |
| Tampa, FL | | | | | | | |
| | | | | | | | |
| UNDER CONTRACT | | | | | | | |
| 18. | Camden Celebration | | | 438 | | | 75.0 | | | 0.0 |
| Orlando, FL | | | | | | | |
| | | | | | | | |
| Subtotal Development Pipeline | | 5,855 | | $ | 1,495.0 | | $ | 249.8 |
| | | | | | | | |
| Other (c) | | | | | | | | 9.4 |
| | | | | | | | |
| Total Development Pipeline | | | | | | $ | 259.2 |
| | | | | | | | |
| | | | | | | | Current |
| LAND HELD FOR SALE AS OF MARCH 31, 2008 ($ in millions) | | Acres | | Book Value |
| 1. | Southeast Florida | | | | | | 2.2 | | $ | 7.3 |
| 2. | Dallas | | | | | | 2.4 | | | 1.8 |
| | | | | | | | |
| Total Land Parcels Held For Sale: | | | | | 4.6 | | $ | 9.1 |
| | | | | | | | |
| (a) Represents development opportunities in the early phase of the development process for which the Company either has an option to acquire land or enter into a leasehold interest, for which the Company is the buyer under a long-term conditional contract to purchase land or where the Company owns land to develop a new community. |
| (b) Camden Sutherland is owned in a fully consolidated joint venture, of which Camden retains a 25% ownership. |
| (c) Includes land holdings no longer under active development and predevelopment costs incurred in pursuit of new developments for which future development is probable. |
| | | | | | | | |
| Note: This table contains forward-looking statements. Please see the paragraph regarding forward-looking statements on page 1 of this document. |
| CAMDEN | | | | | | | | | | | | | REDEVELOPMENT SUMMARY |
| | | | | | | | | | | | | | | | | | | |
| | | | | | | | | | | | | | | | | | | | |
| | | | | | | | | | | | | | | | | | | |
| (Unaudited) | | | | | | | | | | | | | | | | | | |
| | | | | | | | | | | | | | | | | | | |
| REDEVELOPMENT SUMMARY AS OF MARCH 31, 2008 ($ in millions) | | | | | |
| | | | | | | | | | | | | | | | | | | |
| | | | | | Homes | | | | | | Estimated/Actual Dates for | | | |
| | | | Total | | Redeveloped | | Total | | Cost | | Redevelopment | | Redevelopment | | Project | | | 1Q08 Average |
| Communities | | | Homes | | To Date | | Budget | | to Date | | Start | | Completion | | Restabilization | | | % Occupied |
| 1. | Camden Breakers | | 288 | | 284 | | $1.2 | | $0.9 | | 4Q06 | | 2Q08 | | 2Q08 | | | 89% |
| Corpus Christi, TX | | | | | | | | | | | | | | | | | |
| 2. | Camden Canyon | | 200 | | 177 | | 2.9 | | 2.7 | | 1Q07 | | 2Q08 | | 3Q08 | | | 95% |
| Las Vegas, NV | | | | | | | | | | | | | | | | | |
| 3. | Camden Del Mar | | 560 | | 500 | | 8.7 | | 8.0 | | 1Q07 | | 2Q08 | | 3Q08 | | | 87% |
| Las Vegas, NV | | | | | | | | | | | | | | | | | |
| 4. | Camden Fairways | | 320 | | 270 | | 5.3 | | 4.8 | | 1Q07 | | 2Q08 | | 3Q08 | | | 86% |
| Henderson, NV | | | | | | | | | | | | | | | | | |
| 5. | Camden Foxcroft | | 156 | | 60 | | 1.4 | | 0.5 | | 4Q07 | | 1Q09 | | 2Q09 | | | 92% |
| Charlotte, NC | | | | | | | | | | | | | | | | | |
| 6. | Camden Glen Lakes | | 424 | | 424 | | 7.0 | | 7.0 | | 4Q06 | | 1Q08 | | 2Q08 | | | 90% |
| Dallas, TX | | | | | | | | | | | | | | | | | | |
| 7. | Camden Providence Lakes | | 260 | | 260 | | 2.3 | | 2.3 | | 4Q06 | | 1Q08 | | 2Q08 | | | 89% |
| Brandon, FL | | | | | | | | | | | | | | | | | | |
| 8. | Camden Touchstone | | 132 | | 132 | | 1.3 | | 1.1 | | 4Q06 | | 1Q08 | | 2Q08 | | | 93% |
| Charlotte, NC | | | | | | | | | | | | | | | | | |
| 9. | Camden Vanderbilt | | 894 | | 883 | | 8.2 | | 7.3 | | 4Q06 | | 2Q08 | | 3Q08 | | | 85% |
| Houston, TX | | | | | | | | | | | | | | | | | | |
| 10. | Camden Westshore | | 278 | | 278 | | 1.8 | | 1.8 | | 4Q06 | | 1Q08 | | 2Q08 | | | 89% |
| Tampa, FL | | | | | | | | | | | | | | | | | | |
| | | | | | | | | | | | | | | | | | | |
| Total | | | 3,512 | | 3,268 | | $40.0 | | $36.4 | | | | | | | | | 88% |
| |
| |
Note: This table contains forward-looking statements. Please see the paragraph regarding forward-looking statements on page 1 of this document. |
| CAMDEN | | | | | NOTES RECEIVABLE SUMMARY |
| | | | | | | | | | | | | |
| | | | | | | | | | | | |
| | | | | | | | | | | | | |
| | | | | | | | | | | | |
| (Unaudited) | | | | | | | | | | | |
| | | | | | | | | | | | |
| | | | | | | | | | | | |
| NOTES RECEIVABLE AS OF MARCH 31, 2008 ($ in thousands) | | | | | | |
| | | | | | | | | | | | |
| | | | | | | | 03/31/08 | | 03/31/08 | | 12/31/07 |
| | | | | | | | Total | | Note | | Note |
| Location | | Current Property Type | | Current Status | | Homes | | Balance | | Balance |
| Irvine, CA | | Multifamily | | | Development | | 290 | | $ | 21,055 | | | $ | 20,338 | |
| Houston, TX | | Multifamily | | | Development/Predevelopment | | 831 | | | 30,897 | | | | 33,034 | |
| College Park, MD | | Multifamily | | | Development | | 508 | | | 8,477 | | | | 8,186 | |
| Charlotte, NC | | Multifamily | | | Land Under Contract | | - | | | 612 | | | | 365 | |
| | | | | | | | | | | | |
| Total Notes Receivable: | | | | | | | 1,629 | | $ | 61,041 | | | $ | 61,923 | |
| | | | | | | | | | | | |
| Weighted Average Interest Rate Recognized: | | | | | 10.3 | % | | | 11.5 | % |
| CAMDEN | | | | | ACQUISITIONS & DISPOSITIONS | |
| | | | | | | | | | | | | |
| | | | | | | | | | | | | | |
| | | | | | | | | | | | | |
| (Unaudited) | | | | | | | | | | | |
| | | | | | | | | | | | | |
| | | | | | | | | | | | | |
| 2008 ACQUISITION/DISPOSITION ACTIVITY | | | | | | | | | | | |
| | | | | | | | | Apartment Homes/ | | | |
| Dispositions | | Location | | | Property Type | | Retail Square Feet | | Year Built | | Closing Date |
| 1. | Retail Center | | Las Vegas, NV | | Retail | | 4,100 Square Feet | | NA | | 02/05/08 |
| 2. | Camden Ridgeview | | Austin, TX | | Multifamily | | 167 | | 1984 | | 02/28/08 |
| | | | | | | | | | | | | |
| Total Disposition Volume: | | $12.0 million | | | | 167 apartment homes | | |
| | | | | | | | | 4,100 Square Feet | | |
| | | | | | | | | | | | | |
| Dispositions to Joint Ventures | | Location | | | Property Type | | Acreage | | Year Built | | Closing Date |
| 1. | Camden Amber Oaks (a) | | Austin, TX | | Undeveloped Land | | 14.3 Acres | | N/A | | 03/07/08 |
| | | | | | | | | | | | | |
| | | | | | | | | | | | | |
| Total Disposition to Joint Ventures Volume: | | $4.8 million (a) | | 14.3 Acres | | | | |
| | | | | | | | | | | | | |
| (a) Represents value of partnership interests for undeveloped land parcel sold on March 7, 2008. | | | | |
| CAMDEN | | | | | | | | | | DEBT ANALYSIS |
| | | | | | | | (In thousands, except property data amounts) |
| | | | | | | | | | | | |
| | | | | | | | | | | |
| (Unaudited) | | | | | | | | | | |
| | | | | | | | | | | |
| DEBT MATURITIES AS OF MARCH 31, 2008: (a) | | | | | | |
| | | | | | | | | | | Weighted Average |
| | | Future Scheduled Repayments | | Percent | | Interest Rate on |
| Year | | Amortization | | Maturities | | Total | | of Total | | Maturing Debt |
| 2008 | | $ | 8,557 | | $ | 188,879 | | | $ | 197,435 | | | | 6.8 | % | | 4.8% | |
| 2009 | | | 7,772 | | | 190,324 | | | | 198,096 | | | | 6.8 | % | | 5.0% | |
| 2010 | | | 7,026 | | | 445,677 | | | | 452,703 | | | | 15.6 | % | | 5.1% | |
| 2011 | | | 4,033 | | | 244,233 | | | | 248,266 | | | | 8.5 | % | | 6.5% | |
| 2012 | | | 2,913 | | | 769,541 | | | | 772,454 | | | | 26.5 | % | | 5.4% | |
| 2013 | | | 1,624 | | | 225,831 | | | | 227,455 | | | | 7.8 | % | | 5.4% | |
| Thereafter | | | 45,920 | | | 567,629 | | | | 613,549 | | | | 21.1 | % | | 5.3% | |
| Total Maturing Debt | | $ | 77,845 | | $ | 2,632,113 | | | $ | 2,709,958 | | | | 93.1 | % | | 5.4% | |
| | | | | | | | | | | |
| Unsecured Line of Credit | | | 0 | | | 201,000 | | | | 201,000 | | | | 6.9 | % | | 3.4% | |
| Total Debt | | $ | 77,845 | | $ | 2,833,113 | | | $ | 2,910,958 | | | | 100.0 | % | | 5.2% | |
| | | | | | | | | | | |
| Weighted Average Maturity of Debt | | 4.6 Years | | (excluding line of credit) | | |
| | | | | | | | | | | |
| | | | | | | | | | | |
| | | | | | | | | Weighted Average | | |
| FLOATING vs. FIXED RATE DEBT: | | Balance | | % of Total | | Interest Rate | | |
| Floating rate debt | | | | $ | 258,374 | | | | 8.9 | % | | | 3.5% | | | |
| Fixed rate debt | | | | | 2,652,584 | | | | 91.1 | % | | | 5.4% | | | |
| Total | | | | $ | 2,910,958 | | | | 100.0 | % | | | 5.2% | | | |
| | | | | | | | | | | |
| | | | | | | | | Weighted Average | | |
| SECURED vs. UNSECURED DEBT: | | Balance | | % of Total | | Interest Rate | | |
| Unsecured debt | | | | $ | 2,351,006 | | | | 80.8 | % | | | 5.3% | | | |
| Secured debt | | | | | 559,952 | | | | 19.2 | % | | | 4.8% | | | |
| Total | | | | $ | 2,910,958 | | | | 100.0 | % | | | 5.2% | | | |
| | | | | | | | | | | |
| | | | | | | | | Weighted Average | | |
| SECURED DEBT DETAIL: | | | | Balance | | % of Total | | Interest Rate | | |
| Conventional fixed-rate mortgage debt | | $ | 496,257 | | | | 88.6 | % | | | 4.9% | | | |
| Tax exempt fixed rate debt | | | 6,321 | | | | 1.1 | % | | | 7.3% | | | |
| Tax exempt variable rate debt | | | 57,374 | | | | 10.3 | % | | | 3.7% | | | |
| Total | | | | $ | 559,952 | | | | 100.0 | % | | | 4.8% | | | |
| | | | | | | | | | | |
| REAL ESTATE ASSETS: (b) | | | | Total Homes | | % of Total | | Total Cost | | % of Total |
| Unencumbered real estate assets | | | 45,383 | | | | 83.9 | % | | $ | 4,553,507 | | | 81.7 | % |
| Encumbered real estate assets | | | 8,701 | | | | 16.1 | % | | | 1,019,806 | | | 18.3 | % |
| Total | | | | | 54,084 | | | | 100.0 | % | | $ | 5,573,313 | | | 100.0 | % |
| | | | | | | | | | | |
| | | Ratio of unencumbered assets at cost to unsecured debt is 1.9 times | |
| | | | | | | | | | | |
| | | | | | | | | | | |
| UNCONSOLIDATED, NON-RECOURSE DEBT: | | | | | | |
| Pro-Rata Share of Debt | | | | $ | 226,828 | | | | | | | |
| Weighted Average Interest Rate | | | 5.3 | % | | | | | | |
| | | | | | | | | | | |
| | | | | | | | | | | |
| (a) Debt maturities exclude unsecured line of credit, which after all extensions matures in January 2011. |
| (b) Real estate assets include communities under development and exclude communities held through joint ventures. |
| CAMDEN | | | | | DEBT COVENANT ANALYSIS |
| | | | | | March 31, 2008 |
| | | | | | | | | | |
| | | | | | | | | |
| (Unaudited) | | | | | | | | |
| | | | | | | | | |
| | | | | | | | | |
| UNSECURED LINE OF CREDIT | | | | | | | | |
| | | | | | | | | |
| | | | | | | | | |
| Covenant (a) | | | Required | | Actual (b) | | Compliance |
| Total Consolidated Debt to Gross Asset Value | | ≤ | 60% | | 50% | | Yes |
| | | | | | | | | |
| Secured Debt to Gross Asset Value | | | ≤ | 40% | | 9% | | Yes |
| | | | | | | | | |
| Consolidated EBITDA to Total Fixed Charges | | ≥ | 150% | | 199% | | Yes |
| | | | | | | | | |
| Unencumbered Adjusted NOI to Unsecured Interest Expense | | > | 200% | | 231% | | Yes |
| | | | | | | | | |
| | | | | | | | | |
| SENIOR UNSECURED NOTES | | | | | | | | |
| | | | | | | | | |
| Covenant (a) | | | Required | | Actual (b) | | Compliance |
| Total Consolidated Debt to Total Asset Value | | ≤ | 60% | | 51% | | Yes |
| | | | | | | | | |
| Total Secured Debt to Total Asset Value | | | ≤ | 40% | | 10% | | Yes |
| | | | | | | | | |
| Total Unencumbered Asset Value to Total Unsecured Debt | | ≥ | 150% | | 199% | | Yes |
| | | | | | | | | |
| Consolidated Income Available for Debt Service to Total | | > | 150% | | 229% | | Yes |
| Annual Service Charges | | | | | | | | |
| | | | | | | | | |
| | | | | | | | | |
| (a) For a complete listing of all Debt Covenants related to the Company's Unsecured Line of Credit and Senior Unsecured Notes, as well as definitions of the above terms, please refer to the Company's filings with the Securities and Exchange Commission. |
| | | | | | | | | |
| (b) Defined terms used in the above covenant calculations may differ between the Unsecured Line of Credit and the Senior Unsecured Notes. |
| CAMDEN | | | | | | CAPITALIZED EXPENDITURES |
| | | | | | | | & MAINTENANCE EXPENSE |
| | | | | | | (In thousands, except unit data) |
| | | | | | | | | | | | |
| | | | | | | | | | | |
| | | | | | | | | | | |
| | | First Quarter 2008 (a) | | | | |
| | | Capitalized | | Expensed |
| | | Weighted Average | | | | | | | | |
| Item | | Useful Life (b) | | Total | | Per Unit | | Total | | Per Unit |
| Interiors | | | | | | | | | | |
| Floor coverings | | 5.5 years | | $ | 2,320 | | $ | 45 | | $ | 686 | | $ | 13 |
| Appliances | | 9.1 years | | | 512 | | | 10 | | | 147 | | | 3 |
| Painting | | - | | | - | | | - | | | 1,275 | | | 25 |
| Cabinetry/Countertops | | 10.0 years | | | 272 | | | 5 | | | - | | | - |
| Other | | 8.7 years | | | 809 | | | 16 | | | 347 | | | 7 |
| Exteriors | | | | | | | | | | |
| Painting | | 5.0 years | | | 160 | | | 3 | | | - | | | - |
| Carpentry | | 10.0 years | | | 191 | | | 4 | | | - | | | - |
| Landscaping | | 6.0 years | | | 491 | | | 9 | | | 2,715 | | | 52 |
| Roofing | | 20.0 years | | | 313 | | | 6 | | | 71 | | | 1 |
| Site Drainage | | 10.0 years | | | 77 | | | 1 | | | - | | | - |
| Fencing/Stair | | 10.0 years | | | 81 | | | 2 | | | - | | | - |
| Other (c) | | 8.1 years | | | 631 | | | 12 | | | 1,790 | | | 35 |
| Common Areas | | | | | | | | | | |
| Mech., Elec., Plumbing | | 9.6 years | | | 698 | | | 13 | | | 671 | | | 13 |
| Parking/Paving | | 5.0 years | | | 45 | | | 1 | | | - | | | - |
| Pool/Exercise/Facility | | 7.8 years | | | 602 | | | 12 | | | 230 | | | 4 |
| | | | | $ | 7,202 | | $ | 139 | | $ | 7,932 | | $ | 153 |
| | | | | | | | | | | |
| Weighted Average Apartment Homes | | | | | 51,763 | | | | | 51,763 |
| | | | | | | | | | | |
| | | | | | | | | | | |
| (a) Includes discontinued operations. Capitalized expenditures for discontinued operations were $49 for the three months ended March 31, 2008. Maintenance expenses for discontinued operations were $63 for the same period. |
|
| (b) of capitalized expenses for the three months ended March 31, 2008 |
| (c) Includes in part the following items: site/building repair, masonry/plaster, and general conditions. Costs recorded as repairs and maintenance exclude costs related to our trash removal rebilling program which were included as a component of repairs and maintenance in prior periods but are now included in utility costs during the period. |
| CAMDEN | | | | NON-GAAP FINANCIAL MEASURES |
| | | | DEFINITIONS & RECONCILIATIONS |
| | | | | | (In thousands, except per share amounts) |
| | | | | | | | | | | | | |
| | | | | | | | | | | | |
| | | | | | | | | | | | |
| (Unaudited) | | | | | | | | | | | |
| | | | | | | | | | | | |
| This document contains certain non-GAAP financial measures management believes are useful in evaluating an equity REIT's performance. Camden's definitions and calculations of non-GAAP financial measures may differ from those used by other REITs, and thus may not be comparable. The non-GAAP financial measures should not be considered as an alternative to net income as an indication of our operating performance, or to net cash provided by operating activities as a measure of our liquidity. |
| | | | | | | | | | | | |
| | | | | | | | | | | | |
| FFO | | | | | | | | | | | |
| The National Association of Real Estate Investment Trusts (“NAREIT”) currently defines FFO as net income computed in accordance with generally accepted accounting principles (“GAAP”), excluding gains or losses from depreciable operating property sales, plus real estate depreciation and amortization, and after adjustments for unconsolidated partnerships and joint ventures. Camden’s definition of diluted FFO also assumes conversion of all dilutive convertible securities, including minority interests, which are convertible into common equity. The Company considers FFO to be an appropriate supplemental measure of operating performance because, by excluding gains or losses on dispositions of operating properties and excluding depreciation, FFO can help one compare the operating performance of a company's real estate between periods or as compared to different companies. A reconciliation of net income to FFO is provided below: |
| | | | | | | | | | | | |
| | | | | | | | | | | | |
| | | | | | | | | Three Months Ended | |
| | | | | | | | | March 31, | |
| | | | | | | | | 2008 | | 2007 | |
| Net income | | | | | | | | $ | 14,915 | | | $ | 13,037 | | |
| Real estate depreciation and amortization from continuing operations | | | | | | | 41,921 | | | | 38,338 | | |
| Real estate depreciation from discontinued operations | | | | | | | 17 | | | | 1,268 | | |
| Adjustments for unconsolidated joint ventures | | | | | | | 1,539 | | | | 1,086 | | |
| Income from continuing operations allocated to common units | | | | | | | 1,156 | | | | 736 | | |
| Income from discontinued operations allocated to common units | | | | | | | - | | | | 270 | | |
| (Gain) loss on sale of operating properties, net of taxes | | | | | | | (1,106 | ) | | | 1,184 | | |
| (Gain) on sale of discontinued operations | | | | | | | (6,112 | ) | | | - | | |
| Funds from operations - diluted | | | | | | $ | 52,330 | | | $ | 55,919 | | |
| | | | | | | | | | | | |
| Weighted average number of common and common equivalent shares outstanding: | | | | | | | | | | |
| | | | | | | | | |
| EPS diluted | | | | | | | | | 55,625 | | | | 59,994 | | |
| FFO diluted | | | | | | | | | 58,544 | | | | 63,021 | | |
| | | | | | | | | | | | |
| Net income per common share - diluted | | | | | | | $ | 0.27 | | | $ | 0.22 | | |
| FFO per common share - diluted | | | | | | | $ | 0.89 | | | $ | 0.89 | | |
| | | | | | | | | | | | |
| Expected FFO | | | | | | | | | | | |
| Expected FFO is calculated in a method consistent with historical FFO, and is considered an appropriate supplemental measure of expected operating | | | |
| performance when compared to expected net income (EPS). A reconciliation of the ranges provided for expected net income per diluted share to expected | | | |
| FFO per diluted share is provided below: | | | | | | | | | | |
| | | 2Q08 Range | | | | 2008 Range | |
| | | Low | | High | | | | Low | | High | |
| | | | | | | | | | | | |
| Expected net income per share - diluted | $ | 0.08 | | | $ | 0.12 | | | | | $ | 0.57 | | | $ | 0.77 | | |
| Expected difference between EPS and fully diluted FFO shares | | (0.01 | ) | | | (0.01 | ) | | | | | ($0.03 | ) | | | ($0.03 | ) | |
| Expected real estate depreciation | | 0.73 | | | | 0.73 | | | | | $ | 2.94 | | | $ | 2.94 | | |
| Expected adjustments for unconsolidated joint ventures | | 0.04 | | | | 0.04 | | | | | $ | 0.13 | | | $ | 0.13 | | |
| Expected income allocated to common units | | 0.03 | | | | 0.03 | | | | | $ | 0.11 | | | $ | 0.11 | | |
| Expected (gain) on sale of properties and properties held for sale | | 0.00 | | | | 0.00 | | | | | | ($0.12 | ) | | | ($0.12 | ) | |
| Expected FFO per share - diluted | $ | 0.87 | | | $ | 0.91 | | | | | $ | 3.60 | | | $ | 3.80 | | |
| | | | | | | | | | | | |
| | | | | | | | | | | | |
| Note: This table contains forward-looking statements. Please see the paragraph regarding forward-looking statements on page 1 of this document. |
CAMDEN |
NON-GAAP FINANCIAL MEASURES |
DEFINITIONS & RECONCILIATIONS |
(In thousands, except per share amounts) |
| |
(Unaudited) |
| |
Net Operating Income (NOI) | | | | | | | | |
NOI is defined by the Company as total property income less property operating and maintenance expenses less real estate taxes. The Company considers NOI to be an appropriate supplemental measure of operating performance to net income because it reflects the operating performance of our communities without allocation of corporate level property management overhead or general and administrative costs. A reconciliation of net income to net operating income is provided below: |
|
| | | | | | | | | | | |
| | | | | | | | Three Months Ended |
| | | | | | | | March 31, |
| | | | | | | | 2008 | | 2007 |
| Net income | | | | | | | $ | 14,915 | | | $ | 13,037 | |
| Fee and asset management income | | | | | | | (2,412 | ) | | | (2,386 | ) |
| Interest and other income | | | | | | | (1,333 | ) | | | (1,562 | ) |
| Income on deferred compensation plans | | | | | | | 8,541 | | | | (2,306 | ) |
| Property management expense | | | | | | | 4,900 | | | | 4,728 | |
| Fee and asset management expense | | | | | | | 1,725 | | | | 1,620 | |
| General and administrative expense | | | | | | | 7,960 | | | | 8,054 | |
| Interest expense | | | | | | | | 32,661 | | | | 27,790 | |
| Depreciation and amortization | | | | | | | 42,785 | | | | 39,053 | |
| Amortization of deferred financing costs | | | | | | | 742 | | | | 913 | |
| Expense on deferred compensation plans | | | | | | | (8,541 | ) | | | 2,306 | |
| (Gain) loss on sale of properties, including land | | | | | | | (1,106 | ) | | | - | |
| Equity in income of joint ventures | | | | | | | 47 | | | | (735 | ) |
| Distributions on perpetual preferred units | | | | | | | 1,750 | | | | 1,750 | |
| Income allocated to common units and other minority interests | | | | | | | 1,269 | | | | 787 | |
| Income tax expense | | | | | | | | 273 | | | | 1,905 | |
| Income tax expense on sale of depreciable operating properties | | | | | | | - | | | | - | |
| Income from discontinued operations | | | | | | | (228 | ) | | | (2,186 | ) |
| Gain on sale of discontinued operations | | | | | | | (6,127 | ) | | | - | |
| Income from discontinued operations allocated to common units | | | | | | | - | | | | 270 | |
| Net Operating Income (NOI) | | | | | | $ | 97,821 | | | $ | 93,038 | |
| | | | | | | | | | |
| "Same Property" Communities | | | | | | $ | 81,328 | | | $ | 80,232 | |
| Non-"Same Property" Communities | | | | | | | 8,990 | | | | 6,395 | |
| Development and Lease-Up Communities | | | | | | | 978 | | | | (90 | ) |
| Redevelopment Communities | | | | | | | 5,886 | | | | 5,969 | |
| Dispositions / Other | | | | | | | | 639 | | | | 532 | |
| Net Operating Income (NOI) | | | | | | $ | 97,821 | | | $ | 93,038 | |
| | | | | | | | | | |
| | | | | | | | | | |
EBITDA | | | | | | | | | |
| EBITDA is defined by the Company as earnings before interest, taxes, depreciation and amortization, including net operating income from discontinued operations, excluding equity in income of joint ventures, gain on sale of real estate assets, and income allocated to minority interests. The Company considers EBITDA to be an appropriate supplemental measure of operating performance to net income because it represents income before non-cash depreciation and the cost of debt, and excludes gains or losses from property dispositions. A reconciliation of net income to EBITDA is provided below: |
| | | | | | | | | | |
| | | | | | | | Three Months Ended |
| | | | | | | | March 31, |
| | | | | | | | 2008 | | 2007 |
| Net income | | | | | | | $ | 14,915 | | | $ | 13,037 | |
| Interest expense | | | | | | | | 32,775 | | | | 27,911 | |
| Amortization of deferred financing costs including discontinued operations | | | | | | | 742 | | | | 913 | |
| Depreciation and amortization | | | | | | | 42,785 | | | | 39,053 | |
| Distributions on perpetual preferred units | | | | | | | 1,750 | | | | 1,750 | |
| Income allocated to common units and other minority interests | | | | | | | 1,269 | | | | 787 | |
| Income tax expense | | | | | | | | 273 | | | | 1,905 | |
| Real estate depreciation from discontinued operations | | | | | | | 17 | | | | 1,268 | |
| (Gain) loss on sale of properties, including land | | | | | | | (1,106 | ) | | | - | |
| Equity in income of joint ventures | | | | | | | 47 | | | | (735 | ) |
| Gain on sale of discontinued operations | | | | | | | (6,127 | ) | | | - | |
| Income from discontinued operations allocated to common units | | | | | | | - | | | | 270 | |
| EBITDA | | | | | | | $ | 87,340 | | | $ | 86,159 | |
| CAMDEN | | | | | | | | | | | OTHER DATA |
| | | | | | | | | | | | | | | | | |
| | | | | | | | | | | | | | | | | |
| | | | | | | | | | | | | | | | |
| (Unaudited) | | | | | | | | | | | | | | |
| | | | | | | | | | | | | | | | |
| Stock Symbol: | | CPT | | | | | | | | | | | | |
| | | | | | | | | | | | | | | | |
| Exchange Traded: | | NYSE | | | | | | | | | | | | |
| | | | | | | | | | | | | | | | |
| Senior Unsecured Debt Ratings: | | | | | Rating | | Outlook | | | | | | | |
| | | | Standard & Poors | | BBB+ | | Stable | | | | | | | |
| | | | Fitch | | | BBB+ | | Stable | | | | | | | |
| | | | Moody's | | | Baa1 | | Stable | | | | | | | |
| | | | | | | | | | | | | | | | |
| | | | | | | | | | | | | | | | |
| Estimated Future Dates: | | | | | Q2 '08 | | Q3 '08 | | Q4 '08 | | Q1 '09 | | | |
| Earnings release & conference call | | | Early Aug | | Early Nov | | Early Feb | | Early May | | | |
| | | | | | | | | | | | | | | | |
| Dividend Information - Common Shares: | | | Q1 '08 | | | | | | | | | |
| Declaration Date | | | | | 03/14/08 | | | | | | | | | |
| Record Date | | | | | 03/31/08 | | | | | | | | | |
| Payment Date | | | | | 04/17/08 | | | | | | | | | |
| Distributions Per Share | | | | | $0.70 | | | | | | | | | |
| | | | | | | | | | | | | | | | |
| | | | | | | | | | | | | | | | |
| Investor Relations Data: | | | | | | | | | | | | | | |
| | | | | | | | | | | | | | | | |
| Camden does not send quarterly reports to shareholders, but supplies 10-Q's, Earnings Releases and |
| Supplemental Data upon request. | | | | | | | | | | | | |
| | | | | | | | | | | | | | | | |
| For Investor Relations: recent press releases, 10-Q's, 10-K's and other information, call | | | | | |
| 1-800-9CAMDEN or (713) 354-2787. | | | | | | | | | | | | |
| | | | | | | | | | | | | | | | |
| To access Camden's Quarterly Conference Call, please visit our web site at camdenliving.com | | | | |
| | | | | | | | | | | | | | | | |
| For questions contact: | | | | | | | | | | | | | | |
| | | | | | | | | | | | | | | | |
| | Richard J. Campo | | | Chairman & Chief Executive Officer | | | | | |
| | D. Keith Oden | | | President | | | | | | | | | |
| | H. Malcolm Stewart | | | Chief Operating Officer | | | | | | | |
| | Dennis M. Steen | | | Chief Financial Officer | | | | | | | |
| | Kimberly A. Callahan | | | Vice President- Investor Relations & Asset Management | | | |
| CAMDEN | | | | | | | | | | | COMMUNITY TABLE |
| | | | | | | | | | | | | | | Community Statistics as of 3/31/08 |
| | | | | | | | | | | | | | | | | | | | | | | |
| | | | | | | | | | | | | | | | | | | | | | |
| (Unaudited) | | | | | | | | | | | | | | | | | 1Q08 Avg |
| | | | | | | | | Year Placed | | Average | | Apartment | | | 1Q08 Avg | | | Market Rental Rates |
| Community Name | | City | | State | | in Service | | Size | | | Homes | | | Occupancy | | | Per Home | | Per Sq. Ft. |
| | | | | | | | | | | | | | | | | | | | | | |
| Camden Copper Square | | Phoenix | | AZ | | 2000 | | 786 | | | 332 | | | 92% | | | 867 | | 1.10 |
| Camden Fountain Palms (1) | | Peoria | | AZ | | 1986/1996 | | 1,050 | | | 192 | | | 94% | | | 819 | | 0.78 |
| Camden Legacy | | Scottsdale | | AZ | | 1996 | | 1,067 | | | 428 | | | 95% | | | 1,008 | | 0.94 |
| Camden Pecos Ranch (1) | | Chandler | | AZ | | 2001 | | 924 | | | 272 | | | 93% | | | 858 | | 0.93 |
| Camden San Paloma | | Scottsdale | | AZ | | 1993/1994 | | 1,042 | | | 324 | | | 93% | | | 1,053 | | 1.01 |
| Camden Sierra (1) | | Peoria | | AZ | | 1997 | | 925 | | | 288 | | | 94% | | | 788 | | 0.85 |
| Camden Towne Center (1) | | Glendale | | AZ | | 1998 | | 871 | | | 240 | | | 94% | | | 805 | | 0.92 |
| | Camden Vista Valley | | Mesa | | AZ | | 1986 | | 923 | | | 357 | | | 91% | | | 741 | | 0.80 |
| | TOTAL ARIZONA | | 8 | | Properties | | 951 | | | 2,433 | | | 93% | | | 878 | | 0.92 |
| | | | | | | | | | | | | | | | | | | | | | |
| Camden Crown Valley | | Mission Viejo | | CA | | 2001 | | 1,009 | | | 380 | | | 95% | | | 1,654 | | 1.64 |
| Camden Harbor View | | Long Beach | | CA | | 2004 | | 975 | | | 538 | | | 95% | | | 2,036 | | 2.09 |
| Camden Martinique | | Costa Mesa | | CA | | 1986 | | 794 | | | 714 | | | 92% | | | 1,391 | | 1.75 |
| Camden Parkside (1) | | Fullerton | | CA | | 1972 | | 836 | | | 421 | | | 93% | | | 1,299 | | 1.55 |
| Camden Sea Palms | | Costa Mesa | | CA | | 1990 | | 891 | | | 138 | | | 96% | | | 1,589 | | 1.78 |
| | Total Los Angeles/Orange County | | 5 | | Properties | | 890 | | | 2,191 | | | 94% | | | 1,590 | | 1.79 |
| | | | | | | | | | | | | | | | | | | | | | |
| Camden Old Creek | | San Marcos | | CA | | 2007 | | 1,037 | | | 350 | | | 96% | | | 1,471 | | 1.42 |
| Camden Sierra at Otay Ranch | | Chula Vista | | CA | | 2003 | | 962 | | | 422 | | | 96% | | | 1,521 | | 1.58 |
| Camden Tuscany | | San Diego | | CA | | 2003 | | 896 | | | 160 | | | 97% | | | 1,910 | | 2.13 |
| Camden Vineyards | | Murrieta | | CA | | 2002 | | 1,053 | | | 264 | | | 91% | | | 1,306 | | 1.24 |
| | Total San Diego/Inland Empire | | 4 | | Properties | | 995 | | | 1,196 | | | 95% | | | 1,511 | | 1.52 |
| | | | | | | | | | | | | | | | | | | | | | | |
| | TOTAL CALIFORNIA | | 9 | | Properties | | 927 | | | 3,387 | | | 94% | | | 1,562 | | 1.68 |
| | | | | | | | | | | | | | | | | | | | | | |
| Camden Arbors | | Westminster | | CO | | 1986 | | 810 | | | 358 | | | 93% | | | 726 | | 0.90 |
| Camden Caley | | Englewood | | CO | | 2000 | | 925 | | | 218 | | | 95% | | | 849 | | 0.92 |
| Camden Centennial | | Littleton | | CO | | 1985 | | 744 | | | 276 | | | 96% | | | 701 | | 0.94 |
| Camden Denver West (1) | | Golden | | CO | | 1997 | | 1,015 | | | 320 | | | 96% | | | 1,064 | | 1.05 |
| Camden Highlands Ridge | | Highlands Ranch | | CO | | 1996 | | 1,149 | | | 342 | | | 95% | | | 1,077 | | 0.94 |
| Camden Interlocken | | Broomfield | | CO | | 1999 | | 1,022 | | | 340 | | | 96% | | | 1,044 | | 1.02 |
| Camden Lakeway | | Littleton | | CO | | 1997 | | 932 | | | 451 | | | 93% | | | 912 | | 0.98 |
| | Camden Pinnacle (2) | | Westminster | | CO | | 1985 | | 748 | | | 224 | | | 90% | | | 669 | | 0.89 |
| | TOTAL COLORADO | | 8 | | Properties | | 929 | | | 2,529 | | | 95% | | | 895 | | 0.96 |
| | | | | | | | | | | | | | | | | | | | | | |
| Camden Ashburn Farms | | Ashburn | | VA | | 2000 | | 1,062 | | | 162 | | | 96% | | | 1,330 | | 1.25 |
| Camden Clearbrook | | Frederick | | MD | | 2007 | | 1,048 | | | 297 | | | 94% | | | 1,297 | | 1.24 |
| Camden Fair Lakes | | Fairfax | | VA | | 1999 | | 1,056 | | | 530 | | | 93% | | | 1,441 | | 1.37 |
| Camden Fairfax Corner | | Fairfax | | VA | | 2006 | | 934 | | | 488 | | | 95% | | | 1,545 | | 1.65 |
| Camden Fallsgrove | | Rockville | | MD | | 2004 | | 996 | | | 268 | | | 97% | | | 1,498 | | 1.50 |
| Camden Grand Parc | | Washington | | DC | | 2002 | | 674 | | | 105 | | | 95% | | | 2,227 | | 3.30 |
| Camden Lansdowne | | Leesburg | | VA | | 2002 | | 1,006 | | | 690 | | | 95% | | | 1,282 | | 1.27 |
| Camden Largo Town Center | | Largo | | MD | | 2000/2007 | | 1,027 | | | 245 | | | 93% | | | 1,596 | | 1.55 |
| Camden Monument Place (3) | | Fairfax | | VA | | 2007 | | 856 | | | 368 | | | Lease-up | | | 1,388 | | 1.62 |
| Camden Roosevelt | | Washington | | DC | | 2003 | | 856 | | | 198 | | | 95% | | | 2,186 | | 2.55 |
| Camden Russett | | Laurel | | MD | | 2000 | | 992 | | | 426 | | | 93% | | | 1,325 | | 1.34 |
| Camden Silo Creek | | Washington | | DC | | 2004 | | 975 | | | 284 | | | 94% | | | 1,245 | | 1.28 |
| | Camden Westwind | | Ashburn | | VA | | 2006 | | 1,036 | | | 464 | | | 94% | | | 1,268 | | 1.22 |
| | TOTAL DC METRO | | 13 | | Properties | | 983 | | | 4,525 | | | 94% | | | 1,432 | | 1.46 |
| | | | | | | | | | | | | | | | | | | | | | |
| Camden Aventura | | Aventura | | FL | | 1995 | | 1,108 | | | 379 | | | 94% | | | 1,408 | | 1.27 |
| Camden Brickell | | Miami | | FL | | 2003 | | 937 | | | 405 | | | 97% | | | 1,519 | | 1.62 |
| Camden Doral | | Miami | | FL | | 1999 | | 1,120 | | | 260 | | | 97% | | | 1,496 | | 1.34 |
| Camden Doral Villas | | Miami | | FL | | 2000 | | 1,253 | | | 232 | | | 97% | | | 1,572 | | 1.25 |
| Camden Las Olas | | Ft. Lauderdale | | FL | | 2004 | | 1,043 | | | 420 | | | 92% | | | 1,684 | | 1.61 |
| Camden Plantation | | Plantation | | FL | | 1997 | | 1,201 | | | 502 | | | 91% | | | 1,346 | | 1.12 |
| Camden Portofino | | Pembroke Pines | | FL | | 1995 | | 1,112 | | | 322 | | | 97% | | | 1,327 | | 1.19 |
| | Total Southeast Florida | | 7 | | Properties | | 1,103 | | | 2,520 | | | 94% | | | 1,473 | | 1.34 |
| | | | | | | | | | | | | | | | | | | | | | |
| Camden Club | | Longwood | | FL | | 1986 | | 1,077 | | | 436 | | | 93% | | | 904 | | 0.84 |
| Camden Hunter's Creek | | Orlando | | FL | | 2000 | | 1,075 | | | 270 | | | 97% | | | 992 | | 0.92 |
| Camden Lago Vista | | Orlando | | FL | | 2005 | | 955 | | | 366 | | | 96% | | | 962 | | 1.01 |
| Camden Landings | | Orlando | | FL | | 1983 | | 748 | | | 220 | | | 93% | | | 740 | | 0.99 |
| Camden Lee Vista | | Orlando | | FL | | 2000 | | 937 | | | 492 | | | 93% | | | 879 | | 0.94 |
| Camden Renaissance | | Altamonte Springs | | FL | | 1996/1998 | | 899 | | | 578 | | | 92% | | | 873 | | 0.97 |
| Camden Reserve | | Orlando | | FL | | 1990/1991 | | 824 | | | 526 | | | 92% | | | 791 | | 0.96 |
| Camden World Gateway | | Orlando | | FL | | 2000 | | 979 | | | 408 | | | 97% | | | 997 | | 1.02 |
| | Total Orlando | | 8 | | Properties | | 937 | | | 3,296 | | | 94% | | | 891 | | 0.95 |
| CAMDEN | | | | | | | | | | | | COMMUNITY TABLE |
| | | | | | | | | | | | | | Community Statistics as of 3/31/08 |
| | | | | | | | | | | | | | | | | | | | |
| | | | | | | | | | | | | | | | | | | |
| (Unaudited) | | | | | | | | | | | | | | 1Q08 Avg |
| | | | | | | | | Year Placed | | Average | | Apartment | | 1Q08 Avg | | Market Rental Rates |
| Community Name | | City | | State | | in Service | | Size | | Homes | | Occupancy | | Per Home | | Per Sq. Ft. |
| | | | | | | | | | | | | | | | | | | |
| Camden Bay | | Tampa | | FL | | 1997/2001 | | 943 | | 760 | | 94% | | 849 | | 0.90 |
| Camden Bay Pointe | | Tampa | | FL | | 1984 | | 771 | | 368 | | 94% | | 720 | | 0.93 |
| Camden Bayside | | Tampa | | FL | | 1987/1989 | | 748 | | 832 | | 95% | | 755 | | 1.01 |
| Camden Citrus Park | | Tampa | | FL | | 1985 | | 704 | | 247 | | 94% | | 704 | | 1.00 |
| Camden Lakes | | St. Petersburg | | FL | | 1982/1983 | | 732 | | 688 | | 93% | | 723 | | 0.99 |
| Camden Lakeside | | Brandon | | FL | | 1986 | | 729 | | 228 | | 95% | | 749 | | 1.03 |
| Camden Live Oaks | | Tampa | | FL | | 1990 | | 1,093 | | 770 | | 95% | | 803 | | 0.73 |
| Camden Preserve | | Tampa | | FL | | 1996 | | 942 | | 276 | | 92% | | 1,066 | | 1.13 |
| Camden Providence Lakes (4) | | Brandon | | FL | | 1996 | | 1,024 | | 260 | | 91% | | 923 | | 0.90 |
| Camden Royal Palms | | Brandon | | FL | | 2006 | | 1,017 | | 352 | | 87% | | 976 | | 0.96 |
| Camden Westshore (4) | | Tampa | | FL | | 1986 | | 728 | | 278 | | 91% | | 841 | | 1.16 |
| Camden Woods | | Tampa | | FL | | 1986 | | 1,223 | | 444 | | 95% | | 855 | | 0.70 |
| | Total Tampa/St. Petersburg | | 12 | | Properties | | 897 | | 5,503 | | 94% | | 816 | | 0.91 |
| | | | | | | | | | | | | | | | | | | |
| | TOTAL FLORIDA | | 27 | | Properties | | 955 | | 11,319 | | 94% | | 984 | | 1.03 |
| | | | | | | | | | | | | | | | | | | |
| Camden Brookwood | | Atlanta | | GA | | 2002 | | 912 | | 359 | | 93% | | 1,001 | | 1.10 |
| Camden Dunwoody | | Atlanta | | GA | | 1997 | | 1,007 | | 324 | | 96% | | 938 | | 0.93 |
| Camden Deerfield | | Alpharetta | | GA | | 2000 | | 1,187 | | 292 | | 92% | | 952 | | 0.80 |
| Camden Midtown Atlanta | | Atlanta | | GA | | 2001 | | 935 | | 296 | | 94% | | 1,032 | | 1.10 |
| Camden Peachtree City | | Peachtree City | | GA | | 2001 | | 1,027 | | 399 | | 94% | | 877 | | 0.85 |
| Camden River | | Duluth | | GA | | 1997 | | 1,103 | | 352 | | 93% | | 904 | | 0.82 |
| Camden Shiloh | | Kennesaw | | GA | | 1999/2002 | | 1,143 | | 232 | | 95% | | 846 | | 0.74 |
| Camden St. Clair | | Atlanta | | GA | | 1997 | | 999 | | 336 | | 93% | | 961 | | 0.96 |
| Camden Stockbridge | | Stockbridge | | GA | | 2003 | | 1,009 | | 304 | | 90% | | 765 | | 0.76 |
| Camden Sweetwater | | Lawrenceville | | GA | | 2000 | | 1,151 | | 308 | | 94% | | 807 | | 0.70 |
| | TOTAL GEORGIA | | 10 | | Properties | | 1,042 | | 3,202 | | 94% | | 910 | | 0.87 |
| | | | | | | | | | | | | | | | | | | |
| Camden Brookside (1) | | Louisville | | KY | | 1987 | | 732 | | 224 | | 96% | | 626 | | 0.85 |
| Camden Meadows (1) | | Louisville | | KY | | 1987/1990 | | 746 | | 400 | | 95% | | 656 | | 0.88 |
| Camden Oxmoor (1) | | Louisville | | KY | | 2000 | | 903 | | 432 | | 95% | | 792 | | 0.88 |
| Camden Prospect Park (1) | | Louisville | | KY | | 1990 | | 916 | | 138 | | 93% | | 731 | | 0.80 |
| | TOTAL KENTUCKY | | 4 | | Properties | | 820 | | 1,194 | | 95% | | 708 | | 0.86 |
| | | | | | | | | | | | | | | | | | | |
| Camden Passage (1) | | Kansas City | | MO | | 1989/1997 | | 834 | | 596 | | 95% | | 681 | | 0.82 |
| | Total Kansas City | | 1 | | Property | | 834 | | 596 | | 95% | | 681 | | 0.82 |
| | | | | | | | | | | | | | | | | | | |
| Camden Cedar Lakes (1) | | Lake St. Louis | | MO | | 1986 | | 852 | | 420 | | 92% | | 632 | | 0.74 |
| Camden Cove West (1) | | Creve Coeur | | MO | | 1990 | | 828 | | 276 | | 96% | | 851 | | 1.03 |
| Camden Cross Creek (1) | | St. Louis | | MO | | 1973/1980 | | 947 | | 591 | | 96% | | 757 | | 0.80 |
| Camden Westchase (1) | | St. Louis | | MO | | 1986 | | 945 | | 160 | | 95% | | 827 | | 0.88 |
| | Total St. Louis | | 4 | | Properties | | 896 | | 1,447 | | 95% | | 746 | | 0.83 |
| | | | | | | | | | | | | | | | | | | |
| | TOTAL MISSOURI | | 5 | | Properties | | 878 | | 2,043 | | 95% | | 727 | | 0.83 |
| | | | | | | | | | | | | | | | | | | |
| Camden Bel Air | | Las Vegas | | NV | | 1988/1995 | | 943 | | 528 | | 92% | | 870 | | 0.92 |
| Camden Breeze | | Las Vegas | | NV | | 1989 | | 846 | | 320 | | 95% | | 859 | | 1.02 |
| Camden Canyon (4) | | Las Vegas | | NV | | 1995 | | 987 | | 200 | | 95% | | 979 | | 0.99 |
| Camden Commons | | Henderson | | NV | | 1988 | | 936 | | 376 | | 90% | | 913 | | 0.98 |
| Camden Cove | | Las Vegas | | NV | | 1990 | | 898 | | 124 | | 97% | | 870 | | 0.97 |
| Camden Del Mar (4) | | Las Vegas | | NV | | 1995 | | 986 | | 560 | | 87% | | 1,034 | | 1.05 |
| Camden Fairways (4) | | Henderson | | NV | | 1989 | | 896 | | 320 | | 86% | | 1,009 | | 1.13 |
| Camden Hills | | Las Vegas | | NV | | 1991 | | 439 | | 184 | | 98% | | 635 | | 1.45 |
| Camden Legends | | Henderson | | NV | | 1994 | | 792 | | 113 | | 90% | | 928 | | 1.17 |
| Camden Palisades | | Las Vegas | | NV | | 1991 | | 905 | | 624 | | 94% | | 890 | | 0.98 |
| Camden Pines (1) | | Las Vegas | | NV | | 1997 | | 982 | | 315 | | 96% | | 934 | | 0.95 |
| Camden Pointe | | Las Vegas | | NV | | 1996 | | 983 | | 252 | | 95% | | 917 | | 0.93 |
| Camden Summit (1) | | Henderson | | NV | | 1995 | | 1,187 | | 234 | | 97% | | 1,214 | | 1.02 |
| Camden Tiara (1) | | Las Vegas | | NV | | 1996 | | 1,043 | | 400 | | 94% | | 987 | | 0.95 |
| Camden Vintage | | Las Vegas | | NV | | 1994 | | 978 | | 368 | | 95% | | 860 | | 0.88 |
| Oasis Bay (1) | | Las Vegas | | NV | | 1990 | | 876 | | 128 | | 93% | | 858 | | 0.98 |
| Oasis Crossing (1) | | Las Vegas | | NV | | 1996 | | 983 | | 72 | | 96% | | 886 | | 0.90 |
| CAMDEN | | | | | | | | | | COMMUNITY TABLE |
| | | | | | | | | | Community Statistics as of 3/31/08 |
| | | | | | | | | | | | | | | | | |
| | | | | | | | | | | | | | | | |
| (Unaudited) | | | | | | | | | | | | | | 1Q08 Avg |
| | | | | | Year Placed | | Average | | Apartment | | 1Q08 Avg | | Market Rental Rates |
| Community Name | | City | | State | | in Service | | Size | | Homes | | Occupancy | | Per Home | | Per Sq. Ft. |
| Oasis Emerald (1) | | Las Vegas | | NV | | 1988 | | 873 | | 132 | | 97% | | 773 | | 0.89 |
| Oasis Gateway (1) | | Las Vegas | | NV | | 1997 | | 1,146 | | 360 | | 94% | | 950 | | 0.83 |
| Oasis Island (1) | | Las Vegas | | NV | | 1990 | | 901 | | 118 | | 94% | | 747 | | 0.83 |
| Oasis Landing (1) | | Las Vegas | | NV | | 1990 | | 938 | | 144 | | 95% | | 810 | | 0.86 |
| Oasis Meadows (1) | | Las Vegas | | NV | | 1996 | | 1,031 | | 383 | | 93% | | 887 | | 0.86 |
| Oasis Palms (1) | | Las Vegas | | NV | | 1989 | | 880 | | 208 | | 92% | | 817 | | 0.93 |
| Oasis Pearl (1) | | Las Vegas | | NV | | 1989 | | 930 | | 90 | | 99% | | 781 | | 0.84 |
| Oasis Place (1) | | Las Vegas | | NV | | 1992 | | 440 | | 240 | | 96% | | 590 | | 1.34 |
| Oasis Ridge (1) | | Las Vegas | | NV | | 1984 | | 391 | | 477 | | 92% | | 538 | | 1.38 |
| Oasis Sands (2) | | Las Vegas | | NV | | 1994 | | 1,125 | | 48 | | 95% | | 872 | | 0.78 |
| Oasis Sierra (1) | | Las Vegas | | NV | | 1998 | | 923 | | 208 | | 94% | | 922 | | 1.00 |
| Oasis Springs (1) | | Las Vegas | | NV | | 1988 | | 838 | | 304 | | 93% | | 757 | | 0.90 |
| Oasis Vinings (1) | | Las Vegas | | NV | | 1994 | | 1,152 | | 234 | | 94% | | 866 | | 0.75 |
| TOTAL NEVADA | | 30 | | Properties | | 904 | | 8,064 | | 94% | | 874 | | 0.97 |
| | | | | | | | | | | | | | | | |
| Camden Ballantyne | | Charlotte | | NC | | 1998 | | 1,045 | | 400 | | 92% | | 905 | | 0.87 |
| Camden Cotton Mills | | Charlotte | | NC | | 2002 | | 905 | | 180 | | 95% | | 1,255 | | 1.39 |
| Camden Dilworth | | Charlotte | | NC | | 2006 | | 857 | | 145 | | 95% | | 1,240 | | 1.45 |
| Camden Fairview | | Charlotte | | NC | | 1983 | | 1,036 | | 135 | | 96% | | 835 | | 0.81 |
| Camden Forest | | Charlotte | | NC | | 1989 | | 703 | | 208 | | 93% | | 622 | | 0.88 |
| Camden Foxcroft (4) | | Charlotte | | NC | | 1979 | | 940 | | 156 | | 93% | | 755 | | 0.80 |
| Camden Grandview | | Charlotte | | NC | | 2000 | | 1,057 | | 266 | | 93% | | 1,386 | | 1.31 |
| Camden Habersham | | Charlotte | | NC | | 1986 | | 773 | | 240 | | 94% | | 663 | | 0.86 |
| Camden Park Commons | | Charlotte | | NC | | 1997 | | 861 | | 232 | | 92% | | 728 | | 0.85 |
| Camden Pinehurst | | Charlotte | | NC | | 1967 | | 1,147 | | 407 | | 93% | | 802 | | 0.70 |
| Camden Sedgebrook | | Charlotte | | NC | | 1999 | | 972 | | 368 | | 92% | | 810 | | 0.83 |
| Camden Simsbury | | Charlotte | | NC | | 1985 | | 874 | | 100 | | 94% | | 769 | | 0.88 |
| Camden South End Square | | Charlotte | | NC | | 2003 | | 882 | | 299 | | 94% | | 1,146 | | 1.30 |
| Camden Stonecrest | | Charlotte | | NC | | 2001 | | 1,098 | | 306 | | 90% | | 954 | | 0.87 |
| Camden Touchstone (4) | | Charlotte | | NC | | 1986 | | 899 | | 132 | | 94% | | 753 | | 0.84 |
| Total Charlotte | | 15 | | Properties | | 961 | | 3,574 | | 93% | | 912 | | 0.95 |
| | | | | | | | | | | | | | | | |
| Camden Crest | | Raleigh | | NC | | 2001 | | 1,013 | | 438 | | 93% | | 785 | | 0.78 |
| Camden Governor's Village | | Chapel Hill | | NC | | 1999 | | 1,046 | | 242 | | 91% | | 863 | | 0.83 |
| Camden Lake Pine | | Apex | | NC | | 1999 | | 1,066 | | 446 | | 95% | | 797 | | 0.75 |
| Camden Manor Park | | Raleigh | | NC | | 2006 | | 966 | | 484 | | 95% | | 851 | | 0.88 |
| Camden Overlook | | Raleigh | | NC | | 2001 | | 1,060 | | 320 | | 97% | | 853 | | 0.80 |
| Camden Reunion Park | | Apex | | NC | | 2000/2004 | | 972 | | 420 | | 93% | | 674 | | 0.69 |
| Camden Westwood | | Morrisville | | NC | | 1999 | | 1,027 | | 354 | | 94% | | 749 | | 0.73 |
| Total Raleigh | | 7 | | Properties | | 1,017 | | 2,704 | | 94% | | 792 | | 0.78 |
| | | | | | | | | | | | | | | | | |
| TOTAL NORTH CAROLINA | | 22 | | Properties | | 985 | | 6,278 | | 94% | | 860 | | 0.87 |
| | | | | | | | | | | | | | | | |
| Camden Valleybrook | | Chadds Ford | | PA | | 2002 | | 992 | | 352 | | 95% | | 1,275 | | 1.29 |
| TOTAL PENNSYLVANIA | | 1 | | Property | | 992 | | 352 | | 95% | | 1,275 | | 1.29 |
| | | | | | | | | | | | | | | | |
| Camden Briar Oaks | | Austin | | TX | | 1980 | | 711 | | 430 | | 93% | | 613 | | 0.86 |
| Camden Gaines Ranch | | Austin | | TX | | 1997 | | 955 | | 390 | | 93% | | 979 | | 1.03 |
| Camden Huntingdon | | Austin | | TX | | 1995 | | 903 | | 398 | | 96% | | 763 | | 0.85 |
| Camden Laurel Ridge | | Austin | | TX | | 1986 | | 702 | | 183 | | 90% | | 618 | | 0.88 |
| Camden Ridgecrest | | Austin | | TX | | 1995 | | 855 | | 284 | | 94% | | 687 | | 0.80 |
| Camden South Congress | | Austin | | TX | | 2001 | | 975 | | 253 | | 95% | | 1,463 | | 1.50 |
| Camden Stoneleigh | | Austin | | TX | | 2001 | | 908 | | 390 | | 95% | | 863 | | 0.95 |
| Camden Woodview | | Austin | | TX | | 1984 | | 644 | | 283 | | 96% | | 654 | | 1.02 |
| Total Austin | | 8 | | Properties | | 839 | | 2,611 | | 94% | | 823 | | 0.98 |
| | | | | | | | | | | | | | | | |
| Camden Breakers (4) | | Corpus Christi | | TX | | 1996 | | 868 | | 288 | | 89% | | 874 | | 1.01 |
| Camden Copper Ridge | | Corpus Christi | | TX | | 1986 | | 775 | | 344 | | 92% | | 641 | | 0.83 |
| Camden Miramar (5) | | Corpus Christi | | TX | | 1994-2004 | | 482 | | 778 | | 89% | | 869 | | 1.80 |
| Total Corpus Christi | | 3 | | Properties | | 632 | | 1,410 | | 92% | | 814 | | 1.29 |
| CAMDEN | | | | | | | | | | COMMUNITY TABLE |
| | | | | | | | | | | | | Community Statistics as of 3/31/08 |
| | | | | | | | | | | | | | | | | | | | |
| | | | | | | | | | | | | | | | | | | |
| (Unaudited) | | | | | | | | | | | | | | 1Q08 Avg |
| | | | | | | | | Year Placed | | Average | | Apartment | | 1Q08 Avg | | Market Rental Rates |
| Community Name | | City | | State | | in Service | | Size | | Homes | | Occupancy | | Per Home | | Per Sq. Ft. |
| Camden Addison (1) | | Addison | | TX | | 1996 | | 942 | | 456 | | 94% | | 830 | | 0.88 |
| Camden Buckingham | | Richardson | | TX | | 1997 | | 919 | | 464 | | 93% | | 805 | | 0.88 |
| Camden Centreport | | Ft. Worth | | TX | | 1997 | | 911 | | 268 | | 95% | | 796 | | 0.87 |
| Camden Cimarron | | Irving | | TX | | 1992 | | 772 | | 286 | | 96% | | 767 | | 0.99 |
| Camden Farmers Market | | Dallas | | TX | | 2001/2005 | | 932 | | 904 | | 96% | | 918 | | 0.98 |
| Camden Gardens | | Dallas | | TX | | 1983 | | 652 | | 256 | | 94% | | 541 | | 0.83 |
| Camden Glen Lakes (4) | | Dallas | | TX | | 1979 | | 877 | | 424 | | 90% | | 772 | | 0.88 |
| Camden Lakeview | | Irving | | TX | | 1985 | | 853 | | 476 | | 94% | | 626 | | 0.73 |
| Camden Legacy Creek | | Plano | | TX | | 1995 | | 831 | | 240 | | 96% | | 808 | | 0.97 |
| Camden Legacy Park | | Plano | | TX | | 1996 | | 871 | | 276 | | 96% | | 841 | | 0.97 |
| Camden Oasis | | Euless | | TX | | 1986 | | 548 | | 602 | | 75% | | 531 | | 0.97 |
| Camden Place | | Mesquite | | TX | | 1984 | | 772 | | 442 | | 95% | | 581 | | 0.75 |
| Camden Springs | | Dallas | | TX | | 1987 | | 713 | | 304 | | 93% | | 575 | | 0.81 |
| Camden Towne Village | | Mesquite | | TX | | 1983 | | 735 | | 188 | | 96% | | 627 | | 0.85 |
| Camden Valley Creek | | Irving | | TX | | 1984 | | 855 | | 380 | | 93% | | 652 | | 0.76 |
| Camden Valley Park | | Irving | | TX | | 1986 | | 743 | | 516 | | 93% | | 637 | | 0.86 |
| Camden Valley Ridge | | Irving | | TX | | 1987 | | 773 | | 408 | | 92% | | 594 | | 0.77 |
| Camden Westview | | Lewisville | | TX | | 1983 | | 697 | | 335 | | 95% | | 603 | | 0.87 |
| | Total Dallas/Ft. Worth | | 18 | | Properties | | 807 | | 7,225 | | 93% | | 705 | | 0.87 |
| | | | | | | | | | | | | | | | | | | |
| Camden Baytown | | Baytown | | TX | | 1999 | | 844 | | 272 | | 96% | | 829 | | 0.98 |
| Camden City Centre (3) | | Houston | | TX | | 2007 | | 932 | | 379 | | Lease-up | | 1,381 | | 1.48 |
| Camden Creek | | Houston | | TX | | 1984 | | 639 | | 456 | | 92% | | 587 | | 0.92 |
| Camden Greenway | | Houston | | TX | | 1999 | | 861 | | 756 | | 96% | | 987 | | 1.15 |
| Camden Holly Springs (1) | | Houston | | TX | | 1999 | | 934 | | 548 | | 97% | | 902 | | 0.97 |
| Camden Midtown | | Houston | | TX | | 1999 | | 844 | | 337 | | 98% | | 1,157 | | 1.37 |
| Camden Oak Crest | | Houston | | TX | | 2003 | | 870 | | 364 | | 96% | | 830 | | 0.95 |
| Camden Park (1) | | Houston | | TX | | 1995 | | 866 | | 288 | | 94% | | 782 | | 0.90 |
| Camden Plaza (1)(3) | | Houston | | TX | | 2007 | | 915 | | 271 | | Lease-up | | 1,365 | | 1.49 |
| Camden Royal Oaks (3) | | Houston | | TX | | 2006 | | 923 | | 236 | | Lease-up | | 1,069 | | 1.16 |
| Camden Steeplechase | | Houston | | TX | | 1982 | | 748 | | 290 | | 93% | | 625 | | 0.83 |
| Camden Stonebridge | | Houston | | TX | | 1993 | | 845 | | 204 | | 98% | | 822 | | 0.97 |
| Camden Sugar Grove (1) | | Stafford | | TX | | 1997 | | 921 | | 380 | | 95% | | 843 | | 0.92 |
| Camden Vanderbilt (4) | | Houston | | TX | | 1996/1997 | | 863 | | 894 | | 85% | | 1,107 | | 1.28 |
| Camden West Oaks | | Houston | | TX | | 1982 | | 726 | | 671 | | 95% | | 578 | | 0.80 |
| | Total Houston | | 15 | | Properties | | 843 | | 6,346 | | 95% | | 921 | | 1.09 |
| | | | | | | | | | | | | | | | | | | | |
| | TOTAL TEXAS | | 44 | | Properties | | 811 | | 17,592 | | 94% | | 809 | | 1.00 |
| | | | | | | | | | | | | | | | | | | | |
| TOTAL PROPERTIES | | 181 | | Properties | | 910 | | 62,918 | | 94% | | 949 | | 1.04 |
| | | | | | | | | | | | | | | | | | | |
| (1) | Communities owned through investment in joint venture. |
| (2) | Communities held for sale as of March 31, 2008. |
| (3) | Completed communities in lease-up as of March 31, 2008 are excluded from total occupancy numbers. |
| (4) | Communities under redevelopment as of March 31, 2008 are excluded from total occupancy numbers. |
| (5) | Miramar is a student housing community which is excluded from total occupancy numbers. |