United States
Securities and Exchange Commission
Washington, D.C. 20549
SCHEDULE 14A
(Rule 14a-101)
INFORMATION REQUIRED IN PROXY STATEMENT
SCHEDULE 14A INFORMATION
Proxy Statement Pursuant to Section 14(a) of the Securities
Exchange Act of 1934 (Amendment No. )
Filed by the Registrant x
Filed by a Party other than the Registrant ¨
Check the appropriate box:
| ¨ | Preliminary Proxy Statement |
| ¨ | Confidential, for Use of the Commission Only (as permitted by Rule 14a-6(e)(2)) |
| ¨ | Definitive Proxy Statement |
| x | Definitive Additional Materials |
| ¨ | Soliciting Material Pursuant to §240.14a-12 |
| NTL INCORPORATED |
| (Name of Registrant as Specified In Its Charter) |
| N/A |
| (Name of Person(s) Filing Proxy Statement, if other than the registrant) |
Payment of Filing Fee (Check the appropriate box):
| x | No fee required. |
| ¨ | Fee computed on table below per Exchange Act Rules 14a-6(i)(1) and 0-11. |
| (1) | Title of each class of securities to which transaction applies: |
| (2) | Aggregate number of securities to which transaction applies: |
| (3) | Per unit price or other underlying value of transaction computed pursuant to Exchange Act Rule 0-11 (set forth the amount on which the filing fee is calculated and state how it was determined): |
| (4) | Proposed maximum aggregate value of transaction: |
| (5) | Total fee paid: |
| | ¨ | Fee paid previously with preliminary materials: |
| ¨ | Check box if any part of the fee is offset as provided by the Exchange Act Rule 0-11(a)(2) and identify the filing for which the offsetting fee was paid previously. Identify the previous filing by registration statement number, or the Form or Schedule and the date of its filing: | ||
| (1) | Amount Previously Paid: | ||
| (2) | Form, Schedule or Registration Statement No: |
| (3) | Filing Party: |
| (4) | Date Filed: |
Filed by NTL Incorporated
Pursuant to Rule 14a-6
Under the Securities Exchange Act of 1934
NTL Inc. & Telewest Global, Inc.
Full Year 2005 Results
| Forward Looking Statements |
“Safe Harbor” Statement under the Private Securities Litigation Reform Act of 1995:
Variousstatementscontained in this documentconstitute“forward -lookingstatements” as that term is defined under the PrivateSecuritiesLitigationReform Act of 1995. Words like “believe,”“anticipate,”“should,”“intend,” “plan,” “will,” “expects,”“estimates,”“projects,”“positioned,”“strategy,” and similar expressionsidentify these forward -lookingstatements, which involve known and unknown risks, uncertainties and other factors that may cause our actual results,performance or achievements or industry results to be materially different from those contemplated,projected,forecasted,estimated or budgeted,whetherexpressed or implied, by these forward -lookingstatements. These factors include: (1) the failure to obtain and retain expectedsynergies from the proposedmerger with Telewest; (2) rates of success inexecuting,managing and integrating key acquisitions,including the proposedmerger with Telewest; (3) the ability to achievebusiness plans for the combinedNTL/Telewest group; (4) the ability to manage and maintain key customerrelationships; (5) the ability to fund debt serviceobligationsthroughoperating cash flow; (6) the ability to obtain additionalfinancing in the future and react to competitive and technologicalchanges; (7) the ability to comply with restrictivecovenants in NTL’s indebtednessagreements; (8) the ability to control customer churn; (9) our potential offer for 100% of of the shares of Virgin Mobile; (10) the ability to compete with a range of other communications and contentproviders; (11) the effect of technologicalchanges on NTL’s businesses; (12) the functionality or marketacceptance of new products that NTL may introduce; (13) possible losses in revenues due to systemsfailures; (14) the ability to maintain and upgrad e NTL’s networks in a cost-effective and timelymanner; (15) the reliance on single-source suppliers for some equipment and software; (16) the ability to provideattractive programming at a reasonable cost; and (17) the extent to which NTL’s future earnings will be sufficient to cover its fixed charges.
These and other factors are discussed in more detail under “Risk Factors” and elsewhere in NTL’s Form 10-K and in our joint proxy statement/prospectus dated January 30, 2006. We assume no obligation to update our forward -lookingstatements to reflect actual results,changes in assumptions or changes in factors affecting these statements.
2
Jim Mooney
Chairman, NTL
3
| Today’s Agenda |
| • | Jim Mooney, Chairman of NTL | |
| – | Strategic vision and overview of merged company | |
| • | Steve Burch, CEO of NTL | |
| – | Overview of integration priorities and initiatives to drive future growth | |
| • | Jacques Kerrest, CFO of NTL | |
| – | Financial review | |
4
| Our Strategic Vision |
| • | Branding and Marketing | |
| • | Bundling, including the addition of a wireless offering | |
| • | Cross-sell/Up-sell | |
| – | Supported by continued rollout of advanced RGUs (VOD/SVOD, DVR, HD, VoIP) | |
| • | Content distribution across multiple platforms | |
| • | Product convergence | |
| – | Television, Broadband, Telephony (landline and wireless) | |
| • | Best of breed margins | |
| • | Shareholder value maximization | |
| – | Significant cash flow generation opportunity | |
5
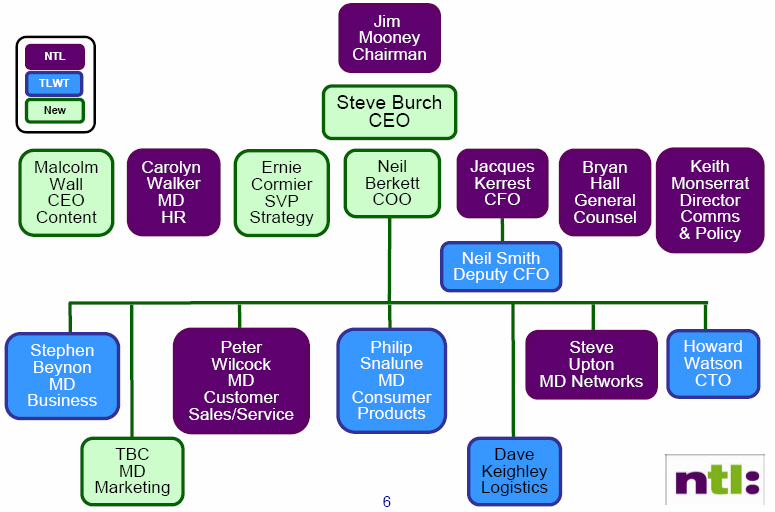
| Best of Breed Management Team |
| Best of Breed Processes Infusion |
| • | Pre Sales | • | Segmentation | |||
| – | Pricing / packaging driven by investment return appraisal | – | Target approach to prospect base | |||
| – | Bundled and benefit-led marketing | – | Customer insight tools | |||
| – | Sales channel optimisation | – | Propensity tools | |||
| – | Informed marketing approach (eg DM & ATL/BTL mix) | |||||
| • | Point of Sale | |||||
| – | Value maximisation / RGUs per sale | • | Credit | |||
| – | Sales commission structure aligned to customer lifetime value | – | Upfront credit policy and compliance | |||
| – | Increasing focus on upsell | – | Collections approach to minimise churn and debt | |||
| – | Credit management tools | |||||
| • | Provisioning | – | Reduced bad debt levels | |||
| – | Customer oriented install process | |||||
| – | Completion rate improvement | • | Back Office / Internal | |||
| – | Self-install programme trials | – | Shared service centre | |||
| – | Developed self-service environment | |||||
| • | Customer care / assurance | – | Single ERP (Finance, HR, procurement) | |||
| – | Migration to Common billing platform | |||||
| – | Network monitoring | |||||
| – | Fault management | |||||
| Retention incl Moves & Transfers | ||||||
7
| Growth Opportunity |
| UK Cable will exploit various growth opportunities along existing and new product categories aimed at driving revenue, RGU and ARPU growth |
- Up-sell existing customers to higher value packages
- Cross sell products to existing customers
- Exploit under penetrated PayTV and Broadband markets
- Price increases
- New products to exploit network advantage eg VOD, SVOD, DVR,HDTV, potentially Mobile
- Grow Triple-play and pursue Quad-play
- Enhance marketing and brand – increased scale
- Grow Business revenues through on-net data and leveraging mergednetwork
- Grow Content revenues through strong channel performance andenhanced content
| Product Development & Convergence |
| NTL & Telewest will remain focused on advancing product development convergence |
- Near-term product rollouts include
| VOD | 10Mpbs As Standard | SVOD | DVR | HD |
- Near-term product rollouts include
| Mobile | VoIP | mp3/iPod | Fixed/Mobile combo Phone |
| Future offerings will enable convergence of all home communications and entertainment needs, supported by both companies’ fully rebuilt, two-way, high-bandwidth state-of-the-art network |
9
| Strategically Valuable Content Assets |
| Increasing scale and leverage of content assets as a strategic tool versus competition – Sky, Freeview and DSL |
| • | Strategic partnerships with other major PayTV providers | |
| – | Strong desire from third parties for strategic relationship | |
| • | Address imbalance between our basic channel portfolio and lack of premium content | |
| – | Investigate bid for FAPL soccer rights | |
| – | Movie content | |
| • | Organic growth and differentiation through investment in home grown content | |
| – | Reduce channels’ reliance on acquired programming | |
| • | Differentiation through content exclusive or weighted to cable platform | |
10
| Established Leadership Position |
| UK Cable is well-positioned as the single source provider of a whole range of communication service offerings |
| UK Cable | Sky | BT | LLU Player | |||||||||||||||
| Network | Coverage | Ö Ö | Ö Ö Ö | Ö Ö Ö | Ö | |||||||||||||
| Capabilities | Ö Ö Ö | Ö Ö | Ö Ö | Ö Ö | ||||||||||||||
| Broadband | Ö Ö Ö | Ö | Ö Ö Ö | Ö Ö | ||||||||||||||
| TV | Ö Ö Ö | Ö Ö Ö | ? | ? | ||||||||||||||
| Services | Telephony | Ö Ö | ? | Ö Ö Ö | Ö Ö | |||||||||||||
| Packages | Ö Ö Ö | Ö | Ö Ö | Ö | ||||||||||||||
| ? | Undecided | |||||||||||||||||
| Ö | Low competitive position | |||||||||||||||||
| Ö Ö | Average competitive position | |||||||||||||||||
| Ö Ö Ö | Strong competitive position | |||||||||||||||||
11
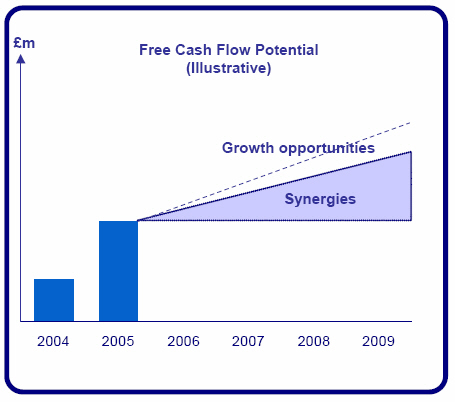
| Capital Structure Optionality |
| A combination of growth opportunities available to us together with the substantial cost synergies creates significant free cash flow generation |
 | |||
| Potential uses of FCF | |||
| • | Reduce leverage | ||
| • | Dividends | ||
| • | Share buybacks | ||
| • | Content acquisition | ||
| • | Strategic in-fill acquisitions | ||
12
Steve Burch
Chief Executive Officer, NTL
13
| Integration Priorities & Objectives |
| • | Maximize synergies | |
| – | Exploring options to increase size and timing of recognition | |
| • | Operational process improvement | |
| – | Review and implement proven strategies | |
| • | Best of Breed | |
| – | Customer care | |
| – | Management | |
| • | Customer growth | |
| – | Continue focus on RGU growth | |
| – | Drive ARPU | |
| – | Reduce churn | |
| • | New product deployment | |
| – | VOD and SVOD | |
| – | DVR | |
| – | HDTV | |
| – | Potentially Mobile | |
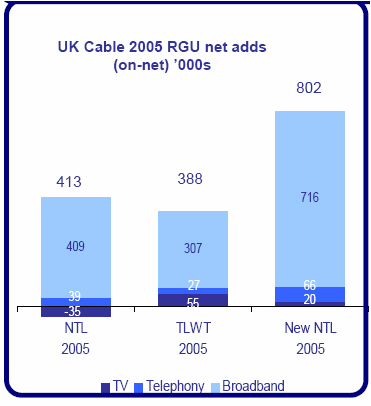
| RGU Growth Opportunities |
| RGU growth driven by broadband. UK’s largest residential broadband provider |
 | • | Broadband | ||
| – | Currently 23% penetration; 62% UK internet penetration | |||
| – | Compete on | |||
| • | Service: Own end-to-end network | |||
| • | Speed upgrades to 10Mb with potential for higher speeds | |||
| • | Content packages/upgrade paths | |||
| • | Television | |||
| – | 25% TV and 74% digital penetration | |||
| – | UK market relatively under-penetrated | |||
| – | New services add competitive strengths and underpin ARPU potential | |||
| • | Telephony | |||
| – | 34% penetration | |||
| – | Migrating to flat rate | |||
| – | Potential addition of a wireless offering | |||
15
| Triple Play to Underpin ARPU |
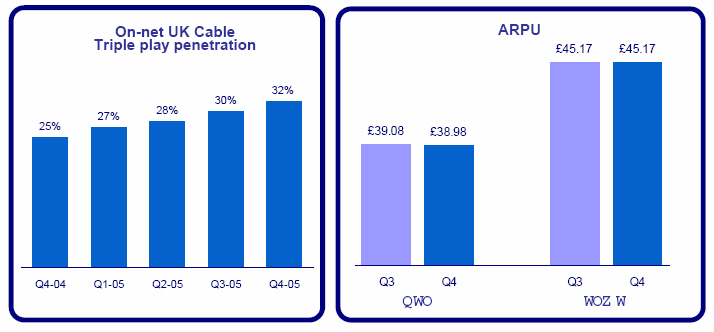 |
| • | Triple play customers generate higher ARPU and lower churn | |
| • | Cable has competitive strengths in providing triple play | |
| – | Expertise in selling and marketing bundles | |
| – | Robust product experience in TV, telephony and broadband | |
| – | End-to-end network control (no reliance on BT) | |
16
| ARPU – Disciplined Initiatives |
| • | Continued growth in triple play penetration and RGU/customer | |
| – | Bundled marketing and promotions | |
| – | Sales commission structure to emphasis bundle | |
| – | Cross-sell to existing customers | |
| • | Potential creation of the quadruple play | |
| • | Migrating telephony customers to higher ARPU Talk plans | |
| • | Increased TV capability | |
| – | VOD, DVR and HDTV | |
| • | Continued migration from analogue to digital | |
| • | Upsell and mix initiatives | |
| • | Potential to add mobile to the bundle | |
| • | Application of tight and consistent credit policy | |
| • | NTL and Telewest price increases | |
17
| Phasing of Cost Synergies |
| (in millions £) | Yr 1 | Yr 2 | Yr 3 | Exit Rate |
| EBITDA impacting: | ||||
| Savings | 60 - 80 | 135 | 185 | |
| 4th quarter run rate | 85 | 140 | 200 | 200 |
| Costs to capture | (60) - (80) | (45) | (20) | |
| Net Capex impact | (25) | 10 | 40 | 50 |
| Total Cash flow impact | (5) - (45) | 100 | 205 | 250 |
- Current estimated view of synergy phasing derived from collaborationphase of integration
- £250m of annualized cash savings as we exit year 3, with slightincrease thereafter
- Significant revenue synergies also anticipated – not included in thesenumbers
Note: Year 1 commences at the completion of the transaction
18
| Customer Care Roadmap |
| UK Cable will implement best of breed practices from NTL, Telewest and external sources to deliver superior customer care |
Improvements in customer care will be driven by:
| • | Transition to a unified billing platform | |
| • | Focus on end-to-end customer care | |
| • | Lowering costs while delivering quality customer satisfaction | |
| • | Network monitoring / fault management | |
| • | Consolidation of call centers | |
| – | NTL previously consolidated 13 call centers down to three | |
| – | Telewest previously consolidated 12 call centers down to five | |
| Telewest recently named top of JD Power customer satisfaction survey and won Contact centre of the year |
19
| Churn – Retention Strategies |
| UK Cable’s churn reduction initiatives to include: | ||
| • | Increasing RGU per customer; creating bundle “stickiness” | |
| – | Addition of a wireless offering | |
| – | Introduction of bundles for all types of customers | |
| • | Pro-active customer contact ahead of the expiration of promotional offerings | |
| • | Execution of customer care roadmap | |
| – | Customer relations center of excellence | |
| – | Movers center of excellence | |
| • | Non-pay churn addressed through | |
| – | tighter and consistent credit control | |
| – | customer segmentation | |
| • | Larger footprint reduces “movers” churn | |
20
| Business Division Growth Opportunities |
| Competitively positioned | ||
| – | Combined UK Cable national reach | |
| – | No 2 in addressable areas for profitability and cash flow | |
| – | Quality of network deployed enabling high bandwidth services | |
| – | Synergies remain in tandem with Consumer division on network and back office | |
| – | Compete effectively on service quality | |
| – | Focus on on-net traffic, data and value added services | |
| Future growth opportunities are robust | ||
| – | Market share gains can be recognized | |
| – | Expansion of sales channel | |
| – | Further leverage network quality to offer high quality services | |
| Merged Business Divisions will have greater access to on-net business; increasing reach and scale should aid competitiveness and margin |
| Business Division Stable |
- Business revenues relatively stable in challenging market conditions
- Focusing on revenue growth in data services
22
Jacques Kerrest
Chief FinancialOfficer, NTL
FinancialReview
![]()
23
| NTL Net Loss |
| 2005 | Q4 Charges/Gains | |||||||
| Q4 | Q3 | |||||||
| £m | £m | |||||||
| OCF | 155 | 166 | Includes a £9.2m bad debt charge | |||||
| increase over Q3 2005, £1.8m in | ||||||||
| Telewest related merger costs and | ||||||||
| £1.1m in redundancy costs | ||||||||
| Other charges | (22 | ) | (1 | ) | ||||
| Depreciation & Amortisation | (167 | ) | (170 | ) | ||||
| Operating income (loss) | (34 | ) | (5 | ) | Includes a charge of £22.6m relating to | |||
| an increase in the provision for vacant | ||||||||
| leasehold properties | ||||||||
| Net interest expense | (48 | ) | (45 | ) | ||||
| Other | 1 | (2 | ) | |||||
| FX transaction (losses) | 35 | (13 | ) | |||||
| Income (loss) before income taxes | (46 | ) | (65 | ) | Includes foreign currency transaction | |||
| gains of £35.2m principally due to | ||||||||
| favorable movements in the value of | ||||||||
| hedge transactions | ||||||||
| Minority interest expense | (0 | ) | (1 | ) | ||||
| Income Tax (expense) benefit | (10 | ) | 12 | |||||
| (Loss) from continuing operations | (56 | ) | (54 | ) | ||||
| Gain on disposal, net of tax | - | 2 | ||||||
| Net income (loss) | (56 | ) | (52 | ) | ||||
Note: (1) OCF is an NTL non-GAAPmeasure. SeeAppendix.
![]()
24
| SequentialPerformance |
| Q4-05 | Q3-05 | Q4-05 | Q3-05 | |||||||||||||||
| NTL | NTL | Change | TLWT | TLWT | Change | |||||||||||||
| £m | £m | £m | £m | £m | £m | |||||||||||||
| Consumer | ||||||||||||||||||
| On-net | 362 | 360 | 2 | 252 | 249 | 3 | ||||||||||||
| Off-net | 18 | 18 | (0 | ) | - | - | - | |||||||||||
| Business | 105 | 105 | - | 63 | 64 | (1 | ) | |||||||||||
| Content | - | - | 36 | 33 | 3 | |||||||||||||
| sit-up | - | - | 84 | 58 | 26 | |||||||||||||
| Revenue | 485 | 483 | 1 | 435 | 404 | 31 | ||||||||||||
| Operating Costs | (205 | ) | (200 | ) | (5 | ) | (163 | ) | (134 | ) | (29 | ) | ||||||
| S,G&A | (125 | ) | (116 | ) | (9 | ) | (129 | ) | (128 | ) | (1 | ) | ||||||
| OCF(1)/Adjusted EBITDA(2) | 155 | 166 | (11 | ) | 143 | 142 | 1 |
| (1) | OCF is an NTL non-GAAP measure. See Appendix. NTL’s Q4 2005 OCF includes a £9.2m bad debt charge increase over Q3 2005, £1.8m in Telewest related merger costs and £1.1m in redundancy costs. |
| (2) | Adjusted EBITDA is a Telewest non-GAAP measure. See Appendix. |
![]()
25
| Year-On-Year Performance |
| Q4-05 | Q4-04 | Q4-05 | Q4-04(2) | |||||||||||||||
| NTL | NTL | Change | TLWT | TLWT | Change | |||||||||||||
| £m | £m | £m | £m | £m | £m | |||||||||||||
| Consumer | ||||||||||||||||||
| On-net | 362 | 380 | -5 | % | 252 | 241 | 5 | % | ||||||||||
| Off-net | 18 | 10 | 80 | % | - | - | ||||||||||||
| Business | 105 | 122 | -14 | % | 63 | 63 | 0 | % | ||||||||||
| Content | - | - | 36 | 32 | 13 | % | ||||||||||||
| sit-up | - | - | 84 | 81 | 4 | % | ||||||||||||
| Revenue | 485 | 512 | -5 | % | 435 | 417 | 4 | % | ||||||||||
| Operating Costs | (205 | ) | (206 | ) | 0 | % | (163 | ) | (152 | ) | 7 | % | ||||||
| S,G&A | (125 | ) | (132 | ) | -5 | % | (129 | ) | (129 | ) | 0 | % | ||||||
| OCF/Adjusted EBITDA | 155 | 174 | -11 | % | 143 | 136 | 5 | % |
| Notes: | (1) | OCF is an NTL non-GAAP measure. See Appendix. |
| AdjustedEBITDA is a Telewest non-GAAP measure. See Appendix. | ||
| (2) | Telewest Q4-04 is pro forma as if sit-up had been acquired on January 1, 2004. Q4 2004 for sit-up is UK GAAP. This presentation is not intended to suggest that Telewest managementcontrolled or directed sit-up operations before 12th May 2005. Effect of proforma adjustments is to add £ 81m, £ 58m, £ 15m and £ 8m to revenue,operating costs, SG & A and AdjustedEBITDArespectively. | |
![]()
26
| Free Cash Flow |
| 2005 | 2005 | |||||
| NTL | Telewest | |||||
| £m | £m | |||||
| OCF / Adjusted EBITDA | 656 | 577 | ||||
| Other charges and non-cash items | - | 12 | ||||
| Purchase of fixed assets | (288 | ) | (232 | ) | ||
| Working Capital | (10 | ) | (17 | ) | ||
| Free Cash Flow pre-interest | 358 | 340 | ||||
| Cash interest payments, net | (187 | ) | (107 | ) | ||
| Free Cash Flow from continuing operations | 171 | 233 |
| Note: | (1) | Free cash flow from continuingoperations is a non-GAAP measure (as are OCF and Adjusted EBITDA). See Appendix. |
![]()
27
| Debt Structure |
| Q4-05 | Structure I | Structure II | |||||||||||||
| £m | £m | Rate | £m | Rate | |||||||||||
| NTL Senior Credit Facility A | 544 | 3,200 | L+162.5 | 3,200 | L+187.5 | ||||||||||
| NTL Senior Credit Facility B | 919 | - | 1,200 | L+225.0 | |||||||||||
| NTL Existing Senior Notes - Cable plc | 777 | 777 | 9.75 | % | 777 | 9.75 | % | ||||||||
| New Senior Notes - Cable plc | - | - | 600 | TBD | |||||||||||
| New Senior Notes - TopCo (Bridge) | - | 1,800 | TBD | - | |||||||||||
| Capital Leases/Other | 40 | 136 | 136 | ||||||||||||
| Gross Debt | 2,280 | 5,913 | 5,913 | ||||||||||||
| Cash | (832 | ) | |||||||||||||
| Net Debt(1) | 1,448 | ||||||||||||||
| Note: | (1) | Net Debt is a non-GAAPmeasure. SeeAppendix. |
![]()
28
Jim Mooney
Chairman, NTL
![]()
29
| InvestmentSummary |
| Greatly enhanced management team | ||
| Solid Growth Opportunities | ||
| — | Revenue | |
| — | Net subscriber growth | |
| — | Product Expansion | |
| Brand infusion | ||
| Marketing leverage | ||
| Significant expense reduction | ||
| Margin expansion opportunities | ||
| Free cash flow generation | ||
![]()
30
| CautionaryStatementRegardingSynergies |
The informationcontained in the discussion of synergies set forth above is subjective in many respects and therefore is susceptible to variousinterpretations. The discussion of synergiesreflectsnumerousassumptions made by the management of ntl and Telewest with respect to the speed and the scale of delivery, all of which are difficult to predict and many of which are beyond ntl’s and Telewest’s control. ntl and Telewest cannot predict whether the assumptions made in preparing the discussion of synergies will prove accurate. While presented with numericspecificity, the discussion of synergies is inherentlyimprecise, and ntl and Telewest can give no any assurance that the anticipatedsynergies will match thoseactuallyachieved, which may ultimately be materially higher or lower than those discussed above. The provision of this information should not be regarded as an indication that ntl, Telewest or any third parties consider such information to be a reliableprediction of future events, and this information should not be relied on as such.
ntl and Telewest do not intend to, and specificallydisclaim any duty to, update the discussion of synergies, even if any or all of the underlyingassumptions are shown to be in error or if there is any change that would warrant any such update.
The discussion of synergies was not prepared in compliance with any regulations or guidelinespromulgated by the U.S. Securities and ExchangeCommission(includingRegulation G of the SEC) or the AmericanInstitute of Certified Public Accountantsrelating to the presentation of financialinformation, nor was it prepared in accordance with U.S. GAAP. The discussion of synergiescontains “non-GAAP financialmeasures” within the meaning of Regulation G of Regulation S-K that have not been reconciled with GAAP financialmeasures. Neither ntl’s nor Telewest’s auditors nor any other independentaccountants have compiled,examined or performed anyprocedures with respect to the informationcontained in the discussion of synergies. In addition,neither ntl’s or Telewest’s auditors nor any other independentaccountants have expressed any opinion or any other form of assurance with respect to this information or its achievability, and assume no responsibility for, and disclaim any association with, this information.
For all of the reasons noted above, we stronglycaution you not to place undue reliance on the discussion of synergies.
![]()
31
| Responsibility for SeparateInformation |
The information in this presentationrelating to NTL has been provided by NTL, which is solely responsible for that information. The information in this presentationrelating to Telewest has been provided by Telewest, which is solely responsible for that information.
The statements of combined NTL and Telewest amounts in this presentation are estimates and have been calculated by adding similar categoryinformationderived from the companies’separate filings with the Securities and ExchangeCommission or informationotherwiseprovided by each company for the relevantperiods. This data has not been adjusted to reflect, for example, inter-companyamounts,differences in accountingpolicies or other matters.Consequently, this measurementmethod may result in amounts that differ from those that the companies or the combinedcompany may use in the future.
![]()
32
| AdditionalInformation and Where to Find It |
This document may be deemed to be solicitationmaterial in respect of the proposedmerger of ntl and Telewest or any relatedtransaction. In connection with the proposedmerger and relatedtransactions, ntl and Telewest have filed a joint proxy statement/prospectus with the U.S. Securities and ExchangeCommission (the “SEC”) . INVESTORS AND SECURITYHOLDERS OF NTL AND TELEWEST ARE ADVISED TO READ THE JOINT PROXYSTATEMENT/PROSPECTUS AND ANY OTHERRELEVANTDOCUMENTS FILED WITH THE SEC BECAUSETHOSEDOCUMENTS WILL CONTAINIMPORTANTINFORMATIONABOUT THE PROPOSEDMERGER AND RELATEDTRANSACTIONS. The final joint proxy statement/prospectus was mailed to stockholders of ntl and Telewest on or about January 31, 2006. Investors and securityholders may obtain a free copy of the joint proxy statement/prospectus, and other documents filed by ntl and Telewest with the SEC, at the SEC’s web site at http://www. sec.gov. Free copies of the joint proxy statement/prospectus, and each company’s other filings with the SEC, may also be obtained from the respectivecompanies. Free copies of ntl’s filings may be obtained by directing a request to ntl Incorporated, 909 Third Avenue, Suite 2863, New York, New York 10022,Attention:InvestorRelations. Free copies of Telewest’s filings may be obtained by directing a request to Telewest Global, Inc., 160 Great Portland Street, London W1W 5QA, United Kingdom,Attention:InvestorRelations.
This communication shall not constitute an offer to sell or the solicitation of an offer to buy securities, nor shall there be any sale of securities in any jurisdiction in which such offer, solicitation or sale would be unlawful prior to registration or qualification under the securities laws of such jurisdiction.
![]()
33
| NTL Appendices |
| • | Use of non-U.S. GAAP measures | |
| – | The company’s intention is to provide investors with a better understanding of the operating results and underlying trends to measure past and future performance and liquidity. We evaluate operating performance based on several non-U.S. GAAP measures, including (i) operating income before depreciation, amortization and other charges (OCF) and the associated term OCF margin, (ii) free cash flow from continuing operations (iii)fixed asset additions (accrual basis), and (iv) net debt as we believe these are important measures of the operational strength of our business. Since these measures are not calculated in accordance with U.S. GAAP, they should notbe considered as substitutes for operating income (loss), net cash provided by (used in) operating activities and purchase of fixed assets, respectively, as indicators of our operating and cash flow performance and expenditure for fixed assets. | |
| – | The presentation of this supplemental information is not meant to be considered in isolation or as a substitute for other measures of financial performance reported in accordance with U.S. GAAP. These non-U.S. GAAP financial measures reflect an additional way of viewing aspects of ntl’soperations that, when viewed with ntl’sU.S. GAAP results and the accompanying reconciliations to corresponding U.S. GAAP financial measures, provide a more complete understanding of factors and trends affecting ntl’sbusiness. Management encourages investors to review ntl’sfinancial statements and publicly-filed reports in their entirety and to not rely on any single financial measure. | |
| • | Reconciliations to U.S. GAAP | |
![]()
34
| NTL Appendices |
Use of Non-U.S. GAAP(GenerallyAccepted AccountingPrinciples)FinancialMeasures
Operatingincomebeforedepreciation,amortization and other charges (OCF)
•Operatingincome before depreciation,amortisation and other charges, which we refer to as OCF, is not a financialmeasurerecognised under U.S. GAAP. OCF represents our earnings before interest, taxes, depreciation and amortisation, other charges, share of income from equity investments, loss on extinguishment of debt and foreigncurrencytransaction gains (losses) . Our management,including our chief executive officer who is our chief operatingdecisionmaker,considers OCF as an importantindicator of our operationalstrength and performance. OCF excludes the impact of costs and expenses that do not directly affect our cash flows. Other charges,includingrestructuringcharges, are also excluded from OCF as managementbelieves they are not characteristic of our underlyingbusinessoperations. OCF is most directlycomparable to the U.S. GAAP financialmeasureoperating income (loss). Some of the significantlimitationsassociated with the use of OCF as compared to operatingincome (loss)) are that OCF does not consider the amount of requiredreinvestment in depreciable fixed assets and ignores the impact on our results of operations of items that managementbelieves are not characteristic of our underlyingbusinessoperations.
•We believe OCF is helpful for understanding our performance and assessing our prospects for the future, and that it provides useful supplementalinformation to investors. In particular, this non-U.S. GAAP financialmeasurereflectsadditional ways of viewingaspects of our operations that, when viewed with our U.S. GAAP results and the reconciliation to operatingincome (loss) shown below, provides a more completeunderstanding of factors and trends affecting our business. Because non-U.S. GAAP financialmeasures are not standardised, it may not be possible to compare OCF with other companies’ non-U.S. GAAP financialmeasures that have the same or similar names.
35
| NTL Appendices |
Reconciliation of OperatingIncomebeforeDepreciation,Amortization and other Charges to U.S. GAAP Operatingincome (loss)
| 3 months ended | 3 months ended | ||||||||||||||||||||
| Year ended | Year ended | ||||||||||||||||||||
| December 31, | Dec 31, | Sept 30, | June 30, | March 31, | December 31, | Dec 31, | Sept 30, | June 30, | March 31, | ||||||||||||
| 2005 | 2005 | 2005 | 2005 | 2005 | 2004 | 2004 | 2004 | 2004 | 2004 | ||||||||||||
| Revenue | £1,947.6 | £484.6 | £482.7 | £482.5 | £497.8 | £2,000.3 | £512.3 | £498.5 | £493.8 | £495.7 | |||||||||||
| Operating income before depreciation, amortization and other charges | 656.3 | 154.7 | 166.3 | 164.2 | 171.1 | 670.4 | 174.9 | 171.4 | 164.0 | 160.1 | |||||||||||
| Reconciling items: | |||||||||||||||||||||
| Other charges | (24.8 | ) | (22.4 | ) | (1.3 | ) | (0.7 | ) | (0.4 | ) | (23.8 | ) | (4.8 | ) | (3.7 | ) | (14.7 | ) | (0.6 | ) | |
| Depreciation and amortization | (651.2 | ) | (166.7 | ) | (169.7 | ) | (157.1 | ) | (157.7 | ) | (699.1 | ) | (181.2 | ) | (175.5 | ) | (171.9 | ) | (170.5 | ) | |
| Operating (loss) income | (£19.7 | ) | (£34.4 | ) | (£4.7 | ) | £6.4 | £13.0 | (£52.5 | ) | (£11.1 | ) | (£7.8 | ) | (£22.6 | ) | (£11.0 | ) | |||
| OCF as a precentage of revenue (OCF margin) | 33.7% | 31.9% | 34.5% | 34.0% | 34.4% | 33.5% | 34.1% | 34.4% | 33.2% | 32.3% | |||||||||||
| Operating (loss) income as a percentage of revenue | (1.0% | ) | (7.1% | ) | (1.0% | ) | 1.3% | 2.6% | (2.6% | ) | (2.2% | ) | (1.6% | ) | (4.6% | ) | (2.2% | ) | |||
36
| NTL Appendices |
Use of Non-U.S. GAAP(GenerallyAcceptedAccountingPrinciples)FinancialMeasures,cont‘d.
Free Cash Flow (ContinuingOperations)
•ntl's primarymeasure of cash flow is Free Cash Flow. Free Cash Flow is defined as net cash provided by (used in) operatingactivities less cash used in the purchase of fixed assets adding back cash used in the purchase of marketablesecurities and one-off contributions to our defined benefit pensionschemes made as a condition of the sale of our Broadcast operations. ntl's business is underpinned by its significantinvestment in networkinfrastructure and informationtechnology.Managementthereforeconsiders it important to measure cash flow from continuingoperations after cash used in the purchase of fixed assets. Free Cash Flow is most directlycomparable to the U.S. GAAP financialmeasure net cash provided by (used in) operatingactivities. The significantlimitationassociated with Free Cash Flow as compared to net cash provided by (used in) operatingactivities is that Free Cash Flow deducts cash used in the purchase of fixed assets and adds back cash flow from the purchase of marketablesecurities as well as one-off contributions to defined benefit pensionschemes which are made as a condition of the sale of our Broadcastoperation.Managementdeductspurchase of fixed assets in arriving at Free Cash Flow because it considers the amountinvested in the purchase of fixed assets to be an importantcomponent in evaluating ntl's liquidity. Management adds back the purchase of marketablesecurities and the one-off pensioncontributionbecause it believes that they are not importantcomponents in evaluating ntl's liquidity on a continuing basis.
•The presentation of this supplementalinformation is not meant to be considered in isolation or as a substitute for other measures of financialperformancereported in accordance with U.S. GAAP accepted in the United States. These non-U.S. GAAP financialmeasures reflect an additional way of viewingaspects of ntl’s operations that, when viewed with ntl’s U.S. GAAP results and the accompanyingreconciliations to corresponding U.S. GAAP financialmeasures,provide a more completeunderstanding of factors and trends affecting ntl’s business. Managementencouragesinvestors to review ntl’s financialstatements and publicly -filed reports in their entirety and to not rely on any single financialmeasure.
37
| NTL Appendices |
Reconciliation of Free Cashflow to U.S. GAAP Net cash provided by continuing operating activites
|
| Year ended |
| 3 months ended |
| Year ended |
| 3 months ended |
| ||||||||||||||||||||||
|
| Dec 31, |
| Dec 31, |
| Sept 30, |
| June 30, |
| March 31, |
| Dec 31, |
| Dec 31, |
| Sept 30, |
| June 30, |
| March 31, |
| ||||||||||
Free Cash Flow from continuing operations |
|
| £170.8 |
|
| £35.5 |
|
| £44.8 |
|
| £24.3 |
|
| £66.2 |
|
| (£13.1 | ) |
| (£2.6 | ) |
| £27.0 |
|
| (£0.4 | ) |
| (£37.1 | ) |
|
|
|
|
|
|
|
|
|
|
|
|
|
|
|
|
|
|
|
|
|
| ||||||||||
Pension Payment* |
| (54.0 | ) |
|
|
|
| (54.0 | ) |
|
|
|
|
|
|
|
|
|
|
|
| ||||||||||
Marketable securities |
| (79.3 | ) | (4.4 | ) | (0.0 | ) | (77.6 | ) | 2.7 |
| (12.1 | ) | (12.1 | ) | — |
| — |
| — |
| ||||||||||
Purchase of Fixed Assets - continuing operations |
| 288.1 |
| 71.8 |
| 71.9 |
| 70.6 |
| 73.8 |
| 274.5 |
| 82.8 |
| 75.5 |
| 65.5 |
| 50.7 |
| ||||||||||
Net cash provided by operating activities continuing operations |
|
| £325.6 |
|
| £102.2 |
|
| £116.7 |
|
| (£36.7 | ) |
| £142.7 |
|
| £249.3 |
|
| £68.1 |
| £ | 102.5 |
|
| £65.1 |
|
| £13.6 |
|
*The £54m Pension payment in Q2-05 relates to a one-off contribution of our defined pension Schemes which was made in
connection with the sale of our Broadcast operations.
38
| NTL Appendices |
Use of Non-U.S.GAAP(GenerallyAcceptedAccountingPrinciples)FinancialMeasures,cont‘d.
Net debt
Net debt is defined as the sum of debt repayable, capital lease obligations and accruedinterestpayable on notes and debentures less cash and cash equivalents and marketablesecurities. The Company’smanagement,including its chief operatingdecision -maker,considers net debt an importantmeasure of the financingobligationsundertaken by the Company.
Net debt is not a financialmeasurerecognized under U.S. GAAP. This measure is most directlycomparable to the U.S. GAAP financialmeasure, total liabilities. The significantlimitationassociated with the use of net debt as compared to total liabilities is that net debt does not considercurrentliabilities due in respect of accountspayable and other liabilities. It also assumes that all of cash and cash equivalents and marketablesecurities are available to service debt. ntl believes net debt is helpful for understanding its entire net debt fundingobligations and it provides useful supplementalinformation to investors.Because non-U.S.GAAP financialmeasures are not standardized, it may not be possible to compare net debt with other companies' non-U.S.GAAP financialmeasures that have the same or similar names. The presentation of this supplementalinformation is not meant to be considered in isolation or as a substitute for total liabilities, or other measures of financialperformancereported in accordance with U.S.GAAP.
39
| NTL Appendices |
Reconciliation of net debt to U.S. GAAP to Total liabilities
| in millions | Year ended December 31, | |||
| 2005 | 2004 | |||
| Net Debt | £1,447.9 | £2,876.7 | ||
| Cash and cash equivalents | 735.2 | 125.2 | ||
| Marketable Securities | 96.9 | 11.6 | ||
| Total Debt | 2,280.0 | 3,013.5 | ||
| Accounts payable | 176.9 | 114.0 | ||
| Accrued expenses and other current liabilities | 291.1 | 300.1 | ||
| Interest Payable | 37.8 | 51.9 | ||
| Liabilities of discontinued operations | 0.0 | 112.6 | ||
| Deferred Revenue and other long-term liabilities | 237.5 | 326.7 | ||
| Deferred Income Taxes | 9.2 | 0.0 | ||
| Minority Interest | 1.0 | 0.0 | ||
| Total liabilities | 3,033.5 | 3,918.8 | ||
40
| Telewest Appendices |
AdjustedEBITDA
•Telewest’s primarymeasure of income or loss for each of our reportablesegments is AdjustedEBITDA. Our management,including our chief operatingdecision -maker,considersAdjustedEBITDA an importantindicator of the operationalstrength and performance of our reportablesegments.AdjustedEBITDA for each segment and in total excludes the impact of costs and expenses that do not directly affect our cash flows or do not directly relate to the operatingperformance of that segment. These costs and expensesincludedepreciation,amortization,financialrestructuringcharges,mergerrelated fees, interestexpense,foreignexchangegains/(losses), share of net income/(loss) from affiliates and income taxes. It is the belief of management that the legal and professional costs relating to our financialrestructuring and the proposedmerger with NTL are not characteristic of our underlyingbusinessoperations.Furthermoremanagementbelieves that some of the components of thesecharges are not directlyrelated to the performance of a single reportablesegment.
•AdjustedEBITDA is not a financialmeasurerecognised under GAAP. This measure is most directlycomparable to the GAAP financialmeasure net income/(loss) . Some of the significantlimitationsassociated with the use of AdjustedEBITDA as compared to net income/(loss) are that AdjustedEBITDA does not reflect the amount of requiredreinvestment in depreciable fixed assets,financialrestructuringcharges,mergerrelated fees, interestexpense,foreignexchange gains or losses,income taxes expense or benefit and similar items on our results of operations. We believeAdjustedEBITDA is helpful for understanding our performance and assessing our prospects for the future, and that it provides useful supplementalinformation to investors. In particular, this non-GAAP financialmeasurereflects an additional way of viewingaspects of our operations that, when viewed with our GAAP results and the reconciliations to net income/(loss), shown below, provide a more completeunderstanding of facto rs and trends affecting our business.Because non-GAAP financialmeasures are not standardized, it may not be possible to compareAdjustedEBITDA with other companies’ non-GAAP financialmeasures that have the same or similar names. The presentation of this supplementalinformation is not meant to be considered in isolation or as a substitute for net cash provided by operatingactivities,operatingincome/(loss), net income/(loss), or other measures of financialperformancereported in accordance with GAAP.
41
| Telewest Appendices |
| Reconciliations of Non-GAAP Financial Measures | |||||
| (amounts in £millions) | |||||
| Three months ended Dec. 31, | |||||
| 2005 | 2004 | ||||
| Reorganized | Reorganized | ||||
| Company | Company | ||||
| Reconciliation of Adjusted EBITDA to net income/(loss) | |||||
| Adjusted EBITDA | 143 | 128 | |||
| Financial restructuring | |||||
| charges | - | - | |||
| Merger related fees | (6 | ) | - | ||
| Depreciation | (98 | ) | (101 | ) | |
| Amortization | (9 | ) | (9 | ) | |
| Operating income | 30 | 18 | |||
| Interest income | 5 | 5 | |||
| Interest expense (including | |||||
| amortization of debt | |||||
| discount) | (42 | ) | (47 | ) | |
| Foreign exchange | |||||
| (losses)/gains, net | (2 | ) | 3 | ||
| Share of net income of | |||||
| affiliates | 3 | 4 | |||
| Other, net | 3 | - | |||
| Income tax (charge)/benefit | (1 | ) | - | ||
| Net (loss)/income | (4 | ) | (17 | ) | |
42
| Telewest Appendices |
Reconciliation of Telewest pro-forma adjustedEBITDA to net income for the 3 months ended December 31, 2004
| £m | ||||
| Pro-forma adjusted EBITDA | 136 | |||
| sit-up pro-forma revenue adjustment | -81 | |||
| sit-up pro-forma operating costs adjustment | 58 | |||
| sit-up pro-forma SG&A adjustment | 15 | |||
| -8 | ||||
| Adjusted EBITDA | 128 | |||
| Depreciation | -101 | |||
| Amortization | -9 | |||
| Operating income | 18 | |||
| Interest income | 5 | |||
| Interest expense | -47 | |||
| Foreign exchange gains | 3 | |||
| Share of net income of affiliates | 4 | |||
| Net income | -17 | |||
43
| Telewest Appendices |
Free cash flow
•Telewest's primarymeasure of cash flow is free cash flow. Free cash flow is defined as net cash providedby/(used in) operatingactivitiesexcluding cash paid for financialrestructuringcharges and mergerrelated fees, less capital expenditure. Our management,including our chief operatingdecision -maker,considers free cash flow an importantindicator of the operationalperformance of our business.
•Free cash flow is not a financialmeasurerecognized under GAAP. This measure is mostdirectlycomparable to the GAAP financialmeasure net cash providedby/(used in) operatingactivities. The significantlimitationassociated with the use of free cash flow as compared to net cash providedby/(used in) operatingactivities is that free cash flow does not consider the amount of cash required to pay financialrestructuringcharges and mergerrelated fees. We believe free cash flow is helpful for understanding our performance and it provides useful supplementalinformation to investors.Because non-GAAP financialmeasures are not standardized, it may not be possible to compare free cash flow with other companies' non-GAAP financialmeasures that have the same or similar names. The presentation of this supplementalinformation is not meant to be considered in isolation or as a substitute for net cash providedby/(used in) operatingactivities, or other measures of financialperformancereported in accordance with GAAP.
44
| Telewest Appendices |
Reconciliations of Non-GAAP FinancialMeasures
Reconciliation of free cash flow to net cash provided byoperatingactivities
| Year ended 31 Dec. 2005 | |
| £m | |
| Free cash flow | 233 |
| Deduct cash paid for financial restructuring charges | -1 |
| Deduct cash paid for merger related fees | -3 |
| Add capital expenditure | 232 |
| Net cash provided by operating activities | 461 |
Free cash flow is reported after cash paid for interest, net, and cash received for income taxes
| Supplementary cash flow information: | |
| Cash paid for interest, net | 107 |
| Cash received for income taxes, net | -2 |
45
| Telewest Appendices |
Net debt
•Net debt is defined as the sum of debt repayable, capital lease obligations and accruedinterestpayable on notes and debentures less cash and cash equivalents. The Company’smanagement,including its chief operatingdecision -maker,considers net debt an importantmeasure of the financingobligationsundertaken by the Company.
•Net debt is not a financialmeasurerecognized under GAAP. This measure is most directlycomparable to the GAAP financialmeasure, total liabilities. The significantlimitationassociated with the use of net debt as compared total liabilities is that net debt does not considercurrentliabilities due in respect of accountspayable and other liabilities. It also assumes that all of cash and cash equivalents is available to service debt. Telewest believes net debt is helpful for understanding its entire net debt fundingobligations and it provides useful supplementalinformation to investors.Because non-GAAP financialmeasures are not standardized, it may not be possible to compare net debt with other companies' non-GAAP financialmeasures that have the same or similar names. The presentation of this supplementalinformation is not meant to be considered in isolation or as a substitute for total liabilities, or other measures of financial performancereported in accordance with GAAP.
46
| Telewest Appendices |
| Dec. 31, | |
| 2005 | |
| Reorganized | |
| Company | |
| Reconciliation of net debt to total liabilities | |
| Net debt | 1,601 |
| Cash and cash equivalents | 292 |
| Total debt | 1,893 |
| Accounts payable | 129 |
| Other liabilities | 463 |
| Deferred taxes | 98 |
| Total liabilities | 2,583 |
47