Link to searchable text of slide shown above
Link to searchable text of slide shown above
Link to searchable text of slide shown above
Link to searchable text of slide shown above
Link to searchable text of slide shown above
Link to searchable text of slide shown above
Link to searchable text of slide shown above
Link to searchable text of slide shown above
Link to searchable text of slide shown above
Link to searchable text of slide shown above

Link to searchable text of slide shown above
Link to searchable text of slide shown above
Link to searchable text of slide shown above
Link to searchable text of slide shown above
Link to searchable text of slide shown above
Link to searchable text of slide shown above
Link to searchable text of slide shown above
Link to searchable text of slide shown above
Link to searchable text of slide shown above
Link to searchable text of slide shown above
Link to searchable text of slide shown above
Link to searchable text of slide shown above
Link to searchable text of slide shown above
Link to searchable text of slide shown above
Link to searchable text of slide shown above
Link to searchable text of slide shown above

Link to searchable text of slide shown above
Link to searchable text of slide shown above
Link to searchable text of slide shown above
Link to searchable text of slide shown above
Link to searchable text of slide shown above
Link to searchable text of slide shown above

Link to searchable text of slide shown above
Searchable text section of graphics shown above
NTL Incorporated
Second Quarter 2004 Results
Simon Duffy, CEO
Scott Schubert, CFO
August 4, 2004
[LOGO]
Safe Harbor
Various statements contained in this presentation constitute “forward-looking statements” as defined under the Private Securities Litigation Reform Act of 1995. Words like “believe,” “anticipate,” “should,” “intend,” “plan,” “will,” “expects,” “estimates,” “projects,” “positioned,” “strategy,” and similar expressions identify these forward-looking statements, which involve known and unknown risks, uncertainties and other factors that may cause our actual results or performance, achievements or industry results to be materially different from those contemplated, whether expressed or implied, by these forward-looking statements. These factors include those set forth under the caption “Risk Factors” in our form 10-K that was filed with the SEC on March 11, 2004, such as: potential adverse developments with respect to our liquidity or results of operations; our significant debt payments and other contractual commitments; our ability to fund and execute our business plan; our ability to generate cash sufficient to service our debt; the impact of new business opportunities requiring significant up-front investments; our ability to attract and retain customers, increase our overall market penetration and react to competition from providers of alternative services; our ability to integrate our billing systems; our significant management changes; our ability to develop and maintain back-up for our critical systems; our ability to respond adequately to technological developments; our ability to maintain contracts that are critical to our operations; our ability to continue to design networks, install facilities, obtain and maintain any required governmental licenses or approvals and finance construction and development, in a timely manner at reasonable costs and on satisfactory terms and conditions; the extent to which UK and EU merger control laws restrict our ability to expand through mergers or acquisitions; our ability to achieve, or realize benefits from, any further consolidation in the UK cable industry; interest rate and currency exchange rate fluctuations; the impact of our recent reorganization and subsequent organizational restructuring. We assume no obligation to update these forward-looking statements to reflect actual results, changes in assumptions or changes in factors affecting these statements.
This presentation also contains non-GAAP financial measures as defined in Regulation G adopted by the SEC. We provided a reconciliation of these non-GAAP financial measures, such as segment profit, to the most directly comparable GAAP financial measure in our quarterly earnings releases and the appendix of this presentation, both of which can be found on the investor relations page of our website at www.ntl.com.
2
Second Quarter 2004 Results Agenda
• | Progress on Stated Objectives |
|
|
• | Financial Report |
|
|
• | Operational Review |
|
|
• | Closing Remarks |
|
|
• | Questions & Answers |
3
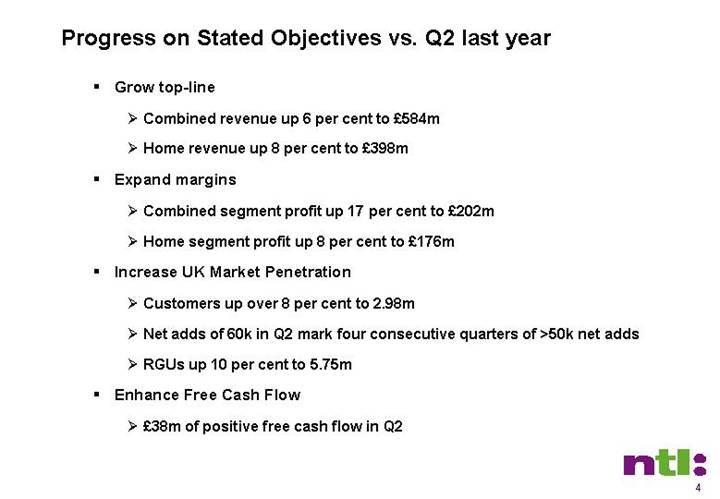
Progress on Stated Objectives vs. Q2 last year
• Grow top-line
• Combined revenue up 6 per cent to £584m
• Home revenue up 8 per cent to £398m
• Expand margins
• Combined segment profit up 17 per cent to £202m
• Home segment profit up 8 per cent to £176m
• Increase UK Market Penetration
• Customers up over 8 per cent to 2.98m
• Net adds of 60k in Q2 mark four consecutive quarters of >50k net adds
• RGUs up 10 per cent to 5.75m
• Enhance Free Cash Flow
• £38m of positive free cash flow in Q2
4
Second Quarter 2004 Results
• | Progress on Stated Objectives |
|
|
• | Financial Report |
|
|
• | Operational Review |
|
|
• | Closing Remarks |
|
|
• | Questions & Answers |
5
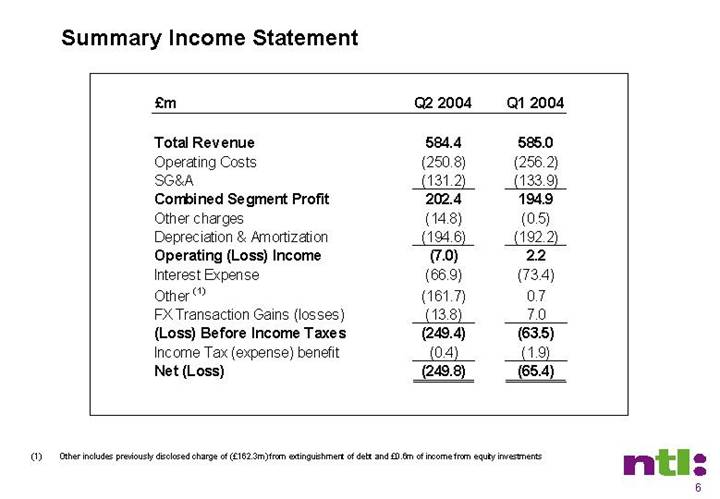
Summary Income Statement
£m |
| Q2 2004 |
| Q1 2004 |
|
|
|
|
|
|
|
Total Revenue |
| 584.4 |
| 585.0 |
|
Operating Costs |
| (250.8 | ) | (256.2 | ) |
SG&A |
| (131.2 | ) | (133.9 | ) |
Combined Segment Profit |
| 202.4 |
| 194.9 |
|
Other charges |
| (14.8 | ) | (0.5 | ) |
Depreciation & Amortization |
| (194.6 | ) | (192.2 | ) |
Operating (Loss) Income |
| (7.0 | ) | 2.2 |
|
Interest Expense |
| (66.9 | ) | (73.4 | ) |
Other (1) |
| (161.7 | ) | 0.7 |
|
FX Transaction Gains (losses) |
| (13.8 | ) | 7.0 |
|
(Loss) Before Income Taxes |
| (249.4 | ) | (63.5 | ) |
Income Tax (expense) benefit |
| (0.4 | ) | (1.9 | ) |
Net (Loss) |
| (249.8 | ) | (65.4 | ) |
(1) Other includes previously disclosed charge of (£162.3m) from extinguishment of debt and £0.6m of income from equity investments
6
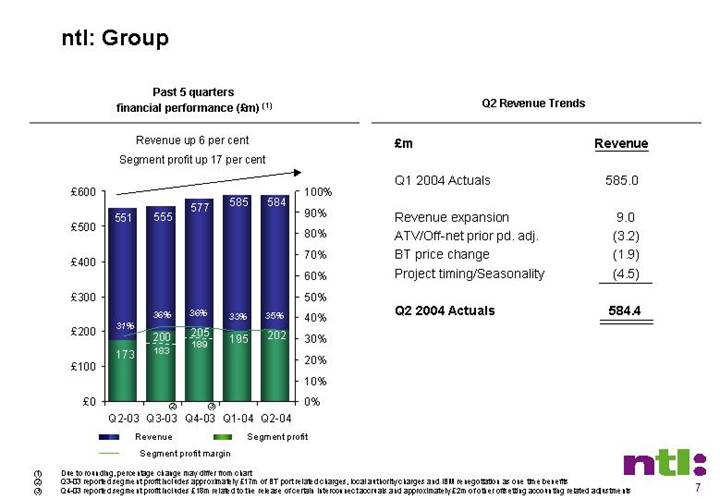
ntl: Group
Past 5 quarters
financial performance (£m) (1)
Revenue up 6 per cent
Segment profit up 17 per cent
[CHART]
Q2 Revenue Trends
£m |
| Revenue |
|
|
|
|
|
Q1 2004 Actuals |
| 585.0 |
|
|
|
|
|
Revenue expansion |
| 9.0 |
|
ATV/Off-net prior pd. adj. |
| (3.2 | ) |
BT price change |
| (1.9 | ) |
Project timing/Seasonality |
| (4.5 | ) |
|
|
|
|
Q2 2004 Actuals |
| 584.4 |
|
(1) Due to rounding, percentage change may differ from chart
(2) Q3-03 reported segment profit includes approximately £17m of BT port related charges, local authority charges and IBM renegotiation as one time benefits
(3) Q4-03 reported segment profit includes £18m related to the release of certain interconnect accruals and approximately £2m of other offsetting accounting related adjustments
7
ntl: Home
Past 5 quarters
financial performance (£m) (1)
Revenue up 8 per cent
Segment profit up 8 per cent
[CHART]
Q2 Revenue Highlights
• Continued strong growth in customers and RGUs
• Improved customer mix
• Increased penetration of broadband
• Growth in telephony Talk Plan subscribers
• Increase in DTV customers
• Offsetting
• ATV/Off-net prior pd. adj.
• Seasonality
• BT price change
(1) Due to rounding, percentage change may differ from chart
8
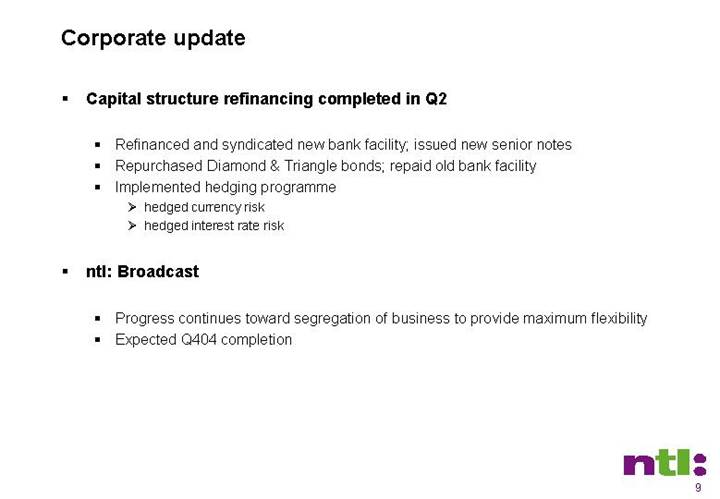
Corporate update
• Capital structure refinancing completed in Q2
• Refinanced and syndicated new bank facility; issued new senior notes
• Repurchased Diamond & Triangle bonds; repaid old bank facility
• Implemented hedging programme
• hedged currency risk
• hedged interest rate risk
• ntl: Broadcast
• Progress continues toward segregation of business to provide maximum flexibility
• Expected Q404 completion
9
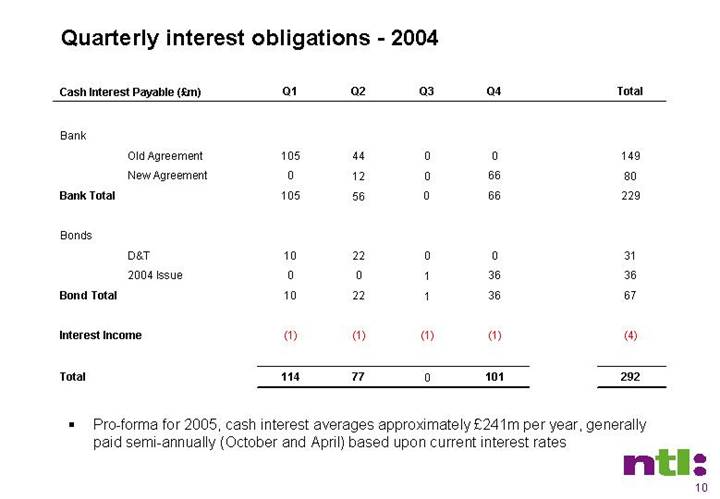
Quarterly interest obligations - - 2004
Cash Interest Payable (£m) |
| Q1 |
| Q2 |
| Q3 |
| Q4 |
| Total |
|
|
|
|
|
|
|
|
|
|
|
|
|
Bank |
|
|
|
|
|
|
|
|
|
|
|
Old Agreement |
| 105 |
| 44 |
| 0 |
| 0 |
| 149 |
|
New Agreement |
| 0 |
| 12 |
| 0 |
| 66 |
| 80 |
|
Bank Total |
| 105 |
| 56 |
| 0 |
| 66 |
| 229 |
|
|
|
|
|
|
|
|
|
|
|
|
|
Bonds |
|
|
|
|
|
|
|
|
|
|
|
D&T |
| 10 |
| 22 |
| 0 |
| 0 |
| 31 |
|
2004 Issue |
| 0 |
| 0 |
| 1 |
| 36 |
| 36 |
|
Bond Total |
| 10 |
| 22 |
| 1 |
| 36 |
| 67 |
|
|
|
|
|
|
|
|
|
|
|
|
|
Interest Income |
| (1 | ) | (1 | ) | (1 | ) | (1 | ) | (4 | ) |
|
|
|
|
|
|
|
|
|
|
|
|
Total |
| 114 |
| 77 |
| 0 |
| 101 |
| 292 |
|
• Pro-forma for 2005, cash interest averages approximately £241m per year, generally paid semi-annually (October and April) based upon current interest rates
10
Free Cash Flow
£m |
| Q2 2004 |
| Q1 2004 |
|
|
|
|
|
|
|
Combined Segment Profit |
| 202 |
| 195 |
|
Fixed Asset Additions |
| (69 | ) | (68 | ) |
Net Working Capital movements and Other (1) |
| (18 | ) | (26 | ) |
Net Cash Interest Paid |
| (77 | ) | (114 | ) |
Free Cash Flow (2) |
| 38 |
| (13 | ) |
|
|
|
|
|
|
Cash and cash equivalents ntl: Group |
| 102 |
| 199 |
|
• Q1 net cash interest paid reflects payments under previous bank facility
(1) Q2-04 Net Working Capital movements of (£8m) and Other of (£10m); Q1-04 Net Working Capital movements of (£25m) and Other of (£1m).
(2) See appendix for GAAP reconciliation
11
Second Quarter 2004 Results
• Progress on Stated Objectives
• Financial Report
• Operational Review
• Closing Remarks
• Questions & Answers
12
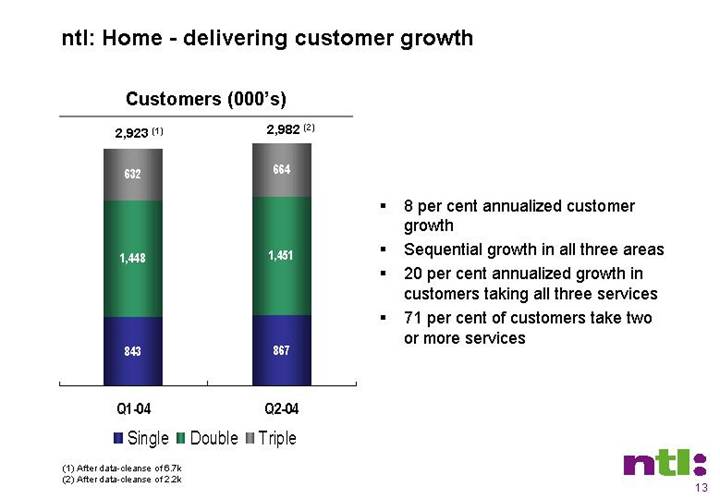
ntl: Home - delivering customer growth
Customers (000’s)
[CHART]
• 8 per cent annualized customer growth
• Sequential growth in all three areas
• 20 per cent annualized growth in customers taking all three services
• 71 per cent of customers take two or more services
(1) After data-cleanse of 6.7k
(2) After data-cleanse of 2.2k
13
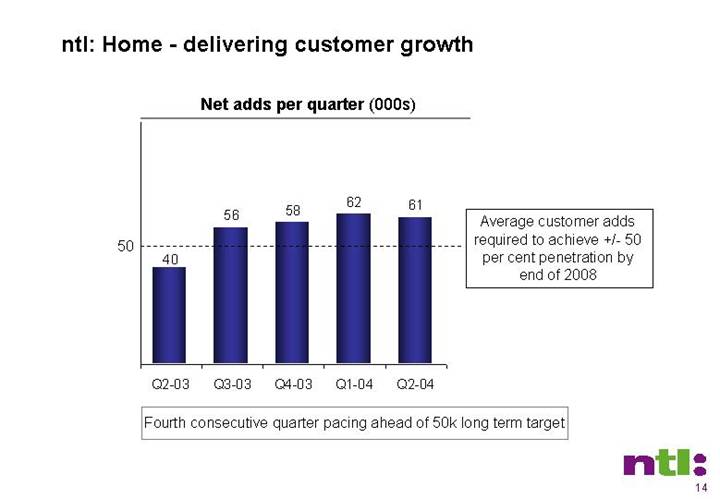
Net adds per quarter (000s)
[CHART]
Average customer adds required to achieve +/-50 per cent penetration by end of 2008
Fourth consecutive quarter pacing ahead of 50k long term target
14
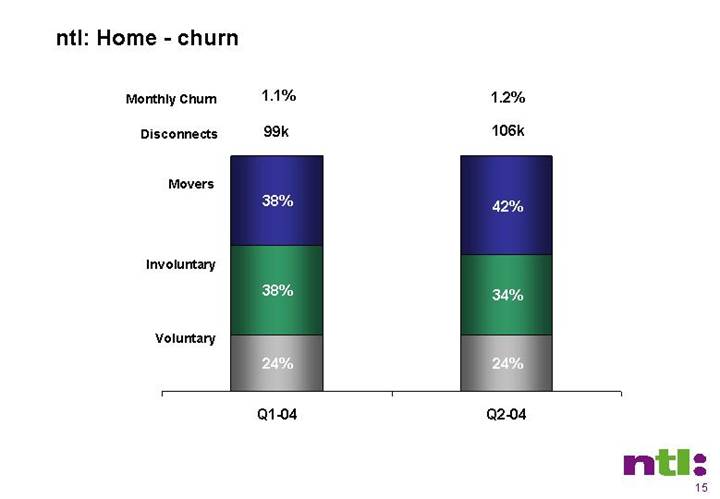
ntl: Home - churn
[CHART]
15
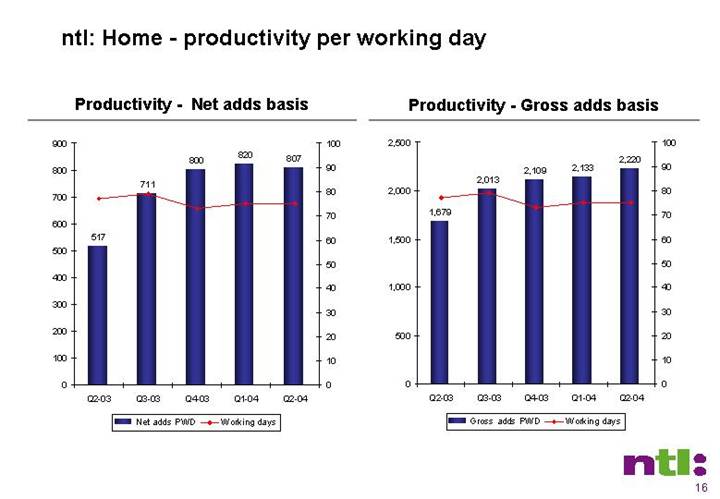
ntl: Home - productivity per working day
Productivity - Net adds basis
[CHART]
Productivity - Gross adds basis
[CHART]
16
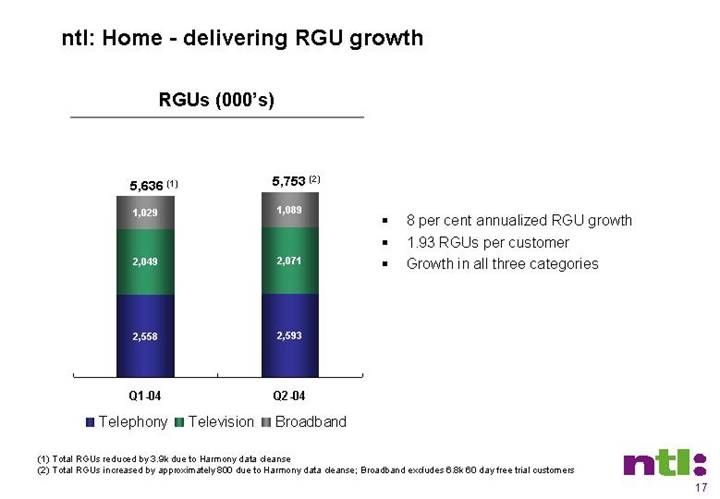
ntl: Home - delivering RGU growth
RGUs (000’s)
[CHART]
• 8 per cent annualized RGU growth
• 1.93 RGUs per customer
• Growth in all three categories
(1) Total RGUs reduced by 3.9k due to Harmony data cleanse
(2) Total RGUs increased by approximately 800 due to Harmony data cleanse; Broadband excludes 6.8k 60 day free trial customers
17
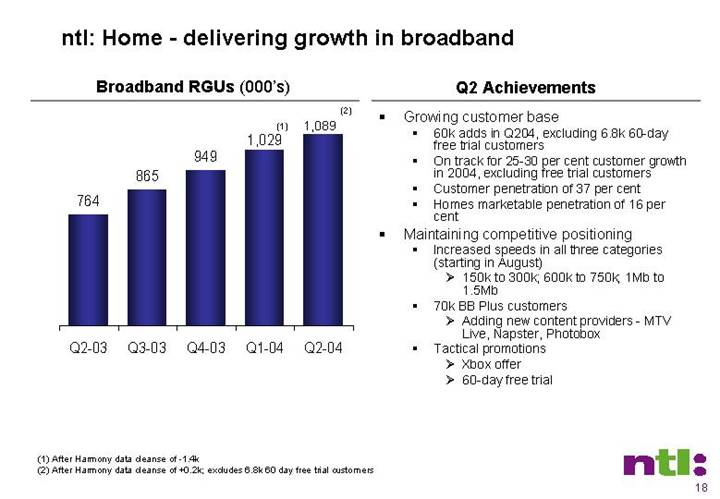
ntl: Home - delivering growth in broadband
Broadband RGUs (000’s)
[CHART]
Q2 Achievements
• Growing customer base
• 60k adds in Q204, excluding 6.8k 60-day free trial customers
• On track for 25-30 per cent customer growth in 2004, excluding free trial customers
• Customer penetration of 37 per cent
• Homes marketable penetration of 16 per cent
• Maintaining competitive positioning
• Increased speeds in all three categories (starting in August)
• 150k to 300k; 600k to 750k; 1Mb to 1.5Mb
• 70k BB Plus customers
• Adding new content providers -MTV Live, Napster, Photobox
• Tactical promotions
• Xbox offer
• 60-day free trial
(1) After Harmony data cleanse of -1.4k
(2) After Harmony data cleanse of +0.2k; excludes 6.8k 60 day free trial customers
18
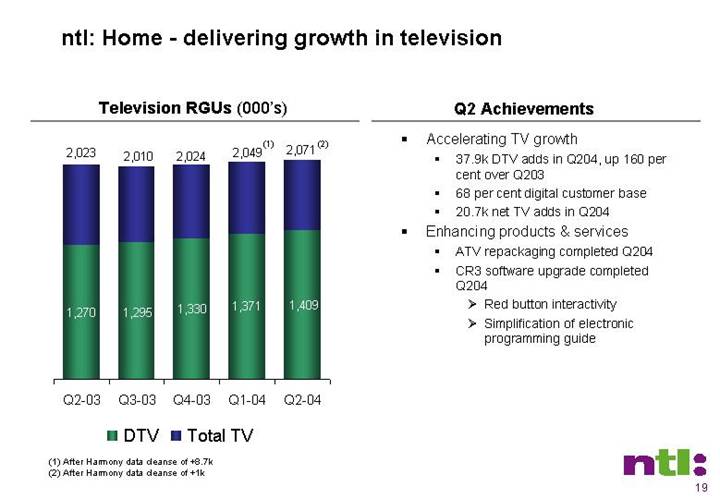
ntl: Home - delivering growth in television
Television RGUs (000’s)
[CHART]
Q2 Achievements
• Accelerating TV growth
• 37.9k DTV adds in Q204, up 160 per cent over Q203
• 68 per cent digital customer base
• 20.7k net TV adds in Q204
• Enhancing products & services
• ATV repackaging completed Q204
• CR3 software upgrade completed Q204
• Red button interactivity
• Simplification of electronic programming guide
(1) After Harmony data cleanse of +8.7k
(2) After Harmony data cleanse of +1k
19
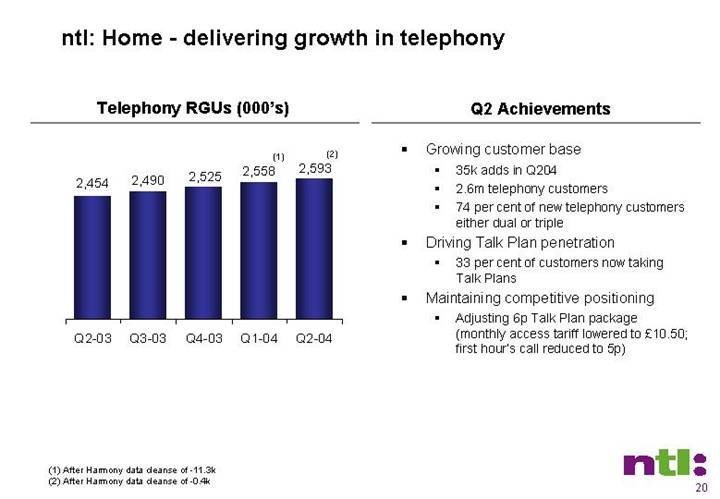
ntl: Home - delivering growth in telephony
Telephony RGUs (000’s)
[CHART]
Q2 Achievements
• Growing customer base
• 35k adds in Q204
• 2.6m telephony customers
• 74 per cent of new telephony customers either dual or triple
• Driving Talk Plan penetration
• 33 per cent of customers now taking Talk Plans
• Maintaining competitive positioning
• Adjusting 6p Talk Plan package (monthly access tariff lowered to £10.50; first hour’s call reduced to 5p)
(1) After Harmony data cleanse of -11.3k
(2) After Harmony data cleanse of -0.4k
20
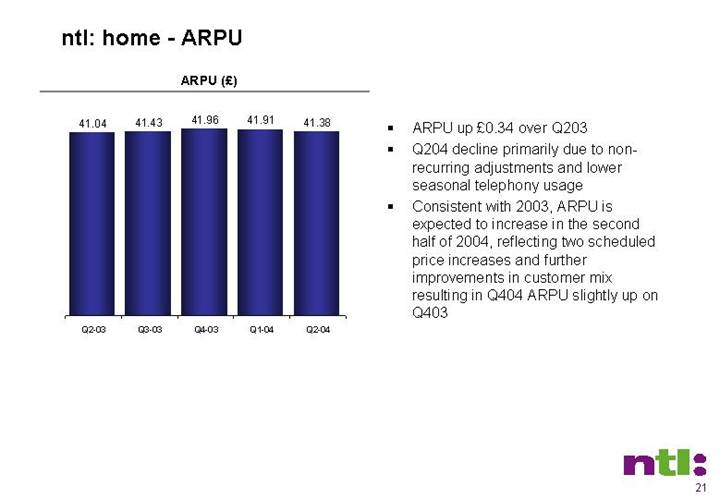
ntl: home -ARPU
ARPU (£)
[CHART]
• ARPU up £0.34 over Q203
• Q204 decline primarily due to non-recurring adjustments and lower seasonal telephony usage
• Consistent with 2003, ARPU is expected to increase in the second half of 2004, reflecting two scheduled price increases and further improvements in customer mix resulting in Q404 ARPU slightly up on Q403
21
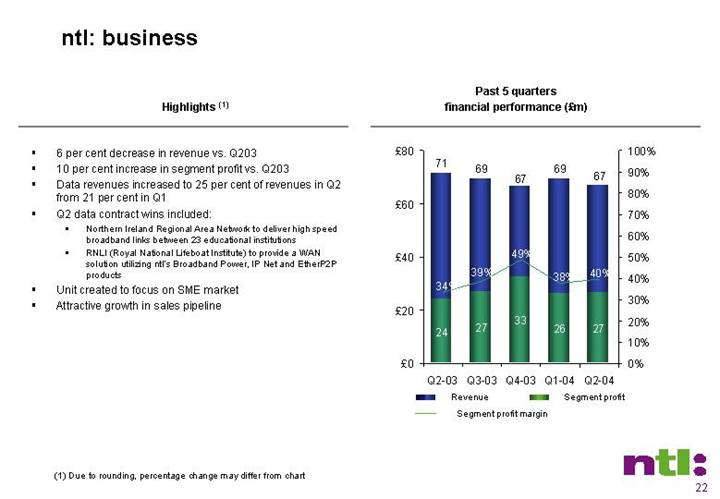
ntl: business
Highlights (1)
• 6 per cent decrease in revenue vs. Q203
• 10 per cent increase in segment profit vs. Q203
• Data revenues increased to 25 per cent of revenues in Q2 from 21 per cent in Q1
• Q2 data contract wins included:
• Northern Ireland Regional Area Network to deliver high speed broadband links between 23 educational institutions
• RNLI (Royal National Lifeboat Institute) to provide a WAN solution utilizing ntl’s Broadband Power, IP Net and EtherP2P products
• Unit created to focus on SME market
• Attractive growth in sales pipeline
Past 5 quarters
financial performance (£m)
[CHART]
(1) Due to rounding, percentage change may differ from chart
22
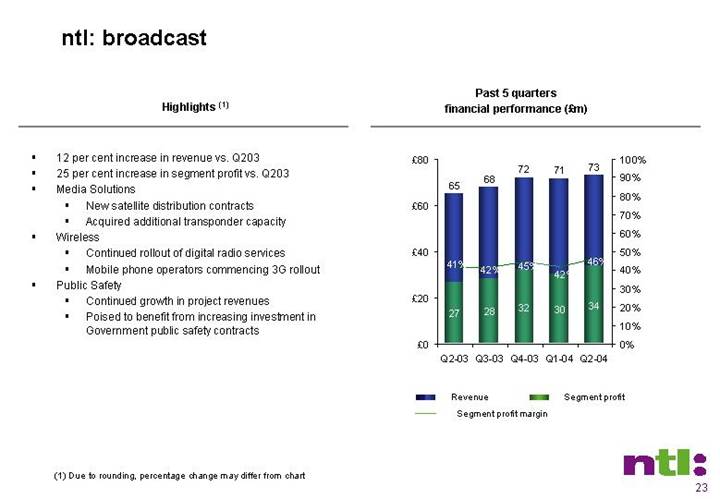
ntl: broadcast
Highlights (1)
• 12 per cent increase in revenue vs. Q203
• 25 per cent increase in segment profit vs. Q203
• Media Solutions
• New satellite distribution contracts
• Acquired additional transponder capacity
• Wireless
• Continued rollout of digital radio services
• Mobile phone operators commencing 3G rollout
• Public Safety
• Continued growth in project revenues
• Poised to benefit from increasing investment in Government public safety contracts
Past 5 quarters
financial performance (£m)
[CHART]
(1) Due to rounding, percentage change may differ from chart
23
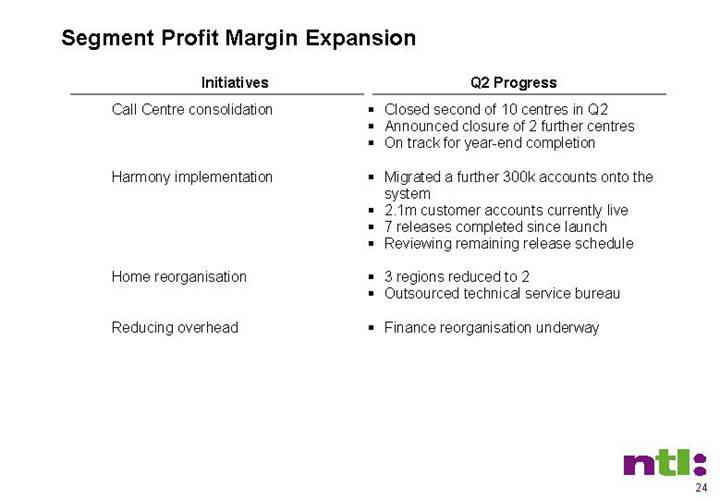
Segment Profit Margin Expansion
Initiatives |
| Q2 Progress |
Call Centre consolidation |
| • Closed second of 10 centres in Q2 |
|
| • Announced closure of 2 further centres |
|
| • On track for year-end completion |
|
|
|
Harmony implementation |
| • Migrated a further 300k accounts onto the system |
|
| • 2.1m customer accounts currently live |
|
| • 7 releases completed since launch |
|
| • Reviewing remaining release schedule |
|
|
|
Home reorganisation |
| • 3 regions reduced to 2 |
|
| • Outsourced technical service bureau |
|
|
|
Reducing overhead |
| • Finance reorganisation underway |
24
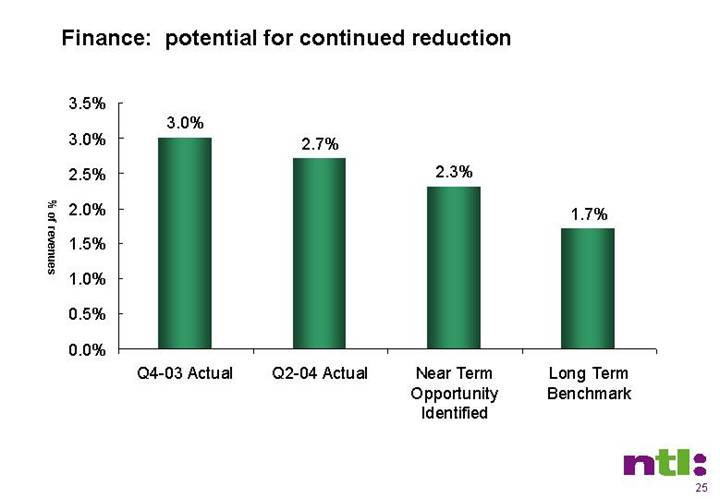
Finance: potential for continued reduction
[CHART]
25
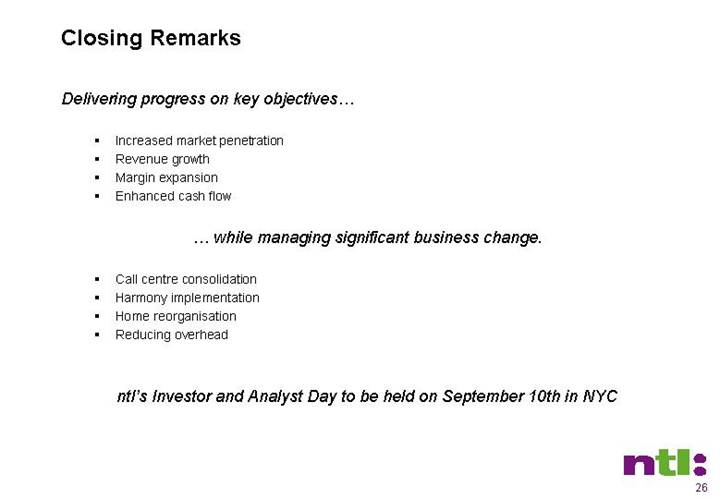
Closing Remarks
Delivering progress on key objectives…
• Increased market penetration
• Revenue growth
• Margin expansion
• Enhanced cash flow
… while managing significant business change.
• Call centre consolidation
• Harmony implementation
• Home reorganisation
• Reducing overhead
ntl’s Investor and Analyst Day to be held on September 10th in NYC
26
[LOGO]
27
Appendix
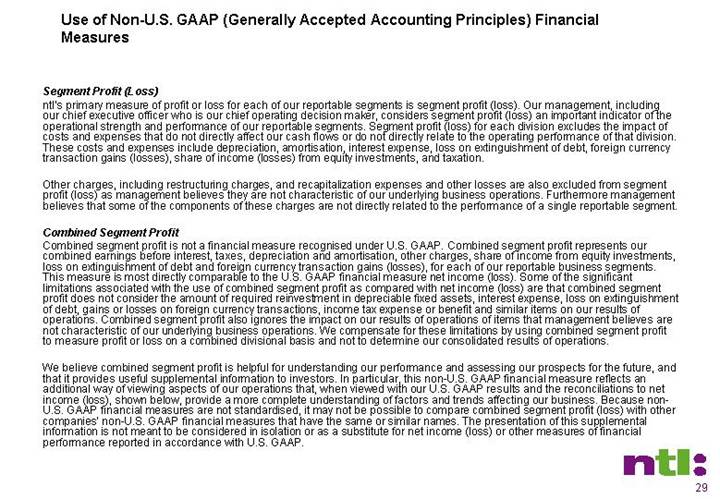
Use of Non-U.S. GAAP (Generally Accepted Accounting Principles) Financial Measures
Segment Profit (Loss)
ntl’s primary measure of profit or loss for each of our reportable segments is segment profit (loss). Our management, including our chief executive officer who is our chief operating decision maker, considers segment profit (loss) an important indicator of the operational strength and performance of our reportable segments. Segment profit (loss) for each division excludes the impact of costs and expenses that do not directly affect our cash flows or do not directly relate to the operating performance of that division. These costs and expenses include depreciation, amortisation, interest expense, loss on extinguishment of debt, foreign currency transaction gains (losses), share of income (losses) from equity investments, and taxation.
Other charges, including restructuring charges, and recapitalization expenses and other losses are also excluded from segment profit (loss) as management believes they are not characteristic of our underlying business operations. Furthermore management believes that some of the components of these charges are not directly related to the performance of a single reportable segment.
Combined Segment Profit
Combined segment profit is not a financial measure recognised under U.S. GAAP. Combined segment profit represents our combined earnings before interest, taxes, depreciation and amortisation, other charges, share of income from equity investments, loss on extinguishment of debt and foreign currency transaction gains (losses), for each of our reportable business segments. This measure is most directly comparable to the U.S. GAAP financial measure net income (loss). Some of the significant limitations associated with the use of combined segment profit as compared with net income (loss) are that combined segment profit does not consider the amount of required reinvestment in depreciable fixed assets, interest expense, loss on extinguishment of debt, gains or losses on foreign currency transactions, income tax expense or benefit and similar items on our results of operations. Combined segment profit also ignores the impact on our results of operations of items that management believes are not characteristic of our underlying business operations. We compensate for these limitations by using combined segment profit to measure profit or loss on a combined divisional basis and not to determine our consolidated results of operations.
We believe combined segment profit is helpful for understanding our performance and assessing our prospects for the future, and that it provides useful supplemental information to investors. In particular, this non-U.S. GAAP financial measure reflects an additional way of viewing aspects of our operations that, when viewed with our U.S. GAAP results and the reconciliations to net income (loss), shown below, provide a more complete understanding of factors and trends affecting our business. Because non-U.S. GAAP financial measures are not standardised, it may not be possible to compare combined segment profit (loss) with other companies’ non-U.S. GAAP financial measures that have the same or similar names. The presentation of this supplemental information is not meant to be considered in isolation or as a substitute for net income (loss) or other measures of financial performance reported in accordance with U.S. GAAP.
29
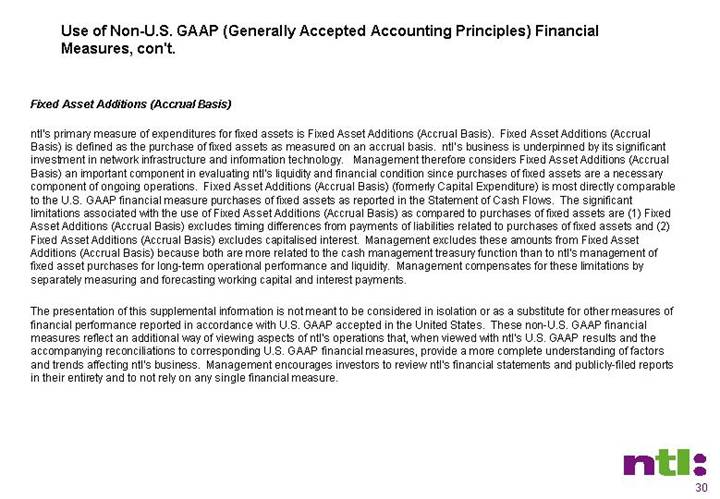
Fixed Asset Additions (Accrual Basis)
ntl’s primary measure of expenditures for fixed assets is Fixed Asset Additions (Accrual Basis). Fixed Asset Additions (Accrual Basis) is defined as the purchase of fixed assets as measured on an accrual basis. ntl’s business is underpinned by its significant investment in network infrastructure and information technology. Management therefore considers Fixed Asset Additions (Accrual Basis) an important component in evaluating ntl’s liquidity and financial condition since purchases of fixed assets are a necessary component of ongoing operations. Fixed Asset Additions (Accrual Basis) (formerly Capital Expenditure) is most directly comparable to the U.S. GAAP financial measure purchases of fixed assets as reported in the Statement of Cash Flows. The significant limitations associated with the use of Fixed Asset Additions (Accrual Basis) as compared to purchases of fixed assets are (1) Fixed Asset Additions (Accrual Basis) excludes timing differences from payments of liabilities related to purchases of fixed assets and (2) Fixed Asset Additions (Accrual Basis) excludes capitalised interest. Management excludes these amounts from Fixed Asset Additions (Accrual Basis) because both are more related to the cash management treasury function than to ntl’s management of fixed asset purchases for long-term operational performance and liquidity. Management compensates for these limitations by separately measuring and forecasting working capital and interest payments.
The presentation of this supplemental information is not meant to be considered in isolation or as a substitute for other measures of financial performance reported in accordance with U.S. GAAP accepted in the United States. These non-U.S. GAAP financial measures reflect an additional way of viewing aspects of ntl’s operations that, when viewed with ntl’s U.S. GAAP results and the accompanying reconciliations to corresponding U.S. GAAP financial measures, provide a more complete understanding of factors and trends affecting ntl’s business. Management encourages investors to review ntl’s financial statements and publicly-filed reports in their entirety and to not rely on any single financial measure.
30
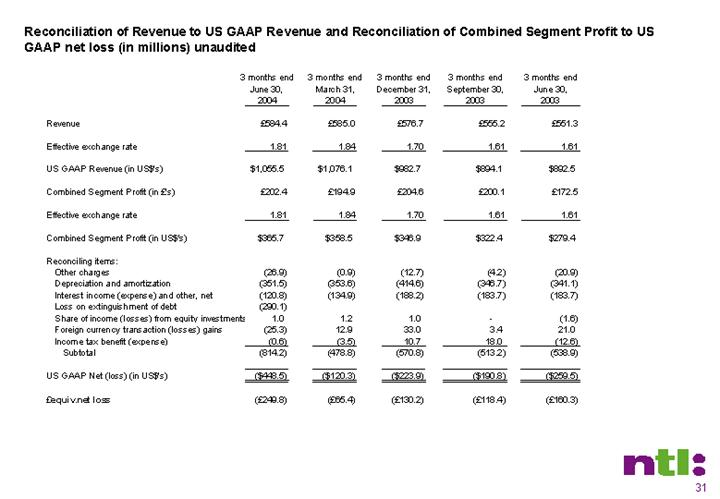
Reconciliation of Revenue to US GAAP Revenue and Reconciliation of Combined Segment Profit to US GAAP net loss (in millions) unaudited
|
| 3 months end |
| 3 months end |
| 3 months end |
| 3 months end |
| 3 months end |
| |||||
|
|
|
|
|
|
|
|
|
|
|
| |||||
Revenue |
| £ | 584.4 |
| £ | 585.0 |
| £ | 576.7 |
| £ | 555.2 |
| £ | 551.3 |
|
|
|
|
|
|
|
|
|
|
|
|
| |||||
Effective exchange rate |
| 1.81 |
| 1.84 |
| 1.70 |
| 1.61 |
| 1.61 |
| |||||
|
|
|
|
|
|
|
|
|
|
|
| |||||
US GAAP Revenue (in US$’s) |
| $ | 1,055.5 |
| $ | 1,076.1 |
| $ | 982.7 |
| $ | 894.1 |
| $ | 892.5 |
|
|
|
|
|
|
|
|
|
|
|
|
| |||||
Combined Segment Profit (in £’s) |
| £ | 202.4 |
| £ | 194.9 |
| £ | 204.6 |
| £ | 200.1 |
| £ | 172.5 |
|
|
|
|
|
|
|
|
|
|
|
|
| |||||
Effective exchange rate |
| 1.81 |
| 1.84 |
| 1.70 |
| 1.61 |
| 1.61 |
| |||||
|
|
|
|
|
|
|
|
|
|
|
| |||||
Combined Segment Profit (in US$’s) |
| $ | 365.7 |
| $ | 358.5 |
| $ | 346.9 |
| $ | 322.4 |
| $ | 279.4 |
|
|
|
|
|
|
|
|
|
|
|
|
| |||||
Reconciling items: |
|
|
|
|
|
|
|
|
|
|
| |||||
Other charges |
| (26.9 | ) | (0.9 | ) | (12.7 | ) | (4.2 | ) | (20.9 | ) | |||||
Depreciation and amortization |
| (351.5 | ) | (353.6 | ) | (414.6 | ) | (346.7 | ) | (341.1 | ) | |||||
Interest income (expense) and other, net |
| (120.8 | ) | (134.9 | ) | (188.2 | ) | (183.7 | ) | (183.7 | ) | |||||
Loss on extinguishment of debt |
| (290.1 | ) |
|
|
|
|
|
|
|
| |||||
Share of income (losses) from equity investments |
| 1.0 |
| 1.2 |
| 1.0 |
| — |
| (1.6 | ) | |||||
Foreign currency transaction (losses) gains |
| (25.3 | ) | 12.9 |
| 33.0 |
| 3.4 |
| 21.0 |
| |||||
Income tax benefit (expense) |
| (0.6 | ) | (3.5 | ) | 10.7 |
| 18.0 |
| (12.6 | ) | |||||
Subtotal |
| (814.2 | ) | (478.8 | ) | (570.8 | ) | (513.2 | ) | (538.9 | ) | |||||
|
|
|
|
|
|
|
|
|
|
|
| |||||
US GAAP Net (loss) (in US$’s) |
| $ | (448.5 | ) | $ | (120.3 | ) | $ | (223.9 | ) | $ | (190.8 | ) | $ | (259.5 | ) |
|
|
|
|
|
|
|
|
|
|
|
| |||||
£equiv.net loss |
| £ | (249.8 | ) | £ | (65.4 | ) | £ | (130.2 | ) | £ | (118.4 | ) | £ | (160.3 | ) |
31
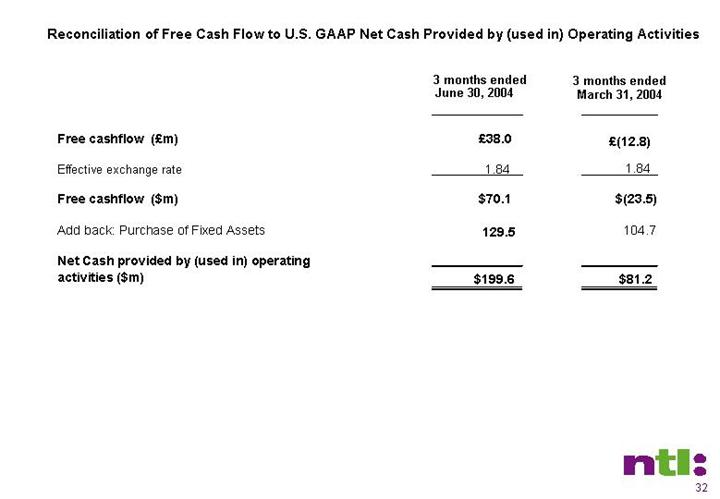
Reconciliation of Free Cash Flow to U.S. GAAP Net Cash Provided by (used in) Operating Activities
|
| 3 months ended |
| 3 months ended |
| ||
|
|
|
|
|
| ||
Free cashflow (£m) |
| £ | 38.0 |
| £ | (12.8 | ) |
|
|
|
|
|
| ||
Effective exchange rate |
| 1.84 |
| 1.84 |
| ||
|
|
|
|
|
| ||
Free cashflow ($m) |
| $ | 70.1 |
| $ | (23.5 | ) |
|
|
|
|
|
| ||
Add back: Purchase of Fixed Assets |
| 129.5 |
| 104.7 |
| ||
|
|
|
|
|
| ||
Net Cash provided by (used in) operating activities ($m) |
| $ | 199.6 |
| $ | 81.2 |
|
32
Reconciliation of Fixed Asset Additions (accrual basis) to US GAAP Purchase of Fixed Assets (in millions)
|
| 3 months end |
| 3 months end |
| 3 months end |
| 3 months end |
| 3 months end |
| |||||
|
|
|
|
|
|
|
|
|
|
|
| |||||
Fixed Asset Additions (accrual basis) (in £’s) |
| £ | 69.3 |
| £ | 68.5 |
| £ | 63.6 |
| £ | 58.9 |
| £ | 72.2 |
|
|
|
|
|
|
|
|
|
|
|
|
| |||||
Effective exchange rate |
| 1.81 |
| 1.84 |
| 1.71 |
| 1.61 |
| 1.61 |
| |||||
|
|
|
|
|
|
|
|
|
|
|
| |||||
Fixed Asset Additions (accrual basis) (in US$’s) |
| $ | 125.4 |
| $ | 125.9 |
| $ | 109.0 |
| $ | 95.00 |
| $ | 117.0 |
|
|
|
|
|
|
|
|
|
|
|
|
| |||||
Other Items: |
|
|
|
|
|
|
|
|
|
|
| |||||
Changes in liabilities related to Fixed Asset Additions (accrual b |
| 4.4 |
| -21.2 |
| 7.7 |
| 62.8 |
| -4.4 |
| |||||
Capitalized interest |
| 1.9 |
|
|
|
|
|
|
|
|
| |||||
Subtotal |
| 4.4 |
| -21.2 |
| 7.7 |
| 62.8 |
| -2.5 |
| |||||
|
|
|
|
|
|
|
|
|
|
|
| |||||
Purchase of Fixed Assets (in US $’s) |
| $ | 129.5 |
| $ | 104.7 |
| $ | 116.7 |
| $ | 157.8 |
| $ | 114.5 |
|
33