Link to searchable text of slide shown above
Link to searchable text of slide shown above

Link to searchable text of slide shown above

Link to searchable text of slide shown above
Link to searchable text of slide shown above
Link to searchable text of slide shown above
Link to searchable text of slide shown above
Link to searchable text of slide shown above
Link to searchable text of slide shown above
Link to searchable text of slide shown above
Link to searchable text of slide shown above
Link to searchable text of slide shown above
Link to searchable text of slide shown above
Link to searchable text of slide shown above
Link to searchable text of slide shown above
Link to searchable text of slide shown above
Link to searchable text of slide shown above
Link to searchable text of slide shown above
Link to searchable text of slide shown above
Link to searchable text of slide shown above
Link to searchable text of slide shown above
Link to searchable text of slide shown above
Link to searchable text of slide shown above
Link to searchable text of slide shown above
Link to searchable text of slide shown above
Link to searchable text of slide shown above
Link to searchable text of slide shown above
Link to searchable text of slide shown above
Link to searchable text of slide shown above
Link to searchable text of slide shown above

Link to searchable text of slide shown above
Link to searchable text of slide shown above
Link to searchable text of slide shown above
Link to searchable text of slide shown above
Link to searchable text of slide shown above
Link to searchable text of slide shown above

Link to searchable text of slide shown above
Link to searchable text of slide shown above
Link to searchable text of slide shown above
Searchable text section of graphics shown above
NTL Incorporated
Fourth Quarter and Full Year 2004 Results
Simon Duffy, CEO
Jacques Kerrest, CFO
March 15, 2005
[LOGO]
Safe Harbor
Various statements contained in this document constitute “forward-looking statements” as that term is defined under the Private Securities Litigation Reform Act of1995. Words like “believe,” “anticipate,” “should,” “intend,” “plan,” “will,” “expects,” “estimates,” “projects,” “positioned,” “strategy,” and similar expressions identify these forward-looking statements, which involve known and unknown risks, uncertainties and other factors that may cause our actual results, performance or achievements or industry results to be materially different from those contemplated, projected, forecasted, estimated or budgeted whether expressed or implied, by these forward-looking statements. These factors include: potential adverse developments with respect to our liquidity or results of operations; our significant debt payments and other contractual commitments; our ability to fund and execute our business plan; our ability to generate cash sufficient to service our debt; the impact of new business opportunities requiring significant up-front investments; our ability to attract and retain customers and increase our overall market penetration; our ability to compete against other communications and content distribution businesses; our ability to complete the integration of our billing systems; our ability to develop and maintain back-up for our critical systems; our ability to respond adequately to technological developments; our ability to maintain contracts that are critical to our operations; our ability to continue to design networks, install facilities, obtain and maintain any required governmental licenses or approvals and finance construction and development, in a timely manner at reasonable costs and on satisfactory terms and conditions; our ability to have an impact upon, or to respond effectively to, new or modified laws or regulations; and interest rate and currency exchange rate fluctuations. We assume no obligation to update these forward-looking statements contained herein to reflect actual results, changes in assumptions or changes in factors affecting these statements.
2
Fourth Quarter 2004 Results Agenda
• Reporting Changes and Highlights
• Financial Report
• Operational Review
• Closing Remarks
• Questions & Answers
3
Reporting changes
• Today’s results presented on basis of continuing operations to reflect sale of Broadcast division
• Sale of Broadcast enables us to concentrate on growing and improving our communications and content distribution business
• Consequently, from now on we will report:
• Revenues for Consumer, Business and Ireland
• Operating income before depreciation, amortization and other charges for the group as a whole
4
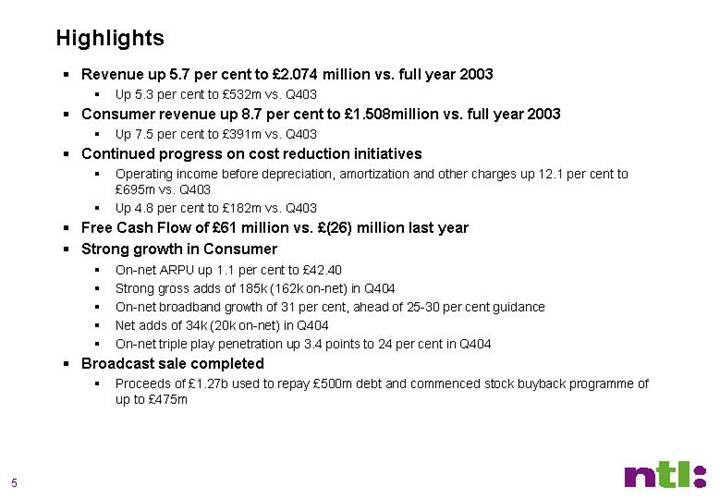
Highlights
• Revenue up 5.7 per cent to £2.074 million vs. full year 2003
• Up 5.3 per cent to £532m vs. Q403
• Consumer revenue up 8.7 per cent to £1.508million vs. full year 2003
• Up 7.5 per cent to £391m vs. Q403
• Continued progress on cost reduction initiatives
• Operating income before depreciation, amortization and other charges up 12.1 per cent to £695m vs. Q403
• Up 4.8 per cent to £182m vs. Q403
• Free Cash Flow of £61 million vs. £(26) million last year
• Strong growth in Consumer
• On-net ARPU up 1.1 per cent to £42.40
• Strong gross adds of 185k (162k on-net) in Q404
• On-net broadband growth of 31 per cent, ahead of 25-30 per cent guidance
• Net adds of 34k (20k on-net) in Q404
• On-net triple play penetration up 3.4 points to 24 per cent in Q404
• Broadcast sale completed
• Proceeds of £1.27b used to repay £500m debt and commenced stock buyback programme of up to £475m
5
Fourth Quarter 2004 Results
• Reporting Changes and Highlights
• Financial Report
• Operational Review
• Closing Remarks
• Questions & Answers
6
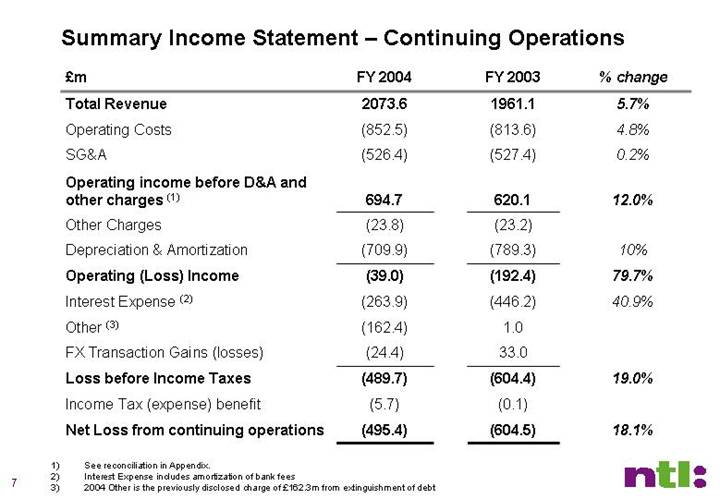
Summary Income Statement – Continuing Operations
£m |
| FY 2004 |
| FY 2003 |
| % change |
|
Total Revenue |
| 2073.6 |
| 1961.1 |
| 5.7 | % |
Operating Costs |
| (852.5 | ) | (813.6 | ) | 4.8 | % |
SG&A |
| (526.4 | ) | (527.4 | ) | 0.2 | % |
Operating income before D&A and other charges (1) |
| 694.7 |
| 620.1 |
| 12.0 | % |
Other Charges |
| (23.8 | ) | (23.2 | ) |
|
|
Depreciation & Amortization |
| (709.9 | ) | (789.3 | ) | 10 | % |
Operating (Loss) Income |
| (39.0 | ) | (192.4 | ) | 79.7 | % |
Interest Expense (2) |
| (263.9 | ) | (446.2 | ) | 40.9 | % |
Other (3) |
| (162.4 | ) | 1.0 |
|
|
|
FX Transaction Gains (losses) |
| (24.4 | ) | 33.0 |
|
|
|
Loss before Income Taxes |
| (489.7 | ) | (604.4 | ) | 19.0 | % |
Income Tax (expense) benefit |
| (5.7 | ) | (0.1 | ) |
|
|
Net Loss from continuing operations |
| (495.4 | ) | (604.5 | ) | 18.1 | % |
(1) See reconciliation in Appendix.
(2) Interest Expense includes amortization of bank fees
(3) 2004 Other is the previously disclosed charge of £162.3m from extinguishment of debt
7
2004 margin improvement
(Operating income before depreciation, amortization and other charges)
• Reported margin on 2004 operating income before depreciation, amortization and other charges was up nearly two points to 33.5 per cent (Q404 34.1 per cent)
• 2003 included approximately £33m of non-recurring benefit to margin
• In 2004 we made up for these non-recurring items and delivered £72 million of additional margin over 2003
• Primary drivers for improvement include:
• Consumer growth in Broadband, TV and Talkplans
• Lower associate costs
• Lower facilities costs
• Lower IBM and IT maintenance costs
• More favorable terms for content
(1) See appendix for summary of previously disclosed non-recurring benefits in Q3 and Q4 2003
8
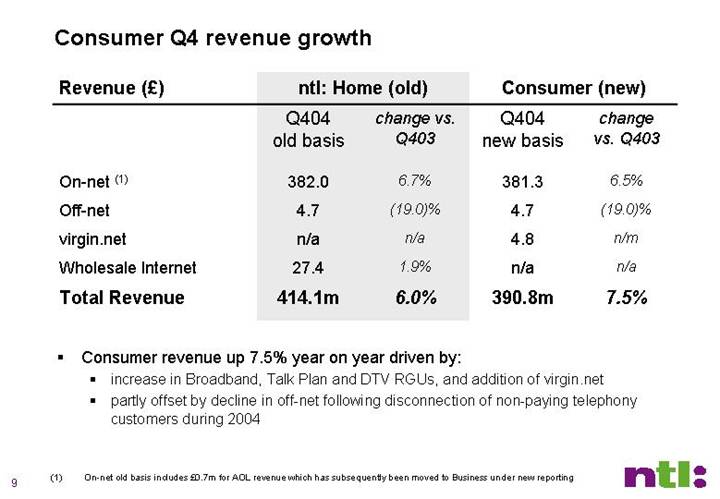
Consumer Q4 revenue growth
|
| ntl: Home (old) |
| Consumer (new) |
| ||||
|
| Q404 |
| change vs. |
| Q404 |
| change |
|
Revenue (£) |
| old basis |
| Q403 |
| new basis |
| vs. Q403 |
|
|
|
|
|
|
|
|
|
|
|
On-net (1) |
| 382.0 |
| 6.7 | % | 381.3 |
| 6.5 | % |
Off-net |
| 4.7 |
| (19.0 | )% | 4.7 |
| (19.0 | )% |
virgin.net |
| n/a |
| n/a |
| 4.8 |
| n/m |
|
Wholesale Internet |
| 27.4 |
| 1.9 | % | n/a |
| n/a |
|
Total Revenue |
| 414.1m |
| 6.0 | % | 390.8m |
| 7.5 | % |
• Consumer revenue up 7.5% year on year driven by:
• increase in Broadband, Talk Plan and DTV RGUs, and addition of virgin.net
• partly offset by decline in off-net following disconnection of non-paying telephony customers during 2004
(1) On-net old basis includes £0.7m for AOL revenue which has subsequently been moved to Business under new reporting
9
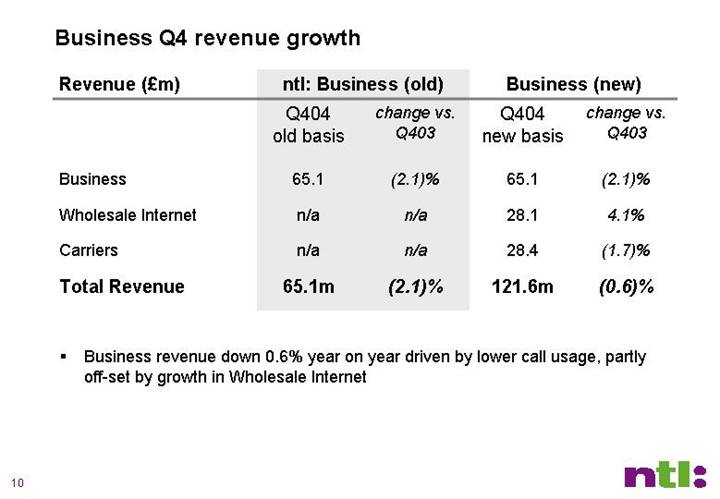
Business Q4 revenue growth
|
| ntl: Business (old) |
| Business (new) |
| ||||
|
| Q404 |
| change vs. |
| Q404 |
| change vs. |
|
Revenue (£m) |
| old basis |
| Q403 |
| new basis |
| Q403 |
|
|
|
|
|
|
|
|
|
|
|
Business |
| 65.1 |
| (2.1 | )% | 65.1 |
| (2.1 | )% |
Wholesale Internet |
| n/a |
| n/a |
| 28.1 |
| 4.1 | % |
Carriers |
| n/a |
| n/a |
| 28.4 |
| (1.7 | )% |
Total Revenue |
| 65.1 | m | (2.1 | )% | 121.6 | m | (0.6 | )% |
• Business revenue down 0.6% year on year driven by lower call usage, partly off-set by growth in Wholesale Internet
10
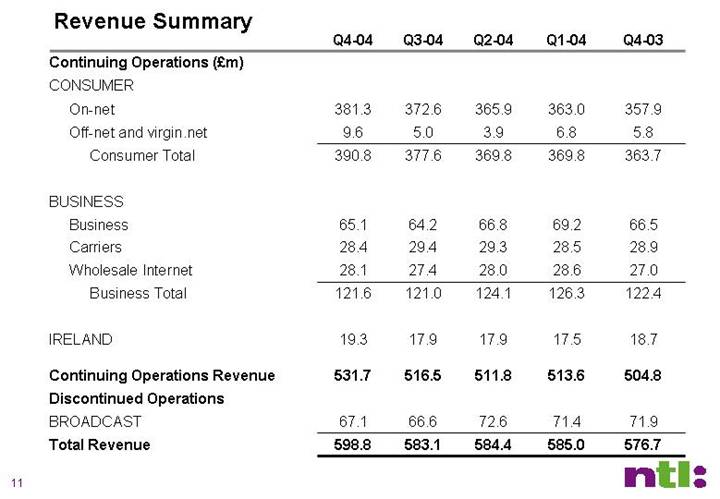
Revenue Summary
|
| Q4-04 |
| Q3-04 |
| Q2-04 |
| Q1-04 |
| Q4-03 |
|
Continuing Operations (£m) |
|
|
|
|
|
|
|
|
|
|
|
CONSUMER |
|
|
|
|
|
|
|
|
|
|
|
On-net |
| 381.3 |
| 372.6 |
| 365.9 |
| 363.0 |
| 357.9 |
|
Off-net and virgin.net |
| 9.6 |
| 5.0 |
| 3.9 |
| 6.8 |
| 5.8 |
|
Consumer Total |
| 390.8 |
| 377.6 |
| 369.8 |
| 369.8 |
| 363.7 |
|
|
|
|
|
|
|
|
|
|
|
|
|
BUSINESS |
|
|
|
|
|
|
|
|
|
|
|
Business |
| 65.1 |
| 64.2 |
| 66.8 |
| 69.2 |
| 66.5 |
|
Carriers |
| 28.4 |
| 29.4 |
| 29.3 |
| 28.5 |
| 28.9 |
|
Wholesale Internet |
| 28.1 |
| 27.4 |
| 28.0 |
| 28.6 |
| 27.0 |
|
Business Total |
| 121.6 |
| 121.0 |
| 124.1 |
| 126.3 |
| 122.4 |
|
|
|
|
|
|
|
|
|
|
|
|
|
IRELAND |
| 19.3 |
| 17.9 |
| 17.9 |
| 17.5 |
| 18.7 |
|
|
|
|
|
|
|
|
|
|
|
|
|
Continuing Operations Revenue |
| 531.7 |
| 516.5 |
| 511.8 |
| 513.6 |
| 504.8 |
|
Discontinued Operations |
|
|
|
|
|
|
|
|
|
|
|
BROADCAST |
| 67.1 |
| 66.6 |
| 72.6 |
| 71.4 |
| 71.9 |
|
Total Revenue |
| 598.8 |
| 583.1 |
| 584.4 |
| 585.0 |
| 576.7 |
|
11
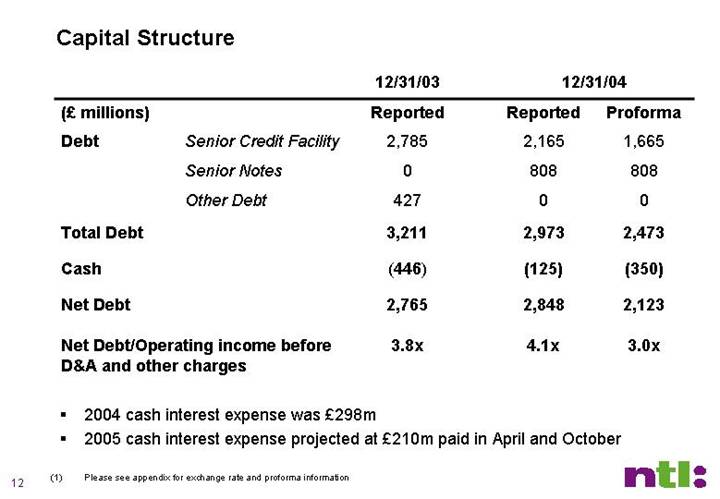
Capital Structure
|
| 12/31/03 |
| 12/31/04 |
| |||
(£millions) |
| Reported |
| Reported |
| Proforma |
| |
Debt | Senior Credit Facility |
| 2,785 |
| 2,165 |
| 1,665 |
|
| Senior Notes |
| 0 |
| 808 |
| 808 |
|
| Other Debt |
| 427 |
| 0 |
| 0 |
|
Total Debt |
| 3,211 |
| 2,973 |
| 2,473 |
| |
Cash |
| (446 | ) | (125 | ) | (350 | ) | |
Net Debt |
| 2,765 |
| 2,848 |
| 2,123 |
| |
|
|
|
|
|
|
|
| |
Net Debt/Operating income before D&A and other charges |
| 3.8 | x | 4.1 | x | 3.0 | x | |
• 2004 cash interest expense was £298m
• 2005 cash interest expense projected at £210m paid in April and October
(1) Please see appendix for exchange rate and proforma information
12
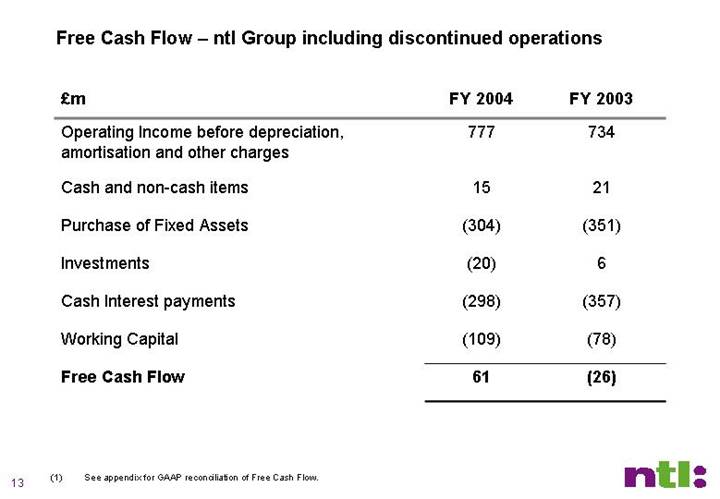
Free Cash Flow – ntl Group including discontinued operations
£m |
| FY 2004 |
| FY 2003 |
|
Operating Income before depreciation, amortisation and other charges |
| 777 |
| 734 |
|
|
|
|
|
|
|
Cash and non-cash items |
| 15 |
| 21 |
|
|
|
|
|
|
|
Purchase of Fixed Assets |
| (304 | ) | (351 | ) |
|
|
|
|
|
|
Investments |
| (20 | ) | 6 |
|
|
|
|
|
|
|
Cash Interest payments |
| (298 | ) | (357 | ) |
|
|
|
|
|
|
Working Capital |
| (109 | ) | (78 | ) |
|
|
|
|
|
|
Free Cash Flow |
| 61 |
| (26 | ) |
(1) See appendix for GAAP reconciliation of Free Cash Flow.
13
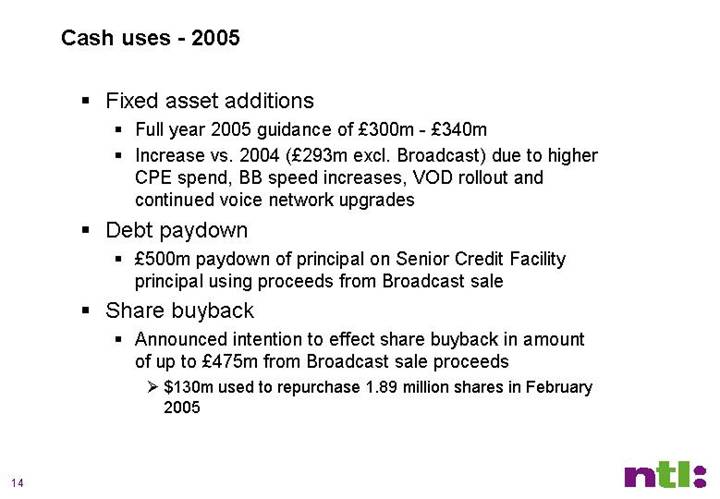
Cash uses - 2005
• Fixed asset additions
• Full year 2005 guidance of £300m - £340m
• Increase vs. 2004 (£293m excl. Broadcast) due to higher CPE spend, BB speed increases, VOD rollout and continued voice network upgrades
• Debt paydown
• £500m paydown of principal on Senior Credit Facility principal using proceeds from Broadcast sale
• Share buyback
• Announced intention to effect share buyback in amount of up to £475m from Broadcast sale proceeds
• $130m used to repurchase 1.89 million shares in February 2005
14
Fourth Quarter 2004 Results
• Reporting Changes and Highlights
• Financial Report
• Operational Review
• Closing Remarks
• Questions & Answers
15
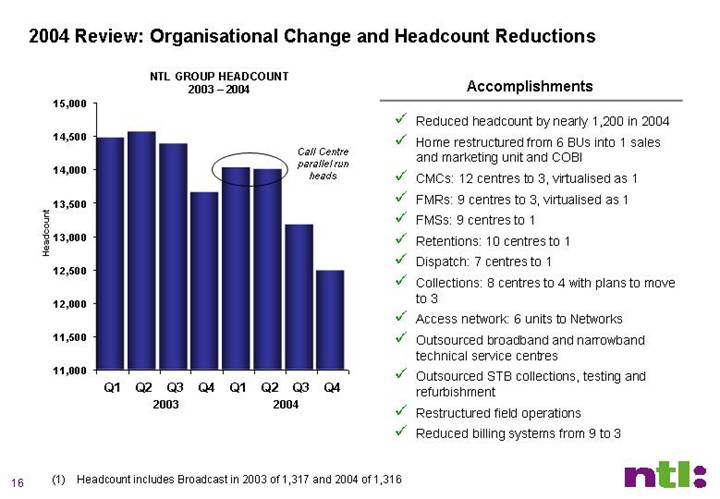
2004 Review: Organisational Change and Headcount Reductions
NTL GROUP HEADCOUNT
2003 – 2004
[CHART]
Accomplishments
• Reduced headcount by nearly 1,200 in 2004
• Home restructured from 6 BUs into 1 sales and marketing unit and COBI
• CMCs: 12 centres to 3, virtualised as 1
• FMRs: 9 centres to 3, virtualised as 1
• FMSs: 9 centres to 1
• Retentions: 10 centres to 1
• Dispatch: 7 centres to 1
• Collections: 8 centres to 4 with plans to move to 3
• Access network: 6 units to Networks
• Outsourced broadband and narrowband technical service centres
• Outsourced STB collections, testing and refurbishment
• Restructured field operations
• Reduced billing systems from 9 to 3
(1) Headcount includes Broadcast in 2003 of 1,317 and 2004 of 1,316
16
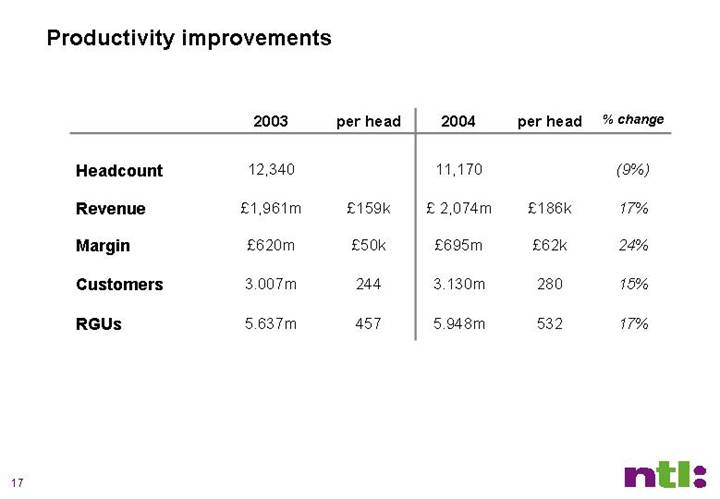
Productivity improvements
|
| 2003 |
| per head |
| 2004 |
| per head |
| % change |
| ||||
|
|
|
|
|
|
|
|
|
|
|
| ||||
Headcount |
| 12,340 |
|
|
| 11,170 |
|
|
| (9 | %) | ||||
|
|
|
|
|
|
|
|
|
|
|
| ||||
Revenue |
| £ | 1,961 | m | £ | 159 | k | £ | 2,074 | m | £ | 186 | k | 17 | % |
|
|
|
|
|
|
|
|
|
|
|
| ||||
Margin |
| £ | 620 | m | £ | 50 | k | £ | 695 | m | £ | 62 | k | 24 | % |
|
|
|
|
|
|
|
|
|
|
|
| ||||
Customers |
| 3.007 | m | 244 |
| 3.130 | m | 280 |
| 15 | % | ||||
|
|
|
|
|
|
|
|
|
|
|
| ||||
RGUs |
| 5.637 | m | 457 |
| 5.948 | m | 532 |
| 17 | % | ||||
17
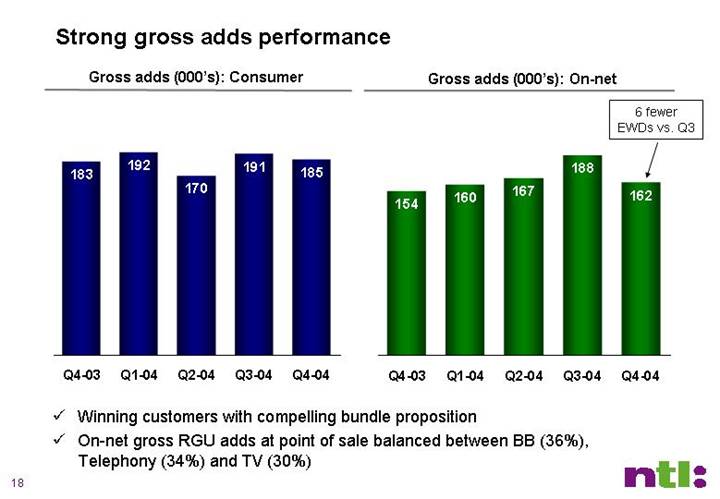
Strong gross adds performance
Gross adds (000’s): Consumer
[CHART]
Gross adds (000’s): On-net
[CHART]
• Winning customers with compelling bundle proposition
• On-net gross RGU adds at point of sale balanced between BB (36%), Telephony (34%) and TV (30%)
18
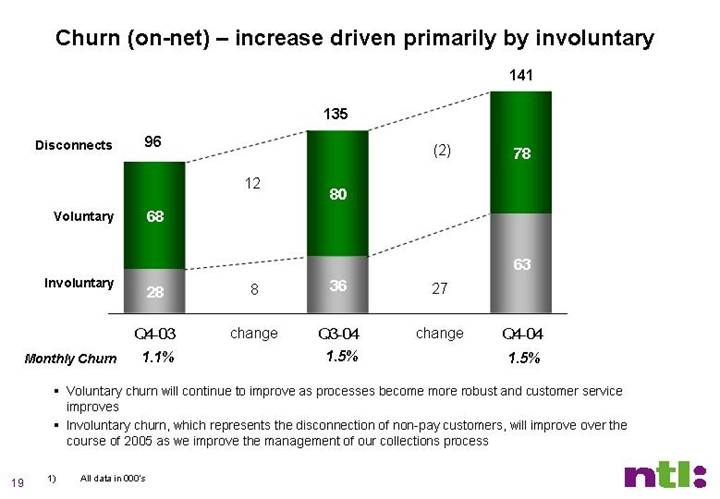
Churn (on-net) – increase driven primarily by involuntary
[CHART]
• Voluntary churn will continue to improve as processes become more robust and customer service improves
• Involuntary churn, which represents the disconnection of non-pay customers, will improve over the course of 2005 as we improve the management of our collections process
1) All data in 000’s
19
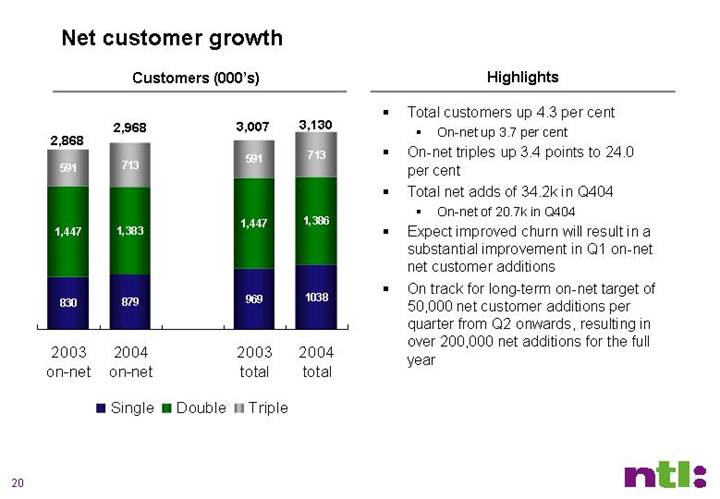
Net customer growth
Customers (000’s)
[CHART]
Highlights
• Total customers up 4.3 per cent
• On-net up 3.7 per cent
• On-net triples up 3.4 points to 24.0 per cent
• Total net adds of 34.2k in Q404
• On-net of 20.7k in Q404
• Expect improved churn will result in a substantial improvement in Q1 on-net net customer additions
• On track for long-term on-net target of 50,000 net customer additions per quarter from Q2 onwards, resulting in over 200,000 net additions for the full year
20
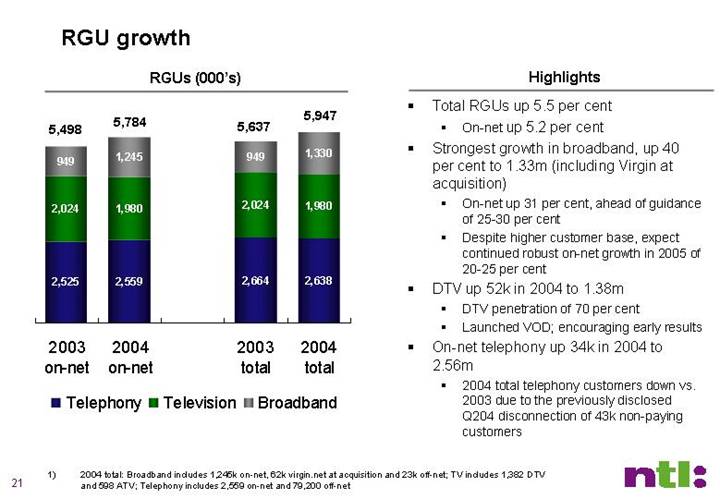
RGU growth
RGUs (000’s)
[CHART]
Highlights
• Total RGUs up 5.5 per cent
• On-net up 5.2 per cent
• Strongest growth in broadband, up 40 per cent to 1.33m (including Virgin at acquisition)
• On-net up 31 per cent, ahead of guidance of 25-30 per cent
• Despite higher customer base, expect continued robust on-net growth in 2005 of 20-25 per cent
• DTV up 52k in 2004 to 1.38m
• DTV penetration of 70 per cent
• Launched VOD; encouraging early results
• On-net telephony up 34k in 2004 to 2.56m
• 2004 total telephony customers down vs. 2003 due to the previously disclosed Q204 disconnection of 43k non-paying customers
1) 2004 total: Broadband includes 1,245k on-net, 62k virgin.net at acquisition and 23k off-net; TV includes 1,382 DTV and 598 ATV; Telephony includes 2,559 on-net and 79,200 off-net
21
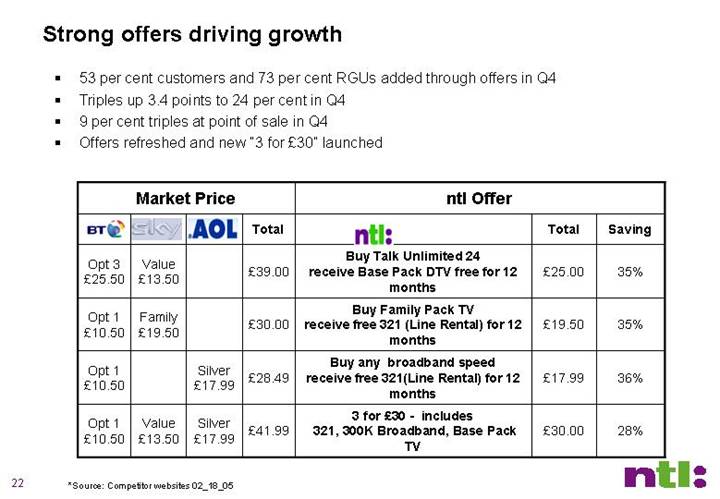
Strong offers driving growth
• 53 per cent customers and 73 per cent RGUs added through offers in Q4
• Triples up 3.4 points to 24 per cent in Q4
• 9 per cent triples at point of sale in Q4
• Offers refreshed and new “3 for £30” launched
Market Price |
| ntl Offer |
| ||||||||||||
[LOGO] |
| [LOGO] |
| [LOGO] |
| Total |
| [LOGO] |
| Total |
| Saving |
| ||
Opt 3 |
| Value |
|
|
| £ | 39.00 |
| Buy Talk Unlimited 24 |
| £ | 25.00 |
| 35 | % |
|
|
|
|
|
|
|
|
|
|
|
|
|
| ||
Opt 1 |
| Family |
|
|
| £ | 30.00 |
| Buy Family Pack TV |
| £ | 19.50 |
| 35 | % |
|
|
|
|
|
|
|
|
|
|
|
|
|
| ||
Opt 1 |
|
|
| Silver |
| £ | 28.49 |
| Buy any broadband speed |
| £ | 17.99 |
| 36 | % |
|
|
|
|
|
|
|
|
|
|
|
|
|
| ||
Opt 1 |
| Value |
| Silver |
| £ | 41.99 |
| 3 for £30 - includes |
| £ | 30.00 |
| 28 | % |
*Source: Competitor websites 02_18_05
22
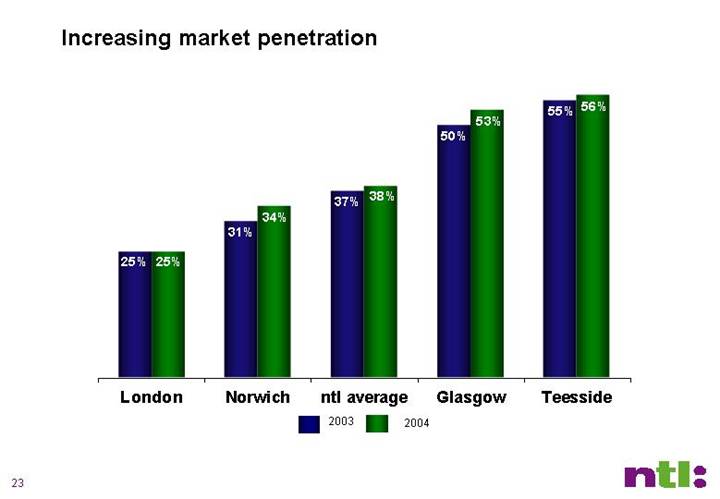
Increasing market penetration
[CHART]
23
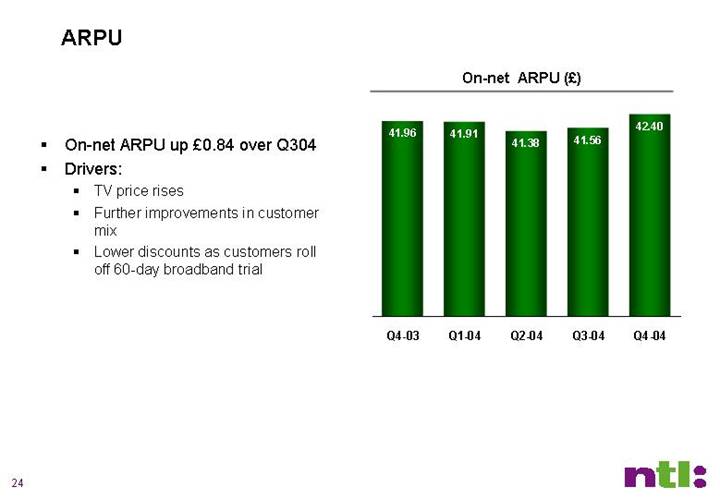
ARPU
• On-net ARPU up £0.84 over Q304
• Drivers:
• TV price rises
• Further improvements in customer mix
• Lower discounts as customers roll off 60-day broadband trial
On-net ARPU (£)
[CHART]
24
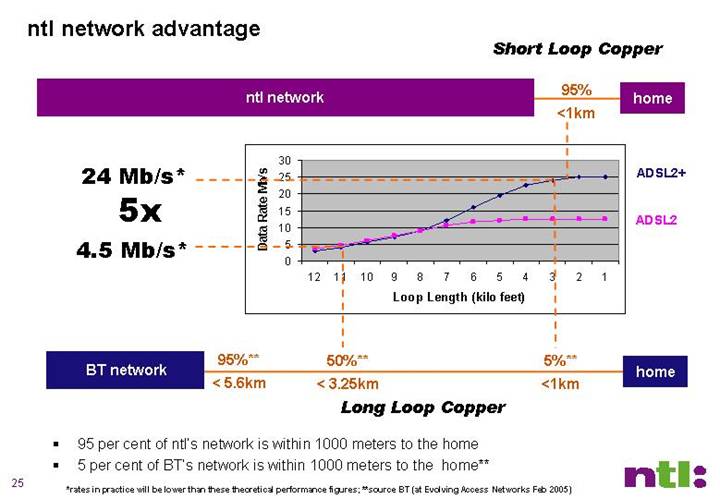
ntl network advantage
[CHART]
• 95 per cent of ntl’s network is within 1000 meters to the home
• 5 per cent of BT’s network is within 1000 meters to the home**
*rates in practice will be lower than these theoretical performance figures; **source BT (at Evolving Access Networks Feb 2005)
25
Successful ADSL2+ and HDTV trials launched
• In February 2005 ntl launched the UK’s first ADSL2+ trial. The trial has proven that we can deliver broadband connections with downstream line rates in excess of 18 Mb/s without any modification to our copper infrastructure.
• In March 2005 we also launched the first known UK trial using ADSL2+, which will enable us to deliver on-demand streaming of HDTV channels over an IP Broadband infrastructure.
26
Closing Remarks
• Delivered on 2004 objectives
• Grew customers and revenue
• Drove down costs and expense
• Expanded margins
• Delivered strong free cash flow
• Improved capital structure
• Sold Broadcast
• Looking forward to 2005…
• Focus on building our UK cable business
• Strong net adds growth
• Further margin improvement
• Continued focus on shareholder value
27
[LOGO]
28
Appendices
• Use of non-GAAP terms
• Reconciliations to US GAAP
• Non-recurring items in Q3 and Q4 2003
• Q4 2004 OCF margin
• ntl network advantage
• Capital Structure notes
Use of Non-U.S. GAAP (Generally Accepted Accounting Principles) Financial Measures
Operating Income before Depreciation, Amortization and other charges (OCF) Adjusted OCF
• Operating income before depreciation, amortisation and other charges, which we refer to as OCF, is not a financial measure recognised under U.S. GAAP. OCF represents our earnings before interest, taxes, depreciation and amortisation, other charges, share of income from equity investments, loss on extinguishment of debt and foreign currency transaction gains (losses). Adjusted OCF represents OCF adjusted so that it does not take into account the costs of our layoff of approximately 450 employees in December 2004. Our management, including our chief executive officer who is our chief operating decision maker, considers OCF and Adjusted OCF as important indicators of our operational strength and performance. OCF and Adjusted OCF excludes the impact of costs and expenses that do not directly affect our cash flows. Other charges, including restructuring charges, are also excluded from OCF and Adjusted OCF as management believes they are not characteristic of our underlying business operations. In addition, Adjusted OCF also excludes layoff costs that management believes are not characteristic of our underlying business operations. OCF and Adjusted OCF are most directly comparable to the U.S. GAAP financial measure operating income (loss). Some of the significant limitations associated with the use of OCF and Adjusted OCF as compared to operating income (loss)) are that OCF and Adjusted OCF do not consider the amount of required reinvestment in depreciable fixed assets and ignore the impact on our results of operations of items that management believes are not characteristic of our underlying business operations.
• We believe OCF and Adjusted OCF are helpful for understanding our performance and assessing our prospects for the future, and that they provide useful supplemental information to investors. In particular, these non-U.S. GAAP financial measures reflect additional ways of viewing aspects of our operations that, when viewed with our U.S. GAAP results and the reconciliation to operating income (loss) shown below, provide a more complete understanding of factors and trends affecting our business. Because non-U.S. GAAP financial measures are not standardised, it may not be possible to compare OCF and Adjusted OCF with other companies’ non-U.S. GAAP financial measures that have the same or similar names. The presentation of this supplemental information is not meant to be considered in isolation or as a substitute for operating income (loss) or other measures of financial performance reported in accordance with U.S. GAAP.
30
Fixed Asset Additions (Accrual Basis)
ntl’s primary measure of expenditures for fixed assets is Fixed Asset Additions (Accrual Basis). Fixed Asset Additions (Accrual Basis) is defined as the purchase of fixed assets as measured on an accrual basis. ntl’s business is underpinned by its significant investment in network infrastructure and information technology. Management therefore considers Fixed Asset Additions (Accrual Basis) an important component in evaluating ntl’s liquidity and financial condition since purchases of fixed assets are a necessary component of ongoing operations. Fixed Asset Additions (Accrual Basis) (formerly Capital Expenditure) is most directly comparable to the U.S. GAAP financial measure purchases of fixed assets as reported in the Statement of Cash Flows. The significant limitations associated with the use of Fixed Asset Additions (Accrual Basis) as compared to purchases of fixed assets are (1) Fixed Asset Additions (Accrual Basis) excludes timing differences from payments of liabilities related to purchases of fixed assets and (2) Fixed Asset Additions (Accrual Basis) excludes capitalised interest. Management excludes these amounts from Fixed Asset Additions (Accrual Basis) because both are more related to the cash management treasury function than to ntl’s management of fixed asset purchases for long-term operational performance and liquidity. Management compensates for these limitations by separately measuring and forecasting working capital and interest payments.
The presentation of this supplemental information is not meant to be considered in isolation or as a substitute for other measures of financial performance reported in accordance with U.S. GAAP accepted in the United States. These non-U.S. GAAP financial measures reflect an additional way of viewing aspects of ntl’s operations that, when viewed with ntl’s U.S. GAAP results and the accompanying reconciliations to corresponding U.S. GAAP financial measures, provide a more complete understanding of factors and trends affecting ntl’s business. Management encourages investors to review ntl’s financial statements and publicly-filed reports in their entirety and to not rely on any single financial measure.
31
Free Cash Flow
ntl’s primary measure of cash flow is Free Cash Flow. Free Cash Flow is defined as net cash provided by (used in) operating activities less net cash (used in) investing activities. ntl’s business is underpinned by its significant investment in network infrastructure and information technology. Management therefore considers it important to measure cash flow after cash used in the purchase of fixed assets and cash used in other investing activities. Free Cash Flow is most directly comparable to the US GAAP financial measure net cash provided by (used in) operating activities. The significant limitation associated with Free Cash Flow as compared to net cash provided by (used in) operating activities is that Free Cash Flow includes cash used in the investing activities. Management deducts purchase of fixed assets in arriving at Free Cash Flow because it considers the amount invested in the purchase of fixed assets to be an important component in evaluating ntl’s liquidity.
The presentation of this supplemental information is not meant to be considered in isolation or as a substitute for other measures of financial performance reported in accordance with US GAAP accepted in the United States. These non-US GAAP financial measures reflect an additional way of viewing aspects of ntl’s operations that, when viewed with ntl’s US GAAP results and the accompanying reconciliations to corresponding US GAAP financial measures, provide a more complete understanding of factors and trends affecting ntl’s business. Management encourages investors to review ntl’s financial statements and publicly-filed reports in their entirety and to not rely on any single financial measure.
32
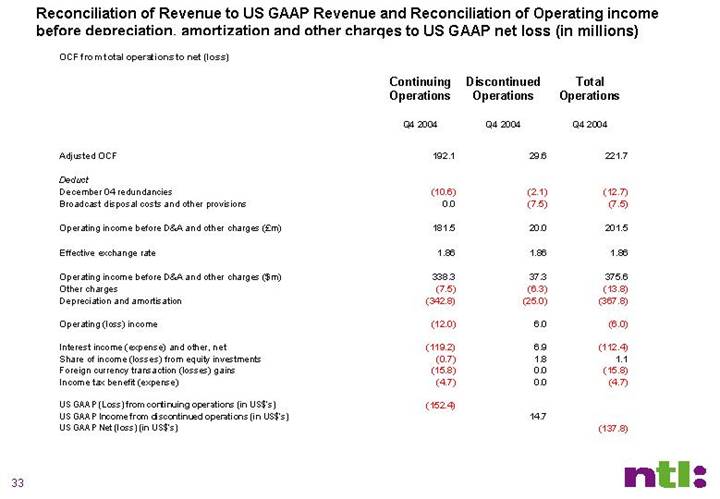
Reconciliation of Revenue to US GAAP Revenue and Reconciliation of Operating income before depreciation, amortization and other charges to US GAAP net loss (in millions)
OCF from total operations to net (loss)
|
| Continuing |
| Discontinued |
| Total |
|
|
| Operations |
| Operations |
| Operations |
|
|
| Q4 2004 |
| Q4 2004 |
| Q4 2004 |
|
|
|
|
|
|
|
|
|
Adjusted OCF |
| 192.1 |
| 29.6 |
| 221.7 |
|
|
|
|
|
|
|
|
|
Deduct |
|
|
|
|
|
|
|
December 04 redundancies |
| (10.6 | ) | (2.1 | ) | (12.7 | ) |
Broadcast disposal costs and other provisions |
| 0.0 |
| (7.5 | ) | (7.5 | ) |
|
|
|
|
|
|
|
|
Operating income before D&A and other charges (£m) |
| 181.5 |
| 20.0 |
| 201.5 |
|
|
|
|
|
|
|
|
|
Effective exchange rate |
| 1.86 |
| 1.86 |
| 1.86 |
|
|
|
|
|
|
|
|
|
Operating income before D&A and other charges ($m) |
| 338.3 |
| 37.3 |
| 375.6 |
|
Other charges |
| (7.5 | ) | (6.3 | ) | (13.8 | ) |
Depreciation and amortisation |
| (342.8 | ) | (25.0 | ) | (367.8 | ) |
|
|
|
|
|
|
|
|
Operating (loss) income |
| (12.0 | ) | 6.0 |
| (6.0 | ) |
|
|
|
|
|
|
|
|
Interest income (expense) and other, net |
| (119.2 | ) | 6.9 |
| (112.4 | ) |
Share of income (losses) from equity investments |
| (0.7 | ) | 1.8 |
| 1.1 |
|
Foreign currency transaction (losses) gains |
| (15.8 | ) | 0.0 |
| (15.8 | ) |
Income tax benefit (expense) |
| (4.7 | ) | 0.0 |
| (4.7 | ) |
|
|
|
|
|
|
|
|
US GAAP (Loss) from continuing operations (in US$’s) |
| (152.4 | ) |
|
|
|
|
US GAAP Income from discontinued operations (in US$’s) |
|
|
| 14.7 |
|
|
|
US GAAP Net (loss) (in US$’s) |
|
|
|
|
| (137.8 | ) |
33
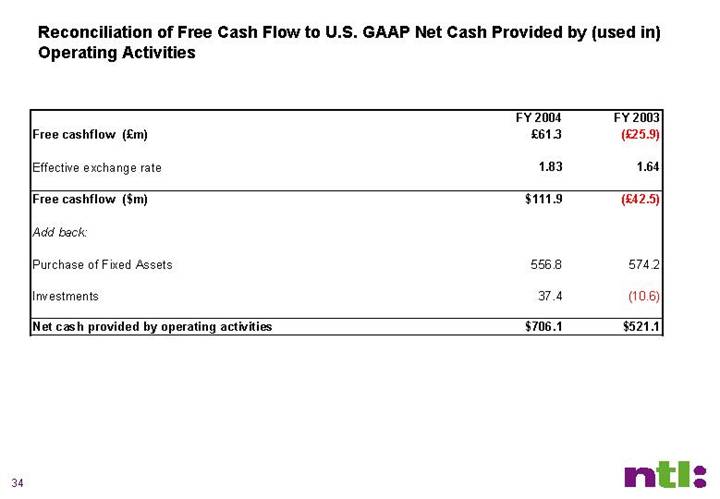
Reconciliation of Free Cash Flow to U.S. GAAP Net Cash Provided by (used in) Operating Activities
|
| FY 2004 |
| FY 2003 |
| ||
Free cashflow (£m) |
| £ | 61.3 |
| £ | (25.9 | ) |
|
|
|
|
|
| ||
Effective exchange rate |
| 1.83 |
| 1.64 |
| ||
|
|
|
|
|
| ||
Free cashflow ($m) |
| $ | 111.9 |
| £ | (42.5 | ) |
|
|
|
|
|
| ||
Add back: |
|
|
|
|
| ||
|
|
|
|
|
| ||
Purchase of Fixed Assets |
| 556.8 |
| 574.2 |
| ||
|
|
|
|
|
| ||
Investments |
| 37.4 |
| (10.6 | ) | ||
|
|
|
|
|
| ||
Net cash provided by operating activities |
| $ | 706.1 |
| $ | 521.1 |
|
34
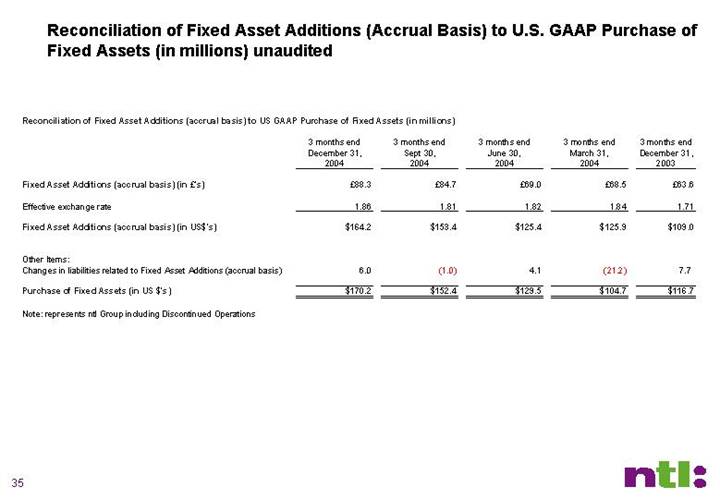
Reconciliation of Fixed Asset Additions (Accrual Basis) to U.S. GAAP Purchase of Fixed Assets (in millions) unaudited
Reconciliation of Fixed Asset Additions (accrual basis) to US GAAP Purchase of Fixed Assets (in millions)
|
| 3 months end |
| 3 months end |
| 3 months end |
| 3 months end |
| 3 months end |
| |||||
|
|
|
|
|
|
|
|
|
|
|
| |||||
Fixed Asset Additions (accrual basis) (in £’s) |
| £ | 88.3 |
| £ | 84.7 |
| £ | 69.0 |
| £ | 68.5 |
| £ | 63.6 |
|
|
|
|
|
|
|
|
|
|
|
|
| |||||
Effective exchange rate |
| 1.86 |
| 1.81 |
| 1.82 |
| 1.84 |
| 1.71 |
| |||||
|
|
|
|
|
|
|
|
|
|
|
| |||||
Fixed Asset Additions (accrual basis) (in US$’s) |
| $ | 164.2 |
| $ | 153.4 |
| $ | 125.4 |
| $ | 125.9 |
| $ | 109.0 |
|
|
|
|
|
|
|
|
|
|
|
|
| |||||
Other Items: |
|
|
|
|
|
|
|
|
|
|
| |||||
Changes in liabilities related to Fixed Asset Additions (accrual basis) |
| 6.0 |
| (1.0 | ) | 4.1 |
| (21.2 | ) | 7.7 |
| |||||
|
|
|
|
|
|
|
|
|
|
|
| |||||
Purchase of Fixed Assets (in US $’s) |
| $ | 170.2 |
| $ | 152.4 |
| $ | 129.5 |
| $ | 104.7 |
| $ | 116.7 |
|
Note: represents ntl Group including Discontinued Operations
35
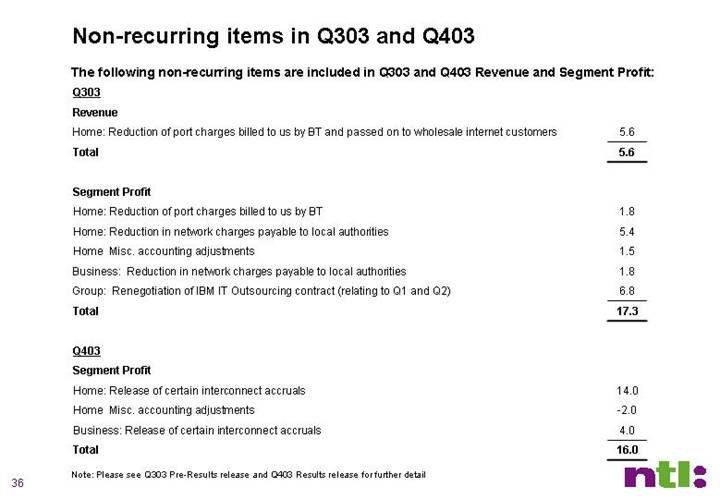
Non-recurring items in Q303 and Q403
The following non-recurring items are included in Q303 and Q403 Revenue and Segment Profit:
Q303 |
|
|
|
Revenue |
|
|
|
Home: Reduction of port charges billed to us by BT and passed on to wholesale internet customers |
| 5.6 |
|
Total |
| 5.6 |
|
|
|
|
|
Segment Profit |
|
|
|
Home: Reduction of port charges billed to us by BT |
| 1.8 |
|
Home: Reduction in network charges payable to local authorities |
| 5.4 |
|
Home Misc. accounting adjustments |
| 1.5 |
|
Business: Reduction in network charges payable to local authorities |
| 1.8 |
|
Group: Renegotiation of IBM IT Outsourcing contract (relating to Q1 and Q2) |
| 6.8 |
|
Total |
| 17.3 |
|
|
|
|
|
Q403 |
|
|
|
Segment Profit |
|
|
|
Home: Release of certain interconnect accruals |
| 14.0 |
|
Home Misc. accounting adjustments |
| -2.0 |
|
Business: Release of certain interconnect accruals |
| 4.0 |
|
Total |
| 16.0 |
|
Note: Please see Q303 Pre-Results release and Q403 Results release for further detail
36
Q4 2004 OCF Margin
|
| Q4 2004 (£m, except margins) |
| ||||
|
| Continuing |
| Discontinued |
| Total |
|
|
| Operations |
| Operations |
| Operations |
|
Revenue |
| 531.7 |
| 67.1 |
| 598.8 |
|
Operating income before D&A and other charges (OCF) |
| 181.5 |
| 20.0 |
| 201.5 |
|
December 04 redundancies |
| 10.6 |
| 2.1 |
| 12.7 |
|
Broadcast disposal costs and other provisions |
| 0.0 |
| 7.5 |
| 7.5 |
|
Adjusted OCF |
| 192.1 |
| 29.6 |
| 221.7 |
|
OCF margin |
| 34.1 | % |
|
| 33.7 | % |
Adjusted OCF margin |
| 36.1 | % |
|
| 37.0 | % |
37
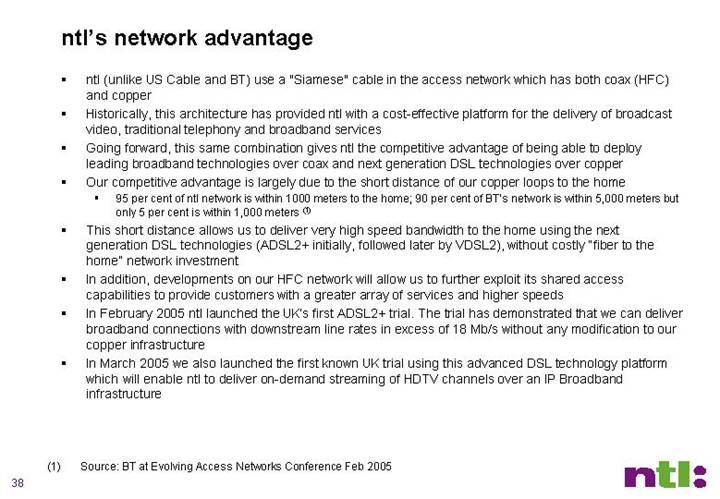
ntl’s network advantage
• ntl (unlike US Cable and BT) use a “Siamese” cable in the access network which has both coax (HFC) and copper
• Historically, this architecture has provided ntl with a cost-effective platform for the delivery of broadcast video, traditional telephony and broadband services
• Going forward, this same combination gives ntl the competitive advantage of being able to deploy leading broadband technologies over coax and next generation DSL technologies over copper
• Our competitive advantage is largely due to the short distance of our copper loops to the home
• 95 per cent of ntl network is within 1000 meters to the home; 90 per cent of BT’s network is within 5,000 meters but only 5 per cent is within 1,000 meters (1)
• This short distance allows us to deliver very high speed bandwidth to the home using the next generation DSL technologies (ADSL2+ initially, followed later by VDSL2), without costly “fiber to the home” network investment
• In addition, developments on our HFC network will allow us to further exploit its shared access capabilities to provide customers with a greater array of services and higher speeds
• In February 2005 ntl launched the UK’s first ADSL2+ trial. The trial has demonstrated that we can deliver broadband connections with downstream line rates in excess of 18 Mb/s without any modification to our copper infrastructure
• In March 2005 we also launched the first known UK trial using this advanced DSL technology platform which will enable ntl to deliver on-demand streaming of HDTV channels over an IP Broadband infrastructure
(1) Source: BT at Evolving Access Networks Conference Feb 2005
38
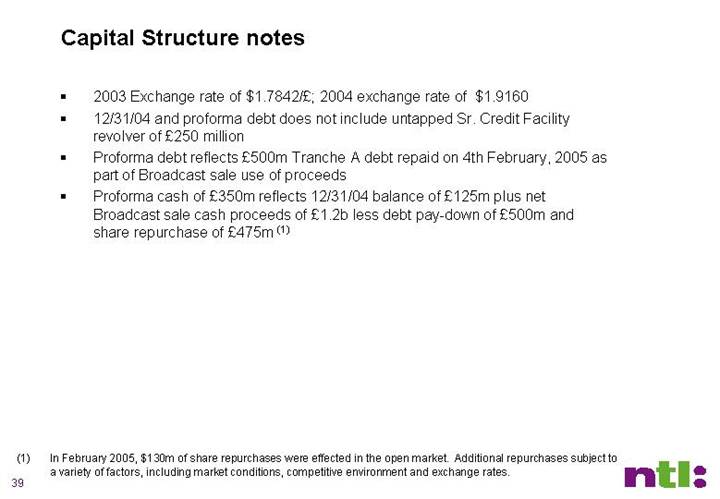
Capital Structure notes
• 2003 Exchange rate of $1.7842/£; 2004 exchange rate of $1.9160
• 12/31/04 and proforma debt does not include untapped Sr. Credit Facility revolver of £250 million
• Proforma debt reflects £500m Tranche A debt repaid on 4th February, 2005 as part of Broadcast sale use of proceeds
• Proforma cash of £350m reflects 12/31/04 balance of £125m plus net Broadcast sale cash proceeds of £1.2b less debt pay-down of £500m and share repurchase of £475m (1)
(1) In February 2005, $130m of share repurchases were effected in the open market. Additional repurchases subject to a variety of factors, including market conditions, competitive environment and exchange rates.
39