| NTL Incorporated Q3 2003 Results November 12, 2003 |

| Safe Harbor Statement Under the Private Securities Litigation Reform Act of 1995 Various statements contained herein constitute "forward-looking statements" as that term is defined under the Private Securities Litigation Reform Act of 1995. When used herein, the words "believe," "anticipate," "should," "intend," "plan," "will," "expects," "estimates," "projects," "positioned," "strategy," and similar expressions identify these forward-looking statements. These forward-looking statements involve known and unknown risks, uncertainties and other factors that may cause our actual results, performance or achievements or industry results to be materially different from those contemplated, projected, forecasted, estimated or budgeted, whether expressed or implied, by these forward-looking statements. These factors include those set forth under the caption "Risk Factors" in our amended registration statement on Form S-1 that was filed with the SEC on 31 October 2003, such as: potential adverse developments with respect to our liquidity or results of operations; the significant debt payments commencing in 2005 and other contractual commitments coming due over the next several years; our ability to fund and execute our business plan; the impact of new business opportunities requiring significant up-front investments; our ability to attract and retain customers, increase our overall market penetration and react to competition from providers of alternative services; our ability to integrate our billing systems; our significant management changes; our ability to develop and maintain back-up for our critical systems; our ability to respond adequately to technological developments; our ability to maintain contracts that are critical to our operations; our ability to continue to design networks, install facilities, obtain and maintain any required governmental licenses or approvals and finance construction and development, in a timely manner at reasonable costs and on satisfactory terms and conditions; interest rate and currency exchange rate fluctuations; the impact of our recent reorganization and subsequent organizational restructuring; and risks related to the rights offering. We assume no obligation to update the forward-looking statements contained herein to reflect actual results, changes in assumptions or changes in factors affecting these statements. |

| Disclaimer Pursuant to the rights offering, the rights and shares of our common stock relating to the rights are not being and may not be offered and sold to or acquired by persons outside the United States, except for persons who fall within permitted categories under UK law or who provide evidence satisfactory to us that they are permitted to purchase the rights. No prospectus relating to the rights or shares of our common stock relating to the rights has been or will be filed for registration with any authority outside the United States. On November 4, 2003, we filed a prospectus with the U.S. Securities and Exchange Commission. We refer you to this filing, which can be found on the SEC's website (www.sec.gov), for information relating to us and to the rights offering. As our rights offering is still continuing, we have limited this presentation to our third quarter results. Please limit your questions accordingly. Nothing in this presentation constitutes investment advice and this presentation shall not constitute an offer to sell or the solicitation of an offer to buy any rights or shares of our common stock or otherwise to engage in investment activity. Any investment decision in connection with the rights offering should be made solely on the basis of the information contained in the prospectus. |
| Use of non-GAAP (Generally Accepted Accounting Principles) terms To supplement our financial information, we use combined segment profit, which is not a financial measure recognized under GAAP. Combined segment profit represents our combined earnings before interest, taxes, depreciation and amortization, other charges, share of (losses) from equity investments, foreign currency transaction gains (losses) and recapitalization items, net, for each of our reportable business segments. This measure is most directly comparable to the GAAP financial measure net income (loss). Some of the significant limitations associated with the use of combined segment profit as compared to net income (loss) are that combined segment profit does not consider the amount of required reinvestment in depreciable fixed assets, interest expense, gains or losses on foreign currency transactions, income tax expense or benefit and similar items on our results of operations. Combined segment profit also ignores the impact on our results of operations of items that management believes are not characteristic of our underlying business operations. We compensate for these limitations by using combined segment profit to measure profit or loss on a combined divisional basis and not to determine our consolidated results of operations. Reconciliations of combined segment profit to net loss are contained in our 10Q and are set out in the appendix to this presentation. We believe combined segment profit is helpful for understanding our performance and assessing our prospects for the future, and that it provides useful supplemental information to investors. In particular, this non- GAAP financial measure reflects an additional way of viewing aspects of our operations that, when viewed with our GAAP results and the reconciliations to net income (loss), provide a more complete understanding of factors and trends affecting our business. Because non-GAAP financial measures are not standardized, it may not be possible to compare combined segment profit (loss) with other companies' non-GAAP financial measures that have the same or similar names. The presentation of this supplemental information is not meant to be considered in isolation or as a substitute for net income (loss) or other measures of financial performance reported in accordance with GAAP. |

| Agenda Introduction Financial Review Operational Review Questions and Answers |

| Financial Review Scott Schubert Chief Financial Officer |
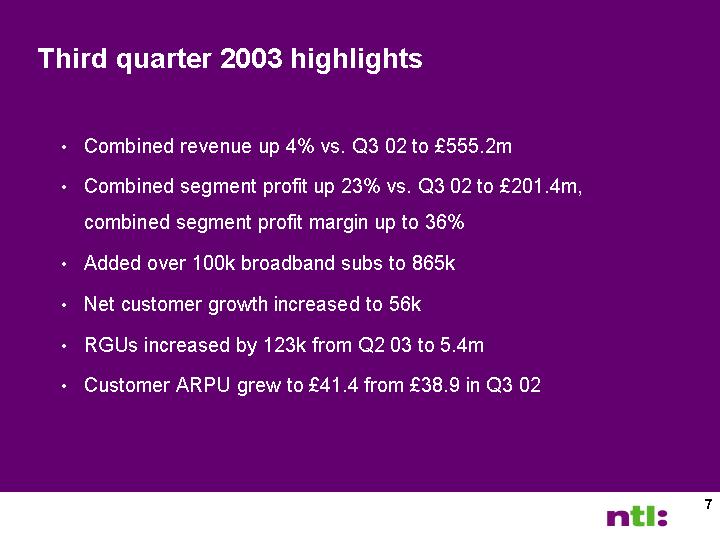
| Third quarter 2003 highlights Combined revenue up 4% vs. Q3 02 to £555.2m Combined segment profit up 23% vs. Q3 02 to £201.4m, combined segment profit margin up to 36% Added over 100k broadband subs to 865k Net customer growth increased to 56k RGUs increased by 123k from Q2 03 to 5.4m Customer ARPU grew to £41.4 from £38.9 in Q3 02 |
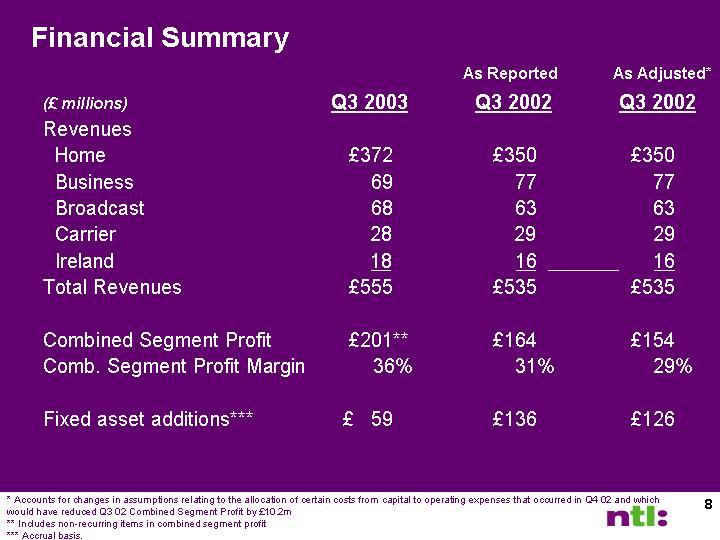
| Financial Summary (£ millions) Q3 2003 Q3 2002 Q3 2002 Revenues Home £372 £350 £350 Business 69 77 77 Broadcast 68 63 63 Carrier 28 29 29 Ireland 18 16 16 Total Revenues £555 £535 £535 Combined Segment Profit £201** £164 £154 Comb. Segment Profit Margin 36% 31% 29% Fixed asset additions*** £ 59 £136 £126 As Adjusted* * Accounts for changes in assumptions relating to the allocation of certain costs from capital to operating expenses that occurred in Q4 02 and which would have reduced Q3 02 Combined Segment Profit by £10.2m ** Includes non-recurring items in combined segment profit *** Accrual basis. As Reported |
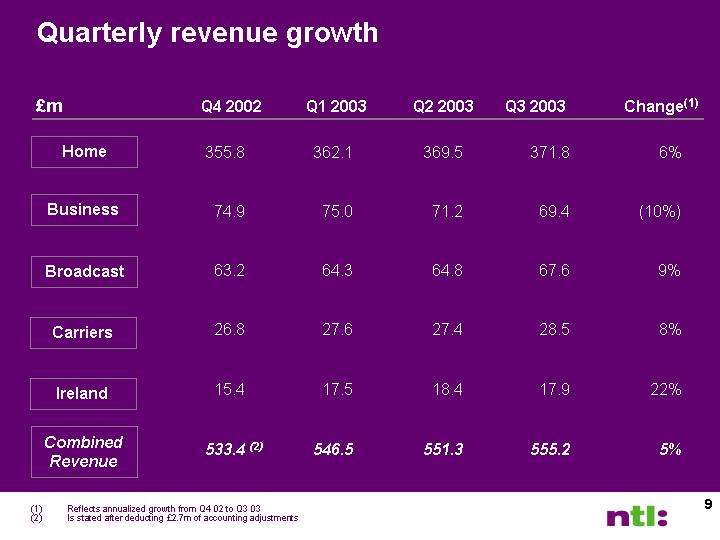
| Home Quarterly revenue growth 355.8 362.1 369.5 371.8 6% 74.9 75.0 71.2 69.4 (10%) 63.2 64.3 64.8 67.6 9% 26.8 27.6 27.4 28.5 8% 15.4 17.5 18.4 17.9 22% 533.4 (2) 546.5 551.3 555.2 5% £m Q4 2002 Q1 2003 Q2 2003 Q3 2003 Change(1) (1) Reflects annualized growth from Q4 02 to Q3 03 (2) Is stated after deducting £2.7m of accounting adjustments Business Broadcast Carriers Combined Revenue Ireland |

| Quarterly segment profit growth(1) 159.6 156.4 152.7 163.7 176.5 17% 21.6 19.9 21.1 24.0 26.9 47% 23.9 23.9 28.6 26.9 28.2 24% 22.4 22.4 22.2 23.3 23.9 9% 3.5 3.5 4.9 5.6 7.5 152% 163.0 151.1 156.5 173.8 201.4 44% £m Q4 2002 Q4 2002 Q1 2003 Q2 2003 Q3 2003 Change(2) (1) Individual divisions segment profit excludes shared services (2) Reflects annualized growth from Q4 02 ("as adjusted") to Q3 03 (3) Combined segment profit includes shared services and £16m of non-recurring items (4) Q4 02 segment profit restated to allocate Q4 02 accounting adjustments across prior quarters Home Business Broadcast Carriers Combined Segment Profit(3) Ireland As As reported adjusted(4) |
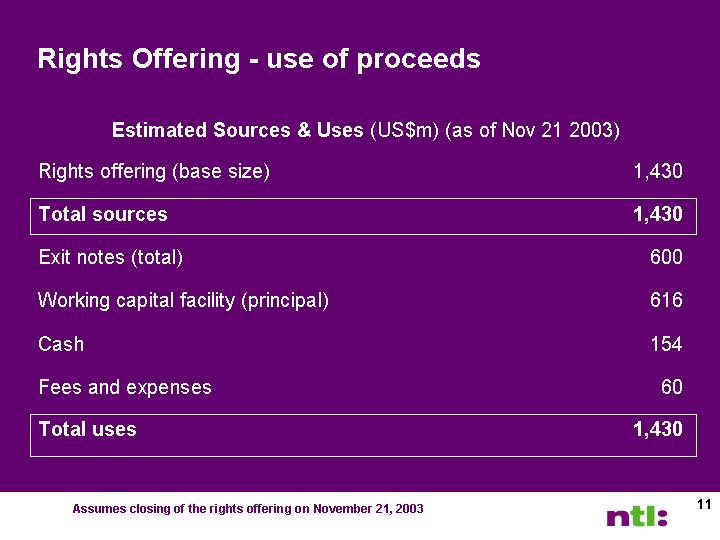
| Rights Offering - use of proceeds Estimated Sources & Uses (US$m) (as of Nov 21 2003) Rights offering (base size) 1,430 Total sources 1,430 Exit notes (total) 600 Working capital facility (principal) 616 Cash 154 Fees and expenses 60 Total uses 1,430 Assumes closing of the rights offering on November 21, 2003 |
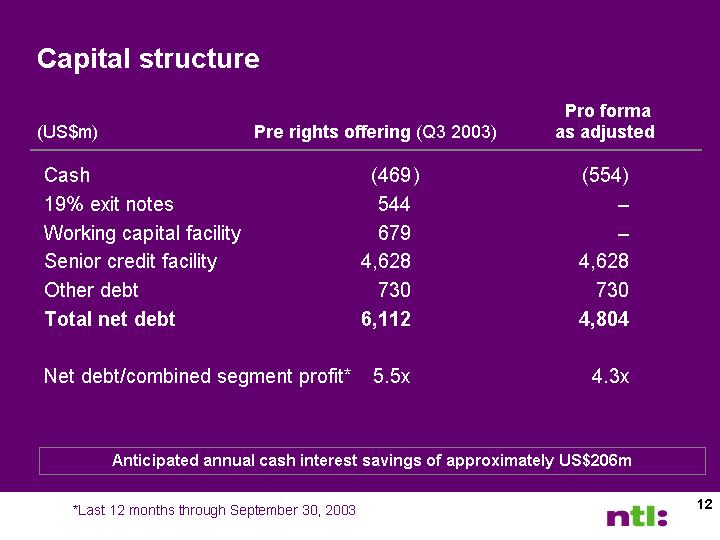
| Capital structure Cash (469 ) (554) 19% exit notes 544 - Working capital facility 679 - Senior credit facility 4,628 4,628 Other debt 730 730 Total net debt 6,112 4,804 Net debt/combined segment profit* 5.5x 4.3x Pro forma (US$m) Pre rights offering (Q3 2003) as adjusted Anticipated annual cash interest savings of approximately US$206m *Last 12 months through September 30, 2003 |

| Operational Review Simon Duffy Chief Executive Officer |
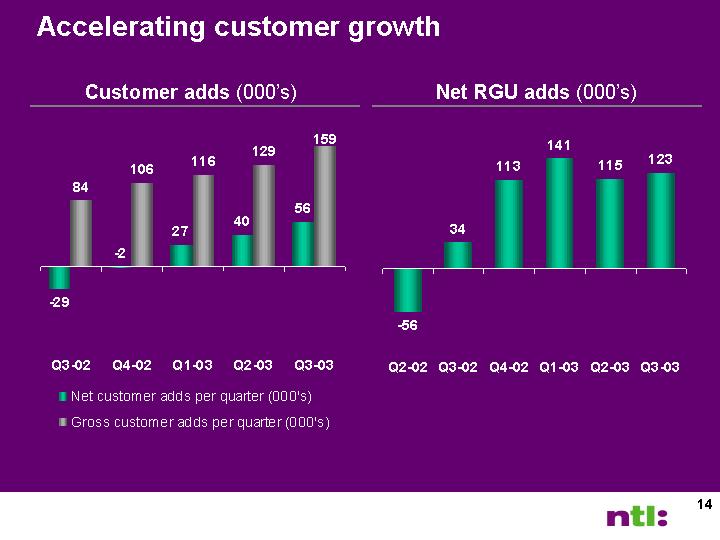
| Accelerating customer growth Customer adds (000's) Q3-02 Q4-02 Q1-03 Q2-03 Q3-03 Net customer adds per quarter (000's) -29 -2 27 40 56 Gross customer adds per quarter (000's) 84 106 116 129 159 Net RGU adds (000's) Q2-02 Q3-02 Q4-02 Q1-03 Q2-03 Q3-03 -56 34 113 141 115 123 |
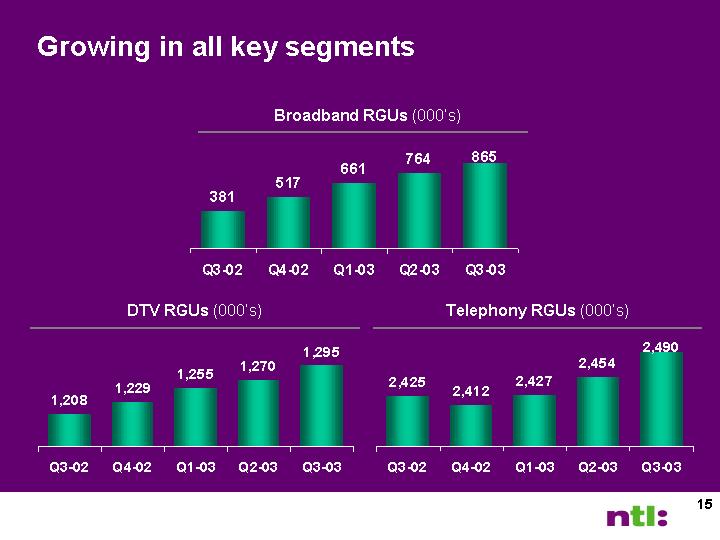
| Growing in all key segments Q3-02 Q4-02 Q1-03 Q2-03 Q3-03 Total broadband subscribers 1207.8 1229 1255.2 1269.7 1294.8 Broadband RGUs (000's) DTV RGUs (000's) Telephony RGUs (000's) Q3-02 Q4-02 Q1-03 Q2-03 Q3-03 Total broadband subscribers 2425 2411.5 2426.7 2453.7 2489.8 Q3-02 Q4-02 Q1-03 Q2-03 Q3-03 Total broadband subscribers 381 517 661 764 865 |
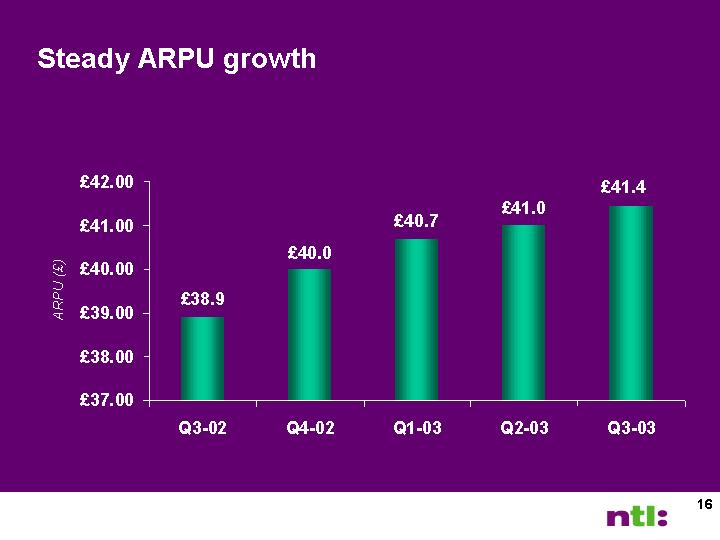
| Steady ARPU growth Q3-02 Q4-02 Q1-03 Q2-03 Q3-03 ARPU 38.9 40 40.7 41 41.43 1st Qtr 2nd Qtr 3rd Qtr 4th Qtr East 20.4 27.4 90 20.4 West 30.6 38.6 34.6 31.6 North 45.9 46.9 45 43.9 |
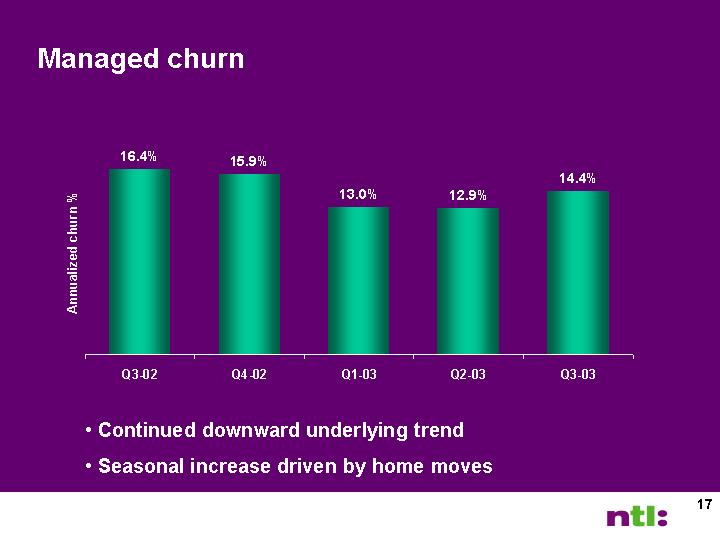
| Managed churn Q3-02 Q4-02 Q1-03 Q2-03 Q3-03 Churn % 0.164 0.159 0.13 0.129 0.144 Continued downward underlying trend Seasonal increase driven by home moves |

| Q3 2003 Business summary Actual Change Q3 03 Q3 v Q2 Y-O-Y Revenue £69.4m (£1.8m) (7.3m) Segment profit £26.9m £2.9m £8.9m Segment profit margin 38.8% 5.1% 15.3% Headcount (approx) 1,400 (250) (700) |
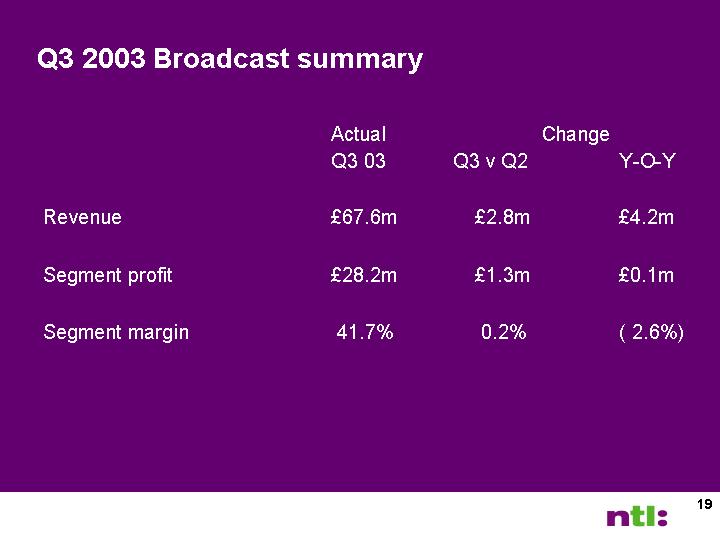
| Q3 2003 Broadcast summary Actual Change Q3 03 Q3 v Q2 Y-O-Y Revenue £67.6m £2.8m £4.2m Segment profit £28.2m £1.3m £0.1m Segment margin 41.7% 0.2% ( 2.6%) |
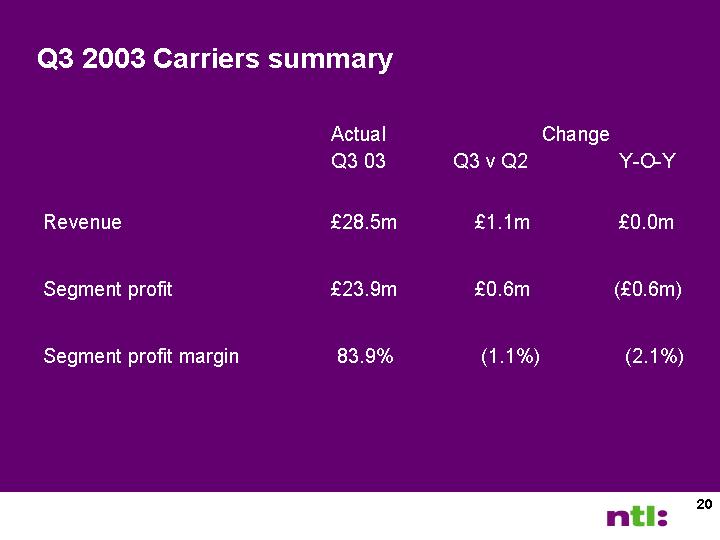
| Q3 2003 Carriers summary Actual Change Q3 03 Q3 v Q2 Y-O-Y Revenue £28.5m £1.1m £0.0m Segment profit £23.9m £0.6m (£0.6m) Segment profit margin 83.9% (1.1%) (2.1%) |
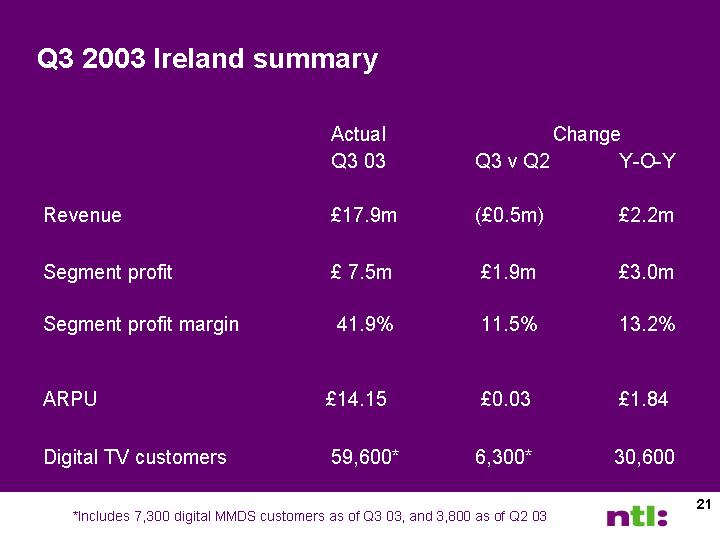
| Q3 2003 Ireland summary Actual Change Q3 03 Q3 v Q2 Y-O-Y Revenue £17.9m (£0.5m) £2.2m Segment profit £ 7.5m £1.9m £3.0m Segment profit margin 41.9% 11.5% 13.2% ARPU £14.15 £0.03 £1.84 Digital TV customers 59,600* 6,300* 30,600 *Includes 7,300 digital MMDS customers as of Q3 03, and 3,800 as of Q2 03 |


| Appendix |
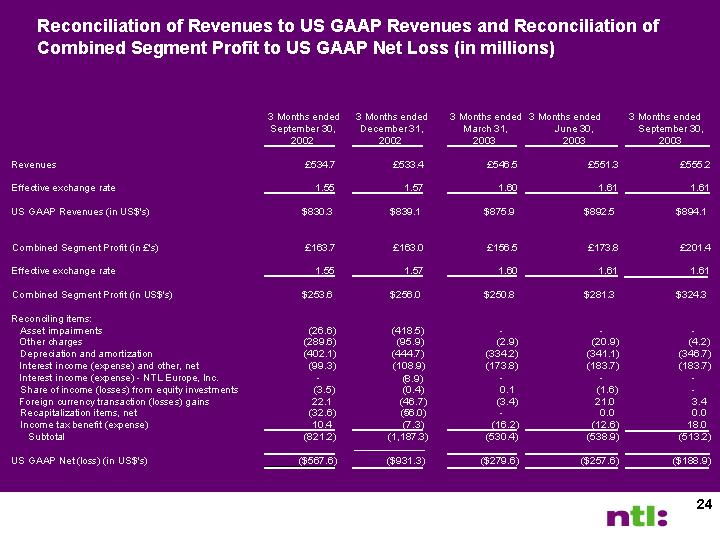
| Reconciliation of Revenues to US GAAP Revenues and Reconciliation of Combined Segment Profit to US GAAP Net Loss (in millions) 3 Months ended 3 Months ended 3 Months ended 3 Months ended 3 Months ended September 30, December 31, March 31, June 30, September 30, 2002 2002 2003 2003 2003 Revenues £534.7 £533.4 £546.5 £551.3 £555.2 Effective exchange rate 1.55 1.57 1.60 1.61 1.61 US GAAP Revenues (in US$'s) $830.3 $839.1 $875.9 $892.5 $894.1 Combined Segment Profit (in £'s) £163.7 £163.0 £156.5 £173.8 £201.4 Effective exchange rate 1.55 1.57 1.60 1.61 1.61 Combined Segment Profit (in US$'s) $253.6 $256.0 $250.8 $281.3 $324.3 Reconciling items: Asset impairments (26.6) (418.5) - - - - - - Other charges (289.6) (95.9) (2.9) (20.9) (4.2) Depreciation and amortization (402.1) (444.7) (334.2) (341.1) (346.7) Interest income (expense) and other, net (99.3) (108.9) (173.8) (183.7) (183.7) Interest income (expense) - NTL Europe, Inc. - - - - (8.9) - - - - - - Share of income (losses) from equity investments (3.5) (0.4) 0.1 (1.6) - - Foreign currency transaction (losses) gains 22.1 (46.7) (3.4) 21.0 3.4 Recapitalization items, net (32.6) - - (56.0) - - 0.0 0.0 Income tax benefit (expense) 10.4 (7.3) (16.2) (12.6) 18.0 Subtotal (821.2) (1,187.3) (530.4) (538.9) (513.2) US GAAP Net (loss) (in US$'s) ($567.6) ($931.3) ($279.6) ($257.6) ($188.9) |
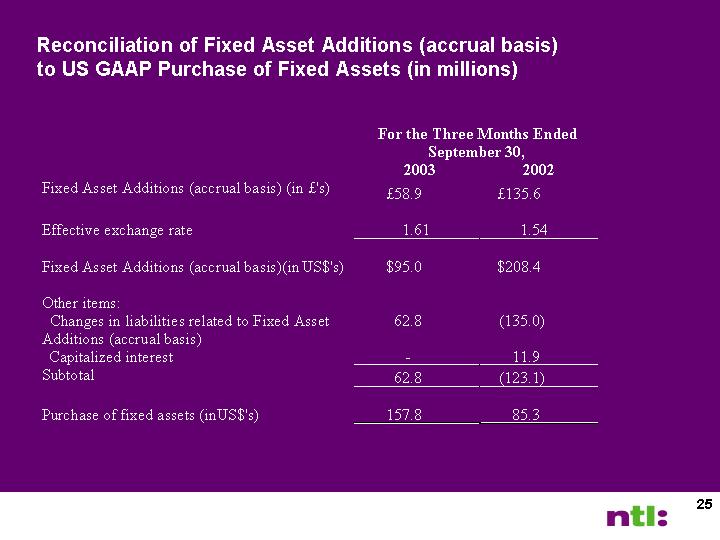
| Reconciliation of Fixed Asset Additions (accrual basis) to US GAAP Purchase of Fixed Assets (in millions) For the Three Months Ended September 30, 2003 2002 Fixed Asset Additions (accrual basis) (in £'s) £58.9 £135.6 Effective exchange rate 1.61 1.54 Fixed Asset Additions (accrual basis)(in US$'s) $95.0 $208.4 Other items: Changes in liabilities related to Fixed Asset Additions (accrual basis) 62.8 (135.0) Capitalized interest - - 11.9 Subtotal 62.8 (123.1) Purchase of fixed assets (in US$'s) 157.8 85.3 |