UNITED STATES
SECURITIES AND EXCHANGE COMMISSION
Washington, D.C. 20549
FORM N-CSR
CERTIFIED SHAREHOLDER REPORT OF REGISTERED
MANAGEMENT INVESTMENT COMPANIES
Investment Company Act file number | 811-7762 |
|
First Eagle Funds |
(Exact name of registrant as specified in charter) |
|
1345 Avenue of the Americas
New York, NY | | 10105-4300 |
(Address of principal executive offices) | | (Zip code) |
|
Robert Bruno First Eagle Funds 1345 Avenue of the Americas New York, NY 10105-4300 |
(Name and address of agent for service) |
|
Registrant’s telephone number, including area code: | 1-212-632-2700 | |
|
Date of fiscal year end: | October 31 | |
|
Date of reporting period: | April 30, 2009 | |
| | | | | | | | |
Form N-CSR is to be used by management investment companies to file reports with the Commission not later than 10 days after the transmission to stockholders of any report that is required to be transmitted to stockholders under Rule 30e-1 under the Investment Company Act of 1940 (17 CFR 270.30e-1). The Commission may use the information provided on Form N-CSR in its regulatory, disclosure review, inspection, and policymaking roles.
A registrant is required to disclose the information specified by Form N-CSR, and the Commission will make this information public. A registrant is not required to respond to the collection of information contained in Form N-CSR unless the Form displays a currently valid Office of Management and Budget (“OMB”) control number. Please direct comments concerning the accuracy of the information collection burden estimate and any suggestions for reducing the burden to Secretary, Securities and Exchange Commission, 450 Fifth Street, NW, Washington, DC 20549-0609. The OMB has reviewed this collection of information under the clearance requirements of 44 U.S.C. § 3507.
Item 1. Reports to Stockholders.

Semi-Annual Report
APRIL 30, 2009
Global Fund
Overseas Fund
U.S. Value Fund
Gold Fund
Fund of America
ADVISED BY ARNHOLD AND S. BLEICHROEDER ADVISERS, LLC
Forward-Looking Statement Disclosure
One of our most important responsibilities as mutual fund managers is to communicate with shareholders in an open and direct manner. Some of our comments in our letters to shareholders are based on current management expectations and are considered "forward-looking statements." Actual future results, however, may prove to be different from our expectations. You can identify forward-looking statements by words such as "may", "will", "believe", "attempt", "seem", "think", "ought", "try" and other similar terms. We cannot promise future returns. Our opinions are a reflection of our best judgment at the time this report is compiled, and we disclaim any obligation to update or alter forward-looking statements as a result of new information, future events, or otherwise.
Table of Contents
| Letter from the President | | | 4 | | |
|
| Letter from the Global Value Team Portfolio Managers | | | 6 | | |
|
Management's Discussion of Fund Performance: First Eagle Global, Overseas,
U.S. Value and Gold Funds | | | 8 | | |
|
| Performance Chart | | | 12 | | |
|
| First Eagle Global Fund: | |
|
| Fund Overview | | | 16 | | |
|
| Schedule of Investments | | | 18 | | |
|
| First Eagle Overseas Fund: | |
|
| Fund Overview | | | 36 | | |
|
| Schedule of Investments | | | 38 | | |
|
| First Eagle U.S. Value Fund: | |
|
| Fund Overview | | | 52 | | |
|
| Schedule of Investments | | | 54 | | |
|
| First Eagle Gold Fund: | |
|
| Fund Overview | | | 62 | | |
|
| Schedule of Investments | | | 64 | | |
|
| First Eagle Fund of America: | |
|
| Management's Discussion of Fund Performance | | | 69 | | |
|
| Fund Overview | | | 70 | | |
|
| Schedule of Investments | | | 72 | | |
|
| Statements of Assets and Liabilities | | | 78 | | |
|
| Statements of Operations | | | 82 | | |
|
| Statements of Changes in Net Assets | | | 84 | | |
|
| Financial Highlights | | | 88 | | |
|
| Notes to Financial Statements | | | 98 | | |
|
| General Information | | | 117 | | |
|
| Fund Expenses | | | 118 | | |
|
| Additional Information | | | 121 | | |
|
| Consideration of Investment Advisory Agreements | | | 129 | | |
|
Letter from the President
Dear Fellow Shareholders,
Since my last letter six months ago markets around the world have continued along a volatile path. Through February most global markets seemed to be in a consistent state of decline. Then on March 9th domestic markets began to rise off the bottom and many thought this could be the first sign of recovery. At First Eagle Funds we believe that the future is still very uncertain and we continue to worry first and foremost about what could go wrong. In our opinion, we have yet to see the complete ramifications of the extraordinary actions taken by global governments in an effort to restore both liquidity and consumer confidence. This does not mean that we are doom-sayers though.
As I look across the industry, many investors experienced a loss during the last 18 months, some more significant than others. We believe that the majority of our losses are temporary in nature and that over the long-term we think that we will recover most, if not all, of the loss of capital experienced by our clients in our funds. Our primary goal remains focused on preserving capital over time for our shareholders.
We continue to manage assets with an unwavering adherence to intelligent value investing. Our portfolio management and analyst teams search the globe for high quality businesses with strong balance sheets trading at a discount to our estimate of intrinsic value. Currently, we are able to find new opportunities and add to existing positions in a variety of sectors, countries and across the entire capital structure due to the depressed valuations which further add to the potential for future value creation in our portfolios.
I am pleased to say that the Global Value Team is stronger than it has ever been. Jean-Marie Eveillard officially transitioned to a senior advisory role on March 26th. He remains a Senior Vice President of Arnhold and S. Bleichroeder Advisers, LLC as well as a Trustee of the First Eagle Funds. Since early September he has worked closely with the portfolio management team and we expect that the dialogue will continue. In February we named Rachel Benepe and Abhay Deshpande as portfolio managers of First Eagle Gold Fund. We also

John P. Arnhold
FIRST EAGLE FUNDS | SEMI-ANNUAL REPORT | APRIL 30, 2009
4
recently announced that Senior Analyst Elizabeth Tobin has re-joined the team. Elizabeth and Jean-Marie worked together on the Funds for over 15 years. She brings tremendous expertise to the team and her temperament is that of a true value investor. The Global Value Team led by Matthew McLennan is deep and the spirit of value investing has never been more palpable.
First Eagle Fund of America, sub-advised by Harold Levy and David Cohen of Iridian Asset Management, has now produced consistently strong performance on both a relative and absolute basis for over 22 years. The Fund invests in what are believed to be undervalued companies poised to benefit from a corporate event. We believe this fund is an undiscovered mutual fund treasure. There are few peers with First Eagle Fund of America's long-term performance record, risk profile and the same management team since inception available for investment today.
Please be assured that your investments in our funds will continue to be managed in the same diligent manner as they have been for over 30 years. Our portfolio managers and other senior executives have substantial investments alongside of yours and we are grateful for the confidence that you continue to place in our firm.
Sincerely,

John P. Arnhold
President
May 2009
"Our primary goal remains focused on preserving capital over time for our shareholders."
Past performance is no guarantee of future results. The portfolio is actively managed. The portfolio and opinions expressed herein are subject to change. Current and future portfolio holdings are subject to risk.
FIRST EAGLE FUNDS | SEMI-ANNUAL REPORT | APRIL 30, 2009
5
Letter from the Global Value Team Portfolio Managers
There is often wisdom in sailing a steady course despite stormy waters. When markets are unusually volatile many feel a tendency to zig and zag trying to be ahead of each development in sentiment. For those who try to speculate on market sentiment, the past six months would have been a challenge: in February the chorus was "isn't it obvious that we're in a deflationary spiral and shouldn't one own all bonds"; in April the chorus was "isn't it obvious that the authorities are reflating and shouldn't one own all levered equities". The truth is that it is never obvious—nobody has a perfect crystal ball. When all the past six month's market gyrations are fully accounted for, the Funds sailed a steady course with low turnover and the majority returning a handful of percentage points. Sometimes it is better to simply watch the grass grow than to frenetically mow the lawn every week!
We exist in a world where the range of potential future outcomes is broad. Governments in many countries are taking on debt at a rapid rate as they grow their economic influence; on the one hand, banks are scrambling to recapitalize in developed markets and, on the other hand, banks are rapidly expanding balance sheets in some emerging markets and to add to the mix the central banks of the world are expanding the definition of what constitutes lender of last resort with a suite of unconventional market interventions. With deleveraging and rising unemployment having a life of their own, current deflationary forces are strong yet the second order effects of all this government medicine may be to produce more future inflation. Thus there is paradoxically more risk of both deflation and inflation depending on one's time horizon and even today we see some signs of both co-existing with inflation in food and energy prices over the pas t few months even as real estate prices in many areas continue to deflate. Our sense of the possibilities is foggier than usual.
When one's time horizon is short, cash provides stability against a backdrop of uncertainty but as one's horizon lengthens to years from months this stability is exposed as illusory due to inflation, currency debasement and taxes. As long term investors, our approach to dealing with the current uncertainty is to be primarily owners of enterprises, favoring those with entrenched market position, latency in potential cash flows, prudent management, strong balance sheets and most importantly modest prices. We believe such businesses can better endure the current storm and can better sustain real purchasing power in the long term. We are not 100% fully invested—we typically like to have some deferred purchasing power because we fundamentally acknowledge the world as uncertain and hope that when we least expect it opportunity will come knocking in some
FIRST EAGLE FUNDS | SEMI-ANNUAL REPORT | APRIL 30, 2009
6

Pictured: (from left to right) Abhay Deshpande, Matthew McLennan and Jean-Marie Eveillard
corner of the globe. Importantly, a good part of our deferred purchasing power remains in gold and gold equities. With interest rates low, government credit weakening and a global race to devalue currencies in order to protect domestic profits a possibility, we believe that the opportunity cost of holding gold as money is reasonable despite gold's strength in recent years.
Our analysts are busy as ever attempting to unearth opportunities in a world of lower prices but are also willing to realistically move on where either fundamentals have eroded or new risks are emerging. Their focus and open-minded calm in the storm has been impressive.

Matthew McLennan
Global Value Team Lead
Portfolio Manager – Global, Overseas and U.S. Value Funds

Abhay Deshpande
Portfolio Manager – Global, Overseas, U.S. Value and Gold Funds

Jean-Marie Eveillard
Senior Adviser
May 2009
Past performance is no guarantee of future results. The portfolio is actively managed. The portfolio and opinions expressed herein are subject to change. Current and future portfolio holdings are subject to risk.
FIRST EAGLE FUNDS | SEMI-ANNUAL REPORT | APRIL 30, 2009
7
Management's Discussion of Fund Performance
Global markets were mixed for the six months ended April 30, 2009 as investors tried to identify which markets would benefit from a world-wide economic recovery. The market's rally which began in early March gathered pace through April even as negative news about the U.S. auto industry emerged. The MSCI World Index fell 5% and the MSCI EAFE Index fell 3% during the period. In Japan, the Nikkei 225 Index rose 3%. In Europe, the French CAC 40 Index fell 9% and the German DAX Index fell 4%. In the U.S., the S&P 500 Index declined 9%. The U.S. dollar fell 4% against the euro and was unchanged against the Japanese yen as fear about the global financial system weakened the dollar. Crude oil fell 25% to $51 by the end of April while gold rose 23% to $888 per ounce as concerns about inflation increased.
First Eagle Global Fund
The net asset value ("NAV") of the Fund's Class A shares rose 2.01% for the six month period while the MSCI World Index declined 5.44%. The Fund's cash position decreased slightly from 6.2% at the end of October to 4.8% on April 30, 2009.
The five largest contributors to the performance of First Eagle Global Fund over the period were Gold bullion, Gold Fields Limited, ADR (gold mining, South Africa), Fresnillo PLC (gold & silver mining, Mexico), Newmont Mining Corporation (gold mining, U.S.) and Wharf Holdings Limited (real estate investment company, Hong Kong) collectively accounting for 4.11% of this period's performance.
The five largest detractors were San Juan Basin Royalty Trust (energy trust, U.S.), Berkshire Hathaway, Inc., Class 'A' (holding company, U.S.), Astellas Pharma, Inc. (pharmaceuticals, Japan), Toho Company Limited (motion picture distributor, Japan) and Pargesa Holding SA (holding company, Switzerland). Their combined negative performance over the six month period subtracted 2.24% from the Fund's performance.
In most instances, prices declined in the absence of changes in our estimates of business value. In some cases, the Fund seized the opportunity to add to the positions at prices we deemed attractive.
As of April 30, 2009, we were approximately 30% hedged on the Japanese yen as we believe Asian currencies should ultimately be revalued against the U.S. dollar. We also remained approximately 60% hedged on the euro.
FIRST EAGLE FUNDS | SEMI-ANNUAL REPORT | APRIL 30, 2009
8
First Eagle Global, Overseas, U.S. Value and Gold Funds
First Eagle Overseas Fund
The NAV of the Fund's Class A shares rose 1.96% for the six month period while the MSCI EAFE Index declined 2.64%. The Fund's cash position remained relatively unchanged during the six-month period at 7.7% on April 30, 2009.
The five largest contributors to the performance of First Eagle Overseas Fund over the period were Gold bullion, Gold Fields Limited, ADR (gold mining, South Africa), Wharf Holdings Limited (real estate investment company, Hong Kong), Newmont Mining Corporation (gold mining, U.S.) and Kuehne & Nagel International AG (freight transportation, Switzerland) collectively accounting for 3.80% of this period's performance.
The five largest detractors were Pargesa Holding SA (holding company, Switzerland), Astellas Pharma, Inc. (pharmaceuticals, Japan), T. Hasegawa Company Limited (flavors & fragrances, Japan), Toho Company Limited (motion picture distributor, Japan) and Laurent-Perrier (champagne, France). Their combined negative performance over the six month period subtracted 1.49% from the Fund's performance.
In most instances, prices declined in the absence of changes in our estimates of business value. In some cases, the Fund seized the opportunity to add to the positions at prices we deemed attractive.
As of April 30, 2009, we were approximately 30% hedged on the Japanese yen as we believe Asian currencies should ultimately be revalued against the U.S. dollar. We also remained approximately 60% hedged on the euro.
First Eagle U.S. Value Fund
The NAV of the Fund's Class A shares increased 1.23% for the six month period while the S&P 500 Index declined 8.53% and the Russell 2000 Index decreased 8.40%. The Fund's cash position decreased from 20.9% at the beginning of the period to 16.0% on April 30, 2009.
The five largest contributors to the performance of First Eagle U.S. Value Fund over the period were Gold bullion, Newmont Mining Corporation (gold mining), Barnes & Noble, Inc. (retail), Sirius XM Radio, Inc. (radio) and Rayonier, Inc., REIT (paper & forest products) collectively accounting for 3.69% of this period's performance.
FIRST EAGLE FUNDS | SEMI-ANNUAL REPORT | APRIL 30, 2009
9
Management's Discussion of Fund Performance (continued)
The five largest detractors were Berkshire Hathaway, Inc., Class 'A' (holding company), San Juan Basin Royalty Trust (energy trust), Blount International, Inc. (diversified manufacturing company), Beazer Homes USA, Inc. Corporate Bond (homebuilder) and ConocoPhillips (energy). Their combined negative performance over the six month period subtracted 3.32% from the Fund's performance.
First Eagle Gold Fund
The NAV of the Fund's Class A shares rose 40.87% for the six month period while the FTSE Gold Mines Index increased 51.47%. The Fund's cash position increased from 4.5% at the beginning of the period to 7.5% on April 30, 2009.
The five largest contributors to the performance of First Eagle Gold Fund over the period were Gold bullion, IAMGOLD Corporation (Canada), Randgold Resources Limited, ADR (Africa), Gold Fields Limited, ADR (South Africa) and Kinross Gold Corporation (Canada) collectively accounting for 22.47% of this period's performance.
The five largest detractors were NovaGold Resources (Canada), Dundee Precious Metals, Inc. (Canada), Anglo American PLC (U.K.), Gammon Gold (Canada) and Etruscan Resources, Inc. (Canada). Their combined negative performance over the six month period subtracted 1.51% from the Fund's performance.
We look at gold as insurance against "extreme outcomes." In the U.S., the current financial crisis is the worst since the Great Depression. The status of the U.S. dollar as the world's reserve currency is suspect, and the other major currencies (the euro, the yen) are not particularly appealing. There is a scarcity side to gold: as we pointed out a year ago, the value of all above ground gold is about 1% of the value of global real estate plus financial assets. From a long-term standpoint, we believe gold as insurance still makes sense.
FIRST EAGLE FUNDS | SEMI-ANNUAL REPORT | APRIL 30, 2009
10
First Eagle Global, Overseas, U.S. Value and Gold Funds
As always, we appreciate your confidence and thank you for your support.
Matthew McLennan
Global Value Team Lead
Portfolio Manager
Global, Overseas
and U.S. Value Funds
 | |  | |
|
| Abhay Deshpande | | Rachel Benepe | |
|
| Portfolio Manager | | Portfolio Manager | |
|
Global, Overseas,
Gold and U.S. Value Funds | | Gold Fund | |
|

Jean-Marie Eveillard
Senior Adviser
May 2009
Past performance is no guarantee of future results. The portfolio is actively managed. The portfolio and opinions expressed herein are subject to change. Current and future portfolio holdings are subject to risk.
FIRST EAGLE FUNDS | SEMI-ANNUAL REPORT | APRIL 30, 2009
11
Performance Chart1
| | | ONE-YEAR | | THREE-YEARS | | FIVE-YEARS | | TEN-YEARS | | SINCE
INCEPTION | | INCEPTION
DATE | |
| First Eagle Global Fund | |
| Class A (SGENX) | |
| without sales charge | | | -22.77 | % | | | -2.30 | % | | | 6.63 | % | | | 11.24 | % | | | 14.02 | % | | 01/01/792 | |
| with sales charge | | | -26.63 | | | | -3.96 | | | | 5.55 | | | | 10.81 | | | | 13.88 | | | 01/01/792 | |
| Class C (FESGX) | | | -24.12 | | | | -3.05 | | | | 5.84 | | | | — | | | | 10.32 | | | 06/05/00 | |
| Class I (SGIIX) | | | -22.57 | | | | -2.07 | | | | 6.90 | | | | 11.50 | | | | 10.87 | | | 07/31/98 | |
| MSCI World Index3 | | | -39.33 | | | | -11.54 | | | | -1.02 | | | | -1.57 | | | | 8.94 | | | 01/01/79 | |
| First Eagle Overseas Fund | |
| Class A (SGOVX) | |
| without sales charge | | | -25.21 | % | | | -4.24 | % | | | 6.64 | % | | | 11.64 | % | | | 11.32 | % | | 08/31/93 | |
| with sales charge | | | -28.95 | | | | -5.87 | | | | 5.55 | | | | 11.21 | | | | 11.05 | | | 08/31/93 | |
| Class C (FESOX) | | | -26.56 | | | | -4.98 | | | | 5.83 | | | | — | | | | 10.17 | | | 06/05/00 | |
| Class I (SGOIX) | | | -25.04 | | | | -4.01 | | | | 6.91 | | | | 11.88 | | | | 11.44 | | | 07/31/98 | |
| MSCI EAFE Index4 | | | -42.76 | | | | -12.34 | | | | 0.66 | | | | -0.04 | | | | 3.08 | | | 08/31/93 | |
| First Eagle U.S. Value Fund | |
| Class A (FEVAX) | |
| without sales charge | | | -19.69 | % | | | -1.94 | % | | | 3.67 | % | | | — | | | | 7.35 | % | | 09/04/01 | |
| with sales charge | | | -23.70 | | | | -3.60 | | | | 2.61 | | | | — | | | | 6.63 | | | 09/04/01 | |
| Class C (FEVCX) | | | -21.09 | | | | -2.69 | | | | 2.88 | | | | — | | | | 6.54 | | | 09/04/01 | |
| Class I (FEVIX) | | | -19.51 | | | | -1.72 | | | | 3.91 | | | | — | | | | 7.60 | | | 09/04/01 | |
Standard & Poor's
500 Index5 | | | -35.31 | | | | -10.76 | | | | -2.70 | | | | — | | | | -1.50 | | | 09/04/01 | |
| First Eagle Gold Fund | |
| Class A (SGGDX) | |
| without sales charge | | | -12.95 | % | | | 0.75 | % | | | 14.16 | % | | | 17.70 | % | | | 8.61 | % | | 08/31/93 | |
| with sales charge | | | -17.30 | | | | -0.96 | | | | 13.00 | | | | 17.26 | | | | 8.35 | | | 08/31/93 | |
| Class C (FEGOX) | | | -14.42 | | | | 0.02 | | | | 13.32 | | | | — | | | | 13.90 | | | 05/15/03 | |
| Class I (FEGIX) | | | -12.69 | | | | 1.03 | | | | 14.45 | | | | — | | | | 15.03 | | | 05/15/03 | |
| FTSE Gold Mines Index6 | | | -17.90 | | | | -5.17 | | | | 10.34 | | | | 8.29 | | | | 1.17 | | | 08/31/93 | |
| MSCI World Index3 | | | -39.33 | | | | -11.54 | | | | -1.02 | | | | -1.57 | | | | 4.18 | | | 08/31/93 | |
Please see the following pages for important notes to this table.
FIRST EAGLE FUNDS | SEMI-ANNUAL REPORT | APRIL 30, 2009
12
Average Annual Returns as of April 30, 2009 (unaudited)
| | | ONE-YEAR | | THREE-YEARS | | FIVE-YEARS | | TEN-YEARS | | SINCE
INCEPTION | | INCEPTION
DATE | |
| First Eagle Fund of America | |
| Class A (FEFAX) | |
| without sales charge | | | -31.35 | % | | | -4.93 | % | | | 1.71 | % | | | 3.47 | % | | | 4.74 | % | | 11/20/98 | |
| with sales charge | | | -34.79 | | | | -6.54 | | | | 0.67 | | | | 2.94 | | | | 4.23 | | | 11/20/98 | |
| Class C (FEAMX) | | | -32.55 | | | | -5.66 | | | | 0.97 | | | | 2.80 | | | | 4.23 | | | 03/02/98 | |
| Class Y (FEAFX)7 | | | -31.38 | | | | -4.95 | | | | 1.71 | | | | 3.56 | | | | 10.88 | | | 04/10/87 | |
Standard &Poor's
500 Index5 | | | -35.31 | | | | -10.76 | | | | -2.70 | | | | -2.48 | | | | 7.53 | | | 04/10/87 | |
1The performance data quoted herein represents past performance and does not guarantee future results. Market volatility can dramatically impact the Funds' short term performance. Current performance may be lower or higher than figures shown. The investment return and principal value will fluctuate so that an investor's shares, when redeemed, may be worth more or less than their original cost. Past performance data through the most recent month end is available at www.firsteaglefunds.com or by calling (800) 334-2143. The average annual returns shown on the prior page are historical and reflect changes in share price, reinvested dividends and are net of expenses. The average annual returns for Class A Shares "with sales charge" of First Eagle Global Fund, First Eagle Overseas Fund and First Eagle Gold Fund give effect to the deduction of the maximum sales charge of 3.75% for periods prior to March 1, 2000 and of 5.00% the reafter. The average annual returns for Class A Shares "with sales charge" of First Eagle U.S. Value Fund and First Eagle Fund of America give effect to the deduction of the maximum sales charge of 5.00%.
The average annual returns for Class C Shares reflect the CDSC (Contingent Deferred Sales Charge) of 1.00% which pertains to the first year or less of investment only.
Class I Shares of First Eagle Global Fund, First Eagle Overseas Fund, First Eagle U.S. Value Fund, and First Eagle Gold Fund require $1mm minimum investment and are offered without charge.
Class Y Shares of First Eagle Fund of America are offered without charge.
2Commencement of management by Jean-Marie Eveillard. Mr. Eveillard transitioned to senior adviser on March 26, 2009, a position he also held from January 2005 to March 2007, and continues to be a member of First Eagle Fund's Board of Trustees and a Senior Vice President of Arnhold and S. Bleichroeder Advisers, LLC. The Fund commenced operations on April 28, 1970.
3The MSCI World Index is a widely followed, unmanaged group of stocks from 23 international markets and is not available for purchase. The index provides total returns in U.S. dollars with net dividends reinvested.
4The MSCI EAFE Index is a total return index, reported in U.S. dollars, based on share prices and reinvested net dividends of approximately 1,100 companies from 21 countries and is not available for purchase.
Please see the following page for important notes to this table.
FIRST EAGLE FUNDS | SEMI-ANNUAL REPORT | APRIL 30, 2009
13
Performance Chart (continued)
5The Standard & Poor's 500 Index is a widely recognized unmanaged index including a representative sample of 500 leading companies in leading sectors of the U.S. economy and is not available for purchase. Although the Standard & Poor's 500 Index focuses on the large-cap segment of the market, with approximately 75% coverage of U.S. equities, it is also considered a proxy for the total market.
6The FTSE Gold Mines Index is an unmanaged index composed of approximately 19 mining companies and is only available without dividends reinvested and is not available for purchase.
7As of September 1, 2005 First Eagle Fund of America Class Y is closed to new accounts.
Expense Ratios As Stated In The Most Recent Prospectus
Total Annual Gross Operating Expense Ratios
| | | CLASS A | | CLASS I | | CLASS C | | CLASS Y | |
| First Eagle Global Fund | | | 1.14 | % | | | 0.89 | % | | | 1.89 | % | | | — | % | |
| First Eagle Overseas Fund | | | 1.15 | | | | 0.90 | | | | 1.90 | | | | — | | |
| First Eagle U.S. Value Fund | | | 1.21 | | | | 0.96 | | | | 1.96 | | | | — | | |
| First Eagle Gold Fund | | | 1.21 | | | | 0.96 | | | | 1.96 | | | | — | | |
| First Eagle Fund of America | | | 1.42 | | | | — | | | | 2.17 | | | | 1.42 | | |
These expense ratios are presented as of October 31, 2008 and may differ from corresponding ratios shown elsewhere in this report because of differing time periods (and/or, if applicable, because these expense ratios do not include expense credits or waivers).
FIRST EAGLE FUNDS | SEMI-ANNUAL REPORT | APRIL 30, 2009
14
This page was intentionally left blank.

Fund Overview | Data as of April 30, 2009 (unaudited)
INVESTMENT OBJECTIVE
First Eagle Global Fund seeks long-term growth of capital by investing in a wide range of asset classes from markets in the United States and around the world. This truly global fund is managed with a highly disciplined, bottom-up, value oriented style that may help to minimize risk.
Average Annual Returns
| | | ONE-YEAR | | FIVE-YEARS | | TEN-YEARS | |
First Eagle Global
Fund (A Shares) | |
| without sales charge | | | -22.77 | % | | | 6.63 | % | | | 11.24 | % | |
| with sales charge | | | -26.63 | | | | 5.55 | | | | 10.81 | | |
| MSCI World Index | | | -39.33 | | | | -1.02 | | | | -1.57 | | |
| Consumer Price Index | | | -0.74 | | | | 2.55 | | | | 2.52 | | |
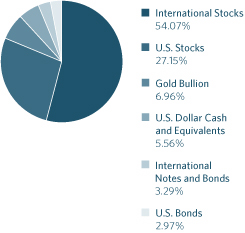
Asset Allocation
Countries
| United States | | | 37.08 | % | |
| Japan | | | 23.26 | | |
| France | | | 12.82 | | |
| Switzerland | | | 5.07 | | |
| Singapore | | | 1.87 | | |
| Germany | | | 1.86 | | |
| South Africa | | | 1.85 | | |
| Italy | | | 1.67 | | |
| Hong Kong | | | 1.64 | | |
| Mexico | | | 1.51 | | |
| South Korea | | | 1.12 | | |
| United Kingdom | | | 0.96 | | |
| Malaysia | | | 0.81 | | |
| Netherlands | | | 0.81 | | |
| Taiwan | | | 0.71 | | |
| Brazil | | | 0.51 | | |
| Thailand | | | 0.46 | | |
| Panama | | | 0.16 | | |
| Canada | | | 0.09 | | |
| Chile | | | 0.08 | | |
| Norway | | | 0.06 | | |
| Belgium | | | 0.03 | | |
| Jersey | | | 0.01 | | |
The Fund's portfolio composition (represented as a percentage of net assets) is subject to change at any time.
FIRST EAGLE FUNDS | SEMI-ANNUAL REPORT | APRIL 30, 2009
16
Global Fund
Growth of a $10,000 Initial Investment
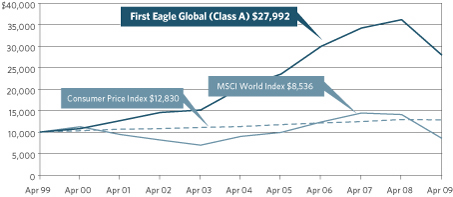
Performance data quoted herein represents past performance and should not be considered indicative of future results. Performance data quoted herein does not reflect the deduction of taxes that a shareholder would pay on Fund distributions or the sale of Fund shares. The average annual returns shown above are historical and reflect changes in share price, reinvested dividends and are net of expenses.
The average annual returns for Class A Shares give effect to the deduction of the maximum sales charge of 3.75% for periods prior to March 1, 2000 and of 5.00% thereafter.
The MSCI World Index is a widely followed, unmanaged group of stocks from 23 international markets and is not available for purchase. The index provides total returns in U.S. dollars with net dividends reinvested. The Consumer Price Index (CPI) represents the change in price of all goods and services purchased for consumption by urban households.
Top 10 Holdings
| Gold Bullion (precious metal) | | | 6.96 | % | |
| Berkshire Hathaway, Inc., Class 'A' (U.S. holding company) | | | 2.71 | | |
| Fanuc Limited (Japanese industrial manufacturing company) | | | 2.48 | | |
| SMC Corporation (Japanese automated control devices manufacturer) | | | 2.47 | | |
| Secom Company Limited (Japanese security services provider) | | | 2.25 | | |
| Sanofi-Aventis SA (French health care company) | | | 1.91 | | |
| Sodexo (French food management services provider) | | | 1.84 | | |
| Keyence Corporation (Japanese sensors manufacturer) | | | 1.79 | | |
| Aioi Insurance Company Limited (Japanese insurance company) | | | 1.78 | | |
| Cintas Corporation (U.S. uniform designer and manufacturer) | | | 1.73 | | |
FIRST EAGLE FUNDS | SEMI-ANNUAL REPORT | APRIL 30, 2009
17
First Eagle Global Fund
| NUMBER OF SHARES | | DESCRIPTION | | COST (NOTE 1) | | VALUE (NOTE 1) | |
| Common Stocks—80.21% | | | |
| U.S. Common Stocks—27.06% | | | |
| Consumer Discretionary 6.57% | | | |
| | 10,768,581 | | | Cintas Corporation (a) | | $ | 380,345,326 | | | $ | 276,321,788 | | |
| | 5,304,276 | | | Barnes & Noble, Inc. (a) | | | 142,425,487 | | | | 138,547,689 | | |
| | 2,572,580 | | | Costco Wholesale Corporation | | | 98,858,810 | | | | 125,027,388 | | |
| | 8,316,595 | | | Comcast Corporation , Class 'A' | | | 147,903,820 | | | | 122,087,615 | | |
| | 4,463,150 | | | Home Depot, Inc. | | | 110,672,383 | | | | 117,470,108 | | |
| | 3,013,150 | | | Omnicom Group, Inc. | | | 77,356,445 | | | | 94,823,830 | | |
| | 1,966,900 | | | Tiffany & Company | | | 49,748,172 | | | | 56,922,086 | | |
| | 1,111,175 | | | Wal-Mart Stores, Inc. | | | 51,029,419 | | | | 56,003,220 | | |
| | 1,381,358 | | | Unifirst Corporation | | | 30,865,195 | | | | 51,510,840 | | |
| | 241,530 | | | Weyco Group, Inc. | | | 712,328 | | | | 6,629,999 | | |
| | 2,485 | | | JG Boswell Company (b) | | | 573,840 | | | | 1,354,325 | | |
| | 185,000 | | | St. John Knits
International, Inc. (b)(c) | | | 3,180,703 | | | | 749,250 | | |
| | | | | | | | 1,093,671,928 | | | | 1,047,448,138 | | |
| Energy 2.86% | | | |
| | 2,407,091 | | | Apache Corporation | | | 164,692,743 | | | | 175,380,650 | | |
| | 2,536,293 | | | ConocoPhillips | | | 116,539,901 | | | | 103,988,013 | | |
| | 2,327,880 | | | Helmerich & Payne, Inc. | | | 57,215,205 | | | | 71,745,262 | | |
| | 3,975,644 | | | San Juan Basin Royalty Trust (a) | | | 141,567,358 | | | | 56,493,901 | | |
| | 1,008,530 | | | Murphy Oil Corporation | | | 39,438,919 | | | | 48,116,966 | | |
| | | | | | | | 519,454,126 | | | | 455,724,792 | | |
| Financials 4.18% | | | |
| | 4,599 | | | Berkshire Hathaway, Inc. ,
Class 'A' (c) | | | 392,199,945 | | | | 432,306,000 | | |
| | 9,253,133 | | | American Express Company | | | 397,945,907 | | | | 233,364,014 | | |
| | 34,924 | | | Mills Music Trust (a)(b) | | | 1,055,337 | | | | 699,179 | | |
| | 192,250 | | | LandCo Real Estate LLC (b)(c)(d)(e) | | | 669,030 | | | | 669,030 | | |
| | 21,124 | | | Security Capital European
Realty (b)(c)(d) | | | — | | | | — | | |
| | | | | | | | 791,870,219 | | | | 667,038,223 | | |
| Health Care 1.02% | | | |
| | 2,499,370 | | | WellPoint, Inc. (c) | | | 118,103,478 | | | | 106,873,061 | | |
| | 1,059,980 | | | Johnson & Johnson | | | 59,610,842 | | | | 55,500,553 | | |
| | | | | | | | 177,714,320 | | | | 162,373,614 | | |
See Notes to Financial Statements.
18
Schedule of Investments | Six-Month Period Ended April 30, 2009 (unaudited)
| NUMBER OF SHARES | | DESCRIPTION | | COST (NOTE 1) | | VALUE (NOTE 1) | |
| U.S. Common Stocks—27.06%—(continued) | |
| Industrials 2.78% | |
| | 4,564,980 | | | 3M Company | | $ | 364,617,757 | | | $ | 262,942,848 | | |
| | 1,474,890 | | | Alliant Techsystems, Inc. (c) | | | 158,314,106 | | | | 117,474,989 | | |
| | 9,778,961 | | | Blount International, Inc. (a)(c) | | | 127,911,050 | | | | 62,585,350 | | |
| | 4,169 | | | Conbraco Industries, Inc. (a)(b)(c) | | | 1,258,498 | | | | 604,505 | | |
| | | | | | 652,101,411 | | | | 443,607,692 | | |
| Information Technology 2.95% | |
| | 11,770,017 | | | Microsoft Corporation | | | 289,344,087 | | | | 238,460,544 | | |
| | 5,821,360 | | | Linear Technology Corporation | | | 163,252,124 | | | | 126,789,221 | | |
| | 6,694,310 | | | Intel Corporation | | | 91,240,768 | | | | 105,636,212 | | |
| | | | | | 543,836,979 | | | | 470,885,977 | | |
| Materials 5.38% | |
| | 6,493,622 | | | Rayonier, Inc. , REIT (a) | | | 149,477,283 | | | | 250,783,681 | | |
| | 5,603,662 | | | Newmont Mining Corporation | | | 228,913,155 | | | | 225,491,359 | | |
| | 3,676,750 | | | Newmont Mining Corporation, CDI | | | 3,394,059 | | | | 14,985,255 | | |
| | 3,987,548 | | | Plum Creek Timber
Company, Inc. , REIT | | | 147,118,846 | | | | 137,650,157 | | |
| | 2,784,350 | | | Weyerhaeuser Company | | | 124,714,724 | | | | 98,176,181 | | |
| | 1,655,620 | | | Vulcan Materials Company | | | 110,867,265 | | | | 78,724,731 | | |
| | 1,258,500 | | | Deltic Timber Corporation (a) | | | 62,903,243 | | | | 53,033,190 | | |
| | | | | | 827,388,575 | | | | 858,844,554 | | |
| Telecommunication Services 0.65% | |
| | 5,391,150 | | | Cisco Systems, Inc. (c) | | | 86,351,072 | | | | 104,157,018 | | |
| Utilities 0.67% | |
| | 4,440,260 | | | IDACorporation, Inc. (a) | | | 148,334,642 | | | | 106,433,032 | | |
| Total U.S. Common Stocks | | | | | 4,840,723,272 | | | | 4,316,513,040 | | |
| International Common Stocks—53.15% | |
| Belgium 0.03% | |
| | 1,863,159 | | | Deceuninck NV (a) | | | 44,135,320 | | | | 5,552,027 | | |
| Brazil 0.51% | |
| | 3,031,450 | | | Petroleo Brasileiro SA , ADR | | | 50,673,221 | | | | 81,788,521 | | |
| Canada 0.07% | |
| | 2,628,490 | | | Harry Winston Diamond
Corporation | | | 66,744,399 | | | | 11,031,401 | | |
| Chile 0.08% | |
| | 7,600,803 | | | Quinenco SA (b) | | | 5,676,192 | | | | 13,458,530 | | |
See Notes to Financial Statements.
19
Global Fund
| NUMBER OF SHARES | | DESCRIPTION | | COST (NOTE 1) | | VALUE (NOTE 1) | |
| International Common Stocks—53.15%—(continued) | | | |
| France 12.52% | | | |
| | 5,259,547 | | | Sanofi-Aventis SA | | $ | 415,745,822 | | | $ | 304,890,576 | | |
| | 6,059,452 | | | Sodexo | | | 204,703,427 | | | | 292,837,254 | | |
| | 2,943,836 | | | Neopost SA (a) | | | 284,754,430 | | | | 250,596,390 | | |
| | 5,398,259 | | | Cie Generale d'Optique Essilor
International SA | | | 243,531,070 | | | | 234,073,099 | | |
| | 4,530,023 | | | Carrefour SA | | | 282,483,345 | | | | 185,326,459 | | |
| | 5,361,738 | | | Remy Cointreau SA (a) | | | 250,320,035 | | | | 178,095,208 | | |
| | 2,307,233 | | | Société BIC SA | | | 125,700,859 | | | | 124,290,556 | | |
| | 1,429,334 | | | Air Liquide SA | | | 160,589,540 | | | | 117,092,115 | | |
| | 2,095,213 | | | Total SA | | | 116,415,367 | | | | 106,403,530 | | |
| | 2,299,271 | | | Wendel | | | 133,700,715 | | | | 85,401,347 | | |
| | 541,213 | | | Guyenne et Gascogne SA (a) | | | 72,303,381 | | | | 47,307,638 | | |
| | 63,019 | | | Sucrière de Pithiviers-Le-Vieil (a) | | | 35,947,627 | | | | 39,644,617 | | |
| | 165,085 | | | Robertet SA | | | 21,842,347 | | | | 14,867,421 | | |
| | 42,252 | | | Robertet SA CI (b) | | | 800,508 | | | | 2,797,927 | | |
| | 104,457 | | | Gaumont SA | | | 6,087,824 | | | | 5,536,480 | | |
| | 385,000 | | | Sabeton SA (a) | | | 4,841,233 | | | | 5,358,985 | | |
| | 69,500 | | | NSC Groupe (a)(b) | | | 12,298,421 | | | | 2,485,236 | | |
| | | | | | | | 2,372,065,951 | | | | 1,997,004,838 | | |
| Germany 1.56% | | | |
| | 2,556,816 | | | Fraport AG | | | 108,879,985 | | | | 103,449,835 | | |
| | 1,172,304 | | | Pfeiffer Vacuum | | | 105,767,273 | | | | 78,219,948
Technology AG (a) | | |
| | 2,464,510 | | | Tognum AG | | | 26,236,180 | | | | 30,224,608 | | |
| | 1,337,532 | | | Bertelsmann AG , Series 'A' (f) | | | 33,414,943 | | | | 24,268,552 | | |
| | 386,842 | | | Hornbach Baumarkt AG | | | 21,504,161 | | | | 12,808,337 | | |
| | | | | | | | 295,802,542 | | | | 248,971,280 | | |
| Hong Kong 1.64% | | | |
| | 55,141,450 | | | Wharf Holdings Limited | | | 147,882,908 | | | | 183,210,732 | | |
| | 12,693,580 | | | Guoco Group Limited | | | 115,086,260 | | | | 78,126,433 | | |
| | 20,738,780 | | | City e-Solutions Limited (a)(b)(c) | | | 936,898 | | | | 963,344 | | |
| | | | | | | | 263,906,066 | | | | 262,300,509 | | |
See Notes to Financial Statements.
20
Schedule of Investments | Six-Month Period Ended April 30, 2009 (unaudited)
| NUMBER OF SHARES | | DESCRIPTION | | COST (NOTE 1) | | VALUE (NOTE 1) | |
| International Common Stocks—53.15%—(continued) | | | |
| Italy 1.67% | | | |
| | 18,139,395 | | | Italcementi S.p.A. RSP | | $ | 249,186,230 | | | $ | 116,035,009 | | |
| | 4,682,069 | | | Italcementi S.p.A. | | | 86,201,872 | | | | 57,079,573 | | |
| | 1,734,972 | | | Italmobiliare S.p.A. RSP | | | 121,356,934 | | | | 42,509,237 | | |
| | 1,021,137 | | | Italmobiliare S.p.A. | | | 107,360,738 | | | | 39,070,653 | | |
| | 3,067,773 | | | Gewiss S.p.A. | | | 18,442,735 | | | | 11,376,283 | | |
| | | | | | | | 582,548,509 | | | | 266,070,755 | | |
| Japan 23.13% | | | |
| | 5,524,780 | | | Fanuc Limited | | | 472,265,654 | | | | 395,866,977 | | |
| | 4,053,720 | | | SMC Corporation (a) | | | 474,941,650 | | | | 394,402,676 | | |
| | 9,712,830 | | | Secom Company Limited | | | 441,193,277 | | | | 358,312,569 | | |
| | 1,617,690 | | | Keyence Corporation | | | 323,870,015 | | | | 284,780,331 | | |
| | 64,994,300 | | | Aioi Insurance Company
Limited (a) | | | 312,994,683 | | | | 284,560,024 | | |
| | 8,089,020 | | | Astellas Pharma, Inc. | | | 332,426,725 | | | | 263,157,537 | | |
| | 5,211,900 | | | Ono Pharmaceutical
Company Limited | | | 237,044,527 | | | | 220,793,980 | | |
| | 7,086,170 | | | Shimano, Inc. (a) | | | 164,314,591 | | | | 207,550,738 | | |
| | 14,646,430 | | | MISUMI Group, Inc. (a) | | | 256,798,648 | | | | 196,681,056 | | |
| | 14,072,800 | | | THK Company Limited (a) | | | 262,374,634 | | | | 193,542,005 | | |
| | 1,579,510 | | | Hirose Electric Company Limited | | | 175,236,917 | | | | 163,761,906 | | |
| | 4,567,060 | | | Canon, Inc. | | | 218,295,606 | | | | 136,544,309 | | |
| | 10,972,000 | | | Kirin Holdings Company Limited | | | 145,500,358 | | | | 120,428,458 | | |
| | 7,791,760 | | | Toho Company Limited | | | 133,461,584 | | | | 102,974,106 | | |
| | 14,391,850 | | | Sompo Japan Insurance, Inc. | | | 152,635,615 | | | | 85,764,749 | | |
| | 3,501,380 | | | Chofu Seisakusho Company
Limited (a) | | | 63,721,317 | | | | 64,229,227 | | |
| | 5,147,000 | | | T. Hasegawa Company Limited (a) | | | 79,849,658 | | | | 53,259,218 | | |
| | 2,719,100 | | | Meitec Corporation (a) | | | 79,203,905 | | | | 36,706,610 | | |
| | 3,461,892 | | | Nissin Healthcare Food Service
Company Limited | | | 47,886,384 | | | | 32,699,740 | | |
| | 1,505,600 | | | Shimachu Company Limited | | | 36,098,733 | | | | 26,214,866 | | |
| | 1,725,100 | | | Ariake Japan Company Limited (a) | | | 29,754,119 | | | | 23,620,250 | | |
| | 2,002,100 | | | Seikagaku Corporation | | | 21,143,745 | | | | 19,073,416 | | |
| | 2,567,150 | | | Nipponkoa Insurance
Company Limited | | | 8,856,912 | | | | 13,893,363 | | |
| | 175,240 | | | Mabuchi Motor Company Limited | | | 10,233,214 | | | | 7,903,294 | | |
| | 271,100 | | | Aderans Holdings
Company Limited | | | 6,159,738 | | | | 2,599,175 | | |
| | | | | | | | 4,486,262,209 | | | | 3,689,320,580 | | |
See Notes to Financial Statements.
21
Global Fund
| NUMBER OF SHARES | | DESCRIPTION | | COST (NOTE 1) | | VALUE (NOTE 1) | |
| International Common Stocks—53.15%—(continued) | | | |
| Malaysia 0.81% | | | |
| | 98,012,905 | | | Genting Berhad | | $ | 207,219,051 | | | $ | 128,848,426 | | |
| Mexico 1.51% | | | |
| | 16,559,243 | | | Fresnillo PLC | | | 131,822,209 | | | | 131,089,444 | | |
| | 9,745,693 | | | Industrias Peñoles S.A.B. de C.V. | | | 17,199,241 | | | | 105,339,863 | | |
| | 1,746,840 | | | Grupo Televisa S.A.B. CPO | | | 5,488,500 | | | | 5,378,668 | | |
| | | | | | | | 154,509,950 | | | | 241,807,975 | | |
| Netherlands 0.33% | | | |
| | 2,199,913 | | | Heineken Holding NV | | | 64,244,115 | | | | 52,356,752 | | |
| Panama 0.16% | | | |
| | 2,036,652 | | | Banco Latinoamericano de
Exportaciones SA (a) | | | 33,554,517 | | | | 25,050,820 | | |
| Singapore 0.43% | | | |
| | 4,246,220 | | | United Overseas Bank Limited | | | 49,821,426 | | | | 32,999,851 | | |
| | 12,704,120 | | | Fraser and Neave Limited | | | 12,799,700 | | | | 22,493,526 | | |
| | 13,467,250 | | | ComfortDelgro Corporation
Limited | | | 3,279,184 | | | | 12,923,464 | | |
| | 20,890 | | | UOL Group Limited | | | 28,240 | | | | 31,340 | | |
| | | | | | | | 65,928,550 | | | | 68,448,181 | | |
| South Africa 1.85% | | | |
| | 21,587,580 | | | Gold Fields Limited , ADR | | | 255,003,062 | | | | 224,510,832 | | |
| | 749,210 | | | Gold Fields Limited | | | 2,173,737 | | | | 7,825,353 | | |
| | 5,676,147 | | | Harmony Gold Mining Company
Limited , ADR (c) | | | 55,528,431 | | | | 52,901,690 | | |
| | 1,000,000 | | | Harmony Gold Mining Company
Limited (c) | | | 4,591,642 | | | | 9,340,623 | | |
| | | | | | | | 317,296,872 | | | | 294,578,498 | | |
| South Korea 0.39% | | | |
| | 51,900 | | | Lotte Confectionery | | | 21,157,499 | | | | 41,665,628
Company Limited | | |
| | 39,989 | | | Namyang Dairy Products
Company Limited (a) | | | 7,325,466 | | | | 15,958,198 | | |
| | 740,720 | | | Daeduck GDS Company Limited | | | 4,554,227 | | | | 4,018,247 | | |
| | | | | | | | 33,037,192 | | | | 61,642,073 | | |
| Switzerland 5.07% | | | |
| | 3,783,070 | | | Pargesa Holding SA | | | 237,781,696 | | | | 241,581,916 | | |
| | 3,086,146 | | | Kuehne & Nagel International AG | | | 139,997,099 | | | | 234,409,669 | | |
| | 5,417,450 | | | Nestlé SA | | | 135,598,090 | | | | 177,415,789 | | |
See Notes to Financial Statements.
22
Schedule of Investments | Six-Month Period Ended April 30, 2009 (unaudited)
| NUMBER OF SHARES | | DESCRIPTION | | COST (NOTE 1) | | VALUE (NOTE 1) | |
| International Common Stocks—53.15%—(continued) | |
| Switzerland 5.07%—(continued) | |
| | 4,280 | | | Lindt & Spruengli AG | | $ | 128,261,246 | | | $ | 82,257,188 | | |
| | 40,274 | | | Lindt & Spruengli AG PC | | | 67,067,587 | | | | 64,958,064 | | |
| | 39,740 | | | Edipresse SA | | | 10,811,874 | | | | 7,663,745 | | |
| | | | | | 719,517,592 | | | | 808,286,371 | | |
| Thailand 0.46% | |
| | 26,375,300 | | | Bangkok Bank PCL NVDR | | | 84,757,791 | | | | 63,545,933 | | |
| | 448,850 | | | Bangkok Bank PCL | | | 1,459,292 | | | | 1,090,955 | | |
| | 577,000 | | | OHTL PCL (b) | | | 3,451,517 | | | | 8,210,147 | | |
| | | | | | 89,668,600 | | | | 72,847,035 | | |
| United Kingdom 0.93% | |
| | 3,238,610 | | | Willis Group Holdings Limited | | | 96,652,950 | | | | 89,094,161 | | |
| | 2,714,983 | | | Anglo American PLC | | | 62,810,160 | | | | 59,617,598 | | |
| | | | | | 159,463,110 | | | | 148,711,759 | | |
| Total International Common Stocks | | | | | 10,012,253,958 | | | | 8,478,076,331 | | |
| Total Common Stocks | | | | | 14,852,977,230 | | | | 12,794,589,371 | | |
| Preferred Stocks—1.01% | |
| U.S. Preferred Stocks—0.09% | |
| Financials 0.01% | |
| | 137,410 | | | Price Legacy Corporation,
Series '1' REIT (b) | | | 1,339,514 | | | | 965,305 | | |
| Utilities 0.08% | |
| | 335,000 | | | Calenergy Capital Trust III (b) | | | 14,782,812 | | | | 13,400,000 | | |
| Total U.S. Preferred Stocks | | | | | 16,122,326 | | | | 14,365,305 | | |
| International Preferred Stocks—0.92% | |
| Germany 0.30% | |
| | 877,242 | | | Hornbach Holding AG | | | 63,837,360 | | | | 47,727,531 | | |
| South Korea 0.62% | |
| | 384,890 | | | Samsung Electronics
Company Limited | | | 58,999,278 | | | | 99,597,412 | | |
| Total International Preferred Stocks | | | | | 122,836,638 | | | | 147,324,943 | | |
| Total Preferred Stocks | | | | | 138,958,964 | | | | 161,690,248 | | |
| OUNCES | | | | | | | |
| Commodity—6.96% | |
| | 1,249,002 | | | Gold bullion (c) | | | 693,749,790 | | | | 1,109,925,515 | | |
See Notes to Financial Statements.
23
Global Fund
| PRINCIPAL AMOUNT | | DESCRIPTION | | COST (NOTE 1) | | VALUE (NOTE 1) | |
| Notes and Bonds—6.26% | | | |
| U.S. Bonds—2.97% | | | |
| Corporate Bonds 0.94% | | | |
| | $4,910,000
| | | American Standard, Inc.
8.25% due 6/1/2009 | | | $4,914,922
| | | | $4,921,205
| | |
| | 2,810,655 | | | Avis Budget Car Rental LLC
7.625% due 5/15/2014 | | | 2,763,541 | | | | 815,090 | | |
| | 5,467,000 | | | Bausch & Lomb, Inc.
7.125% due 8/1/2028 (b) | | | 4,706,604 | | | | 1,640,100 | | |
| | 28,930,000 | | | Blount, Inc.
8.875% due 8/1/2012 | | | 28,946,625 | | | | 28,206,750 | | |
| | 6,900,000 | | | Briggs & Stratton Corporation
8.875% due 3/15/2011 | | | 7,021,716 | | | | 6,951,750 | | |
| | 13,500,000 | | | GATX Financial Corporation
8.875% due 6/1/2009 | | | 13,484,646 | | | | 13,523,085 | | |
| | 11,000,000 | | | Level 3 Financing, Inc.
9.25% due 11/1/2014 | | | 10,682,131 | | | | 8,868,750 | | |
| | 5,000,000 | | | Pulte Homes, Inc.
5.20% due 2/15/2015 | | | 4,228,008 | | | | 4,225,000 | | |
| | 12,522,000 | | | Sirius XM Radio, Inc.
9.625% due 8/1/2013 | | | 12,303,258 | | | | 7,575,810 | | |
| | 8,073,000 | | | Texas Industries, Inc.
7.25% due 7/15/2013 (g) | | | 5,914,516 | | | | 6,599,677 | | |
| | 2,794,000 | | | Texas Industries, Inc.
7.25% due 7/15/2013 | | | 2,049,689 | | | | 2,284,095 | | |
| | 3,500,000 | | | Toys R US, Inc.
7.625% due 8/1/2011 | | | 3,464,831 | | | | 2,380,000 | | |
| | 57,142,000 | | | Tronox Worldwide LLC
9.50% due 12/1/2012 (h) | | | 43,266,004 | | | | 9,999,850 | | |
| | 28,622,000 | | | Valassis Communications, Inc.
8.25% due 3/1/2015 | | | 26,414,757 | | | | 15,956,765 | | |
| | 12,554,000 | | | Yankee Acquisition Corporation,
Series 'B' 8.50% due 2/15/2015 | | | 12,462,771 | | | | 8,913,340 | | |
| | 22,554,000 | | | Yankee Acquisition Corporation,
Series 'B' 9.75% due 2/15/2017 | | | 21,795,006 | | | | 14,660,100 | | |
| | 220,588 | | | The Yankee Candle Company, Inc.
2.44% due 2/6/2014 | | | 142,909 | | | | 180,882 | | |
| | 14,933,556 | | | The Yankee Candle Company, Inc.
3.22% due 2/6/2014 | | | 9,670,106 | | | | 12,245,516 | | |
| | | | | | | | 214,232,040 | | | | 149,947,765 | | |
| Government Obligations 1.86% | | | |
| | 77,202,627 | | | United States Treasury
Inflation Indexed Bond
1.875% due 7/15/2013 (i) | | | 80,059,452 | | | | 78,770,766 | | |
See Notes to Financial Statements.
24
Schedule of Investments | Six-Month Period Ended April 30, 2009 (unaudited)
| PRINCIPAL AMOUNT | | DESCRIPTION | | COST (NOTE 1) | | VALUE (NOTE 1) | |
| U.S. Bonds—2.97%—(continued) | |
| Government Obligations 1.86%—(continued) | |
$132,920,572
| | United States Treasury
Inflation Indexed Bond
2.375% due 4/15/2011 (i) | | | $135,810,700
| | | | $135,869,814
| | |
| | 79,399,495 | | | United States Treasury
Inflation Indexed Bond
4.25% due 1/15/2010 (i) | | | 80,333,099 | | | | 81,235,608 | | |
| | | | | | 296,203,251 | | | | 295,876,188 | | |
| Convertible Bond 0.17% | |
| | 34,617,000 | | | Boston Properties LP, REIT
3.625% due 2/15/2014 (g) | | | 24,206,363 | | | | 27,607,057 | | |
| Total U.S. Bonds | | | | | 534,641,654 | | | | 473,431,010 | | |
| International Notes and Bonds—3.29% | |
| International Corporate Notes and Bonds—0.90% | |
| Canada 0.02% | |
33,260,000
USD | | CanWest LP
9.25% due 8/1/2015 (b)(g) | | | 28,951,677
| | | | 3,242,850
| | |
| France 0.30% | |
12,000,000
EUR | | FINEL 9.50%
due 6/30/2017 (b)(c)(d)(e)(h) | | | 14,474,400
| | | | —
| | |
15,000,000
EUR | | FINEL 9.50%
due 10/15/2017 (b)(c)(d)(e)(h) | | | 18,067,500
| | | | —
| | |
7,938,000
USD | | Lafarge SA 6.50%
due 7/15/2016 | | | 5,511,489
| | | | 5,899,426
| | |
2,000,000
USD | | Legrand SA 8.50%
due 2/15/2025 | | | 1,958,289
| | | | 1,594,152
| | |
12,050,000
EUR | | Wendel 4.375%
due 8/9/2017 | | | 10,133,631
| | | | 10,054,181
| | |
330,000
EUR | | Wendel 4.875%
due 11/4/2014 | | | 250,364
| | | | 295,010
| | |
10,000,000
EUR | | Wendel 4.875%
due 9/21/2015 (j) | | | 9,529,962
| | | | 8,807,259
| | |
3,500,000
EUR | | Wendel 4.875%
due 5/26/2016 | | | 2,266,682
| | | | 2,966,656
| | |
15,471,000
EUR | | Wendel 5.00%
due 2/16/2011 | | | 15,607,235
| | | | 18,748,158
| | |
| | | | | | 77,799,552 | | | | 48,364,842 | | |
| Ireland — 0.00% | |
13,650,000
EUR
| | Waterford Wedgwood PLC
9.875% due 12/1/2010
(b)(d)(g)(h) | | | 16,339,337
| | | | —
| | |
See Notes to Financial Statements.
25
Global Fund
| PRINCIPAL AMOUNT | | DESCRIPTION | | COST (NOTE 1) | | VALUE (NOTE 1) | |
| International Corporate Notes and Bonds—0.90%—(continued) | |
| Jersey 0.01% | |
2,500,000
EUR
| | Independent News &
Media Finance Limited
5.75% due 5/17/2009 | | | $2,918,970
| | | | $1,821,050
| | |
| Netherlands 0.48% | |
39,700,000
EUR | | UPC Holding BV 7.75%
due 1/15/2014 (j) | | | 46,296,203
| | | | 47,583,699
| | |
22,660,000
EUR | | UPC Holding BV 8.625%
due 1/15/2014 (j) | | | 26,654,625
| | | | 27,910,137
| | |
| | | | | | 72,950,828 | | | | 75,493,836 | | |
| Norway 0.06% | |
5,500,000
USD | | Den Norske Bank ASA FRN
1.938% due 8/28/2009 (b) | | | 3,888,750
| | | | 2,876,555
| | |
3,170,000
USD | | Den Norske Creditbank FRN
1.563% due 5/29/2009 (b) | | | 2,059,625
| | | | 1,505,592
| | |
3,500,000
USD | | Den Norske Creditbank FRN
2.025% due 8/31/2009 (b) | | | 2,610,000
| | | | 1,806,038
| | |
10,000,000
USD | | Nordea Bank Norge ASA FRN
2.783% due 5/18/2009 (b) | | | 6,826,750
| | | | 3,238,880
| | |
| | | | | | 15,385,125 | | | | 9,427,065 | | |
| United Kingdom 0.03% | |
3,000,000
GBP | | Marks & Spencer PLC
6.375% due 11/7/2011 | | | 5,265,700
| | | | 4,490,653
| | |
| Total International Corporate Notes and Bonds | | | | | 219,611,189 | | | | 142,840,296 | | |
| International Government Bonds—2.39% | |
| Japan 0.13% | |
2,196,478,800
JPY | | Japanese Government CPI Linked
Bond 1.40% due 6/10/2018 (i) | | | 20,176,060
| | | | 19,502,025
| | |
| Singapore 1.44% | |
52,947,000
SGD | | Singapore Government Bond
2.375% due 10/1/2009 | | | 32,470,112
| | | | 36,096,132
| | |
60,827,000
SGD | | Singapore Government Bond
3.625% due 7/1/2011 | | | 44,904,705
| | | | 43,896,890
| | |
211,030,000
SGD | | Singapore Government Bond
4.625% due 7/1/2010 | | | 147,279,231
| | | | 149,754,789
| | |
| | | | | | 224,654,048 | | | | 229,747,811 | | |
| South Korea 0.11% | |
22,823,640,000
KRW
| | Inflation Linked Korea
Treasury Bond 2.75%
due 3/10/2017 (i) | | | 21,744,808
| | | | 17,581,052
| | |
See Notes to Financial Statements.
26
Schedule of Investments | Six-Month Period Ended April 30, 2009 (unaudited)
| PRINCIPAL AMOUNT | | DESCRIPTION | | COST (NOTE 1) | | VALUE (NOTE 1) | |
| International Government Bonds—2.39%—(continued) | | | |
| Taiwan 0.71% | | | |
| | 1,767,500,000
TWD | | | Taiwan Government Bond
2.00% due 7/20/2012 | | | $53,849,283
| | | | $55,365,100
| | |
| | 1,826,000,000
TWD | | | Taiwan Government Bond
2.375% due 1/16/2013 | | | 59,116,581
| | | | 58,105,099
| | |
| | | | | | | | 112,965,864 | | | | 113,470,199 | | |
| Total International Government Bonds | | | | | 379,540,780 | | | | 380,301,087 | | |
| Total International Notes and Bonds | | | | | 599,151,969 | | | | 523,141,383 | | |
| Total Bonds | | | | | 1,133,793,623 | | | | 996,572,393 | | |
| U.S. Commercial Paper—4.80% | | | |
| $ | 7,000,000 | | | Altria Group, Inc. | | | 6,994,692 | | | | 6,994,692 | | |
| | | | | 1.05% due 5/27/2009 | | | | | | | | | |
| | 8,493,000 | | | Altria Group, Inc.
1.05% due 5/28/2009 | | | 8,486,312 | | | | 8,486,312 | | |
| | 6,399,000 | | | Altria Group, Inc.
1.05% due 5/29/2009 | | | 6,393,774 | | | | 6,393,774 | | |
| | 3,761,000 | | | Altria Group, Inc.
1.05% due 6/15/2009 | | | 3,756,064 | | | | 3,756,064 | | |
| | 12,500,000 | | | Altria Group, Inc.
1.60% due 5/19/2009 | | | 12,490,000 | | | | 12,490,000 | | |
| | 10,000,000 | | | Altria Group, Inc.
1.60% due 5/29/2009 | | | 9,987,556 | | | | 9,987,556 | | |
| | 10,000,000 | | | Altria Group, Inc.
1.65% due 5/11/2009 | | | 9,995,417 | | | | 9,995,417 | | |
| | 12,689,000 | | | Avery Dennison Corporation
0.75% due 5/1/2009 | | | 12,689,000 | | | | 12,689,000 | | |
| | 4,371,000 | | | Avery Dennison Corporation
0.85% due 5/18/2009 | | | 4,369,246 | | | | 4,369,246 | | |
| | 7,009,000 | | | Avery Dennison Corporation
0.85% due 5/27/2009 | | | 7,004,697 | | | | 7,004,697 | | |
| | 9,131,000 | | | Bemis Company, Inc.
0.30% due 5/5/2009 | | | 9,130,696 | | | | 9,130,696 | | |
| | 20,000,000 | | | BMW 0.50% due 5/1/2009 | | | 20,000,000 | | | | 20,000,000 | | |
| | 5,945,000 | | | The Clorox Company
0.60% due 5/22/2009 | | | 5,942,919 | | | | 5,942,919 | | |
| | 11,686,000 | | | The Coca-Cola Company
0.20% due 5/19/2009 | | | 11,684,831 | | | | 11,684,831 | | |
| | 64,015,000 | | | The Coca-Cola Company
0.20% due 5/20/2009 | | | 64,008,243 | | | | 64,008,243 | | |
| | 40,711,000 | | | ConocoPhillips
0.20% due 5/5/2009 | | | 40,710,095 | | | | 40,710,095 | | |
| | 40,000,000 | | | ConocoPhillips
0.27% due 5/1/2009 | | | 40,000,000 | | | | 40,000,000 | | |
See Notes to Financial Statements.
27
Global Fund
| PRINCIPAL AMOUNT | | DESCRIPTION | | COST (NOTE 1) | | VALUE (NOTE 1) | |
| U.S. Commercial Paper—4.80%—(continued) | | | |
| $ | 18,000,000 | | | Consolidated Edison, Inc. | | $ | 18,000,000 | | | $ | 18,000,000 | | |
| | | | | 0.30% due 5/1/2009 | | | | | | | | | |
| | 11,455,000 | | | Diageo Capital PLC
0.85% due 6/2/2009 | | | 11,446,345 | | | | 11,446,345 | | |
| | 10,000,000 | | | Emerson Electric Company
0.20% due 5/26/2009 | | | 9,998,611 | | | | 9,998,611 | | |
| | 19,107,000 | | | H.J. Heinz Company Limited
0.40% due 6/4/2009 | | | 19,099,782 | | | | 19,099,782 | | |
| | 15,652,000 | | | H.J. Heinz Company Limited
0.55% due 6/18/2009 | | | 15,640,522 | | | | 15,640,522 | | |
| | 29,513,000 | | | H.J. Heinz Company Limited
0.60% due 5/19/2009 | | | 29,504,146 | | | | 29,504,146 | | |
| | 8,874,000 | | | Harley Davidson, Inc.
0.50% due 5/1/2009 | | | 8,874,000 | | | | 8,874,000 | | |
| | 23,355,000 | | | Harley Davidson, Inc.
0.55% due 5/13/2009 | | | 23,350,718 | | | | 23,350,718 | | |
| | 9,402,000 | | | Harley Davidson, Inc.
0.55% due 5/18/2009 | | | 9,399,558 | | | | 9,399,558 | | |
| | 6,992,000 | | | Harley Davidson, Inc.
0.55% due 5/19/2009 | | | 6,990,077 | | | | 6,990,077 | | |
| | 4,174,000 | | | Harley Davidson, Inc.
1.75% due 5/7/2009 | | | 4,172,783 | | | | 4,172,783 | | |
| | 12,422,000 | | | ITT Corporation
1.20% due 5/4/2009 | | | 12,420,758 | | | | 12,420,758 | | |
| | 13,725,000 | | | ITT Corporation
1.50% due 5/18/2009 | | | 13,715,278 | | | | 13,715,278 | | |
| | 15,000,000 | | | ITT Corporation
1.75% due 5/1/2009 | | | 15,000,000 | | | | 15,000,000 | | |
| | 15,658,000 | | | Kraft Foods, Inc.
0.55% due 5/26/2009 | | | 15,652,020 | | | | 15,652,020 | | |
| | 25,000,000 | | | Microsoft Corporation
0.17% due 6/22/2009 | | | 24,993,861 | | | | 24,993,861 | | |
| | 11,442,000 | | | Moody's Corporation
0.50% due 5/1/2009 | | | 11,442,000 | | | | 11,442,000 | | |
| | 40,000,000 | | | Moody's Corporation
0.55% due 5/4/2009 | | | 39,998,167 | | | | 39,998,167 | | |
| | 22,021,000 | | | Moody's Corporation
0.55% due 5/8/2009 | | | 22,018,645 | | | | 22,018,645 | | |
| | 15,000,000 | | | Moody's Corporation
0.55% due 5/11/2009 | | | 14,997,708 | | | | 14,997,708 | | |
| | 35,775,000 | | | Nestle Capital Corporation
0.03% due 5/4/2009 | | | 35,774,911 | | | | 35,774,911 | | |
| | 31,939,000 | | | The Procter & Gamble Company
0.13% due 5/11/2009 | | | 31,937,847 | | | | 31,937,847 | | |
| | 10,341,000 | | | Transocean, Inc.
0.60% due 5/1/2009 | | | 10,341,000 | | | | 10,341,000 | | |
See Notes to Financial Statements.
28
Schedule of Investments | Six-Month Period Ended April 30, 2009 (unaudited)
| PRINCIPAL AMOUNT | | DESCRIPTION | | COST (NOTE 1) | | VALUE (NOTE 1) | |
| U.S. Commercial Paper—4.80%—(continued) | |
| $ | 7,119,000 | | | Transocean, Inc. | | $ | 7,118,614 | | | $ | 7,118,614 | | |
| | | 0.65% due 5/4/2009 | | | | | | | | | |
| | 40,000,000 | | | Transocean, Inc.
0.70% due 5/11/2009 | | | 39,992,222 | | | | 39,992,222 | | |
| | 22,332,000 | | | Verizon Communications Inc.
0.90% due 5/5/2009 | | | 22,329,767 | | | | 22,329,767 | | |
| | 2,366,000 | | | Verizon Communications Inc.
1.05% due 5/7/2009 | | | 2,365,586 | | | | 2,365,586 | | |
| | 16,172,000 | | | Vulcan Materials Company
0.45% due 5/1/2009 | | | 16,172,000 | | | | 16,172,000 | | |
| Total U.S. Commercial Paper | | | | | 766,390,468 | | | | 766,390,468 | | |
| Total Investments—99.24% | | | | $ | 17,585,870,075 | | | | 15,829,167,995 | | |
| Other Assets in Excess of Liabilities—0.76% | | | | | | | | | 121,097,853 | | |
| Net Assets—100.00% | | | | | | | | $ | 15,950,265,848 | | |
(a) An affiliate of the Fund as defined by the Investment Company Act of 1940. An affiliate is defined as a company in which the Fund directly or indirectly owns, controls, or holds power to vote 5% or more of the outstanding voting securities.
(b) Security is deemed illiquid. At April 30, 2009, the value of these securities amounted to $60,666,793 or 0.38% of net assets.
(c) Non-income producing security/commodity.
(d) Securities valued in accordance with fair value procedures under the supervision of the Board of Trustees, representing $669,030 or 0.00% of net assets.
(e) Represents interest in a restricted security which has not been registered with the Securities and Exchange Commission under the Securities Act of 1933. At April 30, 2009, the value of these securities amounted to $669,030 or 0.00% of net assets.
(f) Participation certificate security—A type of investment with a combination of share and bond-like features. This security does not come with voting rights.
(g) All or a portion of the security is exempt from registration under the Securities Act of 1933. Rule 144A securities may only be sold to qualified institutional buyers, pursuant to Rule 144A under the Securities Act of 1933.
(h) Defaulted security.
(i) Inflation protected security.
(j) Represents a security registered under Regulation S. Bonds sold under Regulation S may not be offered, sold or delivered within the U.S., or for the account or benefit of, U.S. persons, except pursuant to an exemption from, or in a transaction not subject to, the registration requirements of the Securities Act of 1933.
At April 30, 2009 cost is substantially identical for both book and federal income tax purposes; and net unrealized depreciation consisted of:
| Gross unrealized appreciation | | $ | 1,301,353,223 | | |
| Gross unrealized depreciation | | | (3,058,055,303 | ) | |
| Net unrealized depreciation | | $ | (1,756,702,080 | ) | |
See Notes to Financial Statements.
29
Global Fund
ADR — American Depository Receipt
CDI — Chess Depository Interest
CPI — Consumer Price Index
CPO — Ordinary Participation Certificate
FRN — Floating Rate Note
NVDR — Non-Voting Depository Receipt
PC — Participation Certificate
PCL — Public Company Limited
PLC — Public Limited Company
REIT — Real Estate Investment Trust
RSP — Represents Non-Voting Shares
Currencies
EUR — Euro
GBP — British Pound
JPY — Japanese Yen
KRW — South Korean Won
SGD — Singapore Dollar
TWD — Taiwan Dollar
USD — United States Dollar
Restricted Securities
| SECURITY | | ACQUISITION
DATE | | COST | | CARRYING VALUE PER
SHARE/PRINCIPAL | |
| LandCo Real Estate LLC | | 9/6/2006 | | $ | 669,030 | | | $ | 3.48 | | |
| FINEL 9.50% due 6/30/2017 | | 6/22/2005 | | | 14,474,400 | | | | — | | |
| FINEL 9.50% due 10/15/2017 | | 10/11/2005 | | | 18,067,500 | | | | — | | |
Foreign Currency Exchange Contracts — Purchases
SETTLEMENT
DATES
THROUGH | | FOREIGN CURRENCY
TO BE RECEIVED | | U.S. $
TO BE
DELIVERED | | U.S. $ VALUE
AT APRIL 30,
2009 | | UNREALIZED
APPRECIATION
AT APRIL 30,
2009 | | UNREALIZED
DEPRECIATION
AT APRIL 30,
2009 | |
| 7/15/2009 | | | 241,223,000 | | | Euro | | $ | 312,190,807 | | | $ | 319,752,183 | | | $ | 7,561,376 | | | $ | — | | |
| 7/15/2009 | | | 40,788,000 | | | Pound Sterling | | | 58,150,228 | | | | 60,478,733 | | | | 2,328,505 | | | | — | | |
| 7/15/2009 | | | 35,882,000 | | | Pound Sterling | | | 52,832,657 | | | | 53,204,323 | | | | 371,666 | | | | — | | |
| | | | | | | | | $ | 423,173,692 | | | $ | 433,435,239 | | | $ | 10,261,547 | | | $ | | — | |
See Notes to Financial Statements.
30
Schedule of Investments | Six-Month Period Ended April 30, 2009 (unaudited)
Foreign Currency Exchange Contracts — Sales
SETTLEMENT
DATES
THROUGH | | FOREIGN CURRENCY
TO BE DELIVERED | | U.S. $
TO BE
RECEIVED | | U.S. $ VALUE
AT APRIL 30,
2009 | | UNREALIZED
APPRECIATION
AT APRIL 30,
2009 | | UNREALIZED
DEPRECIATION
AT APRIL 30,
2009 | |
| 7/15/2009 | | | 1,364,649,000 | | | Euro | | $ | 1,816,625,118 | | | $ | 1,808,907,097 | | | $ | 7,718,021 | | | $ | — | | |
| 7/15/2009 | | | 63,949,000 | | | Pound Sterling | | | 94,606,150 | | | | 94,820,891 | | | | — | | | | (214,741 | ) | |
| 7/15/2009 | | | 12,721,000 | | | Pound Sterling | | | 18,617,820 | | | | 18,862,165 | | | | — | | | | (244,345 | ) | |
| 7/15/2009 | | | 62,435,000 | | | Swiss Franc | | | 56,169,549 | | | | 54,850,734 | | | | 1,318,815 | | | | — | | |
| 8/12/2009 | | | 46,316,893,000 | | | Japanese Yen | | | 508,402,556 | | | | 469,728,857 | | | | 38,673,699 | | | | — | | |
| 9/16/2009 | | | 62,809,343,000 | | | Japanese Yen | | | 660,464,486 | | | | 636,957,729 | | | | 23,506,757 | | | | — | | |
| | | | | | | | | $ | 3,154,885,679 | | | $ | 3,084,127,473 | | | $ | 71,217,292 | | | $ | (459,086 | ) | |
Affiliated Securities
| AFFILIATE | | SHARES
OCTOBER 31,
2008 | | GROSS
ADDITIONS | | GROSS
REDUCTIONS | | SHARES
APRIL 30,
2009 | | MARKET
VALUE
APRIL 30,
2009 | | REALIZED
LOSS | | DIVIDEND
INCOME | |
Aioi
Insurance
Company
Limited | | | 64,994,300 | | | | — | | | | — | | | | 64,994,300 | | | $ | 284,560,024 | | | $ | — | | | $ | 6,193,422 | | |
Ariake
Japan
Company
Limited | | | 1,725,100 | | | | — | | | | — | | | | 1,725,100 | | | | 23,620,250 | | | | — | | | | 328,776 | | |
Banco
Latinoamericano
de
Exportaciones
SA | | | 2,036,652 | | | | — | | | | — | | | | 2,036,652 | | | | 25,050,820 | | | | — | | | | 753,561 | | |
Barnes &
Noble, Inc. | | | 6,483,956 | | | | — | | | | 1,179,680 | | | | 5,304,276 | | | | 138,547,689 | | | | (3,056,880 | ) | | | 3,241,978 | | |
Blount
International,
Inc. | | | 9,778,961 | | | | — | | | | — | | | | 9,778,961 | | | | 62,585,350 | | | | — | | | | — | | |
Chofu
Seisakusho
Company
Limited | | | 3,501,380 | | | | — | | | | — | | | | 3,501,380 | | | | 64,229,227 | | | | — | | | | 503,262 | | |
Cintas
Corporation | | | 10,059,141 | | | | 709,440 | | | | — | | | | 10,768,581 | | | | 276,321,788 | | | | — | | | | 5,061,233 | | |
City
e-Solutions
Limited | | | 20,738,780 | | | | — | | | | — | | | | 20,738,780 | | | | 963,344 | | | | — | | | | — | | |
Conbraco
Industries, Inc. | | | 4,169 | | | | — | | | | — | | | | 4,169 | | | | 604,505 | | | | — | | | | — | | |
Deceuninck
NV | | | 2,210,071 | | | | — | | | | 346,912 | | | | 1,863,159 | | | | 5,552,027 | | | | (9,941,080 | ) | | | — | | |
Deltic
Timber
Corporation | | | 1,258,500 | | | | — | | | | — | | | | 1,258,500 | | | | 53,033,190 | | | | — | | | | 188,775 | | |
Guyenne et
Gascogne SA | | | 541,213 | | | | — | | | | — | | | | 541,213 | | | | 47,307,638 | | | | — | | | | — | | |
See Notes to Financial Statements.
31
Global Fund
Affiliated Securities—(continued)
| AFFILIATE | | SHARES
OCTOBER 31,
2008 | | GROSS
ADDITIONS | | GROSS
REDUCTIONS | | SHARES
APRIL 30,
2009 | | MARKET
VALUE
APRIL 30,
2009 | | REALIZED
LOSS | | DIVIDEND
INCOME | |
IDA
Corporation,
Inc. | | | 4,440,260 | | | | — | | | | — | | | | 4,440,260 | | | $ | 106,433,032 | | | $ | — | | | $ | 2,664,156 | | |
Meitec
Corporation | | | 3,663,695 | | | | 110,400 | | | | 1,054,995 | | | | 2,719,100 | | | | 36,706,610 | | | | (14,964,639 | ) | | | 712,547 | | |
Mills Music
Trust | | | 34,924 | | | | — | | | | — | | | | 34,924 | | | | 699,179 | | | | — | | | | 52,963 | | |
MISUMI
Group, Inc. | | | 14,646,430 | | | | — | | | | — | | | | 14,646,430 | | | | 196,681,056 | | | | — | | | | 418,705 | | |
Namyang
Dairy
Products
Company
Limited | | | 39,989 | | | | — | | | | — | | | | 39,989 | | | | 15,958,198 | | | | — | | | | 24,409 | | |
| Neopost SA | | | 3,039,356 | | | | — | | | | 95,520 | | | | 2,943,836 | | | | 250,596,390 | | | | (3,101,018 | ) | | | 5,734,179 | | |
| NSC Groupe | | | 70,650 | | | | — | | | | 1,150 | | | | 69,500 | | | | 2,485,236 | | | | (121,438 | ) | | | — | | |
Pfeiffer
Vacuum
Technology
AG | | | 1,172,304 | | | | — | | | | — | | | | 1,172,304 | | | | 78,219,948 | | | | — | | | | — | | |
Rayonier, Inc.,
REIT | | | 5,905,362 | | | | 588,260 | | | | — | | | | 6,493,622 | | | | 250,783,681 | | | | — | | | | 6,199,492 | | |
Remy
Cointreau SA | | | 5,361,738 | | | | — | | | | — | | | | 5,361,738 | | | | 178,095,208 | | | | — | | | | — | | |
| Sabeton SA | | | 385,000 | | | | — | | | | — | | | | 385,000 | | | | 5,358,985 | | | | — | | | | — | | |
San Juan
Basin Royalty
Trust | | | 4,218,754 | | | | — | | | | 243,110 | | | | 3,975,644 | | | | 56,493,901 | | | | (2,444,034 | ) | | | 2,250,218 | | |
| Shimano, Inc. | | | 7,086,170 | | | | — | | | | — | | | | 7,086,170 | | | | 207,550,738 | | | | — | | | | 2,218,902 | | |
SMC
Corporation | | | 4,053,720 | | | | — | | | | — | | | | 4,053,720 | | | | 394,402,676 | | | | — | | | | 2,317,716 | | |
Sucrière de
Pithiviers-
Le-Vieil | | | 63,019 | | | | — | | | | — | | | | 63,019 | | | | 39,644,617 | | | | — | | | | 2,122,104 | | |
T. Hasegawa
Company
Limited | | | 5,147,000 | | | | — | | | | — | | | | 5,147,000 | | | | 53,259,218 | | | | — | | | | 490,467 | | |
THK
Company
Limited | | | 14,581,600 | | | | — | | | | 508,800 | | | | 14,072,800 | | | | 193,542,005 | | | | (4,193,879 | ) | | | 1,111,605 | | |
| Total | | $ | 3,049,286,530 | | | $ | (37,822,968 | ) | | $ | 42,588,470 | | |
See Notes to Financial Statements.
32
Schedule of Investments | Six-Month Period Ended April 30, 2009 (unaudited)
| INDUSTRY DIVERSIFICATION FOR PORTFOLIO HOLDINGS | | PERCENT OF
NET ASSETS | |
| U.S. Common Stocks | |
| Consumer Discretionary | | | 6.57 | % | |
| Energy | | | 2.86 | | |
| Financials | | | 4.18 | | |
| Health Care | | | 1.02 | | |
| Industrials | | | 2.78 | | |
| Information Technology | | | 2.95 | | |
| Materials | | | 5.38 | | |
| Telecommunication Services | | | 0.65 | | |
| Utilities | | | 0.67 | | |
| Total U.S. Common Stocks | | | 27.06 | | |
| International Common Stocks | |
| Consumer Discretionary | | | 5.62 | | |
| Consumer Staples | | | 6.50 | | |
| Energy | | | 1.18 | | |
| Financials | | | 6.89 | | |
| Health Care | | | 6.53 | | |
| Industrials | | | 14.42 | | |
| Information Technology | | | 5.31 | | |
| Materials | | | 6.55 | | |
| Telecommunication Services | | | 0.15 | | |
| Total International Common Stocks | | | 53.15 | | |
| U.S. Preferred Stocks | |
| Financials | | | 0.01 | | |
| Utilities | | | 0.08 | | |
| Total U.S. Preferred Stocks | | | 0.09 | | |
| International Preferred Stocks | |
| Consumer Discretionary | | | 0.30 | | |
| Information Technology | | | 0.62 | | |
| Total International Preferred Stocks | | | 0.92 | | |
| Commodity | | | 6.96 | | |
See Notes to Financial Statements.
33
Global Fund
| INDUSTRY DIVERSIFICATION FOR PORTFOLIO HOLDINGS—(CONTINUED) | | PERCENT OF
NET ASSETS | |
| U.S. Bonds | |
| Consumer Discretionary | | | 0.50 | % | |
| Energy | | | 0.36 | | |
| Government Issues | | | 1.85 | | |
| Industrials | | | 0.04 | | |
| Materials | | | 0.12 | | |
| Telecommunication Services | | | 0.10 | | |
| Total U.S. Bonds | | | 2.97 | | |
| International Notes and Bonds | |
| Consumer Discretionary | | | 0.03 | | |
| Financials | | | 0.32 | | |
| Government Issues | | | 2.38 | | |
| Industrials | | | 0.02 | | |
| Information Technology | | | 0.47 | | |
| Materials | | | 0.04 | | |
| Telecommunication Services | | | 0.03 | | |
| Total International Notes and Bonds | | | 3.29 | | |
| U.S. Commercial Paper | | | 4.80 | | |
| Total Investments | | | 99.24 | % | |
See Notes to Financial Statements.
34
This page was intentionally left blank.

Fund Overview | Data as of April 30, 2009 (unaudited)
INVESTMENT OBJECTIVE
First Eagle Overseas Fund seeks long-term growth of capital by investing primarily in equities issued by non-U.S. corporations. Management's research-driven process seeks to minimize risk by focusing on undervalued securities.
Average Annual Returns
| | | ONE-YEAR | | FIVE-YEARS | | TEN-YEARS | |
First Eagle Overseas
Fund (A Shares) | |
| without sales charge | | | -25.21 | % | | | 6.64 | % | | | 11.64 | % | |
| with sales charge | | | -28.95 | | | | 5.55 | | | | 11.21 | | |
| MSCI EAFE Index | | | -42.76 | | | | 0.66 | | | | -0.04 | | |
| Consumer Price Index | | | -0.74 | | | | 2.55 | | | | 2.52 | | |
Asset Allocation

Countries
| Japan | | | 32.36 | % | |
| France | | | 13.70 | | |
| United States | | | 10.29 | | |
| Switzerland | | | 5.68 | | |
| Germany | | | 4.09 | | |
| Singapore | | | 3.73 | | |
| South Korea | | | 3.27 | | |
| Hong Kong | | | 2.37 | | |
| Taiwan | | | 1.91 | | |
| Italy | | | 1.88 | | |
| South Africa | | | 1.85 | | |
| Thailand | | | 1.76 | | |
| Netherlands | | | 1.72 | | |
| Canada | | | 1.32 | | |
| Brazil | | | 1.11 | | |
| United Kingdom | | | 1.05 | | |
| Malaysia | | | 0.82 | | |
| Chile | | | 0.76 | | |
| Mexico | | | 0.72 | | |
| Panama | | | 0.32 | | |
| Australia | | | 0.24 | | |
| Belgium | | | 0.10 | | |
| Jersey | | | 0.07 | | |
| New Zealand | | | 0.05 | | |
The Fund's portfolio composition (represented as a percentage of net assets) is subject to change at any time.
FIRST EAGLE FUNDS | SEMI-ANNUAL REPORT | APRIL 30, 2009
36
Overseas Fund
Growth of a $10,000 Initial Investment

Performance data quoted herein represents past performance and should not be considered indicative of future results. Performance data quoted herein does not reflect the deduction of taxes that a shareholder would pay on Fund distributions or the sale of Fund shares. The average annual returns shown above are historical and reflect changes in share price, reinvested dividends and are net of expenses.
The average annual returns for Class A Shares give effect to the deduction of the maximum sales charge of 3.75% for periods prior to March 1, 2000 and of 5.00% thereafter.
The MSCI EAFE Index is a total return index, reported in U.S. Dollars, based on share prices and reinvested net dividends of approximately 1,100 companies from 21 countries and is not available for purchase. The Consumer Price Index (CPI) represents the change in price of all goods and services purchased for consumption by urban households.
Top 10 Holdings
| Gold Bullion (precious metal) | | | 9.13 | % | |
| Shimano, Inc. (Japanese bicycle parts manufacturer) | | | 2.67 | | |
| Pargesa Holding SA (Swiss diversified financials company) | | | 2.40 | | |
| SMC Corporation (Japanese automated control devices manufacturer) | | | 2.13 | | |
| Keyence Corporation (Japanese sensors manufacturer) | | | 1.94 | | |
| Sodexo (French food management services provider) | | | 1.94 | | |
| Ono Pharmaceutical Company Limited (Japanese pharmaceutical company) | | | 1.90 | | |
| Sanofi-Aventis SA (French health care company) | | | 1.85 | | |
| Fanuc Limited (Japanese industrial manufacturing company) | | | 1.79 | | |
| Secom Company Limited (Japanese security services provider) | | | 1.79 | | |
FIRST EAGLE FUNDS | SEMI-ANNUAL REPORT | APRIL 30, 2009
37
First Eagle Overseas Fund
| NUMBER OF SHARES | | DESCRIPTION | | COST (NOTE 1) | | VALUE (NOTE 1) | |
| Common Stocks—77.05% | |
| International Common Stocks—75.96% | | | |
| Australia 0.24% | |
| | 9,217,342 | | | Spotless Group Limited | | $ | 25,816,120 | | | $ | 13,752,181 | | |
| Belgium 0.10% | |
| | 1,900,433 | | | Deceuninck NV (d) | | | 42,892,055 | | | | 5,663,100 | | |
| Brazil 1.11% | |
| | 2,311,604 | | | Petroleo Brasileiro SA , ADR | | | 25,079,655 | | | | 62,367,076 | | |
| Canada 0.89% | |
| | 1,015,250 | | | EnCana Corporation | | | 22,697,114 | | | | 46,427,382 | | |
| | 864,070 | | | Harry Winston Diamond
Corporation | | | 20,298,938 | | | | 3,626,380 | | |
| | | | 42,996,052 | | | | 50,053,762 | | |
| Chile 0.76% | |
| | 24,062,197 | | | Quinenco SA (b) | | | 16,182,017 | | | | 42,606,263 | | |
| France 12.99% | |
| | 2,260,564 | | | Sodexo | | | 63,527,652 | | | | 109,247,066 | | |
| | 1,795,333 | | | Sanofi-Aventis SA | | | 148,151,678 | | | | 104,073,623 | | |
| | 1,002,820 | | | Neopost SA | | | 63,899,883 | | | | 85,365,853 | | |
| | 1,492,745 | | | Rémy Cointreau SA | | | 44,530,281 | | | | 49,582,939 | | |
| | 850,960 | | | Total SA | | | 53,737,976 | | | | 43,215,247 | | |
| | 979,653 | | | Cie Generale d'Optique
Essilor International SA | | | 26,650,167 | | | | 42,478,587 | | |
| | 713,623 | | | Société BIC SA | | | 28,490,268 | | | | 38,442,844 | | |
| | 436,829 | | | Air Liquide SA | | | 47,963,870 | | | | 35,785,360 | | |
| | 563,378 | | | Laurent-Perrier (d) | | | 20,236,693 | | | | 33,195,667 | | |
| | 900,000 | | | Frégate (a)(b)(c)(e) | | | 23,235,900 | | | | 29,798,996 | | |
| | 783,428 | | | Wendel | | | 17,077,099 | | | | 29,098,704 | | |
| | 39,143 | | | Sucrière de Pithiviers-Le-Vieil (d) | | | 15,598,306 | | | | 24,624,466 | | |
| | 236,140 | | | Robertet SA (d) | | | 20,639,502 | | | | 21,266,577 | | |
| | 51,500 | | | Robertet SA CI (b) | | | 2,151,628 | | | | 3,410,330 | | |
| | 364,373 | | | Gaumont SA (d) | | | 21,698,753 | | | | 19,312,673 | | |
| | 438,430 | | | Société Foncière Financière et
de Participations FFP | | | 28,868,987 | | | | 17,303,567 | | |
| | 540,680 | | | Zodiac Aerospace | | | 29,615,032 | | | | 15,911,220 | | |
| | 372,678 | | | Carrefour SA | | | 17,177,685 | | | | 15,246,522 | | |
| | 120,246 | | | Guyenne et Gascogne SA | | | 20,523,158 | | | | 10,510,750 | | |
| | 100,000 | | | Sabeton SA | | | 1,463,142 | | | | 1,391,944 | | |
See Notes to Financial Statements.
38
Schedule of Investments | Six Month Period Ended April 30, 2009 (unaudited)
| NUMBER OF SHARES | | DESCRIPTION | | COST (NOTE 1) | | VALUE (NOTE 1) | |
| International Common Stocks—75.96%—(continued) | | | |
| France 12.99%—(continued) | |
| | 1,000 | | | Société Vermandoise | | $ | 854,846 | | | $ | 1,297,925 | | |
| | | | | de Sucreries | | | | | | | | | |
| | 3,593,581 | | | FINEL (a)(b)(c)(d)(e)(f) | | | 9,152,131 | | | | — | | |
| | | | 705,244,637 | | | | 730,560,860 | | |
| Germany 3.53% | |
| | 915,140 | | | Pfeiffer Vacuum
Technology AG (d) | | | 39,449,539 | | | | 61,061,127 | | |
| | 956,235 | | | Fraport AG | | | 34,094,606 | | | | 38,689,664 | | |
| | 2,047,306 | | | Deutsche Wohnen AG (a)(d) | | | 39,841,345 | | | | 37,390,919 | | |
| | 2,612,470 | | | Tognum AG | | | 52,989,260 | | | | 32,039,181 | | |
| | 1,358,769 | | | Bertelsmann AG , Series 'A' (g) | | | 30,601,684 | | | | 24,653,882 | | |
| | 66,207 | | | Axel Springer AG | | | 2,852,938 | | | | 4,822,650 | | |
| | | | 199,829,372 | | | | 198,657,423 | | |
| Hong Kong 2.37% | |
| | 19,689,240 | | | Wharf Holdings Limited | | | 51,081,160 | | | | 65,418,666 | | |
| | 7,966,340 | | | Guoco Group Limited | | | 59,235,773 | | | | 49,031,221 | | |
| | 7,000,000 | | | Hopewell Holdings Limited | | | 7,601,832 | | | | 18,154,721 | | |
| | 10,851,720 | | | City e-Solutions Limited (a)(b) | | | 323,358 | | | | 504,077 | | |
| | | | 118,242,123 | | | | 133,108,685 | | |
| Italy 1.88% | |
| | 7,315,306 | | | Italcementi S.p.A. RSP | | | 87,341,485 | | | | 46,794,923 | | |
| | 1,197,736 | | | Italmobiliare S.p.A. RSP | | | 50,324,929 | | | | 29,346,205 | | |
| | 165,635 | | | Italmobiliare S.p.A. | | | 19,155,452 | | | | 6,337,511 | | |
| | 6,279,204 | | | Gewiss S.p.A. (d) | | | 24,839,299 | | | | 23,285,295 | | |
| | | | 181,661,165 | | | | 105,763,934 | | |
| Japan 32.36% | |
| | 5,133,700 | | | Shimano, Inc. (d) | | | 88,454,134 | | | | 150,363,768 | | |
| | 1,231,500 | | | SMC Corporation | | | 156,971,922 | | | | 119,817,574 | | |
| | 621,000 | | | Keyence Corporation | | | 122,578,391 | | | | 109,321,678 | | |
| | 2,528,100 | | | Ono Pharmaceutical
Company Limited | | | 104,432,562 | | | | 107,098,997 | | |
| | 1,405,700 | | | Fanuc Limited | | | 121,013,894 | | | | 100,722,601 | | |
| | 2,725,600 | | | Secom Company Limited | | | 115,234,914 | | | | 100,549,144 | | |
| | 3,048,720 | | | Astellas Pharma, Inc. | | | 125,719,586 | | | | 99,183,046 | | |
| | 20,785,230 | | | Nissay Dowa General Insurance
Company Limited (d) | | | 109,655,110 | | | | 89,106,641
| | |
See Notes to Financial Statements.
39
Overseas Fund
| NUMBER OF SHARES | | DESCRIPTION | | COST (NOTE 1) | | VALUE (NOTE 1) | |
| International Common Stocks—75.96%—(continued) | | | |
| Japan 32.36%—(continued) | |
| | 11,702,810 | | | Sompo Japan Insurance, Inc. | | $ | 130,349,871 | | | $ | 69,740,066 | | |
| | 15,519,800 | | | Aioi Insurance Company Limited | | | 54,260,013 | | | | 67,949,261 | | |
| | 619,380 | | | Hirose Electric Company Limited | | | 72,762,514 | | | | 64,216,655 | | |
| | 4,305,870 | | | MISUMI Group, Inc. | | | 74,376,073 | | | | 57,821,808 | | |
| | 1,838,970 | | | Canon, Inc. | | | 88,676,122 | | | | 54,980,860 | | |
| | 2,832,150 | | | Nitto Kohki Company Limited (d) | | | 50,121,709 | | | | 49,082,563 | | |
| | 6,512,500 | | | Japan Wool Textile
Company Limited (d) | | | 49,370,448 | | | | 38,017,635 | | |
| | 2,022,800 | | | Chofu Seisakusho
Company Limited (d) | | | 33,096,084 | | | | 37,106,192 | | |
| | 3,452,591 | | | T. Hasegawa Company Limited (d) | | | 47,344,131 | | | | 35,726,111 | | |
| | 9,513,700 | | | Okumura Corporation | | | 49,089,448 | | | | 35,578,750 | | |
| | 2,538,900 | | | THK Company Limited | | | 41,219,496 | | | | 34,917,273 | | |
| | 5,453,000 | | | Kansai Paint Company Limited | | | 41,956,987 | | | | 29,069,403 | | |
| | 1,780,400 | | | Toho Company Limited | | | 17,604,179 | | | | 23,529,356 | | |
| | 4,226,650 | | | Nipponkoa Insurance
Company Limited | | | 14,950,311 | | | | 22,874,542 | | |
| | 1,670,400 | | | Fuji Seal International, Inc. (d) | | | 38,681,302 | | | | 22,515,780 | | |
| | 2,535,900 | | | Yomeishu Seizo
Company Limited (d) | | | 22,847,623 | | | | 22,359,714 | | |
| | 2,181,200 | | | Seikagaku Corporation | | | 17,605,118 | | | | 20,779,649 | | |
| | 1,472,300 | | | Meitec Corporation | | | 43,510,663 | | | | 19,875,379 | | |
| | 1,443,600 | | | Ariake Japan Company Limited | | | 30,991,137 | | | | 19,765,923 | | |
| | 2,376,980 | | | Daiichikosho Company Limited | | | 25,716,873 | | | | 19,031,258 | | |
| | 3,005,000 | | | OSG Corporation | | | 35,696,828 | | | | 18,882,132 | | |
| | 2,068,330 | | | Maezawa Kasei Industries
Company Limited (d) | | | 31,939,631 | | | | 18,698,190 | | |
| | 853,360 | | | Icom, Inc. (d) | | | 22,353,412 | | | | 17,288,605 | | |
| | 936,347 | | | Mandom Corporation | | | 15,567,941 | | | | 16,825,208 | | |
| | 1,058,246 | | | Matsumoto Yushi-Seiyaku
Company Limited (d) | | | 25,950,562 | | | | 14,956,157 | | |
| | 897,760 | | | AS One Corporation | | | 19,294,141 | | | | 14,739,751 | | |
| | 1,517,756 | | | Nissin Healthcare Food Service
Company Limited | | | 24,345,733 | | | | 14,336,157 | | |
| | 303,200 | | | Mabuchi Motor Company Limited | | | 18,025,224 | | | | 13,674,268 | | |
| | 767,602 | | | Nagaileben Company Limited | | | 14,432,256 | | | | 13,598,544 | | |
| | 2,572,675 | | | The Tokushima Bank Limited | | | 17,372,742 | | | | 12,776,029 | | |
| | 798,380 | | | Chudenko Corporation | | | 12,166,734 | | | | 11,206,611 | | |
See Notes to Financial Statements.
40
Schedule of Investments | Six Month Period Ended April 30, 2009 (unaudited)
| NUMBER OF SHARES | | DESCRIPTION | | COST (NOTE 1) | | VALUE (NOTE 1) | |
| International Common Stocks—75.96%—(continued) | | | |
| Japan 32.36%—(continued) | |
| | 507,106 | | | SK Kaken Company Limited | | $ | 9,442,605 | | | $ | 9,420,546 | | |
| | 100,000 | | | Asahi Broadcasting Corporation | | | 6,141,481 | | | | 8,047,025 | | |
| | 1,223,670 | | | Sansei Yusoki Company
Limited (d) | | | 10,265,159 | | | | 5,332,706 | | |
| | 304,600 | | | Shimachu Company Limited | | | 6,008,154 | | | | 5,303,565 | | |
| | 1,424,100 | | | Shingakukai Company Limited (d) | | | 10,266,277 | | | | 3,507,209 | | |
| | 21,600 | | | Doshisha Company Limited | | | 407,780 | | | | 260,724 | | |
| | | | 2,168,267,275 | | | | 1,819,955,054 | | |
| Malaysia 0.82% | |
| | 35,046,240 | | | Genting Berhad | | | 77,433,514 | | | | 46,072,023 | | |
| Mexico 0.72% | |
| | 3,552,612 | | | Industrias Peñoles S.A.B. de C.V. | | | 3,110,554 | | | | 38,399,698 | | |
| | 622,500 | | | Grupo Televisa S.A.B. CPO | | | 1,955,870 | | | | 1,916,730 | | |
| | | | 5,066,424 | | | | 40,316,428 | | |
| Netherlands 0.94% | |
| | 496,018 | | | HAL Trust | | | 13,919,475 | | | | 35,999,553 | | |
| | 698,529 | | | Heineken Holding NV | | | 16,264,846 | | | | 16,624,616 | | |
| | | | 30,184,321 | | | | 52,624,169 | | |
| New Zealand 0.05% | |
| | 5,750,000 | | | Tasman Farms Limited (a)(b)(d) | | | 1,054,354 | | | | 2,759,971 | | |
| Panama 0.32% | |
| | 1,461,723 | | | Banco Latinoamericano
de Exportaciones SA | | | 19,858,281 | | | | 17,979,193 | | |
| Singapore 2.94% | |
| | 23,149,730 | | | Haw Par Corporation Limited (d) | | | 76,707,488 | | | | 59,448,538 | | |
| | 3,733,120 | | | United Overseas Bank Limited | | | 45,240,352 | | | | 29,012,252 | | |
| | 27,917,700 | | | Singapore Airport Terminal
Services Limited | | | 32,162,021 | | | | 24,715,112 | | |
| | 9,974,000 | | | Fraser and Neave Limited | | | 10,285,189 | | | | 17,659,659 | | |
| | 11,657,433 | | | UOL Group Limited | | | 16,670,575 | | | | 17,489,104 | | |
| | 17,549,625 | | | ComfortDelgro Corporation
Limited | | | 6,946,456 | | | | 16,840,998 | | |
| | | | 188,012,081 | | | | 165,165,663 | | |
See Notes to Financial Statements.
41
Overseas Fund
| NUMBER OF SHARES | | DESCRIPTION | | COST (NOTE 1) | | VALUE (NOTE 1) | |
| International Common Stocks—75.96%—(continued) | | | |
| South Africa 1.85% | |
| | 8,156,160 | | | Gold Fields Limited , ADR | | $ | 110,850,599 | | | $ | 84,824,064 | | |
| | 2,073,780 | | | Harmony Gold Mining
Company Limited , ADR (a) | | | 21,612,384 | | | | 19,327,630 | | |
| | | | 132,462,983 | | | | 104,151,694 | | |
| South Korea 1.97% | |
| | 33,070 | | | Lotte Confectionery
Company Limited | | | 10,159,503 | | | | 26,548,792 | | |
| | 120,620 | | | Nong Shim Company Limited | | | 31,736,226 | | | | 20,307,030 | | |
| | 39,708 | | | Nong Shim Holdings
Company Limited | | | 3,625,272 | | | | 1,795,061 | | |
| | 939,030 | | | Fursys, Inc. (d) | | | 11,308,973 | | | | 17,053,312 | | |
| | 494,900 | | | Hankuk Paper Manufacturing
Company Limited (d) | | | 17,020,271 | | | | 13,500,779 | | |
| | 117,880 | | | Pacific Corporation | | | 18,010,606 | | | | 10,933,531 | | |
| | 22,950 | | | Namyang Dairy Products
Company Limited | | | 4,912,653 | | | | 9,158,535 | | |
| | 1,182,040 | | | Dong Ah Tire & Rubber
Company Limited | | | 5,161,359 | | | | 7,619,229 | | |
| | 521,420 | | | Daeduck GDS Company Limited | | | 2,704,577 | | | | 2,828,592 | | |
| | 296,024 | | | Sam-A Pharm Company Limited | | | 2,324,917 | | | | 1,229,779 | | |
| | | | 106,964,357 | | | | 110,974,640 | | |
| Switzerland 5.68% | |
| | 2,111,661 | | | Pargesa Holding SA | | | 109,671,398 | | | | 134,847,917 | | |
| | 1,098,186 | | | Kuehne & Nagel International AG | | | 39,852,800 | | | | 83,413,234 | | |
| | 2,260,150 | | | Nestlé SA | | | 48,733,932 | | | | 74,017,535 | | |
| | 1,072 | | | Lindt & Spruengli AG | | | 9,210,853 | | | | 20,602,735 | | |
| | 35,000 | | | Edipresse SA | | | 11,616,314 | | | | 6,749,649 | | |
| | | | 219,085,297 | | | | 319,631,070 | | |
| Taiwan 1.65% | |
| | 65,598,907 | | | Compal Electronics, Inc. | | | 69,462,073 | | | | 55,734,328 | | |
| | 19,985,980 | | | Taiwan Secom Company Limited | | | 31,799,171 | | | | 30,184,277 | | |
| | 12,966,228 | | | Taiwan Sogo Shin Kong Security
Company Limited | | | 11,747,151 | | | | 6,684,330 | | |
| | | | 113,008,395 | | | | 92,602,935 | | |
| Thailand 1.76% | |
| | 457,215,505 | | | Thai Beverage PCL | | | 78,469,335 | | | | 58,706,502 | | |
| | 14,789,489 | | | Bangkok Bank PCL NVDR | | | 47,460,043 | | | | 35,632,272 | | |
See Notes to Financial Statements.
42
Schedule of Investments | Six Month Period Ended April 30, 2009 (unaudited)
| NUMBER OF SHARES | | DESCRIPTION | | COST (NOTE 1) | | VALUE (NOTE 1) | |
| International Common Stocks—75.96%—(continued) | | | |
| Thailand 1.76%—(continued) | |
| | 250,000 | | | OHTL PCL (b) | | $ | 1,503,207 | | | $ | 3,557,256 | | |
| | 496,220 | | | Bangkok Bank PCL | | | 1,613,300 | | | | 1,206,091 | | |
| | | | 129,045,885 | | | | 99,102,121 | | |
| United Kingdom 1.03% | |
| | 2,986,700 | | | Spirax-Sarco Engineering PLC | | | 20,282,386 | | | | 37,940,702 | | |
| | 892,218 | | | Anglo American PLC | | | 18,748,394 | | | | 19,591,980 | | |
| | 503,640 | | | Chrysalis Group PLC (a) | | | 2,798,900 | | | | 408,017 | | |
| | | | 41,829,680 | | | | 57,940,699 | | |
| Total International Common Stocks | | | 4,590,216,043 | | | | 4,271,808,944 | | |
| U.S. Common Stocks—1.09% | | | |
| Financials 0.00% | |
| | 14,083 | | | Security Capital European
Realty (a)(b)(c) | | | — | | | | — | | |
| Materials 1.09% | |
| | 1,522,583 | | | Newmont Mining Corporation | | | 48,160,158 | | | | 61,268,740 | | |
| Total U.S. Common Stocks | | | 48,160,158 | | | | 61,268,740 | | |
| Total Common Stocks | | | 4,638,376,201 | | | | 4,333,077,684 | | |
| International Preferred Stocks—1.86% | |
| Germany 0.56% | |
| | 581,442 | | | Hornbach Holding AG | | | 39,598,446 | | | | 31,634,134 | | |
| South Korea 1.30% | |
| | 263,014 | | | Samsung Electronics
Company Limited | | | 36,478,547 | | | | 68,059,741 | | |
| | 28,850 | | | Namyang Dairy Products
Company Limited | | | 479,095 | | | | 4,677,163 | | |
| | 75,655 | | | Daekyo Company Limited | | | 264,319 | | | | 160,981 | | |
| | | | 37,221,961 | | | | 72,897,885 | | |
| Total International Preferred Stocks | | | 76,820,407 | | | | 104,532,019 | | |
| OUNCES | | | | | | | |
| Commodity—9.13% | |
| | 577,779 | | | Gold bullion (a) | | | 293,104,679 | | | | 513,442,993 | | |
See Notes to Financial Statements.
43
Overseas Fund
| PRINCIPAL AMOUNT | | DESCRIPTION | | COST (NOTE 1) | | VALUE (NOTE 1) | |
| International Bonds—3.06% | | | |
| International Corporate Bonds—1.62% | | | |
| Canada 0.43% | | | |
10,000,000
USD | | CanWest LP 9.25%
due 8/1/2015 (b)(h) | | $ | 8,636,458 |
| | $ | 975,000 |
| |
47,142,000
USD | | Catalyst Paper Corporation
7.375% due 3/1/2014 (b) | | | 39,708,579 |
| | | 20,742,480 |
| |
5,000,000
USD | | Catalyst Paper Corporation,
Series 'D' 8.625% due 6/15/2011 (b) | | | 4,594,566 |
| | | 2,800,000 |
| |
| | | | 52,939,603 | | | | 24,517,480 | | |
| France 0.32% | | | |
8,000,000
EUR | | FINEL 9.50%
due 6/30/2017 (a)(b)(c)(e)(j) | | | 9,649,600 |
| | | — |
| |
10,000,000
EUR | | FINEL 9.50%
due 10/15/2017 (a)(b)(c)(e)(j) | | | 12,045,000 |
| | | — |
| |
2,829,000
USD | | Lafarge SA 6.50% due 7/15/2016
| | | 1,964,276 |
| | | 2,102,479 |
| |
2,000,000
USD | | Legrand SA 8.50%
due 2/15/2025 | | | 2,059,920 |
| | | 1,594,152 |
| |
6,352,000
EUR | | Wendel 4.875% due 11/4/2014
| | | 6,749,137 |
| | | 5,678,497 |
| |
1,950,000
EUR | | Wendel 4.875% due 9/21/2015 (i)
| | | 1,354,150 |
| | | 1,717,416 |
| |
5,562,000
EUR | | Wendel 5.00% due 2/16/2011
| | | 5,610,982 |
| | | 6,740,175 |
| |
| | | | 39,433,065 | | | | 17,832,719 | | |
| Ireland 0.00% | | | |
22,300,000
EUR | | Waterford Wedgwood PLC 9.875%
due 12/1/2010 (b)(c)(h)(j) | | | 27,682,258 |
| | | — |
| |
| Jersey 0.07% | | | |
5,500,000
EUR
| | Independent News & Media
Finance Limited 5.75%
due 5/17/2009 | | | 6,435,480 |
| | | 4,006,309 |
| |
| Netherlands 0.78% | | | |
23,350,000
EUR | | UPC Holding BV 7.75%
due 1/15/2014 (i) | | | 27,240,977 |
| | | 27,986,886 |
| |
12,740,000
EUR | | UPC Holding BV 8.625%
due 1/15/2014 (i) | | | 14,986,200 |
| | | 15,691,754 |
| |
| | | | 42,227,177 | | | | 43,678,640 | | |
| United Kingdom 0.02% | | | |
1,000,000
GBP | | Marks & Spencer PLC 6.375%
due 11/7/2011 | | | 1,751,776 |
| | | 1,496,885 |
| |
| Total International Corporate Bonds | | | 170,469,359 | | | | 91,532,033 | | |
See Notes to Financial Statements.
44
Schedule of Investments | Six Month Period Ended April 30, 2009 (unaudited)
| PRINCIPAL AMOUNT | | DESCRIPTION | | COST (NOTE 1) | | VALUE (NOTE 1) | |
| International Government Bonds—1.44% | | | |
| France 0.39% | |
| | 15,292,002
EUR | | | France Government Bond OAT
3.00% due 7/25/2012 (k) | | | $19,302,432
| | | | $21,722,324
| | |
| Singapore 0.79% | |
| | 20,033,000
SGD | | | Singapore Government Bond
2.375% due 10/1/2009 | | | 12,255,565
| | | | 13,657,314
| | |
| | 11,564,000
SGD | | | Singapore Government Bond
3.625% due 7/1/2011 | | | 8,197,463
| | | | 8,345,367
| | |
| | 32,082,000
SGD | | | Singapore Government Bond
4.625% due 7/1/2010 | | | 22,526,844
| | | | 22,766,588
| | |
| | | | 42,979,872 | | | | 44,769,269 | | |
| Taiwan 0.26% | |
| | 462,700,000
TWD | | | Taiwan Government Bond
2.00% due 7/20/2012 | | | 14,118,293
| | | | 14,493,596
| | |
| Total International Government Bonds | | | 76,400,597 | | | | 80,985,189 | | |
| Total International Bonds | | | 246,869,956 | | | | 172,517,222 | | |
| SHARES | | | | | | | |
| Investment Companies—0.07% | |
| | 100,000 | | | First NIS Regional Fund
SICAV (a)(b)(c)(e) | | | 1,000,000
| | | | 50,000
| | |
| | 34,500 | | | Third Avenue Global
Value Fund (a)(b)(e) | | | 3,450,000
| | | | 3,910,952
| | |
| Total Investment Companies | | | 4,450,000 | | | | 3,960,952 | | |
| PRINCIPAL AMOUNT | | | | | | | |
| U.S. Commercial Paper—7.67% | |
| $ | 7,000,000 | | | Altria Group, Inc. 1.05%
due 5/27/2009 | | | 6,994,692
| | | | 6,994,692
| | |
| | 10,279,000 | | | Altria Group, Inc. 1.05%
due 5/29/2009 | | | 10,270,605
| | | | 10,270,605
| | |
| | 12,500,000 | | | Altria Group, Inc. 1.60%
due 5/19/2009 | | | 12,490,000
| | | | 12,490,000
| | |
| | 8,125,000 | | | Altria Group, Inc. 1.60%
due 5/29/2009 | | | 8,114,889
| | | | 8,114,889
| | |
| | 20,000,000 | | | Altria Group, Inc. 1.65%
due 5/11/2009 | | | 19,990,833
| | | | 19,990,833
| | |
| | 10,000,000 | | | Avery Dennison Corporation
0.75% due 5/1/2009 | | | 10,000,000
| | | | 10,000,000
| | |
| | 6,998,000 | | | Avery Dennison Corporation
0.85% due 5/18/2009 | | | 6,995,191
| | | | 6,995,191
| | |
See Notes to Financial Statements.
45
Overseas Fund
| PRINCIPAL AMOUNT | | DESCRIPTION | | COST (NOTE 1) | | VALUE (NOTE 1) | |
| U.S. Commercial Paper—7.67%—(continued) | |
| $ | 15,963,000 | | | Avery Dennison Corporation | | $ | 15,953,200 | | | $ | 15,953,200 | | |
| | | | | 0.85% due 5/27/2009 | | | | | | | | | |
| | 10,000,000 | | | BMW 0.50% due 5/1/2009 | | | 10,000,000 | | | | 10,000,000 | | |
| | 4,000,000 | | | The Clorox Company 0.60%
due 5/22/2009 | | | 3,998,600 | | | | 3,998,600 | | |
| | 33,250,000 | | | The Coca-Cola Company
0.20% due 5/20/2009 | | | 33,246,490 | | | | 33,246,490 | | |
| | 32,374,000 | | | ConocoPhillips 0.20%
due 5/5/2009 | | | 32,373,281 | | | | 32,373,281 | | |
| | 20,000,000 | | | ConocoPhillips 0.27%
due 5/1/2009 | | | 20,000,000 | | | | 20,000,000 | | |
| | 18,000,000 | | | Consolidated Edison, Inc.
0.30% due 5/1/2009 | | | 18,000,000 | | | | 18,000,000 | | |
| | 4,717,000 | | | Emerson Electric Company
0.20% due 5/26/2009 | | | 4,716,345 | | | | 4,716,345 | | |
| | 5,893,000 | | | H.J. Heinz Company Limited
0.40% due 6/4/2009 | | | 5,890,774 | | | | 5,890,774 | | |
| | 5,487,000 | | | H.J. Heinz Company Limited
0.60% due 5/19/2009 | | | 5,485,354 | | | | 5,485,354 | | |
| | 20,605,000 | | | H.J. Heinz Company Limited
1.00% due 5/11/2009 | | | 20,599,276 | | | | 20,599,276 | | |
| | 9,402,000 | | | Harley Davidson, Inc. 0.55%
due 5/18/2009 | | | 9,399,558 | | | | 9,399,558 | | |
| | 6,000,000 | | | Harley Davidson, Inc. 0.55%
due 5/19/2009 | | | 5,998,350 | | | | 5,998,350 | | |
| | 1,668,000 | | | Harley Davidson, Inc. 1.75%
due 5/7/2009 | | | 1,667,514 | | | | 1,667,514 | | |
| | 9,520,000 | | | ITT Corporation 1.50%
due 5/27/2009 | | | 9,509,687 | | | | 9,509,687 | | |
| | 13,925,000 | | | ITT Corporation 1.70%
due 5/22/2009 | | | 13,911,191 | | | | 13,911,191 | | |
| | 15,000,000 | | | ITT Corporation 1.75%
due 5/1/2009 | | | 15,000,000 | | | | 15,000,000 | | |
| | 12,349,000 | | | Kraft Foods, Inc. 0.55%
due 5/26/2009 | | | 12,344,283 | | | | 12,344,283 | | |
| | 11,441,000 | | | Moody's Corporation 0.50%
due 5/1/2009 | | | 11,441,000 | | | | 11,441,000 | | |
| | 3,848,000 | | | Moody's Corporation 0.55%
due 5/8/2009 | | | 3,847,588
| | | | 3,847,588
| | |
| | 12,000,000 | | | Moody's Corporation 0.55%
due 5/11/2009 | | | 11,998,167 | | | | 11,998,167 | | |
| | 16,442,000 | | | Nestle Capital Corporation
0.03% due 5/4/2009 | | | 16,441,959 | | | | 16,441,959 | | |
| | 10,000,000 | | | The Procter & Gamble Company
0.13% due 5/11/2009 | | | 9,999,639 | | | | 9,999,639 | | |
See Notes to Financial Statements.
46
Schedule of Investments | Six Month Period Ended April 30, 2009 (unaudited)
| PRINCIPAL AMOUNT | | DESCRIPTION | | COST (NOTE 1) | | VALUE (NOTE 1) | |
| U.S. Commercial Paper—7.67%—(continued) | |
| $ | 10,341,000 | | | Transocean, Inc. 0.60% | | $ | 10,341,000 | | | $ | 10,341,000 | | |
| | | | | due 5/1/2009 | | | | | | | | | |
| | 5,127,000 | | | Transocean, Inc. 0.65%
due 5/4/2009 | | | 5,126,722 | | | | 5,126,722 | | |
| | 39,066,000 | | | Transocean, Inc. 0.70%
due 5/11/2009 | | | 39,058,404 | | | | 39,058,404 | | |
| | 10,000,000 | | | Vulcan Materials Company
0.45% due 5/1/2009 | | | 10,000,000 | | | | 10,000,000 | | |
| Total Commercial Paper | | | 431,204,592 | | | | 431,204,592 | | |
| Total Investments—98.84% | | $ | 5,690,825,835 | | | | 5,558,735,462 | | |
| Other Assets in Excess of Liabilities—1.16% | | | | | 65,139,479 | | |
| Net Assets—100.00% | | | | $ | 5,623,874,941 | | |
(a) Non-income producing security/commodity.
(b) Security is deemed illiquid. At April 30, 2009, the value of these securities amounted to $111,115,325 or 1.98% of net assets.
(c) Securities valued in accordance with fair value procedures under the supervision of the Board of Trustees, representing $29,848,996 or 0.53% of net assets.
(d) An affiliate of the fund as defined by the Investment Company Act of 1940. An affiliate is defined as a company in which the Fund directly or indirectly owns, controls, or holds power to vote 5% or more of the outstanding voting securities.
(e) Represents interest in a restricted security which has not been registered with the Securities and Exchange Commission under the Securities Act of 1933. At April 30, 2009, the value of these securities amounted to $33,759,948 or 0.60% of net assets.
(f) Held through Financiere Bleue, LLC.
(g) Participation certificate security—A type of investment with a combination of share and bond-like features. This security does not come with voting rights.
(h) All or a portion of the security is exempt from registration under the Securities Act of 1933. Rule 144A securities may only be sold to qualified institutional buyers, pursuant to Rule 144A under the Securities Act of 1933.
(i) Represents a security registered under Regulation S. Bonds sold under Regulation S may not be offered, sold or delivered within the U.S., or for the account or benefit of, U.S. persons, except pursuant to an exemption from, or in a transaction not subject to, the registration requirements of the Securities Act of 1933.
(j) Defaulted security.
(k) Inflation protected security.
At April 30, 2009 cost is substantially identical for both book and federal income tax purposes; and net unrealized depreciation consisted of:
| Gross unrealized appreciation | | $ | 893,875,072 | | |
| Gross unrealized depreciation | | | (1,025,965,445 | ) | |
| Net unrealized depreciation | | $ | (132,090,373 | ) | |
See Notes to Financial Statements.
47
Overseas Fund
ADR — American Depository Receipt
CPO — Ordinary Participation Certificate
NVDR — Non-Voting Depository Receipt
PCL — Public Company Limited
PLC — Public Limited Company
RSP — Represents Non-Voting Shares
Currencies
EUR — Euro
GBP — British Pound
SGD — Singapore Dollar
TWD — Taiwan Dollar
USD — United States Dollar
Restricted Securities
| SECURITY | | ACQUISITION
DATE | | COST | | CARRYING VALUE PER
SHARE/PRINCIPAL | |
| FINEL | | 7/14/1999 | | $ | 9,152,131 | | | $ | — | | |
| FINEL 9.50% due 6/30/2017 | | 6/22/2005 | | | 9,649,600 | | | | — | | |
| FINEL 9.50% due 10/15/2017 | | 10/11/2005 | | | 12,045,000 | | | | — | | |
| First NIS Regional Fund SICAV | | 11/22/1994 | | | 1,000,000 | | | | 0.50 | | |
| Fregate | | 4/30/2004 | | | 23,235,900 | | | | 33.11 | | |
| Third Avenue Globlal Fund L.P. | | 6/30/1997 | | | 3,450,000 | | | | 113.61 | | |
Foreign Currency Exchange Contracts — Purchases
SETTLEMENT
DATES
THROUGH | | FOREIGN CURRENCY
TO BE RECEIVED | | U.S. $
TO BE
DELIVERED | | U.S. $ VALUE
AT APRIL 30,
2009 | | UNREALIZED
APPRECIATION
AT APRIL 30,
2009 | | UNREALIZED
DEPRECIATION
AT APRIL 30,
2009 | |
| 7/15/2009 | | | 87,373,000 | | | Euro | | $ | 113,078,137 | | | $ | 115,816,931 | | | $ | 2,738,794 | | | $ | — | | |
| 7/15/2009 | | | 18,055,000 | | | Pound Sterling | | | 25,804,489 | | | | 26,771,195 | | | | 966,706 | | | | — | | |
| 7/15/2009 | | | 28,848,000 | | | Pound Sterling | | | 42,475,795 | | | | 42,774,603 | | | | 298,808 | | | | — | | |
| | | | | | | | | $ | 181,358,421 | | | $ | 185,362,729 | | | $ | 4,004,308 | | | $ | — | | |
Foreign Currency Exchange Contracts — Sales
SETTLEMENT
DATES
THROUGH | | FOREIGN CURRENCY
TO BE DELIVERED | | U.S. $
TO BE
RECEIVED | | U.S. $ VALUE
AT APRIL 30,
2009 | | UNREALIZED
APPRECIATION
AT APRIL 30,
2009 | | UNREALIZED
DEPRECIATION
AT APRIL 30,
2009 | |
| 7/15/2009 | | | 583,661,000 | | | Euro | | $ | 776,996,330 | | | $ | 773,671,531 | | | $ | 3,324,799 | | | $ | — | | |
| 7/15/2009 | | | 46,903,000 | | | Pound Sterling | | | 69,388,298 | | | | 69,545,798 | | | | — | | | | (157,500 | ) | |
| 7/15/2009 | | | 24,804,000 | | | Swiss Franc | | | 22,323,361 | | | | 21,790,944 | | | | 532,417 | | | | — | | |
| 8/12/2009 | | | 22,571,295,000 | | | Japanese Yen | | | 247,460,270 | | | | 228,911,842 | | | | 18,548,428 | | | | — | | |
| 9/16/2009 | | | 31,129,233,000 | | | Japanese Yen | | | 327,817,415 | | | | 315,693,034 | | | | 12,124,381 | | | | — | | |
| | | | | | | | | $ | 1,443,985,674 | | | $ | 1,409,613,149 | | | $ | 34,530,025 | | | $ | (157,500 | ) | |
See Notes to Financial Statements.
48
Schedule of Investments | Six Month Period Ended April 30, 2009 (unaudited)
Affiliated Securities
| AFFILIATE | | SHARES
OCTOBER 31,
2008 | | GROSS
ADDITIONS | | GROSS
REDUCTIONS | | SHARES
APRIL 30,
2009 | | MARKET
VALUE
APRIL 30,
2009 | | REALIZED
GAIN/
(LOSS) | | DIVIDEND
INCOME | |
Chofu
Seisakusho
Company
Limited | | | 2,022,800 | | | | — | | | | — | | | | 2,022,800 | | | $ | 37,106,192 | | | $ | — | | | $ | 290,742 | | |
Deceuninck
NV | | | 2,027,619 | | | | — | | | | 127,186 | | | | 1,900,433 | | | | 5,663,100 | | | | (3,947,804 | ) | | | — | | |
Deutsche
Wohnen AG | | | 2,047,306 | | | | — | | | | — | | | | 2,047,306 | | | | 37,390,919 | | | | — | | | | — | | |
| FINEL | | | 3,593,581 | | | | — | | | | — | | | | 3,593,581 | | | | — | | | | — | | | | — | | |
Fuji Seal
International,
Inc. | | | 1,954,500 | | | | — | | | | 284,100 | | | | 1,670,400 | | | | 22,515,780 | | | | (1,541,383 | ) | | | 238,763 | | |
| Fursys, Inc. | | | 939,030 | | | | — | | | | — | | | | 939,030 | | | | 17,053,312 | | | | — | | | | 362,013 | | |
| Gaumont SA | | | 364,373 | | | | — | | | | — | | | | 364,373 | | | | 19,312,673 | | | | — | | | | 124,190 | | |
| Gewiss S.p.A. | | | 6,421,411 | | | | — | | | | 142,207 | | | | 6,279,204 | | | | 23,285,295 | | | | (423,433 | ) | | | — | | |
Hankuk Paper
Manufacturing
Company
Limited | | | 494,900 | | | | — | | | | — | | | | 494,900 | | | | 13,500,779 | | | | — | | | | 95,396 | | |
Haw Par
Corporation
Limited | | | 23,149,730 | | | | — | | | | — | | | | 23,149,730 | | | | 59,448,538 | | | | — | | | | — | | |
| Icom, Inc. | | | 853,360 | | | | — | | | | — | | | | 853,360 | | | | 17,288,605 | | | | — | | | | 162,636 | | |
Japan Wool
Textile
Company
Limited | | | 5,693,500 | | | | 819,000 | | | | — | | | | 6,512,500 | | | | 38,017,635 | | | | — | | | | 546,294 | | |
Laurent-
Perrier | | | 563,378 | | | | — | | | | — | | | | 563,378 | | | | 33,195,667 | | | | — | | | | — | | |
Maezawa
Kasei
Industries
Company
Limited | | | 2,068,330 | | | | — | | | | — | | | | 2,068,330 | | | | 18,698,190 | | | | — | | | | 325,206 | | |
Matsumoto
Yushi-Seiyaku
Company
Limited | | | 1,058,246 | | | | — | | | | — | | | | 1,058,246 | | | | 14,956,157 | | | | — | | | | 605,053 | | |
Nissay Dowa
General
Insurance
Company
Limited | | | 20,785,230 | | | | — | | | | — | | | | 20,785,230 | | | | 89,106,641 | | | | — | | | | 1,584,529 | | |
Nitto Kohki
Company
Limited | | | 2,832,150 | | | | — | | | | — | | | | 2,832,150 | | | | 49,082,563 | | | | — | | | | 539,761 | | |
Pfeiffer
Vacuum
Technology
AG | | | 915,140 | | | | — | | | | — | | | | 915,140 | | | | 61,061,127 | | | | — | | | | — | | |
See Notes to Financial Statements.
49
Overseas Fund
Affiliated Securities—(continued)
| AFFILIATE | | SHARES
OCTOBER 31,
2008 | | GROSS
ADDITIONS | | GROSS
REDUCTIONS | | SHARES
APRIL 30,
2009 | | MARKET
VALUE
APRIL 30,
2009 | | REALIZED
GAIN/
(LOSS) | | DIVIDEND
INCOME | |
| Robertet SA | | | 236,140 | | | | — | | | | — | | | | 236,140 | | | $ | 21,266,577 | | | $ | — | | | $ | — | | |
Sansei Yusoki
Company
Limited | | | 1,223,670 | | | | — | | | | — | | | | 1,223,670 | | | | 5,332,706 | | | | — | | | | 81,624 | | |
| Shimano, Inc. | | | 5,654,500 | | | | — | | | | 520,800 | | | | 5,133,700 | | | | 150,363,768 | | | | 4,018,269 | | | | 1,693,258 | | |
Shingakukai
Company
Limited | | | 1,444,600 | | | | — | | | | 20,500 | | | | 1,424,100 | | | | 3,507,209 | | | | (66,353 | ) | | | 81,423 | | |
Sucriere de
Pithiviers-
Le-Vieil | | | 39,143 | | | | — | | | | — | | | | 39,143 | | | | 24,624,466 | | | | — | | | | 1,318,103 | | |
T. Hasegawa
Company
Limited | | | 3,452,591 | | | | — | | | | — | | | | 3,452,591 | | | | 35,726,111 | | | | — | | | | 329,004 | | |
Tasman
Farms
Limited | | | 5,750,000 | | | | — | | | | — | | | | 5,750,000 | | | | 2,759,971 | | | | — | | | | — | | |
Yomeishu
Seizo
Company
Limited | | | 2,535,900 | | | | — | | | | — | | | | 2,535,900 | | | | 22,359,714 | | | | — | | | | 434,971 | | |
| Total | | $ | 822,623,695 | | | $ | (1,960,704 | ) | | $ | 8,812,966 | | |
See Notes to Financial Statements.
50
Schedule of Investments | Six Month Period Ended April 30, 2009 (unaudited)
| INDUSTRY DIVERSIFICATION FOR PORTFOLIO HOLDINGS | | PERCENT OF
NET ASSETS | |
| U.S. Common Stocks | |
| Materials | | | 1.09 | % | |
| Total U.S. Common Stocks | | | 1.09 | | |
| International Common Stocks | |
| Consumer Discretionary | | | 9.19 | | |
| Consumer Staples | | | 7.71 | | |
| Energy | | | 2.70 | | |
| Financials | | | 13.06 | | |
| Health Care | | | 7.17 | | |
| Industrials | | | 20.80 | | |
| Information Technology | | | 7.17 | | |
| Materials | | | 7.72 | | |
| Telecommunication Services | | | 0.44 | | |
| Total International Common Stocks | | | 75.96 | | |
| International Preferred Stocks | |
| Consumer Discretionary | | | 0.57 | | |
| Consumer Staples | | | 0.08 | | |
| Information Technology | | | 1.21 | | |
| Total International Preferred Stocks | | | 1.86 | | |
| Commodity | | | 9.13 | | |
| International Bonds | |
| Information Technology | | | 0.78 | | |
| Government Issues | | | 1.44 | | |
| Materials | | | 0.46 | | |
| Financials | | | 0.23 | | |
| Telecommunication Services | | | 0.09 | | |
| Consumer Discretionary | | | 0.03 | | |
| Industrials | | | 0.03 | | |
| Total International Bonds | | | 3.06 | | |
| Investment Companies | | | 0.07 | | |
| U.S. Commercial Paper | | | 7.67 | | |
| Total Investments | | | 98.84 | % | |
See Notes to Financial Statements.
51

Fund Overview | Data as of April 30, 2009 (unaudited)
INVESTMENT OBJECTIVE
First Eagle U.S. Value Fund seeks long-term growth of capital by investing primarily in equity and debt securities issued by U.S. corporations. Management utilizes a highly disciplined, bottom-up, value-oriented approach in achieving its investment objective.
Average Annual Returns
| | | ONE-YEAR | | FIVE-YEARS | | SINCE
INCEPTION
(09-04-01) | |
First Eagle U.S. Value
Fund (A Shares) | |
| without sales charge | | | -19.69 | % | | | 3.67 | % | | | 7.35 | % | |
| with sales charge | | | -23.70 | | | | 2.61 | | | | 6.63 | | |
Standard & Poor's
500 Index | | | -35.31 | | | | -2.70 | | | | -1.50 | | |
| Consumer Price Index | | | -0.74 | | | | 2.55 | | | | 2.42 | | |
Asset Allocation
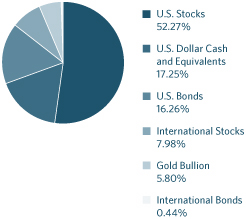
Sector/Industry
Consumer
Discretionary | | | 22.41 | % | |
| Energy | | | 10.04 | | |
| Materials | | | 8.56 | | |
| Industrials | | | 7.16 | | |
| Financials | | | 6.86 | | |
| Information Technology | | | 6.81 | | |
| Commodity (Gold Bullion) | | | 5.80 | | |
| Health Care | | | 5.72 | | |
| Government Bonds | | | 4.77 | | |
Telecommunication
Services | | | 2.30 | | |
| Utilities | | | 1.19 | | |
| Investment Company | | | 0.57 | | |
| Consumer Staples | | | 0.56 | | |
The Fund's portfolio composition (represented as a percentage of net assets) is subject to change at any time.
FIRST EAGLE FUNDS | SEMI-ANNUAL REPORT | APRIL 30, 2009
52
U.S. Value Fund
Growth of a $10,000 Initial Investment
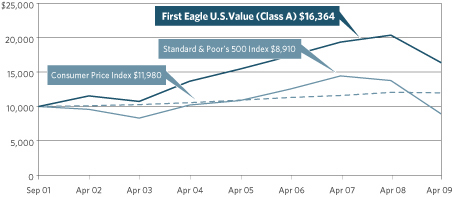
Performance data quoted herein represents past performance and should not be considered indicative of future results. Performance data quoted herein does not reflect the deduction of taxes that a shareholder would pay on Fund distributions or the sale of Fund shares.
The average annual returns shown above are historical and reflect changes in share price, reinvested dividends and are net of expenses. The average annual returns for Class A Shares with a sales charge gives effect to the deduction of the maximum sales charge of 5.00%.
The Standard & Poor's 500 Index is a widely recognized unmanaged index including a representative sample of 500 leading companies in leading sectors of the U.S. economy and is not available for purchase. Although the Standard & Poor's 500 Index focuses on the large-cap segment of the market, with approximately 75% coverage of U.S. equities, it is also considered a proxy for the total market. The Consumer Price Index (CPI) represents the change in price of all goods and services purchased for consumption by urban households.
Top 10 Holdings
| Gold Bullion (precious metal) | | | 5.80 | % | |
United States Treasury Inflation Indexed Bond 1.875% due 7/15/2013
(U.S. Treasury Bond) | | | 4.24 | | |
| Berkshire Hathaway, Inc., Class 'A' (U.S. holding company) | | | 2.85 | | |
| Cintas Corporation (U.S. uniform designer and manufacturer) | | | 2.84 | | |
| Sanofi-Aventis SA ADR (French health care company) | | | 2.69 | | |
| Blount, Inc. 8.75% due 8/1/2012 (U.S. outdoor industrial equipment manufacturer) | | | 2.24 | | |
| Newmont Mining Corporation (U.S. gold mining) | | | 2.07 | | |
| Home Depot, Inc. (U.S. home improvement retailer) | | | 2.05 | | |
| 3M Company (U.S. industrial conglomerate) | | | 2.02 | | |
| Helmerich & Payne, Inc. (U.S. contract energy drilling) | | | 1.93 | | |
FIRST EAGLE FUNDS | SEMI-ANNUAL REPORT | APRIL 30, 2009
53
First Eagle U.S. Value Fund
| NUMBER OF SHARES | | DESCRIPTION | | COST (NOTE 1) | | VALUE (NOTE 1) | |
| Common Stocks—58.67% | |
| U.S. Common Stocks—50.69% | | | |
| Consumer Discretionary 18.30% | |
| | 841,770 | | | Cintas Corporation | | $ | 27,123,402 | | | $ | 21,599,818 | | |
| | 591,550 | | | Home Depot, Inc. | | | 13,543,913 | | | | 15,569,596 | | |
| | 237,034 | | | Wal-Mart Stores, Inc. | | | 10,698,940 | | | | 11,946,514 | | |
| | 290,862 | | | Unifirst Corporation | | | 8,235,507 | | | | 10,846,244 | | |
| | 704,595 | | | Comcast Corporation , Class 'A' | | | 12,311,291 | | | | 10,343,455 | | |
| | 416,540 | | | International Speedway
Corporation , Class 'A' | | | 15,513,567 | | | | 9,863,667 | | |
| | 355,216 | | | Barnes & Noble, Inc. | | | 9,141,814 | | | | 9,278,242 | | |
| | 342,770 | | | Ascent Media Corporation (a) | | | 7,999,427 | | | | 8,829,755 | | |
| | 172,800 | | | Costco Wholesale Corporation | | | 7,069,497 | | | | 8,398,080 | | |
| | 257,710 | | | Omnicom Group, Inc. | | | 6,781,631 | | | | 8,110,134 | | |
| | 235,660 | | | Tiffany & Company | | | 5,459,355 | | | | 6,820,000 | | |
| | 83,960 | | | McDonald's Corporation | | | 1,738,460 | | | | 4,474,228 | | |
| | 106,310 | | | Copart, Inc. (a) | | | 2,822,656 | | | | 3,337,071 | | |
| | 89,907 | | | Weyco Group, Inc. | | | 1,447,668 | | | | 2,467,947 | | |
| | 262,005 | | | News Corporation , Class 'A' | | | 3,176,857 | | | | 2,164,161 | | |
| | 336,742 | | | Liberty Media Corporation -
Interactive , Series 'A' (a) | | | 5,856,746 | | | | 1,784,733 | | |
| | 58,216 | | | Liberty Media Corporation -
Entertainment , Series 'A' (a) | | | 84,175 | | | | 1,417,560 | | |
| | 14,554 | | | Liberty Media Corporation -
Capital , Series 'A' (a) | | | 711,727 | | | | 170,282 | | |
| | 102,830 | | | CBS Corporation , Class 'B' | | | 2,969,115 | | | | 723,923 | | |
| | 33,410 | | | Viacom, Inc. , Class 'B' (a) | | | 1,141,884 | | | | 642,808 | | |
| | 70,000 | | | Hampshire Group Limited (a)(b) | | | 1,171,963 | | | | 203,000 | | |
| | 600 | | | St. John Knits International, Inc. (a)(b) | | | 18,600 | | | | 2,430 | | |
| | | | 145,018,195 | | | | 138,993,648 | | |
| Energy 6.92% | |
| | 475,460 | | | Helmerich & Payne, Inc. | | | 11,745,451 | | | | 14,653,677 | | |
| | 199,050 | | | Apache Corporation | | | 13,212,920 | | | | 14,502,783 | | |
| | 233,918 | | | ConocoPhillips | | | 10,334,567 | | | | 9,590,638 | | |
| | 163,180 | | | Murphy Oil Corporation | | | 8,253,168 | | | | 7,785,318 | | |
| | 231,339 | | | San Juan Basin Royalty Trust | | | 8,214,910 | | | | 3,287,327 | | |
| | 42,171 | | | SEACOR Holdings, Inc. (a) | | | 2,999,870 | | | | 2,771,478 | | |
| | | | 54,760,886 | | | | 52,591,221 | | |
See Notes to Financial Statements.
54
Schedule of Investments | Six Month Period Ended April 30, 2009 (unaudited)
| NUMBER OF SHARES | | DESCRIPTION | | COST (NOTE 1) | | VALUE (NOTE 1) | |
| U.S. Common Stocks—50.69%—(continued) | | | |
| Financials 5.21% | |
| | 230 | | | Berkshire Hathaway, Inc. , Class 'A' (a) | | $ | 20,859,068 | | | $ | 21,620,000 | | |
| | 539,480 | | | American Express Company | | | 17,980,113 | | | | 13,605,685 | | |
| | 127,220 | | | Mercury General Corporation | | | 6,165,938 | | | | 4,297,492 | | |
| | 8,000 | | | LandCo Real Estate LLC (a)(b)(c)(d) | | | 27,840 | | | | 27,840 | | |
| | | | 45,032,959 | | | | 39,551,017 | | |
| Health Care 3.03% | |
| | 225,170 | | | Johnson & Johnson | | | 13,559,259 | | | | 11,789,901 | | |
| | 216,880 | | | WellPoint, Inc. (a) | | | 9,685,401 | | | | 9,273,789 | | |
| | 68,610 | | | DENTSPLY International, Inc. | | | 1,348,983 | | | | 1,963,618 | | |
| | | | 24,593,643 | | | | 23,027,308 | | |
| Industrials 4.65% | |
| | 266,960 | | | 3M Company | | | 18,570,921 | | | | 15,376,896 | | |
| | 150,890 | | | Alliant Techsystems, Inc. (a) | | | 13,666,436 | | | | 12,018,389 | | |
| | 1,239,695 | | | Blount International, Inc. (a) | | | 13,695,961 | | | | 7,934,048 | | |
| | | | 45,933,318 | | | | 35,329,333 | | |
| Information Technology 5.06% | |
| | 638,125 | | | Microsoft Corporation | | | 14,688,446 | | | | 12,928,412 | | |
| | 498,660 | | | Linear Technology Corporation | | | 12,826,697 | | | | 10,860,815 | | |
| | 661,104 | | | Intel Corporation | | | 11,185,906 | | | | 10,432,221 | | |
| | 364,335 | | | Dell, Inc. (a) | | | 5,377,844 | | | | 4,233,573 | | |
| | | | 44,078,893 | | | | 38,455,021 | | |
| Materials 6.25% | |
| | 390,712 | | | Newmont Mining Corporation | | | 17,168,282 | | | | 15,722,251 | | |
| | 339,520 | | | Rayonier, Inc. , REIT | | | 10,784,259 | | | | 13,112,262 | | |
| | 179,910 | | | Weyerhaeuser Company | | | 7,553,489 | | | | 6,343,627 | | |
| | 151,637 | | | Plum Creek Timber Company, Inc. , REIT | | | 4,966,204 | | | | 5,234,509 | | |
| | 95,350 | | | Deltic Timber Corporation | | | 4,565,760 | | | | 4,018,049 | | |
| | 64,050 | | | Vulcan Materials Company | | | 4,273,513 | | | | 3,045,578 | | |
| | | | 49,311,507 | | | | 47,476,276 | | |
| Telecommunication Services 0.55% | |
| | 217,050 | | | Cisco Systems, Inc. (a) | | | 3,354,947 | | | | 4,193,406 | | |
See Notes to Financial Statements.
55
U.S. Value Fund
| NUMBER OF SHARES | | DESCRIPTION | | COST (NOTE 1) | | VALUE (NOTE 1) | |
| U.S. Common Stocks—50.69%—(continued) | |
| Utilities 0.72% | |
| | 201,750 | | | IDACorporation, Inc. | | $ | 6,462,710 | | | $ | 4,835,948 | | |
| | 40,000 | | | Hawaiian Electric Industries, Inc. | | | 845,477 | | | | 621,600 | | |
| | | | 7,308,187 | | | | 5,457,548 | | |
| Total U.S. Common Stocks | | | 419,392,535 | | | | 385,074,778 | | |
| International Common Stocks—7.98% | |
| Canada 0.84% | |
| | 299,997 | | | Franco-Nevada Corporation | | | 4,988,710 | | | | 6,380,669 | | |
| France 2.69% | |
| | 712,230 | | | Sanofi-Aventis SA , ADR | | | 27,830,692 | | | | 20,455,246 | | |
| United Kingdom 4.45% | |
| | 1,079,510 | | | UTi Worldwide, Inc. | | | 14,274,699 | | | | 14,530,205 | | |
| | 455,205 | | | Willis Group Holdings Limited | | | 12,187,337 | | | | 12,522,689 | | |
| | 321,590 | | | Amdocs Limited (a) | | | 7,627,407 | | | | 6,730,879 | | |
| | | | 34,089,443 | | | | 33,783,773 | | |
| Total International Common Stocks | | | 66,908,845 | | | | 60,619,688 | | |
| Total Common Stocks | | | | | 486,301,380 | | | | 445,694,466 | | |
| U.S. Preferred Stocks—1.01% | |
| Consumer Staples 0.54% | |
| | 168,915 | | | Seneca Foods Corporation (a)(b)(d) | | | 2,542,171 | | | | 4,125,749 | | |
| Utilities 0.47% | |
| | 88,100 | | | Calenergy Capital Trust III (b) | | | 3,778,987 | | | | 3,524,000 | | |
| Total U.S. Preferred Stocks | | | | | 6,321,158 | | | | 7,649,749 | | |
| OUNCES | | | | | | | |
| Commodity—5.80% | |
| | 49,619 | | | Gold bullion (a) | | | 31,344,786 | | | | 44,093,555 | | |
| PRINCIPAL AMOUNT | | | | | | | |
| Bonds—16.70% | |
| U.S. Bonds—16.26% | |
| Corporate Bonds 10.62% | |
| $ | 500,000 | | | American Standard, Inc. | | | 500,457 | | | | 501,141 | | |
| | 8.25% due 6/1/2009 | | | | | | | | | |
| | 814,345 |
| | Avis Budget Car Rental LLC
7.625% due 5/15/2014 | | | 800,695
| | | | 236,160
| | |
See Notes to Financial Statements.
56
Schedule of Investments | Six Month Period Ended April 30, 2009 (unaudited)
| PRINCIPAL AMOUNT | | DESCRIPTION | | COST (NOTE 1) | | VALUE (NOTE 1) | |
| U.S. Bonds—16.26%—(continued) | | | |
| Corporate Bonds 10.62%—(continued) | |
| $ | 600,000 | | | Bausch & Lomb, Inc. | | $ | 512,658 | | | $ | 180,000 | | |
| | | | | 7.125% due 8/1/2028 (b) | | | | | | | | | |
| | 8,000,000 | | | Beazer Homes USA, Inc.
8.625% due 5/15/2011 | | | 7,039,989 | | | | 3,320,000 | | |
| | 17,429,000 | | | Blount, Inc. 8.875% due 8/1/2012 | | | 17,604,621 | | | | 16,993,275 | | |
| | 1,000,000 | | | Briggs & Stratton Corporation
8.875% due 3/15/2011 | | | 1,016,573 | | | | 1,007,500 | | |
| | 250,000 | | | Elizabeth Arden, Inc.
7.75% due 1/15/2014 | | | 250,000 | | | | 187,500 | | |
| | 1,075,000 | | | GATX Financial Corporation
8.875% due 6/1/2009 | | | 1,073,667 | | | | 1,076,838 | | |
| | 6,862,000 | | | Level 3 Financing, Inc.
9.25% due 11/1/2014 | | | 6,657,020 | | | | 5,532,488 | | |
| | 5,975,000 | | | Mueller Water Products, Inc.
7.375% due 6/1/2017 | | | 4,553,419 | | | | 3,555,125 | | |
| | 2,000,000 | | | Pulte Homes, Inc.
6.25% due 2/15/2013 | | | 1,821,868 | | | | 1,880,000 | | |
| | 3,800,000 | | | Sanmina-SCI Corporation
6.75% due 3/1/2013 | | | 3,385,742 | | | | 2,166,000 | | |
| | 2,000,000 | | | Sanmina-SCI Corporation
8.125% due 3/1/2016 | | | 1,763,294 | | | | 1,020,000 | | |
| | 10,169,000 | | | Sealy Mattress Company
8.25% due 6/15/2014 | | | 7,016,627 | | | | 6,813,230 | | |
| | 12,786,000 | | | Sirius XM Radio, Inc.
9.625% due 8/1/2013 | | | 12,390,876 | | | | 7,735,530 | | |
| | 9,500,000 | | | Texas Industries, Inc.
7.25% due 7/15/2013 (e) | | | 7,262,148 | | | | 7,766,250 | | |
| | 1,000,000 | | | Texas Industries, Inc.
7.25% due 7/15/2013 | | | 1,000,000 | | | | 817,500 | | |
| | 14,966,000 | | | Tronox Worldwide LLC
9.50% due 12/1/2012 (f) | | | 13,273,021 | | | | 2,619,050 | | |
| | 8,808,000 | | | Valassis Communications, Inc.
8.25% due 3/1/2015 | | | 8,115,472 | | | | 4,910,460 | | |
| | 250,000 | | | Visant Holding Corporation
10.25% due 12/1/2013 (b) | | | 189,365 | | | | 237,500 | | |
| | 5,424,000 | | | Yankee Acquisition Corporation,
Series 'B' 8.50% due 2/15/2015 | | | 5,512,476 | | | | 3,851,040 | | |
| | 12,697,000 | | | Yankee Acquisition Corporation,
Series 'B' 9.75% due 2/15/2017 | | | 12,691,982 | | | | 8,253,050 | | |
| | | | 114,431,970 | | | | 80,659,637 | | |
See Notes to Financial Statements.
57
U.S. Value Fund
| PRINCIPAL AMOUNT | | DESCRIPTION | | COST (NOTE 1) | | VALUE (NOTE 1) | |
| U.S. Bonds—16.26%—(continued) | | | |
| Government Obligations 4.77% | |
| $ | 31,535,322 | | | United States Treasury | | $ | 30,045,581 | | | $ | 32,175,868 | | |
| | | | | Inflation Indexed Bond | | | | | | |
| | |
| | | | | 1.875% due 7/15/2013 (g) | | | | | | | | | |
| | 3,997,611 | | | United States Treasury
Inflation Indexed Bond
2.375% due 4/15/2011 (g) | | | 4,084,697
| | | | 4,086,310
| | |
| | | | 34,130,278 | | | | 36,262,178 | | |
| Convertible Bond 0.87% | |
| | 8,307,000 | | | Boston Properties LP, REIT
3.625% due 2/15/2014 (e) | | | 5,968,353
| | | | 6,624,832
| | |
| Total U.S. Bonds | | | 154,530,601 | | | | 123,546,647 | | |
| International Bond—0.44% | | | |
| International Corporate Bond—0.44% | | | |
| Canada 0.44% | |
| | 3,520,000
USD | | | Celestica, Inc.
7.625% due 7/1/2013 | | | 3,328,988
| | | | 3,361,600
| | |
| Total Bonds | | | 157,859,589 | | | | 126,908,247 | | |
| NUMBER OF SHARES | | | | | | | |
| Investment Company—0.57% | |
| | 171,960 | | | PowerShares DB Agriculture Fund , ETF (a) | | | 4,071,817 | | | | 4,348,868 | | |
| PRINCIPAL AMOUNT | | | | | | | |
| U.S. Commercial Paper—15.96% | |
| $ | 7,000,000 | | | Altria Group, Inc. | | | 6,994,692 | | | | 6,994,692 | | |
| | | | | 1.05% due 5/27/2009 | | | | | | | | | |
| | 7,577,000 |
| | Altria Group, Inc.
1.05% due 5/28/2009 | | | 7,571,033
| | | | 7,571,033
| | |
| | 8,322,000 |
| | Altria Group, Inc.
1.05% due 5/29/2009 | | | 8,315,204
| | | | 8,315,204
| | |
| | 11,278,000 |
| | Avery Dennison Corporation
0.75% due 5/1/2009 | | | 11,278,000
| | | | 11,278,000
| | |
| | 6,567,000 |
| | Avery Dennison Corporation
0.85% due 5/18/2009 | | | 6,564,364
| | | | 6,564,364
| | |
| | 877,000 |
| | Avery Dennison Corporation
0.85% due 5/27/2009 | | | 876,462
| | | | 876,462
| | |
| | 7,000,000 |
| | The Clorox Company
0.60% due 5/22/2009 | | | 6,997,550
| | | | 6,997,550
| | |
| | 10,000,000 |
| | Consolidated Edison, Inc.
0.30% due 5/1/2009 | | | 10,000,000
| | | | 10,000,000
| | |
See Notes to Financial Statements.
58
Schedule of Investments | Six Month Period Ended April 30, 2009 (unaudited)
| PRINCIPAL AMOUNT | | DESCRIPTION | | COST (NOTE 1) | | VALUE (NOTE 1) | |
| U.S. Commercial Paper—15.96%—(continued) | |
| $ | 7,200,000 | | | Harley Davidson, Inc. | | $ | 7,198,130 | | | $ | 7,198,130 | | |
| | | | | 0.55% due 5/18/2009 | | | | | | | | | |
| | 7,000,000 | | | Harley Davidson, Inc.
0.55% due 5/19/2009 | | | 6,998,075 | | | | 6,998,075 | | |
| | 3,347,000 | | | ITT Corporation
1.50% due 5/18/2009 | | | 3,344,629 | | | | 3,344,629 | | |
| | 5,584,000 | | | Kraft Foods, Inc.
0.55% due 5/26/2009 | | | 5,581,867 | | | | 5,581,867 | | |
| | 7,000,000 | | | Moody's Corporation
0.50% due 5/1/2009 | | | 7,000,000 | | | | 7,000,000 | | |
| | 7,000,000 | | | Moody's Corporation
0.55% due 5/11/2009 | | | 6,998,931 | | | | 6,998,931 | | |
| | 6,200,000 | | | The Procter & Gamble Company
0.13% due 5/11/2009 | | | 6,199,776 | | | | 6,199,776 | | |
| | 6,618,000 | | | Transocean, Inc. 0.60% due 5/1/2009 | | | 6,618,000 | | | | 6,618,000 | | |
| | 5,465,000 | | | Transocean, Inc. 0.65% due 5/4/2009 | | | 5,464,704 | | | | 5,464,704 | | |
| | 7,234,000 | | | Transocean, Inc. 0.70% due 5/11/2009 | | | 7,232,593 | | | | 7,232,593 | | |
| Total U.S. Commercial Paper | | | 121,234,010 | | | | 121,234,010 | | |
| Total Investments—98.71% | | $ | 807,132,740 | | | | 749,928,895 | | |
| Other Assets in Excess of Liabilities—1.29% | | | | | 9,812,715 | | |
| Net Assets—100.00% | | | | $ | 759,741,610 | | |
(a) Non-income producing security/commodity.
(b) Security is deemed illiquid. At April 30, 2009, the value of these securities amounted to $8,300,519 or 1.09% of net assets.
(c) Represents interest in a restricted security which has not been registered with the Securities and Exchange Commission under the Securities Act of 1933. At April 30, 2009, the value of these securities amounted to $27,840 or 0.00% of net assets.
(d) Securities valued in accordance with fair value procedures under the supervision of the Board of Trustees, representing $4,153,589 or 0.54% of net assets.
(e) All or a portion of the security is exempt from registration under the Securities Act of 1933. Rule 144A securities may only be sold to qualified institutional buyers, pursuant to Rule 144A under the Securities Act of 1933.
(f) Defaulted security.
(g) Inflation protected security.
At April 30, 2009 cost is substantially identical for both book and federal income tax purposes; and net unrealized depreciation consisted of:
| Gross unrealized appreciation | | $ | 45,508,180 | | |
| Gross unrealized depreciation | | | (102,712,025 | ) | |
| Net unrealized depreciation | | $ | (57,203,845 | ) | |
See Notes to Financial Statements.
59
U.S. Value Fund
ADR — American Depository Receipt
ETF — Exchange Traded Fund
REIT — Real Estate Investment Trust
Currency
USD — United States Dollar
Restricted Securities
| SECURITY | | ACQUISITION
DATE | | COST | | CARRYING VALUE PER
SHARE/PRINCIPAL | |
| LandCo Real Estate LLC | | | 9/6/2006 | | | $ | 27,840 | | | $ | 3.48 | | |
| INDUSTRY DIVERSIFICATION FOR PORTFOLIO HOLDINGS | | PERCENT OF
NET ASSETS | |
| U.S. Common Stocks | |
| Consumer Discretionary | | | 18.30 | % | |
| Energy | | | 6.92 | | |
| Financials | | | 5.21 | | |
| Health Care | | | 3.03 | | |
| Industrials | | | 4.65 | | |
| Information Technology | | | 5.06 | | |
| Materials | | | 6.25 | | |
| Telecommunication Services | | | 0.55 | | |
| Utilities | | | 0.72 | | |
| Total U.S. Common Stocks | | | 50.69 | | |
| International Common Stocks | |
| Financials | | | 1.65 | | |
| Health Care | | | 2.69 | | |
| Industrials | | | 1.91 | | |
| Information Technology | | | 0.89 | | |
| Materials | | | 0.84 | | |
| Total International Common Stocks | | | 7.98 | | |
See Notes to Financial Statements.
60
Schedule of Investments | Six Month Period Ended April 30, 2009 (unaudited)
| INDUSTRY DIVERSIFICATION FOR PORTFOLIO HOLDINGS—(CONTINUED) | | PERCENT OF
NET ASSETS | |
| U.S. Preferred Stocks | |
| Consumer Staples | | | 0.54 | % | |
| Utilities | | | 0.47 | | |
| Total U.S. Preferred Stocks | | | 1.01 | | |
| Commodity | | | 5.80 | | |
| U.S. Bonds | |
| Government Issues | | | 4.77 | | |
| Consumer Discretionary | | | 4.11 | | |
| Industrials | | | 0.60 | | |
| Consumer Staples | | | 0.02 | | |
| Information Technology | | | 0.42 | | |
| Telecommunication Services | | | 1.75 | | |
| Materials | | | 1.47 | | |
| Energy | | | 3.12 | | |
| Total U.S. Bonds | | | 16.26 | | |
| International Bond | |
| Information Technology | | | 0.44 | | |
| Total International Bond | | | 0.44 | | |
| Investment Company | | | 0.57 | | |
| U.S. Commercial Paper | | | 15.96 | | |
| Total Investments | | | 98.71 | % | |
See Notes to Financial Statements.
61

Fund Overview | Data as of April 30, 2009 (unaudited)
INVESTMENT OBJECTIVE
First Eagle Gold Fund is a non-diversified fund whose investment objective is to provide exposure to the investment characteristics of gold and, to a limited extent, other precious metals. In seeking to achieve its objective, the Fund invests primarily in securities of companies engaged in mining, processing, dealing in or holding gold and other precious metals such as silver, platinum and palladium, both in the United States and in foreign countries.
Average Annual Returns
| | | ONE-YEAR | | FIVE-YEARS | | TEN-YEARS | |
First Eagle Gold
Fund (A Shares) | |
| without sales charge | | | -12.95 | % | | | 14.16 | % | | | 17.70 | % | |
| with sales charge | | | -17.30 | | | | 13.00 | | | | 17.26 | | |
| FTSE Gold Mines Index | | | -17.90 | | | | 10.34 | | | | 8.29 | | |
| MSCI World Index | | | -39.33 | | | | -1.02 | | | | -1.57 | | |
| Consumer Price Index | | | -0.74 | | | | 2.55 | | | | 2.52 | | |
Asset Allocation
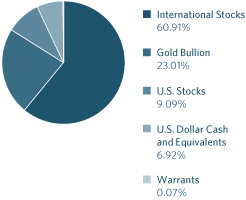
Countries
| United States | | | 32.10 | % | |
| Canada | | | 26.85 | | |
| South Africa | | | 12.64 | | |
| Australia | | | 6.52 | | |
| Africa | | | 5.46 | | |
| Papua New Guinea | | | 4.65 | | |
| Mexico | | | 4.21 | | |
| United Kingdom | | | 0.34 | | |
| Peru | | | 0.31 | | |
The Fund's portfolio composition (represented as a percentage of net assets) is subject to change at any time.
FIRST EAGLE FUNDS | SEMI-ANNUAL REPORT | APRIL 30, 2009
62
Gold Fund
Growth of a $10,000 Initial Investment

Performance data quoted herein represents past performance and should not be considered indicative of future results. Performance data quoted herein does not reflect the deduction of taxes that a shareholder would pay on Fund distributions or the sale of Fund shares. The average annual returns shown above are historical and reflect changes in share price, reinvested dividends and are net of expenses.
The average annual returns for Class A Shares with a sales charge give effect to the deduction of the maximum sales charge of 3.75% for periods prior to March 1, 2000 and of 5.00% thereafter.
The FTSE Gold Mines Index is an unmanaged index composed of approximately 19 mining companies and is only available without dividends reinvested and is not available for purchase. The MSCI World Index is a widely followed, unmanaged group of stocks from 23 international markets and is not available for purchase. The index provides total returns in U.S. dollars with net dividends reinvested. The Consumer Price Index (CPI) represents the change in price of all goods and services purchased for consumption by urban households.
Top 10 Holdings
| Gold Bullion (United States) | | | 23.01 | % | |
| Randgold Resources Limited, ADR (Africa) | | | 5.08 | | |
| Newcrest Mining Limited (Australia) | | | 4.89 | | |
| Newmont Mining Corporation (United States) | | | 4.73 | | |
| Lihir Gold Limited (Papua New Guinea) | | | 4.65 | | |
| Goldcorp, Inc. (Canada) | | | 4.62 | | |
| Harmony Gold Mining Company Limited, ADR (South Africa) | | | 4.55 | | |
| IAMGOLD Corporation (Canada) | | | 4.49 | | |
| Gold Fields Limited, ADR (South Africa) | | | 4.48 | | |
| Kinross Gold Corporation (Canada) | | | 4.26 | | |
FIRST EAGLE FUNDS | SEMI-ANNUAL REPORT | APRIL 30, 2009
63
First Eagle Gold Fund
| NUMBER OF SHARES | | DESCRIPTION | | COST (NOTE 1) | | VALUE (NOTE 1) | |
| Common Stocks—70.00% | | | |
| International Common Stocks—60.91% | | | |
| Africa 5.46% | | | |
| | 1,316,860 | | | Randgold Resources Limited , ADR | | $ | 23,235,862 | | | $ | 63,736,024 | | |
| | 3,415,000 | | | Centamin Egypt Limited (a) | | | 2,233,575 | | | | 2,774,911 | | |
| | 856,360 | | | Moto Goldmines Limited (a)(b) | | | 2,015,238 | | | | 2,030,156 | | |
| | | | | | | | 27,484,675 | | | | 68,541,091 | | |
| Australia 6.52% | | | |
| | 2,814,249 | | | Newcrest Mining Limited | | | 44,719,217 | | | | 61,323,413 | | |
| | 3,277,681 | | | Kingsgate Consolidated Limited (a) | | | 11,214,921 | | | | 14,384,541 | | |
| | 2,093,857 | | | Independence Group NL | | | 7,607,115 | | | | 6,034,680 | | |
| | | | | | | | 63,541,253 | | | | 81,742,634 | | |
| Canada 26.82% | | | |
| | 2,108,430 | | | GoldCorp, Inc. | | | 59,673,488 | | | | 58,023,994 | | |
| | 7,068,062 | | | IAMGOLD Corporation | | | 41,544,680 | | | | 56,307,660 | | |
| | 3,460,552 | | | Kinross Gold Corporation | | | 36,686,593 | | | | 53,465,528 | | |
| | 1,089,994 | | | Barrick Gold Corporation | | | 30,347,104 | | | | 31,718,825 | | |
| | 3,508,279 | | | Yamana Gold, Inc. | | | 33,998,629 | | | | 27,507,846 | | |
| | 3,560,884 | | | Minefinders Corporation (a)(c) | | | 26,421,943 | | | | 25,921,744 | | |
| | 1,036,793 | | | Franco-Nevada Corporation | | | 18,159,990 | | | | 22,051,664 | | |
| | 4,474,350 | | | Aurizon Mines Limited (a) | | | 6,394,385 | | | | 16,566,808 | | |
| | 8,620,771 | | | New Gold, Inc. (a) | | | 15,775,674 | | | | 15,526,415 | | |
| | 1,345,930 | | | Osisko Mining Corporation (a)(b) | | | 4,986,287 | | | | 6,313,892 | | |
| | 1,787,980 | | | Richmont Mines, Inc. (a)(c) | | | 5,728,117 | | | | 6,305,672 | | |
| | 2,923,230 | | | European Goldfields Limited (a) | | | 6,455,506 | | | | 6,195,411 | | |
| | 4,262,336 | | | Dundee Precious Metals, Inc. (a)(b) | | | 19,295,662 | | | | 6,069,924 | | |
| | 98,763 | | | Agnico-Eagle Mines Limited | | | 841,823 | | | | 4,364,187 | | |
| | 732,250 | | | Etruscan Resources, Inc. (a) | | | 1,842,613 | | | | 208,557 | | |
| | | | | | | | 308,152,494 | | | | 336,548,127 | | |
| Mexico 4.21% | | | |
| | 4,286,341 | | | Fresnillo PLC | | | 17,256,013 | | | | 33,932,351 | | |
| | 1,748,090 | | | Industrias Peñoles S.A.B. de C.V. | | | 3,596,561 | | | | 18,894,866 | | |
| | | | | | | | 20,852,574 | | | | 52,827,217 | | |
| Papua New Guinea 4.65% | | | |
| | 26,748,006 | | | Lihir Gold Limited (a) | | | 41,964,012 | | | | 58,401,590 | | |
| Peru 0.31% | | | |
| | 187,090 | | | Cia de Minas Buenaventura SA , ADR | | | 3,523,239 | | | | 3,958,824 | | |
See Notes to Financial Statements.
64
Schedule of Investments | Six-Month Period Ended April 30, 2009 (unaudited)
| NUMBER OF SHARES | | DESCRIPTION | | COST (NOTE 1) | | VALUE (NOTE 1) | |
| International Common Stocks—60.91%—(continued) | | | |
| South Africa 12.60% | | | |
| | 6,121,153 | | | Harmony Gold Mining Company
Limited , ADR (a) | | | $65,694,882
| | | | $57,049,146
| | |
| | 5,406,294 | | | Gold Fields Limited , ADR | | | 72,617,136 | | | | 56,225,458 | | |
| | 1,322,319 | | | AngloGold Ashanti Limited , ADR | | | 35,369,755 | | | | 40,727,425 | | |
| | 3,359,790 | | | Great Basin Gold Limited (a) | | | 3,472,135 | | | | 4,137,291 | | |
| | | | | | | | 177,153,908 | | | | 158,139,320 | | |
| United Kingdom 0.34% | | | |
| | 192,464 | | | Anglo American PLC | | | 11,768,440 | | | | 4,226,266 | | |
| Total International Common Stocks | | | | | 654,440,595 | | | | 764,385,069 | | |
| U.S. Common Stocks—9.09% | | | |
| Materials 9.09% | | | |
| | 1,476,437 | | | Newmont Mining Corporation | | | 59,767,151 | | | | 59,411,825 | | |
| | 1,399,501 | | | Royal Gold, Inc. | | | 32,160,351 | | | | 50,605,956 | | |
| | 1,897,230 | | | Anatolia Minerals Development
Limited (a)(b) | | | 3,459,238
| | | | 4,084,507
| | |
| Total U.S. Common Stocks | | | | | 95,386,740 | | | | 114,102,288 | | |
| Total Common Stocks | | | | | 749,827,335 | | | | 878,487,357 | | |
| Warrants—0.07% | | | |
| | 1,500,000 | | | Great Basin Gold Limited
Warrants exp 10/15/2010 (a) | | | —
| | | | 452,356
| | |
| | 650,000 | | | Dundee Precious Metals, Inc.
Warrants exp 11/20/2015 (a)(b) | | | —
| | | | 337,592
| | |
| | 100,000 | | | Osisko Mining Corporation
Warrants exp 11/17/2009 (a)(b) | | | —
| | | | 92,146
| | |
| Total Warrants | | | | | — | | | | 882,094 | | |
| OUNCES | | | | | | | |
| Commodity—23.01% | | | |
| | 324,877 | | | Gold bullion (a) | | | 140,331,566 | | | | 288,702,365 | | |
| PRINCIPAL AMOUNT | | | | | | | |
| U.S. Commercial Paper—7.45% | | | |
| | $6,337,000
| | | Altria Group, Inc.
1.05% due 5/28/2009 | | | 6,332,010
| | | | 6,332,010
| | |
| | 1,875,000 | | | Altria Group, Inc.
1.60% due 5/29/2009 | | | 1,872,667 | | | | 1,872,667 | | |
| | 12,033,000 | | | Avery Dennison Corporation
0.75% due 5/1/2009 | | | 12,033,000 | | | | 12,033,000 | | |
| | 2,355,000 | | | The Clorox Company
0.60% due 5/22/2009 | | | 2,354,176 | | | | 2,354,176 | | |
See Notes to Financial Statements.
65
Gold Fund
| PRINCIPAL AMOUNT | | DESCRIPTION | | COST (NOTE 1) | | VALUE (NOTE 1) | |
| U.S. Commercial Paper—7.45%—(continued) | |
| $ | 14,000,000 | | | Consolidated Edison, Inc. | | $ | 14,000,000 | | | $ | 14,000,000 | | |
| | | 0.30% due 5/1/2009 | | | | | | | | | |
| | 4,783,000 | | | Emerson Electric Company
0.20% due 5/26/2009 | | | 4,782,336 | | | | 4,782,336 | | |
| | 8,496,000 | | | Harley Davidson, Inc.
0.55% due 5/18/2009 | | | 8,493,793 | | | | 8,493,793 | | |
| | 2,142,000 | | | Kraft Foods, Inc.
0.55% due 5/26/2009 | | | 2,141,182 | | | | 2,141,182 | | |
| | 7,417,000 | | | Moody's Corporation
0.50% due 5/1/2009 | | | 7,417,000 | | | | 7,417,000 | | |
| | 12,000,000 | | | Moody's Corporation
0.55% due 5/11/2009 | | | 11,998,167 | | | | 11,998,167 | | |
| | 7,876,000 | | | The Procter & Gamble Company
0.13% due 5/11/2009 | | | 7,875,716 | | | | 7,875,716 | | |
| | 3,128,000 | | | Transocean, Inc.
0.65% due 5/4/2009 | | | 3,127,831 | | | | 3,127,831 | | |
| | 11,000,000 | | | Transocean, Inc.
0.70% due 5/11/2009 | | | 10,997,861 | | | | 10,997,861 | | |
| Total U.S. Commercial Paper | | | | | 93,425,739 | | | | 93,425,739 | | |
| Total Investments—100.53% | | | | $ | 983,584,640 | | | | 1,261,497,555 | | |
| Liabilities in Excess of Other Assets—(0.53)% | | | | | | | | | (6,671,048 | ) | |
| Net Assets—100.00% | | | | | | | | $ | 1,254,826,507 | | |
(a) Non-income producing security/commodity.
(b) All or a portion of the security is exempt from registration under the Securities Act of 1933. Rule 144A securities may only be sold to qualified institutional buyers, pursuant to Rule 144A under the Securities Act of 1933.
(c) An affiliate of the fund as defined by the Investment Company Act of 1940. An affiliate is defined as a company in which the Fund directly or indirectly owns, controls, or holds power to vote 5% or more of the outstanding voting securities.
At April 30, 2009 cost is substantially identical for both book and federal income tax purposes; and net unrealized appreciation consisted of:
| Gross unrealized appreciation | | $ | 336,429,888 | | |
| Gross unrealized depreciation | | | (58,516,973 | ) | |
| Net unrealized appreciation | | $ | 277,912,915 | | |
ADR — American Depository Receipt
PLC — Public Limited Company
See Notes to Financial Statements.
66
Schedule of Investments | Six-Month Period Ended April 30, 2009 (unaudited)
Affiliated Securities
| | | SHARES
OCTOBER 31,
2008 | | GROSS
ADDITIONS | | GROSS
REDUCTIONS | | SHARES
APRIL 30,
2009 | | MARKET
VALUE
APRIL 30,
2009 | | REALIZED
GAIN/
(LOSS) | | DIVIDEND
INCOME | |
Minefinders
Corporation | | | 2,136,414 | | | | 1,424,470 | | | | — | | | | 3,560,884 | | | $ | 25,921,744 | | | $ | — | | | $ | — | | |
Richmont
Mines, Inc. | | | 1,787,980 | | | | — | | | | — | | | | 1,787,980 | | | | 6,305,672 | | | | — | | | | — | | |
| Total | | $ | 32,227,416 | | | $ | — | | | $ | — | | |
| INDUSTRY DIVERSIFICATION FOR PORTFOLIO HOLDINGS | | PERCENT OF
NET ASSETS | |
| International Common Stocks | |
| Materials | | | 60.91 | % | |
| U.S. Common Stocks | |
| Materials | | | 9.09 | | |
| Warrants | | | 0.07 | | |
| Commodity | | | 23.01 | | |
| U.S. Commercial Paper | | | 7.45 | | |
| Total Investments | | | 100.53 | % | |
FIRST EAGLE FUNDS | SEMI-ANNUAL REPORT | APRIL 30, 2009
67
This page was intentionally left blank.
Management's Discussion of Fund Performance
First Eagle Fund of America Class Y declined 4.40% for the six months ending April 2009 versus a decline of 8.53% for the S&P 500. The most significant contributors to the decline were Devon Energy Corporation and Atlas America, Inc. both domestic natural gas providers. The largest positive contributions were Valspar Corporation, a paint company and Praxair Inc., an industrial gas company.
The economic meltdown which began in earnest following the Lehman Brothers bankruptcy seems to be nearing an end. There are many impediments to returning to a period of robust economic growth, but economic stabilization at a minimum seems to be in the cards as a result of production declining faster than consumption and massive injections of capital into the system by the world's monetary and political authorities. Ultimately, the price for saving the system will have to be paid but that is a problem for the future.
We have chosen to become somewhat more concentrated in our holdings as the price declines in equity securities seemed to be random in many instances. Some of our favorite holdings declined as much as other holdings where we thought risks were higher.
We expect difficult, but not catastrophic economic conditions to persist. However, we believe that our holdings offer significant appreciation potential given their free cash flow characteristics in the current difficult environment versus the current historic low cost of money.
We look forward to reporting progress on the restoration of our asset values in the next few periods.
We thank you for your continued confidence.

Harold Levy
Portfolio Manager
May 2009

Harold Levy
First Eagle Fund of America Class Y will only accept additional investments from existing shareholders. However, Class A and Class C remain open to all investors.
Past performance is no guarantee of future results. Portfolio is actively managed and opinions expressed herein are subject to change.
FIRST EAGLE FUNDS | SEMI-ANNUAL REPORT | APRIL 30, 2009
69

Fund Overview | Data as of April 30, 2009 (unaudited)
INVESTMENT OBJECTIVE
First Eagle Fund of America is a non-diversified U.S. equity fund that seeks long-term capital appreciation. The Fund has a unique event-driven bias that focuses on identifying companies poised to benefit from change that the market has not yet recognized.
Average Annual Returns
| | | ONE-YEAR | | FIVE-YEARS | | TEN-YEARS | |
First Eagle
Fund of America
(Y Shares) | | | -31.38 | % | | | 1.71 | % | | | 3.56 | % | |
Standard & Poor's
500 Index | | | -35.31 | | | | -2.70 | | | | -2.48 | | |
Asset Allocation
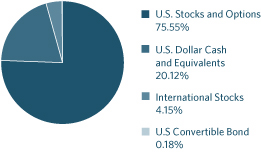
Sector/Industry*
| Health Care | | | 18.47 | % | |
| Materials | | | 17.92 | | |
| Energy | | | 14.52 | | |
| Industrials | | | 11.17 | | |
| Information Technology | | | 7.20 | | |
Consumer
Discretionary | | | 5.42 | | |
| Investment Company | | | 3.97 | | |
Telecommunication
Services | | | 2.72 | | |
| Consumer Staples | | | 2.56 | | |
| Financials | | | 0.10 | | |
* percentages exclude option positions
The Fund's portfolio composition (represented as a percentage of net assets) is subject to change at any time.
FIRST EAGLE FUNDS | SEMI-ANNUAL REPORT | APRIL 30, 2009
70
Fund of America
Growth of a $10,000 Initial Investment
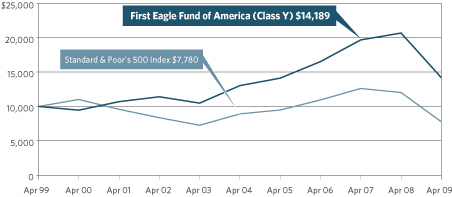
Performance data quoted herein represents past performance and should not be considered indicative of future results. Performance data quoted herein does not reflect the deduction of taxes that a shareholder would pay on Fund distributions or the sale of Fund shares.
The Fund's average annual returns shown above are historical and reflect changes in share price, reinvested dividends and is net of expenses.
The Standard & Poor's 500 Index is a widely recognized unmanaged index including a representative sample of 500 leading companies in leading sectors of the U.S. economy and is not available for purchase. Although the Standard & Poor's 500 Index focuses on the large-cap segment of the market, with approximately 75% coverage of U.S. equities, it is also considered a proxy for the total market.
As of September 1, 2005, First Eagle Fund of America Class Y is closed to new accounts.
Top 10 Holdings
| General Dynamics Corporation (aerospace and defense manufacturer) | | | 4.90 | % | |
| Dresser-Rand Group, Inc. (oil field services and equipment) | | | 4.43 | | |
| SPDR Gold Trust (exchange traded fund) | | | 3.97 | | |
| Praxair Inc. (specialty chemicals) | | | 3.86 | | |
| Valeant Pharmaceuticals International (pharmaceuticals company) | | | 3.83 | | |
| Crown Holdings, Inc. (containers and packaging manufacturer) | | | 3.82 | | |
| Ball Corporation (containers and packaging manufacturer) | | | 3.64 | | |
| Precision Castparts Corporation (metal components manufacturer) | | | 3.40 | | |
| Devon Energy Corporation (energy company) | | | 3.21 | | |
| The DIRECTV Group, Inc. (digital television services provider) | | | 3.09 | | |
FIRST EAGLE FUNDS | SEMI-ANNUAL REPORT | APRIL 30, 2009
71
First Eagle Fund of America
| NUMBER OF SHARES | | DESCRIPTION | | COST (NOTE 1) | | VALUE (NOTE 1) | |
| Common Stocks—79.64% | |
| U.S. Common Stocks—75.49% | | | |
| Consumer Discretionary 5.42% | |
| | 880,790 | | | The DIRECTV Group, Inc. (a)(b) | | $ | 20,125,753 | | | $ | 21,781,937 | | |
| | 267,200 | | | Yum! Brands, Inc. (b) | | | 7,935,638 | | | | 8,911,120 | | |
| | 133,600 | | | The Sherwin-Williams Company (b) | | | 7,061,807 | | | | 7,567,104 | | |
| | | | 35,123,198 | | | | 38,260,161 | | |
| Consumer Staples 2.56% | |
| | 873,490 | | | Dean Foods Company (a)(b) | | | 13,698,943 | | | | 18,081,243 | | |
| Energy 11.17% | |
| | 1,268,590 | | | Dresser-Rand Group, Inc. (a)(b) | | | 33,030,193 | | | | 31,245,372 | | |
| | 436,900 | | | Devon Energy Corporation (b) | | | 32,582,923 | | | | 22,653,265 | | |
| | 504,700 | | | Walter Energy, Inc. (b) | | | 11,525,527 | | | | 11,507,160 | | |
| | 707,165 | | | Atlas America, Inc. | | | 22,671,620 | | | | 11,003,487 | | |
| | 434,050 | | | McMoRan Exploration Company (a) | | | 6,235,955 | | | | 2,382,935 | | |
| | | | 106,046,218 | | | | 78,792,219 | | |
| Financials 0.10% | |
| | 91,342 | | | Walter Investment Management
Corporation , REIT (a) | | | 729,047 | | | | 730,736 | | |
| Health Care 17.62% | |
| | 1,614,250 | | | Valeant Pharmaceuticals
International (a)(b) | | | 25,122,463 | | | | 27,054,830 | | |
| | 506,540 | | | Chemed Corporation (b) | | | 22,182,984 | | | | 21,441,838 | | |
| | 2,554,830 | | | PDL BioPharma, Inc. (b) | | | 19,983,800 | | | | 18,267,034 | | |
| | 356,440 | | | Amgen, Inc. (a)(b) | | | 20,210,466 | | | | 17,276,647 | | |
| | 265,690 | | | Edwards Lifesciences
Corporation (a)(b) | | | 11,985,005 | | | | 16,839,432 | | |
| | 285,400 | | | Baxter International, Inc. (b) | | | 14,156,072 | | | | 13,841,900 | | |
| | 1,166,267 | | | Enzon Pharmaceuticals, Inc. (a) | | | 9,862,698 | | | | 6,706,035 | | |
| | 312,150 | | | Facet Biotech Corporation (a) | | | 5,492,992 | | | | 2,918,603 | | |
| | | | 128,996,480 | | | | 124,346,319 | | |
| Industrials 11.17% | |
| | 668,690 | | | General Dynamics Corporation (b) | | | 37,354,328 | | | | 34,551,212 | | |
| | 320,300 | | | Precision Castparts Corporation (b) | | | 24,495,132 | | | | 23,977,658 | | |
| | 966,790 | | | DynCorp International, Inc. (a) | | | 13,071,952 | | | | 14,743,548 | | |
| | 143,640 | | | Rockwell Collins, Inc. (b) | | | 6,781,247 | | | | 5,508,594 | | |
| | | | 81,702,659 | | | | 78,781,012 | | |
See Notes to Financial Statements.
72
Schedule of Investments | Six Month Period Ended April 30, 2009 (unaudited)
| NUMBER OF SHARES | | DESCRIPTION | | COST (NOTE 1) | | VALUE (NOTE 1) | |
| U.S. Common Stocks—75.49%—(continued) | | | |
| Information Technology 7.02% | |
| | 1,874,377 | | | L-1 Identity Solutions, Inc. (a)(c) | | $ | 24,318,664 | | | $ | 13,720,440 | | |
| | 1,039,350 | | | Nvidia Corporation (a)(b) | | | 13,098,615 | | | | 11,931,738 | | |
| | 547,920 | | | Agilent Technologies, Inc. (a)(b) | | | 15,003,609 | | | | 10,005,019 | | |
| | 1,844,580 | | | Atmel Corporation (a) | | | 7,219,448 | | | | 7,083,187 | | |
| | 1,763,506 | | | LSI Corporation (a) | | | 9,765,384 | | | | 6,771,863 | | |
| | | | 69,405,720 | | | | 49,512,247 | | |
| Materials 17.92% | |
| | 364,830 | | | Praxair, Inc. (b) | | | 25,275,762 | | | | 27,219,966 | | |
| | 1,223,870 | | | Crown Holdings, Inc. (a)(b) | | | 22,078,176 | | | | 26,986,334 | | |
| | 681,650 | | | Ball Corporation (b) | | | 23,139,297 | | | | 25,711,838 | | |
| | 828,470 | | | Valspar Corporation (b) | | | 15,823,866 | | | | 19,883,280 | | |
| | 343,560 | | | Eagle Materials, Inc. | | | 14,006,979 | | | | 9,550,968 | | |
| | 235,400 | | | Eastman Chemical Company (b) | | | 6,426,350 | | | | 9,340,672 | | |
| | 489,100 | | | Packaging Corporation of America (b) | | | 7,858,234 | | | | 7,762,017 | | |
| | | | 114,608,664 | | | | 126,455,075 | | |
| Telecommunication Services 2.51% | |
| | 249,390 | | | Leap Wireless International, Inc. (a)(b) | | | 9,646,909 | | | | 8,995,497 | | |
| | 1,133,312 | | | General Communication, Inc. (a) | | | 7,286,598 | | | | 8,681,170 | | |
| | | | 16,933,507 | | | | 17,676,667 | | |
| Total U.S. Common Stocks | | | 567,244,436 | | | | 532,635,679 | | |
| International Common Stocks—4.15% | | | |
| Bahamas 2.26% | |
| | 945,590 | | | Teekay Corporation | | | 34,964,269 | | | | 13,654,319 | | |
| | 190,830 | | | Teekay Tankers Limited | | | 3,567,511 | | | | 2,301,410 | | |
| | | | 38,531,780 | | | | 15,955,729 | | |
| Bermuda 0.21% | |
| | 208,400 | | | Global Crossing Limited (a) | | | 4,266,319 | | | | 1,512,984 | | |
| Canada 1.68% | |
| | 1,031,832 | | | MDS, Inc. (a) | | | 13,591,595 | | | | 6,025,899 | | |
| | 4,692,800 | | | UTS Energy Corporation (a) | | | 18,746,923 | | | | 5,818,089 | | |
| | | | 32,338,518 | | | | 11,843,988 | | |
| Total International Common Stocks | | | 75,136,617 | | | | 29,312,701 | | |
| Total Common Stocks | | | 642,381,053 | | | | 561,948,380 | | |
See Notes to Financial Statements.
73
Fund of America
| PRINCIPAL AMOUNT | | DESCRIPTION | | COST (NOTE 1) | | VALUE (NOTE 1) | |
| U.S. Bonds—15.63% | |
| Convertible Bond 0.18% | |
| $ | 1,800,000 | | | L-1 Identity Solutions, Inc. | | $ | 934,198 | | | $ | 1,257,750 | | |
| | | | | 3.75% due 5/15/2027 | | | | | | | | | |
| U.S. Treasury Bills 15.45% | |
| | 34,000,000 | | | U.S. Treasury Bill 0.20% due 6/4/2009 | | | 33,996,430 | | | | 33,996,430 | | |
| | 75,000,000 | | | U.S. Treasury Bill 0.26% due 7/2/2009 | | | 74,974,166 | | | | 74,989,650 | | |
| | | | 108,970,596 | | | | 108,986,080 | | |
| Total U.S. Bonds | | | 109,904,794 | | | | 110,243,830 | | |
| NUMBER OF SHARES | | | | | | | |
| Limited Partnership—0.26% | |
| | 135,200 | | | Teekay Offshore Partners LP | | | 2,726,300 | | | | 1,849,536 | | |
| Investment Company—3.97% | | | |
| | 320,900 | | | SPDR Gold Trust (b) | | | 29,409,497 | | | | 28,004,943 | | |
| Warrant—0.00% | |
| | 1,470,588 | | | Regen Biologics, Inc. (a)(c)(d)(e) | | | — | | | | — | | |
| PRINCIPAL AMOUNT | | | | | | | |
| Repurchase Agreement—5.58% | |
| $ | 39,391,000 | | | State Street Bank and Trust Company, | | | 39,391,000 | | | | 39,391,000 | | |
| | | | | 0.01%, dated 4/30/09 (collateralized by | | | | | | |
| | |
| | | | | United States Treasury Bill, 0.125% | | | | | | |
| | |
| | | | | due 8/27/09 valued at $40,182,942); | | | | | | |
| | |
| | | | | proceeds $39,391,011 | | | | | | | | | |
Total Investment Portfolio
Excluding Options Written—105.08% | | | 823,812,644 | | | | 741,437,689 | | |
| CONTRACTS | | | | EXPIRATION DATE | | | |
| Covered Call Options Written—(4.17)% | |
| | 822 | | | Agilent Technologies, Inc. @ $15 | | | May 2009 | | | | (277,425 | ) | |
| | 274 | | | Agilent Technologies, Inc. @ $17.5 | | | May 2009 | | | | (48,224 | ) | |
| | 108 | | | Amgen, Inc. @ $47.5 | | | June 2009 | | | | (35,100 | ) | |
| | 1,031 | | | Amgen, Inc. @ $50 | | | June 2009 | | | | (193,828 | ) | |
| | 207 | | | Amgen, Inc. @ $52.5 | | | June 2009 | | | | (21,114 | ) | |
| | 1,317 | | | Ball Corporation @ $40 | | | June 2009 | | | | (125,115 | ) | |
| | 90 | | | Ball Corporation @ $45 | | | June 2009 | | | | (1,125 | ) | |
| | 1,827 | | | Baxter International, Inc. @ $50 | | | June 2009 | | | | (237,510 | ) | |
| | 285 | | | Baxter International, Inc. @ $52.5 | | | June 2009 | | | | (18,525 | ) | |
| | 641 | | | Chemed Corporation @ $40 | | | June 2009 | | | | (262,810 | ) | |
| | 956 | | | Chemed Corporation @ $45 | | | June 2009 | | | | (167,300 | ) | |
| | 1,048 | | | Crown Holdings, Inc. @ $17.5 | | | May 2009 | | | | (482,080 | ) | |
See Notes to Financial Statements.
74
Schedule of Investments | Six Month Period Ended April 30, 2009 (unaudited)
| CONTRACTS | | DESCRIPTION | | EXPIRATION DATE | | VALUE (NOTE 1) | |
| Covered Call Options Written—(4.17)%—(continued) | |
| | 2,149 | | | Crown Holdings, Inc. @ $22.5 | | May 2009 | | $ | (96,705 | ) | |
| | 187 | | | Dean Foods Company @ $15 | | June 2009 | | | (109,395 | ) | |
| | 930 | | | Dean Foods Company @ $17.5 | | May 2009 | | | (316,200 | ) | |
| | 1,399 | | | Dean Foods Company @ $17.5 | | June 2009 | | | (510,635 | ) | |
| | 694 | | | Dean Foods Company @ $20 | | May 2009 | | | (98,895 | ) | |
| | 670 | | | Dean Foods Company @ $20 | | June 2009 | | | (122,275 | ) | |
| | 95 | | | Devon Energy Corporation @ $50 | | May 2009 | | | (28,500 | ) | |
| | 1,935 | | | The DIRECTV Group, Inc. @ $22.5 | | May 2009 | | | (541,800 | ) | |
| | 1,227 | | | The DIRECTV Group, Inc. @ $22.5 | | June 2009 | | | (368,100 | ) | |
| | 579 | | | The DIRECTV Group, Inc. @ $25 | | May 2009 | | | (49,215 | ) | |
| | 1,503 | | | The DIRECTV Group, Inc. @ $25 | | June 2009 | | | (300,600 | ) | |
| | 398 | | | Dresser-Rand Group, Inc. @ $17.5 | | May 2009 | | | (282,580 | ) | |
| | 682 | | | Dresser-Rand Group, Inc. @ $20 | | May 2009 | | | (323,950 | ) | |
| | 64 | | | Dresser-Rand Group, Inc. @ $20 | | June 2009 | | | (30,720 | ) | |
| | 674 | | | Dresser-Rand Group, Inc. @ $22.5 | | June 2009 | | | (207,255 | ) | |
| | 2,812 | | | Dresser-Rand Group, Inc. @ $25 | | June 2009 | | | (442,890 | ) | |
| | 1,907 | | | Eastman Chemical Company @ $25 | | June 2009 | | | (2,812,825 | ) | |
| | 272 | | | Eastman Chemical Company @ $35 | | June 2009 | | | (190,400 | ) | |
| | 175 | | | Eastman Chemical Company @ $40 | | June 2009 | | | (46,812 | ) | |
| | 133 | | | Edwards Lifesciences Corporation @ $65 | | June 2009 | | | (24,605 | ) | |
| | 1,168 | | | General Dynamics Corporation @ $40 | | May 2009 | | | (1,419,120 | ) | |
| | 587 | | | General Dynamics Corporation @ $45 | | May 2009 | | | (481,340 | ) | |
| | 199 | | | General Dynamics Corporation @ $55 | | August 2009 | | | (51,740 | ) | |
| | 517 | | | Leap Wireless International, Inc. @ $35 | | May 2009 | | | (155,100 | ) | |
| | 220 | | | Leap Wireless International, Inc. @ $35 | | June 2009 | | | (81,400 | ) | |
| | 1,054 | | | Leap Wireless International, Inc. @ $35 | | July 2009 | | | (449,004 | ) | |
| | 1,070 | | | Nvidia Corporation @ $10 | | May 2009 | | | (180,830 | ) | |
| | 9,323 | | | Nvidia Corporation @ $10 | | June 2009 | | | (1,817,985 | ) | |
| | 140 | | | Packaging Corporation of America @ $12.5 | | July 2009 | | | (51,800 | ) | |
| | 1,239 | | | Packaging Corporation of America @ $15 | | June 2009 | | | (210,630 | ) | |
| | 1,000 | | | PDL BioPharma, Inc. @ $7.5 | | June 2009 | | | (37,500 | ) | |
| | 1,383 | | | Praxair, Inc. @ $55 | | July 2009 | | | (2,648,445 | ) | |
| | 1,372 | | | Praxair, Inc. @ $60 | | May 2009 | | | (1,982,540 | ) | |
| | 153 | | | Praxair, Inc. @ $65 | | June 2009 | | | (161,415 | ) | |
| | 254 | | | Praxair, Inc. @ $65 | | July 2009 | | | (283,210 | ) | |
| | 156 | | | Praxair, Inc. @ $70 | | June 2009 | | | (115,440 | ) | |
| | 1,075 | | | Precision Castparts Corporation @ $50 | | June 2009 | | | (2,682,125 | ) | |
| | 732 | | | Precision Castparts Corporation @ $55 | | May 2009 | | | (1,460,340 | ) | |
| | 293 | | | Precision Castparts Corporation @ $60 | | May 2009 | | | (439,500 | ) | |
See Notes to Financial Statements.
75
Fund of America
| CONTRACTS | | DESCRIPTION | | EXPIRATION DATE | | VALUE (NOTE 1) | |
| Covered Call Options Written—(4.17)%—(continued) | |
| | 320 | | | Precision Castparts Corporation @ $65 | | June 2009 | | $ | (432,000 | ) | |
| | 160 | | | Precision Castparts Corporation @ $70 | | June 2009 | | | (150,400 | ) | |
| | 80 | | | Rockwell Collins, Inc. @ $35 | | May 2009 | | | (26,400 | ) | |
| | 712 | | | The Sherwin-Williams Company @ $50 | | June 2009 | | | (519,760 | ) | |
| | 624 | | | The Sherwin-Williams Company @ $55 | | June 2009 | | | (237,120 | ) | |
| | 163 | | | SPDR Gold Trust @ $88 | | May 2009 | | | (23,309 | ) | |
| | 171 | | | SPDR Gold Trust @ $90 | | May 2009 | | | (12,825 | ) | |
| | 58 | | | SPDR Gold Trust @ $94 | | May 2009 | | | (1,450 | ) | |
| | 60 | | | SPDR Gold Trust @ $97 | | June 2009 | | | (5,580 | ) | |
| | 543 | | | Valeant Pharmaceuticals
International @ $17.5 | | May 2009
| | | (21,720)
| | |
| | 1,903 | | | Valeant Pharmaceuticals
International @ $17.5 | | June 2009
| | | (195,058)
| | |
| | 1,985 | | | Valspar Corporation @ $17.5 | | July 2009 | | | (1,359,725 | ) | |
| | 3,925 | | | Walter Energy, Inc. @ $22.5 | | June 2009 | | | (1,208,250 | ) | |
| | 1,122 | | | Walter Energy, Inc. @ $25 | | June 2009 | | | (375,870 | ) | |
| | 1,789 | | | Yum! Brands, Inc. @ $29 | | July 2009 | | | (966,060 | ) | |
| | 883 | | | Yum! Brands, Inc. @ $30 | | July 2009 | | | (415,010 | ) | |
| Total Covered Call Options Written (Cost: $(20,714,422)) | | | | | (29,434,514 | ) | |
| Total Investments—100.91% (Cost: $803,098,222) | | | | | 712,003,175 | | |
| Liabilities in Excess of Other Assets— (0.91)% | | | | | (6,415,664 | ) | |
| Net Assets—100.00% | | | | $ | 705,587,511 | | |
(a) Non-income producing security/commodity.
(b) At April 30, 2009 all or a portion of this security was segregated to cover collateral requirement for options.
(c) All or a portion of the security is exempt from registration under the Securities Act of 1933. Rule 144A securities may only be sold to qualified institutional buyers, pursuant to Rule 144A under the Securities Act of 1933.
(d) Securities valued in accordance with fair value procedures under the supervision of the Board of Trustees, representing $0 or 0.00% of net assets.
(e) Security is deemed illiquid. At April 30, 2009, the value of these securities amounted to $0 or 0.00% of net assets.
At April 30, 2009 cost is substantially identical for both book and federal income tax purposes; and net unrealized depreciation consisted of:
| Gross unrealized appreciation | | $ | 36,403,314 | | |
| Gross unrealized depreciation | | | (127,498,361 | ) | |
| Net unrealized depreciation | | $ | (91,095,047 | ) | |
See Notes to Financial Statements.
76
Schedule of Investments | Six Month Period Ended April 30, 2009 (unaudited)
REIT — Real Estate Investment Trust
SPDR — Standard & Poor's Depository Receipts
| INDUSTRY DIVERSIFICATION FOR PORTFOLIO HOLDINGS | | PERCENT OF
NET ASSETS | |
| U.S. Common Stocks | |
| Consumer Discretionary | | | 5.42 | % | |
| Consumer Staples | | | 2.56 | | |
| Energy | | | 11.17 | | |
| Financials | | | 0.10 | | |
| Health Care | | | 17.62 | | |
| Industrials | | | 11.17 | | |
| Information Technology | | | 7.02 | | |
| Materials | | | 17.92 | | |
| Telecommunication Services | | | 2.51 | | |
| Total U.S. Common Stocks | | | 75.49 | | |
| International Common Stocks | |
| Energy | | | 3.09 | | |
| Health Care | | | 0.85 | | |
| Telecommunication Services | | | 0.21 | | |
| Total International Common Stocks | | | 4.15 | | |
| U.S. Bonds | |
| Information Technology | | | 0.18 | | |
| U.S. Treasury Bills | | | 15.45 | | |
| Total U.S. Bonds | | | 15.63 | | |
| Limited Partnership | | | 0.26 | | |
| Investment Company | | | 3.97 | | |
| Repurchase Agreement | | | 5.58 | | |
| Covered Call Options Written | | | (4.17 | ) | |
| Total Investments | | | 100.91 | % | |
See Notes to Financial Statements.
77
Statements of Assets and Liabilities
| | | FIRST EAGLE
GLOBAL FUND | | FIRST EAGLE
OVERSEAS FUND | | FIRST EAGLE
U.S. VALUE FUND | |
| Assets | |
| Investments, at Cost (Note 1) | |
| Unaffiliated issuers | | $ | 13,160,704,255 | | | $ | 4,516,936,865 | | | $ | 775,787,954 | | |
| Affiliated issuers | | | 3,731,416,030 | | | | 880,784,291 | | | | — | | |
| Gold Bullion | | | 693,749,790 | | | | 293,104,679 | | | | 31,344,786 | | |
| Foreign currency | | | 257 | | | | 4,025,429 | | | | — | | |
| | | | 17,585,870,332 | | | | 5,694,851,264 | | | | 807,132,740 | | |
| Investments, at Value (Note 1) | |
| Unaffiliated issuers | | | 11,669,955,950 | | | | 4,222,668,774 | | | | 705,835,340 | | |
| Affiliated issuers | | | 3,049,286,530 | | | | 822,623,695 | | | | — | | |
| Gold Bullion | | | 1,109,925,515 | | | | 513,442,993 | | | | 44,093,555 | | |
| Foreign currency | | | 257 | | | | 4,051,782 | | | | — | | |
| | | | 15,829,168,252 | | | | 5,562,787,244 | | | | 749,928,895 | | |
| Cash | | | — | | | | 7,690 | | | | 112 | | |
| Receivable for forward currency contracts held, at value (Note 1) | | | 81,478,839 | | | | 38,534,333 | | | | — | | |
| Receivable for investment securities sold | | | 25,508,265 | | | | 1,713,884 | | | | 982,312 | | |
| Receivable for premiums for written options | | | — | | | | — | | | | — | | |
| Receivable for Fund shares sold | | | 38,750,864 | | | | 14,368,165 | | | | 6,004,625 | | |
| Accrued interest and dividends receivable | | | 65,999,001 | | | | 31,727,514 | | | | 4,895,121 | | |
| Investment for trustee deferred compensation plan (Note 2) | | | 492,451 | | | | 553,464 | | | | 142,181 | | |
| Other assets | | | 476,165 | | | | 172,936 | | | | 18,022 | | |
| Total Assets | | | 16,041,873,837 | | | | 5,649,865,230 | | | | 761,971,268 | | |
| Liabilities | |
| Option contracts written, at value (premiums received $20,714,422) (Note 3) | | | — | | | | — | | | | — | | |
| Payable for Fund shares redeemed | | | 27,995,579 | | | | 11,528,997 | | | | 1,158,123 | | |
| Payable for investment securities purchased | | | 38,687,299 | | | | 4,614,150 | | | | — | | |
| Payable for forward currency contracts held, at value (Note 1) | | | 459,086 | | | | 157,500 | | | | — | | |
| Investment advisory fees payable (Note 2) | | | 9,532,099 | | | | 3,393,291 | | | | 438,133 | | |
| Distribution fees payable (Note 4) | | | 4,390,745 | | | | 1,053,931 | | | | 202,317 | | |
| Services fees payable (Note 4) | | | 864,120 | | | | 135,292 | | | | 42,681 | | |
| Trustee deferred compensation plan (Note 2) | | | 492,451 | | | | 553,464 | | | | 142,181 | | |
| Administrative costs payable (Note 2) | | | 296,148 | | | | 105,412 | | | | 13,645 | | |
| Trustee fees payable | | | 86,969 | | | | 46,123 | | | | 458 | | |
| Accrued expenses and other liabilities | | | 8,803,493 | | | | 4,402,129 | | | | 232,120 | | |
| Total Liabilities | | | 91,607,989 | | | | 25,990,289 | | | | 2,229,658 | | |
| Net Assets | | $ | 15,950,265,848 | | | $ | 5,623,874,941 | | | $ | 759,741,610 | | |
See Notes to Financial Statements.
78
| | | FIRST EAGLE
GOLD FUND | | FIRST EAGLE
FUND OF AMERICA | |
| Assets | |
| Investments, at Cost (Note 1) | |
| Unaffiliated issuers | | $ | 811,103,014 | | | $ | 823,812,644 | | |
| Affiliated issuers | | | 32,150,060 | | | | — | | |
| Gold Bullion | | | 140,331,566 | | | | — | | |
| Foreign currency | | | — | | | | — | | |
| | | | 983,584,640 | | | | 823,812,644 | | |
| Investments, at Value (Note 1) | |
| Unaffiliated issuers | | | 940,567,774 | | | | 741,437,689 | | |
| Affiliated issuers | | | 32,227,416 | | | | — | | |
| Gold Bullion | | | 288,702,365 | | | | — | | |
| Foreign currency | | | — | | | | — | | |
| | | | 1,261,497,555 | | | | 741,437,689 | | |
| Cash | | | 3,089 | | | | 792 | | |
| Receivable for forward currency contracts held, at value (Note 1) | | | — | | | | — | | |
| Receivable for investment securities sold | | | 25,237 | | | | — | | |
| Receivable for premiums for written options | | | — | | | | 487,036 | | |
| Receivable for Fund shares sold | | | 5,533,117 | | | | 3,243,305 | | |
| Accrued interest and dividends receivable | | | 3,742 | | | | 269,259 | | |
| Investment for trustee deferred compensation plan (Note 2) | | | 55,060 | | | | 299,628 | | |
| Other assets | | | 25,823 | | | | 85,227 | | |
| Total Assets | | | 1,267,143,623 | | | | 745,822,936 | | |
| Liabilities | |
| Option contracts written, at value (premiums received $20,714,422) (Note 3) | | | — | | | | 29,434,514 | | |
| Payable for Fund shares redeemed | | | 1,722,514 | | | | 931,779 | | |
| Payable for investment securities purchased | | | 8,790,566 | | | | 8,473,880 | | |
| Payable for forward currency contracts held, at value (Note 1) | | | — | | | | — | | |
| Investment advisory fees payable (Note 2) | | | 768,301 | | | | 559,462 | | |
| Distribution fees payable (Note 4) | | | 320,704 | | | | 167,321 | | |
| Services fees payable (Note 4) | | | 44,355 | | | | 13,729 | | |
| Trustee deferred compensation plan (Note 2) | | | 55,060 | | | | 299,628 | | |
| Administrative costs payable (Note 2) | | | 23,805 | | | | 13,056 | | |
| Trustee fees payable | | | 5,642 | | | | 3,713 | | |
| Accrued expenses and other liabilities | | | 586,169 | | | | 338,343 | | |
| Total Liabilities | | | 12,317,116 | | | | 40,235,425 | | |
| Net Assets | | $ | 1,254,826,507 | | | $ | 705,587,511 | | |
April 30, 2009 (unaudited)
FIRST EAGLE FUNDS | SEMI-ANNUAL REPORT | APRIL 30, 2009
79
Statements of Assets and Liabilities (continued)
| | | FirsT EaglE
GlobaL FunD | | FirsT EaglE
OverseaS FunD | | FirsT EaglE
U.S. ValuE FunD | |
| Net Assets Consist of | |
| Capital stock (par value, $0.001 per share) | | $ | 489,216 | | | $ | 352,810 | | | $ | 60,497 | | |
| Capital surplus | | | 18,277,226,229 | | | | 5,915,253,924 | | | | 820,009,952 | | |
| Net unrealized appreciation (depreciation) on: | |
| Investments | | | (1,756,702,080 | ) | | | (132,090,373 | ) | | | (57,203,845 | ) | |
| Foreign currency related translation | | | 80,636,146 | | | | 38,027,926 | | | | — | | |
| Written Options | | | — | | | | — | | | | — | | |
| Undistributed net realized losses on investments | | | (620,055,612 | ) | | | (113,823,128 | ) | | | (8,385,614 | ) | |
| Undistributed net investment income (loss) | | | (31,328,051 | ) | | | (83,846,218 | ) | | | 5,260,620 | | |
| Net Assets | | $ | 15,950,265,848 | | | $ | 5,623,874,941 | | | $ | 759,741,610 | | |
| Class A | |
| Net assets | | $ | 9,011,743,569 | | | $ | 3,222,551,057 | | | $ | 388,969,658 | | |
| Shares outstanding | | | 275,511,195 | | | | 202,467,996 | | | | 30,971,210 | | |
| Net asset value per share and redemption proceeds per share | | $ | 32.71 | | | $ | 15.92 | | | $ | 12.56 | | |
| Offering price per share (NAV per share plus maximum sales charge)1 | | $ | 34.43 | | | $ | 16.76 | | | $ | 13.22 | | |
| Class I | |
| Net assets | | $ | 2,597,718,661 | | | $ | 1,733,755,231 | | | $ | 151,453,816 | | |
| Shares outstanding | | | 79,159,331 | | | | 107,503,248 | | | | 11,943,377 | | |
| Net asset value per share and redemption proceeds per share | | $ | 32.82 | | | $ | 16.13 | | | $ | 12.68 | | |
| Class C | |
| Net assets | | $ | 4,340,803,618 | | | $ | 667,568,653 | | | $ | 219,318,136 | | |
| Shares outstanding | | | 134,545,385 | | | | 42,838,716 | | | | 17,582,279 | | |
| Net asset value per share | | $ | 32.26 | | | $ | 15.58 | | | $ | 12.47 | | |
Redemption proceeds per share (NAV per share less maximum contingent
deferred sale charge)2 | | $ | 31.94 | | | $ | 15.42 | | | $ | 12.35 | | |
| Class Y | |
| Net assets | | | — | | | | — | | | | — | | |
| Shares outstanding | | | — | | | | — | | | | — | | |
| Net asset value per share and redemption proceeds per share | | | — | | | | — | | | | — | | |
1The maximum sales charge is 5.00% for class A shares. Classes I, C and Y have no front-end sales charges.
2The maximum CSDC (Contingent Deferred Sales Charge) is 1.00% for class C shares, which is charged on the lesser of the offering price or the net asset value at the time of sale by the shareholder. This pertains to investments of one year or less.
See Notes to Financial Statements.
80
| | | FIRST EAGLE
GOLD FUND | | FIRST EAGLE
FUND OF AMERICA | |
| Net Assets Consist of | �� |
| Capital stock (par value, $0.001 per share) | | $ | 63,561 | | | $ | 41,720 | | |
| Capital surplus | | | 1,011,208,134 | | | | 871,278,005 | | |
| Net unrealized appreciation (depreciation) on: | |
| Investments | | | 277,912,915 | | | | (82,374,955 | ) | |
| Foreign currency related translation | | | — | | | | — | | |
| Written Options | | | — | | | | (8,720,092 | ) | |
| Undistributed net realized losses on investments | | | (21,855,040 | ) | | | (73,579,920 | ) | |
| Undistributed net investment income (loss) | | | (12,503,063 | ) | | | (1,057,247 | ) | |
| Net Assets | | $ | 1,254,826,507 | | | $ | 705,587,511 | | |
| Class A | |
| Net assets | | $ | 918,268,332 | | | $ | 197,293,051 | | |
| Shares outstanding | | | 46,378,033 | | | | 11,653,439 | | |
| Net asset value per share and redemption proceeds per share | | $ | 19.80 | | | $ | 16.93 | | |
| Offering price per share (NAV per share plus maximum sales charge)1 | | $ | 20.84 | | | $ | 17.82 | | |
| Class I | |
| Net assets | | $ | 116,686,318 | | | | — | | |
| Shares outstanding | | | 5,835,373 | | | | — | | |
| Net asset value per share and redemption proceeds per share | | $ | 20.00 | | | | — | | |
| Class C | |
| Net assets | | $ | 219,871,857 | | | $ | 70,354,361 | | |
| Shares outstanding | | | 11,347,919 | | | | 4,638,094 | | |
| Net asset value per share | | $ | 19.38 | | | $ | 15.17 | | |
Redemption proceeds per share (NAV per share less maximum contingent
deferred sale charge)2 | | $ | 19.19 | | | $ | 15.02 | | |
| Class Y | |
| Net assets | | | — | | | $ | 437,940,099 | | |
| Shares outstanding | | | — | | | | 25,428,623 | | |
| Net asset value per share and redemption proceeds per share | | | — | | | $ | 17.22 | | |
April 30, 2009 (unaudited)
FIRST EAGLE FUNDS | SEMI-ANNUAL REPORT | APRIL 30, 2009
81
Statements of Operations
| | | FIRST EAGLE
GLOBAL FUND | | FIRST EAGLE
OVERSEAS FUND | | FIRST EAGLE
U.S. VALUE FUND | |
| Investment Income | |
| Interest | | $ | 24,234,161 | | | $ | 10,251,697 | | | $ | 5,866,659 | | |
Dividends from: (net of $11,912,249, $5,784,250, $256,889,
$148,980 and $0, foreign taxes withheld, respectively) | |
| Unaffiliated issuers | | | 115,554,342 | | | | 51,601,180 | | | | 5,158,665 | | |
| Affiliated issuers | | | 42,588,470 | | | | 8,812,966 | | | | — | | |
| Other Income | | | 105 | | | | 494 | | | | — | | |
| Total Income | | | 182,377,078 | | | | 70,666,337 | | | | 11,025,324 | | |
| Expenses | |
| Investment advisory fees (Note 2) | | | 58,832,855 | | | | 21,320,751 | | | | 2,366,752 | | |
| Administrative costs (Note 2) | | | 2,057,162 | | | | 745,764 | | | | 82,575 | | |
| Distribution fees (Note 4) | |
| Class A | | | 11,140,852 | | | | 4,054,270 | | | | 392,141 | | |
| Class C | | | 15,874,891 | | | | 2,571,095 | | | | 732,215 | | |
| Class Y | | | — | | | | — | | | | — | | |
| Service fees - Class C (Note 4) | | | 5,291,630 | | | | 857,032 | | | | 244,072 | | |
| Shareholder servicing agent fees | | | 8,509,898 | | | | 3,227,281 | | | | 446,918 | | |
| Custodian and accounting fees | | | 2,102,337 | | | | 1,340,773 | | | | 45,091 | | |
| Shareholder reporting fees | | | 961,139 | | | | 357,580 | | | | 30,182 | | |
| Trustees' fees | | | 347,124 | | | | 134,387 | | | | 9,932 | | |
| Registration and filing fees | | | 273,100 | | | | 129,292 | | | | 51,651 | | |
| Professional fees | | | 428,388 | | | | 281,881 | | | | 38,432 | | |
| Other expenses | | | 305,888 | | | | 127,883 | | | | 9,221 | | |
| Total expenses | | | 106,125,264 | | | | 35,147,989 | | | | 4,449,182 | | |
| Expense reductions due to earnings credits (Note 1) | | | (7,349 | ) | | | (3,993 | ) | | | (765 | ) | |
| Net expenses | | | 106,117,915 | | | | 35,143,996 | | | | 4,448,417 | | |
| Net investment income (loss) (Note 1) | | | 76,259,163 | | | | 35,522,341 | | | | 6,576,907 | | |
Realized and Unrealized Gains (Losses) on Investments, Foreign
Currency Related Transactions and Written Options (Note 1) | |
| Net realized gains (losses) from: | |
| Investment transactions of unaffiliated issuers | | | (509,363,828 | ) | | | (80,617,109 | ) | | | (8,194,297 | ) | |
| Investment transactions of affiliated issuers | | | (37,822,968 | ) | | | (1,960,704 | ) | | | — | | |
| Net increase from payments by affiliate | | | 1,837 | | | | — | | | | — | | |
| Foreign currency related transactions | | | 516,748,104 | | | | 304,645,230 | | | | 665 | | |
| Written Options | | | — | | | | — | | | | — | | |
| | | | (30,436,855 | ) | | | 222,067,417 | | | | (8,193,632 | ) | |
| Changes in unrealized appreciation (depreciation) of: | |
| Investment transactions | | | 663,407,077 | | | | 127,286,224 | | | | 21,057,458 | | |
| Foreign currency related translation | | | (505,747,753 | ) | | | (294,027,711 | ) | | | — | | |
| Written Options | | | — | | | | — | | | | — | | |
| | | | 157,659,324 | | | | (166,741,487 | ) | | | 21,057,458 | | |
Net realized and unrealized gains (losses) on investments, foreign
currency related transactions and written options | | | 127,222,469 | | | | 55,325,930 | | | | 12,863,826 | | |
| Net Increase (Decrease) in Net Assets Resulting from Operations | | $ | 203,481,632 | | | $ | 90,848,271 | | | $ | 19,440,733 | | |
See Notes to Financial Statements.
82
For the Six Months Ended April 30, 2009 (unaudited)
| | | FIRST EAGLE
GOLD FUND | | FIRST EAGLE
FUND OF AMERICA | |
| Investment Income | |
| Interest | | $ | 1,323,642 | | | $ | 192,056 | | |
Dividends from: (net of $11,912,249, $5,784,250, $256,889,
$148,980 and $0, foreign taxes withheld, respectively) | |
| Unaffiliated issuers | | | 1,590,657 | | | | 3,750,289 | | |
| Affiliated issuers | | | — | | | | — | | |
| Other Income | | | — | | | | — | | |
| Total Income | | | 2,914,299 | | | | 3,942,345 | | |
| Expenses | |
| Investment advisory fees (Note 2) | | | 3,748,218 | | | | 3,183,367 | | |
| Administrative costs (Note 2) | | | 130,398 | | | | 83,360 | | |
| Distribution fees (Note 4) | |
| Class A | | | 920,719 | | | | 179,920 | | |
| Class C | | | 624,240 | | | | 227,936 | | |
| Class Y | | | — | | | | 539,943 | | |
| Service fees - Class C (Note 4) | | | 208,080 | | | | 75,979 | | |
| Shareholder servicing agent fees | | | 645,146 | | | | 453,596 | | |
| Custodian and accounting fees | | | 202,148 | | | | 32,809 | | |
| Shareholder reporting fees | | | 55,124 | | | | 34,712 | | |
| Trustees' fees | | | 16,860 | | | | 13,389 | | |
| Registration and filing fees | | | 54,908 | | | | 74,744 | | |
| Professional fees | | | 77,862 | | | | 52,707 | | |
| Other expenses | | | 17,529 | | | | 13,475 | | |
| Total expenses | | | 6,701,232 | | | | 4,965,937 | | |
| Expense reductions due to earnings credits (Note 1) | | | (489 | ) | | | (363 | ) | |
| Net expenses | | | 6,700,743 | | | | 4,965,574 | | |
| Net investment income (loss) (Note 1) | | | (3,786,444 | ) | | | (1,023,229 | ) | |
Realized and Unrealized Gains (Losses) on Investments, Foreign
Currency Related Transactions and Written Options (Note 1) | |
| Net realized gains (losses) from: | |
| Investment transactions of unaffiliated issuers | | | (20,615,709 | ) | | | (79,540,102 | ) | |
| Investment transactions of affiliated issuers | | | — | | | | — | | |
| Net increase from payments by affiliate | | | — | | | | — | | |
| Foreign currency related transactions | | | (13,305 | ) | | | — | | |
| Written Options | | | — | | | | 8,703,856 | | |
| | | | (20,629,014 | ) | | | (70,836,246 | ) | |
| Changes in unrealized appreciation (depreciation) of: | |
| Investment transactions | | | 293,382,270 | | | | 51,239,764 | | |
| Foreign currency related translation | | | — | | | | — | | |
| Written Options | | | — | | | | (9,653,334 | ) | |
| | | | 293,382,270 | | | | 41,586,430 | | |
Net realized and unrealized gains (losses) on investments, foreign
currency related transactions and written options | | | 272,753,256 | | | | (29,249,816 | ) | |
| Net Increase (Decrease) in Net Assets Resulting from Operations | | $ | 268,966,812 | | | $ | (30,273,045 | ) | |
FIRST EAGLE FUNDS | SEMI-ANNUAL REPORT | APRIL 30, 2009
83
Statements of Changes in Net Assets
| | | FIRST EAGLE
GLOBAL FUND | | FIRST EAGLE
OVERSEAS FUND | |
| | | SiX MonthS
EndeD
ApriL 30, 2009
(unaudited) | | YeaR EndeD
OctobeR 31,
2008 | | SiX MonthS
EndeD
ApriL 30, 2009
(unaudited) | | YeaR EndeD
OctobeR 31,
2008 | |
| Operations | |
| Net investment income (loss) | | $ | 76,259,163 | | | $ | 287,176,789 | | | $ | 35,522,341 | | | $ | 137,951,375 | | |
Net realized gain (loss) from investments, foreign currency
related transactions and written options | | | (30,436,855 | ) | | | 571,807,723 | | | | 222,067,417 | | | | 313,674,313 | | |
Change in unrealized appreciation (depreciation) of investments,
foreign currency translation and written options | | | 157,659,324 | | | | (6,731,622,390 | ) | | | (166,741,487 | ) | | | (3,144,942,612 | ) | |
| Net increase (decrease) in net assets resulting from operations | | | 203,481,632 | | | | (5,872,637,878 | ) | | | 90,848,271 | | | | (2,693,316,924 | ) | |
| Distribution to Shareholders | |
| Dividends paid from net investment income | |
| Class A | | | (39,077,415 | ) | | | (279,366,208 | ) | | | (3,998,540 | ) | | | (180,189,537 | ) | |
| Class I | | | (19,540,281 | ) | | | (74,255,465 | ) | | | (2,929,304 | ) | | | (121,691,715 | ) | |
| Class C | | | (7,250 | ) | | | (76,410,477 | ) | | | (7,588 | ) | | | (28,086,827 | ) | |
Distributions paid from net realized gains from
investment transactions | |
| Class A | | | (631,563,973 | ) | | | (1,149,497,548 | ) | | | (317,087,295 | ) | | | (652,293,124 | ) | |
| Class I | | | (178,533,975 | ) | | | (273,763,609 | ) | | | (174,084,325 | ) | | | (406,827,856 | ) | |
| Class C | | | (302,779,457 | ) | | | (481,349,457 | ) | | | (69,460,426 | ) | | | (133,975,356 | ) | |
| Decrease in net assets resulting from distributions | | | (1,171,502,351 | ) | | | (2,334,642,764 | ) | | | (567,567,478 | ) | | | (1,523,064,415 | ) | |
| Fund Share Transactions (Note 7) | |
| Net proceeds from shares sold | | | 2,031,937,092 | | | | 7,080,403,346 | | | | 1,051,591,519 | | | | 2,177,489,462 | | |
Net asset value of shares issued for reinvested dividends
and distributions | | | 964,568,563 | | | | 1,934,139,194 | | | | 487,753,631 | | | | 1,295,750,389 | | |
| Cost of shares redeemed | | | (3,384,674,874 | ) | | | (5,741,382,568 | ) | | | (1,662,051,008 | ) | | | (4,153,912,271 | ) | |
| Redemption fees | | | 1,628,224 | | | | 1,655,839 | | | | 559,136 | | | | 689,425 | | |
| Increase (decrease) in net assets from Fund share transactions | | | (386,540,995 | ) | | | 3,274,815,811 | | | | (122,146,722 | ) | | | (679,982,995 | ) | |
| Net increase (decrease) in net assets | | | (1,354,561,714 | ) | | | (4,932,464,831 | ) | | | (598,865,929 | ) | | | (4,896,364,334 | ) | |
| Net Assets (Note 1) | |
| Beginning of period | | | 17,304,827,562 | | | | 22,237,292,393 | | | | 6,222,740,870 | | | | 11,119,105,204 | | |
| End of period | | $15,950,265,848 | | $ | 17,304,827,562 | | | $ | 5,623,874,941 | | | $ | 6,222,740,870 | | |
| Undistributed net investment income (loss) | | $ | (31,328,051 | ) | | $ | (48,962,268 | ) | | $ | (83,846,218 | ) | | $ | (112,433,127 | ) | |
See Notes to Financial Statements.
84
| | | FIRST EAGLE
U.S. VALUE FUND | | FIRST EAGLE
GOLD FUND | |
| | | SIX MONTHS
ENDED
APRIL 30, 2009
(unaudited) | | YEAR ENDED
OCTOBER 31,
2008 | | SIX MONTHS
ENDED
APRIL 30, 2009
(unaudited) | | YEAR ENDED
OCTOBER 31,
2008 | |
| Operations | |
| Net investment income (loss) | | $ | 6,576,907 | | | $ | 12,501,110 | | | $ | (3,786,444 | ) | | $ | (5,374,345 | ) | |
Net realized gain (loss) from investments, foreign currency
related transactions and written options | | | (8,193,632 | ) | | | 6,453,735 | | | | (20,629,014 | ) | | | 51,876,811 | | |
Change in unrealized appreciation (depreciation) of investments,
foreign currency translation and written options | | | 21,057,458 | | | | (154,116,250 | ) | | | 293,382,270 | | | | (530,308,205 | ) | |
| Net increase (decrease) in net assets resulting from operations | | | 19,440,733 | | | | (135,161,405 | ) | | | 268,966,812 | | | | (483,805,739 | ) | |
| Distribution to Shareholders | |
| Dividends paid from net investment income | |
| Class A | | | (5,591,065 | ) | | | (5,722,863 | ) | | | — | | | | (25,074,580 | ) | |
| Class I | | | (2,247,106 | ) | | | (2,101,375 | ) | | | — | | | | (4,201,766 | ) | |
| Class C | | | (2,430,964 | ) | | | (2,651,972 | ) | | | — | | | | (4,460,113 | ) | |
Distributions paid from net realized gains from
investment transactions | |
| Class A | | | (2,846,360 | ) | | | (12,287,319 | ) | | | (34,328,380 | ) | | | (30,818,251 | ) | |
| Class I | | | (1,015,200 | ) | | | (3,944,580 | ) | | | (4,616,129 | ) | | | (4,799,864 | ) | |
| Class C | | | (1,987,359 | ) | | | (9,027,699 | ) | | | (7,932,453 | ) | | | (6,948,463 | ) | |
| Decrease in net assets resulting from distributions | | | (16,118,054 | ) | | | (35,735,808 | ) | | | (46,876,962 | ) | | | (76,303,037 | ) | |
| Fund Share Transactions (Note 7) | |
| Net proceeds from shares sold | | | 382,635,007 | | | | 250,653,753 | | | | 479,480,976 | | | | 293,412,807 | | |
Net asset value of shares issued for reinvested dividends
and distributions | | | 12,783,370 | | | | 29,227,280 | | | | 40,225,122 | | | | 62,146,503 | | |
| Cost of shares redeemed | | | (181,302,168 | ) | | | (228,317,642 | ) | | | (147,492,355 | ) | | | (387,225,293 | ) | |
| Redemption fees | | | 15,550 | | | | 81,890 | | | | 239,898 | | | | 153,422 | | |
| Increase (decrease) in net assets from Fund share transactions | | | 214,131,759 | | | | 51,645,281 | | | | 372,453,641 | | | | (31,512,561 | ) | |
| Net increase (decrease) in net assets | | | 217,454,438 | | | | (119,251,932 | ) | | | 594,543,491 | | | | (591,621,337 | ) | |
| Net Assets (Note 1) | |
| Beginning of period | | | 542,287,172 | | | | 661,539,104 | | | | 660,283,016 | | | | 1,251,904,353 | | |
| End of period | | $ | 759,741,610 | | | $ | 542,287,172 | | | $ | 1,254,826,507 | | | $ | 660,283,016 | | |
| Undistributed net investment income (loss) | | $ | 5,260,620 | | | $ | 8,952,848 | | | $ | (12,503,063 | ) | | $ | (8,716,619 | ) | |
FIRST EAGLE FUNDS | SEMI-ANNUAL REPORT | APRIL 30, 2009
85
Statements of Changes in Net Assets (continued)
| | | FIRST EAGLE
FUND OF AMERICA | |
| | | SIX MONTHS
ENDED
APRIL 30,2009
(unaudited) | | YEAR ENDED
OCTOBER 31,
2008 | |
| Operations | |
| Net investment loss | | $ | (1,023,229 | ) | | $ | (1,193,856 | ) | |
Net realized gain (loss) from investments, foreign currency
related transactions and written options | | | (70,836,246 | ) | | | 47,962,328 | | |
Change in unrealized appreciation (depreciation) of investments,
foreign currency translation and written options | | | 41,586,430 | | | | (338,387,730 | ) | |
| Net decrease in net assets resulting from operations | | | (30,273,045 | ) | | | (291,619,258 | ) | |
| Distribution to Shareholders | |
| Dividends paid from net investment income | |
| Class A | | | — | | | | (204,496 | ) | |
| Class C | | | — | | | | — | | |
| Class Y | | | — | | | | (1,385,075 | ) | |
Distributions paid from net realized gains from
investment transactions | |
| Class A | | | (8,260,418 | ) | | | (8,095,784 | ) | |
| Class C | | | (4,348,195 | ) | | | (6,936,699 | ) | |
| Class Y | | | (28,605,629 | ) | | | (71,479,766 | ) | |
| Decrease in net assets resulting from distributions | | | (41,214,242 | ) | | | (88,101,820 | ) | |
| Fund Share Transactions (Note 7) | |
| Net proceeds from shares sold | | | 158,206,860 | | | | 275,946,279 | | |
Net asset value of shares issued for reinvested dividends
and distributions | | | 34,915,646 | | | | 77,214,426 | | |
| Cost of shares redeemed | | | (105,099,118 | ) | | | (187,350,534 | ) | |
| Redemption fees | | | 7,313 | | | | 40,236 | | |
| Increase in net assets from Fund share transactions | | | 88,030,701 | | | | 165,850,407 | | |
| Net increase (decrease) in net assets | | | 16,543,414 | | | | (213,870,671 | ) | |
| Net Assets (Note 1) | |
| Beginning of period | | | 689,044,097 | | | | 902,914,768 | | |
| End of period | | $ | 705,587,511 | | | $ | 689,044,097 | | |
| Undistributed net investment loss | | $ | (1,057,247 | ) | | $ | (34,018 | ) | |
See Notes to Financial Statements.
86
This page was intentionally left blank.

Financial Highlights
| | | SIX MONTHS ENDED | | YEAR ENDED OCTOBER 31, | |
| | | APRIL 30, 2009 (unaudited) | | 2008 | | 2007 | |
| | | CLASS A | | CLASS I | | CLASS C | | CLASS A | | CLASS I | | CLASS C | | CLASS A | | CLASS I | | CLASS C | |
| Selected per share data* | |
| Net asset value, beginning of period | | $ | 34.45 | | | $ | 34.62 | | | $ | 33.99 | | | $ | 51.09 | | | $ | 51.32 | | | $ | 50.46 | | | $ | 48.36 | | | $ | 48.56 | | | $ | 47.83 | | |
| Income from investment operations: | |
| Net investment income | | | 0.18 | | | | 0.22 | | | | 0.06 | | | | 0.64 | | | | 0.76 | | | | 0.31 | | | | 0.67 | | | | 0.79 | | | | 0.31 | | |
Net realized and unrealized
gains (losses) on investments | | | 0.53 | | | | 0.54 | | | | 0.52 | | | | -11.82 | | | | -11.88 | | | | -11.69 | | | | 6.91 | | | | 6.94 | | | | 6.84 | | |
Total income (loss) from
investment operations | | | 0.71 | | | | 0.76 | | | | 0.58 | | | | -11.18 | | | | -11.12 | | | | -11.38 | | | | 7.58 | | | | 7.73 | | | | 7.15 | | |
| Less distributions: | |
| Dividends from net investment income | | | -0.14 | | | | -0.25 | | | | — | | | | -1.07 | | | | -1.19 | | | | -0.70 | | | | -1.22 | | | | -1.34 | | | | -0.89 | | |
| Distributions from capital gains | | | -2.31 | | | | -2.31 | | | | -2.31 | | | | -4.39 | | | | -4.39 | | | | -4.39 | | | | -3.63 | | | | -3.63 | | | | -3.63 | | |
| Total distributions | | | -2.45 | | | | -2.56 | | | | -2.31 | | | | -5.46 | | | | -5.58 | | | | -5.09 | | | | -4.85 | | | | -4.97 | | | | -4.52 | | |
| Net asset value, end of period | | $ | | 32.71 | | $ | 32.82 | | | $ | 32.26 | | | $ | 34.45 | | | $ | 34.62 | | | $ | 33.99 | | | $ | 51.09 | | | $ | 51.32 | | | $ | 50.46 | | |
| Total return(C) | | | 2.01 | %(a) | | | 2.15 | %(a) | | | 1.63 | %(a) | | | -24.41 | % | | | -24.21 | % | | | -24.99 | % | | | 16.91 | % | | | 17.19 | % | | | 16.03 | % | |
| Ratios and supplemental data | |
| Net assets, end of period (millions) | | $ | 9,012 | | | $ | 2,597 | | | $ | 4,341 | | | $ | 9,784 | | | $ | 2,898 | | | $ | 4,623 | | | $ | 13,451 | | | $ | 3,193 | | | $ | 5,593 | | |
Ratio of operating expenses to
average net assets including
earnings credits | | | 1.19 | %(b) | | | 0.94 | %(b) | | | 1.94 | %(b) | | | 1.14 | % | | | 0.89 | % | | | 1.89 | % | | | 1.12 | % | | | 0.87 | % | | | 1.87 | % | |
Ratio of operating expenses to average
net assets excluding earnings credits | | | 1.19 | %(b) | | | 0.94 | %(b) | | | 1.94 | %(b) | | | 1.14 | % | | | 0.89 | % | | | 1.89 | % | | | 1.12 | % | | | 0.87 | % | | | 1.87 | % | |
Ratio of net investment income to
average net assets including
earnings credits | | | 1.13 | %(b) | | | 1.39 | %(b) | | | 0.39 | %(b) | | | 1.48 | % | | | 1.74 | % | | | 0.73 | % | | | 1.40 | % | | | 1.64 | % | | | 0.65 | % | |
Ratio of net investment income
to average net assets excluding
earnings credits | | | 1.13 | %(b) | | | 1.39 | %(b) | | | 0.39 | %(b) | | | 1.48 | % | | | 1.74 | % | | | 0.73 | % | | | 1.39 | % | | | 1.64 | % | | | 0.64 | % | |
| Portfolio turnover rate | | | 6.85 | %(a) | | | 6.85 | %(a) | | | 6.85 | %(a) | | | 29.69 | % | | | 29.69 | % | | | 29.69 | % | | | 37.58 | % | | | 37.58 | % | | | 37.58 | % | |
*Per share amounts have been calculated using the average shares method.
(a) Not Annualized
(b) Annualized
(c) Does not give effect to the deduction of the CDSC (Contingent Deferred Sales Charge) of 1.00% for Class C shares.
See Notes to Financial Statements.
FIRST EAGLE FUNDS | SEMI-ANNUAL REPORT | APRIL 30, 2009
88
Global Fund
| | | YEAR ENDED OCTOBER 31, | |
| | | 2006 | | 2005 | | 2004 | |
| | | CLASS A | | CLASS I | | CLASS C | | CLASS A | | CLASS I | | CLASS C | | CLASS A | | CLASS I | | CLASS C | |
| Selected per share data* | |
| Net asset value, beginning of period | | $ | 42.47 | | | $ | 42.62 | | | $ | 42.06 | | | $ | 36.53 | | | $ | 36.64 | | | $ | 36.30 | | | $ | 32.37 | | | $ | 32.41 | | | $ | 32.15 | | |
| Income from investment operations: | |
| Net investment income | | | 0.59 | | | | 0.71 | | | | 0.25 | | | | 0.48 | | | | 0.60 | | | | 0.19 | | | | 0.50 | | | | 0.56 | | | | 0.23 | | |
Net realized and unrealized
gains (losses) on investments | | | 7.82 | | | | 7.85 | | | | 7.77 | | | | 6.07 | | | | 6.06 | | | | 6.01 | | | | 5.18 | | | | 5.22 | | | | 5.18 | | |
Total income (loss) from
investment operations | | | 8.41 | | | | 8.56 | | | | 8.02 | | | | 6.55 | | | | 6.66 | | | | 6.20 | | | | 5.68 | | | | 5.78 | | | | 5.41 | | |
| Less distributions: | |
| Dividends from net investment income | | | -0.84 | | | | -0.94 | | | | -0.57 | | | | -0.43 | | | | -0.50 | | | | -0.26 | | | | -0.67 | | | | -0.70 | | | | -0.41 | | |
| Distributions from capital gains | | | -1.68 | | | | -1.68 | | | | -1.68 | | | | -0.18 | | | | -0.18 | | | | -0.18 | | | | -0.85 | | | | -0.85 | | | | -0.85 | | |
| Total distributions | | | -2.52 | | | | -2.62 | | | | -2.25 | | | | -0.61 | | | | -0.68 | | | | -0.44 | | | | -1.52 | | | | -1.55 | | | | -1.26 | | |
| Net asset value, end of period | | $ | 48.36 | | | $ | 48.56 | | | $ | 47.83 | | | $ | 42.47 | | | $ | 42.62 | | | $ | 42.06 | | | $ | 36.53 | | | $ | 36.64 | | | $ | 36.30 | | |
| Total return(C) | | | 20.73 | % | | | 21.06 | % | | | 19.86 | % | | | 18.15 | % | | | 18.42 | % | | | 17.23 | % | | | 18.18 | % | | | 18.47 | % | | | 17.31 | % | |
| Ratios and supplemental data | |
| Net assets, end of period (millions) | | $ | 11,854 | | | $ | 2,641 | | | $ | 4,928 | | | $ | 9,526 | | | $ | 1,752 | | | $ | 3,828 | | | $ | 5,972 | | | $ | 641 | | | $ | 1,986 | | |
Ratio of operating expenses to
average net assets including
earnings credits | | | 1.13 | % | | | 0.88 | % | | | 1.88 | % | | | 1.20 | % | | | 0.95 | % | | | 1.95 | % | | | 1.24 | % | | | 0.99 | % | | | 1.99 | % | |
Ratio of operating expenses to average
net assets excluding earnings credits | | | 1.14 | % | | | 0.89 | % | | | 1.89 | % | | | 1.20 | % | | | 0.95 | % | | | 1.95 | % | | | 1.24 | % | | | 0.99 | % | | | 1.99 | % | |
Ratio of net investment income to
average net assets including
earnings credits | | | 1.31 | % | | | 1.57 | % | | | 0.56 | % | | | 1.21 | % | | | 1.48 | % | | | 0.47 | % | | | 1.46 | % | | | 1.67 | % | | | 0.66 | % | |
Ratio of net investment income
to average net assets excluding
earnings credits | | | 1.30 | % | | | 1.57 | % | | | 0.56 | % | | | 1.20 | % | | | 1.48 | % | | | 0.47 | % | | | 1.46 | % | | | 1.67 | % | | | 0.66 | % | |
| Portfolio turnover rate | | | 28.59 | % | | | 28.59 | % | | | 28.59 | % | | | 12.29 | % | | | 12.29 | % | | | 12.29 | % | | | 4.94 | % | | | 4.94 | % | | | 4.94 | % | |
FIRST EAGLE FUNDS | SEMI-ANNUAL REPORT | APRIL 30, 2009
89

Financial Highlights
| | | SIX MONTHS ENDED | | YEAR ENDED OCTOBER 31, | |
| | | APRIL 30, 2009 (unaudited) | | 2008 | | 2007 | |
| | | CLASS A | | CLASS I | | CLASS C | | CLASS A | | CLASS I | | CLASS C | | CLASS A | | CLASS I | | CLASS C | |
| Selected per share data* | |
| Net asset value, beginning of period | | $ | 17.21 | | | $ | 17.41 | | | $ | 16.93 | | | $ | 28.09 | | | $ | 28.38 | | | $ | 27.66 | | | $ | 26.70 | | | $ | 26.94 | | | $ | 26.33 | | |
| Income from investment operations: | |
| Net investment income | | | 0.10 | | | | 0.12 | | | | 0.04 | | | | 0.35 | | | | 0.40 | | | | 0.18 | | | | 0.41 | | | | 0.48 | | | | 0.21 | | |
Net realized and unrealized
gains (losses) on investments | | | 0.29 | | | | 0.29 | | | | 0.27 | | | | -7.21 | | | | -7.28 | | | | -7.10 | | | | 4.05 | | | | 4.10 | | | | 4.00 | | |
Total income (loss) from
investment operations | | | 0.39 | | | | 0.41 | | | | 0.31 | | | | -6.86 | | | | -6.88 | | | | -6.92 | | | | 4.46 | | | | 4.58 | | | | 4.21 | | |
| Less distributions: | |
| Dividends from net investment income | | | -0.02 | | | | -0.03 | | | | — | | | | -0.87 | | | | -0.94 | | | | -0.66 | | | | -0.87 | | | | -0.94 | | | | -0.68 | | |
| Distributions from capital gains | | | -1.66 | | | | -1.66 | | | | -1.66 | | | | -3.15 | | | | -3.15 | | | | -3.15 | | | | -2.20 | | | | -2.20 | | | | -2.20 | | |
| Total distributions | | | -1.68 | | | | -1.69 | | | | -1.66 | | | | -4.02 | | | | -4.09 | | | | -3.81 | | | | -3.07 | | | | -3.14 | | | | -2.88 | | |
| Net asset value, end of period | | $ | 15.92 | | | $ | 16.13 | | | $ | 15.58 | | | $ | 17.21 | | | $ | 17.41 | | | $ | 16.93 | | | $ | 28.09 | | | $ | 28.38 | | | $ | 27.66 | | |
| Total return(C) | | | 1.96 | %(a) | | | 2.04 | %(a) | | | 1.48 | %(a) | | | -28.15 | % | | | -27.97 | % | | | -28.67 | % | | | 18.20 | % | | | 18.52 | % | | | 17.31 | % | |
| Ratios and supplemental data | |
| Net assets, end of period (millions) | | $ | 3,222 | | | $ | 1,734 | | | $ | 668 | | | $ | 3,518 | | | $ | 1,968 | | | $ | 737 | | | $ | 5,974 | | | $ | 3,942 | | | $ | 1,203 | | |
Ratio of operating expenses to
average net assets including
earnings credits | | | 1.22 | %(b) | | | 0.97 | %(b) | | | 1.97 | %(b) | | | 1.15 | % | | | 0.90 | % | | | 1.90 | % | | | 1.12 | % | | | 0.87 | % | | | 1.87 | % | |
Ratio of operating expenses to average
net assets excluding earnings credits | | | 1.22 | %(b) | | | 0.97 | %(b) | | | 1.97 | %(b) | | | 1.15 | % | | | 0.90 | % | | | 1.90 | % | | | 1.12 | % | | | 0.87 | % | | | 1.87 | % | |
Ratio of net investment income to
average net assets including
earnings credits | | | 1.27 | %(b) | | | 1.51 | %(b) | | | 0.51 | %(b) | | | 1.57 | % | | | 1.76 | % | | | 0.82 | % | | | 1.54 | % | | | 1.80 | % | | | 0.79 | % | |
Ratio of net investment income
to average net assets excluding
earnings credits | | | 1.27 | %(b) | | | 1.51 | %(b) | | | 0.51 | %(b) | | | 1.57 | % | | | 1.76 | % | | | 0.82 | % | | | 1.54 | % | | | 1.79 | % | | | 0.78 | % | |
| Portfolio turnover rate | | | 2.96 | %(a) | | | 2.96 | %(a) | | | 2.96 | %(a) | | | 15.72 | % | | | 15.72 | % | | | 15.72 | % | | | 34.29 | % | | | 34.29 | % | | | 34.29 | % | |
*Per share amounts have been calculated using the average shares method.
(a) Not Annualized
(b) Annualized
(c) Does not give effect to the deduction of the CDSC (Contingent Deferred Sales Charge) of 1.00% for Class C shares.
See Notes to Financial Statements.
FIRST EAGLE FUNDS | SEMI-ANNUAL REPORT | APRIL 30, 2009
90
Overseas Fund
| | | YEAR ENDED OCTOBER 31, | |
| | | 2006 | | 2005 | | 2004 | |
| | | CLASS A | | CLASS I | | CLASS C | | CLASS A | | CLASS I | | CLASS C | | CLASS A | | CLASS I | | CLASS C | |
| Selected per share data* | |
| Net asset value, beginning of period | | $ | 24.13 | | | $ | 24.33 | | | $ | 23.83 | | | $ | 20.25 | | | $ | 20.37 | | | $ | 19.97 | | | $ | 17.50 | | | $ | 17.57 | | | $ | 17.28 | | |
| Income from investment operations: | |
| Net investment income | | | 0.39 | | | | 0.46 | | | | 0.20 | | | | 0.27 | | | | 0.33 | | | | 0.10 | | | | 0.17 | | | | 0.22 | | | | 0.03 | | |
Net realized and unrealized
gains (losses) on investments | | | 4.57 | | | | 4.60 | | | | 4.53 | | | | 3.96 | | | | 3.99 | | | | 3.93 | | | | 3.20 | | | | 3.22 | | | | 3.17 | | |
Total income (loss) from
investment operations | | | 4.96 | | | | 5.06 | | | | 4.73 | | | | 4.23 | | | | 4.32 | | | | 4.03 | | | | 3.37 | | | | 3.44 | | | | 3.20 | | |
| Less distributions: | |
| Dividends from net investment income | | | -0.81 | | | | -0.87 | | | | -0.65 | | | | -0.24 | | | | -0.25 | | | | -0.06 | | | | -0.47 | | | | -0.49 | | | | -0.36 | | |
| Distributions from capital gains | | | -1.58 | | | | -1.58 | | | | -1.58 | | | | -0.11 | | | | -0.11 | | | | -0.11 | | | | -0.15 | | | | -0.15 | | | | -0.15 | | |
| Total distributions | | | -2.39 | | | | -2.45 | | | | -2.23 | | | | -0.35 | | | | -0.36 | | | | -0.17 | | | | -0.62 | | | | -0.64 | | | | -0.51 | | |
| Net asset value, end of period | | $ | 26.70 | | | $ | 26.94 | | | $ | 26.33 | | | $ | 24.13 | | | $ | 24.33 | | | $ | 23.83 | | | $ | 20.25 | | | $ | 20.37 | | | $ | 19.97 | | |
| Total return(C) | | | 22.24 | % | | | 22.53 | % | | | 21.33 | % | | | 21.16 | % | | | 21.47 | % | | | 20.28 | % | | | 19.77 | % | | | 20.09 | % | | | 18.89 | % | |
| Ratios and supplemental data | |
| Net assets, end of period (millions) | | $ | 5,785 | | | $ | 4,031 | | | $ | 1,145 | | | $ | 4,866 | | | $ | 3,028 | | | $ | 994 | | | $ | 3,846 | | | $ | 2,152 | | | $ | 804 | | |
Ratio of operating expenses to
average net assets including
earnings credits | | | 1.12 | % | | | 0.87 | % | | | 1.87 | % | | | 1.18 | % | | | 0.93 | % | | | 1.93 | % | | | 1.25 | % | | | 1.00 | % | | | 2.00 | % | |
Ratio of operating expenses to average
net assets excluding earnings credits | | | 1.12 | % | | | 0.87 | % | | | 1.87 | % | | | 1.18 | % | | | 0.93 | % | | | 1.93 | % | | | 1.25 | % | | | 1.00 | % | | | 2.00 | % | |
Ratio of net investment income to
average net assets including
earnings credits | | | 1.57 | % | | | 1.82 | % | | | 0.81 | % | | | 1.21 | % | | | 1.46 | % | | | 0.46 | % | | | 0.90 | % | | | 1.17 | % | | | 0.17 | % | |
Ratio of net investment income
to average net assets excluding
earnings credits | | | 1.56 | % | | | 1.82 | % | | | 0.81 | % | | | 1.21 | % | | | 1.46 | % | | | 0.46 | % | | | 0.90 | % | | | 1.17 | % | | | 0.17 | % | |
| Portfolio turnover rate | | | 27.98 | % | | | 27.98 | % | | | 27.98 | % | | | 19.40 | % | | | 19.40 | % | | | 19.40 | % | | | 5.88 | % | | | 5.88 | % | | | 5.88 | % | |
FIRST EAGLE FUNDS | SEMI-ANNUAL REPORT | APRIL 30, 2009
91

Financial Highlights
| | | SIX MONTHS ENDED | | YEAR ENDED OCTOBER 31, | |
| | | APRIL 30, 2009 (unaudited) | | 2008 | | 2007 | |
| | | CLASS A | | CLASS I | | CLASS C | | CLASS A | | CLASS I | | CLASS C | | CLASS A | | CLASS I | | CLASS C | |
| Selected per share data* | |
| Net asset value, beginning of period | | $ | 12.75 | | | $ | 12.89 | | | $ | 12.63 | | | $ | 17.01 | | | $ | 17.19 | | | $ | 16.87 | | | $ | 16.19 | | | $ | 16.34 | | | $ | 16.08 | | |
| Income from investment operations: | |
| Net investment income | | | 0.13 | | | | 0.15 | | | | 0.09 | | | | 0.36 | | | | 0.40 | | | | 0.24 | | | | 0.33 | | | | 0.38 | | | | 0.21 | | |
Net realized and unrealized
gains (losses) on investments | | | 0.01 | | | | 0.00 | ** | | | 0.00 | ** | | | -3.65 | | | | -3.69 | | | | -3.63 | | | | 1.45 | | | | 1.46 | | | | 1.44 | | |
| Total income (loss) from investment operations | | | 0.14 | | | | 0.15 | | | | 0.09 | | | | -3.29 | | | | -3.29 | | | | -3.39 | | | | 1.78 | | | | 1.84 | | | | 1.65 | | |
| Less distributions: | |
| Dividends from net investment income | | | -0.22 | | | | -0.25 | | | | -0.14 | | | | -0.31 | | | | -0.35 | | | | -0.19 | | | | -0.30 | | | | -0.33 | | | | -0.20 | | |
| Distributions from capital gains | | | -0.11 | | | | -0.11 | | | | -0.11 | | | | -0.66 | | | | -0.66 | | | | -0.66 | | | | -0.66 | | | | -0.66 | | | | -0.66 | | |
| Total distributions | | | -0.33 | | | | -0.36 | | | | -0.25 | | | | -0.97 | | | | -1.01 | | | | -0.85 | | | | -0.96 | | | | -0.99 | | | | -0.86 | | |
| Net asset value, end of period | | $ | 12.56 | | | $ | 12.68 | | | $ | 12.47 | | | $ | 12.75 | | | $ | 12.89 | | | $ | 12.63 | | | $ | 17.01 | | | $ | 17.19 | | | $ | 16.87 | | |
| Total return(C) | | | 1.23 | %(a) | | | 1.29 | %(a) | | | 0.78 | %(a) | | | -20.56 | % | | | -20.36 | % | | | -21.17 | % | | | 11.47 | % | | | 11.78 | % | | | 10.65 | % | |
| Ratios and supplemental data | |
| Net assets, end of period (millions) | | $ | 389 | | | $ | 152 | | | $ | 219 | | | $ | 271 | | | $ | 104 | | | $ | 167 | | | $ | 324 | | | $ | 104 | | | $ | 233 | | |
Ratio of operating expenses to
average net assets including
earnings credits | | | 1.22 | %(b) | | | 0.97 | %(b) | | | 1.97 | %(b) | | | 1.20 | % | | | 0.95 | % | | | 1.96 | % | | | 1.20 | % | | | 0.95 | % | | | 1.95 | % | |
Ratio of operating expenses to average
net assets excluding
earnings credits | | | 1.22 | %(b) | | | 0.97 | %(b) | | | 1.97 | %(b) | | | 1.21 | % | | | 0.96 | % | | | 1.96 | % | | | 1.20 | % | | | 0.96 | % | | | 1.95 | % | |
Ratio of net investment income to
average net assets including
earnings credits | | | 2.28 | %(b) | | | 2.51 | %(b) | | | 1.49 | %(b) | | | 2.28 | % | | | 2.53 | % | | | 1.53 | % | | | 2.04 | % | | | 2.32 | % | | | 1.29 | % | |
Ratio of net investment income
to average net assets excluding
earnings credits | | | 2.28 | %(b) | | | 2.51 | %(b) | | | 1.49 | %(b) | | | 2.28 | % | | | 2.53 | % | | | 1.52 | % | | | 2.04 | % | | | 2.32 | % | | | 1.28 | % | |
| Portfolio turnover rate | | | 1.70 | %(a) | | | 1.70 | %(a) | | | 1.70 | %(a) | | | 21.75 | % | | | 21.75 | % | | | 21.75 | % | | | 32.54 | % | | | 32.54 | % | | | 32.54 | % | |
*Per share amounts have been calculated using the average shares method.
**Amount represents less than $0.01 per share.
(a) Not Annualized
(b) Annualized
(c) Does not give effect to the deduction of the CDSC (Contingent Deferred Sales Charge) of 1.00% for Class C shares.
See Notes to Financial Statements.
FIRST EAGLE FUNDS | SEMI-ANNUAL REPORT | APRIL 30, 2009
92
U.S. Value Fund
| | | YEAR ENDED OCTOBER 31, | |
| | | 2006 | | 2005 | | 2004 | |
| | | CLASS A | | CLASS I | | CLASS C | | CLASS A | | CLASS I | | CLASS C | | CLASS A | | CLASS I | | CLASS C | |
| Selected per share data* | |
| Net asset value, beginning of period | | $ | 14.95 | | | $ | 15.07 | | | $ | 14.90 | | | $ | 13.95 | | | $ | 14.05 | | | $ | 13.92 | | | $ | 12.71 | | | $ | 12.76 | | | $ | 12.61 | | |
| Income from investment operations: | |
| Net investment income | | | 0.29 | | | | 0.33 | | | | 0.17 | | | | 0.20 | | | | 0.24 | | | | 0.10 | | | | 0.22 | | | | 0.27 | | | | 0.13 | | |
Net realized and unrealized
gains (losses) on investments | | | 1.46 | | | | 1.48 | | | | 1.47 | | | | 1.35 | | | | 1.36 | | | | 1.35 | | | | 1.66 | | | | 1.65 | | | | 1.64 | | |
| Total income (loss) from investment operations | | | 1.75 | | | | 1.81 | | | | 1.64 | | | | 1.55 | | | | 1.60 | | | | 1.45 | | | | 1.88 | | | | 1.92 | | | | 1.77 | | |
| Less distributions: | |
| Dividends from net investment income | | | -0.24 | | | | -0.27 | | | | -0.19 | | | | -0.20 | | | | -0.23 | | | | -0.12 | | | | -0.32 | | | | -0.31 | | | | -0.14 | | |
| Distributions from capital gains | | | -0.27 | | | | -0.27 | | | | -0.27 | | | | -0.35 | | | | -0.35 | | | | -0.35 | | | | -0.32 | | | | -0.32 | | | | -0.32 | | |
| Total distributions | | | -0.51 | | | | -0.54 | | | | -0.46 | | | | -0.55 | | | | -0.58 | | | | -0.47 | | | | -0.64 | | | | -0.63 | | | | -0.46 | | |
| Net asset value, end of period | | $ | 16.19 | | | $ | 16.34 | | | $ | 16.08 | | | $ | 14.95 | | | $ | 15.07 | | | $ | 14.90 | | | $ | 13.95 | | | $ | 14.05 | | | $ | 13.92 | | |
| Total return(C) | | | 12.05 | % | | | 12.35 | % | | | 11.26 | % | | | 11.35 | % | | | 11.65 | % | | | 10.56 | % | | | 15.38 | % | | | 15.58 | % | | | 14.43 | % | |
| Ratios and supplemental data | |
| Net assets, end of period (millions) | | $ | 254 | | | $ | 115 | | | $ | 161 | | | $ | 150 | | | $ | 68 | | | $ | 97 | | | $ | 62 | | | $ | 54 | | | $ | 29 | | |
Ratio of operating expenses to
average net assets including
earnings credits | | | 1.25 | % | | | 0.99 | % | | | 1.99 | % | | | 1.28 | % | | | 1.04 | % | | | 2.02 | % | | | 1.38 | % | | | 1.13 | % | | | 2.13 | % | |
Ratio of operating expenses to average
net assets excluding
earnings credits | | | 1.25 | % | | | 1.00 | % | | | 2.00 | % | | | 1.28 | % | | | 1.04 | % | | | 2.02 | % | | | 1.38 | % | | | 1.13 | % | | | 2.13 | % | |
Ratio of net investment income to
average net assets including
earnings credits | | | 1.87 | % | | | 2.13 | % | | | 1.13 | % | | | 1.40 | % | | | 1.63 | % | | | 0.67 | % | | | 1.66 | % | | | 2.00 | % | | | 0.95 | % | |
Ratio of net investment income
to average net assets excluding
earnings credits | | | 1.87 | % | | | 2.12 | % | | | 1.12 | % | | | 1.40 | % | | | 1.63 | % | | | 0.66 | % | | | 1.66 | % | | | 2.00 | % | | | 0.95 | % | |
| Portfolio turnover rate | | | 31.76 | % | | | 31.76 | % | | | 31.76 | % | | | 17.22 | % | | | 17.22 | % | | | 17.22 | % | | | 23.47 | % | | | 23.47 | % | | | 23.47 | % | |
FIRST EAGLE FUNDS | SEMI-ANNUAL REPORT | APRIL 30, 2009
93

Financial Highlights
| | | SIX MONTHS ENDED | | YEAR ENDED OCTOBER 31, | |
| | | APRIL 30, 2009 (unaudited) | | 2008 | | 2007 | |
| | | CLASS A | | CLASS I | | CLASS C | | CLASS A | | CLASS I | | CLASS C | | CLASS A | | CLASS I | | CLASS C | |
| Selected per share data* | |
| Net asset value, beginning of period | | $ | 14.85 | | | $ | 14.98 | | | $ | 14.60 | | | $ | 27.28 | | | $ | 27.48 | | | $ | 26.86 | | | $ | 23.48 | | | $ | 23.62 | | | $ | 23.17 | | |
| Income from investment operations: | |
| Net investment income (loss) | | | -0.06 | | | | -0.04 | | | | -0.13 | | | | -0.09 | | | | -0.05 | | | | -0.27 | | | | -0.12 | | | | -0.07 | | | | -0.28 | | |
Net realized and unrealized
gains (losses) on investments | | | 6.07 | | | | 6.12 | | | | 5.97 | | | | -10.61 | | | | -10.66 | | | | -10.43 | | | | 7.72 | | | | 7.78 | | | | 7.61 | | |
Total income (loss) from
investment operations | | | 6.01 | | | | 6.08 | | | | 5.84 | | | | -10.70 | | | | -10.71 | | | | -10.70 | | | | 7.60 | | | | 7.71 | | | | 7.33 | | |
| Less distributions: | |
| Dividends from net investment income | | | — | | | | — | | | | — | | | | -0.78 | | | | -0.84 | | | | -0.61 | | | | -0.74 | | | | -0.79 | | | | -0.58 | | |
| Distributions from capital gains | | | -1.06 | | | | -1.06 | | | | -1.06 | | | | -0.95 | | | | -0.95 | | | | -0.95 | | | | -3.06 | | | | -3.06 | | | | -3.06 | | |
| Total distributions | | | -1.06 | | | | -1.06 | | | | -1.06 | | | | -1.73 | | | | -1.79 | | | | -1.56 | | | | -3.80 | | | | -3.85 | | | | -3.64 | | |
| Net asset value, end of period | | $ | 19.80 | | | $ | 20.00 | | | $ | 19.38 | | | $ | 14.85 | | | $ | 14.98 | | | $ | 14.60 | | | $ | 27.28 | | | $ | 27.48 | | | $ | 26.86 | | |
| Total return(C) | | | 40.87 | %(a) | | | 40.99 | %(a) | | | 40.39 | %(a) | | | -41.56 | % | | | -41.36 | % | | | -41.99 | % | | | 37.57 | % | | | 37.93 | % | | | 36.55 | % | |
| Ratios and supplemental data | |
| Net assets, end of period (millions) | | $ | 918 | | | $ | 117 | | | $ | 220 | | | $ | 480 | | | $ | 71 | | | $ | 109 | | | $ | 890 | | | $ | 166 | | | $ | 196 | | |
Ratio of operating expenses to
average net assets including
earnings credits | | | 1.24 | %(b) | | | 0.99 | %(b) | | | 1.98 | %(b) | | | 1.21 | % | | | 0.95 | % | | | 1.96 | % | | | 1.20 | % | | | 0.95 | % | | | 1.95 | % | |
Ratio of operating expenses to average
net assets excluding
earnings credits | | | 1.24 | %(b) | | | 0.99 | %(b) | | | 1.98 | %(b) | | | 1.21 | % | | | 0.96 | % | | | 1.96 | % | | | 1.20 | % | | | 0.95 | % | | | 1.95 | % | |
Ratio of net investment income (loss)
to average net assets including
earnings credits | | | -0.65 | %(b) | | | -0.40 | %(b) | | | -1.41 | %(b) | | | -0.38 | % | | | -0.20 | % | | | -1.13 | % | | | -0.55 | % | | | -0.30 | % | | | -1.30 | % | |
Ratio of net investment loss
to average net assets excluding
earnings credits | | | -0.65 | %(b) | | | -0.40 | %(b) | | | -1.41 | %(b) | | | -0.38 | % | | | -0.20 | % | | | -1.14 | % | | | -0.56 | % | | | -0.31 | % | | | -1.31 | % | |
| Portfolio turnover rate | | | 0.93 | %(a) | | | 0.93 | %(a) | | | 0.93 | %(a) | | | 8.74 | % | | | 8.74 | % | | | 8.74 | % | | | 16.37 | % | | | 16.37 | % | | | 16.37 | % | |
*Per share amounts have been calculated using the average shares method.
**Amount represents less than $0.01 per share.
(a) Not Annualized
(b) Annualized
(c) Does not give effect to the deduction of the CDSC (Contingent Deferred Sales Charge) of 1.00% for Class C shares.
See Notes to Financial Statements.
FIRST EAGLE FUNDS | SEMI-ANNUAL REPORT | APRIL 30, 2009
94
Gold Fund
| | | YEAR ENDED OCTOBER 31, | |
| | | 2006 | | 2005 | | 2004 | |
| | | CLASS A | | CLASS I | | CLASS C | | CLASS A | | CLASS I | | CLASS C | | CLASS A | | CLASS I | | CLASS C | |
| Selected per share data* | |
| Net asset value, beginning of period | | $ | 17.45 | | | $ | 17.55 | | | $ | 17.25 | | | $ | 16.82 | | | $ | 16.88 | | | $ | 16.76 | | | $ | 15.99 | | | $ | 16.03 | | | $ | 15.96 | | |
| Income from investment operations: | |
| Net investment income (loss) | | | -0.13 | | | | -0.08 | | | | -0.30 | | | | -0.04 | | | | 0.00 | ** | | | -0.16 | | | | -0.10 | | | | -0.05 | | | | -0.21 | | |
Net realized and unrealized
gains (losses) on investments | | | 6.65 | | | | 6.69 | | | | 6.60 | | | | 0.67 | | | | 0.67 | | | | 0.65 | | | | 1.49 | | | | 1.48 | | | | 1.47 | | |
Total income (loss) from
investment operations | | | 6.52 | | | | 6.61 | | | | 6.30 | | | | 0.63 | | | | 0.67 | | | | 0.49 | | | | 1.39 | | | | 1.43 | | | | 1.26 | | |
| Less distributions: | |
| Dividends from net investment income | | | -0.49 | | | | -0.54 | | | | -0.38 | | | | — | | | | — | | | | — | | | | -0.56 | | | | -0.58 | | | | -0.46 | | |
| Distributions from capital gains | | | — | | | | — | | | | — | | | | — | | | | — | | | | — | | | | — | | | | — | | | | — | | |
| Total distributions | | | -0.49 | | | | -0.54 | | | | -0.38 | | | | — | | | | — | | | | — | | | | -0.56 | | | | -0.58 | | | | -0.46 | | |
| Net asset value, end of period | | $ | 23.48 | | | $ | 23.62 | | | $ | 23.17 | | | $ | 17.45 | | | $ | 17.55 | | | $ | 17.25 | | | $ | 16.82 | | | $ | 16.88 | | | $ | 16.76 | | |
| Total return(C) | | | 37.97 | % | | | 38.29 | % | | | 36.95 | % | | | 3.75 | % | | | 3.97 | % | | | 2.92 | % | | | 8.59 | % | | | 8.82 | % | | | 7.79 | % | |
| Ratios and supplemental data | |
| Net assets, end of period (millions) | | $ | 774 | | | $ | 147 | | | $ | 158 | | | $ | 570 | | | $ | 84 | | | $ | 115 | | | $ | 516 | | | $ | 75 | | | $ | 92 | | |
Ratio of operating expenses to
average net assets including
earnings credits | | | 1.21 | % | | | 0.96 | % | | | 1.96 | % | | | 1.29 | % | | | 1.04 | % | | | 2.04 | % | | | 1.39 | % | | | 1.14 | % | | | 2.14 | % | |
Ratio of operating expenses to average
net assets excluding
earnings credits | | | 1.22 | % | | | 0.97 | % | | | 1.97 | % | | | 1.30 | % | | | 1.05 | % | | | 2.05 | % | | | 1.39 | % | | | 1.14 | % | | | 2.14 | % | |
Ratio of net investment income (loss)
to average net assets including
earnings credits | | | -0.59 | % | | | -0.34 | % | | | -1.33 | % | | | -0.24 | % | | | 0.02 | % | | | -0.98 | % | | | -0.62 | % | | | -0.35 | % | | | -1.34 | % | |
Ratio of net investment loss
to average net assets excluding
earnings credits | | | -0.59 | % | | | -0.34 | % | | | -1.34 | % | | | -0.24 | % | | | -0.01 | % | | | -0.98 | % | | | -0.62 | % | | | -0.35 | % | | | -1.34 | % | |
| Portfolio turnover rate | | | 32.26 | % | | | 32.26 | % | | | 32.26 | % | | | 21.73 | % | | | 21.73 | % | | | 21.73 | % | | | 3.61 | % | | | 3.61 | % | | | 3.61 | % | |
FIRST EAGLE FUNDS | SEMI-ANNUAL REPORT | APRIL 30, 2009
95

Financial Highlights
| | | SIX MONTHS ENDED | | YEAR ENDED OCTOBER 31, | |
| | | APRIL 30, 2009 (unaudited) | | 2008 | | 2007 | |
| | | CLASS A | | CLASS C | | CLASS Y | | CLASS A | | CLASS C | | CLASS Y | | CLASS A | | CLASS C | | CLASS Y | |
| Selected per share data* | |
| Net asset value, beginning of period | | $ | 18.92 | | | $ | 17.14 | | | $ | 19.23 | | | $ | 29.79 | | | $ | 27.39 | | | $ | 30.22 | | | $ | 27.92 | | | $ | 26.12 | | | $ | 28.28 | | |
| Income from investment operations: | |
| Net investment income (loss) | | | -0.02 | | | | -0.07 | | | | -0.02 | | | | -0.06 | | | | -0.20 | | | | -0.01 | | | | 0.05 | (d) | | | -0.13 | (d) | | | 0.07 | (d) | |
Net realized and unrealized
gains (losses) on investments | | | -0.82 | | | | -0.75 | | | | -0.84 | | | | -7.85 | | | | -7.16 | | | | -8.03 | | | | 5.30 | | | | 4.88 | | | | 5.35 | | |
Total income (loss) from
investment operations | | | -0.84 | | | | -0.82 | | | | -0.86 | | | | -7.91 | | | | -7.36 | | | | -8.04 | | | | 5.35 | | | | 4.75 | | | | 5.42 | | |
| Less distributions: | |
| Dividends from net investment income | | | — | | | | — | | | | — | | | | -0.07 | | | | — | | | | -0.06 | | | | — | | | | — | | | | — | | |
| Distributions from capital gains | | | -1.15 | | | | -1.15 | | | | -1.15 | | | | -2.89 | | | | -2.89 | | | | -2.89 | | | | -3.48 | | | | -3.48 | | | | -3.48 | | |
| Total distributions | | | -1.15 | | | | -1.15 | | | | -1.15 | | | | -2.96 | | | | -2.89 | | | | -2.95 | | | | -3.48 | | | | -3.48 | | | | -3.48 | | |
| Net asset value, end of period | | $ | 16.93 | | | $ | 15.17 | | | $ | 17.22 | | | $ | 18.92 | | | $ | 17.14 | | | $ | 19.23 | | | $ | 29.79 | | | $ | 27.39 | | | $ | 30.22 | | |
| Total return(C) | | | -4.37 | %(a) | | | -4.72 | %(a) | | | -4.40 | %(a) | | | -29.20 | % | | | -29.74 | % | | | -29.23 | % | | | 21.28 | % | | | 20.34 | % | | | 21.25 | % | |
| Ratios and supplemental data | |
| Net assets, end of period (millions) | | $ | 197 | | | $ | 70 | | | $ | 438 | | | $ | 127 | | | $ | 61 | | | $ | 501 | | | $ | 82 | | | $ | 65 | | | $ | 756 | | |
Ratio of operating expenses to
average net assets including
earnings credits | | | 1.49 | %(b) | | | 2.24 | %(b) | | | 1.49 | %(b) | | | 1.41 | % | | | 2.16 | % | | | 1.41 | % | | | 1.40 | % | | | 2.15 | % | | | 1.40 | % | |
Ratio of operating expenses to average
net assets excluding
earnings credits | | | 1.49 | %(b) | | | 2.24 | %(b) | | | 1.49 | %(b) | | | 1.42 | % | | | 2.17 | % | | | 1.42 | % | | | 1.41 | % | | | 2.16 | % | | | 1.41 | % | |
Ratio of net investment income (loss)
to average net assets including
earnings credits | | | -0.23 | %(b) | | | -1.00 | %(b) | | | -0.26 | %(b) | | | -0.23 | % | | | -0.87 | % | | | -0.06 | % | | | 0.18 | %(d) | | | -0.51 | %(d) | | | 0.26 | %(d) | |
Ratio of net investment income (loss)
to average net assets excluding
earnings credits | | | -0.23 | %(b) | | | -1.00 | %(b) | | | -0.26 | %(b) | | | -0.24 | % | | | -0.88 | % | | | -0.07 | % | | | 0.17 | %(d) | | | -0.52 | %(d) | | | 0.25 | %(d) | |
| Portfolio turnover rate | | | 17.23 | %(a) | | | 17.23 | %(a) | | | 17.23 | %(a) | | | 63.97 | % | | | 63.97 | % | | | 63.97 | % | | | 50.26 | % | | | 50.26 | % | | | 50.26 | % | |
*Per share amounts have been calculated using the average shares method.
(a) Not Annualized
(b) Annualized
(c) Does not give effect to the deduction of the CDSC (Contingent Deferred Sales Charge) of 1.00% for Class C shares.
(d) Investment income (loss) per share reflects special dividends received in Class A, C and Y which amounts to $0.13, $0.12, and $0.13 per share. Excluding the special dividend, the ratio of net investment income (loss) to average net assets both with and without the effect of earnings credits in Class A, C and Y would have been (0.31%), (1.00%), and (0.22%).
See Notes to Financial Statements.
FIRST EAGLE FUNDS | SEMI-ANNUAL REPORT | APRIL 30, 2009
96
Fund of America
| | | YEAR ENDED OCTOBER 31, | |
| | | 2006 | | 2005 | | 2004 | |
| | | CLASS A | | CLASS C | | CLASS Y | | CLASS A | | CLASS C | | CLASS Y | | CLASS A | | CLASS C | | CLASS Y | |
| Selected per share data* | |
| Net asset value, beginning of period | | $ | 26.11 | | | $ | 24.74 | | | $ | 26.42 | | | $ | 25.54 | | | $ | 24.44 | | | $ | 25.81 | | | $ | 22.80 | | | $ | 21.99 | | | $ | 23.03 | | |
| Income from investment operations: | |
| Net investment income (loss) | | | -0.08 | | | | -0.26 | | | | -0.08 | | | | -0.09 | | | | -0.26 | | | | -0.07 | | | | -0.22 | | | | -0.33 | | | | -0.16 | | |
Net realized and unrealized
gains (losses) on investments | | | 4.23 | | | | 3.98 | | | | 4.28 | | | | 2.36 | | | | 2.26 | | | | 2.38 | | | | 3.43 | | | | 3.25 | | | | 3.41 | | |
Total income (loss) from
investment operations | | | 4.15 | | | | 3.72 | | | | 4.20 | | | | 2.27 | | | | 2.00 | | | | 2.31 | | | | 3.21 | | | | 2.92 | | | | 3.25 | | |
| Less distributions: | |
| Dividends from net investment income | | | — | | | | — | | | | — | | | | — | | | | — | | | | — | | | | — | | | | — | | | | — | | |
| Distributions from capital gains | | | -2.34 | | | | -2.34 | | | | -2.34 | | | | -1.70 | | | | -1.70 | | | | -1.70 | | | | -0.47 | | | | -0.47 | | | | -0.47 | | |
| Total distributions | | | -2.34 | | | | -2.34 | | | | -2.34 | | | | -1.70 | | | | -1.70 | | | | -1.70 | | | | -0.47 | | | | -0.47 | | | | -0.47 | | |
| Net asset value, end of period | | $ | 27.92 | | | $ | 26.12 | | | $ | 28.28 | | | $ | 26.11 | | | $ | 24.74 | | | $ | 26.42 | | | $ | 25.54 | | | $ | 24.44 | | | $ | 25.81 | | |
| Total return(C) | | | 16.81 | % | | | 15.93 | % | | | 16.80 | % | | | 9.16 | % | | | 8.43 | % | | | 9.23 | % | | | 14.27 | % | | | 13.46 | % | | | 14.30 | % | |
| Ratios and supplemental data | |
| Net assets, end of period (millions) | | $ | 46 | | | $ | 48 | | | $ | 671 | | | $ | 29 | | | $ | 36 | | | $ | 684 | | | $ | 14 | | | $ | 17 | | | $ | 601 | | |
Ratio of operating expenses to
average net assets including
earnings credits | | | 1.41 | % | | | 2.16 | % | | | 1.41 | % | | | 1.49 | % | | | 2.17 | % | | | 1.43 | % | | | 1.72 | % | | | 2.21 | % | | | 1.46 | % | |
Ratio of operating expenses to average
net assets excluding
earnings credits | | | 1.41 | % | | | 2.16 | % | | | 1.41 | % | | | 1.49 | % | | | 2.17 | % | | | 1.43 | % | | | 1.72 | % | | | 2.21 | % | | | 1.46 | % | |
Ratio of net investment income (loss)
to average net assets including
earnings credits | | | -0.30 | % | | | -1.05 | % | | | -0.30 | % | | | -0.34 | % | | | -1.03 | % | | | -0.27 | % | | | -0.91 | % | | | -1.39 | % | | | -0.63 | % | |
Ratio of net investment income (loss)
to average net assets excluding
earnings credits | | | -0.30 | % | | | -1.05 | % | | | -0.30 | % | | | -0.34 | % | | | -1.04 | % | | | -0.27 | % | | | -0.84 | % | | | -1.32 | % | | | -0.57 | % | |
| Portfolio turnover rate | | | 40.38 | % | | | 40.38 | % | | | 40.38 | % | | | 54.54 | % | | | 54.54 | % | | | 54.54 | % | | | 44.68 | % | | | 44.68 | % | | | 44.68 | % | |
FIRST EAGLE FUNDS | SEMI-ANNUAL REPORT | APRIL 30, 2009
97
Notes to Financial Statements (unaudited)
Note 1—Significant Accounting Policies
First Eagle Funds (the "Trust"), is an open-end management investment company registered under the Investment Company Act of 1940, as amended ("1940 Act"). The Trust consists of five separate portfolios, First Eagle Global Fund, First Eagle Overseas Fund, First Eagle U.S. Value Fund, First Eagle Gold Fund and First Eagle Fund of America (each individually a "Fund" or collecti vely the "Funds"). All the Funds are diversified mutual funds except for First Eagle Gold Fund and First Eagle Fund of America, which are non-diversified. The Trust is a Delaware statutory trust and was, until April 23, 2004, a Maryland corporation operating under the name First Eagle Funds, Inc. First Eagle Fund of America, previously a portfolio of a separate Delaware statutory trust, was reorganized as a portfolio of the Trust effective December 31, 2002. The First Eagle Global Fund seeks long-term growth of capital by investing in a range of asset classes from markets in the United States and around the world. The First Eagle Overseas Fund seeks long-term growth of capital by investing primarily in equities issued by non-U.S. corporations. The First Eagle U.S. Value Fund seeks long-term growth of capital by investing primarily in equity and debt securities issued by U.S. corporations. The First Eagle Gold Fund's investment objective is to provide exposure to the investment characteristics of gold and, to a limited extent, other precious metals. The First Eagle Fund of America is primarily a U.S. equity fund with a unique event-driven bias that seeks capital appreciation.
The following is a summary of significant accounting policies adhered to by the Funds and are in conformity with U.S. generally accepted accounting principles ("GAAP").
a) Investment valuation—Each Fund computes its net asset value once daily as of the close of trading on each day the New York Stock Exchange ("NYSE") is open for trading. The net asset value per share is computed by dividing the total current value of the assets of a Fund, less its liabilities, by the total number of shares outstanding at the time of such computation.
A portfolio security (including an option), other than a bond, which is traded on a U.S. national securities exchange or a securities exchange abroad is normally valued at the price of the last sale on the exchange as of the close of business on the date on which assets are valued. If there are no sales on such date, such portfolio investment will be valued at the mean between the closing bid and asked prices (and if there is only a bid or only an asked price
FIRST EAGLE FUNDS | SEMI-ANNUAL REPORT | APRIL 30, 2009
98
(continued)
on such date, valuation will be at such bid or asked price for long or short positions, respectively). Securities, other than bonds, traded in the over-the-counter market are valued at the mean between the last bid and asked prices prior to the time of valuation (and if there is only a bid or only an asked price on such date, valuation will be at such bid or asked price for long or short positions, respectively), except if such unlisted security traded on the NASDAQ in which case it is valued at its last sale price (or, if available in the case of NASDAQ securities, the NASDAQ Official Closing Price ('NOCP')).
Commodities (such as physical metals) are valued at the spot price at the time trading on the New York Stock Exchange closes (normally 4:00 p.m. E.S.T.).
Forward currency contracts are valued at the current cost of covering or offsetting such contracts.
All bonds, whether listed on an exchange or traded in the over-the-counter market (and except for short-term investments as described in the next sentence), for which market quotations are readily available are valued at the mean between the last bid and asked prices received from dealers in the over-the-counter market in the United States or abroad, except that when no asked price is available, bonds are valued at the last bid price alone. Short-term investments maturing in sixty days or less are valued at cost plus interest earned (or discount amortized, as the case may be), which is deemed to approximate value.
The 2:00 pm E.S.T. exchange rates typically are used to convert foreign security prices into U.S. dollars. Any security that is listed or traded on more than one exchange (or traded in multiple markets) is valued at the relevant quotation on the exchange or market deemed to be the primary trading venue for that security. In the absence of such a quotation, a quotation from the exchange or market deemed by Arnhold and S. Bleichroeder Advisers, LLC (the "Adviser") to be the secondary trading venue for the particular security shall be used. The Funds use pricing services to identify the market prices of publicly traded securities in their portfolios. When market prices are determined to be "stale" as a result of limited market activity for a particular holding, or in other circumstances when market prices are unavailable, such as for private placements, or determined to be unreliable for a particular holding, such holdings may be " fair valued" in accordance with procedures approved by the Board of Trustees ("Board"). Additionally, with respect to foreign holdings, specifically in circumstances leading the Adviser to believe
FIRST EAGLE FUNDS | SEMI-ANNUAL REPORT | APRIL 30, 2009
99
Notes to Financial Statements (unaudited)
that significant events occurring after the close of a foreign market have materially affected the value of a Fund's holdings in that market, such holdings may be fair valued to reflect the events in accordance with procedures approved by the Board. The determination of whether a particular foreign investment should be fair valued will be based on review of a number of factors, including developments in foreign markets, the performance of U.S. securities markets, and security-specific events. The values assigned to a Fund's holdings therefore may differ on occasion from reported market values.
The Funds with significant non-U.S. holdings have adopted procedures under which movements in the prices for U.S. securities (beyond specified thresholds) occurring after the close of a foreign market may require fair valuation of securities traded on that foreign market. The values assigned to a Fund's holdings therefore may differ on occasion from reported market values. The Trust and the Adviser believe relying on the procedures described above will result in prices that are more reflective of the actual market value of portfolio securities held by the Funds.
In September 2006, the Financial Accounting Standards Board ("FASB") issued FASB Statement No. 157—Fair Value Measurements that defines fair value, establishes a framework for measuring fair value in generally accepted accounting principles and expands disclosures about fair value measurements. The Statement applies to fair value measurements that are already required or permitted by other accounting standards and is intended to increase consistency of those measurements. The Statement applies broadly to securities and other types of assets and liabilities. FASB 157 is effective for financial statements issued for fiscal years beginning after November 15, 2007. The Statement also establishes a fair value hierarchy which prioritizes inputs or assumptions to valuation techniques. These inputs are summarized in the three broad levels listed below:
Level 1—Quoted prices in active markets for identical securities.
Level 2—Other significant observable inputs (including quoted prices for similar securities, interest rates, prepayment speeds, credit risk, etc.).
Level 3—Other significant unobservable inputs (including fund's own assumption in determining the fair value of investments).
The inputs or methodology used for valuing securities may not be an indication of the risk associated with investing in those securities.
FIRST EAGLE FUNDS | SEMI-ANNUAL REPORT | APRIL 30, 2009
100
(continued)
The following is a summary of the inputs used to value the Fund's investments as of April 30, 2009:
| | | LEVEL 1 | | LEVEL 2 | | LEVEL 3 | | TOTAL
FAIR MARKET
VALUE | |
| Assets: | |
| Investments in securities: | |
First Eagle
Global Fund | | $ | 12,909,922,843 | | | $ | 1,808,650,607 | | | $ | 669,030 | | | $ | 14,719,242,480 | | |
First Eagle
Overseas Fund | | | 4,354,972,811 | | | | 660,470,662 | | | | 29,848,996 | | | | 5,045,292,469 | | |
First Eagle
U.S. Value Fund | | | 449,810,064 | | | | 255,997,436 | | | | 27,840 | | | | 705,835,340 | | |
First Eagle
Gold Fund | | | 878,824,950 | | | | 93,970,240 | | | | — | | | | 972,795,190 | | |
First Eagle
Fund of America | | | 591,802,859 | | | | 149,634,830 | | | | — | | | | 741,437,689 | | |
| Investments in derivatives *: | |
First Eagle
Global Fund | | | 81,478,839 | | | | — | | | | — | | | | 81,478,839 | | |
First Eagle
Overseas Fund | | | 38,534,333 | | | | — | | | | — | | | | 38,534,333 | | |
| Investments in other financial instruments **: | |
First Eagle
Global Fund | | | 1,109,925,515 | | | | — | | | | — | | | | 1,109,925,515 | | |
First Eagle
Overseas Fund | | | 513,442,993 | | | | — | | | | — | | | | 513,442,993 | | |
First Eagle
U.S. Value Fund | | | 44,093,555 | | | | — | | | | — | | | | 44,093,555 | | |
First Eagle
Gold Fund | | | 288,702,365 | | | | — | | | | — | | | | 288,702,365 | | |
| Liabilities: | |
| Investments in derivatives *: | |
First Eagle
Global Fund | | | 459,086 | | | | — | | | | — | | | | 459,086 | | |
First Eagle
Overseas Fund | | | 157,500 | | | | — | | | | — | | | | 157,500 | | |
First Eagle
Fund of America | | | 29,434,514 | | | | — | | | | — | | | | 29,434,514 | | |
* Includes foreign forward currency contracts valued at net unrealized appreciation (depreciation) on the instrument and covered call options.
** Includes gold bullion.
FIRST EAGLE FUNDS | SEMI-ANNUAL REPORT | APRIL 30, 2009
101
Notes to Financial Statements (unaudited)
Fair Value Level 3 activity for the six months ended April 30, 2009 was as follows:
| | | FIRST EAGLE
GLOBAL FUND | | FIRST EAGLE
OVERSEAS FUND | | FIRST EAGLE
U.S. VALUE FUND | |
| Assets: | |
| Investments in securities: | |
| Beginning Balance—market value | | $ | 18,855,171 | | | $ | 18,793,916 | | | $ | 27,840 | | |
| Purchases (Sales) | | | (328,500 | ) | | | 15,000,000 | | | | — | | |
| Transfers In (Out)—Level 3 | | | — | | | | — | | | | — | | |
| Accrued Amortization | | | — | | | | — | | | | — | | |
| Gains (Losses)—Realized and Unrealized | | | (17,857,641 | ) | | | (3,944,920 | ) | | | — | | |
| Ending Balance—market value | | $ | 669,030 | | | $ | 29,848,996 | | | $ | 27,840 | | |
b) Investment transactions and income—Investment transactions are accounted for on a trade date basis. The specific identification method is used in determining realized gains and losses from investment transactions. Dividend income is recorded on the ex-dividend date. Interest income is recorded daily on the accrual basis. In computing investment income, each Fund accretes discounts and amortizes premiums on debt obligations using the interest method. Investment income is allocated to each Fund's share class in proportion to its relative net assets. Payments received from certain investments held by the Funds may be comprised of dividends, capital gains and return of capital. The Funds originally estimate the expected classification of such payments. The amounts may subsequently be reclassified upon receipt of information from the iss uer.
c) Expenses—Expenses arising in connection with a Fund are charged directly to that Fund. Expenses common to all Funds are allocated to each Fund in proportion to its relative net assets. Certain expenses are shared with the First Eagle Variable Funds, an affiliated fund group. Such costs are generally allocated using the ratio of the Fund's average daily net assets relative to the total average daily net assets of the First Eagle Variable Funds. Earnings credits reduce custody fees, shareholder servicing agent fees and accounting fees by the amount of interest earned on balances with such service provider.
d) Foreign currency translation—The books and records of the Funds are maintained in U.S. dollars. The market values of securities which are not traded in U.S. currency are recorded in the financial statements after translation to U.S. dollars based on the applicable exchange rates at the end of the
FIRST EAGLE FUNDS | SEMI-ANNUAL REPORT | APRIL 30, 2009
102
(continued)
period. The costs of such securities are translated at exchange rates prevailing when acquired. Related dividends, interest and withholding taxes are accrued at the rates of exchange prevailing on the respective dates of such transactions.
The net assets of each of the Funds are presented at the foreign exchange rates and market values at the close of the period. The Funds do not isolate that portion of gains and losses on investments which is due to changes in foreign exchange rates from that which is due to changes in market prices of the equity securities. However, for federal income tax purposes each Fund does isolate the effect of changes in foreign exchange rates from the changes in market prices for realized gains and losses on debt obligations.
e) Forward currency contracts—In connection with portfolio purchases and sales of securities denominated in foreign currencies, the Funds may enter into forward currency contracts. Additionally, each Fund may enter into such contracts to hedge certain other foreign currency denominated investments. These contracts are valued at the current cost of covering or offsetting such contracts, and the related realized and unrealized foreign exchange gains and losses are included in the statement of operations. In the event that counterparties fail to settle these currency contracts or the related foreign security trades, a Fund could be exposed to foreign currency fluctuations.
f) Repurchase agreements—The Funds may enter into repurchase agreement transactions with institutions that meet the adviser's credit guidelines. Each repurchase agreement is valued at amortized cost. The Funds require that the collateral received in a repurchase agreement transaction be transferred to a custodian in a manner sufficient to enable the Funds to obtain collateral in the event of a counterparty default. If the counterparty defaults and the fair value of the collateral declines, realization of the collateral by the Funds may be delayed or limited.
g) Options—In order to produce incremental earnings or protect against changes in the value of portfolio securities, the Funds may buy and sell put and call options, write covered call options on portfolio securities and write cash-secured put options.
The Funds generally purchase put options or writes covered call options to hedge against adverse movements in the value of portfolio holdings. The Funds may also use options for speculative purposes, although it does not employ options for this purpose at the present time. The Funds will segregate assets to cover its obligations under option contracts.
FIRST EAGLE FUNDS | SEMI-ANNUAL REPORT | APRIL 30, 2009
103
Notes to Financial Statements (unaudited)
Options contracts are valued daily based upon the last sale price on the principal exchange on which the option is traded and unrealized appreciation/depreciation is recorded. If there is no sale on such day, the mean between the last bid and asked prices is used. The Funds will realize a gain or loss upon the expiration or closing of the option transaction. When an option is exercised, the proceeds on the sale of a written call option, the purchase cost of a written put option, or the cost of the security for a purchased put or call option is adjusted by the amount of premium received or paid. When a written option expires, the Funds will realize a gain equal to the amount of the premium received. When the Funds enter into a closing purchase transaction, the Funds will realize a gain (or loss, if the cost of the closing purchase transaction exceeds the premium received when the option was written) without regard to any unrealiz ed gain or loss on the underlying security and the liability related to such option is eliminated.
The risk in writing a call option is that the Funds give up the opportunity for profit if the market price of the security increases and the option is exercised. The risk in writing a put option is that the Funds may incur a loss if the market price of the security decreases and the option is exercised. The Funds also have the additional risk of not being able to enter into a closing transaction if a liquid secondary market does not exist. The Funds may also write over-the-counter options where the completion of the obligation is dependent upon the credit standing of the counterparty.
h) Treasury Inflation-Protected Securities—The Funds may invest in Treasury Inflation-Protected Securities ("TIPS") which are specially structured bonds in which the principal amount is adjusted to keep pace with inflation, as measured by the U.S. Consumer Price Index ("CPI"). The inflation (deflation) adjustment is applied to the principal of each bond on a monthly basis and is accounted for as interest income on the Statements of Operations. TIPS are subject to interest rate risk.
i) Structured notes—The Funds may invest in structured notes, the value of which is linked to currencies, interest rates, other commodities, indices or other financial indicators. In order to qualify as a regulated investment company ("RIC") under the Internal Revenue Code of 1986, as amended (the "Code"), the Fund must meet certain requirements regarding the source of its income, the diversification of its assets and the distribution of its income. One of these requirements is that the Fund derive at least 90% of its gross income for each taxable year from dividends, interest, payments with respect
FIRST EAGLE FUNDS | SEMI-ANNUAL REPORT | APRIL 30, 2009
104
(continued)
to certain securities loans, gains from the sale or other disposition of stock, securities or foreign currencies, other income derived with respect to its business of investing in such stock, securities or currencies or net income derived from interests in certain publicly traded partnerships ("Qualifying Income"). If any Fund fails to qualify as a RIC, the Fund will be subject to federal, state and local income tax on its net income and capital gains at regular corporate rates (without reduction for distributions to shareholders). When distributed, that income would also be taxable to shareholders as an ordinary dividend to the extent attributable to each Fund's earnings and profits. None of the Funds held structured notes as of April 30, 2009.
j) Short Sales—The First Eagle Fund of America may seek to realize additional gains through short sale transactions in securities listed on one or more national security exchanges, or in unlisted securities. At the time a short sale is effected, the Fund incurs an obligation to replace the security borrowed at whatever its price may be at the time the Fund purchases it for delivery to the lender. The price at such time may be more or less than the price at which the security was sold by the Fund. Until the security is replaced, the Fund is required to pay the lender amounts equal to any dividend or interest that accrues during the period of the loan. To borrow the security, the Fund may also be required to pay a premium. The proceeds of the sh ort sale will be retained by the broker, to the extent necessary to meet margin requirements, until the short position is closed. There were no open short sales as of April 30, 2009.
k) Restricted Securities—The Funds may invest in securities that are subject to legal or contractual restrictions on resale. These securities generally may be resold in transactions exempt from registration or to the public if the securities are registered. Disposal of these securities may involve time-consuming negotiations and expense, and prompt sale at an acceptable price may be difficult. Information regarding restricted securities, if any, is included at the end of each Fund's Portfolio of Investments.
l) United States income taxes—No provision has been made for U.S. federal income taxes since it is the intention of each Fund to distribute to shareholders all taxable net investment income and net realized gains on investments, if any, within the allowable time limit, and to comply with the provisions of the Internal Revenue Code for a regulated investment company.
FIRST EAGLE FUNDS | SEMI-ANNUAL REPORT | APRIL 30, 2009
105
Notes to Financial Statements (unaudited)
First Eagle Global Fund, First Eagle Overseas Fund, First Eagle U.S. Value Fund, First Eagle Gold Fund and First Eagle Fund of America declare and pay such income, dividends and capital gains distributions on an annual basis.
In June 2006, the Financial Accounting Standards Board (FASB) issued FASB Interpretation No. 48—Accounting for Uncertainty in Income Taxes that require the tax effects of certain tax positions to be recognized. These tax positions must meet a "more likely than not" standard that based on their technical merits, have a more than 50 percent likelihood of being sustained upon examination. FASB Interpretation No. 48 is effective for fiscal periods beginning after December 15, 2006. At adoption, the financial statements must be adjusted to reflect only those tax positions that are more likely than not of being sustained. In accordance with FASB Interpretation No. 48, management of the Trust has analyzed the Funds' tax positions taken on federal and state income tax returns for all open tax years (the current and the prior three tax year s) and has concluded that no provision for income tax is required in the Funds' financial statements.
m) Class Accounting—Investment income, common expenses and realized/unrealized gain (loss) on investments are allocated to the various classes of the Fund on the basis of daily net assets of each class. Fees relating to a specific class are charged directly to that class.
n) Use of estimates—The preparation of financial statements in conformity with generally accepted accounting principles requires management to make estimates and assumptions that affect the reported amounts of assets and liabilities at the date of the financial statements and the reported amounts of revenues and expenses during the reporting period. Actual results could differ from those estimates.
o) Redemption Fee—Effective May 1, 2008, the redemption fee period was shortened for the First Eagle Global Fund, First Eagle Overseas Fund and First Eagle Gold Fund. The sale or exchange of shares of these Funds will be subject to a redemption fee if sold or exchanged within 60 days of the purchase of such shares, rather than if sold or exchanged within 90 days of the purchase of such shares. The redemption fee of 2% remains the same.
Also on May 1, 2008, the redemption fee was removed for the First Eagle U.S. Value Fund and the First Eagle Fund of America. The sale or exchange of shares of these Funds will no longer be subject to a redemption fee.
FIRST EAGLE FUNDS | SEMI-ANNUAL REPORT | APRIL 30, 2009
106
(continued)
p) Recently issued accounting pronouncements—On March 19, 2008, the FASB released Statement of Financial Accounting Standards No. 161, "Disclosures about Derivative Instruments and Hedging Activities" ("FAS 161"). FAS 161 requires qualitative disclosures about objectives and strategies for using derivatives, quantitative disclosures about fair value amounts of and gains and losses on derivative instruments, and disclosures about credit-risk-related contingent features in derivative agreements. The application of FAS 161 is required for fiscal years and interim periods beginning after November 15, 2008. At this time, management is evaluating the implications of FAS 161 and believes the adoption of FAS 161 will have no material impact on the Fund's financial statements.
In April 2009, the Financial Accounting Standards Board ("FASB") issued FASB Staff Position No. 157-4, "Determining Fair Value When the Volume and Level of Activity for the Asset or Liability Have Significantly Decreased and Identifying Transactions That Are Not Orderly" ("FSP 157-4"). FSP 157-4 provides additional guidance for estimating fair value in accordance with FASB Statement of Financial Accounting Standards No. 157, "Fair Value Measurements" ("FAS 157"), when the volume and level of activity for the asset or liability have significantly decreased as well as guidance on identifying circumstances that indicate a transaction is not orderly. FSP 157-4 is effective for fiscal years and interim periods ending after June 15, 2009. Management is currently evaluating the impact the adoption of FSP 157-4 will have on the Funds' financial statement disclosures.
Note 2—Investment Advisory, Custody and Administration Agreements; Transactions with Related Persons
Arnhold and S. Bleichroeder Advisers, LLC, a subsidiary of Arnhold and S. Bleichroeder Holdings, Inc. ("ASB Holdings"), manages the Funds. For its services, the Adviser receives, pursuant to an Investment Advisory Agreement between the Funds and the Adviser (the "Advisory Agreement") an annual advisory fee as follows: First Eagle Global Fund, First Eagle Overseas Fund, First Eagle U.S. Value Fund and First Eagle Gold Fund at 0.75% of each Fund's average daily net assets and First Eagle Fund of America at 1% of the Fund's average daily net assets.
The Adviser also performs certain administrative, accounting, operations, compliance and other services on behalf of the Funds, and in accordance with its agreement with them, the Funds reimburse the Adviser for costs (including
FIRST EAGLE FUNDS | SEMI-ANNUAL REPORT | APRIL 30, 2009
107
Notes to Financial Statements (unaudited)
personnel, related overhead and other costs) related to those services. For the six-month period ended April 30, 2009, the Funds reimbursed the Adviser amounts as disclosed in the Statements of Operations.
The Adviser agreed to reimburse the First Eagle Gold Fund to the extent that the aggregate annualized expenses exceeded 2% for Class I and 3% for Class C of average daily net assets until February 29, 2004. For the period from November 1, 2003 to February 29, 2004, the Adviser did not need to reimburse or waive any of First Eagle Gold Fund's fees.
The Adviser voluntarily paid the First Eagle Global Fund a total of $1,837 for losses on transaction related activity.
Pursuant to a subadvisory agreement, dated December 10, 2002, which agreement was amended and restated most recently in March 2009, ("Subadvisory Agreement") Iridian Asset Management LLC ("Iridian" or the "Subadviser") manages the investments of the First Eagle Fund of America. Iridian, a registered investment adviser, is a majority-owned subsidiary of BIAM (US), Inc., a U.S. subsidiary of The Governor and Company of The Bank of Ireland. The fees paid to Iridian by the Adviser under the Subadvisory Agreement are based on a reference amount equal to 50% of the combined (i) fees received by the Adviser for advisory services on behalf of the Fund and (ii) the fees received by the Fund's distributor for its shareholder liaison services on behalf of the Fund. These amounts are reduced by certain direct marketing costs borne by the Adviser in connection with the Fund and are further reduced by the amount paid by the Adviser for certai n administrative expenses incurred in providing services to the Fund.
The Funds have entered into Custody Agreements with State Street Bank and Trust Co. ("SSB"). The Custody Agreements provide for an annual fee based on the amount of assets under custody plus transaction charges. SSB serves as custodian of the Funds' portfolio securities and other assets. SSB has directly entered into a sub-custodial agreement to maintain the custody of gold bullion. Under the terms of the Custody Agreement between the Funds and SSB, SSB maintains and deposits in separate accounts, cash, securities and other assets of the Funds. SSB is also required, upon the order of the Funds, to deliver securities held by SSB and the sub-custodian, and to make payments for securities purchased by the Funds. SSB has also entered into sub-custodian agreements with a
FIRST EAGLE FUNDS | SEMI-ANNUAL REPORT | APRIL 30, 2009
108
(continued)
number of foreign banks and clearing agencies, pursuant to which portfolio securities purchased outside the United States are maintained in the custody of these entities. SSB serves as the custodian for the Funds.
The Funds have also entered into an Administration Agreement with SSB, pursuant to which SSB provides certain tax-related and other administrative services. SSB, as the Funds' Administrator, receives annual fees separate from and in addition to the fees it receives for its services as the Funds' custodian.
First Eagle Funds Distributors, a division of ASB Securities LLC, a wholly owned subsidiary of ASB Holdings, serves as the Funds' principal underwriter. For the six-month period ended April 30, 2009, First Eagle Funds Distributors realized $443,042, $76,369, $59,353, $170,265 and $27,755, pertaining to the sales of shares of First Eagle Global Fund, First Eagle Overseas Fund, First Eagle U.S. Value Fund, First Eagle Gold Fund and First Eagle Fund of America, respectively.
The Trust adopted a Trustee Deferred Compensation Plan, which allows the independent Trustees to defer the receipt of all or a portion of compensation related to performance of their duties as a Trustee. The deferred fees are invested in various First Eagle Funds until distribution in accordance with the Trustee Deferred Compensation Plan. As of April 30, 2009, balances to the Plan can be seen on the Statements of Assets and Liabilities.
Note 3—Options
For the six-month period ended April 30, 2009, First Eagle Fund of America had the following written options transactions:
| | | NUMBER OF CONTRACTS | | PREMIUMS
RECEIVED | |
| Options outstanding at October 31, 2008 | | | 22,342 | | | $ | 7,422,821 | | |
| Options written | | | 181,111 | | | | 52,511,822 | | |
| Options assigned | | | (4,252 | ) | | | (1,364,021 | ) | |
| Options expired/closed | | | (135,677 | ) | | | (37,856,200 | ) | |
| Options outstanding at April 30, 2009 | | | 63,524 | | | $ | 20,714,422 | | |
As of April 30, 2009, portfolio securities valued at $197,526,005 were segregated to cover collateral requirements for written options.
Note 4—Plans of Distribution
Under the terms of the Distribution Plans and Agreements ("the Plans") with First Eagle Funds Distributors, a division of ASB Securities LLC ("the Distributor"),
FIRST EAGLE FUNDS | SEMI-ANNUAL REPORT | APRIL 30, 2009
109
Notes to Financial Statements (unaudited)
pursuant to the provisions of Rule 12b-1 under the 1940 Act, the First Eagle Global Fund, First Eagle Overseas Fund, First Eagle U.S. Value Fund and First Eagle Gold Fund pay the Distributor quarterly, a distribution fee with respect to Class A and Class C shares at an annual rate of up to 0.25% and 0.75%, respectively, of each Fund's average daily net assets. In the case of First Eagle Fund of America, it pays the Distributor quarterly, a distribution fee with respect to Class Y, Class C and Class A shares at an annual rate of up to 0.25%, 0.75% and 0.25%, respectively of the Fund's average daily net assets. Under the Plans, the Distributor is obligated to use the amounts received under the Plans for payments to qualifying dealers for their assistance in the distribution of a Fund's shares and the provision of shareholder services and for other expenses such as advertising costs and the payment for the printing and distribution of prospectuses to prospective investors.
The Distributor bears distribution costs of a Fund to the extent they exceed payments received under the Plan. For the six-month period ended April 30, 2009, the distribution fees incurred by the Funds are disclosed in the Statements of Operations.
The Distributor receives an annual service fee with respect to Class C at the annual rate of 0.25% of each Fund's average daily net assets, payable quarterly to cover expenses incurred by the Distributor for providing shareholder liaison services, including assistance with subscriptions, redemptions and other shareholder questions. For the six-month period ended April 30, 2009, the services fees incurred by the Funds are disclosed in the Statement of Operations.
Note 5—Purchases and Sales of Securities
During the six-month period ended April 30, 2009, the cost of purchases of investments, excluding U.S. Government and short-term securities, totaled $1,022,560,883, $154,021,288, $178,265,127, $284,638,475 and $208,565,027 for First Eagle Global Fund, First Eagle Overseas Fund, First Eagle U.S. Value Fund, First Eagle Gold Fund and First Eagle Fund of America, respectively. Proceeds from sales of investments, excluding U.S. government securities and short-term securities, totaled $1,591,400,876, $530,571,235, $9,146,680, $8,667,645 and $82,150,891 for First Eagle Global Fund, First Eagle Overseas Fund, First Eagle U.S. Value Fund, First Eagle Gold Fund and First Eagle Fund of America, respectively.
The cost of purchases of U.S. Government securities, excluding short-term securities, totaled $0, $0, $30,904,234, $0 and $0 for First Eagle Global Fund,
FIRST EAGLE FUNDS | SEMI-ANNUAL REPORT | APRIL 30, 2009
110
(continued)
First Eagle Overseas Fund, First Eagle U.S. Value Fund, First Eagle Gold Fund and First Eagle Fund of America, respectively. Proceeds from sales of U.S. government securities, excluding short-term securities, totaled $39,840,882, $0, $0, $0 and $0 for First Eagle Global Fund, First Eagle Overseas Fund, First Eagle U.S. Value Fund, First Eagle Gold Fund and First Eagle Fund of America, respectively.
Note 6—Line of Credit
As of September 10, 2008, the Board of Trustees approved a $200 million committed, unsecured line of credit ("Credit Facility") with State Street Bank and Trust Company for the Funds, to be utilized for temporarily financing the purchase or sale of securities for prompt delivery in the ordinary course of business or for temporarily financing the redemption of shares of each Fund at the request of shareholders and other temporary or emergency purposes. Interest on amounts borrowed is calculated based on Federal Funds rate plus 0.50% per annum. Under the Credit Facility arrangement, each Fund has agreed to pay an annual commitment fee of 0.125% on the unused balance, allocated pro rata, based on the relative asset size of the Funds. Commitment fees related to the line of credit are paid by the Funds and are included in miscellaneous expenses in the Statements of Operations. During the six month period ended April 30, 2009, the Fun ds had borrowings under the agreement as follows:
| FUND | | AVERAGE
DAILY LOAN
BALANCE | | NUMBER OF DAYS
OUTSTANDING | | INTEREST
EXPENSE | | WEIGHTED
AVERAGE
ANNUALIZED
INTEREST RATE | |
| First Eagle Global Fund | | $ | — | | | | — | | | $ | — | | | | — | | |
| First Eagle Overseas Fund | | | 3,802,000 | | | | 1 | | | | 52.81 | | | | 0.00 | %* | |
| First Eagle U.S. Value Fund | | | 1,500,000 | | | | 1 | | | | 20.83 | | | | 0.00 | %* | |
| First Eagle Gold Fund | | | — | | | | — | | | | — | | | | — | | |
| First Eagle Fund of America | | | — | | | | — | | | | — | | | | — | | |
* Amount represents less than 0.01%.
As of April 30, 2009, there were no outstanding borrowings from the credit facility.
Note 7—Capital Stock
At April 30, 2009, the Funds have an unlimited number of shares authorized for issuance. The Funds have the ability to issue multiple classes of shares.
FIRST EAGLE FUNDS | SEMI-ANNUAL REPORT | APRIL 30, 2009
111
Notes to Financial Statements (unaudited)
Transactions in shares of capital stock were as follows:
| | | SIX-MONTH PERIOD ENDED APRIL 30, 2009 | | SIX-MONTH PERIOD ENDED APRIL 30, 2009 | |
| | | FIRST EAGLE GLOBAL FUND | | FIRST EAGLE OVERSEAS FUND | | FIRST EAGLE U.S. VALUE FUND | |
| | | CLASS A | | CLASS I | | CLASS C | | CLASS A | | CLASS I | | CLASS C | | CLASS A | | CLASS I | | CLASS C | |
| Shares sold | | | 30,222,981 | | | | 18,203,473 | | | | 15,676,129 | | | | 37,668,535 | | | | 21,546,794 | | | | 6,454,785 | | | | 16,845,384 | | | | 6,278,593 | | | | 9,394,967 | | |
Shares issued for reinvested
dividends and distributions | | | 18,109,693 | | | | 4,549,283 | | | | 6,631,410 | | | | 17,644,515 | | | | 8,732,564 | | | | 3,153,124 | | | | 609,075 | | | | 178,097 | | | | 273,853 | | |
| Shares redeemed | | | (56,858,905 | ) | | | (27,293,743 | ) | | | (23,766,296 | ) | | | (57,203,279 | ) | | | (35,833,708 | ) | | | (10,276,877 | ) | | | (7,736,045 | ) | | | (2,556,933 | ) | | | (5,360,107 | ) | |
| Net increase (decrease) | | | (8,526,231 | ) | | | (4,540,987 | ) | | | (1,458,757 | ) | | | (1,890,229 | ) | | | (5,554,350 | ) | | | (668,968 | ) | | | 9,718,414 | | | | 3,899,757 | | | | 4,308,713 | | |
| | | SIX-MONTH PERIOD ENDED APRIL 30, 2009 | | SIX-MONTH PERIOD ENDED APRIL 30, 2009 | |
| | | FIRST EAGLE GOLD FUND | | FIRST EAGLE FUND OF AMERICA | |
| | | CLASS A | | CLASS I | | CLASS C | | CLASS A | | CLASS C | | CLASS Y | |
| Shares sold | | | 18,633,726 | | | | 1,614,661 | | | | 4,548,634 | | | | 6,290,890 | | | | 1,603,614 | | | | 1,766,756 | | |
Shares issued for reinvested
dividends and distributions | | | 1,576,368 | | | | 236,404 | | | | 342,567 | | | | 438,430 | | | | 213,945 | | | | 1,425,579 | | |
| Shares redeemed | | | (6,174,792 | ) | | | (722,738 | ) | | | (1,041,893 | ) | | | (1,786,347 | ) | | | (756,127 | ) | | | (3,811,670 | ) | |
| Net increase (decrease) | | | 14,035,302 | | | | 1,128,327 | | | | 3,849,308 | | | | 4,942,973 | | | | 1,061,432 | | | | (619,335 | ) | |
| | | YEAR ENDED OCTOBER 31, 2008 | | YEAR ENDED OCTOBER 31, 2008 | |
| | | FIRST EAGLE GLOBAL FUND | | FIRST EAGLE OVERSEAS FUND | | FIRST EAGLE U.S. VALUE FUND | |
| | | CLASS A | | CLASS I | | CLASS C | | CLASS A | | CLASS I | | CLASS C | | CLASS A | | CLASS I | | CLASS C | |
| Shares sold | | | 75,198,015 | | | | 46,137,156 | | | | 42,650,283 | | | | 53,918,059 | | | | 36,339,153 | | | | 8,976,374 | | | | 8,871,653 | | | | 4,173,274 | | | | 3,757,921 | | |
Shares issued for reinvested
dividends and distributions | | | 28,071,819 | | | | 5,754,096 | | | | 9,114,495 | | | | 32,392,050 | | | | 18,060,451 | | | | 5,046,138 | | | | 985,724 | | | | 284,778 | | | | 545,993 | | |
| Shares redeemed | | | (82,505,436 | ) | | | (30,398,726 | ) | | | (26,612,079 | ) | | | (94,603,366 | ) | | | (80,259,586 | ) | | | (13,987,426 | ) | | | (7,631,247 | ) | | | (2,489,779 | ) | | | (4,866,343 | ) | |
| Net increase (decrease) | | | 20,764,398 | | | | 21,492,526 | | | | 25,152,699 | | | | (8,293,257 | ) | | | (25,859,982 | ) | | | 35,086 | | | | 2,226,130 | | | | 1,968,273 | | | | (562,429 | ) | |
| | | YEAR ENDED OCTOBER 31, 2008 | | YEAR ENDED OCTOBER 31, 2008 | |
| | | FIRST EAGLE GOLD FUND | | FIRST EAGLE FUND OF AMERICA | |
| | | CLASS A | | CLASS I | | CLASS C | | CLASS A | | CLASS C | | CLASS Y | |
| Shares sold | | | 9,428,364 | | | | 1,314,468 | | | | 2,219,049 | | | | 5,447,853 | | | | 1,689,034 | | | | 4,012,896 | | |
Shares issued for reinvested
dividends and distributions | | | 1,974,866 | | | | 307,964 | | | | 358,191 | | | | 292,451 | | | | 224,578 | | | | 2,452,363 | | |
| Shares redeemed | | | (11,687,761 | ) | | | (2,959,569 | ) | | | (2,368,303 | ) | | | (1,785,192 | ) | | | (717,831 | ) | | | (5,423,395 | ) | |
| Net increase (decrease) | | | (284,531 | ) | | | (1,337,137 | ) | | | 208,937 | | | | 3,955,112 | | | | 1,195,781 | | | | 1,041,864 | | |
FIRST EAGLE FUNDS | SEMI-ANNUAL REPORT | APRIL 30, 2009
112
(continued)
FIRST EAGLE FUNDS | SEMI-ANNUAL REPORT | APRIL 30, 2009
113
Notes to Financial Statements (unaudited)
Transactions in dollars of capital stock were as follows:
| | | SIX-MONTH PERIOD ENDED APRIL 30, 2009 | | SIX-MONTH PERIOD ENDED APRIL 30, 2009 | |
| | | FIRST EAGLE GLOBAL FUND | | FIRST EAGLE OVERSEAS FUND | | FIRST EAGLE U.S. VALUE FUND | |
| | | CLASS A | | CLASS I | | CLASS C | | CLASS A | | CLASS I | | CLASS C | | CLASS A | | CLASS I | | CLASS C | |
| Shares sold | | $ | 961,074,685 | | | $ | 577,537,221 | | | $ | 493,325,186 | | | $ | 601,683,174 | | | $ | 346,936,839 | | | $ | 102,971,506 | | | $ | 198,063,930 | | | $ | 74,829,138 | | | $ | 109,741,939 | | |
Shares issued for reinvested
dividends and distributions | | | 597,629,082 | | | | 150,490,259 | | | | 216,449,222 | | | | 290,958,051 | | | | 145,746,487 | | | | 51,049,093 | | | | 7,333,267 | | | | 2,163,880 | | | | 3,286,223 | | |
| Shares redeemed | | | (1,778,492,047 | ) | | | (868,628,275 | ) | | | (735,926,328 | ) | | | (914,059,296 | ) | | | (586,743,979 | ) | | | (160,688,597 | ) | | | (89,396,456 | ) | | | (29,822,505 | ) | | | (62,067,657 | ) | |
| Net increase (decrease) | | $ | (219,788,280 | ) | | $ | (140,600,795 | ) | | $ | (26,151,920 | ) | | $ | (21,418,071 | ) | | $ | (94,060,653 | ) | | $ | (6,667,998 | ) | | $ | 116,000,741 | | | $ | 47,170,513 | | | $ | 50,960,505 | | |
| | | SIX-MONTH PERIOD ENDED APRIL 30, 2009 | | SIX-MONTH PERIOD ENDED APRIL 30, 2009 | |
| | | FIRST EAGLE GOLD FUND | | FIRST EAGLE FUND OF AMERICA | |
| | | CLASS A | | CLASS I | | CLASS C | | CLASS A | | CLASS C | | CLASS Y | |
| Shares sold | | $ | 359,953,920 | | | $ | 32,163,998 | | | $ | 87,363,058 | | | $ | 104,206,185 | | | $ | 23,943,696 | | | $ | 30,056,979 | | |
Shares issued for reinvested
dividends and distributions | | | 29,478,076 | | | | 4,460,947 | | | | 6,286,099 | | | | 7,356,862 | | | | 3,224,159 | | | | 24,334,625 | | |
| Shares redeemed | | | (115,864,327 | ) | | | (12,865,145 | ) | | | (18,522,985 | ) | | | (29,750,081 | ) | | | (11,181,681 | ) | | | (64,160,043 | ) | |
| Net increase (decrease) | | $ | 273,567,669 | | | $ | 23,759,800 | | | $ | 75,126,172 | | | $ | 81,812,966 | | | $ | 15,986,174 | | | $ | (9,768,439 | ) | |
| | | YEAR ENDED OCTOBER 31, 2008 | | YEAR ENDED OCTOBER 31, 2008 | |
| | | FIRST EAGLE GLOBAL FUND | | FIRST EAGLE OVERSEAS FUND | | FIRST EAGLE U.S. VALUE FUND | |
| | | CLASS A | | CLASS I | | CLASS C | | CLASS A | | CLASS I | | CLASS C | | CLASS A | | CLASS I | | CLASS C | |
| Shares sold | | $ | 3,253,372,393 | | | $ | 1,988,837,367 | | | $ | 1,838,193,586 | | | $ | 1,186,545,157 | | | $ | 793,760,846 | | | $ | 197,183,459 | | | $ | 131,925,450 | | | $ | 63,391,324 | | | $ | 55,336,979 | | |
Shares issued for reinvested
dividends and distributions | | | 1,265,758,306 | | | | 260,142,643 | | | | 408,238,245 | | | | 754,734,774 | | | | 424,601,202 | | | | 116,414,413 | | | | 15,850,445 | | | | 4,619,106 | | | | 8,757,729 | | |
| Shares redeemed | | | (3,421,928,092 | ) | | | (1,239,421,544 | ) | | | (1,078,377,093 | ) | | | (2,041,179,422 | ) | | | (1,816,450,609 | ) | | | (295,592,815 | ) | | | (116,253,611 | ) | | | (38,125,997 | ) | | | (73,856,144 | ) | |
| Net increase (decrease) | | $ | 1,097,202,607 | | | $ | 1,009,558,466 | | | $ | 1,168,054,738 | | | $ | (99,899,491 | ) | | $ | (598,088,561 | ) | | $ | 18,005,057 | | | $ | 31,522,284 | | | $ | 29,884,433 | | | $ | (9,761,436 | ) | |
| | | YEAR ENDED OCTOBER 31, 2008 | | YEAR ENDED OCTOBER 31, 2008 | |
| | | FIRST EAGLE GOLD FUND | | FIRST EAGLE FUND OF AMERICA | |
| | | CLASS A | | CLASS I | | CLASS C | | CLASS A | | CLASS C | | CLASS Y | |
| Shares sold | | $ | 218,484,735 | | | $ | 25,386,715 | | | $ | 49,541,357 | | | $ | 134,887,588 | | | $ | 37,909,600 | | | $ | 103,149,091 | | |
Shares issued for reinvested
dividends and distributions | | | 46,508,074 | | | | 7,292,576 | | | | 8,345,853 | | | | 7,551,098 | | | | 5,288,805 | | | | 64,374,523 | | |
| Shares redeemed | | | (262,984,501 | ) | | | (72,465,944 | ) | | | (51,621,426 | ) | | | (41,259,286 | ) | | | (15,524,079 | ) | | | (130,526,933 | ) | |
| Net increase (decrease) | | $ | 2,008,308 | | | $ | (39,786,653 | ) | | $ | 6,265,784 | | | $ | 101,179,400 | | | $ | 27,674,326 | | | $ | 36,996,681 | | |
FIRST EAGLE FUNDS | SEMI-ANNUAL REPORT | APRIL 30, 2009
114
(continued)
FIRST EAGLE FUNDS | SEMI-ANNUAL REPORT | APRIL 30, 2009
115
Notes to Financial Statements (unaudited) (continued)
Note 8—Indemnification and Foreign Investment Risk
In the normal course of business, the Funds enter into contracts that contain a variety of representations which provide general indemnifications. Each Fund's maximum exposure under these arrangements is unknown, as this would involve future claims that may be made against each Fund that have not yet occurred. However, based on experience, the Funds expect the risk of loss to be remote. The Funds may have elements of risk not typically associated with investments in the United States of America due to their investments in foreign countries or regions. Such foreign investments may subject the Funds to additional risks resulting from political or economic conditions in such countries or regions and the possible imposition of adverse governmental laws or currency exchange restrictions could cause the securities and their markets to be less liquid and their prices to be more volatile than those of comparable U.S. securities. The sec urities markets in many emerging-market countries are substantially smaller, less developed, less liquid and more volatile than the securities markets of developed countries.
FIRST EAGLE FUNDS | SEMI-ANNUAL REPORT | APRIL 30, 2009
116
General Information
Quarterly Form N-Q portfolio schedule
The First Eagle Funds file their complete schedule of portfolio holdings with the Securities and Exchange Commission ("SEC") for the first and third quarters of each fiscal year on Form N-Q. The Funds' Forms N-Q is available on the SEC's Web site at www.sec.gov. The Funds' Forms N-Q may be reviewed and copied at the SEC's Public Reference Room in Washington, D.C. Information on the operation of the SEC's Public Reference Room may be obtained by calling 1-800-SEC 0330. Additionally, you may obtain copies of Forms N-Q from the Funds upon request by calling 1-800-334-2143.
Proxy voting policies, procedures and record
You may obtain a description of the Funds' (1) proxy voting policies, (2) proxy voting procedures and (3) information regarding how the Funds voted any proxies related to portfolio securities during the most recent 12-month period ended June 30 for which an SEC filing has been made, without charge, upon request by contacting the Funds directly at 1-800-334-2143 or on the EDGAR Database on the SEC's Web site (www.sec.gov).
FIRST EAGLE FUNDS | SEMI-ANNUAL REPORT | APRIL 30, 2009
117
Fund Expenses (unaudited)
Example
As a shareholder of the First Eagle Funds, you may incur two types of costs: (1) transaction costs, including front-end and contingent deferred sales charges (loads), and (2) ongoing costs, including advisory fees; distribution (12b-1) and/or service fees; and other fund expenses. This Example is intended to help you understand your ongoing costs (in dollars) of investing in each of the First Eagle Funds and to compare these costs with the ongoing costs of investing in other mutual funds.
This Example is based on an investment of $1,000 invested on November 1, 2008 and held for the six months ended April 30, 2009.
Actual Expenses
The table below titled "Based on Actual Total Return" provides information about actual account values and actual expenses. You may use the information provided in this table, together with the amount you invested, to estimate the expenses that you paid over the period. To estimate the expenses you paid on your account, divide your ending account value by $1,000 (for example, an $8,600 ending account value divided by $1,000 = 8.6), then multiply the result by the number under the heading entitled "Expenses Paid During the Period".
FIRST EAGLE FUNDS | SEMI-ANNUAL REPORT | APRIL 30, 2009
118
Based on Actual Total Return1
| | | ACTUAL TOTAL
RETURN
WITHOUT
SALES CHARGE2 | | BEGINNING
ACCOUNT
VALUE | | ENDING
ACCOUNT
VALUE | | EXPENSES
PAID
DURING THE
PERIOD3 | |
| First Eagle Global Fund Class A | | | 2.01 | % | | $ | 1,000.00 | | | $ | 1,020.10 | | | $ | 5.96 | | |
| First Eagle Global Fund Class I | | | 2.15 | | | | 1,000.00 | | | | 1,021.50 | | | | 4.71 | | |
| First Eagle Global Fund Class C | | | 1.63 | | | | 1,000.00 | | | | 1,016.30 | | | | 9.70 | | |
| First Eagle Overseas Fund Class A | | | 1.96 | | | | 1,000.00 | | | | 1,019.60 | | | | 6.11 | | |
| First Eagle Overseas Fund Class I | | | 2.04 | | | | 1,000.00 | | | | 1,020.40 | | | | 4.86 | | |
| First Eagle Overseas Fund Class C | | | 1.48 | | | | 1,000.00 | | | | 1,014.80 | | | | 9.84 | | |
| First Eagle U.S. Value Fund Class A | | | 1.23 | | | | 1,000.00 | | | | 1,012.30 | | | | 6.09 | | |
| First Eagle U.S. Value Fund Class I | | | 1.29 | | | | 1,000.00 | | | | 1,012.90 | | | | 4.84 | | |
| First Eagle U.S. Value Fund Class C | | | 0.78 | | | | 1,000.00 | | | | 1,007.80 | | | | 9.81 | | |
| First Eagle Gold Fund Class A | | | 40.87 | | | | 1,000.00 | | | | 1,408.70 | | | | 7.41 | | |
| First Eagle Gold Fund Class I | | | 40.99 | | | | 1,000.00 | | | | 1,409.90 | | | | 5.92 | | |
| First Eagle Gold Fund Class C | | | 40.39 | | | | 1,000.00 | | | | 1,403.90 | | | | 11.80 | | |
| First Eagle Fund of America Class A | | | -4.37 | | | | 1,000.00 | | | | 956.30 | | | | 7.23 | | |
| First Eagle Fund of America Class C | | | -4.72 | | | | 1,000.00 | | | | 952.80 | | | | 10.85 | | |
| First Eagle Fund of America Class Y | | | -4.40 | | | | 1,000.00 | | | | 956.00 | | | | 7.23 | | |
1For the six months ended April 30, 2009.
2Assumes reinvestment of all dividends and capital gain distributions, if any, at net asset value and does not reflect the deduction of the applicable sales charge, exchange fees or redemption fees. Had the effect of sales charges been reflected, expenses would have been higher and returns lower. Total return is not annualized, as it may not be representative of the total return for the year.
3Expenses are equal to the annualized expense ratio of 1.19%, 0.94%, 1.94%, 1.22%, 0.97%, 1.97%, 1.22%, 0.97%, 1.97%, 1.24%, 0.99%, 1.98%, 1.49%, 2.24% and 1.49% for the First Eagle Global Fund Class A, I, and C; First Eagle Overseas Fund Class A, I, and C; First Eagle U.S. Value Fund Class A, I, and C; First Eagle Gold Fund Class A, I, and C; and First Eagle Fund of America Class A, C, and Y, respectively, multiplied by the average account value over the period, multiplied by 181/365 (to reflect the one-half year period).
Hypothetical Example for Comparison Purposes
The table below titled "Based on Hypothetical Total Return" provides information about hypothetical account values and hypothetical expenses based on the actual expense ratios and an assumed rate of return of 5.00% per year before expenses, which is not the First Eagle Fund's actual return. The hypothetical account values and expenses may not be used to estimate the actual ending account balance or expenses you paid for the period. You may use the information provided in this table to compare the ongoing costs of investing in the
FIRST EAGLE FUNDS | SEMI-ANNUAL REPORT | APRIL 30, 2009
119
Fund Expenses (unaudited) (continued)
First Eagle Funds and other funds. To do so, compare the 5.00% hypothetical example relating to the First Eagle Funds with the 5.00% hypothetical examples that appear in the shareholder reports of other funds.
This Example is based on an investment of $1,000 invested on November 1, 2008 and held for the six months ended April 30, 2009.
Please note that the expenses shown in the table below are meant to highlight your ongoing costs only and do not reflect any transactional costs, such as front-end or back-end sales charges (loads). Therefore, the table is useful in comparing ongoing costs only, and will not help you determine the relative total costs of owning different funds. In addition, if these transaction costs were included, your costs would have been higher.
Based on Hypothetical Total Return1
| | | HYPOTHETICAL
ANNUALIZED
TOTAL
RETURN | | BEGINNING
ACCOUNT
VALUE | | ENDING
ACCOUNT
VALUE | | EXPENSES
PAID
DURING THE
PERIOD2 | |
| First Eagle Global Fund Class A | | | 5.00 | % | | $ | 1,000.00 | | | $ | 1,018.89 | | | $ | 5.96 | | |
| First Eagle Global Fund Class I | | | 5.00 | | | | 1,000.00 | | | | 1,020.13 | | | | 4.71 | | |
| First Eagle Global Fund Class C | | | 5.00 | | | | 1,000.00 | | | | 1,015.17 | | | | 9.69 | | |
| First Eagle Overseas Fund Class A | | | 5.00 | | | | 1,000.00 | | | | 1,018.74 | | | | 6.11 | | |
| First Eagle Overseas Fund Class I | | | 5.00 | | | | 1,000.00 | | | | 1,019.98 | | | | 4.86 | | |
| First Eagle Overseas Fund Class C | | | 5.00 | | | | 1,000.00 | | | | 1,015.03 | | | | 9.84 | | |
| First Eagle U.S. Value Fund Class A | | | 5.00 | | | | 1,000.00 | | | | 1,018.74 | | | | 6.11 | | |
| First Eagle U.S. Value Fund Class I | | | 5.00 | | | | 1,000.00 | | | | 1,019.98 | | | | 4.86 | | |
| First Eagle U.S. Value Fund Class C | | | 5.00 | | | | 1,000.00 | | | | 1,015.03 | | | | 9.84 | | |
| First Eagle Gold Fund Class A | | | 5.00 | | | | 1,000.00 | | | | 1,018.65 | | | | 6.21 | | |
| First Eagle Gold Fund Class I | | | 5.00 | | | | 1,000.00 | | | | 1,019.89 | | | | 4.96 | | |
| First Eagle Gold Fund Class C | | | 5.00 | | | | 1,000.00 | | | | 1,014.98 | | | | 9.89 | | |
| First Eagle Fund of America Class A | | | 5.00 | | | | 1,000.00 | | | | 1,017.41 | | | | 7.45 | | |
| First Eagle Fund of America Class C | | | 5.00 | | | | 1,000.00 | | | | 1,013.69 | | | | 11.18 | | |
| First Eagle Fund of America Class Y | | | 5.00 | | | | 1,000.00 | | | | 1,017.41 | | | | 7.45 | | |
1For the six months ended April 30, 2009.
2Expenses are equal to the annualized expense ratio of 1.19%, 0.94%, 1.94%, 1.22%, 0.97%, 1.97%, 1.22%, 0.97%, 1.97%, 1.24%, 0.99%, 1.98%, 1.49%, 2.24% and 1.49% for the First Eagle Global Fund Class A, I, and C; First Eagle Overseas Fund Class A, I, and C; First Eagle U.S. Value Fund Class A, I, and C; First Eagle Gold Fund Class A, I, and C; and First Eagle Fund of America Class A, C, and Y, respectively, multiplied by the average account value over the period, multiplied by 181/365 (to reflect the one-half year period).
FIRST EAGLE FUNDS | SEMI-ANNUAL REPORT | APRIL 30, 2009
120
Additional Information (unaudited)
Management of the Trust
The business of the Trust is managed by its Board of Trustees, which elects officers responsible for the day to day operations of the Funds and for the execution of the policies formulated by the Board of Trustees.
Pertinent information regarding the members of the Board of Trustees and principal officers of the Trust is set forth below. Some of the Trustees and officers are employees of the Adviser and its affiliates. At least a majority of the Trust's Board of Trustees are not "interested persons" as that term is defined in the Investment Company Act.
Independent Trustees1
NAME, ADDRESS
AND DATE OF BIRTH | | POSITION(S)
HELD WITH
THE TRUST | | TERM OF
OFFICE2 AND
LENGTH
OF TIME
SERVED | | PRINCIPAL
OCCUPATION(S)
DURING PAST 5 YEARS | | NUMBER OF
PORTFOLIOS
IN THE FUND
COMPLEX
OVERSEEN BY
TRUSTEE | | OTHER
DIRECTORSHIPS/
TRUSTEESHIPS
HELD BY TRUSTEE | |
Lisa Anderson
1345 Avenue of the Americas
New York, New York 10105
(born October 1950) | | Trustee | | December 2005 to present | | Provost, American University in Cairo; James T. Shotwell Professor of International Relations and Dean, School of International and Public Affairs, Columbia University | | | 6 | | | Chair, Social Science Research Council; Member, Carnegie Council on Ethics and International Affairs; Member Emerita, Human Rights Watch; Trustee, First Eagle Variable Funds (1 portfolio) | |
1Trustees who are not "interested persons" of the Trust as defined in the Investment Company Act.
2The term of office of each Independent Trustee expires on his/her 70th birthday.
FIRST EAGLE FUNDS | SEMI-ANNUAL REPORT | APRIL 30, 2009
121
Additional Information (unaudited)
NAME, ADDRESS
AND DATE OF BIRTH | | POSITION(S)
HELD WITH
THE TRUST | | TERM OF
OFFICE1 AND
LENGTH
OF TIME
SERVED | | PRINCIPAL
OCCUPATION(S)
DURING PAST 5 YEARS | | NUMBER OF
PORTFOLIOS
IN THE FUND
COMPLEX
OVERSEEN BY
TRUSTEE | | OTHER
DIRECTORSHIPS/
TRUSTEESHIPS
HELD BY TRUSTEE | |
Candace K. Beinecke
One Battery Park Plaza
New York, New York 10004
(born December 1946) | | Trustee (Chair) | | December 1999 to present2 | | Chair, Hughes Hubbard & Reed LLP | | | 6 | | | Director, ALSTOM; Trustee, Vornado Realty Trust; Director, Rockefeller Financial Services, Inc.; Director, Rockefeller & Company, Inc.; Trustee, The Wallace Foundation; Director, Vice Chair and Member of the Executive Committee, Partnership for New York City; Board of Advisors, Yale Law School Center for the Study of Corporate Law; Trustee, First Eagle Variable Funds (Chair) (1 portfolio) | |
| Jean D. Hamilton 1345 Avenue of the Americas New York, New York 10105 (born January 1947) | | Trustee | | March 2003 to present | | Private Investor/ Independent Consultant/ Member, Brock Capital Group LLC; prior to November 2002, Chief Executive Officer, Prudential Institutional; Executive Vice President, Prudential Financial, Inc. | | | 6 | | | Director, RenaissanceRe Holdings Ltd; Director, Four Nations; Trustee, First Eagle Variable Funds (1 portfolio) | |
1The term of office of each Independent Trustee expires on his/her 70th birthday.
2Ms. Beinecke also served as a trustee of a predecessor fund to First Eagle Fund of America since 1996.
FIRST EAGLE FUNDS | SEMI-ANNUAL REPORT | APRIL 30, 2009
122
(continued)
NAME, ADDRESS
AND DATE OF BIRTH | | POSITION(S)
HELD WITH
THE TRUST | | TERM OF
OFFICE1 AND
LENGTH
OF TIME
SERVED | | PRINCIPAL
OCCUPATION(S)
DURING PAST 5 YEARS | | NUMBER OF
PORTFOLIOS
IN THE FUND
COMPLEX
OVERSEEN BY
TRUSTEE | | OTHER
DIRECTORSHIPS/
TRUSTEESHIPS
HELD BY TRUSTEE | |
| James E. Jordan 1345 Avenue of the Americas New York, New York 10105 (born April 1944) | | Trustee | | December 1999 to present | | Private Investor and Independent Consultant; prior to July 2005, Managing Director, Arnhold and S. Bleichroeder Advisers, LLC and Director, ASB Securities LLC and ASB Advisers UK, Limited; prior to July 2002, private investor and consultant to The Jordan Company (private investment banking firm) since June 1997 | | | 6 | | | Director, Leucadia National Corporation; Director, JZ Capital Partners, Plc. (Guernsey investment trust company); Dean's Advisory Council, Columbia University School of International and Public Affairs; Chairman's Council, Conservation International; Trustee, First Eagle Variable Funds (1 portfolio) | |
William M. Kelly
500 Fifth Avenue, 50th Floor
New York, New York 10110 (born February 1944) | | Trustee | | December 1999 to present2 | | President, Lingold Associates | | | 6 | | | Treasurer and Trustee, Black Rock Forest Preservation and Consortium; Trustee, St. Anselm College; Trustee, First Eagle Variable Funds (1 portfolio) | |
1The term of office of each Independent Trustee expires on his/her 70th birthday.
2Mr. Kelly also served as a trustee of a predecessor fund to First Eagle Fund of America since 1998.
FIRST EAGLE FUNDS | SEMI-ANNUAL REPORT | APRIL 30, 2009
123
Additional Information (unaudited)
NAME, ADDRESS
AND DATE OF BIRTH | | POSITION(S)
HELD WITH
THE TRUST | | TERM OF
OFFICE1 AND
LENGTH
OF TIME
SERVED | | PRINCIPAL
OCCUPATION(S)
DURING PAST 5 YEARS | | NUMBER OF
PORTFOLIOS
IN THE FUND
COMPLEX
OVERSEEN BY
TRUSTEE | | OTHER
DIRECTORSHIPS/
TRUSTEESHIPS
HELD BY TRUSTEE | |
Paul J. Lawler
One Michigan Avenue East Battle Creek, Michigan 49017 (born May 1948) | | Trustee | | March 2002 to present | | Vice President Investments and Chief Investment Officer, W.K. Kellogg Foundation | | | 6 | | | Finance and Investment Committee Member, Battle Creek Community Foundation; Custody Advisory Committee Member, The Bank of New York; Advisory Committee, Common Fund Capital; Advisory Committee, TA Realty Advisors; Trustee, First Eagle Variable Funds (1 portfolio) | |
1The term of office of each Independent Trustee expires on his/her 70th birthday.
FIRST EAGLE FUNDS | SEMI-ANNUAL REPORT | APRIL 30, 2009
124
(continued)
Interested Trustees
NAME, ADDRESS
AND DATE OF BIRTH | | POSITION(S)
HELD WITH
THE TRUST | | TERM OF
OFFICE1 AND
LENGTH
OF TIME
SERVED | | PRINCIPAL
OCCUPATION(S)
DURING PAST 5 YEARS | | NUMBER OF
PORTFOLIOS
IN THE FUND
COMPLEX
OVERSEEN BY
TRUSTEE | | OTHER
DIRECTORSHIPS/
TRUSTEESHIPS
HELD BY TRUSTEE | |
John P. Arnhold2
1345 Avenue of the Americas New York, New York 10105 (born December 1953) | | President and Trustee | | December 1999 to present | | Co-President, Co-CEO and Director, Arnhold and S. Bleichroeder Holdings, Inc.; Chairman, CEO and Director, Arnhold and S. Bleichroeder Advisers, LLC and ASB Securities LLC; prior to March 2005, President and Director, Natexis Bleichroeder, Inc. and Natexis Bleichroeder UK | | | 6 | | | Director, Arnhold Ceramics; Director, The Arnhold Foundation; Director, The Mulago Foundation; Director, Hanseatic Asset Management LBG; Director, Quantum Endowment Fund; Director, Educational Broadcasting Corporation; Trustee, Trinity Episcopal Schools Corp.; Trustee, Vassar College; Trustee, Sports and Arts in Schools Foundation; Trustee, Jazz at Lincoln Center; Managing Member, New Eagle Management Company, LLC; President and Trustee, First Eagle Variable Funds (1 portfolio) | |
1The term of office of each Interested Trustee is indefinite.
2Mr. Arnhold and Mr. Eveillard are Interested Trustees (i.e., each is an "interested person" of the Trust as defined in the Investment Company Act). Mr. Arnhold is an officer and director of the Trust's investment adviser and principal underwriter, and Mr. Eveillard is an employee of the Trust's investment adviser.
FIRST EAGLE FUNDS | SEMI-ANNUAL REPORT | APRIL 30, 2009
125
Additional Information (unaudited)
NAME, ADDRESS
AND DATE OF BIRTH | | POSITION(S)
HELD WITH
THE TRUST | | TERM OF
OFFICE1 AND
LENGTH
OF TIME
SERVED | | PRINCIPAL
OCCUPATION(S)
DURING PAST 5 YEARS | | NUMBER OF
PORTFOLIOS
IN THE FUND
COMPLEX
OVERSEEN BY
TRUSTEE | | OTHER
DIRECTORSHIPS/
TRUSTEESHIPS
HELD BY TRUSTEE | |
Jean-Marie Eveillard2
1345 Avenue of the Americas New York, New York 10105
(born January 1940) | | Trustee | | June 2008 to present | | Senior Advisor to Arnhold and S. Bleichroeder Advisers, LLC since March 2009; Senior Vice President, Arnhold and S. Bleichroeder Advisers, LLC since January 2000; Portfolio Manager of First Eagle Global Fund, First Eagle Overseas Fund, First Eagle U.S. Value Fund, First Eagle Gold Fund, and First Eagle Variable Funds March 2007 through March 2009 and prior to December 2004 (portfolio management responsibilities commenced 1979) | | | 6 | | | Director, SocGen International SICAV (Luxembourg); Trustee, The Frick Collection; Trustee, First Eagle Variable Funds (1 portfolio) | |
1The term of office of each Interested Trustee is indefinite.
2Mr. Arnhold and Mr. Eveillard are Interested Trustees (i.e., each is an "interested person" of the Trust as defined in the Investment Company Act). Mr. Arnhold is an officer and director of the Trust's investment adviser and principal underwriter, and Mr. Eveillard is an employee of the Trust's investment adviser.
FIRST EAGLE FUNDS | SEMI-ANNUAL REPORT | APRIL 30, 2009
126
(continued)
Officers
NAME, ADDRESS
AND DATE OF BIRTH | | POSITION(S)
HELD WITH
THE TRUST | | TERM OF
OFFICE AND
LENGTH OF
TIME SERVED1 | | PRINCIPAL OCCUPATION(S)
DURING PAST FIVE (5) YEARS | |
John P. Arnhold
1345 Avenue of the Americas
New York, New York 10105 (born December 1953) | | President and Trustee | | December 1999 to present | | See table on preceding page related to Interested Trustees | |
Robert Bruno
1345 Avenue of the Americas
New York, New York 10105
(born June 1964) | | Chief Operations Officer | | December 1999 to present | | Senior Vice President, Arnhold and S. Bleichroeder Advisers, LLC; President, ASB Securities LLC; Chief Operations Officer, First Eagle Variable Funds | |
Joseph T. Malone
1345 Avenue of the Americas
New York, New York 10105
(born September 1967) | | Chief Financial Officer | | September 2008 to present | | Senior Vice President, Arnhold and S. Bleichroeder Advisers, LLC; Chief Financial Officer, First Eagle Variable Funds; from September 2008; Chief Financial Officer and Treasurer, Aberdeen Funds from November 2007; Director, UBS Global Asset Management from October 2001; Global Fund Treasurer, UBS Global Asset Management from September 2006; Treasurer and Co-Head Mutual Fund Administration Group, UBS Global Asset Management from July 2005 | |
1The term of office of each officer is indefinite. Length of time served represents time served as an officer of the Trust (or its predecessor entities), although various positions may have been held during the period.
FIRST EAGLE FUNDS | SEMI-ANNUAL REPORT | APRIL 30, 2009
127
Additional Information (unaudited) (continued)
NAME, ADDRESS
AND DATE OF BIRTH | | POSITION(S)
HELD WITH
THE TRUST | | TERM OF
OFFICE AND
LENGTH OF
TIME SERVED1 | | PRINCIPAL OCCUPATION(S)
DURING PAST FIVE (5) YEARS | |
Mark D. Goldstein
1345 Avenue of the Americas
New York, New York 10105
(born October 1964) | | Chief Compliance Officer | | February 2005 to present | | General Counsel, Chief Compliance Officer and Senior Vice President, Arnhold and S. Bleichroeder Advisers, LLC; General Counsel and Secretary of Arnhold and S. Bleichroeder Holdings, Inc., and Chief Compliance Officer, First Eagle Variable Funds from February 2005; Chief Compliance Officer, Good Hope Advisers, LLC from January 2006; Senior Counsel and Chief Compliance Officer, MacKay Shields LLC from April 2004 | |
Suzan J. Afifi
1345 Avenue of the Americas
New York, New York 10105
(born October 1952) | | Secretary and Vice President | | December 1999 to present | | Senior Vice President, Arnhold and S. Bleichroeder Advisers, LLC; Vice President, ASB Securities LLC; Vice President and Secretary, First Eagle Variable Funds | |
Philip Santopadre
1345 Avenue of the Americas
New York, New York 10105
(born August 1977) | | Treasurer | | September 2005 to present | | Vice President, Arnhold and S. Bleichroeder Advisers, LLC; Treasurer, First Eagle Variable Funds | |
Michael Luzzatto
1345 Avenue of the Americas
New York, New York 10105
(born April 1977) | | Vice President | | December 2004 to present | | Senior Vice President, Arnhold and S. Bleichroeder Advisers, LLC; Vice President, ASB Securities LLC; Vice President, First Eagle Variable Funds | |
Winnie Chin
1345 Avenue of the Americas
New York, New York 10105
(born July 1974) | | Assistant Treasurer | | March 2001 to present | | Vice President, Arnhold and S. Bleichroeder Advisers, LLC; Assistant Treasurer, First Eagle Variable Funds | |
1The term of office of each officer is indefinite. Length of time served represents time served as an officer of the Trust (or its predecessor entities), although various positions may have been held during the period.
FIRST EAGLE FUNDS | SEMI-ANNUAL REPORT | APRIL 30, 2009
128
Consideration of Investment Advisory Agreements
The Adviser
On December 22, 1999, the shareholders of the Global Fund, the Overseas Fund and the Gold Fund initially approved the Advisory Agreement between the Trust and the Adviser. The shareholders of the U.S. Value Fund initially approved the Advisory Agreement applicable to that Fund on August 31, 2001, and the shareholders of the First Eagle Fund of America initially approved the Advisory Agreement applicable to that Fund on December 10, 2002. The Board of Trustees of the Trust approved the continuation of all of these Advisory Agreements most recently on December 9, 2008 at an in-person meeting.
Prior to the meeting the Trustees requested information from the Adviser including performance and expense information and other material as they deemed reasonably necessary to evaluate the terms of the Advisory Agreements. The Trustees also met with legal counsel in Executive Session where they were advised of their legal and fiduciary obligations in approving the Advisory Agreements.
During the course of their most recent review, the Trustees covered the following, among other topics:
• The Trustees considered the responsibilities of the Adviser under the Advisory Agreements, noting that the Adviser is responsible for providing the Funds with investment research and advice, and determining the securities to be purchased and sold in accordance with the investment objectives and policies of each of the Funds.
• The Trustees reviewed the Funds' long-standing historical relationship with the Adviser. They noted the quality and depth of the investment personnel retained by the Adviser, commenting with approval on the hiring of Mr. Matthew McLennan as a portfolio manager, the promotion of Mr. Abhay Deshpande, and the continued development of the analyst team. They expressed confidence in the capability and integrity of the Adviser's senior staff and management. They also discussed the institutional resources available to the Adviser as a result of its parent company's 2007 reorganization and sale of shares to a private equity firm with specialization and contacts in the investment management industry. Finally, the Trustees expressed appreciation that Mr. Eveillard will continue to be available in an advisory capacity and as a committed member of their Board.
FIRST EAGLE FUNDS | SEMI-ANNUAL REPORT | APRIL 30, 2009
129
Consideration of Investment Advisory Agreements
• The Trustees reviewed the performance of the Funds on both an absolute and a relative basis. Significant short-term and long-term outperformance was noted relative to the Funds' benchmarks, to the performance of peer mutual funds and to Morningstar, Lipper and similar composites. Notwithstanding losses on an absolute basis, which were considered in light of the highly negative market environment, performance for each Fund was determined to be excellent given its returns relative to benchmarks and peers.
• The Trustees reviewed the total compensation to be received by the Adviser and the Funds' total cost for using the Adviser's services, taking into account expenses incurred by the Adviser that are passed through to the Funds. They concluded that this compensation was commensurate with the nature, extent, and quality of the services provided and therefore reasonable under the circumstances. As part of their analysis, the Trustees considered competitive prices for services comparable to those provided by the Adviser. In doing so, they considered fees charged by investment advisers to peer mutual funds and determined that the Adviser's fees were competitive, as each Fund's net management fee was generally similar to or lower than its reviewed peer group average, except that the net management fee of First Eagle Fund of America was higher than the reviewed peer group median. The Trustees discussed First Eagle Fund of America's advisory fee in light of this comparison and determined that the fee was justified by the superior service record, consistent long-term performance, and management team stability achieved by the Adviser. The Trustees also considered the advisory fees charged to institutional clients of the Adviser, but considered that comparison less informative after taking into account the differing legal expenses and practical requirements of such clients. While analyzing the effects of indirect compensation to the Adviser, such as soft dollar and other service benefits, the Trustees noted the generally low levels of soft dollars and absence of affiliated broker-dealer relationships.
• The Trustees reviewed the Funds' expense ratios, which were deemed reasonable both on an absolute basis and in comparison to peer funds. The Trustees discussed the impact of the advisory fee on the ratio of total expenses to total assets and noted that the Funds' expense ratios decreased in past years as the Funds grew, highlighting a benefit to shareholders resulting from the development of economies of scale in the operation of the Funds.
FIRST EAGLE FUNDS | SEMI-ANNUAL REPORT | APRIL 30, 2009
130
(continued)
• The Trustees reviewed the Adviser's financial condition and profitability. They commented that profits appear healthy and that the Adviser has always shown the willingness to commit resources to support investment in the business.
At the conclusion of their review, with no single factor being determinative, the Trustees determined that the Advisory Agreements serve the best interests of the Funds and their shareholders and should be continued.
The Subadviser
The shareholders of the First Eagle Fund of America approved the Subadvisory Agreement on December 10, 2002. The Board of Trustees recently approved the Agreement, in accordance with its annual review process, at a regularly scheduled Board meeting on December 9, 2008. In doing so, the Trustees considered the Adviser's capacity and commitment to oversee the Subadviser's portfolio management services, as well as the costs and benefits of continuing the Fund's relationship with Messrs. Harold Levy and David Cohen. The Trustees reiterated that the Subadviser's fees are paid by the Adviser and do not increase the total advisory fees borne by the Fund's shareholders. They noted with approval the investment performance of the Fund, which was superior and more consistent over the long-term than the reviewed peer group average. They also noted the costs incurred by the Subadviser in delivering its services, as well as the impact of soft dollars and other benefits to the Subadviser resulting from its relationship with the Fund. (A number of the factors evaluated by the Trustees in considering the Investment Advisory Agreement were found not to be additionally relevant in respect of the Subadvisory Agreement, principally because the payments in question had been separately evaluated in respect of the Investment Advisory Agreement.)
The Board then reviewed the arrangements with Iridian again at a special meeting held on March 30, 2009. The March 2009 review was prompted by actions taken by the Irish government that affected Iridian's ultimate parent company, the Bank of Ireland. In particular, the Irish government agreed in March 2009 to recapitalize the Bank of Ireland, making a substantial cash investment in the Bank and in return received various governance rights and economic interests in the Bank, including the right to appoint 25% of the Bank's board of directors. Because that recapitalization transaction could have been viewed as a "change of control" of Iridian, Iridian and the Bank of Ireland consulted with the SEC staff and received specific "no-action" relief that First
FIRST EAGLE FUNDS | SEMI-ANNUAL REPORT | APRIL 30, 2009
131
Consideration of Investment Advisory Agreements (continued)
Eagle Fund of America shareholder approval was not required, assuming the Board promptly reviewed and approved a new version of the subadvisory agreement, which the Board did at its meeting held on March 30, 2009. There were no material changes to the new agreement. In their review, the Trustees considered their deliberations from the December 9, 2008 meeting, and additionally considered representations from Mr. Levy that, as a result of the Bank of Ireland transaction, there would be no change in actual, day-to-day control of Iridian or Iridian's personnel, that morale among Iridian's analysts remains high, and that First Eagle Fund of America remains important to Iridian's business. After full discussion, and with no single factor being determinative the Trustees then determined that it serves the best interests of First Eagle Fund of America and its shareholders to continue the subadvisory arrangements with Iridian without in terruption.
Certain Terms of the Advisory and Subadvisory Agreements
As to each fund, the Advisory Agreement, and additionally with respect to the First Eagle Fund of America, the Subadvisory Agreement, will continue in effect only so long as such continuance is specifically approved at least annually in conformity with the Investment Company Act. The Advisory Agreement provides that the Adviser will not be liable for any error of judgment or for any loss suffered by the Fund in connection with the matters to which the Advisory Agreement relates, except a loss resulting from willful misfeasance, bad faith, gross negligence or reckless disregard of duty. The Advisory Agreement provides that it will terminate automatically if assigned, within the meaning of the Investment Company Act, and that it may be terminated without penalty by either party upon not more than 60 days' nor less than 30 days' written notice. The Subadvisory Agreement provides that Iridian will not be liable for any error of judg ment or for any loss suffered by the First Eagle Fund of America in connection with the matters to which the Subadvisory Agreement relates, except a loss resulting from willful misfeasance, bad faith, gross negligence or reckless disregard of duty. The Subadvisory Agreement provides that it will terminate automatically if assigned, within the meaning of the Investment Company Act, and that it may be terminated without penalty by either party upon not more than 60 days' nor less than 30 days' written notice.
FIRST EAGLE FUNDS | SEMI-ANNUAL REPORT | APRIL 30, 2009
132
First Eagle Funds
Trustees
Lisa Anderson
John P. Arnhold
Candace K. Beinecke (Chair)
Jean-Marie Eveillard
Jean D. Hamilton
James E. Jordan
William M. Kelly
Paul J. Lawler
Officers
John P. Arnhold
President
Robert Bruno
Chief Operations Officer
Joseph T. Malone
Chief Financial Officer
Mark D. Goldstein
Chief Compliance Officer
Suzan J. Afifi
Secretary & Vice President
Philip Santopadre
Treasurer
Michael Luzzatto
Vice President
Winnie Chin
Assistant Treasurer
Investment Adviser
Arnhold and S. Bleichroeder
Advisers, LLC
1345 Avenue of the Americas
New York, NY 10105
Legal Counsel
Shearman & Sterling LLP
599 Lexington Avenue
New York, NY 10022
Custodian
State Street Bank and Trust Company
801 Pennsylvania
Kansas City, MO 64105
Shareholder Servicing Agent
DST Systems, Inc.
330 West 9th Street
Kansas City, MO 64105
(800) 334-2143
Underwriter
First Eagle Funds Distributors, a division of
ASB Securities LLC
1345 Avenue of the Americas
New York, NY 10105
Independent Registered
Public Accounting Firm
PricewaterhouseCoopers LLP
300 Madison Avenue
New York, NY 10017
This report is not authorized for distribution to prospective investors unless preceded or accompanied by a currently effective prospectus of First Eagle Funds.
The financial information included herein is taken from records of the Funds without examination by the Funds' independent auditors, who do not express an opinion thereon.
FIRST EAGLE FUNDS | SEMI-ANNUAL REPORT | APRIL 30, 2009
133
This page was intentionally left blank.
This page was intentionally left blank.
This page was intentionally left blank.
This page was intentionally left blank.
This page was intentionally left blank.

1345 Avenue of the Americas | New York, NY | 10105-4300 | 800.334.2143 | www.firsteaglefunds.com
Item 2. Code of Ethics.
The Registrant has adopted a code of ethics that applies to its principal executive officer and principal financial officer. Copies of the code of ethics may be requested free of charge by calling 1-800-334-2143 (toll free).
Item 3. Audit Committee Financial Expert.
Not applicable at this time.
Item 4. Principal Accountant Fees and Services
Not applicable at this time.
Item 5. Audit Committee of Listed Registrants
Not applicable at this time.
Item 6. Schedule of Investments
Please see schedule of investments contained in the Report to Stockholders included under Item 1 of this Form N-CSR.
Item 7. Disclosure of Proxy Voting Policies and Procedures for Closed-End Management Investment Companies.
Not applicable at this time.
Item 8. Portfolio Managers of Closed-End Investment companies.
Not applicable at this time.
Item 9. Purchases of Equity Securities by Closed-End Management Investment Company and Affiliated Purchasers.
Not applicable at this time.
Item 10. Submission of Matters to a Vote of Security Holders.
No material change to report at this time.
Item 11. Controls and Procedures.
(a) In the opinion of the principal executive officer and principal financial officer, based on their evaluation, the registrant’s disclosure controls and procedures are adequately designed and are operating effectively to ensure (i) that material information relating to the registrant, including its consolidated subsidiaries, is made known to them by others within those entities, particularly during the period in which this report is being prepared; and (ii) that information required to be disclosed by the registrant on Form N-CSR is recorded, processed, summarized and reported within the time periods specified in the Securities and Exchange Commission’s rules and forms.
(b) There were no changes in the registrant’s internal control over financial reporting that occurred during the registrant’s most recent fiscal half-year (the registrant’s second fiscal half-year in the case of an annual report) that have materially affected or are reasonably likely to materially affect, the registrant’s internal control over financial reporting.
Item 12. Exhibits.
(a)(1) Code of ethics required to be disclosed under Item 2 of Form N-CSR.
(a)(2) Certifications pursuant to Rule 30a-2(a) under the Investment Company Act of 1940 (17 CFR 270.30a-2(a)): Attached hereto.
(a)(3) Not applicable.
(b) Certification pursuant to Rule 30a-2(b) under the Investment Company Act of 1940 (17 CFR 270.30a-2(b)): Attached hereto.
SIGNATURES
Pursuant to the requirements of the Securities Exchange Act of 1934 and the Investment Company Act of 1940, the registrant has duly caused this report to be signed on its behalf by the undersigned, thereunto duly authorized.
(Registrant) | First Eagle Funds |
| |
By (Signature and Title)* | /s/ John P. Arnhold |
| |
| John P. Arnhold, President |
Date: July 1, 2009
Pursuant to the requirements of the Securities Exchange Act of 1934 and the Investment Company Act of 1940, this report has been signed below by the following persons on behalf of the registrant and in the capacities and on the dates indicated.
By (Signature and Title)* | /s/ John P. Arnhold |
| |
| John P. Arnhold, Principal Executive Officer |
Date: July 1, 2009
By (Signature and Title)* | /s/ Joseph T. Malone |
| |
| Joseph T. Malone, Principal Financial Officer |
Date: July 1, 2009
* Print the name and title of each signing officer under his or her signature.