UNITED STATES
SECURITIES AND EXCHANGE COMMISSION
Washington, D.C. 20549
FORM N-CSR
CERTIFIED SHAREHOLDER REPORT OF REGISTERED
MANAGEMENT INVESTMENT COMPANIES
Investment Company Act file number | 811-7762 |
|
First Eagle Funds |
(Exact name of registrant as specified in charter) |
|
1345 Avenue of the Americas New York, NY | | 10105 |
(Address of principal executive offices) | | (Zip code) |
|
Sheelyn Michael First Eagle Funds 1345 Avenue of the Americas New York, NY 10105 |
(Name and address of agent for service) |
|
Registrant’s telephone number, including area code: | 1-212-632-2700 | |
|
Date of fiscal year end: | October 31 | |
|
Date of reporting period: | October 31, 2018 | |
| | | | | | | | |
Form N-CSR is to be used by management investment companies to file reports with the Commission not later than 10 days after the transmission to stockholders of any report that is required to be transmitted to stockholders under Rule 30e-1 under the Investment Company Act of 1940 (17 CFR 270.30e-1). The Commission may use the information provided on Form N-CSR in its regulatory, disclosure review, inspection, and policymaking roles.
A registrant is required to disclose the information specified by Form N-CSR, and the Commission will make this information public. A registrant is not required to respond to the collection of information contained in Form N-CSR unless the Form displays a currently valid Office of Management and Budget (“OMB”) control number. Please direct comments concerning the accuracy of the information collection burden estimate and any suggestions for reducing the burden to Secretary, Securities and Exchange Commission, 450 Fifth Street, NW, Washington, DC 20549-0609. The OMB has reviewed this collection of information under the clearance requirements of 44 U.S.C. § 3507.
Item 1. Reports to Stockholders.

First Eagle Global Fund
First Eagle Overseas Fund
First Eagle U.S. Value Fund
First Eagle Gold Fund
First Eagle Global Income Builder Fund
First Eagle High Yield Fund
First Eagle Fund of America

Advised by First Eagle Investment Management, LLC
Forward-Looking Statement Disclosure
One of our most important responsibilities as mutual fund managers is to communicate with shareholders in an open and direct manner. Some of our comments in our letters to shareholders are based on current management expectations and are considered "forward-looking statements". Actual future results, however, may prove to be different from our expectations. You can identify forward-looking statements by words such as "may", "will", "believe", "attempt", "seem", "think", "ought", "try" and other similar terms. We cannot promise future returns. Our opinions are a reflection of our best judgment at the time this report is compiled, and we disclaim any obligation to update or alter forward-looking statements as a result of new information, future events, or otherwise.
First Eagle Funds | Annual Report | October 31, 2018
2
Table of Contents
Letter from the President | | | 4 | | |
Management's Discussion of Fund Performance | | | 7 | | |
Performance Chart | | | 12 | | |
First Eagle Global Fund: | |
Fund Overview | | | 20 | | |
Consolidated Schedule of Investments | | | 22 | | |
First Eagle Overseas Fund: | |
Fund Overview | | | 38 | | |
Consolidated Schedule of Investments | | | 40 | | |
First Eagle U.S. Value Fund: | |
Fund Overview | | | 54 | | |
Consolidated Schedule of Investments | | | 56 | | |
First Eagle Gold Fund: | |
Fund Overview | | | 64 | | |
Consolidated Schedule of Investments | | | 66 | | |
First Eagle Global Income Builder Fund: | |
Fund Overview | | | 70 | | |
Schedule of Investments | | | 72 | | |
First Eagle High Yield Fund | |
Fund Overview | | | 88 | | |
Schedule of Investments | | | 90 | | |
First Eagle Fund of America | |
Fund Overview | | | 100 | | |
Schedule of Investments | | | 102 | | |
Statements of Assets and Liabilities | | | 108 | | |
Statements of Operations | | | 116 | | |
Statements of Changes in Net Assets | | | 120 | | |
Financial Highlights | | | 132 | | |
Notes to Financial Statements | | | 144 | | |
Report of Independent Registered Accounting Firm | | | 172 | | |
Fund Expenses | | | 173 | | |
General Information | | | 179 | | |
Board Consideration for Continuation of Advisory Agreement | | | 180 | | |
Tax Information | | | 185 | | |
Privacy Notice | | | 186 | | |
Additional Information | | | 188 | | |
First Eagle Funds | Annual Report | October 31, 2018
3
Letter from the President (unaudited)

Dear Fellow Shareholders,
We wrote in the last few letters about the distinction between volatility and risk, and the divergent paths they have taken. On the one hand, low equity volatility meant that the market marched steadily higher, thereby pricing increasingly optimistic scenarios into future expectations. On the other hand, the risk side of the ledger grew meaningfully over time across the spectrum of stretched asset valuations, inflated fiscal imbalances and thorny geopolitical tensions. Sooner or later, the dichotomy between volatility and risk had to correct, either with increased volatility and concomitant negative impact on asset valuations, or through the benign resolution of key risks. Over the course of 2018, many of the key risks have come into sharper focus in the broader market, and we are experiencing an increase in volatility and consequent contraction in asset valuations. We see this increase in risk-perception as a positive development over the longer term.
Emerging equity and debt markets have remained under pressure for much of the year. In particular, stocks in China generally suffered steep declines, with the equity market down approximately 20% year-to-date based on the MSCI China Index. Problems in China run deeper than the trade dispute with the U.S. China has been at the epicenter of the boom in global money-supply growth and debt creation, which has been the source of sustained economic growth not only in China but also across the globe. Even small downshifts in economic conditions could cause the debt cycle to turn viciously negative, and we believe investors are only beginning to understand and price the potential impact of this risk into asset valuations.
Europe continues to struggle with growth, and the rise of nationalism is starting to nip at the edges of the grand experiment that is the European Union—Brexit and the recently proposed Italian budget are striking examples, but the theme manifests itself in political trends across much of Europe. European unemployment is down, as it is in many regions, and commentators say that economic conditions appear benign, but we wonder to what extent economic conditions supported by negative real interest rates should be considered "benign." European banks' share prices are down substantially and could be the proverbial canary in the coal mine.
First Eagle Funds | Annual Report | October 31, 2018
4
Letter from the President (unaudited)
Conditions in the U.S. are in stark contrast with most large economies. The U.S. economy has recovered strongly from the Great Recession, and unemployment is at 3.7%,* a level last seen in the late 1960s. What worries us about the U.S. is the budget deficit, which is currently at 4%* and is expected to grow. This deficit is large relative to where we are in the business cycle, and it raises the specter of even larger deficits if the economy were to weaken. By comparison, when unemployment was last approximately 4%* in the late 1990s, the U.S. had a budget surplus. It will take a few more quarters to determine how much of the recent growth in corporate earnings was the result of fiscal stimulus, including tax reform, and how much of that growth might be self-sustaining.
More generally, economies around the world did not use the upcycle since the global financial crisis to deleverage; if anything, the leverage that was applied to aid in recovery efforts has multiplied over time. As a result, debt (in proportion to GDP) is higher than in 2007-2008 for most developed markets. The recent increase in financial market volatility—across all asset classes, not just equities—is a sign that investors are finally beginning to factor risk into their assessments of valuation. This is a healthy, if sometimes nerve-wracking, process.
Our patient, long-term-oriented, "margin-of-safety" driven approach to value investing has led us in our view to be positioned appropriately for current conditions. We believe it is important to remain prudent and to proceed with caution while taking advantage of volatility by deploying capital into great businesses at sensible valuations.
Global Value Team
The Global Value team maintained a cautious posture, holding slightly less than 30% of the Global, Overseas and U.S. Value funds in cash, cash equivalents, bonds, gold and gold-related investments, and approximately 10% of the Global Income Builder Fund in cash, cash equivalents and gold. Despite overall caution, cash levels recently decreased to their lowest levels since early 2016. As volatility returned to markets in the fall, some share prices fell to attractive levels, and the team was able to initiate a few new positions and enlarge many existing positions in companies across various sectors and geographies.
High Yield Team
During this period, volatility also rose in the fixed income markets. Yields of ten-year Treasuries gyrated as the market was pulled in opposite directions by the transition to a more normal monetary policy and a generalized risk-off sentiment. The High Yield team continued to work to reduce exposure to risks for which the market was not providing adequate compensation. The team kept duration short and
First Eagle Funds | Annual Report | October 31, 2018
5
Letter from the President (unaudited)
emphasized bonds of relatively high credit quality, including a sizable allocation to investment-grade bonds. The team attempted to steer clear of smaller bonds and loans that might have limited liquidity, and also maintained a substantial cash position.
Fund of America Team
In an environment changed by both the end of the Federal Reserve accommodation and an increase in concerns about global economic growth, markets placed a premium on certainty. Against this backdrop, corporate change stories did not fare very well. The Fund of America team continued to focus on areas where it expected change catalysts to be robust, such as stories of management change or impending spinoffs. The Fund sought investments in companies that could deploy a large amount of financial self-help to take advantage of market volatility.
We are thankful for the opportunity to serve you.
Sincerely,

Mehdi Mahmud
President
December 2018
First Eagle defines "margin-of-safety" as the difference between a company's purchase price and our estimate of its intrinsic value.
First Eagle Funds | Annual Report | October 31, 2018
6
Management's Discussion of Fund Performance (unaudited)*
First Eagle Global Fund
The net asset value ("NAV") of the Fund's Class A shares decreased 2.82% for the twelve months ending October 31, 2018 while the MSCI World Index increased 1.16%. The Fund's cash and cash equivalents position was 14.8% as of October 31, 2018.
The five largest contributors to the performance of First Eagle Global Fund over the period were Microsoft Corp. (software, US), Union Pacific Corp. (road & rail, US), ConocoPhillips (oil, gas & consumable fuels, US), Anthem, Inc. (health care providers & services, US) and Omnicom Group, Inc. (media, US) collectively accounting for 1.37% points of this period's performance.
The five largest detractors were gold bullion, Schlumberger Ltd. (energy equipment & services, US), HeidelbergCement AG (construction materials, Germany), Weyerhauser Co. (equity real estate investment trusts, US) and FANUC Corp. (machinery, Japan). Their combined negative performance over the period subtracted 1.55% points from performance.
First Eagle Overseas Fund
The NAV of the Fund's Class A shares decreased 7.27% for the twelve months ending October 31, 2018 while the MSCI EAFE Index decreased 6.85%. The Fund's cash and cash equivalents position was 13.1% as of October 31, 2018.
The five largest contributors to the performance of First Eagle Overseas Fund over the period were Secom Co. Ltd. (commercial services & supplies, Japan), Robertet SA (chemicals, France), Linde plc (chemicals, UK), GlaxoSmithKline plc (pharmaceuticals, UK) and As One Corp. (health care providers & services, Japan) collectively accounting for 0.65% points of this period's performance.
The five largest detractors were British American Tobacco plc (tobacco, UK), Cielo SA (information technology services, Brazil), Cie de Saint-Gobain (building products, France), HeidelbergCement AG (construction materials, Germany) and FANUC Corp. (machinery, Japan). Their combined negative performance over the period subtracted 2.20% points from performance.
* Performance information for Class A Shares is without the effect of sales charges and assumes all distributions have been reinvested. If a sales charge was included values would be lower.
First Eagle Funds | Annual Report | October 31, 2018
7
Management's Discussion of Fund Performance (unaudited)
First Eagle U.S. Value Fund
The NAV of the Fund's Class A shares increased 2.01% for the twelve months ending October 31, 2018 while the S&P 500 Index increased 7.35%. The Fund's cash and cash equivalents position was 17.6% as of October 31, 2018.
The five largest contributors to the performance of First Eagle U.S. Value Fund over the period were Microsoft Corp. (software, US), Union Pacific Corp. (road & rail, US), ConocoPhillips (oil, gas & consumable fuels, US), Anthem, Inc. (health care providers & services, US) and Omnicom Group, Inc. (media, US) collectively accounting for 2.53% points of this period's performance.
The five largest detractors were Colgate-Palmolive Co. (household products, US), 3M Co. (industrial conglomerates, US), Schlumberger Ltd. (energy equipment & services, US), gold bullion and Weyerhauser Co. (equity real estate investment trusts, US). Their combined negative performance over the period subtracted 2.06% points from performance.
First Eagle Gold Fund
The NAV of the Fund's Class A shares decreased 20.73% for the twelve months ending October 31, 2018 while the FTSE Gold Mines Index decreased 16.57%. The Fund's cash and cash equivalents position was 2.3% as of October 31, 2018.
The five largest contributors to the performance of First Eagle Gold Fund over the period were Dundee Precious Metals, Inc. (metals & mining, US), AngloGold Ashanti Ltd. (metals & mining, South Africa), OceanaGold Corp. (metals & mining, Australia), Orla Mining Ltd. (metals & mining, Canada) and Detour Gold Corp. (metals & mining, Canada) collectively accounting for 0.36% points of this period's performance.
The five largest detractors were gold bullion (precious metal), Goldcorp, Inc. (metals & mining, Canada), Tahoe Resources, Inc. (metals & mining, US), Fresnillo plc (metals & mining, Mexico) and New Gold, Inc. (metals & mining, Canada). Their combined negative performance over the period subtracted 8.34% points from performance.
First Eagle Global Income Builder Fund
The NAV of the Fund's Class A shares decreased 2.64% for the twelve months ending October 31, 2018 while the MSCI World Index increased 1.16% and the Bloomberg Barclays U.S. Aggregate Bond Index decreased 2.05%. The composite index1 returned 0.01% over the same time period. The Fund's cash and cash equivalents position was 3.1% as of October 31, 2018.
1 The composite index consists of 60% of the MSCI World Index and 40% of the Bloomberg Barclays U.S. Aggregate Bond Index.
First Eagle Funds | Annual Report | October 31, 2018
8
Management's Discussion of Fund Performance (unaudited)
The five largest contributors to the performance of First Eagle Global Income Builder Fund over the period were Microsoft Corp. (software, US), ConocoPhillips (oil, gas & consumable fuels, US), Anthem, Inc. (health care providers & services, US), Union Pacific Corp. (road & rail, US), and GlaxoSmithKline (pharmaceuticals, UK) collectively accounting for 1.18% points of this period's performance.
The five largest detractors were Cie de Saint-Gobain (buildings products, France), Cielo SA (information technology services, Brazil), HeidelbergCement AG (construction materials, Germany), Weyerhauser Co. (equity real estate investment trusts, US) and British American Tobacco plc (tobacco, UK). Their combined negative performance over the period subtracted 1.54% points from performance.
First Eagle High Yield Fund
The NAV of the Fund's Class I shares increased 2.74% for the twelve months ending October 31, 2018 while the Bloomberg Barclays U.S. Corporate High Yield Index increased 0.97%. The Fund's cash and cash equivalents position was 5.9% as of October 31, 2018.
The five largest contributors to the performance of First Eagle High Yield Fund over the period were BI-LO LLC 8.625% due 09/15/2018 (food & staples retailing, US), EnQuest plc 7.00% due 04/15/2022 (oil, gas & consumable fuels, UK), California Resources Corp. 8.00% due 12/15/2022 (oil, gas & consumable Fuels, US), Caelus Energy Alaska 03 LLC, Second Lien Term Loan 9.84% due 04/15/2020 (oil, gas & consumable fuels, US) and Osum Production Corp., Term Loan 7.89% due 07/31/2020 (oil, gas & consumable fuels, US) collectively accounting for 2.89% points of this period's performance.
The five largest detractors were Acco Brands Corp. 5.25% due 12/15/24 (commercial services & supplies, US), New Gold Inc. 6.25% due 11/15/22 (metals & mining, Canada), Cloud Peak Energy Resources LLC 12.00% due 11/01/2021 (oil, gas & consumable fuels, US), Jupiter Resources, Inc. 8.5% due 10/01/2022 (oil, gas & consumable fuels, Canada) and Ultra Resources, Inc. 7.125% due 4/15/2025 (oil, gas & consumable fuels, US). Their combined negative performance over the period subtracted 1.49% points from performance.
First Eagle Fund of America
The NAV of the Fund's Class Y shares decreased 11.85% for the twelve months ending October 31, 2018 while the S&P 500 Index increased 7.35%. The Fund's cash and cash equivalents position was 3.0% as of October 31, 2018.
First Eagle Funds | Annual Report | October 31, 2018
9
Management's Discussion of Fund Performance (unaudited)
The five largest contributors to the performance of Fund of America over the period were Armstrong World Industries, Inc. (building products, US), KLX, Inc. (aerospace & defense, US), La Quinta Holdings Inc. (hotels, restaurants & leisure, US), ServiceMaster Global Holdings, Inc. (diversified consumer services, US) and HP, Inc. (technology hardware, storage & peripherals, US) collectively accounting for 3.36% points of this period's performance.
The five largest detractors were Wyndham Worldwide Corp. (hotels, restaurants & leisure, US), EQT Corp. (oil, gas & consumable fuels, US), Visteon Corp. (auto components, US), Chemours Co. (chemicals, US) and Western Digital Corp. (technology hardware, storage & peripherals, US). Their combined negative performance over the period subtracted 7.03% points from performance.

| | 
| |
Matthew McLennan
Head of the Global Value Team
Portfolio Manager
Global, Overseas,
U.S. Value and Gold Funds | | T. Kimball Brooker, Jr.
Portfolio Manager
Global, Overseas,
U.S. Value and
Global Income Builder Funds | |

| | 
| |
Matt Lamphier
Portfolio Manager
U.S. Value Fund
| | Edward Meigs
Portfolio Manager
Global Income Builder and
High Yield Funds | |

| | 
| |
Sean Slein
Portfolio Manager
Global Income Builder and
High Yield Funds | | Thomas Kertsos
Portfolio Manager
Gold Fund
| |
First Eagle Funds | Annual Report | October 31, 2018
10
Management's Discussion of Fund Performance (unaudited)

| | 
| |
Harold Levy
Portfolio Manager
Fund of America | | Eric Stone
Portfolio Manager
Fund of America | |

| | | |
Lukasz Thieme
Portfolio Manager
Fund of America | | | |
December 2018 | | | |
The performance data quoted herein represents past performance and does not guarantee future results. Market volatility can dramatically impact a fund's short-term performance. Current performance may be lower or higher than figures shown. The investment return and principal value will fluctuate so that an investor's shares, when redeemed, may be worth more or less than their original cost. Past performance data through the most recent month end is available at feim.com or by calling 800.334.2143.
The commentary represents the opinion of Mehdi Mahmud and the Portfolio Management Teams as of December 2018 and is subject to change based on market and other conditions. These materials are provided for informational purposes only. These opinions are not intended to be a forecast of future events, a guarantee of future results, or investment advice. The views expressed herein may change at any time subsequent to the date of issue hereof. The information provided is not to be construed as a recommendation or an offer to buy or sell or the solicitation of an offer to buy or sell any fund or security.
First Eagle Funds | Annual Report | October 31, 2018
11
Performance Chart1 (unaudited)
| | | One-
Year | | Three-
Years | | Five-
Years | | Ten-
Years | | Since
Inception | | Inception Date | |
First Eagle Global Fund | |
Class A (SGENX)
without sales charge | | | -2.82 | % | | | 5.44 | % | | | 4.54 | % | | | 8.94 | % | | | 12.85 | % | | 01/01/792 | |
with sales charge | | | -7.68 | % | | | 3.66 | % | | | 3.47 | % | | | 8.39 | % | | | 12.75 | % | | 01/01/792 | |
| Class C (FESGX) | | | -4.47 | % | | | 4.65 | % | | | 3.76 | % | | | 8.13 | % | | | 9.32 | % | | 06/05/00 | |
| Class I (SGIIX) | | | -2.54 | % | | | 5.72 | % | | | 4.82 | % | | | 9.23 | % | | | 10.23 | % | | 07/31/98 | |
| Class R3 (EARGX) | | | — | | | | — | | | | — | | | | — | | | | -3.95 | % | | 05/01/18 | |
| Class R4 (EAGRX) | | | — | | | | — | | | | — | | | | — | | | | -7.95 | % | | 01/17/18 | |
Class R6 (FEGRX) | | | -2.49 | % | | | — | | | | — | | | | — | | | | 2.11 | % | | 03/01/17 | |
MSCI World Index3 | | | 1.16 | % | | | 7.91 | % | | | 6.81 | % | | | 10.02 | % | | | 9.48 | % | | 01/01/79 | |
First Eagle Overseas Fund4 | |
Class A (SGOVX)
without sales charge | | | -7.27 | % | | | 2.92 | % | | | 2.47 | % | | | 7.51 | % | | | 9.94 | % | | 08/31/93 | |
with sales charge | | | -11.90 | % | | | 1.18 | % | | | 1.43 | % | | | 6.95 | % | | | 9.77 | % | | 08/31/93 | |
| Class C (FESOX) | | | -8.81 | % | | | 2.18 | % | | | 1.72 | % | | | 6.71 | % | | | 8.47 | % | | 06/05/00 | |
| Class I (SGOIX) | | | -6.98 | % | | | 3.21 | % | | | 2.75 | % | | | 7.78 | % | | | 9.81 | % | | 07/31/98 | |
| Class R3 (EAROX) | | | — | | | | — | | | | — | | | | — | | | | -7.49 | % | | 05/01/18 | |
| Class R4 (FIORX) | | | — | | | | — | | | | — | | | | — | | | | -11.17 | % | | 01/17/18 | |
| Class R6 (FEORX) | | | -6.92 | % | | | — | | | | — | | | | — | | | | 0.34 | % | | 03/01/17 | |
MSCI EAFE Index5 | | | -6.85 | % | | | 3.62 | % | | | 2.02 | % | | | 6.89 | % | | | 4.75 | % | | 08/31/93 | |
First Eagle U.S. Value Fund | |
Class A (FEVAX)
without sales charge | | | 2.01 | % | | | 7.59 | % | | | 6.30 | % | | | 9.37 | % | | | 8.67 | % | | 09/04/01 | |
with sales charge | | | -3.10 | % | | | 5.77 | % | | | 5.21 | % | | | 8.81 | % | | | 8.34 | % | | 09/04/01 | |
| Class C (FEVCX) | | | 0.27 | % | | | 6.76 | % | | | 5.49 | % | | | 8.54 | % | | | 7.85 | % | | 09/04/01 | |
| Class I (FEVIX) | | | 2.24 | % | | | 7.87 | % | | | 6.57 | % | | | 9.64 | % | | | 8.94 | % | | 09/04/01 | |
| Class R3 (EARVX) | | | — | | | | — | | | | — | | | | — | | | | -0.83 | % | | 05/01/18 | |
| Class R6 (FEVRX) | | | 2.28 | % | | | — | | | | — | | | | — | | | | 4.16 | % | | 03/01/17 | |
S&P 500 Index6 | | | 7.35 | % | | | 11.52 | % | | | 11.34 | % | | | 13.24 | % | | | 7.34 | % | | 09/04/01 | |
First Eagle Funds | Annual Report | October 31, 2018
12
Performance Chart (unaudited)
| | | One-
Year | | Three-
Years | | Five-
Years | | Ten-
Years | | Since
Inception | | Inception Date | |
First Eagle Gold Fund | |
Class A (SGGDX)
without sales charge | | | -20.73 | % | | | 1.91 | % | | | -5.14 | % | | | 0.44 | % | | | 4.03 | % | | 08/31/93 | |
with sales charge | | | -24.70 | % | | | 0.18 | % | | | -6.11 | % | | | -0.07 | % | | | 3.88 | % | | 08/31/93 | |
| Class C (FEGOX) | | | -22.08 | % | | | 1.10 | % | | | -5.88 | % | | | -0.33 | % | | | 2.64 | % | | 05/15/03 | |
| Class I (FEGIX) | | | -20.47 | % | | | 2.20 | % | | | -4.87 | % | | | 0.70 | % | | | 3.69 | % | | 05/15/03 | |
| Class R3 (EAURX) | | | — | | | | — | | | | — | | | | — | | | | -17.80 | % | | 05/01/18 | |
| Class R6 (FEURX) | | | -20.40 | % | | | — | | | | — | | | | — | | | | -14.85 | % | | 03/01/17 | |
FTSE Gold
Mines Index7 | | | -16.57 | % | | | 8.83 | % | | | -4.85 | % | | | -2.02 | % | | | -1.72 | % | | 08/31/93 | |
MSCI World Index3 | | | 1.16 | % | | | 7.91 | % | | | 6.81 | % | | | 10.02 | % | | | 6.78 | % | | 08/31/93 | |
First Eagle Global Income Builder | |
Class A (FEBAX)
without sales charge | | | -2.64 | % | | | 4.99 | % | | | 3.62 | % | | | — | | | | 5.43 | % | | 05/01/12 | |
with sales charge | | | -7.48 | % | | | 3.23 | % | | | 2.56 | % | | | — | | | | 4.59 | % | | 05/01/12 | |
| Class C (FEBCX) | | | -4.33 | % | | | 4.19 | % | | | 2.84 | % | | | — | | | | 4.64 | % | | 05/01/12 | |
| Class I (FEBIX) | | | -2.31 | % | | | 5.27 | % | | | 3.90 | % | | | — | | | | 5.71 | % | | 05/01/12 | |
| Class R3 (FBRRX) | | | — | | | | — | | | | — | | | | — | | | | -3.02 | % | | 05/01/18 | |
| Class R6 (FEBRX) | | | -2.27 | % | | | — | | | | — | | | | — | | | | 3.11 | % | | 03/01/17 | |
Composite Index8 | | | 0.01 | % | | | 5.23 | % | | | 4.93 | % | | | — | | | | 6.31 | % | | 05/01/12 | |
MSCI World Index3 | | | 1.16 | % | | | 7.91 | % | | | 6.81 | % | | | — | | | | 9.19 | % | | 05/01/12 | |
Bloomberg Barclays
U.S. Aggregate
Bond Index9 | | | -2.05 | % | | | 1.04 | % | | | 1.83 | % | | | — | | | | 1.68 | % | | 05/01/12 | |
First Eagle Funds | Annual Report | October 31, 2018
13
Performance Chart (unaudited)
| | | One-
Year | | Three-
Years | | Five-
Years | | Ten-
Years | | Since
Inception | | Inception Date | |
First Eagle High Yield | |
Class A (FEHAX)
without sales charge | | | 2.56 | % | | | 5.48 | % | | | 3.11 | % | | | — | | | | 5.00 | % | | 01/03/12 | |
with sales charge | | | -2.11 | % | | | 3.87 | % | | | 2.16 | % | | | — | | | | 4.30 | % | | 01/03/12 | |
| Class C (FEHCX) | | | 0.71 | % | | | 4.71 | % | | | 2.35 | % | | | — | | | | 4.20 | % | | 01/03/12 | |
| Class I (FEHIX) | | | 2.74 | % | | | 5.78 | % | | | 3.41 | % | | | 10.72 | % | | | 8.09 | % | | 11/19/0710 | |
| Class R3 (EARHX) | | | — | | | | — | | | | — | | | | — | | | | 1.41 | % | | 05/01/18 | |
| Class R6 (FEHRX) | | | 2.80 | % | | | — | | | | — | | | | — | | | | 3.48 | % | | 03/01/17 | |
Bloomberg Barclays
U.S. Corporate High
Yield Index11 | | | 0.97 | % | | | 6.60 | % | | | 4.68 | % | | | 11.20 | % | | | 7.46 | % | | 11/19/07 | |
First Eagle Fund of America | |
Class A (FEFAX)
without sales charge | | | -11.84 | % | | | 1.04 | % | | | 3.14 | % | | | 9.56 | % | | | 7.50 | % | | 11/20/98 | |
with sales charge | | | -16.24 | % | | | -0.67 | % | | | 2.09 | % | | | 9.00 | % | | | 7.22 | % | | 11/20/98 | |
| Class C (FEAMX) | | | -13.26 | % | | | 0.29 | % | | | 2.37 | % | | | 8.74 | % | | | 6.74 | % | | 03/02/98 | |
| Class I (FEAIX) | | | -11.53 | % | | | 1.35 | % | | | 3.44 | % | | | — | | | | 5.52 | % | | 03/08/13 | |
| Class Y (FEAFX)12 | | | -11.85 | % | | | 1.04 | % | | | 3.13 | % | | | 9.55 | % | | | 10.79 | % | | 04/10/87 | |
| Class R3 (EARFX) | | | — | | | | — | | | | — | | | | — | | | | -10.74 | % | | 05/01/18 | |
| Class R6 (FEFRX) | | | -11.53 | % | | | — | | | | — | | | | — | | | | -1.37 | % | | 03/01/17 | |
S&P 500 Index6 | | | 7.35 | % | | | 11.52 | % | | | 11.34 | % | | | 13.24 | % | | | 9.74 | % | | 04/10/87 | |
1 The performance data quoted herein represents past performance and does not guarantee future results. Market volatility can dramatically impact the fund's short-term performance. Current performance may be lower or higher than figures shown. The investment return and principal value will fluctuate so that an investor's shares, when redeemed, may be worth more or less than their original cost. Past performance data through the most recent month end is available at feim.com or by calling 800.334.2143. The average annual returns for Class A Shares "with sales charge" of First Eagle Global, Overseas, U.S. Value, Gold, Fund of America, and Global Income Builder give effect to the deduction of the maximum sales charge of 5.00%. The average annual returns for Class A Shares "with sales charge" of First Eagle High Yield gives effect to the deduction of the maximum sales charge of 4.50%.
The average annual returns for Class C Shares reflect the maximum contingent deferred sales charge (CDSC), which is charged on the lesser of the original purchase price or the current market value at the time of sale. This pertains to shares sold or redeemed within the first year of purchase.
First Eagle Funds | Annual Report | October 31, 2018
14
Performance Chart (unaudited)
A contingent deferred sales charge of 1.00% may apply on redemptions of Class A shares made within 18 months following a purchase of $1,000,000 or more without an initial sales charge.
Class I Shares of First Eagle Global Fund, First Eagle Overseas Fund, First Eagle U.S. Value Fund, First Eagle Gold Fund, First Eagle Global Income Builder Fund, First Eagle High Yield Fund, and First Eagle Fund of America require $1 million minimum investment and are offered without a sales charge.
Class Y Shares of First Eagle Fund of America are offered without a sales charge. Class Y is currently closed to new investors. Please see prospectus for more information.
Class R4 Shares of First Eagle Global Fund and First Eagle Overseas Fund are offered without a sales charge.
Class R3 Shares and Class R6 Shares of First Eagle Global Fund, First Eagle Overseas Fund, First Eagle U.S. Value Fund, First Eagle Gold Fund, First Eagle Global Income Builder Fund, First Eagle High Yield Fund, and First Eagle Fund of America are offered without a sales charge.
2 The Fund commenced operation April 28, 1970. Performance for periods prior to January 1, 2000 occurred while a prior portfolio manager of the fund was affiliated with another firm. Inception date shown is when this prior portfolio manager assumed portfolio management responsibilities.
3 The MSCI World Index is a widely followed, unmanaged group of stocks from 23 developed international markets. The index provides total returns in U.S. dollars with net dividends reinvested. One cannot invest directly in an index.
4 Effective May 9, 2014, the First Eagle Overseas Fund is closed to certain investors. Please see prospectus for more information.
5 The MSCI EAFE Index is an unmanaged total return index, reported in U.S. dollars, based on share prices and reinvested net dividends of approximately 1,100 companies from 21 developed market countries. One cannot invest directly in an index.
6 The S&P 500 Index is a widely recognized unmanaged index including a representative sample of 500 leading companies in leading sectors of the U.S. economy. Although the S&P 500 Index focuses on the large-cap segment of the market, with approximately 80% coverage of U.S. equities, it is also considered a proxy for the total market. The S&P 500 Index includes dividends reinvested. One cannot invest directly in an index.
7 The FTSE Gold Mines Index is designed to reflect the performance of the worldwide market in the shares of companies whose principal activity is the mining of gold. The FTSE Gold Mines Index encompasses all gold mining companies that have a sustainable, attributable gold production of at least 300,000 ounces a year and that derive 51% or more of their revenue from mined gold. The Index is unmanaged, and includes dividends reinvested. One cannot invest directly in an index.
8 The composite index consists of 60% of the MSCI World Index and 40% of the Bloomberg Barclays U.S. Aggregate Bond Index.
9 The Bloomberg Barclays U.S. Aggregate Bond Index is an unmanaged broad-based benchmark that measures the investment grade, U.S. dollar-denominated, fixed-rate taxable bond market, including Treasuries, government-related and corporate securities, MBS (agency fixed-rate and hybrid ARM passthroughs), ABS, and CMBS. One cannot invest directly in an index.
10 First Eagle High Yield Fund commenced operations in its present form on December 30, 2011, and is successor to another mutual fund pursuant to a reorganization on December 30, 2011. Information prior to December 30, 2011 is for this predecessor fund. Immediately after the reorganization, changes in net asset value of the Class I shares were partially impacted by differences in how the Fund and the predecessor fund price portfolio securities.
First Eagle Funds | Annual Report | October 31, 2018
15
Performance Chart (unaudited)
11 The Bloomberg Barclays U.S. Corporate High Yield Index is composed of fixed-rate, publicly issued, noninvestment grade debt and is unmanaged, with dividends reinvested. The index includes both corporate and non-corporate sectors. The corporate sectors are Industrial, Utility, and Finance, which include both U.S. and non-U.S. corporations. One cannot invest directly in an index.
12 As of September 1, 2005 First Eagle Fund of America Class Y is closed to new accounts.
Expense Ratios As Stated In The Most Recent Prospectus17
| | | Class A | | Class C | | Class I | | Class Y | | Class R313 | | Class R414 | | Class R6 | |
First Eagle Global Fund | | | 1.11 | % | | | 1.85 | % | | | 0.84 | % | | | — | | | | 1.29 | % | | | 1.04 | % | | | 0.78 | % | |
First Eagle Overseas Fund | | | 1.15 | | | | 1.88 | | | | 0.87 | | | | — | | | | 1.30 | | | | 1.05 | | | | 0.79 | | |
First Eagle U.S. Value Fund15,16 | | | 1.14 | | | | 1.89 | | | | 0.86 | | | | — | | | | 1.32 | | | | N/A | | | | 0.85 | | |
First Eagle Gold Fund | | | 1.26 | | | | 2.04 | | | | 0.99 | | | | — | | | | 1.35 | | | | N/A | | | | 0.90 | | |
First Eagle Global Income Builder Fund | | | 1.19 | | | | 1.94 | | | | 0.93 | | | | — | | | | 1.34 | | | | N/A | | | | 0.89 | | |
First Eagle High Yield Fund15,16 | | | 1.21 | | | | 1.95 | | | | 0.91 | | | | — | | | | 1.32 | | | | N/A | | | | 0.92 | | |
First Eagle Fund of America | | | 1.31 | | | | 2.06 | | | | 1.01 | | | | 1.31 | % | | | 1.47 | | | | N/A | | | | 1.00 | | |
13 Class R3 Shares commenced investment operations on May 1, 2018 for the First Eagle Global Fund, First Eagle Overseas Fund, First Eagle U.S. Value Fund, First Eagle Gold Fund, First Eagle Global Income Builder Fund, First Eagle High Yield Fund and First Eagle Fund of America. The percentages shown above are based on anticipated expenses of Class R3 for the first fiscal year. However, the rate at which expenses are accrued during the fiscal year may not be constant and, at any particular point, may be greater or less than the stated average percentage.
14 Class R4 Shares commenced investment operations on January 17, 2018 for the First Eagle Global Fund and First Eagle Overseas Fund. The percentages shown above are based on anticipated expenses of Class R4 for the first fiscal year. However, the rate at which expenses are accrued during the fiscal year may not be constant and, at any particular point, may be greater or less than the stated average percentage.
15 These are the actual fund operating expenses prior to the application of fee waivers and/or expense reimbursements. The Adviser has contractually agreed to waive its management fee at an annual rate in the amount of 0.05% of the average daily value of the Fund's net assets for the period through February 28, 2019. This waiver has the effect of reducing the management fee for the term of the waiver from 0.75% to 0.70% on First Eagle U.S. Value Fund. Effective July 1, 2018, the Adviser has contractually agreed to waive First Eagle High Yield Fund's management fee at an annual rate in the amount of 0.10% of the average daily value of the Fund's net assets for the period through February 29, 2020. This waiver has the effect of reducing the management fee for the term of the waiver from 0.70% to 0.65% until June 30, 2018 and from 0.70% to 0.60% from July 1, 2018 through the end of the year on First Eagle High Yield Fund.
16 For the First Eagle U.S. Value Fund and First Eagle High Yield Fund, had fees not been waived and/or expenses reimbursed, returns would have been lower.
17 Certain other share classes were newly organized during the period but did not yet have assets or expenses during the period.
These expense ratios are presented as of March 1, 2018 and may differ from corresponding ratios shown elsewhere in this report because of differing time periods (and/or, if applicable, because these expense ratios do not include expense credits or waivers).
First Eagle Funds | Annual Report | October 31, 2018
16
Performance Chart (unaudited)
There are risks associated with investing in funds that invest in securities of foreign countries, such as erratic market conditions, economic and political instability and fluctuations in currency exchange rates. These risks may be more pronounced with respect to investments in emerging markets. Funds whose investments are concentrated in a specific industry or sector may be subject to a higher degree of risk than funds whose investments are diversified and may not be suitable for all investors.
All securities may be subject to adverse market trends. The value of a Fund's portfolio holdings may fluctuate in response to events specific to the companies or stock or bond markets in which a Fund invests, as well as economic, political, or social events in the United States or abroad. This may cause a Fund's portfolio to be worth less than the price originally paid for it, or less than it was worth at an earlier time. Market risk may affect a single issuer or the market as a whole. As a result, a portfolio of such securities may underperform the market as a whole.
In addition to investments in larger companies, each Fund may invest in small and medium-size companies, which historically have been more volatile in price than larger company securities, especially over the short term. Positions in smaller companies, especially when the Fund is a large holder of a small company's securities, also may be more difficult or expensive to trade. Among the reasons for the greater price volatility are the less certain growth prospects of smaller companies, the lower degree of liquidity in the markets for such securities and the greater sensitivity of smaller companies to changing economic conditions. In addition, smaller companies may lack depth of management, they may be unable to generate funds necessary for growth or development, or they may be developing or marketing new products or services for which markets are not yet established and may never become established. The Funds consider small companies to be companies with market capitalizations of less than $1 billion and medium-size companies to have market capitalizations of less than $10 billion.
Holding illiquid securities restricts or otherwise limits the ability for a Fund to freely dispose of its investments for specific periods of time. A Fund might not be able to sell illiquid securities at its desired price or time. Changes in the markets or in regulations governing the trading of illiquid instruments can cause rapid changes in the price or ability to sell an illiquid security. The market for lower-quality debt instruments, including junk bonds and leveraged loans, is generally less liquid than the market for higher-quality debt instruments.
Investment in gold and gold-related investments present certain risks, including political and economic risks affecting the price of gold and other precious metals like changes in U.S. or foreign regulatory policies, tax, currency or mining laws, increased environmental costs, international monetary and political policies, economic conditions within an individual country, trade imbalances, and trade or currency restrictions between countries. The price of gold, in turn, is likely to affect the market prices of securities of companies mining or processing gold, and accordingly, the value of investments in such securities may also be affected. Gold-related investments as a group have not performed as well as the stock market in general during periods when the U.S. dollar is strong, inflation is low and general economic conditions are stable. In addition, returns on gold-related investments have traditionally been more volatile than investments in broader equity or debt markets.
The event-driven investment style of the First Eagle Fund of America carries the additional risk that the event anticipated occurs later than expected, does not occur at all, or does not have the desired effect on the market price of the securities.
First Eagle High Yield and Global Income Builder Funds invest in high yield instruments (commonly known as "junk bonds") which may be subject to greater levels of interest rate, credit (including issuer default) and liquidity risk than investment grade instruments and may experience extreme price fluctuations. The securities of such companies may be considered speculative and the ability of such companies to pay their debts on schedule may be uncertain.
First Eagle Funds | Annual Report | October 31, 2018
17
Performance Chart (unaudited)
First Eagle High Yield and Global Income Builder Funds invest in bank loans. These investments potentially expose a fund to the credit risk of the underlying borrower, and in certain cases, of the financial institution. The fund's ability to receive payments in connection with the loan depends primarily on the financial condition of the borrower. The market for bank loans may be illiquid and the fund may have difficulty selling them, especially in the case of leveraged loans, which can be difficult to value. In addition, bank loans often have contractual restrictions on resale, which can delay the sale and adversely impact the sale price. At times, a fund may decline to receive non-public information relating to loans, which could disadvantage the fund relative to other investors.
Funds that invest in bonds are subject to credit and interest rate risk. The value of a fund's portfolio may fluctuate in response to the risk that the issuer of a bond or other instrument will not be able to make payments of interest and principal when due. In addition, fluctuations in interest rates can affect the value of debt instruments held by a fund. An increase in interest rates tends to reduce the market value of debt instruments, while a decline in interest rates tends to increase their values. Longer duration instruments tend to be more sensitive to interest rate changes than those with shorter durations.
Income generation and dividends are not guaranteed. If dividend paying stocks in the fund's portfolio stop paying or reduce dividends the fund's ability to generate income will be adversely affected.
An investment made at a perceived "margin of safety" or "discount to intrinsic or fundamental value" can trade at prices substantially lower than when an investment is made, so that any perceived "margin of safety" or "discount to value" is no guarantee against loss.
All investments involve the risk of loss.
First Eagle Funds | Annual Report | October 31, 2018
18
This page was intentionally left blank.
Data as of October 31, 2018 (unaudited)
Investment Objective
The First Eagle Global Fund seeks long-term growth of capital by investing in a range of asset classes from markets in the United States and throughout the world. This truly global fund is managed with a highly disciplined, bottom-up, value-oriented style.
Average Annual Returns (%) | | | | | | One-Year | | Five-Years | | Ten-Years | |
First Eagle Global Fund | | Class A | | without sales load | | | -2.82 | | | | 4.54 | | | | 8.94 | | |
| | | | with sales load | | | -7.68 | | | | 3.47 | | | | 8.39 | | |
MSCI World Index | | | | | | | 1.16 | | | | 6.81 | | | | 10.02 | | |
Consumer Price Index | | | | | | | 2.52 | | | | 1.61 | | | | 1.56 | | |
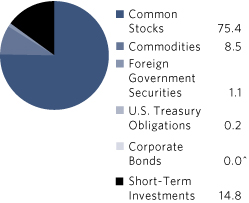
Sectors* (%) | |
Financials | | | 13.7 | | |
Industrials | | | 11.8 | | |
Information Technology | | | 8.6 | | |
Commodities | | | 8.5 | | |
Communication Services | | | 7.4 | | |
Materials | | | 7.4 | | |
Consumer Staples | | | 7.0 | | |
Energy | | | 7.0 | | |
Health Care | | | 4.7 | | |
Consumer Discretionary | | | 4.2 | | |
Real Estate | | | 3.2 | | |
Foreign Government Securities | | | 1.1 | | |
Utilities | | | 0.4 | | |
U.S. Treasury Obligations | | | 0.2 | | |
Short-Term Investments | | | 14.8 | | |
Countries*~ (%)
United States | | | 45.4 | | |
Japan | | | 11.7 | | |
United Kingdom | | | 6.0 | | |
France | | | 4.9 | | |
Canada | | | 4.2 | | |
Hong Kong | | | 2.2 | | |
Switzerland | | | 2.0 | | |
South Korea | | | 1.7 | | |
Mexico | | | 1.0 | | |
Germany | | | 0.9 | | |
Sweden | | | 0.9 | | |
Thailand | | | 0.6 | | |
Australia | | | 0.6 | | |
Belgium | | | 0.5 | | |
Brazil | | | 0.5 | | |
Singapore | | | 0.4 | | |
Taiwan | | | 0.4 | | |
Ireland | | | 0.3 | | |
Denmark | | | 0.2 | | |
Poland | | | 0.2 | | |
Russia | | | 0.2 | | |
Norway | | | 0.1 | | |
Israel | | | 0.1 | | |
Indonesia | | | 0.1 | | |
Africa | | | 0.1 | | |
Italy | | | 0.0 | ^ | |
Malaysia | | | 0.0 | ^ | |
Venezuela | | | — | | |
Short-Term Investments | | | 14.8 | | |
^Less than 0.05%.
*Asset Allocation, Sector and Countries percentages are based on total investments in the portfolio.
~Country allocations reflect country of risk (not currency of issue). Bonds of non-U.S. issuers may be U.S. dollar denominated.
The Fund's portfolio composition is subject to change at any time.
First Eagle Funds | Annual Report | October 31, 2018
20
First Eagle Global Fund | Fund Overview
Growth of a $10,000 Initial Investment
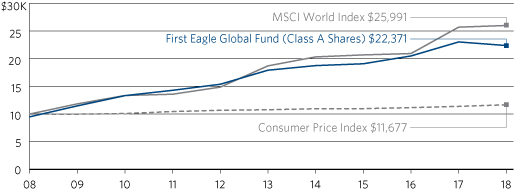
Performance data quoted herein represents past performance and should not be considered indicative of future results. Performance data quoted herein does not reflect the deduction of taxes that a shareholder would pay on Fund distributions or the sale of Fund shares. The average annual returns shown above are historical and reflect changes in share price, reinvested dividends and are net of expenses.
The average annual returns for Class A shares give effect to the deduction of the maximum sales charge of 5.00%.
The MSCI World Index is a widely followed, unmanaged group of stocks from 23 developed international markets. The index provides total returns in U.S. dollars with net dividends reinvested. One cannot invest directly in an index. The Consumer Price Index (CPI) represents the change in price of all goods and services purchased for consumption by urban households.
Top 10 Holdings* (%)
Gold bullion** (Precious Metal) | | | 8.4 | | |
Oracle Corp. (Software, United States) | | | 2.4 | | |
Exxon Mobil Corp. (Oil, Gas & Consumable Fuels, United States) | | | 1.8 | | |
Comcast Corp. (Media, United States) | | | 1.8 | | |
Schlumberger Ltd. (Energy Equipment & Services, United States) | | | 1.5 | | |
KDDI Corp. (Wireless Telecommunication Services, Japan) | | | 1.5 | | |
Omnicom Group, Inc. (Media, United States) | | | 1.5 | | |
FANUC Corp. (Machinery, Japan) | | | 1.4 | | |
Secom Co. Ltd. (Commercial Services & Supplies, Japan) | | | 1.4 | | |
Sompo Holdings, Inc. (Insurance, Japan) | | | 1.4 | | |
Total | | | 23.1 | | |
* Holdings in cash, commercial paper and other short-term cash equivalents have been excluded.
**The Fund invests in gold and precious metals through investment in a wholly-owned subsidiary of the Fund organized under the laws of the Cayman Islands (the "Subsidiary"). Gold bullion and commodities include the Fund's investment in the Subsidiary.
Percentages are based on total net assets.
First Eagle Funds | Annual Report | October 31, 2018
21
First Eagle Global Fund | Consolidated Schedule of Investments | October 31, 2018
Investments | | Shares | | Value ($) | |
Common Stocks — 75.0% | |
Africa — 0.1% | |
Randgold Resources Ltd., ADR | | | 413,501 | | | | 32,476,368 | | |
Australia — 0.6% | |
Newcrest Mining Ltd. | | | 21,416,357 | | | | 313,497,218 | | |
Belgium — 0.5% | |
Groupe Bruxelles Lambert SA | | | 2,788,865 | | | | 259,373,079 | | |
Brazil — 0.5% | |
Cielo SA | | | 71,021,952 | | | | 251,911,801 | | |
Canada — 4.2% | |
Agnico Eagle Mines Ltd. | | | 5,969,324 | | | | 210,850,064 | | |
Barrick Gold Corp. | | | 21,030,475 | | | | 263,932,461 | | |
Canadian Natural Resources Ltd. | | | 2,388,401 | | | | 65,531,577 | | |
Cenovus Energy, Inc. | | | 8,257,342 | | | | 69,857,113 | | |
Franco-Nevada Corp. | | | 2,615,497 | | | | 163,353,081 | | |
Goldcorp, Inc. | | | 9,883,228 | | | | 89,146,717 | | |
Imperial Oil Ltd. | | | 9,729,552 | | | | 303,907,614 | | |
Nutrien Ltd. | | | 11,230,751 | | | | 594,443,650 | | |
Power Corp. of Canada | | | 6,247,295 | | | | 128,984,373 | | |
Wheaton Precious Metals Corp. | | | 13,906,393 | | | | 228,482,037 | | |
| | | | 2,118,488,687 | | |
Denmark — 0.2% | |
ISS A/S | | | 3,009,360 | | | | 98,830,930 | | |
France — 4.9% | |
Bouygues SA | | | 5,688,713 | | | | 207,243,733 | | |
Cie de Saint-Gobain | | | 8,656,610 | | | | 326,106,807 | | |
Danone SA | | | 8,247,355 | | | | 584,023,131 | | |
Legrand SA | | | 1,437,991 | | | | 93,902,191 | | |
LVMH Moet Hennessy Louis Vuitton SE | | | 320,194 | | | | 97,148,593 | | |
NSC Groupe (a) | | | 38,717 | | | | 3,398,593 | | |
Rexel SA | | | 11,789,132 | | | | 150,279,830 | | |
Robertet SA | | | 157,260 | | | | 93,335,158 | | |
Robertet SA CI (non-voting)‡ (b) | | | 42,252 | | | | 17,553,847 | | |
Sabeton SA (a) | | | 385,000 | | | | 10,347,187 | | |
Sanofi | | | 5,286,679 | | | | 472,420,640 | | |
First Eagle Funds | Annual Report | October 31, 2018
22
First Eagle Global Fund | Consolidated Schedule of Investments | October 31, 2018
Investments | | Shares | | Value ($) | |
France — 4.9% (continued) | |
Sodexo SA | | | 3,449,673 | | | | 352,131,799 | | |
Wendel SA | | | 851,376 | | | | 110,318,016 | | |
| | | | 2,518,209,525 | | |
Germany — 0.9% | |
HeidelbergCement AG | | | 5,883,039 | | | | 399,249,060 | | |
Hornbach Baumarkt AG | | | 29,871 | | | | 795,084 | | |
Hornbach Holding AG & Co. KGaA (a) | | | 1,181,422 | | | | 78,076,885 | | |
| | | | 478,121,029 | | |
Hong Kong — 2.2% | |
CK Asset Holdings Ltd. | | | 26,868,500 | | | | 174,853,443 | | |
Guoco Group Ltd. | | | 12,693,580 | | | | 213,851,632 | | |
Hang Lung Properties Ltd. | | | 125,232,969 | | | | 227,006,469 | | |
Hysan Development Co. Ltd. | | | 23,163,348 | | | | 108,629,091 | | |
Jardine Matheson Holdings Ltd. | | | 6,979,771 | | | | 403,035,967 | | |
Jardine Strategic Holdings Ltd. | | | 520,800 | | | | 17,494,999 | | |
| | | | 1,144,871,601 | | |
Ireland — 0.3% | |
CRH plc | | | 4,704,407 | | | | 140,475,964 | | |
Israel — 0.1% | |
Israel Chemicals Ltd. | | | 11,910,153 | | | | 68,602,721 | | |
Italy — 0.0% (c) | |
Italmobiliare SpA | | | 932,842 | | | | 20,603,377 | | |
Japan — 11.6% | |
Chofu Seisakusho Co. Ltd. (a) | | | 3,346,500 | | | | 67,761,023 | | |
FANUC Corp. | | | 4,251,100 | | | | 739,551,385 | | |
Hirose Electric Co. Ltd. (a) | | | 2,622,015 | | | | 249,898,530 | | |
Hoya Corp. | | | 5,430,340 | | | | 307,225,831 | | |
KDDI Corp. | | | 31,838,200 | | | | 770,479,696 | | |
Keyence Corp. | | | 873,600 | | | | 426,770,909 | | |
Mitsubishi Electric Corp. | | | 12,786,600 | | | | 161,871,221 | | |
Mitsubishi Estate Co. Ltd. | | | 30,826,080 | | | | 492,656,271 | | |
MS&AD Insurance Group Holdings, Inc. | | | 9,086,420 | | | | 272,930,954 | | |
Nissin Foods Holdings Co. Ltd. | | | 1,968,830 | | | | 126,949,128 | | |
First Eagle Funds | Annual Report | October 31, 2018
23
First Eagle Global Fund | Consolidated Schedule of Investments | October 31, 2018
Investments | | Shares | | Value ($) | |
Japan — 11.6% (continued) | |
NTT DOCOMO, Inc. | | | 16,534,400 | | | | 410,034,012 | | |
Secom Co. Ltd. | | | 8,590,030 | | | | 703,279,360 | | |
Shimano, Inc. | | | 1,737,990 | | | | 237,366,365 | | |
SMC Corp. | | | 698,556 | | | | 222,653,978 | | |
Sompo Holdings, Inc. | | | 17,037,000 | | | | 702,700,242 | | |
T Hasegawa Co. Ltd. (a) | | | 3,002,800 | | | | 53,319,400 | | |
| | | | 5,945,448,305 | | |
Mexico — 0.6% | |
Fresnillo plc | | | 18,230,274 | | | | 197,690,339 | | |
Industrias Penoles SAB de CV | | | 6,401,020 | | | | 90,217,568 | | |
| | | | 287,907,907 | | |
Norway — 0.1% | |
Orkla ASA | | | 8,235,230 | | | | 71,064,370 | | |
Russia — 0.2% | |
Gazprom PJSC, ADR | | | 15,687,012 | | | | 74,175,848 | | |
South Korea — 1.7% | |
Hyundai Mobis Co. Ltd. | | | 1,067,561 | | | | 178,327,369 | | |
Kia Motors Corp. | | | 9,085,322 | | | | 227,094,195 | | |
KT&G Corp. | | | 4,321,898 | | | | 385,389,290 | | |
Lotte Confectionery Co. Ltd. | | | 153,688 | | | | 21,469,813 | | |
Lotte Corp.* | | | 913,277 | | | | 38,213,075 | | |
Namyang Dairy Products Co. Ltd. (a) | | | 39,989 | | | | 21,090,245 | | |
| | | | 871,583,987 | | |
Sweden — 0.9% | |
Investor AB, Class A | | | 5,939,940 | | | | 259,030,409 | | |
Investor AB, Class B | | | 3,394,798 | | | | 147,084,255 | | |
Svenska Handelsbanken AB, Class A | | | 4,892,177 | | | | 53,177,192 | | |
| | | | 459,291,856 | | |
Switzerland — 2.0% | |
Cie Financiere Richemont SA (Registered) | | | 2,022,834 | | | | 147,850,235 | | |
Nestle SA (Registered) | | | 6,590,466 | | | | 556,387,628 | | |
Pargesa Holding SA | | | 4,327,670 | | | | 317,694,459 | | |
| | | | 1,021,932,322 | | |
First Eagle Funds | Annual Report | October 31, 2018
24
First Eagle Global Fund | Consolidated Schedule of Investments | October 31, 2018
Investments | | Shares | | Value ($) | |
Taiwan — 0.4% | |
Taiwan Semiconductor Manufacturing Co. Ltd., ADR | | | 4,640,930 | | | | 176,819,433 | | |
Thailand — 0.6% | |
Bangkok Bank PCL, NVDR | | | 51,812,900 | | | | 323,839,589 | | |
Bangkok Bank PCL | | | 36,500 | | | | 233,764 | | |
| | | | 324,073,353 | | |
United Kingdom — 5.9% | |
Berkeley Group Holdings plc (a) | | | 6,602,948 | | | | 295,107,496 | | |
British American Tobacco plc | | | 12,208,844 | | | | 529,256,653 | | |
BT Group plc | | | 46,726,193 | | | | 143,075,885 | | |
Diageo plc | | | 7,767,232 | | | | 268,524,964 | | |
GlaxoSmithKline plc | | | 14,471,132 | | | | 280,273,435 | | |
Liberty Global plc, Class C* | | | 5,645,208 | | | | 141,356,008 | | |
Linde plc | | | 2,507,089 | | | | 412,815,818 | | |
Lloyds Banking Group plc | | | 499,952,090 | | | | 364,834,893 | | |
TechnipFMC plc | | | 15,536,847 | | | | 408,619,076 | | |
Unilever NV, CVA | | | 1,486,602 | | | | 79,882,557 | | |
WPP plc | | | 9,574,565 | | | | 108,343,211 | | |
| | | | 3,032,089,996 | | |
United States — 36.5% | |
3M Co. | | | 2,815,173 | | | | 535,614,815 | | |
Alleghany Corp. | | | 418,350 | | | | 251,294,478 | | |
Alphabet, Inc., Class A* | | | 134,718 | | | | 146,920,756 | | |
Alphabet, Inc., Class C* | | | 163,012 | | | | 175,526,431 | | |
American Express Co. | | | 5,421,408 | | | | 556,941,244 | | |
Analog Devices, Inc. | | | 2,899,743 | | | | 242,737,487 | | |
Anthem, Inc. | | | 1,692,405 | | | | 466,376,046 | | |
Bank of New York Mellon Corp. (The) | | | 13,360,022 | | | | 632,329,841 | | |
BB&T Corp. | | | 10,500,485 | | | | 516,203,843 | | |
Berkshire Hathaway, Inc., Class A* | | | 1,088 | | | | 334,783,040 | | |
Booking Holdings, Inc.* | | | 67,672 | | | | 126,856,578 | | |
Brown & Brown, Inc. | | | 7,986,426 | | | | 225,057,485 | | |
CH Robinson Worldwide, Inc. | | | 4,051,312 | | | | 360,688,307 | | |
Cincinnati Financial Corp. | | | 1,900,903 | | | | 149,487,012 | | |
Cintas Corp. | | | 619,374 | | | | 112,645,549 | | |
First Eagle Funds | Annual Report | October 31, 2018
25
First Eagle Global Fund | Consolidated Schedule of Investments | October 31, 2018
Investments | | Shares | | Value ($) | |
United States — 36.5% (continued) | |
Colgate-Palmolive Co. | | | 7,738,881 | | | | 460,850,364 | | |
Comcast Corp., Class A | | | 24,265,172 | | | | 925,473,660 | | |
ConocoPhillips | | | 3,271,569 | | | | 228,682,673 | | |
Cummins, Inc. | | | 1,568,854 | | | | 214,446,653 | | |
Deere & Co. | | | 3,176,107 | | | | 430,171,932 | | |
DENTSPLY SIRONA, Inc. | | | 4,407,526 | | | | 152,632,625 | | |
Devon Energy Corp. | | | 3,449,156 | | | | 111,752,654 | | |
Exxon Mobil Corp. | | | 11,628,713 | | | | 926,575,852 | | |
Facebook, Inc., Class A* | | | 1,493,637 | | | | 226,719,160 | | |
Flowserve Corp. (a) | | | 8,414,508 | | | | 386,225,917 | | |
H&R Block, Inc. | | | 3,992,318 | | | | 105,956,120 | | |
HCA Healthcare, Inc. | | | 1,598,067 | | | | 213,389,887 | | |
IPG Photonics Corp.* | | | 899,962 | | | | 120,189,925 | | |
JG Boswell Co. | | | 2,485 | | | | 1,635,130 | | |
Mastercard, Inc., Class A | | | 642,322 | | | | 126,967,790 | | |
Microsoft Corp. | | | 4,763,483 | | | | 508,787,619 | | |
Mills Music Trust (a) | | | 31,592 | | | | 723,773 | | |
National Oilwell Varco, Inc. | | | 14,744,541 | | | | 542,599,109 | | |
Newmont Mining Corp. | | | 5,940,201 | | | | 183,671,015 | | |
NOW, Inc.* (a) | | | 5,851,664 | | | | 75,135,366 | | |
Omnicom Group, Inc. | | | 10,111,773 | | | | 751,506,969 | | |
Oracle Corp. | | | 24,906,308 | | | | 1,216,424,083 | | |
Philip Morris International, Inc. | | | 4,919,392 | | | | 433,250,853 | | |
Royal Gold, Inc. | | | 1,260,596 | | | | 96,599,471 | | |
San Juan Basin Royalty Trust (a) | | | 3,908,035 | | | | 19,970,059 | | |
Schlumberger Ltd. | | | 15,336,977 | | | | 786,940,290 | | |
Scotts Miracle-Gro Co. (The) | | | 1,614,331 | | | | 107,740,451 | | |
Synchrony Financial | | | 10,542,022 | | | | 304,453,595 | | |
Teradata Corp.* (a) | | | 12,190,179 | | | | 443,722,516 | | |
Texas Instruments, Inc. | | | 2,493,377 | | | | 231,460,187 | | |
Tiffany & Co. | | | 1,638,891 | | | | 182,408,568 | | |
Travelers Cos., Inc. (The) | | | 575,655 | | | | 72,031,710 | | |
UGI Corp. | | | 3,379,074 | | | | 179,293,666 | | |
First Eagle Funds | Annual Report | October 31, 2018
26
First Eagle Global Fund | Consolidated Schedule of Investments | October 31, 2018
Investments | | Shares | | Value ($) | |
United States — 36.5% (continued) | |
Union Pacific Corp. | | | 3,392,742 | | | | 496,086,735 | | |
Universal Health Services, Inc., Class B | | | 1,969,033 | | | | 239,355,651 | | |
US Bancorp | | | 7,819,459 | | | | 408,723,122 | | |
Varian Medical Systems, Inc.* | | | 2,150,273 | | | | 256,678,088 | | |
Visa, Inc., Class A | | | 935,693 | | | | 128,985,280 | | |
Vista Outdoor, Inc.* (a) | | | 3,252,457 | | | | 40,655,713 | | |
Weyerhaeuser Co., REIT | | | 23,709,923 | | | | 631,395,250 | | |
Willis Towers Watson plc | | | 2,058,297 | | | | 294,665,799 | | |
WR Berkley Corp. | | | 4,386,051 | | | | 332,901,271 | | |
Xilinx, Inc. | | | 2,691,151 | | | | 229,743,561 | | |
| | | | 18,661,043,024 | | |
Total Common Stocks
(Cost $29,124,389,744) | | | 38,370,892,701 | | |
| | | Ounces | | | |
Commodities — 8.4% | |
Gold bullion*
(Cost $3,796,826,237) | | | 3,532,469 | | | | 4,296,577,677 | | |
| | | Principal Amount ($) | | | |
Foreign Government Securities — 1.2% | |
Indonesia — 0.1% | |
Indonesia Treasury Bond
8.25%, 7/15/2021 | | IDR | 965,460,000,000 | | | | 63,751,923 | | |
Malaysia — 0.0% (c) | |
Malaysia Government Bond
3.66%, 10/15/2020 | | MYR | 54,021,000 | | | | 12,943,700 | | |
Mexico — 0.5% | |
Mexican Bonos
5.00%, 12/11/2019 | | MXN | 764,192,000 | | | | 36,198,697 | | |
6.50%, 6/10/2021 | | MXN | 1,813,760,000 | | | | 84,867,887 | | |
6.50%, 6/9/2022 | | MXN | 2,337,520,000 | | | | 107,432,768 | | |
| | | | 228,499,352 | | |
Poland — 0.2% | |
Poland Government Bond
3.25%, 7/25/2019 | | PLN | 306,347,000 | | | | 80,981,983 | | |
First Eagle Funds | Annual Report | October 31, 2018
27
First Eagle Global Fund | Consolidated Schedule of Investments | October 31, 2018
Investments | | Principal Amount ($) | | Value ($) | |
Singapore — 0.4% | |
Singapore Government Bond
3.25%, 9/1/2020 | | SGD | 119,604,000 | | | | 88,183,071 | | |
2.25%, 6/1/2021 | | SGD | 147,741,000 | | | | 106,937,968 | | |
| | | | 195,121,039 | | |
Venezuela, Bolivarian Republic of — 0.0% | |
Venezuela Government Bond
(Oil Indexed Payment Obligation)
Zero Coupon, 4/15/2020‡ (b)(d)(e) | | | 53,230 | | | | — | | |
Total Foreign Government Securities
(Cost $627,890,008) | | | 581,297,997 | | |
U.S. Treasury Obligations — 0.2% | |
U.S. Treasury Notes
1.13%, 1/15/2019
(Cost $113,860,704) | | | 114,023,000 | | | | 113,758,712 | | |
Corporate Bonds — 0.0% (c) | |
United States — 0.0% (c) | |
Bausch & Lomb, Inc.
7.13%, 8/1/2028‡
(Cost $4,935,985) | | | 5,467,000 | | | | 5,425,998 | | |
Short-Term Investments — 14.7% | |
Commercial Paper — 14.7% | |
ABB Treasury Center USA, Inc.
2.26%, 12/18/2018 (f) | | | 80,460,000 | | | | 80,209,180 | | |
American Honda Finance Corp.
2.14%, 11/9/2018 (f) | | | 30,675,000 | | | | 30,657,860 | | |
2.16%, 11/26/2018 (f) | | | 30,500,000 | | | | 30,449,578 | | |
2.19%, 11/27/2018 (f) | | | 45,000,000 | | | | 44,922,577 | | |
2.23%, 12/5/2018 (f) | | | 28,160,000 | | | | 28,096,429 | | |
2.23%, 12/6/2018 (f) | | | 19,233,000 | | | | 19,188,303 | | |
2.39%, 1/11/2019 (f) | | | 52,895,000 | | | | 52,638,565 | | |
2.41%, 1/18/2019 (f) | | | 58,142,000 | | | | 57,830,937 | | |
Anthem, Inc.
2.35%, 11/1/2018 (f) | | | 3,323,000 | | | | 3,322,783 | | |
First Eagle Funds | Annual Report | October 31, 2018
28
First Eagle Global Fund | Consolidated Schedule of Investments | October 31, 2018
Investments | | Principal Amount ($) | | Value ($) | |
Commercial Paper — 14.7% (continued) | |
Apple, Inc.
2.20%, 12/4/2014 (f)(g) | | | 50,000,000 | | | | 49,892,853 | | |
2.16%, 11/6/2018 (f)(g) | | | 18,295,000 | | | | 18,288,267 | | |
2.18%, 11/9/2018 (f)(g) | | | 37,815,000 | | | | 37,794,060 | | |
2.15%,11/13/2018 (f)(g) | | | 111,551,000 | | | | 111,461,372 | | |
2.14%, 11/14/2018 (f)(g) | | | 68,317,000 | | | | 68,257,807 | | |
2.17%, 11/15/2018 (f)(g) | | | 65,490,000 | | | | 65,429,149 | | |
2.17%, 11/19/2018 (f)(g) | | | 43,317,000 | | | | 43,265,835 | | |
2.21%, 12/6/2018 (f)(g) | | | 36,723,000 | | | | 36,639,492 | | |
2.22%, 12/13/2018 (f)(g) | | | 40,239,000 | | | | 40,128,935 | | |
2.25%, 1/4/2019 (f)(g) | | | 74,825,000 | | | | 74,510,621 | | |
2.26%, 1/9/2019 (f)(g) | | | 15,377,000 | | | | 15,307,244 | | |
2.29%, 1/11/2019 (f)(g) | | | 78,511,000 | | | | 78,144,197 | | |
2.32%, 1/18/2019 (f)(g) | | | 89,449,000 | | | | 88,988,698 | | |
BP Capital Markets plc
2.31%, 12/5/2018 (f) | | | 18,343,000 | | | | 18,300,646 | | |
2.31%, 12/7/2018 (f) | | | 72,501,000 | | | | 72,323,431 | | |
2.31%, 12/14/2018 (f) | | | 38,466,000 | | | | 38,352,649 | | |
2.31%, 12/17/2018 (f) | | | 80,460,000 | | | | 80,205,476 | | |
2.37%, 1/3/2019 (f) | | | 42,048,000 | | | | 41,861,718 | | |
2.40%, 1/10/2019 (f) | | | 36,866,000 | | | | 36,682,558 | | |
2.42%, 1/14/2019 (f) | | | 84,921,000 | | | | 84,471,626 | | |
2.42%, 1/15/2019 (f) | | | 79,607,000 | | | | 79,179,457 | | |
2.48%, 1/17/2019 (f) | | | 56,532,000 | | | | 56,219,293 | | |
Chevron Corp.
2.16%, 12/11/2018 (f) | | | 106,168,000 | | | | 105,895,098 | | |
2.08%, 11/7/2018 (f) | | | 117,222,000 | | | | 117,172,311 | | |
2.03%, 11/19/2018 (f) | | | 50,000,000 | | | | 49,941,206 | | |
2.03%, 11/21/2018 (f) | | | 50,000,000 | | | | 49,934,900 | | |
2.08%, 11/29/2018 (f) | | | 18,267,000 | | | | 18,233,920 | | |
2.14%, 12/12/2018 (f) | | | 55,226,000 | | | | 55,080,517 | | |
Coca-Cola Co. (The)
2.23%, 11/8/2018 (f) | | | 20,853,000 | | | | 20,842,652 | | |
2.14%, 11/19/2018 (f) | | | 47,390,000 | | | | 47,333,525 | | |
2.11%, 11/27/2018 (f) | | | 43,415,000 | | | | 43,340,956 | | |
First Eagle Funds | Annual Report | October 31, 2018
29
First Eagle Global Fund | Consolidated Schedule of Investments | October 31, 2018
Investments | | Principal Amount ($) | | Value ($) | |
Commercial Paper — 14.7% (continued) | |
2.29%, 1/3/2019 (f) | | | 21,796,000 | | | | 21,704,786 | | |
2.27%, 1/4/2019 (f) | | | 804,000 | | | | 800,581 | | |
EI du Pont de Nemours & Co.
2.42%, 11/8/2018 (f) | | | 36,250,000 | | | | 36,230,618 | | |
2.32%, 11/9/2018 (f) | | | 50,182,000 | | | | 50,151,740 | | |
2.51%, 11/16/2018 (f) | | | 36,971,000 | | | | 36,930,710 | | |
2.49%, 12/10/2018 (f) | | | 30,581,000 | | | | 30,493,912 | | |
2.49%, 12/11/2018 (f) | | | 25,109,000 | | | | 25,035,622 | | |
Engie SA
2.20%, 11/16/2018 (f) | | | 52,392,000 | | | | 52,340,260 | | |
2.13%, 11/23/2018 (f) | | | 29,241,000 | | | | 29,199,227 | | |
2.22%, 12/5/2018 (f) | | | 61,546,000 | | | | 61,410,770 | | |
2.23%, 12/7/2018 (f) | | | 79,220,000 | | | | 79,035,664 | | |
Eni Finance USA, Inc.
2.37%, 11/1/2018 (f) | | | 4,952,000 | | | | 4,951,674 | | |
Erste Abwicklungsanstalt
2.25%, 11/2/2018 (f)(g) | | | 109,652,000 | | | | 109,638,555 | | |
2.44%, 1/9/2019 (f)(g) | | | 71,333,000 | | | | 70,991,791 | | |
2.44%, 1/10/2019 (f)(g) | | | 39,803,000 | | | | 39,609,575 | | |
Exxon Mobil Corp.
2.12%, 11/8/2018 (f) | | | 58,772,000 | | | | 58,743,463 | | |
2.20%, 12/4/2018 (f) | | | 41,247,000 | | | | 41,159,233 | | |
2.15%, 12/12/2018 (f) | | | 57,700,000 | | | | 57,547,999 | | |
General Dynamics Corp.
2.06%, 11/1/2018 (f) | | | 45,945,000 | | | | 45,942,160 | | |
Henkel US Operations Corp.
2.21%, 11/2/2018 (f) | | | 19,445,000 | | | | 19,442,594 | | |
2.21%, 11/5/2018 (f) | | | 54,887,000 | | | | 54,869,962 | | |
Hitachi America Capital Ltd.
2.37%, 11/1/2018 (f) | | | 18,244,000 | | | | 18,242,798 | | |
IBM Credit LLC
2.16%, 11/7/2018 (f) | | | 62,250,000 | | | | 62,223,008 | | |
2.19%, 11/28/2018 (f) | | | 36,817,000 | | | | 36,751,826 | | |
2.21%, 12/6/2018 (f) | | | 41,600,000 | | | | 41,504,569 | | |
Intel Corp.
2.21%, 12/20/2018 (f) | | | 100,000,000 | | | | 99,679,583 | | |
2.21%, 12/21/2018 (f) | | | 50,000,000 | | | | 49,836,446 | | |
First Eagle Funds | Annual Report | October 31, 2018
30
First Eagle Global Fund | Consolidated Schedule of Investments | October 31, 2018
Investments | | Principal Amount ($) | | Value ($) | |
Commercial Paper — 14.7% (continued) | |
2.21%, 12/26/2018 (f) | | | 50,000,000 | | | | 49,819,478 | | |
2.21%, 12/27/2018 (f) | | | 50,000,000 | | | | 49,816,096 | | |
International Business Machines Corp.
2.21%, 12/18/2018 (f) | | | 100,000,000 | | | | 99,693,067 | | |
2.24%, 12/19/2018 (f) | | | 63,306,000 | | | | 63,107,472 | | |
Kreditanstalt fuer Wiederaufbau
2.13%, 11/5/2018 (f) | | | 87,526,000 | | | | 87,498,527 | | |
2.16%, 11/13/2018 (f) | | | 17,071,000 | | | | 17,057,068 | | |
LVMH Moet Hennessy Louis Vuitton, Inc.
2.30%, 11/16/2018 (f) | | | 60,000,000 | | | | 59,938,613 | | |
2.35%, 12/18/2018 (f) | | | 32,191,000 | | | | 32,088,933 | | |
MetLife Short Term Funding LLC
2.21%, 11/2/2018 (f) | | | 41,786,000 | | | | 41,780,830 | | |
2.21%, 11/6/2018 (f) | | | 75,000,000 | | | | 74,972,025 | | |
2.13%, 11/8/2018 (f) | | | 73,635,000 | | | | 73,598,314 | | |
2.24%, 11/16/2018 (f) | | | 50,000,000 | | | | 49,949,733 | | |
2.26%, 11/30/2018 (f) | | | 50,000,000 | | | | 49,904,583 | | |
2.25%, 12/10/2018 (f) | | | 49,488,000 | | | | 49,360,816 | | |
2.29%, 12/17/2018 (f) | | | 40,239,000 | | | | 40,116,543 | | |
2.32%, 12/19/2018 (f) | | | 59,300,000 | | | | 59,111,371 | | |
2.43%, 1/7/2019 (f) | | | 54,935,000 | | | | 54,683,575 | | |
Nestle Capital Corp.
2.13%, 11/1/2018 (f) | | | 56,839,000 | | | | 56,835,539 | | |
2.13%, 11/2/2018 (f) | | | 26,637,000 | | | | 26,633,753 | | |
2.31%, 11/13/2018 (f) | | | 80,865,000 | | | | 80,800,524 | | |
2.31%, 11/14/2018 (f) | | | 87,152,000 | | | | 87,077,131 | | |
2.18%, 11/19/2018 (f) | | | 55,200,000 | | | | 55,135,382 | | |
2.10%, 11/20/2018 (f) | | | 43,906,000 | | | | 43,851,850 | | |
Nestle Finance International Ltd.
2.24%, 12/14/2018 (f) | | | 64,203,000 | | | | 64,021,027 | | |
Novartis Finance Corp.
2.27%, 12/12/2018 (f) | | | 79,607,000 | | | | 79,394,503 | | |
NRW Bank
2.16%, 11/5/2014 (f) | | | 64,975,000 | | | | 64,954,930 | | |
2.15%, 11/1/2018 (f) | | | 170,658,000 | | | | 170,647,515 | | |
2.33%, 1/16/2019 (f) | | | 95,418,000 | | | | 94,942,269 | | |
First Eagle Funds | Annual Report | October 31, 2018
31
First Eagle Global Fund | Consolidated Schedule of Investments | October 31, 2018
Investments | | Principal Amount ($) | | Value ($) | |
Commercial Paper — 14.7% (continued) | |
Oesterreichische Kontrollbank AG
2.17%, 11/15/2018 (f) | | | 56,200,000 | | | | 56,147,547 | | |
Pfizer, Inc.
2.16%, 12/13/2018 (f) | | | 160,434,000 | | | | 159,995,168 | | |
2.29%, 1/10/2019 (f) | | | 111,274,000 | | | | 110,759,373 | | |
2.30%, 1/14/2019 (f) | | | 80,809,000 | | | | 80,413,373 | | |
Philip Morris International, Inc.
2.20%, 11/13/2018 (f) | | | 32,911,000 | | | | 32,884,224 | | |
2.20%, 11/15/2018 (f) | | | 32,911,000 | | | | 32,880,009 | | |
2.20%, 11/16/2018 (f) | | | 29,826,000 | | | | 29,796,015 | | |
2.18%, 11/21/2018 (f) | | | 53,165,000 | | | | 53,094,539 | | |
Praxair, Inc.
2.18%, 11/9/2018 (f) | | | 47,849,000 | | | | 47,822,420 | | |
Procter & Gamble Co. (The)
2.26%, 1/7/2019 (f) | | | 37,413,000 | | | | 37,247,776 | | |
Province of Quebec Canada
2.04%, 11/6/2018 (f) | | | 33,161,000 | | | | 33,148,797 | | |
2.04%, 11/7/2018 (f) | | | 21,839,000 | | | | 21,829,615 | | |
2.04%, 11/9/2018 (f) | | | 33,402,000 | | | | 33,383,504 | | |
2.10%, 11/15/2018 (f) | | | 55,854,000 | | | | 55,802,102 | | |
2.18%, 12/3/2018 (f) | | | 65,125,000 | | | | 64,989,665 | | |
2.20%, 12/19/2018 (f) | | | 32,350,000 | | | | 32,248,991 | | |
PSP Capital, Inc.
2.16%, 11/14/2018 (f)(g) | | | 135,000,000 | | | | 134,882,505 | | |
2.15%, 11/16/2018 (f)(g) | | | 33,850,000 | | | | 33,816,270 | | |
2.15%, 11/20/2018 (f)(g) | | | 75,000,000 | | | | 74,906,250 | | |
2.21%, 12/3/2018 (f)(g) | | | 30,461,000 | | | | 30,397,672 | | |
2.25%, 12/10/2018 (f)(g) | | | 31,264,000 | | | | 31,184,555 | | |
2.37%, 1/11/2019 (f)(g) | | | 85,979,000 | | | | 85,566,645 | | |
QUALCOMM, Inc.
2.32%, 12/5/2018 (f) | | | 65,471,000 | | | | 65,318,871 | | |
Roche Holdings, Inc.
2.21%, 11/20/2018 (f) | | | 50,750,000 | | | | 50,686,845 | | |
Rockwell Automation, Inc.
2.46%, 1/10/2019 (f) | | | 78,553,000 | | | | 78,163,366 | | |
Sanofi
2.32%, 11/16/2018 (f) | | | 30,153,000 | | | | 30,123,088 | | |
First Eagle Funds | Annual Report | October 31, 2018
32
First Eagle Global Fund | Consolidated Schedule of Investments | October 31, 2018
Investments | | Principal Amount ($) | | Value ($) | |
Commercial Paper — 14.7% (continued) | |
2.24%, 12/14/2018 (f) | | | 33,182,000 | | | | 33,087,870 | | |
2.25%, 12/17/2018 (f) | | | 94,878,000 | | | | 94,589,387 | | |
Siemens Capital Co. LLC
2.24%, 12/3/2018 (f) | | | 69,917,000 | | | | 69,774,399 | | |
2.24%, 12/10/2018 (f) | | | 65,266,000 | | | | 65,102,110 | | |
Total Capital Canada Ltd.
2.16%, 11/6/2018 (f) | | | 85,651,000 | | | | 85,619,409 | | |
2.23%, 12/4/2018 (f) | | | 105,280,000 | | | | 105,047,430 | | |
2.27%, 12/6/2018 (f) | | | 72,501,000 | | | | 72,331,058 | | |
2.36%, 1/3/2019 (f) | | | 83,743,000 | | | | 83,385,845 | | |
2.36%, 1/4/2019 (f) | | | 36,723,000 | | | | 36,563,735 | | |
2.36%, 1/16/2019 (f) | | | 50,059,000 | | | | 49,798,818 | | |
Unilever Capital Corp.
2.12%, 11/19/2018 (f) | | | 100,000,000 | | | | 99,880,828 | | |
2.15%, 11/26/2018 (f) | | | 21,318,000 | | | | 21,283,020 | | |
Walt Disney Co. (The)
2.31%, 1/18/2019 (f) | | | 100,000,000 | | | | 99,466,311 | | |
Total Commercial Paper
(Cost $7,516,524,694) | | | 7,515,476,679 | | |
| | | Shares | | | |
Investment Companies — 0.0% (c) | |
JP Morgan U.S. Government Money Market Fund,
Agency Shares 1.98% (h)
(Cost $240,743) | | | 240,743 | | | | 240,743 | | |
Total Short-Term Investments
(Cost $7,516,765,437) | | | 7,515,717,422 | | |
Total Investments — 99.5%
(Cost $41,184,668,115) | | | 50,883,670,507 | | |
Other Assets Less Liabilities — 0.5% | | | 257,477,067 | | |
Net Assets — 100.0% | | | 51,141,147,574 | | |
* Non-income producing security.
‡ Value determined using significant unobservable inputs.
(a) Affiliated company as defined under the Investment Company Act of 1940.
(b) Security fair valued as of October 31, 2018 in accordance with procedures approved by the Board of Trustees. Total value of all such securities at October 31, 2018 amounted to $17,553,847, which represents approximately 0.03% of net assets of the Fund.
(c) Represents less than 0.05% of net assets.
First Eagle Funds | Annual Report | October 31, 2018
33
First Eagle Global Fund | Consolidated Schedule of Investments | October 31, 2018
(d) Variable or floating rate security, linked to the referenced benchmark.
(e) Defaulted security.
(f) The rate shown was the current yield as of October 31, 2018.
(g) Securities exempt from registration under Rule 144A or section 4(a)(2), of the Securities Act of 1933. Under procedures approved by the Board of Trustees, such securities have been determined to be liquid by the investment adviser and may be resold, normally to qualified institutional buyers in transactions exempt from registration.
(h) Represents 7-day effective yield as of October 31, 2018.
As of October 31, 2018, the gross unrealized appreciation (depreciation) of investments based on the aggregate cost of investment securities and derivative instruments, if applicable, for federal income tax purposes was as follows:
Aggregate gross unrealized appreciation | | $ | 12,054,963,501 | | |
Aggregate gross unrealized depreciation | | | (2,916,908,531 | ) | |
Net unrealized appreciation | | $ | 9,138,054,970 | | |
Federal income tax cost | | $ | 41,813,157,138 | | |
Forward Foreign Currency Exchange Contracts outstanding as of October 31, 2018
Currency
Purchased | | Currency Sold | | Counterparty | | Settlement
Date | | Unrealized
Appreciation
(Depreciation) | |
USD | 410,244,670 | | | EUR | 343,963,000 | | | Goldman Sachs | | 11/14/2018 | | $ | 20,289,871 | | |
USD | 45,739,097 | | | GBP | 33,862,000 | | | Goldman Sachs | | 11/14/2018 | | | 2,434,407 | | |
USD | 257,587,240 | | | JPY | 28,020,340,000 | | | Goldman Sachs | | 11/14/2018 | | | 9,045,395 | | |
USD | 158,677,793 | | | EUR | 133,824,000 | | | JPMorgan Chase Bank | | 12/12/2018 | | | 6,566,528 | | |
USD | 43,593,767 | | | GBP | 32,717,000 | | | JPMorgan Chase Bank | | 12/12/2018 | | | 1,691,306 | | |
USD | 337,860,958 | | | JPY | 37,299,174,000 | | | JPMorgan Chase Bank | | 12/12/2018 | | | 6,186,855 | | |
USD | 49,996,227 | | | EUR | 42,608,000 | | | UBS AG | | 01/16/2019 | | | 1,386,148 | | |
USD | 108,314,736 | | | GBP | 83,486,000 | | | UBS AG | | 01/16/2019 | | | 1,159,206 | | |
USD | 88,819,280 | | | JPY | 9,734,149,000 | | | UBS AG | | 01/16/2019 | | | 1,949,116 | | |
USD | 162,928,983 | | | EUR | 137,780,000 | | | HSBC Bank plc | | 02/13/2019 | | | 5,339,596 | | |
USD | 49,927,143 | | | GBP | 37,856,000 | | | HSBC Bank plc | | 02/13/2019 | | | 1,268,573 | | |
USD | 255,157,864 | | | JPY | 28,202,216,000 | | | HSBC Bank plc | | 02/13/2019 | | | 2,890,283 | | |
USD | 162,358,359 | | | EUR | 137,586,000 | | | Bank of New York Mellon | | 05/15/2019 | | | 3,729,737 | | |
USD | 45,322,150 | | | GBP | 33,888,000 | | | Bank of New York Mellon | | 05/15/2019 | | | 1,569,871 | | |
USD | 342,550,690 | | | JPY | 37,779,573,000 | | | Bank of New York Mellon | | 05/15/2019 | | | 2,034,709 | | |
Net unrealized appreciation | | $ | 67,541,601 | | |
First Eagle Funds | Annual Report | October 31, 2018
34
First Eagle Global Fund | Consolidated Schedule of Investments | October 31, 2018
Abbreviations
ADR — American Depositary Receipt
CVA — Dutch Certification
EUR — Euro
GBP — British Pound
IDR — Indonesian Rupiah
JPY — Japanese Yen
MXN — Mexican Peso
MYR — Malaysian Ringgit
NVDR — Non-Voting Depositary Receipt
PJSC — Public Joint Stock Company
PLN — Polish Zloty
REIT — Real Estate Investment Trust
SGD — Singapore Dollar
USD — United States Dollar
Affiliated Securities
Security Description | | Shares at
October 31, 2018 | | Market Value
October 31, 2017 | | Purchases at
Cost | | Proceeds from
Sales | |
Berkeley Group
Holdings plc | | | 6,602,948 | | | $ | 366,860,523 | | | $ | — | | | $ | (44,384,164 | ) | |
Chofu Seisakusho
Co. Ltd. | | | 3,346,500 | | | | 83,273,333 | | | | — | | | | (1,555,163 | ) | |
Emin Leydier SA^ | | | — | | | | 53,816,069 | | | | — | | | | (74,327,127 | ) | |
Flowserve Corp. | | | 8,414,508 | | | | 370,827,368 | | | | — | | | | — | | |
Hirose Electric Co. Ltd. | | | 2,622,015 | | | | 367,409,683 | | | | 5,321,634 | | | | — | | |
Hornbach Holding
AG & Co. KGaA | | | 1,181,422 | | | | 101,162,948 | | | | — | | | | — | | |
Mills Music Trust | | | 31,592 | | | | 770,845 | | | | — | | | | — | | |
Namyang Dairy
Products Co. Ltd. | | | 39,989 | | | | 23,439,818 | | | | — | | | | — | | |
NOW, Inc.* | | | 5,851,664 | | | | 73,262,833 | | | | — | | | | — | | |
NSC Groupe | | | 38,717 | | | | 5,740,670 | | | | — | | | | (2,420,028 | ) | |
Orbital ATK, Inc.^ | | | — | | | | 491,057,511 | | | | — | | | | (496,857,257 | ) | |
Sabeton SA | | | 385,000 | | | | 11,077,141 | | | | — | | | | — | | |
San Juan Basin
Royalty Trust | | | 3,908,035 | | | | 29,427,504 | | | | — | | | | — | | |
T Hasegawa Co. Ltd. | | | 3,002,800 | | | | 67,686,317 | | | | — | | | | (6,948,991 | ) | |
Teradata Corp.* | | | 12,190,179 | | | | 407,761,488 | | | | — | | | | — | | |
Vista Outdoor, Inc.* | | | 3,252,457 | | | | 68,008,876 | | | | — | | | | — | | |
Total | | | | $ | 2,521,582,927 | | | $ | 5,321,634 | | | $ | (626,492,730 | ) | |
First Eagle Funds | Annual Report | October 31, 2018
35
First Eagle Global Fund | Consolidated Schedule of Investments | October 31, 2018
Affiliated Securities (continued)
Security Description | | Net Realized
Gain
(Loss) | | Change in
Unrealized
Appreciation/
(Depreciation) | | Market Value
October 31,
2018 | | Dividend/
Interest
Income | | Capital Gain
Distributions | |
Berkeley Group
Holdings plc | | $ | 26,776,597 | | | $ | (54,145,460 | ) | | $ | 295,107,496 | | | $ | 8,070,856 | | | $ | — | | |
Chofu Seisakusho
Co. Ltd. | | | 127,037 | | | | (14,084,184 | ) | | | 67,761,023 | | | | 869,039 | | | | — | | |
Emin Leydier SA^ | | | 74,152,999 | | | | (53,641,941 | ) | | | — | | | | 110,565 | | | | — | | |
Flowserve Corp. | | | — | | | | 15,398,549 | | | | 386,225,917 | | | | 6,395,026 | | | | — | | |
Hirose Electric Co. Ltd. | | | — | | | | (122,832,787 | ) | | | 249,898,530 | | | | 7,388,654 | | | | — | | |
Hornbach Holding
AG & Co. KGaA | | | — | | | | (23,086,063 | ) | | | 78,076,885 | | | | 1,769,466 | | | | — | | |
Mills Music Trust | | | — | | | | (47,072 | ) | | | 723,773 | | | | 84,627 | | | | — | | |
Namyang Dairy
Products Co. Ltd. | | | — | | | | (2,349,573 | ) | | | 21,090,245 | | | | 29,151 | | | | — | | |
NOW, Inc.* | | | — | | | | 1,872,533 | | | | 75,135,366 | | | | — | | | | — | | |
NSC Groupe | | | (2,667,280 | ) | | | 2,745,231 | | | | 3,398,593 | | | | 122,259 | | | | — | | |
Orbital ATK, Inc.^ | | | 309,084,986 | | | | (303,285,240 | ) | | | — | | | | 3,546,342 | | | | — | | |
Sabeton SA | | | — | | | | (729,954 | ) | | | 10,347,187 | | | | 83,640 | | | | — | | |
San Juan Basin
Royalty Trust | | | — | | | | (9,457,445 | ) | | | 19,970,059 | | | | 1,834,850 | | | | — | | |
T Hasegawa Co. Ltd. | | | 1,772,806 | | | | (9,190,732 | ) | | | 53,319,400 | | | | 952,284 | | | | — | | |
Teradata Corp.* | | | — | | | | 35,961,028 | | | | 443,722,516 | | | | — | | | | — | | |
Vista Outdoor, Inc.* | | | — | | | | (27,353,163 | ) | | | 40,655,713 | | | | — | | | | — | | |
Total | | $ | 409,247,145 | | | $ | (564,226,273 | ) | | $ | 1,745,432,703 | | | $ | 31,256,759 | | | $ | — | | |
*Non-income producing security.
^Represents an unaffiliated issuer as of October 31, 2018.
See Notes to Financial Statements.
First Eagle Funds | Annual Report | October 31, 2018
36
This page was intentionally left blank.
First Eagle Overseas Fund
Data as of October 31, 2018 (unaudited)
Investment Objective
The First Eagle Overseas Fund seeks long-term growth of capital by investing primarily in equities issued by non-U.S. corporations. Management's research-driven process focuses on undervalued securities.
| Average Annual Returns (%) | | | | | | One-Year | | Five-Years | | Ten-Years | |
First Eagle Overseas Fund | | Class A | | without sales load | | | -7.27 | | | | 2.47 | | | | 7.51 | | |
| | | | with sales load | | | -11.90 | | | | 1.43 | | | | 6.95 | | |
MSCI EAFE Index | | | | | | | -6.85 | | | | 2.02 | | | | 6.89 | | |
Consumer Price Index | | | | | | | 2.52 | | | | 1.61 | | | | 1.56 | | |
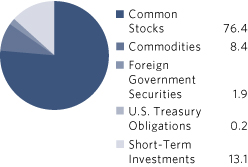
Sectors* (%) | |
Industrials | | | 13.4 | | |
Financials | | | 12.1 | | |
Consumer Staples | | | 10.8 | | |
Materials | | | 10.7 | | |
Commodities | | | 8.4 | | |
Communication Services | | | 6.3 | | |
Health Care | | | 5.6 | | |
Consumer Discretionary | | | 5.5 | | |
Real Estate | | | 4.5 | | |
Energy | | | 4.1 | | |
Information Technology | | | 3.4 | | |
Foreign Government Securities | | | 1.9 | | |
U.S. Treasury Obligations | | | 0.2 | | |
Short-Term Investments | | | 13.1 | | |
Countries*~ (%)
Japan | | | 20.8 | | |
United States | | | 10.1 | | |
United Kingdom | | | 9.9 | | |
France | | | 9.3 | | |
Canada | | | 6.7 | | |
Hong Kong | | | 5.7 | | |
Switzerland | | | 3.6 | | |
South Korea | | | 3.5 | | |
Singapore | | | 2.4 | | |
Germany | | | 2.1 | | |
Sweden | | | 1.9 | | |
Mexico | | | 1.6 | | |
Thailand | | | 1.3 | | |
Brazil | | | 0.9 | | |
Chile | | | 0.8 | | |
Norway | | | 0.8 | | |
Taiwan | | | 0.7 | | |
Belgium | | | 0.7 | | |
Netherlands | | | 0.7 | | |
Australia | | | 0.6 | | |
Denmark | | | 0.6 | | |
Greece | | | 0.5 | | |
Ireland | | | 0.4 | | |
Poland | | | 0.3 | | |
Russia | | | 0.3 | | |
Israel | | | 0.2 | | |
Indonesia | | | 0.2 | | |
Turkey | | | 0.1 | | |
Italy | | | 0.1 | | |
Africa | | | 0.1 | | |
Malaysia | | | 0.0 | ^ | |
Short-Term Investments | | | 13.1 | | |
^Less than 0.05%.
*Asset Allocation, Sector and Countries percentages are based on total investments in the portfolio.
~Country allocations reflect country of risk (not currency of issue). Bonds of non-U.S. issuers may be U.S. dollar denominated.
The Fund's portfolio composition is subject to change at any time.
First Eagle Funds | Annual Report | October 31, 2018
38
First Eagle Overseas Fund | Fund Overview
Growth of a $10,000 Initial Investment
Performance data quoted herein represents past performance and should not be considered indicative of future results. Performance data quoted herein does not reflect the deduction of taxes that a shareholder would pay on Fund distributions or the sale of Fund shares. The average annual returns shown above are historical and reflect changes in share price, reinvested dividends and are net of expenses.
The average annual returns for Class A shares give effect to the deduction of the maximum sales charge of 5.00%.
The MSCI EAFE Index is an unmanaged total return index, reported in U.S. dollars, based on share prices and reinvested net dividends of approximately 1,100 companies from 21 developed market countries. One cannot invest directly in an index. The Consumer Price Index (CPI) represents the change in price of all goods and services purchased for consumption in urban households.
Top 10 Holdings* (%)
Gold bullion** (Precious Metal) | | | 8.3 | | |
KDDI Corp. (Wireless Telecommunication Services, Japan) | | | 2.4 | | |
FANUC Corp. (Machinery, Japan) | | | 2.4 | | |
Secom Co. Ltd. (Commercial Services & Supplies, Japan) | | | 2.1 | | |
Sompo Holdings, Inc. (Insurance, Japan) | | | 2.0 | | |
Danone SA (Food Products, France) | | | 2.0 | | |
Nestle SA (Registered) (Food Products, Switzerland) | | | 1.9 | | |
Nutrien Ltd. (Chemicals, Canada) | | | 1.9 | | |
TechnipFMC plc (Energy Equipment & Services, United Kingdom) | | | 1.7 | | |
Mitsubishi Estate Co. Ltd. (Real Estate Management & Development, Japan) | | | 1.6 | | |
Total | | | 26.3 | | |
* Holdings in cash, commercial paper and other short-term cash equivalents have been excluded.
**The Fund invests in gold and precious metals through investment in a wholly-owned subsidiary of the Fund organized under the laws of the Cayman Islands (the "Subsidiary"). Gold bullion and commodities include the Fund's investment in the Subsidiary.
Percentages are based on total net assets.
First Eagle Funds | Annual Report | October 31, 2018
39
First Eagle Overseas Fund | Consolidated Schedule of Investments | October 31, 2018
Investments | | Shares | | Value ($) | |
Common Stocks — 75.4% | |
Africa — 0.1% | |
Randgold Resources Ltd., ADR | | | 118,663 | | | | 9,319,792 | | |
Australia — 0.6% | |
Newcrest Mining Ltd. | | | 6,277,234 | | | | 91,887,495 | | |
Belgium — 0.7% | |
Groupe Bruxelles Lambert SA | | | 907,727 | | | | 84,421,421 | | |
Sofina SA | | | 98,473 | | | | 18,834,583 | | |
| | | | 103,256,004 | | |
Brazil — 0.9% | |
Cielo SA | | | 35,837,586 | | | | 127,114,372 | | |
Canada — 6.6% | |
Agnico Eagle Mines Ltd. | | | 1,977,932 | | | | 69,865,045 | | |
Barrick Gold Corp. | | | 6,244,857 | | | | 78,372,955 | | |
Canadian Natural Resources Ltd. | | | 1,096,974 | | | | 30,098,143 | | |
Cenovus Energy, Inc. | | | 6,627,505 | | | | 56,068,692 | | |
Franco-Nevada Corp. | | | 882,841 | | | | 55,138,583 | | |
Goldcorp, Inc. | | | 5,488,932 | | | | 49,510,167 | | |
Imperial Oil Ltd. | | | 6,877,585 | | | | 214,824,942 | | |
Nutrien Ltd. | | | 5,208,451 | | | | 275,683,311 | | |
Power Corp. of Canada | | | 3,181,347 | | | | 65,683,476 | | |
Wheaton Precious Metals Corp. | | | 4,232,770 | | | | 69,544,411 | | |
| | | | 964,789,725 | | |
Chile — 0.8% | |
Cia Cervecerias Unidas SA, ADR | | | 4,800,004 | | | | 120,336,100 | | |
Denmark — 0.6% | |
ISS A/S | | | 2,727,957 | | | | 89,589,324 | | |
France — 9.2% | |
Bouygues SA | | | 2,577,374 | | | | 93,895,510 | | |
Cie de Saint-Gobain | | | 4,172,299 | | | | 157,176,436 | | |
Danone SA | | | 4,115,540 | | | | 291,435,322 | | |
Laurent-Perrier (a) | | | 558,938 | | | | 57,307,183 | | |
Legrand SA | | | 653,934 | | | | 42,702,517 | | |
Legris Industries SA*‡ (a)(b)(c) | | | 905,366 | | | | 27,728,513 | | |
Rexel SA | | | 7,346,731 | | | | 93,651,126 | | |
First Eagle Funds | Annual Report | October 31, 2018
40
First Eagle Overseas Fund | Consolidated Schedule of Investments | October 31, 2018
Investments | | Shares | | Value ($) | |
France — 9.2% (continued) | |
Robertet SA (a) | | | 191,299 | | | | 113,537,596 | | |
Robertet SA CI (non-voting)‡ (b) | | | 51,500 | | | | 21,395,984 | | |
Sabeton SA | | | 100,000 | | | | 2,687,581 | | |
Sanofi | | | 2,263,796 | | | | 202,294,097 | | |
Sodexo SA | | | 1,610,285 | | | | 164,372,842 | | |
Wendel SA | | | 493,657 | | | | 63,966,169 | | |
| | | | 1,332,150,876 | | |
Germany — 2.1% | |
Hamburger Hafen und Logistik AG | | | 1,426,565 | | | | 30,219,061 | | |
HeidelbergCement AG | | | 2,561,826 | | | | 173,856,849 | | |
Hornbach Holding AG & Co. KGaA | | | 385,305 | | | | 25,463,733 | | |
Telefonica Deutschland Holding AG | | | 19,522,787 | | | | 75,893,361 | | |
| | | | 305,433,004 | | |
Greece — 0.5% | |
JUMBO SA | | | 5,055,719 | | | | 73,612,488 | | |
Hong Kong — 5.6% | |
CK Asset Holdings Ltd. | | | 13,982,500 | | | | 90,994,594 | | |
Great Eagle Holdings Ltd. | | | 22,777,700 | | | | 104,018,879 | | |
Guoco Group Ltd. | | | 7,806,340 | | | | 131,515,187 | | |
Hang Lung Properties Ltd. | | | 63,003,162 | | | | 114,204,154 | | |
Hopewell Holdings Ltd. | | | 20,708,981 | | | | 63,986,673 | | |
Hysan Development Co. Ltd. | | | 17,500,405 | | | | 82,071,603 | | |
Jardine Matheson Holdings Ltd. | | | 3,666,900 | | | | 211,739,409 | | |
Jardine Strategic Holdings Ltd. | | | 233,600 | | | | 7,847,219 | | |
Swire Properties Ltd. | | | 4,561,319 | | | | 15,587,518 | | |
| | | | 821,965,236 | | |
Ireland — 0.4% | |
CRH plc | | | 2,108,597 | | | | 62,963,769 | | |
Israel — 0.2% | |
Israel Chemicals Ltd. | | | 5,848,076 | | | | 33,685,036 | | |
Italy — 0.1% | |
Italmobiliare SpA | | | 519,057 | | | | 11,464,243 | | |
First Eagle Funds | Annual Report | October 31, 2018
41
First Eagle Overseas Fund | Consolidated Schedule of Investments | October 31, 2018
Investments | | Shares | | Value ($) | |
Japan — 20.5% | |
As One Corp. (a) | | | 1,183,340 | | | | 84,236,921 | | |
Chofu Seisakusho Co. Ltd. (a) | | | 1,842,500 | | | | 37,307,541 | | |
Daiichikosho Co. Ltd. | | | 2,415,680 | | | | 111,497,489 | | |
FANUC Corp. | | | 1,989,540 | | | | 346,114,432 | | |
Hirose Electric Co. Ltd. | | | 1,168,730 | | | | 111,389,107 | | |
Hoya Corp. | | | 2,326,830 | | | | 131,642,269 | | |
Kansai Paint Co. Ltd. | | | 3,559,930 | | | | 52,602,574 | | |
KDDI Corp. | | | 14,346,200 | | | | 347,175,902 | | |
Keyence Corp. | | | 347,800 | | | | 169,907,191 | | |
Maezawa Kasei Industries Co. Ltd. (a) | | | 837,200 | | | | 8,330,873 | | |
Mitsubishi Electric Corp. | | | 6,383,800 | | | | 80,815,346 | | |
Mitsubishi Estate Co. Ltd. | | | 15,022,050 | | | | 240,079,411 | | |
MS&AD Insurance Group Holdings, Inc. | | | 4,008,600 | | | | 120,407,270 | | |
Nagaileben Co. Ltd. | | | 1,687,224 | | | | 37,794,762 | | |
Nissin Foods Holdings Co. Ltd. | | | 907,930 | | | | 58,542,851 | | |
NTT DOCOMO, Inc. | | | 7,050,600 | | | | 174,846,732 | | |
Secom Co. Ltd. | | | 3,748,800 | | | | 306,920,193 | | |
Shimano, Inc. | | | 750,470 | | | | 102,495,605 | | |
SK Kaken Co. Ltd. | | | 87,561 | | | | 37,135,543 | | |
SMC Corp. | | | 305,490 | | | | 97,370,238 | | |
Sompo Holdings, Inc. | | | 7,108,700 | | | | 293,202,161 | | |
T Hasegawa Co. Ltd. | | | 1,906,436 | | | | 33,851,746 | | |
| | | | 2,983,666,157 | | |
Mexico — 0.7% | |
Fresnillo plc | | | 5,813,900 | | | | 63,046,329 | | |
Industrias Penoles SAB de CV | | | 2,246,692 | | | | 31,665,436 | | |
| | | | 94,711,765 | | |
Netherlands — 0.6% | |
HAL Trust | | | 583,076 | | | | 93,635,136 | | |
Norway — 0.8% | |
Orkla ASA | | | 13,188,419 | | | | 113,806,983 | | |
Russia — 0.3% | |
Gazprom PJSC, ADR | | | 8,419,603 | | | | 39,811,992 | | |
First Eagle Funds | Annual Report | October 31, 2018
42
First Eagle Overseas Fund | Consolidated Schedule of Investments | October 31, 2018
Investments | | Shares | | Value ($) | |
Singapore — 1.8% | |
ComfortDelGro Corp. Ltd. | | | 32,779,415 | | | | 53,373,497 | | |
Haw Par Corp. Ltd. (a) | | | 23,079,313 | | | | 214,106,178 | | |
| | | | 267,479,675 | | |
South Korea — 3.5% | |
Fursys, Inc. (a) | | | 872,463 | | | | 22,509,247 | | |
Hyundai Mobis Co. Ltd. | | | 461,565 | | | | 77,100,674 | | |
Kia Motors Corp. | | | 5,054,863 | | | | 126,349,957 | | |
KT&G Corp. | | | 2,026,271 | | | | 180,685,232 | | |
Lotte Confectionery Co. Ltd. | | | 104,605 | | | | 14,613,046 | | |
Lotte Corp.* | | | 621,610 | | | | 26,009,227 | | |
Namyang Dairy Products Co. Ltd. | | | 22,950 | | | | 12,103,857 | | |
Namyang Dairy Products Co. Ltd. (Preference) | | | 27,183 | | | | 4,413,018 | | |
NongShim Co. Ltd. | | | 203,663 | | | | 39,036,260 | | |
| | | | 502,820,518 | | |
Sweden — 1.9% | |
Industrivarden AB, Class C | | | 1,031,319 | | | | 21,421,617 | | |
Investor AB, Class A | | | 3,013,030 | | | | 131,392,976 | | |
Investor AB, Class B | | | 2,096,088 | | | | 90,815,873 | | |
Svenska Handelsbanken AB, Class A | | | 2,696,400 | | | | 29,309,442 | | |
| | | | 272,939,908 | | |
Switzerland — 3.6% | |
Cie Financiere Richemont SA (Registered) | | | 871,464 | | | | 63,695,863 | | |
Nestle SA (Registered) | | | 3,289,839 | | | | 277,738,436 | | |
Pargesa Holding SA | | | 2,413,791 | | | | 177,196,511 | | |
| | | | 518,630,810 | | |
Taiwan — 0.7% | |
Taiwan Secom Co. Ltd. | | | 8,545,694 | | | | 24,325,844 | | |
Taiwan Semiconductor Manufacturing Co. Ltd., ADR | | | 2,060,731 | | | | 78,513,851 | | |
| | | | 102,839,695 | | |
Thailand — 1.3% | |
Bangkok Bank PCL, NVDR | | | 25,697,959 | | | | 160,616,689 | | |
Bangkok Bank PCL | | | 15,000 | | | | 96,067 | | |
Thai Beverage PCL | | | 52,214,985 | | | | 23,584,067 | | |
| | | | 184,296,823 | | |
First Eagle Funds | Annual Report | October 31, 2018
43
First Eagle Overseas Fund | Consolidated Schedule of Investments | October 31, 2018
Investments | | Shares | | Value ($) | |
Turkey — 0.1% | |
AG Anadolu Grubu Holding A/S | | | 5,893,909 | | | | 12,002,361 | | |
United Kingdom — 9.7% | |
Berkeley Group Holdings plc | | | 2,568,676 | | | | 114,802,592 | | |
British American Tobacco plc | | | 5,198,018 | | | | 225,335,471 | | |
BT Group plc | | | 22,262,999 | | | | 68,169,437 | | |
Diageo plc | | | 3,139,106 | | | | 108,523,645 | | |
GlaxoSmithKline plc | | | 6,551,859 | | | | 126,894,844 | | |
Hiscox Ltd. | | | 3,277,703 | | | | 68,085,732 | | |
Liberty Global plc, Class C* | | | 2,684,482 | | | | 67,219,429 | | |
Linde plc | | �� | 668,941 | | | | 109,749,298 | | |
Lloyds Banking Group plc | | | 255,626,572 | | | | 186,540,860 | | |
TechnipFMC plc | | | 9,437,980 | | | | 248,218,874 | | |
Unilever NV, CVA | | | 669,808 | | | | 35,992,132 | | |
WPP plc | | | 5,126,141 | | | | 58,006,037 | | |
| | | | 1,417,538,351 | | |
United States — 1.5% | |
Newmont Mining Corp. | | | 1,695,641 | | | | 52,429,220 | | |
Royal Gold, Inc. | | | 551,449 | | | | 42,257,537 | | |
Willis Towers Watson plc | | | 841,188 | | | | 120,424,474 | | |
| | | | 215,111,231 | | |
Total Common Stocks
(Cost $8,678,500,634) | | | 10,966,858,869 | | |
| | | Ounces | | | |
Commodities — 8.3% | |
Gold bullion*
(Cost $943,190,896) | | | 991,296 | | | | 1,205,722,763 | | |
| | | Principal Amount ($) | | | |
Foreign Government Securities — 1.9% | |
Indonesia — 0.2% | |
Indonesia Treasury Bond
8.25%, 7/15/2021 | | IDR | 436,483,000,000 | | | | 28,822,147 | | |
Malaysia — 0.0% (d) | |
Malaysia Government Bond
3.66%, 10/15/2020 | | MYR | 25,956,000 | | | | 6,219,187 | | |
First Eagle Funds | Annual Report | October 31, 2018
44
First Eagle Overseas Fund | Consolidated Schedule of Investments | October 31, 2018
Investments | | Principal Amount ($) | | Value ($) | |
Mexico — 0.9% | |
Mexican Bonos
5.00%, 12/11/2019 | | MXN | 480,074,000 | | | | 22,740,428 | | |
6.50%, 6/10/2021 | | MXN | 1,025,590,000 | | | | 47,988,519 | | |
6.50%, 6/9/2022 | | MXN | 1,264,500,000 | | | | 58,116,609 | | |
| | | | 128,845,556 | | |
Poland — 0.3% | |
Poland Government Bond
3.25%, 7/25/2019 | | PLN | 157,760,000 | | | | 41,703,420 | | |
Singapore — 0.5% | |
Singapore Government Bond
3.25%, 9/1/2020 | | SGD | 53,521,000 | | | | 39,460,605 | | |
2.25%, 6/1/2021 | | SGD | 46,160,000 | | | | 33,411,555 | | |
| | | | 72,872,160 | | |
Total Foreign Government Securities
(Cost $302,543,669) | | | 278,462,470 | | |
U.S. Treasury Obligations — 0.2% | |
U.S. Treasury Notes
1.13%, 1/15/2019
(Cost $35,925,792) | | | 35,977,000 | | | | 35,893,611 | | |
Short-Term Investments — 12.9% | |
Commercial Paper — 12.9% | |
ABB Treasury Center USA, Inc.
2.26%, 12/18/2018 (e) | | | 17,436,000 | | | | 17,381,646 | | |
American Honda Finance Corp.
2.23%, 12/5/2018 (e) | | | 6,103,000 | | | | 6,089,222 | | |
2.23%, 12/6/2018 (e) | | | 5,767,000 | | | | 5,753,598 | | |
2.39%, 1/11/2019 (e) | | | 17,105,000 | | | | 17,022,075 | | |
2.41%, 1/18/2019 (e) | | | 6,858,000 | | | | 6,821,309 | | |
Anthem, Inc.
2.35%, 11/1/2018 (e) | | | 10,993,000 | | | | 10,992,282 | | |
Apple, Inc.
2.16%, 11/6/2018 (e)(f) | | | 6,705,000 | | | | 6,702,532 | | |
2.18%, 11/9/2018 (e)(f) | | | 11,585,000 | | | | 11,578,585 | | |
2.17%, 11/13/2018 (e)(f) | | | 13,449,000 | | | | 13,438,194 | | |
2.15%, 11/14/2018 (e)(f) | | | 6,683,000 | | | | 6,677,210 | | |
First Eagle Funds | Annual Report | October 31, 2018
45
First Eagle Overseas Fund | Consolidated Schedule of Investments | October 31, 2018
Investments | | Principal Amount ($) | | Value ($) | |
Commercial Paper — 12.9% (continued) | |
2.17%, 11/15/2018 (e)(f) | | | 9,510,000 | | | | 9,501,164 | | |
2.17%, 11/19/2018 (e)(f) | | | 6,683,000 | | | | 6,675,106 | | |
2.21%, 12/6/2018 (e)(f) | | | 13,277,000 | | | | 13,246,808 | | |
2.22%, 12/13/2018 (e)(f) | | | 9,761,000 | | | | 9,734,301 | | |
2.25%, 1/4/2019 (e)(f) | | | 25,175,000 | | | | 25,069,226 | | |
2.26%, 1/9/2019 (e)(f) | | | 5,173,000 | | | | 5,149,533 | | |
2.29%, 1/11/2019 (e)(f) | | | 25,389,000 | | | | 25,270,383 | | |
2.32%, 1/18/2019 (e)(f) | | | 10,551,000 | | | | 10,496,705 | | |
BP Capital Markets plc
2.31%, 12/5/2018 (e) | | | 6,193,000 | | | | 6,178,700 | | |
2.31%, 12/7/2018 (e) | | | 24,477,000 | | | | 24,417,051 | | |
2.31%, 12/14/2018 (e) | | | 11,534,000 | | | | 11,500,012 | | |
2.31%, 12/17/2018 (e) | | | 17,436,000 | | | | 17,380,844 | | |
2.37%, 1/3/2019 (e) | | | 15,202,000 | | | | 15,134,652 | | |
2.40%, 1/10/2019 (e) | | | 13,134,000 | | | | 13,068,646 | | |
2.42%, 1/14/2019 (e) | | | 15,079,000 | | | | 14,999,207 | | |
2.42%, 1/15/2019 (e) | | | 20,393,000 | | | | 20,283,476 | | |
2.48%, 1/17/2019 (e) | | | 6,668,000 | | | | 6,631,116 | | |
Chevron Corp.
2.15%, 12/11/2018 (e) | | | 68,832,000 | | | | 68,655,070 | | |
2.08%, 11/7/2018 (e) | | | 17,778,000 | | | | 17,770,464 | | |
2.08%, 11/29/2018 (e) | | | 11,133,000 | | | | 11,112,839 | | |
2.14%, 12/12/2018 (e) | | | 19,774,000 | | | | 19,721,909 | | |
Coca-Cola Co. (The)
2.23%, 11/8/2018 (e) | | | 4,147,000 | | | | 4,144,942 | | |
2.11%, 11/27/2018 (e) | | | 6,585,000 | | | | 6,573,770 | | |
2.29%, 1/3/2019 (e) | | | 3,554,000 | | | | 3,539,127 | | |
2.27%, 1/4/2019 (e) | | | 396,000 | | | | 394,316 | | |
EI du Pont de Nemours & Co.
2.42%, 11/8/2018 (e) | | | 12,239,000 | | | | 12,232,456 | | |
2.32%, 11/9/2018 (e) | | | 17,968,000 | | | | 17,957,165 | | |
2.51%, 11/16/2018 (e) | | | 6,029,000 | | | | 6,022,430 | | |
2.49%, 12/10/2018 (e) | | | 7,419,000 | | | | 7,397,872 | | |
2.49%, 12/11/2018 (e) | | | 6,091,000 | | | | 6,073,200 | | |
First Eagle Funds | Annual Report | October 31, 2018
46
First Eagle Overseas Fund | Consolidated Schedule of Investments | October 31, 2018
Investments | | Principal Amount ($) | | Value ($) | |
Commercial Paper — 12.9% (continued) | |
Engie SA
2.20%, 11/16/2018 (e) | | | 7,608,000 | | | | 7,600,487 | | |
2.13%, 11/23/2018 (e) | | | 19,382,000 | | | | 19,354,312 | | |
2.22%, 12/5/2018 (e) | | | 18,454,000 | | | | 18,413,452 | | |
2.23%, 12/7/2018 (e) | | | 34,060,000 | | | | 33,980,746 | | |
Eni Finance USA, Inc.
2.37%, 11/1/2018 (e) | | | 16,381,000 | | | | 16,379,922 | | |
Erste Abwicklungsanstalt
2.25%, 11/2/2018 (e)(f) | | | 40,348,000 | | | | 40,343,053 | | |
2.44%, 1/9/2019 (e)(f) | | | 12,667,000 | | | | 12,606,410 | | |
2.44%, 1/10/2019 (e)(f) | | | 10,197,000 | | | | 10,147,447 | | |
Exxon Mobil Corp.
2.10%, 11/8/2018 (e) | | | 38,362,000 | | | | 38,343,373 | | |
2.20%, 12/4/2018 (e) | | | 17,734,000 | | | | 17,696,265 | | |
2.15%, 12/12/2018 (e) | | | 17,300,000 | | | | 17,254,426 | | |
General Dynamics Corp.
2.06%, 11/1/2018 (e) | | | 36,755,000 | | | | 36,752,728 | | |
Henkel US Operations Corp.
2.21%, 11/2/2018 (e) | | | 7,155,000 | | | | 7,154,115 | | |
2.21%, 11/5/2018 (e) | | | 13,963,000 | | | | 13,958,665 | | |
Hitachi America Capital Ltd.
2.37%, 11/1/2018 (e) | | | 60,353,000 | | | | 60,349,023 | | |
IBM Credit LLC
2.19%, 11/28/2018 (e) | | | 13,183,000 | | | | 13,159,663 | | |
International Business Machines Corp.
2.24%, 12/19/2018 (e) | | | 16,429,000 | | | | 16,377,479 | | |
Kreditanstalt fuer Wiederaufbau
2.13%, 11/5/2018 (e) | | | 12,474,000 | | | | 12,470,085 | | |
2.16%, 11/13/2018 (e) | | | 10,404,000 | | | | 10,395,509 | | |
LVMH Moet Hennessy Louis Vuitton, Inc.
2.35%, 12/18/2018 (e) | | | 7,809,000 | | | | 7,784,240 | | |
MetLife Short Term Funding LLC
2.21%, 11/2/2018 (e) | | | 15,314,000 | | | | 15,312,105 | | |
2.13%, 11/8/2018 (e) | | | 26,365,000 | | | | 26,351,864 | | |
2.25%, 12/10/2018 (e) | | | 14,912,000 | | | | 14,873,676 | | |
2.29%, 12/17/2018 (e) | | | 9,761,000 | | | | 9,731,295 | | |
2.43%, 1/7/2019 (e) | | | 17,765,000 | | | | 17,683,694 | | |
First Eagle Funds | Annual Report | October 31, 2018
47
First Eagle Overseas Fund | Consolidated Schedule of Investments | October 31, 2018
Investments | | Principal Amount ($) | | Value ($) | |
Commercial Paper — 12.9% (continued) | |
Nestle Capital Corp.
2.13%, 11/1/2018 (e) | | | 11,161,000 | | | | 11,160,320 | | |
2.13%, 11/2/2018 (e) | | | 9,763,000 | | | | 9,761,810 | | |
2.31%, 11/13/2018 (e) | | | 19,135,000 | | | | 19,119,743 | | |
2.31%, 11/14/2018 (e) | | | 12,848,000 | | | | 12,836,963 | | |
2.10%, 11/20/2018 (e) | | | 11,394,000 | | | | 11,379,948 | | |
Nestle Finance International Ltd.
2.24%, 12/14/2018 (e) | | | 16,662,000 | | | | 16,614,774 | | |
Novartis Finance Corp.
2.27%, 12/12/2018 (e) | | | 20,393,000 | | | | 20,338,564 | | |
NRW Bank
2.16%, 11/5/2014 (e) | | | 10,025,000 | | | | 10,021,903 | | |
2.14%, 11/1/2018 (e) | | | 13,892,000 | | | | 13,891,147 | | |
Pfizer, Inc.
2.16%, 12/13/2018 (e) | | | 9,166,000 | | | | 9,140,928 | | |
2.30%, 1/10/2019 (e) | | | 32,126,000 | | | | 31,977,422 | | |
2.30%, 1/14/2019 (e) | | | 28,791,000 | | | | 28,650,044 | | |
Philip Morris International, Inc.
2.20%, 11/13/2018 (e) | | | 13,433,000 | | | | 13,422,071 | | |
2.20%, 11/15/2018 (e) | | | 13,433,000 | | | | 13,420,350 | | |
2.20%, 11/16/2018 (e) | | | 19,770,000 | | | | 19,750,125 | | |
2.18%, 11/21/2018 (e) | | | 35,241,000 | | | | 35,194,294 | | |
Praxair, Inc.
2.18%, 11/9/2018 (e) | | | 31,717,000 | | | | 31,699,381 | | |
Procter & Gamble Co. (The)
2.26%, 1/7/2019 (e) | | | 12,587,000 | | | | 12,531,413 | | |
Province of Quebec Canada
2.04%, 11/6/2018 (e) | | | 36,839,000 | | | | 36,825,443 | | |
2.04%, 11/7/2018 (e) | | | 24,261,000 | | | | 24,250,575 | | |
2.04%, 11/9/2018 (e) | | | 24,398,000 | | | | 24,384,490 | | |
2.10%, 11/15/2018 (e) | | | 19,146,000 | | | | 19,128,210 | | |
2.18%, 12/3/2018 (e) | | | 41,775,000 | | | | 41,688,188 | | |
2.20%, 12/19/2018 (e) | | | 7,913,000 | | | | 7,888,292 | | |
PSP Capital, Inc.
2.21%, 12/3/2018 (e)(f) | | | 19,539,000 | | | | 19,498,379 | | |
2.25%, 12/10/2018 (e)(f) | | | 8,536,000 | | | | 8,514,309 | | |
2.37%, 1/11/2019 (e)(f) | | | 14,021,000 | | | | 13,953,755 | | |
First Eagle Funds | Annual Report | October 31, 2018
48
First Eagle Overseas Fund | Consolidated Schedule of Investments | October 31, 2018
Investments | | Principal Amount ($) | | Value ($) | |
Commercial Paper — 12.9% (continued) | |
QUALCOMM, Inc.
2.32%, 12/5/2018 (e) | | | 28,149,000 | | | | 28,083,593 | | |
Roche Holdings, Inc.
2.21%, 11/20/2018 (e) | | | 17,134,000 | | | | 17,112,678 | | |
Rockwell Automation, Inc.
2.46%, 1/10/2019 (e) | | | 21,447,000 | | | | 21,340,620 | | |
Sanofi
2.32%, 11/16/2018 (e) | | | 5,997,000 | | | | 5,991,051 | | |
2.24%, 12/14/2018 (e) | | | 61,281,000 | | | | 61,107,159 | | |
2.25%, 12/17/2018 (e) | | | 24,622,000 | | | | 24,547,102 | | |
Siemens Capital Co. LLC
2.24%, 12/3/2018 (e) | | | 27,549,000 | | | | 27,492,812 | | |
Total Capital Canada Ltd.
2.16%, 11/6/2018 (e) | | | 37,749,000 | | | | 37,735,077 | | |
2.23%, 12/4/2018 (e) | | | 8,520,000 | | | | 8,501,179 | | |
2.27%, 12/6/2018 (e) | | | 24,477,000 | | | | 24,419,626 | | |
2.36%, 1/3/2019 (e) | | | 41,302,000 | | | | 41,125,852 | | |
2.36%, 1/4/2019 (e) | | | 13,277,000 | | | | 13,219,418 | | |
2.36%, 1/16/2019 (e) | | | 11,441,000 | | | | 11,381,535 | | |
Unilever Capital Corp.
2.15%, 11/26/2018 (e) | | | 23,682,000 | | | | 23,643,140 | | |
Total Commercial Paper
(Cost $1,876,255,997) | | | 1,876,006,860 | | |
| | | Shares | | | |
Investment Companies — 0.0% (d) | |
JP Morgan U.S. Government Money Market Fund,
Agency Shares 1.98% (g)
(Cost $103,474) | | | 103,474 | | | | 103,474 | | |
Total Short-Term Investments
(Cost $1,876,359,471) | | | 1,876,110,334 | | |
Total Investments — 98.7%
(Cost $11,836,520,462) | | | 14,363,048,047 | | |
Other Assets Less Liabilities — 1.3% | | | 184,378,867 | | |
Net Assets — 100.0% | | | 14,547,426,914 | | |
* Non-income producing security.
‡ Value determined using significant unobservable inputs.
(a) Affiliated company as defined under the Investment Company Act of 1940.
First Eagle Funds | Annual Report | October 31, 2018
49
First Eagle Overseas Fund | Consolidated Schedule of Investments | October 31, 2018
(b) Security fair valued as of October 31, 2018 in accordance with procedures approved by the Board of Trustees. Total value of all such securities at October 31, 2018 amounted to $49,124,497, which represents approximately 0.34% of net assets of the Fund.
(c) Represents a security that is subject to legal or contractual restrictions on resale.
(d) Represents less than 0.05% of net assets.
(e) The rate shown was the current yield as of October 31, 2018.
(f) Securities exempt from registration under Rule 144A or section 4(a)(2), of the Securities Act of 1933. Under procedures approved by the Board of Trustees, such securities have been determined to be liquid by the investment adviser and may be resold, normally to qualified institutional buyers in transactions exempt from registration.
(g) Represents 7-day effective yield as of October 31, 2018.
As of October 31, 2018, the gross unrealized appreciation (depreciation) of investments based on the aggregate cost of investment securities and derivative instruments, if applicable, for federal income tax purposes was as follows:
Aggregate gross unrealized appreciation | | $ | 3,362,344,134 | | |
Aggregate gross unrealized depreciation | | | (1,494,177,315 | ) | |
Net unrealized appreciation | | $ | 1,868,166,819 | | |
Federal income tax cost | | $ | 12,532,610,665 | | |
Restricted Securities | | Acquisition Date | | Cost | | Carrying Value
Per
Share/Principal | |
Legris Industries SA | | 04/30/04 | | $ | 23,433,066 | | | $ | 30.63 | | |
Forward Foreign Currency Exchange Contracts outstanding as of October 31, 2018
Currency
Purchased | | Currency Sold | | Counterparty | | Settlement
Date | | Unrealized
Appreciation
(Depreciation) | |
USD | 252,666,339 | | | EUR | 211,844,000 | | | Goldman Sachs | | 11/14/2018 | | $ | 12,496,365 | | |
USD | 32,350,463 | | | GBP | 23,950,000 | | | Goldman Sachs | | 11/14/2018 | | | 1,721,813 | | |
USD | 146,966,088 | | | JPY | 15,986,971,000 | | | Goldman Sachs | | 11/14/2018 | | | 5,160,839 | | |
USD | 84,540,650 | | | EUR | 71,299,000 | | | JPMorgan Chase Bank | | 12/12/2018 | | | 3,498,527 | | |
USD | 18,501,068 | | | GBP | 13,885,000 | | | JPMorgan Chase Bank | | 12/12/2018 | | | 717,786 | | |
USD | 181,064,095 | | | JPY | 19,989,114,000 | | | JPMorgan Chase Bank | | 12/12/2018 | | | 3,315,617 | | |
USD | 25,629,403 | | | EUR | 21,842,000 | | | UBS AG | | 01/16/2019 | | | 710,576 | | |
USD | 44,372,377 | | | GBP | 34,201,000 | | | UBS AG | | 01/16/2019 | | | 474,882 | | |
USD | 34,249,464 | | | JPY | 3,753,570,000 | | | UBS AG | | 01/16/2019 | | | 751,596 | | |
USD | 86,113,017 | | | EUR | 72,821,000 | | | HSBC Bank plc | | 02/13/2019 | | | 2,822,142 | | |
USD | 21,989,520 | | | GBP | 16,673,000 | | | HSBC Bank plc | | 02/13/2019 | | | 558,721 | | |
USD | 116,386,688 | | | JPY | 12,864,046,000 | | | HSBC Bank plc | | 02/13/2019 | | | 1,318,362 | | |
USD | 101,385,176 | | | EUR | 85,916,000 | | | Bank of New York Mellon | | 05/15/2019 | | | 2,329,046 | | |
USD | 22,491,224 | | | GBP | 16,817,000 | | | Bank of New York Mellon | | 05/15/2019 | | | 779,052 | | |
USD | 180,830,853 | | | JPY | 19,943,654,000 | | | Bank of New York Mellon | | 05/15/2019 | | | 1,074,113 | | |
Net unrealized appreciation | | | | | | | | $ | 37,729,437 | | |
First Eagle Funds | Annual Report | October 31, 2018
50
First Eagle Overseas Fund | Consolidated Schedule of Investments | October 31, 2018
Abbreviations
ADR — American Depositary Receipt
CVA — Dutch Certification
EUR — Euro
GBP — British Pound
IDR — Indonesian Rupiah
JPY — Japanese Yen
MXN — Mexican Peso
MYR — Malaysian Ringgit
NVDR — Non-Voting Depositary Receipt
PJSC — Public Joint Stock Company
PLN — Polish Zloty
Preference — A special type of equity investment that shares in the earnings of the company, has limited voting rights, and may have a dividend preference. Preference shares may also have liquidation preference.
SGD — Singapore Dollar
USD — United States Dollar
Affiliated Securities
Security Description | | Shares at
October 31, 2018 | | Market Value
October 31, 2017 | | Purchases at
Cost | | Proceeds from
Sales | |
As One Corp. | | | 1,183,340 | | | $ | 71,451,190 | | | $ | — | | | $ | (8,082,034 | ) | |
Chofu Seisakusho
Co. Ltd. | | | 1,842,500 | | | | 45,665,265 | | | | — | | | | (673,830 | ) | |
Emin Leydier SA^ | | | — | | | | 51,993,413 | | | | — | | | | (72,582,815 | ) | |
Fursys, Inc. | | | 872,463 | | | | 26,243,587 | | | | — | | | | — | | |
Haw Par Corp. Ltd. | | | 23,079,313 | | | | 228,338,184 | | | | — | | | | (24,029,106 | ) | |
Laurent-Perrier | | | 558,938 | | | | 52,418,364 | | | | — | | | | — | | |
Legris Industries
SA*‡ (b)(c) | | | 905,366 | | | | 34,348,829 | | | | — | | | | — | | |
Maezawa Kasei
Industries Co. Ltd. | | | 837,200 | | | | 12,682,521 | | | | — | | | | (3,389,190 | ) | |
Robertet SA | | | 191,299 | | | | 108,188,782 | | | | — | | | | (21,655,306 | ) | |
Total | | | | $ | 631,330,135 | | | $ | — | | | $ | (130,412,281 | ) | |
First Eagle Funds | Annual Report | October 31, 2018
51
First Eagle Overseas Fund | Consolidated Schedule of Investments | October 31, 2018
Affiliated Securities (continued)
Security Description | | Net Realized
Gain
(Loss) | | Change in
Unrealized
Appreciation/
(Depreciation) | | Market Value
October 31,
2018 | | Dividend/
Interest
Income | | Capital Gain
Distributions | |
As One Corp. | | $ | 5,223,569 | | | $ | 15,644,196 | | | $ | 84,236,921 | | | $ | 1,399,581 | | | $ | — | | |
Chofu Seisakusho
Co. Ltd. | | | 55,274 | | | | (7,739,168 | ) | | | 37,307,541 | | | | 478,439 | | | | — | | |
Emin Leydier SA^ | | | 63,324,560 | | | | (42,735,158 | ) | | | — | | | | 64,494 | | | | — | | |
Fursys, Inc. | | | — | | | | (3,734,340 | ) | | | 22,509,247 | | | | 508,865 | | | | — | | |
Haw Par Corp. Ltd. | | | 12,693,125 | | | | (2,896,025 | ) | | | 214,106,178 | | | | 4,605,950 | | | | — | | |
Laurent-Perrier | | | — | | | | 4,888,819 | | | | 57,307,183 | | | | 581,408 | | | | — | | |
Legris Industries
SA*‡ (b)(c) | | | — | | | | (6,620,316 | ) | | | 27,728,513 | | | | — | | | | — | | |
Maezawa Kasei
Industries Co. Ltd. | | | (961,045 | ) | | | (1,413 | ) | | | 8,330,873 | | | | 218,825 | | | | — | | |
Robertet SA | | | 15,663,038 | | | | 11,341,082 | | | | 113,537,596 | | | | 1,008,761 | | | | — | | |
Total | | $ | 95,998,521 | | | $ | (31,852,323 | ) | | $ | 565,064,052 | | | $ | 8,866,323 | | | $ | — | | |
* Non-income producing security.
^ Represents an unaffiliated issuer as of October 31, 2018.
‡ Value determined using significant unobservable inputs.
(b) Security fair valued as of October 31, 2018 in accordance with procedures approved by the Board of Trustees. Total value of all such affiliated securities at October 31, 2018 amounted to $27,728,513, which represents approximately 0.19% of net assets of the Fund.
(c) Represents a security that is subject to legal or contractual restrictions on resale.
See Notes to Financial Statements.
First Eagle Funds | Annual Report | October 31, 2018
52
This page was intentionally left blank.
First Eagle U.S. Value Fund
Data as of October 31, 2018 (unaudited)
Investment Objective
The First Eagle U.S. Value Fund seeks long-term growth of capital by investing, under normal market conditions, at least 80% of its net assets (plus any borrowings for investment purposes) in domestic equity and debt securities. Management utilizes a highly disciplined, bottom-up, value-oriented approach in seeking to achieve its investment objective.
Average Annual Returns^ (%) | | | | | | One-Year | | Five-Years | | Ten-Years | |
First Eagle U.S. Value Fund | | Class A | | without sales charge | | | 2.01 | | | | 6.30 | | | | 9.37 | | |
| | | | with sales charge | | | -3.10 | | | | 5.21 | | | | 8.81 | | |
S&P 500 Index | | | | | | | 7.35 | | | | 11.34 | | | | 13.24 | | |
Consumer Price Index | | | | | | | 2.52 | | | | 1.61 | | | | 1.56 | | |

Sectors* (%)
Financials | | | 16.3 | | |
Information Technology | | | 12.2 | | |
Commodities | | | 10.0 | | |
Energy | | | 9.2 | | |
Industrials | | | 9.1 | | |
Communication Services | | | 7.9 | | |
Materials | | | 5.3 | | |
Health Care | | | 4.3 | | |
Consumer Staples | | | 3.1 | | |
Real Estate | | | 2.6 | | |
Consumer Discretionary | | | 1.7 | | |
Utilities | | | 0.7 | | |
Short-Term Investments | | | 17.6 | | |
^Performance figures reflect certain fee waivers and/or expense limitations, without which returns may have been lower.
*Asset Allocation and Sector percentages are based on total investments in the portfolio.
The Fund's portfolio composition is subject to change at any time.
First Eagle Funds | Annual Report | October 31, 2018
54
First Eagle U.S. Value Fund | Fund Overview | October 31, 2018
Growth of a $10,000 Initial Investment
Performance data quoted herein represents past performance and should not be considered indicative of future results. Performance data quoted herein does not reflect the deduction of taxes that a shareholder would pay on Fund distributions or the sale of Fund shares. The average annual returns shown above are historical and reflect changes in share price, reinvested dividends and are net of expenses.
The average annual returns for Class A shares give effect to the deduction of the maximum sales charge of 5.00%.
The S&P 500 Index is a widely recognized unmanaged index including a representative sample of 500 leading companies in leading sectors of the U.S. economy. Although the S&P 500 Index focuses on the large-cap segment of the market, with approximately 80% coverage of U.S. equities, it is also considered a proxy for the total market. The S&P 500 Index includes dividends reinvested. One cannot invest directly in an index. The Consumer Price Index (CPI) represents the change in price of all goods and services purchased for consumption by urban households.
Top 10 Holdings* (%)
Gold bullion** (Precious Metal) | | | 9.9 | | |
Oracle Corp. (Software, United States) | | | 4.4 | | |
Omnicom Group, Inc. (Media, United States) | | | 3.2 | | |
Comcast Corp. (Media, United States) | | | 3.0 | | |
Weyerhaeuser Co. (Equity Real Estate Investment Trusts (REITs), United States) | | | 2.6 | | |
Alleghany Corp. (Insurance, United States) | | | 2.5 | | |
Schlumberger Ltd. (Energy Equipment & Services, United States) | | | 2.3 | | |
Teradata Corp. (IT Services, United States) | | | 2.3 | | |
Flowserve Corp. (Machinery, United States) | | | 2.0 | | |
BB&T Corp. (Banks, United States) | | | 2.0 | | |
Total | | | 34.2 | | |
* Holdings in cash, commercial paper and other short-term cash equivalents have been excluded.
**The Fund invests in gold and precious metals through investment in a wholly-owned subsidiary of the Fund organized under the laws of the Cayman Islands (the "Subsidiary"). Gold bullion and commodities include the Fund's investment in the Subsidiary.
Percentages are based on total net assets.
First Eagle Funds | Annual Report | October 31, 2018
55
First Eagle U.S. Value Fund | Consolidated Schedule of Investments | October 31, 2018
Investments | | Shares | | Value ($) | |
Common Stocks — 70.4% | |
Air Freight & Logistics — 1.1% | |
CH Robinson Worldwide, Inc. | | | 230,405 | | | | 20,512,957 | | |
Banks — 3.5% | |
BB&T Corp. | | | 729,608 | | | | 35,867,529 | | |
US Bancorp | | | 520,595 | | | | 27,211,501 | | |
| | | | 63,079,030 | | |
Capital Markets — 1.9% | |
Bank of New York Mellon Corp. (The) | | | 728,362 | | | | 34,473,373 | | |
Chemicals — 2.0% | |
Linde plc (United Kingdom) | | | 60,413 | | | | 9,996,539 | | |
Nutrien Ltd. (Canada) | | | 396,349 | | | | 20,978,753 | | |
Scotts Miracle-Gro Co. (The) | | | 88,434 | | | | 5,902,085 | | |
| | | | 36,877,377 | | |
Commercial Services & Supplies — 0.3% | |
Cintas Corp. | | | 32,805 | | | | 5,966,245 | | |
Consumer Finance — 2.6% | |
American Express Co. | | | 287,462 | | | | 29,530,971 | | |
Synchrony Financial | | | 637,111 | | | | 18,399,766 | | |
| | | | 47,930,737 | | |
Diversified Consumer Services — 0.4% | |
H&R Block, Inc. | | | 300,081 | | | | 7,964,150 | | |
Diversified Financial Services — 1.1% | |
Berkshire Hathaway, Inc., Class A* | | | 66 | | | | 20,308,530 | | |
Electronic Equipment, Instruments & Components — 0.4% | |
IPG Photonics Corp.* | | | 49,932 | | | | 6,668,419 | | |
Energy Equipment & Services — 5.2% | |
National Oilwell Varco, Inc. | | | 912,708 | | | | 33,587,654 | | |
Schlumberger Ltd. | | | 822,654 | | | | 42,210,377 | | |
TechnipFMC plc (United Kingdom) | | | 710,652 | | | | 18,690,148 | | |
| | | | 94,488,179 | | |
Equity Real Estate Investment Trusts (REITs) — 2.6% | |
Weyerhaeuser Co. | | | 1,773,946 | | | | 47,240,182 | | |
Gas Utilities — 0.7% | |
UGI Corp. | | | 241,735 | | | | 12,826,459 | | |
First Eagle Funds | Annual Report | October 31, 2018
56
First Eagle U.S. Value Fund | Consolidated Schedule of Investments | October 31, 2018
Investments | | Shares | | Value ($) | |
Health Care Equipment & Supplies — 1.5% | |
DENTSPLY SIRONA, Inc. | | | 269,147 | | | | 9,320,561 | | |
Varian Medical Systems, Inc.* | | | 145,469 | | | | 17,364,634 | | |
| | | | 26,685,195 | | |
Health Care Providers & Services — 2.8% | |
Anthem, Inc. | | | 101,140 | | | | 27,871,150 | | |
HCA Healthcare, Inc. | | | 85,014 | | | | 11,351,919 | | |
Universal Health Services, Inc., Class B | | | 104,421 | | | | 12,693,417 | | |
| | | | 51,916,486 | | |
Household Products — 1.6% | |
Colgate-Palmolive Co. | | | 492,096 | | | | 29,304,317 | | |
Industrial Conglomerates — 1.6% | |
3M Co. | | | 155,288 | | | | 29,545,095 | | |
Insurance — 6.5% | |
Alleghany Corp. | | | 75,164 | | | | 45,149,512 | | |
Brown & Brown, Inc. | | | 538,007 | | | | 15,161,037 | | |
Cincinnati Financial Corp. | | | 124,524 | | | | 9,792,567 | | |
Travelers Cos., Inc. (The) | | | 32,220 | | | | 4,031,689 | | |
Willis Towers Watson plc | | | 161,294 | | | | 23,090,849 | | |
WR Berkley Corp. | | | 282,471 | | | | 21,439,549 | | |
| | | | 118,665,203 | | |
Interactive Media & Services — 1.8% | |
Alphabet, Inc., Class A* | | | 7,298 | | | | 7,959,053 | | |
Alphabet, Inc., Class C* | | | 9,165 | | | | 9,868,597 | | |
Facebook, Inc., Class A* | | | 92,579 | | | | 14,052,566 | | |
| | | | 31,880,216 | | |
Internet & Direct Marketing Retail — 0.4% | |
Booking Holdings, Inc.* | | | 3,998 | | | | 7,494,571 | | |
IT Services — 3.1% | |
Mastercard, Inc., Class A | | | 34,640 | | | | 6,847,289 | | |
Teradata Corp.* | | | 1,158,000 | | | | 42,151,200 | | |
Visa, Inc., Class A | | | 50,475 | | | | 6,957,978 | | |
| | | | 55,956,467 | | |
Leisure Products — 0.2% | |
Vista Outdoor, Inc.* | | | 326,357 | | | | 4,079,462 | | |
First Eagle Funds | Annual Report | October 31, 2018
57
First Eagle U.S. Value Fund | Consolidated Schedule of Investments | October 31, 2018
Investments | | Shares | | Value ($) | |
Machinery — 4.1% | |
Cummins, Inc. | | | 91,841 | | | | 12,553,746 | | |
Deere & Co. | | | 188,587 | | | | 25,542,223 | | |
Flowserve Corp. | | | 802,902 | | | | 36,853,202 | | |
| | | | 74,949,171 | | |
Media — 6.2% | |
Comcast Corp., Class A | | | 1,416,586 | | | | 54,028,590 | | |
Omnicom Group, Inc. | | | 787,030 | | | | 58,492,070 | | |
| | | | 112,520,660 | | |
Metals & Mining — 3.2% | |
Agnico Eagle Mines Ltd. (Canada) | | | 205,280 | | | | 7,250,955 | | |
Barrick Gold Corp. (Canada) | | | 787,213 | | | | 9,879,523 | | |
Franco-Nevada Corp. (Canada) | | | 135,713 | | | | 8,476,071 | | |
Goldcorp, Inc. (Canada) | | | 353,962 | | | | 3,192,737 | | |
Newcrest Mining Ltd. (Australia) | | | 758,581 | | | | 11,104,271 | | |
Newmont Mining Corp. | | | 231,844 | | | | 7,168,617 | | |
Randgold Resources Ltd., ADR (Africa) | | | 21,756 | | | | 1,708,716 | | |
Royal Gold, Inc. | | | 121,921 | | | | 9,342,806 | | |
Tahoe Resources, Inc.* | | | 325,000 | | | | 767,785 | | |
| | | | 58,891,481 | | |
Oil, Gas & Consumable Fuels — 3.7% | |
Canadian Natural Resources Ltd. (Canada) | | | 142,767 | | | | 3,917,159 | | |
ConocoPhillips | | | 174,862 | | | | 12,222,854 | | |
Devon Energy Corp. | | | 185,963 | | | | 6,025,201 | | |
Exxon Mobil Corp. | | | 417,478 | | | | 33,264,647 | | |
Imperial Oil Ltd. (Canada) | | | 297,287 | | | | 9,285,914 | | |
San Juan Basin Royalty Trust | | | 595,832 | | | | 3,044,702 | | |
| | | | 67,760,477 | | |
Road & Rail — 1.7% | |
Union Pacific Corp. | | | 211,561 | | | | 30,934,449 | | |
Semiconductors & Semiconductor Equipment — 2.1% | |
Analog Devices, Inc. | | | 156,714 | | | | 13,118,529 | | |
Texas Instruments, Inc. | | | 133,715 | | | | 12,412,764 | | |
Xilinx, Inc. | | | 149,952 | | | | 12,801,402 | | |
| | | | 38,332,695 | | |
First Eagle Funds | Annual Report | October 31, 2018
58
First Eagle U.S. Value Fund | Consolidated Schedule of Investments | October 31, 2018
Investments | | Shares | | Value ($) | |
Software — 5.9% | |
Microsoft Corp. | | | 253,089 | | | | 27,032,436 | | |
Oracle Corp. | | | 1,667,597 | | | | 81,445,438 | | |
| | | | 108,477,874 | | |
Specialty Retail — 0.6% | |
Tiffany & Co. | | | 101,855 | | | | 11,336,461 | | |
Tobacco — 1.4% | |
Philip Morris International, Inc. | | | 299,258 | | | | 26,355,652 | | |
Trading Companies & Distributors — 0.2% | |
NOW, Inc.* | | | 293,998 | | | | 3,774,934 | | |
Total Common Stocks
(Cost $871,175,104) | | | 1,287,196,504 | | |
| | | Ounces | | | |
Commodities — 9.9% | |
Gold bullion*
(Cost $178,239,069) | | | 149,594 | | | | 181,952,654 | | |
| | | Principal Amount ($) | | | |
Corporate Bonds — 1.8% | |
Banks — 0.7% | |
Wachovia Capital Trust III
(ICE LIBOR USD 3 Month + 0.93%, 5.57% Floor),
5.57%, 12/6/2018 (a)(b) | | | 12,404,000 | | | | 12,093,900 | | |
Health Care Equipment & Supplies — 0.0% (c) | |
Bausch & Lomb, Inc.
7.13%, 8/1/2028‡ | | | 600,000 | | | | 595,500 | | |
Oil, Gas & Consumable Fuels — 0.4% | |
CITGO Petroleum Corp.
6.25%, 8/15/2022 (d) | | | 6,542,000 | | | | 6,443,870 | | |
Software — 0.7% | |
Veritas US, Inc.
7.50%, 2/1/2023 (d) | | | 4,945,000 | | | | 4,685,388 | | |
10.50%, 2/1/2024 (d) | | | 10,198,000 | | | | 8,770,280 | | |
| | | | 13,455,668 | | |
Total Corporate Bonds
(Cost $32,726,499) | | | 32,588,938 | | |
First Eagle Funds | Annual Report | October 31, 2018
59
First Eagle U.S. Value Fund | Consolidated Schedule of Investments | October 31, 2018
Investments | | Principal Amount ($) | | Value ($) | |
Short-Term Investments — 17.6% | |
Commercial Paper — 4.0% | |
Anthem, Inc.
2.35%, 11/1/2018 (e) | | | 1,124,000 | | | | 1,123,927 | | |
Engie SA (France)
2.13%, 11/23/2018 (e) | | | 6,377,000 | | | | 6,367,890 | | |
2.23%, 12/7/2018 (e) | | | 7,720,000 | | | | 7,702,036 | | |
Eni Finance USA, Inc. (Italy)
2.37%, 11/1/2018 (e) | | | 1,674,000 | | | | 1,673,890 | | |
Exxon Mobil Corp.
2.20%, 12/4/2018 (e) | | | 4,019,000 | | | | 4,010,448 | | |
Hitachi America Capital Ltd.
2.37%, 11/1/2018 (e) | | | 6,168,000 | | | | 6,167,594 | | |
Philip Morris International, Inc.
2.20%, 11/13/2018 (e) | | | 3,656,000 | | | | 3,653,026 | | |
2.20%, 11/15/2018 (e) | | | 3,656,000 | | | | 3,652,557 | | |
2.20%, 11/16/2018 (e) | | | 6,504,000 | | | | 6,497,461 | | |
2.18%, 11/21/2018 (e) | | | 11,594,000 | | | | 11,578,634 | | |
Praxair, Inc.
2.18%, 11/9/2018 (e) | | | 10,434,000 | | | | 10,428,204 | | |
QUALCOMM, Inc.
2.32%, 12/5/2018 (e) | | | 6,380,000 | | | | 6,365,175 | | |
Siemens Capital Co. LLC (Germany)
2.23%, 12/3/2018 (e) | | | 3,234,000 | | | | 3,227,404 | | |
Total Commercial Paper
(Cost $72,455,505) | | | 72,448,246 | | |
| | | Shares | | | |
Investment Companies — 0.0% (c) | |
JP Morgan U.S. Government Money Market Fund,
Agency Shares, 1.98% (f)
(Cost $43,272) | | | 43,272 | | | | 43,272 | | |
First Eagle Funds | Annual Report | October 31, 2018
60
First Eagle U.S. Value Fund | Consolidated Schedule of Investments | October 31, 2018
Investments | | Principal Amount ($) | | Value ($) | |
U.S. Treasury Obligations — 13.6% | |
U.S. Treasury Bills
1.98%, 11/1/2018 (e) | | | 30,000,000 | | | | 30,000,000 | | |
1.98%, 11/8/2018 (e) | | | 20,000,000 | | | | 19,991,872 | | |
2.03%, 11/15/2018 (e) | | | 50,000,000 | | | | 49,958,924 | | |
2.08%, 11/29/2018 (e) | | | 40,000,000 | | | | 39,932,761 | | |
2.02%, 12/6/2018 (e) | | | 20,000,000 | | | | 19,958,535 | | |
2.04%, 12/13/2018 (e) | | | 30,000,000 | | | | 29,924,925 | | |
2.13%, 12/20/2018 (e) | | | 30,000,000 | | | | 29,912,208 | | |
2.22%, 1/3/2019 (e) | | | 30,000,000 | | | | 29,883,909 | | |
Total U.S. Treasury Obligations
(Cost $249,576,276) | | | 249,563,134 | | |
Total Short-Term Investments
(Cost $322,075,053) | | | 322,054,652 | | |
Total Investments — 99.7%
(Cost $1,404,215,725) | | | 1,823,792,748 | | |
Other Assets Less Liabilities — 0.3% | | | 5,385,537 | | |
Net Assets — 100.0% | | | 1,829,178,285 | | |
* Non-income producing security.
‡ Value determined using significant unobservable inputs.
(a) Perpetual security. The rate reflected was the rate in effect on October 31, 2018. The maturity date reflects the next call date.
(b) Variable or floating rate security, linked to the referenced benchmark. The interest rate shown is the rate in effect as of October 31, 2018.
(c) Represents less than 0.05% of net assets.
(d) Securities exempt from registration under Rule 144A or section 4(a)(2), of the Securities Act of 1933. Under procedures approved by the Board of Trustees, such securities have been determined to be liquid by the investment adviser and may be resold, normally to qualified institutional buyers in transactions exempt from registration.
(e) The rate shown was the current yield as of October 31, 2018.
(f) Represents 7-day effective yield as of October 31, 2018.
Abbreviations
ADR — American Depositary Receipt
ICE — Intercontinental Exchange
LIBOR — London Interbank Offered Rate
USD — United States Dollar
First Eagle Funds | Annual Report | October 31, 2018
61
First Eagle U.S. Value Fund | Consolidated Schedule of Investments | October 31, 2018
As of October 31, 2018, the gross unrealized appreciation (depreciation) of investments based on the aggregate cost of investment securities and derivative instruments, if applicable, for federal income tax purposes was as follows:
Aggregate gross unrealized appreciation | | $ | 488,583,287 | | |
Aggregate gross unrealized depreciation | | | (64,722,302 | ) | |
Net unrealized appreciation | | $ | 423,860,985 | | |
Federal income tax cost | | $ | 1,399,931,763 | | |
See Notes to Financial Statements.
First Eagle Funds | Annual Report | October 31, 2018
62
This page was intentionally left blank.
Data as of October 31, 2018 (unaudited)
Investment Objective
The First Eagle Gold Fund is a non-diversified fund. The Fund's investment objective seeks to provide investors the opportunity to participate in the investment characteristics of gold (and to a limited extent other precious metals) for a portion of their overall investment portfolio. In seeking to achieve its objective, the Fund invests at least 80% of its net assets (plus any borrowings for investment purposes) in gold, and/or securities (which may include both equity and, to a limited extent, debt instruments) directly related to gold or issuers principally engaged in the gold industry.
Average Annual Returns (%) | | | | | | One-Year | | Five-Years | | Ten-Years | |
First Eagle Gold Fund | | Class A | | without sales load | | | -20.73 | | | | -5.14 | | | | 0.44 | | |
| | | | with sales load | | | -24.70 | | | | -6.11 | | | | -0.07 | | |
FTSE Gold Mines Index | | | | | | | -16.57 | | | | -4.85 | | | | -2.02 | | |
MSCI World Index | | | | | | | 1.16 | | | | 6.81 | | | | 10.02 | | |
Consumer Price Index | | | | | | | 2.52 | | | | 1.61 | | | | 1.56 | | |
Sectors* (%)
Materials | | | 75.1 | | |
Commodities | | | 22.6 | | |
Short-Term Investments | | | 2.3 | | |
Countries*~ (%)
Canada | | | 43.3 | | |
United States | | | 34.2 | | |
Mexico | | | 7.1 | | |
Australia | | | 6.6 | | |
Africa | | | 4.9 | | |
South Africa | | | 1.6 | | |
Short-Term Investments | | | 2.3 | | |
^Less than 0.05%
*Asset Allocation, Sector and Countries percentages are based on total investments in the portfolio.
~Country allocations reflect country of risk (not currency of issue). Bonds of non-U.S. issuers may be U.S. dollar denominated.
The Fund's portfolio composition is subject to change at any time.
First Eagle Funds | Annual Report | October 31, 2018
64
First Eagle Gold Fund | Fund Overview
Growth of a $10,000 Initial Investment
Performance data quoted herein represents past performance and should not be considered indicative of future results. Performance data quoted herein does not reflect the deduction of taxes that a shareholder would pay on Fund distributions or the sale of Fund shares. The average annual returns shown above are historical and reflect changes in share price, reinvested dividends and are net of expenses.
The average annual returns for Class A shares give effect to the deduction of the maximum sales charge of 5.00%.
The MSCI World Index is a widely followed, unmanaged group of stocks from 23 developed international markets. The index provides total returns in U.S. dollars with dividends reinvested. The FTSE Gold Mines Index is designed to reflect the performance of the worldwide market in the shares of companies whose principal activity is the mining of gold. The FTSE Gold Mines Index encompasses all gold mining companies that have a sustainable, attributable gold production of at least 300,000 ounces a year and that derive 51% or more of their revenue from mined gold. The index is unmanaged, is available with dividends reinvested. One cannot invest directly in an index. The Consumer Price Index (CPI) represents the change in price of all goods and services purchased for consumption by urban households.
Top 10 Holdings* (%)
Gold bullion** (Precious Metal) | | | 16.8 | | |
Newcrest Mining Ltd. (Metals & Mining, Australia) | | | 6.1 | | |
Silver bullion** (Precious Metal) | | | 5.9 | | |
Barrick Gold Corp. (Metals & Mining, Canada) | | | 5.4 | | |
Wheaton Precious Metals Corp. (Metals & Mining, Canada) | | | 5.3 | | |
Royal Gold, Inc. (Metals & Mining, United States) | | | 4.9 | | |
Randgold Resources Ltd. (Metals & Mining, Africa) | | | 4.9 | | |
Newmont Mining Corp. (Metals & Mining, United States) | | | 4.9 | | |
Franco-Nevada Corp. (Metals & Mining, Canada) | | | 4.7 | | |
Agnico Eagle Mines Ltd. (Metals & Mining, Canada) | | | 4.6 | | |
Total | | | 63.5 | | |
* Holdings in cash, commercial paper and other short-term cash equivalents have been excluded.
**The Fund invests in gold and precious metals through investment in a wholly-owned subsidiary of the Fund organized under the laws of the Cayman Islands (the "Subsidiary"). Gold bullion and commodities include the Fund's investment in the Subsidiary.
Percentages are based on total net assets.
First Eagle Funds | Annual Report | October 31, 2018
65
First Eagle Gold Fund | Consolidated Schedule of Investments | October 31, 2018
Investments | | Shares | | Value ($) | |
Common Stocks — 75.3% | |
Africa — 4.9% | |
Randgold Resources Ltd., ADR | | | 545,974 | | | | 42,880,798 | | |
Australia — 6.6% | |
Newcrest Mining Ltd. | | | 3,631,329 | | | | 53,156,171 | | |
OceanaGold Corp. | | | 1,406,000 | | | | 4,047,811 | | |
| | | | 57,203,982 | | |
Canada — 43.4% | |
Agnico Eagle Mines Ltd. | | | 1,142,787 | | | | 40,365,829 | | |
Alamos Gold, Inc., Class A | | | 2,964,338 | | | | 11,844,292 | | |
B2Gold Corp.* | | | 12,710,500 | | | | 31,379,183 | | |
Barrick Gold Corp. | | | 3,764,173 | | | | 47,240,371 | | |
Detour Gold Corp.* | | | 4,789,049 | | | | 35,323,534 | | |
Dundee Precious Metals, Inc.* | | | 5,355,070 | | | | 13,993,271 | | |
Eldorado Gold Corp.* | | | 4,840,192 | | | | 3,235,496 | | |
Franco-Nevada Corp. | | | 652,710 | | | | 40,765,556 | | |
Goldcorp, Inc. | | | 3,715,245 | | | | 33,511,510 | | |
Guyana Goldfields, Inc.* | | | 1,852,133 | | | | 2,490,239 | | |
Kinross Gold Corp.* | | | 2,797,363 | | | | 7,245,170 | | |
MAG Silver Corp.* | | | 2,710,367 | | | | 19,476,677 | | |
New Gold, Inc.* | | | 6,237,931 | | | | 4,975,371 | | |
Novagold Resources, Inc.* | | | 7,331,809 | | | | 29,547,190 | | |
Orla Mining Ltd.* | | | 2,310,100 | | | | 2,509,357 | | |
Osisko Gold Royalties Ltd. | | | 1,102,197 | | | | 8,439,474 | | |
Wheaton Precious Metals Corp. | | | 2,837,077 | | | | 46,613,175 | | |
| | | | 378,955,695 | | |
Mexico — 7.2% | |
Fresnillo plc | | | 3,473,953 | | | | 37,671,784 | | |
Industrias Penoles SAB de CV | | | 1,756,596 | | | | 24,757,901 | | |
| | | | 62,429,685 | | |
South Africa — 1.6% | |
AngloGold Ashanti Ltd., ADR | | | 1,515,964 | | | | 14,265,221 | | |
First Eagle Funds | Annual Report | October 31, 2018
66
First Eagle Gold Fund | Consolidated Schedule of Investments | October 31, 2018
Investments | | Shares | | Value ($) | |
United States — 11.6% | |
Newmont Mining Corp. | | | 1,358,421 | | | | 42,002,377 | | |
Royal Gold, Inc. | | | 563,506 | | | | 43,181,465 | | |
Tahoe Resources, Inc.* | | | 6,835,667 | | | | 16,148,676 | | |
| | | | 101,332,518 | | |
Total Common Stocks
(Cost $793,653,640) | | | 657,067,899 | | |
| | | Ounces | | | |
Commodities — 22.7% | |
Gold bullion* | | | 120,553 | | | | 146,629,913 | | |
Silver bullion* | | | 3,577,528 | | | | 51,070,641 | | |
Total Commodities
(Cost $145,936,070) | | | 197,700,554 | | |
| | | Number of Warrants | | | |
Warrants — 0.0% (a) | |
Canada — 0.0% (a) | |
Osisko Gold Royalties Ltd., expiring 2/26/2019*
(Cost $81,620) | | | 59,602 | | | | 1,471 | | |
| | | Principal Amount ($) | | | |
Short-Term Investments — 2.3% | |
Commercial Paper — 2.3% | |
Anthem, Inc.
2.35%, 11/1/2018 (b) | | | 2,554,000 | | | | 2,553,833 | | |
Eni Finance USA, Inc.
2.37%, 11/1/2018 (b) | | | 3,807,000 | | | | 3,806,750 | | |
Hitachi America Capital Ltd.
2.37%, 11/1/2018 (b) | | | 14,024,000 | | | | 14,023,076 | | |
Total Commercial Paper
(Cost $20,385,001) | | | 20,383,659 | | |
First Eagle Funds | Annual Report | October 31, 2018
67
First Eagle Gold Fund | Consolidated Schedule of Investments | October 31, 2018
Investments | | Shares | | Value ($) | |
Investment Companies — 0.0% (a) | |
JP Morgan U.S. Government Money Market Fund,
Agency Shares 1.98% (c)
(Cost $66,251) | | | 66,251 | | | | 66,251 | | |
Total Short-Term Investments
(Cost $20,451,252) | | | 20,449,910 | | |
Total Investments — 100.3%
(Cost $960,122,582) | | | 875,219,834 | | |
Liabilities in excess of other assets — (0.3)% | | | (2,260,932 | ) | |
Net Assets — 100.0% | | | 872,958,902 | | |
* Non-income producing security.
(a) Represents less than 0.05% of net assets.
(b) The rate shown was the current yield as of October 31, 2018.
(c) Represents 7-day effective yield as of October 31, 2018.
Abbreviations
ADR — American Depositary Receipt
As of October 31, 2018, the gross unrealized appreciation (depreciation) of investments based on the aggregate cost of investment securities and derivative instruments, if applicable, for federal income tax purposes was as follows:
Aggregate gross unrealized appreciation | | $ | 218,122,242 | | |
Aggregate gross unrealized depreciation | | | (353,191,938 | ) | |
Net unrealized depreciation | | $ | (135,069,696 | ) | |
Federal income tax cost | | $ | 1,010,289,530 | | |
See Notes to Financial Statements.
First Eagle Funds | Annual Report | October 31, 2018
68
This page was intentionally left blank.
First Eagle Global Income Builder Fund
Data as of October 31, 2018 (unaudited)
Investment Objective
The First Eagle Global Income Builder Fund seeks current income generation and long-term growth of capital. Fundamental research drives the identification of income-producing investment opportunities across all market environments.
Average Annual Returns^ (%) | | | | | | One-Year | | Five-Years | | Since
Inception
(05/01/2012) | |
First Eagle Global Income Builder | | Class A | | without sales load | | | -2.64 | | | | 3.62 | | | | 5.43 | | |
| | | | | with sales load | | | -7.48 | | | | 2.56 | | | | 4.59 | | |
Composite Index | | | | | | | 0.01 | | | | 4.93 | | | | 6.31 | | |
MSCI World Index | | | | | | | 1.16 | | | | 6.81 | | | | 9.19 | | |
Bloomberg Barclays U.S. Aggregate Bond Index | | | | | | | -2.05 | | | | 1.83 | | | | 1.68 | | |
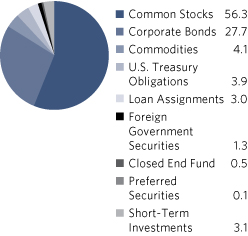
Sectors* (%) | |
Industrials | | | 14.5 | | |
Consumer Staples | | | 14.3 | | |
Financials | | | 11.3 | | |
Energy | | | 8.4 | | |
Health Care | | | 7.8 | | |
Materials | | | 7.4 | | |
Information Technology | | | 7.0 | | |
Communication Services | | | 6.5 | | |
Consumer Discretionary | | | 6.4 | | |
Commodities | | | 4.1 | | |
U.S. Treasury Obligations | | | 3.9 | | |
Real Estate | | | 3.6 | | |
Foreign Government Securities | | | 1.3 | | |
Utilities | | | 0.4 | | |
Short-Term Investments | | | 3.1 | | |
Countries*~ (%)
United States | | | 50.4 | | |
United Kingdom | | | 8.9 | | |
Japan | | | 5.3 | | |
France | | | 5.1 | | |
Hong Kong | | | 4.8 | | |
Canada | | | 4.3 | | |
Germany | | | 2.9 | | |
Switzerland | | | 2.6 | | |
Netherlands | | | 1.6 | | |
Belgium | | | 1.4 | | |
South Korea | | | 1.3 | | |
Mexico | | | 1.3 | | |
Sweden | | | 1.0 | | |
Singapore | | | 0.8 | | |
Thailand | | | 0.8 | | |
Chile | | | 0.7 | | |
Norway | | | 0.6 | | |
Denmark | | | 0.5 | | |
Brazil | | | 0.5 | | |
Australia | | | 0.4 | | |
Austria | | | 0.4 | | |
Taiwan | | | 0.4 | | |
Russia | | | 0.2 | | |
Ireland | | | 0.2 | | |
New Zealand | | | 0.2 | | |
Poland | | | 0.1 | | |
Malaysia | | | 0.1 | | |
Indonesia | | | 0.1 | | |
Short-Term Investments | | | 3.1 | | |
^Performance figures reflect certain fee waivers and/or expense limitations, without which returns may have been lower.
*Asset Allocation, Sector and Countries percentages are based on total investments in the portfolio.
~Country allocations reflect country of risk (not currency of issue). Bonds of non-U.S. issuers may be U.S. dollar denominated.
The Fund's portfolio composition is subject to change at any time.
First Eagle Funds | Annual Report | October 31, 2018
70
First Eagle Global Income Builder Fund | Fund Overview
Growth of a $10,000 Initial Investment
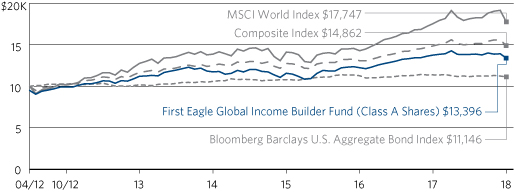
Performance data quoted herein represents past performance and should not be considered indicative of future results. Performance data quoted herein does not reflect the deduction of taxes that a shareholder would pay on Fund distributions or the sale of Fund shares. The average annual returns shown above are historical and reflect changes in share price, reinvested dividends and are net of expenses.
The average annual returns for Class A shares give effect to the deduction of the maximum sales charge of 5.00%.
The composite index consists of 60% of the MSCI World Index and 40% of the Bloomberg Barclays U.S. Aggregate Bond Index. The MSCI World Index is a widely followed, unmanaged group of stocks from 23 developed international markets. The index provides total returns in U.S. dollars with net dividends reinvested. The Bloomberg Barclays U.S. Aggregate Bond Index is an unmanaged broad-based benchmark that measures the investment grade, U.S. dollar-denominated, fixed-rate taxable bond market, including Treasuries, government-related and corporate securities, MBS (agency fixed-rate and hybrid ARM pasthroughs), ABS and CMBS. One cannot invest directly in an index.
Top 10 Holdings* (%)
Gold bullion (Precious Metal) | | | 4.1 | | |
Nestle SA (Registered) (Food Products, Switzerland) | | | 2.3 | | |
Exxon Mobil Corp. (Oil, Gas & Consumable Fuels, United States) | | | 1.8 | | |
Jardine Matheson Holdings Ltd. (Industrial Conglomerates, Hong Kong) | | | 1.5 | | |
British American Tobacco plc (Tobacco, United Kingdom) | | | 1.5 | | |
Groupe Bruxelles Lambert SA (Diversified Financial Services, Belgium) | | | 1.3 | | |
KDDI Corp. (Wireless Telecommunication Services, Japan) | | | 1.3 | | |
BI-LO Holding Finance LLC, First Lien Term Loan B (Food & Staples Retailing,
United States) | | | 1.3 | | |
Danone SA (Food Products, France) | | | 1.3 | | |
Nutrien Ltd. (Chemicals, Canada) | | | 1.2 | | |
Total | | | 17.6 | | |
*Holdings in cash, commercial paper and other short-term cash equivalents have been excluded.
Percentages are based on total net assets.
First Eagle Funds | Annual Report | October 31, 2018
71
First Eagle Global Income Builder Fund | Schedule of Investments | October 31, 2018
Investments | | Shares | | Value ($) | |
Common Stocks — 55.9% | |
Austria — 0.4% | |
Mayr Melnhof Karton AG | | | 39,074 | | | | 4,947,951 | | |
Belgium — 1.3% | |
Groupe Bruxelles Lambert SA | | | 195,927 | | | | 18,221,817 | | |
Brazil — 0.5% | |
Cielo SA | | | 1,861,348 | | | | 6,602,121 | | |
Canada — 2.7% | |
Agnico Eagle Mines Ltd. | | | 144,891 | | | | 5,117,879 | | |
Franco-Nevada Corp. | | | 49,135 | | | | 3,068,768 | | |
Goldcorp, Inc. | | | 173,654 | | | | 1,566,359 | | |
Nutrien Ltd. | | | 318,641 | | | | 16,865,668 | | |
Power Corp. of Canada | | | 290,080 | | | | 5,989,118 | | |
Wheaton Precious Metals Corp. | | | 260,483 | | | | 4,279,736 | | |
| | | | 36,887,528 | | |
Chile — 0.7% | |
Cia Cervecerias Unidas SA, ADR | | | 373,175 | | | | 9,355,497 | | |
Quinenco SA | | | 200,388 | | | | 523,165 | | |
| | | | 9,878,662 | | |
Denmark — 0.5% | |
ISS A/S | | | 202,239 | | | | 6,641,767 | | |
France — 5.0% | |
Bouygues SA | | | 140,537 | | | | 5,119,860 | | |
Cie de Saint-Gobain | | | 228,828 | | | | 8,620,276 | | |
Danone SA | | | 239,370 | | | | 16,950,600 | | |
Legrand SA | | | 43,918 | | | | 2,867,888 | | |
LVMH Moet Hennessy Louis Vuitton SE | | | 4,980 | | | | 1,510,959 | | |
Rexel SA | | | 503,696 | | | | 6,420,774 | | |
Sanofi | | | 167,783 | | | | 14,993,184 | | |
Sodexo SA | | | 91,100 | | | | 9,299,202 | | |
Thermador Groupe | | | 37,992 | | | | 2,041,669 | | |
| | | | 67,824,412 | | |
First Eagle Funds | Annual Report | October 31, 2018
72
First Eagle Global Income Builder Fund | Schedule of Investments | October 31, 2018
Investments | | Shares | | Value ($) | |
Germany — 1.3% | |
Hamburger Hafen und Logistik AG | | | 94,185 | | | | 1,995,130 | | |
HeidelbergCement AG | | | 145,035 | | | | 9,842,717 | | |
Telefonica Deutschland Holding AG | | | 1,590,230 | | | | 6,181,899 | | |
| | | | 18,019,746 | | |
Hong Kong — 4.8% | |
CK Asset Holdings Ltd. | | | 1,425,000 | | | | 9,273,542 | | |
Great Eagle Holdings Ltd. | | | 1,749,774 | | | | 7,990,689 | | |
Guoco Group Ltd. | | | 67,700 | | | | 1,140,557 | | |
Hang Lung Properties Ltd. | | | 3,067,764 | | | | 5,560,854 | | |
Hopewell Holdings Ltd. | | | 1,488,890 | | | | 4,600,377 | | |
Hysan Development Co. Ltd. | | | 1,193,083 | | | | 5,595,198 | | |
Jardine Matheson Holdings Ltd. | | | 361,400 | | | | 20,868,478 | | |
Mandarin Oriental International Ltd. | | | 4,571,800 | | | | 8,643,610 | | |
Swire Properties Ltd. | | | 370,445 | | | | 1,265,932 | | |
| | | | 64,939,237 | | |
Ireland — 0.2% | |
CRH plc | | | 77,242 | | | | 2,306,485 | | |
Japan — 5.3% | |
FANUC Corp. | | | 57,500 | | | | 10,003,106 | | |
Hoya Corp. | | | 140,600 | | | | 7,954,557 | | |
KDDI Corp. | | | 747,500 | | | | 18,089,388 | | |
Mitsubishi Electric Corp. | | | 338,500 | | | | 4,285,221 | | |
Mitsubishi Estate Co. Ltd. | | | 137,600 | | | | 2,199,096 | | |
NTT DOCOMO, Inc. | | | 421,700 | | | | 10,457,673 | | |
Secom Co. Ltd. | | | 145,700 | | | | 11,928,690 | | |
Sompo Holdings, Inc. | | | 163,900 | | | | 6,760,144 | | |
| | | | 71,677,875 | | |
Malaysia — 0.1% | |
British American Tobacco Malaysia Bhd. | | | 255,200 | | | | 1,895,937 | | |
Mexico — 0.5% | |
Fresnillo plc | | | 646,614 | | | | 7,011,926 | | |
Netherlands — 0.5% | |
HAL Trust | | | 40,466 | | | | 6,498,363 | | |
First Eagle Funds | Annual Report | October 31, 2018
73
First Eagle Global Income Builder Fund | Schedule of Investments | October 31, 2018
Investments | | Shares | | Value ($) | |
New Zealand — 0.2% | |
SKY Network Television Ltd. | | | 1,350,999 | | | | 1,981,022 | | |
Norway — 0.6% | |
Orkla ASA | | | 993,802 | | | | 8,575,828 | | |
Russia — 0.2% | |
Gazprom PJSC, ADR | | | 687,492 | | | | 3,250,798 | | |
Singapore — 0.5% | |
ComfortDelGro Corp. Ltd. | | | 3,305,600 | | | | 5,382,385 | | |
Overseas Education Ltd. | | | 8,290,100 | | | | 1,825,420 | | |
| | | | 7,207,805 | | |
South Korea — 1.3% | |
Kia Motors Corp. | | | 214,165 | | | | 5,353,209 | | |
KT&G Corp. | | | 143,173 | | | | 12,766,923 | | |
| | | | 18,120,132 | | |
Sweden — 1.0% | |
Industrivarden AB, Class C | | | 94,347 | | | | 1,959,690 | | |
Investor AB, Class A | | | 232,453 | | | | 10,136,869 | | |
Svenska Handelsbanken AB, Class A | | | 129,000 | | | | 1,402,210 | | |
| | | | 13,498,769 | | |
Switzerland — 2.6% | |
Cie Financiere Richemont SA (Registered) | | | 53,528 | | | | 3,912,396 | | |
Nestle SA (Registered) | | | 368,179 | | | | 31,082,816 | | |
| | | | 34,995,212 | | |
Taiwan — 0.4% | |
Taiwan Semiconductor Manufacturing Co. Ltd., ADR | | | 124,153 | | | | 4,730,229 | | |
Thailand — 0.8% | |
Bangkok Bank PCL, NVDR | | | 1,343,800 | | | | 8,398,982 | | |
Thai Beverage PCL | | | 5,650,400 | | | | 2,552,130 | | |
| | | | 10,951,112 | | |
United Kingdom — 7.0% | |
Berkeley Group Holdings plc | | | 229,710 | | | | 10,266,496 | | |
British American Tobacco plc | | | 477,551 | | | | 20,701,964 | | |
BT Group plc | | | 1,226,496 | | | | 3,755,538 | | |
Diageo plc | | | 238,505 | | | | 8,245,479 | | |
Domino's Pizza Group plc | | | 606,857 | | | | 2,195,491 | | |
First Eagle Funds | Annual Report | October 31, 2018
74
First Eagle Global Income Builder Fund | Schedule of Investments | October 31, 2018
Investments | | Shares | | Value ($) | |
United Kingdom — 7.0% (continued) | |
GlaxoSmithKline plc | | | 819,716 | | | | 15,876,064 | | |
Hiscox Ltd. | | | 303,226 | | | | 6,298,729 | | |
Linde plc | | | 60,776 | | | | 10,010,088 | | |
Lloyds Banking Group plc | | | 13,262,055 | | | | 9,677,848 | | |
Ultra Electronics Holdings plc | | | 170,723 | | | | 3,137,977 | | |
Unilever NV, CVA | | | 38,931 | | | | 2,091,957 | | |
WPP plc | | | 251,367 | | | | 2,844,402 | | |
| | | | 95,102,033 | | |
United States — 17.5% | |
3M Co. | | | 47,526 | | | | 9,042,297 | | |
American Express Co. | | | 32,262 | | | | 3,314,275 | | |
Analog Devices, Inc. | | | 51,493 | | | | 4,310,479 | | |
Anthem, Inc. | | | 30,549 | | | | 8,418,388 | | |
Bank of New York Mellon Corp. (The) | | | 63,500 | | | | 3,005,455 | | |
BB&T Corp. | | | 243,499 | | | | 11,970,411 | | |
CH Robinson Worldwide, Inc. | | | 91,502 | | | | 8,146,423 | | |
Cincinnati Financial Corp. | | | 43,369 | | | | 3,410,538 | | |
Colgate-Palmolive Co. | | | 206,601 | | | | 12,303,090 | | |
ConocoPhillips | | | 45,065 | | | | 3,150,043 | | |
Cummins, Inc. | | | 18,007 | | | | 2,461,377 | | |
Deere & Co. | | | 60,783 | | | | 8,232,450 | | |
Exxon Mobil Corp. | | | 299,494 | | | | 23,863,682 | | |
Flowserve Corp. | | | 70,228 | | | | 3,223,465 | | |
H&R Block, Inc. | | | 100,083 | | | | 2,656,203 | | |
Microsoft Corp. | | | 124,209 | | | | 13,266,763 | | |
National Oilwell Varco, Inc. | | | 142,073 | | | | 5,228,286 | | |
Omnicom Group, Inc. | | | 175,959 | | | | 13,077,273 | | |
Oracle Corp. | | | 236,436 | | | | 11,547,534 | | |
Philip Morris International, Inc. | | | 128,974 | | | | 11,358,740 | | |
Royal Gold, Inc. | | | 38,328 | | | | 2,937,075 | | |
San Juan Basin Royalty Trust | | | 356,080 | | | | 1,819,569 | | |
Schlumberger Ltd. | | | 319,142 | | | | 16,375,176 | | |
Synchrony Financial | | | 119,394 | | | | 3,448,099 | | |
Texas Instruments, Inc. | | | 66,834 | | | | 6,204,200 | | |
First Eagle Funds | Annual Report | October 31, 2018
75
First Eagle Global Income Builder Fund | Schedule of Investments | October 31, 2018
Investments | | Shares | | Value ($) | |
United States — 17.5% (continued) | |
Tiffany & Co. | | | 43,165 | | | | 4,804,264 | | |
Travelers Cos., Inc. (The) | | | 10,696 | | | | 1,338,390 | | |
UGI Corp. | | | 92,192 | | | | 4,891,708 | | |
Union Pacific Corp. | | | 68,028 | | | | 9,947,054 | | |
US Bancorp | | | 29,088 | | | | 1,520,430 | | |
Weyerhaeuser Co., REIT | | | 604,889 | | | | 16,108,194 | | |
Willis Towers Watson plc | | | 14,861 | | | | 2,127,501 | | |
Xilinx, Inc. | | | 55,714 | | | | 4,756,304 | | |
| | | | 238,265,136 | | |
Total Common Stocks
(Cost $716,556,276) | | | 760,031,903 | | |
| | | Principal Amount ($) | | | |
Corporate Bonds — 27.5% | |
Australia — 0.4% | |
Ausdrill Finance Pty. Ltd.
6.88%, 11/1/2019 (a) | | | 2,795,000 | | | | 2,795,000 | | |
Nufarm Australia Ltd.
5.75%, 4/30/2026 (a) | | | 2,633,000 | | | | 2,458,564 | | |
| | | | 5,253,564 | | |
Canada — 1.5% | |
Alimentation Couche-Tard, Inc.
2.35%, 12/13/2019 (a) | | | 2,901,000 | | | | 2,871,298 | | |
Methanex Corp.
3.25%, 12/15/2019 | | | 7,800,000 | | | | 7,755,388 | | |
New Gold, Inc.
6.25%, 11/15/2022 (a) | | | 2,476,000 | | | | 2,154,120 | | |
Open Text Corp.
5.63%, 1/15/2023 (a) | | | 7,229,000 | | | | 7,284,302 | | |
5.88%, 6/1/2026 (a) | | | 398,000 | | | | 399,990 | | |
| | | | 20,465,098 | | |
France — 0.1% | |
Electricite de France SA
2.15%, 1/22/2019 (a) | | | 514,000 | | | | 512,787 | | |
6.50%, 1/26/2019 (a) | | | 629,000 | | | | 634,327 | | |
| | | | 1,147,114 | | |
First Eagle Funds | Annual Report | October 31, 2018
76
First Eagle Global Income Builder Fund | Schedule of Investments | October 31, 2018
Investments | | Principal Amount ($) | | Value ($) | |
Germany — 1.5% | |
Bayer US Finance LLC
2.38%, 10/8/2019 (a) | | | 2,577,000 | | | | 2,555,618 | | |
Fresenius Medical Care US Finance II, Inc.
5.63%, 7/31/2019 (a) | | | 9,929,000 | | | | 10,083,908 | | |
Fresenius Medical Care US Finance, Inc.
5.75%, 2/15/2021 (a) | | | 2,494,000 | | | | 2,592,513 | | |
IHO Verwaltungs GmbH
4.12%, 9/15/2021 (a)(b) | | | 1,950,000 | | | | 1,891,500 | | |
4.50%, 9/15/2023 (a)(b) | | | 3,455,216 | | | | 3,217,670 | | |
| | | | 20,341,209 | | |
Netherlands — 1.1% | |
NXP BV
4.13%, 6/1/2021 (a) | | | 2,953,000 | | | | 2,934,544 | | |
4.63%, 6/1/2023 (a) | | | 4,847,000 | | | | 4,804,589 | | |
Shell International Finance BV
1.38%, 9/12/2019 | | | 426,000 | | | | 420,572 | | |
2.13%, 5/11/2020 | | | 1,946,000 | | | | 1,916,087 | | |
2.25%, 11/10/2020 | | | 4,824,000 | | | | 4,740,204 | | |
| | | | 14,815,996 | | |
United Kingdom — 1.3% | |
Ashtead Capital, Inc.
5.25%, 8/1/2026 (a) | | | 378,000 | | | | 371,990 | | |
BP Capital Markets plc
1.68%, 5/3/2019 | | | 2,356,000 | | | | 2,341,365 | | |
Inmarsat Finance plc
4.88%, 5/15/2022 (a) | | | 1,645,000 | | | | 1,611,310 | | |
6.50%, 10/1/2024 (a) | | | 3,780,000 | | | | 3,728,025 | | |
Jaguar Land Rover Automotive plc
4.13%, 12/15/2018 (a) | | | 4,480,000 | | | | 4,475,520 | | |
5.63%, 2/1/2023 (a) | | | 2,457,000 | | | | 2,340,293 | | |
Lloyds Banking Group plc
3.00%, 1/11/2022 | | | 1,250,000 | | | | 1,213,859 | | |
(ICE LIBOR USD 3 Month + 0.81%),
2.91%, 11/7/2023 (c) | | | 2,090,000 | | | | 1,986,503 | | |
| | | | 18,068,865 | | |
First Eagle Funds | Annual Report | October 31, 2018
77
First Eagle Global Income Builder Fund | Schedule of Investments | October 31, 2018
Investments | | Principal Amount ($) | | Value ($) | |
United States — 21.6% | |
AbbVie, Inc.
2.00%, 11/6/2018 | | | 12,623,000 | | | | 12,622,081 | | |
ACCO Brands Corp.
5.25%, 12/15/2024 (a) | | | 10,340,000 | | | | 9,616,200 | | |
Aircastle Ltd.
4.63%, 12/15/2018 | | | 891,000 | | | | 892,782 | | |
6.25%, 12/1/2019 | | | 4,859,000 | | | | 4,993,594 | | |
7.63%, 4/15/2020 | | | 2,525,000 | | | | 2,660,649 | | |
5.50%, 2/15/2022 | | | 4,919,000 | | | | 5,092,395 | | |
American Axle & Manufacturing, Inc.
6.63%, 10/15/2022 | | | 3,493,000 | | | | 3,545,395 | | |
6.25%, 3/15/2026 | | | 2,351,000 | | | | 2,221,695 | | |
American Express Credit Corp.
1.70%, 10/30/2019 | | | 4,038,000 | | | | 3,984,466 | | |
Andeavor Logistics LP
3.50%, 12/1/2022 | | | 111,000 | | | | 108,371 | | |
Aramark Services, Inc.
5.13%, 1/15/2024 | | | 5,970,000 | | | | 5,940,150 | | |
5.00%, 4/1/2025 (a) | | | 1,343,000 | | | | 1,322,855 | | |
4.75%, 6/1/2026 | | | 1,076,000 | | | | 1,024,890 | | |
5.00%, 2/1/2028 (a) | | | 194,000 | | | | 184,057 | | |
Berry Global, Inc.
5.50%, 5/15/2022 | | | 1,145,000 | | | | 1,145,000 | | |
Block Financial LLC
4.13%, 10/1/2020 | | | 2,474,000 | | | | 2,492,200 | | |
BWX Technologies, Inc.
5.38%, 7/15/2026 (a) | | | 704,000 | | | | 705,760 | | |
CCO Holdings LLC
5.25%, 9/30/2022 | | | 1,459,000 | | | | 1,466,295 | | |
Centene Corp.
4.75%, 5/15/2022 | | | 2,036,000 | | | | 2,038,545 | | |
4.75%, 1/15/2025 | | | 2,941,000 | | | | 2,904,855 | | |
Charles River Laboratories International, Inc.
5.50%, 4/1/2026 (a) | | | 350,000 | | | | 349,125 | | |
Charter Communications Operating LLC
4.46%, 7/23/2022 | | | 2,306,000 | | | | 2,333,025 | | |
4.91%, 7/23/2025 | | | 3,845,000 | | | | 3,861,380 | | |
First Eagle Funds | Annual Report | October 31, 2018
78
First Eagle Global Income Builder Fund | Schedule of Investments | October 31, 2018
Investments | | Principal Amount ($) | | Value ($) | |
United States — 21.6% (continued) | |
CITGO Petroleum Corp.
6.25%, 8/15/2022 (a) | | | 13,847,000 | | | | 13,639,295 | | |
Cloud Peak Energy Resources LLC
12.00%, 11/1/2021 | | | 7,707,000 | | | | 6,516,268 | | |
CNH Industrial Capital LLC
3.88%, 10/15/2021 | | | 3,225,000 | | | | 3,211,629 | | |
CVS Health Corp.
(ICE LIBOR USD 3 Month + 0.72%),
3.05%, 3/9/2021 (c) | | | 963,000 | | | | 968,126 | | |
DCP Midstream Operating LP
5.35%, 3/15/2020 (a) | | | 8,902,000 | | | | 9,002,147 | | |
4.75%, 9/30/2021 (a) | | | 2,859,000 | | | | 2,866,147 | | |
6.45%, 11/3/2036 (a) | | | 1,545,000 | | | | 1,595,213 | | |
Dell International LLC
3.48%, 6/1/2019 (a) | | | 1,610,000 | | | | 1,612,016 | | |
4.42%, 6/15/2021 (a) | | | 4,220,000 | | | | 4,255,011 | | |
6.02%, 6/15/2026 (a) | | | 3,103,000 | | | | 3,215,480 | | |
Diamond Offshore Drilling, Inc.
7.88%, 8/15/2025 | | | 1,619,000 | | | | 1,594,715 | | |
Discover Bank
2.60%, 11/13/2018 | | | 2,921,000 | | | | 2,920,481 | | |
Dollar Tree, Inc.
(ICE LIBOR USD 3 Month + 0.70%),
3.15%, 4/17/2020 (c) | | | 95,000 | | | | 95,077 | | |
3.70%, 5/15/2023 | | | 95,000 | | | | 92,590 | | |
Energizer Gamma Acquisition BV
4.63%, 7/15/2026 (a) | | | 2,632,000 | | | | 3,052,682 | | |
EW Scripps Co. (The)
5.13%, 5/15/2025 (a) | | | 3,493,000 | | | | 3,283,420 | | |
GameStop Corp.
5.50%, 10/1/2019 (a) | | | 13,340,000 | | | | 13,340,000 | | |
Harland Clarke Holdings Corp.
6.88%, 3/1/2020 (a) | | | 3,133,000 | | | | 3,078,172 | | |
HCA, Inc.
6.50%, 2/15/2020 | | | 2,154,000 | | | | 2,224,005 | | |
5.38%, 9/1/2026 | | | 10,424,000 | | | | 10,345,820 | | |
IQVIA, Inc.
4.88%, 5/15/2023 (a) | | | 6,321,000 | | | | 6,253,871 | | |
First Eagle Funds | Annual Report | October 31, 2018
79
First Eagle Global Income Builder Fund | Schedule of Investments | October 31, 2018
Investments | | Principal Amount ($) | | Value ($) | |
United States — 21.6% (continued) | |
John Deere Capital Corp.
2.35%, 1/8/2021 | | | 2,561,000 | | | | 2,517,675 | | |
KFC Holding Co.
5.00%, 6/1/2024 (a) | | | 600,000 | | | | 591,750 | | |
KLX, Inc.
5.88%, 12/1/2022 (a) | | | 3,408,000 | | | | 3,510,240 | | |
Kroger Co. (The)
2.30%, 1/15/2019 | | | 12,795,000 | | | | 12,780,275 | | |
Lamb Weston Holdings, Inc.
4.63%, 11/1/2024 (a) | | | 4,015,000 | | | | 3,932,572 | | |
4.88%, 11/1/2026 (a) | | | 803,000 | | | | 774,895 | | |
Lennar Corp.
4.12%, 12/1/2018 (d) | | | 1,815,000 | | | | 1,812,731 | | |
Marathon Petroleum Corp.
4.75%, 12/15/2023 (a) | | | 3,219,000 | | | | 3,315,769 | | |
5.13%, 12/15/2026 (a) | | | 1,609,000 | | | | 1,651,235 | | |
Meredith Corp.
6.88%, 2/1/2026 (a) | | | 1,716,000 | | | | 1,716,000 | | |
Molson Coors Brewing Co.
1.90%, 3/15/2019 | | | 1,938,000 | | | | 1,928,570 | | |
1.45%, 7/15/2019 | | | 3,813,000 | | | | 3,767,616 | | |
NBCUniversal Enterprise, Inc.
1.97%, 4/15/2019 (a) | | | 2,500,000 | | | | 2,489,813 | | |
Philip Morris International, Inc.
1.88%, 1/15/2019 | | | 3,174,000 | | | | 3,167,919 | | |
Pilgrim's Pride Corp.
5.75%, 3/15/2025 (a) | | | 3,300,000 | | | | 3,077,250 | | |
5.88%, 9/30/2027 (a) | | | 3,343,000 | | | | 3,025,415 | | |
Plantronics, Inc.
5.50%, 5/31/2023 (a) | | | 3,656,000 | | | | 3,564,600 | | |
Post Holdings, Inc.
5.50%, 3/1/2025 (a) | | | 1,076,000 | | | | 1,041,030 | | |
Spectrum Brands, Inc.
5.75%, 7/15/2025 | | | 1,520,000 | | | | 1,478,200 | | |
Sprint Capital Corp.
6.90%, 5/1/2019 | | | 3,774,000 | | | | 3,823,402 | | |
Sprint Spectrum Co. LLC
3.36%, 9/20/2021 (a)(d) | | | 2,803,500 | | | | 2,775,465 | | |
First Eagle Funds | Annual Report | October 31, 2018
80
First Eagle Global Income Builder Fund | Schedule of Investments | October 31, 2018
Investments | | Principal Amount ($) | | Value ($) | |
United States — 21.6% (continued) | |
Symantec Corp.
3.95%, 6/15/2022 | | | 2,040,000 | | | | 1,973,110 | | |
Synchrony Financial
2.60%, 1/15/2019 | | | 7,042,000 | | | | 7,032,493 | | |
3.00%, 8/15/2019 | | | 1,977,000 | | | | 1,968,920 | | |
Targa Resources Partners LP
4.13%, 11/15/2019 | | | 4,787,000 | | | | 4,787,000 | | |
Taylor Morrison Communities, Inc.
5.88%, 4/15/2023 (a) | | | 3,107,000 | | | | 3,068,163 | | |
TEGNA, Inc.
5.13%, 7/15/2020 | | | 4,641,000 | | | | 4,641,000 | | |
Teleflex, Inc.
5.25%, 6/15/2024 | | | 1,428,000 | | | | 1,442,280 | | |
4.63%, 11/15/2027 | | | 824,000 | | | | 768,380 | | |
UnitedHealth Group, Inc.
1.70%, 2/15/2019 | | | 845,000 | | | | 842,334 | | |
1.95%, 10/15/2020 | | | 2,092,000 | | | | 2,044,409 | | |
USG Corp.
4.88%, 6/1/2027 (a) | | | 850,000 | | | | 851,859 | | |
Valvoline, Inc.
4.38%, 8/15/2025 | | | 979,000 | | | | 903,127 | | |
Veritas US, Inc.
7.50%, 2/1/2023 (a) | | | 2,838,000 | | | | 2,689,005 | | |
Vulcan Materials Co.
(ICE LIBOR USD 3 Month + 0.65%),
2.97%, 3/1/2021 (c) | | | 3,834,000 | | | | 3,839,689 | | |
4.50%, 4/1/2025 | | | 10,940,000 | | | | 10,894,685 | | |
Wachovia Capital Trust III
(ICE LIBOR USD 3 Month + 0.93%, 5.57% Floor),
5.57%, 12/6/2018 (c)(e) | | | 6,773,000 | | | | 6,603,675 | | |
WESCO Distribution, Inc.
5.38%, 12/15/2021 | | | 4,695,000 | | | | 4,689,131 | | |
5.38%, 6/15/2024 | | | 2,693,000 | | | | 2,605,478 | | |
Western Digital Corp.
4.75%, 2/15/2026 | | | 4,523,000 | | | | 4,178,121 | | |
| | | | 293,233,211 | | |
Total Corporate Bonds
(Cost $376,989,382) | | | 373,325,057 | | |
First Eagle Funds | Annual Report | October 31, 2018
81
First Eagle Global Income Builder Fund | Schedule of Investments | October 31, 2018
Investments | | Ounces | | Value ($) | |
Commodities — 4.1% | |
Gold bullion*
(Cost $56,212,542) | | | 45,273 | | | | 55,065,632 | | |
| | | Principal Amount ($) | | | |
U.S. Treasury Obligations — 3.8% | |
U.S. Treasury Notes
1.63%, 6/30/2019 | | | 9,640,000 | | | | 9,578,997 | | |
1.63%, 6/30/2020 | | | 9,650,000 | | | | 9,458,508 | | |
2.63%, 7/31/2020 | | | 14,500,000 | | | | 14,441,094 | | |
1.13%, 6/30/2021 | | | 9,770,000 | | | | 9,324,625 | | |
2.13%, 6/30/2022 | | | 9,588,000 | | | | 9,310,098 | | |
| | | | 52,113,322 | | |
Total U.S. Treasury Obligations
(Cost $53,138,795) | | | 52,113,322 | | |
Loan Assignments — 2.9% | |
United States — 2.9% | |
BI-LO Holding Finance LLC, First Lien Term Loan B
(ICE LIBOR USD 3 Month + 8.00%),
10.36%, 5/15/2024 (c) | | | 17,206,875 | | | | 16,970,281 | | |
Caelus Energy Alaska 03 LLC, Second Lien Term Loan
(ICE LIBOR USD 3 Month + 7.50%), 9.84%,
4/15/2020‡ (c) | | | 6,778,000 | | | | 6,201,870 | | |
OSG Bulk Ships, Inc., First Lien Term Loan B
(ICE LIBOR USD 3 Month + 4.25%), 6.77%,
8/5/2019‡ (c) | | | 5,103,195 | | | | 5,047,928 | | |
Osum Productions Corp., Term Loan
(ICE LIBOR USD 3 Month + 5.50%), 7.89%,
7/31/2020‡ (c) | | | 5,925,791 | | | | 5,451,727 | | |
Zebra Technologies Corp., Term Loan B
(ICE LIBOR USD 6 Month + 1.75%), 4.06%,
10/27/2021 (c) | | | 6,319,066 | | | | 6,335,748 | | |
| | | | 40,007,554 | | |
Total Loan Assignments
(Cost $40,581,274) | | | 40,007,554 | | |
First Eagle Funds | Annual Report | October 31, 2018
82
First Eagle Global Income Builder Fund | Schedule of Investments | October 31, 2018
Investments | | Principal Amount ($) | | Value ($) | |
Foreign Government Securities — 1.3% | |
Indonesia — 0.1% | |
Indonesia Treasury Bond
8.25%, 7/15/2021 | | IDR | 24,166,000,000 | | | | 1,595,746 | | |
Mexico — 0.8% | |
Mexican Bonos
6.50%, 6/10/2021 | | MXN | 103,280,000 | | | | 4,832,588 | | |
6.50%, 6/9/2022 | | MXN | 121,300,000 | | | | 5,574,966 | | |
| | | | 10,407,554 | | |
Poland — 0.1% | |
Poland Government Bond
3.25%, 7/25/2019 | | PLN | 7,185,000 | | | | 1,899,335 | | |
Singapore — 0.3% | |
Singapore Government Bond
3.25%, 9/1/2020 | | SGD | 1,568,000 | | | | 1,156,074 | | |
2.25%, 6/1/2021 | | SGD | 3,839,000 | | | | 2,778,747 | | |
| | | | 3,934,821 | | |
Total Foreign Government Securities
(Cost $19,200,477) | | | 17,837,456 | | |
| | | Shares | | | |
Closed End Funds — 0.5% | |
United Kingdom — 0.5% | |
Caledonia Investments plc
(Cost $6,917,625) | | | 196,518 | | | | 6,891,251 | | |
Preferred Stocks — 0.1% | |
United States — 0.1% | |
General American Investors Co., Inc.,
Series B 5.95%, 1/11/2019 (e) | | | 4,712 | | | | 121,522 | | |
MetLife, Inc., Series A(ICE LIBOR USD
3 Month + 1.00%, 4.00% Floor),
4.00%, 1/11/2019 (c)(e) | | | 67,936 | | | | 1,620,274 | | |
Total Preferred Stocks
(Cost $1,760,123) | | | 1,741,796 | | |
First Eagle Funds | Annual Report | October 31, 2018
83
First Eagle Global Income Builder Fund | Schedule of Investments | October 31, 2018
Investments | | Principal Amount ($) | | Value ($) | |
Short-Term Investments — 3.1% | |
Commercial Paper — 0.9% | |
Anthem, Inc.
2.35%, 11/1/2018 (f) | | | 1,530,000 | | | | 1,529,900 | | |
Eni Finance USA, Inc.
2.37%, 11/1/2018 (f) | | | 2,279,000 | | | | 2,278,850 | | |
Hitachi America Capital Ltd.
2.37%, 11/1/2018 (f) | | | 8,398,000 | | | | 8,397,447 | | |
Total Commercial Paper
(Cost $12,207,000) | | | 12,206,197 | | |
U.S. Treasury Obligations — 2.2% | |
U.S. Treasury Bills
2.02%, 12/6/2018 (f) | | | 15,000,000 | | | | 14,968,901 | | |
2.13%, 12/20/2018 (f) | | | 15,000,000 | | | | 14,956,104 | | |
Total U.S. Treasury Obligations
(Cost $29,927,404) | | | 29,925,005 | | |
| | | Shares | | | |
Investment Companies — 0.0% (g) | |
JP Morgan U.S. Government Money Market Fund,
Agency Shares 1.98% (h)
(Cost $2,198) | | | 2,198 | | | | 2,198 | | |
Total Short-Term Investments
(Cost $42,136,602) | | | 42,133,400 | | |
Total Investments — 99.2%
(Cost $1,313,493,096) | | | 1,349,147,371 | | |
Other Assets Less Liabilities — 0.8% | | | 10,940,065 | | |
Net Assets — 100.0% | | | 1,360,087,436 | | |
* Non-income producing security.
‡ Value determined using significant unobservable inputs.
(a) Securities exempt from registration under Rule 144A or section 4(a)(2), of the Securities Act of 1933. Under procedures approved by the Board of Trustees, such securities have been determined to be liquid by the investment adviser and may be resold, normally to qualified institutional buyers in transactions exempt from registration.
(b) Payment in-kind security.
(c) Variable or floating rate security, linked to the referenced benchmark. The interest rate shown is the rate in effect as of October 31, 2018.
(d) Step bond. Interest rate is a fixed rate for an initial period that either resets at a specific date or may reset in the future at a contingent upon predetermined trigger. The interest rate shown was the current rate as of October 31, 2018.
First Eagle Funds | Annual Report | October 31, 2018
84
First Eagle Global Income Builder Fund | Schedule of Investments | October 31, 2018
(e) Perpetual security. The rate reflected was the rate in effect on October 31, 2018. The maturity date reflects the next call date.
(f) The rate shown was the current yield as of October 31, 2018.
(g) Represents less than 0.05% of net assets.
(h) Represents 7-day effective yield as of October 31, 2018.
As of October 31, 2018, the gross unrealized appreciation (depreciation) of investments based on the aggregate cost of investment securities and derivative instruments, if applicable, for federal income tax purposes was as follows:
Aggregate gross unrealized appreciation | | $ | 107,189,210 | | |
Aggregate gross unrealized depreciation | | | (76,291,414 | ) | |
Net unrealized appreciation | | $ | 30,897,796 | | |
Federal income tax cost | | $ | 1,320,067,733 | | |
Forward Foreign Currency Exchange Contracts outstanding as of October 31, 2018
Currency
Purchased | | Currency Sold | | Counterparty | | Settlement
Date | | Unrealized
Appreciation
(Depreciation) | |
USD | 8,034,027 | | | EUR | 6,736,000 | | | Goldman Sachs | | 11/14/2018 | | $ | 397,347 | | |
USD | 2,049,088 | | | GBP | 1,517,000 | | | Goldman Sachs | | 11/14/2018 | | | 109,060 | | |
USD | 3,155,902 | | | JPY | 343,299,000 | | | Goldman Sachs | | 11/14/2018 | | | 110,822 | | |
USD | 6,091,044 | | | EUR | 5,137,000 | | | JPMorgan Chase Bank | | 12/12/2018 | | | 252,064 | | |
USD | 1,765,496 | | | GBP | 1,325,000 | | | JPMorgan Chase Bank | | 12/12/2018 | | | 68,496 | | |
USD | 3,633,263 | | | JPY | 401,105,000 | | | JPMorgan Chase Bank | | 12/12/2018 | | | 66,532 | | |
USD | 4,220,720 | | | EUR | 3,597,000 | | | UBS AG | | 01/16/2019 | | | 117,020 | | |
USD | 4,735,510 | | | GBP | 3,650,000 | | | UBS AG | | 01/16/2019 | | | 50,680 | | |
USD | 795,237 | | | JPY | 87,154,000 | | | UBS AG | | 01/16/2019 | | | 17,451 | | |
USD | 6,676,564 | | | EUR | 5,646,000 | | | HSBC Bank plc | | 02/13/2019 | | | 218,808 | | |
USD | 1,489,004 | | | GBP | 1,129,000 | | | HSBC Bank plc | | 02/13/2019 | | | 37,833 | | |
USD | 3,596,403 | | | JPY | 397,505,000 | | | HSBC Bank plc | | 02/13/2019 | | | 40,738 | | |
USD | 3,170,446 | | | EUR | 2,654,000 | | | Bank of New York Mellon | | 04/17/2019 | | | 118,332 | | |
USD | 6,946,954 | | | EUR | 5,887,000 | | | Bank of New York Mellon | | 05/15/2019 | | | 159,587 | | |
USD | 900,077 | | | GBP | 673,000 | | | Bank of New York Mellon | | 05/15/2019 | | | 31,177 | | |
USD | 3,739,267 | | | JPY | 412,400,000 | | | Bank of New York Mellon | | 05/15/2019 | | | 22,211 | | |
Net unrealized appreciation | | $ | 1,818,158 | | |
Abbreviations
ADR — American Depositary Receipt
CVA — Dutch Certification
EUR — Euro
GBP — British Pound
ICE — Intercontinental Exchange
IDR — Indonesian Rupiah
JPY — Japanese Yen
First Eagle Funds | Annual Report | October 31, 2018
85
First Eagle Global Income Builder Fund | Schedule of Investments | October 31, 2018
LIBOR — London Interbank Offered Rate
MXN — Mexican Peso
NVDR — Non-Voting Depositary Receipt
PJSC — Public Joint Stock Company
PLN — Polish Zloty
REIT — Real Estate Investment Trust
SGD — Singapore Dollar
USD — United States Dollar
See Notes to Financial Statements.
First Eagle Funds | Annual Report | October 31, 2018
86
This page was intentionally left blank.
First Eagle High Yield Fund
Data as of October 31, 2018 (unaudited)
Investment Objective
The First Eagle High Yield Fund seeks to provide investors with a high level of current income. To pursue this objective, the Fund normally invests at least 80% of its net assets (plus any borrowings for investment purposes) in high yield, below investment-grade instruments.
Average Annual Returns^ (%) | | One-Year | | Five-Years | | Ten-Years | |
| First Eagle High Yield Fund Class I | | | 2.74 | | | | 3.41 | | | | 10.72 | | |
Bloomberg Barclays U.S. Corporate High Yield Index | | | 0.97 | | | | 4.68 | | | | 11.20 | | |
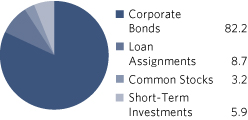
Sectors* (%) | |
Energy | | | 19.4 | | |
Industrials | | | 15.2 | | |
Communication Services | | | 11.8 | | |
Consumer Staples | | | 11.1 | | |
Consumer Discretionary | | | 10.3 | | |
Information Technology | | | 9.2 | | |
Materials | | | 8.4 | | |
Health Care | | | 5.8 | | |
Real Estate | | | 1.7 | | |
Financials | | | 1.2 | | |
Short-Term Investments | | | 5.9 | | |
Countries*~ (%)
United States | | | 77.3 | | |
Canada | | | 5.7 | | |
United Kingdom | | | 5.5 | | |
Germany | | | 1.9 | | |
Australia | | | 1.5 | | |
Netherlands | | | 1.2 | | |
South Korea | | | 0.6 | | |
Singapore | | | 0.4 | | |
Short-Term Investments | | | 5.9 | | |
^Performance figures reflect certain fee waivers and/or expense limitations, without which returns may have been lower.
*Asset Allocation, Sector and Countries percentages are based on total investments in the portfolio.
~Country allocations reflect country of risk (not currency of issue). Bonds of non-U.S. issuers may be U.S. dollar denominated.
The Fund's portfolio composition is subject to change at any time.
First Eagle Funds | Annual Report | October 31, 2018
88
First Eagle High Yield Fund | Fund Overview
Growth of a $10,000 Initial Investment

Performance data quoted herein represents past performance and should not be considered indicative of future results. Performance data quoted herein does not reflect the deduction of taxes that a shareholder would pay on Fund distributions or the sale of Fund shares. The average annual returns shown above are historical and reflect changes in share price, reinvested dividends and are net of expenses.
Class I Shares require $1 million minimum investment and are offered without a sales charge. If a sales charge was included values would be lower.
The Bloomberg Barclays U.S. Corporate High Yield Index is composed of fixed-rate, publicly issued, non-investment grade debt and is unmanaged, with dividends reinvested. The index includes both corporate and non-corporate sectors. The corporate sectors are Industrial, Utility, and Finance, which include both U.S. and non-U.S. corporations. One cannot invest directly in an index.
Top 10 Holdings* (%)
Southeastern Grocers, Inc. (Food & Staples Retailing, United States) | | | 3.2 | | |
BI-LO Holding Finance LLC, First Lien Term Loan B (Food & Staples Retailing,
United States) | | | 2.2 | | |
GameStop Corp. (Specialty Retail, United States) | | | 2.2 | | |
Caelus Energy Alaska 03 LLC, Second Lien Term Loan (Oil, Gas &
Consumable Fuels, United States) | | | 2.2 | | |
Osum Productions Corp., Term Loan (Oil, Gas & Consumable Fuels, United States) | | | 2.1 | | |
Aircastle Ltd. (Trading Companies & Distributors, United States) | | | 2.1 | | |
CITGO Petroleum Corp. (Oil, Gas & Consumable Fuels, United States) | | | 2.1 | | |
Cloud Peak Energy Resources LLC (Oil, Gas & Consumable Fuels, United States) | | | 2.0 | | |
Sprint Capital Corp. (Diversified Telecommunication Services, United States) | | | 2.0 | | |
EnQuest plc (Oil, Gas & Consumable Fuels, United Kingdom) | | | 1.9 | | |
Total | | | 22.0 | | |
*Holdings in cash, commercial paper and other short-term cash equivalents have been excluded.
Percentages are based on total net assets.
First Eagle Funds | Annual Report | October 31, 2018
89
First Eagle High Yield Fund | Schedule of Investments | October 31, 2018
Investments | | Principal Amount ($) | | Value ($) | |
Corporate Bonds — 80.8% | |
Australia — 1.4% | |
Ausdrill Finance Pty. Ltd.
6.88%, 11/1/2019 (a) | | | 4,114,000 | | | | 4,114,000 | | |
Nufarm Australia Ltd.
5.75%, 4/30/2026 (a) | | | 637,000 | | | | 594,799 | | |
| | | | 4,708,799 | | |
Canada — 5.6% | |
Clearwater Seafoods, Inc.
6.88%, 5/1/2025 (a) | | | 1,876,000 | | | | 1,796,270 | | |
Kinross Gold Corp.
4.50%, 7/15/2027 | | | 1,868,000 | | | | 1,671,860 | | |
Mercer International, Inc.
5.50%, 1/15/2026 | | | 924,000 | | | | 896,003 | | |
New Gold, Inc.
6.25%, 11/15/2022 (a) | | | 5,338,000 | | | | 4,644,060 | | |
Open Text Corp.
5.63%, 1/15/2023 (a) | | | 5,902,000 | | | | 5,947,150 | | |
5.88%, 6/1/2026 (a) | | | 94,000 | | | | 94,470 | | |
Precision Drilling Corp.
7.75%, 12/15/2023 | | | 2,068,000 | | | | 2,150,720 | | |
Ritchie Bros Auctioneers, Inc.
5.38%, 1/15/2025 (a) | | | 942,000 | | | | 927,870 | | |
| | | | 18,128,403 | | |
Germany — 1.9% | |
Fresenius Medical Care US Finance II, Inc.
5.63%, 7/31/2019 (a) | | | 3,790,000 | | | | 3,849,130 | | |
IHO Verwaltungs GmbH
4.12%, 9/15/2021 (a)(b) | | | 800,000 | | | | 776,000 | | |
4.50%, 9/15/2023 (a)(b) | | | 1,609,174 | | | | 1,498,544 | | |
| | | | 6,123,674 | | |
Netherlands — 1.2% | |
NXP BV
4.63%, 6/1/2023 (a) | | | 4,013,000 | | | | 3,977,886 | | |
Singapore — 0.4% | |
Avation Capital SA
6.50%, 5/15/2021 (a) | | | 1,216,000 | | | | 1,219,040 | | |
First Eagle Funds | Annual Report | October 31, 2018
90
First Eagle High Yield Fund | Schedule of Investments | October 31, 2018
Investments | | Principal Amount ($) | | Value ($) | |
South Korea — 0.6% | |
MagnaChip Semiconductor Corp.
6.63%, 7/15/2021 (c) | | | 2,202,000 | | | | 2,069,880 | | |
United Kingdom — 5.4% | |
CNH Industrial NV
4.50%, 8/15/2023 | | | 1,880,000 | | | | 1,894,100 | | |
EnQuest plc
7.00%, 4/15/2022 (b)(d) | | | 6,898,957 | | | | 6,243,556 | | |
Inmarsat Finance plc
4.88%, 5/15/2022 (a) | | | 3,593,000 | | | | 3,519,415 | | |
6.50%, 10/1/2024 (a) | | | 948,000 | | | | 934,965 | | |
Jaguar Land Rover Automotive plc
5.63%, 2/1/2023 (a) | | | 790,000 | | | | 752,475 | | |
Virgin Media Secured Finance plc
5.50%, 1/15/2025 (a) | | | 4,285,000 | | | | 4,172,519 | | |
| | | | 17,517,030 | | |
United States — 64.3% | |
ACCO Brands Corp.
5.25%, 12/15/2024 (a) | | | 4,362,000 | | | | 4,056,660 | | |
AECOM
5.13%, 3/15/2027 | | | 188,000 | | | | 174,840 | | |
Aircastle Ltd.
4.63%, 12/15/2018 | | | 6,732,000 | | | | 6,745,464 | | |
7.63%, 4/15/2020 | | | 4,515,000 | | | | 4,757,556 | | |
American Axle & Manufacturing, Inc.
6.63%, 10/15/2022 | | | 2,682,000 | | | | 2,722,230 | | |
6.25%, 3/15/2026 | | | 2,996,000 | | | | 2,831,220 | | |
AMN Healthcare, Inc.
5.13%, 10/1/2024 (a) | | | 6,161,000 | | | | 5,937,664 | | |
Antero Resources Corp.
5.38%, 11/1/2021 | | | 2,259,000 | | | | 2,261,824 | | |
5.63%, 6/1/2023 | | | 4,082,000 | | | | 4,082,000 | | |
5.00%, 3/1/2025 | | | 942,000 | | | | 914,917 | | |
Aramark Services, Inc.
5.13%, 1/15/2024 | | | 3,103,000 | | | | 3,087,485 | | |
5.00%, 4/1/2025 (a) | | | 584,000 | | | | 575,240 | | |
4.75%, 6/1/2026 | | | 1,556,000 | | | | 1,482,090 | | |
5.00%, 2/1/2028 (a) | | | 57,000 | | | | 54,079 | | |
First Eagle Funds | Annual Report | October 31, 2018
91
First Eagle High Yield Fund | Schedule of Investments | October 31, 2018
Investments | | Principal Amount ($) | | Value ($) | |
United States — 64.3% (continued) | |
B&G Foods, Inc.
5.25%, 4/1/2025 | | | 3,669,000 | | | | 3,494,722 | | |
Berry Global, Inc.
5.50%, 5/15/2022 | | | 332,000 | | | | 332,000 | | |
BWX Technologies, Inc.
5.38%, 7/15/2026 (a) | | | 168,000 | | | | 168,420 | | |
California Resources Corp.
8.00%, 12/15/2022 (a) | | | 4,244,000 | | | | 3,777,160 | | |
CCO Holdings LLC
5.25%, 9/30/2022 | | | 427,000 | | | | 429,135 | | |
Centene Corp.
5.63%, 2/15/2021 | | | 2,258,000 | | | | 2,291,870 | | |
4.75%, 5/15/2022 | | | 3,271,000 | | | | 3,275,089 | | |
CenturyLink, Inc.
Series S, 6.45%, 6/15/2021 | | | 1,984,000 | | | | 2,028,640 | | |
Series W, 6.75%, 12/1/2023 | | | 2,968,000 | | | | 3,027,360 | | |
Charles River Laboratories International, Inc.
5.50%, 4/1/2026 (a) | | | 89,000 | | | | 88,778 | | |
Charter Communications Operating LLC
4.91%, 7/23/2025 | | | 465,000 | | | | 466,981 | | |
Chemours Co. (The)
6.63%, 5/15/2023 | | | 2,202,000 | | | | 2,251,545 | | |
CITGO Petroleum Corp.
6.25%, 8/15/2022 (a) | | | 6,799,000 | | | | 6,697,015 | | |
Cloud Peak Energy Resources LLC
12.00%, 11/1/2021 | | | 7,629,000 | | | | 6,450,320 | | |
CNH Industrial Capital LLC
3.38%, 7/15/2019 | | | 200,000 | | | | 199,820 | | |
3.88%, 10/15/2021 | | | 1,559,000 | | | | 1,552,536 | | |
Cornerstone Chemical Co.
6.75%, 8/15/2024 (a) | | | 1,400,000 | | | | 1,359,750 | | |
Crown Americas LLC
4.50%, 1/15/2023 | | | 3,692,000 | | | | 3,618,160 | | |
4.75%, 2/1/2026 (a) | | | 1,844,000 | | | | 1,740,275 | | |
DCP Midstream Operating LP
4.75%, 9/30/2021 (a) | | | 5,186,000 | | | | 5,198,965 | | |
Dell International LLC
3.48%, 6/1/2019 (a) | | | 835,000 | | | | 836,045 | | |
7.13%, 6/15/2024 (a) | | | 4,740,000 | | | | 5,016,410 | | |
First Eagle Funds | Annual Report | October 31, 2018
92
First Eagle High Yield Fund | Schedule of Investments | October 31, 2018
Investments | | Principal Amount ($) | | Value ($) | |
United States — 64.3% (continued) | |
Diamond Offshore Drilling, Inc.
7.88%, 8/15/2025 | | | 982,000 | | | | 967,270 | | |
EMC Corp.
2.65%, 6/1/2020 | | | 3,800,000 | | | | 3,696,966 | | |
Energizer Gamma Acquisition BV
4.63%, 7/15/2026 (a) | | | 652,000 | | | | 756,211 | | |
EW Scripps Co. (The)
5.13%, 5/15/2025 (a) | | | 1,489,000 | | | | 1,399,660 | | |
FirstCash, Inc.
5.38%, 6/1/2024 (a) | | | 1,596,000 | | | | 1,572,060 | | |
Frontier Communications Corp.
7.13%, 3/15/2019 | | | 2,894,000 | | | | 2,901,235 | | |
8.50%, 4/1/2026 (a) | | | 584,000 | | | | 542,390 | | |
GameStop Corp.
5.50%, 10/1/2019 (a) | | | 7,251,000 | | | | 7,251,000 | | |
6.75%, 3/15/2021 (a) | | | 200,000 | | | | 201,500 | | |
Genesis Energy LP
6.00%, 5/15/2023 | | | 3,702,000 | | | | 3,489,135 | | |
6.50%, 10/1/2025 | | | 1,421,000 | | | | 1,310,872 | | |
GLP Capital LP
5.25%, 6/1/2025 | | | 3,627,000 | | | | 3,645,171 | | |
Harland Clarke Holdings Corp.
6.88%, 3/1/2020 (a) | | | 4,364,000 | | | | 4,287,630 | | |
HCA Healthcare, Inc.
6.25%, 2/15/2021 | | | 2,240,000 | | | | 2,326,800 | | |
HCA, Inc.
5.38%, 9/1/2026 | | | 2,419,000 | | | | 2,400,858 | | |
IQVIA, Inc.
4.88%, 5/15/2023 (a) | | | 2,928,000 | | | | 2,896,905 | | |
5.00%, 10/15/2026 (a) | | | 800,000 | | | | 771,000 | | |
JBS USA LUX SA
6.75%, 2/15/2028 (a) | | | 4,607,000 | | | | 4,439,996 | | |
KFC Holding Co.
5.00%, 6/1/2024 (a) | | | 3,845,000 | | | | 3,792,131 | | |
5.25%, 6/1/2026 (a) | | | 600,000 | | | | 589,500 | | |
KLX, Inc.
5.88%, 12/1/2022 (a) | | | 3,594,000 | | | | 3,701,820 | | |
Koppers, Inc.
6.00%, 2/15/2025 (a) | | | 471,000 | | | | 451,124 | | |
First Eagle Funds | Annual Report | October 31, 2018
93
First Eagle High Yield Fund | Schedule of Investments | October 31, 2018
Investments | | Principal Amount ($) | | Value ($) | |
United States — 64.3% (continued) | |
Lamb Weston Holdings, Inc.
4.63%, 11/1/2024 (a) | | | 1,939,000 | | | | 1,899,192 | | |
4.88%, 11/1/2026 (a) | | | 388,000 | | | | 374,420 | | |
Men's Wearhouse, Inc. (The)
7.00%, 7/1/2022 | | | 1,623,000 | | | | 1,663,575 | | |
Meredith Corp.
6.88%, 2/1/2026 (a) | | | 245,000 | | | | 245,000 | | |
MGIC Investment Corp.
5.75%, 8/15/2023 | | | 470,000 | | | | 481,750 | | |
NGL Energy Partners LP
7.50%, 11/1/2023 | | | 2,936,000 | | | | 2,880,950 | | |
Party City Holdings, Inc.
6.63%, 8/1/2026 (a) | | | 557,000 | | | | 541,682 | | |
Pilgrim's Pride Corp.
5.75%, 3/15/2025 (a) | | | 1,021,000 | | | | 952,083 | | |
5.88%, 9/30/2027 (a) | | | 638,000 | | | | 577,390 | | |
Plantronics, Inc.
5.50%, 5/31/2023 (a) | | | 1,696,000 | | | | 1,653,600 | | |
Post Holdings, Inc.
5.50%, 3/1/2025 (a) | | | 430,000 | | | | 416,025 | | |
Radian Group, Inc.
4.50%, 10/1/2024 | | | 233,000 | | | | 224,262 | | |
SBA Communications Corp.
4.88%, 9/1/2024 | | | 1,902,000 | | | | 1,835,430 | | |
Shea Homes LP
5.88%, 4/1/2023 (a) | | | 4,705,000 | | | | 4,446,225 | | |
Silgan Holdings, Inc.
5.50%, 2/1/2022 | | | 4,720,000 | | | | 4,743,600 | | |
Spectrum Brands, Inc.
5.75%, 7/15/2025 | | | 2,968,000 | | | | 2,886,380 | | |
Sprint Capital Corp.
6.90%, 5/1/2019 | | | 6,349,000 | | | | 6,432,108 | | |
Sprint Communications, Inc.
9.00%, 11/15/2018 (a) | | | 4,084,000 | | | | 4,092,168 | | |
7.00%, 8/15/2020 | | | 2,000,000 | | | | 2,070,000 | | |
Sprint Spectrum Co. LLC
3.36%, 9/20/2021 (a)(c) | | | 2,179,500 | | | | 2,157,705 | | |
Symantec Corp.
3.95%, 6/15/2022 | | | 918,000 | | | | 887,899 | | |
First Eagle Funds | Annual Report | October 31, 2018
94
First Eagle High Yield Fund | Schedule of Investments | October 31, 2018
Investments | | Principal Amount ($) | | Value ($) | |
United States — 64.3% (continued) | |
Taylor Morrison Communities, Inc.
5.88%, 4/15/2023 (a) | | | 3,228,000 | | | | 3,187,650 | | |
TEGNA, Inc.
5.13%, 7/15/2020 | | | 3,514,000 | | | | 3,514,000 | | |
Teleflex, Inc.
5.25%, 6/15/2024 | | | 472,000 | | | | 476,720 | | |
4.63%, 11/15/2027 | | | 264,000 | | | | 246,180 | | |
Tennant Co.
5.63%, 5/1/2025 | | | 235,000 | | | | 233,825 | | |
Ultra Resources, Inc.
7.13%, 4/15/2025 (a) | | | 3,868,000 | | | | 1,701,920 | | |
USG Corp.
4.88%, 6/1/2027 (a) | | | 360,000 | | | | 360,788 | | |
Valvoline, Inc.
5.50%, 7/15/2024 | | | 233,000 | | | | 231,544 | | |
4.38%, 8/15/2025 | | | 362,000 | | | | 333,945 | | |
Veritas US, Inc.
7.50%, 2/1/2023 (a) | | | 2,331,000 | | | | 2,208,623 | | |
Weight Watchers International, Inc.
8.63%, 12/1/2025 (a) | | | 2,774,000 | | | | 2,947,375 | | |
WellCare Health Plans, Inc.
5.38%, 8/15/2026 (a) | | | 279,000 | | | | 278,303 | | |
WESCO Distribution, Inc.
5.38%, 12/15/2021 | | | 4,523,000 | | | | 4,517,346 | | |
Western Digital Corp.
4.75%, 2/15/2026 | | | 531,000 | | | | 490,511 | | |
| | | | 209,565,673 | | |
Total Corporate Bonds
(Cost $266,129,093) | | | 263,310,385 | | |
Loan Assignments — 8.5% | |
United States — 8.5% | |
BI-LO Holding Finance LLC, First Lien Term Loan B
(ICE LIBOR USD 3 Month + 8.00%),
10.36%, 5/15/2024 (e) | | | 7,481,250 | | | | 7,378,383 | | |
BJ's Wholesale Club, Inc., Term Loan B
(ICE LIBOR USD 1 Month + 3.00%),
5.28%, 2/3/2024 (e) | | | 902,000 | | | | 903,552 | | |
First Eagle Funds | Annual Report | October 31, 2018
95
First Eagle High Yield Fund | Schedule of Investments | October 31, 2018
Investments | | Principal Amount ($) | | Value ($) | |
United States — 8.5% (continued) | |
Caelus Energy Alaska 03 LLC, Second Lien Term Loan
(ICE LIBOR USD 3 Month + 7.50%),
9.84%, 4/15/2020‡ (e) | | | 7,782,000 | | | | 7,120,530 | | |
OSG Bulk Ships, Inc., First Lien Term Loan B
(ICE LIBOR USD 3 Month + 4.25%),
6.77%, 8/5/2019‡ (e) | | | 3,310,048 | | | | 3,274,200 | | |
Osum Productions Corp., Term Loan
(ICE LIBOR USD 3 Month + 5.50%),
7.89%, 7/31/2020‡ (e) | | | 7,388,956 | | | | 6,797,839 | | |
Zebra Technologies Corp., Term Loan B
(ICE LIBOR USD 6 Month + 1.75%),
4.06%, 10/27/2021 (e) | | | 2,372,257 | | | | 2,378,519 | | |
| | | | 27,853,023 | | |
Total Loan Assignments
(Cost $28,694,229) | | | 27,853,023 | | |
| | | Shares | | | |
Common Stocks — 3.2% | |
United States — 3.2% | |
Southeastern Grocers, Inc.*‡ (f)
(Cost $7,855,278) | | | 257,973 | | | | 10,393,732 | | |
| | | Principal Amount ($) | | | |
Short-Term Investments — 5.8% | |
Commercial Paper — 5.8% | |
Anthem, Inc.
2.35%, 11/1/2018 (g) | | | 2,367,000 | | | | 2,366,845 | | |
Eni Finance USA, Inc.
2.37%, 11/1/2018 (g) | | | 3,527,000 | | | | 3,526,768 | | |
Hitachi America Capital Ltd.
2.37%, 11/1/2018 (g) | | | 12,993,000 | | | | 12,992,144 | | |
Total Commercial Paper
(Cost $18,887,000) | | | 18,885,757 | | |
First Eagle Funds | Annual Report | October 31, 2018
96
First Eagle High Yield Fund | Schedule of Investments | October 31, 2018
Investments | | Shares | | Value ($) | |
| Investment Companies — 0.0% (h) | |
JP Morgan U.S. Government Money Market Fund,
Agency Shares 1.98% (i)
(Cost $1,854) | | | 1,854 | | | | 1,854 | | |
Total Short-Term Investments
(Cost $18,888,854) | | | 18,887,611 | | |
Total Investments — 98.3%
(Cost $321,567,454) | | | 320,444,751 | | |
Other Assets Less Liabilities — 1.7% | | | 5,468,076 | | |
Net Assets — 100.0% | | | 325,912,827 | | |
* Non-income producing security.
‡ Value determined using significant unobservable inputs.
(a) Securities exempt from registration under Rule 144A or section 4(a)(2), of the Securities Act of 1933. Under procedures approved by the Board of Trustees, such securities have been determined to be liquid by the investment adviser and may be resold, normally to qualified institutional buyers in transactions exempt from registration.
(b) Payment in-kind security.
(c) Step bond. Interest rate is a fixed rate for an initial period that either resets at a specific date or may reset in the future at a contingent upon predetermined trigger. The interest rate shown was the current rate as of October 31, 2018.
(d) Security exempt from registration pursuant to Regulation S under the Securities Act of 1933. Regulation S applies to securities offerings that are made outside of the United States and do not involve direct selling efforts in the United States and as such may have restrictions on resale.
(e) Variable or floating rate security, linked to the referenced benchmark. The interest rate shown is the rate in effect as of October 31, 2018.
(f) Security fair valued as of October 31, 2018 in accordance with procedures approved by the Board of Trustees. Total value of all such securities at October 31, 2018 amounted to $10,393,732, which represents approximately 3.19% of net assets of the Fund.
(g) The rate shown was the current yield as of October 31, 2018.
(h) Represents less than 0.05% of net assets.
(i) Represents 7-day effective yield as of October 31, 2018.
As of October 31, 2018, the gross unrealized appreciation (depreciation) of investments based on the aggregate cost of investment securities and derivative instruments, if applicable, for federal income tax purposes was as follows:
Aggregate gross unrealized appreciation | | $ | 7,549,195 | | |
Aggregate gross unrealized depreciation | | | (8,680,018 | ) | |
Net unrealized depreciation | | $ | (1,130,823 | ) | |
Federal income tax cost | | $ | 321,604,219 | | |
First Eagle Funds | Annual Report | October 31, 2018
97
First Eagle High Yield Fund | Schedule of Investments | October 31, 2018
Forward Foreign Currency Exchange Contracts outstanding as of October 31, 2018
Currency
Purchased | | Currency Sold | |
Counterparty | | Settlement
Date | | Unrealized
Appreciation
(Depreciation) | |
USD | 784,198 | | | EUR | 657,000 | | | Bank of New York Mellon | | 04/17/2019 | | $ | 28,645 | | |
Net unrealized appreciation | | $ | 28,645 | | |
Abbreviations
EUR — Euro
ICE — Intercontinental Exchange
LIBOR — London Interbank Offered Rate
USD — United States Dollar
See Notes to Financial Statements.
First Eagle Funds | Annual Report | October 31, 2018
98
This page was intentionally left blank.
First Eagle Fund of America
Data as of October 31, 2018 (unaudited)
Investment Objective
The First Eagle Fund of America is a non-diversified U.S. equity fund that seeks capital appreciation by investing primarily in domestic stocks and, to a lesser extent, in debt and foreign equity securities. The Fund has a unique event-driven bias that focuses on identifying companies poised to benefit from change that the market has not yet recognized.
Average Annual Returns (%) | | One-Year | | Five-Years | | Ten-Years | |
| First Eagle Fund of America Class Y | | | -11.85 | | | | 3.13 | | | | 9.55 | | |
S&P 500 Index | | | 7.35 | | | | 11.34 | | | | 13.24 | | |
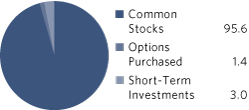
Sectors* (%)
Materials | | | 22.9 | | |
Information Technology | | | 16.9 | | |
Health Care | | | 16.1 | | |
Consumer Discretionary | | | 14.0 | | |
Industrials | | | 12.8 | | |
Financials | | | 5.7 | | |
Energy | | | 4.0 | | |
Consumer Staples | | | 3.0 | | |
Communication Services | | | 0.2 | | |
Options Purchased | | | 1.4 | | |
Short-Term Investments | | | 3.0 | | |
*Asset Allocation and Sector percentages are based on total investments in the portfolio.
The Fund's portfolio composition is subject to change at any time.
First Eagle Funds | Annual Report | October 31, 2018
100
First Eagle Fund of America | Fund Overview
Growth of a $10,000 Initial Investment
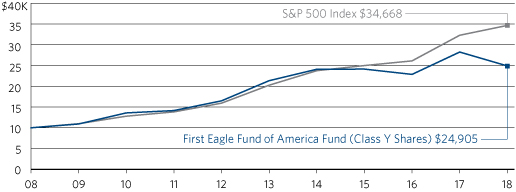
Performance data quoted herein represents past performance and should not be considered indicative of future results. Performance data quoted herein does not reflect the deduction of taxes that a shareholder would pay on Fund distributions or the sale of Fund shares.
The average annual returns shown above are historical and reflect changes in share price, reinvested dividends and are net of expenses.
The S&P 500 Index is a widely recognized unmanaged index including a representative sample of 500 leading companies in leading sectors of the U.S. economy. Although the S&P 500 Index focuses on the large-cap segment of the market, with approximately 80% coverage of U.S. equities, it is also considered a proxy for the total market. The S&P 500 Index includes dividends reinvested. One cannot invest directly in an index.
Top 10 Holdings* (%)
Packaging Corp. of America (Containers & Packaging, United States) | | | 5.9 | | |
HP, Inc. (Technology Hardware, Storage & Peripherals, United States) | | | 5.8 | | |
Martin Marietta Materials, Inc. (Construction Materials, United States) | | | 4.9 | | |
Wyndham Destinations, Inc. (Hotels, Restaurants & Leisure, United States) | | | 4.1 | | |
Chemours Co. (The) (Chemicals, United States) | | | 3.9 | | |
Ball Corp. (Containers & Packaging, United States) | | | 3.7 | | |
Anthem, Inc. (Health Care Providers & Services, United States) | | | 3.4 | | |
Albemarle Corp. (Chemicals, United States) | | | 3.2 | | |
Visteon Corp. (Auto Components, United States) | | | 3.2 | | |
ServiceMaster Global Holdings, Inc. (Diversified Consumer Services, United States) | | | 3.1 | | |
Total | | | 41.2 | | |
* Holdings in cash, commercial paper and other short-term cash equivalents have been excluded.
Percentages are based on total net assets.
First Eagle Funds | Annual Report | October 31, 2018
101
First Eagle Fund of America | Schedule of Investments | October 31, 2018
Investments | | Shares | | Value ($) | |
Common Stocks — 96.0% | |
Aerospace & Defense — 4.7% | |
Aerojet Rocketdyne Holdings, Inc.* (a) | | | 1,143,569 | | | | 40,390,857 | | |
General Dynamics Corp. (a) | | | 178,600 | | | | 30,822,788 | | |
| | | | 71,213,645 | | |
Auto Components — 3.2% | |
Visteon Corp.* | | | 618,826 | | | | 48,912,007 | | |
Biotechnology — 4.7% | |
Alexion Pharmaceuticals, Inc.* (a) | | | 270,582 | | | | 30,324,125 | | |
Halozyme Therapeutics, Inc.* | | | 2,173,089 | | | | 33,748,072 | | |
Intrexon Corp.* | | | 739,731 | | | | 8,551,290 | | |
| | | | 72,623,487 | | |
Capital Markets — 3.9% | |
Intercontinental Exchange, Inc. | | | 367,775 | | | | 28,333,386 | | |
KKR & Co. LP (a) | | | 1,339,711 | | | | 31,684,165 | | |
| | | | 60,017,551 | | |
Chemicals — 8.5% | |
Albemarle Corp. (a) | | | 493,915 | | | | 49,006,246 | | |
Chemours Co. (The) | | | 1,803,455 | | | | 59,532,050 | | |
Huntsman Corp. | | | 971,926 | | | | 21,265,741 | | |
| | | | 129,804,037 | | |
Construction & Engineering — 1.5% | |
frontdoor, Inc.* | | | 693,397 | | | | 23,610,168 | | |
Construction Materials — 4.9% | |
Martin Marietta Materials, Inc. (a) | | | 440,878 | | | | 75,513,584 | | |
Containers & Packaging — 9.6% | |
Ball Corp. | | | 1,259,997 | | | | 56,447,866 | | |
Packaging Corp. of America (a) | | | 989,634 | | | | 90,858,297 | | |
| | | | 147,306,163 | | |
Diversified Consumer Services — 3.1% | |
ServiceMaster Global Holdings, Inc.* | | | 1,120,801 | | | | 48,059,947 | | |
Electrical Equipment — 2.6% | |
nVent Electric plc (United Kingdom) (a) | | | 1,655,784 | | | | 40,434,245 | | |
Food Products — 3.0% | |
Post Holdings, Inc.* | | | 513,457 | | | | 45,399,868 | | |
First Eagle Funds | Annual Report | October 31, 2018
102
First Eagle Fund of America | Schedule of Investments | October 31, 2018
Investments | | Shares | | Value ($) | |
Health Care Providers & Services — 3.4% | |
Anthem, Inc. (a) | | | 190,085 | | | | 52,381,723 | | |
Hotels, Restaurants & Leisure — 6.7% | |
Wyndham Destinations, Inc. | | | 1,730,536 | | | | 62,091,632 | | |
Wyndham Hotels & Resorts, Inc. | | | 827,342 | | | | 40,779,687 | | |
| | | | 102,871,319 | | |
Insurance — 1.8% | |
Aon plc (a) | | | 177,089 | | | | 27,657,760 | | |
Internet & Direct Marketing Retail — 1.1% | |
eBay, Inc.* | | | 551,341 | | | | 16,005,429 | | |
IT Services — 1.3% | |
Conduent, Inc.* | | | 1,055,536 | | | | 20,160,738 | | |
Media — 0.2% | |
New York Times Co. (The), Class A (a) | | | 125,800 | | | | 3,321,120 | | |
Oil, Gas & Consumable Fuels — 4.0% | |
EQT Corp. | | | 657,635 | | | | 22,339,861 | | |
Marathon Petroleum Corp. (a) | | | 551,470 | | | | 38,851,061 | | |
| | | | 61,190,922 | | |
Pharmaceuticals — 8.0% | |
Allergan plc (a) | | | 194,700 | | | | 30,764,547 | | |
Innoviva, Inc.* (a) | | | 1,636,845 | | | | 22,850,356 | | |
Medicines Co. (The)* | | | 352,868 | | | | 8,207,710 | | |
Perrigo Co. plc (a) | | | 675,400 | | | | 47,480,620 | | |
TherapeuticsMD, Inc.* (a) | | | 2,824,565 | | | | 13,812,123 | | |
| | | | 123,115,356 | | |
Professional Services — 0.9% | |
Equifax, Inc. (a) | | | 130,916 | | | | 13,280,119 | | |
Semiconductors & Semiconductor Equipment — 5.6% | |
Cree, Inc.* (a) | | | 398,000 | | | | 15,450,360 | | |
Qorvo, Inc.* | | | 554,116 | | | | 40,733,067 | | |
Versum Materials, Inc. (a) | | | 934,301 | | | | 29,486,540 | | |
| | | | 85,669,967 | | |
Software — 2.5% | |
BlackBerry Ltd. (Canada)* | | | 4,056,906 | | | | 37,526,381 | | |
First Eagle Funds | Annual Report | October 31, 2018
103
First Eagle Fund of America | Schedule of Investments | October 31, 2018
Investments | | Shares | | Value ($) | |
Technology Hardware, Storage & Peripherals — 7.6% | |
HP, Inc. (a) | | | 3,697,870 | | | | 89,266,582 | | |
Western Digital Corp. | | | 558,993 | | | | 24,075,828 | | |
Xerox Corp. (a) | | | 119,400 | | | | 3,327,678 | | |
| | | | 116,670,088 | | |
Trading Companies & Distributors — 3.2% | |
HD Supply Holdings, Inc.* (a) | | | 176,817 | | | | 6,643,015 | | |
Univar, Inc.* | | | 1,700,709 | | | | 41,871,455 | | |
| | | | 48,514,470 | | |
Total Common Stocks
(Cost $1,368,661,756) | | | 1,471,260,094 | | |
| | | No. of Contracts | | | |
Options Purchased — 1.4% | |
Call Options — 1.4% | |
Exchange Traded | |
Capital Markets — 0.1% | |
Intercontinental Exchange, Inc. 01/18/2019 at USD 55
Notional Amount: USD 3,852,000 | | | 500 | | | | 1,137,500 | | |
Chemicals — 0.2% | |
Albemarle Corp. 01/18/2019 at USD 80
Notional Amount: USD 14,883,000 | | | 1,500 | | | | 3,202,500 | | |
Containers & Packaging — 0.2% | |
Ball Corp. 01/18/2019 at USD 32.5
Notional Amount: USD 2,387,840 | | | 533 | | | | 671,580 | | |
Ball Corp. 01/17/2020 at USD 37.5
Notional Amount: USD 13,440,000 | | | 3,000 | | | | 2,985,000 | | |
| | | | 3,656,580 | | |
Food Products — 0.2% | |
Post Holdings, Inc. 01/18/2019 at USD 50
Notional Amount: USD 4,421,000 | | | 500 | | | | 1,965,000 | | |
Tyson Foods, Inc. 01/17/2020 at USD 60
Notional Amount: USD 1,498,000 | | | 250 | | | | 175,000 | | |
| | | | 2,140,000 | | |
| Interactive Media & Services — 0.0% (b) | |
Snap, Inc. 01/17/2020 at USD 10
Notional Amount: USD 2,313,500 | | | 3,500 | | | | 248,500 | | |
First Eagle Funds | Annual Report | October 31, 2018
104
First Eagle Fund of America | Schedule of Investments | October 31, 2018
Investments | | No. of Contracts | | Value ($) | |
Professional Services — 0.5% | |
Equifax, Inc. 01/17/2020 at USD 80
Notional Amount: USD 25,360,000 | | | 2,500 | | | | 6,762,500 | | |
Equifax, Inc. 01/17/2020 at USD 85
Notional Amount: USD 5,072,000 | | | 500 | | | | 1,172,500 | | |
| | | | 7,935,000 | | |
Technology Hardware, Storage & Peripherals — 0.2% | |
Western Digital Corp. 01/17/2020 at USD 40
Notional Amount: USD 12,921,000 | | | 3,000 | | | | 2,445,000 | | |
Total Call Options | | | 20,765,080 | | |
| Put Options — 0.0% (b) | |
| Auto Components — 0.0% (b) | |
Visteon Corp. 11/16/2018 at USD 75
Notional Amount: USD 2,371,200 | | | 300 | | | | 39,750 | | |
Visteon Corp. 12/21/2018 at USD 85
Notional Amount: USD 3,161,600 | | | 400 | | | | 312,000 | | |
| | | | 351,750 | | |
| Construction Materials — 0.0% (b) | |
Martin Marietta Materials, Inc. 11/16/2018 at USD 170
Notional Amount: USD 6,851,200 | | | 400 | | | | 276,000 | | |
Total Put Options | | | 627,750 | | |
Total Options Purchased
(Cost $34,739,633) | | | 21,392,830 | | |
| | Shares | | | |
Short-Term Investments — 3.0% | |
Investment Companies — 3.0% | |
JP Morgan U.S. Government Money Market Fund,
Agency Shares, 1.98% (c)
(Cost $45,456,524) | | | 45,456,524 | | | | 45,456,524 | | |
Total Investments — 100.4%
(Cost $1,448,857,913) | | | 1,538,109,448 | | |
Liabilities in Excess of Other Assets — (0.4%) | | | (6,681,335 | ) | |
Net Assets — 100.0% | | | 1,531,428,113 | | |
* Non-income producing security.
(a) All or a portion of the security pledged as collateral for call options written.
First Eagle Funds | Annual Report | October 31, 2018
105
First Eagle Fund of America | Schedule of Investments | October 31, 2018
(b) Represents less than 0.05% of net assets.
(c) Represents 7-day effective yield as of October 31, 2018.
As of October 31, 2018, the gross unrealized appreciation (depreciation) of investments based on the aggregate cost of investment securities and derivative instruments, if applicable, for federal income tax purposes was as follows:
Aggregate gross unrealized appreciation | | $ | 227,034,587 | | |
Aggregate gross unrealized depreciation | | | (132,666,120 | ) | |
Net unrealized appreciation | | $ | 94,368,467 | | |
Federal income tax cost | | $ | 1,438,824,711 | | |
Written Call Options Contracts as of October 31, 2018:
Description | | Counterparty | | Number of
Contracts | | Notional
Amount | | Exercise
Price | | Expiration
Date | | Value ($) | |
Aerojet Rocketdyne
Holdings, Inc. | | Exchange Traded | | | 2,288 | | | USD | (8,081,216 | ) | | USD | 35.00 | | | 12/21/2018 | | | (526,240 | ) | |
Albemarle Corp. | | Exchange Traded | | | 34 | | | USD | (337,348 | ) | | USD | 100.00 | | | 12/21/2018 | | | (17,782 | ) | |
Alexion
Pharmaceuticals, Inc. | | Exchange Traded | | | 556 | | | USD | (6,231,092 | ) | | USD | 135.00 | | | 01/18/2019 | | | (82,010 | ) | |
Allergan plc | | Exchange Traded | | | 95 | | | USD | (1,501,095 | ) | | USD | 170.00 | | | 12/21/2018 | | | (25,745 | ) | |
Allergan plc | | Exchange Traded | | | 86 | | | USD | (1,358,886 | ) | | USD | 185.00 | | | 12/21/2018 | | | (6,192 | ) | |
Allergan plc | | Exchange Traded | | | 1,142 | | | USD | (18,044,742 | ) | | USD | 190.00 | | | 11/16/2018 | | | (7,994 | ) | |
Allergan plc | | Exchange Traded | | | 624 | | | USD | (9,859,824 | ) | | USD | 195.00 | | | 11/16/2018 | | | (2,496 | ) | |
Anthem, Inc. | | Exchange Traded | | | 113 | | | USD | (3,113,941 | ) | | USD | 270.00 | | | 12/21/2018 | | | (125,995 | ) | |
Anthem, Inc. | | Exchange Traded | | | 71 | | | USD | (1,956,547 | ) | | USD | 280.00 | | | 12/21/2018 | | | (47,393 | ) | |
Aon plc | | Exchange Traded | | | 135 | | | USD | (2,108,430 | ) | | USD | 150.00 | | | 01/18/2019 | | | (132,300 | ) | |
Aon plc | | Exchange Traded | | | 69 | | | USD | (1,077,642 | ) | | USD | 155.00 | | | 01/18/2019 | | | (44,850 | ) | |
Cree, Inc. | | Exchange Traded | | | 425 | | | USD | (1,649,850 | ) | | USD | 37.00 | | | 12/21/2018 | | | (148,750 | ) | |
Cree, Inc. | | Exchange Traded | | | 1,945 | | | USD | (7,550,490 | ) | | USD | 39.00 | | | 11/16/2018 | | | (295,640 | ) | |
Cree, Inc. | | Exchange Traded | | | 199 | | | USD | (772,518 | ) | | USD | 39.00 | | | 12/21/2018 | | | (52,138 | ) | |
Cree, Inc. | | Exchange Traded | | | 1,197 | | | USD | (4,646,754 | ) | | USD | 40.00 | | | 11/16/2018 | | | (135,261 | ) | |
Cree, Inc. | | Exchange Traded | | | 214 | | | USD | (830,748 | ) | | USD | 40.00 | | | 12/21/2018 | | | (40,660 | ) | |
Equifax, Inc. | | Exchange Traded | | | 156 | | | USD | (1,582,464 | ) | | USD | 135.00 | | | 01/18/2019 | | | (1,560 | ) | |
General
Dynamics Corp. | | Exchange Traded | | | 437 | | | USD | (7,541,746 | ) | | USD | 195.00 | | | 11/16/2018 | | | (2,185 | ) | |
General
Dynamics Corp. | | Exchange Traded | | | 251 | | | USD | (4,331,758 | ) | | USD | 200.00 | | | 11/16/2018 | | | (1,255 | ) | |
General
Dynamics Corp. | | Exchange Traded | | | 1,098 | | | USD | (18,949,284 | ) | | USD | 205.00 | | | 11/16/2018 | | | (3,294 | ) | |
HD Supply
Holdings, Inc. | | Exchange Traded | | | 285 | | | USD | (1,070,745 | ) | | USD | 40.00 | | | 11/16/2018 | | | (4,987 | ) | |
HP, Inc. | | Exchange Traded | | | 489 | | | USD | (1,180,446 | ) | | USD | 24.00 | | | 01/18/2019 | | | (69,438 | ) | |
HP, Inc. | | Exchange Traded | | | 2,661 | | | USD | (6,423,654 | ) | | USD | 25.00 | | | 01/18/2019 | | | (250,134 | ) | |
Innoviva, Inc. | | Exchange Traded | | | 2,484 | | | USD | (3,467,664 | ) | | USD | 15.00 | | | 12/21/2018 | | | (124,200 | ) | |
Innoviva, Inc. | | Exchange Traded | | | 3,840 | | | USD | (5,360,640 | ) | | USD | 15.00 | | | 01/18/2019 | | | (249,600 | ) | |
KKR & Co., Inc. | | Exchange Traded | | | 330 | | | USD | (780,450 | ) | | USD | 25.00 | | | 01/18/2019 | | | (29,700 | ) | |
First Eagle Funds | Annual Report | October 31, 2018
106
First Eagle Fund of America | Schedule of Investments | October 31, 2018
Written Call Options Contracts as of October 31, 2018: (continued)
Description | | Counterparty | | Number of
Contracts | | Notional
Amount | | Exercise
Price | | Expiration
Date | | Value ($) | |
Marathon
Petroleum Corp. | | Exchange Traded | | | 222 | | | USD | (1,563,990 | ) | | USD | 80.00 | | | 12/21/2018 | | | (21,978 | ) | |
Marathon
Petroleum Corp. | | Exchange Traded | | | 441 | | | USD | (3,106,845 | ) | | USD | 80.00 | | | 01/18/2019 | | | (76,734 | ) | |
Marathon
Petroleum Corp. | | Exchange Traded | | | 858 | | | USD | (6,044,610 | ) | | USD | 82.50 | | | 11/16/2018 | | | (12,870 | ) | |
Marathon
Petroleum Corp. | | Exchange Traded | | | 1,302 | | | USD | (9,172,590 | ) | | USD | 85.00 | | | 11/16/2018 | | | (18,228 | ) | |
Martin Marietta
Materials, Inc. | | Exchange Traded | | | 500 | | | USD | (8,564,000 | ) | | USD | 175.00 | | | 01/18/2019 | | | (490,000 | ) | |
New York Times
Co. (The) | | Exchange Traded | | | 1,258 | | | USD | (3,321,120 | ) | | USD | 27.00 | | | 12/21/2018 | | | (160,395 | ) | |
nVent Electric plc | | Exchange Traded | | | 979 | | | USD | (2,390,718 | ) | | USD | 25.00 | | | 12/21/2018 | | | (105,243 | ) | |
Packaging Corp.
of America | | Exchange Traded | | | 500 | | | USD | (4,590,500 | ) | | USD | 90.00 | | | 01/18/2019 | | | (315,000 | ) | |
Packaging Corp.
of America | | Exchange Traded | | | 95 | | | USD | (872,195 | ) | | USD | 95.00 | | | 11/16/2018 | | | (11,875 | ) | |
Perrigo Co. plc | | Exchange Traded | | | 681 | | | USD | (4,787,430 | ) | | USD | 70.00 | �� | | 11/16/2018 | | | (207,705 | ) | |
Perrigo Co. plc | | Exchange Traded | | | 6,073 | | | USD | (42,693,190 | ) | | USD | 75.00 | | | 11/16/2018 | | | (765,198 | ) | |
TherapeuticsMD,
Inc. | | Exchange Traded | | | 3,167 | | | USD | (1,548,663 | ) | | USD | 7.00 | | | 12/21/2018 | | | (47,505 | ) | |
Versum
Materials, Inc. | | Exchange Traded | | | 200 | | | USD | (631,200 | ) | | USD | 35.00 | | | 12/21/2018 | | | (5,000 | ) | |
Xerox Corp. | | Exchange Traded | | | 1,194 | | | USD | (3,327,678 | ) | | USD | 27.00 | | | 01/18/2019 | | | (250,740 | ) | |
Total Written Options Contracts (Premiums Received ($10,177,653)) | | | | | | | | | | | | | (4,916,270 | ) | |
Abbreviations
USD — United States Dollar
See Notes to Financial Statements.
First Eagle Funds | Annual Report | October 31, 2018
107
Statements of Assets and Liabilities
| | | First Eagle
Global Fund* | | First Eagle
Overseas Fund* | |
Assets | |
Investments, at Cost (Note 1) | |
Investments in securities of unaffiliated issuers | | $ | 35,677,274,173 | | | $ | 10,696,204,842 | | |
Investments in securities of affiliated issuers | | | 1,710,567,705 | | | | 197,124,724 | | |
Gold bullion | | | 3,796,826,237 | | | | 943,190,896 | | |
Silver bullion | | | — | | | | — | | |
Foreign currency | | | — | | | | 8 | | |
Investments, at Value (Note 1) | |
Investments in securities of unaffiliated issuers | | | 44,841,660,127 | | | | 12,592,261,232 | | |
Investments in securities of affiliated issuers | | | 1,745,432,703 | | | | 565,064,052 | | |
Gold bullion | | | 4,296,577,677 | | | | 1,205,722,763 | | |
Silver bullion | | | — | | | | — | | |
Foreign currency | | | — | | | | 8 | | |
Cash | | | — | | | | 4,245 | | |
Unrealized appreciation on forward foreign currency exchange contracts | | | 67,541,601 | | | | 37,729,437 | | |
Receivable for investment securities sold | | | 147,013,086 | | | | 178,693,310 | | |
Foreign tax reclaims receivable | | | 41,623,930 | | | | 27,263,080 | | |
Receivable for Fund shares sold | | | 33,892,310 | | | | 30,144,705 | | |
Accrued interest and dividends receivable | | | 114,595,188 | | | | 54,187,846 | | |
Due from custodian | | | — | | | | — | | |
Investment for trustee deferred compensation plan (Note 2) | | | 3,689,335 | | | | 3,198,248 | | |
Other assets | | | 183,356 | | | | 59,756 | | |
Total Assets | | | 51,292,209,313 | | | | 14,694,328,682 | | |
Liabilities | |
Investment advisory fees payable (Note 2) | | | 33,389,366 | | | | 9,558,314 | | |
Payable for investment securities purchased | | | 9,271,114 | | | | 85,935,773 | | |
Distribution fees payable (Note 3) | | | 8,360,821 | | | | 930,298 | | |
Administrative fees payable (Note 2) | | | 329,959 | | | | 151,266 | | |
Trustee deferred compensation plan (Note 2) | | | 3,689,335 | | | | 3,198,248 | | |
Service fees payable (Note 3) | | | 1,890,798 | | | | 150,778 | | |
Trustee fees payable | | | 119,734 | | | | 30,888 | | |
Payable for Fund shares redeemed | | | 67,394,103 | | | | 35,205,329 | | |
Accrued expenses and other liabilities | | | 26,616,509 | | | | 11,740,874 | | |
Total Liabilities | | | 151,061,739 | | | | 146,901,768 | | |
Net Assets | | $ | 51,141,147,574 | | | $ | 14,547,426,914 | | |
Net Assets Consist of | |
Capital stock (par value, $0.001 per share) | | | 910,265 | | | | 629,669 | | |
Capital surplus | | | 39,205,883,350 | | | | 12,275,885,434 | | |
Total distributable earnings (losses) | | | 11,934,353,959 | | | | 2,270,911,811 | | |
Net Assets | | $ | 51,141,147,574 | | | $ | 14,547,426,914 | | |
First Eagle Funds | Annual Report | October 31, 2018
108
Year Ended October 31, 2018
| | | First Eagle
U.S. Value Fund* | | First Eagle
Gold Fund* | |
Assets | |
Investments, at Cost (Note 1) | |
Investments in securities of unaffiliated issuers | | $ | 1,225,976,656 | | | $ | 814,186,512 | | |
Investments in securities of affiliated issuers | | | — | | | | — | | |
Gold bullion | | | 178,239,069 | | | | 80,913,060 | | |
Silver bullion | | | — | | | | 65,023,010 | | |
Foreign currency | | | — | | | | — | | |
Investments, at Value (Note 1) | |
Investments in securities of unaffiliated issuers | | | 1,641,840,094 | | | | 677,519,280 | | |
Investments in securities of affiliated issuers | | | — | | | | — | | |
Gold bullion | | | 181,952,654 | | | | 146,629,913 | | |
Silver bullion | | | — | | | | 51,070,641 | | |
Foreign currency | | | — | | | | — | | |
Cash | | | 88 | | | | — | | |
Unrealized appreciation on forward foreign currency exchange contracts | | | — | | | | — | | |
Receivable for investment securities sold | | | 8,492,114 | | | | 156,432 | | |
Foreign tax reclaims receivable | | | — | | | | — | | |
Receivable for Fund shares sold | | | 361,681 | | | | 615,482 | | |
Accrued interest and dividends receivable | | | 1,443,482 | | | | 318 | | |
Due from custodian | | | — | | | | 507,779 | | |
Investment for trustee deferred compensation plan (Note 2) | | | 3,042,070 | | | | 133,517 | | |
Other assets | | | 90,939 | | | | 6,316 | | |
Total Assets | | | 1,837,223,122 | | | | 876,639,678 | | |
Liabilities | |
Investment advisory fees payable (Note 2) | | | 1,191,121 | | | | 577,322 | | |
Payable for investment securities purchased | | | 94,226 | | | | 820,081 | | |
Distribution fees payable (Note 3) | | | 364,861 | | | | 139,105 | | |
Administrative fees payable (Note 2) | | | 41,572 | | | | 38,359 | | |
Trustee deferred compensation plan (Note 2) | | | 3,042,070 | | | | 133,517 | | |
Service fees payable (Note 3) | | | 78,853 | | | | 24,715 | | |
Trustee fees payable | | | 11,494 | | | | 6,460 | | |
Payable for Fund shares redeemed | | | 2,617,464 | | | | 1,281,600 | | |
Accrued expenses and other liabilities | | | 603,176 | | | | 659,617 | | |
Total Liabilities | | | 8,044,837 | | | | 3,680,776 | | |
Net Assets | | $ | 1,829,178,285 | | | $ | 872,958,902 | | |
Net Assets Consist of | |
Capital stock (par value, $0.001 per share) | | | 92,043 | | | | 66,488 | | |
Capital surplus | | | 1,172,773,066 | | | | 1,561,857,286 | | |
Total distributable earnings (losses) | | | 656,313,176 | | | | (688,964,872 | ) | |
Net Assets | | $ | 1,829,178,285 | | | $ | 872,958,902 | | |
First Eagle Funds | Annual Report | October 31, 2018
109
Statements of Assets and Liabilities (continued)
| | | First Eagle
Global Fund* | | First Eagle
Overseas Fund* | |
Class A | |
Net assets | | $ | 12,357,123,518 | | | $ | 2,173,764,524 | | |
Shares outstanding | | | 219,232,910 | | | | 95,702,399 | | |
Net asset value per share and redemption proceeds per share | | $ | 56.37 | | | $ | 22.71 | | |
Offering price per share (NAV per share plus maximum sales charge)** | | $ | 59.34 | (1) | | $ | 23.91 | (1) | |
Class C | |
Net assets | | $ | 8,667,512,430 | | | $ | 687,318,352 | | |
Shares outstanding | | | 160,174,219 | | | | 31,631,117 | | |
Net asset value per share and redemption proceeds per share | | $ | 54.11 | | | $ | 21.73 | | |
Redemption proceeds per share (NAV per share less maximum contingent
deferred sale charge)(2) | | $ | 53.57 | | | $ | 21.51 | | |
Class I | |
Net assets | | $ | 29,334,133,668 | | | $ | 11,093,973,066 | | |
Shares outstanding | | | 517,074,173 | | | | 476,883,544 | | |
Net asset value per share and redemption proceeds per share | | $ | 56.73 | | | $ | 23.26 | | |
Class R3 | |
Net assets | | $ | 48,028 | | | $ | 46,261 | | |
Shares outstanding | | | 848 | | | | 1,992 | | |
Net asset value per share and redemption proceeds per share | | $ | 56.62 | | | $ | 23.22 | | |
Class R4 | |
Net assets | | $ | 116,533 | | | $ | 77,987 | | |
Shares outstanding | | | 2,055 | | | | 3,357 | | |
Net asset value per share and redemption proceeds per share | | $ | 56.70 | | | $ | 23.23 | | |
Class R6 | |
Net assets | | $ | 782,213,397 | | | $ | 592,246,724 | | |
Shares outstanding | | | 13,781,064 | | | | 25,446,909 | | |
Net asset value per share and redemption proceeds per share | | $ | 56.76 | | | $ | 23.27 | | |
* First Eagle Global Fund, First Eagle Overseas Fund, First Eagle U.S. Value Fund and First Eagle Gold Fund financial statements are shown on a consolidated basis and includes the balances of the First Eagle Global Cayman Fund, Ltd., First Eagle Overseas Cayman Fund, Ltd., First Eagle U.S. Value Cayman Fund, Ltd., and First Eagle Gold Cayman Fund, Ltd., respectively.
** A contingent deferred sales charge of 1.00% may apply on redemptions of Class A shares made within 18 months following a purchase of $1,000,000 or more without an initial sales charge.
(1) The maximum sales charge is 5.00% for Class A shares. Classes C, I, R3, R4 and R6 have no front-end sales charges.
(2) The maximum contingent deferred sales charge (CDSC) is 1.00% for Class C shares, which is charged on the lesser of the original purchase price or the current market value at the time of sale. This pertains to shares sold or redeemed within the first year of purchase.
See Notes to Financial Statements.
First Eagle Funds | Annual Report | October 31, 2018
110
Year Ended October 31, 2018
| | | First Eagle
U.S. Value Fund* | | First Eagle
Gold Fund* | |
Class A | |
Net assets | | $ | 590,921,654 | | | $ | 294,509,214 | | |
Shares outstanding | | | 29,715,273 | | | | 22,516,480 | | |
Net asset value per share and redemption proceeds per share | | $ | 19.89 | | | $ | 13.08 | | |
Offering price per share (NAV per share plus maximum sales charge)** | | $ | 20.94 | (1) | | $ | 13.77 | (1) | |
Class C | |
Net assets | | $ | 361,605,702 | | | $ | 111,685,160 | | |
Shares outstanding | | | 19,003,194 | | | | 9,240,028 | | |
Net asset value per share and redemption proceeds per share | | $ | 19.03 | | | $ | 12.09 | | |
Redemption proceeds per share (NAV per share less maximum contingent
deferred sale charge)(2) | | $ | 18.84 | | | $ | 11.97 | | |
Class I | |
Net assets | | $ | 875,239,139 | | | $ | 392,309,761 | | |
Shares outstanding | | | 43,254,719 | | | | 29,200,296 | | |
Net asset value per share and redemption proceeds per share | | $ | 20.23 | | | $ | 13.44 | | |
Class R3 | |
Net assets | | $ | 49,589 | | | $ | 41,088 | | |
Shares outstanding | | | 2,455 | | | | 3,058 | | |
Net asset value per share and redemption proceeds per share | | $ | 20.20 | | | $ | 13.44 | | |
Class R4 | |
Net assets | | $ | — | | | $ | — | | |
Shares outstanding | | | — | | | | — | | |
Net asset value per share and redemption proceeds per share | | $ | — | | | $ | — | | |
Class R6 | |
Net assets | | $ | 1,362,201 | | | $ | 74,413,679 | | |
Shares outstanding | | | 67,312 | | | | 5,528,002 | | |
Net asset value per share and redemption proceeds per share | | $ | 20.24 | | | $ | 13.46 | | |
First Eagle Funds | Annual Report | October 31, 2018
111
Statements of Assets and Liabilities (continued)
| | | First Eagle
Global Income
Builder Fund | | First Eagle
High Yield Fund | |
Assets | |
Investments, at Cost (Note 1) | |
Investments in securities of unaffiliated issuers | | $ | 1,257,280,554 | | | $ | 321,567,454 | | |
Gold bullion | | | 56,212,542 | | | | — | | |
Investments, at Value (Note 1) | |
Investments in securities of unaffiliated issuers | | | 1,294,081,739 | | | | 320,444,751 | | |
Gold bullion | | | 55,065,632 | | | | — | | |
Cash | | | — | | | | — | | |
Unrealized appreciation on forward foreign currency exchange contracts | | | 1,818,158 | | | | 28,645 | | |
Receivable for investment securities sold | | | 2,101,227 | | | | 3,268 | | |
Foreign tax reclaims receivable | | | 1,576,867 | | | | — | | |
Receivable for Fund shares sold | | | 2,223,373 | | | | 1,499,759 | | |
Accrued interest and dividends receivable | | | 7,762,761 | | | | 5,195,110 | | |
Investment for trustee deferred compensation plan (Note 2) | | | 360,748 | | | | 229,110 | | |
Other assets | | | 7,092 | | | | 33,820 | | |
Total Assets | | | 1,364,997,597 | | | | 327,434,463 | | |
Liabilities | |
Investment advisory fees payable (Note 2) | | | 884,692 | | | | 195,693 | | |
Option contracts written, at value (premiums received $—, $— and
$10,177,653, respectively) | | | — | | | | — | | |
Payable for investment securities purchased | | | 120,619 | | | | — | | |
Distribution fees payable (Note 3) | | | 262,293 | | | | 57,654 | | |
Administrative fees payable (Note 2) | | | 58,981 | | | | 13,957 | | |
Trustee deferred compensation plan (Note 2) | | | 360,748 | | | | 229,110 | | |
Service fees payable (Note 3) | | | 64,459 | | | | 13,620 | | |
Trustee fees payable | | | 5,184 | | | | 3,410 | | |
Payable for dividends to shareholders | | | 235,065 | | | | 230,477 | | |
Payable for Fund shares redeemed | | | 2,347,920 | | | | 553,116 | | |
Accrued expenses and other liabilities | | | 570,200 | | | | 224,599 | | |
Total Liabilities | | | 4,910,161 | | | | 1,521,636 | | |
Net Assets | | $ | 1,360,087,436 | | | $ | 325,912,827 | | |
Net Assets Consist of | |
Capital stock (par value, $0.001 per share) | | $ | 118,962 | | | $ | 36,995 | | |
Capital surplus | | | 1,345,716,038 | | | | 438,273,950 | | |
Total distributable earnings (losses) | | | 14,252,436 | | | | (112,398,118 | ) | |
Net Assets | | $ | 1,360,087,436 | | | $ | 325,912,827 | | |
First Eagle Funds | Annual Report | October 31, 2018
112
Year Ended October 31, 2018
| | | First Eagle
Fund of America | |
Assets | |
Investments, at Cost (Note 1) | |
Investments in securities of unaffiliated issuers | | $ | 1,448,857,913 | | |
Gold bullion | | | — | | |
Investments, at Value (Note 1) | |
Investments in securities of unaffiliated issuers | | | 1,538,109,448 | | |
Gold bullion | | | — | | |
Cash | | | 54,866 | | |
Unrealized appreciation on forward foreign currency exchange contracts | | | — | | |
Receivable for investment securities sold | | | 8,463,524 | | |
Foreign tax reclaims receivable | | | — | | |
Receivable for Fund shares sold | | | 520,769 | | |
Accrued interest and dividends receivable | | | 578,588 | | |
Investment for trustee deferred compensation plan (Note 2) | | | 1,465,090 | | |
Other assets | | | 8,000 | | |
Total Assets | | | 1,549,200,285 | | |
Liabilities | |
Investment advisory fees payable (Note 2) | | | 1,266,676 | | |
Option contracts written, at value (premiums received $—, $— and
$10,177,653, respectively) | | | 4,916,270 | | |
Payable for investment securities purchased | | | 3,412,360 | | |
Distribution fees payable (Note 3) | | | 320,204 | | |
Administrative fees payable (Note 2) | | | 30,655 | | |
Trustee deferred compensation plan (Note 2) | | | 1,465,090 | | |
Service fees payable (Note 3) | | | 55,958 | | |
Trustee fees payable | | | 13,509 | | |
Payable for dividends to shareholders | | | — | | |
Payable for Fund shares redeemed | | | 5,568,827 | | |
Accrued expenses and other liabilities | | | 722,623 | | |
Total Liabilities | | | 17,772,172 | | |
Net Assets | | $ | 1,531,428,113 | | |
Net Assets Consist of | |
Capital stock (par value, $0.001 per share) | | $ | 51,472 | | |
Capital surplus | | | 1,175,052,822 | | |
Total distributable earnings (losses) | | | 356,323,819 | | |
Net Assets | | $ | 1,531,428,113 | | |
First Eagle Funds | Annual Report | October 31, 2018
113
Statements of Assets and Liabilities (continued)
| | | First Eagle
Global Income
Builder Fund | | First Eagle
High Yield Fund | |
Class A | |
Net assets | | $ | 319,002,933 | | | $ | 78,360,484 | | |
Shares outstanding | | | 27,849,865 | | | | 8,895,935 | | |
Net asset value per share and redemption proceeds per share | | $ | 11.45 | | | $ | 8.81 | | |
Offering price per share (NAV per share plus maximum sales charge)* | | $ | 12.05 | (1) | | $ | 9.23 | (2) | |
Class C | |
Net assets | | $ | 297,716,004 | | | $ | 62,749,062 | | |
Shares outstanding | | | 26,061,630 | | | | 7,129,539 | | |
Net asset value per share and redemption proceeds per share | | $ | 11.42 | | | $ | 8.80 | | |
Redemption proceeds per share (NAV per share less maximum
contingent deferred sale charge)(3) | | $ | 11.31 | | | $ | 8.71 | | |
Class I | |
Net assets | | $ | 742,408,474 | | | $ | 184,351,367 | | |
Shares outstanding | | | 64,965,979 | | | | 20,917,848 | | |
Net asset value per share and redemption proceeds per share | | $ | 11.43 | | | $ | 8.81 | | |
Class Y | |
Net assets | | $ | — | | | $ | — | | |
Shares outstanding | | | — | | | | — | | |
Net asset value per share and redemption proceeds per share | | $ | — | | | $ | — | | |
Class R3 | |
Net assets | | $ | 48,478 | | | $ | 50,702 | | |
Shares outstanding | | | 4,242 | | | | 5,749 | | |
Net asset value per share and redemption proceeds per share | | $ | 11.43 | | | $ | 8.82 | | |
Class R6 | |
Net assets | | $ | 911,547 | | | $ | 401,212 | | |
Shares outstanding | | | 79,820 | | | | 45,515 | | |
Net asset value per share and redemption proceeds per share | | $ | 11.42 | | | $ | 8.82 | | |
* A contingent deferred sales charge of 1.00% may apply on redemptions of Class A shares made within 18 months following a purchase of $1,000,000 or more without an initial sales charge.
(1) The maximum sales charge is 5.00% for Class A shares. Classes C, I, Y (for First Eagle Fund of America only), R3 and R6 have no front-end sales charges.
(2) The maximum sales charge is 4.50% for Class A shares. Classes C, I, R3 and R6 have no front-end sales charges.
(3) The maximum contingent deferred sales charge (CDSC) is 1.00% for Class C shares, which is charged on the lesser of the original purchase price or the current market value at the time of sale. This pertains to shares sold or redeemed within the first year of purchase.
See Notes to Financial Statements.
First Eagle Funds | Annual Report | October 31, 2018
114
Year Ended October 31, 2018
| | | First Eagle
Fund of America | |
Class A | |
Net assets | | $ | 388,960,675 | | |
Shares outstanding | | | 12,740,195 | | |
Net asset value per share and redemption proceeds per share | | $ | 30.53 | | |
Offering price per share (NAV per share plus maximum sales charge)* | | $ | 32.14 | (1) | |
Class C | |
Net assets | | $ | 244,239,803 | | |
Shares outstanding | | | 10,138,909 | | |
Net asset value per share and redemption proceeds per share | | $ | 24.09 | | |
Redemption proceeds per share (NAV per share less maximum
contingent deferred sale charge)(3) | | $ | 23.85 | | |
Class I | |
Net assets | | $ | 612,844,513 | | |
Shares outstanding | | | 19,478,878 | | |
Net asset value per share and redemption proceeds per share | | $ | 31.46 | | |
Class Y | |
Net assets | | $ | 280,976,834 | | |
Shares outstanding | | | 8,973,610 | | |
Net asset value per share and redemption proceeds per share | | $ | 31.31 | | |
Class R3 | |
Net assets | | $ | 44,621 | | |
Shares outstanding | | | 1,421 | | |
Net asset value per share and redemption proceeds per share | | $ | 31.40 | | |
Class R6 | |
Net assets | | $ | 4,361,667 | | |
Shares outstanding | | | 138,622 | | |
Net asset value per share and redemption proceeds per share | | $ | 31.46 | | |
First Eagle Funds | Annual Report | October 31, 2018
115
| | | First Eagle
Global Fund* | | First Eagle
Overseas Fund* | |
Investment Income | |
Interest (net of $372,503, $243,360, $— and $—, foreign taxes withheld) | | $ | 213,746,356 | | | $ | 65,972,152 | | |
Dividends from: (net of $43,239,578, $26,230,764, $199,506 and $473,986
foreign taxes withheld) | |
Unaffiliated issuers | | | 854,221,585 | | | | 304,733,988 | | |
Affiliated issuers | | | 27,599,852 | | | | 8,801,829 | | |
Total Income | | | 1,095,567,793 | | | | 379,507,969 | | |
Expenses | |
Investment advisory fees (Note 2) | | | 421,073,300 | | | | 129,329,359 | | |
Distributions fees (Note 3) | | | | | |
Class A | | | 35,124,327 | | | | 6,873,391 | | |
Class C | | | 74,902,357 | | | | 6,196,663 | | |
Class R4 | | | 87 | | | | 64 | | |
Class R3 | | | 63 | | | | 61 | | |
Shareholder servicing agent fees | | | 36,714,049 | | | | 11,721,620 | | |
Service fees (Note 3) | | | | | |
Class C | | | 24,967,452 | | | | 2,065,554 | | |
Class R3 | | | 25 | | | | 24 | | |
Administrative Costs (Note 2) | | | 3,374,890 | | | | 1,446,109 | | |
Professional fees | | | 794,708 | | | | 772,453 | | |
Custodian and accounting fees | | | 8,233,485 | | | | 3,410,990 | | |
Shareholder reporting fees | | | 2,772,696 | | | | 1,048,875 | | |
Trustees' fees | | | 1,213,165 | | | | 381,864 | | |
Registration and filing fees | | | 776,373 | | | | 434,128 | | |
Other expenses | | | 908,545 | | | | 303,565 | | |
Total Expenses | | | 610,855,522 | | | | 163,984,720 | | |
Expense waiver | | | — | | | | — | | |
Expense reductions due to earnings credits (Note 1) | | | (270,990 | ) | | | (52,211 | ) | |
Net Expenses | | | 610,584,532 | | | | 163,932,509 | | |
Net Investment Income (Loss) (Note 1) | | | 484,983,261 | | | | 215,575,460 | | |
Realized and Unrealized Gains ( Losses) on Investments and Foreign
Currency Related Transactions (Note 1) | |
Net realized gains (losses) from: | |
Transactions in investment securities of unaffiliated issuers | | | 2,501,776,202 | | | | 184,513,420 | | |
Transactions in investment securities of affiliated issuers | | | 26,009,160 | | | | 32,673,961 | | |
Commodity related transactions | | | — | | | | 14,093,804 | | |
Settlement of foreign currency and foreign currency transactions | | | (3,827,702 | ) | | | (2,909,055 | ) | |
Settlement of forward foreign currency exchange contracts | | | 80,959,085 | | | | 44,134,138 | | |
| | | | 2,604,916,745 | | | | 272,506,268 | | |
Changes in unrealized appreciation (depreciation) of: | |
Investment securities of unaffiliated issuers and commodity related transactions
(net of increase in deferred capital gain country tax accruals of $4,424,398,
$2,198,708, $— and $—) | | | (3,971,812,795 | ) | | | (1,632,006,313 | ) | |
Investment securities of affiliated issuers | | | (564,226,273 | ) | | | (31,852,323 | ) | |
Foreign currency and foreign currency translations | | | (9,835,856 | ) | | | (4,421,295 | ) | |
Forward foreign currency exchange contracts | | | 37,655,927 | | | | 22,017,598 | | |
| | | | (4,508,218,997 | ) | | | (1,646,262,333 | ) | |
Net realized and unrealized gains (losses) on investments, commodity, foreign
currency and forward contract related transactions | | | (1,903,302,252 | ) | | | (1,373,756,065 | ) | |
Net Increase (Decrease) in Net Assets Resulting from Operations | | $ | (1,418,318,991 | ) | | $ | (1,158,180,605 | ) | |
* First Eagle Global Fund, First Eagle Overseas Fund, First Eagle U.S. Value Fund and First Eagle Gold Fund financial statements are shown on a consolidated basis and includes the balances of the First Eagle Global Cayman Fund, Ltd., First Eagle Overseas Cayman Fund, Ltd., First Eagle U.S. Value Cayman Fund, Ltd., and First Eagle Gold Cayman Fund, Ltd., respectively.
See Notes to Financial Statements.
First Eagle Funds | Annual Report | October 31, 2018
116
Year Ended October 31, 2018
| | | First Eagle
U.S. Value Fund* | | First Eagle
Gold Fund* | |
Investment Income | |
Interest (net of $372,503, $243,360, $— and $—, foreign taxes withheld) | | $ | 7,752,896 | | | $ | 472,175 | | |
Dividends from: (net of $43,239,578, $26,230,764, $199,506 and $473,986
foreign taxes withheld) | |
Unaffiliated issuers | | | 25,728,371 | | | | 8,676,708 | | |
Affiliated issuers | | | — | | | | — | | |
Total Income | | | 33,481,267 | | | | 9,148,883 | | |
Expenses | |
Investment advisory fees (Note 2) | | | 15,102,384 | | | | 8,179,994 | | |
Distributions fees (Note 3) | | | | | |
Class A | | | 1,660,977 | | | | 963,628 | | |
Class C | | | 3,115,053 | | | | 1,086,391 | | |
Class R4 | | | — | | | | — | | |
Class R3 | | | 64 | | | | 58 | | |
Shareholder servicing agent fees | | | 1,403,536 | | | | 1,361,081 | | |
Service fees (Note 3) | | | | | |
Class C | | | 1,038,351 | | | | 362,130 | | |
Class R3 | | | 26 | | | | 23 | | |
Administrative Costs (Note 2) | | | 406,230 | | | | 378,423 | | |
Professional fees | | | 245,308 | | | | 203,558 | | |
Custodian and accounting fees | | | 336,559 | | | | 605,950 | | |
Shareholder reporting fees | | | 180,406 | | | | 194,696 | | |
Trustees' fees | | | 60,964 | | | | 38,965 | | |
Registration and filing fees | | | 101,142 | | | | 100,593 | | |
Other expenses | | | 54,367 | | | | 36,282 | | |
Total Expenses | | | 23,705,367 | | | | 13,511,772 | | |
Expense waiver | | | (1,006,855 | ) | | | — | | |
Expense reductions due to earnings credits (Note 1) | | | (13,146 | ) | | | (18,632 | ) | |
Net Expenses | | | 22,685,366 | | | | 13,493,140 | | |
Net Investment Income (Loss) (Note 1) | | | 10,795,901 | | | | (4,344,257 | ) | |
Realized and Unrealized Gains ( Losses) on Investments and Foreign
Currency Related Transactions (Note 1) | |
Net realized gains (losses) from: | |
Transactions in investment securities of unaffiliated issuers | | | 245,739,724 | | | | (51,118,227 | ) | |
Transactions in investment securities of affiliated issuers | | | — | | | | — | | |
Commodity related transactions | | | (41,716 | ) | | | 19,014,419 | | |
Settlement of foreign currency and foreign currency transactions | | | 3,011 | | | | (65,531 | ) | |
Settlement of forward foreign currency exchange contracts | | | — | | | | (20,453 | ) | |
| | | | 245,701,019 | | | | (32,189,792 | ) | |
Changes in unrealized appreciation (depreciation) of: | |
Investment securities of unaffiliated issuers and commodity related transactions
(net of increase in deferred capital gain country tax accruals of $4,424,398,
$2,198,708, $— and $—) | | | (209,202,255 | ) | | | (204,999,935 | ) | |
Investment securities of affiliated issuers | | | — | | | | — | | |
Foreign currency and foreign currency translations | | | (16 | ) | | | 198 | | |
Forward foreign currency exchange contracts | | | — | | | | — | | |
| | | | (209,202,271 | ) | | | (204,999,737 | ) | |
Net realized and unrealized gains (losses) on investments, commodity, foreign
currency and forward contract related transactions | | | 36,498,748 | | | | (237,189,529 | ) | |
Net Increase (Decrease) in Net Assets Resulting from Operations | | $ | 47,294,649 | | | $ | (241,533,786 | ) | |
First Eagle Funds | Annual Report | October 31, 2018
117
Statements of Operations (continued)
| | | First Eagle
Global Income
Builder Fund | | First Eagle
High Yield Fund | |
Investment Income | |
Interest | | $ | 25,471,389 | | | $ | 24,135,714 | | |
Non-cash dividend income from non-affiliates | | | — | | | | — | | |
Dividends from: (net of $1,329,562, $—and $—foreign taxes withheld) | |
Unaffiliated issuers | | | 22,171,141 | | | | 6,259 | | |
Total Income | | | 47,642,530 | | | | 24,141,973 | | |
Expenses | |
Investment advisory fees (Note 2) | | | 10,854,568 | | | | 2,629,900 | | |
Distributions fees (Note 3) | | | | | |
Class A | | | 860,026 | | | | 215,237 | | |
Class C | | | 2,451,831 | | | | 553,130 | | |
Class Y | | | — | | | | — | | |
Class R3 | | | 63 | | | | 63 | | |
Shareholder servicing agent fees | | | 922,911 | | | | 269,181 | | |
Service fees (Note 3) | | | | | |
Class C | | | 817,277 | | | | 184,377 | | |
Class R3 | | | 25 | | | | 25 | | |
Administrative Costs (Note 2) | | | 723,659 | | | | 187,855 | | |
Professional fees | | | 275,687 | | | | 291,177 | | |
Custodian and accounting fees | | | 277,676 | | | | 118,683 | | |
Shareholder reporting fees | | | 99,943 | | | | 57,167 | | |
Trustees' fees | | | 32,845 | | | | 13,210 | | |
Registration and filing fees | | | 139,968 | | | | 105,534 | | |
Other expenses | | | 48,436 | | | | 20,434 | | |
Total Expenses | | | 17,504,915 | | | | 4,645,973 | | |
Expense waiver | | | — | | | | (244,615 | ) | |
Expense reductions due to earnings credits (Note 1) | | | (5,611 | ) | | | (3,307 | ) | |
Net Expenses | | | 17,499,304 | | | | 4,398,051 | | |
Net Investment Income (Loss) (Note 1) | | | 30,143,226 | | | | 19,743,922 | | |
Realized and Unrealized Gains ( Losses) on Investments and Foreign
Currency Related Transactions (Note 1) | |
Net realized gains (losses) from: | |
Transactions in investment securities of unaffiliated issuers | | | 25,219,336 | | | | (18,325,915 | ) | |
Settlement of foreign currency and foreign currency transactions | | | (26,223 | ) | | | (791 | ) | |
Settlement of forward foreign currency exchange contracts | | | 1,358,322 | | | | — | | |
Expiration or closing of option contracts written | | | — | | | | — | | |
| | | | 26,551,435 | | | | (18,326,706 | ) | |
Changes in unrealized appreciation (depreciation) of: | |
Investment securities of unaffiliated issuers and commodity related transactions
(net of increase in deferred capital gain country tax accruals of $106,608,
$— and $—) | | | (95,377,713 | ) | | | 7,699,692 | | |
Foreign currency and foreign currency translations | | | (43,026 | ) | | | 3,130 | | |
Forward foreign currency exchange contracts | | | 1,600,358 | | | | 28,645 | | |
Option contracts written | | | — | | | | — | | |
| | | | (93,820,381 | ) | | | 7,731,467 | | |
Net realized and unrealized gains (losses) on investments, commodity, foreign
currency, forward contract related transactions and option contracts written | | | (67,268,946 | ) | | | (10,595,239 | ) | |
Net Increase (Decrease) in Net Assets Resulting from Operations | | $ | (37,125,720 | ) | | $ | 9,148,683 | | |
See Notes to Financial Statements.
First Eagle Funds | Annual Report | October 31, 2018
118
Year Ended October 31, 2018
| | |
First Eagle
Fund of America | |
Investment Income | |
Interest | | $ | — | | |
Non-cash dividend income from non-affiliates | | | 8,695,348 | | |
Dividends from: (net of $1,329,562, $—and $—foreign taxes withheld) | |
Unaffiliated issuers | | | 23,409,194 | | |
Total Income | | | 32,104,542 | | |
Expenses | |
Investment advisory fees (Note 2) | | | 18,362,634 | | |
Distributions fees (Note 3) | | | |
Class A | | | 1,365,512 | | |
Class C | | | 2,609,656 | | |
Class Y | | | 899,418 | | |
Class R3 | | | 63 | | |
Shareholder servicing agent fees | | | 1,735,017 | | |
Service fees (Note 3) | | | |
Class C | | | 869,885 | | |
Class R3 | | | 25 | | |
Administrative Costs (Note 2) | | | 350,889 | | |
Professional fees | | | 296,617 | | |
Custodian and accounting fees | | | 207,107 | | |
Shareholder reporting fees | | | 217,357 | | |
Trustees' fees | | | 54,137 | | |
Registration and filing fees | | | 125,817 | | |
Other expenses | | | 53,811 | | |
Total Expenses | | | 27,147,945 | | |
Expense waiver | | | — | | |
Expense reductions due to earnings credits (Note 1) | | | (15,218 | ) | |
Net Expenses | | | 27,132,727 | | |
Net Investment Income (Loss) (Note 1) | | | 4,971,815 | | |
Realized and Unrealized Gains ( Losses) on Investments and Foreign
Currency Related Transactions (Note 1) | |
Net realized gains (losses) from: | |
Transactions in investment securities of unaffiliated issuers | | | 283,264,124 | | |
Settlement of foreign currency and foreign currency transactions | | | — | | |
Settlement of forward foreign currency exchange contracts | | | — | | |
Expiration or closing of option contracts written | | | 20,254,505 | | |
| | | | 303,518,629 | | |
Changes in unrealized appreciation (depreciation) of: | |
Investment securities of unaffiliated issuers and commodity related transactions
(net of increase in deferred capital gain country tax accruals of $106,608,
$— and $—) | | | (540,064,203 | ) | |
Foreign currency and foreign currency translations | | | — | | |
Forward foreign currency exchange contracts | | | — | | |
Option contracts written | | | 24,327,553 | | |
| | | | (515,736,650 | ) | |
Net realized and unrealized gains (losses) on investments, commodity, foreign
currency, forward contract related transactions and option contracts written | | | (212,218,021 | ) | |
Net Increase (Decrease) in Net Assets Resulting from Operations | | $ | (207,246,206 | ) | |
First Eagle Funds | Annual Report | October 31, 2018
119
Statements of Changes in Net Assets
| | | First Eagle
Global Fund* | | First Eagle
Overseas Fund* | |
| | | For the
Year Ended
October 31, 2018 | | For the
Year Ended
October 31, 2017 | | For the
Year Ended
October 31, 2018 | | For the
Year Ended
October 31, 2017 | |
Operations | |
Net investment income (loss) | | $ | 484,983,261 | | | $ | 236,849,953 | | | $ | 215,575,460 | | | $ | 123,383,935 | | |
Net realized gain (loss) from investments, commodity, foreign currency
and forward contract related transactions | | | 2,604,916,745 | | | | 2,083,625,061 | | | | 272,506,268 | | | | 336,933,456 | | |
Change in unrealized appreciation (depreciation) of investments,
commodity, foreign currency and forward contract related translations | | | (4,508,218,997 | ) | | | 3,897,988,176 | | | | (1,646,262,333 | ) | | | 1,197,561,090 | | |
Net increase (decrease) in net assets resulting from operations | | | (1,418,318,991 | ) | | | 6,218,463,190 | | | | (1,158,180,605 | ) | | | 1,657,878,481 | | |
Distributions to Shareholders | |
Distributable earnings:^^^^ | |
Class A | | | (606,752,965 | ) | | | (710,643,933 | ) | | | (100,523,358 | ) | | | (118,857,257 | ) | |
Class C | | | (370,678,418 | ) | | | (487,764,922 | ) | | | (25,248,888 | ) | | | (26,858,990 | ) | |
Class I | | | (1,358,148,668 | ) | | | (1,094,366,774 | ) | | | (479,285,134 | ) | | | (387,063,937 | ) | |
Class R6 | | | (33,607,589 | ) | | | — | | | | (23,065,085 | ) | | | — | | |
Decrease in net assets resulting from distributions | | | (2,369,187,640 | ) | | | (2,292,775,629 | ) | | | (628,122,465 | ) | | | (532,780,184 | ) | |
Fund Share Transactions | |
Class A | |
Net proceeds from shares sold | | | 1,224,551,719 | | | | 2,239,895,559 | | | | 276,528,849 | | | | 529,453,901 | | |
Net asset value of shares issued for reinvested dividends and distributions | | | 544,413,334 | | | | 638,085,356 | | | | 93,872,905 | | | | 111,162,700 | | |
Cost of shares redeemed | | | (3,388,063,113 | ) | | | (4,880,034,139 | ) | | | (1,020,086,506 | ) | | | (1,379,970,033 | ) | |
Redemption fees | | | — | | | | — | | | | — | | | | — | | |
Decrease in net assets from Fund share transactions | | | (1,619,098,060 | ) | | | (2,002,053,224 | ) | | | (649,684,752 | ) | | | (739,353,432 | ) | |
Class C | |
Net proceeds from shares sold | | | 648,500,231 | | | | 1,116,551,788 | | | | 52,222,243 | | | | 117,061,472 | | |
Net asset value of shares issued for reinvested dividends and distributions | | | 317,174,866 | | | | 382,599,134 | | | | 22,590,698 | | | | 22,220,344 | | |
Cost of shares redeemed | | | (2,206,072,081 | ) | | | (3,133,222,946 | ) | | | (200,225,033 | ) | | | (286,365,623 | ) | |
Redemption fees | | | — | | | | — | | | | — | | | | — | | |
Decrease in net assets from Fund share transactions | | | (1,240,396,984 | ) | | | (1,634,072,024 | ) | | | (125,412,092 | ) | | | (147,083,807 | ) | |
Class I | |
Net proceeds from shares sold | | | 6,499,724,308 | | | | 10,305,344,539 | | | | 2,741,081,613 | | | | 4,802,530,508 | | |
Net asset value of shares issued for reinvested dividends and distributions | | | 1,111,628,598 | | | | 900,996,012 | | | | 415,932,811 | | | | 342,899,769 | | |
Cost of shares redeemed | | | (7,019,996,696 | ) | | | (4,798,591,803 | ) | | | (4,545,773,336 | ) | | | (2,789,737,757 | ) | |
Redemption fees | | | — | | | | — | | | | — | | | | — | | |
Increase (decrease) in net assets from Fund share transactions | | | 591,356,210 | | | | 6,407,748,748 | | | | (1,388,758,912 | ) | | | 2,355,692,520 | | |
Class R3^ | |
Net proceeds from shares sold | | | 50,000 | | | | — | | | | 50,000 | | | | — | | |
Increase in net assets from Fund share transactions | | | 50,000 | | | | — | | | | 50,000 | | | | — | | |
Class R4^^ | |
Net proceeds from shares sold | | | 137,253 | | | | — | | | | 87,819 | | | | — | | |
Cost of shares redeemed | | | (11,405 | ) | | | — | | | | (203 | ) | | | — | | |
Increase in net assets from Fund share transactions | | | 125,848 | | | | — | | | | 87,616 | | | | — | | |
First Eagle Funds | Annual Report | October 31, 2018
120
| | | First Eagle
U.S. Value Fund* | | First Eagle
Gold Fund* | |
| | | For the
Year Ended
October 31, 2018 | | For the
Year Ended
October 31, 2017 | | For the
Year Ended
October 31, 2018 | | For the
Year Ended
October 31, 2017 | |
Operations | |
Net investment income (loss) | | $ | 10,795,901 | | | $ | 5,227,948 | | | $ | (4,344,257 | ) | | $ | (6,302,265 | ) | |
Net realized gain (loss) from investments, commodity, foreign currency
and forward contract related transactions | | | 245,701,019 | | | | 192,760,506 | | | | (32,189,792 | ) | | | 839,314 | | |
Change in unrealized appreciation (depreciation) of investments,
commodity, foreign currency and forward contract related translations | | | (209,202,271 | ) | | | 108,231,973 | | | | (204,999,737 | ) | | | (106,978,992 | ) | |
Net increase (decrease) in net assets resulting from operations | | | 47,294,649 | | | | 306,220,427 | | | | (241,533,786 | ) | | | (112,441,943 | ) | |
Distributions to Shareholders | |
Distributable earnings:^^^^ | |
Class A | | | (58,503,100 | ) | | | (66,751,876 | ) | | | — | | | | — | | |
Class C | | | (37,627,194 | ) | | | (42,476,226 | ) | | | — | | | | — | | |
Class I | | | (80,531,112 | ) | | | (72,317,467 | ) | | | — | | | | — | | |
Class R6 | | | (71,031 | ) | | | — | | | | — | | | | — | | |
Decrease in net assets resulting from distributions | | | (176,732,437 | ) | | | (181,545,569 | ) | | | — | | | | — | | |
Fund Share Transactions | |
Class A | |
Net proceeds from shares sold | | | 41,991,739 | | | | 82,727,632 | | | | 61,982,742 | | | | 110,635,120 | | |
Net asset value of shares issued for reinvested dividends and distributions | | | 52,538,244 | | | | 59,840,597 | | | | 70 | | | | 35 | | |
Cost of shares redeemed | | | (178,377,316 | ) | | | (286,594,995 | ) | | | (136,640,148 | ) | | | (179,964,453 | ) | |
Redemption fees | | | — | | | | — | | | | 45,462 | | | | 66,076 | | |
Decrease in net assets from Fund share transactions | | | (83,847,333 | ) | | | (144,026,766 | ) | | | (74,611,874 | ) | | | (69,263,222 | ) | |
Class C | |
Net proceeds from shares sold | | | 19,152,245 | | | | 27,574,152 | | | | 14,619,282 | | | | 26,139,387 | | |
Net asset value of shares issued for reinvested dividends and distributions | | | 33,057,577 | | | | 34,634,629 | | | | — | | | | — | | |
Cost of shares redeemed | | | (108,975,779 | ) | | | (153,626,770 | ) | | | (36,873,080 | ) | | | (47,914,073 | ) | |
Redemption fees | | | — | | | | — | | | | 5,150 | | | | 6,498 | | |
Decrease in net assets from Fund share transactions | | | (56,765,957 | ) | | | (91,417,989 | ) | | | (22,248,648 | ) | | | (21,768,188 | ) | |
Class I | |
Net proceeds from shares sold | | | 120,630,775 | | | | 299,984,767 | | | | 227,960,479 | | | | 318,561,550 | | |
Net asset value of shares issued for reinvested dividends and distributions | | | 60,673,897 | | | | 52,602,873 | | | | — | | | | — | | |
Cost of shares redeemed | | | (232,350,174 | ) | | | (268,071,184 | ) | | | (283,488,512 | ) | | | (221,458,786 | ) | |
Redemption fees | | | — | | | | — | | | | 21,428 | | | | 121,602 | | |
Increase (decrease) in net assets from Fund share transactions | | | (51,045,502 | ) | | | 84,516,456 | | | | (55,506,605 | ) | | | 97,224,366 | | |
Class R3^ | |
Net proceeds from shares sold | | | 50,000 | | | | — | | | | 50,000 | | | | — | | |
Increase in net assets from Fund share transactions | | | 50,000 | | | | — | | | | 50,000 | | | | — | | |
Class R4^^ | |
Net proceeds from shares sold | | | — | | | | — | | | | — | | | | — | | |
Cost of shares redeemed | | | — | | | | — | | | | — | | | | — | | |
Increase in net assets from Fund share transactions | | | — | | | | — | | | | — | | | | — | | |
First Eagle Funds | Annual Report | October 31, 2018
121
Statements of Changes in Net Assets (continued)
| | | First Eagle
Global Fund* | | First Eagle
Overseas Fund* | |
| | | For the
Year Ended
October 31, 2018 | | For the
Year Ended
October 31, 2017 | | For the
Year Ended
October 31, 2018 | | For the
Year Ended
October 31, 2017 | |
Class R6^^^ | |
Net proceeds from shares sold | | $ | 418,628,764 | | | $ | 820,033,768 | | | $ | 384,435,275 | | | $ | 540,062,232 | | |
Net asset value of shares issued for reinvested dividends and distributions | | | 33,558,622 | | | | — | | | | 23,065,086 | | | | — | | |
Cost of shares redeemed | | | (459,798,650 | ) | | | (9,261,788 | ) | | | (288,110,948 | ) | | | (11,793,007 | ) | |
Redemption fees | | | — | | | | — | | | | — | | | | — | | |
Increase (decrease) in net assets from Fund share transactions | | | (7,611,264 | ) | | | 810,771,980 | | | | 119,389,413 | | | | 528,269,225 | | |
Total Increase (Decrease) in net assets from Fund share transactions | | | (2,275,574,250 | ) | | | 3,582,395,480 | | | | (2,044,328,727 | ) | | | 1,997,524,506 | | |
Net increase (decrease) in net assets | | | (6,063,080,881 | ) | | | 7,508,083,041 | | | | (3,830,631,797 | ) | | | 3,122,622,803 | | |
Net Assets (Note 1) | |
Beginning of period | | | 57,204,228,455 | | | | 49,696,145,414 | | | | 18,378,058,711 | | | | 15,255,435,908 | | |
End of period | | $ | 51,141,147,574 | | | $ | 57,204,228,455 | | | $ | 14,547,426,914 | | | $ | 18,378,058,711 | | |
Changes in Shares Outstanding | |
Class A | |
Shares outstanding, beginning of period | | | 246,545,224 | | | | 280,933,042 | | | | 122,500,903 | | | | 153,138,562 | | |
Shares sold | | | 20,697,314 | | | | 39,204,294 | | | | 11,304,528 | | | | 22,144,084 | | |
Shares issued on reinvestment of distributions | | | 9,295,122 | | | | 11,746,785 | | | | 3,834,666 | | | | 4,984,874 | | |
Shares redeemed | | | (57,304,750 | ) | | | (85,338,897 | ) | | | (41,937,698 | ) | | | (57,766,617 | ) | |
Shares outstanding, end of period | | | 219,232,910 | | | | 246,545,224 | | | | 95,702,399 | | | | 122,500,903 | | |
Class C | |
Shares outstanding, beginning of period | | | 182,160,833 | | | | 211,222,427 | | | | 37,041,061 | | | | 43,332,631 | | |
Shares sold | | | 11,194,246 | | | | 20,312,161 | | | | 2,206,972 | | | | 5,083,647 | | |
Shares issued on reinvestment of distributions | | | 5,603,815 | | | | 7,277,898 | | | | 958,525 | | | | 1,032,544 | | |
Shares redeemed | | | (38,784,675 | ) | | | (56,651,653 | ) | | | (8,575,441 | ) | | | (12,407,761 | ) | |
Shares outstanding, end of period | | | 160,174,219 | | | | 182,160,833 | | | | 31,631,117 | | | | 37,041,061 | | |
Class I | |
Shares outstanding, beginning of period | | | 507,106,244 | | | | 394,308,490 | | | | 533,805,436 | | | | 434,854,042 | | |
Shares sold | | | 109,292,609 | | | | 179,518,720 | | | | 109,068,698 | | | | 197,313,320 | | |
Shares issued on reinvestment of distributions | | | 18,902,049 | | | | 16,519,912 | | | | 16,630,658 | | | | 15,065,895 | | |
Shares redeemed | | | (118,226,729 | ) | | | (83,240,878 | ) | | | (182,621,248 | ) | | | (113,427,821 | ) | |
Shares outstanding, end of period | | | 517,074,173 | | | | 507,106,244 | | | | 476,883,544 | | | | 533,805,436 | | |
Class R3^ | |
Shares outstanding, beginning of period | | | — | | | | — | | | | — | | | | — | | |
Shares sold | | | 848 | | | | — | | | | 1,992 | | | | — | | |
Shares outstanding, end of period | | | 848 | | | | — | | | | 1,992 | | | | — | | |
Class R4^^ | |
Shares outstanding, beginning of period | | | — | | | | — | | | | — | | | | — | | |
Shares sold | | | 2,247 | | | | — | | | | 3,365 | | | | — | | |
Shares redeemed | | | (192 | ) | | | — | | | | (8 | ) | | | — | | |
Shares outstanding, end of period | | | 2,055 | | | | — | | | | 3,357 | | | | — | | |
First Eagle Funds | Annual Report | October 31, 2018
122
| | | First Eagle
U.S. Value Fund* | | First Eagle
Gold Fund* | |
| | | For the
Year Ended
October 31, 2018 | | For the
Year Ended
October 31, 2017 | | For the
Year Ended
October 31, 2018 | | For the
Year Ended
October 31, 2017 | |
Class R6^^^ | |
Net proceeds from shares sold | | $ | 663,125 | | | $ | 836,047 | | | $ | 76,362,008 | | | $ | 16,243,055 | | |
Net asset value of shares issued for reinvested dividends and distributions | | | 71,031 | | | | — | | | | — | | | | — | | |
Cost of shares redeemed | | | (131,066 | ) | | | (45,596 | ) | | | (2,068,602 | ) | | | (46,839 | ) | |
Redemption fees | | | — | | | | — | | | | 861 | | | | — | | |
Increase (decrease) in net assets from Fund share transactions | | | 603,090 | | | | 790,451 | | | | 74,294,267 | | | | 16,196,216 | | |
Total Increase (Decrease) in net assets from Fund share transactions | | | (191,005,702 | ) | | | (150,137,848 | ) | | | (78,022,860 | ) | | | 22,389,172 | | |
Net increase (decrease) in net assets | | | (320,443,490 | ) | | | (25,462,990 | ) | | | (319,556,646 | ) | | | (90,052,771 | ) | |
Net Assets (Note 1) | |
Beginning of period | | | 2,149,621,775 | | | | 2,175,084,765 | | | | 1,192,515,548 | | | | 1,282,568,319 | | |
End of period | | $ | 1,829,178,285 | | | $ | 2,149,621,775 | | | $ | 872,958,902 | | | $ | 1,192,515,548 | | |
Changes in Shares Outstanding | |
Class A | |
Shares outstanding, beginning of period | | | 33,712,629 | | | | 40,709,944 | | | | 27,337,437 | | | | 31,497,163 | | |
Shares sold | | | 2,059,229 | | | | 4,101,533 | | | | 3,977,822 | | | | 6,635,824 | | |
Shares issued on reinvestment of distributions | | | 2,650,765 | | | | 3,065,602 | | | | — | | | | 2 | | |
Shares redeemed | | | (8,707,350 | ) | | | (14,164,450 | ) | | | (8,798,779 | ) | | | (10,795,552 | ) | |
Shares outstanding, end of period | | | 29,715,273 | | | | 33,712,629 | | | | 22,516,480 | | | | 27,337,437 | | |
Class C | |
Shares outstanding, beginning of period | | | 21,838,438 | | | | 26,415,358 | | | | 10,807,036 | | | | 12,212,791 | | |
Shares sold | | | 981,512 | | | | 1,414,994 | | | | 1,020,450 | | | | 1,645,536 | | |
Shares issued on reinvestment of distributions | | | 1,731,670 | | | | 1,824,796 | | | | — | | | | — | | |
Shares redeemed | | | (5,548,426 | ) | | | (7,816,710 | ) | | | (2,587,458 | ) | | | (3,051,291 | ) | |
Shares outstanding, end of period | | | 19,003,194 | | | | 21,838,438 | | | | 9,240,028 | | | | 10,807,036 | | |
Class I | |
Shares outstanding, beginning of period | | | 45,508,156 | | | | 41,273,073 | | | | 33,122,412 | | | | 27,731,345 | | |
Shares sold | | | 5,837,062 | | | | 14,624,892 | | | | 14,150,900 | | | | 18,423,884 | | |
Shares issued on reinvestment of distributions | | | 3,015,601 | | | | 2,656,711 | | | | — | | | | — | | |
Shares redeemed | | | (11,106,100 | ) | | | (13,046,520 | ) | | | (18,073,016 | ) | | | (13,032,817 | ) | |
Shares outstanding, end of period | | | 43,254,719 | | | | 45,508,156 | | | | 29,200,296 | | | | 33,122,412 | | |
Class R3^ | |
Shares outstanding, beginning of period | | | — | | | | — | | | | — | | | | — | | |
Shares sold | | | 2,455 | | | | — | | | | 3,058 | | | | — | | |
Shares outstanding, end of period | | | 2,455 | | | | — | | | | 3,058 | | | | — | | |
Class R4^^ | |
Shares outstanding, beginning of period | | | — | | | | — | | | | — | | | | — | | |
Shares sold | | | — | | | | — | | | | — | | | | — | | |
Shares redeemed | | | — | | | | — | | | | — | | | | — | | |
Shares outstanding, end of period | | | — | | | | — | | | | — | | | | — | | |
First Eagle Funds | Annual Report | October 31, 2018
123
Statements of Changes in Net Assets (continued)
| | | First Eagle
Global Fund* | | First Eagle
Overseas Fund* | |
| | | For the
Year Ended
October 31, 2018 | | For the
Year Ended
October 31, 2017 | | For the
Year Ended
October 31, 2018 | | For the
Year Ended
October 31, 2017 | |
Class R6^^^ | |
Shares outstanding, beginning of period | | | 13,935,723 | | | | — | | | | 21,010,387 | | | | — | | |
Shares sold | | | 7,052,137 | | | | 14,091,924 | | | | 15,054,091 | | | | 21,470,832 | | |
Shares issued on reinvestment of distributions | | | 570,628 | | | | — | | | | 922,603 | | | | — | | |
Shares redeemed | | | (7,777,424 | ) | | | (156,201 | ) | | | (11,540,172 | ) | | | (460,445 | ) | |
Shares outstanding, end of period | | | 13,781,064 | | | | 13,935,723 | | | | 25,446,909 | | | | 21,010,387 | | |
* First Eagle Global Fund, First Eagle Overseas Fund, First Eagle U.S. Value Fund and First Eagle Gold Fund financial statements are shown on a consolidated basis and includes the balances of the First Eagle Global Cayman Fund, Ltd., First Eagle Overseas Cayman Fund, Ltd., First Eagle U.S. Value Cayman Fund, Ltd., and First Eagle Gold Cayman Fund, Ltd., respectively.
^ Represents the period from May 1, 2018 to October 31, 2018.
^^ Represents the period from January 17, 2018 to October 31, 2018.
^^^ Represents the year ended October 31, 2018 and the period from March 1, 2017 to October 31, 2017.
^^^^ The U.S. GAAP basis of distributions paid to shareholders during the fiscal year ended October 31, 2017 was as follows:
| | | Dividends Paid from Net Investment Income | |
| | | First Eagle
Global Fund | | First Eagle
Overseas Fund | | First Eagle
U.S. Value Fund | | First Eagle
Gold Fund | |
Class A | | | (57,446,218 | ) | | | (38,288,285 | ) | | | (1,396,770 | ) | | | — | | |
Class C | | | — | | | | (3,735,207 | ) | | | — | | | | — | | |
Class I | | | (141,298,463 | ) | | | (144,034,028 | ) | | | (3,689,314 | ) | | | — | | |
| | | Distributions Paid from Net Realized Gains from Investment Transasctions | |
| | | First Eagle
Global Fund | | First Eagle
Overseas Fund | | First Eagle
U.S. Value Fund | | First Eagle
Gold Fund | |
Class A | | | (653,197,715 | ) | | | (80,568,972 | ) | | | (65,355,106 | ) | | | — | | |
Class C | | | (487,764,922 | ) | | | (23,123,783 | ) | | | (42,476,226 | ) | | | — | | |
Class I | | | (953,068,311 | ) | | | (243,029,909 | ) | | | (68,628,153 | ) | | | — | | |
See Notes to Financial Statements.
First Eagle Funds | Annual Report | October 31, 2018
124
| | | First Eagle
U.S. Value Fund* | | First Eagle
Gold Fund* | |
| | | For the
Year Ended
October 31, 2018 | | For the
Year Ended
October 31, 2017 | | For the
Year Ended
October 31, 2018 | | For the
Year Ended
October 31, 2017 | |
Class R6^^^ | |
Shares outstanding, beginning of period | | | 38,511 | | | | — | | | | 925,271 | | | | — | | |
Shares sold | | | 31,624 | | | | 40,699 | | | | 4,742,774 | | | | 927,928 | | |
Shares issued on reinvestment of distributions | | | 3,530 | | | | — | | | | — | | | | — | | |
Shares redeemed | | | (6,353 | ) | | | (2,188 | ) | | | (140,043 | ) | | | (2,657 | ) | |
Shares outstanding, end of period | | | 67,312 | | | | 38,511 | | | | 5,528,002 | | | | 925,271 | | |
First Eagle Funds | Annual Report | October 31, 2018
125
Statements of Changes in Net Assets (continued)
| | | First Eagle
Global Income Builder Fund | | First Eagle
High Yield Fund | |
| | | For the
Year Ended
October 31, 2018 | | For the
Year Ended
October 31, 2017 | | For the
Year Ended
October 31, 2018 | | For the
Year Ended
October 31, 2017 | |
Operations | |
Net investment income (loss) | | $ | 30,143,226 | | | $ | 30,245,828 | | | $ | 19,743,922 | | | $ | 26,857,566 | | |
Net realized gain (loss) from investments, commodity, foreign
currency forward contracts related translations and option
contracts written | | | 26,551,435 | | | | 2,170,196 | | | | (18,326,706 | ) | | | (7,754,905 | ) | |
Change in unrealized appreciation (depreciation) of investments,
commodity, foreign currency forward contracts related translations
and option contracts written | | | (93,820,381 | ) | | | 116,253,951 | | | | 7,731,467 | | | | 10,480,426 | | |
Net increase (decrease) in net assets resulting from operations | | | (37,125,720 | ) | | | 148,669,975 | | | | 9,148,683 | | | | 29,583,087 | | |
Distributions to Shareholders | |
Distributable earnings^^^ | |
Class A | | | (6,559,801 | ) | | | (8,595,355 | ) | | | (4,303,785 | ) | | | (6,417,565 | ) | |
Class C | | | (3,803,993 | ) | | | (5,780,705 | ) | | | (3,142,692 | ) | | | (4,390,518 | ) | |
Class I | | | (16,800,585 | ) | | | (16,454,712 | ) | | | (11,404,922 | ) | | | (15,922,037 | ) | |
Class Y | | | — | | | | — | | | | — | | | | — | | |
Class R3 | | | (434 | ) | | | — | | | | (1,223 | ) | | | — | | |
Class R6 | | | (24,988 | ) | | | (5,986 | ) | | | (7,045 | ) | | | (3,782 | ) | |
Return of capital | |
Class A | | | (1,802,464 | ) | | | — | | | | — | | | | (81,183 | ) | |
Class C | | | (1,712,626 | ) | | | — | | | | — | | | | (64,871 | ) | |
Class I | | | (4,062,522 | ) | | | — | | | | — | | | | (189,825 | ) | |
Class R3 | | | (131 | ) | | | — | | | | — | | | | — | | |
Class R6 | | | (6,134 | ) | | | — | | | | — | | | | (45 | ) | |
Decrease in net assets resulting from distributions | | | (34,773,678 | ) | | | (30,836,758 | ) | | | (18,859,667 | ) | | | (27,069,826 | ) | |
Fund Share Transactions | |
Class A | |
Net proceeds from shares sold | | | 66,225,822 | | | | 75,702,126 | | | | 9,882,632 | | | | 17,911,494 | | |
Net asset value of shares issued for reinvested dividends and distributions | | | 7,550,850 | | | | 8,110,881 | | | | 4,012,630 | | | | 5,785,013 | | |
Cost of shares redeemed | | | (77,800,723 | ) | | | (137,575,268 | ) | | | (31,930,168 | ) | | | (83,897,639 | ) | |
Decrease in net assets from Fund share transactions | | | (4,024,051 | ) | | | (53,762,261 | ) | | | (18,034,906 | ) | | | (60,201,132 | ) | |
Class C | |
Net proceeds from shares sold | | | 47,046,328 | | | | 51,798,601 | | | | 3,355,254 | | | | 7,035,964 | | |
Net asset value of shares issued for reinvested dividends and distributions | | | 4,835,878 | | | | 5,316,367 | | | | 2,736,032 | | | | 3,750,850 | | |
Cost of shares redeemed | | | (72,997,980 | ) | | | (97,877,052 | ) | | | (28,984,402 | ) | | | (38,026,963 | ) | |
Decrease in net assets from Fund share transactions | | | (21,115,774 | ) | | | (40,762,084 | ) | | | (22,893,116 | ) | | | (27,240,149 | ) | |
Class I | |
Net proceeds from shares sold | | | 221,397,842 | | | | 261,613,144 | | | | 56,106,941 | | | | 66,144,568 | | |
Net asset value of shares issued for reinvested dividends and distributions | | | 16,333,126 | | | | 13,694,130 | | | | 8,650,413 | | | | 12,432,294 | | |
Cost of shares redeemed | | | (173,536,233 | ) | | | (122,200,049 | ) | | | (153,351,520 | ) | | | (116,226,126 | ) | |
Increase (decrease) in net assets from Fund share transactions | | | 64,194,735 | | | | 153,107,225 | | | | (88,594,166 | ) | | | (37,649,264 | ) | |
First Eagle Funds | Annual Report | October 31, 2018
126
| | | First Eagle
Fund of America | |
| | | For the
Year Ended
October 31, 2018 | | For the
Year Ended
October 31, 2017 | |
Operations | |
Net investment income (loss) | | $ | 4,971,815 | | | $ | (2,693,864 | ) | |
Net realized gain (loss) from investments, commodity, foreign
currency forward contracts related translations and option
contracts written | | | 303,518,629 | | | | 243,250,787 | | |
Change in unrealized appreciation (depreciation) of investments,
commodity, foreign currency forward contracts related translations
and option contracts written | | | (515,736,650 | ) | | | 253,857,254 | | |
Net increase (decrease) in net assets resulting from operations | | | (207,246,206 | ) | | | 494,414,177 | | |
Distributions to Shareholders | |
Distributable earnings^^^ | |
Class A | | | (56,857,513 | ) | | | (50,501,638 | ) | |
Class C | | | (45,042,463 | ) | | | (35,895,467 | ) | |
Class I | | | (75,650,243 | ) | | | (48,985,140 | ) | |
Class Y | | | (35,245,286 | ) | | | (23,768,515 | ) | |
Class R3 | | | — | | | | — | | |
Class R6 | | | (36,608 | ) | | | — | | |
Return of capital | |
Class A | | | — | | | | — | | |
Class C | | | — | | | | — | | |
Class I | | | — | | | | — | | |
Class R3 | | | — | | | | — | | |
Class R6 | | | — | | | | — | | |
Decrease in net assets resulting from distributions | | | (212,832,113 | ) | | | (159,150,760 | ) | |
Fund Share Transactions | |
Class A | |
Net proceeds from shares sold | | | 39,903,045 | | | | 60,979,259 | | |
Net asset value of shares issued for reinvested dividends and distributions | | | 52,769,121 | | | | 45,456,382 | | |
Cost of shares redeemed | | | (218,170,826 | ) | | | (450,589,468 | ) | |
Decrease in net assets from Fund share transactions | | | (125,498,660 | ) | | | (344,153,827 | ) | |
Class C | |
Net proceeds from shares sold | | | 19,436,450 | | | | 21,919,416 | | |
Net asset value of shares issued for reinvested dividends and distributions | | | 41,134,387 | | | | 31,319,863 | | |
Cost of shares redeemed | | | (138,117,970 | ) | | | (217,206,105 | ) | |
Decrease in net assets from Fund share transactions | | | (77,547,133 | ) | | | (163,966,826 | ) | |
Class I | |
Net proceeds from shares sold | | | 147,394,674 | | | | 218,003,463 | | |
Net asset value of shares issued for reinvested dividends and distributions | | | 49,666,258 | | | | 30,660,041 | | |
Cost of shares redeemed | | | (254,904,256 | ) | | | (347,167,463 | ) | |
Increase (decrease) in net assets from Fund share transactions | | | (57,843,324 | ) | | | (98,503,959 | ) | |
First Eagle Funds | Annual Report | October 31, 2018
127
Statements of Changes in Net Assets (continued)
| | | First Eagle
Global Income Builder Fund | | First Eagle
High Yield Fund | |
| | | For the
Year Ended
October 31, 2018 | | For the
Year Ended
October 31, 2017 | | For the
Year Ended
October 31, 2018 | | For the
Year Ended
October 31, 2017 | |
Class Y | |
Net proceeds from shares sold | | $ | — | | | $ | — | | | $ | — | | | $ | — | | |
Net asset value of shares issued for reinvested dividends and distributions | | | — | | | | — | | | | — | | | | — | | |
Cost of shares redeemed | | | — | | | | — | | | | — | | | | — | | |
Decrease in net assets from Fund share transactions | | | — | | | | — | | | | — | | | | — | | |
Class R3^ | |
Net proceeds from shares sold | | | 50,000 | | | | — | | | | 50,000 | | | | — | | |
Net asset value of shares issued for reinvested dividends and distributions | | | 565 | | | | — | | | | 1,223 | | | | — | | |
Increase in net assets from Fund share transactions | | | 50,565 | | | | — | | | | 51,223 | | | | — | | |
Class R6^^ | |
Net proceeds from shares sold | | | 1,925,274 | | | | 936,167 | | | | 343,197 | | | | 115,681 | | |
Net asset value of shares issued for reinvested dividends and distributions | | | 31,214 | | | | 5,470 | | | | 7,037 | | | | 3,379 | | |
Cost of shares redeemed | | | (1,947,635 | ) | | | (414 | ) | | | (57,186 | ) | | | (4,177 | ) | |
Increase in net assets from Fund share transactions | | | 8,853 | | | | 941,223 | | | | 293,048 | | | | 114,883 | | |
Total Increase (Decrease) in net assets from Fund share transactions | | | 39,114,328 | | | | 59,524,103 | | | | (129,177,917 | ) | | | (124,975,662 | ) | |
Net increase (decrease) in net assets | | | (32,785,070 | ) | | | 177,357,320 | | | | (138,888,901 | ) | | | (122,462,401 | ) | |
Net Assets (Note 1) | |
Beginning of period | | | 1,392,872,506 | | | | 1,215,515,186 | | | | 464,801,728 | | | | 587,264,129 | | |
End of period | | $ | 1,360,087,436 | | | $ | 1,392,872,506 | | | $ | 325,912,827 | | | $ | 464,801,728 | | |
Changes in Shares Outstanding | |
Class A | |
Shares outstanding, beginning of period | | | 28,201,813 | | | | 32,908,379 | | | | 10,912,189 | | | | 17,592,315 | | |
Shares sold | | | 5,507,762 | | | | 6,621,083 | | | | 1,108,334 | | | | 1,980,975 | | |
Shares issued on reinvestment of distributions | | | 630,329 | | | | 703,233 | | | | 449,785 | | | | 639,586 | | |
Shares redeemed | | | (6,490,039 | ) | | | (12,030,882 | ) | | | (3,574,373 | ) | | | (9,300,687 | ) | |
Shares outstanding, end of period | | | 27,849,865 | | | | 28,201,813 | | | | 8,895,935 | | | | 10,912,189 | | |
Class C | |
Shares outstanding, beginning of period | | | 27,835,245 | | | | 31,450,181 | | | | 9,694,123 | | | | 12,710,582 | | |
Shares sold | | | 3,924,680 | | | | 4,535,093 | | | | 376,126 | | | | 780,696 | | |
Shares issued on reinvestment of distributions | | | 404,752 | | | | 462,182 | | | | 306,957 | | | | 415,040 | | |
Shares redeemed | | | (6,103,047 | ) | | | (8,612,211 | ) | | | (3,247,667 | ) | | | (4,212,195 | ) | |
Shares outstanding, end of period | | | 26,061,630 | | | | 27,835,245 | | | | 7,129,539 | | | | 9,694,123 | | |
Class I | |
Shares outstanding, beginning of period | | | 59,703,331 | | | | 46,454,190 | | | | 30,840,541 | | | | 35,036,376 | | |
Shares sold | | | 18,440,862 | | | | 22,772,722 | | | | 6,281,474 | | | | 7,304,360 | | |
Shares issued on reinvestment of distributions | | | 1,367,141 | | | | 1,186,990 | | | | 969,127 | | | | 1,373,916 | | |
Shares redeemed | | | (14,545,355 | ) | | | (10,710,571 | ) | | | (17,173,294 | ) | | | (12,874,111 | ) | |
Shares outstanding, end of period | | | 64,965,979 | | | | 59,703,331 | | | | 20,917,848 | | | | 30,840,541 | | |
First Eagle Funds | Annual Report | October 31, 2018
128
| | | First Eagle
Fund of America | |
| | | For the
Year Ended
October 31, 2018 | | For the
Year Ended
October 31, 2017 | |
Class Y | |
Net proceeds from shares sold | | $ | 12,490,982 | | | $ | 22,567,234 | | |
Net asset value of shares issued for reinvested dividends and distributions | | | 33,494,417 | | | | 22,537,453 | | |
Cost of shares redeemed | | | (89,539,418 | ) | | | (92,019,919 | ) | |
Decrease in net assets from Fund share transactions | | | (43,554,019 | ) | | | (46,915,232 | ) | |
Class R3^ | |
Net proceeds from shares sold | | | 50,000 | | | | — | | |
Net asset value of shares issued for reinvested dividends and distributions | | | — | | | | — | | |
Increase in net assets from Fund share transactions | | | 50,000 | | | | — | | |
Class R6^^ | |
Net proceeds from shares sold | | | 8,717,300 | | | | 371,417 | | |
Net asset value of shares issued for reinvested dividends and distributions | | | 36,609 | | | | — | | |
Cost of shares redeemed | | | (4,047,537 | ) | | | — | | |
Increase in net assets from Fund share transactions | | | 4,706,372 | | | | 371,417 | | |
Total Increase (Decrease) in net assets from Fund share transactions | | | (299,686,764 | ) | | | (653,168,427 | ) | |
Net increase (decrease) in net assets | | | (719,765,083 | ) | | | (317,905,010 | ) | |
Net Assets (Note 1) | |
Beginning of period | | | 2,251,193,196 | | | | 2,569,098,206 | | |
End of period | | $ | 1,531,428,113 | | | $ | 2,251,193,196 | | |
Changes in Shares Outstanding | |
Class A | |
Shares outstanding, beginning of period | | | 16,302,212 | | | | 26,267,874 | | |
Shares sold | | | 1,126,102 | | | | 1,770,634 | | |
Shares issued on reinvestment of distributions | | | 1,511,576 | | | | 1,400,381 | | |
Shares redeemed | | | (6,199,695 | ) | | | (13,136,677 | ) | |
Shares outstanding, end of period | | | 12,740,195 | | | | 16,302,212 | | |
Class C | |
Shares outstanding, beginning of period | | | 12,924,139 | | | | 18,654,550 | | |
Shares sold | | | 692,334 | | | | 785,855 | | |
Shares issued on reinvestment of distributions | | | 1,483,925 | | | | 1,177,881 | | |
Shares redeemed | | | (4,961,489 | ) | | | (7,694,147 | ) | |
Shares outstanding, end of period | | | 10,138,909 | | | | 12,924,139 | | |
Class I | |
Shares outstanding, beginning of period | | | 21,188,008 | | | | 23,972,780 | | |
Shares sold | | | 4,044,530 | | | | 6,151,299 | | |
Shares issued on reinvestment of distributions | | | 1,384,232 | | | | 923,773 | | |
Shares redeemed | | | (7,137,892 | ) | | | (9,859,844 | ) | |
Shares outstanding, end of period | | | 19,478,878 | | | | 21,188,008 | | |
First Eagle Funds | Annual Report | October 31, 2018
129
Statements of Changes in Net Assets (continued)
| | | First Eagle
Global Income Builder Fund | | First Eagle
High Yield Fund | |
| | | For the
Year Ended
October 31, 2018 | | For the
Year Ended
October 31, 2017 | | For the
Year Ended
October 31, 2018 | | For the
Year Ended
October 31, 2017 | |
Class Y | |
Shares outstanding, beginning of period | | | — | | | | — | | | | — | | | | — | | |
Shares sold | | | — | | | | — | | | | — | | | | — | | |
Shares issued on reinvestment of distributions | | | — | | | | — | | | | — | | | | — | | |
Shares redeemed | | | — | | | | — | | | | — | | | | — | | |
Shares outstanding, end of period | | | — | | | | — | | | | — | | | | — | | |
Class R3^ | |
Shares outstanding, beginning of period | | | — | | | | — | | | | — | | | | — | | |
Shares sold | | | 4,194 | | | | — | | | | 5,611 | | | | — | | |
Shares issued on reinvestment of distributions | | | 48 | | | | — | | | | 138 | | | | — | | |
Shares outstanding, end of period | | | 4,242 | | | | — | | | | 5,749 | | | | — | | |
Class R6^^ | |
Shares outstanding, beginning of period | | | 80,353 | | | | — | | | | 12,629 | | | | — | | |
Shares sold | | | 161,993 | | | | 79,927 | | | | 38,513 | | | | 12,718 | | |
Shares issued on reinvestment of distributions | | | 2,615 | | | | 461 | | | | 790 | | | | 373 | | |
Shares redeemed | | | (165,141 | ) | | | (35 | ) | | | (6,417 | ) | | | (462 | ) | |
Shares outstanding, end of period | | | 79,820 | | | | 80,353 | | | | 45,515 | | | | 12,629 | | |
^ Represents the period from May 1, 2018 to October 31, 2018.
^^ Represents the year ended October 31, 2018 and the period from March 1, 2017 to October 31, 2017.
^^^ The U.S. GAAP basis of distributions paid to shareholders during the fiscal year ended October 31, 2017 was as follows:
| | | Dividends Paid from Net Investment Income | |
| | First Eagle
Global Income Builder Fund | | First Eagle
High Yield Fund | | First Eagle
Fund of America | |
Class A | | | (8,595,355 | ) | | | (6,417,565 | ) | | | (1,539,695 | ) | |
Class C | | | (5,780,705 | ) | | | (4,390,518 | ) | | | — | | |
Class I | | | (16,454,712 | ) | | | (15,922,037 | ) | | | (3,803,398 | ) | |
Class Y | | | — | | | | — | | | | (864,309 | ) | |
Class R6 | | | (5,986 | ) | | | (3,782 | ) | | | — | | |
| | | Distributions Paid from Net Realized Gains from Investment Transasctions | |
| | | First Eagle
Global Income Builder Fund | | First Eagle
High Yield Fund | | First Eagle
Fund of America | |
Class A | | | — | | | | — | | | | (48,961,943 | ) | |
Class C | | | — | | | | — | | | | (35,895,467 | ) | |
Class I | | | — | | | | — | | | | (45,181,742 | ) | |
Class Y | | | — | | | | — | | | | (22,904,206 | ) | |
See Notes to Financial Statements.
First Eagle Funds | Annual Report | October 31, 2018
130
| | | First Eagle
Fund of America | |
| | | For the
Year Ended
October 31, 2018 | | For the
Year Ended
October 31, 2017 | |
Class Y | |
Shares outstanding, beginning of period | | | 10,169,352 | | | | 11,465,333 | | |
Shares sold | | | 346,003 | | | | 630,347 | | |
Shares issued on reinvestment of distributions | | | 935,598 | | | | 678,635 | | |
Shares redeemed | | | (2,477,343 | ) | | | (2,604,963 | ) | |
Shares outstanding, end of period | | | 8,973,610 | | | | 10,169,352 | | |
Class R3^ | |
Shares outstanding, beginning of period | | | — | | | | — | | |
Shares sold | | | 1,421 | | | | — | | |
Shares issued on reinvestment of distributions | | | — | | | | — | | |
Shares outstanding, end of period | | | 1,421 | | | | — | | |
Class R6^^ | |
Shares outstanding, beginning of period | | | 10,147 | | | | — | | |
Shares sold | | | 241,166 | | | | 10,147 | | |
Shares issued on reinvestment of distributions | | | 1,021 | | | | — | | |
Shares redeemed | | | (113,712 | ) | | | — | | |
Shares outstanding, end of period | | | 138,622 | | | | 10,147 | | |
First Eagle Funds | Annual Report | October 31, 2018
131
| | Per share operating performance* | |
| | | | | Investment operations | | Less dividends and distributions | |
Selected per
share data for
the year ended: | | Net asset
value,
beginning
of year | | Net
investment
income/
loss | | Net
realized
and
unrealized
gains
(losses) on
investments | | Total
investment
operations | | From net
investment
income | | From
capital
gains | | Return of
capital | | Total
distributions | |
First Eagle Global Fund Class A | |
October 31, 2018 | | $ | 60.46 | | | | 0.49 | | | | (2.08 | ) | | | (1.59 | ) | | | (0.44 | ) | | | (2.06 | ) | | | — | | | | (2.50 | ) | |
October 31, 2017 | | $ | 56.36 | | | | 0.25 | | | | 6.41 | | | | 6.66 | | | | (0.21 | ) | | | (2.35 | ) | | | — | | | | (2.56 | ) | |
October 31, 2016 | | $ | 53.10 | | | | 0.30 | | | | 3.56 | | | | 3.86 | | | | (0.07 | ) | | | (0.53 | ) | | | — | | | | (0.60 | ) | |
October 31, 2015 | | $ | 54.90 | | | | 0.28 | | | | 0.60 | | | | 0.88 | | | | (0.30 | ) | | | (2.38 | ) | | | — | | | | (2.68 | ) | |
October 31, 2014 | | $ | 54.92 | | | | 0.30 | | | | 2.12 | | | | 2.42 | | | | (0.66 | ) | | | (1.78 | ) | | | — | | | | (2.44 | ) | |
First Eagle Global Fund Class C | |
October 31, 2018 | | $ | 58.14 | | | | 0.05 | | | | (2.02 | ) | | | (1.97 | ) | | | — | | | | (2.06 | ) | | | — | | | | (2.06 | ) | |
October 31, 2017 | | $ | 54.47 | | | | (0.16 | ) | | | 6.18 | | | | 6.02 | | | | — | | | | (2.35 | ) | | | — | | | | (2.35 | ) | |
October 31, 2016 | | $ | 51.66 | | | | (0.11 | ) | | | 3.45 | | | | 3.34 | | | | — | | | | (0.53 | ) | | | — | | | | (0.53 | ) | |
October 31, 2015 | | $ | 53.57 | | | | (0.12 | ) | | | 0.59 | | | | 0.47 | | | | — | | | | (2.38 | ) | | | — | | | | (2.38 | ) | |
October 31, 2014 | | $ | 53.67 | | | | (0.11 | ) | | | 2.08 | | | | 1.97 | | | | (0.29 | ) | | | (1.78 | ) | | | — | | | | (2.07 | ) | |
First Eagle Global Fund Class I | |
October 31, 2018 | | $ | 60.85 | | | | 0.66 | | | | (2.11 | ) | | | (1.45 | ) | | | (0.61 | ) | | | (2.06 | ) | | | — | | | | (2.67 | ) | |
October 31, 2017 | | $ | 56.70 | | | | 0.43 | | | | 6.42 | | | | 6.85 | | | | (0.35 | ) | | | (2.35 | ) | | | — | | | | (2.70 | ) | |
October 31, 2016 | | $ | 53.43 | | | | 0.44 | | | | 3.57 | | | | 4.01 | | | | (0.21 | ) | | | (0.53 | ) | | | — | | | | (0.74 | ) | |
October 31, 2015 | | $ | 55.23 | | | | 0.43 | | | | 0.60 | | | | 1.03 | | | | (0.45 | ) | | | (2.38 | ) | | | — | | | | (2.83 | ) | |
October 31, 2014 | | $ | 55.23 | | | | 0.43 | | | | 2.13 | | | | 2.56 | | | | (0.78 | ) | | | (1.78 | ) | | | — | | | | (2.56 | ) | |
First Eagle Global Fund Class R3 | |
For The Period
5/01/18^-
10/31/18 | | $ | 58.95 | | | | 0.28 | | | | (2.61 | ) | | | (2.33 | ) | | | — | | | | — | | | | — | | | | — | | |
First Eagle Global Fund Class R4 | |
For The Period
1/17/18^^-
10/31/18 | | $ | 61.60 | | | | 0.55 | | | | (5.45 | ) | | | (4.90 | ) | | | — | | | | — | | | | — | | | | — | | |
First Eagle Global Fund Class R6 | |
For The Year Ended
October 31, 2018 | | $ | 60.88 | | | | 0.72 | | | | (2.14 | ) | | | (1.42 | ) | | | (0.64 | ) | | | (2.06 | ) | | | — | | | | (2.70 | ) | |
For The Period
3/01/17^^^-
10/31/17 | | $ | 57.33 | | | | 0.37 | | | | 3.18 | | | | 3.55 | | | | — | | | | — | | | | — | | | | — | | |
First Eagle Overseas Fund Class A | |
October 31, 2018 | | $ | 25.33 | | | | 0.25 | | | | (2.03 | ) | | | (1.78 | ) | | | (0.40 | ) | | | (0.44 | ) | | | — | | | | (0.84 | ) | |
October 31, 2017 | | $ | 23.86 | | | | 0.12 | | | | 2.16 | | | | 2.28 | | | | (0.26 | ) | | | (0.55 | ) | | | — | | | | (0.81 | ) | |
October 31, 2016 | | $ | 22.62 | | | | 0.19 | | | | 1.34 | | | | 1.53 | | | | (0.04 | ) | | | (0.25 | ) | | | — | | | | (0.29 | ) | |
October 31, 2015 | | $ | 23.18 | | | | 0.14 | | | | 0.39 | | | | 0.53 | | | | (0.23 | ) | | | (0.86 | ) | | | — | | | | (1.09 | ) | |
October 31, 2014 | | $ | 24.40 | | | | 0.15 | | | | 0.05 | | | | 0.20 | | | | (0.46 | ) | | | (0.96 | ) | | | — | | | | (1.42 | ) | |
First Eagle Funds | Annual Report | October 31, 2018
132
| | | | | | | | | Ratio/Supplemental data | | | |
| | | | | | | | | Ratios to Average Net Assets of: | | | |
Selected per
share data for
the year ended: | | Net asset
value, end
of period | | Total
Return(a) | | Net assets,
end of
period
(thousands) | | Operating
expenses
excluding
earnings
credits
and/or fee
waivers | | Operating
expenses
including
earnings
credits
and/or fee
waivers | | Net
investment
income
excluding
earnings
credits
and/or fee
waivers | | Net
investment
income
including
earnings
credits
and/or fee
waivers | | Portfolio
turnover
rate | |
First Eagle Global Fund Class A | |
October 31, 2018 | | $ | 56.37 | | | | (2.82 | )% | | $ | 12,357,124 | | | | 1.11 | % | | | 1.11 | % | | | 0.84 | % | | | 0.84 | % | | | 14.91 | % | |
October 31, 2017 | | $ | 60.46 | | | | 12.35 | % | | $ | 14,907,330 | | | | 1.11 | % | | | 1.11 | % | | | 0.44 | % | | | 0.44 | % | | | 9.67 | % | |
October 31, 2016 | | $ | 56.36 | | | | 7.38 | % | | $ | 15,833,531 | | | | 1.10 | % | | | 1.10 | % | | | 0.55 | % | | | 0.55 | % | | | 11.54 | % | |
October 31, 2015 | | $ | 53.10 | | | | 1.78 | % | | $ | 16,274,867 | | | | 1.11 | % | | | 1.11 | % | | | 0.52 | % | | | 0.52 | % | | | 11.28 | % | |
October 31, 2014 | | $ | 54.90 | | | | 4.64 | % | | $ | 17,734,529 | | | | 1.11 | % | | | 1.11 | % | | | 0.55 | % | | | 0.55 | % | | | 15.36 | % | |
First Eagle Global Fund Class C | |
October 31, 2018 | | $ | 54.11 | | | | (3.54 | )% | | $ | 8,667,512 | | | | 1.86 | % | | | 1.86 | % | | | 0.09 | % | | | 0.09 | % | | | 14.91 | % | |
October 31, 2017 | | $ | 58.14 | | | | 11.52 | % | | $ | 10,589,991 | | | | 1.85 | % | | | 1.85 | % | | | (0.29 | )% | | | (0.29 | )% | | | 9.67 | % | |
October 31, 2016 | | $ | 54.47 | | | | 6.56 | % | | $ | 11,505,279 | | | | 1.86 | % | | | 1.86 | % | | | (0.21 | )% | | | (0.21 | )% | | | 11.54 | % | |
October 31, 2015 | | $ | 51.66 | | | | 1.02 | % | | $ | 11,662,706 | | | | 1.86 | % | | | 1.86 | % | | | (0.23 | )% | | | (0.23 | )% | | | 11.28 | % | |
October 31, 2014 | | $ | 53.57 | | | | 3.85 | % | | $ | 12,342,299 | | | | 1.86 | % | | | 1.86 | % | | | (0.21 | )% | | | (0.21 | )% | | | 15.36 | % | |
First Eagle Global Fund Class I | |
October 31, 2018 | | $ | 56.73 | | | | (2.54 | )% | | $ | 29,334,134 | | | | 0.84 | % | | | 0.84 | % | | | 1.11 | % | | | 1.11 | % | | | 14.91 | % | |
October 31, 2017 | | $ | 60.85 | | | | 12.64 | % | | $ | 30,858,477 | | | | 0.84 | % | | | 0.84 | % | | | 0.74 | % | | | 0.74 | % | | | 9.67 | % | |
October 31, 2016 | | $ | 56.70 | | | | 7.65 | % | | $ | 22,357,335 | | | | 0.84 | % | | | 0.84 | % | | | 0.81 | % | | | 0.81 | % | | | 11.54 | % | |
October 31, 2015 | | $ | 53.43 | | | | 2.07 | % | | $ | 19,998,978 | | | | 0.84 | % | | | 0.84 | % | | | 0.79 | % | | | 0.79 | % | | | 11.28 | % | |
October 31, 2014 | | $ | 55.23 | | | | 4.90 | % | | $ | 20,388,583 | | | | 0.86 | % | | | 0.86 | % | | | 0.78 | % | | | 0.78 | % | | | 15.36 | % | |
First Eagle Global Fund Class R3 | |
For The Period
5/01/18^-
10/31/18 | | $ | 56.62 | | | | (3.95 | )%(b) | | $ | 48 | | | | 1.25 | %(c) | | | 1.25 | %(c) | | | 0.95 | %(c) | | | 0.95 | %(c) | | | 14.91 | %(b) | |
First Eagle Global Fund Class R4 | |
For The Period
1/17/18^^-
10/31/18 | | $ | 56.70 | | | | (7.95 | )%(b) | | $ | 117 | | | | 1.02 | %(c) | | | 1.02 | %(c) | | | 1.18 | %(c) | | | 1.18 | %(c) | | | 14.91 | %(b) | |
First Eagle Global Fund Class R6 | |
For The Year Ended
October 31, 2018 | | $ | 56.76 | | | | (2.49 | )% | | $ | 782,213 | | | | 0.78 | % | | | 0.78 | % | | | 1.21 | % | | | 1.21 | % | | | 14.91 | % | |
For The Period
3/01/17^^^-
10/31/17 | | $ | 60.88 | | | | 6.19 | %(b) | | $ | 848,431 | | | | 0.78 | %(c) | | | 0.78 | %(c) | | | 0.94 | %(c) | | | 0.94 | %(c) | | | 9.67 | %(b) | |
First Eagle Overseas Fund Class A | |
October 31, 2018 | | $ | 22.71 | | | | (7.27 | )% | | $ | 2,173,765 | | | | 1.15 | % | | | 1.15 | % | | | 1.04 | % | | | 1.04 | % | | | 12.10 | % | |
October 31, 2017 | | $ | 25.33 | | | | 9.99 | % | | $ | 3,102,414 | | | | 1.15 | % | | | 1.15 | % | | | 0.51 | % | | | 0.51 | % | | | 8.45 | % | |
October 31, 2016 | | $ | 23.86 | | | | 6.90 | % | | $ | 3,654,512 | | | | 1.14 | % | | | 1.14 | % | | | 0.84 | % | | | 0.84 | % | | | 9.30 | % | |
October 31, 2015 | | $ | 22.62 | | | | 2.59 | % | | $ | 4,142,588 | | | | 1.16 | % | | | 1.16 | % | | | 0.60 | % | | | 0.60 | % | | | 12.95 | % | |
October 31, 2014 | | $ | 23.18 | | | | 1.00 | % | | $ | 4,644,161 | | | | 1.14 | % | | | 1.14 | % | | | 0.62 | % | | | 0.62 | % | | | 12.01 | % | |
First Eagle Funds | Annual Report | October 31, 2018
133
| | Per share operating performance* | |
| | | | | Investment operations | | Less dividends and distributions | |
Selected per
share data for
the year ended: | | Net asset
value,
beginning
of year | | Net
investment
income/
loss | | Net
realized
and
unrealized
gains
(losses) on
investments | | Total
investment
operations | | From net
investment
income | | From
capital
gains | | Return of
capital | | Total
distributions | |
First Eagle Overseas Fund Class C | |
October 31, 2018 | | $ | 24.29 | | | | 0.08 | | | | (1.95 | ) | | | (1.87 | ) | | | (0.25 | ) | | | (0.44 | ) | | | — | | | | (0.69 | ) | |
October 31, 2017 | | $ | 22.91 | | | | (0.05 | ) | | | 2.07 | | | | 2.02 | | | | (0.09 | ) | | | (0.55 | ) | | | — | | | | (0.64 | ) | |
October 31, 2016 | | $ | 21.84 | | | | 0.02 | | | | 1.30 | | | | 1.32 | | | | — | | | | (0.25 | ) | | | — | | | | (0.25 | ) | |
October 31, 2015 | | $ | 22.42 | | | | (0.03 | ) | | | 0.39 | | | | 0.36 | | | | (0.08 | ) | | | (0.86 | ) | | | — | | | | (0.94 | ) | |
October 31, 2014 | | $ | 23.64 | | | | (0.03 | ) | | | 0.07 | | | | 0.04 | | | | (0.30 | ) | | | (0.96 | ) | | | — | | | | (1.26 | ) | |
First Eagle Overseas Fund Class I | |
October 31, 2018 | | $ | 25.91 | | | | 0.34 | | | | (2.08 | ) | | | (1.74 | ) | | | (0.47 | ) | | | (0.44 | ) | | | — | | | | (0.91 | ) | |
October 31, 2017 | | $ | 24.40 | | | | 0.21 | | | | 2.17 | | | | 2.38 | | | | (0.32 | ) | | | (0.55 | ) | | | — | | | | (0.87 | ) | |
October 31, 2016 | | $ | 23.12 | | | | 0.26 | | | | 1.38 | | | | 1.64 | | | | (0.11 | ) | | | (0.25 | ) | | | — | | | | (0.36 | ) | |
October 31, 2015 | | $ | 23.62 | | | | 0.20 | | | | 0.41 | | | | 0.61 | | | | (0.25 | ) | | | (0.86 | ) | | | — | | | | (1.11 | ) | |
October 31, 2014 | | $ | 24.84 | | | | 0.21 | | | | 0.05 | | | | 0.26 | | | | (0.52 | ) | | | (0.96 | ) | | | — | | | | (1.48 | ) | |
First Eagle Overseas Fund Class R3 | |
For The Period
5/01/18^-
10/31/18 | | $ | 25.10 | | | | 0.16 | | | | (2.04 | ) | | | (1.88 | ) | | | — | | | | — | | | | — | | | | — | | |
First Eagle Overseas Fund Class R4 | |
For The Period
1/17/18^^-
10/31/18 | | $ | 26.15 | | | | 0.31 | | | | (3.23 | ) | | | (2.92 | ) | | | — | | | | — | | | | — | | | | — | | |
First Eagle Overseas Fund Class R6 | |
For The Year Ended
October 31, 2018 | | $ | 25.92 | | | | 0.36 | | | | (2.09 | ) | | | (1.73 | ) | | | (0.48 | ) | | | (0.44 | ) | | | — | | | | (0.92 | ) | |
For The Period
3/01/17^^^-
10/31/17 | | $ | 23.99 | | | | 0.17 | | | | 1.76 | | | | 1.93 | | | | — | | | | — | | | | — | | | | — | | |
First Eagle U.S. Value Fund Class A | |
October 31, 2018 | | $ | 21.26 | | | | 0.11 | | | | 0.31 | | | | 0.42 | | | | (0.03 | ) | | | (1.76 | ) | | | — | | | | (1.79 | ) | |
October 31, 2017 | | $ | 20.08 | | | | 0.06 | | | | 2.80 | | | | 2.86 | | | | (0.04 | ) | | | (1.64 | ) | | | — | | | | (1.68 | ) | |
October 31, 2016 | | $ | 19.82 | | | | 0.08 | | | | 1.07 | | | | 1.15 | | | | (0.04 | ) | | | (0.85 | ) | | | — | | | | (0.89 | ) | |
October 31, 2015 | | $ | 21.10 | | | | 0.10 | | | | (0.10 | ) | | | (0.00 | )** | | | (0.08 | ) | | | (1.20 | ) | | | — | | | | (1.28 | ) | |
October 31, 2014 | | $ | 20.26 | | | | 0.13 | | | | 1.60 | | | | 1.73 | | | | (0.15 | ) | | | (0.74 | ) | | | — | | | | (0.89 | ) | |
First Eagle U.S. Value Fund Class C | |
October 31, 2018 | | $ | 20.54 | | | | (0.04 | ) | | | 0.29 | | | | 0.25 | | | | — | | | | (1.76 | ) | | | — | | | | (1.76 | ) | |
October 31, 2017 | | $ | 19.55 | | | | (0.09 | ) | | | 2.72 | | | | 2.63 | | | | — | | | | (1.64 | ) | | | — | | | | (1.64 | ) | |
October 31, 2016 | | $ | 19.43 | | | | (0.07 | ) | | | 1.04 | | | | 0.97 | | | | — | | | | (0.85 | ) | | | — | | | | (0.85 | ) | |
October 31, 2015 | | $ | 20.78 | | | | (0.05 | ) | | | (0.10 | ) | | | (0.15 | ) | | | — | | | | (1.20 | ) | | | — | | | | (1.20 | ) | |
October 31, 2014 | | $ | 19.97 | | | | (0.03 | ) | | | 1.58 | | | | 1.55 | | | | (0.00 | )** | | | (0.74 | ) | | | — | | | | (0.74 | ) | |
First Eagle Funds | Annual Report | October 31, 2018
134
| | | | | | | | | Ratio/Supplemental data | | | |
| | | | | | | | | Ratios to Average Net Assets of: | | | |
Selected per
share data for
the year ended: | | Net asset
value, end
of period | | Total
Return(a) | | Net assets,
end of
period
(thousands) | | Operating
expenses
excluding
earnings
credits
and/or fee
waivers | | Operating
expenses
including
earnings
credits
and/or fee
waivers | | Net
investment
income
excluding
earnings
credits
and/or fee
waivers | | Net
investment
income
including
earnings
credits
and/or fee
waivers | | Portfolio
turnover
rate | |
First Eagle Overseas Fund Class C | |
October 31, 2018 | | $ | 21.73 | | | | (7.92 | )% | | $ | 687,318 | | | | 1.88 | % | | | 1.88 | % | | | 0.32 | % | | | 0.32 | % | | | 12.10 | % | |
October 31, 2017 | | $ | 24.29 | | | | 9.14 | % | | $ | 899,654 | | | | 1.88 | % | | | 1.88 | % | | | (0.20 | )% | | | (0.20 | )% | | | 8.45 | % | |
October 31, 2016 | | $ | 22.91 | | | | 6.14 | % | | $ | 992,573 | | | | 1.89 | % | | | 1.89 | % | | | 0.10 | % | | | 0.10 | % | | | 9.30 | % | |
October 31, 2015 | | $ | 21.84 | | | | 1.82 | % | | $ | 1,036,295 | | | | 1.89 | % | | | 1.89 | % | | | (0.13 | )% | | | (0.13 | )% | | | 12.95 | % | |
October 31, 2014 | | $ | 22.42 | | | | 0.28 | % | | $ | 1,085,640 | | | | 1.89 | % | | | 1.89 | % | | | (0.13 | )% | | | (0.13 | )% | | | 12.01 | % | |
First Eagle Overseas Fund Class I | |
October 31, 2018 | | $ | 23.26 | | | | (6.98 | )% | | $ | 11,093,973 | | | | 0.86 | % | | | 0.86 | % | | | 1.35 | % | | | 1.35 | % | | | 12.10 | % | |
October 31, 2017 | | $ | 25.91 | | | | 10.24 | % | | $ | 13,831,360 | | | | 0.87 | % | | | 0.86 | % | | | 0.86 | % | | | 0.86 | % | | | 8.45 | % | |
October 31, 2016 | | $ | 24.40 | | | | 7.22 | % | | $ | 10,608,351 | | | | 0.87 | % | | | 0.87 | % | | | 1.12 | % | | | 1.12 | % | | | 9.30 | % | |
October 31, 2015 | | $ | 23.12 | | | | 2.88 | % | | $ | 8,702,209 | | | | 0.88 | % | | | 0.88 | % | | | 0.88 | % | | | 0.88 | % | | | 12.95 | % | |
October 31, 2014 | | $ | 23.62 | | | | 1.23 | % | | $ | 8,811,126 | | | | 0.89 | % | | | 0.89 | % | | | 0.87 | % | | | 0.87 | % | | | 12.01 | % | |
First Eagle Overseas Fund Class R3 | |
For The Period
5/01/18^-
10/31/18 | | $ | 23.22 | | | | (7.49 | )%(b) | | $ | 46 | | | | 1.21 | %(c) | | | 1.21 | %(c) | | | 1.32 | %(c) | | | 1.32 | %(c) | | | 12.10 | %(b) | |
First Eagle Overseas Fund Class R4 | |
For The Period
1/17/18^^-
10/31/18 | | $ | 23.23 | | | | (11.17 | )%(b) | | $ | 78 | | | | 1.03 | %(c) | | | 1.03 | %(c) | | | 1.60 | %(c) | | | 1.60 | %(c) | | | 12.10 | %(b) | |
First Eagle Overseas Fund Class R6 | |
For The Year Ended
October 31, 2018 | | $ | 23.27 | | | | (6.92 | )% | | $ | 592,247 | | | | 0.80 | % | | | 0.80 | % | | | 1.44 | % | | | 1.44 | % | | | 12.10 | % | |
For The Period
3/01/17^^^-
10/31/17 | | $ | 25.92 | | | | 8.04 | %(b) | | $ | 544,632 | | | | 0.79 | %(c) | | | 0.79 | %(c) | | | 1.01 | %(c) | | | 1.01 | %(c) | | | 8.45 | %(b) | |
First Eagle U.S. Value Fund Class A | |
October 31, 2018 | | $ | 19.89 | | | | 2.01 | % | | $ | 590,922 | | | | 1.15 | % | | | 1.10 | % | | | 0.51 | % | | | 0.56 | % | | | 9.05 | % | |
October 31, 2017 | | $ | 21.26 | | | | 14.94 | % | | $ | 716,820 | | | | 1.14 | % | | | 1.09 | % | | | 0.24 | % | | | 0.29 | % | | | 5.85 | % | |
October 31, 2016 | | $ | 20.08 | | | | 6.21 | % | | $ | 817,481 | | | | 1.11 | % | | | 1.14 | % | | | 0.40 | % | | | 0.37 | % | | | 10.65 | % | |
October 31, 2015 | | $ | 19.82 | | | | 0.04 | % | | $ | 966,396 | | | | 1.14 | % | | | 1.14 | % | | | 0.49 | % | | | 0.49 | % | | | 15.14 | % | |
October 31, 2014 | | $ | 21.10 | | | | 8.93 | % | | $ | 1,228,878 | | | | 1.14 | % | | | 1.14 | % | | | 0.63 | % | | | 0.63 | % | | | 15.64 | % | |
First Eagle U.S. Value Fund Class C | |
October 31, 2018 | | $ | 19.03 | | | | 1.20 | % | | $ | 361,606 | | | | 1.90 | % | | | 1.85 | % | | | (0.24 | )% | | | (0.19 | )% | | | 9.05 | % | |
October 31, 2017 | | $ | 20.54 | | | | 14.13 | % | | $ | 448,462 | | | | 1.89 | % | | | 1.84 | % | | | (0.51 | )% | | | (0.46 | )% | | | 5.85 | % | |
October 31, 2016 | | $ | 19.55 | | | | 5.38 | % | | $ | 516,405 | | | | 1.87 | % | | | 1.90 | % | | | (0.37 | )% | | | (0.40 | )% | | | 10.65 | % | |
October 31, 2015 | | $ | 19.43 | | | | (0.70 | )% | | $ | 592,960 | | | | 1.90 | % | | | 1.90 | % | | | (0.27 | )% | | | (0.27 | )% | | | 15.14 | % | |
October 31, 2014 | | $ | 20.78 | | | | 8.09 | % | | $ | 705,076 | | | | 1.89 | % | | | 1.89 | % | | | (0.13 | )% | | | (0.13 | )% | | | 15.64 | % | |
First Eagle Funds | Annual Report | October 31, 2018
135
| | Per share operating performance* | |
| | | | | Investment operations | | Less dividends and distributions | |
Selected per
share data for
the year ended: | | Net asset
value,
beginning
of year | | Net
investment
income/
loss | | Net
realized
and
unrealized
gains
(losses) on
investments | | Total
investment
operations | | From net
investment
income | | From
capital
gains | | Return of
capital | | Total
distributions | |
First Eagle U.S. Value Fund Class I | |
October 31, 2018 | | $ | 21.61 | | | | 0.18 | | | | 0.29 | | | | 0.47 | | | | (0.09 | ) | | | (1.76 | ) | | | — | | | | (1.85 | ) | |
October 31, 2017 | | $ | 20.38 | | | | 0.12 | | | | 2.84 | | | | 2.96 | | | | (0.09 | ) | | | (1.64 | ) | | | — | | | | (1.73 | ) | |
October 31, 2016 | | $ | 20.11 | | | | 0.13 | | | | 1.08 | | | | 1.21 | | | | (0.09 | ) | | | (0.85 | ) | | | — | | | | (0.94 | ) | |
October 31, 2015 | | $ | 21.40 | | | | 0.16 | | | | (0.12 | ) | | | 0.04 | | | | (0.13 | ) | | | (1.20 | ) | | | — | | | | (1.33 | ) | |
October 31, 2014 | | $ | 20.54 | | | | 0.18 | | | | 1.62 | | | | 1.80 | | | | (0.20 | ) | | | (0.74 | ) | | | — | | | | (0.94 | ) | |
First Eagle U.S. Value Fund Class R3 | |
For The Period
5/01/18^-
10/31/18 | | $ | 20.37 | | | | 0.06 | | | | (0.23 | ) | | | (0.17 | ) | | | — | | | | — | | | | — | | | | — | | |
First Eagle U.S. Value Fund Class R6 | |
For The Year Ended
October 31, 2018 | | $ | 21.62 | | | | 0.18 | | | | 0.30 | | | | 0.48 | | | | (0.10 | ) | | | (1.76 | ) | | | — | | | | (1.86 | ) | |
For The Period
3/01/17^^^-
10/31/17 | | $ | 20.66 | | | | 0.09 | | | | 0.87 | | | | 0.96 | | | | — | | | | — | | | | — | | | | — | | |
First Eagle Gold Fund Class A | |
October 31, 2018 | | $ | 16.50 | | | | (0.07 | ) | | | (3.35 | ) | | | (3.42 | ) | | | — | | | | — | | | | — | | | | — | | |
October 31, 2017 | | $ | 17.99 | | | | (0.09 | ) | | | (1.40 | ) | | | (1.49 | ) | | | — | | | | — | | | | — | | | | — | | |
October 31, 2016 | | $ | 12.36 | | | | (0.11 | ) | | | 5.74 | | | | 5.63 | | | | — | | | | — | | | | — | | | | — | | |
October 31, 2015 | | $ | 13.45 | | | | (0.08 | ) | | | (1.01 | ) | | | (1.09 | ) | | | — | | | | — | | | | — | | | | — | | |
October 31, 2014 | | $ | 17.03 | | | | (0.09 | ) | | | (3.49 | ) | | | (3.58 | ) | | | — | | | | — | | | | — | | | | — | | |
First Eagle Gold Fund Class C | |
October 31, 2018 | | $ | 15.36 | | | | (0.17 | ) | | | (3.10 | ) | | | (3.27 | ) | | | — | | | | — | | | | — | | | | — | | |
October 31, 2017 | | $ | 16.89 | | | | (0.21 | ) | | | (1.32 | ) | | | (1.53 | ) | | | — | | | | — | | | | — | | | | — | | |
October 31, 2016 | | $ | 11.70 | | | | (0.22 | ) | | | 5.41 | | | | 5.19 | | | | — | | | | — | | | | — | | | | — | | |
October 31, 2015 | | $ | 12.84 | | | | (0.18 | ) | | | (0.96 | ) | | | (1.14 | ) | | | — | | | | — | | | | — | | | | — | | |
October 31, 2014 | | $ | 16.37 | | | | (0.20 | ) | | | (3.33 | ) | | | (3.53 | ) | | | — | | | | — | | | | — | | | | — | | |
First Eagle Gold Fund Class I | |
October 31, 2018 | | $ | 16.90 | | | | (0.02 | ) | | | (3.44 | ) | | | (3.46 | ) | | | — | | | | — | | | | — | | | | — | | |
October 31, 2017 | | $ | 18.38 | | | | (0.04 | ) | | | (1.44 | ) | | | (1.48 | ) | | | — | | | | — | | | | — | | | | — | | |
October 31, 2016 | | $ | 12.59 | | | | (0.06 | ) | | | 5.85 | | | | 5.79 | | | | — | | | | — | | | | — | | | | — | | |
October 31, 2015 | | $ | 13.66 | | | | (0.04 | ) | | | (1.03 | ) | | | (1.07 | ) | | | — | | | | — | | | | — | | | | — | | |
October 31, 2014 | | $ | 17.25 | | | | (0.05 | ) | | | (3.54 | ) | | | (3.59 | ) | | | — | | | | — | | | | — | | | | — | | |
First Eagle Gold Fund Class R3 | |
For The Period
5/01/18^-
10/31/18 | | $ | 16.35 | | | | (0.04 | ) | | | (2.87 | ) | | | (2.91 | ) | | | — | | | | — | | | | — | | | | — | | |
First Eagle Funds | Annual Report | October 31, 2018
136
| | | | | | | | | Ratio/Supplemental data | | | |
| | | | | | | | | Ratios to Average Net Assets of: | | | |
Selected per
share data for
the year ended: | | Net asset
value, end
of period | | Total
Return(a) | | Net assets,
end of
period
(thousands) | | Operating
expenses
excluding
earnings
credits
and/or fee
waivers | | Operating
expenses
including
earnings
credits
and/or fee
waivers | | Net
investment
income
excluding
earnings
credits
and/or fee
waivers | | Net
investment
income
including
earnings
credits
and/or fee
waivers | | Portfolio
turnover
rate | |
First Eagle U.S. Value Fund Class I | |
October 31, 2018 | | $ | 20.23 | | | | 2.24 | % | | $ | 875,239 | | | | 0.87 | % | | | 0.82 | % | | | 0.79 | % | | | 0.84 | % | | | 9.05 | % | |
October 31, 2017 | | $ | 21.61 | | | | 15.27 | % | | $ | 983,508 | | | | 0.86 | % | | | 0.81 | % | | | 0.51 | % | | | 0.56 | % | | | 5.85 | % | |
October 31, 2016 | | $ | 20.38 | | | | 6.49 | % | | $ | 841,199 | | | | 0.84 | % | | | 0.87 | % | | | 0.67 | % | | | 0.64 | % | | | 10.65 | % | |
October 31, 2015 | | $ | 20.11 | | | | 0.28 | % | | $ | 942,370 | | | | 0.87 | % | | | 0.87 | % | | | 0.76 | % | | | 0.76 | % | | | 15.14 | % | |
October 31, 2014 | | $ | 21.40 | | | | 9.19 | % | | $ | 1,199,674 | | | | 0.88 | % | | | 0.88 | % | | | 0.87 | % | | | 0.87 | % | | | 15.64 | % | |
First Eagle U.S. Value Fund Class R3 | |
For The Period
5/01/18^-
10/31/18 | | $ | 20.20 | | | | (0.83 | )%(b) | | $ | 50 | | | | 1.24 | %(c) | | | 1.19 | %(c) | | | 0.50 | %(c) | | | 0.55 | %(c) | | | 9.05 | %(b) | |
First Eagle U.S. Value Fund Class R6 | |
For The Year Ended
October 31, 2018 | | $ | 20.24 | | | | 2.28 | % | | $ | 1,362 | | | | 0.86 | % | | | 0.81 | % | | | 0.82 | % | | | 0.87 | % | | | 9.05 | % | |
For The Period
3/01/17^^^-
10/31/17 | | $ | 21.62 | | | | 4.65 | %(b) | | $ | 833 | | | | 0.85 | %(c) | | | 0.80 | %(c) | | | 0.56 | %(c) | | | 0.61 | %(c) | | | 5.85 | %(b) | |
First Eagle Gold Fund Class A | |
October 31, 2018 | | $ | 13.08 | | | | (20.73 | )% | | $ | 294,509 | | | | 1.29 | % | | | 1.29 | % | | | (0.45 | )% | | | (0.45 | )% | | | 9.43 | % | |
October 31, 2017 | | $ | 16.50 | | | | (8.28 | )% | | $ | 451,039 | | | | 1.26 | % | | | 1.26 | % | | | (0.53 | )% | | | (0.53 | )% | | | 7.90 | % | |
October 31, 2016 | | $ | 17.99 | | | | 45.55 | % | | $ | 566,708 | | | | 1.27 | % | | | 1.27 | % | | | (0.65 | )% | | | (0.65 | )% | | | 15.82 | % | |
October 31, 2015 | | $ | 12.36 | | | | (8.10 | )% | | $ | 390,521 | | | | 1.33 | % | | | 1.33 | % | | | (0.57 | )% | | | (0.57 | )% | | | 12.47 | % | |
October 31, 2014 | | $ | 13.45 | | | | (21.02 | )% | | $ | 448,012 | | | | 1.27 | % | | | 1.27 | % | | | (0.54 | )% | | | (0.54 | )% | | | 13.33 | % | |
First Eagle Gold Fund Class C | |
October 31, 2018 | | $ | 12.09 | | | | (21.29 | )% | | $ | 111,685 | | | | 2.05 | % | | | 2.05 | % | | | (1.21 | )% | | | (1.21 | )% | | | 9.43 | % | |
October 31, 2017 | | $ | 15.36 | | | | (9.06 | )% | | $ | 166,043 | | | | 2.04 | % | | | 2.03 | % | | | (1.30 | )% | | | (1.30 | )% | | | 7.90 | % | |
October 31, 2016 | | $ | 16.89 | | | | 44.36 | % | | $ | 206,225 | | | | 2.04 | % | | | 2.04 | % | | | (1.42 | )% | | | (1.42 | )% | | | 15.82 | % | |
October 31, 2015 | | $ | 11.70 | | | | (8.88 | )% | | $ | 148,119 | | | | 2.14 | % | | | 2.14 | % | | | (1.39 | )% | | | (1.39 | )% | | | 12.47 | % | |
October 31, 2014 | | $ | 12.84 | | | | (21.56 | )% | | $ | 185,551 | | | | 2.02 | % | | | 2.02 | % | | | (1.29 | )% | | | (1.29 | )% | | | 13.33 | % | |
First Eagle Gold Fund Class I | |
October 31, 2018 | | $ | 13.44 | | | | (20.47 | )% | | $ | 392,310 | | | | 1.00 | % | | | 1.00 | % | | | (0.15 | )% | | | (0.15 | )% | | | 9.43 | % | |
October 31, 2017 | | $ | 16.90 | | | | (8.05 | )% | | $ | 559,784 | | | | 0.99 | % | | | 0.99 | % | | | (0.25 | )% | | | (0.25 | )% | | | 7.90 | % | |
October 31, 2016 | | $ | 18.38 | | | | 45.99 | % | | $ | 509,635 | | | | 0.98 | % | | | 0.98 | % | | | (0.36 | )% | | | (0.36 | )% | | | 15.82 | % | |
October 31, 2015 | | $ | 12.59 | | | | (7.83 | )% | | $ | 306,131 | | | | 1.03 | % | | | 1.03 | % | | | (0.27 | )% | | | (0.27 | )% | | | 12.47 | % | |
October 31, 2014 | | $ | 13.66 | | | | (20.81 | )% | | $ | 366,186 | | | | 1.01 | % | | | 1.01 | % | | | (0.29 | )% | | | (0.29 | )% | | | 13.33 | % | |
First Eagle Gold Fund Class R3 | |
For The Period
5/01/18^-
10/31/18 | | $ | 13.44 | | | | (17.80 | )%(b) | | $ | 41 | | | | 1.32 | %(c) | | | 1.32 | %(c) | | | (0.59 | )%(c) | | | (0.59 | )%(c) | | | 9.43 | %(b) | |
First Eagle Funds | Annual Report | October 31, 2018
137
| | | Per share operating performance* | |
| | | | | Investment operations | | Less dividends and distributions | |
Selected per
share data for
the year ended: | | Net asset
value,
beginning
of year | | Net
investment
income/
loss | | Net
realized
and
unrealized
gains
(losses) on
investments | | Total
investment
operations | | From net
investment
income | | From
capital
gains | | Return of
capital | | Total
distributions | |
First Eagle Gold Fund Class R6 | |
For The Year Ended
October 31, 2018 | | $ | 16.91 | | | | (0.02 | ) | | | (3.43 | ) | | | (3.45 | ) | | | — | | | | — | | | | — | | | | — | | |
For The Period
3/01/17^^^-
10/31/17 | | $ | 17.60 | | | | (0.06 | ) | | | (0.63 | ) | | | (0.69 | ) | | | — | | | | — | | | | — | | | | — | | |
First Eagle Global Income Builder Fund Class A | |
October 31, 2018 | | $ | 12.05 | | | | 0.25 | | | | (0.56 | ) | | | (0.31 | ) | | | (0.23 | ) | | | — | | | | (0.06 | ) | | | (0.29 | ) | |
October 31, 2017 | | $ | 10.99 | | | | 0.28 | | | | 1.07 | | | | 1.35 | | | | (0.29 | ) | | | — | | | | — | | | | (0.29 | ) | |
October 31, 2016 | | $ | 10.73 | | | | 0.34 | | | | 0.27 | | | | 0.61 | | | | (0.35 | ) | | | — | | | | — | | | | (0.35 | ) | |
October 31, 2015 | | $ | 11.41 | | | | 0.35 | | | | (0.51 | ) | | | (0.16 | ) | | | (0.37 | ) | | | (0.15 | ) | | | — | | | | (0.52 | ) | |
October 31, 2014 | | $ | 11.26 | | | | 0.36 | | | | 0.17 | | | | 0.53 | | | | (0.38 | ) | | | — | | | | — | | | | (0.38 | ) | |
First Eagle Global Income Builder Fund Class C | |
October 31, 2018 | | $ | 12.02 | | | | 0.16 | | | | (0.56 | ) | | | (0.40 | ) | | | (0.14 | ) | | | — | | | | (0.06 | ) | | | (0.20 | ) | |
October 31, 2017 | | $ | 10.96 | | | | 0.19 | | | | 1.07 | | | | 1.26 | | | | (0.20 | ) | | | — | | | | — | | | | (0.20 | ) | |
October 31, 2016 | | $ | 10.71 | | | | 0.25 | | | | 0.26 | | | | 0.51 | | | | (0.26 | ) | | | — | | | | — | | | | (0.26 | ) | |
October 31, 2015 | | $ | 11.38 | | | | 0.26 | | | | (0.50 | ) | | | (0.24 | ) | | | (0.28 | ) | | | (0.15 | ) | | | — | | | | (0.43 | ) | |
October 31, 2014 | | $ | 11.23 | | | | 0.27 | | | | 0.17 | | | | 0.44 | | | | (0.29 | ) | | | — | | | | — | | | | (0.29 | ) | |
First Eagle Global Income Builder Fund Class I | |
October 31, 2018 | | $ | 12.02 | | | | 0.28 | | | | (0.55 | ) | | | (0.27 | ) | | | (0.26 | ) | | | — | | | | (0.06 | ) | | | (0.32 | ) | |
October 31, 2017 | | $ | 10.96 | | | | 0.31 | | | | 1.07 | | | | 1.38 | | | | (0.32 | ) | | | — | | | | — | | | | (0.32 | ) | |
October 31, 2016 | | $ | 10.71 | | | | 0.36 | | | | 0.26 | | | | 0.62 | | | | (0.37 | ) | | | — | | | | — | | | | (0.37 | ) | |
October 31, 2015 | | $ | 11.39 | | | | 0.38 | | | | (0.52 | ) | | | (0.14 | ) | | | (0.39 | ) | | | (0.15 | ) | | | — | | | | (0.54 | ) | |
October 31, 2014 | | $ | 11.23 | | | | 0.38 | | | | 0.19 | | | | 0.57 | | | | (0.41 | ) | | | — | | | | — | | | | (0.41 | ) | |
First Eagle Global Income Builder Fund Class R3 | |
For The Period
5/01/18^-
10/31/18 | | $ | 11.92 | | | | 0.13 | | | | (0.49 | ) | | | (0.36 | ) | | | (0.10 | ) | | | — | | | | (0.03 | ) | | | (0.13 | ) | |
First Eagle Global Income Builder Fund Class R6 | |
For The Year Ended
October 31, 2018 | | $ | 12.01 | | | | 0.28 | | | | (0.54 | ) | | | (0.26 | ) | | | (0.27 | ) | | | — | | | | (0.06 | ) | | | (0.33 | ) | |
For The Period
3/01/17^^^-
10/31/17 | | $ | 11.37 | | | | 0.20 | | | | 0.67 | | | | 0.87 | | | | (0.23 | ) | | | — | | | | — | | | | (0.23 | ) | |
First Eagle High Yield Fund Class A | |
October 31, 2018 | | $ | 9.03 | | | | 0.47 | | | | (0.24 | ) | | | 0.23 | | | | (0.45 | ) | | | — | | | | — | | | | (0.45 | ) | |
October 31, 2017 | | $ | 8.99 | | | | 0.46 | | | | 0.04 | | | | 0.50 | | | | (0.45 | ) | | | — | | | | (0.01 | ) | | | (0.46 | ) | |
October 31, 2016 | | $ | 8.90 | | | | 0.55 | | | | 0.12 | | | | 0.67 | | | | (0.54 | ) | | | — | | | | (0.04 | ) | | | (0.58 | ) | |
October 31, 2015 | | $ | 9.96 | | | | 0.55 | | | | (0.96 | ) | | | (0.41 | ) | | | (0.56 | ) | | | (0.09 | ) | | | — | | | | (0.65 | ) | |
October 31, 2014 | | $ | 10.11 | | | | 0.53 | | | | (0.15 | ) | | | 0.38 | | | | (0.53 | ) | | | — | | | | — | | | | (0.53 | ) | |
First Eagle Funds | Annual Report | October 31, 2018
138
| | | | | | | | | Ratio/Supplemental data | | | |
| | | | | | | | | Ratios to Average Net Assets of: | | | |
Selected per
share data for
the year ended: | | Net asset
value, end
of period | | Total
Return(a) | | Net assets,
end of
period
(thousands) | | Operating
expenses
excluding
earnings
credits
and/or fee
waivers | | Operating
expenses
including
earnings
credits
and/or fee
waivers | | Net
investment
income
excluding
earnings
credits
and/or fee
waivers | | Net
investment
income
including
earnings
credits
and/or fee
waivers | | Portfolio
turnover
rate | |
First Eagle Gold Fund Class R6 | |
For The Year Ended
October 31, 2018 | | $ | 13.46 | | | | (20.40 | )% | | $ | 74,414 | | | | 0.91 | % | | | 0.91 | % | | | (0.14 | )% | | | (0.14 | )% | | | 9.43 | % | |
For The Period
3/01/17^^^-
10/31/17 | | $ | 16.91 | | | | (3.92 | )%(b) | | $ | 15,650 | | | | 0.90 | %(c) | | | 0.91 | %(c) | | | (0.51 | )%(c) | | | (0.51 | )%(c) | | | 7.90 | %(b) | |
First Eagle Global Income Builder Fund Class A | |
October 31, 2018 | | $ | 11.45 | | | | (2.64 | )% | | $ | 319,003 | | | | 1.18 | % | | | 1.18 | % | | | 2.11 | % | | | 2.11 | % | | | 22.15 | % | |
October 31, 2017 | | $ | 12.05 | | | | 12.39 | % | | $ | 339,792 | | | | 1.19 | % | | | 1.19 | % | | | 2.43 | % | | | 2.43 | % | | | 23.18 | % | |
October 31, 2016 | | $ | 10.99 | | | | 5.76 | % | | $ | 361,605 | | | | 1.18 | % | | | 1.18 | % | | | 3.16 | % | | | 3.16 | % | | | 29.76 | % | |
October 31, 2015 | | $ | 10.73 | | | | (1.39 | )% | | $ | 410,153 | | | | 1.19 | % | | | 1.19 | % | | | 3.16 | % | | | 3.16 | % | | | 29.68 | % | |
October 31, 2014 | | $ | 11.41 | | | | 4.67 | % | | $ | 439,569 | | | | 1.26 | % | | | 1.23 | % | | | 3.09 | % | | | 3.12 | % | | | 18.45 | % | |
First Eagle Global Income Builder Fund Class C | |
October 31, 2018 | | $ | 11.42 | | | | (3.38 | )% | | $ | 297,716 | | | | 1.93 | % | | | 1.93 | % | | | 1.35 | % | | | 1.35 | % | | | 22.15 | % | |
October 31, 2017 | | $ | 12.02 | | | | 11.58 | % | | $ | 334,473 | | | | 1.94 | % | | | 1.94 | % | | | 1.69 | % | | | 1.69 | % | | | 23.18 | % | |
October 31, 2016 | | $ | 10.96 | | | | 4.87 | % | | $ | 344,660 | | | | 1.94 | % | | | 1.94 | % | | | 2.40 | % | | | 2.40 | % | | | 29.76 | % | |
October 31, 2015 | | $ | 10.71 | | | | (2.07 | )% | | $ | 382,467 | | | | 1.96 | % | | | 1.96 | % | | | 2.41 | % | | | 2.41 | % | | | 29.68 | % | |
October 31, 2014 | | $ | 11.38 | | | | 3.90 | % | | $ | 379,188 | | | | 2.00 | % | | | 1.97 | % | | | 2.31 | % | | | 2.34 | % | | | 18.45 | % | |
First Eagle Global Income Builder Fund Class I | |
October 31, 2018 | | $ | 11.43 | | | | (2.31 | )% | | $ | 742,408 | | | | 0.92 | % | | | 0.92 | % | | | 2.38 | % | | | 2.38 | % | | | 22.15 | % | |
October 31, 2017 | | $ | 12.02 | | | | 12.71 | % | | $ | 717,643 | | | | 0.93 | % | | | 0.93 | % | | | 2.68 | % | | | 2.68 | % | | | 23.18 | % | |
October 31, 2016 | | $ | 10.96 | | | | 5.93 | % | | $ | 509,250 | | | | 0.92 | % | | | 0.92 | % | | | 3.39 | % | | | 3.39 | % | | | 29.76 | % | |
October 31, 2015 | | $ | 10.71 | | | | (1.14 | )% | | $ | 470,802 | | | | 0.94 | % | | | 0.94 | % | | | 3.41 | % | | | 3.41 | % | | | 29.68 | % | |
October 31, 2014 | | $ | 11.39 | | | | 5.00 | % | | $ | 489,621 | | | | 1.05 | % | | | 0.97 | % | | | 3.25 | % | | | 3.33 | % | | | 18.45 | % | |
First Eagle Global Income Builder Fund Class R3 | |
For The Period
5/01/18^-
10/31/18 | | $ | 11.43 | | | | (3.02 | )%(b) | | $ | 48 | | | | 1.27 | %(c) | | | 1.27 | %(c) | | | 2.23 | %(c) | | | 2.23 | %(c) | | | 22.15 | %(b) | |
First Eagle Global Income Builder Fund Class R6 | |
For The Year Ended
October 31, 2018 | | $ | 11.42 | | | | (2.27 | )% | | $ | 912 | | | | 0.88 | % | | | 0.88 | % | | | 2.38 | % | | | 2.38 | % | | | 22.15 | % | |
For The Period
3/01/17^^^-
10/31/17 | | $ | 12.01 | | | | 7.68 | %(b) | | $ | 965 | | | | 0.89 | %(c) | | | 0.89 | %(c) | | | 2.55 | %(c) | | | 2.55 | %(c) | | | 23.18 | %(b) | |
First Eagle High Yield Fund Class A | |
October 31, 2018 | | $ | 8.81 | | | | 2.56 | % | | $ | 78,360 | | | | 1.26 | % | | | 1.19 | % | | | 5.17 | % | | | 5.24 | % | | | 24.82 | % | |
October 31, 2017 | | $ | 9.03 | | | | 5.71 | % | | $ | 98,548 | | | | 1.21 | % | | | 1.16 | % | | | 5.02 | % | | | 5.07 | % | | | 25.77 | % | |
October 31, 2016 | | $ | 8.99 | | | | 8.24 | % | | $ | 158,102 | | | | 1.15 | % | | | 1.20 | % | | | 6.45 | % | | | 6.40 | % | | | 36.88 | % | |
October 31, 2015 | | $ | 8.90 | | | | (4.24 | )% | | $ | 201,685 | | | | 1.12 | % | | | 1.16 | % | | | 5.81 | % | | | 5.77 | % | | | 31.62 | % | |
October 31, 2014 | | $ | 9.96 | | | | 3.74 | % | | $ | 246,954 | | | | 1.09 | % | | | 1.09 | % | | | 5.17 | % | | | 5.17 | % | | | 43.02 | % | |
First Eagle Funds | Annual Report | October 31, 2018
139
| | Per share operating performance* | |
| | | | | Investment operations | | Less dividends and distributions | |
Selected per
share data for
the year ended: | | Net asset
value,
beginning
of year | | Net
investment
income/
loss | | Net
realized
and
unrealized
gains
(losses) on
investments | | Total
investment
operations | | From net
investment
income | | From
capital
gains | | Return of
capital | | Total
distributions | |
First Eagle High Yield Fund Class C | |
October 31, 2018 | | $ | 9.02 | | | | 0.40 | | | | (0.24 | ) | | | 0.16 | | | | (0.38 | ) | | | — | | | | — | | | | (0.38 | ) | |
October 31, 2017 | | $ | 8.98 | | | | 0.39 | | | | 0.05 | | | | 0.44 | | | | (0.39 | ) | | | — | | | | (0.01 | ) | | | (0.40 | ) | |
October 31, 2016 | | $ | 8.89 | | | | 0.49 | | | | 0.12 | | | | 0.61 | | | | (0.48 | ) | | | — | | | | (0.04 | ) | | | (0.52 | ) | |
October 31, 2015 | | $ | 9.95 | | | | 0.48 | | | | (0.96 | ) | | | (0.48 | ) | | | (0.49 | ) | | | (0.09 | ) | | | — | | | | (0.58 | ) | |
October 31, 2014 | | $ | 10.10 | | | | 0.45 | | | | (0.15 | ) | | | 0.30 | | | | (0.45 | ) | | | — | | | | — | | | | (0.45 | ) | |
First Eagle High Yield Fund Class I | |
October 31, 2018 | | $ | 9.04 | | | | 0.49 | | | | (0.25 | ) | | | 0.24 | | | | (0.47 | ) | | | — | | | | — | | | | (0.47 | ) | |
October 31, 2017 | | $ | 8.99 | | | | 0.49 | | | | 0.05 | | | | 0.54 | | | | (0.48 | ) | | | — | | | | (0.01 | ) | | | (0.49 | ) | |
October 31, 2016 | | $ | 8.90 | | | | 0.58 | | | | 0.12 | | | | 0.70 | | | | (0.57 | ) | | | — | | | | (0.04 | ) | | | (0.61 | ) | |
October 31, 2015 | | $ | 9.96 | | | | 0.58 | | | | (0.96 | ) | | | (0.38 | ) | | | (0.59 | ) | | | (0.09 | ) | | | — | | | | (0.68 | ) | |
October 31, 2014 | | $ | 10.11 | | | | 0.55 | | | | (0.14 | ) | | | 0.41 | | | | (0.56 | ) | | | — | | | | — | | | | (0.56 | ) | |
First Eagle High Yield Fund Class R3 | |
For The Period
5/01/18^-
10/31/18 | | $ | 8.91 | | | | 0.23 | | | | (0.10 | ) | | | 0.13 | | | | (0.22 | ) | | | — | | | | — | | | | (0.22 | ) | |
First Eagle High Yield Fund Class R6 | |
For The Year Ended
October 31, 2018 | | $ | 9.04 | | | | 0.49 | | | | (0.24 | ) | | | 0.25 | | | | (0.47 | ) | | | — | | | | — | | | | (0.47 | ) | |
For The Period
3/01/17^^^-
10/31/17 | | $ | 9.10 | | | | 0.32 | | | | (0.05 | ) | | | 0.27 | | | | (0.33 | ) | | | — | | | | (0.00 | )** | | | (0.33 | ) | |
First Eagle Fund of America Class A | |
October 31, 2018 | | $ | 38.18 | | | | 0.08 | | | | (4.15 | ) | | | (4.07 | ) | | | — | | | | (3.58 | ) | | | — | | | | (3.58 | ) | |
October 31, 2017 | | $ | 32.93 | | | | (0.02 | ) | | | 7.41 | | | | 7.39 | | | | (0.07 | ) | | | (2.07 | ) | | | — | | | | (2.14 | ) | |
October 31, 2016 | | $ | 35.79 | | | | 0.14 | | | | (1.99 | ) | | | (1.85 | ) | | | (0.01 | ) | | | (1.00 | ) | | | — | | | | (1.01 | ) | |
October 31, 2015 | | $ | 38.58 | | | | 0.05 | | | | (0.01 | ) | | | 0.04 | | | | (0.12 | ) | | | (2.71 | ) | | | — | | | | (2.83 | ) | |
October 31, 2014 | | $ | 34.76 | | | | 0.17 | | | | 4.26 | | | | 4.43 | | | | (0.09 | ) | | | (0.52 | ) | | | — | | | | (0.61 | ) | |
First Eagle Fund of America Class C | |
October 31, 2018 | | $ | 31.08 | | | | (0.14 | ) | | | (3.27 | ) | | | (3.41 | ) | | | — | | | | (3.58 | ) | | | — | | | | (3.58 | ) | |
October 31, 2017 | | $ | 27.32 | | | | (0.23 | ) | | | 6.06 | | | | 5.83 | | | | — | | | | (2.07 | ) | | | — | | | | (2.07 | ) | |
October 31, 2016 | | $ | 30.07 | | | | (0.10 | ) | | | (1.65 | ) | | | (1.75 | ) | | | — | | | | (1.00 | ) | | | — | | | | (1.00 | ) | |
October 31, 2015 | | $ | 32.98 | | | | (0.20 | ) | | | (0.00 | )** | | | (0.20 | ) | | | — | | | | (2.71 | ) | | | — | | | | (2.71 | ) | |
October 31, 2014 | | $ | 29.94 | | | | (0.10 | ) | | | 3.66 | | | | 3.56 | | | | — | | | | (0.52 | ) | | | — | | | | (0.52 | ) | |
First Eagle Fund of America Class I | |
October 31, 2018 | | $ | 39.15 | | | | 0.21 | | | | (4.30 | ) | | | (4.09 | ) | | | (0.02 | ) | | | (3.58 | ) | | | — | | | | (3.60 | ) | |
October 31, 2017 | | $ | 33.72 | | | | 0.08 | | | | 7.59 | | | | 7.67 | | | | (0.17 | ) | | | (2.07 | ) | | | — | | | | (2.24 | ) | |
October 31, 2016 | | $ | 36.62 | | | | 0.24 | | | | (2.04 | ) | | | (1.80 | ) | | | (0.10 | ) | | | (1.00 | ) | | | — | | | | (1.10 | ) | |
October 31, 2015 | | $ | 39.39 | | | | 0.16 | | | | (0.00 | )** | | | 0.16 | | | | (0.22 | ) | | | (2.71 | ) | | | — | | | | (2.93 | ) | |
October 31, 2014 | | $ | 35.47 | | | | 0.25 | | | | 4.36 | | | | 4.61 | | | | (0.17 | ) | | | (0.52 | ) | | | — | | | | (0.69 | ) | |
First Eagle Funds | Annual Report | October 31, 2018
140
| | | | | | | | | Ratio/Supplemental data | | | |
| | | | | | | | | Ratios to Average Net Assets of: | | | |
Selected per
share data for
the year ended: | | Net asset
value, end
of period | | Total
Return(a) | | Net assets,
end of
period
(thousands) | | Operating
expenses
excluding
earnings
credits
and/or fee
waivers | | Operating
expenses
including
earnings
credits
and/or fee
waivers | | Net
investment
income
excluding
earnings
credits
and/or fee
waivers | | Net
investment
income
including
earnings
credits
and/or fee
waivers | | Portfolio
turnover
rate | |
First Eagle High Yield Fund Class C | |
October 31, 2018 | | $ | 8.80 | | | | 1.68 | % | | $ | 62,749 | | | | 2.01 | % | | | 1.94 | % | | | 4.43 | % | | | 4.50 | % | | | 24.82 | % | |
October 31, 2017 | | $ | 9.02 | | | | 5.06 | % | | $ | 87,479 | | | | 1.95 | % | | | 1.90 | % | | | 4.30 | % | | | 4.35 | % | | | 25.77 | % | |
October 31, 2016 | | $ | 8.98 | | | | 7.46 | % | | $ | 114,139 | | | | 1.89 | % | | | 1.94 | % | | | 5.74 | % | | | 5.69 | % | | | 36.88 | % | |
October 31, 2015 | | $ | 8.89 | | | | (4.96 | )% | | $ | 129,214 | | | | 1.87 | % | | | 1.91 | % | | | 5.07 | % | | | 5.03 | % | | | 31.62 | % | |
October 31, 2014 | | $ | 9.95 | | | | 2.97 | % | | $ | 184,459 | | | | 1.84 | % | | | 1.83 | % | | | 4.42 | % | | | 4.43 | % | | | 43.02 | % | |
First Eagle High Yield Fund Class I | |
October 31, 2018 | | $ | 8.81 | | | | 2.74 | % | | $ | 184,351 | | | | 0.97 | % | | | 0.90 | % | | | 5.46 | % | | | 5.53 | % | | | 24.82 | % | |
October 31, 2017 | | $ | 9.04 | | | | 6.15 | % | | $ | 278,660 | | | | 0.91 | % | | | 0.86 | % | | | 5.33 | % | | | 5.38 | % | | | 25.77 | % | |
October 31, 2016 | | $ | 8.99 | | | | 8.54 | % | | $ | 315,023 | | | | 0.86 | % | | | 0.91 | % | | | 6.83 | % | | | 6.78 | % | | | 36.88 | % | |
October 31, 2015 | | $ | 8.90 | | | | (3.97 | )% | | $ | 472,930 | | | | 0.83 | % | | | 0.87 | % | | | 6.10 | % | | | 6.06 | % | | | 31.62 | % | |
October 31, 2014 | | $ | 9.96 | | | | 4.03 | % | | $ | 709,776 | | | | 0.83 | % | | | 0.84 | % | | | 5.43 | % | | | 5.42 | % | | | 43.02 | % | |
First Eagle High Yield Fund Class R3 | |
For The Period
5/01/18^-
10/31/18 | | $ | 8.82 | | | | 1.41 | %(b) | | $ | 51 | | | | 1.36 | %(c) | | | 1.27 | %(c) | | | 4.99 | %(c) | | | 5.08 | %(c) | | | 24.82 | %(b) | |
First Eagle High Yield Fund Class R6 | |
For The Year Ended
October 31, 2018 | | $ | 8.82 | | | | 2.80 | % | | $ | 401 | | | | 1.01 | % | | | 0.93 | % | | | 5.36 | % | | | 5.44 | % | | | 24.82 | % | |
For The Period
3/01/17^^^-
10/31/17 | | $ | 9.04 | | | | 2.99 | %(b) | | $ | 114 | | | | 0.92 | %(c) | | | 0.87 | %(c) | | | 5.29 | %(c) | | | 5.34 | %(c) | | | 25.77 | %(b) | |
First Eagle Fund of America Class A | |
October 31, 2018 | | $ | 30.53 | | | | (11.84 | )% | | $ | 388,961 | | | | 1.32 | % | | | 1.32 | % | | | 0.23 | % | | | 0.23 | % | | | 60.29 | % | |
October 31, 2017 | | $ | 38.18 | | | | 23.56 | % | | $ | 622,389 | | | | 1.31 | % | | | 1.31 | % | | | (0.07 | )% | | | (0.07 | )% | | | 57.02 | % | |
October 31, 2016 | | $ | 32.93 | | | | (5.30 | )%(d) | | $ | 865,109 | | | | 1.32 | % | | | 1.32 | % | | | 0.43 | % | | | 0.43 | % | | | 55.06 | % | |
October 31, 2015 | | $ | 35.79 | | | | 0.19 | % | | $ | 1,331,912 | | | | 1.35 | % | | | 1.35 | % | | | 0.12 | % | | | 0.12 | % | | | 32.23 | % | |
October 31, 2014 | | $ | 38.58 | | | | 12.92 | % | | $ | 1,204,402 | | | | 1.36 | % | | | 1.36 | % | | | 0.45 | % | | | 0.45 | % | | | 35.18 | % | |
First Eagle Fund of America Class C | |
October 31, 2018 | | $ | 24.09 | | | | (12.48 | )% | | $ | 244,240 | | | | 2.06 | % | | | 2.06 | % | | | (0.51 | )% | | | (0.51 | )% | | | 60.29 | % | |
October 31, 2017 | | $ | 31.08 | | | | 22.61 | % | | $ | 401,699 | | | | 2.06 | % | | | 2.06 | % | | | (0.81 | )% | | | (0.81 | )% | | | 57.02 | % | |
October 31, 2016 | | $ | 27.32 | | | | (5.99 | )%(d) | | $ | 509,568 | | | | 2.08 | % | | | 2.08 | % | | | (0.35 | )% | | | (0.35 | )% | | | 55.06 | % | |
October 31, 2015 | | $ | 30.07 | | | | (0.55 | )% | | $ | 742,365 | | | | 2.10 | % | | | 2.10 | % | | | (0.63 | )% | | | (0.63 | )% | | | 32.23 | % | |
October 31, 2014 | | $ | 32.98 | | | | 12.06 | % | | $ | 631,696 | | | | 2.11 | % | | | 2.11 | % | | | (0.31 | )% | | | (0.31 | )% | | | 35.18 | % | |
First Eagle Fund of America Class I | |
October 31, 2018 | | $ | 31.46 | | | | (11.53 | )% | | $ | 612,845 | | | | 1.02 | % | | | 1.02 | % | | | 0.58 | % | | | 0.58 | % | | | 60.29 | % | |
October 31, 2017 | | $ | 39.15 | | | | 23.91 | % | | $ | 829,414 | | | | 1.01 | % | | | 1.01 | % | | | 0.22 | % | | | 0.22 | % | | | 57.02 | % | |
October 31, 2016 | | $ | 33.72 | | | | (5.01 | )%(d) | | $ | 808,426 | | | | 1.03 | % | | | 1.03 | % | | | 0.71 | % | | | 0.71 | % | | | 55.06 | % | |
October 31, 2015 | | $ | 36.62 | | | | 0.48 | % | | $ | 1,167,750 | | | | 1.05 | % | | | 1.05 | % | | | 0.41 | % | | | 0.41 | % | | | 32.23 | % | |
October 31, 2014 | | $ | 39.39 | | | | 13.20 | % | | $ | 887,507 | | | | 1.11 | % | | | 1.11 | % | | | 0.66 | % | | | 0.66 | % | | | 35.18 | % | |
First Eagle Funds | Annual Report | October 31, 2018
141
| | Per share operating performance* | |
| | | | | Investment operations | | Less dividends and distributions | |
Selected per
share data for
the year ended: | | Net asset
value,
beginning
of year | | Net
investment
income/
loss | | Net
realized
and
unrealized
gains
(losses) on
investments | | Total
investment
operations | | From net
investment
income | | From
capital
gains | | Return of
capital | | Total
distributions | |
First Eagle Fund of America Class Y | |
October 31, 2018 | | $ | 39.07 | | | | 0.09 | | | | (4.27 | ) | | | (4.18 | ) | | | — | | | | (3.58 | ) | | | — | | | | (3.58 | ) | |
October 31, 2017 | | $ | 33.67 | | | | (0.03 | ) | | | 7.58 | | | | 7.55 | | | | (0.08 | ) | | | (2.07 | ) | | | — | | | | (2.15 | ) | |
October 31, 2016 | | $ | 36.56 | | | | 0.14 | | | | (2.03 | ) | | | (1.89 | ) | | | (0.00 | )** | | | (1.00 | ) | | | — | | | | (1.00 | ) | |
October 31, 2015 | | $ | 39.35 | | | | 0.05 | | | | (0.02 | ) | | | 0.03 | | | | (0.11 | ) | | | (2.71 | ) | | | — | | | | (2.82 | ) | |
October 31, 2014 | | $ | 35.42 | | | | 0.17 | | | | 4.34 | | | | 4.51 | | | | (0.06 | ) | | | (0.52 | ) | | | — | | | | (0.58 | ) | |
First Eagle Fund of America Class R3 | |
For The Period
5/01/18^-
10/31/18 | | $ | 35.19 | | | | 0.14 | | | | (3.93 | ) | | | (3.79 | ) | | | — | | | | — | | | | — | | | | — | | |
First Eagle Fund of America Class R6 | |
For The Year Ended
October 31, 2018 | | $ | 39.15 | | | | 0.65 | | | | (4.73 | ) | | | (4.08 | ) | | | (0.03 | ) | | | (3.58 | ) | | | — | | | | (3.61 | ) | |
For The Period
3/01/17^^^-
10/31/17 | | $ | 35.44 | | | | 0.02 | | | | 3.69 | | | | 3.71 | | | | — | | | | — | | | | — | | | | — | | |
^ Class R3 commenced investment operations on May 1, 2018.
^^ Class R4 commenced investment operations on January 17, 2018.
^^^ Class R6 commenced investment operations on March 1, 2017.
* Per share amounts have been calculated using the average shares method.
** Amount represents less than $0.01 per share.
(a) Does not take into account the sales charge of 5.00% for Class A shares for all Funds, except First Eagle High Yield Fund, which has a sales charge of 4.50% and the CDSC (Contingent Deferred Sales Charge) of 1.00% for Class C shares. A contingent deferred sales charge of 1.00% may apply on redemptions of Class A shares made within 18 months following a purchase of $1,000,000 or more without an initial sales charge.
(b) Not Annualized
(c) Annualized
(d) In 2016, the Fund received a voluntary reimbursement by the subadviser for a realized investment loss. By excluding this reimbursement, total returns would have been -5.30%, -6.02%, -5.01% and -5.31% for Class A, Class C, Class I and Class Y, respectively.
See Notes to Financial Statements.
First Eagle Funds | Annual Report | October 31, 2018
142
| | | | | | | | | Ratio/Supplemental data | | | |
| | | | | | | | | Ratios to Average Net Assets of: | | | |
Selected per
share data for
the year ended: | | Net asset
value, end
of period | | Total
Return(a) | | Net assets,
end of
period
(thousands) | | Operating
expenses
excluding
earnings
credits
and/or fee
waivers | | Operating
expenses
including
earnings
credits
and/or fee
waivers | | Net
investment
income
excluding
earnings
credits
and/or fee
waivers | | Net
investment
income
including
earnings
credits
and/or fee
waivers | | Portfolio
turnover
rate | |
First Eagle Fund of America Class Y | |
October 31, 2018 | | $ | 31.31 | | | | (11.85 | )% | | $ | 280,977 | | | | 1.33 | % | | | 1.33 | % | | | 0.26 | % | | | 0.26 | % | | | 60.29 | % | |
October 31, 2017 | | $ | 39.07 | | | | 23.54 | % | | $ | 397,293 | | | | 1.31 | % | | | 1.31 | % | | | (0.09 | )% | | | (0.09 | )% | | | 57.02 | % | |
October 31, 2016 | | $ | 33.67 | | | | (5.28 | )%(d) | | $ | 385,995 | | | | 1.33 | % | | | 1.33 | % | | | 0.40 | % | | | 0.40 | % | | | 55.06 | % | |
October 31, 2015 | | $ | 36.56 | | | | 0.18 | % | | $ | 495,822 | | | | 1.36 | % | | | 1.36 | % | | | 0.12 | % | | | 0.12 | % | | | 32.23 | % | |
October 31, 2014 | | $ | 39.35 | | | | 12.91 | % | | $ | 527,831 | | | | 1.36 | % | | | 1.36 | % | | | 0.45 | % | | | 0.45 | % | | | 35.18 | % | |
First Eagle Fund of America Class R3 | |
For The Period
5/01/18^-
10/31/18 | | $ | 31.40 | | | | (10.74 | )%(b) | | $ | 45 | | | | 1.38 | %(c) | | | 1.38 | %(c) | | | 0.79 | %(c) | | | 0.79 | %(c) | | | 60.29 | %(b) | |
First Eagle Fund of America Class R6 | |
For The Year Ended
October 31, 2018 | | $ | 31.46 | | | | (11.53 | )% | | $ | 4,362 | | | | 0.98 | % | | | 0.98 | % | | | 1.85 | % | | | 1.86 | % | | | 60.29 | % | |
For The Period
3/01/17^^^-
10/31/17 | | $ | 39.15 | | | | 10.47 | %(b) | | $ | 397 | | | | 1.00 | %(c) | | | 1.00 | %(c) | | | 0.09 | %(c) | | | 0.09 | %(c) | | | 57.02 | %(b) | |
First Eagle Funds | Annual Report | October 31, 2018
143
Notes to Financial Statements
Note 1 — Significant Accounting Policies
First Eagle Funds (the "Trust"), is an open-end management investment company registered under the Investment Company Act of 1940, as amended ("1940 Act"). The Trust consists of seven separate portfolios, First Eagle Global Fund, First Eagle Overseas Fund, First Eagle U.S. Value Fund, First Eagle Gold Fund, First Eagle Global Income Builder Fund, First Eagle High Yield Fund and First Eagle Fund of America (each individually a "Fund" or collectively the "Funds"). All the Funds are diversified mutual funds except for First Eagle Gold Fund and First Eagle Fund of America, which are non-diversified. The Trust is a Delaware statutory trust. The First Eagle Global Fund seeks long-term growth of capital by investing in a range of asset classes from markets in the United States and throughout the world. The First Eagle Overseas Fund seeks long-term growth of capital by investing primarily in equities issued by non-U.S. corporations. The First Eagle U.S. Value Fund seeks long-term growth of capital by investing, under normal market conditions, at least 80% of its net assets (plus any borrowings for investment purposes) in domestic equity and debt securities. The First Eagle Gold Fund seeks to provide investors the opportunity to participate in the investment characteristics of gold (and to a limited extent other precious metals) for a portion of their overall investment portfolio. The First Eagle Global Income Builder Fund seeks current income generation and long-term growth of capital. The First Eagle High Yield Fund seeks to provide investors with a high level of current income. The First Eagle Fund of America seeks capital appreciation by investing primarily in domestic stocks and, to a lesser extent, in debt and foreign equity securities.
The Funds offer seven share classes, Class A shares, Class C shares, Class I shares, Class R3 shares, Class R4 shares, Class R5 shares and Class R6 shares. Additionally, First Eagle Fund of America also offers Class Y shares. Class R4 shares (except for First Eagle Global Fund and First Eagle Overseas Fund) and Class R5 shares (which collectively launched on March 1, 2017 together with Class R6 shares) are not currently funded, but are available for investment.
Effective at the close of business on Friday, May 9, 2014, the First Eagle Overseas Fund is closed to new investors, subject to certain limited exceptions. Additionally, Class Y on First Eagle Fund of America is closed to new investors, subject to certain limited exceptions. Additional information can be found in the Funds' prospectus.
First Eagle Investment Management, LLC (the "Adviser"), a subsidiary of First Eagle Holdings, Inc. ("First Eagle Holdings"), manages the Funds. Investment funds managed by The Blackstone Group, LP and Corsair Capital LLC and certain co-investors own a controlling interest in First Eagle Holdings and the Adviser through BCP CC Holdings L.P.
The following is a summary of significant accounting policies that are adhered to by the Funds. The Funds are investment companies and, accordingly, follow the investment company accounting and reporting guidance of the Financial Accounting Standards Board Accounting Standards Codification Topic 946—Investment Companies, which is part of U.S. generally accepted accounting principles ("GAAP").
a) Investments in Subsidiaries — The First Eagle Global Fund (the "Global Fund"), First Eagle Overseas Fund (the "Overseas Fund"), First Eagle U.S. Value Fund (the "U.S. Value Fund"),
First Eagle Funds | Annual Report | October 31, 2018
144
Notes to Financial Statements
and First Eagle Gold Fund (the "Gold Fund") may invest in certain precious metals through their investment in the First Eagle Global Cayman Fund, Ltd., First Eagle Overseas Cayman Fund, Ltd., First Eagle U.S. Value Cayman Fund, Ltd., and First Eagle Gold Cayman Fund, Ltd., respectively, each a wholly owned subsidiary (each referred to herein as a "Subsidiary" or collectively "the Subsidiaries"). Each Fund may invest up to 25% of its total assets in shares of its respective Subsidiary. Each Subsidiary has the ability to invest in commodities and securities consistent with the investment objective of its respective Fund. Substantially all of each Subsidiary's assets represent physical gold bullion, and First Eagle Gold Cayman Fund, Ltd. also holds physical silver. Trading in bullion directly by the Funds presents the risk of tax consequences (e.g., a change in the Funds' tax status subjecting the Funds to be taxed at the Fund level on all of their income if the Funds' "non-qualifying income" exceeds 10% of the Funds' gross income in any taxable year). Trading in bullion by the Subsidiaries generally does not present the same tax risks.
The First Eagle Global Cayman Fund, Ltd., established on October 18, 2013, is an exempted company under the laws of the Cayman Islands. The consolidated financial statements include the accounts of the First Eagle Global Fund and the First Eagle Global Cayman Fund, Ltd. All intercompany transactions and balances have been eliminated. As of October 31, 2018, the First Eagle Global Cayman Fund, Ltd. has $3,925,699,567 in net assets, representing 7.68% of the Global Fund's net assets.
The First Eagle Overseas Cayman Fund, Ltd., established on October 18, 2013, is an exempted company under the laws of the Cayman Islands. The consolidated financial statements include the accounts of the First Eagle Overseas Fund and the First Eagle Overseas Cayman Fund, Ltd. All intercompany transactions and balances have been eliminated. As of October 31, 2018, the First Eagle Overseas Cayman Fund, Ltd. has $962,984,424 in net assets, representing 6.62% of the Overseas Fund's net assets.
The First Eagle U.S. Value Cayman Fund, Ltd., established on January 24, 2012, is an exempted company under the laws of the Cayman Islands. The consolidated financial statements include the accounts of the First Eagle U.S. Value Fund and the First Eagle U.S. Value Cayman Fund, Ltd. All intercompany transactions and balances have been eliminated. As of October 31, 2018, the First Eagle U.S. Value Cayman Fund, Ltd. has $181,943,411 in net assets, representing 9.95% of the U.S. Value Fund's net assets.
The First Eagle Gold Cayman Fund, Ltd., established on May 28, 2010, is an exempted company under the laws of the Cayman Islands. The consolidated financial statements include the accounts of the First Eagle Gold Fund and the First Eagle Gold Cayman Fund, Ltd. All intercompany transactions and balances have been eliminated. As of October 31, 2018, the First Eagle Gold Cayman Fund, Ltd. has $197,623,408 in net assets, representing 22.64% of the Gold Fund's net assets.
b) Investment valuation — Each Fund computes its net asset value once daily as of the close of trading on each day the New York Stock Exchange ("NYSE") is open for trading. The net asset value per share is computed by dividing the total current value of the assets of a Fund, less its liabilities, by the total number of shares outstanding at the time of such computation.
First Eagle Funds | Annual Report | October 31, 2018
145
Notes to Financial Statements
A portfolio security (including an option), other than a bond, which is traded on a U.S. national securities exchange or a securities exchange abroad is generally valued at the price of the official close (last sales price if an official closing price is not available) as of the local market close on the primary exchange. If there are no round lot sales on such date, such security will be valued at the mean between the closing bid and asked prices (and if there is only a bid or only an asked price on such date, valuation will be at such bid or asked price for long or short positions, respectively). Securities, other than bonds, traded in the over-the-counter market are valued at the mean between the last bid and asked prices prior to the time of valuation (and if there is only a bid or only an asked price on such date, valuation will be at such bid or asked price for long or short positions, respectively), except if such unlisted security is traded on the NASDAQ in which case it is valued at the NASDAQ Official Closing Price. Such prices are provided by approved pricing vendors or other independent pricing sources.
All bonds, whether listed on an exchange or traded in the over-counter-market for which market quotations are readily available are generally priced at the evaluated bid price provided by an approved pricing service, or dealers in the over-the-counter markets in the United States or abroad. Pricing services and broker-dealers use multiple valuation techniques to determine value. In instances where sufficient market activity exists, dealers or pricing services utilize a market-based approach through which quotes from market makers are used to determine fair value. In instances where sufficient market activity may not exist or is limited, the dealers or pricing services also utilize proprietary valuation models which may consider market transactions in comparable securities and the various relationships between securities in determining value and/or market characteristics such as benchmark yield curves, option-adjusted spreads, credit spreads, estimated default rates, coupon-rates, anticipated timing of principal repayments, underlying collateral, and other unique security features in order to estimate the relevant cash flows, which are then discounted to calculate the fair values. Short-term investments are valued at evaluated bid prices.
Commodities (such as physical metals) are valued at a calculated evaluated mean price, as provided by an independent price source as of the close of the NYSE (normally 4:00 p.m. Eastern Time). Prior to June 18, 2018, commodities were valued at the indicative mean of the best-bid/best-offer immediately prior to the close of the NYSE.
Forward foreign currency exchange contracts are valued at the current cost of covering or offsetting such contracts, by reference to forward currency rates at the time the NYSE closes (normally 4:00 p.m. Eastern Time), as provided by an independent pricing source.
The exchange rates, as provided by an independent price source as of the close of the NYSE (normally 4:00 p.m. Eastern Time) are used to convert foreign security prices into U.S. dollars.
Any security that is listed or traded on more than one exchange (or traded in multiple markets) is valued at the official close on the primary exchange or market on which they are traded. In the absence of such a quotation, a security may be valued at the last quoted sales price on the most active exchange or market as determined by the independent pricing agent. The Funds use pricing services to identify the market prices of publicly traded securities in their portfolios.
First Eagle Funds | Annual Report | October 31, 2018
146
Notes to Financial Statements
When market prices are determined to be "stale" as a result of limited market activity for a particular holding, or in other circumstances when market prices are unavailable, such as for private placements, or determined to be unreliable for a particular holding, such holdings may be "fair valued" in accordance with procedures approved by the Board of Trustees ("Board"). The values assigned to a Fund's holdings therefore may differ on occasion from reported market values.
Certain Funds with non-U.S. holdings have adopted procedures under which movements in the prices for U.S. securities (beyond specified thresholds) occurring after the close of a foreign market may require fair valuation of securities traded in that foreign market. The determination of whether a particular foreign investment should be fair valued will be based on review of a number of factors, including developments in foreign markets and security-specific events. The values assigned to a Fund's holdings therefore may differ on occasion from reported market values, especially during periods of higher market price volatility. The Board and the Adviser believe relying on the procedures as just described will result in prices that are more reflective of the actual market value of portfolio securities held by the Funds than relying solely on reported market values.
The Funds adopted provisions surrounding fair value measurements and disclosures that define fair value, establish a framework for measuring fair value in GAAP and expand disclosures about fair value measurements. This applies to fair value measurements that are already required or permitted by other accounting standards and is intended to increase consistency of those measurements and applies broadly to securities and other types of assets and liabilities.
The Funds disclose the fair value of their investments in a hierarchy that prioritizes the inputs or assumptions to valuation techniques used to measure fair value. These inputs are used in determining the value of the Funds' investments and are summarized in the following fair value hierarchy:
Level 1 — Quoted prices in active markets for identical securities.
Level 2 — Other significant observable inputs (including quoted prices for similar securities, interest rates, prepayment speeds, credit risk, etc.).
Level 3 — Other significant unobservable inputs (including the Fund's own assumption in determining the fair value of investments).
The significant unobservable inputs that may be used in determining valuations for investments identified within Level 3 are market comparables and the enterprise value of a company. Indications of value and quotations may be observable at any given time, but are currently treated by the Funds as unobservable. Significant changes in any of the unobservable inputs may significantly impact the fair value measurement. The impact is based on the relationship between each unobservable input and the fair value measurement.
Significant increases (decreases) in enterprise multiples may increase (decrease) the fair value measurement. Significant increases (decreases) in the discount for marketability, probability of insolvency and probability of default may decrease (increase) the fair value measurement.
First Eagle Funds | Annual Report | October 31, 2018
147
Notes to Financial Statements
Fair valuation of securities, other financial investments or other assets (collectively, "securities") held by the Funds shall be determined in good faith under the supervision and responsibility of the Board. The Board has created a Board Valuation Committee (the "Committee") to oversee the execution of the valuation and liquidity procedures for the Funds.
The following is a summary of the Funds' inputs used to value the Funds' investments as of October 31, 2018:
First Eagle Global Fund
Description | | Level 1 | | Level 2 | | Level 3‡ | | Total | |
Assets:† | |
Common Stocks | | $ | 22,432,246,467 | | | $ | 15,921,092,387 | (a) | | $ | 17,553,847 | | | $ | 38,370,892,701 | | |
Corporate Bonds | | | — | | | | — | | | | 5,425,998 | (b) | | | 5,425,998 | | |
Commodities* | | | — | | | | 4,296,577,677 | | | | — | | | | 4,296,577,677 | | |
Foreign Government
Securities | | | — | | | | 581,297,997 | | | | — | ^ | | | 581,297,997 | | |
Short-Term Investments | | | 240,743 | | | | 7,515,476,679 | | | | — | | | | 7,515,717,422 | | |
U.S. Treasury Obligations | | | — | | | | 113,758,712 | | | | — | | | | 113,758,712 | | |
Forward Foreign Currency
Exchange Contracts** | | | — | | | | 67,541,601 | | | | — | | | | 67,541,601 | | |
Total | | $ | 22,432,487,210 | | | $ | 28,495,745,053 | | | $ | 22,979,845 | | | $ | 50,951,212,108 | | |
(a) At October 31, 2018, certain non-U. S. securities applied the procedures under which movements in the price for U.S. securities (beyond specific thresholds) occurring after the close of a foreign market required fair valuation of securities traded in that foreign market. See Note 1(b) for additional details. Certain other securities are identified within Level 2 due to other significant observable inputs.
(b) These investments are valued by brokers and pricing services. The inputs for these investments are not readily available or cannot be reasonably estimated and are generally those inputs described in Note 1(b).
† See Consolidated Schedule of Investments for additional detailed categorizations.
‡ Value determined using significant unobservable inputs.
* Represents gold bullion.
** Forward Foreign Currency Exchange Contracts are valued at net unrealized appreciation (depreciation) on the investment.
^ Fair value represents zero.
First Eagle Funds | Annual Report | October 31, 2018
148
Notes to Financial Statements
Fair Value Level 3 activity for the year ended October 31, 2018 was as follows:
First Eagle Global Fund (continued)
| | | Common
Stocks | | Corporate
Bonds | | Foreign
Government
Securities | | Total
Value | |
Beginning Balance — market value | | $ | 67,646,852 | | | $ | 24,461,850 | | | $ | — | ^ | | $ | 92,108,702 | | |
Purchases(1) | | | — | | | | — | | | | — | | | | — | | |
Sales(2) | | | (74,327,127 | ) | | | (42,873,207 | ) | | | — | | | | (117,200,334 | ) | |
Transfer In — Level 3 | | | — | | | | 5,316,658 | (a) | | | — | | | | 5,316,658 | | |
Transfer Out — Level 3 | | | — | | | | — | | | | — | | | | — | | |
Accrued Amortization | | | — | | | | 33,811 | | | | — | | | | 33,811 | | |
Realized Gains (Losses) | | | 74,152,999 | | | | 14,228,237 | | | | — | | | | 88,381,236 | | |
Change in Unrealized Appreciation
(Depreciation) | | | (49,918,877 | ) | | | 4,258,649 | | | | — | | | | (45,660,228 | ) | |
Ending Balance — market value | | $ | 17,553,847 | | | $ | 5,425,998 | | | $ | — | ^ | | $ | 22,979,845 | | |
Change in unrealized gains or
(losses) relating to assets still
held at reporting date | | $ | 3,723,064 | | | $ | 75,529 | | | $ | — | | | $ | 3,798,593 | | |
(a) Transfers from Level 2 to Level 3 are due to a decline in market activity, e.g., frequency of trades, which resulted in a lack of available market inputs to determine price.
^ Fair value represents zero.
(1) Purchases include all purchases of securities and securities received in corporate actions.
(2) Sales include all sales of securities, maturities, paydowns and securities tendered in corporate actions.
Quantitative Information about Level 3 Fair Value Measurements | |
| | | Fair Value at
October 31, 2018 | | Valuation
Technique(s) | | Unobservable
Input | | Range
(Weighted
Average)(a) | |
Common Stock | | $ | 17,553,847 | | | Comparable
Security | | Market
Discount | | 30% (30%) | |
Foreign Government
Securities | | $ | — | | | Discounted
Cash Flow | | Estimated
Recoverability | | 0% (0%) | |
Total | | $ | 17,553,847 | | | | | | | | | | | | | | |
(a) Unobservable inputs were weighted by the relative fair value of the instruments.
First Eagle Funds | Annual Report | October 31, 2018
149
Notes to Financial Statements
First Eagle Overseas Fund
Description | | Level 1 | | Level 2 | | Level 3‡ | | Total | |
Assets:† | |
Common Stocks | | $ | 2,350,172,246 | | | $ | 8,567,562,126 | (a) | | $ | 49,124,497 | | | $ | 10,966,858,869 | | |
Commodities* | | | — | | | | 1,205,722,763 | | | | — | | | | 1,205,722,763 | | |
Foreign Government
Securities | | | — | | | | 278,462,470 | | | | — | | | | 278,462,470 | | |
Short-Term Investments | | | 103,474 | | | | 1,876,006,860 | | | | — | | | | 1,876,110,334 | | |
U.S. Treasury Obligations | | | — | | | | 35,893,611 | | | | — | | | | 35,893,611 | | |
Forward Currency Contracts** | | | — | | | | 37,729,437 | | | | — | | | | 37,729,437 | | |
Total | | $ | 2,350,275,720 | | | $ | 12,001,377,267 | | | $ | 49,124,497 | | | $ | 14,400,777,484 | | |
(a) At October 31, 2018, these non-U. S. securities applied the procedures under which movements in the price for U.S. securities (beyond specific thresholds) occurring after the close of a foreign market required fair valuation of securities traded in that foreign market. See Note 1(b) for additional details.
† See Consolidated Schedule of Investments for additional detailed categorizations.
‡ Value determined using significant unobservable inputs.
* Represents gold bullion.
** Forward Foreign Currency Exchange Contracts are valued at net unrealized appreciation (depreciation) on the investment.
Fair Value Level 3 activity for the year ended October 31, 2018 was as follows:
| | | Common
Stocks | | Corporate
Bonds | | Total
Value | |
Beginning Balance — market value | | $ | 103,200,268 | | | $ | 16,307,900 | | | $ | 119,508,168 | | |
Purchases(1) | | | — | | | | — | | | | — | | |
Sales(2) | | | (72,582,815 | ) | | | (28,676,029 | ) | | | (101,258,844 | ) | |
Transfer In — Level 3 | | | — | | | | — | | | | — | | |
Transfer Out — Level 3 | | | — | | | | — | | | | — | | |
Accrued Amortization | | | — | | | | — | | | | — | | |
Realized Gains (Losses) | | | 63,324,560 | | | | 9,589,438 | | | | 72,913,998 | | |
Change in Unrealized Appreciation (Depreciation) | | | (44,817,516 | ) | | | 2,778,691 | | | | (42,038,825 | ) | |
Ending Balance — market value | | $ | 49,124,497 | | | $ | — | | | $ | 49,124,497 | | |
Change in unrealized gains or (losses) relating to
assets still held at reporting date | | $ | (2,082,358 | ) | | $ | — | | | $ | (2,082,358 | ) | |
(1) Purchases include all purchases of securities and securities received in corporate actions.
(2) Sales include all sales of securities, maturities, paydowns and securities tendered in corporate actions
First Eagle Funds | Annual Report | October 31, 2018
150
Notes to Financial Statements
First Eagle Overseas Fund (continued)
Quantitative Information about Level 3 Fair Value Measurements | |
| | | Fair Value at
October 31, 2018 | | Valuation
Technique(s) | | Unobservable
Input | | Range
(Weighted
Average)(a) | |
| | | $ | 21,395,984
| | | Comparable
Security
Market | | Market
Discount
Enterprise | | | 30% (30%)
| | |
| | | $ | 27,728,513 | | | Comparable
Companies | | Value
Multiple | | | 0.76x-
8.10x (4.43x) | | |
Common Stocks | | $ | 49,124,497 | | | | | | | | |
Total | | $ | 49,124,497 | | | | | | | | |
(a) Unobservable inputs were weighted by the relative fair value of the instruments.
First Eagle U.S. Value Fund
Description | | Level 1 | | Level 2 | | Level 3‡ | | Total | |
Assets:† | |
Common Stocks | | $ | 1,276,092,233 | | | $ | 11,104,271 | (a) | | $ | — | | | $ | 1,287,196,504 | | |
Corporate Bonds | | | — | | | | 31,993,438 | | | | 595,500 | (b) | | | 32,588,938 | | |
Commodities* | | | — | | | | 181,952,654 | | | | — | | | | 181,952,654 | | |
Short-Term Investments | | | 43,272 | | | | 322,011,380 | | | | — | | | | 322,054,652 | | |
Total | | $ | 1,276,135,505 | | | $ | 547,061,743 | | | $ | 595,500 | | | $ | 1,823,792,748 | | |
(a) At October 31, 2018, these non-U. S. securities applied the procedures under which movements in the price for U.S. securities (beyond specific thresholds) occurring after the close of a foreign market required fair valuation of securities traded in that foreign market. See Note 1(b) for additional details.
(b) These investments are valued by brokers and pricing services. The inputs for these investments are not readily available or cannot be reasonably estimated and are generally those inputs described in Note 1(b).
† See Consolidated Schedule of Investments for additional detailed categorizations.
‡ Value determined using significant unobservable inputs.
* Represents gold bullion.
First Eagle Funds | Annual Report | October 31, 2018
151
Notes to Financial Statements
Fair Value Level 3 activity for the year ended October 31, 2018 was as follows:
First Eagle U.S. Value Fund (continued)
| | | Corporate
Bond | |
Beginning Balance — market value | | $ | — | | |
Purchases(1) | | | — | | |
Sales(2) | | | — | | |
Transfer In — Level 3 | | | 583,500 | (a) | |
Transfer Out — Level 3 | | | — | | |
Accrued Amortization | | | 3,878 | | |
Realized Gains (Losses) | | | — | | |
Change in Unrealized Appreciation (Depreciation) | | | 8,122 | | |
Ending Balance — market value | | $ | 595,500 | | |
Change in unrealized gains or (losses) relating to assets still held at reporting date | | $ | 8,122 | | |
(a) Transfers from Level 2 to Level 3 are due to a decline in market activity, e.g., frequency of trades, which resulted in a lack of available market inputs to determine price.
(1) Purchases include all purchases of securities and securities received in corporate actions.
(2) Sales include all sales of securities, maturities, paydowns and securities tendered in corporate actions
First Eagle Gold Fund
Description | | Level 1 | | Level 2 | | Level 3 | | Total | |
Assets:† | |
Common Stocks | | $ | 566,239,944 | | | $ | 90,827,955 | (a) | | $ | — | | | $ | 657,067,899 | | |
Commodities* | | | — | | | | 197,700,554 | | | | — | | | | 197,700,554 | | |
Short-Term Investments | | | 66,251 | | | | 20,383,659 | | | | — | | | | 20,449,910 | | |
Warrants | | | 1,471 | | | | — | | | | — | | | | 1,471 | | |
Total | | $ | 566,307,666 | | | $ | 308,912,168 | | | $ | — | | | $ | 875,219,834 | | |
(a) At October 31, 2018, these non-U. S. securities applied the procedures under which movements in the price for U.S. securities (beyond specific thresholds) occurring after the close of a foreign market required fair valuation of securities traded in that foreign market. See Note 1(b) for additional details.
† See Consolidated Schedule of Investments for additional detailed categorizations.
* Represents gold and silver bullion.
First Eagle Funds | Annual Report | October 31, 2018
152
Notes to Financial Statements
Fair Value Level 3 activity for the year ended October 31, 2018 was as follows:
First Eagle Gold Fund (continued)
| | | Convertible
Bond | |
Beginning Balance — market value | | $ | 15,000,000 | | |
Purchases(1) | | | — | | |
Sales(2) | | | (15,000,000 | ) | |
Transfer In — Level 3 | | | — | | |
Transfer Out — Level 3 | | | — | | |
Accrued Amortization | | | — | | |
Realized Gains (Losses) | | | — | | |
Change in Unrealized Appreciation (Depreciation) | | | — | | |
Ending Balance — market value | | $ | — | | |
Change in unrealized gains or (losses) relating to assets still held at reporting date | | $ | — | | |
(1) Purchases include all purchases of securities and securities received in corporate actions.
(2) Sales include all sales of securities, maturities, paydowns and securities tendered in corporate actions
First Eagle Global Income Builder Fund
Description | | Level 1 | | Level 2 | | Level 3‡ | | Total | |
Assets:† | |
Common Stocks | | $ | 316,285,112 | | | $ | 443,746,791 | (a) | | $ | — | | | $ | 760,031,903 | | |
Corporate Bonds | | | — | | | | 373,325,057 | | | | — | | | | 373,325,057 | | |
Closed End Funds | | | — | | | | 6,891,251 | | | | — | | | | 6,891,251 | | |
Commodities* | | | — | | | | 55,065,632 | | | | — | | | | 55,065,632 | | |
Foreign Government Securities | | | — | | | | 17,837,456 | | | | — | | | | 17,837,456 | | |
Loan Assignments | | | — | | | | 23,306,029 | | | | 16,701,525 | (b) | | | 40,007,554 | | |
Preferred Stocks | | | 1,741,796 | | | | — | | | | — | | | | 1,741,796 | | |
Short-Term Investments | | | 2,198 | | | | 42,131,202 | | | | — | | | | 42,133,400 | | |
U.S. Treasury Obligations | | | — | | | | 52,113,322 | | | | — | | | | 52,113,322 | | �� |
Forward Foreign Currency
Exchange Contracts** | | | — | | | | 1,818,158 | | | | — | | | | 1,818,158 | | |
Total | | $ | 318,029,106 | | | $ | 1,016,234,898 | | | $ | 16,701,525 | | | $ | 1,350,965,529 | | |
(a) At October 31, 2018, these non-U. S. securities applied the procedures under which movements in the price for U.S. securities (beyond specific thresholds) occurring after the close of a foreign market required fair valuation of securities traded in that foreign market. See Note 1(b) for additional details.
(b) These investments are valued by brokers and pricing services. The inputs for these investments are not readily available or cannot be reasonably estimated and are generally those inputs described in Note 1(b).
† See Schedule of Investments for additional detailed categorizations.
‡ Value determined using significant unobservable inputs.
* Represents gold bullion.
** Forward Foreign Currency Exchange Contracts are valued at net unrealized appreciation (depreciation) on the investment.
First Eagle Funds | Annual Report | October 31, 2018
153
Notes to Financial Statements
Fair Value Level 3 activity for the year ended October 31, 2018 was as follows:
First Eagle Global Income Builder Fund (continued)
| | | Corporate
Bonds | | Loan
Assignments | | Total
Value | |
Beginning Balance — market value | | $ | 2,840,419 | | | $ | 16,763,123 | | | $ | 19,603,542 | | |
Purchases(1) | | | — | | | | — | | | | — | | |
Sales(2) | | | — | | | | (1,070,836 | ) | | | (1,070,836 | ) | |
Transfer In — Level 3 | | | — | | | | — | | | | — | | |
Transfer Out — Level 3 | | | (2,840,419 | )(a) | | | — | | | | (2,840,419 | ) | |
Accrued Amortization | | | — | | | | 55,913 | | | | 55,913 | | |
Realized Gains (Losses) | | | — | | | | 1,815 | | | | 1,815 | | |
Change in Unrealized Appreciation (Depreciation) | | | — | | | | 951,510 | | | | 951,510 | | |
Ending Balance — market value | | $ | — | | | $ | 16,701,525 | | | $ | 16,701,525 | | |
Change in unrealized gains or (losses) relating to assets
still held at reporting date | | $ | — | | | $ | 951,510 | | | $ | 951,510 | | |
(a) Transfers from Level 3 to Level 2 are due to an increase in market activity, e.g., frequency of trades, which resulted in an increase in available market inputs to determine the price.
(1) Purchases include all purchases of securities and securities received in corporate actions.
(2) Sales include all sales of securities, maturities, paydowns and securities tendered in corporate actions
First Eagle High Yield Fund
Description | | Level 1 | | Level 2 | | Level 3‡ | | Total | |
Assets:† | |
Common Stocks | | $ | — | | | $ | — | | | $ | 10,393,732 | | | $ | 10,393,732 | | |
Corporate Bonds | | | — | | | | 263,310,385 | | | | — | | | | 263,310,385 | | |
Loan Assignments | | | — | | | | 10,660,454 | | | | 17,192,569 | (a) | | | 27,853,023 | | |
Short-Term Investments | | | 1,854 | | | | 18,885,757 | | | | — | | | | 18,887,611 | | |
Forward Foreign Currency
Exchange Contracts** | | | — | | | | 28,645 | | | | — | | | | 28,645 | | |
Total | | $ | 1,854 | | | $ | 292,885,241 | | | $ | 27,586,301 | | | $ | 320,473,396 | | |
(a) These investments are valued by brokers and pricing services. The inputs for these investments are not readily available or cannot be reasonably estimated and are generally those inputs described in Note 1(b).
† See Schedule of Investments for additional detailed categorizations.
‡ Value determined using significant unobservable inputs.
** Forward Foreign Currency Exchange Contracts are valued at net unrealized appreciation (depreciation) on the investment.
First Eagle Funds | Annual Report | October 31, 2018
154
Notes to Financial Statements
Fair Value Level 3 activity for the year ended October 31, 2018 was as follows:
First Eagle High Yield Fund (continued)
| | | Common
Stocks | | Corporate
Bonds | | Loan
Assignments | | Total
Value | |
Beginning Balance — market value | | $ | 2,603,164 | | | $ | 9,726,191 | | | $ | 23,239,667 | | | $ | 35,569,022 | | |
Purchases(1) | | | 7,855,278 | | | | 825,199 | | | | 1,068,750 | | | | 9,749,227 | | |
Sales(2) | | | (1,333,116 | ) | | | (16,647,220 | ) | | | (8,148,610 | ) | | | (26,128,946 | ) | |
Transfer In — Level 3 | | | — | | | | — | | | | — | | | | — | | |
Transfer Out — Level 3 | | | — | | | | (4,180,852 | )(a) | | | — | | | | (4,180,852 | ) | |
Accrued Amortization | | | — | | | | (1,103,178 | ) | | | (5,185 | ) | | | (1,108,363 | ) | |
Realized Gains (Losses) | | | (3,604,000 | ) | | | — | | | | (3,172,738 | ) | | | (6,776,738 | ) | |
Change in Unrealized Appreciation
(Depreciation) | | | 4,872,406 | | | | 11,379,860 | | | | 4,210,685 | | | | 20,462,951 | | |
Ending Balance — market value | | $ | 10,393,732 | | | $ | — | | | $ | 17,192,569 | | | $ | 27,586,301 | | |
Change in unrealized gains or
(losses) relating to assets still
held at reporting date | | $ | 2,538,454 | | | $ | — | | | $ | 1,298,887 | | | $ | 3,837,341 | | |
(a) Transfers from Level 3 to Level 2 are due to an increase in market activity, e.g., frequency of trades, which resulted in an increase in available market inputs to determine the price.
(1) Purchases include all purchases of securities and securities received in corporate actions.
(2) Sales include all sales of securities, maturities, paydowns and securities tendered in corporate actions
Quantitative Information about Level 3 Fair Value Measurements | |
| | | Fair Value at
October 31, 2018 | | Valuation
Technique(s) | | Unobservable
Input | | Range
(Weighted
Average)(a) | |
Common Stocks | | | | | | Indicative
Broker
Quotes (Mid) | | $37.50 -
$38.25
($37.92) | |
| | | $ | 10,393,732 | | | Market
Comparable
Companies | | Enterprise
Value
Multiple | |
0.20
6.41x (3.26x)x-
| |
Total | | $ | 10,393,732 | | | | | | | | |
(a) Unobservable inputs were weighted by the relative fair value of the instruments.
First Eagle Funds | Annual Report | October 31, 2018
155
Notes to Financial Statements
First Eagle Fund of America
Description | | Level 1 | | Level 2 | | Level 3 | | Total | |
Assets:† | |
Common Stocks | | $ | 1,471,260,094 | | | $ | — | | | $ | — | | | $ | 1,471,260,094 | | |
Options Purchased | | | 21,392,830 | | | | — | | | | — | | | | 21,392,830 | | |
Short-Term Investments | | | 45,456,524 | | | | — | | | | — | | | | 45,456,524 | | |
Total | | $ | 1,538,109,448 | | | $ | — | | | $ | — | | | $ | 1,538,109,448 | | |
Liabilities: | |
Written Options (Sold Short) | | $ | (4,916,270 | ) | | $ | — | | | $ | — | | | $ | (4,916,270 | ) | |
Total | | $ | (4,916,270 | ) | | $ | — | | | $ | — | | | $ | (4,916,270 | ) | |
† See Schedule of Investments for additional detailed categorizations.
c) Investment transactions and income — Investment transactions are accounted for on a trade date basis. The specific identification method is used in determining realized gains and losses from investment transactions. Dividend income is recorded on the ex-dividend date. Interest income is recorded daily on the accrual basis. In computing investment income, each Fund accretes discounts and amortizes premiums on debt obligations using the effective yield method. Investment income is allocated to each Fund's share class in proportion to its relative net assets. Payments received from certain investments held by the Funds may be comprised of dividends, capital gains and return of capital. The Funds originally estimate the expected classification of such payments. The amounts may subsequently be reclassified upon receipt of information from the issuer.
d) Expenses — Expenses arising in connection with a Fund are charged directly to that Fund. Expenses common to all Funds may be allocated to each Fund in proportion to its relative net assets. Certain expenses are shared with the First Eagle Variable Funds, an affiliated fund group. Such costs are generally allocated using the ratio of the Fund's average daily net assets relative to the total average daily net assets of the First Eagle Variable Funds. Earnings credits may reduce shareholder servicing agent fees by the amount of interest earned on balances with such service provider.
e) Foreign currency translation — The books and records of the Funds are maintained in U.S. dollars. The market values of securities which are not traded in U.S. currency are recorded in the financial statements after translation to U.S. dollars based on the applicable exchange rates at the end of the period. The costs of such securities are translated at exchange rates prevailing when acquired. Related interest, dividends and withholding taxes are accrued at the rates of exchange prevailing on the respective dates of such transactions.
The net assets of each of the Funds are presented at the foreign exchange rates and market values at the close of the period. The Funds do not isolate that portion of gains and losses on investments which is due to changes in foreign exchange rates from that which is due to changes in market prices of the securities. Accordingly, such foreign currency gains (losses) are
First Eagle Funds | Annual Report | October 31, 2018
156
Notes to Financial Statements
included in the reported net realized and unrealized gains (losses) on investment transactions on the Statements of Operations. However, for federal income tax purposes each Fund does isolate the effect of changes in foreign exchange rates from the changes in market prices for realized gains and losses on debt obligations.
f) Forward Foreign Currency Exchange Contracts — In connection with portfolio purchases and sales of securities denominated in foreign currencies, each Fund may enter into forward foreign currency exchange contracts. The First Eagle Global Fund, First Eagle Overseas Fund, First Eagle Global Income Builder Fund and First Eagle High Yield Fund enter into forward foreign currency exchange contracts primarily to manage and/or gain exposure to certain foreign currencies. The Funds' currency transactions include portfolio hedging on portfolio positions. Portfolio hedging is the use of a forward foreign currency exchange contract (or other cash management position) with respect to one or more portfolio security positions denominated or quoted in a particular currency. Currency exchange transactions involve currencies of different countries that the Funds invest in and serve as hedges against possible variations in the exchange rates between these currencies and the U.S. dollar. Each Fund may engage in portfolio hedging with respect to the currency of a particular country in amounts approximating actual or anticipated positions in securities denominated in that currency. Hedging can reduce exposure to currency exchange movements, but cannot eliminate that exposure. It is possible to lose money under a hedge.
Funds investing in forward foreign currency exchange contracts are exposed to risk if the value of the currency changes unfavorably, if the counterparties to the contracts are unable to meet the terms of their contracts or if the Fund is unable to enter into a closing position. Forward foreign currency exchange contracts outstanding at period end, if any, are listed after each Fund's portfolio. For the year ended October 31, 2018, the average monthly outstanding currency purchased or sold in U.S. dollars for forward foreign currency exchange contracts held by the Funds were as follows:
| | | First Eagle
Global
Fund | | First Eagle
Overseas
Fund | | First Eagle
Global
Income
Builder
Fund | | First Eagle
High Yield
Fund | |
Forward Foreign Currency Exchange Contracts: | |
Average Settlement
Value — Purchased | | $ | 157,325,346 | | | $ | 60,384,371 | | | $ | 1,727,860 | | | $ | 763,650 | | |
Average Settlement
Value — Sold | | | 2,650,907,419 | | | | 1,482,841,999 | | | | 60,278,372 | | | | 771,357 | | |
The Funds adopted provisions surrounding disclosures of derivative instruments and hedging activities which require qualitative disclosures about objectives and strategies for using derivatives, quantitative disclosures about fair value amounts of gains and losses on derivative instruments, and disclosures about currency-risk-related contingent features in derivative agreements.
First Eagle Funds | Annual Report | October 31, 2018
157
Notes to Financial Statements
In order to better define its contractual rights and to secure rights that may help the Fund mitigate its counterparty risk, the Fund may enter into an International Swaps and Derivatives Association, Inc. Master Agreement ("ISDA Master Agreement") or similar agreement with its derivative contract counterparties. An ISDA Master Agreement is a bilateral agreement between the Fund and a counterparty that governs over-the-counter ("OTC") derivatives and forward foreign currency exchange contracts and typically contains, among other things, collateral posting terms and netting provisions in the event of a default and/or termination event. Under an ISDA Master Agreement, the Fund may, under certain circumstances, offset with the counterparty certain derivative financial instrument's payables and/or receivables with collateral held and/or posted and create one single net payment. With respect to certain counterparties, in accordance with the terms of the ISDA Master Agreement, the Funds may be required to post or receive collateral in the form of cash or debt securities issued by the U.S. Government or related agencies. Daily movement of cash collateral is subject to minimum threshold amounts. Cash collateral that has been pledged to cover obligations of a Fund, if any, is reported separately on the Statements of Assets and Liabilities as cash pledged. Non-cash collateral pledged by the Fund, if any, is noted in the Schedules of Investments. Collateral received by the Funds is held in a segregated account at the Funds' custodian bank. These amounts are not reflected on the Funds' Statements of Assets and Liabilities and are disclosed in the table below. The provisions of the ISDA Master Agreement typically permit a single net payment in the event of default (close-out netting) including the bankruptcy or insolvency of the counterparty. Note, however, that bankruptcy or insolvency laws of a particular jurisdiction may impose restrictions on or prohibitions against the right of offset in bankruptcy, insolvency or other events.
For financial reporting purposes, the Fund does not offset derivative assets and derivative liabilities that are subject to netting arrangements in the Statements of Asset and Liabilities.
At October 31, 2018, the Funds had the following forward foreign currency exchange contracts grouped into appropriate risk categories illustrated below:
First Eagle Global Fund
| | | | | | | Gain or (Loss)
Derivative Recognized
in Income | |
Risk Type | | Asset Derivative
Fair Value(1) | | Liability Derivative
Fair Value(2) | | Net realized
Gains
(Losses)(3) | | Change in
Appreciation
(Depreciation)(4) | |
Foreign currency | | $ | 67,541,601 | | | $ | — | | | $ | 80,959,085 | | | $ | 37,655,927 | | |
First Eagle Funds | Annual Report | October 31, 2018
158
Notes to Financial Statements
First Eagle Overseas Fund
| | | | | | | Gain or (Loss)
Derivative Recognized
in Income | |
Risk Type | | Asset Derivative
Fair Value(1) | | Liability Derivative
Fair Value(2) | | Net realized
Gains
(Losses)(3) | | Change in
Appreciation
(Depreciation)(4) | |
Foreign currency | | $ | 37,729,437 | | | $ | — | | | $ | 44,134,138 | | | $ | 22,017,598 | | |
First Eagle Gold Fund
| | | | | | | Gain or (Loss)
Derivative Recognized
in Income | |
Risk Type | | Asset Derivative
Fair Value(1) | | Liability Derivative
Fair Value(2) | | Net realized
Gains
(Losses)(3) | | Change in
Appreciation
(Depreciation)(4) | |
Foreign currency | | $ | — | | | $ | — | | | $ | (20,453 | ) | | $ | — | | |
First Eagle Global Income Builder Fund
| | | | | | | Gain or (Loss)
Derivative Recognized
in Income | |
Risk Type | | Asset Derivative
Fair Value(1) | | Liability Derivative
Fair Value(2) | | Net realized
Gains
(Losses)(3) | | Change in
Appreciation
(Depreciation)(4) | |
Foreign currency | | $ | 1,818,158 | | | $ | — | | | $ | 1,358,322 | | | $ | 1,600,358 | | |
First Eagle High Yield Fund
| | | | | | | Gain or (Loss)
Derivative Recognized
in Income | |
Risk Type | | Asset Derivative
Fair Value(1) | | Liability Derivative
Fair Value(2) | | Net realized
Gains
(Losses)(3) | | Change in
Appreciation
(Depreciation)(4) | |
Foreign currency | | $ | 28,645 | | | $ | — | | | $ | — | | | $ | 28,645 | | |
(1) Statement of Assets and Liabilities location: Unrealized appreciation on forward foreign currency exchange contracts.
(2) Statement of Assets and Liabilities location: Unrealized depreciation on forward foreign currency exchange contracts.
(3) Statement of Operations location: Net realized gains (losses) from settlement of forward foreign currency exchange contracts.
(4) Statement of Operations location: Changes in unrealized appreciation (depreciation) of forward foreign currency exchange contracts.
First Eagle Funds | Annual Report | October 31, 2018
159
Notes to Financial Statements
The following tables present each Fund's gross derivative assets and liabilities by counterparty net of amounts available for offset under netting arrangements and any related collateral received or pledged by each fund as of October 31, 2018:
First Eagle Global Fund
Counterparty | | Gross Amounts
of Assets
Presented in
Statement of
Assets and
Liabilities | | Derivatives
Available for
Offset | | Collateral
Received | | Net Amount
(Not Less
Than $0) | |
Bank of New York Mellon | | $ | 7,334,317 | | | $ | — | | | $ | — | | | $ | 7,334,317 | | |
Goldman Sachs | | | 31,769,673 | | | | — | | | | (31,769,673 | ) | | | — | | |
HSBC Bank plc | | | 9,498,452 | | | | — | | | | — | | | | 9,498,452 | | |
JPMorgan Chase Bank | | | 14,444,689 | | | | — | | | | — | | | | 14,444,689 | | |
UBS AG | | | 4,494,470 | | | | — | | | | — | | | | 4,494,470 | | |
| | | $ | 67,541,601 | | | $ | — | | | $ | (31,769,673 | ) | | $ | 35,771,928 | | |
First Eagle Overseas Fund
Counterparty | | Gross Amounts
of Assets
Presented in
Statement of
Assets and
Liabilities | | Derivatives
Available for
Offset | | Collateral
Received | | Net Amount
(Not Less
Than $0) | |
Bank of New York Mellon | | $ | 4,182,211 | | | $ | — | | | $ | — | | | $ | 4,182,211 | | |
Goldman Sachs | | | 19,379,017 | | | | — | | | | (19,379,017 | ) | | | — | | |
HSBC Bank plc | | | 4,699,225 | | | | — | | | | — | | | | 4,699,225 | | |
JPMorgan Chase Bank | | | 7,531,930 | | | | — | | | | — | | | | 7,531,930 | | |
UBS AG | | | 1,937,054 | | | | — | | | | — | | | | 1,937,054 | | |
| | | $ | 37,729,437 | | | $ | — | | | $ | (19,379,017 | ) | | $ | 18,350,420 | | |
First Eagle Funds | Annual Report | October 31, 2018
160
Notes to Financial Statements
First Eagle Global Income Builder Fund
Counterparty | | Gross Amounts
of Assets
Presented in
Statement of
Assets and
Liabilities | | Derivatives
Available for
Offset | | Collateral
Received | | Net Amount
(Not Less
Than $0) | |
Bank of New York Mellon | | $ | 331,307 | | | $ | — | | | $ | — | | | $ | 331,307 | | |
Goldman Sachs | | | 617,229 | | | | — | | | | (540,000 | ) | | | 77,229 | | |
HSBC Bank plc | | | 297,379 | | | | — | | | | — | | | | 297,379 | | |
JPMorgan Chase Bank | | | 387,092 | | | | — | | | | — | | | | 387,092 | | |
UBS AG | | | 185,151 | | | | — | | | | — | | | | 185,151 | | |
| | | $ | 1,818,158 | | | $ | — | | | $ | (540,000 | ) | | $ | 1,278,158 | | |
First Eagle High Yield Fund
Counterparty | | Gross Amounts
of Assets
Presented in
Statement of
Assets and
Liabilities | | Derivatives
Available for
Offset | | Collateral
Received | | Net Amount
(Not Less
Than $0) | |
Bank of New York Mellon | | $ | 28,645 | | | $ | — | | | $ | — | | | $ | 28,645 | | |
g) Options — In order to seek to produce incremental earnings or protect against declines in the value of portfolio securities, each Fund may write covered call options on portfolio securities. The Funds may also use options for speculative purposes, although they generally do not employ options for this purpose.
Options contracts are valued daily based upon the official closing price on the relevant exchange on which the option is traded. If there is no official closing price, the mean between the last bid and asked prices may be used. When an option is exercised, the proceeds on the sale of a written call option are adjusted by the amount of premium received or paid. When a written option expires, the Funds will realize a gain equal to the amount of the premium received. When the Funds enter into a closing purchase transaction, the Funds will realize a gain (or loss, if the cost of the closing purchase transaction exceeds the premium received when the option was written) without regard to any unrealized gain or loss on the underlying security and the liability related to such option is eliminated.
The Funds may be required to segregate or earmark assets to cover its obligations under option contracts. In general, a call option is covered if the Funds hold, on a share-for-share basis, either the underlying shares or a call on the same security as the call written where the exercise price of the call held is equal to or less than the exercise price of the call written (or greater than the exercise price of the call written if the difference is maintained by the Funds in cash, Treasury bills or other high grade short-term obligations earmarked with its custodian). One
First Eagle Funds | Annual Report | October 31, 2018
161
Notes to Financial Statements
reason for writing options is to attempt to realize, through the receipt of premiums, a greater return than would be realized on the securities alone. Another reason for writing options is to hedge against a moderate decline in the value of securities owned by the Funds in the case of a call option. If an increase occurs in the underlying security or stock index sufficient to result in the exercise of a call written by the Funds, it may be required to deliver securities or cash and may thereby forego some or all of the gain that otherwise may have been realized on the securities underlying the call option. This "opportunity cost" may be partially or wholly offset by the premium received for the covered call written by the Funds. The risk in writing a covered call option is that the Funds give up the opportunity for profit if the market price of the underlying security increases and the option is exercised. The Funds also have the additional risk of not being able to enter into a closing transaction if a liquid secondary market does not exist.
The Funds may also write over-the-counter options where the completion of the obligation is dependent upon the credit standing of the counterparty.
As of October 31, 2018 for First Eagle Fund of America, portfolio securities valued at $230,973,125 were earmarked to cover collateral requirements for written options.
For the year ended October 31, 2018 for First Eagle Fund of America, the average monthly outstanding contract amount for written options and purchased options totaled 66,240 and 16,686 respectively.
At October 31, 2018, the First Eagle Fund of America had the following options grouped into appropriate risk categories illustrated below:
First Eagle Fund of America
| | | | | | | Gain or (Loss)
Derivative Recognized
in Income | |
Risk Type | | Asset Derivative
Fair Value(1) | | Liability Derivative
Fair Value(2) | | Net realized
Gains (Losses)(3) | | Change in
Appreciation
(Depreciation)(4) | |
Equity —
Written
options | | $ | — | | | $ | 4,916,270 | | | $ | 20,254,505 | | | $ | 24,327,553 | | |
Equity —
Purchased
options | | | 21,392,830 | | | | — | | | | (5,524,585 | ) | | | (17,767,922 | ) | |
(1) Statements of Assets and Liabilities location: Investments in securities of unaffiliated issuers.
(2) Statements of Assets and Liabilities location: Option contracts written, at value.
(3) Statements of Operations location: Net realized gains (losses) from expiration or closing of option contracts written and transactions in investment securities of unaffiliated issuers.
(4) Statements of Operations location: Changes in unrealized appreciation (depreciation) of option contracts written and investment securities of unaffiliated issuers.
First Eagle Funds | Annual Report | October 31, 2018
162
Notes to Financial Statements
h) Repurchase agreements — The Funds may enter into repurchase agreement transactions with institutions that meet the Adviser's credit guidelines. Each repurchase agreement is valued at market. The Funds require that the collateral received in a repurchase agreement transaction be transferred to a custodian in a manner sufficient to enable the Funds to obtain collateral in the event of a counterparty default. If the counterparty defaults and the fair value of the collateral declines, realization of the collateral by the Funds may be delayed or limited.
i) Bank Loans — A Fund may invest in bank loans, which usually take the form of loan participations and assignments. Loan participations and assignments are agreements to make money available to U.S. or foreign corporations, partnerships or other business entities (the "Borrower") in a specified amount, at a specified rate and within a specified time. A loan is typically originated, negotiated and structured by a U.S. or foreign bank, insurance company or other financial institution (the "Agent") for a group of loan investors ("Loan Investors"). The Agent typically administers and enforces the loan on behalf of the other Loan Investors in the syndicate and may hold any collateral on behalf of the Loan Investors. Such loan participations and assignments are typically senior, secured and collateralized in nature. A Fund records an investment when the Borrower withdraws money and records interest as earned. The Fund generally has no right to enforce compliance with the terms of the loan agreement with the Borrower. As a result, the Fund assumes the credit risk of the Borrower, the selling participant and any intermediary between the Fund and the Borrower ("Intermediate Participants"). In the event that the Borrower, selling participant or Intermediate Participants becomes insolvent or enters into bankruptcy, each Fund may incur certain costs and delays in realizing payment or may suffer a loss of principal and/or interest.
j) Treasury Inflation-Protected Securities — The Funds may invest in Treasury Inflation-Protected Securities ("TIPS") which are specially structured bonds in which the principal amount is adjusted to keep pace with inflation. The principal value of TIPS will be adjusted upward or downward and any increase or decrease in the principal amount of TIPS will be included as interest income in the Statements of Operations, even though investors do not receive their principal until maturity. TIPS are subject to interest rate risk.
k) Restricted Securities — The Funds may invest in securities that are subject to legal or contractual restrictions on resale. These securities generally may be resold in transactions exempt from registration or to the public if the securities are registered. Disposal of these securities may involve time-consuming negotiations and expenses, and prompt sale at an acceptable price may be difficult. Information regarding restricted securities, if any, is included at the end of each Fund's Schedule of Investments.
l) United States income taxes — No provision has been made for U.S. federal income taxes since it is the intention of each Fund to distribute to shareholders all taxable net investment income and net realized gains on investments, if any, within the allowable time limit, and to comply with the provisions of Subchapter M of the Internal Revenue Code applicable to the regulated investment company. The Funds declare and pay such income and capital gains on an annual basis except for the First Eagle High Yield Fund and the First Eagle Global Income Builder Fund which declare income daily and pay monthly.
First Eagle Funds | Annual Report | October 31, 2018
163
Notes to Financial Statements
The Funds adopted provisions surrounding income taxes, which require the tax effects of certain tax positions to be recognized. These tax positions must meet a "more likely than not" standard that, based on their technical merits, have a more than 50% likelihood of being sustained upon examination. Management of the Trust has analyzed the Funds' tax positions taken on federal and state income tax returns for all open tax years (the current and the prior three tax years) and has concluded that no provision for income tax is required in the Funds' financial statements.
At October 31, 2018, the components of accumulated earnings on a tax basis were as follows:
| | Undistributed
Net Investment | | Undistributed
Net Realized | | Net
Unrealized
Appreciation | | Capital Loss
Carryforward | |
| | Income | | Gains | | (Depreciation) | | Short-Term | | Long-Term | |
First Eagle Global Fund | | $ | 377,852,763 | | | $ | 2,442,229,921 | | | $ | 9,120,537,846 | | | $ | — | | | $ | — | | |
First Eagle Overseas
Fund | | | 205,913,920 | | | | 207,489,047 | | | | 1,859,705,800 | | | | — | | | | — | | |
First Eagle U.S.
Value Fund | | | 7,732,564 | | | | 225,049,421 | | | | 423,860,985 | | | | — | | | | — | | |
First Eagle Gold Fund | | | — | | | | — | | | | (135,069,699 | ) | | | 27,879,728 | | | | 522,751,811 | | |
First Eagle Global Income
Builder Fund | | | — | | | | — | | | | 30,678,784 | | | | 12,712,979 | | | | 3,405,528 | | |
First Eagle High Yield
Fund | | | 639,379 | | | | — | | | | (1,131,077 | ) | | | 5,701,235 | | | | 105,922,452 | | |
First Eagle Fund of
America | | | 33,684,714 | | | | 231,144,429 | | | | 91,828,929 | | | | — | | | | — | | |
The components of distributable earnings' differences between book basis and tax basis are primarily due to the treatment of passive foreign investment companies, distributions from real estate investment trusts, the treatment of forward foreign currencies contracts, investment in grantor trusts, straddle loss deferral, foreign repatriated earnings for First Eagle Global Fund and First Eagle Overseas Fund, investments in corporate reorganizations and wash sales.
Under the Regulated Investment Company Modernization Act of 2010 (the "Act"), net capital losses recognized by the Funds after December 31, 2010, may get carried forward indefinitely, and retain their character as short-term and/or long-term losses. The Act requires that post-enactment net capital losses be used before pre-enactment net capital losses. First Eagle Gold Fund has capital losses to carry forward prior to the Act of $7,117,310.
Late year ordinary losses incurred after December 31st and within the taxable year are deemed to arise on the first business day of the Funds' next taxable year. For the year ended October 31, 2018, First Eagle Gold Fund had a late year ordinary loss deferral of $2,924,362
First Eagle Funds | Annual Report | October 31, 2018
164
Notes to Financial Statements
m) Reclassification of capital accounts — As a result of certain differences in the computation of net investment income and net realized capital gains under federal income tax rules and regulations versus GAAP, the following amounts were reclassified within the capital accounts:
| | Undistributed Net
Investment Income
(loss) | | Undistributed Net
Realized Gains
(Losses) | | Capital Surplus | |
First Eagle Global Fund | | $ | (55,881,677 | ) | | $ | (130,505,657 | ) | | $ | 186,387,334 | | |
First Eagle Overseas Fund | | | (24,395,230 | ) | | | (52,229,324 | ) | | | 76,624,554 | | |
First Eagle U.S. Value Fund | | | (513,901 | ) | | | (20,026,606 | ) | | | 20,540,507 | | |
First Eagle Gold Fund | | | 17,645,722 | | | | (25,783,509 | ) | | | 8,137,787 | | |
First Eagle Global Income Builder Fund | | | (1,973,055 | ) | | | 1,973,055 | | | | — | | |
First Eagle High Yield Fund | | | (75,466 | ) | | | 75,466 | | | | — | | |
First Eagle Fund of America | | | (298,467 | ) | | | (34,671,469 | ) | | | 34,969,936 | | |
The primary permanent differences causing such reclassification include the tax treatment of currency gains and losses, dividend redesignations, distributions paid in connection with the redemption of Fund shares, investments in corporate reorganizations, investments in passive foreign investment companies, foreign repatriated earnings for First Eagle Global Fund and First Eagle Overseas Fund and differing book and tax treatment of transactions with the Subsidiary.
At the year ended October 31, 2018, the First Eagle Global Cayman Fund, Ltd., First Eagle Overseas Cayman Fund, Ltd., First Eagle Gold Cayman Fund, Ltd. and First Eagle U.S. Value Cayman Fund, Ltd. had unrealized losses for tax purposes. The Subsidiaries' loss for the current year is not available to offset their future taxable income. The unrealized losses to be recognized for tax purposes in the future can only be utilized by the Funds to the extent of tax basis realized gains in the Subsidiaries in the same year. Given the uncertainty of their future use, tax losses have been reclassified to Capital surplus.
n) Distribution to shareholders — Distributions to shareholders during the fiscal year ended October 31, 2018, which are determined in accordance with income tax regulations, are recorded on ex-dividend date.
| | Ordinary Income | | Long Term Capital Gains | |
| | 2018 | | 2017 | | 2018 | | 2017 | |
First Eagle Global Fund | | $ | 498,444,915 | | | $ | 277,916,751 | | | $ | 1,870,742,725 | | | $ | 2,014,858,878 | | |
First Eagle Overseas Fund | | | 346,558,342 | | | | 192,419,404 | | | | 281,564,123 | | | | 340,360,780 | | |
First Eagle U.S. Value Fund | | | 8,112,049 | | | | 10,044,617 | | | | 168,620,388 | | | | 171,500,952 | | |
First Eagle Gold Fund | | | — | | | | — | | | | — | | | | — | | |
First Eagle Global Income
Builder Fund | | | 27,189,801 | | | | 30,836,758 | | | | — | | | | — | | |
First Eagle High Yield Fund | | | 18,859,667 | | | | 26,733,902 | | | | — | | | | — | | |
First Eagle Fund of America | | | 378,746 | | | | 6,207,402 | | | | 212,453,367 | | | | 152,943,358 | | |
First Eagle Funds | Annual Report | October 31, 2018
165
Notes to Financial Statements
| | Return of Capital | |
| | 2018 | | 2017 | |
First Eagle High Yield Fund | | $ | — | | | $ | 335,924 | | |
First Eagle Global Income Builder Fund | | | 7,583,877 | | | | — | | |
o) Class Accounting — Investment income, common expenses and realized/unrealized gain or loss on investments are allocated to the various classes of the Fund on the basis of daily net assets of each class. Fees relating to a specific class are charged directly to that class.
p) Use of estimates — The preparation of financial statements in conformity with GAAP requires management to make estimates and assumptions that affect the reported amounts of assets and liabilities at the date of the financial statements and the reported amounts of revenues and expenses during the reporting period. Actual results could differ from those estimates.
q) Redemption Fee — A redemption fee of 2% will be applied to the First Eagle Gold Fund for the sale or exchange within 60 days of the purchase of such shares.
r) Foreign Taxes — The Funds may be subject to foreign taxes on income, and gains on investments or currency purchases/repatriation, a portion of which may be recoverable. The Funds will accrue such taxes and recoveries as applicable, based upon their current interpretation of tax rules and regulations that exist in the markets in which they invest.
Note 2 — Investment Advisory, Custody and Administration Agreements; Transactions with Related Persons
For its services, the Adviser receives, pursuant to an Investment Advisory Agreement between the Funds and the Adviser (the "Advisory Agreement"), an annual advisory fee as follows:
Fund | | Management Fee
(% of Average Daily Net Assets) | |
First Eagle Global Fund | | | 0.75 | % | |
First Eagle Overseas Fund | | | 0.75 | | |
First Eagle U.S. Value Fund | | | 0.75 | (1) | |
First Eagle Gold Fund | | | 0.75 | | |
First Eagle Global Income Builder Fund | | | 0.75 | | |
First Eagle High Yield Fund | | | 0.70 | (2) | |
First Eagle Fund of America | | | 0.90 | (3) | |
(1) The Adviser has agreed to waive First Eagle U.S. Value Fund's management fee at an annual rate in the amount of 0.05% of the average daily value of the Fund's net assets for the period through February 28, 2019. This waiver has the effect of reducing the management fee shown in the table for the term of the waiver from 0.75% to 0.70%.
(2) The Adviser has agreed to waive First Eagle High Yield Fund's management fee at an annual rate in the amount of 0.05% of the average daily value of the Fund's net assets for the period through February 28, 2019. Effective July 1, 2018, the Adviser has agreed to waive First Eagle High Yield Fund's management fee at an annual rate in the amount of 0.10% of the average daily value of the Fund's net assets for the period through February 29, 2020. This waiver has the effect of reducing
First Eagle Funds | Annual Report | October 31, 2018
166
Notes to Financial Statements
the management fee shown in the table for the term of the waiver from 0.70% to 0.65% until June 30, 2018 and from 0.70% to 0.60% from July 1, 2018 through the end of the year.
(3) The Adviser receives an annual advisory fee at the rate of 0.90% of the first $2.25 billion of the Fund's average daily net assets, 0.85% of the next $2.75 billion of the average daily net assets and 0.80% in excess of $5 billion of the average daily net assets. For the year ended October 31, 2018 the effective rate was 0.90%.
Pursuant to a subadvisory agreement, dated December 1, 2015 ("Subadvisory Agreement") Iridian Asset Management LLC ("Iridian" or "Sub-Adviser") manages the investments of the First Eagle Fund of America. The fees paid to Iridian by the Adviser under the Subadvisory Agreement are based on a reference amount equal to 50% of the combined (i) fees received by the Adviser for advisory services on behalf of the Fund and (ii) fees received by the Fund's distributor for its shareholder liaison services on behalf of the Fund. These amounts are reduced by certain direct marketing costs borne by the Adviser in connection with the Fund and are further reduced by the amount paid by the Adviser for certain administrative expenses incurred in providing services to the Fund.
The Adviser had contractually agreed to waive its management fee and/or reimburse expenses, for the First Eagle High Yield Fund and First Eagle Global Income Builder Fund, so that the total annual operating expenses (excluding certain items) of the First Eagle High Yield Fund's Class A, Class C and Class I shares did not exceed 1.25%, 2.00% and 0.80%, respectively, and the First Eagle Global Income Builder Fund's Class A, Class C and Class I shares did not exceed 1.30%, 2.05%, and 1.05%, respectively, through December 31, 2013. These waivers are no longer in effect.
The Adviser also performs certain administrative, accounting, operations, compliance and other services on behalf of the Funds, and in accordance with its agreement with the Adviser, the Funds (except for First Eagle Global Income Builder Fund and First Eagle High Yield Fund which pay the fee described in the next paragraph) reimburse the Adviser for costs (including personnel and other costs) related to those services. These reimbursements may not exceed an annual rate of 0.05% of a Fund's average daily net assets.
Pursuant to Administrative Services Agreements between each of First Eagle Global Income Builder Fund and First Eagle High Yield Fund, and the Adviser, each pay the Adviser a monthly administration fee that is accrued daily at an annual rate of 0.05% of the Fund's average daily net assets.
For the year ended October 31, 2018, the Funds paid/reimbursed and had payable to the Adviser amounts shown below:
Fund | | Reimbursed to Adviser | | Payable to Adviser | |
First Eagle Global Fund | | $ | 3,243,788 | | | $ | 329,959 | | |
First Eagle Overseas Fund | | | 1,366,261 | | | | 151,266 | | |
First Eagle U.S. Value Fund | | | 391,010 | | | | 41,572 | | |
First Eagle Gold Fund | | | 359,347 | | | | 38,359 | | |
First Eagle Global Income Builder Fund | | | 723,456 | | | | 58,981 | | |
First Eagle High Yield Fund | | | 193,759 | | | | 13,957 | | |
First Eagle Fund of America | | | 347,742 | | | | 30,655 | | |
First Eagle Funds | Annual Report | October 31, 2018
167
Notes to Financial Statements
The Funds have entered into a custody agreement with J.P. Morgan Chase Bank, N.A. ("JPM"). The custody agreement provides for an annual fee based on the amount of assets under custody plus transaction charges. JPM serves as custodian of the Funds' portfolio securities and other assets. JPM has directly entered into sub-custodial agreements to maintain the custody of gold and silver bullion in the Funds. Under the terms of the custody agreement between the Funds and JPM, JPM maintains and deposits in separate accounts, cash, securities and other assets of the Funds. JPM is also required, upon the order of the Funds, to deliver securities held by JPM and the sub-custodian, and to make payments for securities purchased by the Funds. JPM has also entered into sub-custodian agreements with a number of foreign banks and clearing agencies, pursuant to which portfolio securities purchased outside the United States are maintained in the custody of these entities.
The Funds have also entered into an agreement for administrative services with JPM, pursuant to which JPM provides certain financial reporting and other administrative services. JPM, as the Funds' administrator, receives annual fees separate from and in addition to the fees it receives for its services as the Funds' custodian.
FEF Distributors, LLC, a wholly owned subsidiary of the Adviser, serves as the Funds' principal underwriter. For the year ended October 31, 2018, FEF Distributors, LLC realized $789,040, $58,740, $22,846, $26,644, $58,134, $8,678 and $29,509, pertaining to the sales of shares of First Eagle Global Fund, First Eagle Overseas Fund, First Eagle U.S. Value Fund, First Eagle Gold Fund, First Eagle Global Income Builder Fund, First Eagle High Yield Fund and First Eagle Fund of America, respectively.
The Trust adopted a Trustee Deferred Compensation Plan (the "Plan"), which allows the Independent Trustees to defer the receipt of all or a portion of compensation related to performance of their duties as a Trustee. The deferred fees are invested in various First Eagle Funds until distribution in accordance with the Trustee Deferred Compensation Plan. As of October 31, 2018, balances to the Plan are included in the fees payable to the Trustees on the Statements of Assets and Liabilities.
Note 3 — Plans of Distribution
Under the terms of the Distribution Plans and Agreements ("the Plans") with FEF Distributors, LLC (the "Distributor"), pursuant to the provisions of Rule 12b-1 under the 1940 Act, the First Eagle Global Fund, First Eagle Overseas Fund, First Eagle U.S. Value Fund, First Eagle Gold Fund, First Eagle Global Income Builder Fund, First Eagle High Yield Fund and First Eagle Fund of America pay the Distributor monthly a distribution and/or service fee with respect to Class A, Class C, Class Y, Class R3 and Class R4 shares based on each Fund's average daily net assets as shown in the table below. Under the Plans, the Distributor is obligated to use the amounts received under the Plans for, among other things, payments to qualifying dealers for their assistance in the distribution of a Fund's shares and the provision of shareholder services and for other expenses such as advertising costs and the payment for the printing and distribution of prospectuses to prospective investors.
First Eagle Funds | Annual Report | October 31, 2018
168
Notes to Financial Statements
Fund | | Class A | | Class C | | Class Y | | Class R3 | | Class R4 | |
First Eagle Global Fund | | | 0.25 | % | | | 1.00 | % | | | n/a | | | | 0.35 | % | | | 0.10 | % | |
First Eagle Overseas Fund | | | 0.25 | % | | | 1.00 | % | | | n/a | | | | 0.35 | % | | | 0.10 | % | |
First Eagle U.S. Value Fund | | | 0.25 | % | | | 1.00 | % | | | n/a | | | | 0.35 | % | | | 0.10 | % | |
First Eagle Gold Fund | | | 0.25 | % | | | 1.00 | % | | | n/a | | | | 0.35 | % | | | 0.10 | % | |
First Eagle Global Income Builder Fund | | | 0.25 | % | | | 1.00 | % | | | n/a | | | | 0.35 | % | | | 0.10 | % | |
First Eagle High Yield Fund | | | 0.25 | % | | | 1.00 | % | | | n/a | | | | 0.35 | % | | | 0.10 | % | |
First Eagle Fund of America | | | 0.25 | % | | | 1.00 | % | | | 0.25 | % | | | 0.35 | % | | | 0.10 | % | |
The Distributor bears distribution costs of a Fund to the extent they exceed payments received under the Plan. For the year ended October 31, 2018, the distribution fees incurred by the Funds are disclosed in the Statements of Operations.
The Service fee covers expenses incurred by the Distributor for providing shareholder liaison services, including assistance with subscriptions, redemptions and other shareholder questions. For the year ended October 31, 2018, the services fees incurred by the Funds are disclosed in the Statements of Operations.
Note 4 — Purchases and Sales of Securities
For the year ended October 31, 2018, purchases and proceeds from sales of investments, excluding short-term securities, were as follows:
| Fund | | Purchases
excluding
U.S. Government
Securities | | Sales and
Maturities
excluding
U.S. Government
Securities | | Purchases of
U.S. Government
Securities | | Sales and
Maturities of
U.S. Government
Securities | |
First Eagle Global Fund | | $ | 6,691,747,682 | | | $ | 6,574,992,099 | | | $ | 113,225,730 | | | $ | 250,000,000 | | |
First Eagle Overseas Fund | | | 1,679,942,630 | | | | 2,339,348,462 | | | | 35,725,442 | | | | 10,000,000 | | |
First Eagle U.S. Value Fund | | | 151,004,312 | | | | 488,772,912 | | | | — | | | | — | | |
First Eagle Gold Fund | | | 100,155,558 | | | | 180,555,260 | | | | — | | | | — | | |
First Eagle Global Income
Builder Fund | | | 344,237,331 | | | | 284,843,511 | | | | 14,503,398 | | | | — | | |
First Eagle High Yield Fund | | | 83,754,181 | | | | 180,946,193 | | | | — | | | | — | | |
First Eagle Fund of America | | | 1,204,350,806 | | | | 1,714,120,700 | | | | — | | | | — | | |
Note 5 — Line of Credit
On June 18, 2018, the Funds renewed a $200 million committed, unsecured line of credit ("Credit Facility") with JPM for the Funds, to be utilized for temporarily financing the purchase or sale of securities for prompt delivery in the ordinary course of business or for temporarily financing the redemption of shares of each Fund at the request of shareholders and other temporary or emergency purposes. Under the Credit Facility arrangement, each Fund has agreed to pay
First Eagle Funds | Annual Report | October 31, 2018
169
Notes to Financial Statements
an annual commitment fee on the unused balance, allocated pro rata, based on the relative asset size of the Funds. A portion of the commitment fees related to the line of credit are paid by the Funds and are included in other expenses in the Statements of Operations. During the year ended October 31, 2018, the Funds did not have any borrowings under the agreements.
Note 6 — Indemnification and Investment Risk
In the normal course of business, the Funds enter into contracts that contain a variety of representations which provide general indemnifications. Each Fund's maximum exposure under these arrangements is unknown, as this would involve future claims that may be made against each Fund that have not yet occurred. However, based on experience, the Funds expect the risk of loss to be remote. The Funds may have elements of risk not typically associated with investments in the United States due to their investments in foreign countries or regions. Such foreign investments may subject the Funds to additional risks resulting from political or economic conditions in such countries or regions and the possible imposition of adverse governmental laws or currency exchange restrictions could cause the securities and their markets to be less liquid and their prices to be more volatile than those of comparable U.S. securities. The securities markets in many emerging-market countries are substantially smaller, less developed, less liquid and more volatile than the securities markets of developed countries.
The First Eagle High Yield Fund and First Eagle Global Income Builder Fund invest in high yield securities which may be subject to greater levels of interest rate, credit and liquidity risk than investment grade securities. These high yield securities may be considered speculative with respect to the issuer's continuing ability to make principal and interest payments and may be subject to significant price fluctuations.
The Funds are subject to interest rate and credit risk. The value of debt securities may decline as interest rates increase. The Funds could lose money if the issuer of a fixed income security is unable to pay interest or repay principal when it is due. The ability of the issuers of debt to meet their obligations may be affected by the economic and political developments in a specific industry or region.
The Funds enter into derivatives which may represent off-balance sheet risk. Off-balance sheet risk exists when the maximum potential loss on a particular investment is greater than the value of such investment as reflected in the Statements of Assets and Liabilities.
Note 7 — Redemption In-Kind Transactions
The redemption in-kind policy for all of the Funds reserves the right of the Funds to pay redemptions in-kind (i.e., payments in the form of marketable securities or, as needed, other traded assets, rather than cash) if the redemption request is large enough to affect a Fund's operations (for example, if it represents more than $250,000 or 1% of the Fund's assets). When receiving assets distributed in-kind, the recipient will bear applicable commissions or other costs on their sale. There were no redemptions in-kind during the year ended October 31, 2018.
First Eagle Funds | Annual Report | October 31, 2018
170
Notes to Financial Statements
Note 8 — New Accounting Pronouncements
In October 2016, the Securities and Exchange Commission ("SEC") released its Final Rules on Investment Company Reporting Modernization (the "Rules"). The Rules which introduce two new regulatory reporting forms for investment companies—Form N-PORT and Form N-CEN—also contain amendments to Regulation S-X which require standardized, enhanced disclosures about derivatives in investment company financial statements, as well as other amendments. The Regulation S-X amendments had a compliance date of August 1, 2017, and are reflected in these financial statements. The Funds' compliance date for Form N-PORT was June 1, 2018, but the Funds will not be required to make their initial filing on Form N-PORT until the period ending March 31, 2019. The Funds' compliance date for Form N-CEN was June 1, 2018, and the Funds will make their initial filing on Form N-CEN for the period ending October 31, 2018. The adoption will have no effect on the Funds' net assets or results of operations.
In August 2018, the SEC adopted Final Rule Release No. 33-10532, Disclosure Update and Simplification. The new rule amends certain disclosure requirements that the SEC determined to be redundant, duplicative, overlapping, outdated, or superseded, in light of other SEC disclosure requirements, U.S. GAAP, or changes in the information environment. The amendments are intended to facilitate the disclosure of information to investors and simplify compliance without significantly altering the total mix of information provided to investors. The amendments to Regulation S-X were applied to the Funds' financial statements in the current period. The adoption had no effect on the Funds' net assets or results of operations.
In August 2018, the Financial Accounting Standards Board issued ASU No. 2018-13, Disclosure Framework-Changes to the Disclosure Requirements for Fair Value Measurements ("ASU 2018-13"). The amendments in ASU 2018-13 are effective for fiscal years, and interim periods within those fiscal years, beginning after December 15, 2019. Early adoption is permitted. The Funds have elected to early adopt ASU 2018-13 and the amendments are reflected in the current year financial statements. The adoption had no effect on the Funds' net assets or results of operations.
Note 9 — Subsequent Events
In accordance with the provision surrounding Subsequent Events adopted by the Funds, management has evaluated the possibility of subsequent events existing in the Funds' financial statements. Management has determined that there are no material events that would require disclosures in the Funds' financial statements.
First Eagle Funds | Annual Report | October 31, 2018
171
Report of Independent Registered Public Accounting Firm
To the Board of Trustees of First Eagle Funds and Shareholders of First Eagle Global Fund, First Eagle Overseas Fund, First Eagle U.S. Value Fund, First Eagle Gold Fund, First Eagle Global Income Builder Fund, First Eagle High Yield Fund, and First Eagle Fund of America
Opinions on the Financial Statements
We have audited the accompanying statements of assets and liabilities, including the schedules of investments, of First Eagle Global Fund, First Eagle Overseas Fund, First Eagle U.S. Value Fund, First Eagle Gold Fund, First Eagle Global Income Builder Fund, First Eagle High Yield Fund and First Eagle Fund of America (constituting the First Eagle Funds, hereafter collectively referred to as the "Funds") as of October 31, 2018, the related statements of operations for the year ended October 31, 2018, the statements of changes in net assets for each of the two years in the period ended October 31, 2018, including the related notes, and the financial highlights for each of the periods indicated therein (collectively referred to as the "financial statements"). In our opinion, the financial statements present fairly, in all material respects, the financial position of each of the Funds as of October 31, 2018, the results of each of their operations for the year then ended, the changes in each of their net assets for each of the two years in the period ended October 31, 2018 and each of the financial highlights for each of the periods indicated therein in conformity with accounting principles generally accepted in the United States of America.
Basis for Opinions
These financial statements are the responsibility of the Funds' management. Our responsibility is to express an opinion on the Funds' financial statements based on our audits. We are a public accounting firm registered with the Public Company Accounting Oversight Board (United States) ("PCAOB") and are required to be independent with respect to the Funds in accordance with the U.S. federal securities laws and the applicable rules and regulations of the Securities and Exchange Commission and the PCAOB.
We conducted our audits of these financial statements in accordance with the standards of the PCAOB. Those standards require that we plan and perform the audit to obtain reasonable assurance about whether the financial statements are free of material misstatement, whether due to error or fraud.
Our audits included performing procedures to assess the risks of material misstatement of the financial statements, whether due to error or fraud, and performing procedures that respond to those risks. Such procedures included examining, on a test basis, evidence regarding the amounts and disclosures in the financial statements. Our audits also included evaluating the accounting principles used and significant estimates made by management, as well as evaluating the overall presentation of the financial statements. Our procedures included confirmation of securities owned as of October 31, 2018 by correspondence with the custodian and brokers; when replies were not received from brokers, we performed other auditing procedures. We believe that our audits provide a reasonable basis for our opinions.

New York, New York
December 21, 2018
We have served as the auditor of one or more investment companies advised by First Eagle Investment Management, LLC since 2006.
First Eagle Funds | Annual Report | October 31, 2018
172
Fund Expenses (unaudited)
Example
As a shareholder of the First Eagle Funds, you may incur two types of costs: (1) transaction costs and (2) ongoing costs, including advisory fees; distribution fees (12b-1) and/or service fees; and other Fund expenses. This example is intended to help you understand your ongoing costs (in dollars) of investing in the Fund and to compare these costs with the ongoing costs of investing in other mutual funds.
This example is based on an investment of $1,000 invested on May 1, 2018 and held for the six-months ended October 31, 2018.
Actual Expenses
The table below titled "Based on Actual Total Return" provides information about actual account values and actual expenses. You may use the information provided in this table, together with the amount you invested, to estimate the expenses that you paid over the period. To estimate the expenses you paid on your account, divide your ending account value by $1,000 (for example, an $8,600 ending account value divided by $1,000 = 8.6), then multiply the result by the number under the heading entitled "Expenses Paid During the Period".
First Eagle Funds | Annual Report | October 31, 2018
173
Fund Expenses (unaudited)
Based on Actual Total Return(1)
| | | Actual Total
Return without
Sales Charges(2) | | Beginning
Account
Date Value | | Ending
Account
Value | | Annualized
Expense | | Expenses
Paid for
the Period(3) | |
First Eagle Global Fund Consolidated | |
Class A | | | -3.94 | % | | $ | 1,000 | | | $ | 960.60 | | | | 1.11 | % | | $ | 5.49 | | |
Class C | | | -4.30 | | | | 1,000 | | | | 957.00 | | | | 1.86 | | | | 9.17 | | |
Class I | | | -3.80 | | | | 1,000 | | | | 962.00 | | | | 0.84 | | | | 4.15 | | |
Class R3(4) | | | -3.95 | | | | 1,000 | | | | 960.50 | | | | 1.25 | | | | 6.14 | (5) | |
Class R4 | | | -3.82 | | | | 1,000 | | | | 961.80 | | | | 1.04 | | | | 5.14 | | |
Class R6 | | | -3.76 | | | | 1,000 | | | | 962.40 | | | | 0.79 | | | | 3.91 | | |
First Eagle Overseas Fund Consolidated | |
Class A | | | -7.68 | | | | 1,000 | | | | 923.20 | | | | 1.15 | | | | 5.57 | | |
Class C | | | -8.00 | | | | 1,000 | | | | 920.00 | | | | 1.88 | | | | 9.10 | | |
Class I | | | -7.51 | | | | 1,000 | | | | 924.90 | | | | 0.86 | | | | 4.17 | | |
Class R3(4) | | | -7.49 | | | | 1,000 | | | | 925.10 | | | | 1.21 | | | | 5.84 | (5) | |
Class R4 | | | -7.60 | | | | 1,000 | | | | 924.00 | | | | 1.04 | | | | 5.04 | | |
Class R6 | | | -7.51 | | | | 1,000 | | | | 924.90 | | | | 0.80 | | | | 3.88 | | |
First Eagle U.S. Value Fund Consolidated | |
Class A | | | -0.75 | | | | 1,000 | | | | 992.50 | | | | 1.10 | | | | 5.52 | | |
Class C | | | -1.14 | | | | 1,000 | | | | 988.60 | | | | 1.86 | | | | 9.32 | | |
Class I | | | -0.64 | | | | 1,000 | | | | 993.60 | | | | 0.82 | | | | 4.12 | | |
Class R3(4) | | | -0.83 | | | | 1,000 | | | | 991.70 | | | | 1.19 | | | | 5.94 | (5) | |
Class R6 | | | -0.59 | | | | 1,000 | | | | 994.10 | | | | 0.81 | | | | 4.07 | | |
First Eagle Gold Fund Consolidated | |
Class A | | | -17.84 | | | | 1,000 | | | | 821.60 | | | | 1.30 | | | | 5.97 | | |
Class C | | | -18.14 | | | | 1,000 | | | | 818.60 | | | | 2.06 | | | | 9.44 | | |
Class I | | | -17.70 | | | | 1,000 | | | | 823.00 | | | | 1.02 | | | | 4.69 | | |
Class R3(4) | | | -17.80 | | | | 1,000 | | | | 822.00 | | | | 1.32 | | | | 6.03 | (5) | |
Class R6 | | | -17.68 | | | | 1,000 | | | | 823.20 | | | | 0.92 | | | | 4.23 | | |
First Eagle Global Income Builder Fund | |
Class A | | | -3.21 | | | | 1,000 | | | | 967.90 | | | | 1.18 | | | | 5.85 | | |
Class C | | | -3.59 | | | | 1,000 | | | | 964.10 | | | | 1.94 | | | | 9.60 | | |
Class I | | | -3.01 | | | | 1,000 | | | | 969.90 | | | | 0.92 | | | | 4.57 | | |
Class R3(4) | | | -3.02 | | | | 1,000 | | | | 969.80 | | | | 1.27 | | | | 6.27 | (5) | |
Class R6 | | | -2.99 | | | | 1,000 | | | | 970.10 | | | | 0.88 | | | | 4.37 | | |
First Eagle High Yield Fund | |
Class A | | | 1.47 | | | | 1,000 | | | | 1014.70 | | | | 1.19 | | | | 6.04 | | |
Class C | | | 0.97 | | | | 1,000 | | | | 1009.70 | | | | 1.96 | | | | 9.93 | | |
Class I | | | 1.50 | | | | 1,000 | | | | 1015.00 | | | | 0.91 | | | | 4.62 | | |
Class R3(4) | | | 1.41 | | | | 1,000 | | | | 1014.10 | | | | 1.27 | | | | 6.41 | (5) | |
Class R6 | | | 1.57 | | | | 1,000 | | | | 1015.70 | | | | 0.95 | | | | 4.83 | | |
First Eagle Funds | Annual Report | October 31, 2018
174
Fund Expenses (unaudited)
Based on Actual Total Return(1)—(continued)
| | | Actual Total
Return without
Sales Charges(2) | | Beginning
Account
Date Value | | Ending
Account
Value | | Annualized
Expense | | Expenses
Paid for
the Period(3) | |
First Eagle Fund of America | |
Class A | | | -10.84 | % | | $ | 1,000 | | | $ | 891.60 | | | | 1.32 | % | | $ | 6.29 | | |
Class C | | | -11.17 | | | | 1,000 | | | | 888.30 | | | | 2.05 | | | | 9.76 | | |
Class I | | | -10.67 | | | | 1,000 | | | | 893.30 | | | | 1.02 | | | | 4.87 | | |
Class Y | | | -10.85 | | | | 1,000 | | | | 891.50 | | | | 1.35 | | | | 6.44 | | |
Class R3(4) | | | -10.74 | | | | 1,000 | | | | 892.60 | | | | 1.38 | | | | 6.55 | (5) | |
Class R6 | | | -10.67 | | | | 1,000 | | | | 893.30 | | | | 0.98 | | | | 4.68 | | |
(1) For the six-months ended October 31, 2018.
(2) Past performance does not guarantee future results. Assumes reinvestment of all dividends and capital gain distributions, if any, at net asset value. Total return is not annualized, as it may not be representative of the total return for the year.
(3) Expenses are equal to the annualized expense ratio multiplied by the average account value over the period, multiplied by 184/365 (to reflect the one-half year period).
(4) Class R3 commenced investment operations on May 1, 2018.
(5) Expenses are equal to the annualized expense ratio multiplied by the average account value over the period, multiplied by 183/365 (to reflect the actual days in the period).
First Eagle Funds | Annual Report | October 31, 2018
175
Fund Expenses (unaudited)
Hypothetical Example for Comparison Purposes
The table below titled "Based on Hypothetical Total Return" provides information about hypothetical account values and hypothetical expenses based on the actual expense ratios and an assumed rate of return of 5% per year before expenses, which is not the First Eagle Funds' actual return. The hypothetical account values and expenses may not be used to estimate the actual ending account balance or expenses you paid for the period. You may use the information provided in this table to compare the ongoing costs of investing in the Funds and other funds. To do so, compare the 5% hypothetical example relating to the Fund with the 5% hypothetical examples that appear in the shareholder reports of other funds.
This example is based on an investment of $1,000 invested on May 1, 2018 and held for the six-months ended October 31, 2018.
Please note that the expenses shown in the table below are meant to highlight your ongoing costs only and do not reflect any transactional costs, such as front-end or back-end sales charges (loads). Therefore, the table is useful in comparing ongoing costs only, and will not help you determine the relative total costs of owning different funds. In addition, if these transaction costs were included, your costs would have been higher.
First Eagle Funds | Annual Report | October 31, 2018
176
Fund Expenses (unaudited)
Based on Hypothetical Total Return(1)
| | | Hypothetical
Annualized
Total
Return | | Beginning
Account
Date Value | | Ending
Account
Value | | Annualized
Expense | | Expenses
Paid for
the Period(2) | |
First Eagle Global Fund Consolidated | |
Class A | | | 5.00 | % | | $ | 1,000 | | | $ | 1019.61 | | | | 1.11 | % | | $ | 5.65 | | |
Class C | | | 5.00 | | | | 1,000 | | | | 1015.83 | | | | 1.86 | | | | 9.45 | | |
Class I | | | 5.00 | | | | 1,000 | | | | 1020.97 | | | | 0.84 | | | | 4.28 | | |
Class R3(3) | | | 5.00 | | | | 1,000 | | | | 1018.90 | | | | 1.25 | | | | 6.36 | | |
Class R4 | | | 5.00 | | | | 1,000 | | | | 1019.96 | | | | 1.04 | | | | 5.30 | | |
Class R6 | | | 5.00 | | | | 1,000 | | | | 1021.22 | | | | 0.79 | | | | 4.02 | | |
First Eagle Overseas Fund Consolidated | |
Class A | | | 5.00 | | | | 1,000 | | | | 1019.41 | | | | 1.15 | | | | 5.85 | | |
Class C | | | 5.00 | | | | 1,000 | | | | 1015.73 | | | | 1.88 | | | | 9.55 | | |
Class I | | | 5.00 | | | | 1,000 | | | | 1020.87 | | | | 0.86 | | | | 4.38 | | |
Class R3(3) | | | 5.00 | | | | 1,000 | | | | 1019.11 | | | | 1.21 | | | | 6.16 | | |
Class R4 | | | 5.00 | | | | 1,000 | | | | 1019.96 | | | | 1.04 | | | | 5.30 | | |
Class R6 | | | 5.00 | | | | 1,000 | | | | 1021.17 | | | | 0.80 | | | | 4.08 | | |
First Eagle U.S. Value Fund Consolidated | |
Class A | | | 5.00 | | | | 1,000 | | | | 1019.66 | | | | 1.10 | | | | 5.60 | | |
Class C | | | 5.00 | | | | 1,000 | | | | 1015.83 | | | | 1.86 | | | | 9.45 | | |
Class I | | | 5.00 | | | | 1,000 | | | | 1021.07 | | | | 0.82 | | | | 4.18 | | |
Class R3(3) | | | 5.00 | | | | 1,000 | | | | 1019.21 | | | | 1.19 | | | | 6.06 | | |
Class R6 | | | 5.00 | | | | 1,000 | | | | 1021.12 | | | | 0.81 | | | | 4.13 | | |
First Eagle Gold Fund | |
Class A | | | 5.00 | | | | 1,000 | | | | 1018.65 | | | | 1.30 | | | | 6.61 | | |
Class C | | | 5.00 | | | | 1,000 | | | | 1014.82 | | | | 2.06 | | | | 10.46 | | |
Class I | | | 5.00 | | | | 1,000 | | | | 1020.06 | | | | 1.02 | | | | 5.19 | | |
Class R3(3) | | | 5.00 | | | | 1,000 | | | | 1018.55 | | | | 1.32 | | | | 6.72 | | |
Class R6 | | | 5.00 | | | | 1,000 | | | | 1020.57 | | | | 0.92 | | | | 4.69 | | |
First Eagle Global Income Builder Fund | |
Class A | | | 5.00 | | | | 1,000 | �� | | | 1019.26 | | | | 1.18 | | | | 6.01 | | |
Class C | | | 5.00 | | | | 1,000 | | | | 1015.43 | | | | 1.94 | | | | 9.86 | | |
Class I | | | 5.00 | | | | 1,000 | | | | 1020.57 | | | | 0.92 | | | | 4.69 | | |
Class R3(3) | | | 5.00 | | | | 1,000 | | | | 1018.80 | | | | 1.27 | | | | 6.46 | | |
Class R6 | | | 5.00 | | | | 1,000 | | | | 1020.77 | | | | 0.88 | | | | 4.48 | | |
First Eagle High Yield Fund | |
Class A | | | 5.00 | | | | 1,000 | | | | 1019.21 | | | | 1.19 | | | | 6.06 | | |
Class C | | | 5.00 | | | | 1,000 | | | | 1015.32 | | | | 1.96 | | | | 9.96 | | |
Class I | | | 5.00 | | | | 1,000 | | | | 1020.62 | | | | 0.91 | | | | 4.63 | | |
Class R3(3) | | | 5.00 | | | | 1,000 | | | | 1018.80 | | | | 1.27 | | | | 6.46 | | |
Class R6 | | | 5.00 | | | | 1,000 | | | | 1020.42 | | | | 0.95 | | | | 4.84 | | |
First Eagle Funds | Annual Report | October 31, 2018
177
Fund Expenses (unaudited)
Based on Hypothetical Total Return(1)—(continued)
| | | Hypothetical
Annualized
Total
Return | | Beginning
Account
Date Value | | Ending
Account
Value | | Annualized
Expense | | Expenses
Paid for
the Period(2) | |
First Eagle Fund of America | |
Class A | | | 5.00 | % | | $ | 1,000 | | | $ | 1018.55 | | | | 1.32 | % | | $ | 6.72 | | |
Class C | | | 5.00 | | | | 1,000 | | | | 1014.87 | | | | 2.05 | | | | 10.41 | | |
Class I | | | 5.00 | | | | 1,000 | | | | 1020.06 | | | | 1.02 | | | | 5.19 | | |
Class Y | | | 5.00 | | | | 1,000 | | | | 1018.40 | | | | 1.35 | | | | 6.87 | | |
Class R3(3) | | | 5.00 | | | | 1,000 | | | | 1018.25 | | | | 1.38 | | | | 7.02 | | |
Class R6 | | | 5.00 | | | | 1,000 | | | | 1020.27 | | | | 0.98 | | | | 4.99 | | |
(1) For the six-months ended October 31, 2018.
(2) Expenses are equal to the annualized expense ratio multiplied by the average account value over the period, multiplied by 184/365 (to reflect the one-half year period).
(3) Class R3 commenced investment operations on May 1, 2018.
First Eagle Funds | Annual Report | October 31, 2018
178
Quarterly Form N-Q portfolio schedule
The First Eagle Funds file their complete schedule of portfolio holdings with the Securities and Exchange Commission ("SEC") for the first and third quarters of each fiscal year on Form N-Q. The Funds' Forms N-Q are available on the SEC's Web site at www.sec.gov. Additionally, you may obtain copies of Form N-Q from the Fund upon request by calling 1.800.334.2143.
Proxy voting policies, procedures and record
You may obtain (1) a description of the Funds' proxy voting policies, (2) a description of the Funds' proxy voting procedures and (3) information regarding how the Funds voted any proxies related to portfolio securities during the most recent twelve-month period ended June 30 for which an SEC filing has been made, without charge, upon request by contacting the Funds directly at 1.800.334.2143 or on the EDGAR Database on the SEC's Web site at www.sec.gov.
First Eagle Funds | Annual Report | October 31, 2018
179
Board Considerations for Continuation of Advisory Agreements
At a meeting held on June 7 2018, the Board of Trustees of the Funds, including a majority of the independent trustees (the "Independent Trustees"), approved the continuation of the Funds' advisory agreements (the "Advisory Agreements").
In response to a letter on behalf of the Independent Trustees requesting information about the Advisory Agreements and other arrangements and plans, the Board had received various background materials. The Board also had the benefit of presentations and discussions with management throughout the year.
Prior to approving the continuation of the Advisory Agreements, the Independent Trustees met in executive session with their independent counsel to discuss management's responses to their information request and reviewed their legal and fiduciary obligations and the factors relating to their evaluation and approval. In their deliberations, Trustees attributed different weights to the various factors, and no factor alone was considered determinative. At the conclusion of their review the Trustees determined that the advisory fees were fair and reasonable and within the range of what could be negotiated at arm's length, and that the continuance of the agreements should serve the best interests of each Fund and its shareholders. The Trustees considered the following topics in reaching their conclusion to continue the agreements:
Nature, Quality, and Extent of Services Provided by Adviser
• The Trustees reviewed the services provided and to be provided by the Adviser to the Funds. The Adviser (together with Iridian in the case of First Eagle Fund of America) provides the Funds with investment research, advice and supervision and continuously furnishes an investment portfolio for the Funds consistent with the Funds' investment objectives, policies and restrictions as set forth in the Funds' Prospectuses. The Trustees were assured that service levels for Funds subject to fee waivers or breakpoints do not change as a result of those waivers or breakpoints.
• The Trustees reviewed each Fund's long-standing historical relationship with the Adviser (together with Iridian in the case of First Eagle Fund of America) and the organizational resources available to the Funds under that relationship. The Trustees noted the background and experience of the Funds' Portfolio Managers and the quality of the Trustees' frequent meetings with them both individually and as a group throughout the year.
Investment Performance of Fund and Adviser
• The Trustees reviewed the performance of each Fund on both an absolute and a relative basis over 1-year, 3-year, 5-year and 10-year periods. Performance for the Funds over these various periods was noted relative to the Funds' benchmarks, to Morningstar and Lipper Category
First Eagle Funds | Annual Report | October 31, 2018
180
Board Considerations for Continuation of Advisory Agreements
averages (referred to as the composites below) and to a custom group of peer mutual funds. The comparative review reflected research and benchmarking by an independent data provider. Performance results generally were as follows (all periods ended as of March 31, 2018):
º First Eagle Global Fund: Outperformed composites and peer group median over the trailing 3-, 5- and 10-year periods; outperformed benchmark over the trailing 10-year period. Lagged composites, benchmark and peer group median over the trailing 1-year period; lagged benchmark over the trailing 3- and 5-year periods.
º First Eagle Overseas Fund: Outperformed composites, benchmark and peer group median over the trailing 10-year period. Lagged composites, benchmark and peer group median over the trailing 1-, 3-, and 5-year periods.
º First Eagle U.S. Value Fund: Lagged composites, benchmark and peer group median over all periods (trailing 1-, 3-, 5- and 10-year). No instances of outperformance reported.
º First Eagle Gold Fund: Outperformed composites, benchmark and peer group median over the trailing 5- and 10-year periods; outperformed peer group median and one of the two composites over the trailing 1-year period. Lagged composites, benchmark and peer group median over the trailing 3-year period; lagged benchmark and one of the two composites over the trailing 1-year period.
º First Eagle Global Income Builder Fund: Outperformed composites, one of the two benchmarks and peer group median over the trailing 3-year period; outperformed two of the three composites and one of the two benchmarks over the trailing 5-year period; outperformed one of the three composites and one of the two benchmarks over the trailing 1-year period. Lagged two of the three composites, one of the two benchmarks and peer group median over the trailing 1-year period; lagged one of the three composites, one of the two benchmarks and peer group median over the trailing 5-year period; lagged one of the two benchmarks over the trailing 3-year period.
º First Eagle High Yield Fund: Outperformed composites, benchmark and peer group median for 1- and 10-year periods; outperformed composites for the trailing 3-year period; outperformed one of the two composites for the 5-year period. Lagged one of the two composites, benchmark and peer group median for the 5-year period; lagged benchmark and peer group median for the 3-year period.
º First Eagle Fund of America: Lagged composites, benchmark and peer group median over all periods (trailing 1-, 3-, 5- and 10-year). No instances of outperformance reported.
The Trustees noted (and management discussed) the generally less favorable near-term relative performance results for all but two Funds (First Eagle Gold Fund showed mixed near-term relative results and First Eagle High Yield Fund showed stronger near-term relative results). The Trustees also noted (and management discussed) that First Eagle U.S. Value Fund and First Eagle Fund of America lagged against all metrics selected across all periods. Contributors to lagging results (both with and without the impact of higher than median cash positions) were discussed. Gains on an absolute basis over the prior year were noted for all Funds except First Eagle Gold Fund.
First Eagle Funds | Annual Report | October 31, 2018
181
Board Considerations for Continuation of Advisory Agreements
• Performance for each Fund was determined to be adequate given benchmarks, peer comparisons and on an absolute basis, and reflective of each Fund's investment objective and philosophy.
• The Trustees commented on the Funds' holdings of cash and, in some cases, gold positions, and noted that cash and gold are important elements of the Adviser's investment philosophy.
Costs of Services To Be Provided and Profits To Be Realized by Adviser and its Affiliates From Relationship with Funds; Economies of Scale; Fall-Out Benefits
• The Trustees reviewed the total compensation received by the Adviser and the Funds' total costs for using the Adviser's services, taking into account expenses incurred by the Adviser that are passed through to the Funds (e.g., under the administrative cost reimbursement program applicable to certain Funds). They concluded that this compensation was generally commensurate with the nature, extent, and quality of the services provided and therefore fair and reasonable under the circumstances, and referred to their prior discussion on performance of each Fund, including a review of performance against each Fund's respective composites, benchmark and peer group. As part of their analysis, the Trustees considered fees charged by investment advisers to peer mutual funds for services comparable to those provided by the Adviser and referred to a report specifically prepared by an independent third-party data provider in connection with the Trustees' review of the agreements, together with a management summary of the same. In doing so, they considered fees charged by investment advisers to peer mutual funds and determined that the Adviser's fees were competitive, with the net management fees for some Funds being higher and for some Funds being lower than their peer averages/medians, but all being within the range of peers. The Trustees noted the "breakpoints" providing for potential reductions in the First Eagle Fund of America management fee over time. The Trustees considered fee waivers in effect for First Eagle U.S. Value Fund and First Eagle High Yield Fund (with a more favorable waiver also being implemented for First Eagle High Yield Fund). The Trustees also considered, where applicable, the advisory fees charged to other clients of the Adviser (or of Iridian in the case of First Eagle Fund of America) with similar investment objective(s) to a Fund and received information that for some Funds, the fees charged to these other clients were higher or lower relative to the respective Fund. The Trustees were apprised that for some of these other accounts there are different styles and categories of services provided, which may be reflected in lower fees charged relative to the respective Fund.
• While analyzing the effects of direct and indirect compensation to the Adviser and its affiliates, such as soft dollar and other service benefits, the Trustees considered the levels of soft dollars, the absence of affiliated broker-dealer relationships and the effects of the administrative service fees and reimbursements paid to the Adviser. The Trustees noted that (except for First Eagle Fund of America) the Adviser generally is seeking to absorb soft dollar costs and pay them itself, with this change in approach effective January 1, 2018. With regard to other possible benefits associated with the Adviser's management of the Funds, the Trustees noted,
First Eagle Funds | Annual Report | October 31, 2018
182
Board Considerations for Continuation of Advisory Agreements
among other things, that the Distributor is generally able to retain Rule 12b-1 fees on shareholders it services directly and that the Adviser may be able to extend investment and operational efficiencies associated with the Funds to its management of other types of accounts.
• The Trustees reviewed the Funds' expense ratios, which were deemed reasonable both on an absolute basis and in comparison to peer funds. The Trustees again noted the scheduled "breakpoints" for the First Eagle Fund of America management fee and the fee waivers for First Eagle U.S. Value Fund and First Eagle High Yield Fund. The Trustees noted the impact on expense ratios of the administrative fees or reimbursements paid to or charged by the Adviser, as the case may be.
• The Trustees also noted that the Adviser is able to employ economies of scale in certain areas relating to the management of the Fund, such as investment management, trading, compliance and back-office operations. The Trustees discussed the impact of the advisory fee on the ratio of total expenses to net assets and noted that the Funds' expense ratios generally had decreased over time as the Funds grew, highlighting a benefit to shareholders resulting from the development of economies of scale in the operation of the Funds. The Trustees noted that expense ratios for all of the Funds had decreased relative to the prior year and reviewed the causes of those decreases. For each Fund, the principal contributing factor for this decrease was an increase in average net assets over the prior year and/or a decrease in transfer agency fees. The Trustees also considered the effect of Fund asset size on particular categories of expenses, both currently and relative to prior periods.
• The Trustees reviewed the Adviser's financial condition and profitability. They noted that profits appear strong across most of the Funds, although not excessive and generally commensurate with the Funds' investment performance and other service indicia, based on the information provided at the meeting. The Trustees noted the cyclical and competitive nature of the global asset management industry and related importance of profitability in maintaining the Adviser's culture and management continuity. The Trustees also noted that the Adviser has always shown the willingness to commit resources to support investment in the business and to maintain the generally high quality of the overall shareholder experience in the Funds, such as attracting and retaining qualified personnel and investing in technology. The Trustees reviewed the level of personal investment maintained in the Funds by certain portfolio managers (with those investments being both direct and "notional" under the Adviser's compensation plans), which was viewed as evidence of commitment to the organization by key personnel. The Trustees also considered that certain personnel participate in equity ownership and other incentives tied to the financial results of the Adviser as a whole.
First Eagle Funds | Annual Report | October 31, 2018
183
Board Considerations for Continuation of Subadvisory Agreement
At a meeting held on June 7 2018, the Board of Trustees of the Funds, including a majority of the Independent Trustees, approved the continuation of the First Eagle Fund of America Subadvisory Agreement.
In response to a letter on behalf of the Independent Trustees requesting information about the Subadvisory Agreement and other arrangements and plans, the Board had received various background materials. The Board also had the benefit of presentations and discussions with management of the Adviser and Subadviser throughout the year.
Prior to approving the continuation of the Subadvisory Agreement, the Independent Trustees met in executive session with their independent counsel to discuss management's responses to a letter sent by the Independent Trustees requesting certain information relevant to the agreement and reviewed their legal and fiduciary obligations and the factors relating to their evaluation and approval. In their deliberations, Trustees attributed different weights to the various factors, and no factor alone was considered determinative. At the conclusion of their review the Trustees determined that the subadvisory fee was fair and reasonable and within the range of what could be negotiated at arm's length, and that the approval of the agreement should serve the best interests of the Fund and its shareholders.
The Trustees considered information and views substantially similar to those described above relating to the Advisory Agreement for First Eagle Fund of America. Additionally, the Board, including the Independent Trustees, considered the nature, quality, cost and extent of services provided and to be provided under the Subadvisory Agreement (and corresponding services provided by the Adviser). The Board, including the Independent Trustees, determined, among other things, that the size and nature of the Subadviser's staff as it relates to First Eagle Fund of America, and the nature and quality of advisory services provided by the Subadviser, are satisfactory and appropriate. The Board did not separately consider the profitability of the Subadviser, although it did consider the profitability of the Adviser in respect of First Eagle Fund of America, as the Subadviser's advisory fees are paid by the Adviser.
First Eagle Funds | Annual Report | October 31, 2018
184
Fiscal Year Ended October 31, 2018 (unaudited)
| | | % of Qualifying
Dividend
Income | | % of Dividends
Eligible for
the Dividends
Received
Deduction | | Long-Term
Capital Gains | |
First Eagle Global Fund | | | 100 | % | | | 57.80 | % | | $ | 2,035,308,665 | | |
First Eagle Overseas Fund* | | | 68.27 | % | | | 0.16 | % | | | 308,424,896 | | |
First Eagle U.S. Value Fund | | | 100 | % | | | 100 | % | | | 188,732,679 | | |
First Eagle Gold Fund | | | — | | | | — | | | | — | | |
First Eagle Global Income Builder Fund | | | 72.21 | % | | | 20.67 | % | | | — | | |
First Eagle High Yield Fund | | | — | | | | — | | | | — | | |
First Eagle Fund of America | | | 100 | % | | | 100 | % | | | 242,540,531 | | |
* First Eagle Overseas Fund paid foreign taxes of $25,952,215 and recognized Section 853 foreign source income of $232,774,156. Pursuant to Section 853 of the Internal Revenue Code, the First Eagle Overseas Fund designates such amounts (or the maximum amount allowable) as having been paid in connection with dividends distributed from investment company taxable income during the fiscal year ended October 31, 2018.
First Eagle Funds | Annual Report | October 31, 2018
185
The Trust is committed to protecting your privacy. We are providing you with this privacy notice to inform you of how we handle your personal information that we collect and may disclose to our affiliates. If the Trust changes its information practices, we will provide you with notice of any material changes. This privacy policy supersedes any of our previous policies relating to the information you disclose to us.
Why this Privacy Policy Applies to You
You obtained a financial product or service from or through us for personal, family or household purposes when you opened a shareholder account with the Trust, and are therefore covered by this privacy policy.
What We do to Protect Your Personal Information
We protect personal information provided to us by our individual shareholders according to strict standards of security and confidentiality. These standards apply to both our physical facilities and any online services we may provide. We maintain physical, electronic and procedural safeguards that comply with federal standards to guard consumer information. We permit only authorized individuals, who are trained in the proper handling of individual shareholder information and need to access this information to do their job, to have access to this information.
Personal Information that We Collect and May Disclose
As part of providing you with the Trust's products and services, we may obtain nonpublic personal information about you from the following sources:
• Information we receive from you on subscription applications or other forms, such as your name, address, telephone number, Social Security number, occupation, assets and income;
• Information about your transactions with us, our affiliates, or unaffiliated third parties, such as your account balances, payment history and account activity; and
• Information from public records we may access in the ordinary course of business.
Categories of Affiliates to Whom We May Disclose Personal Information
We may share personal information about you with affiliates. Our affiliates do business under names that include First Eagle Holdings, Inc., First Eagle Investment Management, LLC, FEF Distributors, LLC, and ASB Advisers.
First Eagle Funds | Annual Report | October 31, 2018
186
You May Limit Marketing Solicitations by Choosing to Opt Out
We offer you the right to opt out from many types of marketing by our affiliates based on your personal information that we collect and share in accordance with this privacy policy. To limit those marketing solicitations, you may call 800.334.2143 indicating your desire not to receive marketing from our affiliates. Should you choose to opt out, your choice will remain in our records until you notify us otherwise, although we may choose to contact you in the future to modify your preference.
When We May Disclose Your Personal Information to Unaffiliated Third Parties
We will only share your personal information collected, as described above, with unaffiliated third parties:
• At your request;
• When you authorize us to process or service a transaction or product (unaffiliated third parties in this instance may include service providers such as the Trust's distributors, registrar and transfer agent for shareholder transactions, and other parties providing individual shareholder servicing, accounting and recordkeeping services);
• With companies that perform sales and marketing services on our behalf with whom we have agreements to protect the confidentiality of your information and to use the information only for the purposes for which we disclose the information to them; or
• When required by law to disclose such information to appropriate authorities.
We do not otherwise provide information about you to outside firms, organizations or individuals except to our attorneys, accountants and auditors and as permitted by law.
What We do with Personal Information about Our Former Customers
If you decide to discontinue doing business with us, the Trust will continue to adhere to this privacy policy with respect to the information we have in our possession about you and your account following the termination of our shareholder relationship.
First Eagle Funds | Annual Report | October 31, 2018
187
Additional Information (unaudited)
Management of the Trust
The business of the Trust is managed by its Board of Trustees, which elects officers responsible for the day to day operations of the Funds and for the execution of the policies formulated by the Board of Trustees.
Pertinent information regarding the members of the Board of Trustees and principal officers of the Trust is set forth below. Some of the Trustees and officers are employees of the Adviser and its affiliates. At least a majority of the Trust's Board of Trustees are not "interested persons" as that term is defined in the Investment Company Act.
Independent Trustees(1)
Lisa Anderson | Trustee | December 2005 to present
1345 Avenue of the Americas | New York, New York | 10105
(born October 1950)
Principal Occupation(s) During Past 5 Years: James T. Shotwell Professor Emerita of International Relations, School of International and Public Affairs, Columbia; prior to 2016, President of the American University in Cairo
Number of Portfolios in the Fund Complex Overseen by Trustee: 8
Other Directorships/Trusteeships Held by Trustee: Trustee, First Eagle Variable Funds (1 portfolio); Member Emerita, Human Rights Watch; Member, Advisory Board, School of Public Affairs, Sciences Po (Institute of Political Studies), Paris
Candace K. Beinecke(2) | Trustee (Chair) | December 1999 to present
One Battery Park Plaza | New York, New York | 10004
(born December 1946)
Principal Occupation(s) During Past 5 Years: Senior Partner, Hughes Hubbard & Reed LLP; prior to April 2017, Chair, Hughes Hubbard & Reed LLP
Number of Portfolios in the Fund Complex Overseen by Trustee: 8
Other Directorships/Trusteeships Held by Trustee: Trustee, First Eagle Variable Funds (Chair) (1 portfolio); Board Member, CBS Corporation; Director, ALSTOM; Lead Trustee, Vornado Realty Trust; Trustee, Hertie School of Governance (Berlin); Trustee, Tufts University; Trustee, Metropolitan Museum of Art; Trustee, Chairman, The Wallace Foundation; Director, Partnership for New York City
(1) Trustees who are not "interested persons" of the Trust as defined in the Investment Company Act.
(2) Ms. Beinecke also served as trustee of a predecessor fund to Fund of America since 1996.
First Eagle Funds | Annual Report | October 31, 2018
188
Additional Information (unaudited)
Independent Trustees(1)—(continued)
Jean D. Hamilton | Trustee | March 2003 to present
1345 Avenue of the Americas | New York, New York | 10105
(born January 1947)
Principal Occupation(s) During Past 5 Years: Private Investor/Independent Consultant/Member, Brock Capital Group LLC;
Number of Portfolios in the Fund Complex Overseen by Trustee: 8
Other Directorships/Trusteeships Held by Trustee: Trustee, First Eagle Variable Funds (1 portfolio); Director, RenaissanceRe Holdings Ltd; Chairman, Investment Committee, Thomas Cole National Historic Site; Member, Investment Advisory Committee, Liz Claiborne and Art Ortenberg Foundation; prior to June 2012, Director, Four Nations
James E. Jordan | Trustee | December 1999 to present
1345 Avenue of the Americas | New York, New York | 10105
(born April 1944)
Principal Occupation(s) During Past 5 Years: Private Investor and Independent Consultant
Number of Portfolios in the Fund Complex Overseen by Trustee: 8
Other Directorships/Trusteeships Held by Trustee: Trustee, First Eagle Variable Funds (1 portfolio); Director, JZ Capital Partners, Plc. (Guernsey investment trust company); Director, Alpha Andromeda Investment Trust Co., S.A.; Board of Overseers, Gennadias Library, American School of Classical Studies, Athens; Director, Pro Natura de Yucatan; prior to May 2017, Trustee, World Monuments Fund
William M. Kelly(3) | Trustee | December 1999 to present
1345 Avenue of the Americas | New York, New York | 10105
(born February 1944)
Principal Occupation(s) During Past 5 Years: Private Investor
Number of Portfolios in the Fund Complex Overseen by Trustee: 8
Other Directorships/Trusteeships Held by Trustee: Trustee, First Eagle Variable Funds (1 portfolio); Trustee Emeritus, St. Anselm College; Director, Sergi S. Zlinkoff Fund for Medical Research and Education; Savannah Book Festival Investment Committee
(1) Trustees who are not "interested persons" of the Trust as defined in the Investment Company Act.
(3) Mr. Kelly also served as trustee of a predecessor fund to Fund of America since 1998.
First Eagle Funds | Annual Report | October 31, 2018
189
Additional Information (unaudited)
Independent Trustees(1)—(continued)
Paul J. Lawler | Trustee | March 2002 to present
1345 Avenue of the Americas | New York, New York | 10105
(born May 1948)
Principal Occupation(s) During Past 5 Years: Private Investor
Number of Portfolios in the Fund Complex Overseen by Trustee: 8
Other Directorships/Trusteeships Held by Trustee: Trustee, First Eagle Variable Funds (1 portfolio); Trustee and Audit Chair, The American University in Cairo; Trustee, registered investment companies advised by affiliates of The Blackstone Group, L.P. (4 portfolios); Trustee, Ravena Coeymans Historical Society; Trustee, Coeymans Heritage Society
Interested Trustees(4)
John P. Arnhold | Trustee | December 1999 to present
1345 Avenue of the Americas | New York, New York | 10105
(born December 1953)
Principal Occupation(s) During Past 5 Years: Director, First Eagle Holdings, Inc.; Managing Member, Arnhold LLC; prior to July 2017, Director, First Eagle Investment Management LLC; President, First Eagle Funds; President, First Eagle Variable Funds; Director, FEF Distributors, LLC; prior to March 2016, Co-President and Co-CEO First Eagle Holdings, Inc.; CIO and Chairman, First Eagle Investment Management, LLC; CEO and Chairman, FEF Distributors, LLC; prior to February 2010, CEO, First Eagle Investment Management, LLC
Number of Portfolios in the Fund Complex Overseen by Trustee: 8
Other Directorships/Trusteeships Held by Trustee: Trustee, First Eagle Variable Funds (1 portfolio); Chairman and Director, Arnhold Ceramics; Director, The Arnhold Foundation; Director, The Mulago Foundation; Director, WNET.org; Trustee Emeritus, Trinity Episcopal Schools Corp.; Trustee, Jazz at Lincoln Center; Chairman, International Tennis Hall of Fame; Member, Investment Committee of the USTA; Managing Member, New Eagle Holdings Management Company, LLC; Trustee, UC Santa Barbara Foundation; prior to January 2018, Director, First Eagle Amundi; prior to June 2016, Trustee, Vassar College
(1) Trustees who are not "interested persons" of the Trust as defined in the Investment Company Act.
(4) The term of office of each Interested Trustee is indefinite.
First Eagle Funds | Annual Report | October 31, 2018
190
Additional Information (unaudited)
Interested Trustees(5)—(continued)
Jean-Marie Eveillard | Trustee | June 2008 to present
1345 Avenue of the Americas | New York, New York | 10105
(born January 1940)
Principal Occupation(s) During Past 5 Years: Senior Adviser to First Eagle Investment Management, LLC since March 2009; formerly, Senior Vice President, First Eagle Investment Management, LLC since January 2000; previously, Portfolio Manager of First Eagle Global Fund, First Eagle Overseas Fund, First Eagle U.S. Value Fund, First Eagle Gold Fund, and First Eagle Variable Funds (portfolio management tenure: 1979-2004, March 2007-March 2009)
Number of Portfolios in the Fund Complex Overseen by Trustee: 8
Other Directorships/Trusteeships Held by Trustee: Trustee, First Eagle Variable Funds (1 portfolio); Director, Varenne Capital Partners; Trustee (French Money management firm), Board member Perspective (South African money management firm); Trustee, FIAF (Alliance Francaise); prior to March 2015, Trustee, The Frick Collection
Officers(6)
Mehdi Mahmud | President | June 2017 to present
1345 Avenue of the Americas | New York, New York | 10105
(born September 1972)
Principal Occupation(s) During Past Five (5) Years: President and Chief Executive Officer, First Eagle Investment Management, LLC; Prior to March 2016, Chairman and Chief Executive Officer, Jennison Associates LLC; prior to 2012, Vice Chairman and Chief Operating Officer, Jennison Associates LLC; President, First Eagle Variable Funds
Robert Bruno | Senior Vice President | December 1999 to present
1345 Avenue of the Americas | New York, New York | 10105
(born June 1964)
Principal Occupation(s) During Past Five (5) Years: Senior Vice President, First Eagle Investment Management, LLC; President, FEF Distributors, LLC; Senior Vice President, First Eagle Variable Funds
Joseph T. Malone | Chief Financial Officer | September 2008 to present
1345 Avenue of the Americas | New York, New York | 10105
(born September 1967)
Principal Occupation(s) During Past Five (5) Years: Senior Vice President, First Eagle Investment Management, LLC; Chief Financial Officer, First Eagle Variable Funds; from September 2008
(5) The term of office of each Interested Trustee is indefinite.
(6) The term of office of each officer is indefinite. Length of time served represents time served as an officer of the Trust (or its predecessor entities), although various positions may have been held during the period.
First Eagle Funds | Annual Report | October 31, 2018
191
Additional Information (unaudited)
Officers(6)—(continued)
Albert Pisano | Chief Compliance Officer | July 2015 to present
1345 Avenue of the Americas | New York, New York | 10105
(born April 1960)
Principal Occupation(s) During Past Five (5) Years: Chief Compliance Officer and Senior Vice President, First Eagle Investment Management; prior to June 30, 2014, Director and Chief Compliance Officer of Allianz Global Investors Fund Management LLC, and also served as Deputy Chief Compliance Officer for Allianz Global Investors U.S. LLC; Chief Compliance Officer, First Eagle Variable Funds from July 2015
David O'Connor | General Counsel | December 2017 to present
1345 Avenue of the Americas | New York, New York | 10105
(born February 1966)
Principal Occupation(s) During Past Five (5) Years: General Counsel and Senior Vice President, First Eagle Investment Management, LLC; General Counsel, First Eagle Funds and First Eagle Variable Funds; General Counsel, First Eagle Holdings, Inc.; Secretary and General Counsel, FEF Distributors, LLC; Director, First Eagle Amundi; prior to January 2017, Investment Management Consultant; prior to June 2015, Executive Vice President Strategic Investment Initiatives and General Counsel, Delaware Investments
Sheelyn Michael | Deputy General Counsel | December 2017 to present
1345 Avenue of the Americas | New York, New York | 10105
(born September 1971)
Principal Occupation(s) During Past Five (5) Years: Deputy General Counsel and Senior Vice President, First Eagle Investment Management, LLC; Deputy General Counsel, First Eagle Variable Funds; prior to September 2014, Associate, Dechert LLP
Tricia Larkin | Treasurer | March 2016 to present
1345 Avenue of the Americas | New York, New York | 10105
(born July 1979)
Principal Occupation(s) During Past Five (5) Years: Vice President, First Eagle Investment Management, LLC; prior to March 2016, Vice President of Fund Administration, State Street Corporation; prior to November 2013, Director of Fund Administration, Assistant Vice President, State Street Corporation; Treasurer, First Eagle Variable Funds from March 2016
(6) The term of office of each officer is indefinite. Length of time served represents time served as an officer of the Trust (or its predecessor entities), although various positions may have been held during the period.
First Eagle Funds | Annual Report | October 31, 2018
192
Additional Information (unaudited)
Officers(6)—(continued)
Michael Luzzatto | Vice President | December 2004 to present
1345 Avenue of the Americas | New York, New York | 10105
(born April 1977)
Principal Occupation(s) During Past Five (5) Years: Senior Vice President, First Eagle Investment Management, LLC; Vice President, FEF Distributors, LLC; Vice President, First Eagle Variable Funds
Neal Ashinsky | Assistant Treasurer | October 2015 to present
1345 Avenue of the Americas | New York, New York | 10105
(Born October 1987)
Principal Occupation(s) During Past Five (5) Years: Assistant Vice President, First Eagle Investment Management, LLC; prior to August 2015, Advisory Senior Associate, KPMG LLP; prior to November 2014, Assurance Senior Associate, PwC LLP; Assistant Treasurer, First Eagle Variable Funds from August 2015
Thomas Meyer | Assistant Treasurer | April 2018 to present
1345 Avenue of the Americas | New York, New York | 10105
(Born March 1982)
Principal Occupation(s) During Past Five (5) Years: Assistant Vice President, First Eagle Investment Management, LLC; prior to September 2017, Assurance Manager, PwC LLP; Assistant Treasurer, First Eagle Variable Funds from April 2018
(6) The term of office of each officer is indefinite. Length of time served represents time served as an officer of the Trust (or its predecessor entities), although various positions may have been held during the period.
First Eagle Funds | Annual Report | October 31, 2018
193
Trustees
Lisa Anderson
John P. Arnhold
Candace K. Beinecke (Chair)
Jean-Marie Eveillard
Jean D. Hamilton
James E. Jordan
William M. Kelly
Paul J. Lawler
Officers
Mehdi Mahmud
President
Robert Bruno
Senior Vice President
Joseph T. Malone
Chief Financial Officer
Albert Pisano
Chief Compliance Officer
David O'Connor
General Counsel
Sheelyn Michael
Secretary & Deputy General Counsel
Tricia Larkin
Treasurer
Michael Luzzatto
Vice President
Neal Ashinsky
Assistant Treasurer
Thomas Meyer
Assistant Treasurer
Investment Adviser
First Eagle Investment Management, LLC
1345 Avenue of the Americas
New York, NY 10105
Legal Counsel
Shearman & Sterling LLP
599 Lexington Avenue
New York, NY 10022
Custodian
JPMorgan Chase Bank, N.A.
4 Chase Metrotech Center, Floor 16,
Brooklyn, New York, 11245
Shareholder Servicing Agent
DST Systems, Inc.
330 West 9th Street
Kansas City, MO 64105
800.334.2143
Underwriter
FEF Distributors, LLC
1345 Avenue of the Americas
New York, NY 10105
Independent Registered Public
Accounting Firm
PricewaterhouseCoopers LLP
300 Madison Avenue
New York, NY 10017
This report is not authorized for distribution to prospective investors unless preceded or accompanied by a currently effective prospectus of First Eagle Funds.
First Eagle Funds | Annual Report | October 31, 2018
194


First Eagle Investment Management, LLC
1345 Avenue of the Americas, New York, NY 10105-0048
800.334.2143 www.feim.com
Item 2. Code of Ethics.
The Registrant has adopted a code of ethics that applies to its principal executive officer and principal financial officer. Copies of the code of ethics may be requested free of charge by calling 1-800-334-2143 (toll free).
Item 3. Audit Committee Financial Expert.
The Board of Trustees of the registrant has designated Paul J. Lawler, William M. Kelly and Jean Hamilton as Audit Committee Financial Experts. Mr. Lawler, Mr. Kelly and Ms. Hamilton are considered by the Board to be independent trustees.
Item 4. Principal Accountant Fees and Services
(a) Audit Fees:
For the Fiscal years ended October 31, 2018 and October 31, 2017, the aggregate PricewaterhouseCoopers LLP (PwC) audit fees for professional services rendered to the registrant were approximately $472,100 and $446,210, respectively. Fees included in the audit fees category are those associated with the annual audits of the financial statements and services that are normally provided in connection with statutory and regulatory filings.
(b) Audit Related Fees:
For the fiscal years ended October 31, 2018 and October 31, 2017, the aggregate PwC fees for assurance and related services rendered to the registrant were approximately $0 and $0, respectively.
(c) Tax Fees:
In each fiscal year ended October 31, 2018 and October 31, 2017, the aggregate tax fees billed by PwC for professional services rendered to the registrant were approximately $562,500 and $473,750, respectively.
Fees included in the tax fees category comprise all services performed by professional staff in the independent accountant’s tax division except those services related to audits. This category comprises fees for tax compliance and preparation of tax returns.
(d) All Other Fees:
In each of the fiscal years ended October 31, 2018 and October 31, 2017, there were no fees billed by PwC for products and services, other than 4(a)-(c) above, rendered to the registrant.
(e)(1) The registrant’s audit committee has adopted a policy whereby audit and non-audit services performed by the registrant’s principal accountant for the registrant, its investment adviser, and any entity controlling, controlled by, or under common control with the investment adviser that provides ongoing services to the registrant require pre-approval by the committee or a designated member thereof. If such a service is required between regularly scheduled audit committee meetings, pre-approval may be authorized by one audit committee member with ratification at the next scheduled audit committee meeting. Waiver of pre-approval for audit and non-audit services requiring fees of a de minimis amount is not permitted.
(e)(2) No services included in (b) — (d) above were approved pursuant to paragraph (c)(7)(i)(C) of Rule 2-01 of Regulation S-X.
(f) According to PwC, for the fiscal year ended October 31, 2018, the percentage of hours spent on the audit of the registrant’s financial statements for the most recent fiscal year that were attributable to work performed by persons who are not full-time, permanent employees of PwC was 0%.
(g) Other than as described in the table above, the aggregate fees billed for the most recent fiscal year and the preceding fiscal year by the registrant’s principal accountant for non-audit services rendered to the registrant (“covered”), its investment adviser, and any entity controlling, controlled by, or under common control with the investment adviser (“non-covered”) that provides ongoing services to the registrant was $0 in 2018 and 2017.
(h) Not applicable.
Item 5. Audit Committee of Listed Registrants
Not applicable at this time.
Item 6. Schedule of Investments
Please see schedule of investments contained in the Report to Stockholders included under Item 1 of this Form N-CSR.
Item 7. Disclosure of Proxy Voting Policies and Procedures for Closed-End Management Investment Companies.
Not applicable.
Item 8. Portfolio Managers of Closed-End Investment companies.
Not applicable.
Item 9. Purchases of Equity Securities by Closed-End Management Investment Company and Affiliated Purchasers.
Not applicable.
Item 10. Submission of Matters to a Vote of Security Holders.
No material change to report at this time.
Item 11. Controls and Procedures.
(a) In the opinion of the principal executive officer and principal financial officer, based on their evaluation, the registrant’s disclosure controls and procedures are adequately designed and are operating effectively to ensure (i) that material information relating to the registrant, including its consolidated subsidiaries, is made known to them by others within those entities, particularly during the period in which this report is being prepared; and (ii) that information required to be disclosed by the registrant on Form N-CSR is recorded, processed, summarized and reported within the time periods specified in the Securities and Exchange Commission’s rules and forms.
(b) There were no changes in the registrant’s internal control over financial reporting that occurred during the registrant’s most recent fiscal half-year (the registrant’s second fiscal half-year in the case of an annual report) that have materially affected or are reasonably likely to materially affect, the registrant’s internal control over financial reporting.
Item 12. Exhibits.
(a)(1) Code of ethics required to be disclosed under Item 2 of Form N-CSR.
(a)(2) Certifications pursuant to Rule 30a-2(a) under the Investment Company Act of 1940 (17 CFR 270.30a-2(a)): Attached hereto.
(a)(3) Not applicable.
(b) Certification pursuant to Rule 30a-2(b) under the Investment Company Act of 1940 (17 CFR 270.30a-2(b)): Attached hereto.
SIGNATURES
Pursuant to the requirements of the Securities Exchange Act of 1934 and the Investment Company Act of 1940, the registrant has duly caused this report to be signed on its behalf by the undersigned, thereunto duly authorized.
(Registrant) | First Eagle Funds |
| |
By (Signature and Title)* | /s/ Mehdi Mahmud |
| Mehdi Mahmud, President |
Date: January 2, 2019
Pursuant to the requirements of the Securities Exchange Act of 1934 and the Investment Company Act of 1940, this report has been signed below by the following persons on behalf of the registrant and in the capacities and on the dates indicated.
| |
By (Signature and Title)* | /s/ Mehdi Mahmud |
| Mehdi Mahmud, Principal Executive Officer |
Date: January 2, 2019
| |
By (Signature and Title)* | /s/ Joseph T. Malone |
| Joseph T. Malone, Principal Financial Officer |
Date: January 2, 2019
* Print the name and title of each signing officer under his or her signature.